Embed Size (px)
Citation preview
Nitrogen 1s NEXAFS and XPS spectroscopy of NH3-saturated Si(001)-2Ã1:Theoretical predictions and experimental observations at 300 K
C. Mathieu, Xuxu Bai,* F. Bournel, J.-J. Gallet, S. Carniato, and F. Rochet†
Laboratoire de Chimie Physique Matière et Rayonnement, Unité Mixte de Recherche CNRS 7614, Université Pierre et Marie Curie,75231 Paris Cedex, France
F. Sirotti, M. G. Silly, and C. ChauvetSynchrotron SOLEIL, L’Orme des Merisiers, Saint-Aubin, BP 48, 91192 Gif sur Yvette Cedex, France
D. KrizmancicLaboratorio Nazionale TASC-INFM, S.S. 14 km 163.5, Area Science Park, 34012 Trieste, Italy
F. HenniesMAX-Lab, Lund University, P.O. Box 118, 221 00 Lund, Sweden
�Received 24 November 2008; published 21 May 2009�
In the light of hybrid functional density-functional theory calculations of the core-excited and core-ionizedstates, this paper discusses original N 1s x-ray photoemission spectroscopy �XPS� and near-edge x-ray absorp-tion fine-structure �NEXAFS� experimental data on the single-domain �vicinal� Si�001�-2�1 surface saturatedby NH3 at 300 K. The theoretical approach enables to discuss the vibrational shape of the N 1s XPS spectrumand quantifies the binding-energy splitting due to intrarow and inter-row hydrogen bondings between aminepairs. The observed N 1s NEXAFS peaks are interpreted through the analysis of the contour maps of theantibonding Kohn-Sham orbitals of the NH2 adsorbate and through the � Kohn-Sham calculation of thetransition energies, laying a theoretical basis for a discussion of the adsorbate spatial orientation. Finally,suggestions are given for future directions of research to get a further knowledge of a system that has potentialapplications as a template for molecular layer deposition and supramolecular assembly.
DOI: 10.1103/PhysRevB.79.205317 PACS number�s�: 81.05.Cy, 81.07.�b, 82.30.Rs, 82.20.Wt
I. INTRODUCTION
Motivated in the early 1990s by technological consider-ations related to fabrication processes of microelectronics,that is, silicon nitridation,1–6 the study of the adsorption andreaction of NH3 on Si�001�-2�1 is experiencing a renewedinterest,7–16 especially because surface imaging by scanningtunneling microscopy �STM� has pointed to the self-assembly capacity of the adsorbates.8,10–12,14–16 More gener-ally, the study of adsorption modes of nucleophilic lone-pairbearing molecules, such as ammonia and amines,17–20 hasraised a great interest as these molecules probe the “zwitte-rionic” nature of the buckled surface dimers that orientateschemical reactions to first order �see Ref. 21, where an up-dated discussion of the �001� surface reconstruction can befound� and as their spatial ordering at the surface is a conse-quence of interactions mediated through the silicon surfaceelectronic states.22
Concerning the adsorption of ammonia on Si�001�-2�1,the consensus is the following: vibrationalspectroscopies1,3,7,13 as well as x-ray photoemission spectros-copy �XPS� �Refs. 4–6 and 9� show that the reaction is dis-sociative via N-H bond breaking. N 1s XPS �Refs. 5 and 9�combined with theoretical calculations23 indicates that mo-lecular decomposition is limited to the formation of Si-NH2and Si-H groups on Si�001�. The molecular adsorptionstate—the molecule donates its lone pair to the electrophilic“down” dimer atom—is a metastable intermediate state ob-served by STM only in very small amounts at 65 K,8 in
contrast to the case of tertiary amines that can remainblocked in this state at 300 K.17–20
On the other hand, there is general consensus neither onthe adsorption sites of the molecular fragments nor on therelative distribution of the various possible adsorption pat-terns. Indeed NH2 and H can be attached either to the samedimer �“on-dimer” configuration� or to two adjacent dimerspertaining to the same row �“interdimer” configuration�. On-dimer dissociation leads to a nitrogen saturation coverage of0.5 monolayer �ML�, that is, one molecule per dimer, a valuecompatible with ammonia uptake measurements2
�0.50�0.15 ML�. Recent STM images published by Owenet al.10 and Bowler and Owen11 are interpreted in terms of“on-dimer” NH2 and H adducts displaying different contrasts�NH2 is “brighter” than H for a −2 V sample bias�: NH2groups would align on the same side of a dimer row �linearmode� or on alternating sides �zigzag mode� �see Fig. 1� witha statistical ratio linear:zigzag close to 1:1 for adsorption at300 K.10 However, Chung et al.12,14,16 challenged the preced-ing interpretation of linear patterns: they are reinterpreted asresulting from “interdimer” reactions, with H and NH2 frag-ments on the same side of the row and silicon danglingbonds on the opposite side. The work by Chung et al.12,14
pointed also to a large dominance of zigzag patterns at 300 Kat high coverage, in contrast to Refs. 10 and 11.
Neither is there any agreement from infrared studies onthe relative distribution of the zigzag and linear patterns. Theinfrared studies are based on the sensitivity of the Si-Hstretching frequency toward H bond formation between ad-
PHYSICAL REVIEW B 79, 205317 �2009�
1098-0121/2009/79�20�/205317�13� ©2009 The American Physical Society205317-1
jacent NH2 in on-dimer linear patterns. An earlier study wasindicative of a zigzag absorption mode,7 while a recentwork13 points to a majority of “linear patterns”�linear:zigzag=2:1�. As shown in the theoretical work byRignanese and Pasquarello,24 N 1s XPS would be able todetect directly the formation of hydrogen bonds in aminepairs placed on the same side of the dimer row. By perform-ing a periodic density-functional theory �DFT� calculation,within the “pure” generalized gradient approximation�GGA�, Rignanese and Pasquarello found that for a nitrogen-nitrogen distance of 3.42 Å, the H donor and H acceptornitrogen 1s binding energies are split by 0.4 eV. The H ac-ceptor nitrogen has the highest binding energy. The sizableimpact of a relatively weak H bonding on core-level bindingenergies has been further confirmed by a recent hybrid DFT�Becke 3-parameters Lee-Yang-Parr �B3LYP� exchange-correlation functional� quantum chemistry work by ourgroup on a similar system, water-dosed Si�001�-2�1 thatexhibits Si-H and Si-OH moieties.25 The O 1s binding en-ergy is split by 0.28 eV between paired H-acceptor/H-donorhydroxyls, with an O-O distance of 3.373 Å �close to theN-N distance calculated in Ref. 24�. In fact, as no doubletwas observed in the already published experimental N 1sXPS spectra of the ammonia-dosed surface,5 Rignanese andPasquarello24 concluded that DFT calculations lend little
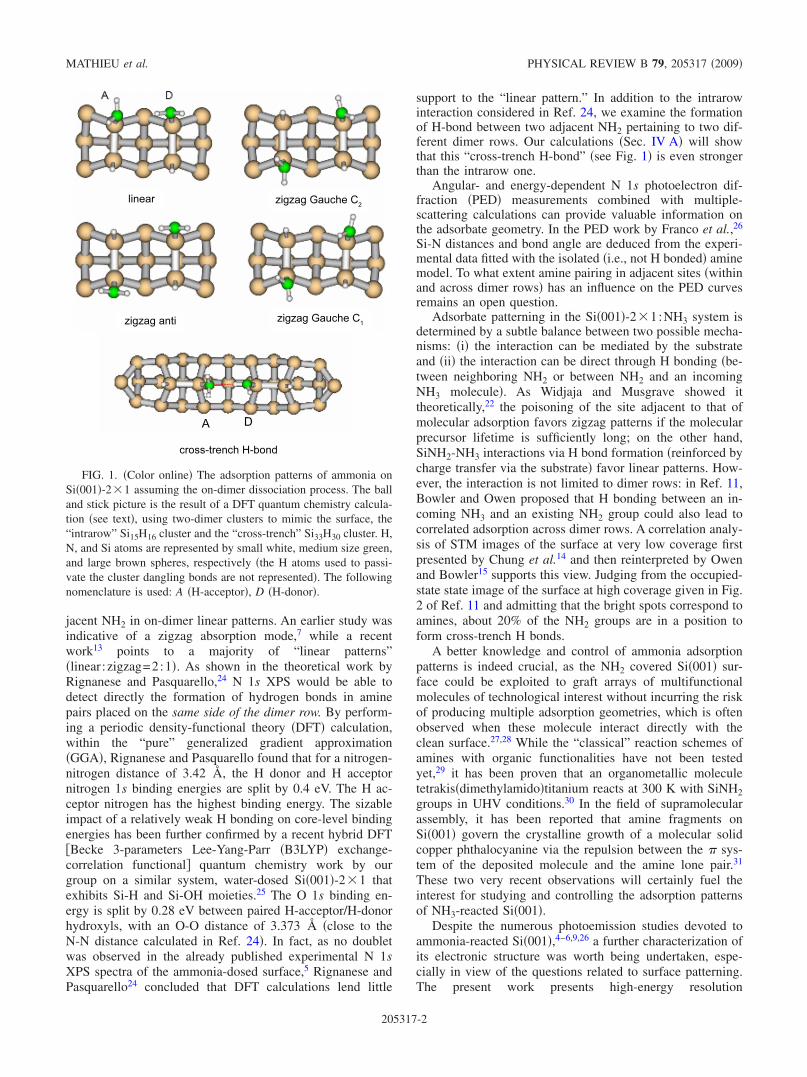
support to the “linear pattern.” In addition to the intrarowinteraction considered in Ref. 24, we examine the formationof H-bond between two adjacent NH2 pertaining to two dif-ferent dimer rows. Our calculations �Sec. IV A� will showthat this “cross-trench H-bond” �see Fig. 1� is even strongerthan the intrarow one.
Angular- and energy-dependent N 1s photoelectron dif-fraction �PED� measurements combined with multiple-scattering calculations can provide valuable information onthe adsorbate geometry. In the PED work by Franco et al.,26
Si-N distances and bond angle are deduced from the experi-mental data fitted with the isolated �i.e., not H bonded� aminemodel. To what extent amine pairing in adjacent sites �withinand across dimer rows� has an influence on the PED curvesremains an open question.
Adsorbate patterning in the Si�001�-2�1:NH3 system isdetermined by a subtle balance between two possible mecha-nisms: �i� the interaction can be mediated by the substrateand �ii� the interaction can be direct through H bonding �be-tween neighboring NH2 or between NH2 and an incomingNH3 molecule�. As Widjaja and Musgrave showed ittheoretically,22 the poisoning of the site adjacent to that ofmolecular adsorption favors zigzag patterns if the molecularprecursor lifetime is sufficiently long; on the other hand,SiNH2-NH3 interactions via H bond formation �reinforced bycharge transfer via the substrate� favor linear patterns. How-ever, the interaction is not limited to dimer rows: in Ref. 11,Bowler and Owen proposed that H bonding between an in-coming NH3 and an existing NH2 group could also lead tocorrelated adsorption across dimer rows. A correlation analy-sis of STM images of the surface at very low coverage firstpresented by Chung et al.14 and then reinterpreted by Owenand Bowler15 supports this view. Judging from the occupied-state state image of the surface at high coverage given in Fig.2 of Ref. 11 and admitting that the bright spots correspond toamines, about 20% of the NH2 groups are in a position toform cross-trench H bonds.
A better knowledge and control of ammonia adsorptionpatterns is indeed crucial, as the NH2 covered Si�001� sur-face could be exploited to graft arrays of multifunctionalmolecules of technological interest without incurring the riskof producing multiple adsorption geometries, which is oftenobserved when these molecule interact directly with theclean surface.27,28 While the “classical” reaction schemes ofamines with organic functionalities have not been testedyet,29 it has been proven that an organometallic moleculetetrakis�dimethylamido�titanium reacts at 300 K with SiNH2groups in UHV conditions.30 In the field of supramolecularassembly, it has been reported that amine fragments onSi�001� govern the crystalline growth of a molecular solidcopper phthalocyanine via the repulsion between the � sys-tem of the deposited molecule and the amine lone pair.31
These two very recent observations will certainly fuel theinterest for studying and controlling the adsorption patternsof NH3-reacted Si�001�.
Despite the numerous photoemission studies devoted toammonia-reacted Si�001�,4–6,9,26 a further characterization ofits electronic structure was worth being undertaken, espe-cially in view of the questions related to surface patterning.The present work presents high-energy resolution
FIG. 1. �Color online� The adsorption patterns of ammonia onSi�001�-2�1 assuming the on-dimer dissociation process. The balland stick picture is the result of a DFT quantum chemistry calcula-tion �see text�, using two-dimer clusters to mimic the surface, the“intrarow” Si15H16 cluster and the “cross-trench” Si33H30 cluster. H,N, and Si atoms are represented by small white, medium size green,and large brown spheres, respectively �the H atoms used to passi-vate the cluster dangling bonds are not represented�. The followingnomenclature is used: A �H-acceptor�, D �H-donor�.
MATHIEU et al. PHYSICAL REVIEW B 79, 205317 �2009�
205317-2
��80 meV� XPS and original near-edge x-ray absorptionfine-structure �NEXAFS� spectroscopy32 data. NEXAFS,which was still lacking to the ensemble of spectroscopiesapplied to the present system, probes the empty states of psymmetry localized around the core-excited nitrogen. In thisrespect, NEXAFS is complementary to the valence-bandphotoemission that probes occupied states, however, with thedrawback of mixing adsorbate and substrate contributions.Using linearly polarized radiation and carrying out angle-dependent measurements of the absorption intensity, NEX-AFS gives information on the spatial orientation of the un-occupied molecular orbitals �UMOs�.32 The XPS andNEXAFS experimental data were interpreted in the light of ahybrid functional DFT calculation of adsorption geometriesand core-ionized/core-excited states. Given the present ex-perimental resolution, a special attention was devoted to thesimulation of the XPS N 1s spectrum, including vibrationalbroadening and H-bond induced binding-energy shifts. Thecalculation of the NEXAFS N 1s transition energies has en-abled an unambiguous attribution of the main experimentalspectral features to a set of unoccupied antibonding orbitals.Finally, the NEXAFS spectra �in the framework of the dipo-lar approximation� have been computed for various adsorp-tion patterns and their theoretical dichroic behavior com-pared with the experimental one.
II. EXPERIMENT
A. Setup and sample preparation
The experiments have been performed at TEMPObeamline33 SOLEIL synchrotron facility �Saint Aubin,France�. The radiation source is an Apple II type insertiondevices �HU80�. The photon energy selection is obtained bysimply rotating “variable line spacing” plane gratings. Theresolving power E /�E is better than 15000 on the wholeenergy range �50–1500 eV�. 90% of the photon intensity isfocused in a spot 45 �m long in the horizontal direction and5–10 �m wide in the vertical dimension using two mirrorsin a Wolter configuration �a spherical mirror is directly fol-lowed by a toroidal mirror and the photon beam is deviatedhorizontally�.
The beamline is equipped with an end station dedicated toelectron spectroscopy studies of surfaces. The analysis cham-ber �base pressure=10−10 mbar� is equipped with aSCIENTA-200 electron analyzer, fitted with a new delay-linetwo-dimensional �2D� detector, designed and commercial-ized by the Instrumentation and Detectors Laboratory ofELETTRA Synchrotron Facility �Trieste, Italy�. A UHVpreparation chamber fitted with a heating stage is connectedto the analysis chamber.
To take a full advantage of the capability of N 1s NEX-AFS spectroscopy to determine NH2 bond orientations, theammonia molecule needs to be deposited on a single-domainvicinal surface. It is well known that on-axis nominal �001�surfaces consist of 2�1 and 1�2 domains in equal quanti-ties, with the dimer rows of one domain running perpendicu-lar to the dimer rows of the other. On the other hand, a
vicinal Si�001� surface cut by 5° off �001� axis toward �11̄0�
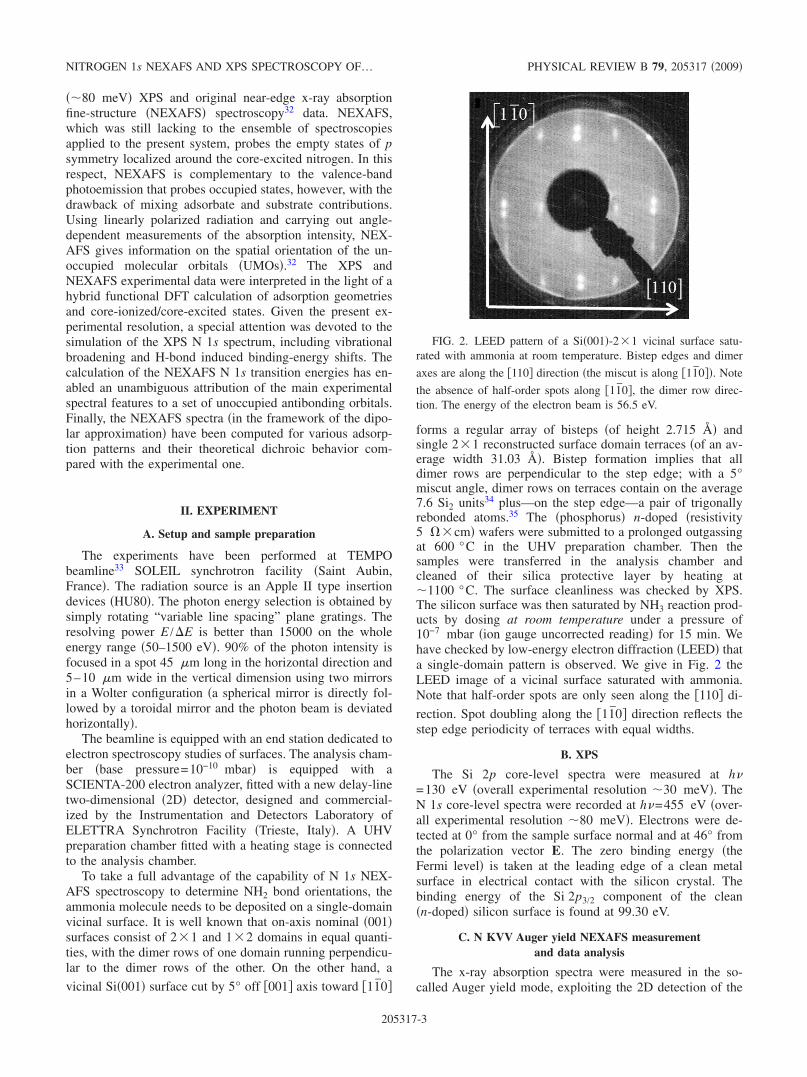
forms a regular array of bisteps �of height 2.715 Å� andsingle 2�1 reconstructed surface domain terraces �of an av-erage width 31.03 Å�. Bistep formation implies that alldimer rows are perpendicular to the step edge; with a 5°miscut angle, dimer rows on terraces contain on the average7.6 Si2 units34 plus—on the step edge—a pair of trigonallyrebonded atoms.35 The �phosphorus� n-doped �resistivity5 ��cm� wafers were submitted to a prolonged outgassingat 600 °C in the UHV preparation chamber. Then thesamples were transferred in the analysis chamber andcleaned of their silica protective layer by heating at�1100 °C. The surface cleanliness was checked by XPS.The silicon surface was then saturated by NH3 reaction prod-ucts by dosing at room temperature under a pressure of10−7 mbar �ion gauge uncorrected reading� for 15 min. Wehave checked by low-energy electron diffraction �LEED� thata single-domain pattern is observed. We give in Fig. 2 theLEED image of a vicinal surface saturated with ammonia.Note that half-order spots are only seen along the �110� di-
rection. Spot doubling along the �11̄0� direction reflects thestep edge periodicity of terraces with equal widths.
B. XPS
The Si 2p core-level spectra were measured at h�=130 eV �overall experimental resolution �30 meV�. TheN 1s core-level spectra were recorded at h�=455 eV �over-all experimental resolution �80 meV�. Electrons were de-tected at 0° from the sample surface normal and at 46° fromthe polarization vector E. The zero binding energy �theFermi level� is taken at the leading edge of a clean metalsurface in electrical contact with the silicon crystal. Thebinding energy of the Si 2p3/2 component of the clean�n-doped� silicon surface is found at 99.30 eV.
C. N KVV Auger yield NEXAFS measurementand data analysis
The x-ray absorption spectra were measured in the so-called Auger yield mode, exploiting the 2D detection of the
FIG. 2. LEED pattern of a Si�001�-2�1 vicinal surface satu-rated with ammonia at room temperature. Bistep edges and dimer
axes are along the �110� direction �the miscut is along �11̄0��. Note
the absence of half-order spots along �11̄0�, the dimer row direc-tion. The energy of the electron beam is 56.5 eV.
NITROGEN 1s NEXAFS AND XPS SPECTROSCOPY OF… PHYSICAL REVIEW B 79, 205317 �2009�
205317-3
electron analyzer, operated in the so-called “fixed mode.”The pass energy was set to 200 V, so that the nitrogen KVVAuger yield could be measured within an energy window of�12 eV centered at a kinetic energy of 375 eV. The photonenergy was scanned in the 395–420 eV range. As the surfacenitrogen coverage is low ��0.5 ML�, a photon bandwidth of80 meV was chosen to obtain good Auger yield statisticswithin reasonable acquisition times �typically 30 min�.
The raw N KVV Auger yield spectra from the ammonia-reacted sample were divided by the reference grid currentthat monitors the x-ray intensity variation with h�. To avoidstrong variations in photon intensity versus photon energydue to the undulator peak, the synchronous scanning of un-dulator gap and monochromator was made. The photon fluxincreased smoothly by only 30% between h�=395 eV andh�=420 eV. This ensured a very reliable normalization pro-cedure, which consists in plotting curves having an equalabsorption jump, just before the edge �395 eV� and �30 eVafter.
Finally, the photon energy was calibrated by subtractingthe kinetic energy of Si 2p photoelectrons excited by first-order radiation �h�� to that of Si 2p photoelectrons excitedby the second-order radiation �2�h��. To check forsynchrotron-radiation damage beam effects, we comparedsystematically the shape of the N 1s XPS spectra before andafter the x-ray absorption measurements.
The vicinal surface we used enabled NEXAFS measure-ments with the electric field vector E of the radiation placed
at 20° from the surface normal within the �11̄0� plane �graz-ing incidence� and placed in the surface plane �normal inci-dence�. For the in-plane geometry, E was positioned eitherorthogonal �along �110�� or parallel to the dimer rows �along
�11̄0��, by rotating azimuthally the sample by 90°.
III. COMPUTATIONAL
A. Adsorption geometries
We have started from the isolated amines using a one-dimer cluster �Si9H12�. Ignoring inter-row interactions, zig-zag and aligned �intrarow H-bonded� patterns have been re-produced, using a two-dimer-in-a-row cluster �Si15H16�. Across-trench two-dimer cluster �Si33H30� has been used toexamine the H-bond interaction between two amines pertain-ing to two adjacent dimer rows. The competition betweenintrarow and inter-row hydrogen bondings that need stilllarger silicon clusters has not been examined.
Electronic structure calculations were completed with theGAMESS�U.S.� �Ref. 36� software package using Becke threeparameter exchange functional,37 along with theLee-Yang-Parr38 gradient-corrected correlation functional�the so-called B3LYP functional�. We have used effectivecore potentials �due to Stevens, Basch, Krauss, and Jasien�SBJK� and built into the GAMESS package� for Si atoms, a6-31G� basis set for the terminating H atoms of the clusters,a 6-31G� plus three diffuse functions �one s and two p� forthe H atoms of the adsorbate, and a 6-311G� basis set �plustwo diffuse functions, one s and one p� for N. The addeddiffuse functions enable a better theoretical treatment of the
hydrogen bond, as we have verified in the case of the waterdimer ��H2O�2�.25 Besides the basis set choice, it is generallyadmitted that the hybrid approach gives better results thanthe pure GGA method in the calculation of H bonds, thelatter tending to overestimate the bond strength.39,40 Duringthe computation all silicon clusters were fully relaxed, exceptthe Si33H30 cluster for which the four Si atoms at the bottomwere kept at bulk lattice positions. The calculated adsorptiongeometries are shown in Fig. 1, while characteristic distancesand angles are collected in Table I.
For all models, the Si-N distance �1.75–1.77 Å� we findis consistent with the bond length deduced from the PEDstudy,26 that is, 1.73�0.08 Å. We calculate a Si-N bondangle relative to the surface normal of 21.2° for the gauchemodels in excellent accord with the PED value of 21° �4°.The angle we find for the “antimodel” �28.8°� is only 4° offthe interval of values given by PED. For the �intrarow� linearpattern, we calculate an N-N distance �a H-bond length� of3.55 Å, significantly shorter than the lattice spacing of
3.84 Å along the �11̄0� direction. This demonstrates the for-mation of a hydrogen bond �length 2.69 Å� between the twoamine groups. The N-N distance we find is longer �by �4%�than those calculated with a pure GGA functional, i.e.,3.44 Å in the work of Bowler and Owen11 and 3.42 Å in thework of Rignanese and Pasquarello.24 The comparison to theabove-mentioned periodic slab calculation also indicates thatthe �fully relaxed� cluster is not so “floppy” as to lead tounrealistic short distances. For its part, the cross-trenchH-bonded NH2 pair model �Si33H30 cluster� gives a N-Nbond distance �H-bond length� of 3.30 Å �2.27 Å� signifi-cantly smaller than that of the intrarow interaction.
Only optimized geometry energies calculated with thesame cluster size, that is, the two-dimer intrarow clusterSi15H16, can be consistently compared. They are also re-ported in Table I referenced to the linear model energy, thatis, the most stable structure. The three zigzag geometrieshave systematically higher energies than the linear pattern by0.050–0.070 eV �1.2–1.5 kcal/mol�. This calculated energydifference agrees with the previous quantum chemistryB3LYP calculation by Queeney et al.7 �1 kcal/mol� but islarger than that found by Rignanese and Pasquarello;24 0.5kcal/mol �0.02 eV� per 2�2 surface unit �a value that iswithin the accuracy of their method� with a GGA functional.The energy difference of +14 meV �0.3 kcal/mol� we findbetween the zigzag gauche-C2 and the zigzag anti �Fig. 1 andTable I� that lies within the accuracy range of our calculationis notably smaller than the value of 40 meV per 2�2 surfaceunit given in Ref. 41.
B. Core-excited and core-ionized calculations
The Franck-Condon �FC� principle states that during anelectronic transition the molecular geometry can be assumedto be unchanged. Within this framework, the ground-stateoptimized geometries we find following the procedure de-scribed in Sec. III A for the molecule plus Si cluster systemis the starting point of the calculation of ionization potentials�IPs� and NEXAFS transition energies. The quantum chemi-cal ab initio calculations of the N 1s excited states are also
MATHIEU et al. PHYSICAL REVIEW B 79, 205317 �2009�
205317-4
performed at a DFT level of theory.42,43 We used a modifiedversion of the GAMESS�U.S.� program, enabling �i� the choiceof a fractional occupancy for the core hole and �ii� the cal-culation of singlet core excited energy values.44
The excited atom was described with a large basis set. ForN we use the IGLOO-III basis, to which diffuse functions wereadded. For the H atoms, passivating the silicon cluster a6-31G� basis was used; for those of the adsorbate, diffusefunctions were added. For the calculation of N 1s IP �theso-called vertical transition energy�, the �Kohn-Shammethod �denoted hereafter �KS� is applied. The IP is thedifference between the energy of the excited state repre-sented by a core hole in the 1s orbital and that of the groundstate. Absolute values of NEXAFS transitions are also calcu-lated via the �KS procedure. The energy of the core-excitedstate is obtained by removing one electron from the 1s andadding one to the UMO of interest, i.e., by calculating theNEXAFS state �1s�1�UMO�1. Then the transition energy isobtained as the difference between the energy of the excitedstate and that of the ground state. The relativistic correctionof 0.3 eV is included, according to Triguero.45 The �KStriplet final-state transition energies are corrected using thesum method of Ziegler et al.46 to account for the spin con-servation in dipolar transitions leading to a singlet final state.�KS energies have been calculated for the molecular orbitalsleading to the major oscillator strengths �computed in theframework of the dipolar approximation�. A comparison be-tween the �KS calculation outputs can be made for the vari-ous adsorption models we have considered.
While this separate state Kohn-Sham scheme is a conve-nient and accurate option for IP and first core-excited transi-tion energies calculations, it is not always applicable to cal-culate the whole x-ray absorption spectrum due to problemsof collapse in optimizing higher-excited states. To circum-
vent this difficulty, we diagonalize a potential built from or-bitals where a 1s electron is removed �the full core hole isdenoted FCH� and put into one UMO or “distributed” intomore UMOs—in the latter case, their occupancy is frac-tional. The excited electronic levels are then determined bythe electrostatic field of the remaining molecular system. Theeigenvalues and eigenvectors give the full spectrum of exci-tation energies and moments. The transition energy is simplythe difference between the energy of the virtual orbital andthat of the 1s orbital and the oscillator strengths are obtainedfrom the eigenvectors within the dipolar approximation.
An ad hoc FCH-UMOs potential is found �i� when therelative difference between the various energies correspondsto the calculated �KS ones and �ii� when the oscillatorstrengths �dipolar approximation� compare to those of the�KS method. As the absolute values of the energies may be0.5–1 eV off the �KS �and experimental� ones, the NEXAFSspectra are repositioned on an absolute energy scale providedby the energy of the first bound excited state calculated withthe �KS method described here above. Below the calculatedIP, the NEXAFS spectrum consists of the discrete lines cal-culated by method broadened by convolution with a Gauss-ian of 0.8 eV full width at half maximum �FWHM�. Fortransitions calculated above IP, we convert the discrete linesinto a continuum using the Stieltjes imaging procedure47 �thecalculated continuum cross section is convoluted with thesame Gaussian function used for the discrete part below IP�.
C. Vibrational fine structure of N 1s XPS spectraand its calculation
The theoretical analysis is based on the determination ofthe energy surface of the ground and the core-ionized states.To estimate the respective contributions of the Si-NH2 moi-
TABLE I. Calculated bond lengths d, N-N distances �in Å�, bond angles, and dihedral angles �in degree� obtained from the geometryoptimizations shown in Fig. 1. B3LYP hybrid functional, “large basis” sets �see Sec. III C� were used. Results of GGA periodic calculationsby Rignanese and Pasquarello �Ref. 24� and Bowler and Owen �Ref. 11� are given for comparison. For the H-donor group, � �� indicates thefree hydrogen, while � †� indicates the atom involved in the H bond. For calculations using the double-dimer Si15H16 clusters, optimizedstructure energies �in meV� are referenced to that of the most stable one: the linear pattern.
Pattern
Optimizedstructureenergy dSi-N dN-H dSi-H dH bond NN �Si-Si-N
Linear Si15H16 0 2.69,2.61a 3.55,3.42,b3.44a
acceptor 1.75�1.76� 1.013 1.50
donor 1.75�1.79� 1.011� /1.015† 1.50
Zigzag �anti� Si15H16 +52 1.75�1.76� 1.011 1.50 5.70 118.8
Zigzag �gauche- Si15H16 +66 1.75 1.011 1.49 5.21 111.2
C2�Zigzag �gauche- Si15H16 +50 1.75 1.012 1.49 4.79 5.41 111.2
C1�Cross trench Si15H16 1.51 2.27 3.30
acceptor 1.75 1.014 1.51 120.9
donor 1.75 1.017� /1.022† 1.51 112.25
aReference 11.bReference 24.
NITROGEN 1s NEXAFS AND XPS SPECTROSCOPY OF… PHYSICAL REVIEW B 79, 205317 �2009�
205317-5
ety and of the underlying silicon substrate to the vibrationalbroadening, we have calculated the equilibrium geometriesand vibrational frequencies48 of three models NH2-SiH3,NH2-Si-�SiH3�3, and H2N-Si9H12 characterized by an in-creasing size in the silicon cluster that approximates the sub-strate. A detailed Franck-Condon analysis of the spectra, asdeveloped in Ref. 49, has been carried out. The vibrationalwave function for the core-excited state is assumed to be aproduct of 3N-6 one-dimensional harmonic oscillators�where N is the number of nuclei� that are described either bythe same or different normal coordinates and sets of frequen-cies as those of the ground state. The analytical approach isbased on the expression of the overlap between two productsof harmonic oscillators, where the full core-ionizedpotential-energy surface is displaced from the ground-stateequilibrium position. In order to speed up the calculation, the6-31G� basis set optimized by Carniato and Millié50 and Car-niato and Luo51 �referred hereafter as “small bases”� hasbeen used.
IV. RESULTS AND DISCUSSION
A. X-ray photoemission
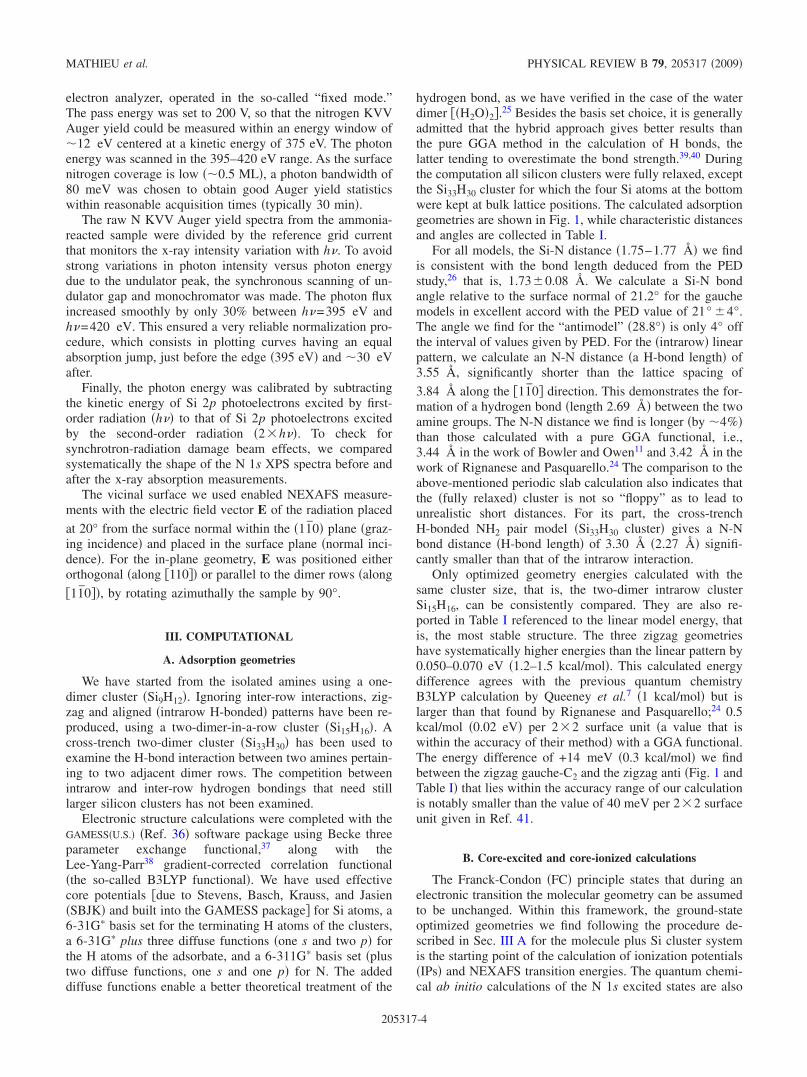
The Si 2p XPS core levels measured in surface sensitiveconditions at a photon energy of 130 eV �Ref. 52� are shownin Fig. 3. Reaction with ammonia �300 K, 10−7 mbar, and 15min� induces a sizable downward band bending: the bulkSi 2p3/2 binding-energy shifts from 99.30 eV �clean surface�to 99.63 �eV� �ammonia-dosed surface�. The disappearanceof the outer-dimer-atom component �at −0.50 eV from thebulk Si 2p3/2 component of the clean surface� indicates thatthe surface is saturated. As the coverage is close to one NH2per dimer �saturation�, all the necessary conditions are gath-ered to observe possible effects of hydrogen pairing in linearadsorption patterns on N 1s XPS and NEXAFS spectra.
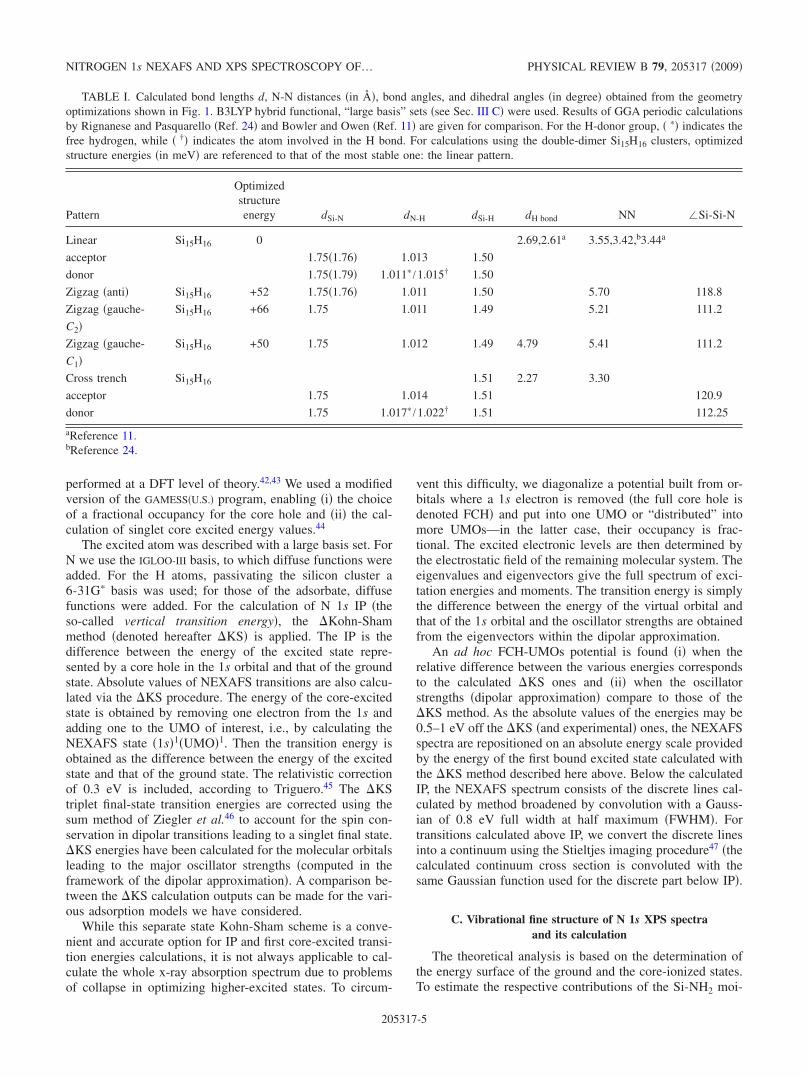
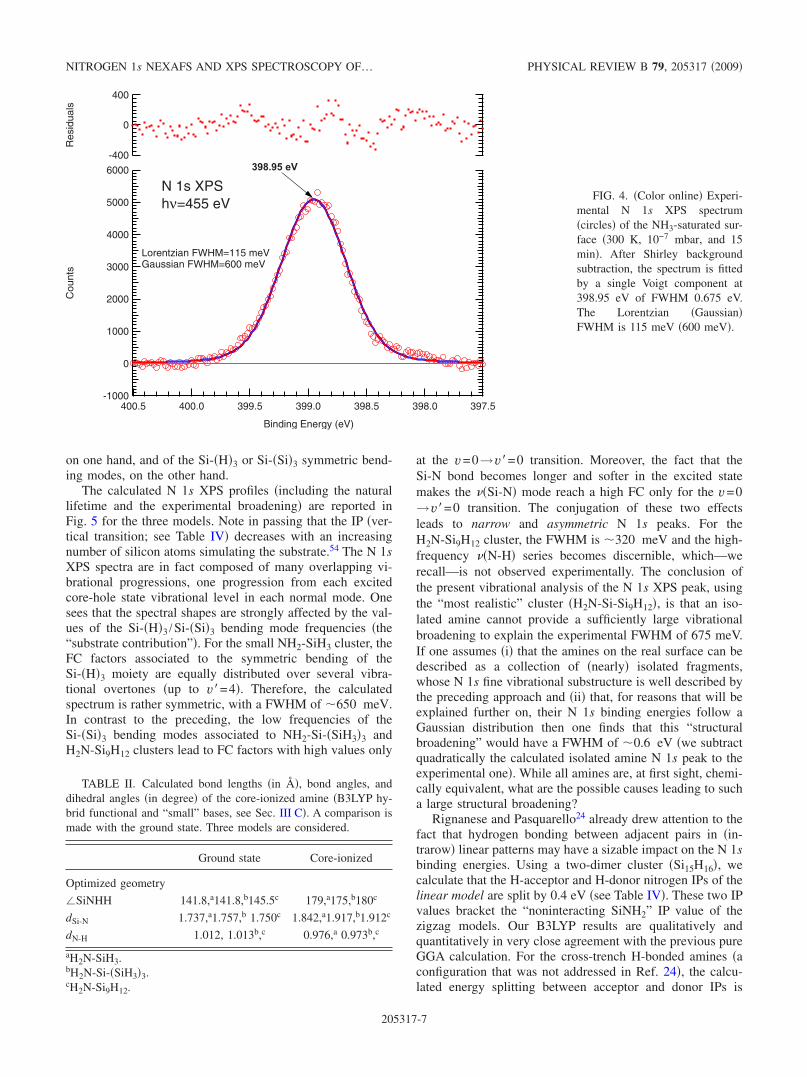
The N 1s core level of the saturated surface we havemeasured at h�=455 eV is given in Fig. 4. The peak can befitted by a single Voigt component peaked at a binding en-ergy of 398.95 eV. This binding energy is characteristic of
Si-NH2 fragments.5,9,23 We do not detect NHx�x2� speciesthat should be found at lower binding energies �from −0.6 to−1.3 eV according to the degree of dehydrogenation23�. Thisindicates that the molecular dissociation on a vicinalsurface—that besides terrace dimers, presents bistep edgesites �pairs of trigonally bonded silicons� amounting to11.6% of all the reaction sites of the vicinal surface—is notdifferent from the one observed on a nominal surface.
The overall width of the N 1s Voigt profile is 0.675 eV�we take a Lorentzian lifetime width of 115 meV, as for N2,53
and a Gaussian width of 600 meV�. Despite the experimentalresolution �80 meV�, we do not observe vibrational series inthis symmetric N 1s peak. The N 1s peak is narrower thanthose previously measured �0.75 eV9� on the Si�001� sur-face. Considering the instrumental resolution of 80 meV, aGaussian inhomogeneous broadening �encompassing struc-tural plus vibrational contributions� of 595 meV is deduced.The sources of inhomogeneous broadening are of two types:�i� vibrational and �ii� structural.
Let us first examine the vibrational aspect. As a first step,we have calculated how vibrations could contribute to the N1s XPS spectrum breadth of an isolated amine, following theprocedure described in Sec. III C. In the core-ionized state,the molecular fragment changes its geometry. For all threemodels �H2N-SiH3, H2N-Si�SiH3�3, and H2N-Si9H12; seeTable II�, we note �i� a depyramidalization of the Si-NH2 unit�the four atoms become coplanar�, �ii� a N-H bond-lengthreduction of 3.7% �0.973 Å instead of �1.01 Å in theground state�, and �iii� a strong increase �9%� in the Si-Nbond length ��1.91 Å instead of �1.75 Å in the groundstate for H2N-Si�SiH3�3, and H2N-Si9H12 models�. Changesin frequencies upon core ionization are reported in Table III.The remarkable fact is the strong decrease in ��Si-N� fre-quency �from 822 to 531 cm−1 for the H2N-Si9H12 cluster�associated with the elongation of the bond. The FC factorsare calculated taking into account the different sets of vibra-tional frequencies for the core-ionized and ground state. Thevalues of the FC factors indicate that the N 1s XPS vibra-tional profile is determined by the simultaneous excitation of��Si-N� and of �high-frequency� ��N-H� stretching modes,
1.0
0.8
0.6
0.4
0.2
0.0
Pho
toem
issi
onIn
tens
ity(A
rbitr
ary
Uni
ts)
3 2 1 0 -1 -2Binding Energy, retative to clean surface bulk Si2p3/2 (eV)
clean surfaceammonia-dosed surface
Si+
(Si 2p3/2)
surfacestates
Si 2p XPShν=130 eV
FIG. 3. �Color online� XPS Si2p spectra of the clean surface�solid line� and of the reacted sur-face �dotted line� after exposure toammonia under a pressure of10−7 mbar for 15 min �300 K�.The photon energy was 130 eV.The bulk line Si 2p3/2 binding en-ergy of the clean surface �99.30eV from EF� is taken as referenceenergy. Note the completequenching of the surface statesand the associated downwardband bending �330 meV�; thegrowth of the Si+ state �at+0.78 eV from the bulk line ofthe ammonia-reacted surface�.
MATHIEU et al. PHYSICAL REVIEW B 79, 205317 �2009�
205317-6
on one hand, and of the Si-�H�3 or Si-�Si�3 symmetric bend-ing modes, on the other hand.
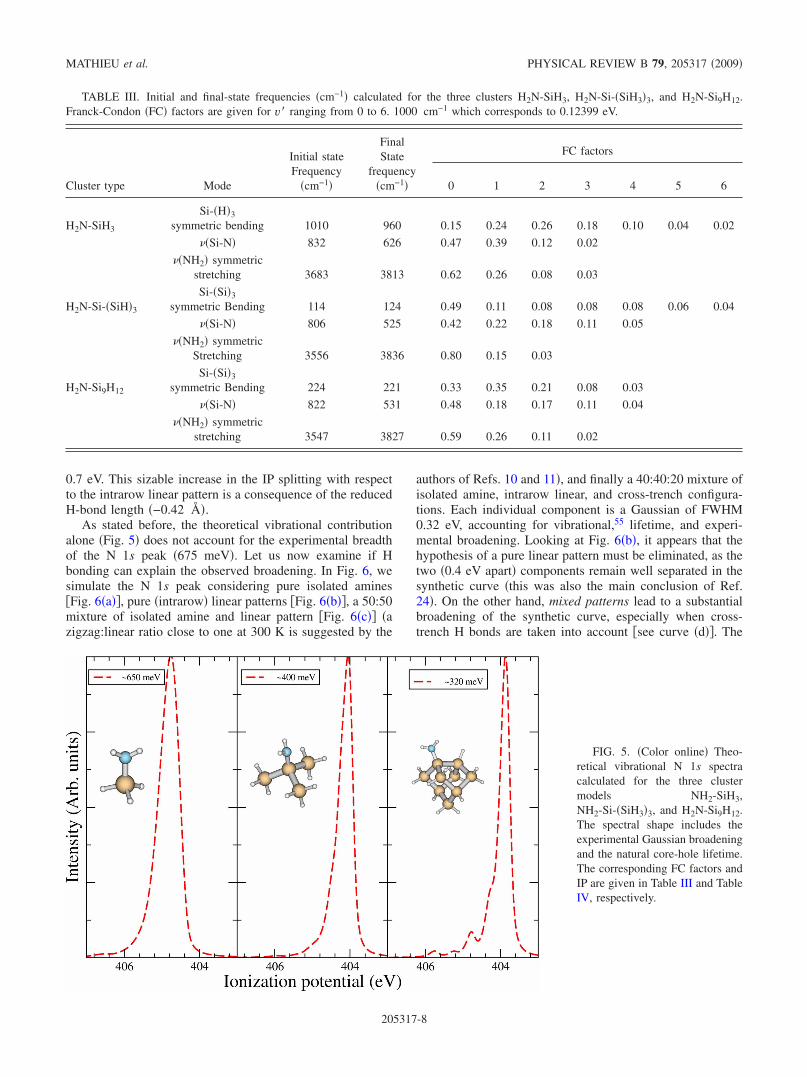
The calculated N 1s XPS profiles �including the naturallifetime and the experimental broadening� are reported inFig. 5 for the three models. Note in passing that the IP �ver-tical transition; see Table IV� decreases with an increasingnumber of silicon atoms simulating the substrate.54 The N 1sXPS spectra are in fact composed of many overlapping vi-brational progressions, one progression from each excitedcore-hole state vibrational level in each normal mode. Onesees that the spectral shapes are strongly affected by the val-ues of the Si-�H�3 /Si-�Si�3 bending mode frequencies �the“substrate contribution”�. For the small NH2-SiH3 cluster, theFC factors associated to the symmetric bending of theSi-�H�3 moiety are equally distributed over several vibra-tional overtones �up to v�=4�. Therefore, the calculatedspectrum is rather symmetric, with a FWHM of �650 meV.In contrast to the preceding, the low frequencies of theSi-�Si�3 bending modes associated to NH2-Si-�SiH3�3 andH2N-Si9H12 clusters lead to FC factors with high values only
at the v=0→v�=0 transition. Moreover, the fact that theSi-N bond becomes longer and softer in the excited statemakes the ��Si-N� mode reach a high FC only for the v=0→v�=0 transition. The conjugation of these two effectsleads to narrow and asymmetric N 1s peaks. For theH2N-Si9H12 cluster, the FWHM is �320 meV and the high-frequency ��N-H� series becomes discernible, which—werecall—is not observed experimentally. The conclusion ofthe present vibrational analysis of the N 1s XPS peak, usingthe “most realistic” cluster �H2N-Si-Si9H12�, is that an iso-lated amine cannot provide a sufficiently large vibrationalbroadening to explain the experimental FWHM of 675 meV.If one assumes �i� that the amines on the real surface can bedescribed as a collection of �nearly� isolated fragments,whose N 1s fine vibrational substructure is well described bythe preceding approach and �ii� that, for reasons that will beexplained further on, their N 1s binding energies follow aGaussian distribution then one finds that this “structuralbroadening” would have a FWHM of �0.6 eV �we subtractquadratically the calculated isolated amine N 1s peak to theexperimental one�. While all amines are, at first sight, chemi-cally equivalent, what are the possible causes leading to sucha large structural broadening?
Rignanese and Pasquarello24 already drew attention to thefact that hydrogen bonding between adjacent pairs in �in-trarow� linear patterns may have a sizable impact on the N 1sbinding energies. Using a two-dimer cluster �Si15H16�, wecalculate that the H-acceptor and H-donor nitrogen IPs of thelinear model are split by 0.4 eV �see Table IV�. These two IPvalues bracket the “noninteracting SiNH2” IP value of thezigzag models. Our B3LYP results are qualitatively andquantitatively in very close agreement with the previous pureGGA calculation. For the cross-trench H-bonded amines �aconfiguration that was not addressed in Ref. 24�, the calcu-lated energy splitting between acceptor and donor IPs is
6000
5000
4000
3000
2000
1000
0
-1000
Cou
nts
400.5 400.0 399.5 399.0 398.5 398.0 397.5
Binding Energy (eV)
-400
0
400
Res
idua
ls
� � � � � � � �
N 1s XPShν=455 eV
Lorentzian FWHM=115 meVGaussian FWHM=600 meV
FIG. 4. �Color online� Experi-mental N 1s XPS spectrum�circles� of the NH3-saturated sur-face �300 K, 10−7 mbar, and 15min�. After Shirley backgroundsubtraction, the spectrum is fittedby a single Voigt component at398.95 eV of FWHM 0.675 eV.The Lorentzian �Gaussian�FWHM is 115 meV �600 meV�.
TABLE II. Calculated bond lengths �in Å�, bond angles, anddihedral angles �in degree� of the core-ionized amine �B3LYP hy-brid functional and “small” bases, see Sec. III C�. A comparison ismade with the ground state. Three models are considered.
Ground state Core-ionized
Optimized geometry
�SiNHH 141.8,a141.8,b145.5c 179,a175,b180c
dSi-N 1.737,a1.757,b 1.750c 1.842,a1.917,b1.912c
dN-H 1.012, 1.013b,c 0.976,a 0.973b,c
aH2N-SiH3.bH2N-Si-�SiH3�3.cH2N-Si9H12.
NITROGEN 1s NEXAFS AND XPS SPECTROSCOPY OF… PHYSICAL REVIEW B 79, 205317 �2009�
205317-7
0.7 eV. This sizable increase in the IP splitting with respectto the intrarow linear pattern is a consequence of the reducedH-bond length �−0.42 Å�.
As stated before, the theoretical vibrational contributionalone �Fig. 5� does not account for the experimental breadthof the N 1s peak �675 meV�. Let us now examine if Hbonding can explain the observed broadening. In Fig. 6, wesimulate the N 1s peak considering pure isolated amines�Fig. 6�a��, pure �intrarow� linear patterns �Fig. 6�b��, a 50:50mixture of isolated amine and linear pattern �Fig. 6�c�� �azigzag:linear ratio close to one at 300 K is suggested by the
authors of Refs. 10 and 11�, and finally a 40:40:20 mixture ofisolated amine, intrarow linear, and cross-trench configura-tions. Each individual component is a Gaussian of FWHM0.32 eV, accounting for vibrational,55 lifetime, and experi-mental broadening. Looking at Fig. 6�b�, it appears that thehypothesis of a pure linear pattern must be eliminated, as thetwo �0.4 eV apart� components remain well separated in thesynthetic curve �this was also the main conclusion of Ref.24�. On the other hand, mixed patterns lead to a substantialbroadening of the synthetic curve, especially when cross-trench H bonds are taken into account �see curve �d��. The
TABLE III. Initial and final-state frequencies �cm−1� calculated for the three clusters H2N-SiH3, H2N-Si-�SiH3�3, and H2N-Si9H12.Franck-Condon �FC� factors are given for v� ranging from 0 to 6. 1000 cm−1 which corresponds to 0.12399 eV.
Cluster type Mode
Initial stateFrequency
�cm−1�
FinalState
frequency�cm−1�
FC factors
0 1 2 3 4 5 6
H2N-SiH3
Si-�H�3
symmetric bending 1010 960 0.15 0.24 0.26 0.18 0.10 0.04 0.02
��Si-N� 832 626 0.47 0.39 0.12 0.02
��NH2� symmetricstretching 3683 3813 0.62 0.26 0.08 0.03
H2N-Si-�SiH�3
Si-�Si�3
symmetric Bending 114 124 0.49 0.11 0.08 0.08 0.08 0.06 0.04
��Si-N� 806 525 0.42 0.22 0.18 0.11 0.05
��NH2� symmetricStretching 3556 3836 0.80 0.15 0.03
H2N-Si9H12
Si-�Si�3
symmetric Bending 224 221 0.33 0.35 0.21 0.08 0.03
��Si-N� 822 531 0.48 0.18 0.17 0.11 0.04
��NH2� symmetricstretching 3547 3827 0.59 0.26 0.11 0.02
FIG. 5. �Color online� Theo-retical vibrational N 1s spectracalculated for the three clustermodels NH2-SiH3,NH2-Si-�SiH3�3, and H2N-Si9H12.The spectral shape includes theexperimental Gaussian broadeningand the natural core-hole lifetime.The corresponding FC factors andIP are given in Table III and TableIV, respectively.
MATHIEU et al. PHYSICAL REVIEW B 79, 205317 �2009�
205317-8
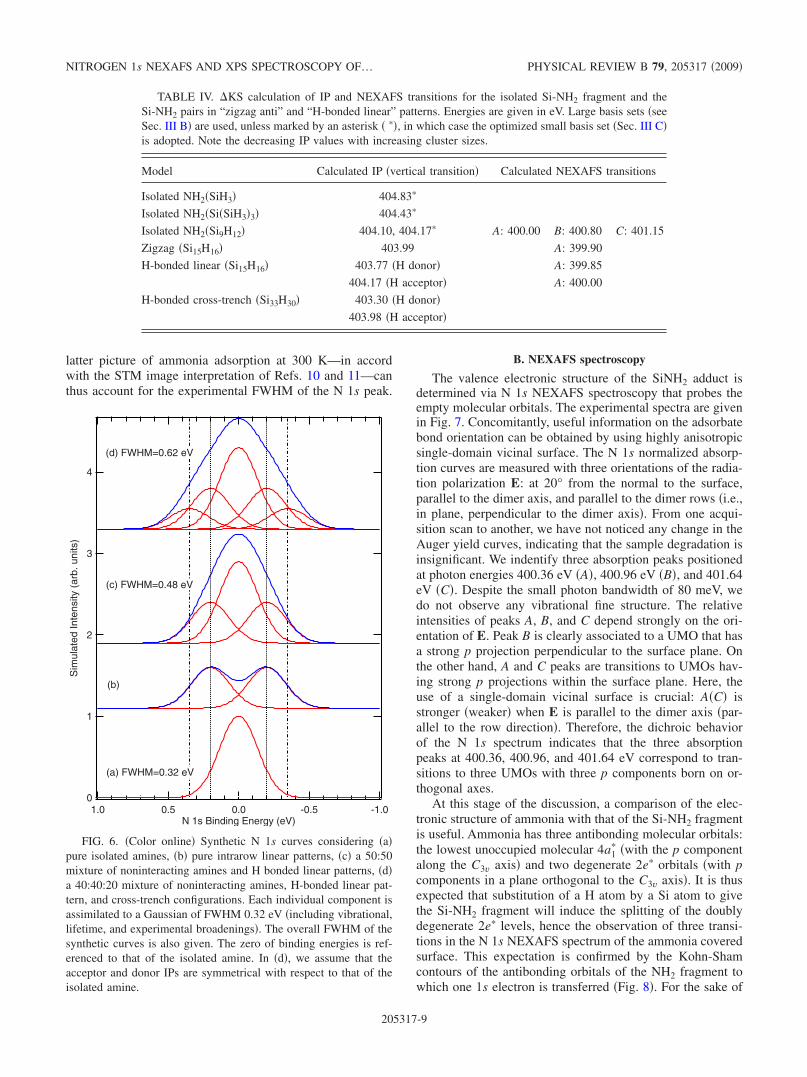
latter picture of ammonia adsorption at 300 K—in accordwith the STM image interpretation of Refs. 10 and 11—canthus account for the experimental FWHM of the N 1s peak.
B. NEXAFS spectroscopy
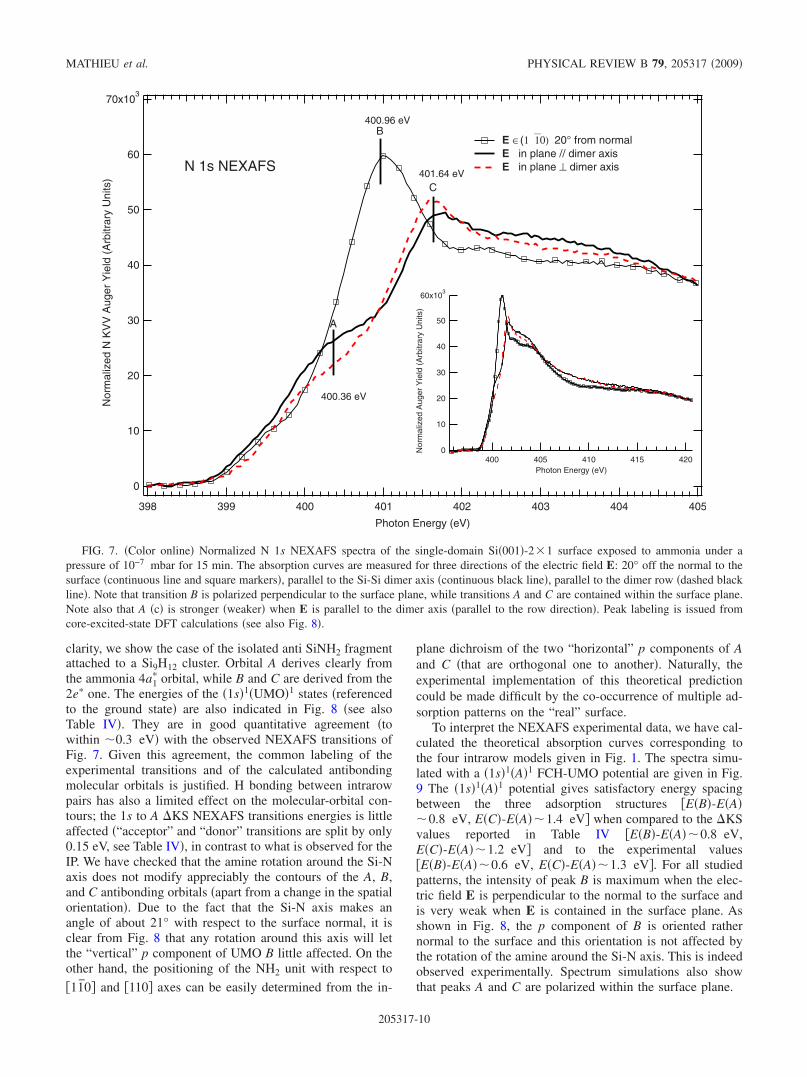
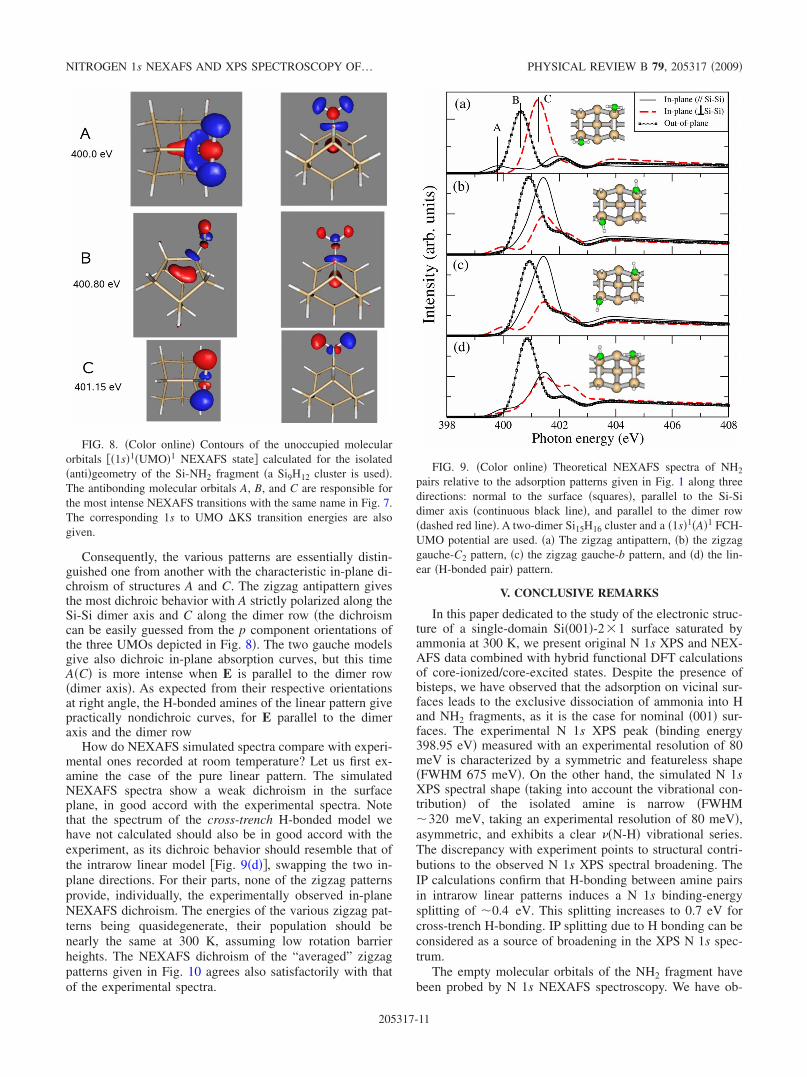
The valence electronic structure of the SiNH2 adduct isdetermined via N 1s NEXAFS spectroscopy that probes theempty molecular orbitals. The experimental spectra are givenin Fig. 7. Concomitantly, useful information on the adsorbatebond orientation can be obtained by using highly anisotropicsingle-domain vicinal surface. The N 1s normalized absorp-tion curves are measured with three orientations of the radia-tion polarization E: at 20° from the normal to the surface,parallel to the dimer axis, and parallel to the dimer rows �i.e.,in plane, perpendicular to the dimer axis�. From one acqui-sition scan to another, we have not noticed any change in theAuger yield curves, indicating that the sample degradation isinsignificant. We indentify three absorption peaks positionedat photon energies 400.36 eV �A�, 400.96 eV �B�, and 401.64eV �C�. Despite the small photon bandwidth of 80 meV, wedo not observe any vibrational fine structure. The relativeintensities of peaks A, B, and C depend strongly on the ori-entation of E. Peak B is clearly associated to a UMO that hasa strong p projection perpendicular to the surface plane. Onthe other hand, A and C peaks are transitions to UMOs hav-ing strong p projections within the surface plane. Here, theuse of a single-domain vicinal surface is crucial: A�C� isstronger �weaker� when E is parallel to the dimer axis �par-allel to the row direction�. Therefore, the dichroic behaviorof the N 1s spectrum indicates that the three absorptionpeaks at 400.36, 400.96, and 401.64 eV correspond to tran-sitions to three UMOs with three p components born on or-thogonal axes.
At this stage of the discussion, a comparison of the elec-tronic structure of ammonia with that of the Si-NH2 fragmentis useful. Ammonia has three antibonding molecular orbitals:the lowest unoccupied molecular 4a1
� �with the p componentalong the C3v axis� and two degenerate 2e� orbitals �with pcomponents in a plane orthogonal to the C3v axis�. It is thusexpected that substitution of a H atom by a Si atom to givethe Si-NH2 fragment will induce the splitting of the doublydegenerate 2e� levels, hence the observation of three transi-tions in the N 1s NEXAFS spectrum of the ammonia coveredsurface. This expectation is confirmed by the Kohn-Shamcontours of the antibonding orbitals of the NH2 fragment towhich one 1s electron is transferred �Fig. 8�. For the sake of
4
3
2
1
0
Sim
ulat
edIn
tens
ity(a
rb.u
nits
)
1.0 0.5 0.0 -0.5 -1.0N 1s Binding Energy (eV)
(a) FWHM=0.32 eV
(b)
(c) FWHM=0.48 eV
(d) FWHM=0.62 eV
FIG. 6. �Color online� Synthetic N 1s curves considering �a�pure isolated amines, �b� pure intrarow linear patterns, �c� a 50:50mixture of noninteracting amines and H bonded linear patterns, �d�a 40:40:20 mixture of noninteracting amines, H-bonded linear pat-tern, and cross-trench configurations. Each individual component isassimilated to a Gaussian of FWHM 0.32 eV �including vibrational,lifetime, and experimental broadenings�. The overall FWHM of thesynthetic curves is also given. The zero of binding energies is ref-erenced to that of the isolated amine. In �d�, we assume that theacceptor and donor IPs are symmetrical with respect to that of theisolated amine.
TABLE IV. �KS calculation of IP and NEXAFS transitions for the isolated Si-NH2 fragment and theSi-NH2 pairs in “zigzag anti” and “H-bonded linear” patterns. Energies are given in eV. Large basis sets �seeSec. III B� are used, unless marked by an asterisk � ��, in which case the optimized small basis set �Sec. III C�is adopted. Note the decreasing IP values with increasing cluster sizes.
Model Calculated IP �vertical transition� Calculated NEXAFS transitions
Isolated NH2�SiH3� 404.83�
Isolated NH2�Si�SiH3�3� 404.43�
Isolated NH2�Si9H12� 404.10, 404.17� A: 400.00 B: 400.80 C: 401.15
Zigzag �Si15H16� 403.99 A: 399.90
H-bonded linear �Si15H16� 403.77 �H donor� A: 399.85
404.17 �H acceptor� A: 400.00
H-bonded cross-trench �Si33H30� 403.30 �H donor�403.98 �H acceptor�
NITROGEN 1s NEXAFS AND XPS SPECTROSCOPY OF… PHYSICAL REVIEW B 79, 205317 �2009�
205317-9
clarity, we show the case of the isolated anti SiNH2 fragmentattached to a Si9H12 cluster. Orbital A derives clearly fromthe ammonia 4a1
� orbital, while B and C are derived from the2e� one. The energies of the �1s�1�UMO�1 states �referencedto the ground state� are also indicated in Fig. 8 �see alsoTable IV�. They are in good quantitative agreement �towithin �0.3 eV� with the observed NEXAFS transitions ofFig. 7. Given this agreement, the common labeling of theexperimental transitions and of the calculated antibondingmolecular orbitals is justified. H bonding between intrarowpairs has also a limited effect on the molecular-orbital con-tours; the 1s to A �KS NEXAFS transitions energies is littleaffected �“acceptor” and “donor” transitions are split by only0.15 eV, see Table IV�, in contrast to what is observed for theIP. We have checked that the amine rotation around the Si-Naxis does not modify appreciably the contours of the A, B,and C antibonding orbitals �apart from a change in the spatialorientation�. Due to the fact that the Si-N axis makes anangle of about 21° with respect to the surface normal, it isclear from Fig. 8 that any rotation around this axis will letthe “vertical” p component of UMO B little affected. On theother hand, the positioning of the NH2 unit with respect to
�11̄0� and �110� axes can be easily determined from the in-
plane dichroism of the two “horizontal” p components of Aand C �that are orthogonal one to another�. Naturally, theexperimental implementation of this theoretical predictioncould be made difficult by the co-occurrence of multiple ad-sorption patterns on the “real” surface.
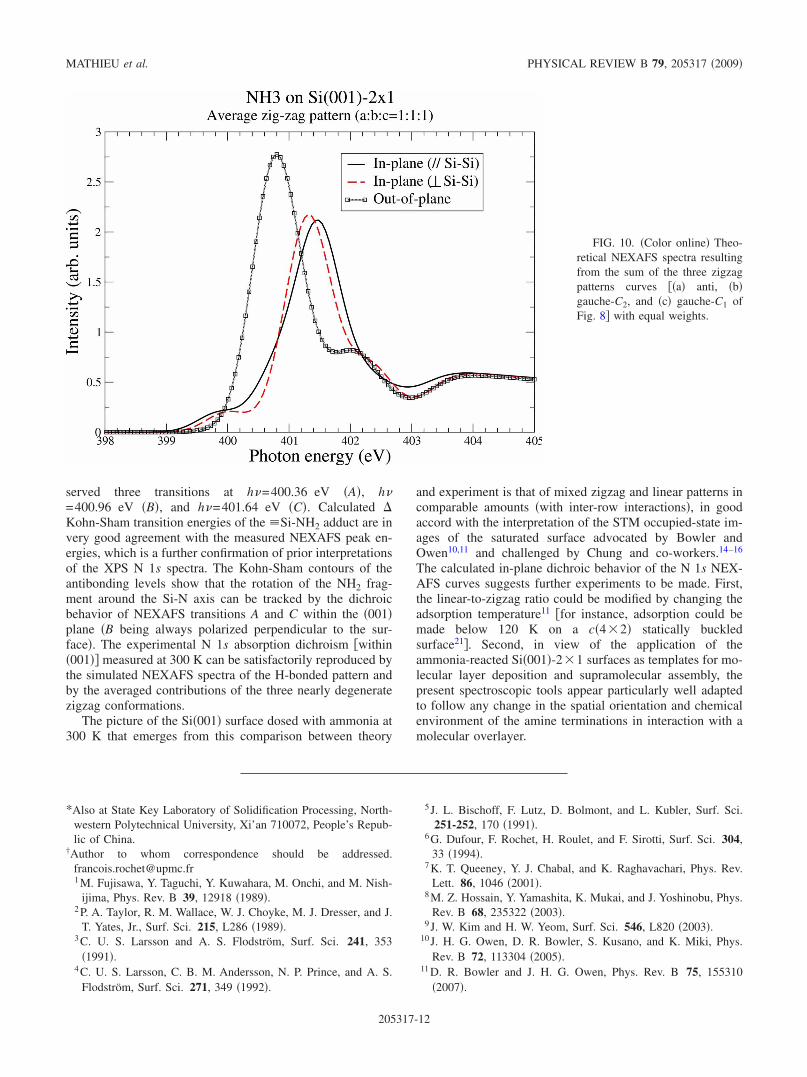
To interpret the NEXAFS experimental data, we have cal-culated the theoretical absorption curves corresponding tothe four intrarow models given in Fig. 1. The spectra simu-lated with a �1s�1�A�1 FCH-UMO potential are given in Fig.9 The �1s�1�A�1 potential gives satisfactory energy spacingbetween the three adsorption structures �E�B�-E�A��0.8 eV, E�C�-E�A��1.4 eV� when compared to the �KSvalues reported in Table IV �E�B�-E�A��0.8 eV,E�C�-E�A��1.2 eV� and to the experimental values�E�B�-E�A��0.6 eV, E�C�-E�A��1.3 eV�. For all studiedpatterns, the intensity of peak B is maximum when the elec-tric field E is perpendicular to the normal to the surface andis very weak when E is contained in the surface plane. Asshown in Fig. 8, the p component of B is oriented rathernormal to the surface and this orientation is not affected bythe rotation of the amine around the Si-N axis. This is indeedobserved experimentally. Spectrum simulations also showthat peaks A and C are polarized within the surface plane.
70x103
60
50
40
30
20
10
0
Nor
mal
ized
NK
VV
Aug
erY
ield
(Arb
itrar
yU
nits
)
405404403402401400399398
Photon Energy (eV)
60x103
50
40
30
20
10
0Nor
mal
ized
Aug
erY
ield
(Arb
itrar
yU
nits
)
420415410405400Photon Energy (eV)
400.96 eV
400.36 eV
401.64 eV
A
B
C
� ∈(1�10) 20° from normal� in plane // dimer axis� in plane ⊥ dimer axisN 1s NEXAFS
FIG. 7. �Color online� Normalized N 1s NEXAFS spectra of the single-domain Si�001�-2�1 surface exposed to ammonia under apressure of 10−7 mbar for 15 min. The absorption curves are measured for three directions of the electric field E: 20° off the normal to thesurface �continuous line and square markers�, parallel to the Si-Si dimer axis �continuous black line�, parallel to the dimer row �dashed blackline�. Note that transition B is polarized perpendicular to the surface plane, while transitions A and C are contained within the surface plane.Note also that A �c� is stronger �weaker� when E is parallel to the dimer axis �parallel to the row direction�. Peak labeling is issued fromcore-excited-state DFT calculations �see also Fig. 8�.
MATHIEU et al. PHYSICAL REVIEW B 79, 205317 �2009�
205317-10
Consequently, the various patterns are essentially distin-guished one from another with the characteristic in-plane di-chroism of structures A and C. The zigzag antipattern givesthe most dichroic behavior with A strictly polarized along theSi-Si dimer axis and C along the dimer row �the dichroismcan be easily guessed from the p component orientations ofthe three UMOs depicted in Fig. 8�. The two gauche modelsgive also dichroic in-plane absorption curves, but this timeA�C� is more intense when E is parallel to the dimer row�dimer axis�. As expected from their respective orientationsat right angle, the H-bonded amines of the linear pattern givepractically nondichroic curves, for E parallel to the dimeraxis and the dimer row
How do NEXAFS simulated spectra compare with experi-mental ones recorded at room temperature? Let us first ex-amine the case of the pure linear pattern. The simulatedNEXAFS spectra show a weak dichroism in the surfaceplane, in good accord with the experimental spectra. Notethat the spectrum of the cross-trench H-bonded model wehave not calculated should also be in good accord with theexperiment, as its dichroic behavior should resemble that ofthe intrarow linear model �Fig. 9�d��, swapping the two in-plane directions. For their parts, none of the zigzag patternsprovide, individually, the experimentally observed in-planeNEXAFS dichroism. The energies of the various zigzag pat-terns being quasidegenerate, their population should benearly the same at 300 K, assuming low rotation barrierheights. The NEXAFS dichroism of the “averaged” zigzagpatterns given in Fig. 10 agrees also satisfactorily with thatof the experimental spectra.
V. CONCLUSIVE REMARKS
In this paper dedicated to the study of the electronic struc-ture of a single-domain Si�001�-2�1 surface saturated byammonia at 300 K, we present original N 1s XPS and NEX-AFS data combined with hybrid functional DFT calculationsof core-ionized/core-excited states. Despite the presence ofbisteps, we have observed that the adsorption on vicinal sur-faces leads to the exclusive dissociation of ammonia into Hand NH2 fragments, as it is the case for nominal �001� sur-faces. The experimental N 1s XPS peak �binding energy398.95 eV� measured with an experimental resolution of 80meV is characterized by a symmetric and featureless shape�FWHM 675 meV�. On the other hand, the simulated N 1sXPS spectral shape �taking into account the vibrational con-tribution� of the isolated amine is narrow �FWHM�320 meV, taking an experimental resolution of 80 meV�,asymmetric, and exhibits a clear ��N-H� vibrational series.The discrepancy with experiment points to structural contri-butions to the observed N 1s XPS spectral broadening. TheIP calculations confirm that H-bonding between amine pairsin intrarow linear patterns induces a N 1s binding-energysplitting of �0.4 eV. This splitting increases to 0.7 eV forcross-trench H-bonding. IP splitting due to H bonding can beconsidered as a source of broadening in the XPS N 1s spec-trum.
The empty molecular orbitals of the NH2 fragment havebeen probed by N 1s NEXAFS spectroscopy. We have ob-
FIG. 8. �Color online� Contours of the unoccupied molecularorbitals ��1s�1�UMO�1 NEXAFS state� calculated for the isolated�anti�geometry of the Si-NH2 fragment �a Si9H12 cluster is used�.The antibonding molecular orbitals A, B, and C are responsible forthe most intense NEXAFS transitions with the same name in Fig. 7.The corresponding 1s to UMO �KS transition energies are alsogiven.
FIG. 9. �Color online� Theoretical NEXAFS spectra of NH2
pairs relative to the adsorption patterns given in Fig. 1 along threedirections: normal to the surface �squares�, parallel to the Si-Sidimer axis �continuous black line�, and parallel to the dimer row�dashed red line�. A two-dimer Si15H16 cluster and a �1s�1�A�1 FCH-UMO potential are used. �a� The zigzag antipattern, �b� the zigzaggauche-C2 pattern, �c� the zigzag gauche-b pattern, and �d� the lin-ear �H-bonded pair� pattern.
NITROGEN 1s NEXAFS AND XPS SPECTROSCOPY OF… PHYSICAL REVIEW B 79, 205317 �2009�
205317-11
served three transitions at h�=400.36 eV �A�, h�=400.96 eV �B�, and h�=401.64 eV �C�. Calculated �Kohn-Sham transition energies of the �Si-NH2 adduct are invery good agreement with the measured NEXAFS peak en-ergies, which is a further confirmation of prior interpretationsof the XPS N 1s spectra. The Kohn-Sham contours of theantibonding levels show that the rotation of the NH2 frag-ment around the Si-N axis can be tracked by the dichroicbehavior of NEXAFS transitions A and C within the �001�plane �B being always polarized perpendicular to the sur-face�. The experimental N 1s absorption dichroism �within�001�� measured at 300 K can be satisfactorily reproduced bythe simulated NEXAFS spectra of the H-bonded pattern andby the averaged contributions of the three nearly degeneratezigzag conformations.
The picture of the Si�001� surface dosed with ammonia at300 K that emerges from this comparison between theory
and experiment is that of mixed zigzag and linear patterns incomparable amounts �with inter-row interactions�, in goodaccord with the interpretation of the STM occupied-state im-ages of the saturated surface advocated by Bowler andOwen10,11 and challenged by Chung and co-workers.14–16
The calculated in-plane dichroic behavior of the N 1s NEX-AFS curves suggests further experiments to be made. First,the linear-to-zigzag ratio could be modified by changing theadsorption temperature11 �for instance, adsorption could bemade below 120 K on a c�4�2� statically buckledsurface21�. Second, in view of the application of theammonia-reacted Si�001�-2�1 surfaces as templates for mo-lecular layer deposition and supramolecular assembly, thepresent spectroscopic tools appear particularly well adaptedto follow any change in the spatial orientation and chemicalenvironment of the amine terminations in interaction with amolecular overlayer.
*Also at State Key Laboratory of Solidification Processing, North-western Polytechnical University, Xi’an 710072, People’s Repub-lic of China.
†Author to whom correspondence should be [email protected] M. Fujisawa, Y. Taguchi, Y. Kuwahara, M. Onchi, and M. Nish-
ijima, Phys. Rev. B 39, 12918 �1989�.2 P. A. Taylor, R. M. Wallace, W. J. Choyke, M. J. Dresser, and J.
T. Yates, Jr., Surf. Sci. 215, L286 �1989�.3 C. U. S. Larsson and A. S. Flodström, Surf. Sci. 241, 353
�1991�.4 C. U. S. Larsson, C. B. M. Andersson, N. P. Prince, and A. S.
Flodström, Surf. Sci. 271, 349 �1992�.
5 J. L. Bischoff, F. Lutz, D. Bolmont, and L. Kubler, Surf. Sci.251-252, 170 �1991�.
6 G. Dufour, F. Rochet, H. Roulet, and F. Sirotti, Surf. Sci. 304,33 �1994�.
7 K. T. Queeney, Y. J. Chabal, and K. Raghavachari, Phys. Rev.Lett. 86, 1046 �2001�.
8 M. Z. Hossain, Y. Yamashita, K. Mukai, and J. Yoshinobu, Phys.Rev. B 68, 235322 �2003�.
9 J. W. Kim and H. W. Yeom, Surf. Sci. 546, L820 �2003�.10 J. H. G. Owen, D. R. Bowler, S. Kusano, and K. Miki, Phys.
Rev. B 72, 113304 �2005�.11 D. R. Bowler and J. H. G. Owen, Phys. Rev. B 75, 155310
�2007�.
FIG. 10. �Color online� Theo-retical NEXAFS spectra resultingfrom the sum of the three zigzagpatterns curves ��a� anti, �b�gauche-C2, and �c� gauche-C1 ofFig. 8� with equal weights.
MATHIEU et al. PHYSICAL REVIEW B 79, 205317 �2009�
205317-12
12 O. N. Chung, H. Kim, J.-Y. Koo, and S. Chung, Phys. Rev. B74, 193312 �2006�.
13 J. C. F. Rodriguez-Reyes and A. V. Teplyakov, Phys. Rev. B 76,075348 �2007�.
14 O. N. Chung, H. Kim, J.-Y. Koo, and S. Chung, Surf. Sci. Lett.602, L69 �2008�.
15 J. H. G. Owen and D. R. Bowler, Surf. Sci. 602, 3760 �2008�.16 J.-Y. Koo, H. Kim, O. N. Chung, and S. Chung, Surf. Sci. 602,
3763 �2008�.17 X. Cao and R. J. Hamers, J. Am. Chem. Soc. 123, 10988 �2001�.18 X. Cao, S. K. Coulter, M. D. Ellison, H. Liu, and R. J. Hamers,
J. Phys. Chem. B 105, 3759 �2001�.19 M. Z. Hossain, S. Machida, Y. Yamashita, K. Mukai, and J.
Yoshinobu, J. Am. Chem. Soc. 125, 9252 �2003�.20 M. Z. Hossain, S. Machida, Y. Yamashita, K. Mukai, and J.
Yoshinobu, J. Phys. Chem. B 108, 4737 �2004�.21 J. Yoshinobu, Prog. Surf. Sci. 77, 37 �2004�.22 Y. Widjaja and C. B. Musgrave, J. Chem. Phys. 120, 1555
�2004�.23 G. M. Rignanese and A. Pasquarello, Appl. Phys. Lett. 76, 553
�2000�.24 G. M. Rignanese and A. Pasquarello, Surf. Sci. 490, L614
�2001�.25 S. Carniato, J.-J. Gallet, F. Rochet, G. Dufour, F. Bournel, S.
Rangan, A. Verdini, and L. Floreano, Phys. Rev. B 76, 085321�2007�.
26 N. Franco, J. Avila, M. E. Davila, M. C. Asensio, D. P. Woodruff,O. Schaff, V. Fernandez, K.-M. Schindler, V. Fritzsche, and A.M. Bradshaw, Phys. Rev. Lett. 79, 673 �1997�.
27 T. R. Leftwich and A. V. Teplyakov, Surf. Sci. Rep. 63, 1�2008�.
28 F. Rochet, F. Bournel, S. Carniato, G. Dufour, J.-J. Gallet, V.Ilakovac, K. L. Guen, S. Rangan, F. Sirotti, and S. Kubsky, Int.J. Nanosci. 6, 85 �2007�.
29 We could think of isocyanates �to form a urea linkage�, acylchlorides/acid anhydrides �to form amides�, ketones/aldehydes�to form imines�, whose reaction with amines could be tested atroom temperature and under low gas pressure �in the range10−9–10−7 mbar�.
30 J. C. F. Rodriguez-Reyes and A. V. Teplyakov, J. Phys. Chem. C111, 16498 �2007�.
31 J. Gardener, J. H. G. Owen, K. Miki, and S. Heutz, Surf. Sci.602, 843 �2008�.
32 J. Stöhr, NEXAFS Spectroscopy, Springer Series in Surface Sci-ences �Springer-Verlag, Berlin, 1992�.
33 http://www.synchrotron-soleil.fr/portal/page/portal/Recherche/LignesLumiere/TEMPO
34 With a miscut angle , the average number of Si2 dimers in arow on a terrace, is ndimer
terrace= 1�2�tan
− 12 .
35 M. Dürr, Z. Hu, A. Biedermann, U. Höfer, and T. F. Heinz, Phys.Rev. B 63, 121315�R� �2001�.
36 http://www.msg.ameslab.gov/GAMESS/GAMESS.html37 A. Becke, J. Chem. Phys. 98, 5648 �1993�.38 C. Lee, W. Yang, and R. G. Parr, Phys. Rev. B 37, 785 �1988�.
39 X. Xu and W. A. Goddard III, Proc. Natl. Acad. Sci. U.S.A. 101,2673 �2004�.
40 T. Todorova, A. P. Seitsonen, J. Hutter, I.-F. W. Kuo, and C. J.Mundy, J. Phys. Chem. B 110, 3685 �2006�.
41 J.-H. Cho and K. S. Kim, Phys. Rev. B 62, 1607 �2000�.42 S. Rangan, F. Bournel, J.-J. Gallet, S. Kubsky, K. Le Guen, G.
Dufour, F. Rochet, F. Sirotti, S. Carniato, and V. Ilakovac, Phys.Rev. B 71, 165319 �2005�.
43 S. Carniato, F. Rochet, J.-J. Gallet, F. Bournel, G. Dufour, and C.Mathieu, Surf. Sci. 601, 5515 �2007�.
44 S. Carniato, V. Ilakovac, J.-J. Gallet, E. Kukk, and Y. Luo, Phys.Rev. A 71, 022511 �2005�.
45 L. Triguero, J. Electron Spectrosc. Relat. Phenom. 104, 195�1999�.
46 T. Ziegler, A. Rauk, and E. J. Baerends, Theor. Chim. Acta 43,261 �1977�.
47 P. W. Langhoff, Chem. Phys. Lett. 22, 60 �1973�.48 The computation of the energy Hessian included in the GAMESS
package �Ref. 36 of the present paper� permits the prediction ofvibrational frequencies.
49 S. Carniato, J. Chem. Phys. 126, 224307 �2007�.50 S. Carniato and P. Millié, J. Chem. Phys. 116, 3521 �2002�.51 S. Carniato and Y. Luo, J. Electron Spectrosc. Relat. Phenom.
142, 163 �2005�.52 F. J. Himpsel, B. S. Meyerson, F. R. McFeely, J. F. Morar, A.
Taleb-Ibrahimi, and J. A. Yarmoff, in Core Level Spectroscopy atSilicon Surfaces and Interfaces, Proceedings of the InternationalSchool of Physics “Enrico Fermi,” Course CVIII, Varenna,�1988� Vol. 222, edited by M. Campagna and R. Rosei �North-Holland, Amsterdam, 1990�.
53 K. C. Prince, M. Vondráček, J. Karvonen, M. Coreno, R. Cam-illoni, L. Avaldi, and M. de Simone, J. Electron Spectrosc. Relat.Phenom. 101-103, 141 �1999�.
54 Changes in the calculated IP can be viewed as “final-state” ef-fects: the relaxation energy, i.e. the ability of the system toscreen out the nitrogen core hole, increases with the silicon clus-ter size. On the other hand, Mulliken charges in the ground statedo not vary much with increasing the silicon cluster size �theyamount to −0.71, −0.73 and −0.71 unit charge for SiH3,Si�SiH3�3, and Si9H12, respectively�.
55 As the calculation of the vibrational fine structure of the N 1sspectrum of paired amines was largely beyond the scope of thepresent paper, we have assumed here that we can sum two, splitapart, components having the same width as that calculated foran isolated amine. As a matter of facts, the H bond between twoamines is relatively weak �the N-N distance is in the range3.3–3.55 Å�. Stronger H bonds may have non-negligible effectson component widths. Indeed in the case of the water dimer�O-O distance of 2.91 Å, see Ref. 25�, the hydrogen bondingand the drastic change in water-dimer potential under O 1s coreionization are responsible for an anomalously strong vibrationalbroadening of both the donor and acceptor oxygens. See V. C.Felicíssimo, I. Minkov, F. F. Guimaraes, F. Gel’mukhanov, A.Cesar, and H. Ågren, Chem. Phys. 312, 311 �2005�.
NITROGEN 1s NEXAFS AND XPS SPECTROSCOPY OF… PHYSICAL REVIEW B 79, 205317 �2009�
205317-13


![Effects of coagulation on the two- phase peristaltic ...usir.salford.ac.uk/50017/1/E__usir CHIN J PHYSICS...critical. According to theoretical and experimental studies [26, 27], blood](https://img.pdfslide.fr/doc/110x75/5f7910d11ee706519713b549/effects-of-coagulation-on-the-two-phase-peristaltic-usir-chin-j-physics.jpg)