Embed Size (px)
Citation preview
Laboratoire de l’Informatique du Parallélisme
École Normale Supérieure de LyonUnité Mixte de Recherche CNRS-INRIA-ENS LYON-UCBL no 5668
A study of large flow interactions in high-speedshared networks with Grid5000 and GtrcNET-10
instruments
Romaric Guillier,Ludovic Hablot,Yuetsu Kodama,Tomohiro Kudoh,Fumihiro Okazaki,Pascale Primet,Sébastien Soudan,Ryousei Takano
November 2006
Research Report No 2006-43
École Normale Supérieure de Lyon46 Allée d’Italie, 69364 Lyon Cedex 07, France
Téléphone : +33(0)4.72.72.80.37Télécopieur : +33(0)4.72.72.80.80
Adresse électronique :[email protected]
A study of large flow interactions in high-speed sharednetworks with Grid5000 and GtrcNET-10 instruments
Romaric Guillier, Ludovic Hablot, Yuetsu Kodama, TomohiroKudoh,Fumihiro Okazaki, Pascale Primet, Sébastien Soudan, Ryousei Takano
November 2006
AbstractWe consider the problem of huge data transfers and bandwidthsharing in con-texts where transfer delay bounds are required. This reportinvestigates largeflow interactions in a real very high-speed network and aims at contributingto high-speed TCP variants evaluation by providing precisemeasurements. Itthen also gives an insight on the behaviour of emulated alternative protocolsunder different realistic congestion and long latency conditions in 10 Gbpsexperimental environments.
Keywords: bulk data transfers, bandwidth sharing, transfer delay predictability, transport protocolexperimentation
RésuméDans ce rapport, nous étudions le problème de transferts massifs de donnéeset du partage de bande passante dans les contextes où il est requis d’avoir destemps de transfert bornés. Nous présentons une étude des interactions de largesflux dans des réseaux très haut-débits et ainsi contribuer à l’évaluation de va-riantes de TCP, adaptée à ce contexte, en proposant des mesures précises. Nousdonnerons aussi un aperçu du comportement de protocoles alternatifs émulédans des environnements expérimentaux à 10 Gbps sous diverses conditionsde congestions et de latences.
Mots-clés: partage de bande passante, expérimentation de protocole detransport, prédiction detemps de transfert total, transferts en masse de données
Study of large flow interactions 1
1 Introduction
The data volumes of future distributed applications such asdata and computing grids, distance visu-alisation and high-end collaborative environment are in the order of terabytes and will likely reachpetabytes in some cases. The movement of these data have demanding performance requirementssuch as reliable and predictable delivery [FFR+04]. This generates specific challenges on the trans-port protocol and its related mechanisms. The enhancement of TCP/IP is being intensively pursuedto tackle limits that classical congestion control solutions encounter in large bandwidth-delay productenvironment [WHVBPa05]. A range of solutions is proposed and their properties have been anal-ysed by simulation. However, few studies have measured the performance of these proposals in realhigh speed networks [MFVBP04,C+]. It is acknowledged that more real and systematic experimentsare needed to have a better insight on the relevance of metrics, representative scenarii for protocolevaluation and on the potential usage of these protocols in particular applications [Flo06b].
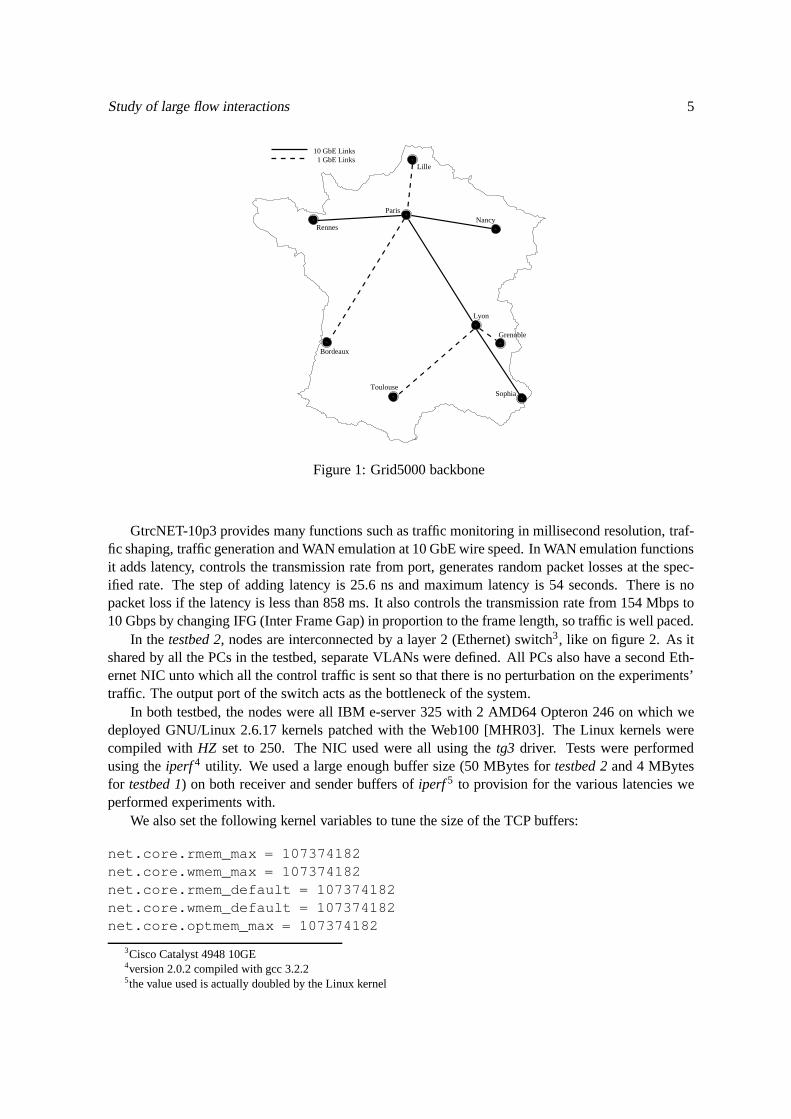
This report contributes to this challenge by exploring several high data transfer scenarii in two ex-perimental environments: the Grid50001 testbed and the AIST GtrcNET-10-based2 testbed [KKT+04].Grid5000, is an experimental grid platform gathering more than 3000 processors over nine geograph-ically distributed sites in France (see figure 1), interconnected by a dedicated private high-speed net-work [Ca05]. The particularity of this testbed is to provideresearchers with a fully reconfigurabilityfeature to dynamically deploy any OS image or protocol stackon any host of the testbed. The otherexperimental environment we used is the GtrcNET-10-based emulated and controlled testbed con-nected within the AIST Super Cluster. Hosts of both testbedshave similar hardware and softwareconfiguration.
This report explores how the transport protocol enhancements could benefit to high-end appli-cations in terms of data transfer efficiency and predictability in two environments. It is centred onelephant-like bulk data transfers in very high-capacity (1Gbps, 10 Gbps) networks like grids are sup-posed to benefit from today. The systematic evaluation of theprotocols in our controlled and realisticenvironment provides a set of measurements of several metrics proposed by [Flo06a]. In this context,we investigate, the different congestion control proposals as well as the fair sharing optimisation ob-jective and their impact on the network resource utilisation and on individual application utility thathave to be simultaneously optimised.
In cluster interconnection context, hundreds of hosts may simultaneously generate large flowsthrough their gigabit interfaces. But as the access links between cluster networks and wide areanetworks currently offer between 1 to 10 Gbps rates, they constitute a strong bottleneck that maydrastically increase the transfer delays and impact the overall distributed environment performance.In the Internet, the endpoints’ access rates are generally much smaller (2 Mbps for DSL lines) thanthe backbone link’s capacity (2.5 Gbps for an OC48 link). According to the law of large numbers,coexistence of many active flows smoothes the variation of load, and a link is not a bottleneck unlessthe load approaches its full capacity [Rob04]. To curb the load, distributed congestion control pro-tocols such as TCP statistically share available bandwidthamong flows in a “fair” way. In contrast,for high-end applications, the bandwidth demand of a singleendpoint (1 Gbps, say) may be com-parable to the capacity of bottleneck link. In such a low multiplexing environment, if no pro-activeadmission control is applied, a transient burst of load can easily cause active transfers have very longduration, miss their deadline or even fail. In addition, to complete more tasks before their respectivedeadlines, sharing instantaneous bandwidth fairly among all active flows is not optimal [GR06]. This
1http://www.grid5000.org2http://projects.gtrc.aist.go.jp/gnet/gnet10p3e.html
2 R. Guillier, L. Hablot, Y. Kodama, T. Kudoh, F. Okazaki, P. Primet, S. Soudan, R. Takano
is the reason why researchers [?] propose to introduce access control and flow scheduling. This couldharmonise network resource management with other grid resources management and serve the globaloptimisation objective. The ultimate goal of this researchis, in different scenarii, to answer questionssuch as: which transport protocol to use in a given context? How many flows to schedule to obtainminimum interaction and maximum throughput? When startingthem to avoid bad interactions duringslow start phase?...
The rest of the article is organised as follows. Section 2 gives some insights on parameter spaceand metrics. Scenario and experiments are described in section 3. Results are discussed in section 4.The article concludes in section 5.
2 Methodology
When the 10 Gbps infrastructure has been set up in Grid5000, very simple experiments, that anygrid user could do, were run to see how grid applications could benefit from the deployed network.These tests have shown very disappointing results [GHPS06]. The hosts were not able to obtaincorrect throughput (45 to 100 Mbps) when competing and the aggregate throughput was very low(about 3 to 6 Gb/s). We then choose to investigate three typesof scenario to understand these badresults and improve them in this 10Gb/s context. This work has been inspired by the results andmethodologies proposed by [LLS06,Flo06b,HLRX06]. [Flo06b] identifies several characteristics anddescribes which aspect of evaluation scenario determine these characteristics and how they can affectthe results of the experiments. This helped us in defining workloads and metrics that are going to bepresented in the following section.
2.1 Traffic characteristics
According to [Flo06b], the aggregated traffic on a link is characterised by:
a) the distribution of per-packet round-trip time
b) the file sizes
c) the packet sizes
d) the ratio between forward-path and reverse-path traffic
e) the distribution of peak flow rates
f) the distribution of transport protocols
Despite no extensive study of grid traffic exists, we assume the specific context we study herepresents the following specificities:
a) The distribution of per-packet round-trip time is multi-modal. Nodes are generally clustered, con-
sequently, several modes may appear (aboutN ∗ (N − 1)
2modes forN sites), each mode of the
distribution representing the set of given site to site connections.
b) File sizes are not exponentially distributed. For example, in Data Grid like LCG (for LHC) filesize and data distribution is defined by the sampling rate of data acquisition. The traffic profile isthen highly uniform.

Study of large flow interactions 3
c) Packet sizes are also mostly constant, with a large proportion of packets having the maximum size(the Ethernet MTU).
d) The ratio between forward-path and reverse-path traffic is unknown and depends on the locationof the storage elements within the global grid.
e) Distribution of peak flow rates may also be uniform.
f) Today, most of grid applications need reliable transportand use TCP-based protocols. The distri-bution of transport protocols is modal.
In the rest of the paper, we call these specific conditions, the "grid context". The next section presentsthe various scenarii we implemented in this context to studythe interactions of large TCP flows.
2.2 Scenarii
We examine two types of features that can help users to obtaingood performance in such context:parallel streams and TCP variants.
We investigate the two following types of scenarii:
• Range of TCP variants in the Grid5000 real testbed and in the AIST-GtrcNET10 testbed withGrid5000 latency.
• Range of TCP variants with a range of emulated latency in the AIST-GtrcNET-10 testbed.
Different TCP variants have been proposed to improve the response function of AIMD congestioncontrol algorithm in high bandwidth delay product networks. All these protocols are not equivalentand not suited for every context. We investigate here their behaviours in our "grid context" in twodifferent testbeds and we also provide comparison grounds between our two testbeds.
The following section describes the various parameters andmetrics that have been used to char-acterise the behaviour of the TCP flows.
2.3 Measured parameters and metrics
We design and configure our experimental testbeds to have a direct access to the following variablemeasurements during experiments:
a) Goodput usingiperf on the receiver side, that corresponds to the actual amount of bandwidth that isavailable for the high-end applications, i.e. retransmissions and headers are not taken into account.
b) Aggregated throughput via the GtrcNET-10 on the 10 Gbps shared link.
c) TCP kernel variables with the Web100 patch on senders and receivers.
The parameters are evolving along the three following axis:
1) TCP variant, among {Reno, BIC, CUBIC, HighSpeed, H-TCP and Scalable}
2) RTT, ranging from 0 ms to 200 ms
3) congestion level, the ratio between the sum of sources’ access link capacity and the bottleneck sizeranging from 0 to 120 %
4 R. Guillier, L. Hablot, Y. Kodama, T. Kudoh, F. Okazaki, P. Primet, S. Soudan, R. Takano
Every test for a given RTT, has been repeated for a given congestion control method and for agiven number of nodes. We took great care of fine measurement precision: 0.5 s foriperf ’s goodput,20 ms for the GtrcNET-10’s throughput and Web100’s variables. Even though we specifyiperf toperformread()/write() of 8 kB, we still observe burstiness in goodputs due to delay variation betweenpackets arrivals andread() returns, which explains why we sometimes observe goodput larger thanlink capacity.
To analyse all the data acquired, several metrics have been used to synthetically characterise thebehaviour of different TCP variants. These metrics are:
• mean goodput:gi = 1T
∑Tt=0 gi(t)
• aggregate goodput:G(t) =∑N
i=1 gi(t)
• standard deviation of goodput:σ =√
1T
∑Tt=0(gi(t) − gi)2
• goodput distribution:{pi,k = p( k100 ∗ 1 Gbps ≤ gi(t) < k+1
100 ∗ 1 Gbps)|k ∈ [[0; 100[[}
• fairness [JMW84]:J =(∑
N
i=1gi)2
N(∑
N
i=1gi
2)
• aggregate throughput:X(t) =∑N
i=1 xi(t)
whereN is the number of nodes involved in the experiment (typically12 in this report),T is thetotal duration of the experiment (typically 2800 s),gi(t) theith node’s goodput over timet averaged onthe iperf sampling interval, andxi(t) theith node’s throughput over timet averaged on the GtrcNET-10 sampling interval.
We have now defined the methodology of our research paper by describing the traffic characteris-tics, the scenarii that will be explored and the parameters and metrics that will help us to characterisethe behaviour of TCP variants. The following section is dedicated to presenting the configurationsthat were used to perform our experiments.
3 Experiment description
3.1 System and service description
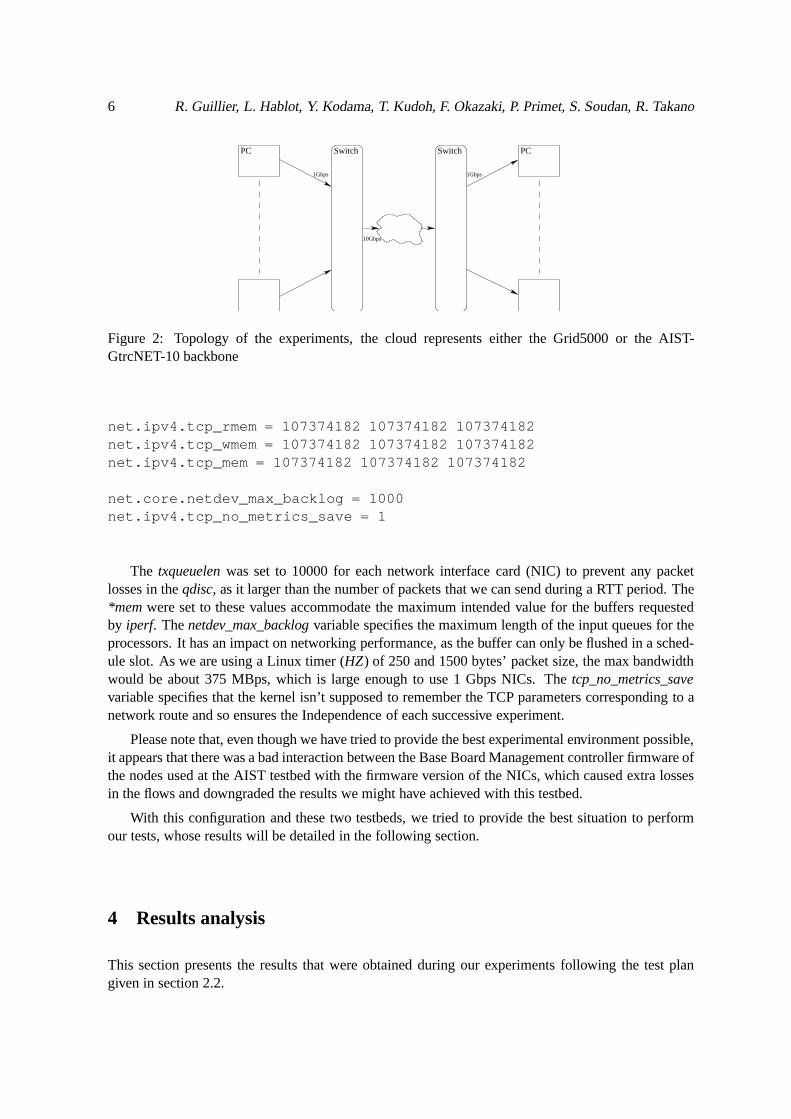
We used two similar experimental systems, composed of a classical dumbbell topology with twelve1 Gbps source workstations connected to a 10 Gbps bottlenecklink and twelve sink workstations onthe other side as described in figure 2. In the first testbed (testbed 1) (Grid5000, France), the backboneof the Grid5000 platform is composed of a private 10 Gbps Ethernet over DWDM dumbbell with abottleneck at 10 Gbps between Rennes and Nancy hubs (see figure 1). The average RTT is 11.5 msthat gives a bandwidth-delay product of 1.507 Mbytes for 1 Gbps connections.
The second testbed (testbed 2) (AIST-GtrcNET-10, Japan), is fully controlled. It is built aroundthe GtrcNET-10p3 equipment that allows latency emulation,rate limitation and precise bandwidthmeasurements at 10 GbE wire speed. GtrcNET-10p3 is a fully programmable network testbed, whichis a 10 Gbps successor of a well-established network testbed, GtrcNET-1 [KKT+04] for 1 GbpsEthernet. GtrcNET-10p3 consists of a large-scale Field Programmable Gate Array (FPGA), three10 Gbps Ethernet XENPAK ports, and three blocks of 1 GB DDR-SDRAM. The FPGA is a XilinxXC2VP100, which includes three 10 Gbps Ethernet MAC and XAUIinterfaces. By re-programmingFPGA configuration, its functions are easily added and modified with keeping 10 GbE wire speed.
Study of large flow interactions 5
Paris
Toulouse
Bordeaux
Nancy
Lille
Rennes
Lyon
Grenoble
Sophia
10 GbE Links 1 GbE Links
Figure 1: Grid5000 backbone
GtrcNET-10p3 provides many functions such as traffic monitoring in millisecond resolution, traf-fic shaping, traffic generation and WAN emulation at 10 GbE wire speed. In WAN emulation functionsit adds latency, controls the transmission rate from port, generates random packet losses at the spec-ified rate. The step of adding latency is 25.6 ns and maximum latency is 54 seconds. There is nopacket loss if the latency is less than 858 ms. It also controls the transmission rate from 154 Mbps to10 Gbps by changing IFG (Inter Frame Gap) in proportion to theframe length, so traffic is well paced.
In the testbed 2, nodes are interconnected by a layer 2 (Ethernet) switch3, like on figure 2. As itshared by all the PCs in the testbed, separate VLANs were defined. All PCs also have a second Eth-ernet NIC unto which all the control traffic is sent so that there is no perturbation on the experiments’traffic. The output port of the switch acts as the bottleneck of the system.
In both testbed, the nodes were all IBM e-server 325 with 2 AMD64 Opteron 246 on which wedeployed GNU/Linux 2.6.17 kernels patched with the Web100 [MHR03]. The Linux kernels werecompiled withHZ set to 250. The NIC used were all using thetg3 driver. Tests were performedusing theiperf 4 utility. We used a large enough buffer size (50 MBytes fortestbed 2 and 4 MBytesfor testbed 1) on both receiver and sender buffers ofiperf 5 to provision for the various latencies weperformed experiments with.
We also set the following kernel variables to tune the size ofthe TCP buffers:
net.core.rmem_max = 107374182net.core.wmem_max = 107374182net.core.rmem_default = 107374182net.core.wmem_default = 107374182net.core.optmem_max = 107374182
3Cisco Catalyst 4948 10GE4version 2.0.2 compiled with gcc 3.2.25the value used is actually doubled by the Linux kernel
6 R. Guillier, L. Hablot, Y. Kodama, T. Kudoh, F. Okazaki, P. Primet, S. Soudan, R. Takano
PCPC Switch Switch
10Gbps
1Gbps 1Gbps
Figure 2: Topology of the experiments, the cloud representseither the Grid5000 or the AIST-GtrcNET-10 backbone
net.ipv4.tcp_rmem = 107374182 107374182 107374182net.ipv4.tcp_wmem = 107374182 107374182 107374182net.ipv4.tcp_mem = 107374182 107374182 107374182
net.core.netdev_max_backlog = 1000net.ipv4.tcp_no_metrics_save = 1
The txqueuelen was set to 10000 for each network interface card (NIC) to prevent any packetlosses in theqdisc, as it larger than the number of packets that we can send during a RTT period. The*mem were set to these values accommodate the maximum intended value for the buffers requestedby iperf. Thenetdev_max_backlog variable specifies the maximum length of the input queues fortheprocessors. It has an impact on networking performance, as the buffer can only be flushed in a sched-ule slot. As we are using a Linux timer (HZ) of 250 and 1500 bytes’ packet size, the max bandwidthwould be about 375 MBps, which is large enough to use 1 Gbps NICs. Thetcp_no_metrics_savevariable specifies that the kernel isn’t supposed to remember the TCP parameters corresponding to anetwork route and so ensures the Independence of each successive experiment.
Please note that, even though we have tried to provide the best experimental environment possible,it appears that there was a bad interaction between the Base Board Management controller firmware ofthe nodes used at the AIST testbed with the firmware version ofthe NICs, which caused extra lossesin the flows and downgraded the results we might have achievedwith this testbed.
With this configuration and these two testbeds, we tried to provide the best situation to performour tests, whose results will be detailed in the following section.
4 Results analysis
This section presents the results that were obtained duringour experiments following the test plangiven in section 2.2.
Study of large flow interactions 7
4.1 Single flows experiment with TCP variants
4.1.1 Experiment description
In this experiment, we evaluate different TCP variant protocols (HS-TCP [Flo03], H-TCP [SL04],Scalable TCP [Kel03], BIC TCP [XHR04], CUBIC [RX05]) with the same latency: 11.5 ms, both onthe Grid5000 and the AIST-GtrcNET-10 testbed. This will help us in characterising how each protocolis able to adjust for a given congestion level and how they areable to take advantage of the availableresources.
For a given TCP variant and a given RTT, the first tests series were performed as follows:
• At time 0, we start the first couple of client-server.
• A iperf client is started 4 seconds after the correspondingiperf server to prevent overlap due tossh connexion delay.
• Everytimer, we start a new couple till all twelve nodes are started.
• As eachiperf client is set to lastmax_duration− nb_nodes_already_started ∗ timer, theygradually stop around timemax_duration.
The interval between each flow’s start is important to avoid flows’ interactions during their slowstart phase. In this case, we make sure that flow interactionsdo not occur during any slow start phaseby choosing atimer value that is large enough, typically 200 s here. After more than 10 nodes havebeen started, we start to have congestion as we have reached the bottleneck’s size.
The next section is dedicated to present the results of this experiment and compare them in thetwo testbeds used.
4.1.2 Results
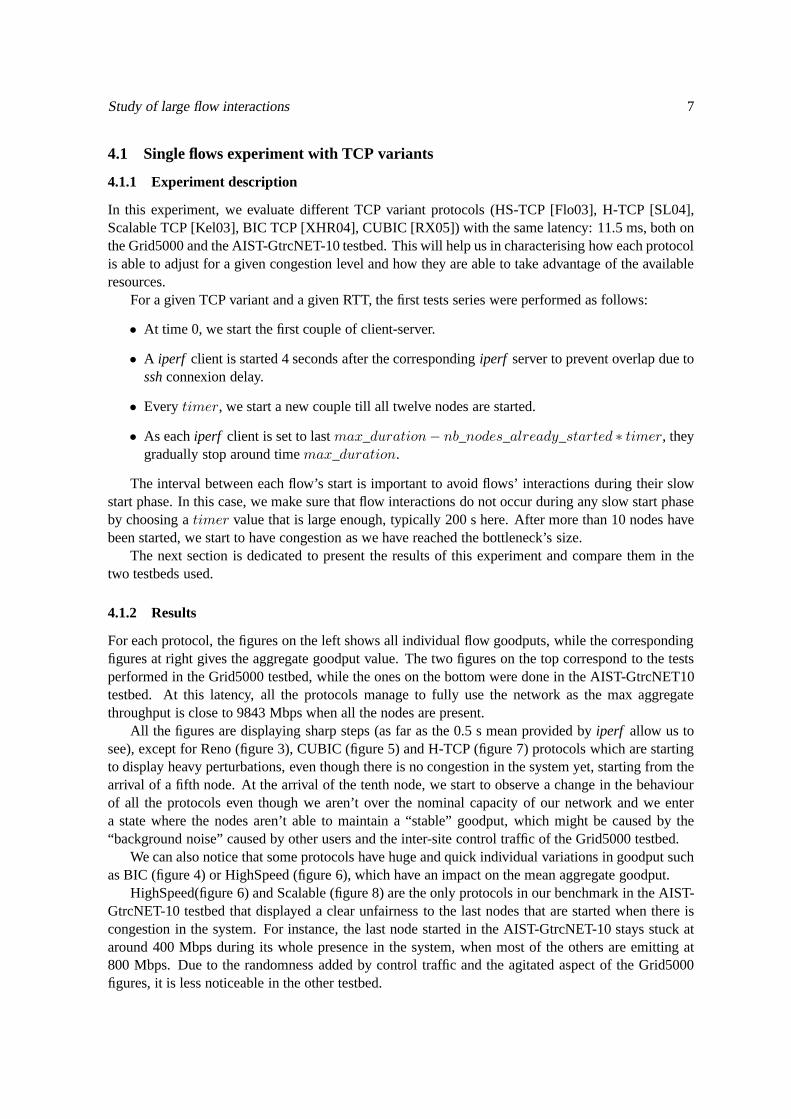
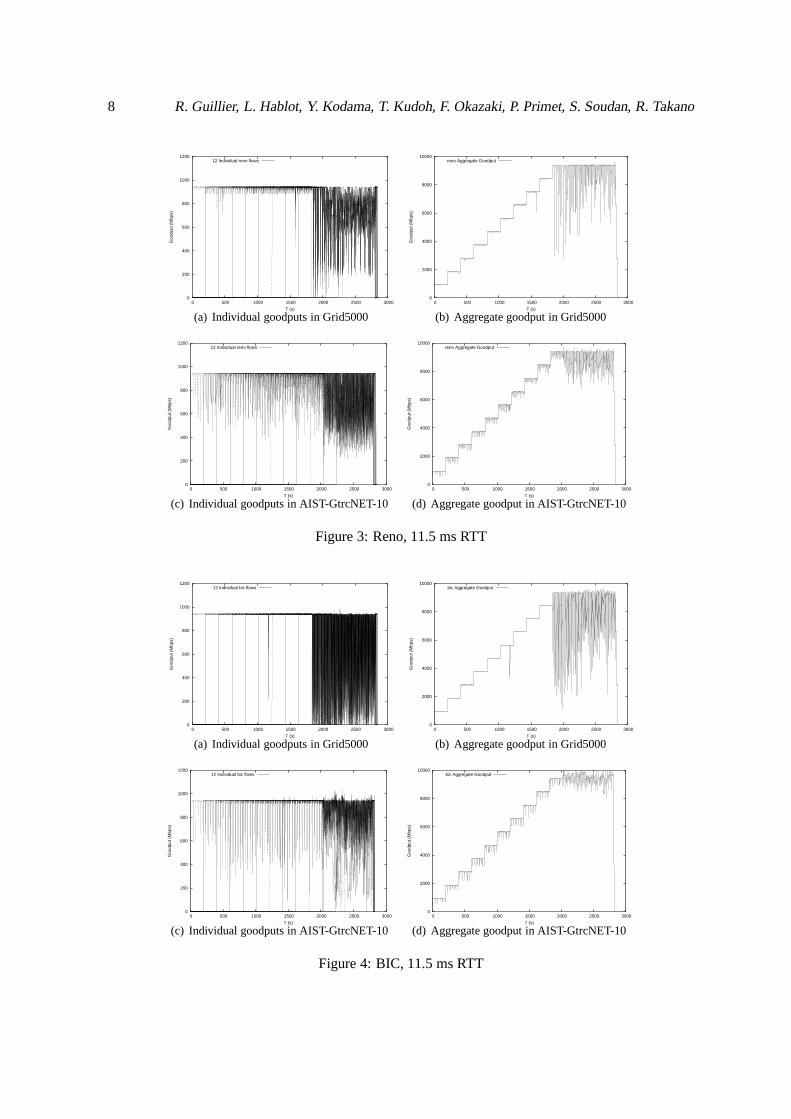
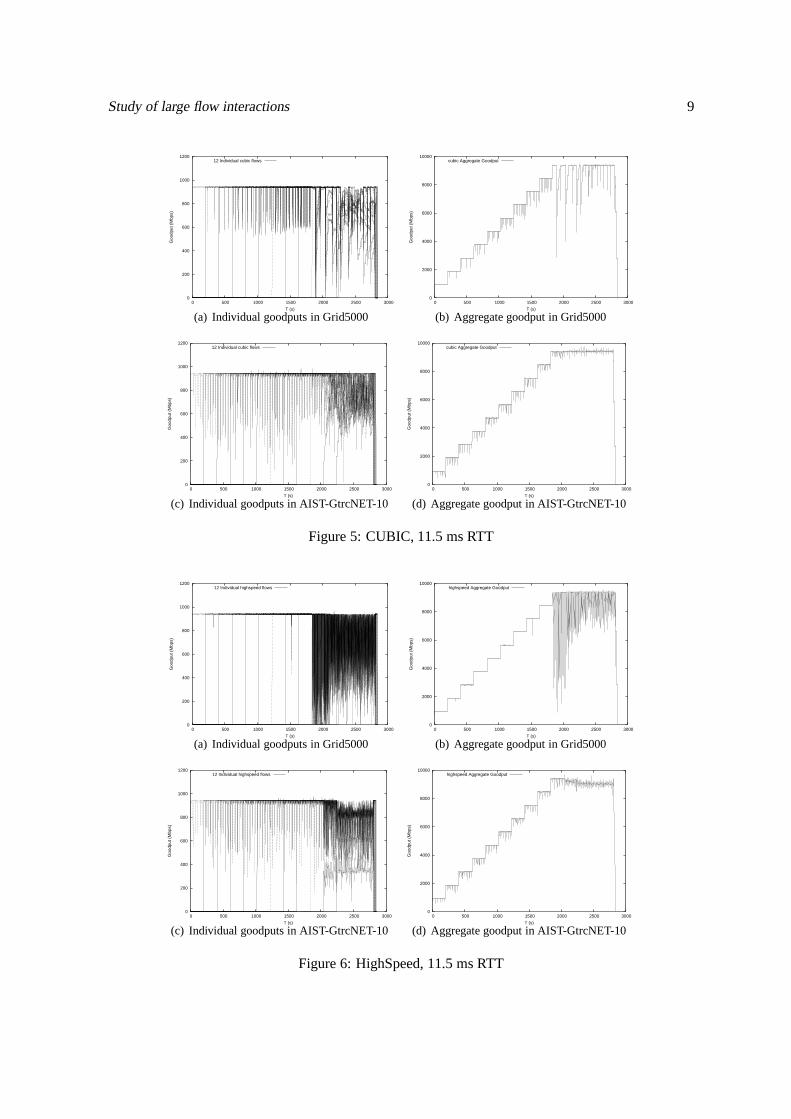
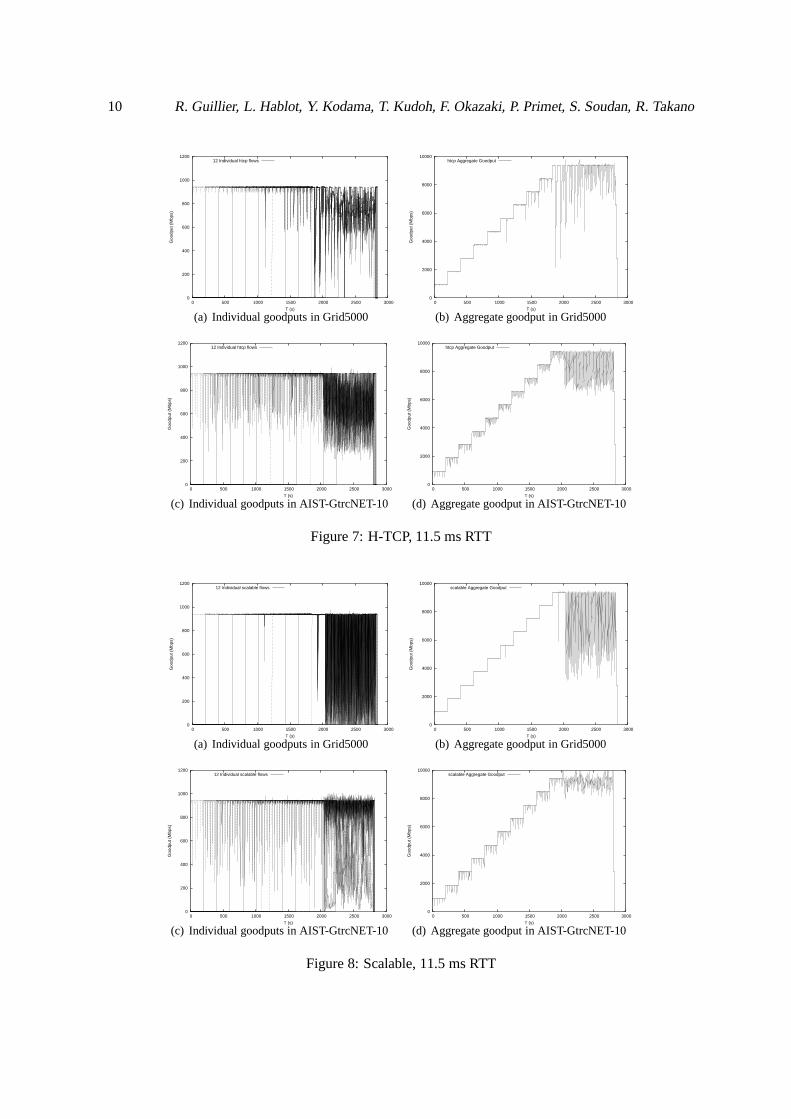
For each protocol, the figures on the left shows all individual flow goodputs, while the correspondingfigures at right gives the aggregate goodput value. The two figures on the top correspond to the testsperformed in the Grid5000 testbed, while the ones on the bottom were done in the AIST-GtrcNET10testbed. At this latency, all the protocols manage to fully use the network as the max aggregatethroughput is close to 9843 Mbps when all the nodes are present.
All the figures are displaying sharp steps (as far as the 0.5 s mean provided byiperf allow us tosee), except for Reno (figure 3), CUBIC (figure 5) and H-TCP (figure 7) protocols which are startingto display heavy perturbations, even though there is no congestion in the system yet, starting from thearrival of a fifth node. At the arrival of the tenth node, we start to observe a change in the behaviourof all the protocols even though we aren’t over the nominal capacity of our network and we entera state where the nodes aren’t able to maintain a “stable” goodput, which might be caused by the“background noise” caused by other users and the inter-sitecontrol traffic of the Grid5000 testbed.
We can also notice that some protocols have huge and quick individual variations in goodput suchas BIC (figure 4) or HighSpeed (figure 6), which have an impact on the mean aggregate goodput.
HighSpeed(figure 6) and Scalable (figure 8) are the only protocols in our benchmark in the AIST-GtrcNET-10 testbed that displayed a clear unfairness to thelast nodes that are started when there iscongestion in the system. For instance, the last node started in the AIST-GtrcNET-10 stays stuck ataround 400 Mbps during its whole presence in the system, whenmost of the others are emitting at800 Mbps. Due to the randomness added by control traffic and the agitated aspect of the Grid5000figures, it is less noticeable in the other testbed.
8 R. Guillier, L. Hablot, Y. Kodama, T. Kudoh, F. Okazaki, P. Primet, S. Soudan, R. Takano
0
200
400
600
800
1000
1200
0 500 1000 1500 2000 2500 3000
Goo
dput
(M
bps)
T (s)
12 Individual reno flows
(a) Individual goodputs in Grid5000
0
2000
4000
6000
8000
10000
0 500 1000 1500 2000 2500 3000
Goo
dput
(M
bps)
T (s)
reno Aggregate Goodput
(b) Aggregate goodput in Grid5000
0
200
400
600
800
1000
1200
0 500 1000 1500 2000 2500 3000
Goo
dput
(M
bps)
T (s)
12 Individual reno flows
(c) Individual goodputs in AIST-GtrcNET-10
0
2000
4000
6000
8000
10000
0 500 1000 1500 2000 2500 3000
Goo
dput
(M
bps)
T (s)
reno Aggregate Goodput
(d) Aggregate goodput in AIST-GtrcNET-10
Figure 3: Reno, 11.5 ms RTT
0
200
400
600
800
1000
1200
0 500 1000 1500 2000 2500 3000
Goo
dput
(M
bps)
T (s)
12 Individual bic flows
(a) Individual goodputs in Grid5000
0
2000
4000
6000
8000
10000
0 500 1000 1500 2000 2500 3000
Goo
dput
(M
bps)
T (s)
bic Aggregate Goodput
(b) Aggregate goodput in Grid5000
0
200
400
600
800
1000
1200
0 500 1000 1500 2000 2500 3000
Goo
dput
(M
bps)
T (s)
12 Individual bic flows
(c) Individual goodputs in AIST-GtrcNET-10
0
2000
4000
6000
8000
10000
0 500 1000 1500 2000 2500 3000
Goo
dput
(M
bps)
T (s)
bic Aggregate Goodput
(d) Aggregate goodput in AIST-GtrcNET-10
Figure 4: BIC, 11.5 ms RTT
Study of large flow interactions 9
0
200
400
600
800
1000
1200
0 500 1000 1500 2000 2500 3000
Goo
dput
(M
bps)
T (s)
12 Individual cubic flows
(a) Individual goodputs in Grid5000
0
2000
4000
6000
8000
10000
0 500 1000 1500 2000 2500 3000
Goo
dput
(M
bps)
T (s)
cubic Aggregate Goodput
(b) Aggregate goodput in Grid5000
0
200
400
600
800
1000
1200
0 500 1000 1500 2000 2500 3000
Goo
dput
(M
bps)
T (s)
12 Individual cubic flows
(c) Individual goodputs in AIST-GtrcNET-10
0
2000
4000
6000
8000
10000
0 500 1000 1500 2000 2500 3000
Goo
dput
(M
bps)
T (s)
cubic Aggregate Goodput
(d) Aggregate goodput in AIST-GtrcNET-10
Figure 5: CUBIC, 11.5 ms RTT
0
200
400
600
800
1000
1200
0 500 1000 1500 2000 2500 3000
Goo
dput
(M
bps)
T (s)
12 Individual highspeed flows
(a) Individual goodputs in Grid5000
0
2000
4000
6000
8000
10000
0 500 1000 1500 2000 2500 3000
Goo
dput
(M
bps)
T (s)
highspeed Aggregate Goodput
(b) Aggregate goodput in Grid5000
0
200
400
600
800
1000
1200
0 500 1000 1500 2000 2500 3000
Goo
dput
(M
bps)
T (s)
12 Individual highspeed flows
(c) Individual goodputs in AIST-GtrcNET-10
0
2000
4000
6000
8000
10000
0 500 1000 1500 2000 2500 3000
Goo
dput
(M
bps)
T (s)
highspeed Aggregate Goodput
(d) Aggregate goodput in AIST-GtrcNET-10
Figure 6: HighSpeed, 11.5 ms RTT
10 R. Guillier, L. Hablot, Y. Kodama, T. Kudoh, F. Okazaki, P. Primet, S. Soudan, R. Takano
0
200
400
600
800
1000
1200
0 500 1000 1500 2000 2500 3000
Goo
dput
(M
bps)
T (s)
12 Individual htcp flows
(a) Individual goodputs in Grid5000
0
2000
4000
6000
8000
10000
0 500 1000 1500 2000 2500 3000
Goo
dput
(M
bps)
T (s)
htcp Aggregate Goodput
(b) Aggregate goodput in Grid5000
0
200
400
600
800
1000
1200
0 500 1000 1500 2000 2500 3000
Goo
dput
(M
bps)
T (s)
12 Individual htcp flows
(c) Individual goodputs in AIST-GtrcNET-10
0
2000
4000
6000
8000
10000
0 500 1000 1500 2000 2500 3000
Goo
dput
(M
bps)
T (s)
htcp Aggregate Goodput
(d) Aggregate goodput in AIST-GtrcNET-10
Figure 7: H-TCP, 11.5 ms RTT
0
200
400
600
800
1000
1200
0 500 1000 1500 2000 2500 3000
Goo
dput
(M
bps)
T (s)
12 Individual scalable flows
(a) Individual goodputs in Grid5000
0
2000
4000
6000
8000
10000
0 500 1000 1500 2000 2500 3000
Goo
dput
(M
bps)
T (s)
scalable Aggregate Goodput
(b) Aggregate goodput in Grid5000
0
200
400
600
800
1000
1200
0 500 1000 1500 2000 2500 3000
Goo
dput
(M
bps)
T (s)
12 Individual scalable flows
(c) Individual goodputs in AIST-GtrcNET-10
0
2000
4000
6000
8000
10000
0 500 1000 1500 2000 2500 3000
Goo
dput
(M
bps)
T (s)
scalable Aggregate Goodput
(d) Aggregate goodput in AIST-GtrcNET-10
Figure 8: Scalable, 11.5 ms RTT
Study of large flow interactions 11
One of the main differences between our two testbeds is that in Grid5000, we can experienceperturbations coming from the control traffic (or even otherusers’ traffic), which might account for theagitation that appears regularly in several figures. It can also explain the differences that were observedbetween the AIST-GtrcNET-10 and Grid5000 figures for CUBIC (figure 5), even though the Web100’slogs report more retransmissions than expected in non-congested state. But these interferences aren’tinevitably bad as the CUBIC figure (or the Reno figure) in the Grid5000 seems to yield better intra-flow fairness and display more stability as seen later in thisreport, on figure 17.
These results allowed us to observe that we are able to obtainvery similar results with the twodifferent testbed, showing that an emulated testbed such asAIST-GtrcNET-10 can indeed help tohave a acceptable environment/provides a good first approximation to simulate a real testbed with lessinfrastructure cost.
In the following sections, we will compare the behaviour of the TCP variants for different valuesof latencies to assert the impact of this parameter on the performance of flows.
4.2 Exploration of TCP variants behaviour in various latency conditions
We experiment the various TCP protocols by applying the sameexperimental procedure we used forGrid5000 in the AIST-GtrcNET-10 testbed. In this emulated testbed, we explore the impact of thelatency on the protocols using this scenario.
4.2.1 Impact of the latency
First, we are going to verify the expected impact of an increasing latency on the various TCP variantswe tested, which is a deterioration of the performances.
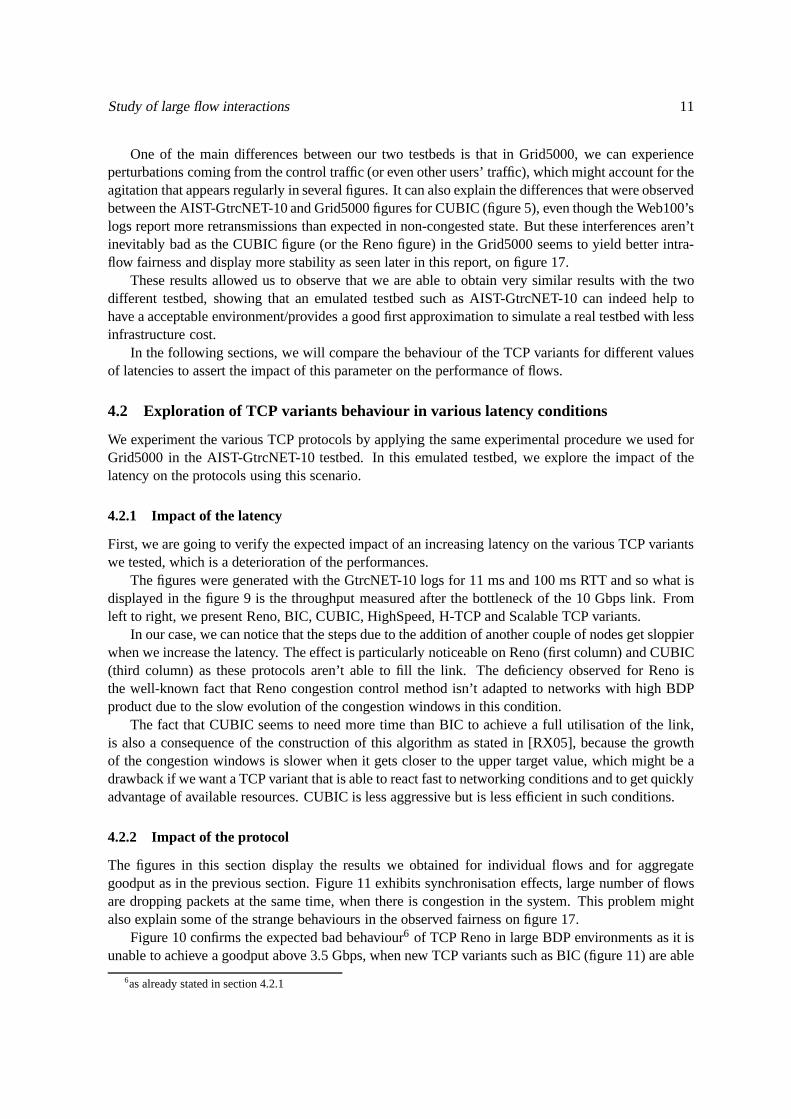
The figures were generated with the GtrcNET-10 logs for 11 ms and 100 ms RTT and so what isdisplayed in the figure 9 is the throughput measured after thebottleneck of the 10 Gbps link. Fromleft to right, we present Reno, BIC, CUBIC, HighSpeed, H-TCPand Scalable TCP variants.
In our case, we can notice that the steps due to the addition ofanother couple of nodes get sloppierwhen we increase the latency. The effect is particularly noticeable on Reno (first column) and CUBIC(third column) as these protocols aren’t able to fill the link. The deficiency observed for Reno isthe well-known fact that Reno congestion control method isn’t adapted to networks with high BDPproduct due to the slow evolution of the congestion windows in this condition.
The fact that CUBIC seems to need more time than BIC to achievea full utilisation of the link,is also a consequence of the construction of this algorithm as stated in [RX05], because the growthof the congestion windows is slower when it gets closer to theupper target value, which might be adrawback if we want a TCP variant that is able to react fast to networking conditions and to get quicklyadvantage of available resources. CUBIC is less aggressivebut is less efficient in such conditions.
4.2.2 Impact of the protocol
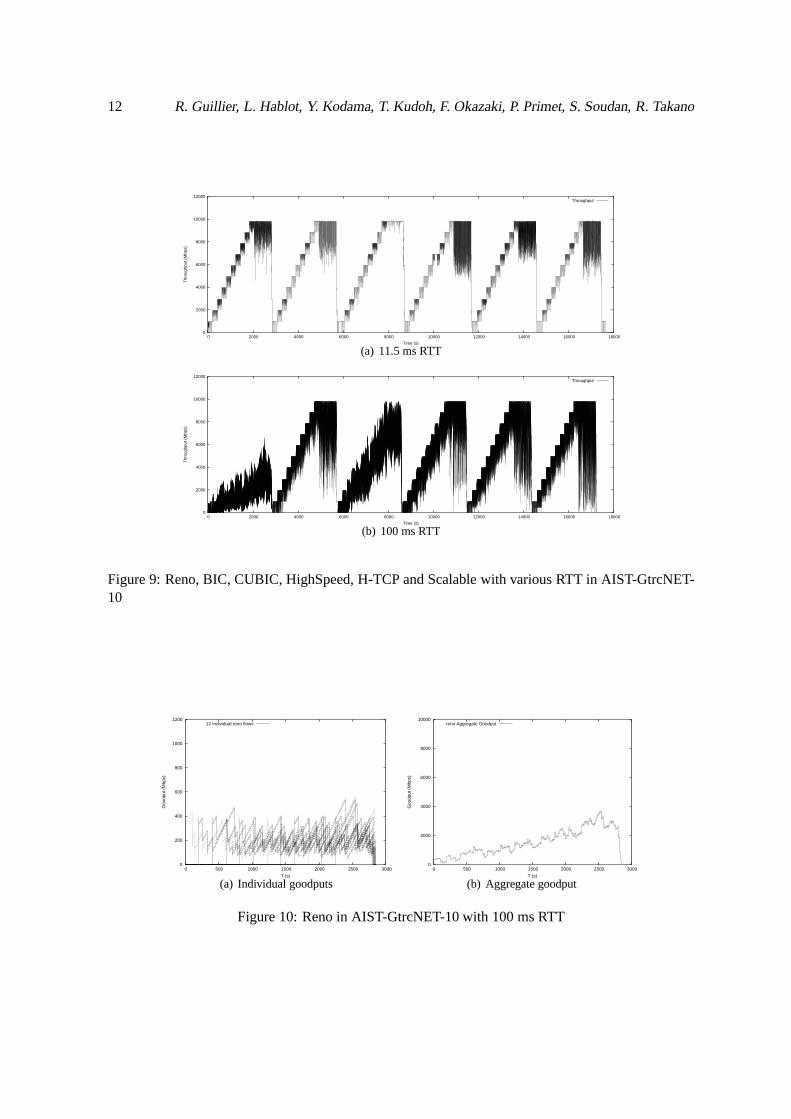
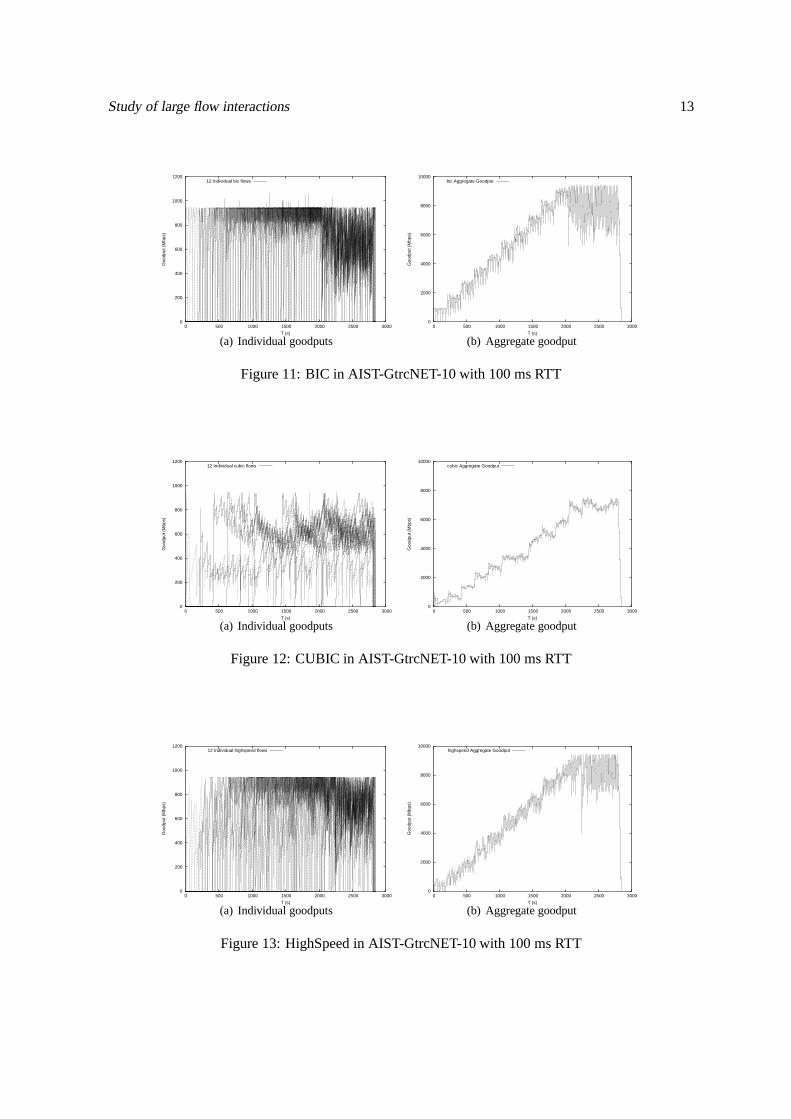
The figures in this section display the results we obtained for individual flows and for aggregategoodput as in the previous section. Figure 11 exhibits synchronisation effects, large number of flowsare dropping packets at the same time, when there is congestion in the system. This problem mightalso explain some of the strange behaviours in the observed fairness on figure 17.
Figure 10 confirms the expected bad behaviour6 of TCP Reno in large BDP environments as it isunable to achieve a goodput above 3.5 Gbps, when new TCP variants such as BIC (figure 11) are able
6as already stated in section 4.2.1
12 R. Guillier, L. Hablot, Y. Kodama, T. Kudoh, F. Okazaki, P. Primet, S. Soudan, R. Takano
0
2000
4000
6000
8000
10000
12000
0 2000 4000 6000 8000 10000 12000 14000 16000 18000
Thr
ough
put (
Mbp
s)
Time (s)
Throughput
(a) 11.5 ms RTT
0
2000
4000
6000
8000
10000
12000
0 2000 4000 6000 8000 10000 12000 14000 16000 18000
Thr
ough
put (
Mbp
s)
Time (s)
Throughput
(b) 100 ms RTT
Figure 9: Reno, BIC, CUBIC, HighSpeed, H-TCP and Scalable with various RTT in AIST-GtrcNET-10
0
200
400
600
800
1000
1200
0 500 1000 1500 2000 2500 3000
Goo
dput
(M
bps)
T (s)
12 Individual reno flows
(a) Individual goodputs
0
2000
4000
6000
8000
10000
0 500 1000 1500 2000 2500 3000
Goo
dput
(M
bps)
T (s)
reno Aggregate Goodput
(b) Aggregate goodput
Figure 10: Reno in AIST-GtrcNET-10 with 100 ms RTT
Study of large flow interactions 13
0
200
400
600
800
1000
1200
0 500 1000 1500 2000 2500 3000
Goo
dput
(M
bps)
T (s)
12 Individual bic flows
(a) Individual goodputs
0
2000
4000
6000
8000
10000
0 500 1000 1500 2000 2500 3000
Goo
dput
(M
bps)
T (s)
bic Aggregate Goodput
(b) Aggregate goodput
Figure 11: BIC in AIST-GtrcNET-10 with 100 ms RTT
0
200
400
600
800
1000
1200
0 500 1000 1500 2000 2500 3000
Goo
dput
(M
bps)
T (s)
12 Individual cubic flows
(a) Individual goodputs
0
2000
4000
6000
8000
10000
0 500 1000 1500 2000 2500 3000
Goo
dput
(M
bps)
T (s)
cubic Aggregate Goodput
(b) Aggregate goodput
Figure 12: CUBIC in AIST-GtrcNET-10 with 100 ms RTT
0
200
400
600
800
1000
1200
0 500 1000 1500 2000 2500 3000
Goo
dput
(M
bps)
T (s)
12 Individual highspeed flows
(a) Individual goodputs
0
2000
4000
6000
8000
10000
0 500 1000 1500 2000 2500 3000
Goo
dput
(M
bps)
T (s)
highspeed Aggregate Goodput
(b) Aggregate goodput
Figure 13: HighSpeed in AIST-GtrcNET-10 with 100 ms RTT
14 R. Guillier, L. Hablot, Y. Kodama, T. Kudoh, F. Okazaki, P. Primet, S. Soudan, R. Takano
0
200
400
600
800
1000
1200
0 500 1000 1500 2000 2500 3000
Goo
dput
(M
bps)
T (s)
12 Individual htcp flows
(a) Individual goodputs
0
2000
4000
6000
8000
10000
0 500 1000 1500 2000 2500 3000
Goo
dput
(M
bps)
T (s)
htcp Aggregate Goodput
(b) Aggregate goodput
Figure 14: HTCP in AIST-GtrcNET-10 with 100 ms RTT
0
200
400
600
800
1000
1200
0 500 1000 1500 2000 2500 3000
Goo
dput
(M
bps)
T (s)
12 Individual scalable flows
(a) Individual goodputs
0
2000
4000
6000
8000
10000
0 500 1000 1500 2000 2500 3000
Goo
dput
(M
bps)
T (s)
scalable Aggregate Goodput
(b) Aggregate goodput
Figure 15: Scalable in AIST-GtrcNET-10 with 100 ms RTT
Study of large flow interactions 15
to achieve goodputs closer to the capacity of the link. We canclearly see the AIMD mechanism behindTCP Reno by looking at the individual goodputs, from the slowincrease in congestion avoidance tothe sharp decrease when a packet loss occurs.
Figure 12 presents the results for the CUBIC protocol, whichjust like Reno, isn’t able to fillcompletely the link before the end of the experiment. We can see that all the nodes aren’t able tostay around the maximum goodput achievable, even when thereis no congestion in the system. Italso seems that some of the nodes, for instance, the two first started nodes, had difficulties duringtheir slow-start and were stuck around 300 Mbps for more than400 s. We also notice that some ofthe nodes are very conservative, for instance the third node, as they slowly decrease the congestionwindow as other nodes enter the system, even when there is no actual congestion.
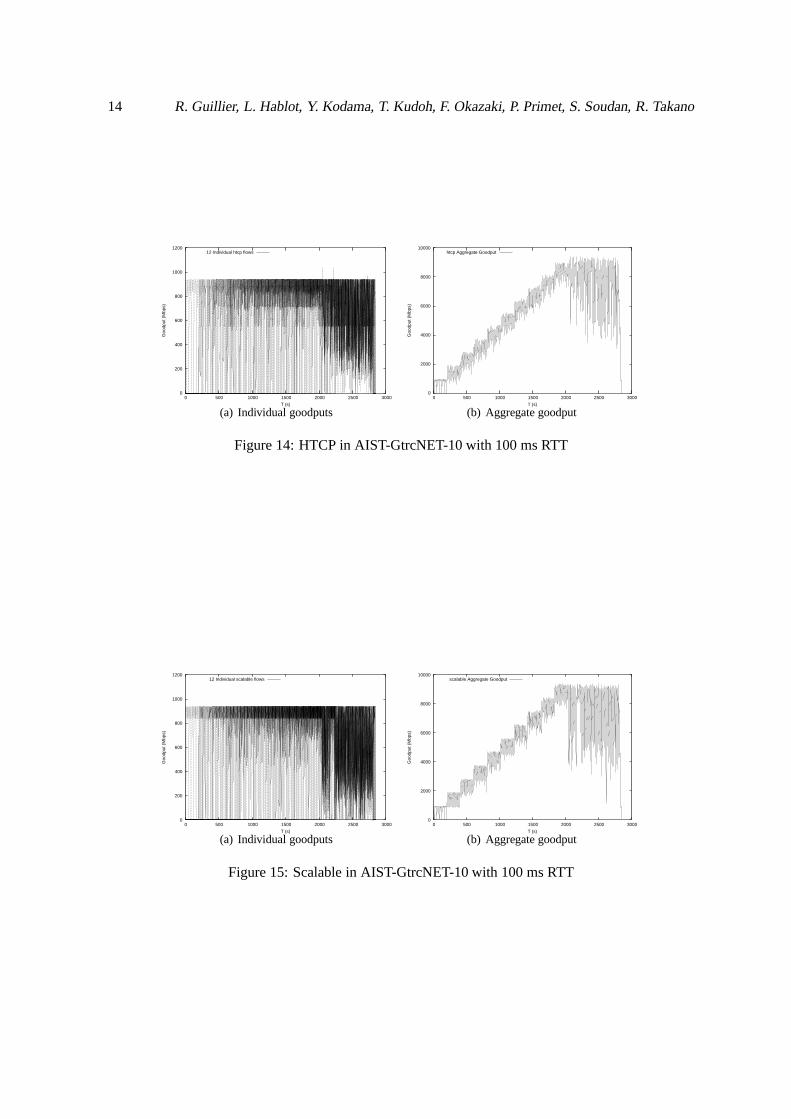
Figure 13 seems to have some difficulties during the earlier phase of the test as the two first nodesthat were started aren’t able to reach the maximum goodput achievable, which might indicate thatHighSpeed require a certain amount of congestion or competition to start working normally. Figure 14and figure 15 - respectively H-TCP and Scalable - are quite similar except that Scalable seems to be abit more agitated and blurry. They still display, like BIC infigure 11, the same kind of steps than withlower RTTs, which shows that there are still able to react rather quickly to congestion level changes.
As already stated in section 3, please note that some of the bad behaviours observed in this sectionmay have been caused by some firmware incompatibilities in the AIST-GtrcNET-10, which causeextra-losses in the nodes.
The work in this section showed that the different TCP variants start behaving differently as soonas they are used in high BDP conditions. It highlights the fact that one need to choose carefully itsTCP variant according to the current RTT condition, as we will try to point in the following section.
4.2.3 Individual goodputs and fairness as a function of latency and protocol
In this section, we tried to aggregate the data acquired fromour previous experiments to representthem as function of latency and congestion control method. We used the three following metrics:mean of goodputs, Jain’s index and standard deviation to themean of goodputs. In the last part of thissection, we also study the distribution of goodputs as it is agood way to synthesize the three othermetrics.
The figures on the left side correspond to the case when only five nodes are emitting, while theones on the right are the case with twelve nodes, that is to saywithout and with congestion.
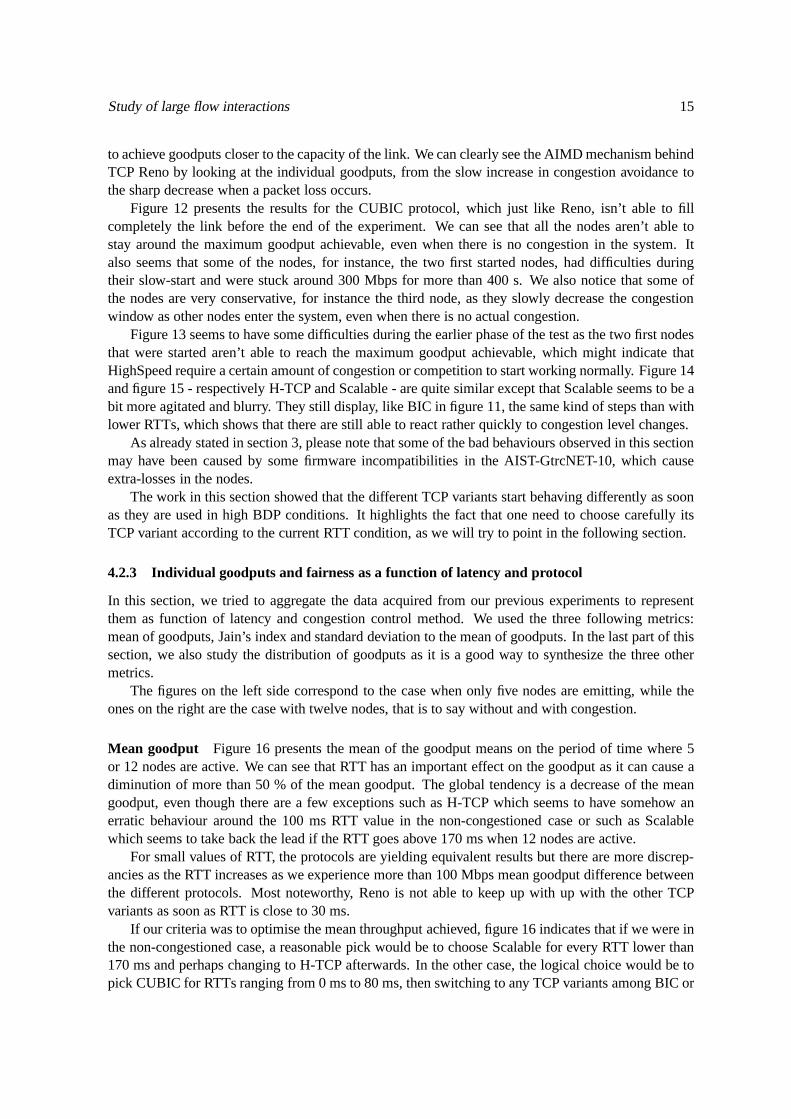
Mean goodput Figure 16 presents the mean of the goodput means on the periodof time where 5or 12 nodes are active. We can see that RTT has an important effect on the goodput as it can cause adiminution of more than 50 % of the mean goodput. The global tendency is a decrease of the meangoodput, even though there are a few exceptions such as H-TCPwhich seems to have somehow anerratic behaviour around the 100 ms RTT value in the non-congestioned case or such as Scalablewhich seems to take back the lead if the RTT goes above 170 ms when 12 nodes are active.
For small values of RTT, the protocols are yielding equivalent results but there are more discrep-ancies as the RTT increases as we experience more than 100 Mbps mean goodput difference betweenthe different protocols. Most noteworthy, Reno is not able to keep up with up with the other TCPvariants as soon as RTT is close to 30 ms.
If our criteria was to optimise the mean throughput achieved, figure 16 indicates that if we were inthe non-congestioned case, a reasonable pick would be to choose Scalable for every RTT lower than170 ms and perhaps changing to H-TCP afterwards. In the othercase, the logical choice would be topick CUBIC for RTTs ranging from 0 ms to 80 ms, then switching to any TCP variants among BIC or
16 R. Guillier, L. Hablot, Y. Kodama, T. Kudoh, F. Okazaki, P. Primet, S. Soudan, R. Takano
0
200
400
600
800
1000
0 50 100 150 200
Mea
n of
Goo
dput
s (M
bps)
RTT (ms)
renobic
cubichighspeed
htcpscalable
(a) 5 active nodes
0
200
400
600
800
1000
0 50 100 150 200
Mea
n of
Goo
dput
s (M
bps)
RTT (ms)
renobic
cubichighspeed
htcpscalable
(b) 12 active nodes
Figure 16: Mean goodputs for TCP variants when 5 or 12 nodes are active in AIST-GtrcNET-10
Study of large flow interactions 17
0.75
0.8
0.85
0.9
0.95
1
0 50 100 150 200
Fai
rnes
s
RTT (ms)
renobic
cubichighspeed
htcpscalable
(a) 5 active nodes
0.75
0.8
0.85
0.9
0.95
1
0 50 100 150 200
Fai
rnes
s
RTT (ms)
renobic
cubichighspeed
htcpscalable
(b) 12 active nodes
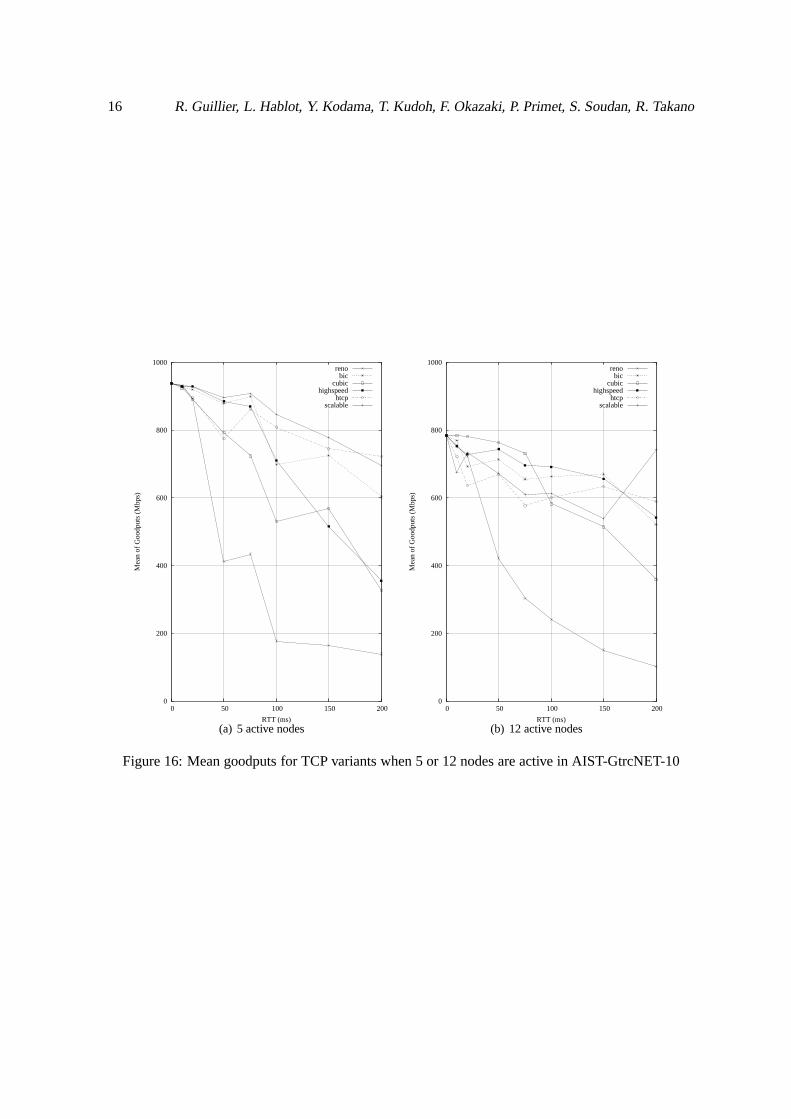
Figure 17: Fairness for TCP variants when 5 or 12 nodes are actives in AIST-GtrcNET-10
18 R. Guillier, L. Hablot, Y. Kodama, T. Kudoh, F. Okazaki, P. Primet, S. Soudan, R. Takano
0
50
100
150
200
250
300
0 50 100 150 200
RTT (ms)
renobic
cubichighspeed
htcpscalable
(a) 5 active nodes
0
50
100
150
200
250
300
0 50 100 150 200
RTT (ms)
renobic
cubichighspeed
htcpscalable
(b) 12 active nodes
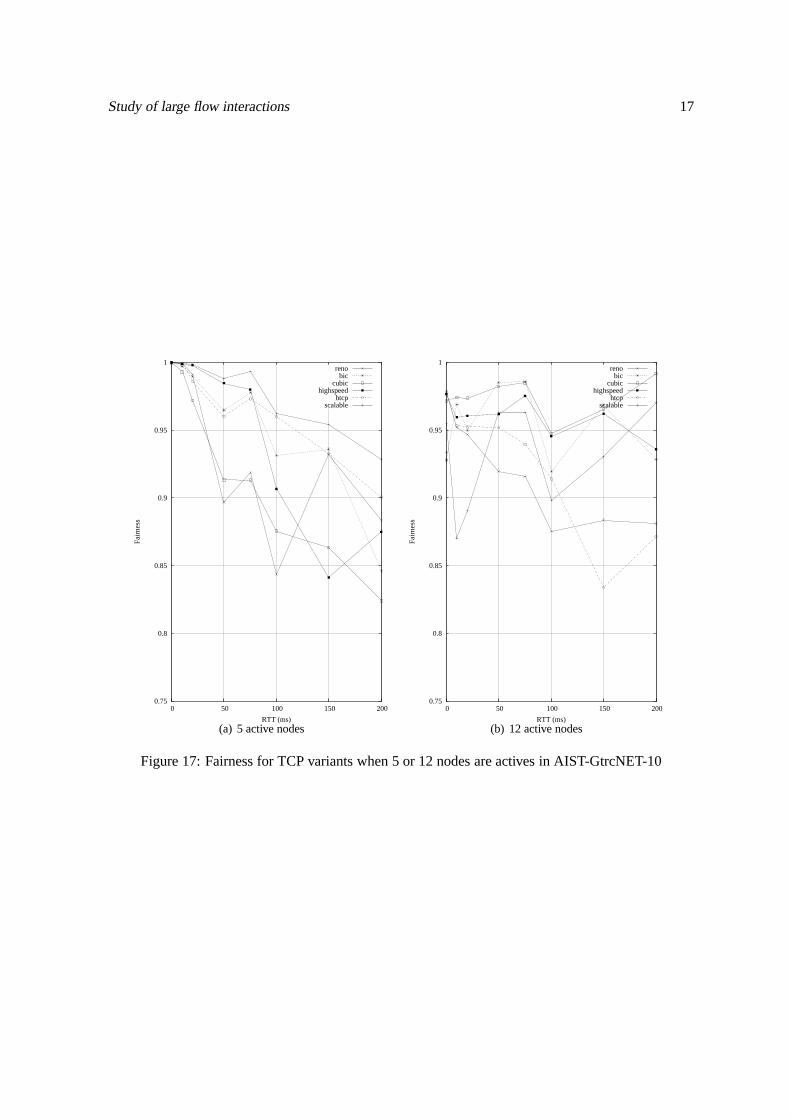
Figure 18: Mean of goodputs’ standard deviation for TCP variants when 5 or 12 nodes are actives inAIST-GtrcNET-10
Study of large flow interactions 19
HighSpeed as they have very similar results for the 80 ms-170ms RTT values and finally use Scalablefor RTT above 170 ms.
This information could help us determine the most adequate TCP variant for a given RTT value,if the mean goodput is the only criteria we have in mind in thisparticular configuration.
Fairness Figure 17 shows the evolution of the fairness for several TCPvariants with respect to theRTT. In the non-congested case, the fairness is decreasing when the RTT is increasing, it is mainlydue to the fact that the flows need more time to increase their throughput and that they tend to stay forrather long times around the same throughput value generating kind of stratas such as can be seen onfigure 10. In the other case, except for a few exceptions (BIC and H-TCP), the fairness remains closeto 0.95 in the congested case, which is a rather good value.
If our main criteria was to maximise the fairness, in the non-congested case, the best solutionwould be to use Scalable for every RTT values. In the other case, it seems that using CUBIC all alongis the most reasonnable choice.
Standard deviation Figure 18 shows the level of variation of the goodputs aroundthe mean goodputachieved, which is an indicator of the stability of a protocol in a given situation. Here we can noticethat when there is no congestion and the RTT is low, all the procols are displaying similar standarddeviations. For medium RTT values (20 ms to 75 ms), the behaviour is still very similar, even thoughthe maximal difference between protocols reaches up to 100 Mbps. It gets worse for some TCPvariants for high RTT values as we can reach more than 200 Mbpsvariation, even though someprotocols such as BIC are behaving better when the RTT increases. This last point might be explainedby the fact that with high RTT values, the fifth node is disadvantaged by its slow start period andrequires more time to join when slow-evolving protocols such as Reno or CUBIC are used.
Please note that having a small standard deviation is perhaps not a good stand-alone criteria, as forinstance Reno is displaying very low standard deviation forhigh RTTs values, but at the same time, itis unable to achieve good mean goodput results.
When there is congestion, the behaviour is more erratic since BIC is showing more than 200 Mbpsof variation for low RTT values and is more stable (less than 50 Mbps) in high RTT conditions. It isquite hard to find similar patterns in their behaviour, especially when the RTT is low, but it seems thatwe have two categories of protocols in high RTT conditions, those with low standard deviation (BICand CUBIC) and those with high standard deviation (Reno, HighSpeed, H-TCP and Scalable)
Similar to our previous discussion with the mean goodput, ifour main criteria were to minimisethis metric, we could easily decide with figure 18 which protocol is most suited to a given RTT value.The reasonable choice in the non-congested case would be to pick any protocol for RTTs lower than20 ms, to take HighSpeed for the 20 ms-75 ms range and than switch to Reno for the rest of the time.In the congested case, a good solution would be to choose HighSpeed on the 0 ms-50 ms RTT range,CUBIC and finally Reno for the rest of the time.
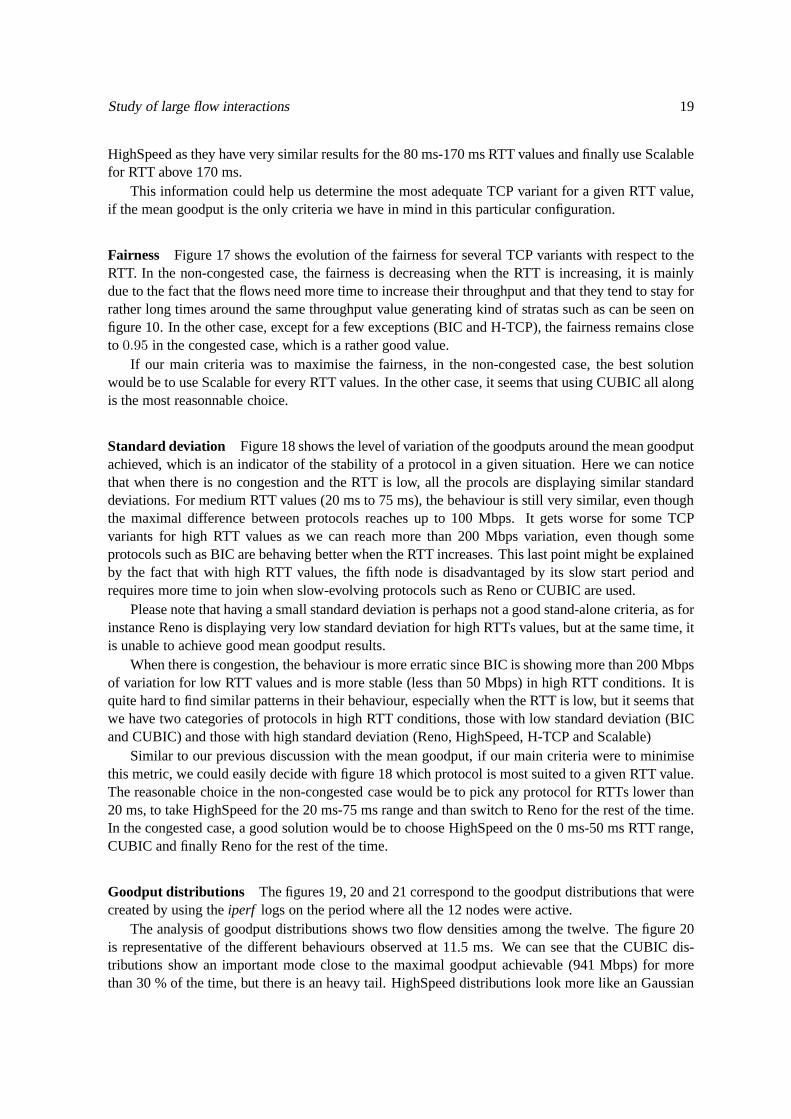
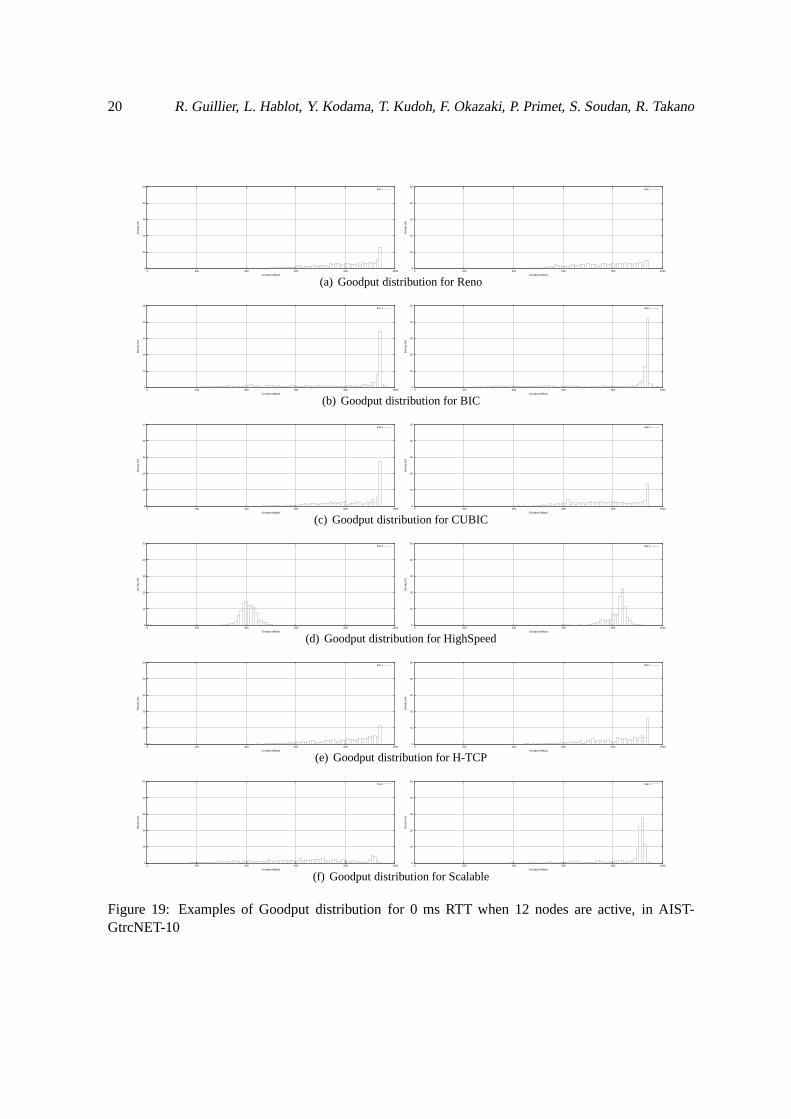
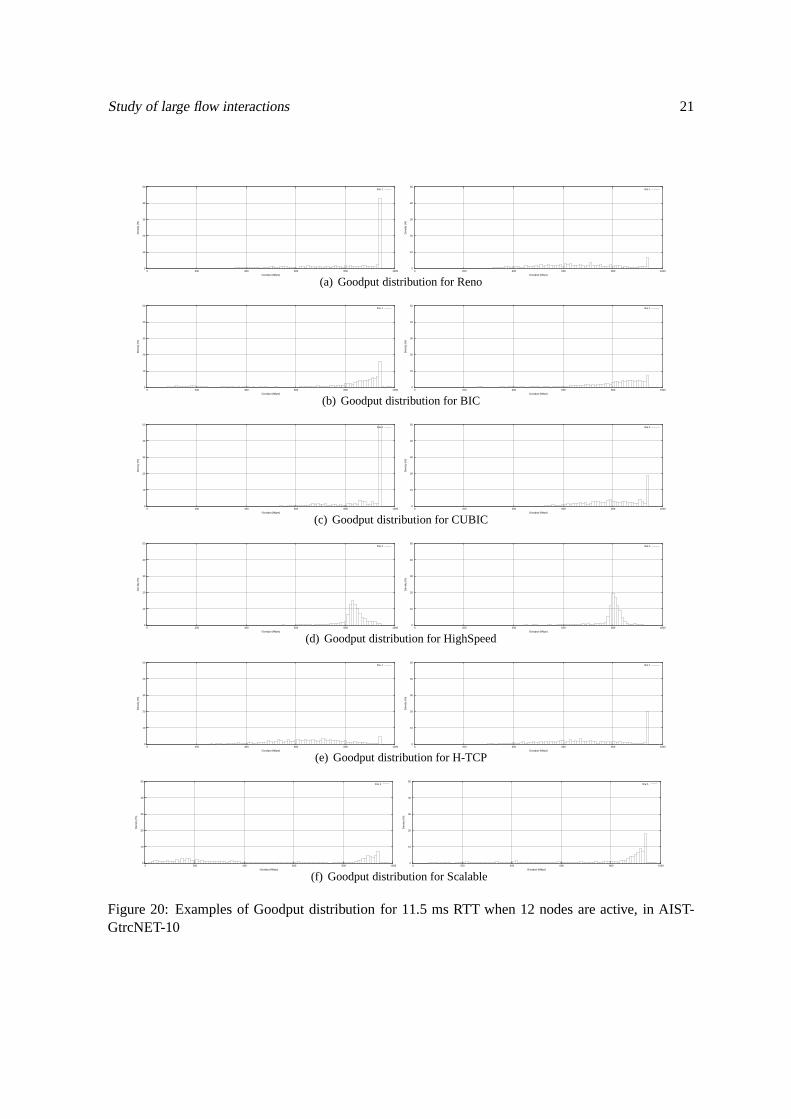
Goodput distributions The figures 19, 20 and 21 correspond to the goodput distributions that werecreated by using theiperf logs on the period where all the 12 nodes were active.
The analysis of goodput distributions shows two flow densities among the twelve. The figure 20is representative of the different behaviours observed at 11.5 ms. We can see that the CUBIC dis-tributions show an important mode close to the maximal goodput achievable (941 Mbps) for morethan 30 % of the time, but there is an heavy tail. HighSpeed distributions look more like an Gaussian
20 R. Guillier, L. Hablot, Y. Kodama, T. Kudoh, F. Okazaki, P. Primet, S. Soudan, R. Takano
0
10
20
30
40
50
0 200 400 600 800 1000
Den
sity
(%
)
Goodput (Mbps)
line 1
0
10
20
30
40
50
0 200 400 600 800 1000
Den
sity
(%
)
Goodput (Mbps)
line 1
(a) Goodput distribution for Reno
0
10
20
30
40
50
0 200 400 600 800 1000
Den
sity
(%
)
Goodput (Mbps)
line 1
0
10
20
30
40
50
0 200 400 600 800 1000
Den
sity
(%
)
Goodput (Mbps)
line 1
(b) Goodput distribution for BIC
0
10
20
30
40
50
0 200 400 600 800 1000
Den
sity
(%
)
Goodput (Mbps)
line 1
0
10
20
30
40
50
0 200 400 600 800 1000
Den
sity
(%
)
Goodput (Mbps)
line 1
(c) Goodput distribution for CUBIC
0
10
20
30
40
50
0 200 400 600 800 1000
Den
sity
(%
)
Goodput (Mbps)
line 1
0
10
20
30
40
50
0 200 400 600 800 1000
Den
sity
(%
)
Goodput (Mbps)
line 1
(d) Goodput distribution for HighSpeed
0
10
20
30
40
50
0 200 400 600 800 1000
Den
sity
(%
)
Goodput (Mbps)
line 1
0
10
20
30
40
50
0 200 400 600 800 1000
Den
sity
(%
)
Goodput (Mbps)
line 1
(e) Goodput distribution for H-TCP
0
10
20
30
40
50
0 200 400 600 800 1000
Den
sity
(%
)
Goodput (Mbps)
line 1
0
10
20
30
40
50
0 200 400 600 800 1000
Den
sity
(%
)
Goodput (Mbps)
line 1
(f) Goodput distribution for Scalable
Figure 19: Examples of Goodput distribution for 0 ms RTT when12 nodes are active, in AIST-GtrcNET-10
Study of large flow interactions 21
0
10
20
30
40
50
0 200 400 600 800 1000
Den
sity
(%
)
Goodput (Mbps)
line 1
0
10
20
30
40
50
0 200 400 600 800 1000
Den
sity
(%
)
Goodput (Mbps)
line 1
(a) Goodput distribution for Reno
0
10
20
30
40
50
0 200 400 600 800 1000
Den
sity
(%
)
Goodput (Mbps)
line 1
0
10
20
30
40
50
0 200 400 600 800 1000
Den
sity
(%
)
Goodput (Mbps)
line 1
(b) Goodput distribution for BIC
0
10
20
30
40
50
0 200 400 600 800 1000
Den
sity
(%
)
Goodput (Mbps)
line 1
0
10
20
30
40
50
0 200 400 600 800 1000
Den
sity
(%
)
Goodput (Mbps)
line 1
(c) Goodput distribution for CUBIC
0
10
20
30
40
50
0 200 400 600 800 1000
Den
sity
(%
)
Goodput (Mbps)
line 1
0
10
20
30
40
50
0 200 400 600 800 1000
Den
sity
(%
)
Goodput (Mbps)
line 1
(d) Goodput distribution for HighSpeed
0
10
20
30
40
50
0 200 400 600 800 1000
Den
sity
(%
)
Goodput (Mbps)
line 1
0
10
20
30
40
50
0 200 400 600 800 1000
Den
sity
(%
)
Goodput (Mbps)
line 1
(e) Goodput distribution for H-TCP
0
10
20
30
40
50
0 200 400 600 800 1000
Den
sity
(%
)
Goodput (Mbps)
line 1
0
10
20
30
40
50
0 200 400 600 800 1000
Den
sity
(%
)
Goodput (Mbps)
line 1
(f) Goodput distribution for Scalable
Figure 20: Examples of Goodput distribution for 11.5 ms RTT when 12 nodes are active, in AIST-GtrcNET-10
22 R. Guillier, L. Hablot, Y. Kodama, T. Kudoh, F. Okazaki, P. Primet, S. Soudan, R. Takano
0
10
20
30
40
50
0 200 400 600 800 1000
Den
sity
(%
)
Goodput (Mbps)
line 1
0
10
20
30
40
50
0 200 400 600 800 1000
Den
sity
(%
)
Goodput (Mbps)
line 1
(a) Goodput distribution for Reno
0
10
20
30
40
50
0 200 400 600 800 1000
Den
sity
(%
)
Goodput (Mbps)
line 1
0
10
20
30
40
50
0 200 400 600 800 1000
Den
sity
(%
)
Goodput (Mbps)
line 1
(b) Goodput distribution for BIC
0
10
20
30
40
50
0 200 400 600 800 1000
Den
sity
(%
)
Goodput (Mbps)
line 1
0
10
20
30
40
50
0 200 400 600 800 1000
Den
sity
(%
)
Goodput (Mbps)
line 1
(c) Goodput distribution for CUBIC
0
10
20
30
40
50
0 200 400 600 800 1000
Den
sity
(%
)
Goodput (Mbps)
line 1
0
10
20
30
40
50
0 200 400 600 800 1000
Den
sity
(%
)
Goodput (Mbps)
line 1
(d) Goodput distribution for HighSpeed
0
10
20
30
40
50
0 200 400 600 800 1000
Den
sity
(%
)
Goodput (Mbps)
line 1
0
10
20
30
40
50
0 200 400 600 800 1000
Den
sity
(%
)
Goodput (Mbps)
line 1
(e) Goodput distribution for H-TCP
0
10
20
30
40
50
0 200 400 600 800 1000
Den
sity
(%
)
Goodput (Mbps)
line 1
0
10
20
30
40
50
0 200 400 600 800 1000
Den
sity
(%
)
Goodput (Mbps)
line 1
(f) Goodput distribution for Scalable
Figure 21: Examples of Goodput distribution for 100 ms RTT when 12 nodes are active, in AIST-GtrcNET-10
Study of large flow interactions 23
distribution, which shows that the HighSpeed goodput tendsto be less variable than the one obtainedwith CUBIC.
When the RTT is low (figure 19), BIC and CUBIC tend to perform rather well as they are able tomaintain a goodput close the maximum achievable (941 Mbps) for more than 40 % of the time, eventhough CUBIC shows a more important tail. The goodput distributions for HighSpeed look morelike a Gaussian distribution with a peak. When the RTT is high(figure 21), the distributions are morewidespread, failing to reveal a dominant mode, which suggest that all the protocols tested in this reportdoesn’t perform well under high latency with congestion.
24 R. Guillier, L. Hablot, Y. Kodama, T. Kudoh, F. Okazaki, P. Primet, S. Soudan, R. Takano
5 Conclusion
In this research report, we have explored the real behaviourof TCP variants in the context of grid-likehigh-speed networks. We have presented a few metrics that helped us characterise different variantsof TCP in various RTT conditions and we have proposed a simplemethodology that could be easilyreproduced everywhere. This work also permitted to ensure that the AIST-GtrcNET-10 testbed, eventough we had some technical difficulties with firmwares, is a good approximation of a real testbed likethe one we used in Grid5000 with interesting extra functionalities like precise bandwidth measurementand latency emulation. Finally, we have provided a set of experimental measurements that allowed usto give a first insight of the performance of several TCP variants and to provide a few hints if we wereto choose to use one of them in given conditions, according tothe RTT or the congestion level, eventough for the moment, there is no universal solution.
In the future, we plan to extend further our work by studying other aspects that could help us toimprove and/or find the most suitable solution for a given setof networking conditions and objectives.To do so, we intend to perform the same kind of tests with parallel streams, which is considered to bean “effective” solution for bulk data transfers [HNA04] andto conduct the study of the evolution oftransfer time according to our parameters as well as the RTT fairness problem in the “grid context”.Moreover, we will also need to check the impact of other parameters such as reverse and backgroundtraffics to be as close as possible to real networking conditions. Not to forget that we are currentlyonly working on memory to memory transfers and that we will also need to tackle the problem of diskto disk transfers.
6 Acknowledgement
This work has been funded by the French ministry of Educationand Research, INRIA, and CNRS, viaACI GRID’s Grid5000 project and ACI MD’s Data Grid Explorer project, the IGTMD ANR grant,Egide Sakura program, NEGST CNRS-JSP project. A part of thisresearch was supported by a grantfrom the Ministry of Education, Sports, Culture, Science and Technology (MEXT) of Japan throughthe NAREGI (National Research Grid Initiative) Project andthe PAI SAKURA 100000SF with AIST-GTRC.
References
[C+] R. Les Cottrell et al. Characterization and evaluation of tcp and udp-based transporton real networks. Presented at 3rd International Workshop on Protocols for Fast Long-distance Networks, Lyon, France, 3-4 Feb 2005.
[Ca05] Franck Cappello and al. Grid5000: A large scale, reconfigurable, controlable andmonitorable grid platform. InGRID2005 worskhop of the IEEE SuperComputingConference, November 2005.
[FFR+04] Ian Foster, Markus Fidler, Alain Roy, Volker Sander, andLinda Winkler. End-to-end quality of service for high-end applications.Computer Communications,27(14):1375–1388, 2004.
[Flo03] S. Floyd. HighSpeed TCP for Large Congestion Windows. RFC 3649 (Experimental),December 2003.

Study of large flow interactions 25
[Flo06a] Metrics for the evaluation of congestion control mechanisms. In Sally Floyd, editor,http://www.ietf.org/internet-drafts/draft-irtf-tmrg-metrics-04.txt, August 2006.
[Flo06b] Tools for the evaluation of simulation and testbedscenarios. In Sally Floyd andE Kohler, editors,http://www.ietf.org/internet-drafts/draft-irtf-tmrg-tools-02.txt, June2006.
[GHPS06] Romaric Guillier, Ludovic Hablot, Pascale Primet, and Sébastien Soudan. Evaluationof 10 gbe links in grid’5000. Technical report, LIP, ENS Lyon, 2006.
[GR06] Sergey Gorinsky and Nageswara S. V. Rao. Dedicated channels as an optimal networksupport for effective transfer of massive data. InHigh-Speed Networking, 2006.
[HLRX06] Sangtae Ha, Long Le, Injong Rhee, and Lisong Xu. A step toward realistic perfor-mance evaluation of high-speed tcp variants.Elsevier Computer Networks (COMNET)Journal, Special issue on "Hot topics in transport protocols for very fast and very longdistance networks" Pascale Vicat-Blanc, Joe Touch, Kasuchi Kobayashi Eds., 2006.
[HNA04] T. Hacker, B. Noble, and B. Athey. "improving throughput and maintaining fairnessusing parallel tcp". InProceedings of the IEEE INFOCOM, 2004.
[JMW84] R. Jain, Chiu D. M., and Hawe W. A quantitative measure of fairness and discrima-tion for resource allocation in shared systems. Technical report, Digital EquipmentCorporation, 1984.
[Kel03] Tom Kelly. Scalable tcp: improving performance in highspeed wide area networks.SIGCOMM Comput. Commun. Rev., 33(2):83–91, 2003.
[KKT +04] Y. Kodama, T. Kudoh, T. Takano, H. Sato, O. Tatebe, and S. Sekiguchi. Gnet-1: Giga-bit ethernet network testbed. InIn Proceedings of the IEEE International ConferenceCluster 2004, San Diego, California, USA, September 20-23 2004.
[LLS06] Yee-Ting Li, Douglas Leith, and Robert N. Shorten. Experimental evaluation of tcpprotocols for high-speed networks. InTransactions on Networking, to appear 2006.
[MFVBP04] Jean Philippe Martin-Flatin and Pascale Vicat-Blanc Primet, editors.High Perfor-mance Networks and Services for Grid : the IST DataTAG project experience. Else-vier, dec 2004.
[MHR03] Matt Mathis, John Heffner, and Raghu Reddy. Web100:extended tcp instrumentationfor research, education and diagnosis.SIGCOMM Comput. Commun. Rev., 33(3):69–79, 2003.
[Rob04] J.W. Roberts. A survey on statistical bandwidth sharing. Computer Networks, Apr.2004.
[RX05] Injong Rhee and Lisong Xu. Cubic: a new tcp-friendly high-speed tcp variant. InThirdInternational Workshop on Protocols for Fast Long-Distance Networks, feb. 2005.
[SL04] R.N. Shorten and Doug Leith. H-TCP: TCP for high-speed and long-distance net-works. In Proceedings of 2nd International Workshop on Protocols for Fast Long-Distance Networks (PFLDnet’04), Argonne, Illinois USA, feb. 2004.

26 R. Guillier, L. Hablot, Y. Kodama, T. Kudoh, F. Okazaki, P. Primet, S. Soudan, R. Takano
[WHVBPa05] Michael Weltz, Eric He, Pascale Vicat-Blanc Primet, and al. Survey of protocols otherthan tcp. Technical report, Open Grid Forum, April 2005. GFD37.
[XHR04] Lisong Xu, Khaled Harfoush, and Injong Rhee. Binaryincrease congestion controlfor fast long-distance networks. InINFOCOM, 2004.
Study of large flow interactions 27
Contents
1 Introduction 1
2 Methodology 22.1 Traffic characteristics . . . . . . . . . . . . . . . . . . . . . . . . . . .. . . . . . . 22.2 Scenarii . . . . . . . . . . . . . . . . . . . . . . . . . . . . . . . . . . . . . . . .. 32.3 Measured parameters and metrics . . . . . . . . . . . . . . . . . . . .. . . . . . . 3
3 Experiment description 43.1 System and service description . . . . . . . . . . . . . . . . . . . . .. . . . . . . . 4
4 Results analysis 64.1 Single flows experiment with TCP variants . . . . . . . . . . . . .. . . . . . . . . . 7
4.1.1 Experiment description . . . . . . . . . . . . . . . . . . . . . . . . .. . . . 74.1.2 Results . . . . . . . . . . . . . . . . . . . . . . . . . . . . . . . . . . . . . 7
4.2 Exploration of TCP variants behaviour in various latency conditions . . . . . . . . . 114.2.1 Impact of the latency . . . . . . . . . . . . . . . . . . . . . . . . . . . .. . 114.2.2 Impact of the protocol . . . . . . . . . . . . . . . . . . . . . . . . . . .. . 114.2.3 Individual goodputs and fairness as a function of latency and protocol . . . . 15
5 Conclusion 24
6 Acknowledgement 24