Embed Size (px)
Citation preview
Agence Française de DéveloppementDirection de la StratégieDépartement de la Recherche
5, rue Roland Barthes75012 Paris < Francewww.afd.fr • [email protected]
Public Private Partnerships inWater and Electricity in Africa
Emmanuelle Auriol, ARQADE and IDEI Toulouse Sciences Economiques ([email protected])
Aymeric Blanc, AFD, Département de la Recherche ([email protected])
DisclaimerThe analysis and conclusions of this document are those of the authors. They do not necessarilyreflect the official position of the AFD or its partner institutions.
Département de la Recherche
WorkingPaper
Age
nce
Fran
çais
e d
e D
ével
opp
emen
t
38january 2007
Emmanuelle Auriol gratefully acknowledges financial support
from the AFD. The paper has benefited from numerous
discussions with Antonio Estache and from the tips and
references he provided. His knowledge of economic theory
and of infrastructure reforms in developing countries was
invaluable. We thank him for his help. We are also grateful to
the participants of the economists’ network seminar at the
AFD, especially to Alexis Bonnel, for their comments on and
discussion of the paper. Any remaining errors are ours.
© AFD Working Paper No. 38 • Public Private Partnerships in Water and Electricity in Africa 2
Acknowledgements
© AFD Working Paper No. 38 • Public Private Partnerships in Water and Electricity in Africa 3
Table of contents
Abstract 4
1. Introduction 5
2. Electricity and Water in Africa 8
2.1. Electricity 8
2.2. Water 10
3. Public Private Partnerships and Consumer Surplus 11
3.1. Productive Efficiency 11
3.2. Allocative Efficiency 12
4. PPPs and Macro-fiscal Balancing (Auriol and Picard (2002)) 15
4.1. Opportunity Cost of Public Funds 15
4.2. The Model 16
4.3. Unprofitable Segment 18
4.4. Low Profitability Segment 18
4.5. Profitable Segment 20
5. Conclusion 23
Appendix 24
A1. Typology of Private Sector Participation in Water Utilities 24
A2. Typology of Private Sector Participation in Electricity Utilities in Africa (without IPP) 25
References 27
The paper analyzes the costs and benefits of private
participation in the electricity and water industries in Sub-
Saharan Africa. Contrary to conventional wisdom, the
participation of private unregulated firms in the supply of
services for the middle class and poor is fairly common in the
region. This private involvement reflects the extreme
weakness of African governments. By contrast, service to the
rich is provided by public utilities. Theory then suggests that
prices should be high, so that the public firms make a profit.
Yet piped water, and to a lesser extent electricity, are heavily
subsidized. This signals a problem of capture by the ruling
elite. It is a matter of justice and efficiency to increase public
utilities revenues to subsidize investment and fiscal relief. This
is especially relevant in electricity, where the economies of
scale are much larger than in water. Electrification is the
biggest challenge to the African economy because it requires
huge investment. Local and regional private investors can
play a non-negligible role in reducing penury. However, their
involvement is conditional on the financial health of the
sector and on strong government commitment.
© AFD Working Paper No. 38 • Public Private Partnerships in Water and Electricity in Africa 4
Abstract
From 1990 to 1997, there was a substantial and
unanticipated increase in private capital flows to the
developing world. The movement created the hope that the
private sector would be the next provider of investment in
infrastructure and public utilities in poor countries. Ten years
later, the assessment of the financial flows involved in the
process is sobering. Since the Asian financial crisis of 1997,
private investors, major commercial banks and international
organizations have retreated from the sector. This withdrawal
has been amplified by the weakening of the global
infrastructure industry. As a result, infrastructure finance to
developing economies from international sources has
declined by at least 50%. Yet at their peak in 1997, they
were just 3.6% of total new international bond, loan, and
equity issuance (World Bank 2004). It is clear today that
international private capital flows are not going to fill the
huge investment gap in poor countries’ infrastructure needs.
This is especially true in Africa, which is the focus of the
paper.1
Sub-Saharan Africa is the only region in the world not on
track to meet any of the Millennium Development Goals
(MDGs), but the situation is not as bleak as it might seem at
first sight. First of all, the average growth rate for the region
has been a steady 4% over the last 5 years. Although some
of this expansion is explained by high growth in oil- and
metal-exporting countries, more than half of Sub-Saharan
African countries have grown by 4% or more on average
during the period. Moreover, this represents a continuation
of a trend over the past 15 years. GDP is projected to grow
at an average of 5% over the next three years (World Bank
2006). However, realizing this growth potential is conditional
on making substantial progress in the provision of essential
public goods and infrastructure, notably electricity. Second,
some of the rare “success stories” with PPPs in electricity
or water took place in Africa, the private partners being
international operators, as in Côte d’Ivoire and Senegal, or
local private enterprises, as in Mauritania and Mozambique.2
Finally, when compared with its group of peers (i.e., poor
South Asian countries), Africa’s performance has been
significantly better in telecommunications access rates3 and
roughly the same in water and sanitation access rates and
in kilometers of roads per capita. In electricity access rates,
however, it has done much worse than its peers. The paper
thus focuses on the electricity and water industries. It aims
to analyze the costs and benefits of private participation in
these public utilities.
In Africa, where it has been difficult to attract international
investors, private participation into traditional public utilities
has not been limited to investment. Many private firms have
been involved into the management of utilities under leases
or concession contracts without actually owning any asset in
such firms. For instance, the World Bank has often favored
performance management contracts, rather unsuccessfully.
The paper extends the definition of Public Private Partnership
© AFD Working Paper No. 38 • Public Private Partnerships in Water and Electricity in Africa 5
1. Introduction
1. In Sub-Saharan Africa annual investment needs in infrastructure are estimated at USD 17-22 billion, while total annual spending is about USD 10 billion (World Bank2005). The investment figure does not include annual operating and maintenance costs, evaluated at USD 17-18 billion. With operating and maintenance costs, the annualAfrican investment requirement in infrastructure is estimated at 9% of GDP by Estache and Wodon (2006). The region’s infrastructure financing gap thus is very likely tobe around 5% of GDP.
2. See Blanc and Ghesquières (2006a), AFD-Hydroconseil (2002), AFD-Hydroconseil–SEURECA (2005).
3. Africa has the fastest growth rate of telecom penetration in the world at over 100% since 2001.
(PPP) to encompass all situations where the private sector is
involved into the provision of utilities services, whether formally
or not. We use the words “privatization” and “private
participation” to refer to situations where a private operator
provides utility services. This ranges from official contracts
between government and international firms to laissez-faire.4
The approach is pragmatic. It confronts the information which
is available from empirical and case studies with the analytical
tools available from regulation and privatization theory. The
objective is to provide a critical overview of private sector
involvement in water and electricity in Sub-Saharan Africa and
try to indicate directions for successful reforms.
Assessments of privatization reforms vary widely depending
on who is making them. As such reforms have led to
improvements in the financial and operating performance of
divested firms, and sometimes also to network expansion,
some specialists tend to think that the reforms have been
successful.5 This positive appraisal contrasts sharply with the
widespread perception among consumers in developing
countries that the reforms have hurt the poor, notably through
increases in prices and unemployment, while benefiting the
powerful and wealthy. For example, surveys from Sub-
Saharan Africa, post-communist transition states and South
Asia show strong popular opposition to privatization policies
(Kikeri and Kolo 2005).6 In Africa, privatization reforms have
been qualified as "re-colonization" due to the participation
of foreign firms in many cases. The progress of democracy
implies that governments have been threatened by the
unpopularity of the reforms. In Africa, they also have been
disappointed by the sluggishness of capital flows. Over the
period 1992-2003, the continent managed to attract only
4% of total international investment in infrastructure (World
Bank 2004).7 Finally, private firms have generally been
disappointed by the profits they can secure in developing
countries. Discouraged by the unpopularity of their actions
and the ensuing changes in policy,8 many of them have
retreated from utility services, notably in water and electricity.
Examples include Veolia in Guinea, Saur in Mali, Hydro-
Québec and Elyo in Senegal, and Biwater in Tanzania.
The contentment of the specialists is not easily reconciled
with the dissatisfaction of consumers, governments and
firms. Frustrations arose because expectations were too
high. A World Bank survey of firms with international equity
investments in developing country power sectors shows
that 44% of the investors expected returns on equity of
more than 16%.9 Simultaneously, consumers were expecting
better and broader services at lower prices, while
governments were looking for fiscal revenue and large flows
of private investment. Yet the productivity gains yielded by
private sector involvement in public utilities management
are at most 10% (more likely around 5%, as surveys in the
United Kingdom suggest; see Newbery and Pollitt 1997).
With the exception of the telecommunications industry,
where private sector involvement has coincided with large
productivity gains, the benefits generated by PPP reforms are
not large enough to please taxpayers, consumers, firms’
managers, investors, international organizations and
governments all at the same time.10 Does this mean that
public private partnerships in developing countries have
come to an end? The paper clarifies this issue.
1. Introduction
© AFD Working Paper No. 38 • Public Private Partnerships in Water and Electricity in Africa 6
4. Official forms of PPP contracts are Operation and Maintenance (i.e., management) contracts, lease or “affermage” contracts; Build and Operate; Build and Finance; Build,Operate and Transfer (BOT) and Concession contracts.
5. For instance, Nellis (2006) writes: “Privatization usually results in improved performance in the affected firms. Its macroeconomic impact is generally assessed as positive,at the very least in the sense of providing governments with opportunities, and being correlated closely with increased growth and aggregate welfare. Data from the best-studied cases show that privatization’s impact on poverty and income distribution is, in many instances, negligible, and far less negative than popular perception wouldhave it.”
6. Similarly, the polling firm Latinobarometro, which conducts annual surveys of 19,000 people in 18 Latin American countries, found that 80% of respondents viewed privatizationnegatively in 2003.
7. Most international financing went to East Asia (44%) until the East Asian crisis, and thereafter to Latin America, Europe and Central Asia.
8. A major concern with privatization reforms has been governments’ commitment capability. Many contracts have been renegotiated after a short period of time. A numberof contracts have not been renewed, and some have simply been cancelled (Harris 2003).
9. The survey shows that investors’ expected returns on equity range from 8% to more than 25%; 44% of respondents were seeking returns of more than 16% (Lamechand Saeed 2003).
10. In telecommunications, the productivity gains yielded by mobile technology have been very large, making PPP reform was easy to implement and sustain.
One major lesson from the analysis below is that, contrary
to conventional wisdom, participation of private firms in the
supply of water and electricity services is fairly common in
Africa. This private involvement reflects the extreme
weakness of African governments. Public utilities services are
usually limited to big cities and wealthy neighborhoods. Yet
everybody needs to have some access to water and energy.
The irreducible part of demand has to be met, one way or the
other. In rural areas, people rely on self-collected wood and
water. In urban areas, the private sector is bridging the gap
between public services and people’s needs. Local private
entrepreneurs have understood the profit they can make
out of the fairly inelastic, irreducible part of demand. Water
supply to the poor is in some African cities a textbook case
of monopoly abuse. Another lesson from the analysis below
is that in light of the financial constraint faced by African
governments, letting private providers serve the less
profitable segments of the market is a second-best solution.
By contrast, profitable segments have to be served by the
public utility at high prices. The utilities’ goal should then be
to extract large rents from the wealthy to subsidize access
for the middle class and the poor. However, public utilities sell
their output at subsidized prices, when they collect their
bills at all. This reveals a problem of capture of such firms by
the ruling elite. Improving the commercial performance of
African public utilities is a matter of justice and efficiency.
In electricity, laissez-faire leads to severe penury on the
continent. First, returns to scale are large, which implies that
it is not possible to produce power at a reasonable cost on
a small scale. Second, demand is conditional on access,
because nobody owns electric appliances when he or she
is not connected to the grid. This is a chicken and egg
problem. Unconnected firms and households rely on
traditional biomass energy. They do not own electric
appliances and, as a consequence, are not very productive.
The low level of demand and the limited size of the utilities’
infrastructure are mutually reinforcing. The situation is so
bad that, despite sustained economic growth, Sub-Saharan
Africa’s demand for power remains low and is growing only
slowly. In practice, the growth of the sector is strongly
dependent on supply. The level of investment required to
improve access rates is high. Moreover, transmission
networks and big generation facilities require public
intervention and international cooperation when cross-border
interconnection is needed. It would be unrealistic to believe
that the private sector is able or willing to design, finance, and
manage the electrification of Africa. Governments will have
to play a central role and invest considerable resources in the
process. In the meantime, self-sufficiency based on private
generators and small privately owned and operated electricity
networks will continue to close the utilities gap at a high
cost.
The paper is organized as follows. Section 2 provides a brief
description of the situation in the water and electricity sectors
in Sub-Saharan Africa. Section 3 provides an overview of the
classic microeconomic theoretical arguments in favor of
privatization. Section 4 presents Auriol and Picard’s (2002)
results on macro-fiscal balancing and their implications for
the provision of water and electricity in Africa. Section 5
concludes.
1. Introduction
© AFD Working Paper No. 38 • Public Private Partnerships in Water and Electricity in Africa 7
2.1 Electricity
Sub-Saharan Africa has the lowest per capita consumption
of electricity in the world. The International Energy Agency
estimates that 24% of the total population had access to
electricity in 2002, as compared to 48% in comparable low-
income countries (IEA 2004).11 This implies that some 526
million Africans do not have access to electricity. The situation
is worse in rural areas, where the average access rate has
been estimated by Estache and Goicoechea (2005) to be as
low as 8%. Whether these figures are accurate or not, it is
undisputable that there is a severe penury of electricity in
Sub-Saharan Africa.
This is a major concern because empirical studies show
that energy consumption is one of the most significant
determinants of growth.12 For instance, in the portfolio of
the International Finance Corporation (IFC) of the World
Bank Group, the contribution of power projects to economic
growth as measured by economic rate of return is greater
than the rest of IFC’s portfolio (Manibog et al. 2003). Since
there is no substitute for electricity as a power source for
lighting and for domestic and professional appliances, the
lack of power acts as a brake on the African economy.
Recent estimates, based on counterfactual analysis, suggest
that on average growth per capita would have been roughly
1% higher if Africa had had East Asia’s growth rate in
electricity generation and in telephones per capita (Esfahani
and Ramirez 2003), or alternatively, if it had had the
infrastructure stock of South Korea (Calderon and Serven
2004).13
These quantitative results are confirmed by surveys collected
by the World Bank as part of its worldwide Investment
Climate Assessments. The questionnaire asks entrepreneurs
for their assessment of the constraints on operation in their
business. In all the cases available but two (South Africa
and Mauritius), electricity is in the top 10 among 19 possible
constraints. In fact, 40% of the firms surveyed list electricity
as a major or very severe obstacle for the operation and
growth of their business.14 The constraint on the African
economy is in fact much more severe than these statistics
suggest, for two reasons. First, the problem is so bad that
40% of the firms surveyed own or share a generator. Once
they are self-sufficient, firms tend to focus on other problems
than electricity. In Kenya, for instance, 71% of the firms
surveyed own or share a generator. Electricity thus ranks 9th
(one of the “best” scores in the sample) among the 19
possible constraints. Second, the number of firms surveyed
in each African country is fairly small (266 on average). The
selection, which is based on tax records, targets firms from
big cities and from the formal sector. Informal businesses and
rural areas, which are the core of the Sub-Saharan economy,
are not in the surveys. Since they cannot afford to own a
© AFD Working Paper No. 38 • Public Private Partnerships in Water and Electricity in Africa 8
2. Electricity and Water in Africa
11. On a sample of 48 African countries, Estache and Goicoechea (2005) find the average access rate to be as low as 15% of the total population, as against 31% in otherlow-income countries.
12. In fact, energy was the leading driver of growth in fast-growing countries such as Brazil, Turkey and Korea (IEA 2004). For similar results on the US economy, see thestudy of the historical growth path since 1900 by Ayres, Ayres and Warr (2003).
13. Specific quantitative analyses on Africa are rare. Estache, Speciale and Veredas (2005) show that over the last 30 years, infrastructure investment accelerated the annualgrowth convergence rate by over 13% in the region.
14. African countries covered by the surveys are Benin, Eritrea, Ethiopia, Kenya, Madagascar, Malawi, Mali, Mauritius, Senegal, South Africa, Tanzania, Uganda, and Zambia.On average, it takes 52.6 days to obtain an electrical connection; there are 50.5 days of electrical outages per year, generating losses evaluated at 9% of sales. Seehttp://www.enterprisesurveys.org/icas.aspx.
generator, they bear the full cost of the lack of power. Lastly,
the study ignores domestic consumers, who also suffer from
the lack of electricity. Children in rural Africa walk hours to
fetch wood and water. For instance, a study conducted in
2002-2003 in rural Guinea reveals that children aged 6 to 14
spend 4 hours per week on average collecting wood and
water (Bardasi and Wodon 2006).15 As pointed out by Estache
and Wodon (2006), electricity has also an impact on health
because it allows refrigeration. This is especially important
for preservation of medicine and vaccines in clinics.
The total cumulative investment required between 2003 and
2015 to achieve the MDGs in Sub-Saharan Africa is
estimated by IEA (2004) at US$46 billion. This implies annual
investment of US$3.9 billion in constant dollars. Fay and
Yepes (2003) estimate the annual investment needs between
2005 and 2010 at US$3.3 billion for electricity generation and
US$2.9 billion for maintenance, which represent 0.7% and
0.63% of GDP respectively. This is less than the estimation
by Estache and Yepes (2005), who put the total annual
investment required to meet the MDGs between 2005 and
2015 at 1.9% of GDP (1.2% in investment and 0.7% in
operation and maintenance). The discrepancy in the
estimates is not surprising. It is hard to assess how much is
needed when nobody knows how much is actually in stock
or how much is invested. There are no reliable data on the
level of expenditure in the sector. The total annual level of
infrastructure expenditure in the region is estimated to lie
between 2% and 4% of GDP.
Whatever the actual annual levels of spending in electricity,
they are very unlikely to amount to the required 1.5-2% of
GDP. The little evidence we have suggests that they are low.
After a phase in the 1960s and 1970s when major investment
projects in generation and transmission were conducted,
investment in electricity came to a halt in the 1980s and
1990s. There are presumably several reasons for this. First,
some of these projects were oversized, and have been
suspected to be badly corrupt.16 National and international
organizations have been discouraged from investing in large
infrastructure projects by the fear of financing “white
elephants”. Second, international donors and creditors, like
the World Bank and the IMF, imposed structural adjustment
programs as a condition for economic assistance in the
context of the explosive debt crisis of the 1980s. The reforms
were clearly intended to relax governments’ budget
constraint. Governments had to cut their spending in order
to get aid. The budgetary adjustments seem to have been
absorbed by the infrastructure industry. This is at least what
is suggested by Estache and Wodon’s (2006) study of a
sample of 11 African countries for which data are available
since the mid-1980s. The study shows that over the last 20
years government expenditures on infrastructure declined
from 4.2% to 1.6% of GDP.17 According to the authors, the
adjustment would have been even more dramatic if the
current situation were benchmarked against the 1970s.
Finally, since the Asian financial crisis of 1997, private
investors, major commercial banks and international
organizations have retreated from the sector. In fiscal year
1998, for instance, 15% of total World Bank loans were
allocated to electricity projects. One year later this figure
had dropped to 1.5% (from US$3.2 billion to US$440 million).
This withdrawal has been amplified by the weakening of the
global infrastructure industry. Between June 2000 and
October 2002, the stock prices of energy companies dropped
by 88%. This crash was triggered by the Enron scandal in
2. Electricity and Water in Africa
© AFD Working Paper No. 38 • Public Private Partnerships in Water and Electricity in Africa 9
15. Girls spend more time collecting water and boys spend more time collecting wood.
16. For instance, in 1973 Cote d'Ivoire commissioned a 176-megawatt hydroelectric facility on the Bandama River at Kossou. Its construction cost billions of CFA francs,as did the relocation of 85,000 Baoulé farmers. Lake Kossou was expected to cover a surface area three times the size of Lake Geneva and to double the country'selectrical generation capacity. Yet poor rainfall during the mid-1970s prevented Lake Kossou from filling to its maximum capacity. Other serious droughts in 1983 and1984 nearly dried it up. Turbines were shut down, and the country was obliged to rely once again on thermal power, which is much more expensive. Similarly, KenyanPresident Daniel Arap Moi decided to build a huge dam on Turkwel River after his visit to François Mitterrand in Paris in 1981. Engineering studies were conducted bySogreah and financed by French government. The project was estimated to cost FF 1 billion, but the contract signed with Spie-Batignolles, without any public tendering,was priced at FF1.8 billion. Rumors of corruption spread concerning Moi's French advisor Nicholas Biwott, especially when Foreign Affairs Minister Robert Ouko wasmurdered in 1990 after he launched an anti-corruption campaign (see http://www.politique-africaine.com/numeros/pdf/040130.pdf). In addition, deforestation causedsiltation on the surface of the dam, which reduced electricity generation capacity and therefore the whole benefit of the project. More recently, Société Tchadienne d’Eauet d’Electricité signed in 2000 a management contract with Vivendi that came to an abrupt end in 2004 after four years of dubious practices by many actors, fundswasted by donors and rumors of corruption about the Sedigui oil project.
17. By contrast, government expenditures on health increased (from 1.6% to 2% of GDP) and education expenditures remained stable (above 4.5% of GDP).
the United States, which was followed by other scandals.
Major international companies such as Enron and AES have
therefore disappeared from developing country markets. A
2002 World Bank survey revealed that of the 50 private
power firms surveyed, 52% were retreating from developing
countries and only three continue to be interested (Lamech
and Saeed 2003). The 50 firms were unanimous that PPPs
were not important for them.
The investment trend has to be inverted, especially in
generation and transmission. Improving the situation of the
electricity sector should be a top priority of African
governments and international agencies in the years to
come.
2.2 Water
The situation in the water sector is better in both absolute and
relative terms. Access to improved water sources, which is
defined as the availability of at least 20 liters per person per
day from an improved source within 1 kilometer of the user's
dwelling, is estimated to be around 56% in Sub-Saharan
Africa.18 This level is reasonably good. First, it is roughly the
same as that of its peers among the poor countries of South
Asia. Second, when the situation in 2004 is compared with
that in 1990, the percentage of the urban population having
access to improved water sources has been stable at around
80%, while in rural areas the percentage increased from
36% to 42%. Since the population has grown during the
period, these results are encouraging. Indeed, they are
excellent by comparison with the access rate in the 1980s,
when it was estimated that only one person in five had
access to clean water. Finally, 56% is likely to be an under-
estimate of the number of people who really have access to
clean water because the WHO/UNICEF definition excludes
vendor provided water, bottled water, and tanker truck water.
Yet many people rely on vendors because they distribute
water from improved water sources directly to their door.
Vendors are providing a carrying service. Unless the tank
used for transportation is contaminated, the water delivered
is fairly safe. If carried water is added to the other sources,
the share of the population having access to an improved
water source is likely to be above 60%. This relatively good
result reflects the fact that water services can be delivered
at fairly small scale by informal firms. It is also the
consequence of concerted international action, notably under
the impetus of the International Drinking Water Decade
(1981-1990). The launch of the second International Water
Decade (2005-2015) should bring new improvements in
access to clean water and sanitation around the world.
Requirements are still large. In Sub-Saharan Africa, only
16% of households are connected to a piped water network.
This implies that 84% of Africans rely on self-collection or on
small-scale providers for their water supply. In sanitation
the situation is even worse. The WHO/UNICEF monitoring
program estimated in 2004 that around 37% of Sub-Saharan
Africans had access to sanitation. Only 8% of homes were
connected to a sanitation network.19 The total annual
investment required in water and sanitation between 2005
and 2015 to meet the MDGs is estimated by Estache and
Yepes (2005) at 1.8% of GDP (1% in investment plus 0.8%
in operation and maintenance). Here again there are no
reliable data on the actual level of expenditures in the sector.
Yet the sum of expenditure required for water and electricity
alone is higher than the total annual level of infrastructure
expenditure in the region. The question of how utilities service
should be financed is not settled. We explore some aspects
of this issue below.
2. Electricity and Water in Africa
© AFD Working Paper No. 38 • Public Private Partnerships in Water and Electricity in Africa 10
18. The term “improved water source” refers to a source that is likely to provide "safe" drinking water, such as a household connection, borehole, public standpipe, protecteddug well, protected spring, rainwater collection. It does not include water from an unprotected well or unprotected spring, vendor provided water, bottled water, or tankertruck water. For more information on water supply and sanitation, see the joint WHO/UNICEF monitoring program at http://www.wssinfo.org/en/welcome.html. The 56%figure is available at http://www.wssinfo.org/en/233_wat_africaS.html.
19. See http://www.wssinfo.org/en/333_san_africaS.html.
3.1 Productive Efficiency
The transfer from public to private ownership has generally
been grounded in the poor economic performance of public
enterprises. A critical problem induced by public ownership,
first identified by Kornai (1980), is the lack of any commitment
on the part of the government not to bail out or subsidize
money-losing firms. This commitment problem is referred to
in the literature on the subject as the soft budget constraint
(interesting surveys are available in Kornai 2000 and in Kornai,
Maskin and Roland 2002). Kornai (2001) provides evidence
of the use of soft budget constraints by state-owned
enterprises (SOEs) in developing countries. Since less
efficient firms have been allowed to rely on the government
for funding, they lack the financial discipline required for
efficient management (Dewatripont and Maskin 1995 and
Schmidt 1996). In Dewatripont and Maskin (1995) and Maskin
(1999), the soft budget constraint is caused by the
incompleteness of contracts between governments and
firms. In these two papers, soft budget constraints affect the
level of un-contractible investments made in firms by
managers. By hardening firms' budget constraint,
privatization helps to restore appropriate investment
incentives and improves productive efficiency. Another part
of the theoretical literature stresses that public ownership is
associated with a lack of economic orientation in
governments' objectives. For instance, in Kornai and Weibull
(1983), Shleifer and Vishny (1996), Debande and Friebel
(2003), governments are described as adopting
“paternalistic” or political behavior as they seek to protect
or increase employment; in Shapiro and Willig (1990),
governments are simply malevolent. The main conclusion of
this theoretical literature is that privatization improves the
internal efficiency of firms.
Empirical evidence supports this result. Megginston and
Netter (2001) offer an extensive review of the literature on the
subject, covering 61 empirical studies at company level
(both within and across countries). They conclude that
privately managed firms tend to be more productive and
profitable than public firms in both developed and developing
countries. This does not mean that privatization always
improves firms’ performance. In three studies, looking at
204 privatizations in 41 countries, one-fifth to one-third of
privatized firms have registered very slight to no
improvement, and even, occasionally, worsening situations
(Megginson and Netter 2001). In all other cases reviewed,
privatization tends to improve firms’ performance.
In developing countries, the gains from private sector
involvement stem from better asset management and bill
collection. This is, at least, what is reported by Manibog et
al. (2003) in their review of the World Bank experience with
private participation in the power sector. Over a five-year
period, average plant availability in their sample increased
10% to 40%, outage indicators decreased by more than
half, and the number of customers per employee increased
50%. Where private operators have taken over retail supply,
they have drastically reduced payment delays, theft, and
unpaid bills. For instance, unpaid bills were reduced from
30% to 12% for Compagnie Ivoirienne d’Electricité.20 Similar
results have been obtained in Latin America. For instance,
© AFD Working Paper No. 38 • Public Private Partnerships in Water and Electricity in Africa 11
3. Public Private Partnerships and Consumer Surplus
20. See Manibog et al. (2003). It had already dropped from 28% in 1990, the year of privatization, to 19.8% in 1992 (Deniau 1993). In this example, assets were not soldbut just leased.
Andres, Foster and Guasch (2006), who studied the impact
of privatization of electricity distribution in 116 cases in ten
Latin American countries, show that privatization brings
improvements in labor productivity, efficiency and
product/service quality. These improvements in performance,
which occurred in most cases in the transition period
between public and private ownership, have been achieved
through a substantial reduction in employment (by more
than 40%). In water, results are somewhat comparable. For
instance, a management contract between Suez and
Johannesburg Water in 2001 for the suburb of Soweto in
South Africa brought a dramatic decrease in leakages and
unaccounted-for-water losses.21 In Senegal, a ten-year
affermage contract signed with Saur in 1996 allowed the
water sector to reach positive financial results from 1999.
Water production increased by 20% between 1997 and
2002, the number of customers increased by 50% between
1996 and 2003, and the network commercial rate (water
paid for over water produced) improved from 68% in 1996
to 80% in 2006.22
3.2 Allocative Efficiency
It is indisputable that privatization tends to improve firms’
asset management and commercial performance. In contrast,
the assumption made by advocates of privatization, namely
that efficiency gains are automatically transmitted to
consumers, merits further discussion. The benefits of private
involvement are real, but without major innovation they are
not huge. For instance, Newbery and Pollitt (1997) estimate
the welfare consequences of the privatization of the UK
electricity sector. They conclude that there were permanent
gains equal to 5% of previous total generation costs, but at
least in the first few years following privatization the new
private shareholders reaped most of the gains, and both
government/taxpayers and consumers lost out.23 Firms try to
keep whatever cost reductions they generate for themselves.
To understand this result, let us assume for a moment that
the government’s objective is to maximize the trade surplus.
In a perfectly competitive market where price equates to
marginal cost, it is true that consumers benefit from the
efficiency gain generated by privatization. In industries
characterized by increasing returns to scale, however, moving
from public to private ownership does not offer a solution to
the lack of competitive pressure. In the absence of
government intervention, the number of firms that survive in
equilibrium is small. Their rent-seeking behavior leads to
high prices and allocative inefficiency. Such market
imperfections hurt consumers. Empirical studies thus reveal
that privatization results in lower prices and higher output in
competitive industries, but not in oligopolistic ones (see
Nellis 1999). According to Birdsall and Nellis (2002), “Steep
price increases following privatization have been quite
common in divested network or infrastructure industries,
e.g. electricity and water and sewerage, and common but not
universal in telecommunications.” Prices are often increased
before privatization in order to reduce the SOEs’ financing
gaps and attract buyers. This, for instance, was the case with
electricity tariffs in Zimbabwe, Kenya and Senegal. In Senegal
the government increased tariffs by 10% after reaching an
agreement with Vivendi (see OECD-AfDB 2003). An
unaccounted-for part of the price increases stemmed from
the termination of illegal connections (Birdsall and Nellis
2002, Estache et al. 2002, OECD-AfDB 2003). Similarly, a
recent study on the impact of privatization of electricity
distribution in Latin America shows that privatization
produced no changes in coverage and output once the
authors controlled for firm-specific time trends. Although
prices were hard to compare across companies, the results
also suggest a rise in prices (Andres, Foster and Guasch
2006). Finally, a review of the World Bank Group’s experience
with private participation in the electricity sector shows that
3. Public Private Partnerships and Consumer Surplus
© AFD Working Paper No. 38 • Public Private Partnerships in Water and Electricity in Africa 12
21. A big operation against unaccounted-for-water losses (7 million cubic meters per month) was launched in 2003. First, networks 100 years or more old were rehabilitated;second, pre-paid meters were introduced and big communication campaigns were launched to educate people about the value of water. Over a four-month period, averagehousehold consumption dropped from 55 m3 to 11 m3 per month. Despite this good result, the municipal authorities chose in 2006 not to renew the five-yearmanagement contract with Ondeo (Blanc and Ghesquières 2006b).
22. More than 1 million people have been connected (see Carcas 2005).
23. Apparently the government underpriced the shares in order to ensure political success.The outcry in Britain concerning the windfall gains to shareholders in this privatizationhelped Tony Blair’s Labour Party regain power. It also led to the imposition of a special tax on shareholder profits (see Birdsall and Nellis 2002).
tariffs have decreased for industry and commerce but have
risen for other customers (Manibog et al. 2003). Experiences
in the water sector show similar results. The improvements
brought by the management contract for water provision in
Johannesburg included a much higher rate of payment
collection with the introduction of pre-paid water meters.
Prices had been increased before private participation (since
1994) to finance massive investment, but in 2000 the South
African authorities decided to provide 6 m3 of water per
household free of charge in the whole country as a safety net
for the poorest. This social pricing policy was supposed to
compensate for severe disconnection measures for those
who do not pay their bills (for consumption above 6 m3).24 In
Senegal, the water sector reached the financial break-even
point through price increases of 3% per year between 1996
and 2002,25 although social block tariffs have been introduced
for small consumers.
Contrary to mobile telecommunications technology, the
power and piped water industries still involve fixed
connections between suppliers and customers. Since it is
inefficient to duplicate transmission facilities, network
industries are referred to as natural monopolies. Water
networks tend to constitute local natural monopolies because
each city constitutes a distinct market. At the national level
there are usually a multitude of local monopolies with various
types of contract and status. At the international level,
however, the water industry is highly concentrated and there
are only four major companies operating in Sub-Saharan
Africa.26 Electricity networks tend to constitute national
monopolies because they are more efficient when operated
at larger scale. Thus, only a small number of firms can survive
in laissez-faire equilibrium. In the European electricity market,
for example, economic liberalization has generated a wave
of mergers and acquisitions leading to higher market
concentration at both national and EU levels (Newbery 2002).
More than two-thirds of the European market is now in the
hands of eight large companies (Jamasb and Pollitt 2005).27
Another feature specific to electrical networks is the strong
interdependency of its parts. The interconnection of networks
yields economies of scale, but it also complicates operations.
It ties producers into a system where each individual action
has repercussions for every other member of the network.
This physical unity is creating major problems in the
implementation of liberalization reforms. For instance, the
failure of a single line, the Lukmanier line in Switzerland,
deprived nearly 56 million people in Italy of power on
September 28, 2003. This incident was preceded by the
blackouts in Sweden and Denmark on September 23, 2003,
and in the north-eastern United States and Ontario, Canada,
on August 14, 2003. In the US case, it was clearly established
that firms’ behavior was at the origin of the problem. As
predicted by theory, deregulation and competition in power
generation led some firms to adopt a free-riding strategy in
their management of reactive power, which in turn led to
the blackout.28
In many non-OECD countries, these problems have
discouraged governments from deregulating and liberalizing
their domestic electricity markets. In a survey of 52
developing countries conducted by the World Bank in 2001,
31% of them had privatized their state-owned power
facilities. This leaves roughly 70% of the sample under public
ownership. It is worth noting that public ownership of the
incumbent power firm does not preclude PPPs: 67% of the
countries reviewed had established independent power
providers (World Bank 2004). Similarly, a recent study on
West Africa shows that six of the nine main power companies
are fully public, while the other three have some private
participation.29 Finally, in light of the technical constraints
imposed by management of a power grid, it seems natural
that all African countries maintain a monopoly in transmission
and distribution.
3. Public Private Partnerships and Consumer Surplus
© AFD Working Paper No. 38 • Public Private Partnerships in Water and Electricity in Africa 13
24. Blanc and Ghesquières (2006b).
25. The government has been criticized by financial institutions for having frozen prices since 2002.
26. The four major companies operating in Africa are Thames Water, Vivendi, Ondeo, and Saur. At the worldwide level there are two more: Anglia Water and Yorkshire Water.
27. According to the European Commission (2005), among the EU-15, concentration in generation and in retailing for the largest three firms is above 60% in 10 and 12markets, respectively. The Europe-wide four-firm concentration ratio is 50%.
28. On the impact of deregulation on service quality in network industries, see Auriol (1998).
29. Muller (2003).
Since water and electricity networks are industries with
increasing returns to scale, according to traditional regulation
literature, a legal monopoly should be set to prevent wasteful
duplication of investment. Moreover, the legal monopoly
should be regulated to avoid the deadweight loss created by
monopoly pricing. Under the complete contract approach
adopted in the regulation literature (see Laffont and Tirole
1993), there is no difference between public and private
ownership under regulated entry conditions and pricing.
This result is important because it shows that ownership is
not the key to the allocative efficiency problem; in industries
with increasing returns to scale, regulation is the key.
Empirical evidence supports this result. Using panel data for
51 developing countries over the 1985-2000 period, Zhang
et al. (2002) study the effects of privatization, competition and
regulation on the performance of electricity generation
industry. They conclude that “the effect of privatization and
having an independent regulator, separately, is statistically
insignificant…; while the co-existence of these two reforms
does seem to be correlated with greater electricity availability,
more generation capacity and higher labour productivity.”
Similarly, the experience in industrialized countries shows that
regulation, especially regulation of the pricing of access to
bottleneck facilities, such as transportation and distribution
networks, is a key component of successful liberalization
reforms. The result is worrying because governments in
developing countries have not been very successful in
establishing regulatory institutions. They usually lack the
human resources, experience and credibility needed to
control large corporations.30 This problem is compounded by
the fact that, in practice, governments in developing countries
are not focused on consumer surplus.
3. Public Private Partnerships and Consumer Surplus
© AFD Working Paper No. 38 • Public Private Partnerships in Water and Electricity in Africa 14
30. For instance in Latin America, the concessions that were granted to private operators following the divestiture of public firms were renegotiated after an average ofonly 2.1 years (see Laffont 2001 and Guash, Laffont and Straub 2002).
4.1 Opportunity Cost of Public Funds
Governments pursue multiple objectives, such as the
production of public goods, the regulation of non-competitive
industries and the control of externalities, under a single
budget constraint. Since the latter is usually binding, the
opportunity cost of public funds (i.e., the Lagrange multiplier
associated with the constraint) is strictly positive. Concretely,
increasing investment in infrastructure such as electricity or
water networks means decreasing the production of essential
public goods such as national security, law enforcement, or
commodities that generate externalities such as health care
and education, or alternatively, increasing the level of taxes
or debt. All of these actions have a social cost, which must
be traded off against the social benefit. Symmetrically, when
the government is able to tax an industry it can increase its
investment in education, health care or other areas. The
social benefit generated by this investment must be
compared with the reduction in consumer surplus generated
by taxes. Contrary to the price mechanism, government
intervention is not, and cannot be, anonymous; it depends
on the opportunity cost of public funds.
The opportunity cost of public funds, defined as the Lagrange
multiplier of the government budget constraint, is higher
when, all other things being equal, government revenue is
lower.31 Tax revenue as a proportion of GDP is typically much
lower in developing countries than in rich countries. The tax
revenue-GDP ratio for 1995, for example, was 36.1% for
OECD countries (see official statistics on the OECD website)
versus 18.2% for developing countries (based on a sample;
Tanzi and Zee 2001). The difference in taxation level reflects
the fact that taxation is a non-convex activity (see Warlters
and Auriol 2005). Drawing the first euro of tax revenue
involves sunk costs. For instance, transforming the informal
sector into a formal one requires investment in education, so
that all firms’ managers are able to keep records. The
government must also provide incentives for firms to register
officially, train inspectors to control corporate activities, and
so on. Developing countries are too poor to invest heavily in
education, or even in their tax administrations. They cannot
match OECD countries’ direct taxation level. Other sources
of public funds are crucial to them. This includes revenue
from public firms. Symmetrically, subsidizing public utilities
services is very costly. It must be justified by a high social
return of the subsidy. The opportunity cost of public funds
� is thus positive. Each dollar that is transferred to the
regulated firm costs 1+ � dollars to society.
Auriol and Picard (2002) study the impact of poor public
budgetary conditions on privatization decisions concerning
infrastructure and public utilities. The approach is normative
and seeks to derive optimal policies. The paper offers a
theoretical analysis of the relationship between a country’s
financial constraints and its optimal industrial policy. The
opportunity cost of public funds summarizes the tightness
of government budget constraints, with larger costs
stemming from tighter constraints. Government assumes
responsibility for a public firm's profit. It subsidizes the firm
in case of loss and taxes it in case of profit. In contrast,
managers and/or owners of privatized firms assume
responsibility for the firms' cash flow. One benefit of
© AFD Working Paper No. 38 • Public Private Partnerships in Water and Electricity in Africa 15
4. PPPs and Macro-fiscal Balancing (Auriol and Picard (2002))
31. The opportunity cost of public funds is different from the marginal cost of public funds (i.e., the deadweight loss created by increasing marginally a specific tax). Themarginal cost of public funds is a general equilibrium concept. It is relevant in the long run because it indicates the social cost (or benefit) of tax reform (for more onthe marginal cost of public funds in developing countries, see Warlters and Auriol 2005). In the short run, however, the taxation level is more or less fixed. The Lagrangemultiplier of the government budget constraint, referred to as the opportunity cost of public funds, is then the relevant parameter for cost-benefit analysis.
privatization is that it reduces government subsidies to
money-losing firms.32 However, privatization has a price. On
the one hand, the government is not able to take advantage
of positive cash flows in profitable firms. On the other, it
abandons direct control of the firm's operations, especially
prices, which has a cost to consumers. As explained earlier,
empirical evidence shows that the output prices of natural
monopolies increased as a result of privatization. Privatization
in developing countries is thus treated in the model as the
transition from public ownership with regulation of entry and
prices to private ownership with price liberalization. One
question addressed in the paper is whether the elimination
of subsidies to unprofitable firms and the cash flow generated
by the sale can compensate for the price distortion
associated with privatization and the loss of revenue from
profitable public firms. The answer is in the affirmative. When
public finance matters, privatization without price control
can be superior to benevolent regulation. To illustrate this
important result, we present a simplified version of Auriol and
Picard (2002). Although the latter considers both monopoly
and duopoly structures, we focus here on the monopoly
case. It is technically simpler and more realistic in the case
of Sub-Saharan Africa.
Sub-Saharan Africa has the lowest electricity and water
demand per capita in the world. Both the water and power
industries are operating below efficient scale. For instance,
Tovar and Trujillo (2005) study electricity generation between
1998 and 2001 in 13 countries (mostly East African). They
show that inefficiencies of scale are of the order of 24%. This
result militates in favor of more concentration in the electricity
industry, and against reforms aimed at unbundling existing
African utilities.33 In practice, unbundling has been tried only
in Uganda and Kenya, without success.34 Similarly, water
utilities are operating below efficient scale. Estache and
Kouassi (2002) study 21 African utilities over the 1995-1997
period. They found that the average efficiency level, which
is correlated with the size of the utility, is 54%. Lastly, Tynan
and Kingdom (2005) study 270 water and sanitation providers
worldwide, including 83 African ones. In the African cases
they found very significant scale efficiency effects. Doubling
the population served increases operation and maintenance
costs by only 61%. These results militate in favor of more
concentration and integration. Water utilities have to expand
their services by connecting more households and firms in
areas where they are already operating. Electricity utilities
need to grow and to absorb private sub-networks, when
these exist. This integration strategy will increase their
productivity and decrease their costs.
4.2 The Model
On the production side, the cost function includes a sunk
cost K>0. This cost is so large that the market has a natural
monopoly structure. The firm must make the investment K
before discovering its idiosyncratic marginal cost c. The
fixed cost K>0 is common knowledge; the marginal cost c
is private information of the firm’s manager. The government,
which does not observe c, has an a priori assumption
concerning the parameter: it is assumed to be independently
drawn from the support according to a uniform
distribution. With a production level of Q, the firm has the
following cost function: C(Q)=K+cQ. It maximizes the profit:
�(Q)=P(Q)Q-cQ-K+t, where P(Q)Q is the sales amount and
t is the net transfer that it gets from the government (subsidy
minus tax).
On the consumer side, demand is linear. The inverse demand
for Q>0 units of the commodity is given by: P(Q)=a-bQ,
where a>0 and b>0 are common knowledge. The gross
consumer surplus, defined as the integral of the inverse
demand function, is therefore S(Q) =aQ-0.5bQ2. The
government is utilitarian. It maximizes the sum of consumer
and producer surpluses minus the social cost of transferring
4. PPPs and Macro-fiscal Balancing (Auriol and Picard (2002))
© AFD Working Paper No. 38 • Public Private Partnerships in Water and Electricity in Africa 16
32. For instance, the privatization commission of Burkina Faso reported that government subsidies to SOEs dropped from 1.42% of GDP in 1991 to 0.08% of GDP in 1999as a result of privatization (OECD-BAD 2003).
33. World Bank reforms to unbundle existing public electric utilities in Europe and Central Asia, which share many features with African utilities, have been very unsuccessful.Reconcentration into larger entities has been necessary in several cases (Manibog et al. 2003).
34. In Kenya, electricity production and distribution were separated by the Electricity Act in 1997. Since the performance of Kenya Power and Lighting Company (KPLC),which is in charge of power distribution, has been very poor, notably in access rates (only 15% of the population) and financial performance, the Energy SectorRecovery Project in Kenya (2004) is focused on pragmatic objectives (commercial support, management contract signed with KPLC). It is no longer contemplating introducingcompetition in the distribution sector.
public funds to the firm. The transfer to the firm can be either
positive (i.e., a subsidy) or negative (i.e., a tax). Government's
objective function is: W=S(Q)-cQ-K-�t, where � is the
opportunity cost of public funds. Under public ownership the
government's control rights on prices and quantities are
associated with accountability for profits and losses. That is,
it must subsidize the firm in case of losses, whereas it taxes
the firm in case of profits. In contrast, under private ownership
the government imposes no control on prices and quantities,
and it takes no responsibility for the firm's profits or losses.
In other words, transfers are ruled out between the
government and the private firm: tPM=0.35
Under private ownership, denoted PM, the firm pays the
sunk cost K, and chooses the laissez-faire monopoly quantity;
QPM = (a-c)/(2b). Under public ownership, the government
pays the sunk cost K, and chooses the regulated monopoly
quantity, denoted RM, which under the situation of
asymmetric information is: QRM = (1+�)/(1+2�) (a-cv)/b, where
cv = c(1+2�)/(1+�), is the total marginal cost of service
provision, that is, it includes the cost of production, c, plus
the cost of information revelation, c�/(1+�). It is
straightforward to check that when �=0, QRM =Q*, which is
the first-best quantity obtained when price PRM equates to
marginal cost c. Symmetrically, when � approaches infinity
the regulator chooses the quantity and price of the monopoly,
evaluated at the virtual cost lim���Cv=2c, so that QRM =QM(2c)
and PRM=PPM(2c)>PPM(c). Let E denote the expectations
operator. One can check that the ex ante welfare level under
private ownership is EWPM =3/2V-K where V=E(a-c)2/(4b) is
the expected gross profit of the monopoly (i.e., the ex ante
firm profit level is E�=V-K). Similarly, the ex ante welfare
level under public ownership is EWRM(�)=
(1+�){(2+2�)/(1+2�)VRM(�)-K}, where VRM(�)=E(a-cv)2/(4b) is V
evaluated at cv instead of c. The optimal choice between
public and private ownership is obtained by comparing the
two welfare functions. The optimal industrial policy
corresponds to privatization if and only if EWPM > EWRM(�).
Figure 1 summarizes Auriol and Picard’s (2002) results for the
monopoly case. On the horizontal axis is the opportunity
cost of public funds. For � close to 0, the government does
not care about transferring funds to the firm. It focuses on
the net consumer surplus (i.e., for �=0 the government’s
objective function is W=S(Q)-cQ-K). Where � is large, the
government gives more weight to transfers and less to
consumer surplus. On the vertical axis is the sunk cost K. The
curve KRM represents the limit values of K above which the
regulated monopoly is no longer valuable (i.e., such that
EWRM<0). The curve KRM/PM represents the limit values of K
under which the regulated monopoly is preferred to the
private monopoly (i.e., such that EWPM < EWRM). In the
hatched area denoted PM, the private unregulated monopoly
is the optimal industrial policy; in the white area denoted
RM, the optimal policy is the public regulated monopoly.
Figure 1 shows that the privatization of natural monopolies
with price liberalization is superior to benevolent regulation
under public ownership for intermediate values of � (i.e.,
for � > �, KRM (�) > KRM/PM (�)). The relevance of the privatization
result depends on the meaning of an “intermediate” value.
If it is very high, in practice privatization is never optimal.
Auriol and Picard (2002) rely on simulations to compute the
threshold value. Depending on the technological uncertainty
(i.e., the marginal cost distribution), it lies in the interval [0.35,
1.14]. In developed economies, � is mainly equal to the
deadweight loss accrued to imperfect income taxation. It is
assessed to be around 0.3 (Snower and Warren, 1996). In
developing countries, low income levels and difficulties in
implementing effective taxation programs are strong
constraints on the government's budget, which leads to
higher values of �. As a benchmark case, the World Bank
(1998) suggests an opportunity cost of 0.9. The value is
much higher in countries that are heavily indebted or close
to financial bankruptcy. This suggests that the right side of
� corresponds to the range of opportunity costs prevailing
in developing countries. In other words, advanced economies
tend to be on the left side of � in Figure 1, and developing
economies on the right side. Under the assumptions
underlying the theoretical analysis, optimal industrial policies
for rich countries are different from those for poor countries.
4. PPPs and Macro-fiscal Balancing (Auriol and Picard (2002))
© AFD Working Paper No. 38 • Public Private Partnerships in Water and Electricity in Africa 17
35. This assumption is an artifact of the model. Private firms do not pay tax on profit, but in Auriol and Picard (2002) they might pay an entry fee. In a static context thesetwo forms of taxation are equivalent. For the sake of simplicity we have dropped it here.
^
^
^
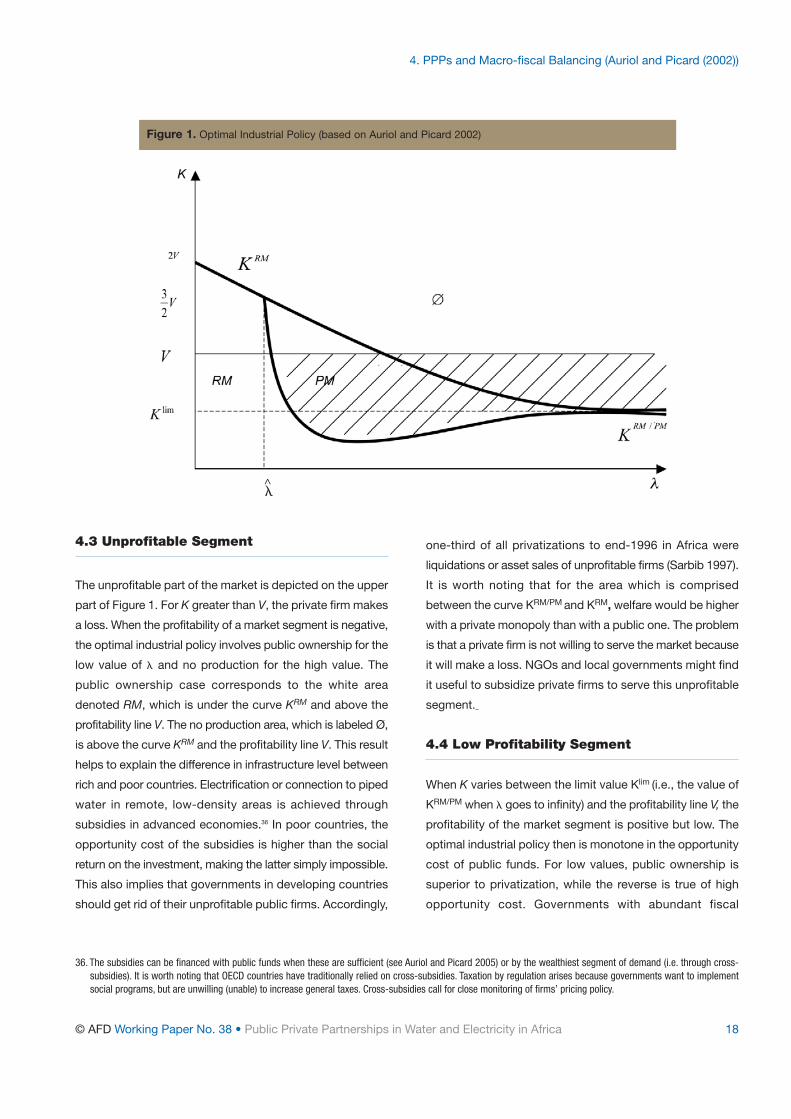
4.3 Unprofitable Segment
The unprofitable part of the market is depicted on the upper
part of Figure 1. For K greater than V, the private firm makes
a loss. When the profitability of a market segment is negative,
the optimal industrial policy involves public ownership for the
low value of � and no production for the high value. The
public ownership case corresponds to the white area
denoted RM, which is under the curve KRM and above the
profitability line V. The no production area, which is labeled Ø,
is above the curve KRM and the profitability line V. This result
helps to explain the difference in infrastructure level between
rich and poor countries. Electrification or connection to piped
water in remote, low-density areas is achieved through
subsidies in advanced economies.36 In poor countries, the
opportunity cost of the subsidies is higher than the social
return on the investment, making the latter simply impossible.
This also implies that governments in developing countries
should get rid of their unprofitable public firms. Accordingly,
one-third of all privatizations to end-1996 in Africa were
liquidations or asset sales of unprofitable firms (Sarbib 1997).
It is worth noting that for the area which is comprised
between the curve KRM/PM and KRM, welfare would be higher
with a private monopoly than with a public one. The problem
is that a private firm is not willing to serve the market because
it will make a loss. NGOs and local governments might find
it useful to subsidize private firms to serve this unprofitable
segment.
4.4 Low Profitability Segment
When K varies between the limit value Klim (i.e., the value of
KRM/PM when � goes to infinity) and the profitability line V, the
profitability of the market segment is positive but low. The
optimal industrial policy then is monotone in the opportunity
cost of public funds. For low values, public ownership is
superior to privatization, while the reverse is true of high
opportunity cost. Governments with abundant fiscal
4. PPPs and Macro-fiscal Balancing (Auriol and Picard (2002))
© AFD Working Paper No. 38 • Public Private Partnerships in Water and Electricity in Africa 18
Figure 1. Optimal Industrial Policy (based on Auriol and Picard 2002)
36. The subsidies can be financed with public funds when these are sufficient (see Auriol and Picard 2005) or by the wealthiest segment of demand (i.e. through cross-subsidies). It is worth noting that OECD countries have traditionally relied on cross-subsidies. Taxation by regulation arises because governments want to implementsocial programs, but are unwilling (unable) to increase general taxes. Cross-subsidies call for close monitoring of firms’ pricing policy.
�^
resources subsidize the investment and let consumers use
it at marginal cost. This policy maximizes the consumer
surplus, which in the case of low opportunity cost of public
funds is equal to utilitarian social welfare. On the other hand,
when the opportunity cost of public funds is high, the
government objective function is tilted toward transfers.
Subsidizing infrastructure, which has a low social return, is
simply too costly. Privatization is then an appealing alternative
to public provision. Consider the limit case where the
government cannot finance infrastructure such as a small
water network or generation facility. If a private firm is eager
to do it in exchange for the freedom to charge monopoly
prices, it is optimal to let the firm do so. Indeed, it is better
to have privately owned and operated infrastructure, even
with the monopoly distortion, than no infrastructure at all. This
result still holds true when the government is able to finance
the infrastructure.
Since the opportunity cost of public funds is high in
developing countries, the latter implement industrial policies
that differ strongly from those favored in developed
economies. There is a public good aspect and externalities
associated with sunk-cost investment such as
infrastructure. As recommended by standard economic
theory, wealthy nations subsidize the construction of most
infrastructure and let people use it at marginal cost. With
low opportunity cost of public funds, this policy maximizes
welfare. In contrast, countries plagued by financial problems
cannot follow this strategy. Private provision of utilities
services is hence fairly common in developing countries.
PPPs between governments and international firms have
attracted a great deal of attention. In Sub-Saharan Africa,
the preferred arrangements for formal private participation
in the water industry have been concession and lease
contracts (PPPs with risk sharing for rehabilitation and
extension of existing infrastructure). In the electricity sector,
Estache and Wodon (2006) report that over the 1990-2003
period greenfield contracts (BOT) were the most popular
type of PPPs. However, formal contracts are only the tip of
the iceberg.
There are thousands of small-scale providers of water and
electricity services operating informally (see the Appendix for
an overview of the structure of water and electricity PPPs).
They have not received much attention, yet they are filling the
service gap in low profitability segments. Small-scale
providers of energy have been documented in Cote d’Ivoire,
Senegal, Somalia, South Africa, Tanzania, Uganda, Ethiopia,
Ghana, Kenya, Mali, Mozambique, and Zimbabwe (Kariuki
and Schwartz 2005). Because it is easier to produce
efficiently at small scale, the phenomenon is even stronger
in the water sector (i.e., it constitutes a local natural
monopoly). In Maputo, for instance, a recent study shows
that some 100 local informal entrepreneurs have invested in
200 small networks. Their access rate in the two poorest
quintiles is comparable to the access rate achieved by the
national operator, Aguas de Mozambique, even though they
receive no subsidy for their operation.37 Small-scale operators
play a very important role in periurban areas of capital cities.
A recent survey estimates that nearly half of urban dwellers
in Africa rely on such private services (mainly point source
systems or vendors). Small-scale providers of water have
been documented in Angola, Benin, Burkina Faso, Cote
d’Ivoire, Ethiopia, Ghana, Guinea, Kenya, Mali, Mauritania,
Mozambique, Niger, Nigeria, Republic of Congo, Senegal,
Somalia, South Africa, Sudan, Tanzania, Uganda, Zambia,
and Zimbabwe (Kariuki and Schwartz 2005). As predicted by
theory, they are bridging the public service gap at a high cost.
They are unregulated and receive no subsidies, so that the
price of their service is much higher than the public utilities’
price. Since they are serving the middle class and the poor,
these groups pay more for a cubic meter of water than the
rich. For instance, a case study in the city of N’Djamena
shows that the corporation of water carriers is well organized.
It behaves as a cartel and applies monopoly pricing. On
average, the water is sold with a markup of 3.5 times the
price at which it is purchased from the regulated public utility
(Bernadac 2005). Similarly, a study in the city of Niamey
shows that the average price paid by the poorest 20% of
households is roughly 2.6 times higher than the price paid
by the richest 20% (Bardasi and Wodon 2006).38 Empirical
4. PPPs and Macro-fiscal Balancing (Auriol and Picard (2002))
© AFD Working Paper No. 38 • Public Private Partnerships in Water and Electricity in Africa 19
37. AFD-Hydroconseil-SEURECA (2005).
38. Households pay on average CFAF 645/m3 in the first quintile, CFAF 541/m3 in the second, CFAF 509/m3 in the third, CFAF 422/m3 in the fourth, and CFAF 249/m3 in thefifth.
studies show that there is a strict negative relationship
between income and the price per cubic meter of water.
Economists and international organizations have hitherto
overlooked these private, often informal, firms in water and
electricity sectors. For the future, it might be useful to conduct
systematic studies on the extent of their services. The
objective should be to target some of these local providers
and to encourage them to expand their services and to
become formal, notably by lending them money,39 while in
exchange controlling their prices. A good example can be
found in small cities of Mauritania, where local operators
have signed three-year delegated management contracts
with a central body, ANEPA. Thus 300 independent small-
scale operators serve more than half of the population, have
invested $5 million, and outperform water services in larger
cities (managed by the national water company) on access
rates and other key indicators.40
4.5 Profitable Segment
When the public utility is profitable, the optimal industrial
policy is non-monotone in the opportunity cost of public
funds. This result is a consequence of the difficulties
encountered by developing countries, particularly in Africa,
in attracting investors while auctioning off profitable state-
owned enterprises (SOEs). Indeed, country risk analysis is
very important in global investment strategies because it
forms the basis for determining expected future returns on
investment. Since the perception of business risk is higher
in poor countries, as illustrated by the International Country
Risk Guide, this negatively affects the supply and cost of
international capital for these countries. SOEs are generally
sold at a discount (see Birdsall and Nellis 2002). With under-
priced public assets, Auriol and Picard (2002) show that the
optimal policy is non-monotone in the opportunity cost of
public funds. For low and high opportunity cost scenarios,
public ownership is preferred to privatization. The reverse
holds true for intermediate opportunity cost.
When the opportunity cost of public funds is low, the
government sets prices close to marginal cost and subsidizes
the regulated firm to cover fixed costs. Rises in the
opportunity cost of public funds increase the social cost of
such transfers. The government prefers to let a private firm
take over for intermediate values. Finally, for large values
the government, which focuses on revenue, prefers to keep
profitable firms public rather than to sell them off. Prices
are set close to the private monopoly level in order to
maximize profit and thus government revenue. It is wrong to
believe that the governments of advanced economies do not
care for the revenues generated by their utilities. The fiscal
argument works for every country in the world.41 The
difference between them lies in the weight given to this
argument. As developing countries are not able to tax as
efficiently as advanced economies, they need the additional
revenues more badly.42 It would be unfair and wrong-headed
to ask them to focus on their consumer surplus, when
advanced economies have always relied on their utilities for
fiscal resources.
The non-monotonicity result has important policy implications
for the profitable segment of the water and the electricity
industry. While divestiture of the profitable public firm, or of
its profitable segments, may be optimal in developed
countries, it is not necessarily ideal in developing countries,
where budget constraints are tight and market institutions are
weak. Indeed, restructuring of public utilities, aimed at
encouraging private participation in developing countries, has
resulted in market-skimming policies. The private firms took
4. PPPs and Macro-fiscal Balancing (Auriol and Picard (2002))
© AFD Working Paper No. 38 • Public Private Partnerships in Water and Electricity in Africa 20
39. Kariuki and Schwartz (2005), who survey 400 documents (articles, reports, case studies), show that small-scale private providers of water and electricity are severelycredit-constrained.
40. See AFD-Hydroconseil (2002). See also AFD-BPD-Hydroconseil (2006).
41. In the United States, for example, a federal excise tax on local and long distance telephony services was created in 1898. It has been repealed occasionally and re-enacted ever since. The opponents of the tax argue that it is regressive and distortive, while its proponents insist on the need for revenues in order to reduce federalbudget deficits. It is hard to get around this argument: at a tax rate of 3%, tax collection reached US$5.185 billion in fiscal year 1999 (reported in Budget of the UnitedStates Government, Fiscal Year 2000).
42. For instance, over the 1990-95 period, revenues collected from public firms amounted to 8% of GDP in Bolivia, 2.2% in Brazil, 5% in Chile, 1% in India, 3% in Mexico,3% in Peru (World Bank 1998). “On the whole this non-tax revenue is more important for developing as opposed to industrial countries, comprising about 21%compared to 10% of total revenue” (Burgess and Stern 1993, p. 782).
over large urban areas, while abandoning unprofitable rural
segments. Consistently with theory, the result has been an
increase in the fiscal costs of the sector when the profit
centers used to finance cross-subsidies are handed over to
the private sector (Estache and Wodon 2006). There is also
significant evidence of higher net fiscal cost associated with
the privatization of public utilities’ profit center in Latin
America (Trujillo et al. 2003). This problem is reinforced by the
fact that breaking up or unbundling African public utilities is
inefficient. They are already operating at a sub-optimal scale.
Based on the normative analysis, the biggest concern with
African public utilities is their commercial and pricing policy.
In line with theory, they are focusing on the wealthy segment
of demand, but contrary to the paper’s recommendation
they do not make a profit out of it. Depending on the value
of � they should charge a price close to, or even above, the
private monopoly price. In fact, public utilities services are
subsidized, which is in total contradiction with the results
above. It signals a problem of capture of public utilities by
the local elite. This is especially striking in the water sector.
A recent study of 26 African countries shows that the
connection rate to piped water is almost 0% in the first three
income quintiles in 21 countries (see Diallo and Wodon
2005).43 This figure is consistent with the statistic produced
by the WHO/UNICEF water monitoring program, which put
at 16% the share of Africans with access to piped water.44
Since the people connected to the water network are wealthy,
subsidizing piped water services in Sub-Saharan Africa
clearly means subsidizing the rich. A survey of papers and
case studies on small-scale private service providers shows
that the average price per cubic meter in Africa is less than
US$0.5 for utilities and around US$4.75 for carter vendors
(Kariuki and Schwartz 2005). It has been estimated that
water utilities need to charge at least US$1 per cubic meter
in developing countries to cover operation, maintenance
and most investment needs (Foster and Yepes 2006). The
financial gap is closed with scarce public subsidies and the
suppression of investment in maintenance and in network
extension. With the poor paying up to 10 times the price paid
by the rich, doubling the price of piped water in Sub-Saharan
Africa and collecting the bills is not simply a matter of
efficiency, it is also a matter of justice.45
We conclude that if public water utilities want to improve
efficiency and equity, they need to subsidize access to the
network for those who are not connected.46 Simultaneously,
they need to raise substantially the price per cubic meter of
water and make users, including the government and public
administrations, pay their bills. Indeed, commercial problems
are acute in African utilities.47 There is no point in revising
tariff structures if the firms do not first improve their
commercial performance. Since private firms are more
efficient than public ones in commercialization, it might be
profitable for public utilities to outsource the distribution
segment to the private sector. Private involvement in
distribution reduces theft, unpaid bills (notably by the
government), and losses.48 Private participation also increases
labor productivity. For instance, Tremolet (2006), who studies
eight water utilities in Africa, finds that the best performer is
4. PPPs and Macro-fiscal Balancing (Auriol and Picard (2002))
© AFD Working Paper No. 38 • Public Private Partnerships in Water and Electricity in Africa 21
43. It is nil in the first quintile. In the second quintile it is nil in 23 countries. In the third quintile (the middle 20% on the African income scale), it is still nil in 18 countries,and below 3% in three additional countries; it is 26% in Cote d’Ivoire, 17% in the Comoros, 7% in Kenya, 9% in Namibia, and 16% in South Africa. In the fourth quintile,connection rates are still below 5% in 19 countries; the access rate in the 7 remaining countries is above 20%. Only in the fifth quintile does one find positive accessrates in all countries.
44. See http://www.wssinfo.org/en/233_wat_africaS.html.
45. Such a price increase is possible. In Uruguay, for instance, residential water tariffs were raised in nominal terms at an average annual rate of 25% (15% in real terms)over the 1997-2003 period (Foster and Yepes 2006). It is easier in Africa, where only the rich are connected.
46. There is no positive relationship between water consumption and income. For instance, Nauges and Van Den Berg (2006) estimate water price elasticity in southwestSri Lanka. For households that use piped water, they conclude that the elasticity is not statistically different between income groups. Similarly, a study of eight LatinAmerican utilities shows that consumption is not well correlated with income (Foster and Yepes 2006). This explains why increasing block tariffs (IBT) perform so badlyin term of targeting. Studies on Latin America and South Asia suggest that the IBT structure delivers only 20% of the subsidies to the poor. Inclusion and exclusion errorsare both very large. To help the poor, it is more efficient to subsidize access.
47. In Bangui (Central African Rep.), SODECA in water and ENERCA in electricity manage to charge only 30% of the amounts they produce. If this rate were improved to areasonable 70%, more than €1 million in water and €5 million in electricity would be saved annually. Similarly, in Kinshasa (Dem. Rep. of Congo), the collection rateof REGIDESO (water) is 35% and that of SNEL (electricity) 30%.
48. If there is strong political will, commercial performances of public utilities can be improved without any private involvement, as in the cases of PPWSA in Cambodia andSONEDE in Tunisia.
Senegal, where the public firm SONES is in charge of capital
management, investment and planning, with the private firm
SDE in charge of operation and distribution. The SONES/SDE
entity serves the highest number of people (5 million with
360,000 connections, as against 180,000 on average in the
sample), with a ratio of 3 employees for 1,000 connections
(as against 10 on average). It is also the only utility that
achieves capital and operating cost recovery.
In electricity the pricing situation is somewhat better.
Comparing the two industries, Foster and Yepes (2006)
estimate that 69% of low-income countries achieve some
degree of cost recovery in electricity, as against only 12% in
water. This difference is explained by the fact that electricity
tariffs are proportionally higher than water tariffs. Average
electricity tariffs in high-income countries are twice as high
as those in low-income countries; in water they are nine
times higher. Thus, most African countries’ tariffs are too
low to recover fully the costs. To increase investment
capacity, public utilities’ tariffs need to be increased. This is
possible. For instance, in Rwanda the price per kwh has
been doubled by the national electricity firm. Electricity
utilities should also develop non-linear tariffs for large
customers, such as peak load pricing, to smooth demand
and to deal more efficiently with the penury of power. Non-
linear tariffs are also useful to shield the poorest consumers
from the burden of the necessary price rises. Contrary to
water, there is some evidence of a positive relationship
between consumption of electric power and wealth. This
implies that it is somewhat possible to target the poor. To
protect its poor customers from the doubling of the price, the
Rwandan national electricity firm is considering implementing
an inverted-U block tariff (IUBT) structure: the first block
would be subsidized by the second block, and the third
block would be priced at cost recovery level. Finally, non-
linear tariffs are useful in maximizing profit. Sophisticated
pricing policies require accurate metering of consumption.
African governments will have to invest in electricity
infrastructure in the years to come. The private, informal
sector is not equipped to produce and distribute power on
an efficient scale. Since public finances are very tight, they
will also have to play an important role of coordination among
the different potential sources of funding. These include
consumers, NGOs, aid agencies, international investors,
and local private entrepreneurs and investors. For instance,
the largest source of external financing in many African
countries is migrant remittances (World Bank 2006). Tapping
some of these funds could be very useful. However, investors
need to believe that they will not be expropriated from their
investment once it is sunk. Moreover, public firms need to be
healthy, with good financial prospects. This requires sound
pricing and marketing policies. A success story is the partial
sale of SEEG, the public electricity and water utility of Gabon,
to local firms (19%) and individual Gabonese (15%). Because
the firm had a good reputation, the demand for the shares
has been so high that the government has been obliged to
ration their allocation.49 Côte d’Ivoire is another success
story of PPP with local participation (see Appendices A1
and A2). Similarly, a recent study on infrastructure financing
in developing countries, drawing on more than 2,700 projects
in the World Bank’s PPI Database for 1998-2003, determined
that investors from developing countries investing regionally
are very important in Africa (more so than in other regions).
These foreign firms are accounting for 38% of all investment
by value. They are also the largest in terms of investments
per project at US$104 million, compared to US$58 million
from local investors and only US$35 million from developed
country firms. They are dominant in telecoms and energy
projects, but not at all in water. In energy, for instance, YTL
Corporation of Malaysia has invested in Zimbabwe, and
Alrosa of Russia in Angola. The regional investors are mainly
from South Africa. Eskom Enterprises has invested in
Zimbabwe and Uganda, NetGroup Solutions has signed a
management contract in Tanzania, and SAD-ELEC has
signed one in Lesotho (Schur 2005). Such investments from
other developing countries, especially African ones, have
to be encouraged. Regional investors have a better
perception of the business risk they face. They are asking for
lower rate of return on their investment and their involvement
is easier to defend politically.
4. PPPs and Macro-fiscal Balancing (Auriol and Picard (2002))
© AFD Working Paper No. 38 • Public Private Partnerships in Water and Electricity in Africa 22
49. AFD (2006). This also raises the issue of independent regulation. President Omar Bongo combines the roles of regulator and shareholder (he owns 3.5% of SEEG). Someanalysts are concerned by the excessive amount of dividends paid to shareholders. They are unsustainable.
As suggested by theory, utilities services provision is more
market-oriented in Sub-Saharan Africa than in OECD
countries. This reflects the extreme weakness of African
governments. Success stories in Sub-Saharan Africa are
generally demand-driven. Examples of this include the
penetration of mobile telephony and water provision to the
middle class and the poor. Since these population groups are
not connected to the public utility, they generally receive no
subsidy. They get a service because they are ready to pay
for it and because local businesses are ready to invest to
provide it. In light of the financial constraint faced by African
governments, letting such businesses serve freely the less
profitable segments of the market is a second-best solution.
For instance, in small Mauritanian cities access rates are
higher than in the capital because of small private
entrepreneurs’ involvement.50 Such involvement is possible
because water services can be provided efficiently on a
fairly small scale. In electricity, however, the returns to scale
are large. As illustrated by the continent-wide penury of
electrical power, laissez-faire is very inefficient. Self-
sufficiency based on private generators and small, privately
owned and operated electricity networks closes the utilities
gap at a high social cost. International organizations and
donors need a pragmatic approach to the problem of the
development of poor countries’ infrastructure. To date, they
have tried to attract international investors at high
restructuring and financial costs.51 Not only have the reforms
been expensive to design and implement, they have often
been unsuccessful as well.52 For the future, it is more efficient
to focus on public utilities’ commercial performance. This is
a first step to collecting public and private funds.
Reform of public utilities must take into account the fiscal
constraint faced by African governments. In profitable market
segments, allocative inefficiency combined with the critical
budgetary conditions found in most Sub-Saharan countries
argue in favor of public ownership with high pricing policies.
This is an effective way of combining regulation of the firm
with a maximum level of taxation. However, if African utilities
focus on the wealthy segment of the demand, they sell their
services at a subsidized price. Moreover, they show no great
interest in collecting bills. This suggests that they have been
captured by the ruling elite. Informing the people through the
media of this political problem might help to raise prices to
cost-recovery level. Increasing the quality of the service,
notably by decreasing the number of shortages, might also
help the wealthy to accept higher payments. This is important
because healthy public firms are necessary to attract
investors – especially local and regional ones, which are the
largest source of private investment in Africa – and to
increase service coverage. Since water and electric utilities
are operating below efficient scale, connecting more people
is the best way to increase consumer surplus and equity
simultaneously. Instead of subsidizing prices, African public
utilities should subsidize new connections.
© AFD Working Paper No. 38 • Public Private Partnerships in Water and Electricity in Africa 23
5. Conclusion
50. AFD-Hydroconseil (2002) and AFD-BPD-Hydroconseil (2006).
51. For instance in Eastern Europe the World Bank spent US$100 million on technical assistance for reforming, without success, the power sectors in Ukraine (Manibog etal. 2003).
52. A striking example is EDM in Mali, where a management and a concession contract have successively been signed and terminated over a 10-year period. The resultis a tremendous backlog in water and electricity. As Tremolet (2005) writes, “The conflict between the private operator and the Malian Government regarding the termsof the contract and EDM’s obligations has mobilized a considerable amount of time and resources by comparison with the overall impact of EDM’s contribution […]EDM only provides services to 10% of the Malian population.”
A1. Typology of Private Sector Participation
in Water Utilities
1. International Operators in Big Cities (contract53 in
operation or to be signed):
• Côte d’Ivoire (a concession contract was signed
with Saur in early 1959 for Abidjan, and has evolved
into various PPP arrangements until a 20-year
affermage contract was signed in 1989 for all cities)
• Senegal (affermage with concession elements
signed with Saur in 1996; renewed in 2006)
• Gabon (20-year concession contract signed with
Veolia in 1999)
• Mozambique (15-year lease contract signed in 1999
with Saur / Aguas de Portugal / private Mozambican
investors. Saur withdrew in 2002)
• Niger (affermage contract signed with Veolia in
2001)
• Morocco (Ondeo in Casablanca / Veolia in Rabat-
Salé and Tanger-Taitouan)
• Zambia (Copper Belt: management contract with
Saur in 2001. Still in operation?)
• Rwanda (5-year management contract signed in
2003 with Lahmeyer)
• Cameroon (Public Offer phase for affermage)
• Madagascar (Public Offer phase for affermage;
management contract with Lahmeyer still in
operation)
• Ghana (5-year management contract signed in 2005
by publicly owned operators Vitens / Rand)
• Burkina Faso (5-year management contract in 2001
with Veolia / Mazars & Guérard)
2. International Operators in Big Cities (contract1 terminated
or not renewed)
• Mali (Management contract in 1995 with
Saur/EDF/Hydroquebec/CRC-Cogema terminated in
1997; Concession contract signed with Saur in 2000
for Bamako and 16 urban centers; terminated by
Saur in 2005)
• Guinea (A lease contract was signed with Saur /
CGE in 1989 for Conakry and 16 cities; terminated
by government in 2002)
• Central African Republic (affermage contract signed
with Saur in 1991; terminated by Saur)
• Chad (Veolia signed a 30-year management contract
in 2000 which was supposed to evolve through a
privatization process; terminated by Vivendi in 2004)
• Cape Verde (50-year concession contract signed
with Aguas de Portugal; in crisis)
• Tanzania (Dar es Salaam: the lease contract signed
with Biwater in 2003 was terminated by the
government in 2005)
• Uganda (management contract with Ondeo 2002-
2004 for Kampala)
• South Africa (Johannesburg: 5 year management
contract with Ondeo in 2001)
• Sao Tome & Principe (Safege, subsidiary of
Suez/Dumez, signed a management contract in
1992 which was terminated in 1995
3. International Operators in Small Cities (contract1 still in
operation):
• Kenya (Malindi – O&M contract signed with Gauff in
1995, followed by a management contract in 1999)
© AFD Working Paper No. 38 • Public Private Partnerships in Water and Electricity in Africa 24
Appendix
53. Operating and Maintenance or Management contracts in italic.
• South Africa (Queenstown: O&M contract signed
with Ondeo in 1992; Nelspruit: concession contract
signed with Biwater in 1992; Dolphin Coast:
concession contract signed with Saur in 1999)
• Mozambique (Aguas de Portugal signed in 2001 a 5-
year affermage contract for 4 secondary cities:
Beira, Quelimane, Nampula, Pemba. Studies about
the next scheme are not finalized yet)
4. Small-Scale Providers Documented in Small Cities:
• Ghana
• Mauritania
• Uganda
• Zambia
• Tanzania
• Niger
5. Small-Scale Providers Documented in Periurban Areas:
• Chad
• Mali
• Kenya (Kibera, Kisumu)
• Mozambique
• Tanzania
• Nigeria
• Angola
• Benin
• Burkina Faso
• Côte d’Ivoire
• Ethiopia
• Ghana
• Guinea
• Mauritania
• Niger
• Nigeria
• RDC
• Senegal
• Somalia
• South Africa
• Sudan
• Uganda
• Zambia
• Zimbabwe
6. Community based Providers Documented in Rural Areas:
• Mali
• Burkina Faso
• Chad
A2. Typology of Private Sector Participation
in Electricity Utilities in Africa (without IPP)
1. International operators in Big Cities (contract54 in
operation):
• Gabon (20-year concession contract signed with
Veolia in 1999)
• Cameroon (20-year concession contract signed with
AES in 2001)
• Côte d’Ivoire (15-year concession contract with
more affermage elements signed in 1990 by Saur –
EDF; renewed)
• Equatorial Guinea (society for production and
distribution has mixed capital from the State and
Infinsa)
• Togo (10-year concession contract for distribution
and some production signed with HydroQuébec /
Elyo in 2000; under stress)
• Rwanda (5-year management contract signed in
2003 with Lahmeyer)
• Kenya (2-year management contract signed with
Manitoba Hydro in 2005)
2. International Operators in Big Cities (contract2 terminated
or not renewed)
• Senegal (concession contract signed with
HydroQuébec / Elyo in 1999; terminated in 2000;
further privatization was unsuccessful)
• Cape Verde (50-year concession contract signed
with Aguas de Portugal; in crisis)
Appendix
© AFD Working Paper No. 38 • Public Private Partnerships in Water and Electricity in Africa 25
54. Operating and Maintenance or Management contracts in italic.
• Mali (Management contract in 1995 with
Saur/EDF/Hydroquebec/CRC-Cogema terminated in
1997; Concession contract signed with Saur in 2000
for Bamako and 33 urban centers; terminated by
Saur in 2005)
• Chad (Veolia signed a 30-year management contract
in 2000 which was supposed to evolve through a
privatization process; terminated by Vivendi in 2004)
3. PPP with Regional Private Sector:
• Uganda (Eskom has signed a concession contract
for production in 2002)
• Uganda (Umeme, a private local company, is in
charge of distribution since 2001)
• Zimbabwe (investment by Eskom)
• Malawi (2.5-year management contract signed in
2001 with Eskom)
• Tanzania (2-year management contract with
NetGroup Solutions from South Africa; extended
until 2005)
• Lesotho (management contract signed by SAD-
ELEC)
4. Small-Scale Providers Documented in Periurban Areas
or Small Cities:
• Côte d’Ivoire
• Senegal
• Somalia
• South Africa
• Tanzania
• Ethiopia
• Ghana
• Kenya
• Mali
• Mozambique
• Zimbabwe
Appendix
© AFD Working Paper No. 38 • Public Private Partnerships in Water and Electricity in Africa 26
AFD-BPD-Hydroconseil (2006), « Les opérateurs indépendants, acteurs marginalisés mais incontournables de l’amélioration
des services d’eau potable », rapport.
AFD-Hydroconseil (2002), « La gestion des services d’eau et assainissement dans les petites villes, Étude de cas Mauritanie »,
rapport.
AFD-Hydroconseil-SEURECA (2005), “Projecto de Reabilitaçao das Redes de Agua Potavel da Aglomeraçao de Maputo“, rapport.
AFD (2006), « Les privatisations en zone franc : synthèse des travaux du groupe de travail MINEFI / AFD », Document de Travail
No. 28, Département de la Recherche de l’AFD.
ANDRES, L., V. FOSTER and J.L. GUASH (2006), “The Impact of Privatization on the Performance of the Infrastructure Sector:
The Case of Electricity Distribution in Latin American Countries”, World Bank Working Paper WPS3936.
AURIOL, E. and P.M. PICARD (2002), “Privatization in Developing Countries and the Government Budget Constraint”, Nota di
Lavoro 75.2002, Fondazione Eni Enrico Mattei, Corso Magenta 63 - I – 20123 Milano, Italy.
AURIOL, E. (1998), “Deregulation and Quality”, International Journal of Industrial Organization, 16, 169-194.
AURIOL, E. and P.M. PICARD (2005), “Ex-Post Contracting with Natural Monopoly”, mimeo, Toulouse.
AURIOL, E. and M. WARLTERS (2005), “Taxation Base in Developing Countries”, Journal of Public Economics, 89(4), 625-46.
AYRES, R.U., L.W. AYRES and B. WARR (2003), “Energy, Power and Work in the US Economy, 1900-1998”, Energy 28 (2), pp.
219-273.
BARDASI, E. and Q. WODON (2006), “Measuring Time Poverty and Analyzing Its Determinants: Concepts and Application to
Guinea”, in C.M. Blackden and Q. Wodon, eds., “Gender, Time Use and Poverty in Sub-Saharan Africa”, World Bank Working
Paper 72, Washington, DC.
BERNADAC, C. (2005), « Projet d’adduction d’eau potable à N’Djamena, une analyse économique », Rapport de mission, AFD,
Paris.
BERNADAC, C. (2005), « Analyse Economique – Projet d’Adduction d’Eau Potable à N’Djamena, Tchad – Mission du 12 au 21
janvier 2005 », mimeo, AFD, Paris.
© AFD Working Paper No. 38 • Public Private Partnerships in Water and Electricity in Africa 27
References
BIRDSALL, N. and J. NELLIS (2002), “Winners and Losers: Assessing the distributional impact of privatization”, Center for Global
Development, Working Paper Number 6.
BLANC, A. and C. GHESQUIERES (2006a), « Secteur de l’eau au Sénégal : un partenariat équilibré entre acteurs publics et privés
pour servir les plus démunis », Document de Travail n° 24, Département de la Recherche de l’AFD.
BLANC, A. and C. GHESQUIERES (2006b), « Décentralisation et politique de l’eau gratuite en Afrique du Sud : quelle place
pour le secteur privé ? », Document de Travail n° 25, Département de la Recherche de l’AFD.
BURGESS and STERN (1993), “Taxation and Development”, Journal of Economic Literature, 31 (2), pp. 762-830.
CALDERON and SERVEN (2004), “The Effects of Infrastructure Development on Growth and Income Distribution”, World
Bank, Policy Research Working Paper WPS 3400.
CARCAS, S. (2004), Amélioration des performances des services d’eau et d’électricité en Afrique Subsaharienne : bilan et
perspectives des partenariats entre le secteur public et le secteur privé, Thèse professionnelle AFD.
DAVIS, J., R. OSSOWSKI, T. RICHARDSON and S. BARNETT (2000), “Fiscal and Macroeconomic Impact of Privatization”, IMF
Occasional Paper, 194.
DEBANDE, O. and G. FRIEBEL, “A Positive Theory of Insider Privatization”, WDI, University of Michigan, DP37.
DENIAU, P. (1993), « Privatisation du service public de l’électricité en Côte d’Ivoire », Rapport AFD, Paris.
DEWATRIPONT, M. and E. MASKIN (1995), “Credit and Efficiency in Centralized and Decentralized Economies”, Review of
Economic Studies, 62(4), pp 541-56.
DIALLO, A.B. and Q. WODON (20005), “A Note on Access to Network-Based Infrastructure Services in Africa: Benefit and Marginal
Benefit Incidence Analysis”, mimeo, World Bank, Washington, DC.
Energy Sector Recovery Project in Kenya (2004), Project Report, World Bank / Agence Française de Développement (AFD) /
Banque Européenne d'Investissement (BEI) / Nordic Development Fund (NDF).
ESFAHANI, H.S. and M.T. RAMIREZ (2003), “Institutions, Infrastructure and Economic Growth”, Journal of Development
Economics, 70, pp. 443-477.
ESTACHE, A. (2006), “Plenary Session 1 – Infrastructure for Growth: Emerging Issues”, Annual Bank Conference on Development
Economics, Tokyo, May 29-30, 2006, Mita Conference Hall, Japan.
ESTACHE A., V. FOSTER, and Q. WODON (2002), “Accounting for Poverty in Infrastructure Reform, Learning from Latin
America's Experience”, World Bank Institute Development Studies.
ESTACHE, A. and A. GOICOECHEA (2005), “An Infrastructure Research Database for Sub-Sahara Africa”.
References
© AFD Working Paper No. 38 • Public Private Partnerships in Water and Electricity in Africa 28
ESTACHE, A. and E. KOUASSI (2002), “Sector Organization, Governance, and the Inefficiency of African Water Utilities”, World
Bank Policy Research Working Paper 2890, September.
ESTACHE, A., B. SPECIALE and D. VEREDAS (2005), How Much Does Infrastructure Contribute to Sub-Sahara Africa’s Growth?.
ESTACHE, A. and T. YEPES (2005), Assessing Africa’s Investment Needs.
ESTACHE, A. and Q. WODON (2006), Infrastructure and Poverty in Sub-Saharan Africa, Draft Book, The World Bank, mimeo.
EUROPEAN COMMISSION (2005), “Annual Report on the Implementation of the Gas and Electricity Internal Market”, Report
from the Commission, SEC (2004) 1720, January, Brussels.
FAY, M. and T. YEPES (2005), “Investing in Infrastructure: What is needed from 2000-2010”, World Bank, Policy Research Working
Paper, 3102.
FOSTER, V. and T. YEPES (2006), “Is Cost Recovery a Feasible Objective for Water and Electricity? The Latin American
Experience”, World Bank Working Paper WPS3943.
GUASH, J-L., J-J LAFFONT and S. STRAUB (2002), “Renegotiation of Concession Contracts in Latin America”, mimeo, IDEI.
HARRIS, C. (2003) “Private Participation in Infrastructure in Developing Countries: Trends, Impacts, and Policy Lessons”,
World Bank Working Paper 5.
INTERNATIONAL ENERGY AGENCY (2004), World Energy Outlook, OECD-IEA, Paris.
JAMASB, T. and M. POLLITT (2005), “Electricity Market Reform in the European Union: Review of Progress toward Liberalization
& Integration”, mimeo.
KARIUKI, M. and J. SCHWARTZ (2005), “Small-Scale Private Service Providers of Water Supply and Electricity – A Review of
Incidence, Structure, Pricing and Operating Characteristics”, World Bank Working Paper WPS3727.
KIKERI, S. and A.F. KOLO (2005), “Privatization: Trends and Recent Developments”, World Bank Policy Research Working Paper
No. 3765, November. Available at SSRN: http://ssrn.com/abstract=849344
KORNAI, J. (1980), “Economics of Shortage”, Amsterdam, North-Holland.
KORNAI, J. (2000), “What the Change of System from Socialism to Capitalism Does and Does Not Mean”, Journal of Economic
Perspectives, 4(1), 27-42.
KORNAI, J. (2001), “Hardening the Budget Constraint: The experience of the post-socialist countries”, European Economic
Review, 45, pp. 1573-99.
KORNAI, J., E. MASKIN and G. ROLAND (2002), “Understanding the Soft Budget Constraint”, Discussion Paper, University of
California, Berkeley.
References
© AFD Working Paper No. 38 • Public Private Partnerships in Water and Electricity in Africa 29
KORNAI, J. and J. WEIBULL (1983), “Paternalism, Buyers' and Sellers' Markets”, Mathematical Social Sciences, 7:153-69.
LAFFONT, J.J. (2001), “Enforcement, Regulation and Development”, mimeo, IDEI Toulouse.
LAFFONT, J.J. and J. TIROLE (1993), A Theory of Incentives in Procurement and Regulation, MIT Press.
LAMECH, R. and K. SAEED (2003), “What International Investors Look for When Investing In Developing Countries – Results
from a Survey of International Investors in the Power Sector”, World Bank, Energy and Mining Sector Board Discussion,
Paper No 6.
MANIBOG, F., R. DOMINGUEZ and S. WEGNER (2003), “Power for Development – A Review of the World Bank Group’s
Experience with Private Participation in the Electricity Sector”, World Bank, mimeo.
MASKIN, E. (1999), “Recent Theoretical Work on the Soft Budget Constraint”, American Economic Review, 89(2), 421-25.
MEGGINSON, W. and J. NETTER (2001), “From State to Market: A Survey of Empirical Studies on Privatization”, Journal of
Economic Literature, 39, pp. 321-89.
MULLER (2003), « Étude comparative des principales compagnies d’électricité Ouest-Africaines », ENPC/AFD.
NAUGES, C. and C. VAN DEN BERG (2006), “Water Markets, Demand and Cost Recovery for Piped Water Supply Services:
Evidence from Southwest Sri Lanka”, World Bank Working Paper WPS3941.
NELLIS, J. (1999), “Time to Rethink Privatization In Transition Economies?”, International Finance Corporation, Discussion
Paper 38.
NELLIS, J. (2006), “Privatization—A Summary Assessment”, Center for Global Development, Working Paper 87.
NEWBERY, D. and M.G. POLLITT (1997), “The Restructuring and Privatization of Britain CEGB- was it worth it?” European
Economic Review, 45, pp. 269-303.
NEWBERY, D. (2002), “Regulatory Challenges to European Electricity Liberalisation”, Swedish Economic Policy Review, 9, 9-43.
OECD-AfDB (2003), African Economic Outlook, OECD.
PLANE, P. (2004), « Privatisation et réseaux d’électricité en Afrique de l’Ouest francophone: une evaluation retrospective »,
Coloquio in Mexico ‘Energia, reformas Institucionales y Desarrollo en America Latina’.
SARBIB, J-L. (1997), “Privatization in Africa: Present and Future Trends”, African Development Bank Group, 1997 Annual
Meeting Symposium on ‘Private Sector Development In Africa’.
SCHMIDT, K (1996), “The Costs and Benefit of Privatization- An Incomplete Contracts Approach”, J. of Law, Economics and
Organization, Vol. 12, pp. 1-24.
References
© AFD Working Paper No. 38 • Public Private Partnerships in Water and Electricity in Africa 30
SHAPIRO, C. and R. WILLIG (1990), “Economic Rationale for the Scope of Privatization”, DP 41, Princeton University.
SHLEIFER, A. and R. VISHNY (1997), “A survey of Corporate Governance”, Journal of Finance, vol 52 (2) pp. 737-83.
SCHUR, M. (2005), “Developing Country Investors and Operators in Infrastructure Projects – Prevalence, Emerging Trends and
Possible Policy Implications for the African Region”, mimeo.
SNOWER, A. and R. WARREN (1996), “The Marginal Welfare Cost of Public Funds: Theory and Estimates”, Journal of Public
Economics, 61, pp. 289-305.
TANZI, V. and H. ZEE (2001), “Tax Policy for Developing Countries”, IMF, Economic Issues No 27.
TOVAR, B. and L. TRUJILLO (2004), “A Short Note on the Economic Efficiency of East African Electricity Operators”, The World
Bank.
TREMOLET, S. (2005), “Mali case study”, KfW / TRC Economics.
TREMOLET, S (2006), “PSP in urban water supply in Sub-Saharan Africa”, Report for the German Development Cooperation.
TRUJILLO, L., N. MARTIN, A. ESTACHE and J. CAMPOS (2003), “Macroeconomic Effects of Private Sector Participation in
Infrastructure”, in Easterly, W. and L. Serven, The Limits of Stabilisation, Stanford University Press, Stanford, pp. 139-170.
TYNAN, N. and B. KINGDON (2005), “Optimal Size for Utilities-Returns to Scale in Water: Evidence from Benchmarking”,
Viewpoint, Note n° 283, The World Bank.
VERGES, J.F. (2002), « L’évolution des contrats de délégation des services publics d’eau et d’électricité en Afrique », ISTED / ICEA.
WARLTERS, M. and E. AURIOL (2005), “The Marginal Cost of Public Funds in Developing Countries: An Application to 38 African
Countries”, World Bank Policy Research Working Paper, 3679.
WORLD BANK (1998), “World Development Indicators”, Washington D.C.
WORLD BANK (2006), “Global Development Finance – The Development Potential of Surging Capital Flows”, mimeo.
WORLD BANK (2004), “The Challenge of Financing Infrastructure in Developing Countries, Chapter 6, Global Development
Finance”, mimeo.
ZHANG, Y-F., D. PARKER and C. KIRKPATRICK (2002), “Electricity Sector Reform in Developing Countries: An Econometric
Assessment of the Effect of Privatisation, Competition and Regulation”, Aston Business School, Aston University, ISBN 1 85449
552 6.
References
© AFD Working Paper No. 38 • Public Private Partnerships in Water and Electricity in Africa 31


![[Résultats] Rapport 2015 de responsabilité sociétale du Groupe AFD](https://img.pdfslide.fr/doc/110x75/579079091a28ab6874c5470d/resultats-rapport-2015-de-responsabilite-societale-du-groupe-afd.jpg)