Embed Size (px)
Citation preview
Agnieszka Rybarczyk, Agnieszka Mickiewicz, Joanna Sarzyńska, Jacek Błażewicz,
Marek Figlerowicz
Poznan University of Technology
INSTITUTE OF COMPUTING SCIENCE page 1/15
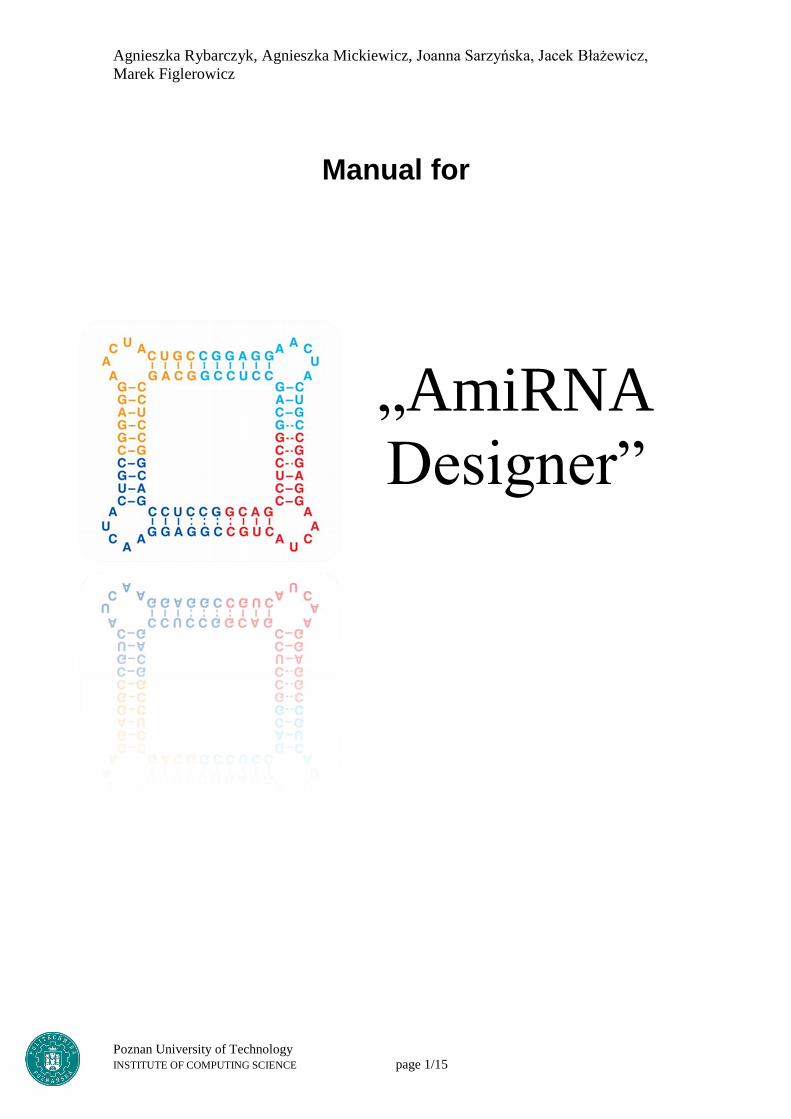
Manual for
„AmiRNA
Designer”
Agnieszka Rybarczyk, Agnieszka Mickiewicz, Joanna Sarzyńska, Jacek Błażewicz,
Marek Figlerowicz
Poznan University of Technology
INSTITUTE OF COMPUTING SCIENCE page 2/15
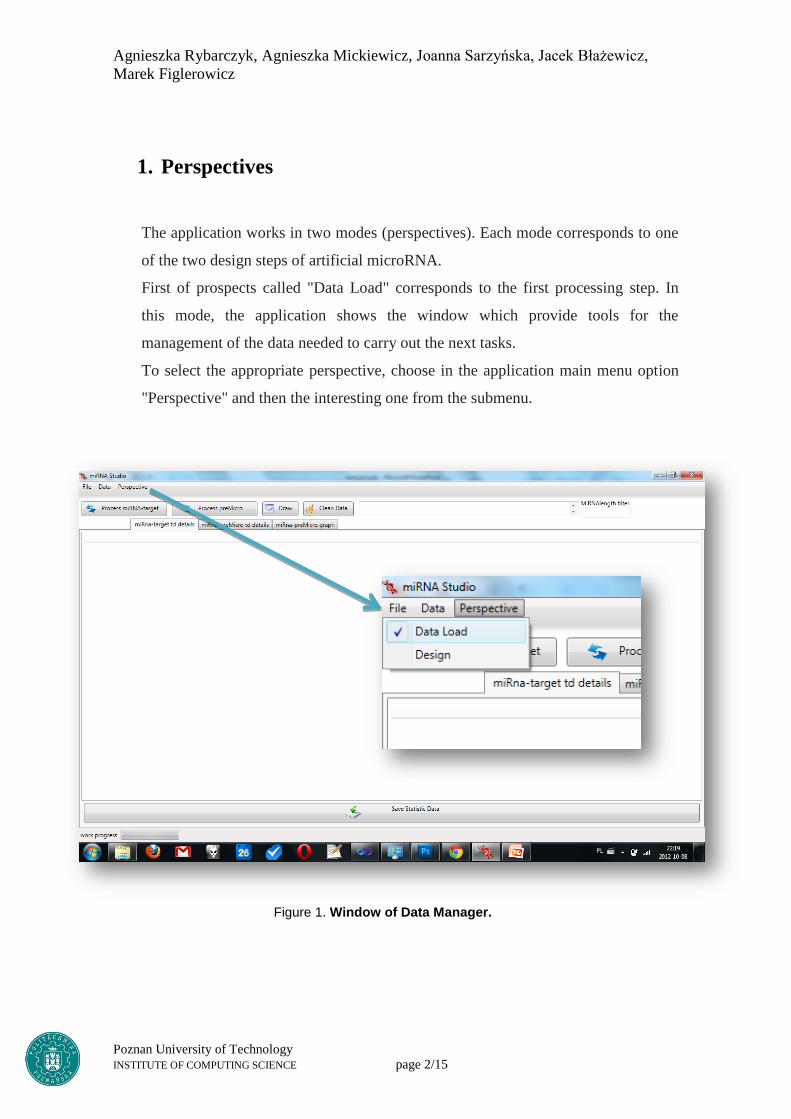
1. Perspectives
The application works in two modes (perspectives). Each mode corresponds to one
of the two design steps of artificial microRNA.
First of prospects called "Data Load" corresponds to the first processing step. In
this mode, the application shows the window which provide tools for the
management of the data needed to carry out the next tasks.
To select the appropriate perspective, choose in the application main menu option
"Perspective" and then the interesting one from the submenu.
Figure 1. Window of Data Manager.
Agnieszka Rybarczyk, Agnieszka Mickiewicz, Joanna Sarzyńska, Jacek Błażewicz,
Marek Figlerowicz
Poznan University of Technology
INSTITUTE OF COMPUTING SCIENCE page 3/15
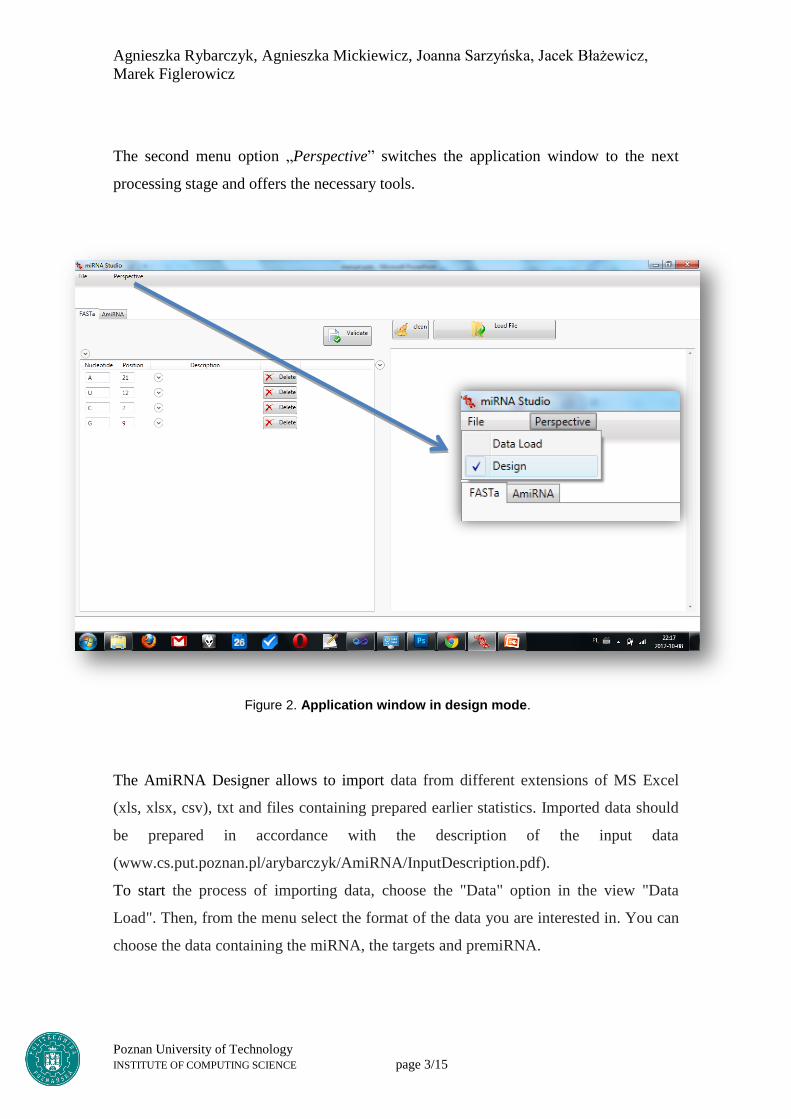
The second menu option „Perspective” switches the application window to the next
processing stage and offers the necessary tools.
The AmiRNA Designer allows to import data from different extensions of MS Excel
(xls, xlsx, csv), txt and files containing prepared earlier statistics. Imported data should
be prepared in accordance with the description of the input data
(www.cs.put.poznan.pl/arybarczyk/AmiRNA/InputDescription.pdf).
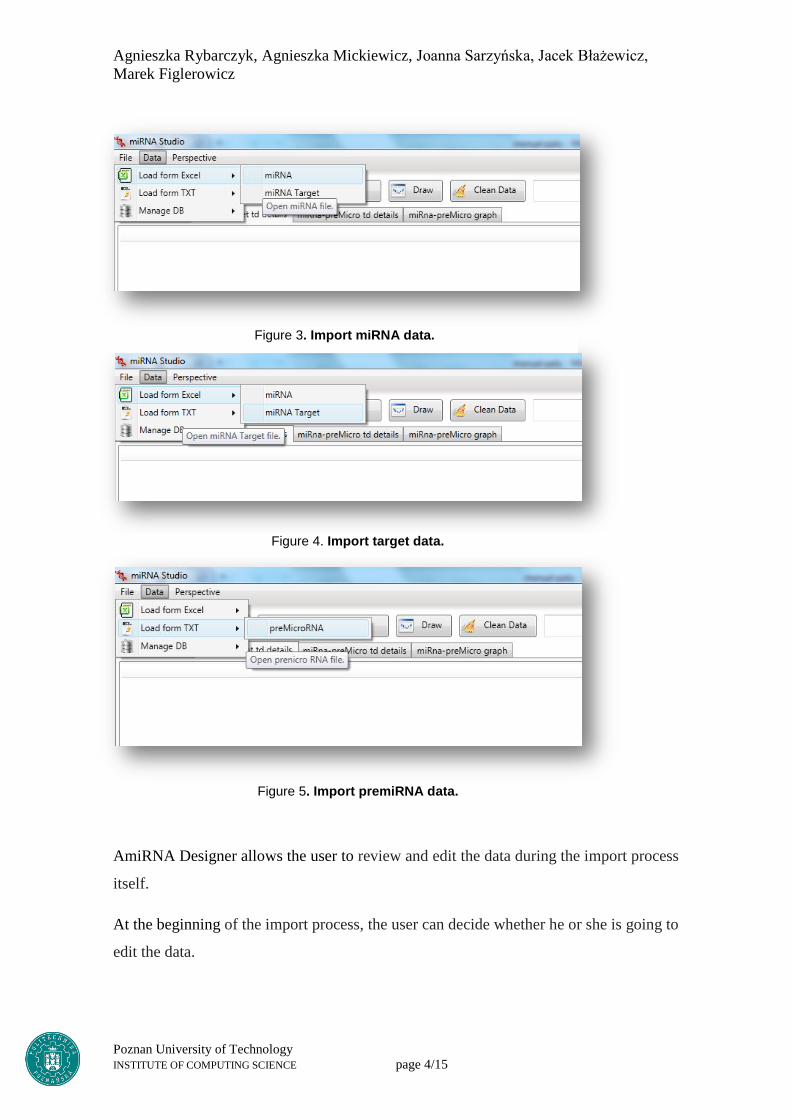
To start the process of importing data, choose the "Data" option in the view "Data
Load". Then, from the menu select the format of the data you are interested in. You can
choose the data containing the miRNA, the targets and premiRNA.
Figure 2. Application window in design mode.
Agnieszka Rybarczyk, Agnieszka Mickiewicz, Joanna Sarzyńska, Jacek Błażewicz,
Marek Figlerowicz
Poznan University of Technology
INSTITUTE OF COMPUTING SCIENCE page 4/15
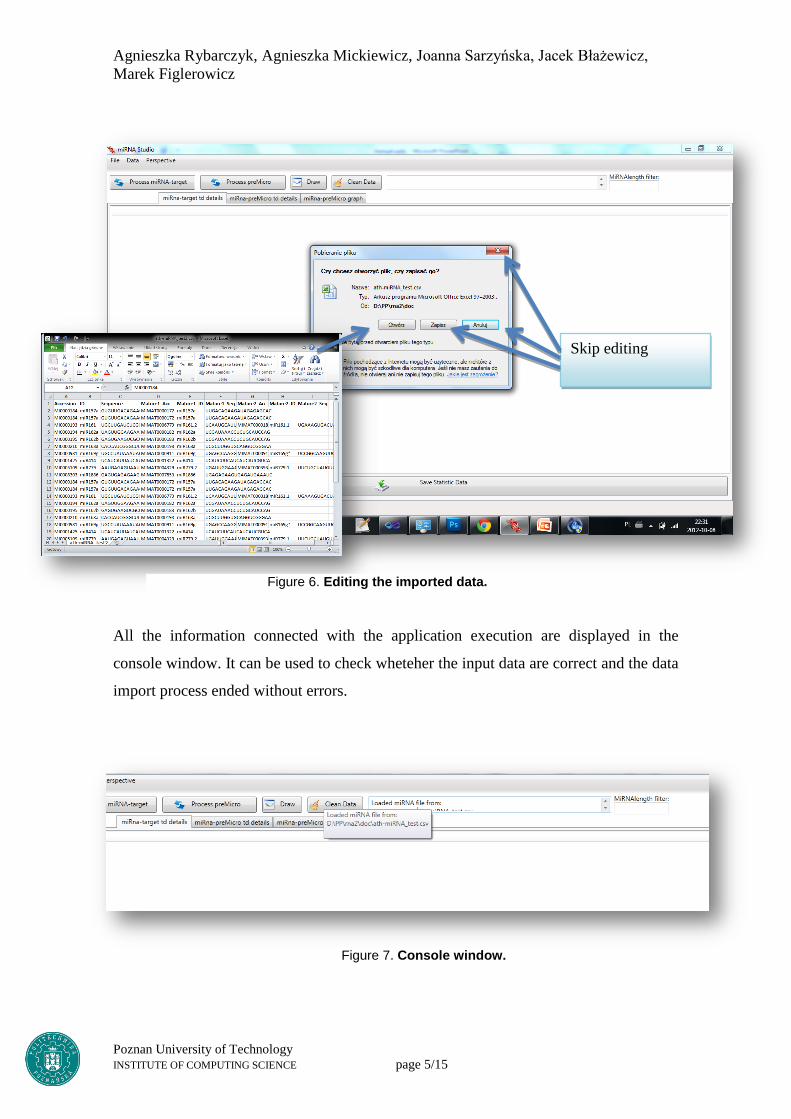
AmiRNA Designer allows the user to review and edit the data during the import process
itself.
At the beginning of the import process, the user can decide whether he or she is going to
edit the data.
Figure 3. Import miRNA data.
Figure 4. Import target data.
Figure 5. Import premiRNA data.
Agnieszka Rybarczyk, Agnieszka Mickiewicz, Joanna Sarzyńska, Jacek Błażewicz,
Marek Figlerowicz
Poznan University of Technology
INSTITUTE OF COMPUTING SCIENCE page 5/15
All the information connected with the application execution are displayed in the
console window. It can be used to check wheteher the input data are correct and the data
import process ended without errors.
Skip editing
Figure 6. Editing the imported data.
Figure 7. Console window.
Agnieszka Rybarczyk, Agnieszka Mickiewicz, Joanna Sarzyńska, Jacek Błażewicz,
Marek Figlerowicz
Poznan University of Technology
INSTITUTE OF COMPUTING SCIENCE page 6/15
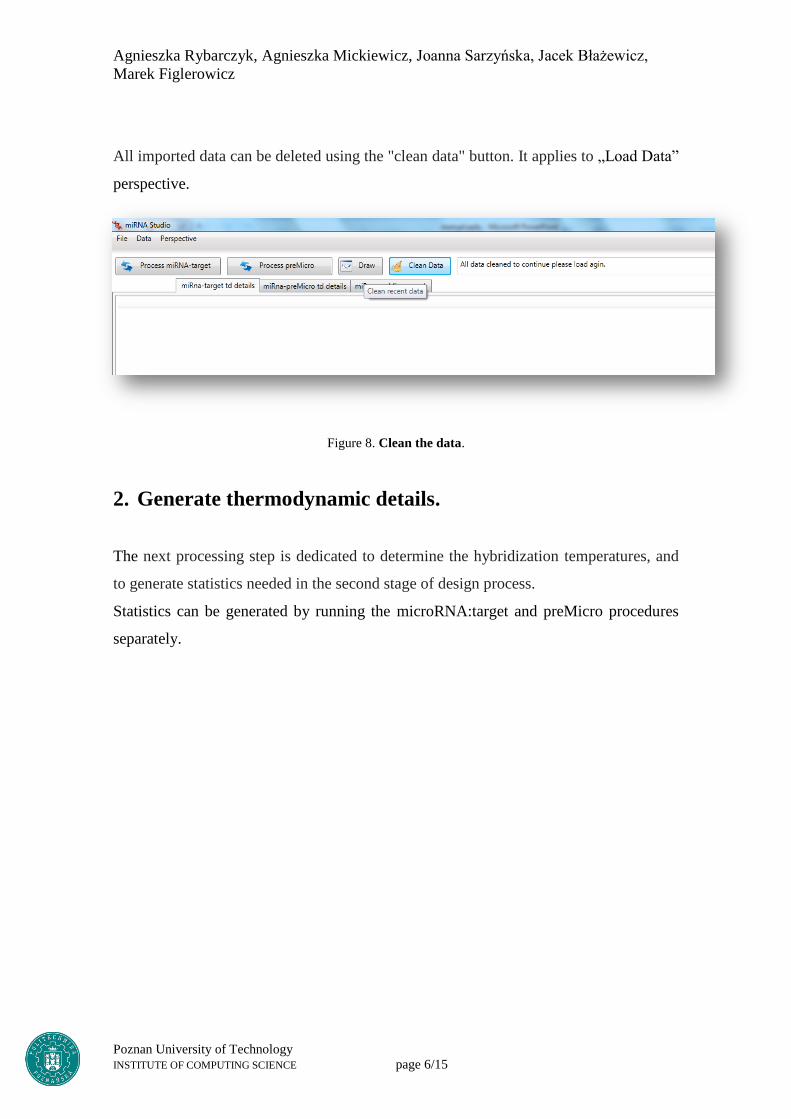
All imported data can be deleted using the "clean data" button. It applies to „Load Data”
perspective.
Figure 8. Clean the data.
2. Generate thermodynamic details.
The next processing step is dedicated to determine the hybridization temperatures, and
to generate statistics needed in the second stage of design process.
Statistics can be generated by running the microRNA:target and preMicro procedures
separately.
Agnieszka Rybarczyk, Agnieszka Mickiewicz, Joanna Sarzyńska, Jacek Błażewicz,
Marek Figlerowicz
Poznan University of Technology
INSTITUTE OF COMPUTING SCIENCE page 7/15
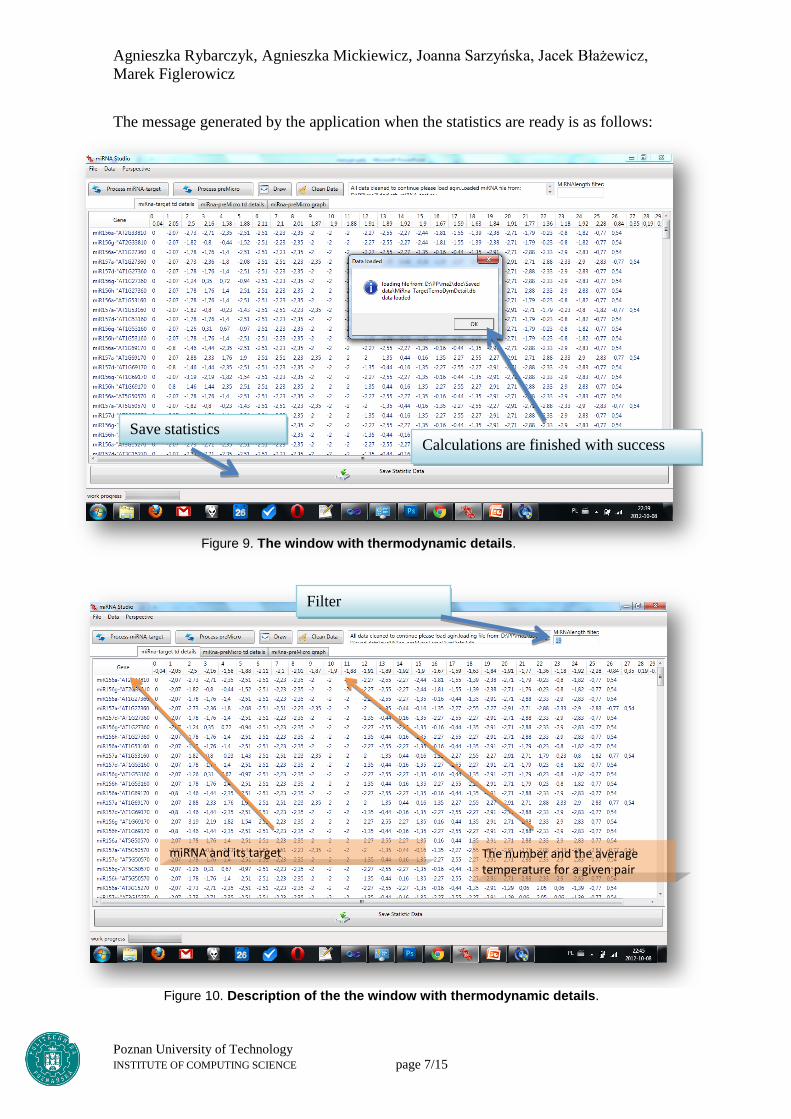
The message generated by the application when the statistics are ready is as follows:
Figure 9. The window with thermodynamic details.
Calculations are finished with success
Otwórz okno edycji
Otwórz okno edycji
Otwórz okno edycji Otwórz okno edycji Otwórz okno edycji
Otwórz okno edycji Otwórz okno edycji
Save statistics
Filter
miRNA and its target The number and the average temperature for a given pair
Figure 10. Description of the the window with thermodynamic details.
Agnieszka Rybarczyk, Agnieszka Mickiewicz, Joanna Sarzyńska, Jacek Błażewicz,
Marek Figlerowicz
Poznan University of Technology
INSTITUTE OF COMPUTING SCIENCE page 8/15
The description of a table with thermodynamic details is presented above.
In the text box named "MiRnaLength filter", which is marked in the above Figure, user
should type the filter value in the format D, D or DD where d is an integer value (int).
This value represents the length of the molecules that will be considered for further
processing.
Eg. if the user introduces 19,20, 21-23 ranges, then the molecules of length
19,20,21,22,23 will be taken into account. The default filtering value is empty, which
means that all molecules are taken into account (no filtering).
Other statistical parameters not visible in the table such as: maximum value, minimum
temperature, next quartiles can be viewed by saving them into a file using the "Save
Statistic Data" button.
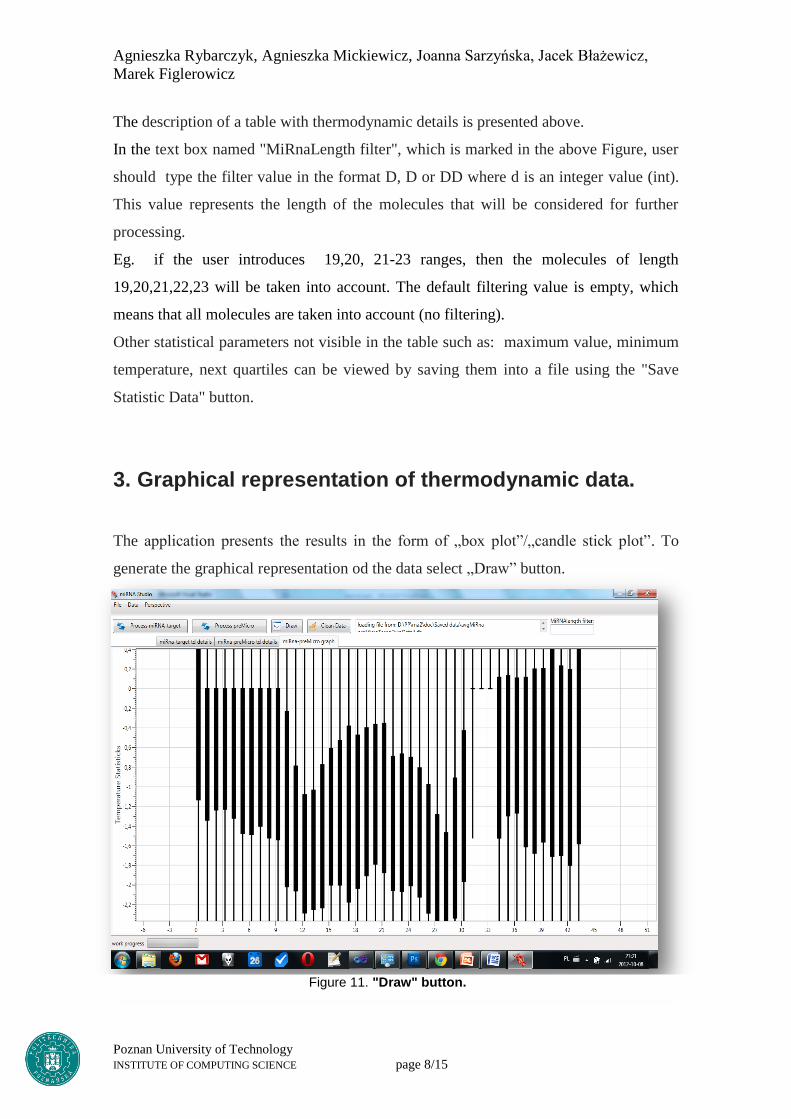
3. Graphical representation of thermodynamic data.
The application presents the results in the form of „box plot”/„candle stick plot”. To
generate the graphical representation od the data select „Draw” button.
Otwórz okno edycji
Otwórz okno edycji Otwórz okno edycji Otwórz okno edycji Otwórz okno edycji
Otwórz okno edycji
Otwórz okno edycji
Figure 11. "Draw" button.
Agnieszka Rybarczyk, Agnieszka Mickiewicz, Joanna Sarzyńska, Jacek Błażewicz,
Marek Figlerowicz
Poznan University of Technology
INSTITUTE OF COMPUTING SCIENCE page 9/15
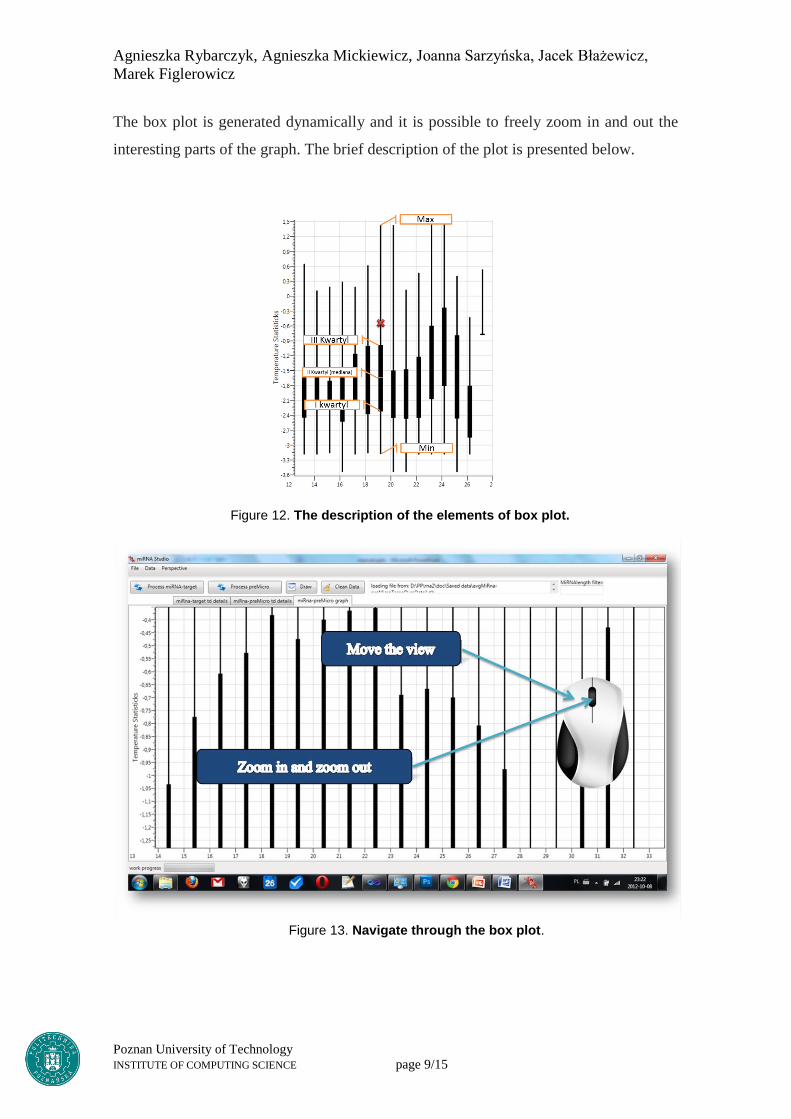
The box plot is generated dynamically and it is possible to freely zoom in and out the
interesting parts of the graph. The brief description of the plot is presented below.
Figure 12. The description of the elements of box plot.
Figure 13. Navigate through the box plot.
Agnieszka Rybarczyk, Agnieszka Mickiewicz, Joanna Sarzyńska, Jacek Błażewicz,
Marek Figlerowicz
Poznan University of Technology
INSTITUTE OF COMPUTING SCIENCE page 10/15
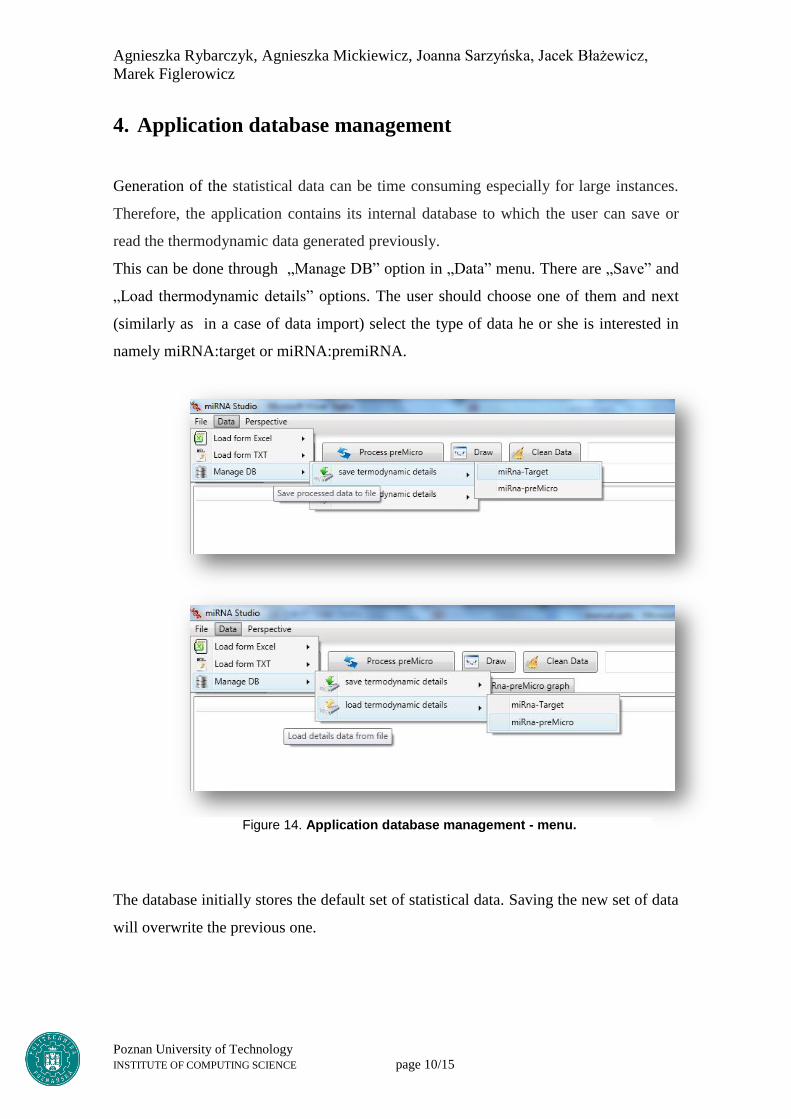
4. Application database management
Generation of the statistical data can be time consuming especially for large instances.
Therefore, the application contains its internal database to which the user can save or
read the thermodynamic data generated previously.
This can be done through „Manage DB” option in „Data” menu. There are „Save” and
„Load thermodynamic details” options. The user should choose one of them and next
(similarly as in a case of data import) select the type of data he or she is interested in
namely miRNA:target or miRNA:premiRNA.
The database initially stores the default set of statistical data. Saving the new set of data
will overwrite the previous one.
Powiększanie/ pomniejsznie
Figure 14. Application database management - menu.
Agnieszka Rybarczyk, Agnieszka Mickiewicz, Joanna Sarzyńska, Jacek Błażewicz,
Marek Figlerowicz
Poznan University of Technology
INSTITUTE OF COMPUTING SCIENCE page 11/15
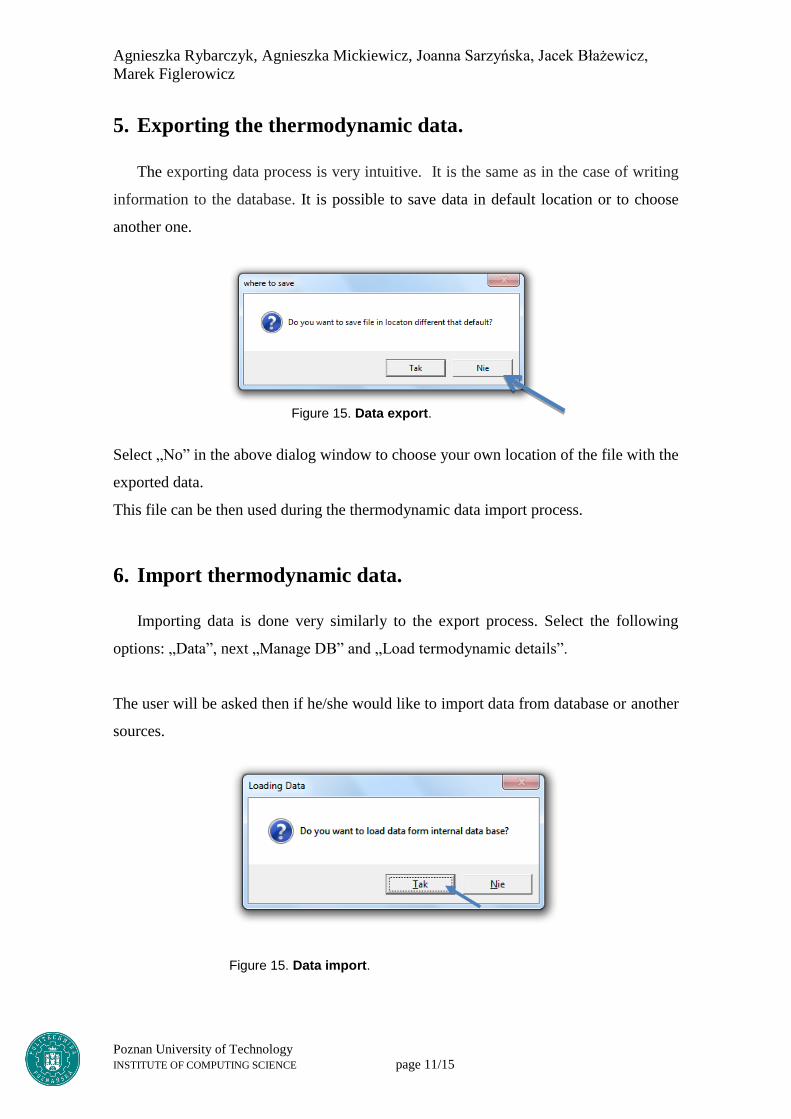
5. Exporting the thermodynamic data.
The exporting data process is very intuitive. It is the same as in the case of writing
information to the database. It is possible to save data in default location or to choose
another one.
Select „No” in the above dialog window to choose your own location of the file with the
exported data.
This file can be then used during the thermodynamic data import process.
6. Import thermodynamic data.
Importing data is done very similarly to the export process. Select the following
options: „Data”, next „Manage DB” and „Load termodynamic details”.
The user will be asked then if he/she would like to import data from database or another
sources.
Figure 15. Data export.
Figure 15. Data import.
Agnieszka Rybarczyk, Agnieszka Mickiewicz, Joanna Sarzyńska, Jacek Błażewicz,
Marek Figlerowicz
Poznan University of Technology
INSTITUTE OF COMPUTING SCIENCE page 12/15
Select „No” in the above dialog window to choose your own location of the file you are
to import.
7. Designing of the artificial micro RNA [MiRNA*].
The design process takes place in the „Design” perspective.
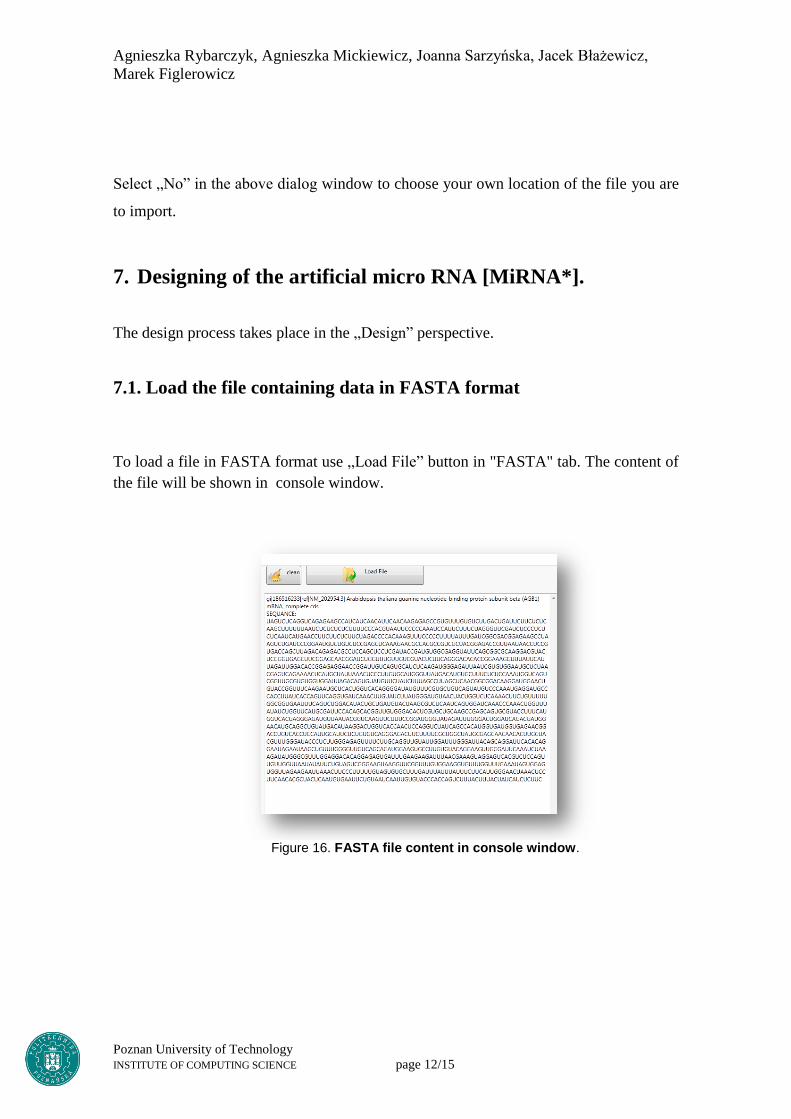
7.1. Load the file containing data in FASTA format
To load a file in FASTA format use „Load File” button in "FASTA" tab. The content of
the file will be shown in console window.
Figure 16. FASTA file content in console window.
Agnieszka Rybarczyk, Agnieszka Mickiewicz, Joanna Sarzyńska, Jacek Błażewicz,
Marek Figlerowicz
Poznan University of Technology
INSTITUTE OF COMPUTING SCIENCE page 13/15
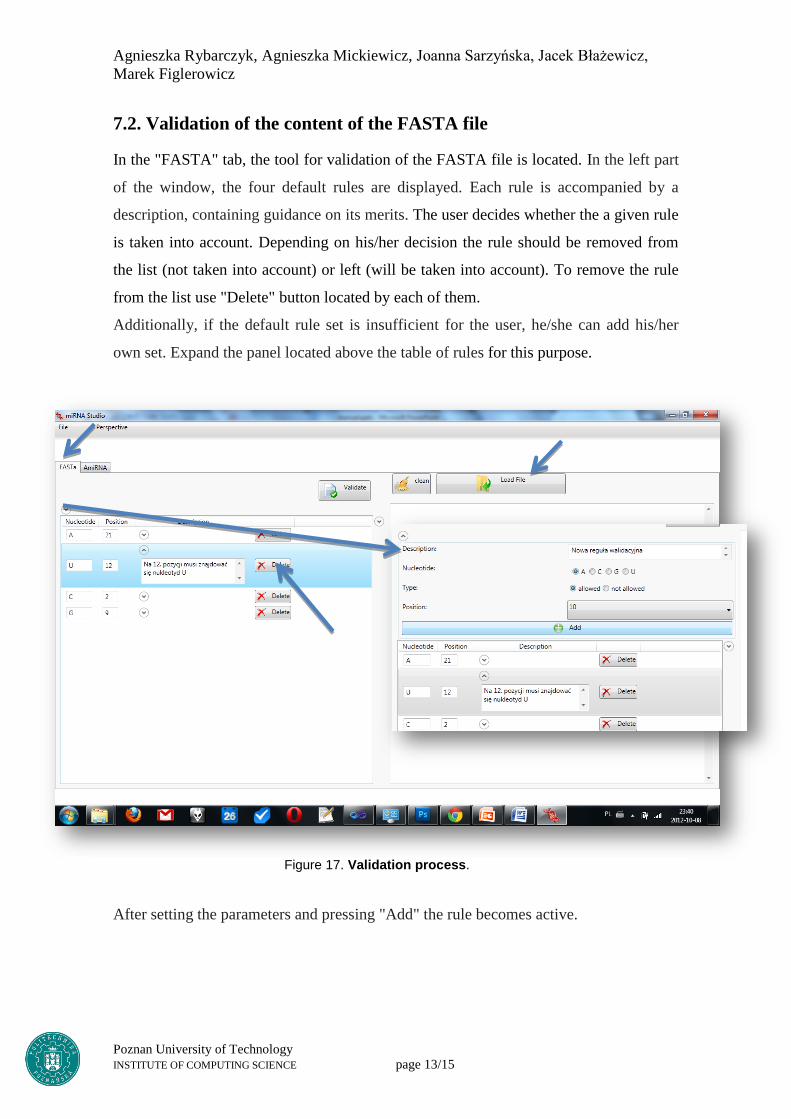
7.2. Validation of the content of the FASTA file
In the "FASTA" tab, the tool for validation of the FASTA file is located. In the left part
of the window, the four default rules are displayed. Each rule is accompanied by a
description, containing guidance on its merits. The user decides whether the a given rule
is taken into account. Depending on his/her decision the rule should be removed from
the list (not taken into account) or left (will be taken into account). To remove the rule
from the list use "Delete" button located by each of them.
Additionally, if the default rule set is insufficient for the user, he/she can add his/her
own set. Expand the panel located above the table of rules for this purpose.
After setting the parameters and pressing "Add" the rule becomes active.
Figure 17. Validation process.
Agnieszka Rybarczyk, Agnieszka Mickiewicz, Joanna Sarzyńska, Jacek Błażewicz,
Marek Figlerowicz
Poznan University of Technology
INSTITUTE OF COMPUTING SCIENCE page 14/15
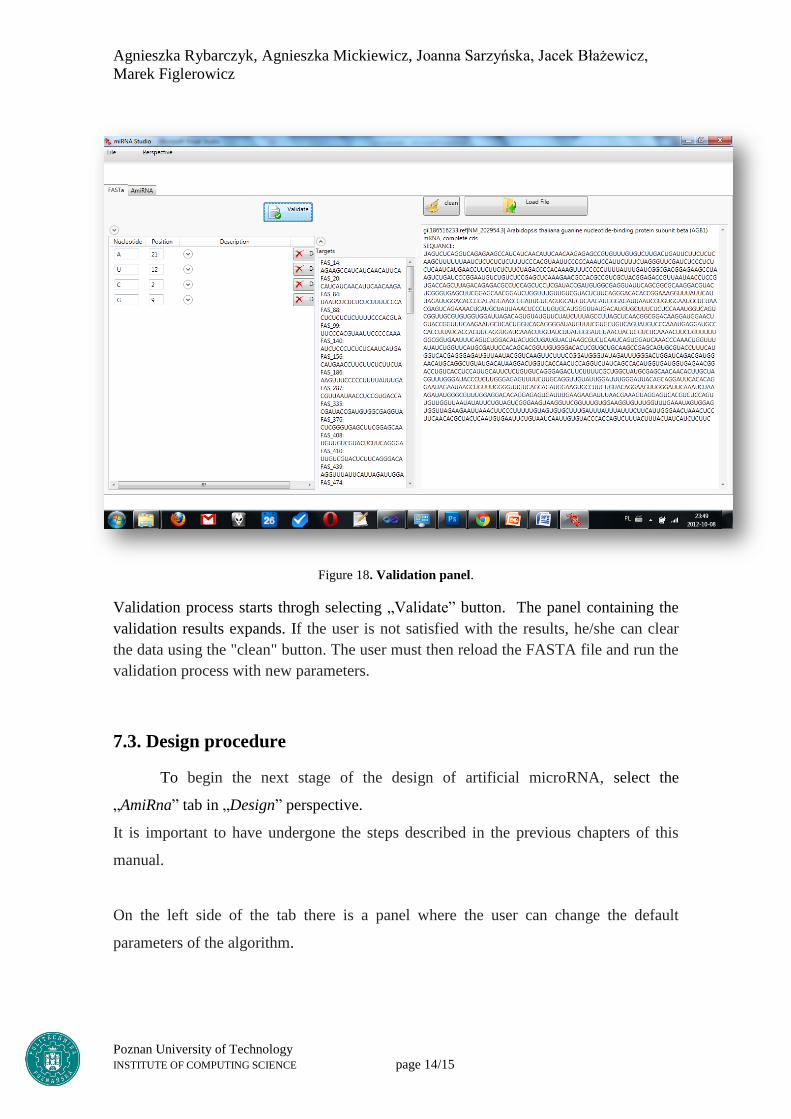
Figure 18. Validation panel.
Validation process starts throgh selecting „Validate” button. The panel containing the
validation results expands. If the user is not satisfied with the results, he/she can clear
the data using the "clean" button. The user must then reload the FASTA file and run the
validation process with new parameters.
7.3. Design procedure
To begin the next stage of the design of artificial microRNA, select the
„AmiRna” tab in „Design” perspective.
It is important to have undergone the steps described in the previous chapters of this
manual.
On the left side of the tab there is a panel where the user can change the default
parameters of the algorithm.
Agnieszka Rybarczyk, Agnieszka Mickiewicz, Joanna Sarzyńska, Jacek Błażewicz,
Marek Figlerowicz
Poznan University of Technology
INSTITUTE OF COMPUTING SCIENCE page 15/15
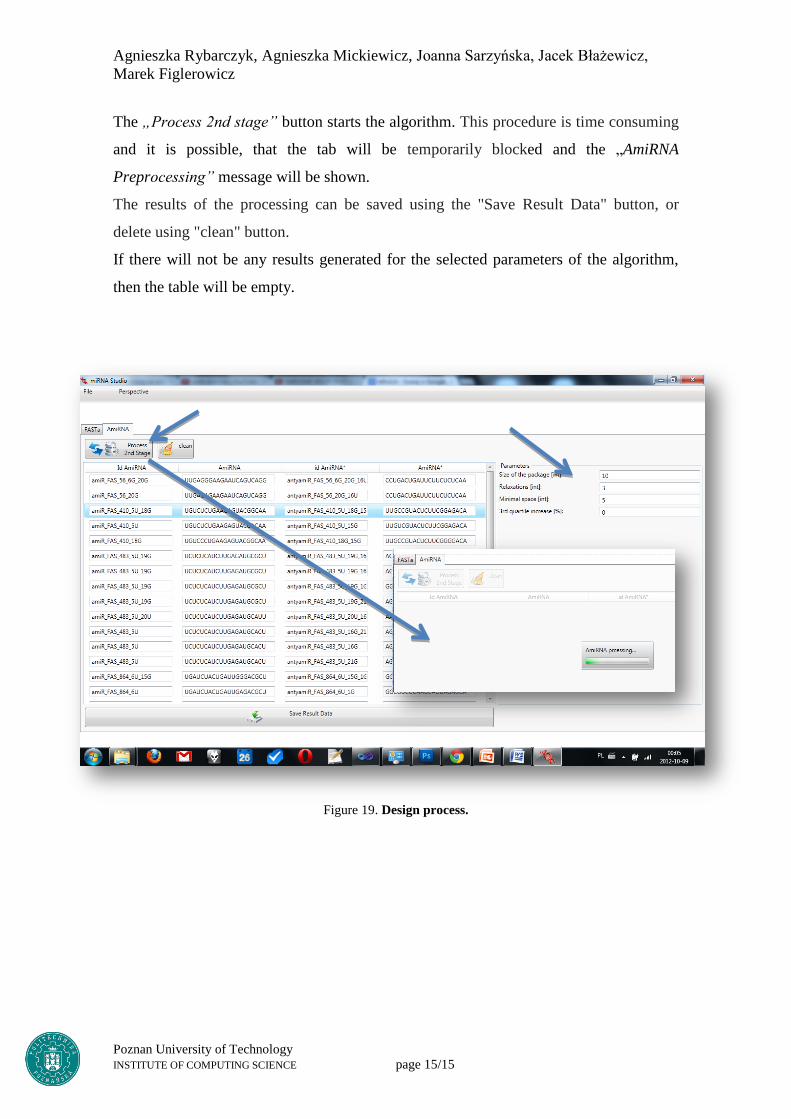
The „Process 2nd stage” button starts the algorithm. This procedure is time consuming
and it is possible, that the tab will be temporarily blocked and the „AmiRNA
Preprocessing” message will be shown.
The results of the processing can be saved using the "Save Result Data" button, or
delete using "clean" button.
If there will not be any results generated for the selected parameters of the algorithm,
then the table will be empty.
Figure 19. Design process.