Embed Size (px)
Citation preview
Aquaculture, employment, poverty, food security and well-being in Bangladesh: A comparative study
Pub
lic D
iscl
osur
e A
utho
rized
Pub
lic D
iscl
osur
e A
utho
rized
Pub
lic D
iscl
osur
e A
utho
rized
Pub
lic D
iscl
osur
e A
utho
rized
Pub
lic D
iscl
osur
e A
utho
rized
Pub
lic D
iscl
osur
e A
utho
rized
Pub
lic D
iscl
osur
e A
utho
rized
Pub
lic D
iscl
osur
e A
utho
rized
2
AuthorsBen Belton, Nasib Ahmed and Khondker Murshed-e-Jahan
CitationThis publication should be cited as: Belton B, Ahmed N and Murshed-e-Jahan K. 2014. Aquaculture, employment, poverty, food security and well-being in Bangladesh: A comparative study. Penang, Malaysia: CGIAR Research Program on Aquatic Agricultural Systems. Program Report: AAS-2014-39.
Acknowledgments The research leading to these results has received funding from the European Union Seventh Framework Programme (FP7/2007-2013) under grant agreement n° 289760. This review is a contribution to the CGIAR research programs on Aquatic Agricultural Systems and Livestock and Fish. Its publication has been made possible by the support of many projects, programs and people. We gratefully acknowledge financial contributions from the United States Agency for International Development (USAID) Feed the Future Cereal Systems Initiative for South Asia project (CSISA-BD), the CGIAR Research Program on Aquatic Agricultural Systems (AAS), the European Union-funded Aquaculture for Food Security and Nutrition project (AFSPAN), and the USAID Feed the Future Aquaculture for Income and Nutrition project (AIN). We thank William Collis, former director of the WorldFish Bangladesh office, for providing the initial impetus and support to begin this work, and Mokarrom Hossain (Project Leader CSISA-BD), Kevin Kamp (Country Leader AAS), Manjurul Karim (Deputy Chief of Party AIN) and Erik Keus (Chief of Party AIN) for facilitating the provision of financial support at various stages during the research. We also acknowledge the hard work and dedication of the research assistants who implemented the household survey; in particular, Biplob Basak, Sidhu Basak, Himangshu Biswas, Mojibar Rahman and Shajahan Siraj, as well as Imke van Assledonk, whose Master of Science dissertation research was conducted as part of this study. Several people kindly reviewed draft versions of the manuscript. We thank Kazi Ali Toufique, Peter Edwards, Derek Johnson, Paula Kantor, Shakuntala Thilsted and Simon Bush for their respective contributions. Finally, we are very grateful to the inhabitants of all the villages surveyed for taking the time to engage with us.
AQUACULTURE, EMPLOYMENT, POVERTY, FOOD SECURITY AND WELL-BEING IN BANGLADESH: A COMPARATIVE STUDY
AQUACULTURE, EMPLOYM
ENT, POVERTY, FOOD SECURITY AND WELL-BEING IN BANGLADESH: A COM
PARATIVE STUDY
3
CONTENTSCONTENTS Executive summary 5
Introduction: Conceptualizing aquaculture, poverty and food security linkages in Bangladesh 7
Methods 9
Research questions 9
The “Q squared” approach 9
Research design 9
Study villages 12
Bawalia (smallholder-dominated pangasius aquaculture) 12
Medila (large-scale pangasius aquaculture) 13
Bilpabla (integrated freshwater gher farming) 15
Salabunia (extensive tiger shrimp culture) 16
Noaga (agriculture and homestead carp culture) 18
Hawli (agriculture and homestead carp culture) 20
Analysis 21
Question 1: To what extent do the resource-poor participate in aquaculture? 21
Gini coefficient of expenditure 24
Summary: Participation in aquaculture by the resource-poor 24
Question 2: What is the relationship between participation in aquaculture and landownership and access? 25
Landownership and access in Bawalia and Medila 26
Landownership and access in Bilpabla and Salabunia 28
Landownership and access in Noaga and Hawli 29
Gini coefficient of land 29
Summary: Links between participation in aquaculture, landownership and access 31
Question 3: What is the extent and nature of employment associated with different types of aquaculture? 32
Occupational structure 32
Use of hired labor 34
Employment duration and intensity 36
Wages 38
Summary: The nature and extent of employment associated with aquaculture 39
Question 4: How does aquaculture affect local food security? 39
Food production 39
Food insecurity 42
Summary: Aquaculture’s effects on local food security 44
Question 5: What are the effects of aquaculture development on well-being? 45
Food production and well-being 46
4
CONTENTS
Land use and well-being 48
Labor and well-being 50
Gender and class relations 52
Summary: Aquaculture development and well-being 59
Conclusion: Interpreting the impacts of aquaculture development in Bangladesh 60
Key findings 60
Conclusions 61
Policy implications 61
Notes 63
References 65
Annex 1: Key definitions 69
5
EXECUTIVE SUMMARY This study addresses five research questions about the nature of aquaculture development in Bangladesh. The questions are designed to test central narratives from the literature on aquaculture, poverty and food security, and to broaden the scope of debate beyond them. The questions are as follows:
• Towhatextentdotheresource-poorparticipateinaquaculture? • Whatistherelationshipbetweenparticipationinaquacultureandlandownershipandaccess? • Whatisthenatureandextentofemploymentassociatedwithdifferenttypesofaquaculture? • Howdoesaquacultureaffectlocalfoodsecurity? • Whataretheeffectsofaquaculturedevelopmentonwell-being?
An integrated quantitative-qualitative survey was conducted in six communities with contrasting patterns of aquaculture development. Data was collected from a representative cross section of village residents to gain insights into the impacts of aquaculture development at the local level, using a structured household survey (578 respondents) and in-depth interviews (165 informants). This approach generated many findings that contradict or add nuance to conventional understandings of aquaculture development. The most important of these are summarized in terms of poverty, landownership and tenure, employment, food security, well-being, and policy implications.
PovertyThe wealthier a household, the higher the likelihood of its members practicing aquaculture as producers. This finding applied to all forms of aquaculture. Nevertheless, participation of resource-poor households with limited landholdings in some forms of commercial aquaculture was much higher than anticipated. In fact, in certain villages, more small landowners and resource-poor farmers practiced commercial aquaculture than semisubsistence forms of aquaculture.
Landownership and accessShifts from agriculture to commercial aquaculture were accompanied by rapid and pervasive changes in land use and land tenure arrangements. Although the rise of commercial aquaculture was accompanied by a decline in the availability of land for paddy cultivation, sharecropping arrangements were replaced by dynamic rental markets that often facilitated access of small and medium producers to land.
EmploymentAlmost all expansion of commercial aquaculture took place on land formerly used for paddy cultivation, resulting in an inverse relationship between employment in aquaculture and agriculture. Nevertheless, with the exception of shrimp farming, smallholder-dominated commercial aquaculture created more employment opportunities than it destroyed by smoothing seasonal demand for labor, often with employment conditions comparable or preferable to those in agriculture. In contrast, noncommercial aquaculture created very limited employment opportunities of any kind.
Food securityContrary to expectations, commercially oriented smallholder aquaculture producers consumed larger quantities of fish from their own farms than households operating subsistence-oriented fish production systems. On average, individuals from households practicing aquaculture consumed (and produced) more rice, fruits, nonleafy vegetables and fish per capita than those that did not.
EXECUTIVE SUMMARY
6
EXECUTIVE SUMMARY
Well-beingThe development of smallholder-dominated forms of commercial aquaculture was accompanied by increasing levels of women’s engagement in related work. Women often lost access to and/or control over certain productive resources as part of this development process, but gained access to or control of others, resulting in ambiguous well-being outcomes.
In all cases studied, the emergence of commercial forms of aquaculture was accompanied by the “commodification of subsistence,” a process by which producers become more deeply integrated into markets, and more dependent upon them for their means of survival. Nonmarket access to resources, particularly land and food, declined, with the result that some households became more vulnerable and increasingly dependent on selling their own labor. However, levels of material well-being often increased markedly for resource-poor households able to enter commercial aquaculture as producers.
Policy implicationsSmallholder-dominated commercial aquaculture development resulted in diverse social and economic transformations and a complex mix of well-being outcomes. Semisubsistence aquaculture created limited economic and social spillover effects. The risk of negative well-being outcomes resulting from development dominated by large-scale capitalist operations was high. Thus, forms of commercial aquaculture into which entry by small landowners and the resource-poor is possible seem to offer the greatest potential to leverage positive development outcomes, but also engender risks.
In light of these findings, policies and interventions promoting aquaculture in Bangladesh should focus on supporting the development of smallholder-dominated aquaculture clusters, while fostering stronger local governance to regulate outcomes likely to impact well-being negatively. The first of these conditions may be met through primary investments in infrastructure (e.g. roads, electricity and marketplaces) that support cluster formation, along with secondary investments in well-regulated markets for production inputs and the provision of specially tailored services (e.g. credit and extension). The second condition is more challenging, requiring stronger local institutions with the capacity to proactively regulate aquaculture at the community level, to control development with exclusionary outcomes, particularly with respect to land and water, and to protect common-property resources that provide a buffer for the poorest against negative effects of the commodification of subsistence.
7
INTRODUCTION: CONCEPTUALIZING AQUACULTURE, POVERTY AND FOOD SECURITY LINKAGES IN BANGLADESH
Aquaculture is widely considered to have the potential to reduce poverty and enhance food security (Edwards 1999; Subasinghe et al. 2010). Nowhere is this more evident than Bangladesh, where for more than 30 years numerous donor- and government-funded initiatives have invested in aquaculture towards achieving these outcomes.
Historically, aquaculture in Bangladesh was a low-intensity, semisubsistence activity, and most development interventions promoted “small-scale” forms of aquaculture in the expectation that adoption of improved management practices by low-income households would increase production of fish for sale and home consumption, thereby reducing poverty and food insecurity (Belton and Little 2011). A number of studies have assessed the impact of such projects in Bangladesh, identifying broadly positive although often modest effects on household income, farm output and food security (Hallman et al. 2003; Thompson et al. 2006; Jahan et al. 2010; Rand and Tarp 2010). However, Lewis (1997) and Belton et al. (2012) have both argued that extremely high levels of landlessness in Bangladesh limit the ability of the most resource-poor households to participate in small-scale aquaculture as producers.
Commercially oriented forms of semi-intensive and intensive aquaculture have emerged in Bangladesh over the last 15 years (Belton and Azad 2012). The high capital requirements of such forms of production have usually been thought to limit the potential for direct involvement by the resource-poor. However, research suggests that the development of commercial aquaculture has benefited landless laborers by creating employment opportunities, particularly involving the provision of supporting goods and services in associated value chains (Belton et al. 2012). Toufique and Gregory (2008) have also reported that the development of commercial aquaculture resulted in gains for low- and middle-income households through the creation of new employment opportunities, although they found that most direct benefits were reaped by better-off landowners. There is also evidence that commercial forms of aquaculture have improved access to fish among poor consumers in Bangladesh by increasing supply and reducing relative prices (Toufique and Belton 2014).
Observations such as these have given rise to debate over whether it is more appropriate to target development investments towards the types of aquaculture that yield mainly direct income and consumption benefits for owner-operators, or whether efforts should be directed toward promoting commercial “quasi-capitalist” or “entrepreneurial” forms of aquaculture with indirect employment and consumption effects (Belton and Azad 2012).
Rapid growth in export-led production of high-value tiger shrimp (Penaeus monodon) and giant freshwater prawn (Macrobrachium rosenbergii) has taken place in coastal and inland areas of southwest Bangladesh since the 1980s. Although this production has generated substantial on- and off-farm employment (USAID 2006), there exists considerable debate over whether production of these two high-value export commodities has occurred at the expense of local food security, particularly in the case of shrimp, production of which has often been associated with salinization of agricultural land and land grabbing (Rahman et al. 2006).
The studies mentioned in the preceding paragraphs have been largely gender blind with respect to exactly who gains or loses in terms of poverty, employment and food security, irrespective of the type of aquaculture assessed. This study was designed to address some of these ambiguities and shortcomings, and to contribute to a deeper understanding of the relationships between different forms of aquaculture, poverty and food security in Bangladesh. Arthur et al. (2013) have argued that many studies attempting to draw links between aquaculture and poverty have
INTRODUCTION: CONCEPTUALIZING AQUACULTURE, POVERTY AND FOOD SECURITY LINKAGES IN BANGLADESH
8
INTRODUCTION: CONCEPTUALIZING AQUACULTURE, POVERTY AND FOOD SECURITY LINKAGES IN BANGLADESH
been compromised by lack of methodological rigor, a reliance on unrepresentative case studies, or limited geographical coverage. Although this study is also case based, attempts were made to overcome some of these criticisms by adopting a well-designed, methodologically robust approach with strong conceptual and theoretical underpinnings.
Six villages where different types of aquaculture are practiced were selected for the study. Surveys captured the experiences of a representative cross section of households in these villages, including those not involved in aquaculture in any way, in an attempt to produce a detailed and comprehensive picture of the impacts of aquaculture within each community. Thus, this study represents the most complete attempt to date to analyze the multidimensional relationships among aquaculture development, poverty and food security in Bangladesh. The study also attempts to broaden analysis beyond these conventional indicators to address subjective and relational dimensions of well-being. (See Annex 1 for more details.) The rationale for and details of this approach are elaborated in the following chapter.
9
METHODS
METHODS
Research questions Some of the possible relationships among aquaculture, poverty, food security and well-being suggested by the introductory discussion can be framed in the form of five questions which also provide the analytical framework for this study:
1. To what extent do the resource-poor participate in aquaculture?
2. What is the relationship between participation in aquaculture and landownership and access?
3. What is the nature and extent of employment associated with different types of aquaculture?
4. How does aquaculture affect local food security?
5. What are the effects of aquaculture development on well-being?
These guiding questions were posed with reference to the impacts of aquaculture as experienced by households living or working in six surveyed communities. No attempt was made to assess relationships between aquaculture and poverty operating beyond the immediate surroundings of each village. The key concepts that underpin these research questions (poverty, land, employment, food security and well-being) are discussed in detail in Annex 1.
The “Q squared” approachMost studies addressing relationships between aquaculture and poverty have adopted methods that are either primarily quantitative or primarily qualitative. Project evaluations conducted in Bangladesh have focused largely on quantifying direct impacts to participating households through structured household surveys (Thompson et al. 2006; Jahan et al. 2010; Rand and Tarp 2010). In contrast, research assessing the effects of employment associated with commercial aquaculture has relied on qualitative case studies (Toufique and Gregory 2008; Belton et al. 2012).
Both approaches have strengths and weaknesses. Unlike qualitative research, primarily quantitative studies possess little explanatory power with respect to the processes by which conditions observed came to occur. They also struggle to adequately represent complex social realities. Conversely, unlike well-designed quantitative research, the findings of primarily qualitative studies are not statistically representative, making it difficult to make generalizations based on the results.
As a result, poverty research increasingly employs mixed methods, often referred to as “Q squared” or “Q2” approaches (Shaffer et al. 2008). However, research in which qualitative and quantitative fieldwork and analysis are planned and undertaken simultaneously remains less common than “putting together” studies combining qualitative and quantitative data on an unplanned or opportunistic basis (Davis and Baulch 2011). In view of these insights, the present study collected qualitative data through semi- and unstructured interviews and focus group discussions nested inside a simultaneously designed and implemented structured household survey.
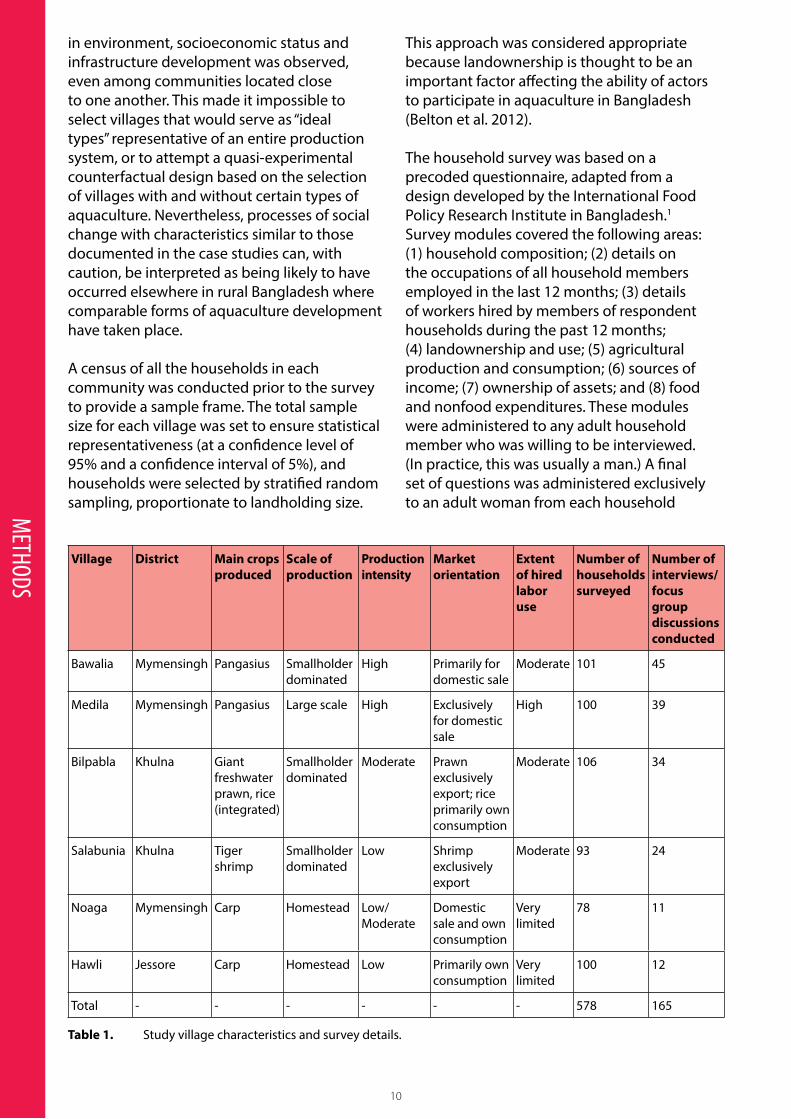
Research designCommercial aquaculture development in Bangladesh usually occurs in a highly geographically clustered manner. Communities with high (or low) concentrations of particular types of aquaculture were therefore chosen as the primary unit of analysis. Six communities from three districts were selected to facilitate comparison between aquaculture systems with a range of contrasting socio-technical characteristics. The most important characteristics for comparison were the species cultured, scale of production, production intensity, market orientation and dependence on hired labor (Table 1).
Rigg and Vandergeest (2012) note that there is no such thing as a “typical village.” This rapidly became apparent during the research design phase, when a high degree of heterogeneity
10
METHODS
in environment, socioeconomic status and infrastructure development was observed, even among communities located close to one another. This made it impossible to select villages that would serve as “ideal types” representative of an entire production system, or to attempt a quasi-experimental counterfactual design based on the selection of villages with and without certain types of aquaculture. Nevertheless, processes of social change with characteristics similar to those documented in the case studies can, with caution, be interpreted as being likely to have occurred elsewhere in rural Bangladesh where comparable forms of aquaculture development have taken place.
A census of all the households in each community was conducted prior to the survey to provide a sample frame. The total sample size for each village was set to ensure statistical representativeness (at a confidence level of 95% and a confidence interval of 5%), and households were selected by stratified random sampling, proportionate to landholding size.
This approach was considered appropriate because landownership is thought to be an important factor affecting the ability of actors to participate in aquaculture in Bangladesh (Belton et al. 2012).
The household survey was based on a precoded questionnaire, adapted from a design developed by the International Food Policy Research Institute in Bangladesh.1 Survey modules covered the following areas: (1) household composition; (2) details on the occupations of all household members employed in the last 12 months; (3) details of workers hired by members of respondent households during the past 12 months; (4) landownership and use; (5) agricultural production and consumption; (6) sources of income; (7) ownership of assets; and (8) food and nonfood expenditures. These modules were administered to any adult household member who was willing to be interviewed. (In practice, this was usually a man.) A final set of questions was administered exclusively to an adult woman from each household
Village District Main crops produced
Scale of production
Production intensity
Market orientation
Extent of hired labor use
Number of households surveyed
Number of interviews/focus group discussions conducted
Bawalia Mymensingh Pangasius Smallholder dominated
High Primarily for domestic sale
Moderate 101 45
Medila Mymensingh Pangasius Large scale High Exclusively for domestic sale
High 100 39
Bilpabla Khulna Giant freshwater prawn, rice (integrated)
Smallholder dominated
Moderate Prawn exclusively export; rice primarily own consumption
Moderate 106 34
Salabunia Khulna Tiger shrimp
Smallholder dominated
Low Shrimp exclusively export
Moderate 93 24
Noaga Mymensingh Carp Homestead Low/Moderate
Domestic sale and own consumption
Very limited
78 11
Hawli Jessore Carp Homestead Low Primarily own consumption
Very limited
100 12
Total - - - - - - 578 165
Table 1. Study village characteristics and survey details.
11
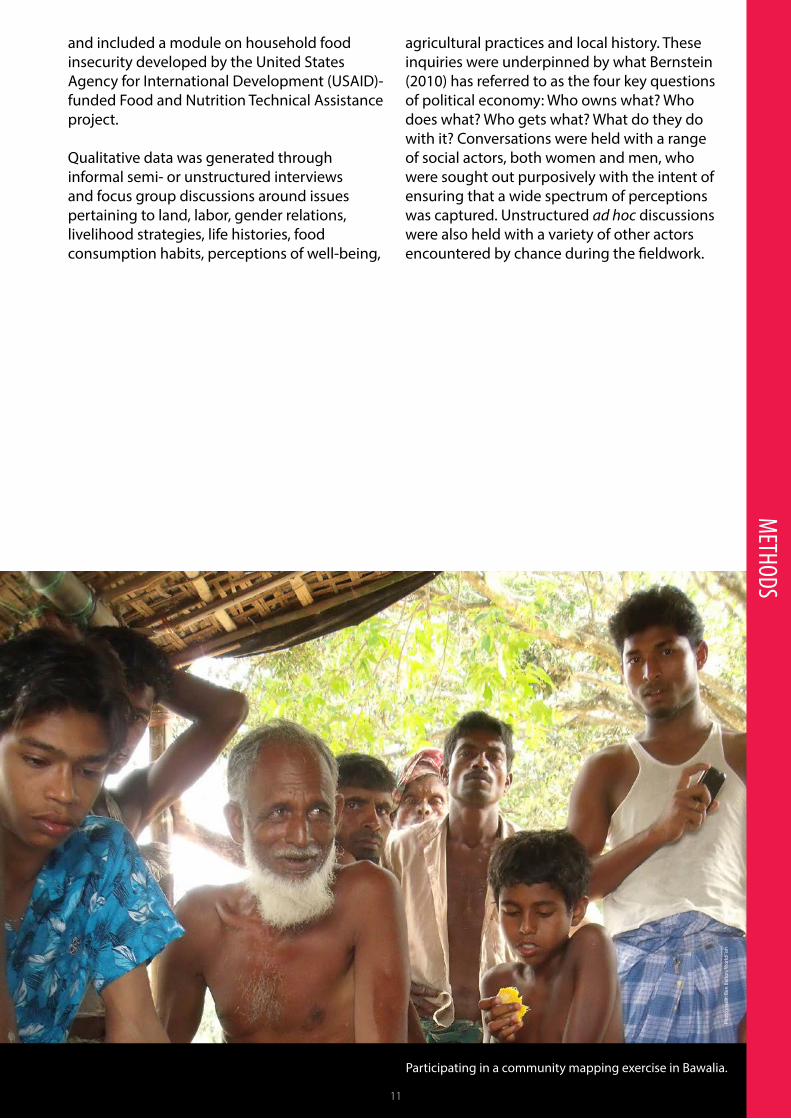
Participating in a community mapping exercise in Bawalia.
Phot
o cr
edit:
Ben
Bel
ton/
Wor
ldFi
sh
METHODS
and included a module on household food insecurity developed by the United States Agency for International Development (USAID)-funded Food and Nutrition Technical Assistance project.
Qualitative data was generated through informal semi- or unstructured interviews and focus group discussions around issues pertaining to land, labor, gender relations, livelihood strategies, life histories, food consumption habits, perceptions of well-being,
11
agricultural practices and local history. These inquiries were underpinned by what Bernstein (2010) has referred to as the four key questions of political economy: Who owns what? Who does what? Who gets what? What do they do with it? Conversations were held with a range of social actors, both women and men, who were sought out purposively with the intent of ensuring that a wide spectrum of perceptions was captured. Unstructured ad hoc discussions were also held with a variety of other actors encountered by chance during the fieldwork.
12
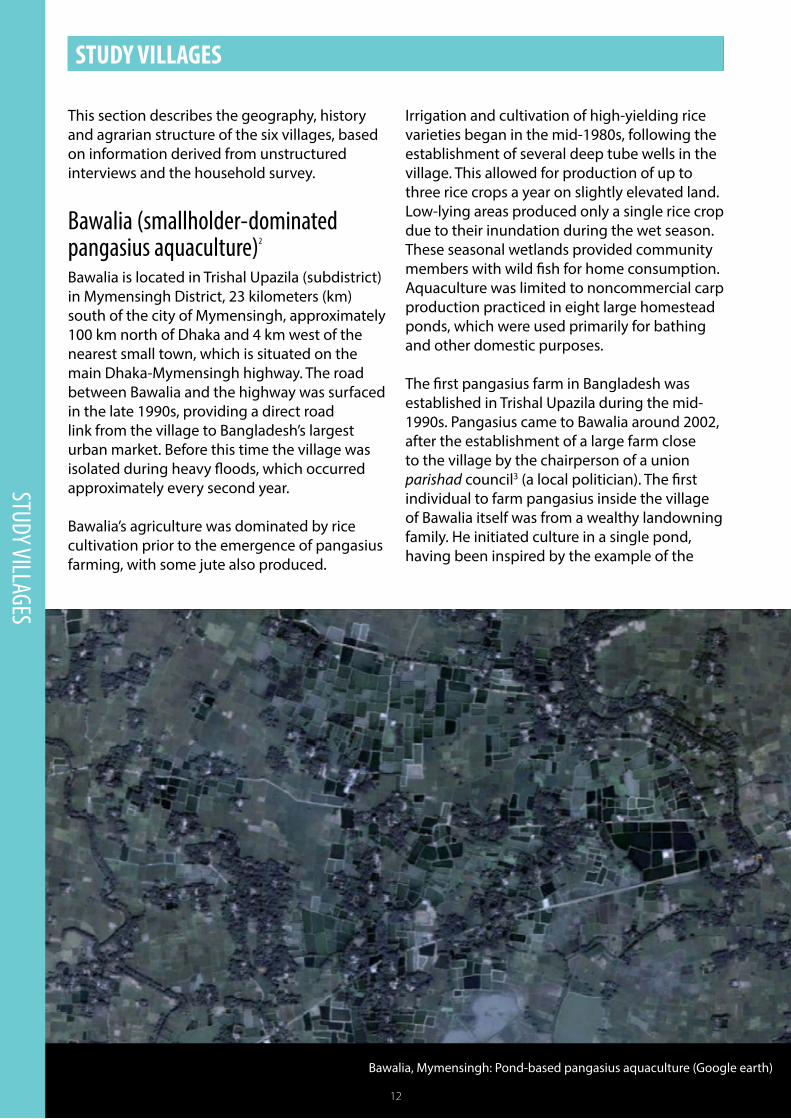
Bawalia, Mymensingh: Pond-based pangasius aquaculture (Google earth)
STUDY VILLAGES
STUDY VILLAGES
This section describes the geography, history and agrarian structure of the six villages, based on information derived from unstructured interviews and the household survey.
Bawalia (smallholder-dominated pangasius aquaculture)2 Bawalia is located in Trishal Upazila (subdistrict) in Mymensingh District, 23 kilometers (km) south of the city of Mymensingh, approximately 100 km north of Dhaka and 4 km west of the nearest small town, which is situated on the main Dhaka-Mymensingh highway. The road between Bawalia and the highway was surfaced in the late 1990s, providing a direct road link from the village to Bangladesh’s largest urban market. Before this time the village was isolated during heavy floods, which occurred approximately every second year.
Bawalia’s agriculture was dominated by rice cultivation prior to the emergence of pangasius farming, with some jute also produced.
Irrigation and cultivation of high-yielding rice varieties began in the mid-1980s, following the establishment of several deep tube wells in the village. This allowed for production of up to three rice crops a year on slightly elevated land. Low-lying areas produced only a single rice crop due to their inundation during the wet season. These seasonal wetlands provided community members with wild fish for home consumption. Aquaculture was limited to noncommercial carp production practiced in eight large homestead ponds, which were used primarily for bathing and other domestic purposes.
The first pangasius farm in Bangladesh was established in Trishal Upazila during the mid-1990s. Pangasius came to Bawalia around 2002, after the establishment of a large farm close to the village by the chairperson of a union parishad council3 (a local politician). The first individual to farm pangasius inside the village of Bawalia itself was from a wealthy landowning family. He initiated culture in a single pond, having been inspired by the example of the
12
13
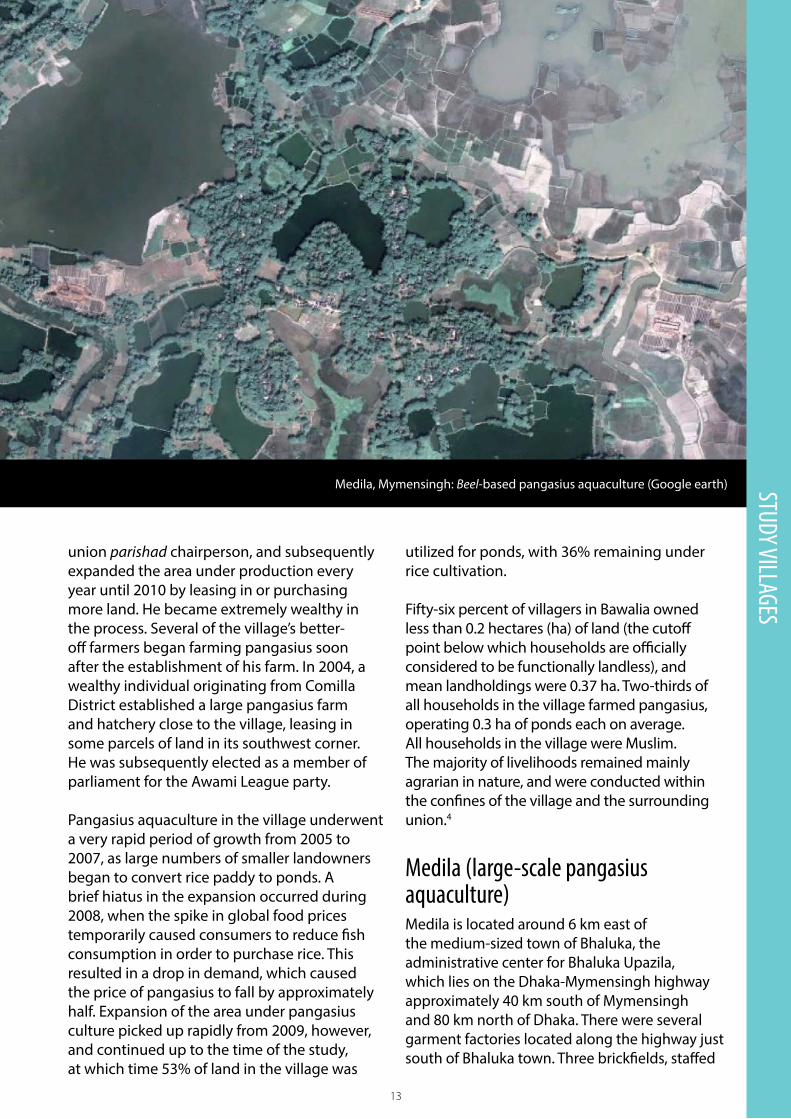
Medila, Mymensingh: Beel-based pangasius aquaculture (Google earth) STUDY VILLAGES
union parishad chairperson, and subsequently expanded the area under production every year until 2010 by leasing in or purchasing more land. He became extremely wealthy in the process. Several of the village’s better-off farmers began farming pangasius soon after the establishment of his farm. In 2004, a wealthy individual originating from Comilla District established a large pangasius farm and hatchery close to the village, leasing in some parcels of land in its southwest corner. He was subsequently elected as a member of parliament for the Awami League party.
Pangasius aquaculture in the village underwent a very rapid period of growth from 2005 to 2007, as large numbers of smaller landowners began to convert rice paddy to ponds. A brief hiatus in the expansion occurred during 2008, when the spike in global food prices temporarily caused consumers to reduce fish consumption in order to purchase rice. This resulted in a drop in demand, which caused the price of pangasius to fall by approximately half. Expansion of the area under pangasius culture picked up rapidly from 2009, however, and continued up to the time of the study, at which time 53% of land in the village was
utilized for ponds, with 36% remaining under rice cultivation.
Fifty-six percent of villagers in Bawalia owned less than 0.2 hectares (ha) of land (the cutoff point below which households are officially considered to be functionally landless), and mean landholdings were 0.37 ha. Two-thirds of all households in the village farmed pangasius, operating 0.3 ha of ponds each on average. All households in the village were Muslim. The majority of livelihoods remained mainly agrarian in nature, and were conducted within the confines of the village and the surrounding union.4
Medila (large-scale pangasius aquaculture)Medila is located around 6 km east of the medium-sized town of Bhaluka, the administrative center for Bhaluka Upazila, which lies on the Dhaka-Mymensingh highway approximately 40 km south of Mymensingh and 80 km north of Dhaka. There were several garment factories located along the highway just south of Bhaluka town. Three brickfields, staffed
14
STUDY VILLAGES
largely by seasonal migrant workers from other districts, were located within the boundaries of the village. Medila has been connected to Bhaluka by a surfaced road since the early 1990s.
The village’s geography was significantly different than that of Bawalia. It was bounded to the east by a large permanent wetland (haor), which was connected to a nearby river. Numerous beels (low-lying areas that flood for several months during the rainy season), ranging from approximately 2 ha to 35 ha in size, were scattered about the village. Houses were located on the higher ground found between them. In the past, the beels and haor became interconnected during the wet season, but at the time of the study this no longer happened, as most beels have been enclosed with high earthen dikes to make them suitable for fish culture. Paddy cultivation was the main type of agriculture in Medila and was based mainly on an irrigated dry season (boro) crop, planted in the haor and the one remaining “open” beel after floodwaters receded.
Water bodies in the village once supported a highly productive subsistence capture fishery and a small population of professional fishers, but catches have been in gradual decline since the construction of flood control sluices upstream around 25 years ago. This enabled increases in boro production by protecting the crop from early flooding, but inhibited the lateral breeding migrations of fish. Pollution from garment factories upstream and the enclosure of most of the beels in the village to facilitate fish culture have also contributed to declining capture fisheries productivity and the exclusion of fishers from former fishing grounds.
Fish cultivation in beels began during the mid-1990s, when a group of 95 individuals owning land in the village’s largest beel began to stock it with carp for a 6-month period during the rainy season. No feed was used, and most of the fish produced was for home consumption. In 1996, a smaller group of 35 landowners leased in the land and intensified fish production to produce a marketable surplus. Collectively managed seasonal carp culture began in a number of other beels in the village at this time, and several beels were leased out to individual operators. Landowners retained the right to produce paddy during the dry season under these arrangements.
In 2005, a fish feed manufacturing company leased in a beel that had previously been used for carp culture during the rainy season, and began to farm pangasius on a 12-month production cycle. From this point on, all but two of the beels in the village were brought under year-round pangasius culture, which yielded higher returns than the less intensively managed carp culture. Pangasius beels were usually managed by a single operator—in most cases a wealthy, politically connected businessperson from outside the village. These included the mayor of Bhaluka, a union parishad chairperson, and two current or former upazila parishad council members. Approximately 18 beels or subdivided portions of beel were farmed in this way at the time of the survey.
Few villagers have been able to enter into pangasius aquaculture in Medila, the costs of operating a farm of several hectares proving highly prohibitive. In addition, the deep water table in the area and the severity of flooding during the rainy season made it difficult to retain water in ponds year round. This made high dikes, with high construction costs, a necessity. As a result, all the larger beels in the village were operated by outside investors. The majority of residents of Medila who have entered aquaculture have done so by establishing seasonal nurseries, which supply fingerlings to beel operators. The first of these was founded in the late 1990s. At the time of the study, around 10 families operated nurseries in Medila.
All households surveyed in Medila were Muslim, but a small number of Hindus, including several fishers, lived close to the southern periphery of the village. Average landholdings were similar to those in Bawalia, at 0.33 ha, but levels of functional landlessness were slightly higher (60%). All but two of the 14 beels falling within the boundaries of the village were being used for pangasius culture, accounting for approximately 20% of the village’s land. Despite this, only 4% of the households surveyed practiced aquaculture of any kind, underlining the fact that large-scale pangasius culture was mainly the domain of wealthy absentee investors.
Agrarian livelihoods predominated in terms of numbers of individuals employed, but the village was well connected to the world
15
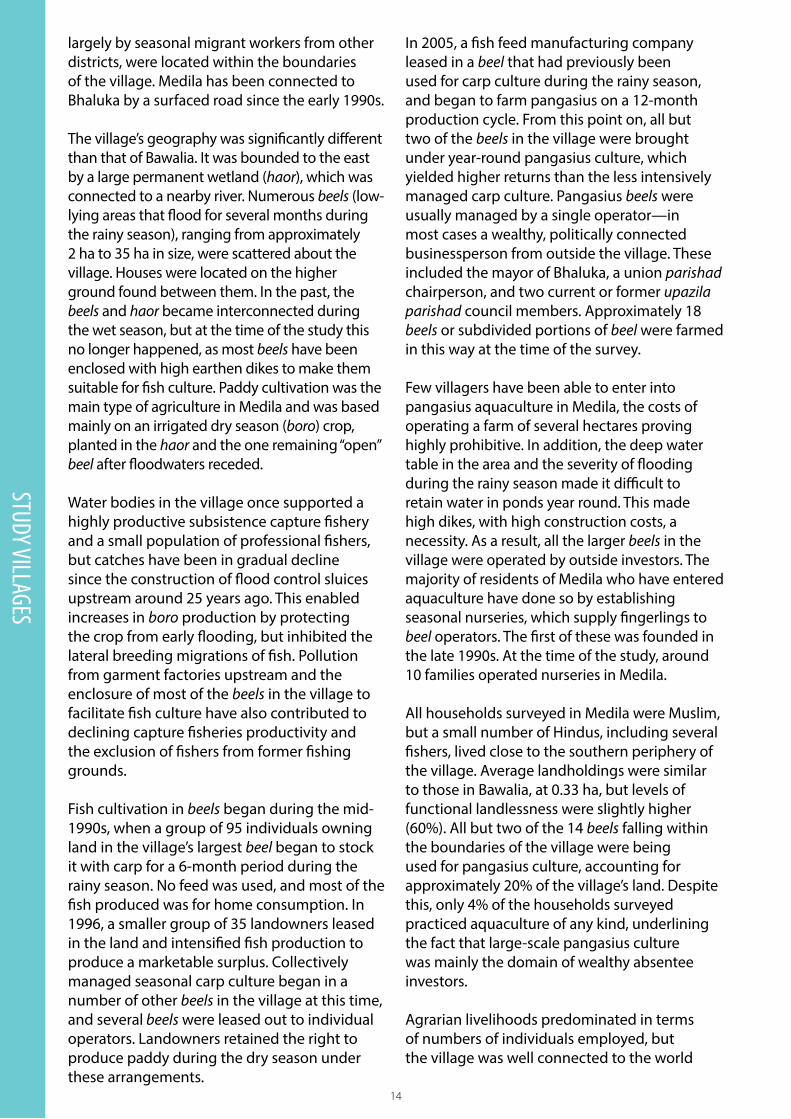
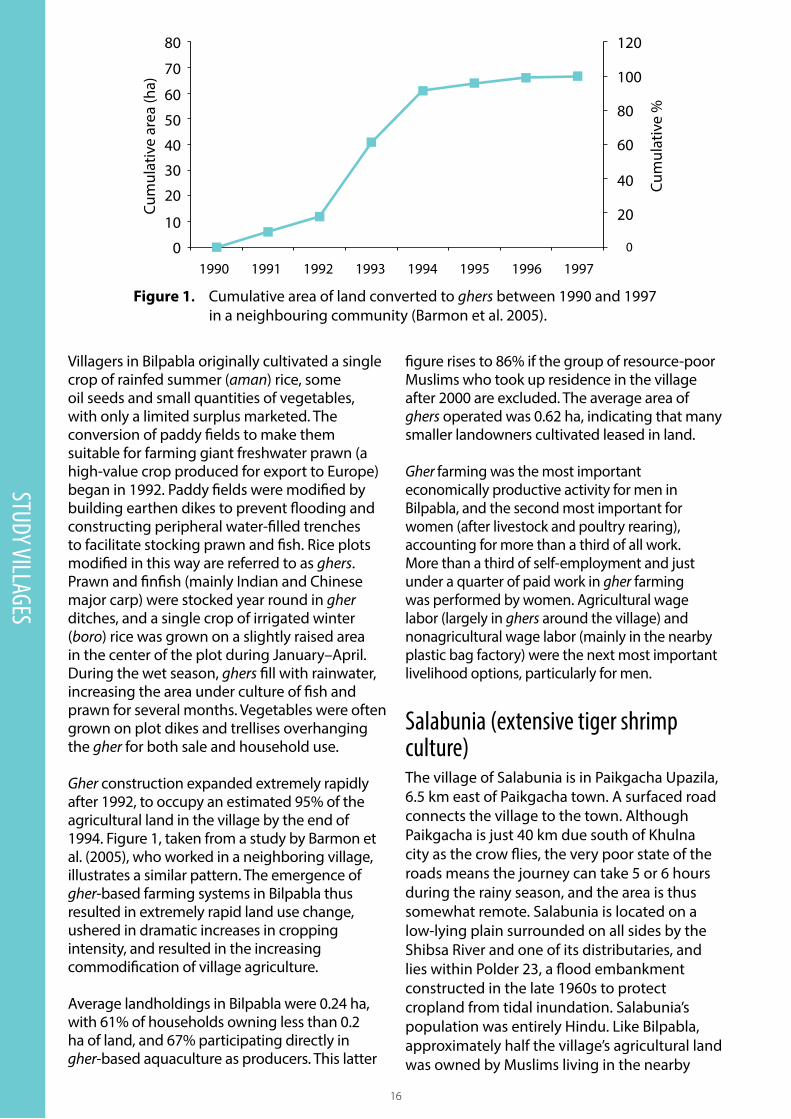
Bilpabla, Khulna: Integrated freshwater gher farming (Google earth)
15
STUDY VILLAGESinto the village, with a number of parcels being purchased by outside investors, but no construction has taken place to date and the land remained leased out for aquaculture, with the lease value unaffected. A plastic bag manufacturing factory employing around 250 people was established beside the road at the entrance to the village in 2010, but only 13% of village households had a member working there.
Sixty percent of Bilpabla’s population was Hindu. Most of the Muslim inhabitants were resource-poor newcomers, who arrived in the early 2000s after being fraudulently sold small parcels of khas (government owned) roadside land, on which they had constructed homesteads. At the time of the study, their tenure remained insecure. Seventeen percent of the village’s inhabitants had migrated from outside the area to lease in agricultural land for prawn cultivation, but did not own any land in the village. Many of these migrants were distantly related to Bilpabla’s Hindu residents. Approximately half of the agricultural land in the village was owned by Muslims living in and around Khulna city. Most of this land was sold during partition and around the time of the upheaval caused by the war of independence in 1971, when many Hindu families permanently relocated to India.
beyond. Significant numbers of its residents engaged in occupations such as working in garment factories or driving auto-rickshaws in the busy town of Bhaluka and its environs. Overseas migration was also a common livelihood strategy, with 32% of households receiving international remittances. Significant numbers of households, particularly from one gushti (patrilineal clan), possessed members with government jobs outside the village, often in other districts (e.g. in banks, as teachers, as agricultural officers and in the army). Deagrarianization in Medila was thus considerably more advanced, and livelihoods considerably more translocal, than in Bawalia.
Bilpabla (integrated freshwater gher farming) Bilpabla is located 9 km west of the divisional capital city of Khulna. A paved road, constructed in 1998, connects the village to the main road to Khulna. The journey to Khulna, which has a population of around 1 million, takes around 20 minutes by motor vehicle. It is planned that the village will eventually be subsumed within the territory of an expanded Khulna City Corporation. This has already encouraged land speculation along the roads leading
16
STUDY VILLAGES
Villagers in Bilpabla originally cultivated a single crop of rainfed summer (aman) rice, some oil seeds and small quantities of vegetables, with only a limited surplus marketed. The conversion of paddy fields to make them suitable for farming giant freshwater prawn (a high-value crop produced for export to Europe) began in 1992. Paddy fields were modified by building earthen dikes to prevent flooding and constructing peripheral water-filled trenches to facilitate stocking prawn and fish. Rice plots modified in this way are referred to as ghers. Prawn and finfish (mainly Indian and Chinese major carp) were stocked year round in gher ditches, and a single crop of irrigated winter (boro) rice was grown on a slightly raised area in the center of the plot during January–April. During the wet season, ghers fill with rainwater, increasing the area under culture of fish and prawn for several months. Vegetables were often grown on plot dikes and trellises overhanging the gher for both sale and household use.
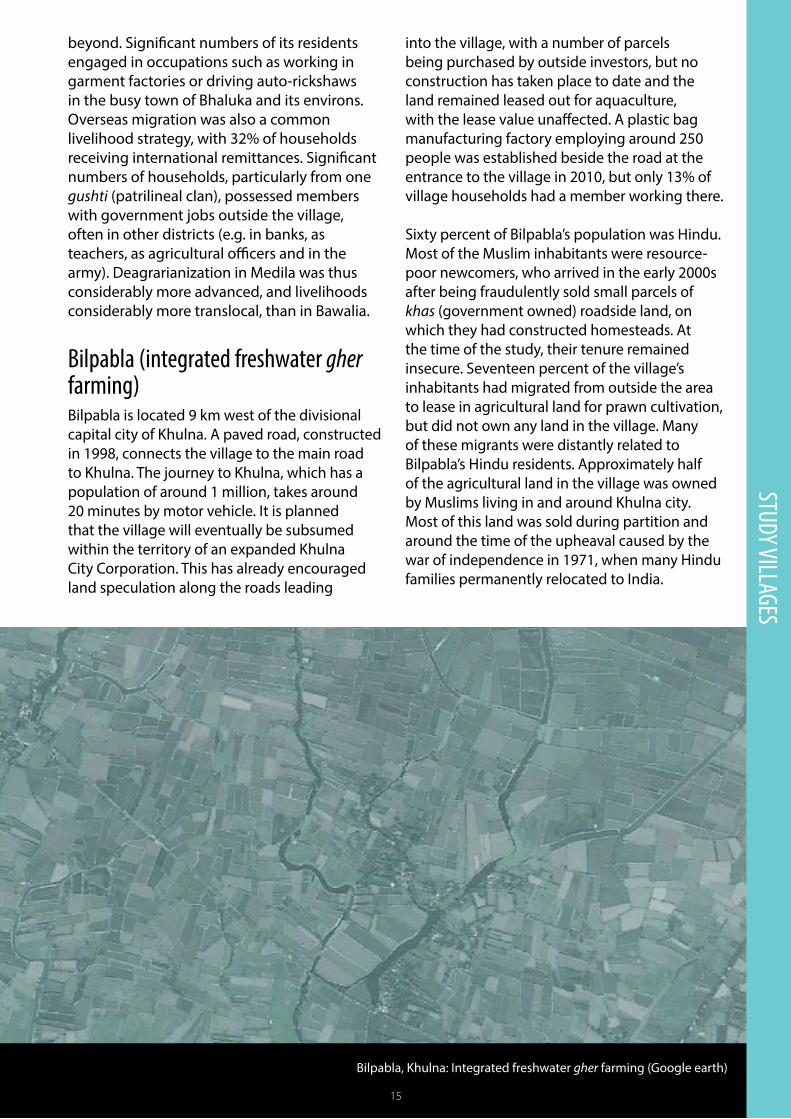
Gher construction expanded extremely rapidly after 1992, to occupy an estimated 95% of the agricultural land in the village by the end of 1994. Figure 1, taken from a study by Barmon et al. (2005), who worked in a neighboring village, illustrates a similar pattern. The emergence of gher-based farming systems in Bilpabla thus resulted in extremely rapid land use change, ushered in dramatic increases in cropping intensity, and resulted in the increasing commodification of village agriculture.
Average landholdings in Bilpabla were 0.24 ha, with 61% of households owning less than 0.2 ha of land, and 67% participating directly in gher-based aquaculture as producers. This latter
figure rises to 86% if the group of resource-poor Muslims who took up residence in the village after 2000 are excluded. The average area of ghers operated was 0.62 ha, indicating that many smaller landowners cultivated leased in land.
Gher farming was the most important economically productive activity for men in Bilpabla, and the second most important for women (after livestock and poultry rearing), accounting for more than a third of all work. More than a third of self-employment and just under a quarter of paid work in gher farming was performed by women. Agricultural wage labor (largely in ghers around the village) and nonagricultural wage labor (mainly in the nearby plastic bag factory) were the next most important livelihood options, particularly for men.
Salabunia (extensive tiger shrimp culture)The village of Salabunia is in Paikgacha Upazila, 6.5 km east of Paikgacha town. A surfaced road connects the village to the town. Although Paikgacha is just 40 km due south of Khulna city as the crow flies, the very poor state of the roads means the journey can take 5 or 6 hours during the rainy season, and the area is thus somewhat remote. Salabunia is located on a low-lying plain surrounded on all sides by the Shibsa River and one of its distributaries, and lies within Polder 23, a flood embankment constructed in the late 1960s to protect cropland from tidal inundation. Salabunia’s population was entirely Hindu. Like Bilpabla, approximately half the village’s agricultural land was owned by Muslims living in the nearby
Figure 1. Cumulative area of land converted to ghers between 1990 and 1997 in a neighbouring community (Barmon et al. 2005).
80 120
1990 1992 19941991 1993 1995 1996 1997
40
40
6080
2020
70 100
30
50
60
10
0 0
Cum
ulat
ive
%
Cum
ulat
ive
area
(ha)
17
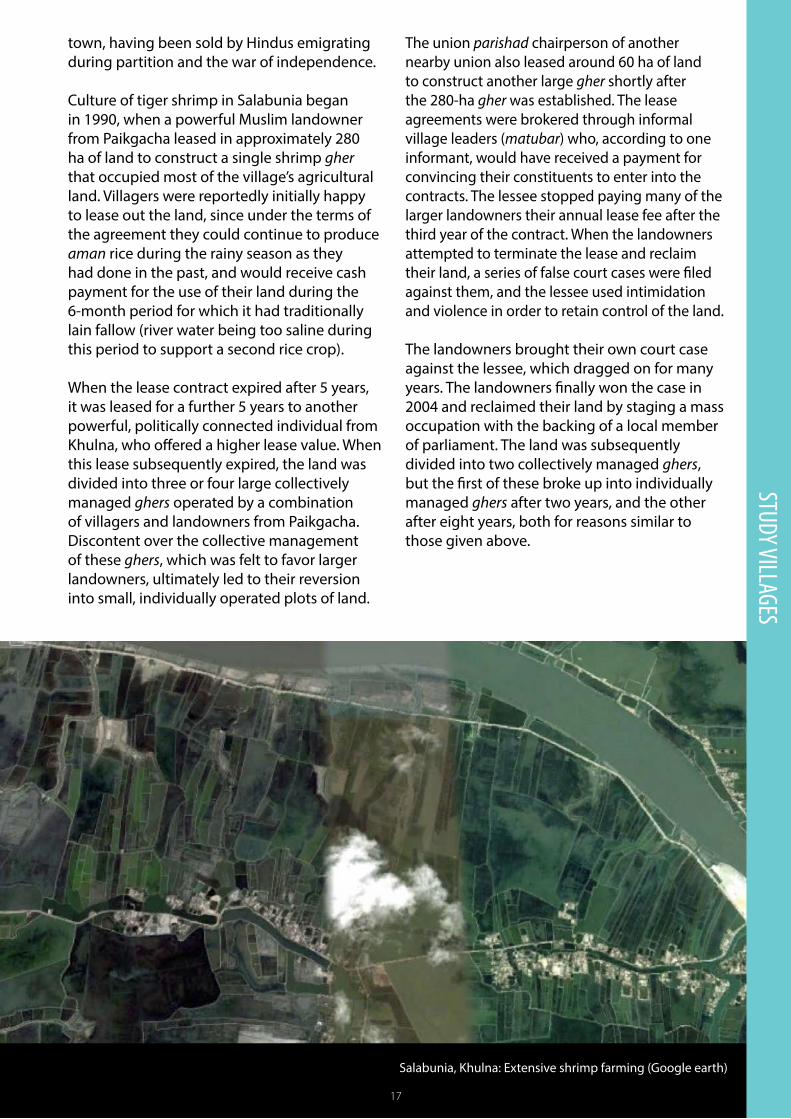
Salabunia, Khulna: Extensive shrimp farming (Google earth)
17
STUDY VILLAGEStown, having been sold by Hindus emigrating during partition and the war of independence.
Culture of tiger shrimp in Salabunia began in 1990, when a powerful Muslim landowner from Paikgacha leased in approximately 280 ha of land to construct a single shrimp gher that occupied most of the village’s agricultural land. Villagers were reportedly initially happy to lease out the land, since under the terms of the agreement they could continue to produce aman rice during the rainy season as they had done in the past, and would receive cash payment for the use of their land during the 6-month period for which it had traditionally lain fallow (river water being too saline during this period to support a second rice crop).
When the lease contract expired after 5 years, it was leased for a further 5 years to another powerful, politically connected individual from Khulna, who offered a higher lease value. When this lease subsequently expired, the land was divided into three or four large collectively managed ghers operated by a combination of villagers and landowners from Paikgacha. Discontent over the collective management of these ghers, which was felt to favor larger landowners, ultimately led to their reversion into small, individually operated plots of land.
The union parishad chairperson of another nearby union also leased around 60 ha of land to construct another large gher shortly after the 280-ha gher was established. The lease agreements were brokered through informal village leaders (matubar) who, according to one informant, would have received a payment for convincing their constituents to enter into the contracts. The lessee stopped paying many of the larger landowners their annual lease fee after the third year of the contract. When the landowners attempted to terminate the lease and reclaim their land, a series of false court cases were filed against them, and the lessee used intimidation and violence in order to retain control of the land.
The landowners brought their own court case against the lessee, which dragged on for many years. The landowners finally won the case in 2004 and reclaimed their land by staging a mass occupation with the backing of a local member of parliament. The land was subsequently divided into two collectively managed ghers, but the first of these broke up into individually managed ghers after two years, and the other after eight years, both for reasons similar to those given above.
18
STUDY VILLAGES
During the time that the ghers were collectively managed, a wet season rice/dry season shrimp crop rotation was still practiced. This arrangement ended after the division of collectively managed ghers into individually operated plots, because the highly fragmented nature of the landholdings meant that individual gher operators located away from canals no longer possessed the ability to discharge saline water at the end of the dry season. This problem was exacerbated because a khas drainage canal running through the area had been occupied for shrimp cultivation by several of the village’s larger landowners. As a result, soil salinities in most areas of the village remained too high to cultivate rice successfully during the rainy season, making year-round production of shrimp the only alternative.
Only 14% of households reported growing rice during the 12 months preceding the survey, whereas virtually all households with access to land would have once done so. It appeared that increases in soil salinity had occurred since the initiation of shrimp cultivation, resulting in a gradual reduction in rice yields, but the breakup of collectively managed ghers into small, privately operated parcels was followed by a much sharper rise in soil salinities. This was exacerbated by Cyclone Aila in 2009, during which a polder embankment was breached, flooding the entire area with saline water for a prolonged period.
Vegetable cultivation and livestock rearing were both limited at the time of the survey as a result of these events. Villagers had raised large numbers of cattle prior to the advent of shrimp farming, but cattle ownership declined sharply due to the disappearance of fallow grazing land, reduced availability of the fodder (rice straw and rice bran) provided by paddy cultivation, and negative effects of saline water on bovine health. As a result, only 20% of the households surveyed owned a cow. Ground water pumped from hand tube wells in Salabunia had always been saline, but homestead ponds, previously used as a source of drinking water during the dry season, have more recently become too saline to provide potable water, forcing households to collect filtered water from ponds close to Paikgacha for 6 months of the year. Trees have also been damaged by high salinity, and few remain within the village boundaries.
Average landholdings in Salabunia were the largest among the six communities, at 0.96 ha, and the proportion of functionally landless households was the lowest of any village (27%). Levels of participation in aquaculture were high (71% of households farmed shrimp), and the average area under aquaculture was large in comparison to other villages, at 1.02 ha.
The transformation of Salabunia’s agroecology profoundly altered livelihood strategies, as well as labor and to some extent gender relations. Increasing dependence on the market for almost all food provisioning resulted in large teams of men migrating within and beyond the district at rice harvesting time to provide labor in exchange for paddy, which was used to ensure (partial) household food security. This resulted in greater female involvement in management of shrimp ghers than was customary in the past. The emergence of an almost completely cash-based economy also compelled women to engage in employment, with women accounting for around a third of employment related to aquaculture, based mainly on the removal of aquatic weeds from larger ghers.
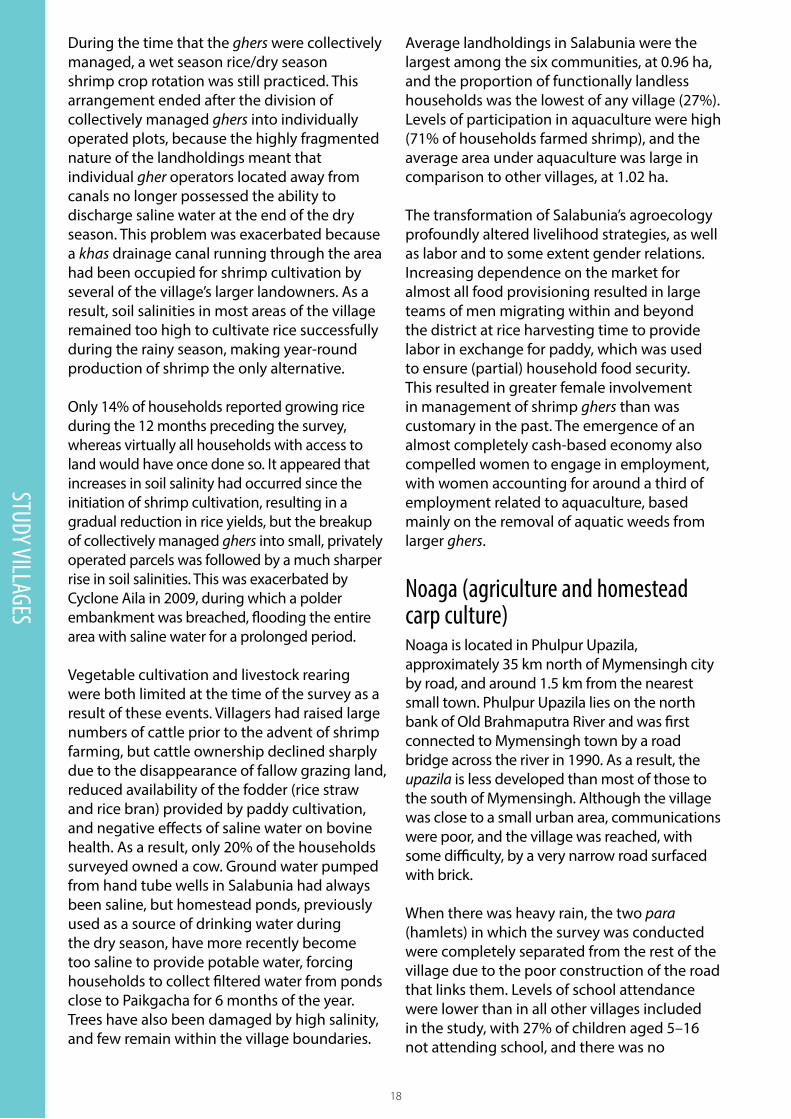
Noaga (agriculture and homestead carp culture)Noaga is located in Phulpur Upazila, approximately 35 km north of Mymensingh city by road, and around 1.5 km from the nearest small town. Phulpur Upazila lies on the north bank of Old Brahmaputra River and was first connected to Mymensingh town by a road bridge across the river in 1990. As a result, the upazila is less developed than most of those to the south of Mymensingh. Although the village was close to a small urban area, communications were poor, and the village was reached, with some difficulty, by a very narrow road surfaced with brick.
When there was heavy rain, the two para (hamlets) in which the survey was conducted were completely separated from the rest of the village due to the poor construction of the road that links them. Levels of school attendance were lower than in all other villages included in the study, with 27% of children aged 5–16 not attending school, and there was no
19
Noaga, Mymensingh: Agriculture and homestead carp culture (Google earth) STUDY VILLAGES
electrical connection. Inhabitants of the village considered the union in which the village was located to be among the poorest in Phulpur.
Seventy-six percent of households surveyed were Muslim. Levels of functional landlessness were extremely high, with 68% of households owning less than 0.2 ha of land. Twenty-five percent of households owned a homestead pond (average area 0.07 ha), and most pond owners sold part of the fish they produced, but no intensive fully commercial aquaculture was practiced. The area is sometimes severely affected by flooding, leading to complete destruction of the aman rice crop and the escape of fish stocked in ponds. The last time this occurred was in 2008.
Paddy cultivation (boro and aman), agricultural wage labor, and a variety of forms of nonfarm self-employment represented the major livelihood activities. Fourteen percent of households received domestic remittances, and 19% of occupations were conducted outside the boundaries of the union, reflecting the rather limited livelihood opportunities available locally. Noaga was the most deprived community studied, with 49% of households falling below the national poverty line.
20
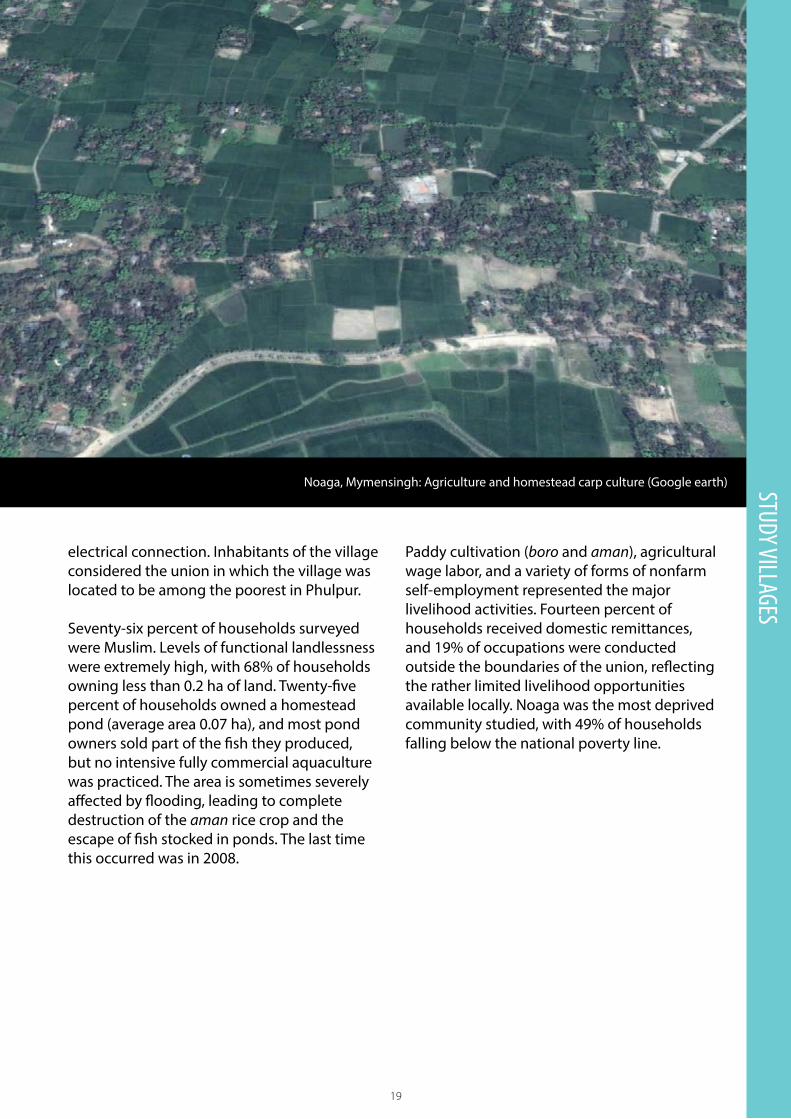
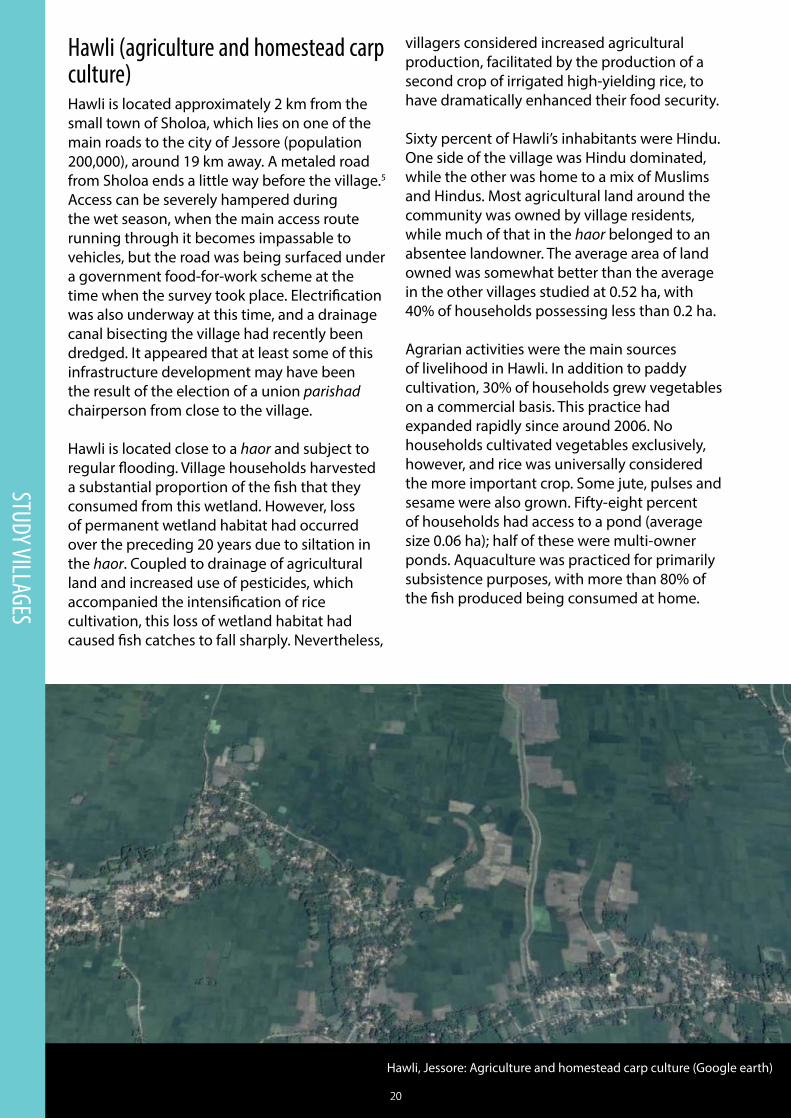
Hawli, Jessore: Agriculture and homestead carp culture (Google earth)
20
STUDY VILLAGES
20
Hawli (agriculture and homestead carp culture) Hawli is located approximately 2 km from the small town of Sholoa, which lies on one of the main roads to the city of Jessore (population 200,000), around 19 km away. A metaled road from Sholoa ends a little way before the village.5 Access can be severely hampered during the wet season, when the main access route running through it becomes impassable to vehicles, but the road was being surfaced under a government food-for-work scheme at the time when the survey took place. Electrification was also underway at this time, and a drainage canal bisecting the village had recently been dredged. It appeared that at least some of this infrastructure development may have been the result of the election of a union parishad chairperson from close to the village.
Hawli is located close to a haor and subject to regular flooding. Village households harvested a substantial proportion of the fish that they consumed from this wetland. However, loss of permanent wetland habitat had occurred over the preceding 20 years due to siltation in the haor. Coupled to drainage of agricultural land and increased use of pesticides, which accompanied the intensification of rice cultivation, this loss of wetland habitat had caused fish catches to fall sharply. Nevertheless,
villagers considered increased agricultural production, facilitated by the production of a second crop of irrigated high-yielding rice, to have dramatically enhanced their food security.
Sixty percent of Hawli’s inhabitants were Hindu. One side of the village was Hindu dominated, while the other was home to a mix of Muslims and Hindus. Most agricultural land around the community was owned by village residents, while much of that in the haor belonged to an absentee landowner. The average area of land owned was somewhat better than the average in the other villages studied at 0.52 ha, with 40% of households possessing less than 0.2 ha.
Agrarian activities were the main sources of livelihood in Hawli. In addition to paddy cultivation, 30% of households grew vegetables on a commercial basis. This practice had expanded rapidly since around 2006. No households cultivated vegetables exclusively, however, and rice was universally considered the more important crop. Some jute, pulses and sesame were also grown. Fifty-eight percent of households had access to a pond (average size 0.06 ha); half of these were multi-owner ponds. Aquaculture was practiced for primarily subsistence purposes, with more than 80% of the fish produced being consumed at home.
21
ANALYSIS
20
ANALYSIS
Analysis in this document is organized around the five central research questions outlined in the methods section. Drawing on a mix of quantitative data derived from the structured household survey and qualitative information from interviews, this section provides a synopsis of key findings from the six study villages. These summaries offer partial answers to each of the research questions.
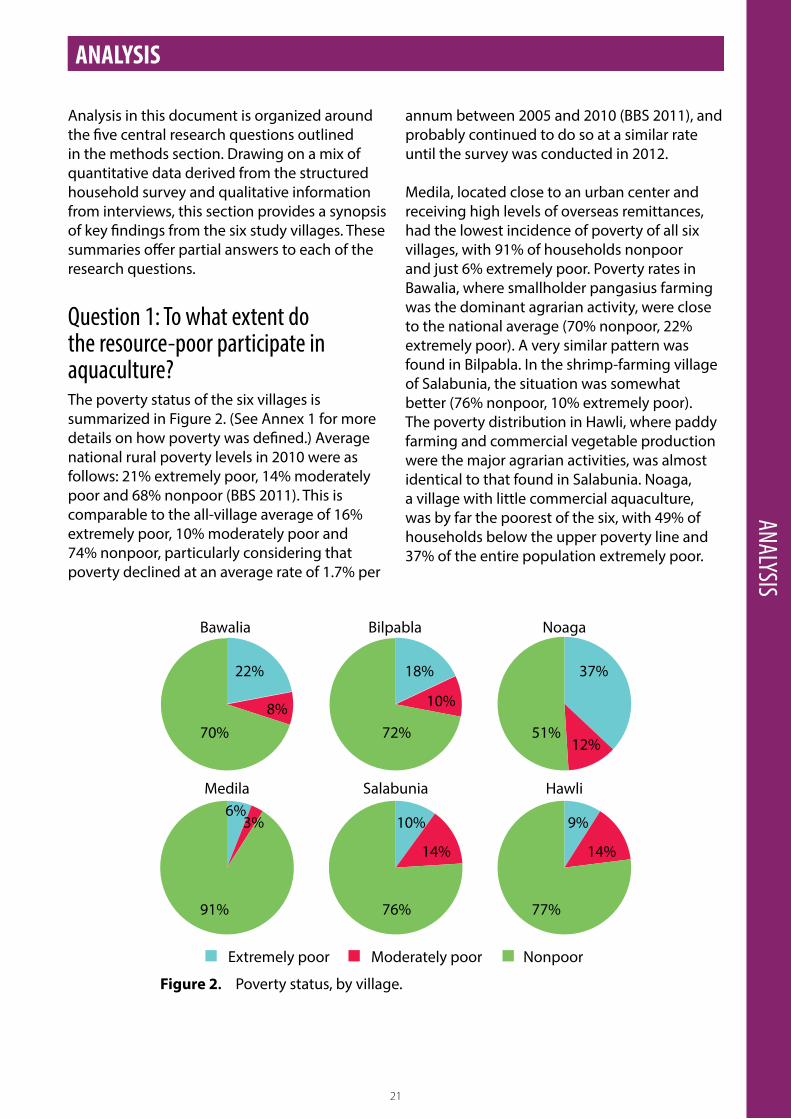
Question 1: To what extent do the resource-poor participate in aquaculture?The poverty status of the six villages is summarized in Figure 2. (See Annex 1 for more details on how poverty was defined.) Average national rural poverty levels in 2010 were as follows: 21% extremely poor, 14% moderately poor and 68% nonpoor (BBS 2011). This is comparable to the all-village average of 16% extremely poor, 10% moderately poor and 74% nonpoor, particularly considering that poverty declined at an average rate of 1.7% per
annum between 2005 and 2010 (BBS 2011), and probably continued to do so at a similar rate until the survey was conducted in 2012.
Medila, located close to an urban center and receiving high levels of overseas remittances, had the lowest incidence of poverty of all six villages, with 91% of households nonpoor and just 6% extremely poor. Poverty rates in Bawalia, where smallholder pangasius farming was the dominant agrarian activity, were close to the national average (70% nonpoor, 22% extremely poor). A very similar pattern was found in Bilpabla. In the shrimp-farming village of Salabunia, the situation was somewhat better (76% nonpoor, 10% extremely poor). The poverty distribution in Hawli, where paddy farming and commercial vegetable production were the major agrarian activities, was almost identical to that found in Salabunia. Noaga, a village with little commercial aquaculture, was by far the poorest of the six, with 49% of households below the upper poverty line and 37% of the entire population extremely poor.
Figure 2. Poverty status, by village.
Bawalia Bilpabla
Salabunia
Noaga
HawliMedila
22% 18% 37%
51%70%
91%
72%
76% 77%
8%
6%9%3%
10%
10%
14% 14%
12%
Extremely poor Moderately poor Nonpoor
22
ANALYSIS
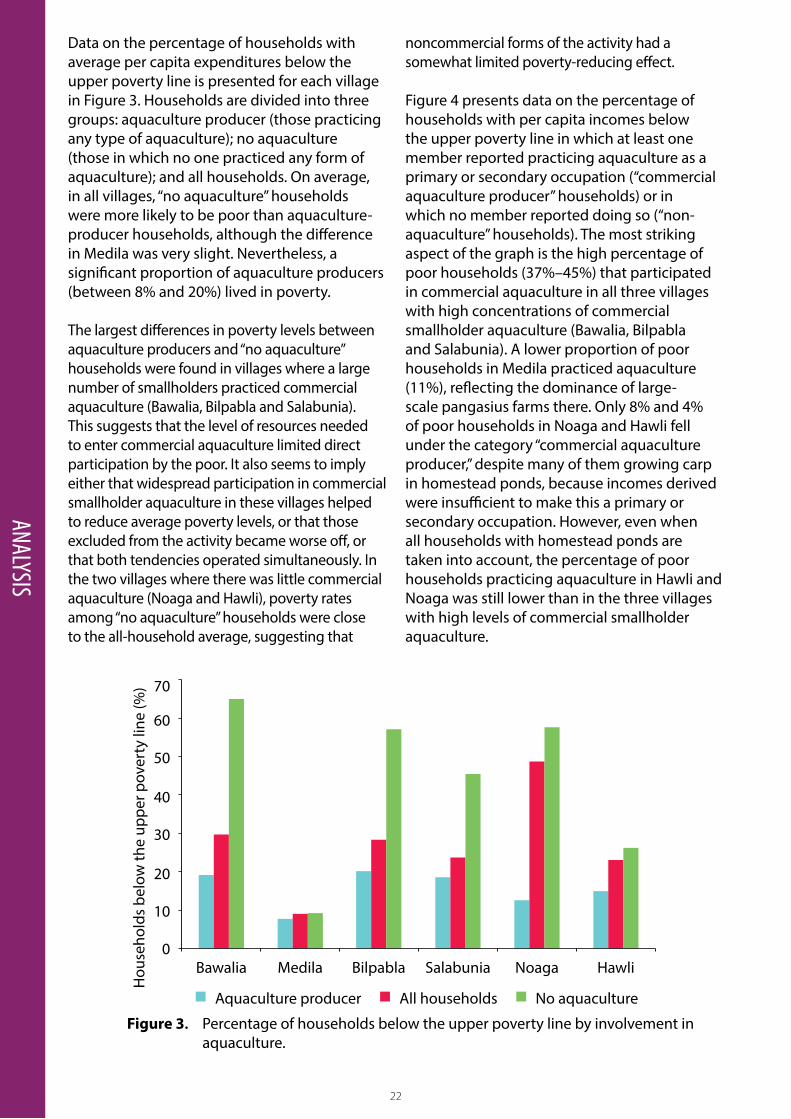
Data on the percentage of households with average per capita expenditures below the upper poverty line is presented for each village in Figure 3. Households are divided into three groups: aquaculture producer (those practicing any type of aquaculture); no aquaculture (those in which no one practiced any form of aquaculture); and all households. On average, in all villages, “no aquaculture” households were more likely to be poor than aquaculture-producer households, although the difference in Medila was very slight. Nevertheless, a significant proportion of aquaculture producers (between 8% and 20%) lived in poverty.
The largest differences in poverty levels between aquaculture producers and “no aquaculture” households were found in villages where a large number of smallholders practiced commercial aquaculture (Bawalia, Bilpabla and Salabunia). This suggests that the level of resources needed to enter commercial aquaculture limited direct participation by the poor. It also seems to imply either that widespread participation in commercial smallholder aquaculture in these villages helped to reduce average poverty levels, or that those excluded from the activity became worse off, or that both tendencies operated simultaneously. In the two villages where there was little commercial aquaculture (Noaga and Hawli), poverty rates among “no aquaculture” households were close to the all-household average, suggesting that
noncommercial forms of the activity had a somewhat limited poverty-reducing effect.
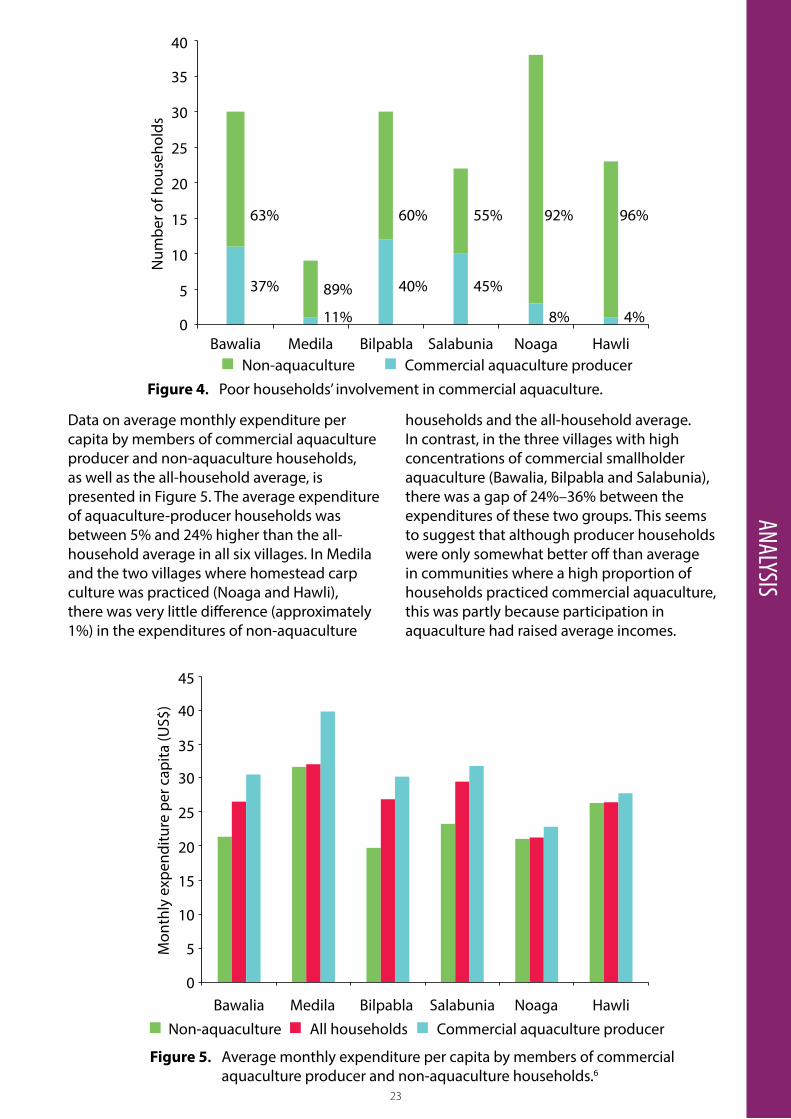
Figure 4 presents data on the percentage of households with per capita incomes below the upper poverty line in which at least one member reported practicing aquaculture as a primary or secondary occupation (“commercial aquaculture producer” households) or in which no member reported doing so (“non-aquaculture” households). The most striking aspect of the graph is the high percentage of poor households (37%–45%) that participated in commercial aquaculture in all three villages with high concentrations of commercial smallholder aquaculture (Bawalia, Bilpabla and Salabunia). A lower proportion of poor households in Medila practiced aquaculture (11%), reflecting the dominance of large-scale pangasius farms there. Only 8% and 4% of poor households in Noaga and Hawli fell under the category “commercial aquaculture producer,” despite many of them growing carp in homestead ponds, because incomes derived were insufficient to make this a primary or secondary occupation. However, even when all households with homestead ponds are taken into account, the percentage of poor households practicing aquaculture in Hawli and Noaga was still lower than in the three villages with high levels of commercial smallholder aquaculture.
Figure 3. Percentage of households below the upper poverty line by involvement in aquaculture.
Bawalia Bilpabla Salabunia Noaga HawliMedila
Aquaculture producer No aquacultureAll households
40
60
20
70
30
50
10
0
Hou
seho
lds
belo
w th
e up
per p
over
ty li
ne (%
)
23
ANALYSIS
63% 60% 92%55%
89%
96%
37% 40% 45%
8% 4%11%
Figure 4. Poor households’ involvement in commercial aquaculture.
Bawalia Bilpabla Salabunia Noaga HawliMedila
25
35
15
40
20
30
10
5
0
Num
ber o
f hou
seho
lds
Commercial aquaculture producerNon-aquaculture
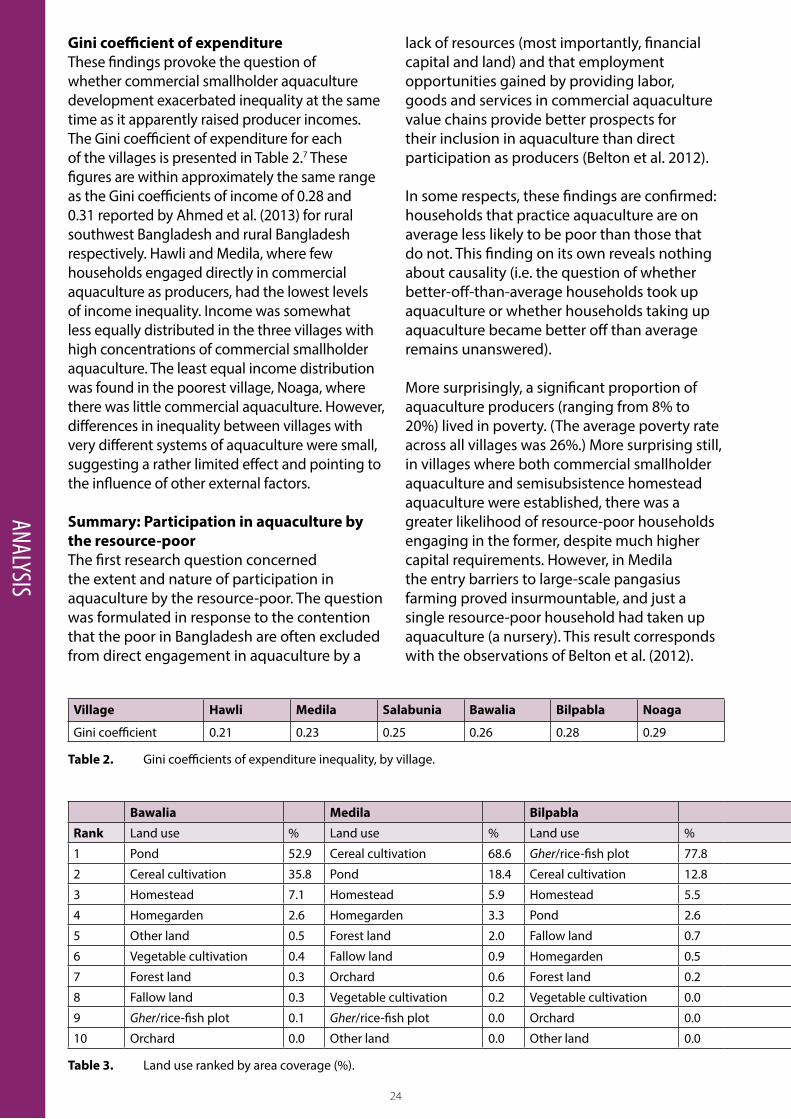
Data on average monthly expenditure per capita by members of commercial aquaculture producer and non-aquaculture households, as well as the all-household average, is presented in Figure 5. The average expenditure of aquaculture-producer households was between 5% and 24% higher than the all-household average in all six villages. In Medila and the two villages where homestead carp culture was practiced (Noaga and Hawli), there was very little difference (approximately 1%) in the expenditures of non-aquaculture
households and the all-household average. In contrast, in the three villages with high concentrations of commercial smallholder aquaculture (Bawalia, Bilpabla and Salabunia), there was a gap of 24%–36% between the expenditures of these two groups. This seems to suggest that although producer households were only somewhat better off than average in communities where a high proportion of households practiced commercial aquaculture, this was partly because participation in aquaculture had raised average incomes.
Figure 5. Average monthly expenditure per capita by members of commercial aquaculture producer and non-aquaculture households.6
Non-aquaculture All households Commercial aquaculture producer
30
40
20
45
25
35
15
10
5
0
Mon
thly
exp
endi
ture
per
cap
ita (U
S$)
Bawalia Bilpabla Salabunia Noaga HawliMedila
24
Gini coefficient of expenditureThese findings provoke the question of whether commercial smallholder aquaculture development exacerbated inequality at the same time as it apparently raised producer incomes. The Gini coefficient of expenditure for each of the villages is presented in Table 2.7 These figures are within approximately the same range as the Gini coefficients of income of 0.28 and 0.31 reported by Ahmed et al. (2013) for rural southwest Bangladesh and rural Bangladesh respectively. Hawli and Medila, where few households engaged directly in commercial aquaculture as producers, had the lowest levels of income inequality. Income was somewhat less equally distributed in the three villages with high concentrations of commercial smallholder aquaculture. The least equal income distribution was found in the poorest village, Noaga, where there was little commercial aquaculture. However, differences in inequality between villages with very different systems of aquaculture were small, suggesting a rather limited effect and pointing to the influence of other external factors.
Summary: Participation in aquaculture by the resource-poorThe first research question concerned the extent and nature of participation in aquaculture by the resource-poor. The question was formulated in response to the contention that the poor in Bangladesh are often excluded from direct engagement in aquaculture by a
lack of resources (most importantly, financial capital and land) and that employment opportunities gained by providing labor, goods and services in commercial aquaculture value chains provide better prospects for their inclusion in aquaculture than direct participation as producers (Belton et al. 2012). In some respects, these findings are confirmed: households that practice aquaculture are on average less likely to be poor than those that do not. This finding on its own reveals nothing about causality (i.e. the question of whether better-off-than-average households took up aquaculture or whether households taking up aquaculture became better off than average remains unanswered).
More surprisingly, a significant proportion of aquaculture producers (ranging from 8% to 20%) lived in poverty. (The average poverty rate across all villages was 26%.) More surprising still, in villages where both commercial smallholder aquaculture and semisubsistence homestead aquaculture were established, there was a greater likelihood of resource-poor households engaging in the former, despite much higher capital requirements. However, in Medila the entry barriers to large-scale pangasius farming proved insurmountable, and just a single resource-poor household had taken up aquaculture (a nursery). This result corresponds with the observations of Belton et al. (2012).
Village Hawli Medila Salabunia Bawalia Bilpabla Noaga
Gini coefficient 0.21 0.23 0.25 0.26 0.28 0.29
Table 2. Gini coefficients of expenditure inequality, by village.ANALYSIS
Bawalia Medila Bilpabla Salabunia Noaga HawliRank Land use % Land use % Land use % Land use % Land use % Land use %
1 Pond 52.9 Cereal cultivation 68.6 Gher/rice-fish plot 77.8 Gher/rice-fish plot 85.2 Cereal cultivation 87.5 Cereal cultivation 79.8
2 Cereal cultivation 35.8 Pond 18.4 Cereal cultivation 12.8 Cereal cultivation 6.8 Homestead 5.6 Vegetable cultivation 6.4
3 Homestead 7.1 Homestead 5.9 Homestead 5.5 Pond 2.5 Pond 3.2 Pond 6.1
4 Homegarden 2.6 Homegarden 3.3 Pond 2.6 Homestead 2.1 Gher/rice-fish plot 1.6 Homestead 3.5
5 Other land 0.5 Forest land 2.0 Fallow land 0.7 Fallow land 1.7 Homegarden 1.3 Homegarden 1.8
6 Vegetable cultivation 0.4 Fallow land 0.9 Homegarden 0.5 Homegarden 1.2 Vegetable cultivation 0.5 Forest land 1.8
7 Forest land 0.3 Orchard 0.6 Forest land 0.2 Orchard 0.3 Fallow land 0.2 Gher/rice-fish plot 0.3
8 Fallow land 0.3 Vegetable cultivation 0.2 Vegetable cultivation 0.0 Other land 0.1 Orchard 0.2 Fallow land 0.2
9 Gher/rice-fish plot 0.1 Gher/rice-fish plot 0.0 Orchard 0.0 Vegetable cultivation 0.1 Forest land 0.1 Other land 0.1
10 Orchard 0.0 Other land 0.0 Other land 0.0 Forest land 0.0 Other land 0.0 Orchard 0.0
Table 3. Land use ranked by area coverage (%).
25
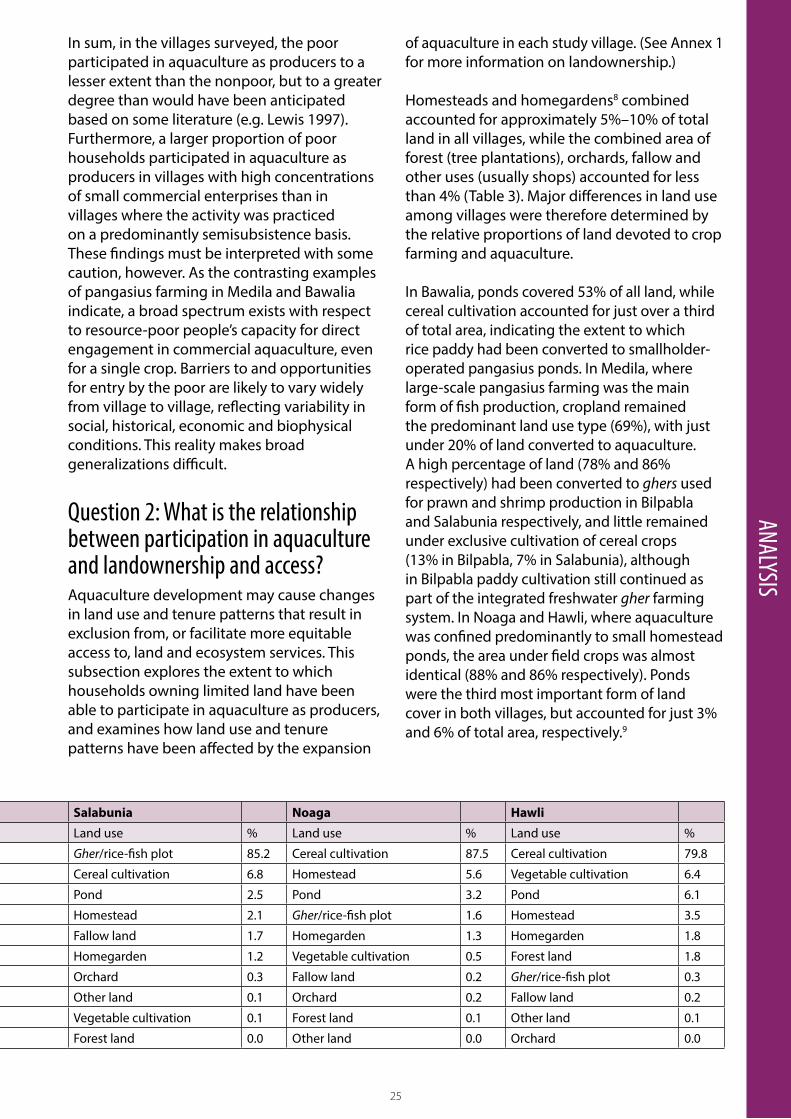
In sum, in the villages surveyed, the poor participated in aquaculture as producers to a lesser extent than the nonpoor, but to a greater degree than would have been anticipated based on some literature (e.g. Lewis 1997). Furthermore, a larger proportion of poor households participated in aquaculture as producers in villages with high concentrations of small commercial enterprises than in villages where the activity was practiced on a predominantly semisubsistence basis. These findings must be interpreted with some caution, however. As the contrasting examples of pangasius farming in Medila and Bawalia indicate, a broad spectrum exists with respect to resource-poor people’s capacity for direct engagement in commercial aquaculture, even for a single crop. Barriers to and opportunities for entry by the poor are likely to vary widely from village to village, reflecting variability in social, historical, economic and biophysical conditions. This reality makes broad generalizations difficult.
Question 2: What is the relationship between participation in aquaculture and landownership and access?Aquaculture development may cause changes in land use and tenure patterns that result in exclusion from, or facilitate more equitable access to, land and ecosystem services. This subsection explores the extent to which households owning limited land have been able to participate in aquaculture as producers, and examines how land use and tenure patterns have been affected by the expansion
ANALYSISof aquaculture in each study village. (See Annex 1 for more information on landownership.) Homesteads and homegardens8 combined accounted for approximately 5%–10% of total land in all villages, while the combined area of forest (tree plantations), orchards, fallow and other uses (usually shops) accounted for less than 4% (Table 3). Major differences in land use among villages were therefore determined by the relative proportions of land devoted to crop farming and aquaculture.
In Bawalia, ponds covered 53% of all land, while cereal cultivation accounted for just over a third of total area, indicating the extent to which rice paddy had been converted to smallholder-operated pangasius ponds. In Medila, where large-scale pangasius farming was the main form of fish production, cropland remained the predominant land use type (69%), with just under 20% of land converted to aquaculture. A high percentage of land (78% and 86% respectively) had been converted to ghers used for prawn and shrimp production in Bilpabla and Salabunia respectively, and little remained under exclusive cultivation of cereal crops (13% in Bilpabla, 7% in Salabunia), although in Bilpabla paddy cultivation still continued as part of the integrated freshwater gher farming system. In Noaga and Hawli, where aquaculture was confined predominantly to small homestead ponds, the area under field crops was almost identical (88% and 86% respectively). Ponds were the third most important form of land cover in both villages, but accounted for just 3% and 6% of total area, respectively.9
Bawalia Medila Bilpabla Salabunia Noaga HawliRank Land use % Land use % Land use % Land use % Land use % Land use %
1 Pond 52.9 Cereal cultivation 68.6 Gher/rice-fish plot 77.8 Gher/rice-fish plot 85.2 Cereal cultivation 87.5 Cereal cultivation 79.8
2 Cereal cultivation 35.8 Pond 18.4 Cereal cultivation 12.8 Cereal cultivation 6.8 Homestead 5.6 Vegetable cultivation 6.4
3 Homestead 7.1 Homestead 5.9 Homestead 5.5 Pond 2.5 Pond 3.2 Pond 6.1
4 Homegarden 2.6 Homegarden 3.3 Pond 2.6 Homestead 2.1 Gher/rice-fish plot 1.6 Homestead 3.5
5 Other land 0.5 Forest land 2.0 Fallow land 0.7 Fallow land 1.7 Homegarden 1.3 Homegarden 1.8
6 Vegetable cultivation 0.4 Fallow land 0.9 Homegarden 0.5 Homegarden 1.2 Vegetable cultivation 0.5 Forest land 1.8
7 Forest land 0.3 Orchard 0.6 Forest land 0.2 Orchard 0.3 Fallow land 0.2 Gher/rice-fish plot 0.3
8 Fallow land 0.3 Vegetable cultivation 0.2 Vegetable cultivation 0.0 Other land 0.1 Orchard 0.2 Fallow land 0.2
9 Gher/rice-fish plot 0.1 Gher/rice-fish plot 0.0 Orchard 0.0 Vegetable cultivation 0.1 Forest land 0.1 Other land 0.1
10 Orchard 0.0 Other land 0.0 Other land 0.0 Forest land 0.0 Other land 0.0 Orchard 0.0
Table 3. Land use ranked by area coverage (%).
26
These figures underline the extent to which clustered development of commercial smallholder aquaculture transformed land use in Bawalia, Bilpabla and Salabunia. They also illustrate the degree to which paddy cultivation dominates land use patterns in most villages where commercial aquaculture development is limited, and its continued persistence even in areas with high densities of aquaculture operations.
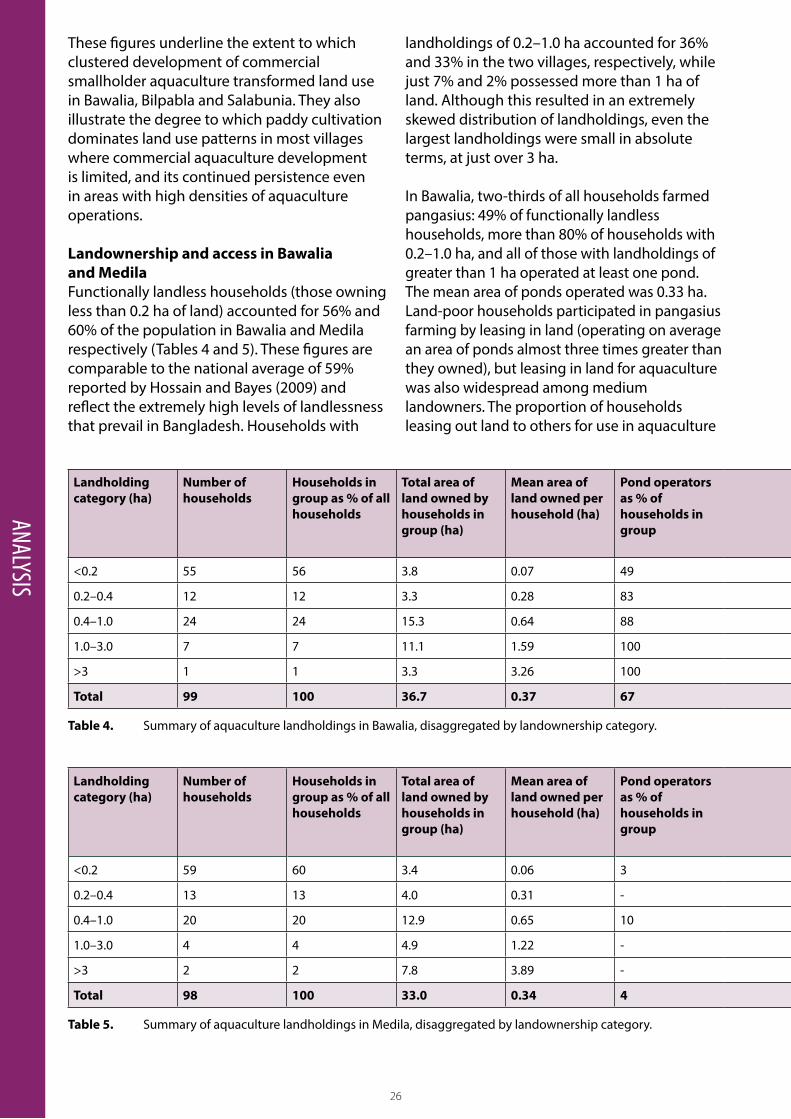
Landownership and access in Bawalia and MedilaFunctionally landless households (those owning less than 0.2 ha of land) accounted for 56% and 60% of the population in Bawalia and Medila respectively (Tables 4 and 5). These figures are comparable to the national average of 59% reported by Hossain and Bayes (2009) and reflect the extremely high levels of landlessness that prevail in Bangladesh. Households with
ANALYSIS
Landholding category (ha)
Number of households
Households in group as % of all households
Total area of land owned by households in group (ha)
Mean area of land owned per household (ha)
Pond operators as % of households in group
Mean area of ponds owned per operating household (ha)
Mean area of ponds operated per operating household (ha)
Area of ponds owned as % of ponds operated
Area of ponds operated as % of ponds owned
Households leasing out land for aquaculture as % of households in group
Area leased out to aquaculture as % of all landholdings in group
<0.2 55 56 3.8 0.07 49 0.07 0.22 32 313 11 13
0.2–0.4 12 12 3.3 0.28 83 0.09 0.23 39 255 33 18
0.4–1.0 24 24 15.3 0.64 88 0.14 0.36 38 265 46 23
1.0–3.0 7 7 11.1 1.59 100 0.17 0.70 24 421 57 23
>3 1 1 3.3 3.26 100 0.23 0.92 25 392 100 15
Total 99 100 36.7 0.37 67 0.14 0.33 41 242 26 21
Table 4. Summary of aquaculture landholdings in Bawalia, disaggregated by landownership category.
Landholding category (ha)
Number of households
Households in group as % of all households
Total area of land owned by households in group (ha)
Mean area of land owned per household (ha)
Pond operators as % of households in group
Mean area of ponds owned per operating household (ha)
Mean area of ponds operated per operating household (ha)
Area of ponds owned as % of ponds operated
Area of ponds operated as % of ponds owned
Households leasing out land for aquaculture as % of households in group
Area leased out to aquaculture as % of all landholdings in group
<0.2 59 60 3.4 0.06 3 0.0 1.08 0.0 - 5 9
0.2–0.4 13 13 4.0 0.31 - - - - 31 17
0.4–1.0 20 20 12.9 0.65 10 0.06 0.19 31.5 316.6 60 23
1.0–3.0 4 4 4.9 1.22 - - - - - 100 20
>3 2 2 7.8 3.89 - - - - - 100 22
Total 98 100 33.0 0.34 4 0.06 0.63 - - 28 20
Table 5. Summary of aquaculture landholdings in Medila, disaggregated by landownership category.
landholdings of 0.2–1.0 ha accounted for 36% and 33% in the two villages, respectively, while just 7% and 2% possessed more than 1 ha of land. Although this resulted in an extremely skewed distribution of landholdings, even the largest landholdings were small in absolute terms, at just over 3 ha.
In Bawalia, two-thirds of all households farmed pangasius: 49% of functionally landless households, more than 80% of households with 0.2–1.0 ha, and all of those with landholdings of greater than 1 ha operated at least one pond. The mean area of ponds operated was 0.33 ha. Land-poor households participated in pangasius farming by leasing in land (operating on average an area of ponds almost three times greater than they owned), but leasing in land for aquaculture was also widespread among medium landowners. The proportion of households leasing out land to others for use in aquaculture
27
increased with landholding size: 11% among functionally landless households, as compared to 100% for those owning 1.0–3.0 ha, but the fraction of land leased out for aquaculture (13%–23%) was similar across all landholding classes. Twenty-one percent of the village’s land was leased out for pangasius aquaculture.
Pangasius farming in Medila took place in a relatively limited number of large natural waterbodies (beels) that had been enclosed to make them suitable for fish culture. The pattern of landholdings under aquaculture in Medila was radically different from that in Bawalia, despite the overall distribution of landholdings in the two villages being similar. Very few residents of Medila possessed sufficient capital to participate directly in beel-based pangasius aquaculture as producers, and most of those engaged in aquaculture nursed fingerlings to supply to large farms operated by absentee investors.
ANALYSIS
Landholding category (ha)
Number of households
Households in group as % of all households
Total area of land owned by households in group (ha)
Mean area of land owned per household (ha)
Pond operators as % of households in group
Mean area of ponds owned per operating household (ha)
Mean area of ponds operated per operating household (ha)
Area of ponds owned as % of ponds operated
Area of ponds operated as % of ponds owned
Households leasing out land for aquaculture as % of households in group
Area leased out to aquaculture as % of all landholdings in group
<0.2 55 56 3.8 0.07 49 0.07 0.22 32 313 11 13
0.2–0.4 12 12 3.3 0.28 83 0.09 0.23 39 255 33 18
0.4–1.0 24 24 15.3 0.64 88 0.14 0.36 38 265 46 23
1.0–3.0 7 7 11.1 1.59 100 0.17 0.70 24 421 57 23
>3 1 1 3.3 3.26 100 0.23 0.92 25 392 100 15
Total 99 100 36.7 0.37 67 0.14 0.33 41 242 26 21
Table 4. Summary of aquaculture landholdings in Bawalia, disaggregated by landownership category.
Landholding category (ha)
Number of households
Households in group as % of all households
Total area of land owned by households in group (ha)
Mean area of land owned per household (ha)
Pond operators as % of households in group
Mean area of ponds owned per operating household (ha)
Mean area of ponds operated per operating household (ha)
Area of ponds owned as % of ponds operated
Area of ponds operated as % of ponds owned
Households leasing out land for aquaculture as % of households in group
Area leased out to aquaculture as % of all landholdings in group
<0.2 59 60 3.4 0.06 3 0.0 1.08 0.0 - 5 9
0.2–0.4 13 13 4.0 0.31 - - - - 31 17
0.4–1.0 20 20 12.9 0.65 10 0.06 0.19 31.5 316.6 60 23
1.0–3.0 4 4 4.9 1.22 - - - - - 100 20
>3 2 2 7.8 3.89 - - - - - 100 22
Total 98 100 33.0 0.34 4 0.06 0.63 - - 28 20
Table 5. Summary of aquaculture landholdings in Medila, disaggregated by landownership category.
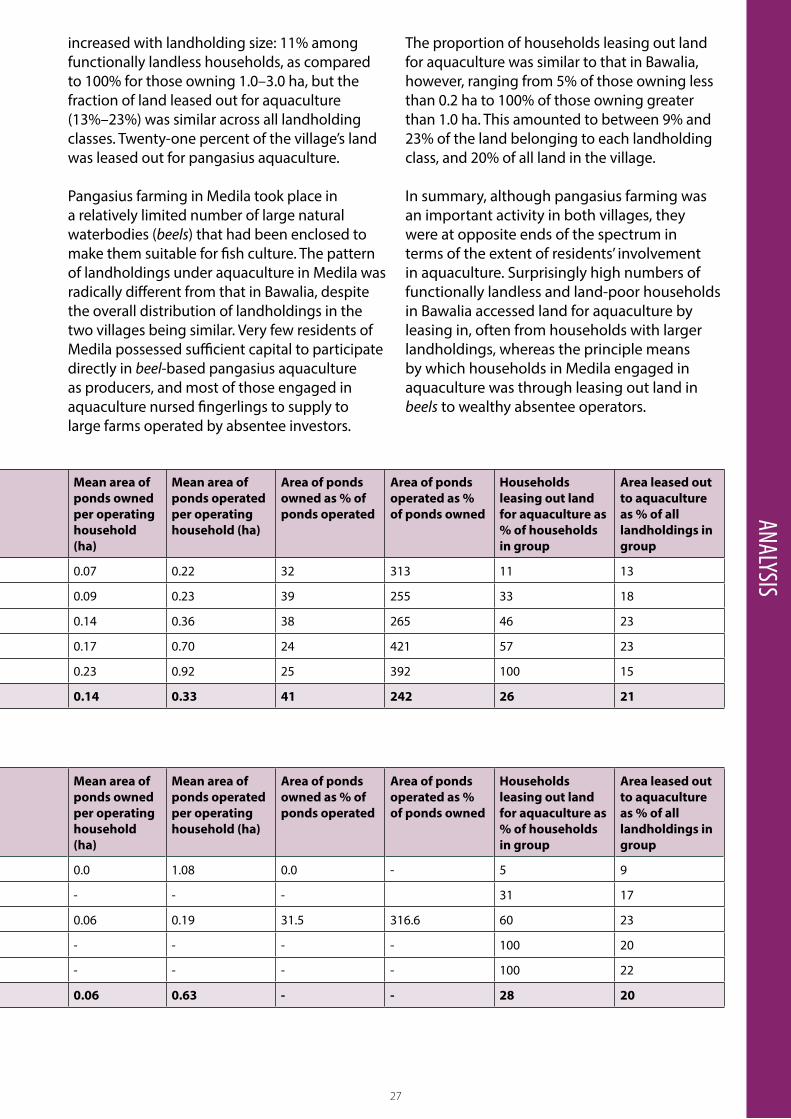
The proportion of households leasing out land for aquaculture was similar to that in Bawalia, however, ranging from 5% of those owning less than 0.2 ha to 100% of those owning greater than 1.0 ha. This amounted to between 9% and 23% of the land belonging to each landholding class, and 20% of all land in the village.
In summary, although pangasius farming was an important activity in both villages, they were at opposite ends of the spectrum in terms of the extent of residents’ involvement in aquaculture. Surprisingly high numbers of functionally landless and land-poor households in Bawalia accessed land for aquaculture by leasing in, often from households with larger landholdings, whereas the principle means by which households in Medila engaged in aquaculture was through leasing out land in beels to wealthy absentee operators.
28
ANALYSIS
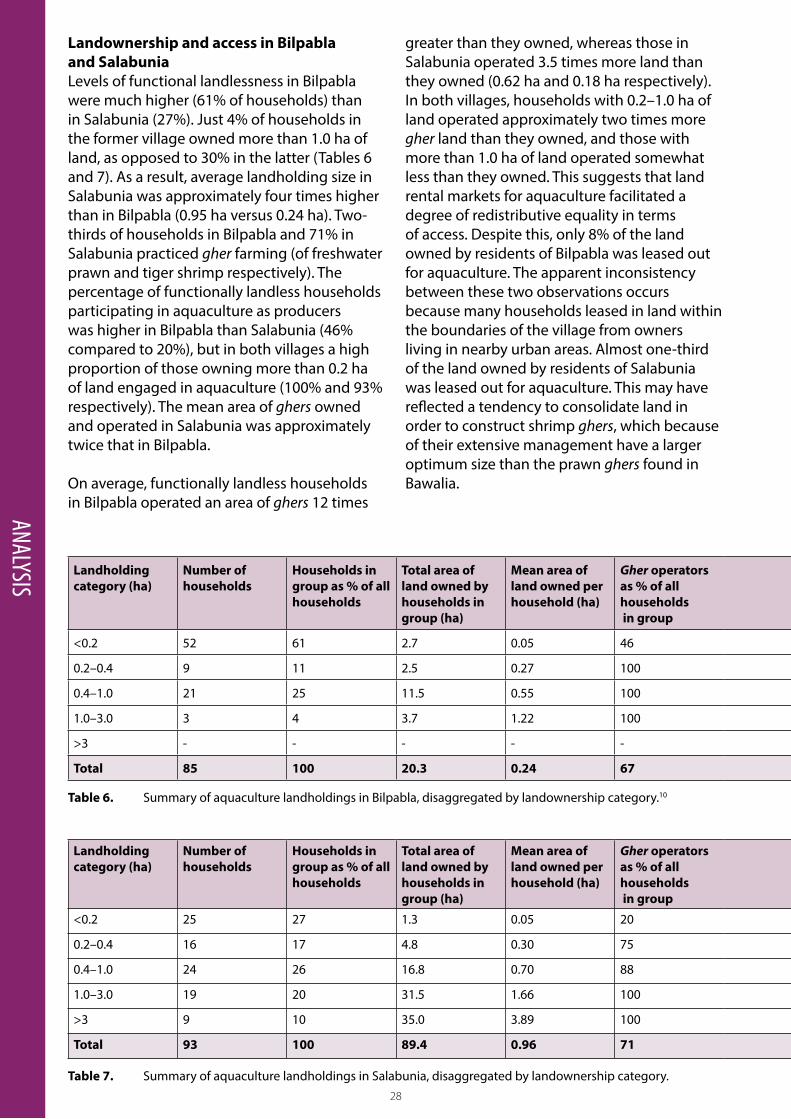
Landownership and access in Bilpabla and SalabuniaLevels of functional landlessness in Bilpabla were much higher (61% of households) than in Salabunia (27%). Just 4% of households in the former village owned more than 1.0 ha of land, as opposed to 30% in the latter (Tables 6 and 7). As a result, average landholding size in Salabunia was approximately four times higher than in Bilpabla (0.95 ha versus 0.24 ha). Two-thirds of households in Bilpabla and 71% in Salabunia practiced gher farming (of freshwater prawn and tiger shrimp respectively). The percentage of functionally landless households participating in aquaculture as producers was higher in Bilpabla than Salabunia (46% compared to 20%), but in both villages a high proportion of those owning more than 0.2 ha of land engaged in aquaculture (100% and 93% respectively). The mean area of ghers owned and operated in Salabunia was approximately twice that in Bilpabla.
On average, functionally landless households in Bilpabla operated an area of ghers 12 times
Landholding category (ha)
Number of households
Households in group as % of all households
Total area of land owned by households in group (ha)
Mean area of land owned per household (ha)
Gher operators as % of all households in group
Mean area of ghers owned per gher-operating household
Mean area of ghers operated per gher-operating household
Gher area owned as % of gher area operated
Gher area operated as % of land owned
Gher area leased out as % of land owned
<0.2 52 61 2.7 0.05 46 0.08 0.62 13 1208 0
0.2–0.4 9 11 2.5 0.27 100 0.15 0.44 34 161 0
0.4–1.0 21 25 11.5 0.55 100 0.21 0.69 31 125 11
1.0–3.0 3 4 3.7 1.22 100 0.37 0.77 48 63 11
>3 - - - - - - - - - -
Total 85 100 20.3 0.24 67 0.22 0.62 35 260 8
Table 6. Summary of aquaculture landholdings in Bilpabla, disaggregated by landownership category.10
Landholding category (ha)
Number of households
Households in group as % of all households
Total area of land owned by households in group (ha)
Mean area of land owned per household (ha)
Gher operators as % of all households in group
Mean area of ghers owned per gher-operating household
Mean area of ghers operated per gher-operating household
Gher area owned as % of gher area operated
Gher area operated as % of land owned
Gher area leased out as % of land owned
<0.2 25 27 1.3 0.05 20 0.12 0.18 69 348 25
0.2–0.4 16 17 4.8 0.30 75 0.18 0.34 53 114 31
0.4–1.0 24 26 16.8 0.70 88 0.32 0.99 32 142 35
1.0–3.0 19 20 31.5 1.66 100 0.49 1.12 44 67 28
>3 9 10 35.0 3.89 100 0.81 2.28 36 58 31
Total 93 100 89.4 0.96 71 0.50 1.02 48 107 31
Table 7. Summary of aquaculture landholdings in Salabunia, disaggregated by landownership category.
greater than they owned, whereas those in Salabunia operated 3.5 times more land than they owned (0.62 ha and 0.18 ha respectively). In both villages, households with 0.2–1.0 ha of land operated approximately two times more gher land than they owned, and those with more than 1.0 ha of land operated somewhat less than they owned. This suggests that land rental markets for aquaculture facilitated a degree of redistributive equality in terms of access. Despite this, only 8% of the land owned by residents of Bilpabla was leased out for aquaculture. The apparent inconsistency between these two observations occurs because many households leased in land within the boundaries of the village from owners living in nearby urban areas. Almost one-third of the land owned by residents of Salabunia was leased out for aquaculture. This may have reflected a tendency to consolidate land in order to construct shrimp ghers, which because of their extensive management have a larger optimum size than the prawn ghers found in Bawalia.
29
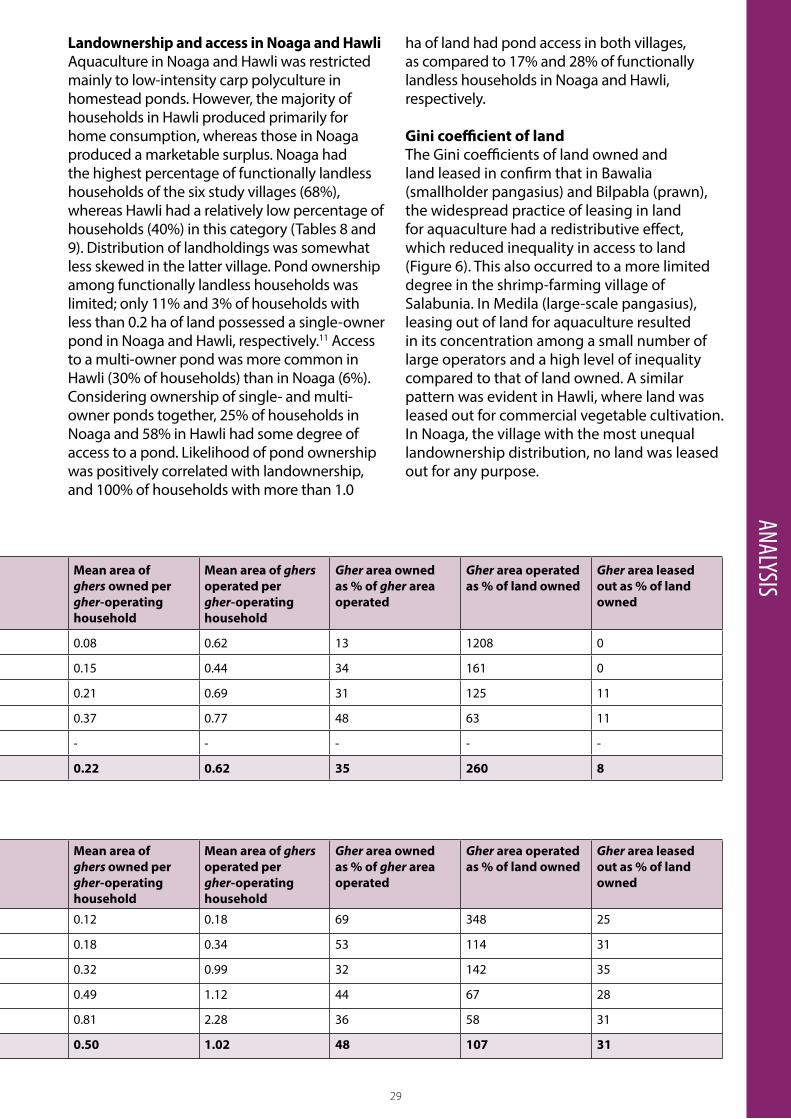
ANALYSISLandownership and access in Noaga and HawliAquaculture in Noaga and Hawli was restricted mainly to low-intensity carp polyculture in homestead ponds. However, the majority of households in Hawli produced primarily for home consumption, whereas those in Noaga produced a marketable surplus. Noaga had the highest percentage of functionally landless households of the six study villages (68%), whereas Hawli had a relatively low percentage of households (40%) in this category (Tables 8 and 9). Distribution of landholdings was somewhat less skewed in the latter village. Pond ownership among functionally landless households was limited; only 11% and 3% of households with less than 0.2 ha of land possessed a single-owner pond in Noaga and Hawli, respectively.11 Access to a multi-owner pond was more common in Hawli (30% of households) than in Noaga (6%). Considering ownership of single- and multi-owner ponds together, 25% of households in Noaga and 58% in Hawli had some degree of access to a pond. Likelihood of pond ownership was positively correlated with landownership, and 100% of households with more than 1.0
Landholding category (ha)
Number of households
Households in group as % of all households
Total area of land owned by households in group (ha)
Mean area of land owned per household (ha)
Gher operators as % of all households in group
Mean area of ghers owned per gher-operating household
Mean area of ghers operated per gher-operating household
Gher area owned as % of gher area operated
Gher area operated as % of land owned
Gher area leased out as % of land owned
<0.2 52 61 2.7 0.05 46 0.08 0.62 13 1208 0
0.2–0.4 9 11 2.5 0.27 100 0.15 0.44 34 161 0
0.4–1.0 21 25 11.5 0.55 100 0.21 0.69 31 125 11
1.0–3.0 3 4 3.7 1.22 100 0.37 0.77 48 63 11
>3 - - - - - - - - - -
Total 85 100 20.3 0.24 67 0.22 0.62 35 260 8
Table 6. Summary of aquaculture landholdings in Bilpabla, disaggregated by landownership category.10
Landholding category (ha)
Number of households
Households in group as % of all households
Total area of land owned by households in group (ha)
Mean area of land owned per household (ha)
Gher operators as % of all households in group
Mean area of ghers owned per gher-operating household
Mean area of ghers operated per gher-operating household
Gher area owned as % of gher area operated
Gher area operated as % of land owned
Gher area leased out as % of land owned
<0.2 25 27 1.3 0.05 20 0.12 0.18 69 348 25
0.2–0.4 16 17 4.8 0.30 75 0.18 0.34 53 114 31
0.4–1.0 24 26 16.8 0.70 88 0.32 0.99 32 142 35
1.0–3.0 19 20 31.5 1.66 100 0.49 1.12 44 67 28
>3 9 10 35.0 3.89 100 0.81 2.28 36 58 31
Total 93 100 89.4 0.96 71 0.50 1.02 48 107 31
Table 7. Summary of aquaculture landholdings in Salabunia, disaggregated by landownership category.
ha of land had pond access in both villages, as compared to 17% and 28% of functionally landless households in Noaga and Hawli, respectively.
Gini coefficient of landThe Gini coefficients of land owned and land leased in confirm that in Bawalia (smallholder pangasius) and Bilpabla (prawn), the widespread practice of leasing in land for aquaculture had a redistributive effect, which reduced inequality in access to land (Figure 6). This also occurred to a more limited degree in the shrimp-farming village of Salabunia. In Medila (large-scale pangasius), leasing out of land for aquaculture resulted in its concentration among a small number of large operators and a high level of inequality compared to that of land owned. A similar pattern was evident in Hawli, where land was leased out for commercial vegetable cultivation. In Noaga, the village with the most unequal landownership distribution, no land was leased out for any purpose.
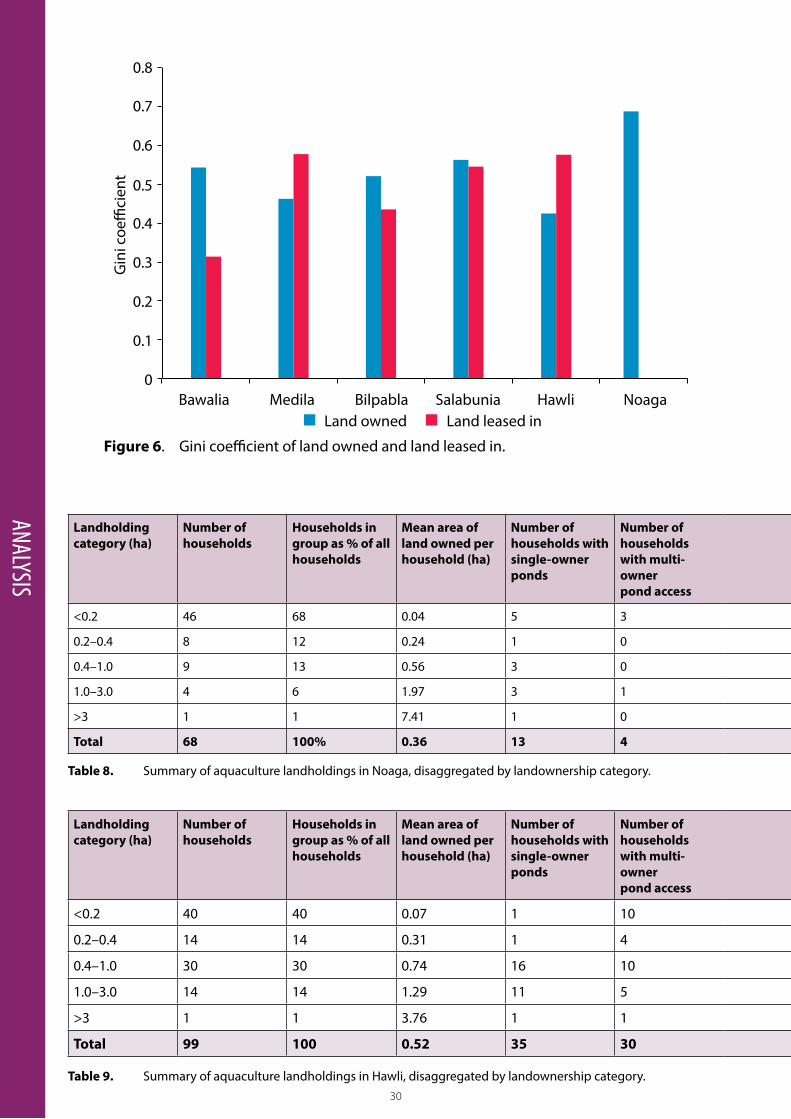
30
ANALYSIS
Landholding category (ha)
Number of households
Households in group as % of all households
Mean area of land owned per household (ha)
Number of households with single-owner ponds
Number of households with multi-owner pond access
Households with single-owner ponds as % of all households in group
Households with multi-owner pond access as % of households in group
Households with pond access as % of households in group
Mean pond area (ha)
Mean pond area as % of mean area of land owned
<0.2 46 68 0.04 5 3 11 7 17 0.04 92
0.2–0.4 8 12 0.24 1 0 13 0 13 0.02 8
0.4–1.0 9 13 0.56 3 0 33 0 33 0.07 13
1.0–3.0 4 6 1.97 3 1 75 25 100 0.08 4
>3 1 1 7.41 1 0 100 0 100 0.32 4
Total 68 100% 0.36 13 4 19 6 25 0.07 20
Table 8. Summary of aquaculture landholdings in Noaga, disaggregated by landownership category.
Landholding category (ha)
Number of households
Households in group as % of all households
Mean area of land owned per household (ha)
Number of households with single-owner ponds
Number of households with multi-owner pond access
Households with single-owner ponds as % of all households in group
Households with multi-owner pond access as % of households in group
Households with pond access as % of households in group
Mean pond area (ha)
Mean pond area as % of mean area of land owned
<0.2 40 40 0.07 1 10 3 25 28 0.05 73
0.2–0.4 14 14 0.31 1 4 7 29 36 0.06 19
0.4–1.0 30 30 0.74 16 10 53 33 87 0.06 7
1.0–3.0 14 14 1.29 11 5 79 36 100 0.07 5
>3 1 1 3.76 1 1 100 100 100 0.06 2
Total 99 100 0.52 35 30 30 30 58 0.06 11
Table 9. Summary of aquaculture landholdings in Hawli, disaggregated by landownership category.
Figure 6. Gini coefficient of land owned and land leased in.
Bawalia Bilpabla Salabunia NoagaHawliMedilaLand owned Land leased in
0.6
0.8
0.4
0.5
0.7
0.3
0.2
0.1
0
Gin
i coe
ffici
ent
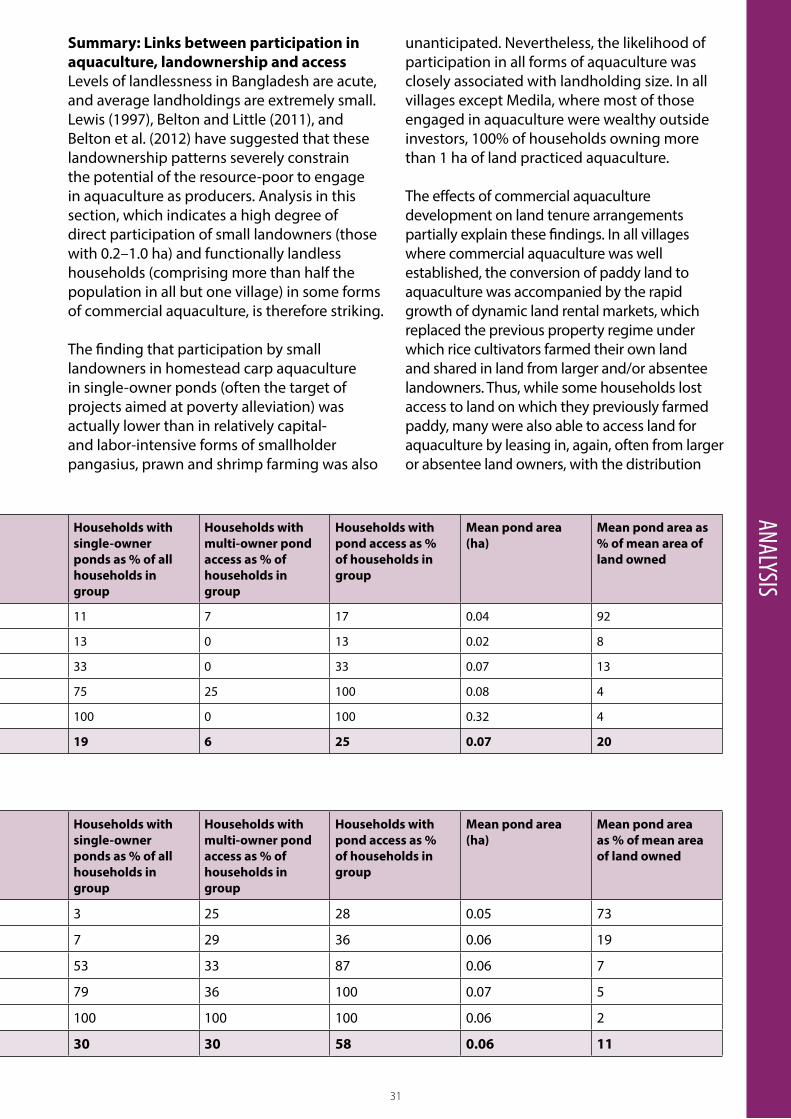
31
Summary: Links between participation in aquaculture, landownership and access Levels of landlessness in Bangladesh are acute, and average landholdings are extremely small. Lewis (1997), Belton and Little (2011), and Belton et al. (2012) have suggested that these landownership patterns severely constrain the potential of the resource-poor to engage in aquaculture as producers. Analysis in this section, which indicates a high degree of direct participation of small landowners (those with 0.2–1.0 ha) and functionally landless households (comprising more than half the population in all but one village) in some forms of commercial aquaculture, is therefore striking.
The finding that participation by small landowners in homestead carp aquaculture in single-owner ponds (often the target of projects aimed at poverty alleviation) was actually lower than in relatively capital- and labor-intensive forms of smallholder pangasius, prawn and shrimp farming was also
ANALYSISunanticipated. Nevertheless, the likelihood of participation in all forms of aquaculture was closely associated with landholding size. In all villages except Medila, where most of those engaged in aquaculture were wealthy outside investors, 100% of households owning more than 1 ha of land practiced aquaculture.
The effects of commercial aquaculture development on land tenure arrangements partially explain these findings. In all villages where commercial aquaculture was well established, the conversion of paddy land to aquaculture was accompanied by the rapid growth of dynamic land rental markets, which replaced the previous property regime under which rice cultivators farmed their own land and shared in land from larger and/or absentee landowners. Thus, while some households lost access to land on which they previously farmed paddy, many were also able to access land for aquaculture by leasing in, again, often from larger or absentee land owners, with the distribution
Landholding category (ha)
Number of households
Households in group as % of all households
Mean area of land owned per household (ha)
Number of households with single-owner ponds
Number of households with multi-owner pond access
Households with single-owner ponds as % of all households in group
Households with multi-owner pond access as % of households in group
Households with pond access as % of households in group
Mean pond area (ha)
Mean pond area as % of mean area of land owned
<0.2 46 68 0.04 5 3 11 7 17 0.04 92
0.2–0.4 8 12 0.24 1 0 13 0 13 0.02 8
0.4–1.0 9 13 0.56 3 0 33 0 33 0.07 13
1.0–3.0 4 6 1.97 3 1 75 25 100 0.08 4
>3 1 1 7.41 1 0 100 0 100 0.32 4
Total 68 100% 0.36 13 4 19 6 25 0.07 20
Table 8. Summary of aquaculture landholdings in Noaga, disaggregated by landownership category.
Landholding category (ha)
Number of households
Households in group as % of all households
Mean area of land owned per household (ha)
Number of households with single-owner ponds
Number of households with multi-owner pond access
Households with single-owner ponds as % of all households in group
Households with multi-owner pond access as % of households in group
Households with pond access as % of households in group
Mean pond area (ha)
Mean pond area as % of mean area of land owned
<0.2 40 40 0.07 1 10 3 25 28 0.05 73
0.2–0.4 14 14 0.31 1 4 7 29 36 0.06 19
0.4–1.0 30 30 0.74 16 10 53 33 87 0.06 7
1.0–3.0 14 14 1.29 11 5 79 36 100 0.07 5
>3 1 1 3.76 1 1 100 100 100 0.06 2
Total 99 100 0.52 35 30 30 30 58 0.06 11
Table 9. Summary of aquaculture landholdings in Hawli, disaggregated by landownership category.
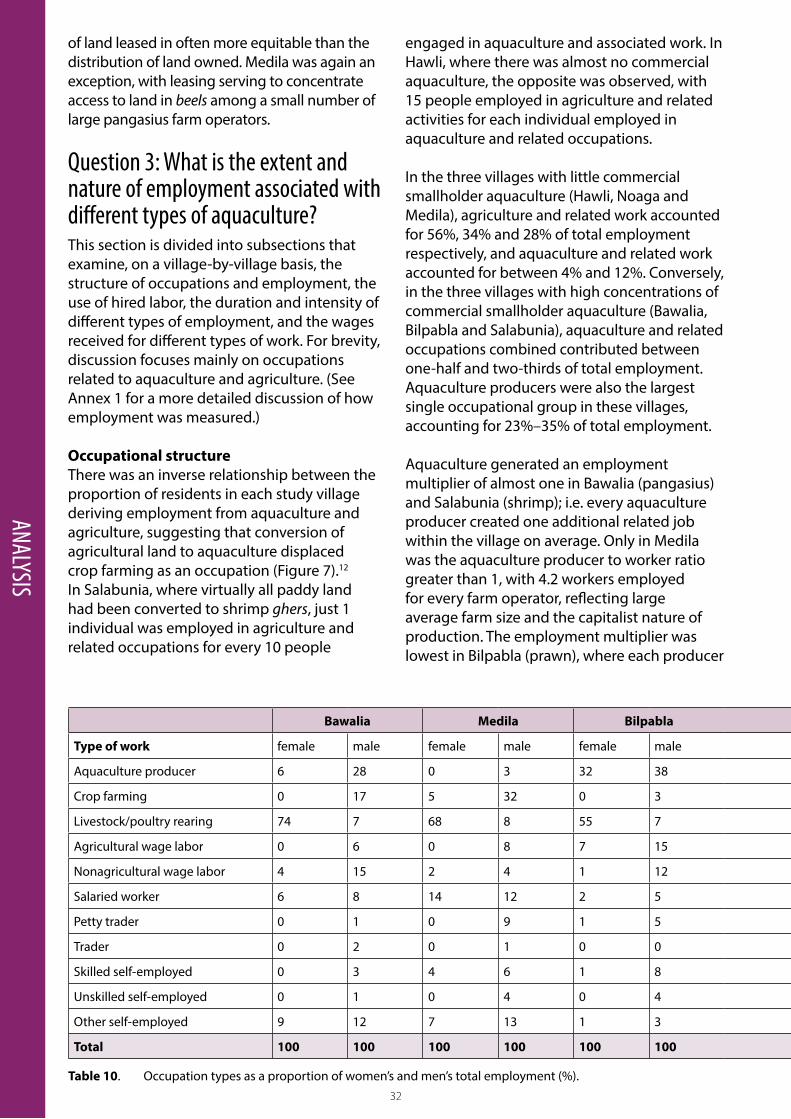
32
ANALYSIS
of land leased in often more equitable than the distribution of land owned. Medila was again an exception, with leasing serving to concentrate access to land in beels among a small number of large pangasius farm operators.
Question 3: What is the extent and nature of employment associated with different types of aquaculture?This section is divided into subsections that examine, on a village-by-village basis, the structure of occupations and employment, the use of hired labor, the duration and intensity of different types of employment, and the wages received for different types of work. For brevity, discussion focuses mainly on occupations related to aquaculture and agriculture. (See Annex 1 for a more detailed discussion of how employment was measured.)
Occupational structureThere was an inverse relationship between the proportion of residents in each study village deriving employment from aquaculture and agriculture, suggesting that conversion of agricultural land to aquaculture displaced crop farming as an occupation (Figure 7).12 In Salabunia, where virtually all paddy land had been converted to shrimp ghers, just 1 individual was employed in agriculture and related occupations for every 10 people
engaged in aquaculture and associated work. In Hawli, where there was almost no commercial aquaculture, the opposite was observed, with 15 people employed in agriculture and related activities for each individual employed in aquaculture and related occupations.
In the three villages with little commercial smallholder aquaculture (Hawli, Noaga and Medila), agriculture and related work accounted for 56%, 34% and 28% of total employment respectively, and aquaculture and related work accounted for between 4% and 12%. Conversely, in the three villages with high concentrations of commercial smallholder aquaculture (Bawalia, Bilpabla and Salabunia), aquaculture and related occupations combined contributed between one-half and two-thirds of total employment. Aquaculture producers were also the largest single occupational group in these villages, accounting for 23%–35% of total employment.
Aquaculture generated an employment multiplier of almost one in Bawalia (pangasius) and Salabunia (shrimp); i.e. every aquaculture producer created one additional related job within the village on average. Only in Medila was the aquaculture producer to worker ratio greater than 1, with 4.2 workers employed for every farm operator, reflecting large average farm size and the capitalist nature of production. The employment multiplier was lowest in Bilpabla (prawn), where each producer
Bawalia Medila Bilpabla Salabunia Noaga Hawli Total
Type of work female male female male female male female male female male female male female male
Aquaculture producer 6 28 0 3 32 38 15 43 2 5 0 3 9 20
Crop farming 0 17 5 32 0 3 1 3 2 27 0 49 1 22
Livestock/poultry rearing 74 7 68 8 55 7 45 3 72 7 84 3 66 6
Agricultural wage labor 0 6 0 8 7 15 27 17 0 20 0 25 6 15
Nonagricultural wage labor 4 15 2 4 1 12 0 0 0 7 4 4 2 7
Salaried worker 6 8 14 12 2 5 2 9 7 1 4 1 6 6
Petty trader 0 1 0 9 1 5 1 13 0 5 0 5 0 6
Trader 0 2 0 1 0 0 0 2 0 1 0 2 0 1
Skilled self-employed 0 3 4 6 1 8 6 3 0 11 4 3 3 6
Unskilled self-employed 0 1 0 4 0 4 0 0 2 6 0 1 0 3
Other self-employed 9 12 7 13 1 3 3 8 16 12 3 4 7 9
Total 100 100 100 100 100 100 100 100 100 100 100 100 100 100
Table 10. Occupation types as a proportion of women’s and men’s total employment (%).
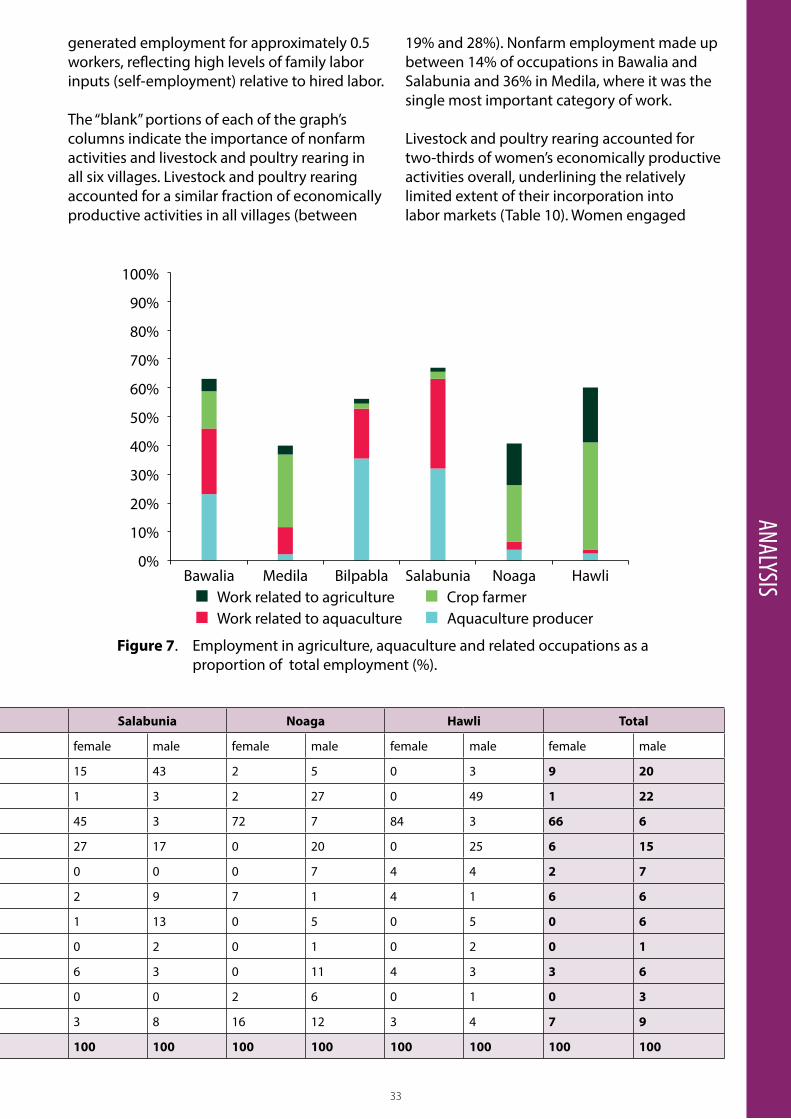
33
generated employment for approximately 0.5 workers, reflecting high levels of family labor inputs (self-employment) relative to hired labor.
The “blank” portions of each of the graph’s columns indicate the importance of nonfarm activities and livestock and poultry rearing in all six villages. Livestock and poultry rearing accounted for a similar fraction of economically productive activities in all villages (between
ANALYSISBawalia Bilpabla Salabunia Noaga HawliMedila
70%
90%
50%
100%
60%
80%
40%
30%
20%
10%
0%
Figure 7. Employment in agriculture, aquaculture and related occupations as a proportion of total employment (%).
Work related to agriculture Crop farmerWork related to aquaculture Aquaculture producer
Bawalia Medila Bilpabla Salabunia Noaga Hawli Total
Type of work female male female male female male female male female male female male female male
Aquaculture producer 6 28 0 3 32 38 15 43 2 5 0 3 9 20
Crop farming 0 17 5 32 0 3 1 3 2 27 0 49 1 22
Livestock/poultry rearing 74 7 68 8 55 7 45 3 72 7 84 3 66 6
Agricultural wage labor 0 6 0 8 7 15 27 17 0 20 0 25 6 15
Nonagricultural wage labor 4 15 2 4 1 12 0 0 0 7 4 4 2 7
Salaried worker 6 8 14 12 2 5 2 9 7 1 4 1 6 6
Petty trader 0 1 0 9 1 5 1 13 0 5 0 5 0 6
Trader 0 2 0 1 0 0 0 2 0 1 0 2 0 1
Skilled self-employed 0 3 4 6 1 8 6 3 0 11 4 3 3 6
Unskilled self-employed 0 1 0 4 0 4 0 0 2 6 0 1 0 3
Other self-employed 9 12 7 13 1 3 3 8 16 12 3 4 7 9
Total 100 100 100 100 100 100 100 100 100 100 100 100 100 100
Table 10. Occupation types as a proportion of women’s and men’s total employment (%).
19% and 28%). Nonfarm employment made up between 14% of occupations in Bawalia and Salabunia and 36% in Medila, where it was the single most important category of work.
Livestock and poultry rearing accounted for two-thirds of women’s economically productive activities overall, underlining the relatively limited extent of their incorporation into labor markets (Table 10). Women engaged
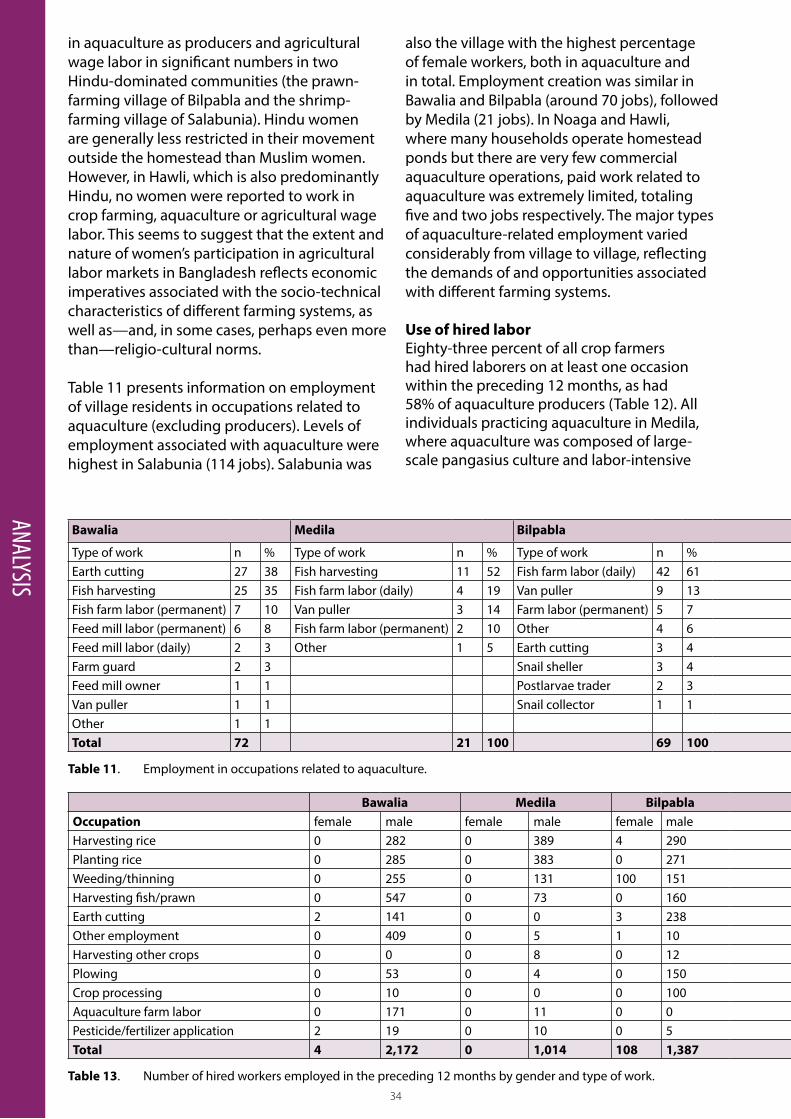
34
Bawalia Medila Bilpabla Salabunia Noaga Hawli
Type of work n % Type of work n % Type of work n % Type of work n % Type of work n % Type of work n %Earth cutting 27 38 Fish harvesting 11 52 Fish farm labor (daily) 42 61 Fish farm labor (daily) 69 61 Fish harvesting 4 80 Fish feed trader 1 50Fish harvesting 25 35 Fish farm labor (daily) 4 19 Van puller 9 13 Fish/shrimp trader 29 25 Other 1 20 Other 1 50Fish farm labor (permanent) 7 10 Van puller 3 14 Farm labor (permanent) 5 7 Other 5 4Feed mill labor (permanent) 6 8 Fish farm labor (permanent) 2 10 Other 4 6 Postlarvae trader 4 4Feed mill labor (daily) 2 3 Other 1 5 Earth cutting 3 4 Market labor (permanent) 3 3Farm guard 2 3 Snail sheller 3 4 Fish farm labor (permanent) 2 2Feed mill owner 1 1 Postlarvae trader 2 3 Farm guard 1 1Van puller 1 1 Snail collector 1 1 Fish feed trader 1 1Other 1 1Total 72 21 100 69 100 114 100 5 100 2 100
Table 11. Employment in occupations related to aquaculture.ANALYSIS
in aquaculture as producers and agricultural wage labor in significant numbers in two Hindu-dominated communities (the prawn-farming village of Bilpabla and the shrimp-farming village of Salabunia). Hindu women are generally less restricted in their movement outside the homestead than Muslim women. However, in Hawli, which is also predominantly Hindu, no women were reported to work in crop farming, aquaculture or agricultural wage labor. This seems to suggest that the extent and nature of women’s participation in agricultural labor markets in Bangladesh reflects economic imperatives associated with the socio-technical characteristics of different farming systems, as well as—and, in some cases, perhaps even more than—religio-cultural norms.
Table 11 presents information on employment of village residents in occupations related to aquaculture (excluding producers). Levels of employment associated with aquaculture were highest in Salabunia (114 jobs). Salabunia was
also the village with the highest percentage of female workers, both in aquaculture and in total. Employment creation was similar in Bawalia and Bilpabla (around 70 jobs), followed by Medila (21 jobs). In Noaga and Hawli, where many households operate homestead ponds but there are very few commercial aquaculture operations, paid work related to aquaculture was extremely limited, totaling five and two jobs respectively. The major types of aquaculture-related employment varied considerably from village to village, reflecting the demands of and opportunities associated with different farming systems.
Use of hired labor Eighty-three percent of all crop farmers had hired laborers on at least one occasion within the preceding 12 months, as had 58% of aquaculture producers (Table 12). All individuals practicing aquaculture in Medila, where aquaculture was composed of large-scale pangasius culture and labor-intensive
Bawalia Medila Bilpabla Salabunia Noaga Hawli TotalOccupation female male female male female male female male female male female male female male male + femaleHarvesting rice 0 282 0 389 4 290 27 78 0 574 0 1,043 31 2,656 2,687Planting rice 0 285 0 383 0 271 2 136 0 616 0 993 2 2,684 2,686Weeding/thinning 0 255 0 131 100 151 315 18 0 290 0 875 415 1,720 2,135Harvesting fish/prawn 0 547 0 73 0 160 8 26 0 14 0 10 8 830 838Earth cutting 2 141 0 0 3 238 65 273 0 0 0 7 68 659 727Other employment 0 409 0 5 1 10 0 15 0 16 0 9 3 464 467Harvesting other crops 0 0 0 8 0 12 4 2 0 0 9 367 13 389 402Plowing 0 53 0 4 0 150 2 13 0 6 0 95 2 321 323Crop processing 0 10 0 0 0 100 5 6 0 0 10 100 15 216 231Aquaculture farm labor 0 171 0 11 0 0 0 9 0 18 0 1 0 210 210Pesticide/fertilizer application 2 19 0 10 0 5 34 25 0 10 0 48 34 117 151Total 4 2,172 0 1,014 108 1,387 462 601 0 1,544 19 3,548 591 10,266 10,857
Table 13. Number of hired workers employed in the preceding 12 months by gender and type of work.
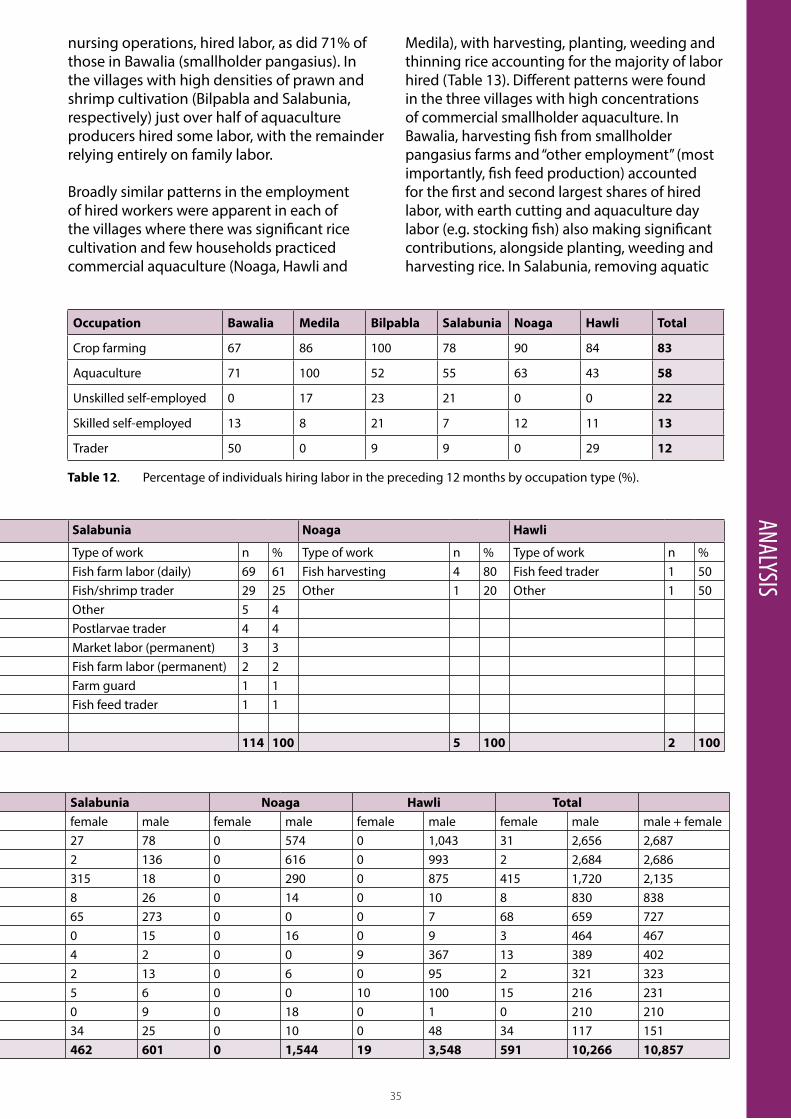
35
Bawalia Medila Bilpabla Salabunia Noaga Hawli
Type of work n % Type of work n % Type of work n % Type of work n % Type of work n % Type of work n %Earth cutting 27 38 Fish harvesting 11 52 Fish farm labor (daily) 42 61 Fish farm labor (daily) 69 61 Fish harvesting 4 80 Fish feed trader 1 50Fish harvesting 25 35 Fish farm labor (daily) 4 19 Van puller 9 13 Fish/shrimp trader 29 25 Other 1 20 Other 1 50Fish farm labor (permanent) 7 10 Van puller 3 14 Farm labor (permanent) 5 7 Other 5 4Feed mill labor (permanent) 6 8 Fish farm labor (permanent) 2 10 Other 4 6 Postlarvae trader 4 4Feed mill labor (daily) 2 3 Other 1 5 Earth cutting 3 4 Market labor (permanent) 3 3Farm guard 2 3 Snail sheller 3 4 Fish farm labor (permanent) 2 2Feed mill owner 1 1 Postlarvae trader 2 3 Farm guard 1 1Van puller 1 1 Snail collector 1 1 Fish feed trader 1 1Other 1 1Total 72 21 100 69 100 114 100 5 100 2 100
Table 11. Employment in occupations related to aquaculture.
ANALYSISnursing operations, hired labor, as did 71% of those in Bawalia (smallholder pangasius). In the villages with high densities of prawn and shrimp cultivation (Bilpabla and Salabunia, respectively) just over half of aquaculture producers hired some labor, with the remainder relying entirely on family labor.
Broadly similar patterns in the employment of hired workers were apparent in each of the villages where there was significant rice cultivation and few households practiced commercial aquaculture (Noaga, Hawli and
Occupation Bawalia Medila Bilpabla Salabunia Noaga Hawli Total
Crop farming 67 86 100 78 90 84 83
Aquaculture 71 100 52 55 63 43 58
Unskilled self-employed 0 17 23 21 0 0 22
Skilled self-employed 13 8 21 7 12 11 13
Trader 50 0 9 9 0 29 12
Table 12. Percentage of individuals hiring labor in the preceding 12 months by occupation type (%).
Medila), with harvesting, planting, weeding and thinning rice accounting for the majority of labor hired (Table 13). Different patterns were found in the three villages with high concentrations of commercial smallholder aquaculture. In Bawalia, harvesting fish from smallholder pangasius farms and “other employment” (most importantly, fish feed production) accounted for the first and second largest shares of hired labor, with earth cutting and aquaculture day labor (e.g. stocking fish) also making significant contributions, alongside planting, weeding and harvesting rice. In Salabunia, removing aquatic
Bawalia Medila Bilpabla Salabunia Noaga Hawli TotalOccupation female male female male female male female male female male female male female male male + femaleHarvesting rice 0 282 0 389 4 290 27 78 0 574 0 1,043 31 2,656 2,687Planting rice 0 285 0 383 0 271 2 136 0 616 0 993 2 2,684 2,686Weeding/thinning 0 255 0 131 100 151 315 18 0 290 0 875 415 1,720 2,135Harvesting fish/prawn 0 547 0 73 0 160 8 26 0 14 0 10 8 830 838Earth cutting 2 141 0 0 3 238 65 273 0 0 0 7 68 659 727Other employment 0 409 0 5 1 10 0 15 0 16 0 9 3 464 467Harvesting other crops 0 0 0 8 0 12 4 2 0 0 9 367 13 389 402Plowing 0 53 0 4 0 150 2 13 0 6 0 95 2 321 323Crop processing 0 10 0 0 0 100 5 6 0 0 10 100 15 216 231Aquaculture farm labor 0 171 0 11 0 0 0 9 0 18 0 1 0 210 210Pesticide/fertilizer application 2 19 0 10 0 5 34 25 0 10 0 48 34 117 151Total 4 2,172 0 1,014 108 1,387 462 601 0 1,544 19 3,548 591 10,266 10,857
Table 13. Number of hired workers employed in the preceding 12 months by gender and type of work.
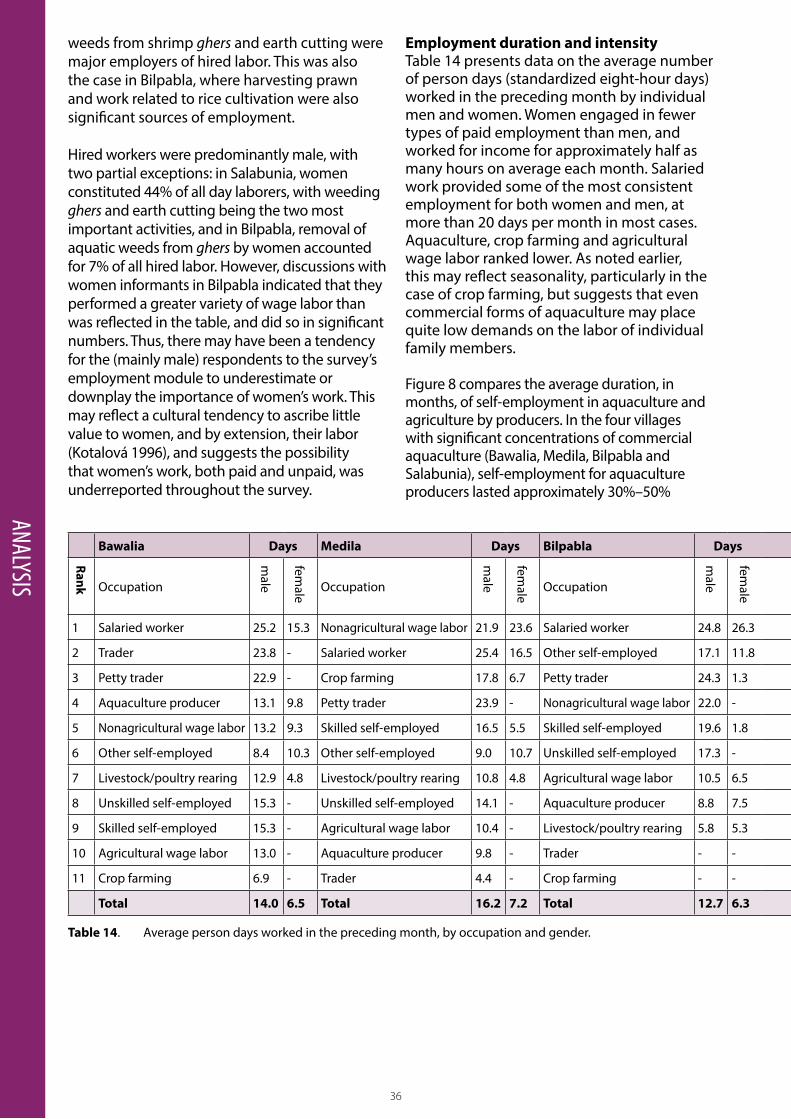
36
ANALYSIS
weeds from shrimp ghers and earth cutting were major employers of hired labor. This was also the case in Bilpabla, where harvesting prawn and work related to rice cultivation were also significant sources of employment.
Hired workers were predominantly male, with two partial exceptions: in Salabunia, women constituted 44% of all day laborers, with weeding ghers and earth cutting being the two most important activities, and in Bilpabla, removal of aquatic weeds from ghers by women accounted for 7% of all hired labor. However, discussions with women informants in Bilpabla indicated that they performed a greater variety of wage labor than was reflected in the table, and did so in significant numbers. Thus, there may have been a tendency for the (mainly male) respondents to the survey’s employment module to underestimate or downplay the importance of women’s work. This may reflect a cultural tendency to ascribe little value to women, and by extension, their labor (Kotalová 1996), and suggests the possibility that women’s work, both paid and unpaid, was underreported throughout the survey.
Employment duration and intensityTable 14 presents data on the average number of person days (standardized eight-hour days) worked in the preceding month by individual men and women. Women engaged in fewer types of paid employment than men, and worked for income for approximately half as many hours on average each month. Salaried work provided some of the most consistent employment for both women and men, at more than 20 days per month in most cases. Aquaculture, crop farming and agricultural wage labor ranked lower. As noted earlier, this may reflect seasonality, particularly in the case of crop farming, but suggests that even commercial forms of aquaculture may place quite low demands on the labor of individual family members.
Figure 8 compares the average duration, in months, of self-employment in aquaculture and agriculture by producers. In the four villages with significant concentrations of commercial aquaculture (Bawalia, Medila, Bilpabla and Salabunia), self-employment for aquaculture producers lasted approximately 30%–50%
Bawalia Days Medila Days Bilpabla Days Salabunia Days Noaga Days Hawli Days
Rank Occupation
male
female Occupation
male
female Occupation
male
female Occupation
male
female Occupation
male
female Occupation
male
female
1 Salaried worker 25.2 15.3 Nonagricultural wage labor 21.9 23.6 Salaried worker 24.8 26.3 Petty trader 23.7 23.3 Salaried worker 22.3 18.9 Salaried worker 24.2 17.8
2 Trader 23.8 - Salaried worker 25.4 16.5 Other self-employed 17.1 11.8 Salaried worker 31.3 12.3 Unskilled self-employed 21.1 19.3 Skilled self-employed 28.3 11.7
3 Petty trader 22.9 - Crop farming 17.8 6.7 Petty trader 24.3 1.3 Trader 27.5 - Skilled self-employed 26.5 - Nonagricultural wage labor 17.3 15.8
4 Aquaculture producer 13.1 9.8 Petty trader 23.9 - Nonagricultural wage labor 22.0 - Other self-employed 17.6 6.6 Petty trader 26.3 - Unskilled self-employed 17.8 -
5 Nonagricultural wage labor 13.2 9.3 Skilled self-employed 16.5 5.5 Skilled self-employed 19.6 1.8 Nonagricultural wage labor 22.3 - Trader 22.5 - Other self-employed 7.8 7.2
6 Other self-employed 8.4 10.3 Other self-employed 9.0 10.7 Unskilled self-employed 17.3 - Livestock/poultry rearing 10.9 5.6 Nonagricultural wage labor 21.4 - Livestock/poultry rearing 6.5 6.6
7 Livestock/poultry rearing 12.9 4.8 Livestock/poultry rearing 10.8 4.8 Agricultural wage labor 10.5 6.5 Skilled self-employed 9.0 7.4 Other self-employed 14.1 6.5 Petty trader 12.4 -
8 Unskilled self-employed 15.3 - Unskilled self-employed 14.1 - Aquaculture producer 8.8 7.5 Aquaculture producer 9.1 5.3 Livestock/poultry rearing 7.9 4.4 Trader 10.6 -
9 Skilled self-employed 15.3 - Agricultural wage labor 10.4 - Livestock/poultry rearing 5.8 5.3 Agricultural wage labor 7.0 6.9 Aquaculture producer 3.0 2.1 Agricultural wage labor 9.8 -
10 Agricultural wage labor 13.0 - Aquaculture producer 9.8 - Trader - - Crop farming 1.6 - Crop farming 4.2 0.5 Aquaculture producer 6.6 -
11 Crop farming 6.9 - Trader 4.4 - Crop farming - - Unskilled self-employed - - Agricultural wage labor 3.0 - Crop farming 6.0 -
Total 14.0 6.5 Total 16.2 7.2 Total 12.7 6.3 Total 14.7 6.4 Total 16.1 5.6 Total 9.4 7.8
Table 14. Average person days worked in the preceding month, by occupation and gender.
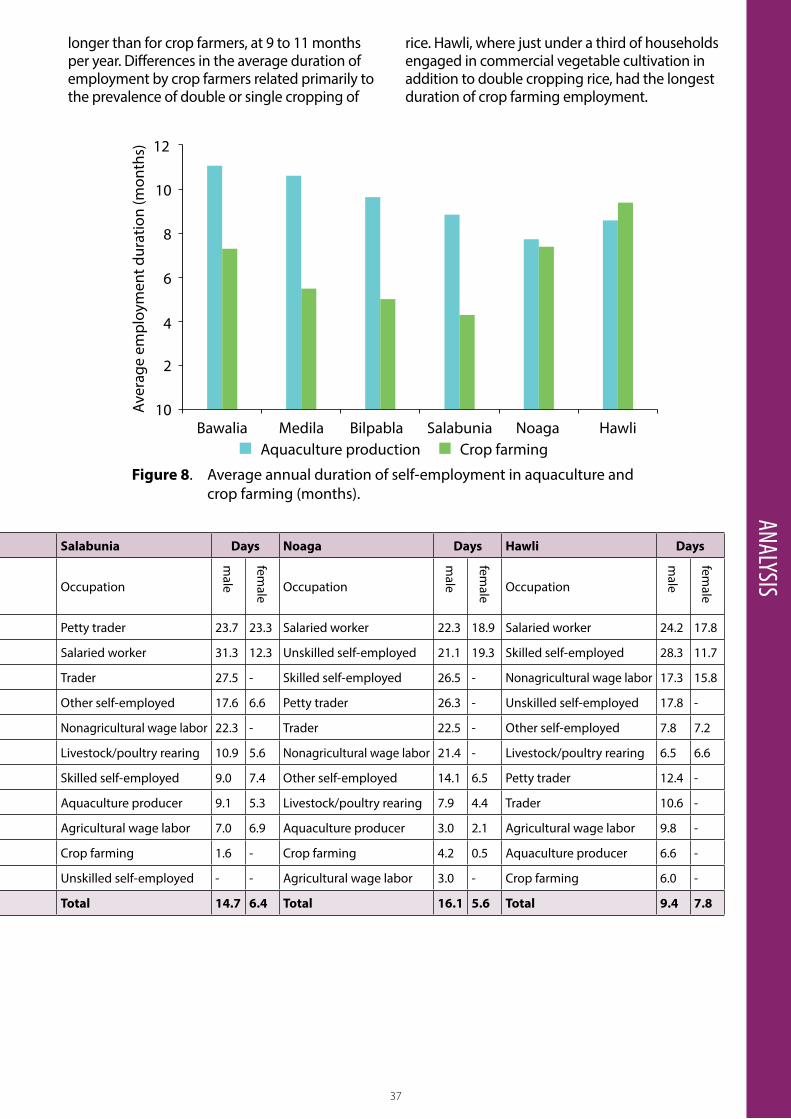
37
ANALYSIS
Bawalia Days Medila Days Bilpabla Days Salabunia Days Noaga Days Hawli Days
Rank Occupation
male
female Occupation
male
female Occupation
male
female Occupation
male
female Occupation
male
female Occupation
male
female
1 Salaried worker 25.2 15.3 Nonagricultural wage labor 21.9 23.6 Salaried worker 24.8 26.3 Petty trader 23.7 23.3 Salaried worker 22.3 18.9 Salaried worker 24.2 17.8
2 Trader 23.8 - Salaried worker 25.4 16.5 Other self-employed 17.1 11.8 Salaried worker 31.3 12.3 Unskilled self-employed 21.1 19.3 Skilled self-employed 28.3 11.7
3 Petty trader 22.9 - Crop farming 17.8 6.7 Petty trader 24.3 1.3 Trader 27.5 - Skilled self-employed 26.5 - Nonagricultural wage labor 17.3 15.8
4 Aquaculture producer 13.1 9.8 Petty trader 23.9 - Nonagricultural wage labor 22.0 - Other self-employed 17.6 6.6 Petty trader 26.3 - Unskilled self-employed 17.8 -
5 Nonagricultural wage labor 13.2 9.3 Skilled self-employed 16.5 5.5 Skilled self-employed 19.6 1.8 Nonagricultural wage labor 22.3 - Trader 22.5 - Other self-employed 7.8 7.2
6 Other self-employed 8.4 10.3 Other self-employed 9.0 10.7 Unskilled self-employed 17.3 - Livestock/poultry rearing 10.9 5.6 Nonagricultural wage labor 21.4 - Livestock/poultry rearing 6.5 6.6
7 Livestock/poultry rearing 12.9 4.8 Livestock/poultry rearing 10.8 4.8 Agricultural wage labor 10.5 6.5 Skilled self-employed 9.0 7.4 Other self-employed 14.1 6.5 Petty trader 12.4 -
8 Unskilled self-employed 15.3 - Unskilled self-employed 14.1 - Aquaculture producer 8.8 7.5 Aquaculture producer 9.1 5.3 Livestock/poultry rearing 7.9 4.4 Trader 10.6 -
9 Skilled self-employed 15.3 - Agricultural wage labor 10.4 - Livestock/poultry rearing 5.8 5.3 Agricultural wage labor 7.0 6.9 Aquaculture producer 3.0 2.1 Agricultural wage labor 9.8 -
10 Agricultural wage labor 13.0 - Aquaculture producer 9.8 - Trader - - Crop farming 1.6 - Crop farming 4.2 0.5 Aquaculture producer 6.6 -
11 Crop farming 6.9 - Trader 4.4 - Crop farming - - Unskilled self-employed - - Agricultural wage labor 3.0 - Crop farming 6.0 -
Total 14.0 6.5 Total 16.2 7.2 Total 12.7 6.3 Total 14.7 6.4 Total 16.1 5.6 Total 9.4 7.8
Table 14. Average person days worked in the preceding month, by occupation and gender.
Figure 8. Average annual duration of self-employment in aquaculture and crop farming (months).
Bawalia Bilpabla Salabunia Noaga HawliMedilaAquaculture production Crop farming
6
10
12
4
8
2
10Aver
age
empl
oym
ent d
urat
ion
(mon
ths)
longer than for crop farmers, at 9 to 11 months per year. Differences in the average duration of employment by crop farmers related primarily to the prevalence of double or single cropping of
rice. Hawli, where just under a third of households engaged in commercial vegetable cultivation in addition to double cropping rice, had the longest duration of crop farming employment.
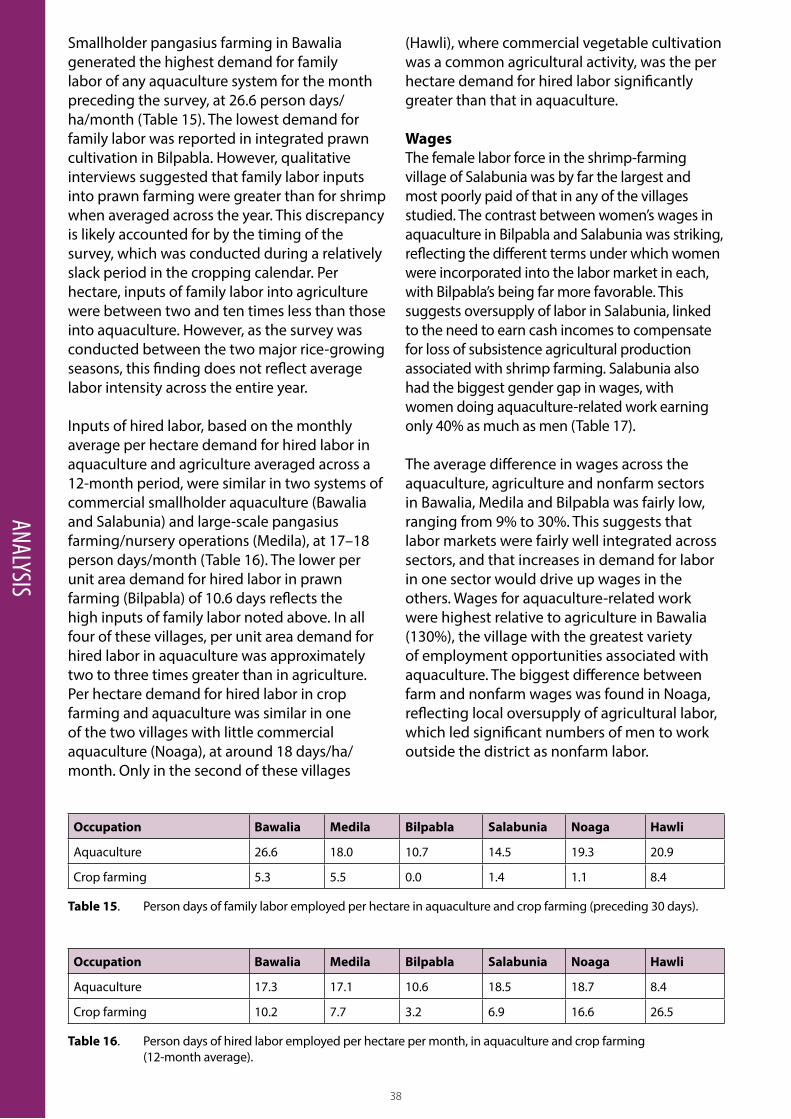
38
Smallholder pangasius farming in Bawalia generated the highest demand for family labor of any aquaculture system for the month preceding the survey, at 26.6 person days/ha/month (Table 15). The lowest demand for family labor was reported in integrated prawn cultivation in Bilpabla. However, qualitative interviews suggested that family labor inputs into prawn farming were greater than for shrimp when averaged across the year. This discrepancy is likely accounted for by the timing of the survey, which was conducted during a relatively slack period in the cropping calendar. Per hectare, inputs of family labor into agriculture were between two and ten times less than those into aquaculture. However, as the survey was conducted between the two major rice-growing seasons, this finding does not reflect average labor intensity across the entire year.
Inputs of hired labor, based on the monthly average per hectare demand for hired labor in aquaculture and agriculture averaged across a 12-month period, were similar in two systems of commercial smallholder aquaculture (Bawalia and Salabunia) and large-scale pangasius farming/nursery operations (Medila), at 17–18 person days/month (Table 16). The lower per unit area demand for hired labor in prawn farming (Bilpabla) of 10.6 days reflects the high inputs of family labor noted above. In all four of these villages, per unit area demand for hired labor in aquaculture was approximately two to three times greater than in agriculture. Per hectare demand for hired labor in crop farming and aquaculture was similar in one of the two villages with little commercial aquaculture (Noaga), at around 18 days/ha/month. Only in the second of these villages
ANALYSIS
(Hawli), where commercial vegetable cultivation was a common agricultural activity, was the per hectare demand for hired labor significantly greater than that in aquaculture.
WagesThe female labor force in the shrimp-farming village of Salabunia was by far the largest and most poorly paid of that in any of the villages studied. The contrast between women’s wages in aquaculture in Bilpabla and Salabunia was striking, reflecting the different terms under which women were incorporated into the labor market in each, with Bilpabla’s being far more favorable. This suggests oversupply of labor in Salabunia, linked to the need to earn cash incomes to compensate for loss of subsistence agricultural production associated with shrimp farming. Salabunia also had the biggest gender gap in wages, with women doing aquaculture-related work earning only 40% as much as men (Table 17).
The average difference in wages across the aquaculture, agriculture and nonfarm sectors in Bawalia, Medila and Bilpabla was fairly low, ranging from 9% to 30%. This suggests that labor markets were fairly well integrated across sectors, and that increases in demand for labor in one sector would drive up wages in the others. Wages for aquaculture-related work were highest relative to agriculture in Bawalia (130%), the village with the greatest variety of employment opportunities associated with aquaculture. The biggest difference between farm and nonfarm wages was found in Noaga, reflecting local oversupply of agricultural labor, which led significant numbers of men to work outside the district as nonfarm labor.
Occupation Bawalia Medila Bilpabla Salabunia Noaga Hawli
Aquaculture 17.3 17.1 10.6 18.5 18.7 8.4
Crop farming 10.2 7.7 3.2 6.9 16.6 26.5
Table 16. Person days of hired labor employed per hectare per month, in aquaculture and crop farming (12-month average).
Occupation Bawalia Medila Bilpabla Salabunia Noaga Hawli
Aquaculture 26.6 18.0 10.7 14.5 19.3 20.9
Crop farming 5.3 5.5 0.0 1.4 1.1 8.4
Table 15. Person days of family labor employed per hectare in aquaculture and crop farming (preceding 30 days).
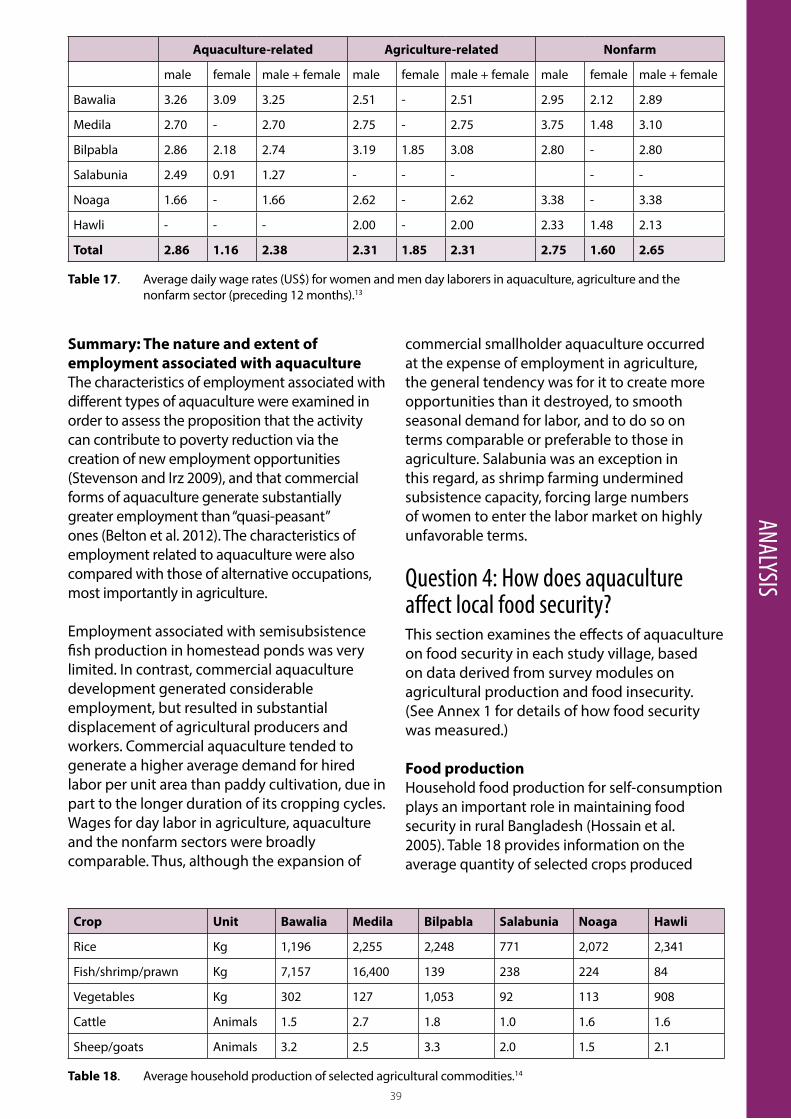
39
ANALYSIS
Summary: The nature and extent of employment associated with aquacultureThe characteristics of employment associated with different types of aquaculture were examined in order to assess the proposition that the activity can contribute to poverty reduction via the creation of new employment opportunities (Stevenson and Irz 2009), and that commercial forms of aquaculture generate substantially greater employment than “quasi-peasant” ones (Belton et al. 2012). The characteristics of employment related to aquaculture were also compared with those of alternative occupations, most importantly in agriculture.
Employment associated with semisubsistence fish production in homestead ponds was very limited. In contrast, commercial aquaculture development generated considerable employment, but resulted in substantial displacement of agricultural producers and workers. Commercial aquaculture tended to generate a higher average demand for hired labor per unit area than paddy cultivation, due in part to the longer duration of its cropping cycles. Wages for day labor in agriculture, aquaculture and the nonfarm sectors were broadly comparable. Thus, although the expansion of
commercial smallholder aquaculture occurred at the expense of employment in agriculture, the general tendency was for it to create more opportunities than it destroyed, to smooth seasonal demand for labor, and to do so on terms comparable or preferable to those in agriculture. Salabunia was an exception in this regard, as shrimp farming undermined subsistence capacity, forcing large numbers of women to enter the labor market on highly unfavorable terms.
Question 4: How does aquaculture affect local food security?This section examines the effects of aquaculture on food security in each study village, based on data derived from survey modules on agricultural production and food insecurity. (See Annex 1 for details of how food security was measured.)
Food productionHousehold food production for self-consumption plays an important role in maintaining food security in rural Bangladesh (Hossain et al. 2005). Table 18 provides information on the average quantity of selected crops produced
Aquaculture-related Agriculture-related Nonfarm
male female male + female male female male + female male female male + female
Bawalia 3.26 3.09 3.25 2.51 - 2.51 2.95 2.12 2.89
Medila 2.70 - 2.70 2.75 - 2.75 3.75 1.48 3.10
Bilpabla 2.86 2.18 2.74 3.19 1.85 3.08 2.80 - 2.80
Salabunia 2.49 0.91 1.27 - - - - -
Noaga 1.66 - 1.66 2.62 - 2.62 3.38 - 3.38
Hawli - - - 2.00 - 2.00 2.33 1.48 2.13
Total 2.86 1.16 2.38 2.31 1.85 2.31 2.75 1.60 2.65
Table 17. Average daily wage rates (US$) for women and men day laborers in aquaculture, agriculture and the nonfarm sector (preceding 12 months).13
Crop Unit Bawalia Medila Bilpabla Salabunia Noaga Hawli
Rice Kg 1,196 2,255 2,248 771 2,072 2,341
Fish/shrimp/prawn Kg 7,157 16,400 139 238 224 84
Vegetables Kg 302 127 1,053 92 113 908
Cattle Animals 1.5 2.7 1.8 1.0 1.6 1.6
Sheep/goats Animals 3.2 2.5 3.3 2.0 1.5 2.1
Table 18. Average household production of selected agricultural commodities.14
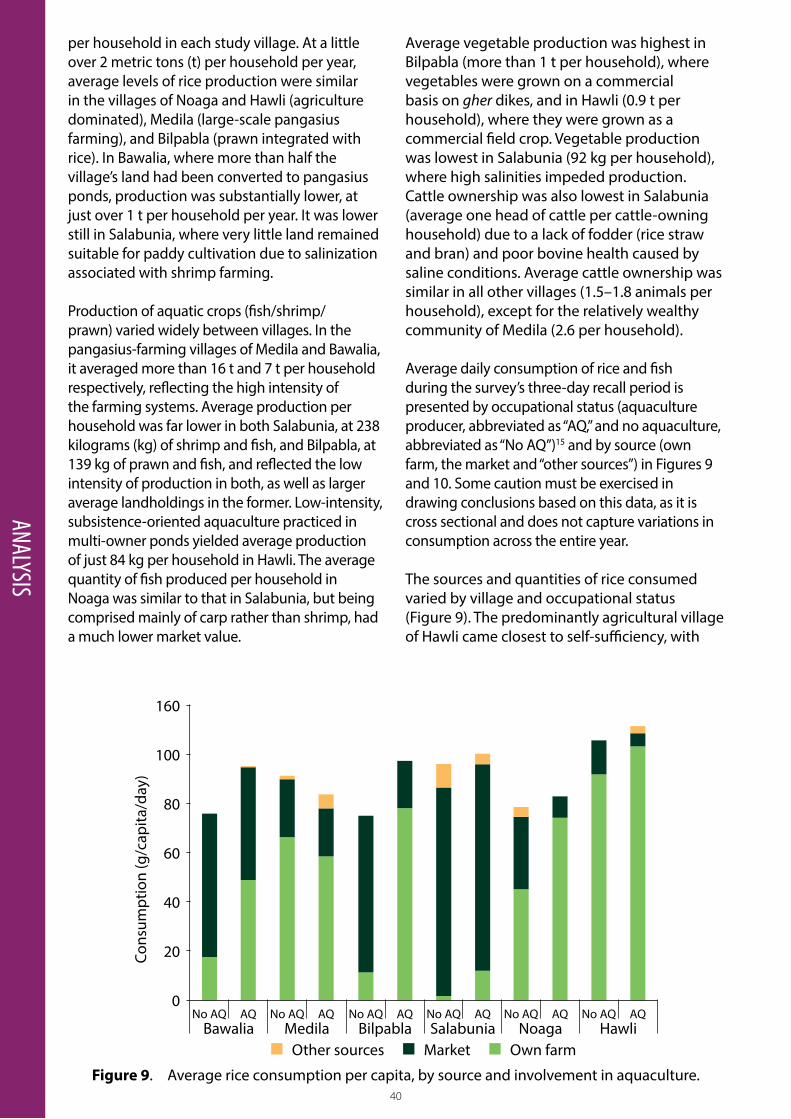
40 41
per household in each study village. At a little over 2 metric tons (t) per household per year, average levels of rice production were similar in the villages of Noaga and Hawli (agriculture dominated), Medila (large-scale pangasius farming), and Bilpabla (prawn integrated with rice). In Bawalia, where more than half the village’s land had been converted to pangasius ponds, production was substantially lower, at just over 1 t per household per year. It was lower still in Salabunia, where very little land remained suitable for paddy cultivation due to salinization associated with shrimp farming.
Production of aquatic crops (fish/shrimp/prawn) varied widely between villages. In the pangasius-farming villages of Medila and Bawalia, it averaged more than 16 t and 7 t per household respectively, reflecting the high intensity of the farming systems. Average production per household was far lower in both Salabunia, at 238 kilograms (kg) of shrimp and fish, and Bilpabla, at 139 kg of prawn and fish, and reflected the low intensity of production in both, as well as larger average landholdings in the former. Low-intensity, subsistence-oriented aquaculture practiced in multi-owner ponds yielded average production of just 84 kg per household in Hawli. The average quantity of fish produced per household in Noaga was similar to that in Salabunia, but being comprised mainly of carp rather than shrimp, had a much lower market value.
Average vegetable production was highest in Bilpabla (more than 1 t per household), where vegetables were grown on a commercial basis on gher dikes, and in Hawli (0.9 t per household), where they were grown as a commercial field crop. Vegetable production was lowest in Salabunia (92 kg per household), where high salinities impeded production. Cattle ownership was also lowest in Salabunia (average one head of cattle per cattle-owning household) due to a lack of fodder (rice straw and bran) and poor bovine health caused by saline conditions. Average cattle ownership was similar in all other villages (1.5–1.8 animals per household), except for the relatively wealthy community of Medila (2.6 per household).
Average daily consumption of rice and fish during the survey’s three-day recall period is presented by occupational status (aquaculture producer, abbreviated as “AQ,” and no aquaculture, abbreviated as “No AQ”)15 and by source (own farm, the market and “other sources”) in Figures 9and 10. Some caution must be exercised in drawing conclusions based on this data, as it is cross sectional and does not capture variations in consumption across the entire year.
The sources and quantities of rice consumed varied by village and occupational status (Figure 9). The predominantly agricultural village of Hawli came closest to self-sufficiency, with
ANALYSIS
Figure 9. Average rice consumption per capita, by source and involvement in aquaculture.
No AQ
Other sources Market Own farmBawalia Bilpabla Salabunia Noaga HawliMedila
100
20
80
160
60
40
0AQ No AQ AQ No AQ AQ No AQ AQ No AQ AQ No AQ AQ
Cons
umpt
ion
(g/c
apita
/day
)
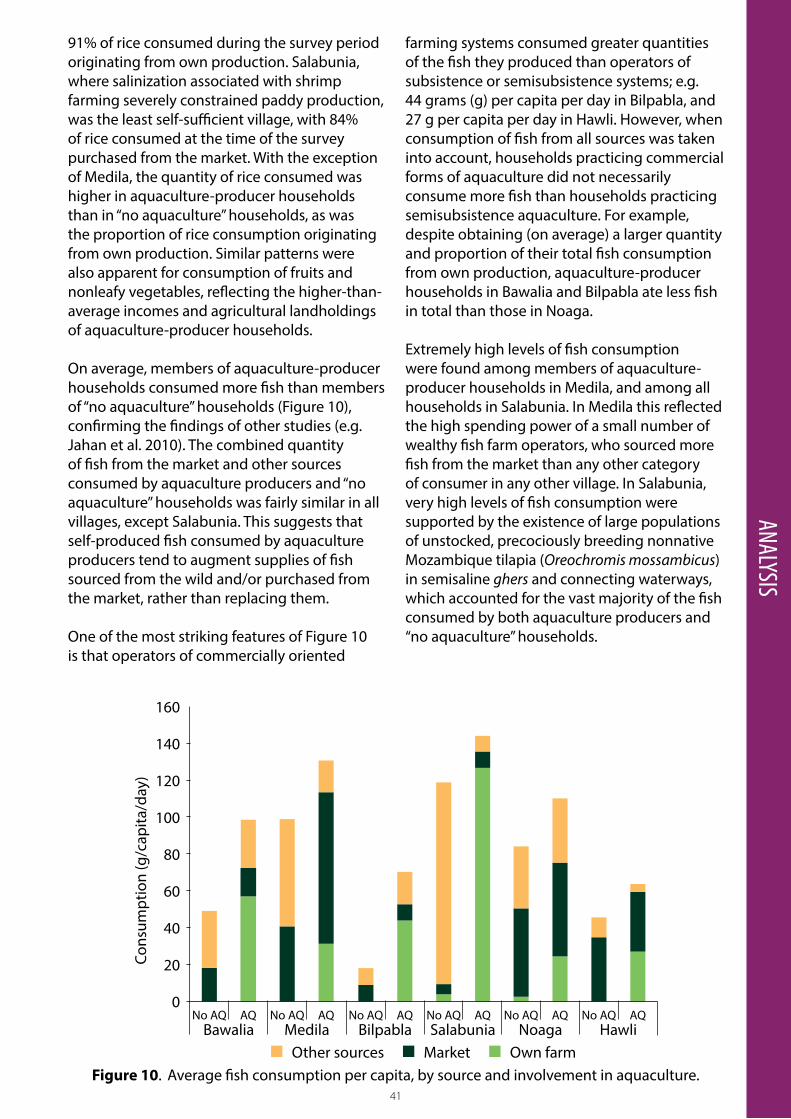
40 41
91% of rice consumed during the survey period originating from own production. Salabunia, where salinization associated with shrimp farming severely constrained paddy production, was the least self-sufficient village, with 84% of rice consumed at the time of the survey purchased from the market. With the exception of Medila, the quantity of rice consumed was higher in aquaculture-producer households than in “no aquaculture” households, as was the proportion of rice consumption originating from own production. Similar patterns were also apparent for consumption of fruits and nonleafy vegetables, reflecting the higher-than-average incomes and agricultural landholdings of aquaculture-producer households.
On average, members of aquaculture-producer households consumed more fish than members of “no aquaculture” households (Figure 10), confirming the findings of other studies (e.g. Jahan et al. 2010). The combined quantity of fish from the market and other sources consumed by aquaculture producers and “no aquaculture” households was fairly similar in all villages, except Salabunia. This suggests that self-produced fish consumed by aquaculture producers tend to augment supplies of fish sourced from the wild and/or purchased from the market, rather than replacing them.
One of the most striking features of Figure 10is that operators of commercially oriented
farming systems consumed greater quantities of the fish they produced than operators of subsistence or semisubsistence systems; e.g. 44 grams (g) per capita per day in Bilpabla, and 27 g per capita per day in Hawli. However, when consumption of fish from all sources was taken into account, households practicing commercial forms of aquaculture did not necessarily consume more fish than households practicing semisubsistence aquaculture. For example, despite obtaining (on average) a larger quantity and proportion of their total fish consumption from own production, aquaculture-producer households in Bawalia and Bilpabla ate less fish in total than those in Noaga.
Extremely high levels of fish consumption were found among members of aquaculture-producer households in Medila, and among all households in Salabunia. In Medila this reflected the high spending power of a small number of wealthy fish farm operators, who sourced more fish from the market than any other category of consumer in any other village. In Salabunia, very high levels of fish consumption were supported by the existence of large populations of unstocked, precociously breeding nonnative Mozambique tilapia (Oreochromis mossambicus) in semisaline ghers and connecting waterways, which accounted for the vast majority of the fish consumed by both aquaculture producers and “no aquaculture” households.
ANALYSIS
Figure 10. Average fish consumption per capita, by source and involvement in aquaculture.Other sources Market Own farm
Bawalia Bilpabla Salabunia Noaga HawliMedila
100
140
20
80
160
60
40
120
0No AQ AQ No AQ AQ No AQ AQ No AQ AQ No AQ AQ No AQ AQ
Cons
umpt
ion
(g/c
apita
/day
)
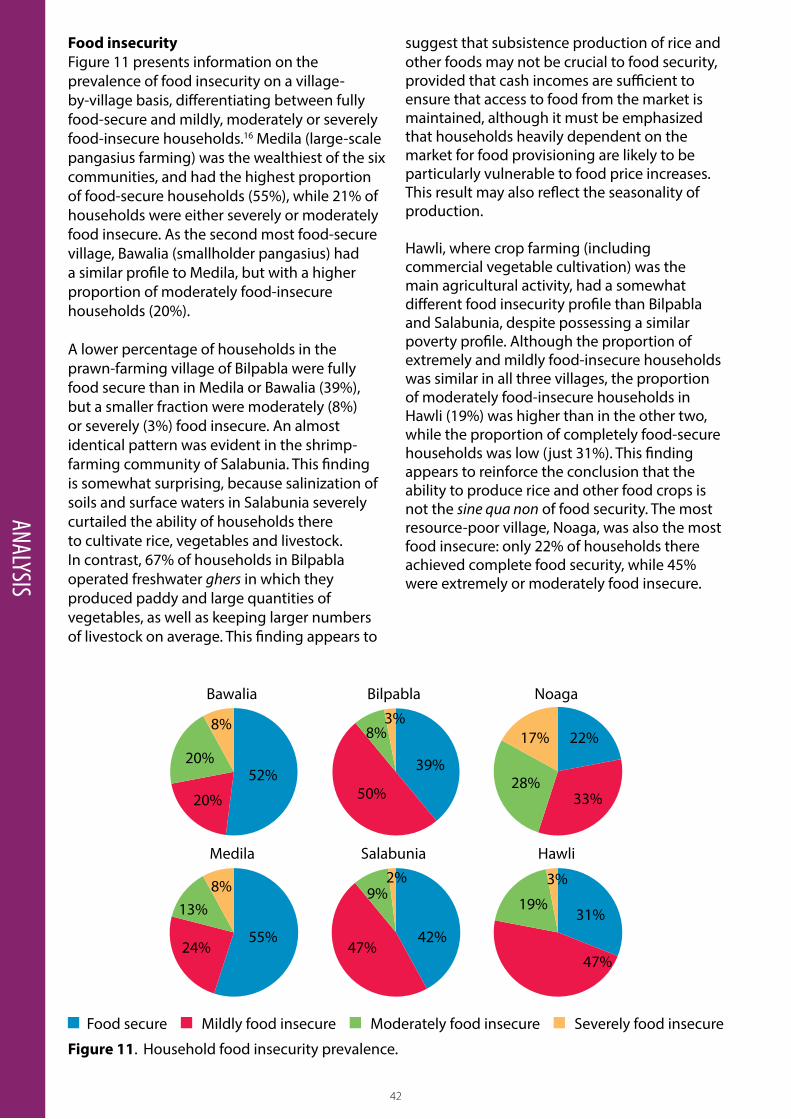
42
Food insecurityFigure 11 presents information on the prevalence of food insecurity on a village-by-village basis, differentiating between fully food-secure and mildly, moderately or severely food-insecure households.16 Medila (large-scale pangasius farming) was the wealthiest of the six communities, and had the highest proportion of food-secure households (55%), while 21% of households were either severely or moderately food insecure. As the second most food-secure village, Bawalia (smallholder pangasius) had a similar profile to Medila, but with a higher proportion of moderately food-insecure households (20%).
A lower percentage of households in the prawn-farming village of Bilpabla were fully food secure than in Medila or Bawalia (39%), but a smaller fraction were moderately (8%) or severely (3%) food insecure. An almost identical pattern was evident in the shrimp-farming community of Salabunia. This finding is somewhat surprising, because salinization of soils and surface waters in Salabunia severely curtailed the ability of households there to cultivate rice, vegetables and livestock. In contrast, 67% of households in Bilpabla operated freshwater ghers in which they produced paddy and large quantities of vegetables, as well as keeping larger numbers of livestock on average. This finding appears to
ANALYSIS
suggest that subsistence production of rice and other foods may not be crucial to food security, provided that cash incomes are sufficient to ensure that access to food from the market is maintained, although it must be emphasized that households heavily dependent on the market for food provisioning are likely to be particularly vulnerable to food price increases. This result may also reflect the seasonality of production.
Hawli, where crop farming (including commercial vegetable cultivation) was the main agricultural activity, had a somewhat different food insecurity profile than Bilpabla and Salabunia, despite possessing a similar poverty profile. Although the proportion of extremely and mildly food-insecure households was similar in all three villages, the proportion of moderately food-insecure households in Hawli (19%) was higher than in the other two, while the proportion of completely food-secure households was low (just 31%). This finding appears to reinforce the conclusion that the ability to produce rice and other food crops is not the sine qua non of food security. The most resource-poor village, Noaga, was also the most food insecure: only 22% of households there achieved complete food security, while 45% were extremely or moderately food insecure.
Figure 11. Household food insecurity prevalence.
Bawalia Bilpabla Noaga
17% 22%
33%28%
20%
20%
52%
8%
50%
39%
8%3%
Salabunia HawliMedila
13%
24%55%
8%
47%
19%31%
3%
42%47%
9%2%
Food secure Mildly food insecure Moderately food insecure Severely food insecure
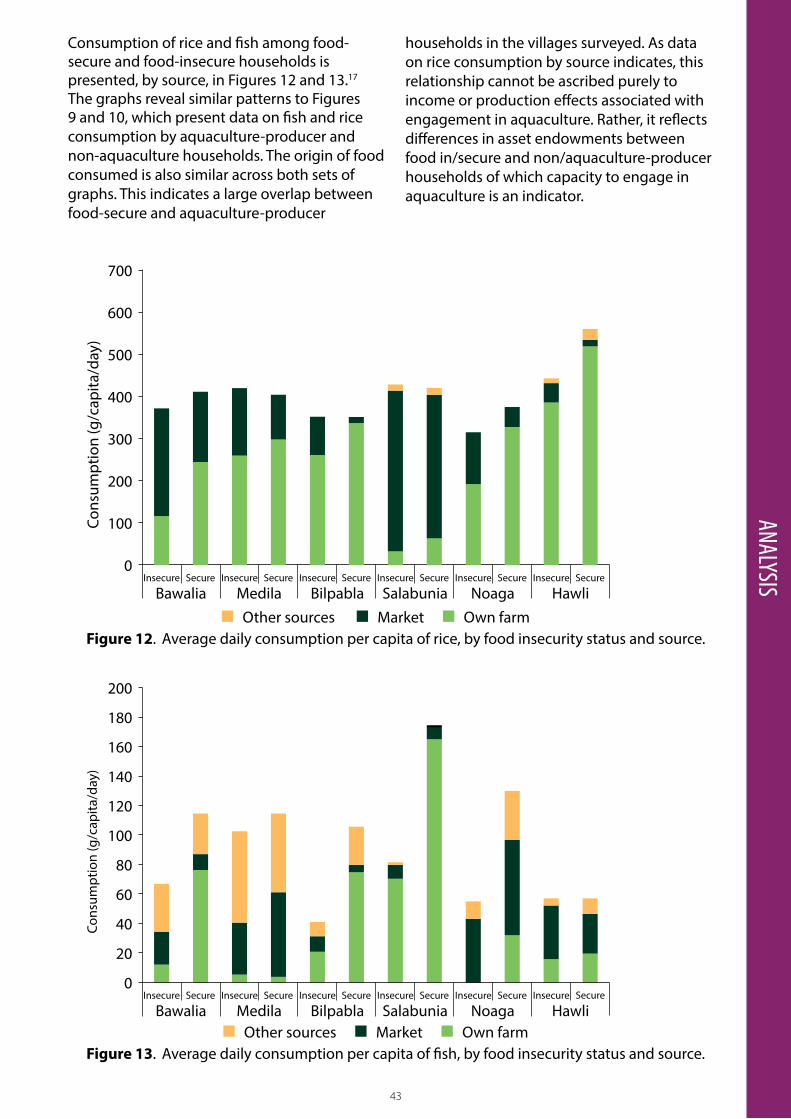
43
ANALYSISConsumption of rice and fish among food-secure and food-insecure households is presented, by source, in Figures 12 and 13.17 The graphs reveal similar patterns to Figures 9 and 10, which present data on fish and rice consumption by aquaculture-producer and non-aquaculture households. The origin of food consumed is also similar across both sets of graphs. This indicates a large overlap between food-secure and aquaculture-producer
households in the villages surveyed. As data on rice consumption by source indicates, this relationship cannot be ascribed purely to income or production effects associated with engagement in aquaculture. Rather, it reflects differences in asset endowments between food in/secure and non/aquaculture-producer households of which capacity to engage in aquaculture is an indicator.
Figure 12. Average daily consumption per capita of rice, by food insecurity status and source.
Bawalia Bilpabla Salabunia Noaga HawliMedila
500
100
400
700
300
200
600
0
Other sources Market Own farm
Cons
umpt
ion
(g/c
apita
/day
)
Insecure Secure Insecure Secure Insecure Secure Insecure Secure Insecure Secure Insecure Secure
Figure 13. Average daily consumption per capita of fish, by food insecurity status and source.
Bawalia Bilpabla Salabunia Noaga HawliMedila
160
20
140
120
200
100
80
60
40
180
0
Other sources Market Own farm
Cons
umpt
ion
(g/c
apita
/day
)
Insecure Secure Insecure Secure Insecure Secure Insecure Secure Insecure Secure Insecure Secure
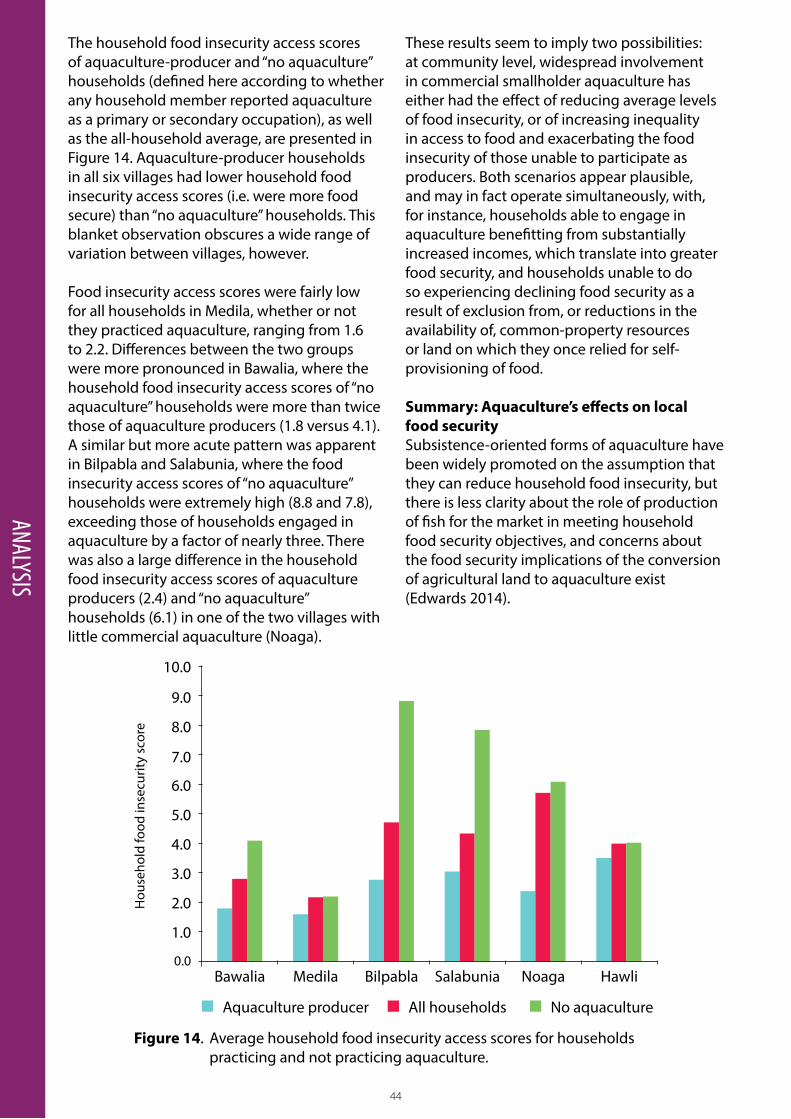
44
The household food insecurity access scores of aquaculture-producer and “no aquaculture” households (defined here according to whether any household member reported aquaculture as a primary or secondary occupation), as well as the all-household average, are presented in Figure 14. Aquaculture-producer households in all six villages had lower household food insecurity access scores (i.e. were more food secure) than “no aquaculture” households. This blanket observation obscures a wide range of variation between villages, however.
Food insecurity access scores were fairly low for all households in Medila, whether or not they practiced aquaculture, ranging from 1.6 to 2.2. Differences between the two groups were more pronounced in Bawalia, where the household food insecurity access scores of “no aquaculture” households were more than twice those of aquaculture producers (1.8 versus 4.1). A similar but more acute pattern was apparent in Bilpabla and Salabunia, where the food insecurity access scores of “no aquaculture” households were extremely high (8.8 and 7.8), exceeding those of households engaged in aquaculture by a factor of nearly three. There was also a large difference in the household food insecurity access scores of aquaculture producers (2.4) and “no aquaculture” households (6.1) in one of the two villages with little commercial aquaculture (Noaga).
These results seem to imply two possibilities: at community level, widespread involvement in commercial smallholder aquaculture has either had the effect of reducing average levels of food insecurity, or of increasing inequality in access to food and exacerbating the food insecurity of those unable to participate as producers. Both scenarios appear plausible, and may in fact operate simultaneously, with, for instance, households able to engage in aquaculture benefitting from substantially increased incomes, which translate into greater food security, and households unable to do so experiencing declining food security as a result of exclusion from, or reductions in the availability of, common-property resources or land on which they once relied for self-provisioning of food.
Summary: Aquaculture’s effects on local food securitySubsistence-oriented forms of aquaculture have been widely promoted on the assumption that they can reduce household food insecurity, but there is less clarity about the role of production of fish for the market in meeting household food security objectives, and concerns about the food security implications of the conversion of agricultural land to aquaculture exist (Edwards 2014).
ANALYSIS
Figure 14. Average household food insecurity access scores for households practicing and not practicing aquaculture.
Bawalia Bilpabla Salabunia Noaga HawliMedila
8.0
10.0
6.0
7.0
9.0
5.0
4.0
3.0
2.0
1.0
0.0
Hou
seho
ld fo
od in
secu
rity
scor
e
Aquaculture producer All households No aquaculture
45
ANALYSISIn all villages, households practicing aquaculture consumed more rice, fruits, nonleafy vegetables and fish on average than those that did not practice aquaculture. The proportion of these foods originating from own production also tended to be higher among aquaculture producers. This is a reflection of the higher-than-average incomes and larger-than-average agricultural landholdings of households engaging in aquaculture. Counter -intuitively, during the period in which the survey was conducted, commercially oriented aquaculture producers consumed, on average, larger quantities of fish from their own farms than those operating subsistence-oriented production systems.
Another surprising finding was that average household food insecurity access scores were very similar in prawn- and shrimp-farming villages, despite very diversified agricultural production occurring in the former, and salinization having seriously reduced the capacity for subsistence production of all field crops in the latter. This appears to indicate that cash returns generated by commercial shrimp aquaculture were sufficient to ensure that access to food from the market was maintained. Low average levels of food security were encountered in villages with little commercial aquaculture, including Hawli, which had the highest levels of self-sufficiency in rice production of any village. Both findings suggest that the ability to produce rice and other food crops is not necessary, nor sufficient, to guarantee household food security, although it is clearly helpful for achieving this outcome.
Large gaps between the average household food insecurity access scores of aquaculture-producer and nonproducer households in villages with high concentrations of commercial smallholder aquaculture suggest a variety of possibilities: widespread involvement in commercial aquaculture may reduce average levels of food insecurity; may increase inequality in access to foods and exacerbate food insecurity among those unable to participate as producers; or may do both simultaneously. When income and employment effects among nonproducers are taken into account, the reality is probably even more complex.
Question 5: What are the effects of aquaculture development on well-being?Preceding sections presented quantitative household survey data that provided indicators of some aspects of material well-being. This section explores themes relating to changing material, relational and subjective dimensions of well-being. These emerged from qualitative analysis of notes from interviews conducted in the four study villages where commercial aquaculture development was well advanced (Bawalia, Medila, Bilpabla and Salabunia). The analysis begins with an evaluation of two material factors—food production and land—that play a crucial role in determining well-being in rural Bangladesh, before examining relational aspects of class and gender. The subject of labor provides a bridge between these areas of inquiry. Discussion of the subjective dimensions of well-being is interwoven with each of these topics. A more detailed introduction to the concept of well-being can be found in Annex 1.
In terms of wide-ranging implications for well-being, perhaps the most important process observed in all four villages was what Bernstein (2010) has referred to as “the commodification of subsistence.” This is the process by which peasant producers become incorporated into capitalist circuits of exchange as producers of commodities and sellers of labor, resulting in a deepening dependence on the market for their means of survival and the emergence of new class divisions, which are often gendered.
In all four villages, the transition from an agrarian system dominated by paddy cultivation to one in which commercial fish, shrimp or prawn production played an important role was marked by an increasing reliance on the market for food. Rapid aquaculture development was also accompanied by accelerating monetization of land access arrangements (primarily through shifts from sharecropping to leasing) and rising land values. The emergence of commercial aquaculture also caused, to varying degrees and in different ways, the expansion of labor markets.18 Thus, the development of commercial aquaculture resulted in producers in all four
46
villages becoming—to differing extents—more fully integrated into and dependent upon markets for commodities, including labor and land. However, in each of these villages, resultant changes in the class structure and their effects on women and men played out in markedly different ways. The dynamics of these transitions and their implications for well-being are considered below.
Food production and well-beingRice and its production play an extremely important role in the construction of subjective and material well-being in rural Bangladesh. White (2010, 161) notes that “self-sufficiency in rice is an ideal of the peasant household, a ground of personal satisfaction as well as a mark of social status.” Kotalová (1996, 102) also reports on the associations between rice and well-being, stating that “a person’s psychological well-being is directly and unequivocally related to her intake of rice,” and that “being able to fill one’s stomach with bhat [rice] is also an indicator of belongingness, intimacy and comfort.” Furthermore, “in Bangladesh, a family’s prosperity as well as a person’s well-being is indicated by a granary full of paddy” (Kotalová 1996, 103). These statements suggest that a reduction in ability to produce rice, which the majority of households in all four villages possessed to some extent prior to the widespread conversion of paddy land to ponds or ghers, may have important implications for a variety of aspects of well-being.
Interviewees’ comments support this assessment. Informants in Salabunia, where salinization linked to shrimp farming resulted in the almost complete cessation of paddy cultivation, constantly cited their inability to grow rice as a cause of distress. As one respondent put it, “[before shrimp farming] we always had rice in stock so there was no tension.” Many other respondents also contrasted the “peace of mind” afforded by cultivating rice and the “tension” associated with failure to do so.19
A related observation, echoed by many respondents, was that “[prior to the advent of shrimp aquaculture] we could produce everything, but now we have to buy every single thing.” As a result, it became necessary for household members, including women, to
engage in wage labor more frequently than in the past in order to meet daily consumption needs. Interestingly, many residents of Salabunia who made these statements also acknowledged that they were financially better off as a result of shrimp farming. As one informant explained, before shrimp farming “money was short but we had enough resources. Now we have enough money but no peace.”
A few informants in Salabunia made statements to the effect that “people are not interested in rice [cultivation] because bagda [shrimp] brings in more money.” These contrasting perceptions reflect class differences. Shrimp is a high-value crop, but is vulnerable to frequent and unpredictable disease-induced losses. Wealthier shrimp farmers with large landholdings are usually able to absorb the financial shocks of unsuccessful crops, and stand to make large returns from the better harvests. In contrast, farmers with limited resources tend to state a preference for the relative security and predictability offered by rice cultivation, despite the potential for shrimp to generate good returns occasionally.
Class-differentiated implications of and preferences for leasing out agricultural land were also apparent in Medila, where rents derived from leasing cropland to large-scale pangasius farms compared favorably with returns from cultivating an equivalent area of paddy. Informants reported that under current market conditions, households cultivating rice on their own land would generally break even or make a very small profit once the implicit costs of family labor were accounted for, while sharecropping often resulted in de facto financial losses, particularly if it was necessary to employ significant hired labor. Thus, when the value of paddy was low, there was a clear economic incentive for leasing out agricultural land rather than cultivating it.
Despite the short-term advantages, most informants believed that leasing out land was detrimental to households retaining insufficient land to produce paddy, because it left them vulnerable to future increases in the price of rice. In contrast, larger landowners able to lease out some land while continuing paddy cultivation elsewhere would gain increased incomes while being protected, and perhaps benefiting, from future price hikes. These observations
ANALYSIS
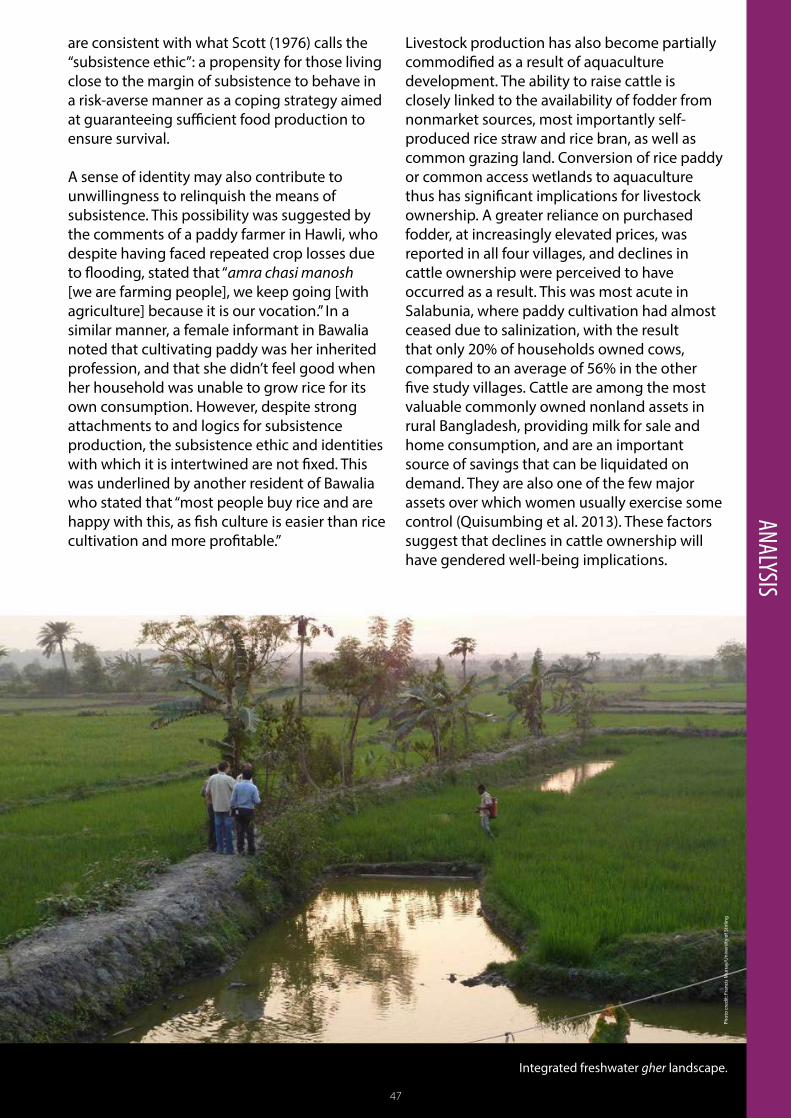
47
Integrated freshwater gher landscape.
Phot
o cr
edit:
Fra
ncis
Mur
ray/
Uni
vers
ity o
f Stir
ling
47
are consistent with what Scott (1976) calls the “subsistence ethic”: a propensity for those living close to the margin of subsistence to behave in a risk-averse manner as a coping strategy aimed at guaranteeing sufficient food production to ensure survival.
A sense of identity may also contribute to unwillingness to relinquish the means of subsistence. This possibility was suggested by the comments of a paddy farmer in Hawli, who despite having faced repeated crop losses due to flooding, stated that “amra chasi manosh [we are farming people], we keep going [with agriculture] because it is our vocation.” In a similar manner, a female informant in Bawalia noted that cultivating paddy was her inherited profession, and that she didn’t feel good when her household was unable to grow rice for its own consumption. However, despite strong attachments to and logics for subsistence production, the subsistence ethic and identities with which it is intertwined are not fixed. This was underlined by another resident of Bawalia who stated that “most people buy rice and are happy with this, as fish culture is easier than rice cultivation and more profitable.”
Livestock production has also become partially commodified as a result of aquaculture development. The ability to raise cattle is closely linked to the availability of fodder from nonmarket sources, most importantly self-produced rice straw and rice bran, as well as common grazing land. Conversion of rice paddy or common access wetlands to aquaculture thus has significant implications for livestock ownership. A greater reliance on purchased fodder, at increasingly elevated prices, was reported in all four villages, and declines in cattle ownership were perceived to have occurred as a result. This was most acute in Salabunia, where paddy cultivation had almost ceased due to salinization, with the result that only 20% of households owned cows, compared to an average of 56% in the other five study villages. Cattle are among the most valuable commonly owned nonland assets in rural Bangladesh, providing milk for sale and home consumption, and are an important source of savings that can be liquidated on demand. They are also one of the few major assets over which women usually exercise some control (Quisumbing et al. 2013). These factors suggest that declines in cattle ownership will have gendered well-being implications.
ANALYSIS
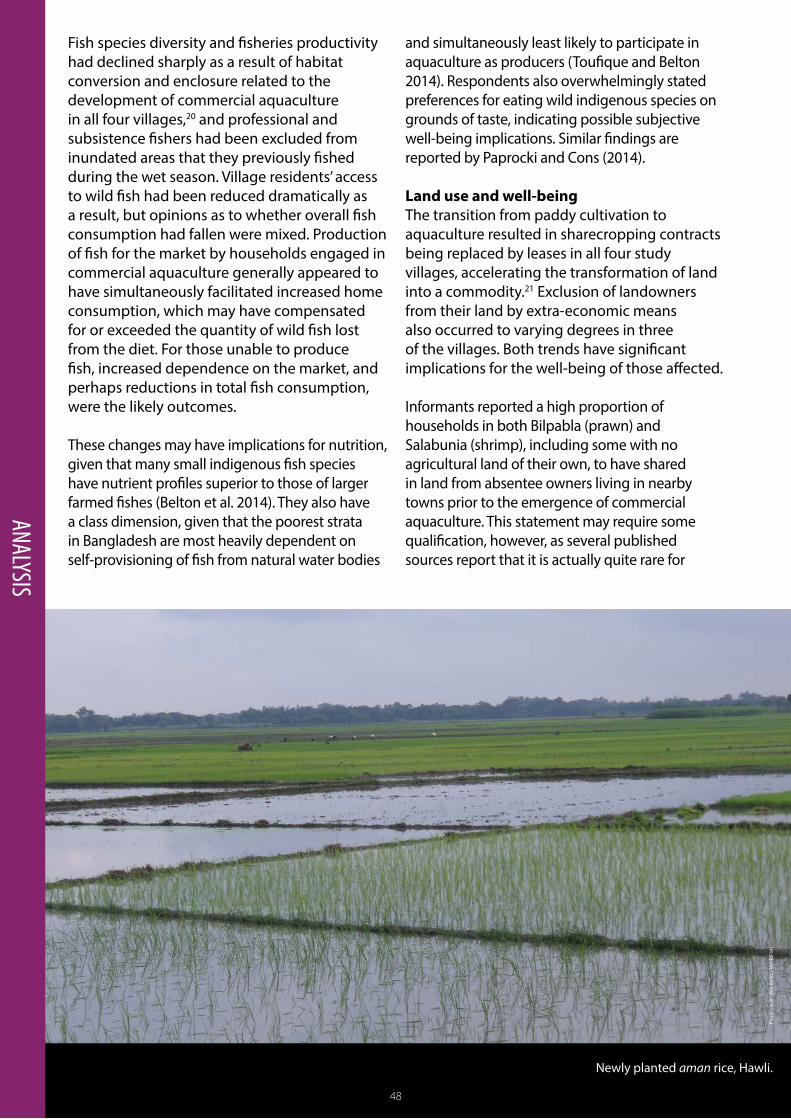
48
Newly planted aman rice, Hawli.
Phot
o cr
edit:
Ben
Bel
ton/
Wor
ldFi
sh
48
Fish species diversity and fisheries productivity had declined sharply as a result of habitat conversion and enclosure related to the development of commercial aquaculture in all four villages,20 and professional and subsistence fishers had been excluded from inundated areas that they previously fished during the wet season. Village residents’ access to wild fish had been reduced dramatically as a result, but opinions as to whether overall fish consumption had fallen were mixed. Production of fish for the market by households engaged in commercial aquaculture generally appeared to have simultaneously facilitated increased home consumption, which may have compensated for or exceeded the quantity of wild fish lost from the diet. For those unable to produce fish, increased dependence on the market, and perhaps reductions in total fish consumption, were the likely outcomes.
These changes may have implications for nutrition, given that many small indigenous fish species have nutrient profiles superior to those of larger farmed fishes (Belton et al. 2014). They also have a class dimension, given that the poorest strata in Bangladesh are most heavily dependent on self-provisioning of fish from natural water bodies
and simultaneously least likely to participate in aquaculture as producers (Toufique and Belton 2014). Respondents also overwhelmingly stated preferences for eating wild indigenous species on grounds of taste, indicating possible subjective well-being implications. Similar findings are reported by Paprocki and Cons (2014).
Land use and well-beingThe transition from paddy cultivation to aquaculture resulted in sharecropping contracts being replaced by leases in all four study villages, accelerating the transformation of land into a commodity.21 Exclusion of landowners from their land by extra-economic means also occurred to varying degrees in three of the villages. Both trends have significant implications for the well-being of those affected.
Informants reported a high proportion of households in both Bilpabla (prawn) and Salabunia (shrimp), including some with no agricultural land of their own, to have shared in land from absentee owners living in nearby towns prior to the emergence of commercial aquaculture. This statement may require some qualification, however, as several published sources report that it is actually quite rare for
ANALYSIS
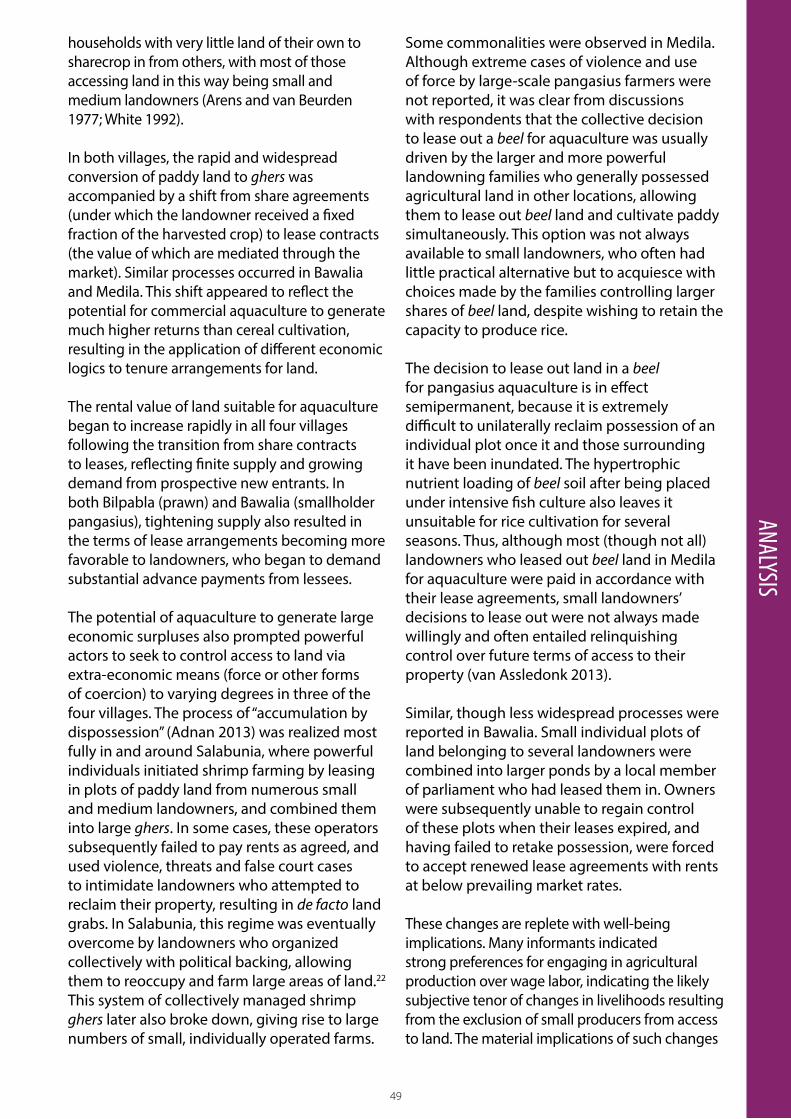
49
households with very little land of their own to sharecrop in from others, with most of those accessing land in this way being small and medium landowners (Arens and van Beurden 1977; White 1992).
In both villages, the rapid and widespread conversion of paddy land to ghers was accompanied by a shift from share agreements (under which the landowner received a fixed fraction of the harvested crop) to lease contracts (the value of which are mediated through the market). Similar processes occurred in Bawalia and Medila. This shift appeared to reflect the potential for commercial aquaculture to generate much higher returns than cereal cultivation, resulting in the application of different economic logics to tenure arrangements for land.
The rental value of land suitable for aquaculture began to increase rapidly in all four villages following the transition from share contracts to leases, reflecting finite supply and growing demand from prospective new entrants. In both Bilpabla (prawn) and Bawalia (smallholder pangasius), tightening supply also resulted in the terms of lease arrangements becoming more favorable to landowners, who began to demand substantial advance payments from lessees.
The potential of aquaculture to generate large economic surpluses also prompted powerful actors to seek to control access to land via extra-economic means (force or other forms of coercion) to varying degrees in three of the four villages. The process of “accumulation by dispossession” (Adnan 2013) was realized most fully in and around Salabunia, where powerful individuals initiated shrimp farming by leasing in plots of paddy land from numerous small and medium landowners, and combined them into large ghers. In some cases, these operators subsequently failed to pay rents as agreed, and used violence, threats and false court cases to intimidate landowners who attempted to reclaim their property, resulting in de facto land grabs. In Salabunia, this regime was eventually overcome by landowners who organized collectively with political backing, allowing them to reoccupy and farm large areas of land.22 This system of collectively managed shrimp ghers later also broke down, giving rise to large numbers of small, individually operated farms.
Some commonalities were observed in Medila. Although extreme cases of violence and use of force by large-scale pangasius farmers were not reported, it was clear from discussions with respondents that the collective decision to lease out a beel for aquaculture was usually driven by the larger and more powerful landowning families who generally possessed agricultural land in other locations, allowing them to lease out beel land and cultivate paddy simultaneously. This option was not always available to small landowners, who often had little practical alternative but to acquiesce with choices made by the families controlling larger shares of beel land, despite wishing to retain the capacity to produce rice.
The decision to lease out land in a beel for pangasius aquaculture is in effect semipermanent, because it is extremely difficult to unilaterally reclaim possession of an individual plot once it and those surrounding it have been inundated. The hypertrophic nutrient loading of beel soil after being placed under intensive fish culture also leaves it unsuitable for rice cultivation for several seasons. Thus, although most (though not all) landowners who leased out beel land in Medila for aquaculture were paid in accordance with their lease agreements, small landowners’ decisions to lease out were not always made willingly and often entailed relinquishing control over future terms of access to their property (van Assledonk 2013).
Similar, though less widespread processes were reported in Bawalia. Small individual plots of land belonging to several landowners were combined into larger ponds by a local member of parliament who had leased them in. Owners were subsequently unable to regain control of these plots when their leases expired, and having failed to retake possession, were forced to accept renewed lease agreements with rents at below prevailing market rates.
These changes are replete with well-being implications. Many informants indicated strong preferences for engaging in agricultural production over wage labor, indicating the likely subjective tenor of changes in livelihoods resulting from the exclusion of small producers from access to land. The material implications of such changes
ANALYSIS
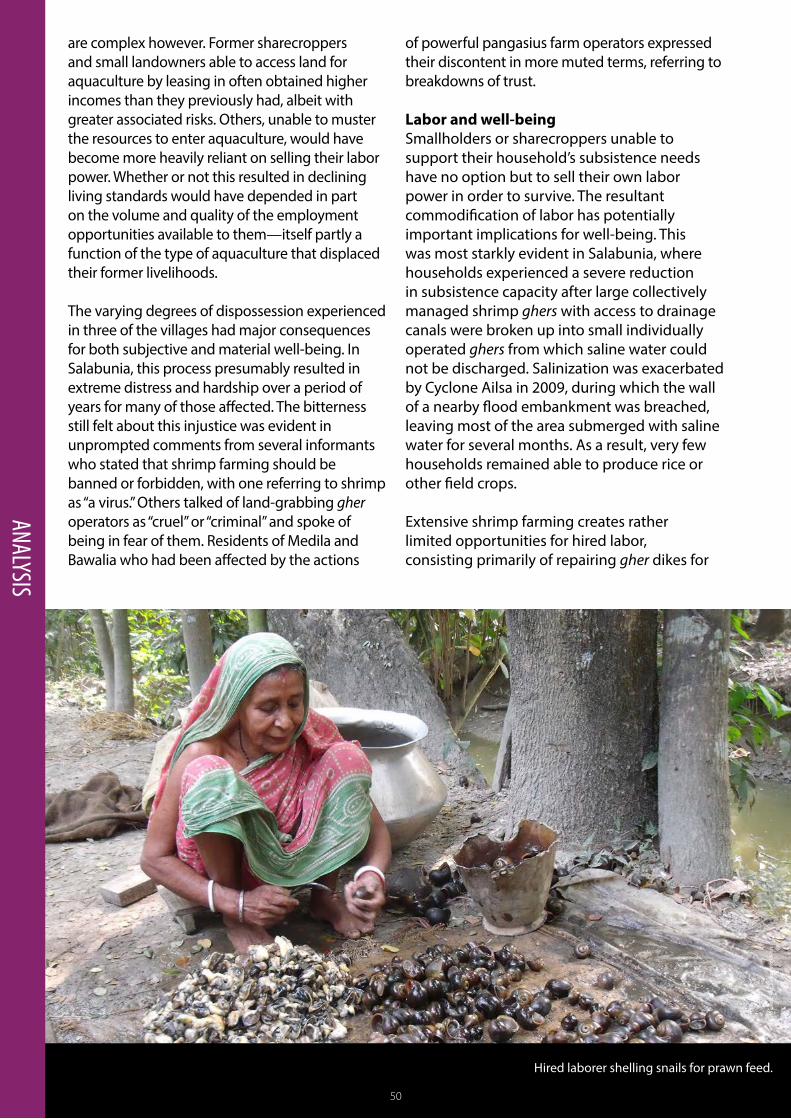
50
Hired laborer shelling snails for prawn feed.
Phot
o cr
edit:
Ben
Bel
ton/
Wor
ldFi
sh
50
are complex however. Former sharecroppers and small landowners able to access land for aquaculture by leasing in often obtained higher incomes than they previously had, albeit with greater associated risks. Others, unable to muster the resources to enter aquaculture, would have become more heavily reliant on selling their labor power. Whether or not this resulted in declining living standards would have depended in part on the volume and quality of the employment opportunities available to them—itself partly a function of the type of aquaculture that displaced their former livelihoods.
The varying degrees of dispossession experienced in three of the villages had major consequences for both subjective and material well-being. In Salabunia, this process presumably resulted in extreme distress and hardship over a period of years for many of those affected. The bitterness still felt about this injustice was evident in unprompted comments from several informants who stated that shrimp farming should be banned or forbidden, with one referring to shrimp as “a virus.” Others talked of land-grabbing gher operators as “cruel” or “criminal” and spoke of being in fear of them. Residents of Medila and Bawalia who had been affected by the actions
of powerful pangasius farm operators expressed their discontent in more muted terms, referring to breakdowns of trust.
Labor and well-beingSmallholders or sharecroppers unable to support their household’s subsistence needs have no option but to sell their own labor power in order to survive. The resultant commodification of labor has potentially important implications for well-being. This was most starkly evident in Salabunia, where households experienced a severe reduction in subsistence capacity after large collectively managed shrimp ghers with access to drainage canals were broken up into small individually operated ghers from which saline water could not be discharged. Salinization was exacerbated by Cyclone Ailsa in 2009, during which the wall of a nearby flood embankment was breached, leaving most of the area submerged with saline water for several months. As a result, very few households remained able to produce rice or other field crops.
Extensive shrimp farming creates rather limited opportunities for hired labor, consisting primarily of repairing gher dikes for
ANALYSIS
51
a short period once each year, guarding and maintaining large ghers operated by absentee landowners (a job for which permanent workers originating from outside the village are usually employed), and clearing aquatic weeds from larger ghers. According to informants, the end of rice production therefore resulted in a decline in employment opportunities. In conjunction with a severely reduced ability to produce food for household consumption and unpredictable returns from shrimp, this decline led men to seek agricultural work outside the district in increasing numbers. Temporary (illegal) migration to India for work in the informal sector was also adopted as a coping strategy. Women reported spending increasing time performing unpaid work in their own ghers to compensate for the loss of male family labor power caused by these migrations.
Women’s participation in the labor market in Salabunia was greater than in any of the other villages studied. Household survey respondents in Salabunia had hired 462 women workers during the previous 12 months—over four times more than in any other village (Table 13). Of these, more than two-thirds were employed in removing aquatic weeds from ghers. This activity was remunerated at just US$ 1.05 per day, less than half the amount received for the same type of work by women in the prawn-farming village of Bilpabla. Women in Salabunia engaged in more than twice as many categories of economically productive activity as those in any other village (Table 10), and received extremely low wages relative to both men and women in other villages, earning just US$ 0.95 per day on average (Table 17).
The entry of women into the labor market in Salabunia thus seems to be a direct product of “the dull compulsion of economic forces” (Marx 1867 paraphrased in Bernstein 2010) set in train by the destruction of rice cultivation. This resulted in the necessity to earn cash to purchase almost all the items necessary for survival, and the creation of a large pool of surplus female labor ready to work in the ghers of larger operators for extremely low wages. One group of women summarized the situation thus: “Ten years ago when we were producing rice we worked less because we had enough food, but now we need to work every day to earn money to fulfill our daily needs. We didn’t
ANALYSISwork in other [people’s] ghers at that time [when we were producing rice]. Now we work 12 months [per year]. At that time we did very little [paid] work.”
In marked contrast, the integration, diversification and intensification of land use that characterized freshwater gher farming in Bilpabla meant that households there were able to produce paddy, fish and vegetables for subsistence and local sale, as well as high-value prawn for export to global markets. This farming system places high demands on household labor. As a result, self-employment in gher farming accounted for around a third of women’s economically productive work in Bilpabla. This share of employment was more than two times higher than in Salabunia, the village with the next highest number of women aquaculture producers (Table 12).23
Conversely, the ability of households in Bilpabla to meet (at least part of ) their subsistence needs through freshwater gher farming meant that women’s incorporation into the labor market there was less comprehensive than in Salabunia. High demand for wage labor in aquaculture and agriculture in Bilpabla was reflected in wage rates that compared favorably to those in all other villages surveyed. As a result, the decisions of women in Bilpabla to sell their labor power sometimes appeared to correspond to livelihood diversification in response to opportunity rather than economic compulsion (Ellis 1998).
In Bawalia, where large numbers of small landowners had entered pangasius farming, several instances of failure that resulted in household members becoming more dependent upon selling their labor power were identified. Informants reported that increasing demand for labor since the takeoff of pangasius farming had resulted in higher wages. Landless men who had always worked as day laborers considered themselves to have become better off as a result. Employment associated with aquaculture was generally preferred to agricultural day labor because the former was available year round, while the latter was seasonal, and because although nominal daily wages for work related to aquaculture and agriculture were similar, the working day for the former was usually two hours shorter than for the latter.24
52
The village of Medila is located close to an urban center that offered a range of nonfarm employment opportunities. International remittances provided a source of income for almost a third of Medila’s households, and significant numbers also had members working in salaried jobs in state institutions outside the village, including the army, banks and schools. The availability of such opportunities led one informant to comment that “Medila villagers are not interested in working in aquaculture.” As a result, earth cutting and permanent fish farm labor—occupations that were viewed favorably by residents of Bawalia—were performed mainly by workers from outside Medila.25 One informant illustrated these preferences by comparing his working conditions as a permanent laborer on a pangasius farm with those in the garment industry. In his estimation, his current job was laborious, involved extremely long hours, and was poorly remunerated with no leave, whereas work in a garment factory would offer fixed, shorter hours, paid overtime, one day off per week, and a significantly higher income when overtime payments were taken into account.
Although some sharecroppers and small landowners in Medila were displaced by conversion of paddy land to large pangasius farms, the village’s deagrarianization was already well advanced by the time that aquaculture emerged, and this process appeared to have been driven at least as much by the pull of opportunities in the nonfarm sector as by economic compulsion to abandon farming. Informants in Medila therefore saw nonfarm work as being a much more significant driver of local development than aquaculture.
The well-being implications of differing patterns of labor commodification apparent in each village were diverse. For individuals already selling a significant part of their labor power before the onset of aquaculture, the new employment opportunities created provoked varied subjective responses, which reflected the characteristics of this work relative to alternatives. Particularly in Bawalia (smallholder pangasius), but also in Bilpabla (prawn), aquaculture-related employment was generally seen in a positive light. In Medila (large-scale pangasius) it was perceived as preferable to agricultural labor but inferior to work in the nonfarm sector. It may be surmised that in Salabunia, especially for
women, it was construed as a necessary evil in the context of the severely reduced capacity of many households to sustain themselves through subsistence production, as well as an acute lack of alternatives.
Sharecroppers and small farmers consistently stated preferences for practicing agriculture and/or aquaculture over any form of wage labor, reflecting a mix of subjective and material motives similar to those noted in previous subsections, as well as the lower social prestige associated with the latter occupation (Arens and van Beurden 1977). However, an informant from Medila provided an important counterpoint to this generalization when observing that “young people now no longer want to work in agriculture, but older people want to continue.” This statement suggests strongly that the tendency of rural inhabitants to equate the ability to farm or the possession of a “granary full of paddy” with well-being (Kotalová 1996) is by no means immutable, particularly where viable nonfarm opportunities and the changing expectations in which they result exist.
Gender and class relationsIn all the villages described in preceding subsections, transitions from paddy-dominated agriculture to commercial aquaculture were mediated by—and brought about modifications in relations of—class, gender and power, which were directly experienced in terms of well-being by those affected.
Changes in the extent and nature of women’s involvement in economically productive activities were reported to have taken place in all four villages in the period following the emergence of commercial aquaculture. The division of labor in aquaculture was gendered to differing degrees in each village. Divisions were least pronounced in Salabunia, where women worked as both unpaid family labor and wage labor, and some women performed all the same work on their own farms as men, including selling shrimp. In Bilpabla, women also practiced a wide range of farming activities, both in their own ghers and as wage labor. Only a few activities (planting rice, applying pesticides and fertilizer to rice, and selling prawn and fish) were reported to be performed exclusively by men. Feeding prawns was performed mainly by women, and a few women also controlled sales of vegetables produced in their own ghers.
ANALYSIS
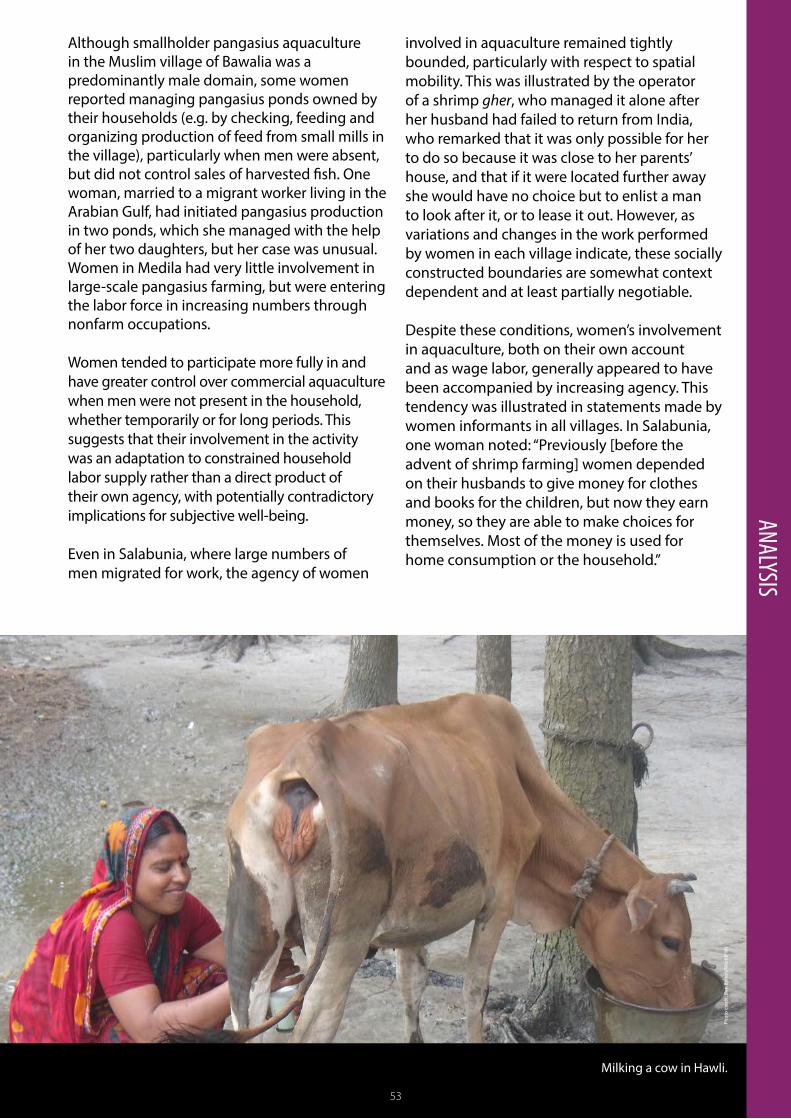
53
Milking a cow in Hawli.
Phot
o cr
edit:
Ben
Bel
ton/
Wor
ldFi
sh
53
Although smallholder pangasius aquaculture in the Muslim village of Bawalia was a predominantly male domain, some women reported managing pangasius ponds owned by their households (e.g. by checking, feeding and organizing production of feed from small mills in the village), particularly when men were absent, but did not control sales of harvested fish. One woman, married to a migrant worker living in the Arabian Gulf, had initiated pangasius production in two ponds, which she managed with the help of her two daughters, but her case was unusual. Women in Medila had very little involvement in large-scale pangasius farming, but were entering the labor force in increasing numbers through nonfarm occupations.
Women tended to participate more fully in and have greater control over commercial aquaculture when men were not present in the household, whether temporarily or for long periods. This suggests that their involvement in the activity was an adaptation to constrained household labor supply rather than a direct product of their own agency, with potentially contradictory implications for subjective well-being.
Even in Salabunia, where large numbers of men migrated for work, the agency of women
involved in aquaculture remained tightly bounded, particularly with respect to spatial mobility. This was illustrated by the operator of a shrimp gher, who managed it alone after her husband had failed to return from India, who remarked that it was only possible for her to do so because it was close to her parents’ house, and that if it were located further away she would have no choice but to enlist a man to look after it, or to lease it out. However, as variations and changes in the work performed by women in each village indicate, these socially constructed boundaries are somewhat context dependent and at least partially negotiable.
Despite these conditions, women’s involvement in aquaculture, both on their own account and as wage labor, generally appeared to have been accompanied by increasing agency. This tendency was illustrated in statements made by women informants in all villages. In Salabunia, one woman noted: “Previously [before the advent of shrimp farming] women depended on their husbands to give money for clothes and books for the children, but now they earn money, so they are able to make choices for themselves. Most of the money is used for home consumption or the household.”
ANALYSIS
54
A group of women interviewed in Bilpabla described their current situation as being better than that before prawn farming began, because they now had more money and household goods and were able to meet all their households’ needs. They also reported having more influence on buying food and clothes and making educational decisions than they once had, and stated: “Now we are doing our own work in the fields and are happy, as we are working for ourselves, whatever the physical conditions. Twenty years ago we couldn’t go anywhere alone. Now we have freedom to do so.”
Women in Bawalia who were involved in the regular management of pangasius ponds reported that although they now worked every day feeding the fish and preparing feed, it was easier than the seasonal work associated with processing paddy, for which they had previously assumed responsibility. They reported that they preferred the current situation because their households had higher incomes and it felt good when they made a big return from sales of fish. They noted that this situation had resulted in improvements in their children’s education and clothing. Somewhat similar observations were made in a different context by a female informant in Medila, who stated: “Now women who are employed [in the nonfarm sector] feel good. Some households never ate food three times a day, but now they have enough and eat well because the women are working.”
Less positively, it appeared that—for reasons explored above—the transition from paddy cultivation to aquaculture had been accompanied by declines in the production of assets and crops over which women usually exercised the greatest control (cattle, poultry and paddy) and their replacement with those over which men usually had command (fish, shrimp, prawn and rents from leasing out land), although the extent of these substitutions varied widely between villages. Similar observations are made by Gurung et al. (2013).
These observations hint at a range of tradeoffs for women (greater agency versus heavier workloads, for instance) and tensions between relinquishing partial control over certain sets of assets and gaining access to others. It should also be emphasized that for women, the decision to become involved in aquaculture, whether on one’s own farm or as wage labor,
was frequently tempered by social class and economic imperatives. Put simply, most women who could afford not to work in aquaculture did not do so.
The complexities and ambiguities apparent in these accounts echo those described by Kabeer (2002) in her study of the interplay of structure and agency influencing Bangladeshi women workers’ labor market decisions. She found these decisions to result in varied outcomes for subjective and material well-being, contingent in part upon individual circumstances and economic conditions and tempered by the quality of gendered interpersonal relationships. This high degree of idiosyncrasy and context dependence makes it problematic to advance broad generalizations about the well-being implications of changes in gender relations associated with the emergence of commercial aquaculture.
The commodification of subsistence is a key driver of the formation of new social classes and thus has important implications for social mobility. Class differentiation occurs when more successful producers generate surpluses, which are reinvested in expanded or diversified operations (expanded reproduction) or long-term strategies for accumulating other forms of capital (e.g. investments in education), at the same time as others confront increasing pressures brought about by indebtedness or the loss of nonmarket access to land and other resources. The following paragraphs explore new patterns of social stratification that have emerged as a result of these processes and their consequences for both material and subjective well-being.
Class differentiation caused by commercial aquaculture development could be most clearly discerned in Bawalia. Pangasius aquaculture in Bawalia began after one of its largest landowners was inspired to begin farming in a single pond after visiting a large farm established by a wealthy acquaintance nearby. This operation was expanded rapidly following initial successful crops, and was quickly emulated by many of Bawalia’s other larger farmers. Subsequently, smaller landowners and some households without any cultivable land also began to establish farms, often by leasing in land.
ANALYSIS
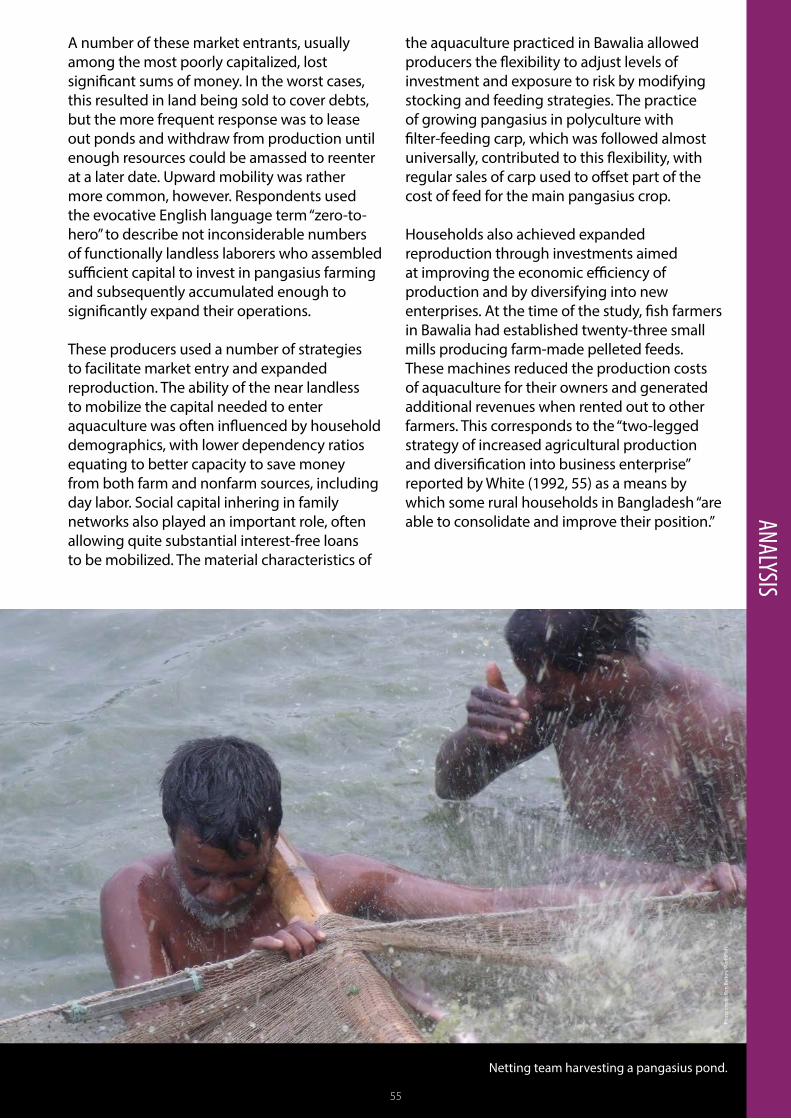
55
Netting team harvesting a pangasius pond.
Phot
o cr
edit:
Ben
Bel
ton/
Wor
ldFi
sh
55
A number of these market entrants, usually among the most poorly capitalized, lost significant sums of money. In the worst cases, this resulted in land being sold to cover debts, but the more frequent response was to lease out ponds and withdraw from production until enough resources could be amassed to reenter at a later date. Upward mobility was rather more common, however. Respondents used the evocative English language term “zero-to-hero” to describe not inconsiderable numbers of functionally landless laborers who assembled sufficient capital to invest in pangasius farming and subsequently accumulated enough to significantly expand their operations.
These producers used a number of strategies to facilitate market entry and expanded reproduction. The ability of the near landless to mobilize the capital needed to enter aquaculture was often influenced by household demographics, with lower dependency ratios equating to better capacity to save money from both farm and nonfarm sources, including day labor. Social capital inhering in family networks also played an important role, often allowing quite substantial interest-free loans to be mobilized. The material characteristics of
the aquaculture practiced in Bawalia allowed producers the flexibility to adjust levels of investment and exposure to risk by modifying stocking and feeding strategies. The practice of growing pangasius in polyculture with filter-feeding carp, which was followed almost universally, contributed to this flexibility, with regular sales of carp used to offset part of the cost of feed for the main pangasius crop.
Households also achieved expanded reproduction through investments aimed at improving the economic efficiency of production and by diversifying into new enterprises. At the time of the study, fish farmers in Bawalia had established twenty-three small mills producing farm-made pelleted feeds. These machines reduced the production costs of aquaculture for their owners and generated additional revenues when rented out to other farmers. This corresponds to the “two-legged strategy of increased agricultural production and diversification into business enterprise” reported by White (1992, 55) as a means by which some rural households in Bangladesh “are able to consolidate and improve their position.” ANALYSIS
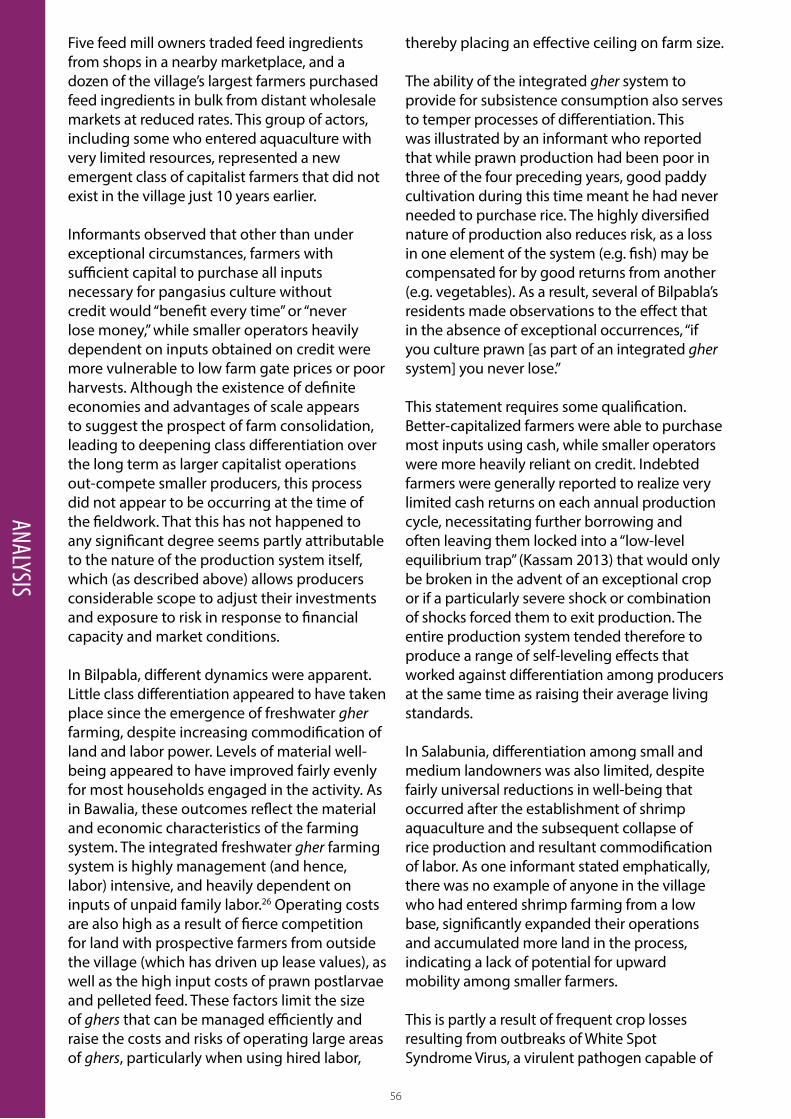
56
Five feed mill owners traded feed ingredients from shops in a nearby marketplace, and a dozen of the village’s largest farmers purchased feed ingredients in bulk from distant wholesale markets at reduced rates. This group of actors, including some who entered aquaculture with very limited resources, represented a new emergent class of capitalist farmers that did not exist in the village just 10 years earlier.
Informants observed that other than under exceptional circumstances, farmers with sufficient capital to purchase all inputs necessary for pangasius culture without credit would “benefit every time” or “never lose money,” while smaller operators heavily dependent on inputs obtained on credit were more vulnerable to low farm gate prices or poor harvests. Although the existence of definite economies and advantages of scale appears to suggest the prospect of farm consolidation, leading to deepening class differentiation over the long term as larger capitalist operations out-compete smaller producers, this process did not appear to be occurring at the time of the fieldwork. That this has not happened to any significant degree seems partly attributable to the nature of the production system itself, which (as described above) allows producers considerable scope to adjust their investments and exposure to risk in response to financial capacity and market conditions. In Bilpabla, different dynamics were apparent. Little class differentiation appeared to have taken place since the emergence of freshwater gher farming, despite increasing commodification of land and labor power. Levels of material well-being appeared to have improved fairly evenly for most households engaged in the activity. As in Bawalia, these outcomes reflect the material and economic characteristics of the farming system. The integrated freshwater gher farming system is highly management (and hence, labor) intensive, and heavily dependent on inputs of unpaid family labor.26 Operating costs are also high as a result of fierce competition for land with prospective farmers from outside the village (which has driven up lease values), as well as the high input costs of prawn postlarvae and pelleted feed. These factors limit the size of ghers that can be managed efficiently and raise the costs and risks of operating large areas of ghers, particularly when using hired labor,
thereby placing an effective ceiling on farm size. The ability of the integrated gher system to provide for subsistence consumption also serves to temper processes of differentiation. This was illustrated by an informant who reported that while prawn production had been poor in three of the four preceding years, good paddy cultivation during this time meant he had never needed to purchase rice. The highly diversified nature of production also reduces risk, as a loss in one element of the system (e.g. fish) may be compensated for by good returns from another (e.g. vegetables). As a result, several of Bilpabla’s residents made observations to the effect that in the absence of exceptional occurrences, “if you culture prawn [as part of an integrated gher system] you never lose.”
This statement requires some qualification. Better-capitalized farmers were able to purchase most inputs using cash, while smaller operators were more heavily reliant on credit. Indebted farmers were generally reported to realize very limited cash returns on each annual production cycle, necessitating further borrowing and often leaving them locked into a “low-level equilibrium trap” (Kassam 2013) that would only be broken in the advent of an exceptional crop or if a particularly severe shock or combination of shocks forced them to exit production. The entire production system tended therefore to produce a range of self-leveling effects that worked against differentiation among producers at the same time as raising their average living standards.
In Salabunia, differentiation among small and medium landowners was also limited, despite fairly universal reductions in well-being that occurred after the establishment of shrimp aquaculture and the subsequent collapse of rice production and resultant commodification of labor. As one informant stated emphatically, there was no example of anyone in the village who had entered shrimp farming from a low base, significantly expanded their operations and accumulated more land in the process, indicating a lack of potential for upward mobility among smaller farmers.
This is partly a result of frequent crop losses resulting from outbreaks of White Spot Syndrome Virus, a virulent pathogen capable of
ANALYSIS
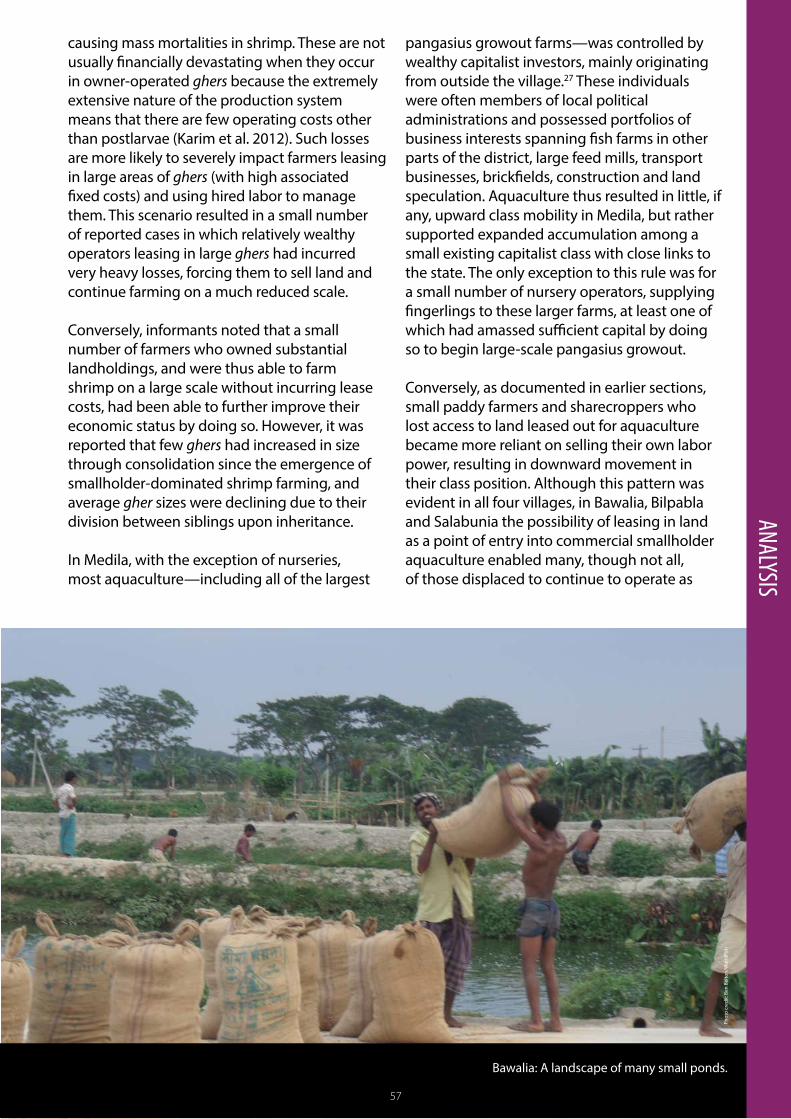
57
Bawalia: A landscape of many small ponds.
Phot
o cr
edit:
Ben
Bel
ton/
Wor
ldFi
sh
57
causing mass mortalities in shrimp. These are not usually financially devastating when they occur in owner-operated ghers because the extremely extensive nature of the production system means that there are few operating costs other than postlarvae (Karim et al. 2012). Such losses are more likely to severely impact farmers leasing in large areas of ghers (with high associated fixed costs) and using hired labor to manage them. This scenario resulted in a small number of reported cases in which relatively wealthy operators leasing in large ghers had incurred very heavy losses, forcing them to sell land and continue farming on a much reduced scale.
Conversely, informants noted that a small number of farmers who owned substantial landholdings, and were thus able to farm shrimp on a large scale without incurring lease costs, had been able to further improve their economic status by doing so. However, it was reported that few ghers had increased in size through consolidation since the emergence of smallholder-dominated shrimp farming, and average gher sizes were declining due to their division between siblings upon inheritance.
In Medila, with the exception of nurseries, most aquaculture—including all of the largest
pangasius growout farms—was controlled by wealthy capitalist investors, mainly originating from outside the village.27 These individuals were often members of local political administrations and possessed portfolios of business interests spanning fish farms in other parts of the district, large feed mills, transport businesses, brickfields, construction and land speculation. Aquaculture thus resulted in little, if any, upward class mobility in Medila, but rather supported expanded accumulation among a small existing capitalist class with close links to the state. The only exception to this rule was for a small number of nursery operators, supplying fingerlings to these larger farms, at least one of which had amassed sufficient capital by doing so to begin large-scale pangasius growout.
Conversely, as documented in earlier sections, small paddy farmers and sharecroppers who lost access to land leased out for aquaculture became more reliant on selling their own labor power, resulting in downward movement in their class position. Although this pattern was evident in all four villages, in Bawalia, Bilpabla and Salabunia the possibility of leasing in land as a point of entry into commercial smallholder aquaculture enabled many, though not all, of those displaced to continue to operate as
ANALYSIS
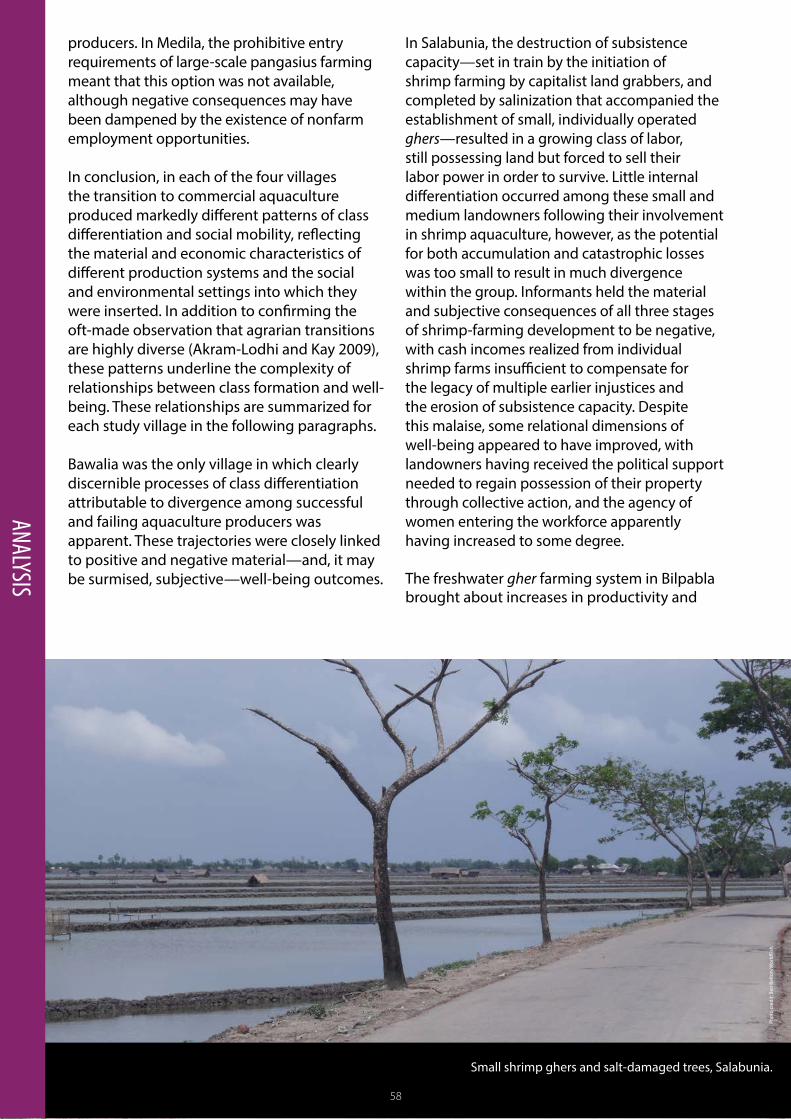
58
producers. In Medila, the prohibitive entry requirements of large-scale pangasius farming meant that this option was not available, although negative consequences may have been dampened by the existence of nonfarm employment opportunities.
In conclusion, in each of the four villages the transition to commercial aquaculture produced markedly different patterns of class differentiation and social mobility, reflecting the material and economic characteristics of different production systems and the social and environmental settings into which they were inserted. In addition to confirming the oft-made observation that agrarian transitions are highly diverse (Akram-Lodhi and Kay 2009), these patterns underline the complexity of relationships between class formation and well-being. These relationships are summarized for each study village in the following paragraphs.
Bawalia was the only village in which clearly discernible processes of class differentiation attributable to divergence among successful and failing aquaculture producers was apparent. These trajectories were closely linked to positive and negative material—and, it may be surmised, subjective—well-being outcomes.
In Salabunia, the destruction of subsistence capacity—set in train by the initiation of shrimp farming by capitalist land grabbers, and completed by salinization that accompanied the establishment of small, individually operated ghers—resulted in a growing class of labor, still possessing land but forced to sell their labor power in order to survive. Little internal differentiation occurred among these small and medium landowners following their involvement in shrimp aquaculture, however, as the potential for both accumulation and catastrophic losses was too small to result in much divergence within the group. Informants held the material and subjective consequences of all three stages of shrimp-farming development to be negative, with cash incomes realized from individual shrimp farms insufficient to compensate for the legacy of multiple earlier injustices and the erosion of subsistence capacity. Despite this malaise, some relational dimensions of well-being appeared to have improved, with landowners having received the political support needed to regain possession of their property through collective action, and the agency of women entering the workforce apparently having increased to some degree.
The freshwater gher farming system in Bilpabla brought about increases in productivity and
Small shrimp ghers and salt-damaged trees, Salabunia.
Phot
o cr
edit:
Ben
Bel
ton/
Wor
ldFi
sh
58
ANALYSIS
59
farm income, but, being heavily dependent on inputs of family labor, possessed limited potential for accumulation. This situation dampened class differentiation among landowners and resulted in a broadly equitable set of outcomes. Simultaneous improvements in material and subjective well-being among small landowners appeared widespread as a result. The population of landless Muslims who settled on khas land in the village after 2000 was largely bypassed by this development, however, and some tensions had arisen between long-term residents of the village and new tenant farmers from other areas, with whom they increasingly competed for access to land.
In Medila, a process of exclusion, enacted primarily through land markets but also possessing power dimensions, altered the class positions of some former sharecroppers and small landowners who lost access to land leased out for large-scale pangasius aquaculture (c.f. Hall et al. 2011). However, it appeared that availability of nonfarm opportunities blunted many of the negative material outcomes that this change might have been expected to induce. The subjective outcomes of Medila’s deagrarianization appeared variable, with many of those displaced expressing disquiet at their loss of subsistence capacity, while others, particularly the young, articulated preferences for pursuing occupations in the nonfarm sector. This suggests that the temptation to assume that inevitably negative well-being implications (subjective, material or relational) will result from the formation of new classes of labor should be avoided.
Summary: Aquaculture development and well-beingThis section has attempted to broaden discussion of the effects of aquaculture development beyond their usual scope and emphasis on deficits (e.g. poverty and food insecurity) by incorporating analysis of effects on well-being, a concept that has yet to be widely applied to the study of aquaculture. This discussion was framed in terms of changes in the subjective, material and relational dimensions of well-being that accompanied the commodification of food, land and labor in the study villages where commercial forms of aquaculture were established, as well as changes in gender and class relations that resulted from these processes.
Rice and its production play extremely important roles in the construction of subjective and material well-being in rural Bangladesh. Where aquaculture impacts the ability to produce rice, implications for well-being are thus likely to be highly significant. In Salabunia, informants indicated that subjective well-being had been eroded since the onset of shrimp farming, despite many landowning households becoming financially better off. This was expressed in terms of “tension” experienced under the current farming regime and “peace of mind” under the paddy-based economy. Such preferences are not universal or unchanging, however: in Medila, where off-farm employment opportunities provided attractive alternatives to agrarian livelihoods, younger people in particular expressed a preference for the former.
Although women’s involvement in aquaculture, both as producers and wage laborers, seemed to have been accompanied by an increasing degree of agency, it was striking that women’s engagement in these activities was often the outcome of necessity, rather than choice. With the partial exception of Bilpabla, where female agricultural wages were high, few women who could afford not to do so opted to partake in these activities entirely out of choice. The well-being implications of women’s involvement in aquaculture are therefore linked closely to their class status, which may in turn be subject to change depending on the forms that aquaculture development takes. The resultant outcomes are therefore often highly ambiguous.
Similar conclusions can be drawn from the observation that commodification of subsistence and the formation of new classes of labor do not inevitably result in negative changes in subjective, material or relational well-being, although they certainly can and do—sometimes, as in Salabunia, to quite extreme degrees. What emerges from the descriptive analysis presented in this section is a far more complex picture. Myriad finely variegated agrarian transitions play out in subtly different ways at the micro level, with different implications for the well-being of different social actors in different places. This makes it extremely difficult to advance broad generalizations about the likely well-being outcomes of aquaculture development.
ANALYSIS
60
This study has reviewed answers to five questions on the nature of aquaculture development in Bangladesh. These were addressed through a comprehensive integrated “Q squared” survey conducted in six villages where contrasting forms of aquaculture development had occurred. The questions were designed to test central narratives from the conceptual and empirical literature on the relationships among aquaculture, poverty and food security, and to broaden the scope of debate beyond them.
Key themes explored included the extent to which resource-poor households are able to participate in and benefit from aquaculture; the relationship between aquaculture and local food security; and the effects of commercial forms of aquaculture on relational, subjective and material dimensions of well-being, as mediated through changing class and gender relations. This concluding chapter presents the most significant of these findings and interprets their implications for future aquaculture development policy and research.
Key findingsParticipation of resource-poor households with limited landholdings in some forms of commercial aquaculture was much higher than anticipated. In some villages, significantly greater numbers of small landowners and the poor practiced commercial aquaculture than semisubsistence forms of the activity. However, household consumption expenditures and landownership were positively associated with the overall likelihood of practicing aquaculture (i.e. the poorer a household, the lower the likelihood of household members practicing aquaculture as producers). This finding applied to all forms of aquaculture covered by this study, including homestead ponds. Large-scale commercial aquaculture was so investment intensive as to completely exclude all poor and most nonpoor households as producers.
CONCLUSION: INTERPRETING THE IMPACTS OF AQUACULTURE DEVELOPMENT IN BANGLADESH
Commercially oriented smallholder aquaculture producers consumed larger quantities of fish from their own farms than households operating subsistence-oriented fish production systems. This finding was unexpected. Individuals from households practicing aquaculture consumed (and produced) more rice, fruits, nonleafy vegetables and fish per capita, on average, than those that did not. This reflected the higher-than-average incomes and larger-than-average agricultural landholdings of the former group.
Commercial forms of aquaculture created substantial on- and off-farm employment, while noncommercial aquaculture created very limited employment opportunities of any kind. Smallholder-dominated forms of commercial aquaculture were found to create the highest levels of direct employment for producers and in a wide range of supporting occupations.
Almost all expansion of commercial aquaculture took place on land formerly used for paddy cultivation, resulting in an inverse relationship between employment in aquaculture and agriculture. Nevertheless, smallholder-dominated commercial aquaculture created more employment opportunities than it destroyed by smoothing seasonal demand for labor, and with terms of employment comparable or preferable to those in agriculture. Day laborers often preferred aquaculture-related work to agricultural labor as a result. However, where viable non farm employment opportunities were available, these were generally favored over any type of on-farm labor.
Shifts from agriculture to commercial aquaculture were accompanied by rapid and pervasive changes in land tenure arrangements. The decline of sharecropping reduced availability of land for paddy cultivation, but, in some cases, new land rental markets facilitated equitable access to land for aquaculture by large numbers of small and medium landowners.
CONCLUSION: INTERPRETING THE IMPACTS OF AQUACULTURE DEVELOPM
ENT IN BANGLADESH
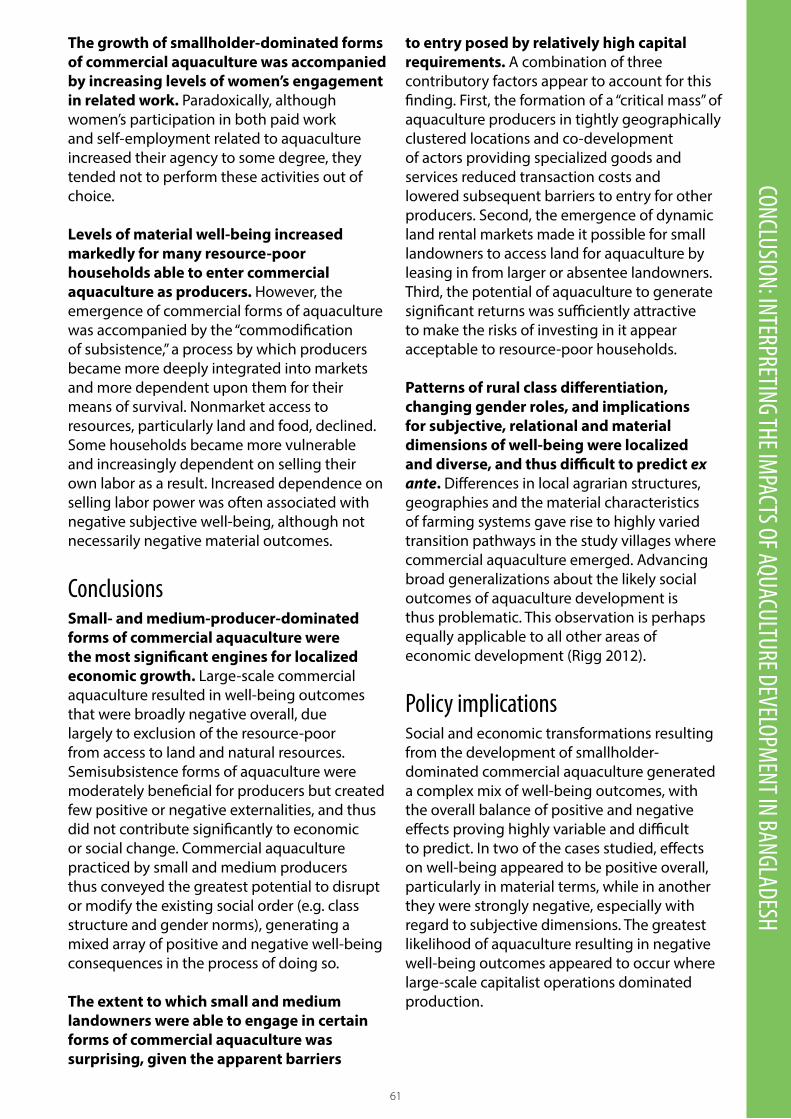
61
CONCLUSION: INTERPRETING THE IMPACTS OF AQUACULTURE DEVELOPM
ENT IN BANGLADESHThe growth of smallholder-dominated forms of commercial aquaculture was accompanied by increasing levels of women’s engagement in related work. Paradoxically, although women’s participation in both paid work and self-employment related to aquaculture increased their agency to some degree, they tended not to perform these activities out of choice.
Levels of material well-being increased markedly for many resource-poor households able to enter commercial aquaculture as producers. However, the emergence of commercial forms of aquaculture was accompanied by the “commodification of subsistence,” a process by which producers became more deeply integrated into markets and more dependent upon them for their means of survival. Nonmarket access to resources, particularly land and food, declined. Some households became more vulnerable and increasingly dependent on selling their own labor as a result. Increased dependence on selling labor power was often associated with negative subjective well-being, although not necessarily negative material outcomes.
ConclusionsSmall- and medium-producer-dominated forms of commercial aquaculture were the most significant engines for localized economic growth. Large-scale commercial aquaculture resulted in well-being outcomes that were broadly negative overall, due largely to exclusion of the resource-poor from access to land and natural resources. Semisubsistence forms of aquaculture were moderately beneficial for producers but created few positive or negative externalities, and thus did not contribute significantly to economic or social change. Commercial aquaculture practiced by small and medium producers thus conveyed the greatest potential to disrupt or modify the existing social order (e.g. class structure and gender norms), generating a mixed array of positive and negative well-being consequences in the process of doing so.
The extent to which small and medium landowners were able to engage in certain forms of commercial aquaculture was surprising, given the apparent barriers
to entry posed by relatively high capital requirements. A combination of three contributory factors appear to account for this finding. First, the formation of a “critical mass” of aquaculture producers in tightly geographically clustered locations and co-development of actors providing specialized goods and services reduced transaction costs and lowered subsequent barriers to entry for other producers. Second, the emergence of dynamic land rental markets made it possible for small landowners to access land for aquaculture by leasing in from larger or absentee landowners. Third, the potential of aquaculture to generate significant returns was sufficiently attractive to make the risks of investing in it appear acceptable to resource-poor households.
Patterns of rural class differentiation, changing gender roles, and implications for subjective, relational and material dimensions of well-being were localized and diverse, and thus difficult to predict ex ante. Differences in local agrarian structures, geographies and the material characteristics of farming systems gave rise to highly varied transition pathways in the study villages where commercial aquaculture emerged. Advancing broad generalizations about the likely social outcomes of aquaculture development is thus problematic. This observation is perhaps equally applicable to all other areas of economic development (Rigg 2012).
Policy implicationsSocial and economic transformations resulting from the development of smallholder-dominated commercial aquaculture generated a complex mix of well-being outcomes, with the overall balance of positive and negative effects proving highly variable and difficult to predict. In two of the cases studied, effects on well-being appeared to be positive overall, particularly in material terms, while in another they were strongly negative, especially with regard to subjective dimensions. The greatest likelihood of aquaculture resulting in negative well-being outcomes appeared to occur where large-scale capitalist operations dominated production.
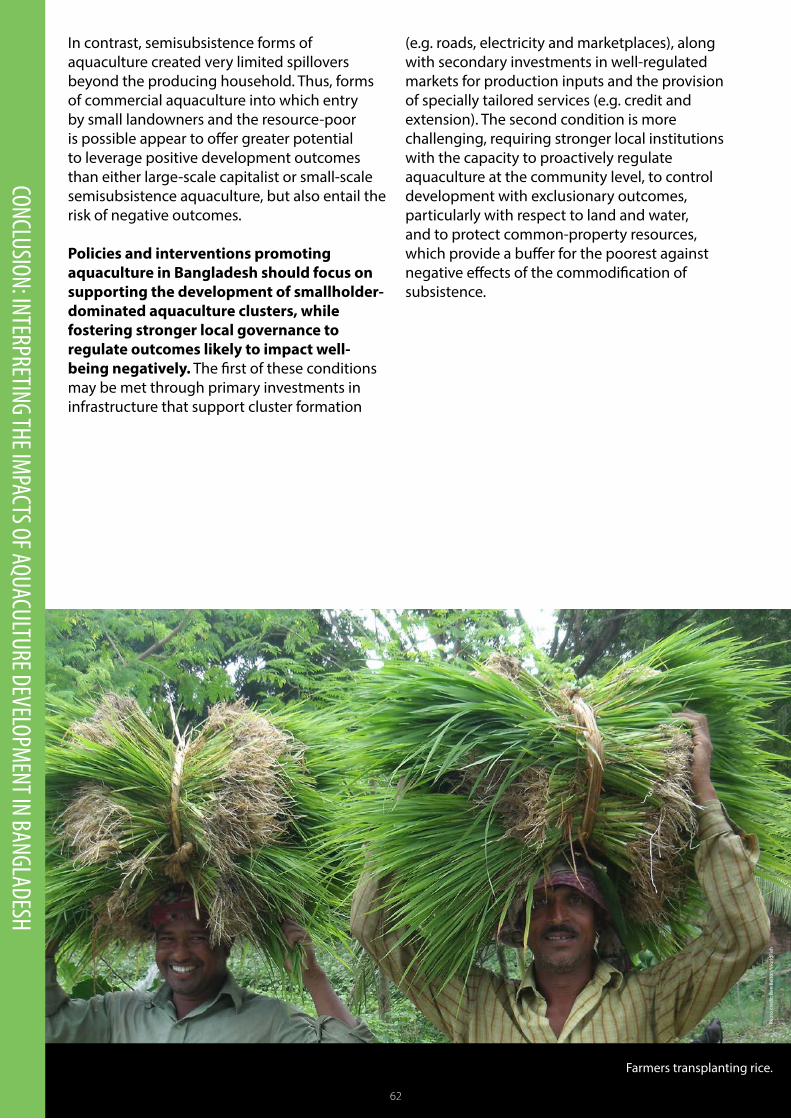
62
Farmers transplanting rice.
Phot
o cr
edit:
Ben
Bel
ton/
Wor
ldFi
sh
62
CONCLUSION: INTERPRETING THE IMPACTS OF AQUACULTURE DEVELOPM
ENT IN BANGLADESH
In contrast, semisubsistence forms of aquaculture created very limited spillovers beyond the producing household. Thus, forms of commercial aquaculture into which entry by small landowners and the resource-poor is possible appear to offer greater potential to leverage positive development outcomes than either large-scale capitalist or small-scale semisubsistence aquaculture, but also entail the risk of negative outcomes.
Policies and interventions promoting aquaculture in Bangladesh should focus on supporting the development of smallholder-dominated aquaculture clusters, while fostering stronger local governance to regulate outcomes likely to impact well-being negatively. The first of these conditions may be met through primary investments in infrastructure that support cluster formation
(e.g. roads, electricity and marketplaces), along with secondary investments in well-regulated markets for production inputs and the provision of specially tailored services (e.g. credit and extension). The second condition is more challenging, requiring stronger local institutions with the capacity to proactively regulate aquaculture at the community level, to control development with exclusionary outcomes, particularly with respect to land and water, and to protect common-property resources, which provide a buffer for the poorest against negative effects of the commodification of subsistence.
63
NOTES 1 Available from the International Food Policy Research Institute website at http://www.ifpri.org/
dataset/chronic-poverty-and-long-term-impact-study-bangladesh
2 This and the following subsection draw on findings published by van Assledonk (2013), who conducted fieldwork in Bawalia and Medila as part of the study.
3 The lowest tier of government.
4 A union is the smallest administrative division. There are approximately 10 unions in each upazila on average.
5 The survey was actually conducted in two small adjacent villages with very similar characteristics. For brevity we refer to both villages by a single name here.
6 US$ 1 was worth approximately BDT 81 in 2012.
7 The Gini coefficient is a widely used measure of inequality. A score of 0 would indicate perfect equality, a score of 1 total inequality.
8 Ali (2005, 266) describes homegardens in Bangladesh as follows: “A typical homegarden … occupies a small space adjacent to the house within the farmstead compound. It is very intensively cultivated to grow and raise a wide variety of plant and animal species utilizing primarily household female and child labor. The primary production goal here is to meet household consumption demand.”
9 The area covered by ponds is probably slightly overrepresented, particularly in Hawli, due to double counting of the area under multi-owner ponds, for which it was not possible to correct.
10 A significant number of households included in the sample population of the household survey do not own land in Bilpabla, but lease in and cultivate ghers in the village, living in rudimentary accommodation constructed on the gher dikes. These are excluded from our analysis because many of them own land in other villages, making their inclusion potentially misleading.
11 Single-owner ponds, as the name suggests, are owned by a single household. Multi-owner ponds are owned by two or more households as a result of the distribution of inherited property among siblings.
12 Bilpabla was a partial exception in this respect, as prawn farming in freshwater ghers was integrated with paddy cultivation.
13 US$ 1 = BDT 81 in 2012.
14 Table 18 provides data on all households that reported production of these crops in the agriculture module of the survey, irrespective of whether the activity was reported as one of the first or second most important sources of income in the employment module.
15 In this instance, the category “aquaculture producer” included all households with access to a pond, gher or rice-fish plot, irrespective of whether aquaculture represented a major occupation.
16 Severity of food insecurity was assessed based on responses to a questionnaire module designed to measure household food insecurity (Coates et al. 2007).
NOTES
64
NOTES
17 Households in food insecurity access category 1 were considered food secure. Those with a score placing them in category 2 or above were considered food insecure (Coates et al. 2007).
18 The commodification of subsistence is not a new process. Rice and other “traditional” crops have long been produced for both subsistence and commercial purposes in Bangladesh (Crow 2001). Reardon et al. (2014, 11) find that, at present, the shares of marketed paddy in Bangladesh are 57% for marginal farmers and 68% overall. However, it is contended that in each of the cases examined here, commodification was accelerated by the emergence of new forms of aquaculture production aimed directly at the market.
19 Paprocki and Cons (2014) report similar sentiments expressed by residents of communities in the same polder where this study was conducted.
20 This trend had begun prior to the advent of commercial aquaculture with the intensification of rice production (facilitated in Medila and Hawli by flood control schemes that allowed for the production of a crop of boro rice) and was also hastened in Medila by incidents of industrial pollution from nearby garment factories.
21 Prior to this time a market for land existed, as it could, of course, be bought and sold. Such transactions were rare, however, apart from the time of independence, when large amounts of land were sold in the two predominantly Hindu villages in Khulna.
22 Similar incidences of shrimp-related land grabs persist in other locations, however, including some villages in the same union as Salabunia.
23 Focus group discussions with women in Bilpabla suggested that the extent of both unpaid own farm work and wage work on the farms of others might have been underreported in the household survey.
24 Except during peaks in agricultural labor demand around planting and harvesting rice, when daily wages were often considerably higher than those in aquaculture.
25 Most earth cutters came from a community located further from Bhaluka town, where aquaculture was less developed and there were fewer employment opportunities. Most permanent labor on pangasius farms came from the remote and relatively deprived subdistrict of Haluaghat.
26 The household survey that informs the present study was conducted during a relatively “slack” period and thus failed to capture the labor-intensive nature of freshwater gher farming. This is confirmed by Jahan (personal communication, 2014), who surveyed labor use in a variety of aquaculture systems across an entire year.
27 This is, in part, a result of the village’s physical geography. A low water table means that ponds in the village do not retain water year round. As a result, pangasius growout is only possible in enclosed natural water bodies (beels) capable of holding water for 12 months per year. These are often several hectares or more in size. The levels of capital investment needed to farm pangasius on such a large scale place extremely high barriers on entry.
28 This index is constructed from the price of a basket of goods, including food and nonfood items, in rural areas of Bangladesh.
29 www.fantaproject.org/monitoring-and-evaluation/household-food-insecurity-access-scale-hfias
30 Our use of “well-being” is similar to that of White (2010) and Camfield et al. (2009b), who also use this term, and Coulthard et al. (2011) and Weeratunge et al. (2013), who refer to “social well-being.”
65
Adnan S. 2013. Land grabs and primitive accumulation in deltaic Bangladesh: Interactions between neoliberal globalization, state interventions, power relations and peasant resistance. Journal of Peasant Studies 40(1):87–128.
Ahmed AU, Ahmad K, Chou V, Hernandez R, Menon P, Naeem F, Naher F, Quabili W, Sraboni E and Yu B. 2013. The Status of Food Security in the Feed the Future Zone and Other Regions of Bangladesh: Results from the 2011–2012 Bangladesh Integrated Household Survey. Dhaka: Bangladesh Policy Research and Strategy Support Program, International Food Policy Research Institute.
Akram-Lodhi AH and Kay C. 2009. Peasants and Globalization: Political Economy, Rural Transformation and the Agrarian Question. New York: Routledge.
Ali AMS. 2005. Homegardens in smallholder farming systems: Examples from Bangladesh. Human Ecology 33(2):245–70.
Arens J and van Beurden J. 1977. Jhagrapur: Poor Peasants and Women in a Village in Bangladesh. Amsterdam: Third World Publications.
Arthur R, Béné C, Leschen W and Little D. 2013. Fisheries and Aquaculture and Their Potential Roles in Development: An Assessment of the Current Evidence. London: Marine Resources Assessment Group, Institute of Development Studies and University of Stirling.
Barmon BK, Matsuda H, Kondo T and Osanami F. 2005. Historical background and diffusion process of rice prawn gher farming system in Bangladesh – A case study of Khulna District. The Review of Agricultural Economics 61:85–100.
[BBS] Bangladesh Bureau of Statistics. 2011. Household Income and Expenditure Survey 2010. Dhaka: Bangladesh Bureau of Statistics, Ministry of Planning, Government of the People’s Republic of Bangladesh.
Belton B and Azad A. 2012. The characteristics and status of pond aquaculture in Bangladesh. Aquaculture 358-359:196–204.
Belton B, Haque MM and Little DC. 2012. Does size matter? Reassessing the relationship between aquaculture and poverty in Bangladesh. Journal of Development Studies 48(7):904–22.
Belton B and Little DC. 2011. Immanent and interventionist inland Asian aquaculture development and its outcomes. Development Policy Review 29(4):459–84.
Belton B, van Assledonk IJM and Thilsted SH. 2014. Faltering fisheries and ascendant aquaculture: Implications for food and nutrition security in Bangladesh. Food Policy 44:77–87.
Bernstein H. 2010. Class Dynamics of Agrarian Change. Boulder, CO: Kumarian Press.
Camfield L, Choudhury K and Devine J. 2009a. Well-being, happiness and why relationships matter: Evidence from Bangladesh. Journal of Happiness Studies 10:71–91.
Camfield L, Crivello G and Woodhead M. 2009b. Wellbeing research in developing countries: Reviewing the role of qualitative methods. Social Indicators Research 90:5–31.
REFERENCES REFERENCES
66
REFERENCES
[CFS] Committee on World Food Security. 2012. Coming to Terms with Terminology, Food Security, Nutrition Security, Food Security and Nutrition, Food and Nutrition Security. Rome: Committee on World Food Security, Food and Agriculture Organization of the United Nations.
Coates J, Swindale A and Bilinsky P. 2007. Household Food Insecurity Access Scale (HFIAS) for Measurement of Food Access: Indicator Guide, Vol. 3. Washington, D.C.: Food and Nutrition Technical Assistance Project, Academy for Educational Development.
Coulthard S, Johnson D and McGregor AJ. 2011. Poverty, sustainability and human wellbeing: A social wellbeing approach to the global fisheries crisis. Global Environmental Change 21(2):453–63.
Crow B. 2001. Markets, Class and Social Change: Trading Networks and Poverty and Rural South Asia. Basingstoke, UK: Palgrave.
Davis P and Baulch B. 2011. Parallel realities: Exploring poverty dynamics using mixed methods in rural Bangladesh. Journal of Development Studies 47(1):118–42.
Deaton A. 1997. The Analysis of Household Surveys: A Microeconomic Approach to Development. Baltimore, MD: Johns Hopkins University Press.
Deaton A and Zaidi S. 2002. Guidelines for constructing consumption aggregates for welfare analysis. LSMS Working Paper 135. Washington, D.C.: World Bank.
Edwards P. 1999. Towards increased impact of rural aquaculture. A discussion paper prepared for the first meeting of the APFIC Ad Hoc Working Group of Experts on Rural Aquaculture, FAO Regional Office for Asia and the Pacific, Bangkok, Thailand, 20–22 October 1999.
Edwards P. 2014. Towards meeting future demand for fish: Aquaculture in inland or marine, land or water-based systems? Aquaculture Asia 19(1):3–9.
Ellis F. 1998. Household strategies and rural livelihood diversification. The Journal of Development Studies 35(1):1–38.
Gough IJ, McGregor A and Camfield L. 2006. Wellbeing in developing countries: Conceptual foundations of the WeD programme. WeD Working Paper 19. Economic and Social Research Council Research Group on Wellbeing in Developing Countries.
Gurung K, Bhandari H, Paris T and Mohanty S. 2013. Changing Rice-Based Agricultural Systems in Bangladesh: Dynamics of Gender Equity and Household Food Security. Dhaka: International Rice Research Institute.
Hall D, Hirsch P and Li TM. 2011. Powers of Exclusion: Land Dilemmas in Southeast Asia. Honolulu, HI: University of Hawaii Press.
Hallman K, Lewis D and Begum S. 2003. An integrated economic and social analysis to assess the impact of vegetable and fishpond technologies on poverty in rural Bangladesh. EPTD Discussion Paper No. 112. Washington, D.C.: International Food Policy Research Institute.
[HKI] Helen Keller International. 2014. State of Food Security and Nutrition in Bangladesh: 2012. Dhaka: Helen Keller International and James P. Grant School of Public Health.
Hossain M and Bayes A. 2009. Rural Economy and Livelihoods: Insights from Bangladesh. Dhaka: AH Development Publishing House.
67
REFERENCESHossain M, Naher F and Shahabuddin Q. 2005. Food security and nutrition in Bangladesh:Progress and determinants. Journal of Agricultural and Development Economics 2(2):103–32.
Jahan KM, Ahmed M and Belton B. 2010. The impacts of aquaculture development on food security: Lessons from Bangladesh. Aquaculture Research 41(4):481–95.
Kabeer, N. 2002. The Power to Choose: Bangladeshi Garment Workers in London and Dhaka. London: Random House.
Karim M, Sarwer RH, Brooks AC, Gregory R, Jahan KM and Belton B. 2012.The incidence of suspected White Spot Syndrome Virus in semi intensive and extensive shrimp farms in Bangladesh: Implications for management. Aquaculture Research 43(9):1357–71.
Kassam L. 2013. Assessing the contribution of aquaculture to poverty reduction in Ghana. [PhD thesis] London: School of Oriental and African Studies.
Kotalová J. 1996. Belonging to Others: Cultural Construction of Womenhood in a Village in Bangladesh. Dhaka: University Press Limited.
Krishna A. 2007. For reducing poverty faster: Target reasons before people. World Development 35(11):1947–60.
Lewis D. 1997. Rethinking aquaculture for resource-poor farmers: Perspectives from Bangladesh. Food Policy 22(6):533–46.
Masset E, Haddad L, Cornelius A and Isaza-Castro J. 2011. A Systematic Review of Agricultural Interventions that Aim to Improve Nutritional Status of Children. London: EPPI-Centre, Social Science Research Unit, Institute of Education, University of London.
Paprocki K and Cons J. 2014. Life in a shrimp zone: Aqua- and other cultures of Bangladesh’s coastal landscape. Journal of Peasant Studies. dx.doi.org/10.1080/03066150.2014.937709
Quisumbing AR, Roy S, Njuki J, Tanvin K and Waithanji E. 2013. Can dairy value-chain projects change gender norms in rural Bangladesh? Impacts on assets, gender norms, and time use. IFPRI Discussion Paper 01311. Washington, D.C.: International Food Policy Research Institute.
Rahman AA, Quddus AHG, Pokrant B and Ali ML, eds. 2006. Shrimp Farming and Industry: Sustainability, Trade and Livelihoods. Dhaka: Bangladesh Center for Advanced Studies and the University Press Limited.
Rand J and Tarp F. 2010. Impact of an aquaculture extension project in Bangladesh. Journal of Development Effectiveness 1(2):130–46.
Reardon T, Tschirley D, Dolislager M, Snyder J, Hu C and White S. 2014. Urbanization, Diet Change, and Transformation of Food Supply Chains in Asia. Lansing, MI: Michigan State University, Global Center for Food Systems Innovation.
Rigg, J. 2012. Unplanned Development: Tracking Change in Southeast Asia. London: Zed Books.
Rigg J and Vandergeest P. 2012. Revisiting Rural Places: Pathways to Poverty and Prosperity in Southeast Asia. Honolulu, HI: University of Hawaii Press.
Scott JC. 1976. The Moral Economy of the Peasant: Rebellion and Subsistence in Southeast Asia. New Haven, CT: Yale University Press.
68
REFERENCES
Shaffer P, Kanbur R, Thang N and Aryeetey EBD. 2008. Introduction. International Journal of Multiple Research Approaches 2:134–44.
Stevenson JR and Irz X. 2009. Is aquaculture development an effective tool for poverty alleviation? A review of theory and evidence. Cahiers Agricultures 18(2–3):292–99. Subasinghe RP, Arthur JR, Bartley DM, De Silva SS, Halwart M, Hishamunda N, Mohan CV and Sorgeloos P, eds. 2010. Farming the waters for people and food. In Proceedings of the Global Conference on Aquaculture 2010, Phuket, Thailand, 22–25 September 2010, 719–83. Rome: FAO; Bangkok: NACA.
Thompson PM, Firoz Khan AKM and Sultana P. 2006. Comparison of aquaculture extension impacts in Bangladesh. Aquaculture Economics and Management 10:15–31.
Toufique KA and Belton B. 2014. Is aquaculture pro-poor? Empirical evidence of impacts on fish consumption from Bangladesh. World Development. dx.doi.org/10.1016/j.worlddev.2014.06.035
Toufique KA and Gregory R. 2008. Common waters and private lands: Distributional impacts of floodplain aquaculture in Bangladesh. Food Policy 33(6):587–94.
[USAID] United States Agency for International Development. 2006. A pro-poor analysis of the shrimp sector in Bangladesh. Greater Access to Trade (GATE) Project. Development and Training Services, 93.
van Assledonk I. 2013. Agrarian transition: Evolving livelihood pathways in the context of the pangasius boom crop in Bangladesh: A comparative case study of two villages in Mymensingh district. [MSc Thesis] Wageningen University, The Netherlands.
von Braun J. 1995. Agricultural commercialization: Impacts on income and nutrition and implications for policy. Food Policy 20(3):187–202.
Weeratunge N, Béné C, Siriwardane R, Charles A, Johnson D, Allison EH, Nayak PK and Badjeck MC. 2013. Small-scale fisheries through the wellbeing lens. Fish and Fisheries 15(2):255–79.
White SC. 1992. Arguing with the Crocodile: Gender and Class in Bangladesh. London: Zed Books.
White SC. 2010. Analysing wellbeing: A framework for development practice. Development in Practice 20(2):158–72.
69
PovertyAlthough poverty is multidimensional and dynamic (Krishna 2007), it is most commonly measured in terms of material deprivation, with reference to thresholds in per capita incomes or expenditures. This approach is also adopted here due to the cross-sectional nature of the survey and the relatively simple research question about whether resource-poor households participate in aquaculture. No attempt was made to answer quantitatively the more complex questions of whether or to what extent aquaculture has been responsible for reducing poverty in the study communities.
Poverty was defined according to the national upper and lower poverty lines set by the Bangladesh Bureau of Statistics (BBS) for 2010 (BBS 2011). BBS defines a food and a nonfood poverty line to delimit the lower and upper poverty lines. There are three steps in the calculation of the food poverty line: (1) a basic food basket of 11 food items is selected; (2) the quantities in the basket are scaled according to the nutritional requirement of 2122 kilocalories per person per day; and (3) the cost of acquiring the basket is calculated. The estimated cost is considered as the food poverty line. The nonfood poverty line is calculated by estimating the average consumption expenditure on nonfood items by households close to the food poverty line (BBS 2011).
The upper poverty line is determined by adding together the food and nonfood poverty lines. “Extreme poor” households are defined as those households whose total expenditures on food and nonfood combined are equal to or less than the food poverty line. “Moderate poor” households are those households whose total expenditures are equal to or less than the upper poverty line but above the food poverty line. Nonpoor households are those households whose total expenditures are above the upper poverty line (BBS 2011).
Consistent with standard approaches to the analysis of household surveys, expenditure per capita was used as a proxy for income per capita on the basis that accurate recall of the latter is more difficult for interviewees (Deaton 1997). Expenditure was constructed using data from the food and nonfood modules of a household survey questionnaire, with items produced by households for own consumption valued at local market prices (Deaton and Zaidi 2002; Davis and Baulch 2011). “Lumpy” expenditures (dowries, weddings, funerals; durable goods; health and medical expenditures; legal costs) were excluded. Household expenditures were deflated to 2010 prices using the general rural consumer price index.28
EmploymentOne of the study’s primary concerns was to measure the quantity and quality of employment associated with different forms of aquaculture and other comparable activities, such as agriculture. The employment module thus represented a major component of the household survey. The first section of the module recorded information on the primary and secondary occupations during the preceding 12 months of all household members above eight years of age, including the length of time spent working, the value of the cash and/or in-kind income received, and whether any labor was employed. The module’s second section recorded information on the pay, working hours and gender of all employees hired by questionnaire respondents’ households. The final section of the module checked whether any of the occupations listed by respondents in the first section were predominantly aquaculture related and, if so, recorded the precise nature of the work. Data obtained from the first part of the module provided a representative picture of all the major employment activities engaged in by village inhabitants, both inside and outside the village, while data from the second part of the module provided a picture of the hired labor working in the village, whether originating from inside or outside the community.
ANNEX 1: KEY DEFINITIONS ANNEX 1
70
ANNEX 1
LandIssues of landownership and access are of critical importance in rural Bangladesh: first, because land is the basis for all agricultural production; and second, because land inheritance laws that require the division of property among offspring, coupled to extremely high population density and rapid population growth, have resulted in extremely atomized and fragmented landholding patterns. Fifty-nine percent of rural households are considered to be functionally landless (defined as ownership of less than 0.2 ha of land—an area insufficient to fulfill basic subsistence needs), and 28% of rural households have no cultivable land whatsoever (Hossain and Bayes 2009). Access to land is mediated by a variety of arrangements, including sharecropping, mortgaging and leasing. Such arrangements are often transformed by new forms of agrarian development, with important implications for those who are excluded by these processes (Hall et al. 2011). Our focus on landholdings explored the extent to which small landowners were able to engage directly in aquaculture as producers, as well as examining the arrangements under which lands utilized for aquaculture were accessed. For analytical purposes, BBS’s five-tiered categorization of landholding size was used: less than 0.2 ha (functionally landless); 0.2–0.4 ha (marginal); 0.4–1.0 ha (small); 1.0–3.0 ha (medium); more than 3.0 ha (large).
Food securityFood and nutrition security exists “when all people at all times have physical, social and economic access to food, which is consumed in sufficient quantity and quality to meet their dietary needs and food preferences” (CFS 2012). Bangladesh has very high rates of malnutrition resulting from poor food and nutrition security, with symptoms including high rates of stunting and wasting, women’s anemia, and low birth weight babies (HKI 2014). Although increases in homestead-based agricultural production are found to have positive effects on the consumption of nutrient-rich foods such as fruits, vegetables, fish and dairy (Masset et al. 2011), there is less consensus as to whether production for the market does so (von Braun 1995), particularly if the conversion of agricultural land or wetlands to aquaculture excludes other resource users (Toufique and Gregory 2008).
Food insecurity was measured using a survey instrument developed by the USAID Food and Nutritional Technical Assistance project.29 The instrument was developed to allow for differentiation between food-secure and food-insecure households in different cultural contexts. It uses answers to nine questions on various events relating to access to food over a four-week recall period and their frequency of occurrence, in order to assign households and populations along a continuum of severity from food secure to severely food insecure (Coates et al. 2007).
Well-beingThe final research question concerns the effects of commercial aquaculture development on well-being.30 Well-being represents a more holistic alternative to the “deficit view” that characterizes most conventional frameworks for understanding poverty and vulnerability (Camfield et al. 2009b) and has gained increasing currency as a concept in international development over the last decade (e.g. Gough et al. 2006), based on the recognition that there is more that matters to people than the purely material aspects of their lives (Coulthard et al. 2011).
Well-being, as visualized by White (2010) and Weeratunge et al. (2013), comprises three interdependent dimensions: the material, the subjective and the relational (Figure 15). Material dimensions of well-being are at the center of traditional approaches to development, which are concerned with welfare indicators such as consumption, income and health, and, often, their quantification (White 2010). Relational dimensions concern the quality and dynamics of social relationships, whether interpersonal (e.g. between members of a family, or between an employer and a worker) or between groups of actors within or beyond the boundaries of a community. These relationships may reflect “social divisions and inequalities, and the forms of entitlement and domination codified in identities by class, caste, gender, religion, race, ethnicity, age, disability, or ritual responsibility” (White 2010, 163). The relational dimension of well-being is particularly
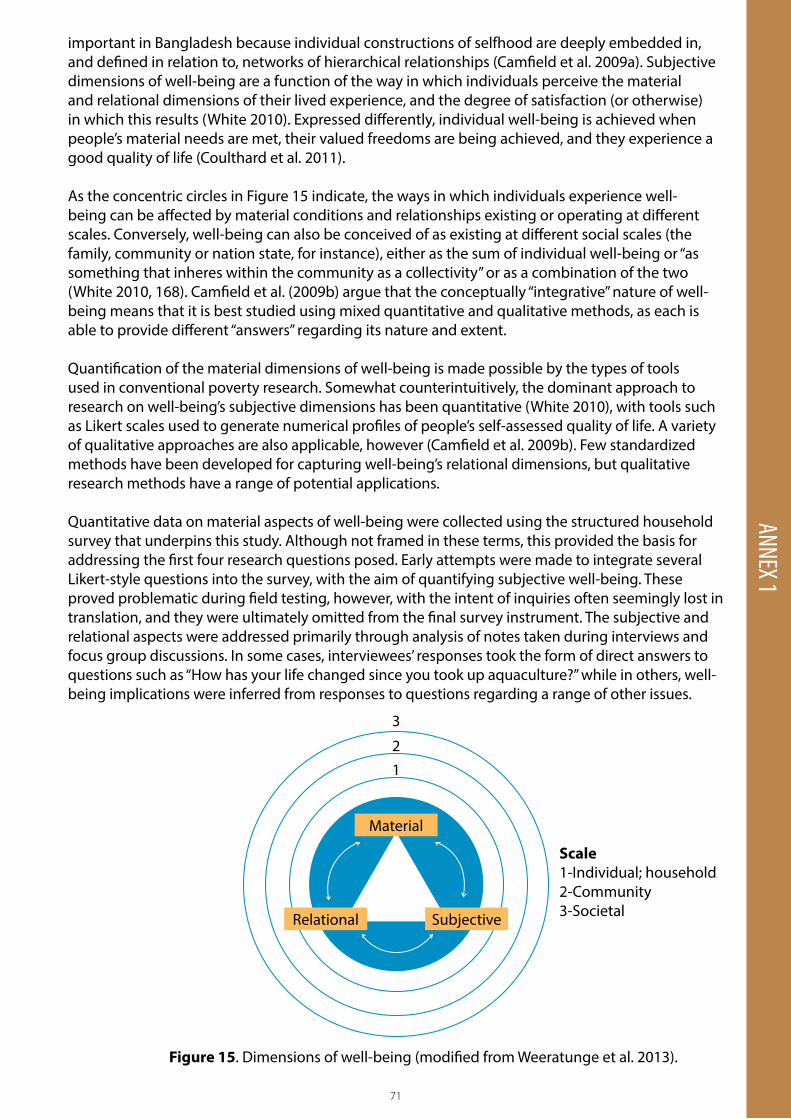
71
ANNEX 1 important in Bangladesh because individual constructions of selfhood are deeply embedded in, and defined in relation to, networks of hierarchical relationships (Camfield et al. 2009a). Subjective dimensions of well-being are a function of the way in which individuals perceive the material and relational dimensions of their lived experience, and the degree of satisfaction (or otherwise) in which this results (White 2010). Expressed differently, individual well-being is achieved when people’s material needs are met, their valued freedoms are being achieved, and they experience a good quality of life (Coulthard et al. 2011).
As the concentric circles in Figure 15 indicate, the ways in which individuals experience well-being can be affected by material conditions and relationships existing or operating at different scales. Conversely, well-being can also be conceived of as existing at different social scales (the family, community or nation state, for instance), either as the sum of individual well-being or “as something that inheres within the community as a collectivity” or as a combination of the two (White 2010, 168). Camfield et al. (2009b) argue that the conceptually “integrative” nature of well-being means that it is best studied using mixed quantitative and qualitative methods, as each is able to provide different “answers” regarding its nature and extent.
Quantification of the material dimensions of well-being is made possible by the types of tools used in conventional poverty research. Somewhat counterintuitively, the dominant approach to research on well-being’s subjective dimensions has been quantitative (White 2010), with tools such as Likert scales used to generate numerical profiles of people’s self-assessed quality of life. A variety of qualitative approaches are also applicable, however (Camfield et al. 2009b). Few standardized methods have been developed for capturing well-being’s relational dimensions, but qualitative research methods have a range of potential applications.
Quantitative data on material aspects of well-being were collected using the structured household survey that underpins this study. Although not framed in these terms, this provided the basis for addressing the first four research questions posed. Early attempts were made to integrate several Likert-style questions into the survey, with the aim of quantifying subjective well-being. These proved problematic during field testing, however, with the intent of inquiries often seemingly lost in translation, and they were ultimately omitted from the final survey instrument. The subjective and relational aspects were addressed primarily through analysis of notes taken during interviews and focus group discussions. In some cases, interviewees’ responses took the form of direct answers to questions such as “How has your life changed since you took up aquaculture?” while in others, well-being implications were inferred from responses to questions regarding a range of other issues.
Figure 15. Dimensions of well-being (modified from Weeratunge et al. 2013).
Scale 1-Individual; household2-Community3-Societal
3
21
SubjectiveRelational
Material
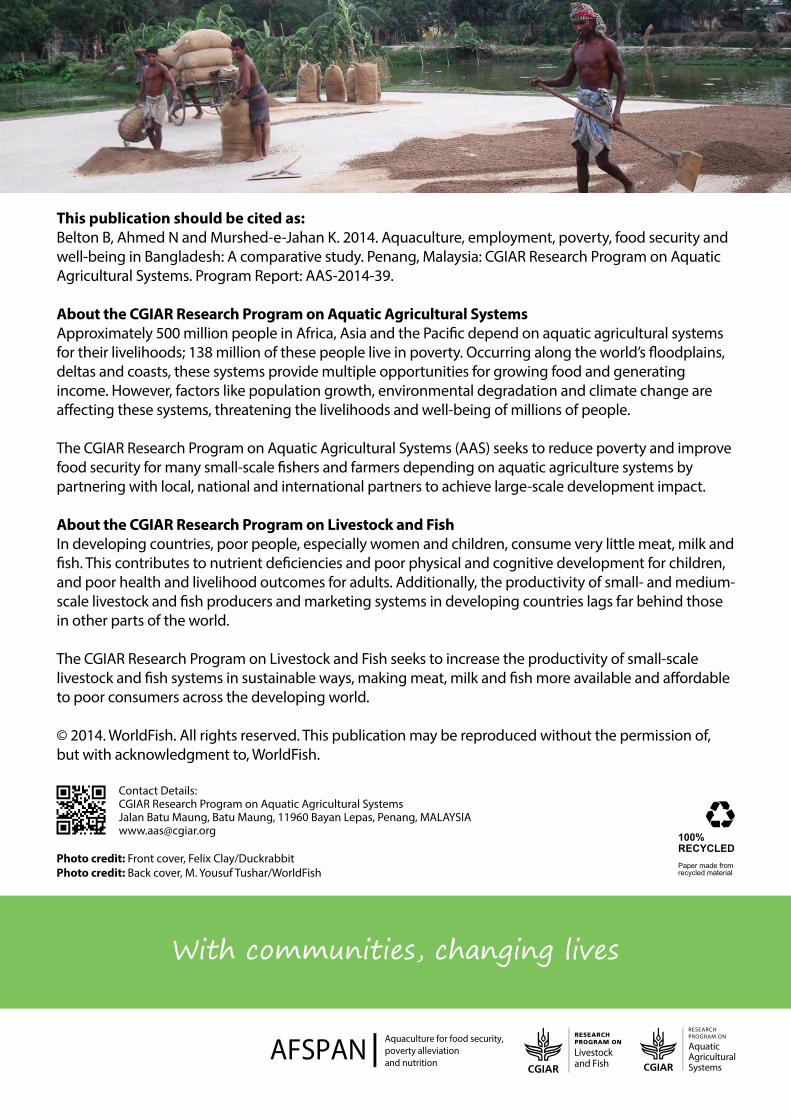
This publication should be cited as: Belton B, Ahmed N and Murshed-e-Jahan K. 2014. Aquaculture, employment, poverty, food security and well-being in Bangladesh: A comparative study. Penang, Malaysia: CGIAR Research Program on Aquatic Agricultural Systems. Program Report: AAS-2014-39.
About the CGIAR Research Program on Aquatic Agricultural SystemsApproximately 500 million people in Africa, Asia and the Pacific depend on aquatic agricultural systems for their livelihoods; 138 million of these people live in poverty. Occurring along the world’s floodplains, deltas and coasts, these systems provide multiple opportunities for growing food and generating income. However, factors like population growth, environmental degradation and climate change are affecting these systems, threatening the livelihoods and well-being of millions of people.
The CGIAR Research Program on Aquatic Agricultural Systems (AAS) seeks to reduce poverty and improve food security for many small-scale fishers and farmers depending on aquatic agriculture systems by partnering with local, national and international partners to achieve large-scale development impact.
About the CGIAR Research Program on Livestock and FishIn developing countries, poor people, especially women and children, consume very little meat, milk and fish. This contributes to nutrient deficiencies and poor physical and cognitive development for children, and poor health and livelihood outcomes for adults. Additionally, the productivity of small- and medium-scale livestock and fish producers and marketing systems in developing countries lags far behind those in other parts of the world. The CGIAR Research Program on Livestock and Fish seeks to increase the productivity of small-scale livestock and fish systems in sustainable ways, making meat, milk and fish more available and affordable to poor consumers across the developing world.
© 2014. WorldFish. All rights reserved. This publication may be reproduced without the permission of, but with acknowledgment to, WorldFish.
Paper made fromrecycled material
100% RECYCLED
Photo credit: Front cover, Felix Clay/DuckrabbitPhoto credit: Back cover, M. Yousuf Tushar/WorldFish
Contact Details:CGIAR Research Program on Aquatic Agricultural SystemsJalan Batu Maung, Batu Maung, 11960 Bayan Lepas, Penang, [email protected]