Embed Size (px)
Citation preview
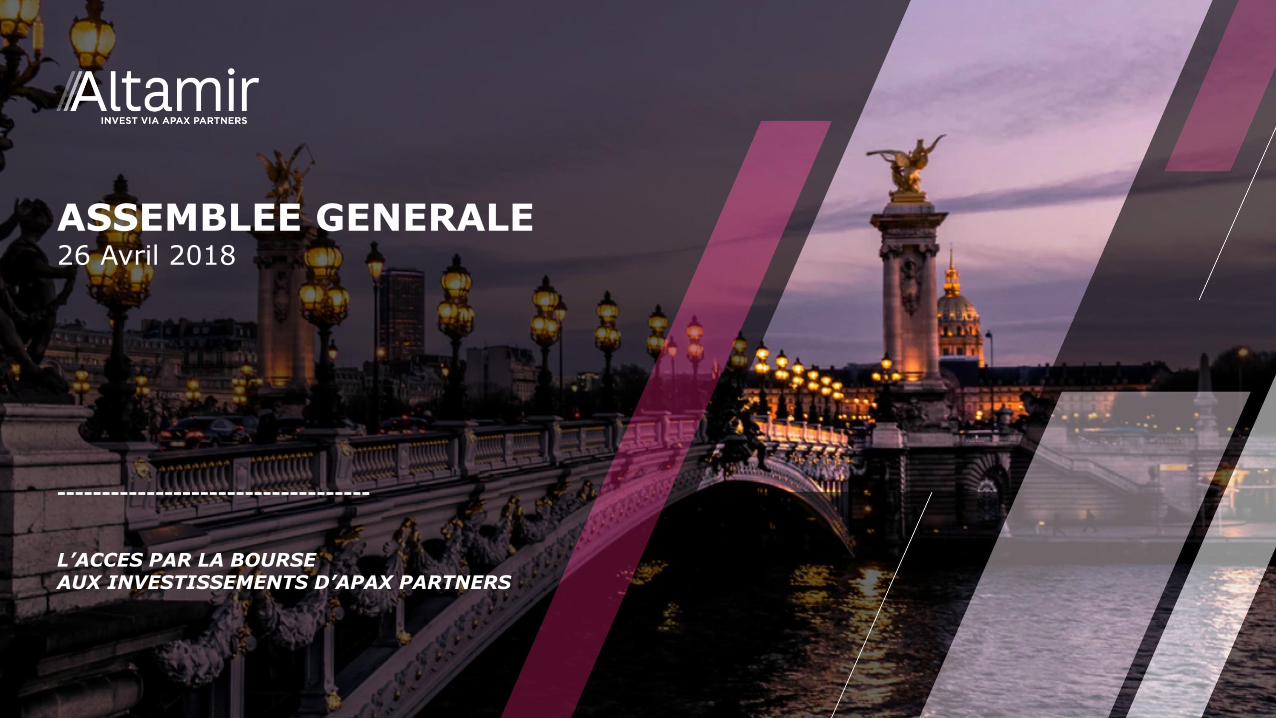
ASSEMBLEE GENERALE26 Avril 2018
-----------------------------------
L’ACCES PAR LA BOURSE AUX INVESTISSEMENTS D’APAX PARTNERS
AGM 26 APRIL 2018 p.2
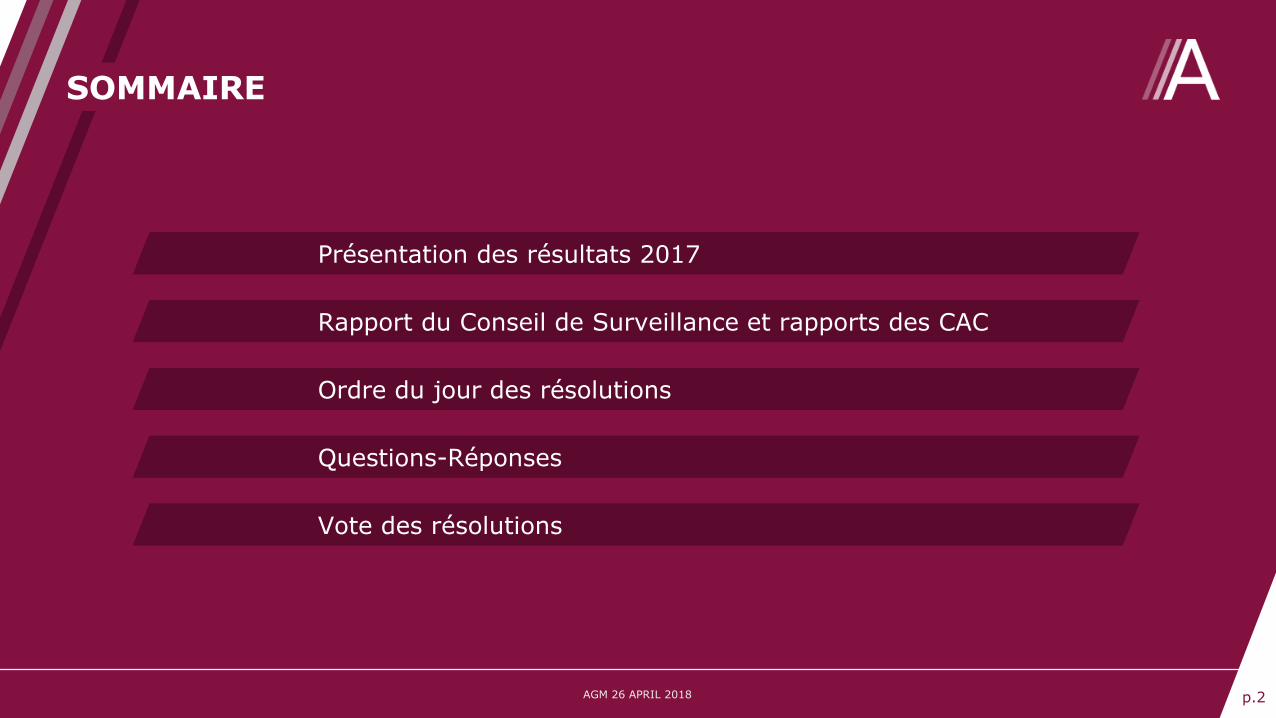
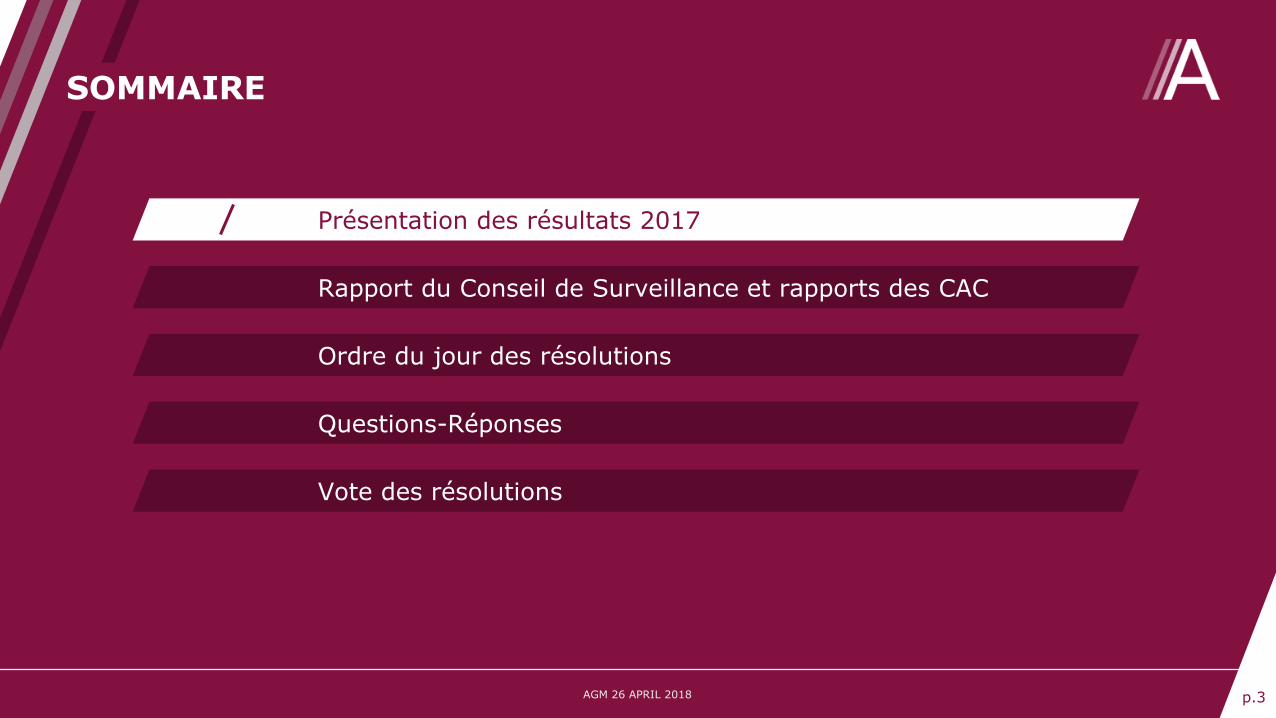
Présentation des résultats 2017
Rapport du Conseil de Surveillance et rapports des CAC
Ordre du jour des résolutions
Questions-Réponses
Vote des résolutions
SOMMAIRE
AGM 26 APRIL 2018 p.3
Rapport du Conseil de Surveillance et rapports des CAC
Ordre du jour des résolutions
Questions-Réponses
Vote des résolutions
Présentation des résultats 2017
SOMMAIRE
AGM 26 APRIL 2018 p.4
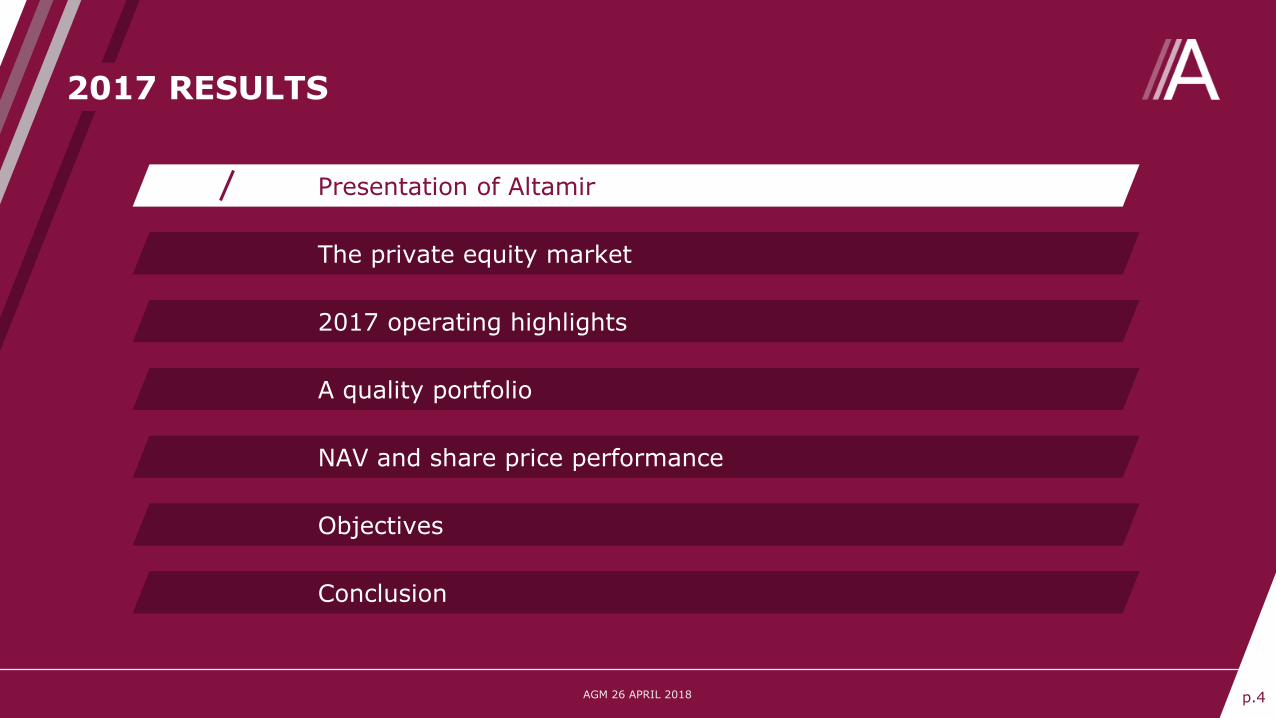
The private equity market
2017 operating highlights
A quality portfolio
NAV and share price performance
Objectives
Conclusion
Presentation of Altamir
2017 RESULTS
AGM 26 APRIL 2018 p.5
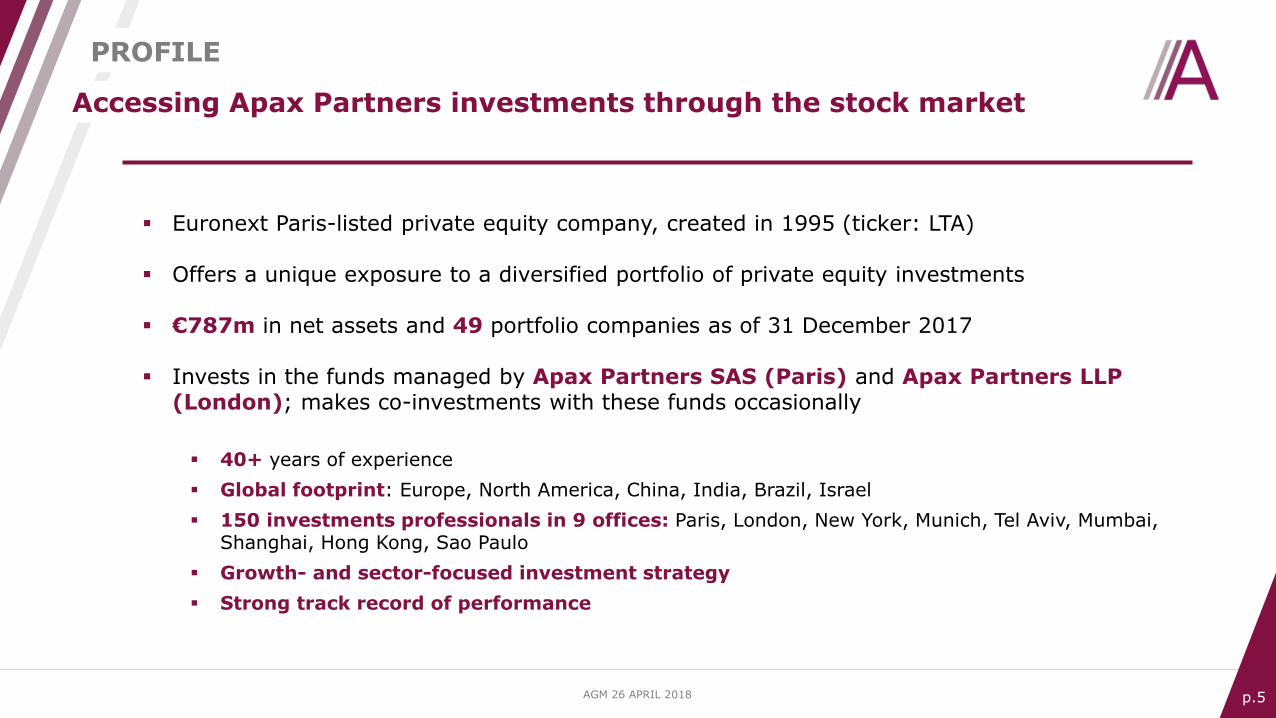
▪ Euronext Paris-listed private equity company, created in 1995 (ticker: LTA)
▪ Offers a unique exposure to a diversified portfolio of private equity investments
▪ €787m in net assets and 49 portfolio companies as of 31 December 2017
▪ Invests in the funds managed by Apax Partners SAS (Paris) and Apax Partners LLP (London); makes co-investments with these funds occasionally
▪ 40+ years of experience
▪ Global footprint: Europe, North America, China, India, Brazil, Israel
▪ 150 investments professionals in 9 offices: Paris, London, New York, Munich, Tel Aviv, Mumbai, Shanghai, Hong Kong, Sao Paulo
▪ Growth- and sector-focused investment strategy
▪ Strong track record of performance
PROFILE
Accessing Apax Partners investments through the stock market
AGM 26 APRIL 2018 p.6
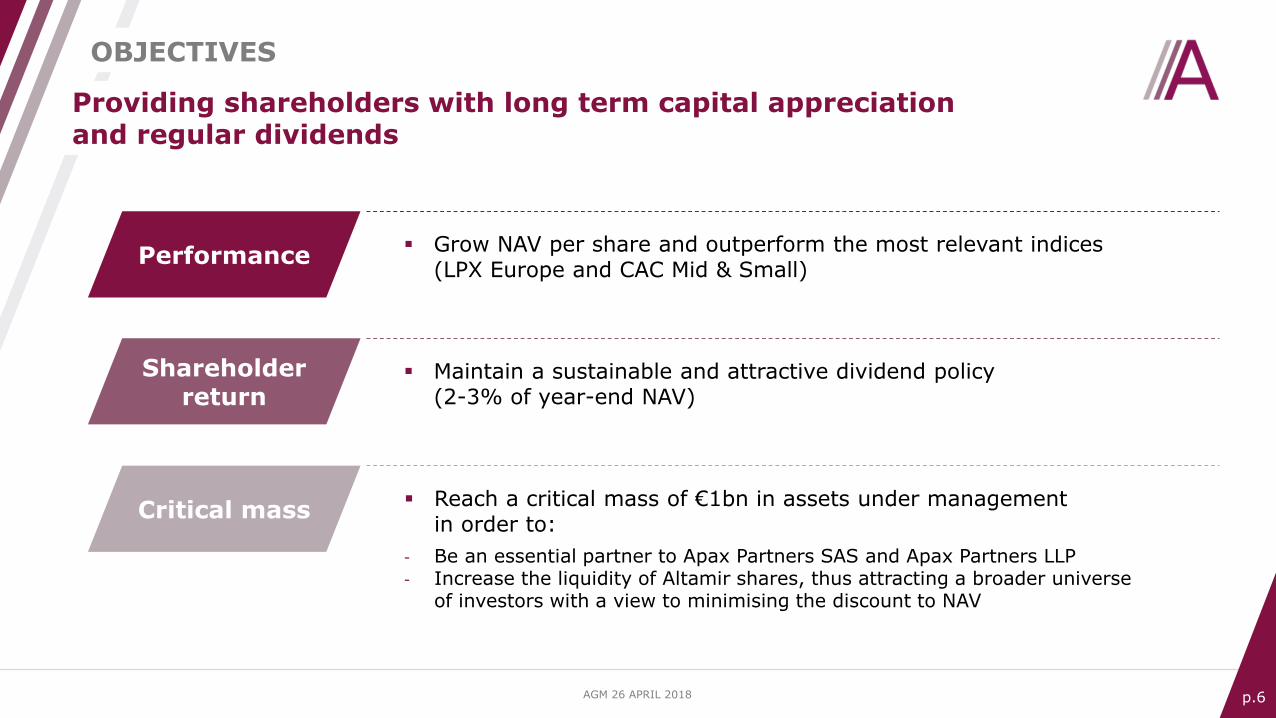
▪ Grow NAV per share and outperform the most relevant indices(LPX Europe and CAC Mid & Small)
Performance
▪ Maintain a sustainable and attractive dividend policy(2-3% of year-end NAV)
Shareholderreturn
▪ Reach a critical mass of €1bn in assets under managementin order to:
- Be an essential partner to Apax Partners SAS and Apax Partners LLP- Increase the liquidity of Altamir shares, thus attracting a broader universe
of investors with a view to minimising the discount to NAV
Critical mass
Providing shareholders with long term capital appreciationand regular dividends
OBJECTIVES
AGM 26 APRIL 2018 p.7
The private equity market
2017 operating highlights
A quality portfolio
NAV and share price performance
Objectives
Conclusion
Presentation of Altamir
2017 RESULTS
AGM 26 APRIL 2018 p.8
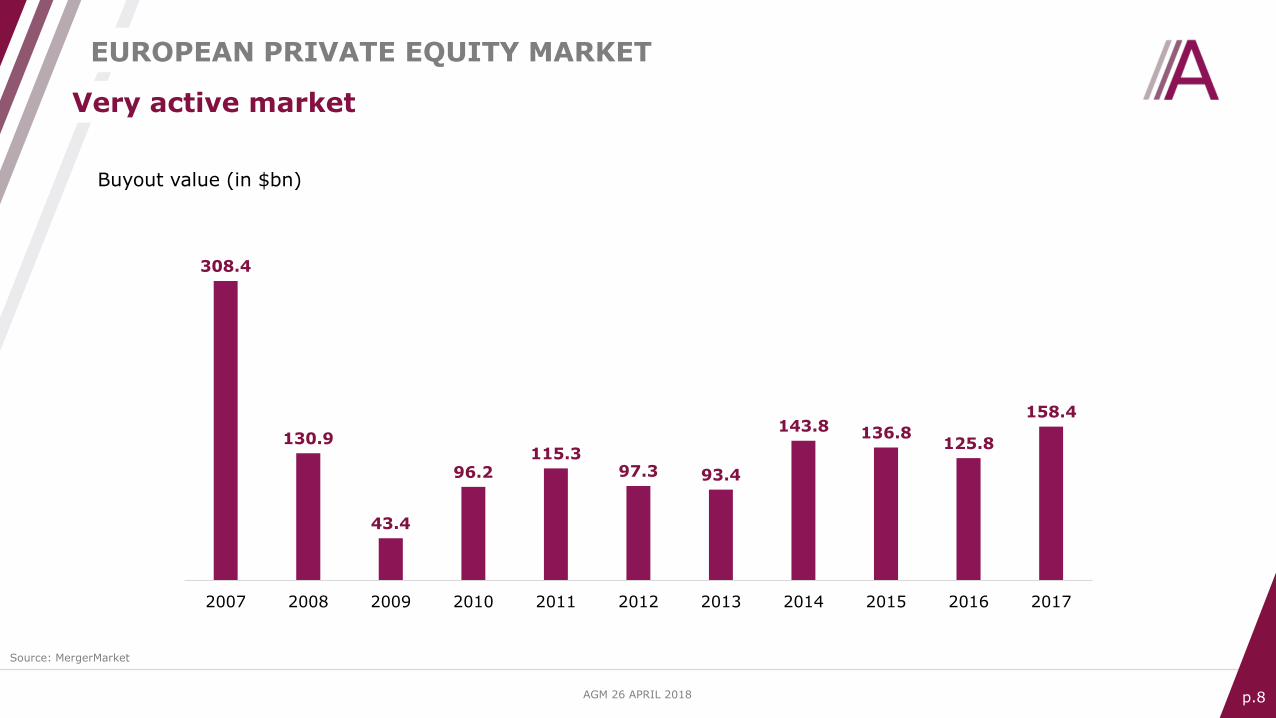
308.4
130.9
43.4
96.2115.3
97.3 93.4
143.8 136.8125.8
158.4
2007 2008 2009 2010 2011 2012 2013 2014 2015 2016 2017
Buyout value (in $bn)
Very active market
EUROPEAN PRIVATE EQUITY MARKET
Source: MergerMarket
AGM 26 APRIL 2018 p.9
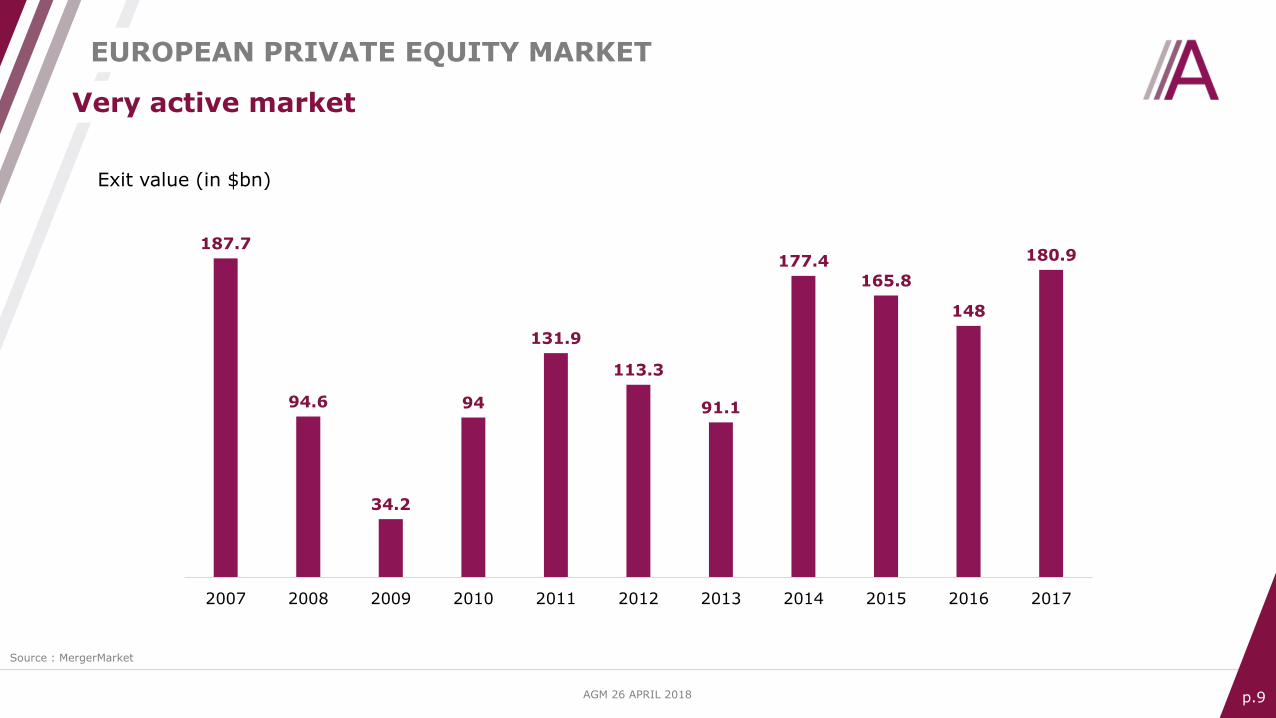
Very active market
EUROPEAN PRIVATE EQUITY MARKET
Exit value (in $bn)
187.7
94.6
34.2
94
131.9
113.3
91.1
177.4
165.8
148
180.9
2007 2008 2009 2010 2011 2012 2013 2014 2015 2016 2017
Source : MergerMarket
AGM 26 APRIL 2018 p.10
The private equity market
2017 operating highlights
A quality portfolio
NAV and share price performance
Objectives
Conclusion
Presentation of Altamir
2017 RESULTS
AGM 26 APRIL 2018 p.11
Statutorynet cashPosition
(at 31/12/2017)
AverageEBITDA growth*
NAV growth
Divestments
Investments&
commitments
New investments & commitments
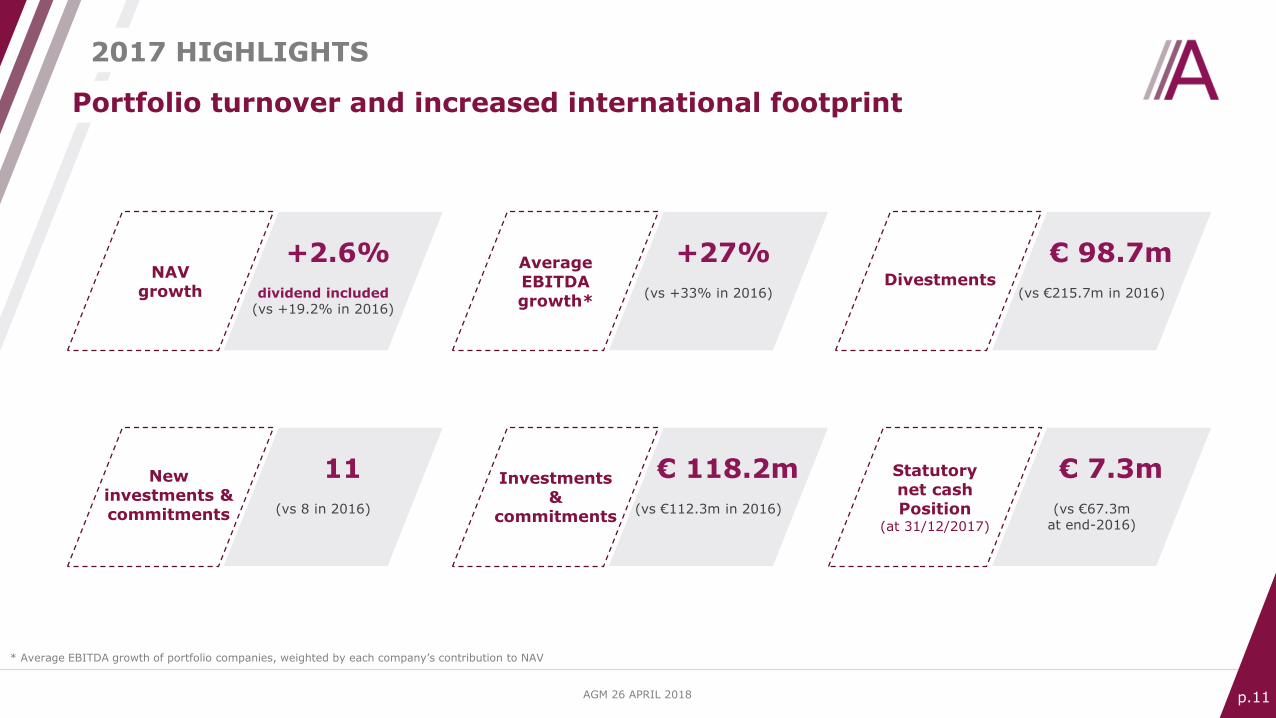
Portfolio turnover and increased international footprint
2017 HIGHLIGHTS
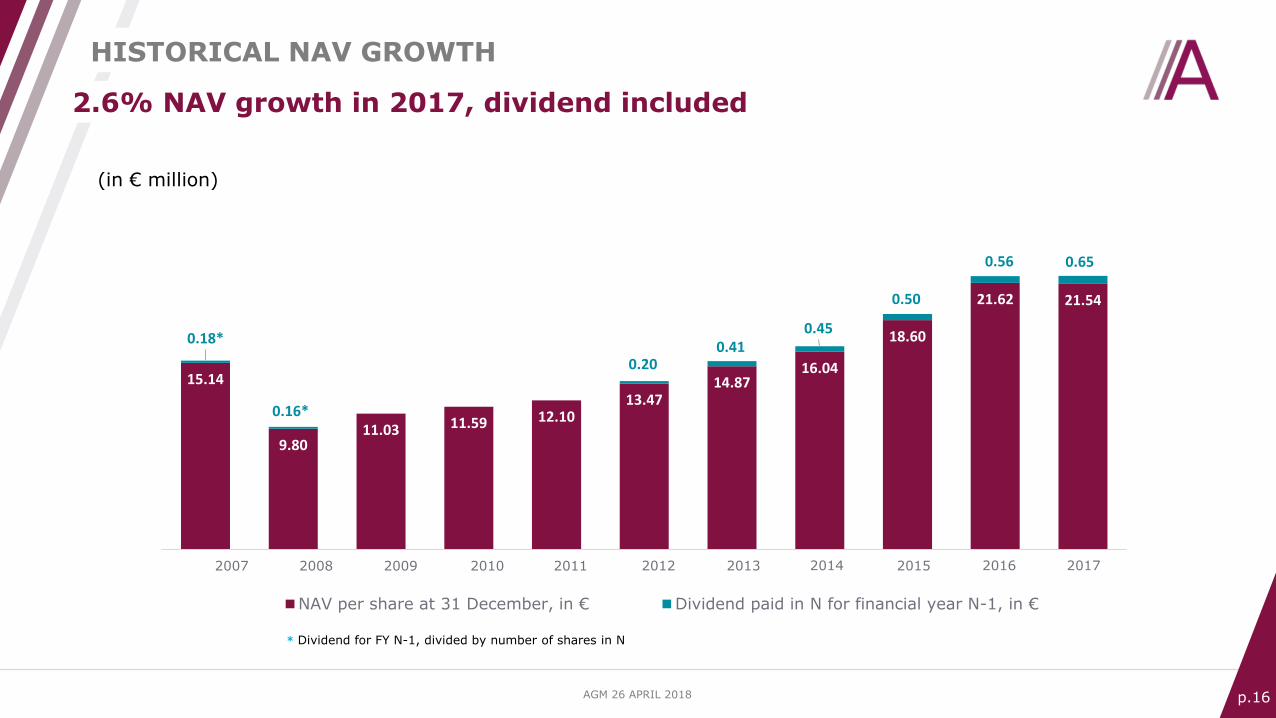
+2.6%
dividend included(vs +19.2% in 2016)
+27%
(vs +33% in 2016)
€ 98.7m
(vs €215.7m in 2016)
11
(vs 8 in 2016)
€ 118.2m
(vs €112.3m in 2016)
€ 7.3m
(vs €67.3mat end-2016)
* Average EBITDA growth of portfolio companies, weighted by each company’s contribution to NAV
AGM 26 APRIL 2018 p.12
€98.7m of divestment proceeds and revenue in 2017
DIVESTMENTS
(in € million)
69.1
4.3 7.2
117.3
188.7
38.5
115.2
63.9
88.2
215.7
98.7
2007 2008 2009 2010 2011 2012 2013 2014 2015 2016 2017
AGM 26 APRIL 2018 p.13
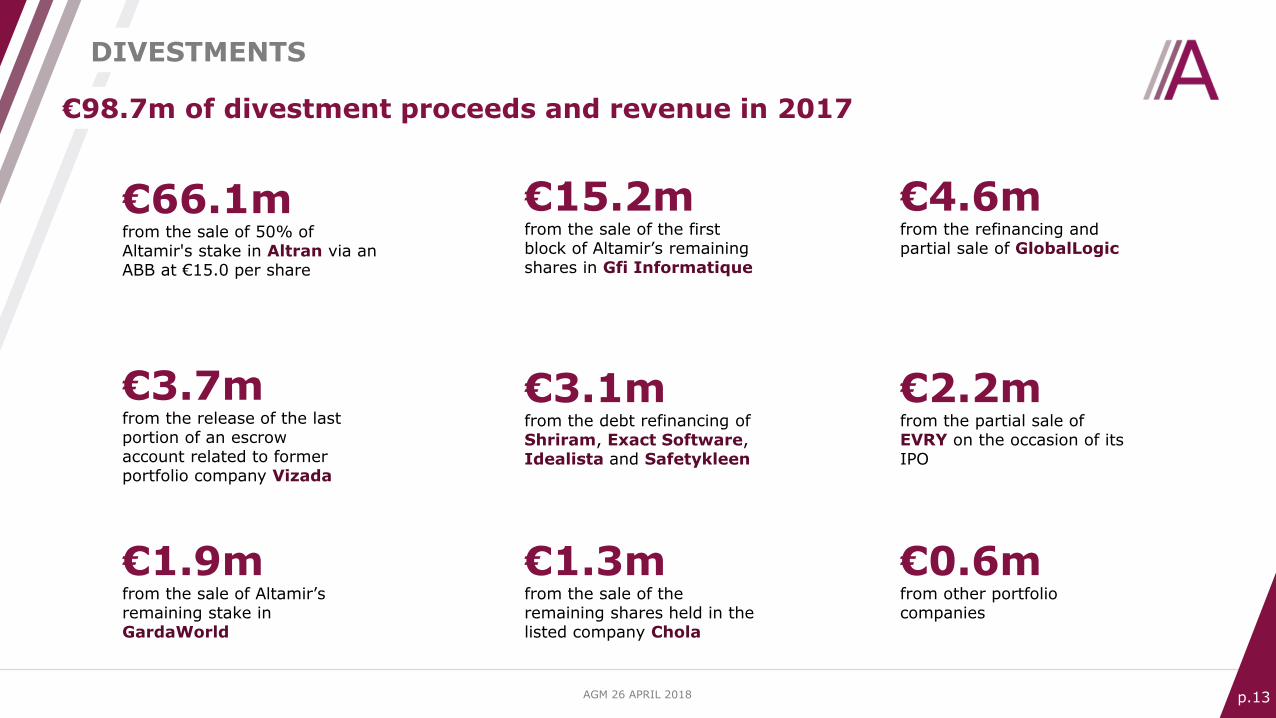
DIVESTMENTS
€66.1mfrom the sale of 50% of Altamir's stake in Altran via an ABB at €15.0 per share
€4.6mfrom the refinancing and partial sale of GlobalLogic
€15.2mfrom the sale of the first block of Altamir’s remainingshares in Gfi Informatique
€3.7mfrom the release of the last portion of an escrowaccount related to former portfolio company Vizada
€1.3mfrom the sale of the remaining shares held in the listed company Chola
€1.9mfrom the sale of Altamir’s remaining stake in GardaWorld
€3.1mfrom the debt refinancing of Shriram, Exact Software,Idealista and Safetykleen
€2.2mfrom the partial sale of EVRY on the occasion of itsIPO
€0.6mfrom other portfolio companies
€98.7m of divestment proceeds and revenue in 2017
AGM 26 APRIL 2018 p.14
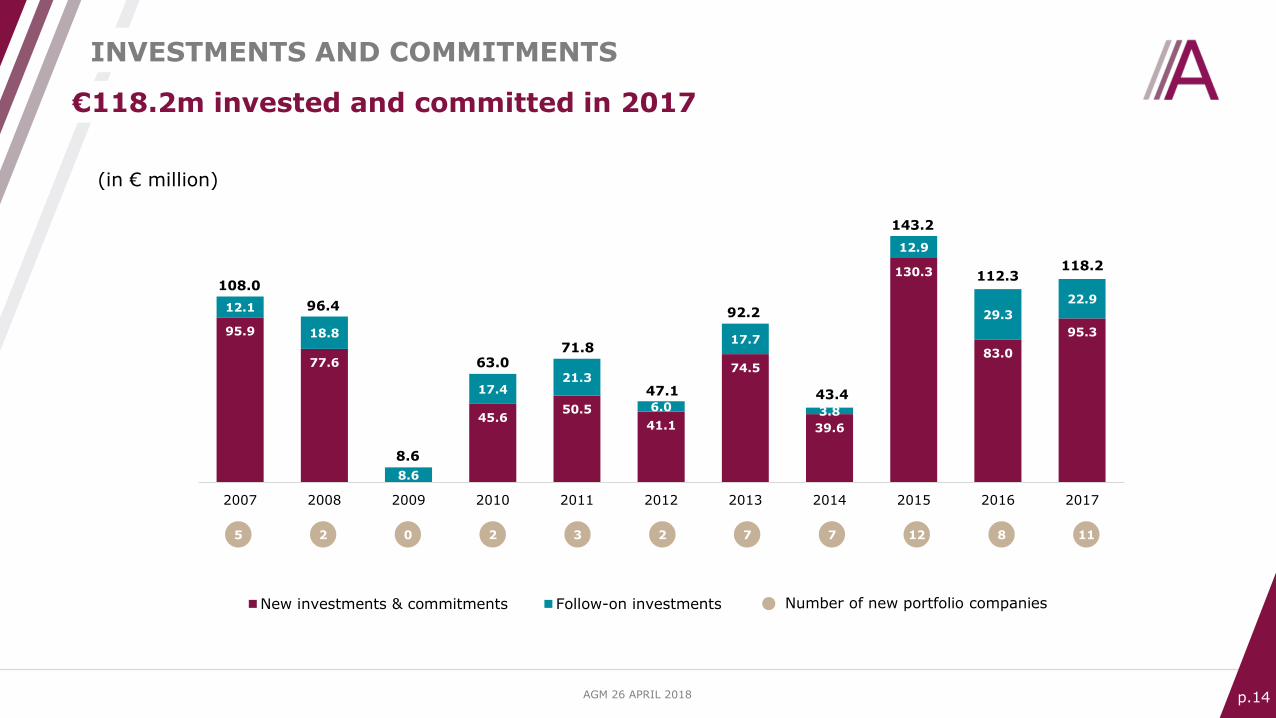
95.9
77.6
45.650.5
41.1
74.5
39.6
130.3
83.0
95.3
12.1
18.8
8.6
17.421.3
6.0
17.7
3.8
12.9
29.3
22.9
2007 2008 2009 2010 2011 2012 2013 2014 2015 2016 2017
Titre du graphique
New investments & commitments Follow-on investments Number of new portfolio companies
5 2 2 3 2 7 127
€118.2m invested and committed in 2017
INVESTMENTS AND COMMITMENTS
(in € million)
8 11
108.0
96.4
8.6
63.071.8
47.1
92.2
43.4
143.2
112.3118.2
0
AGM 26 APRIL 2018 p.15
CONSUMER
HEALTHCARE
€2.8m
KeproAPAX IX LP
Provider of care coordination and quality assurance services primarily for US State and Federal healthcarepayers
SERVICES
€95.3m invested in 11 companies in 2017
INVESTMENTS AND COMMITMENTS
€5.6m
Safetykleen EuropeAPAX IX LP
Leading service provider of surface treatment and chemical application services, with operations in Europe, Brazil, China and Turkey
€3.2m
Attenti(former electronic monitoring business of 3M) APAX IX LP
Global provider of electronic monitoring systems for government correctional and law enforcement agencies
€11.2m including co-investment
ThoughtWorksAPAX IX LP
Global software development and digital transformation consulting company
€4.3m
ECi Software SolutionsAPAX IX LP
Leading provider of enterprise resource planning (ERP) software solutions to SMEs across the distribution, fieldservices, manufacturing, and building & construction industries
€5.3m
Syneron CandelaAPAX IX LP
Leading global non-surgical aesthetic device company
€7.2m
Matchesfashion.comAPAX IX LP
Global leader in online luxury-fashion retailing, offeringa collection of over 450 designers
€47.1m including co-investment
CIPRÉS AssurancesAPAX FRANCE IX
Leading French wholesale broker specialised in supplemental insurance protection for self-employed persons and SMEs
€3.8m
Guotai Junan SecuritiesAPAX IX LP
One of the leading securities firms in China; listed in Shanghai and Hong Kong
€1.7m
Manappuram FinanceAPAX IX LP
Second-largest lender against gold in India, with a loanbook of $2.1bn; listed in Mumbai
€3.0m
Tosca ServicesAPAX IX LP
Leading provider of supply chain solutions and reusable packaging to a variety of perishable grocery markets
TMTSERVICES
AGM 26 APRIL 2018 p.16
15.14
9.8011.03 11.59 12.10
13.4714.87
16.04
18.60
21.62 21.54
0.18*
0.16*
0.200.41
0.45
0.50
0.56 0.65
2007 2008 2009 2010 2011 2012 2013 2014 2015 2016 2017
Titre du graphique
NAV per share at 31 December, in € Dividend paid in N for financial year N-1, in €
2007 2008 2009 2010 2011 2012 2013 2014 2015 2016 2017
2.6% NAV growth in 2017, dividend included
HISTORICAL NAV GROWTH
(in € million)
* Dividend for FY N-1, divided by number of shares in N
AGM 26 APRIL 2018 p.17
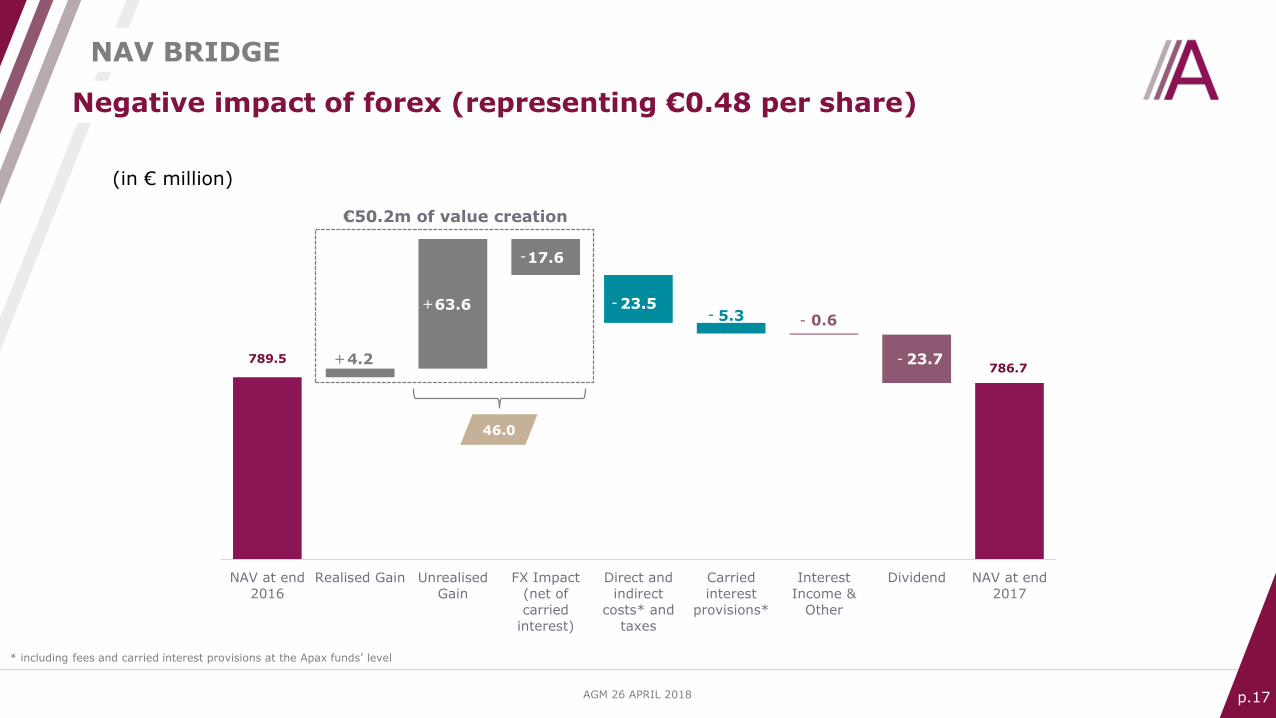
789.5
789.5 793.7
839.7
816.2 811.0 810.4
786.74.2
63.6
17.6
23.55.3 0.6
23.7
NAV at end
2016
Realised Gain Unrealised
Gain
FX Impact
(net of
carried
interest)
Direct and
indirect
costs* and
taxes
Carried
interest
provisions*
Interest
Income &
Other
Dividend NAV at end
2017
€50.2m of value creation
NAV BRIDGE
--
-
+
-
* including fees and carried interest provisions at the Apax funds’ level
(in € million)
+
-
-
46.0
Negative impact of forex (representing €0.48 per share)
AGM 26 APRIL 2018 p.18
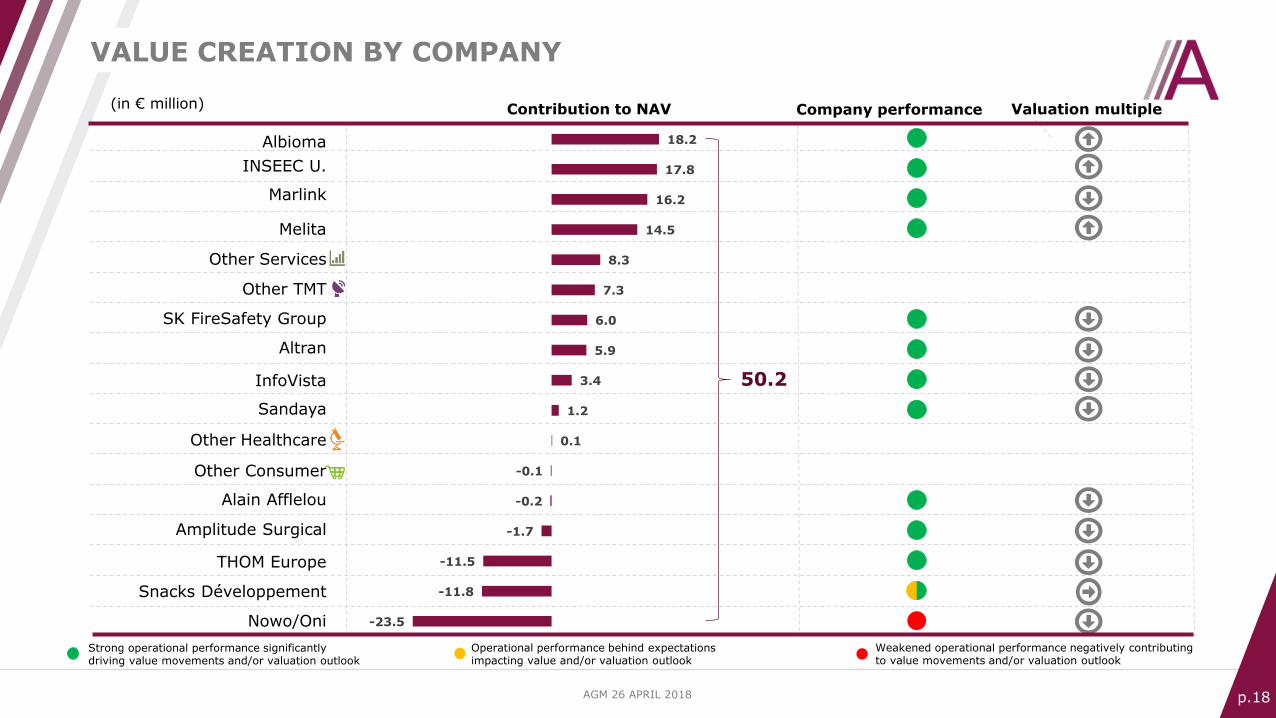
-23.5
-11.8
-11.5
-1.7
-0.2
-0.1
0.1
1.2
3.4
5.9
6.0
7.3
8.3
14.5
16.2
17.8
18.2
VALUE CREATION BY COMPANY
Contribution to NAV Company performance Valuation multiple
Strong operational performance significantlydriving value movements and/or valuation outlook
Operational performance behind expectations impacting value and/or valuation outlook
Weakened operational performance negatively contributing to value movements and/or valuation outlook
Other TMT
Other Services
Other Consumer
Other Healthcare
Albioma
INSEEC U.
Marlink
Melita
SK FireSafety Group
Altran
InfoVista
Sandaya
Alain Afflelou
Amplitude Surgical
THOM Europe
Snacks Développement
Nowo/Oni
50.2
(in € million)
AGM 26 APRIL 2018 p.19
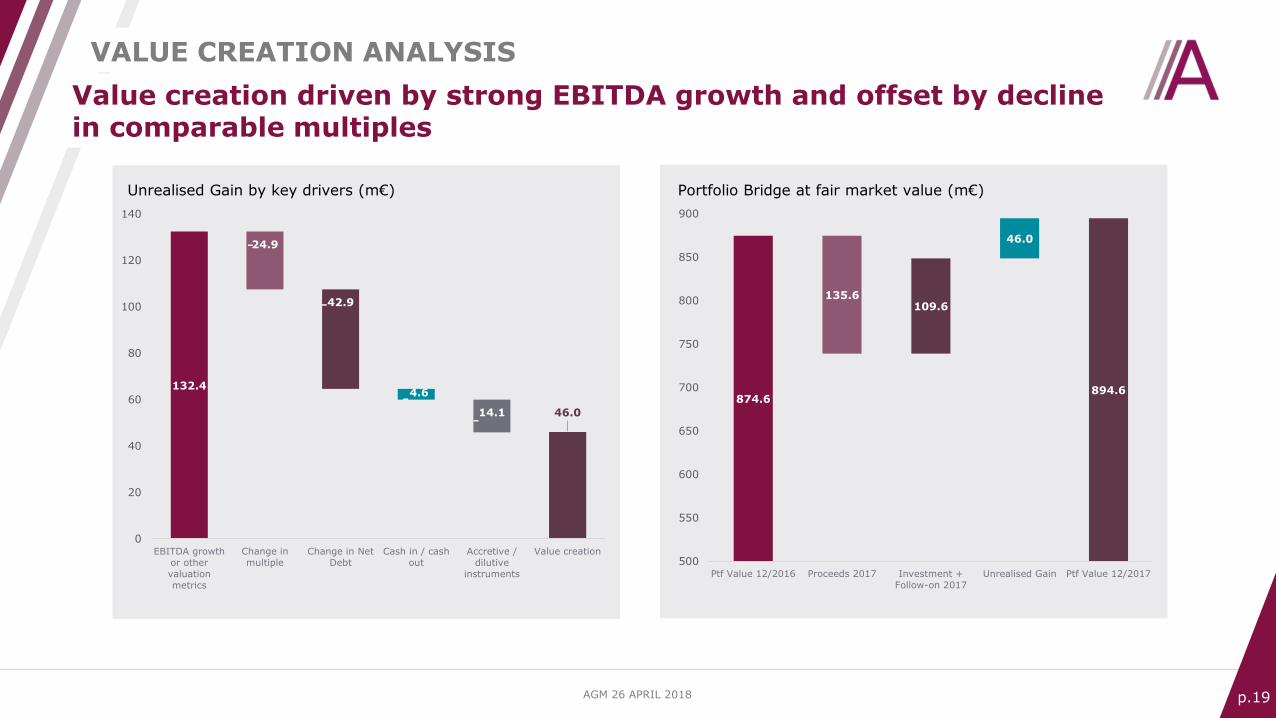
Unrealised Gain by key drivers (m€)
132.4
46.0
24.9
42.9
4.6
14.1
0
20
40
60
80
100
120
140
EBITDA growth
or other
valuation
metrics
Change in
multiple
Change in Net
Debt
Cash in / cash
out
Accretive /
dilutive
instruments
Value creation
874.6894.6
135.6109.6
46.0
500
550
600
650
700
750
800
850
900
Ptf Value 12/2016 Proceeds 2017 Investment +
Follow-on 2017
Unrealised Gain Ptf Value 12/2017
Portfolio Bridge at fair market value (m€)
Value creation driven by strong EBITDA growth and offset by decline in comparable multiples
VALUE CREATION ANALYSIS
-
-
-
-
AGM 26 APRIL 2018 p.20
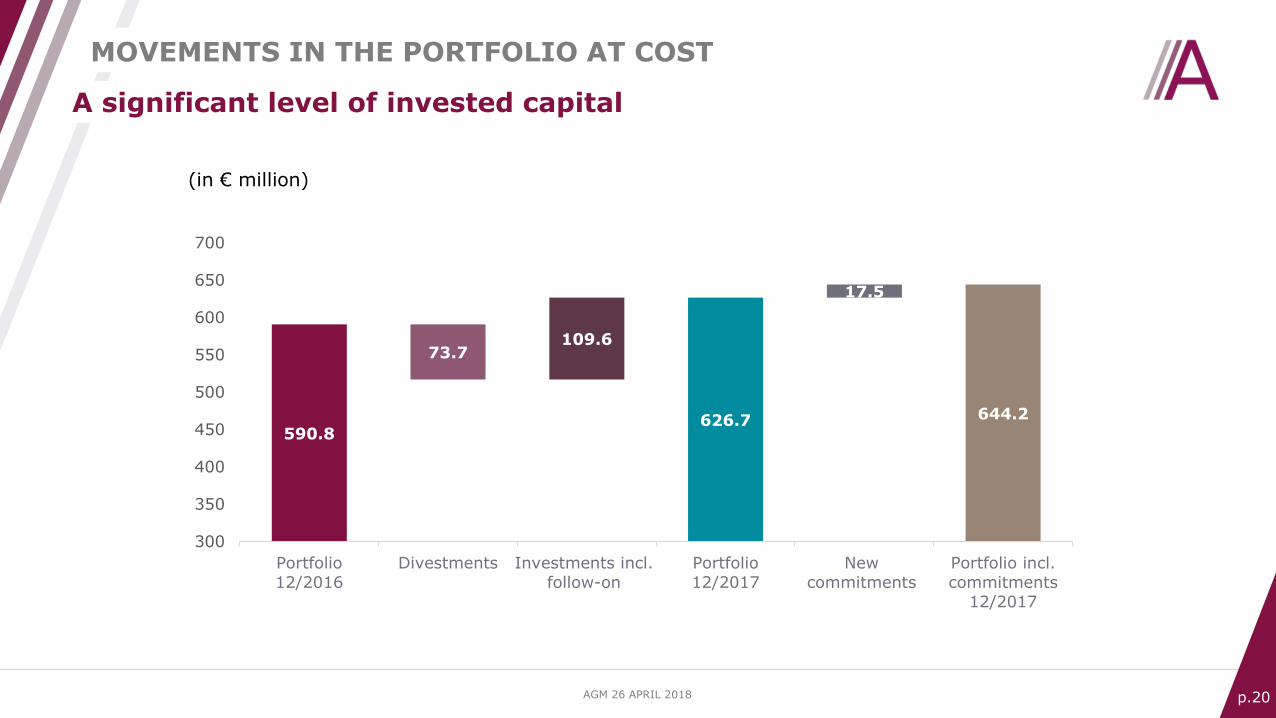
590.8
517.1 517.1
626.7 626.7 644.2
73.7109.6
17.5
300
350
400
450
500
550
600
650
700
Portfolio
12/2016
Divestments Investments incl.
follow-on
Portfolio
12/2017
New
commitments
Portfolio incl.
commitments12/2017
A significant level of invested capital
MOVEMENTS IN THE PORTFOLIO AT COST
(in € million)
AGM 26 APRIL 2018 p.21
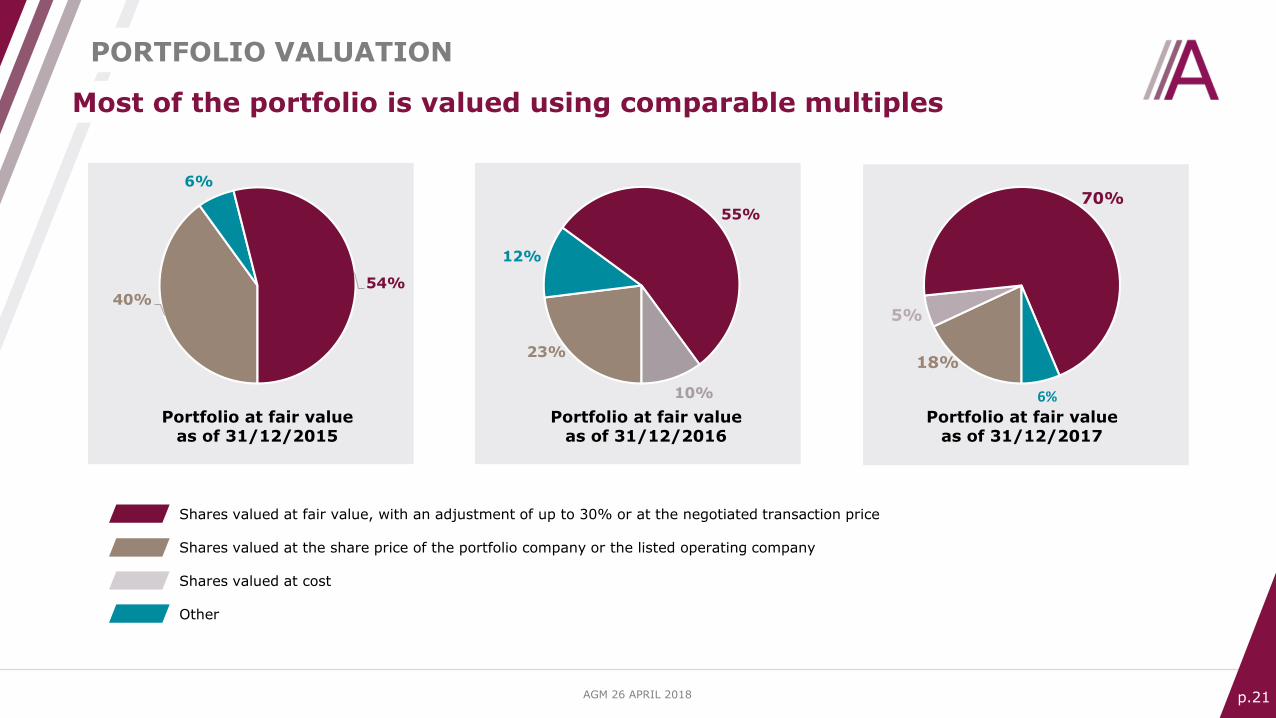
40%
6%
54%
23%
12%
55%
10%
18%
5%
70%
6%
Portfolio at fair value as of 31/12/2015
Portfolio at fair value as of 31/12/2016
Portfolio at fair value as of 31/12/2017
Shares valued at fair value, with an adjustment of up to 30% or at the negotiated transaction price
Shares valued at the share price of the portfolio company or the listed operating company
Shares valued at cost
Other
Most of the portfolio is valued using comparable multiples
PORTFOLIO VALUATION
AGM 26 APRIL 2018 p.22
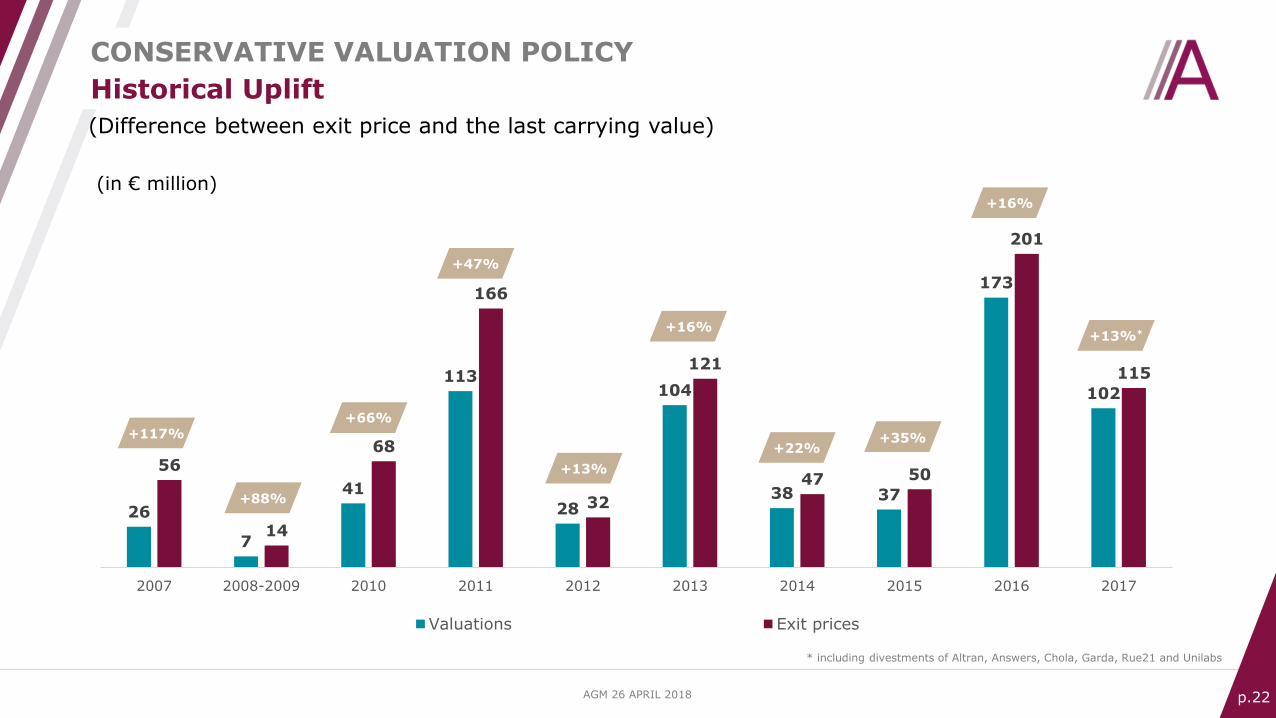
26
7
41
113
28
104
38 37
173
102
56
14
68
166
32
121
47 50
201
115
2007 2008-2009 2010 2011 2012 2013 2014 2015 2016 2017
Valuations Exit prices
+47%
+117%+66%
+13%
+13%*
+16%
+16%
+22%+35%
+88%
Historical Uplift
CONSERVATIVE VALUATION POLICY
* including divestments of Altran, Answers, Chola, Garda, Rue21 and Unilabs
(Difference between exit price and the last carrying value)
(in € million)
AGM 26 APRIL 2018 p.23
€284.6m* of outstanding commitments at end-2017 to be invested over the next 2-3 years:
▪ €191.5m to Apax France IX
▪ €74.2m to Apax IX LP
▪ €16.9m to Apax France VIII
▪ €2m of residual commitment alongside Apax France VII
+ €13m potential follow-on investment in the legacy portfolio to support Altran’s acquisition of Aricent
The outstanding commitments are covered 3.2x by the current portfolio, net cash position and undrawn credit facilties as of 31 December 2017
* The €37.2m invested in Ciprés Assurances, to be called in 2018, not included in this amount.
Outstanding commitments as of 31 December 2017
COMMITMENTS
AGM 26 APRIL 2018 p.24
To minimise the drawbacks of cash shortage, Altamir can rely on:
▪ Statutory net cash position
- €7.3m as of 31 December 2017
▪ Credit facilities used as bridge loans
- €60m overdraft credit facilities in addition to net cash
▪ Greater visibility on cash needs due to Apax Funds’ new way of making capital calls
▪ Opt-out clause with Apax Partners SAS
- €226m to €306m committed to Apax France IX- Altamir can reduce its commitment by up to €80m according to available cash every six months
Critical to optimise listed private equity performance
CASH MANAGEMENT
AGM 26 APRIL 2018 p.25
▪ Apax Partners SA, Altamir's investment advisor since inception, changed its name to Amboise Partners SA on 1 January 2018
▪ 54% of Altamir’s stake in Albioma was sold for ~€37.4m (excl. transaction costs)
▪ Altamir received €0.8m from the sale of US company Genex Services
▪ Apax Partners SAS completed the acquisition of Business Integration Partners (Bip), a leading European consulting company headquartered in Italy; Altamir’s investment is estimated at approximately €30m
▪ Altran successfully raised €750m on the market and completed the refinancing of the acquisition of Aricent; Altamir’s investment in this transaction is €13m
▪ Apax IX LP signed a definitive agreement to acquire a 98% stake in Healthium MedTech, the leading independent medical devices player in India
EVENTS POST 31 DECEMBER 2017
AGM 26 APRIL 2018 p.26
The private equity market
2017 operating highlights
A quality portfolio
NAV and share price performance
Objectives
Conclusion
Presentation of Altamir
2017 RESULTS
AGM 26 APRIL 2018 p.27
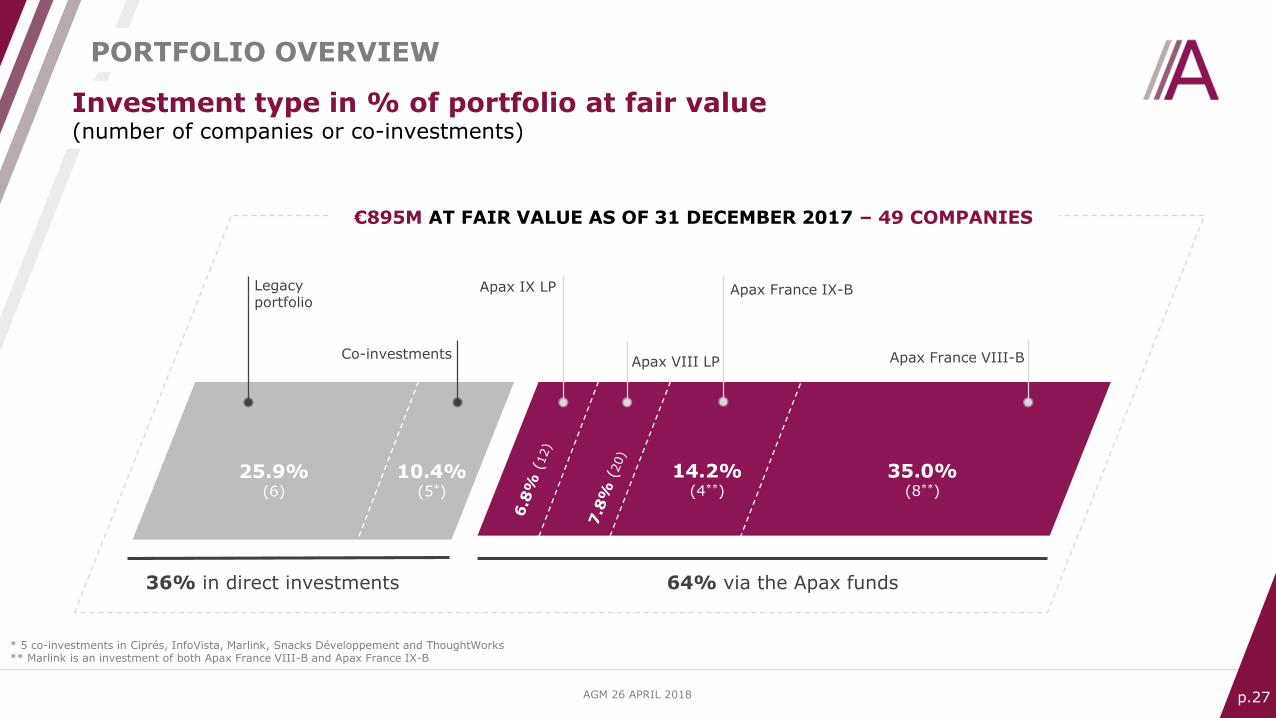
Investment type in % of portfolio at fair value(number of companies or co-investments)
PORTFOLIO OVERVIEW
€895M AT FAIR VALUE AS OF 31 DECEMBER 2017 – 49 COMPANIES
36% in direct investments 64% via the Apax funds
Legacyportfolio
Co-investments
Apax IX LP
Apax VIII LP Apax France VIII-B
Apax France IX-B
25.9%(6)
10.4%(5*)
14.2%(4**)
35.0%(8**)
* 5 co-investments in Ciprés, InfoVista, Marlink, Snacks Développement and ThoughtWorks** Marlink is an investment of both Apax France VIII-B and Apax France IX-B
AGM 26 APRIL 2018 p.28
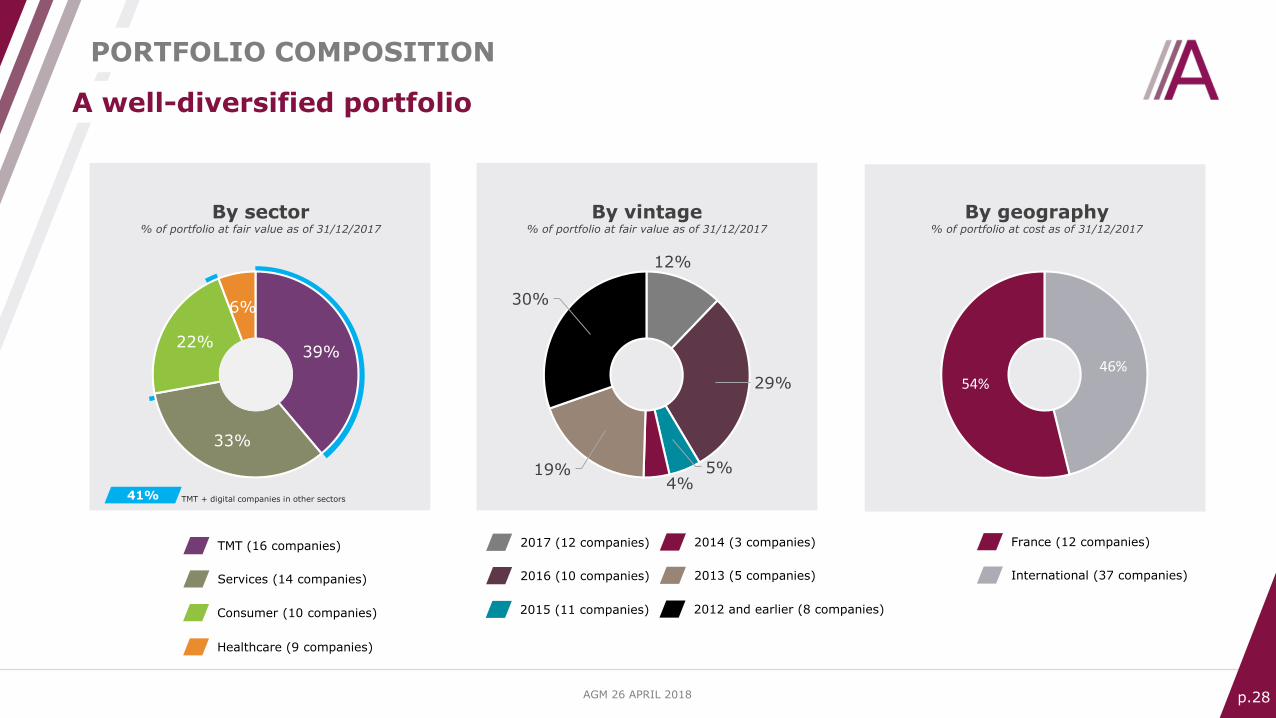
39%
33%
22%
6%
A well-diversified portfolio
12%
29%
5%4%
19%
30%
46%54%
By sector% of portfolio at fair value as of 31/12/2017
By vintage% of portfolio at fair value as of 31/12/2017
By geography% of portfolio at cost as of 31/12/2017
France (12 companies)
International (37 companies)
2017 (12 companies)
2016 (10 companies)
2015 (11 companies)
2014 (3 companies)
2013 (5 companies)
2012 and earlier (8 companies)
PORTFOLIO COMPOSITION
TMT (16 companies)
Services (14 companies)
Consumer (10 companies)
Healthcare (9 companies)
41% TMT + digital companies in other sectors
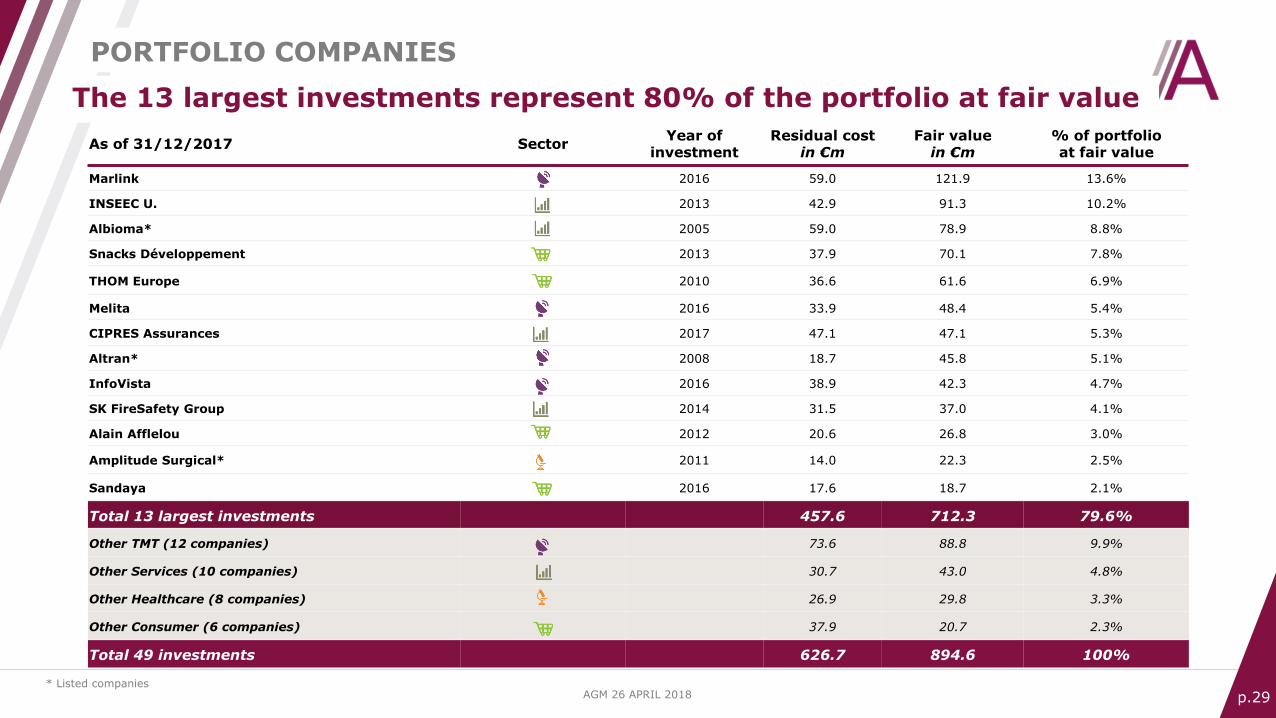
AGM 26 APRIL 2018 p.29
As of 31/12/2017 SectorYear of
investmentResidual cost
in €mFair value
in €m% of portfolioat fair value
Marlink 2016 59.0 121.9 13.6%
INSEEC U. 2013 42.9 91.3 10.2%
Albioma* 2005 59.0 78.9 8.8%
Snacks Développement 2013 37.9 70.1 7.8%
THOM Europe 2010 36.6 61.6 6.9%
Melita 2016 33.9 48.4 5.4%
CIPRES Assurances 2017 47.1 47.1 5.3%
Altran* 2008 18.7 45.8 5.1%
InfoVista 2016 38.9 42.3 4.7%
SK FireSafety Group 2014 31.5 37.0 4.1%
Alain Afflelou 2012 20.6 26.8 3.0%
Amplitude Surgical* 2011 14.0 22.3 2.5%
Sandaya 2016 17.6 18.7 2.1%
Total 13 largest investments 457.6 712.3 79.6%
Other TMT (12 companies) 73.6 88.8 9.9%
Other Services (10 companies) 30.7 43.0 4.8%
Other Healthcare (8 companies) 26.9 29.8 3.3%
Other Consumer (6 companies) 37.9 20.7 2.3%
Total 49 investments 626.7 894.6 100%
PORTFOLIO COMPANIES
* Listed companies
The 13 largest investments represent 80% of the portfolio at fair value
AGM 26 APRIL 2018 p.30
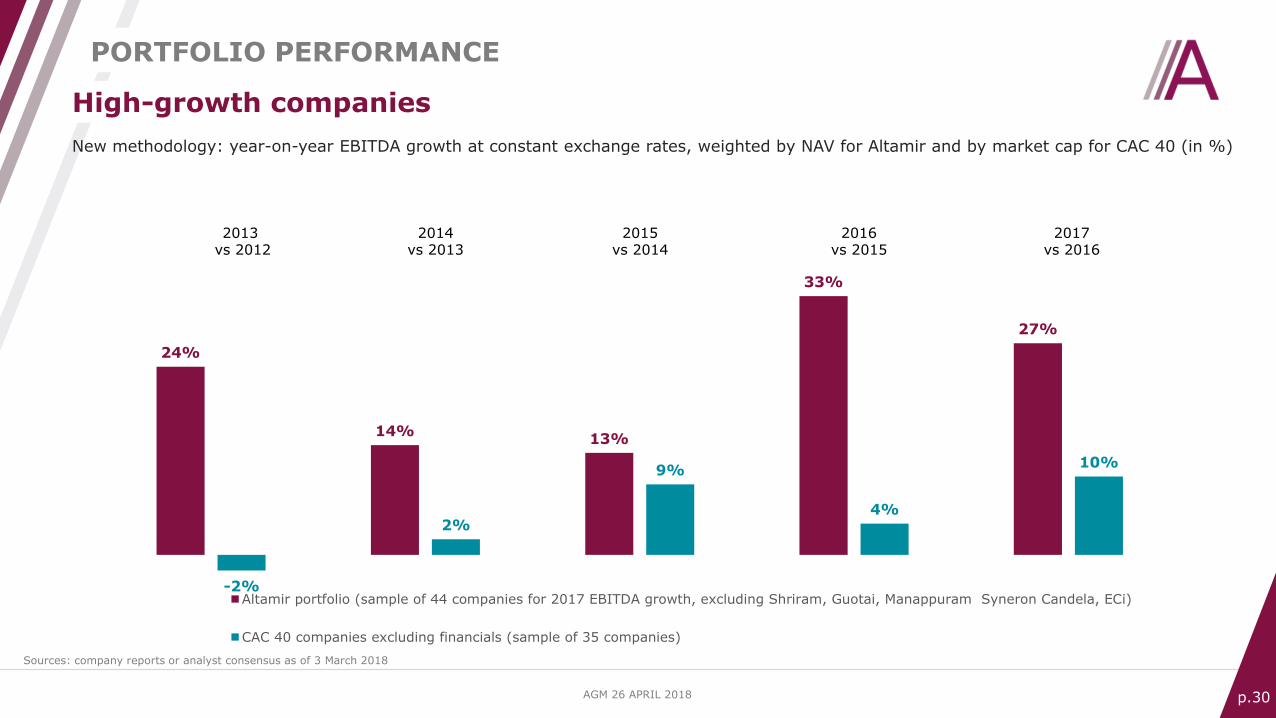
24%
14%13%
33%
27%
-2%
2%
9%
4%
10%
Altamir portfolio (sample of 44 companies for 2017 EBITDA growth, excluding Shriram, Guotai, Manappuram Syneron Candela, ECi)
CAC 40 companies excluding financials (sample of 35 companies)
2013vs 2012
2015vs 2014
2014 vs 2013
2016vs 2015
2017 vs 2016
New methodology: year-on-year EBITDA growth at constant exchange rates, weighted by NAV for Altamir and by market cap for CAC 40 (in %)
High-growth companies
PORTFOLIO PERFORMANCE
Sources: company reports or analyst consensus as of 3 March 2018
AGM 26 APRIL 2018 p.31
8.89
9.52
10.83
10.68
10.88
2013
2014
2015
2016
2017
Valuation multiples at end of period
Average multiples weighted by each company’s contribution to NAV
Entreprise value / LTM EBITDA # of companies
44
38
28
21
17 3.83
3.82
3.96
4.07
4.22
2013
2014
2015
2016
2017
Debt multiples at end of period
Average multiples weighted by each company’s contribution to NAV
Total net debt / LTM EBITDA # of companies
44
38
27
21
16
PORTFOLIO VALUATION AND DEBT MULTIPLES
Sample of 44 companies as of 31/12/2017 (excluding Shriram City Union, Guotai, Manappuram Finance, Huarong, Zensar)
New methodology: weighted average multiples of the Apax France/Apax LLP aggregated portfolio
AGM 26 APRIL 2018 p.32
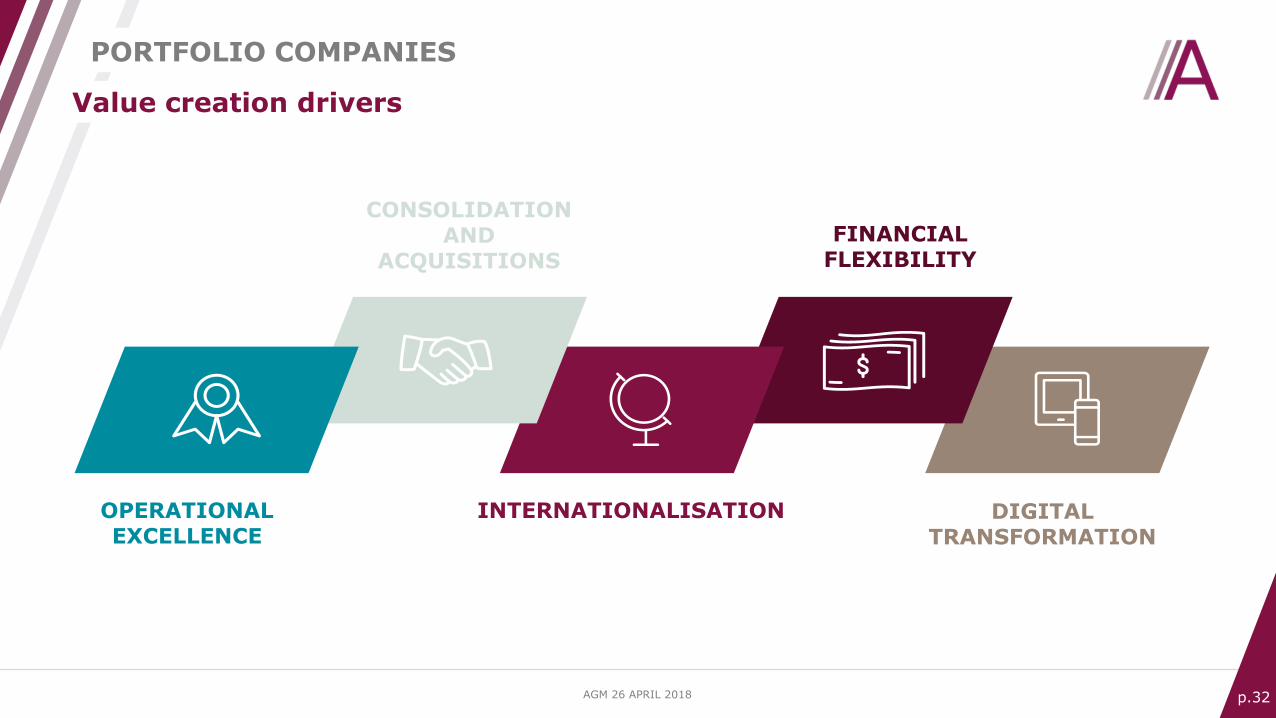
CONSOLIDATIONAND
ACQUISITIONS
DIGITAL TRANSFORMATION
FINANCIALFLEXIBILITY
INTERNATIONALISATIONOPERATIONAL EXCELLENCE
Value creation drivers
PORTFOLIO COMPANIES
AGM 26 APRIL 2018 p.33
The private equity market
2017 operating highlights
A quality portfolio
NAV and share price performance
Objectives
Conclusion
Presentation of Altamir
2017 RESULTS
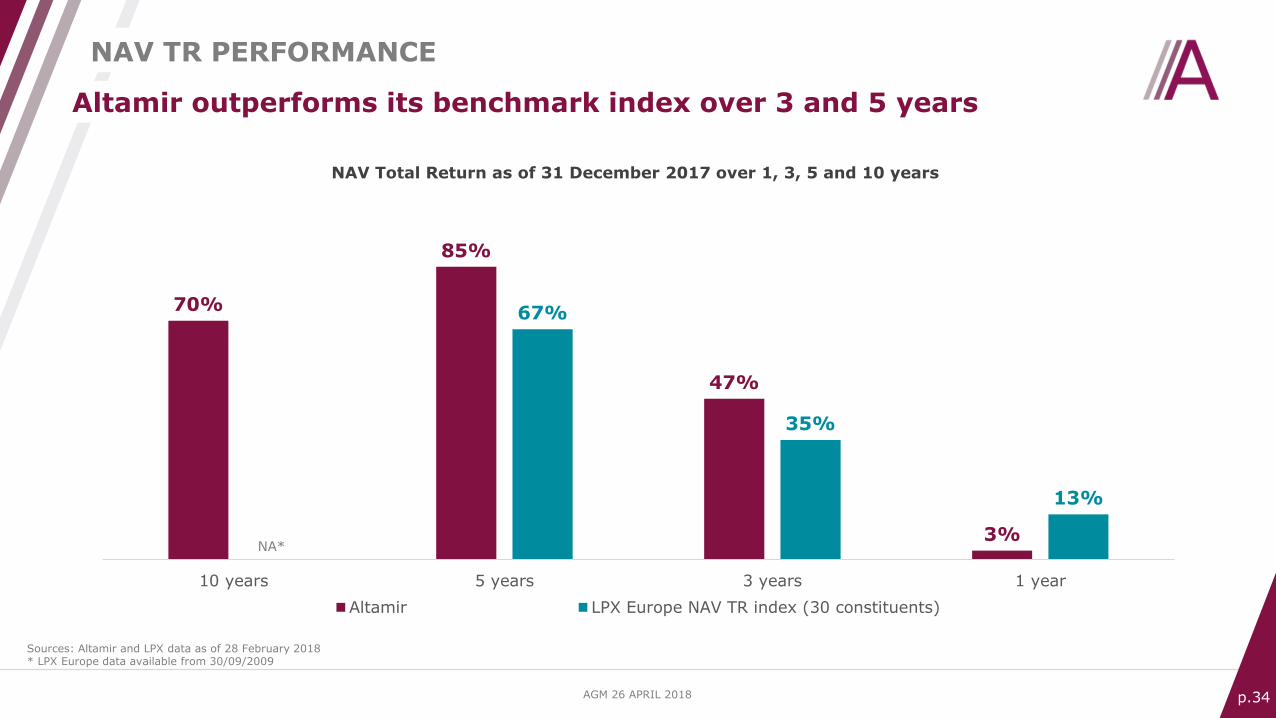
AGM 26 APRIL 2018 p.34
70%
85%
47%
3%
67%
35%
13%
10 years 5 years 3 years 1 year
Altamir LPX Europe NAV TR index (30 constituents)
NA*
NAV Total Return as of 31 December 2017 over 1, 3, 5 and 10 years
Altamir outperforms its benchmark index over 3 and 5 years
NAV TR PERFORMANCE
Sources: Altamir and LPX data as of 28 February 2018 * LPX Europe data available from 30/09/2009
AGM 26 APRIL 2018 p.35
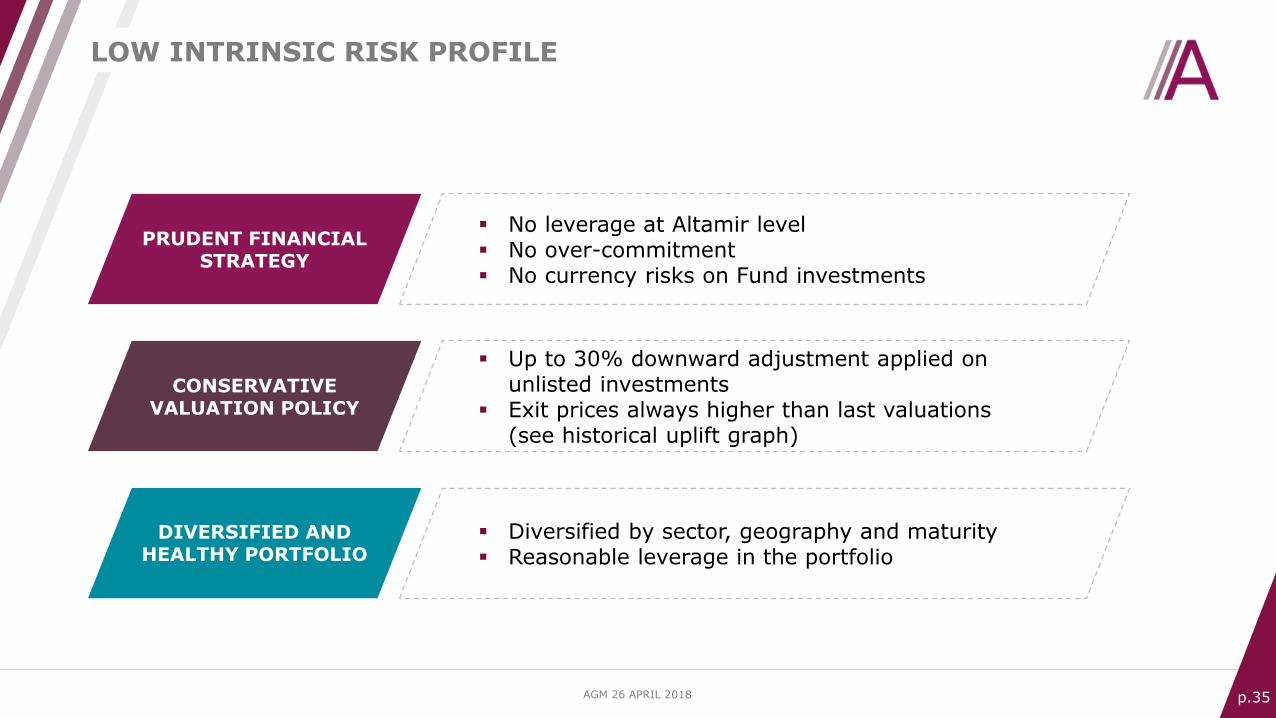
LOW INTRINSIC RISK PROFILE
PRUDENT FINANCIAL STRATEGY
CONSERVATIVE VALUATION POLICY
▪ No leverage at Altamir level▪ No over-commitment▪ No currency risks on Fund investments
▪ Up to 30% downward adjustment applied on unlisted investments
▪ Exit prices always higher than last valuations(see historical uplift graph)
▪ Diversified by sector, geography and maturity▪ Reasonable leverage in the portfolio
DIVERSIFIED ANDHEALTHY PORTFOLIO
AGM 26 APRIL 2018 p.36
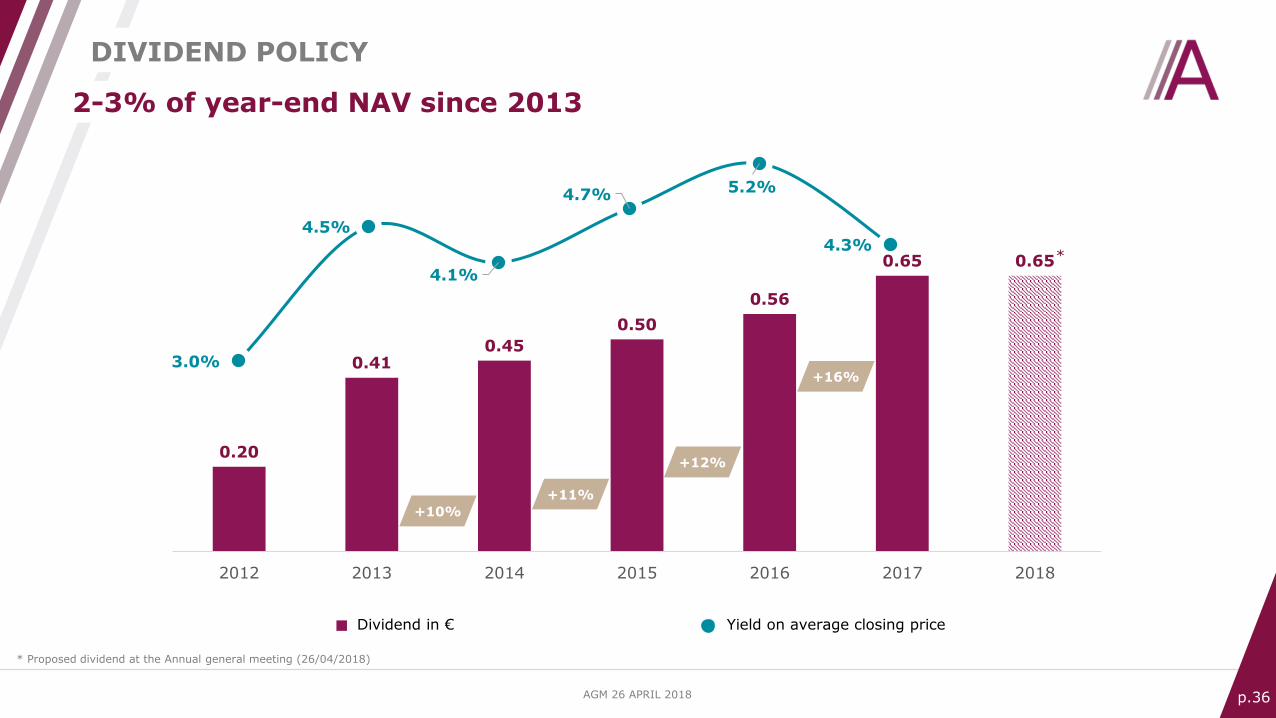
3.0%
4.5%
4.1%
4.7% 5.2%
4.3%
0.20
0.410.45
0.50
0.56
0.65 0.65
2012 2013 2014 2015 2016 2017 2018
+16%
+12%
+11%
+10%
Yield on average closing priceDividend in €
2-3% of year-end NAV since 2013
DIVIDEND POLICY
*
* Proposed dividend at the Annual general meeting (26/04/2018)
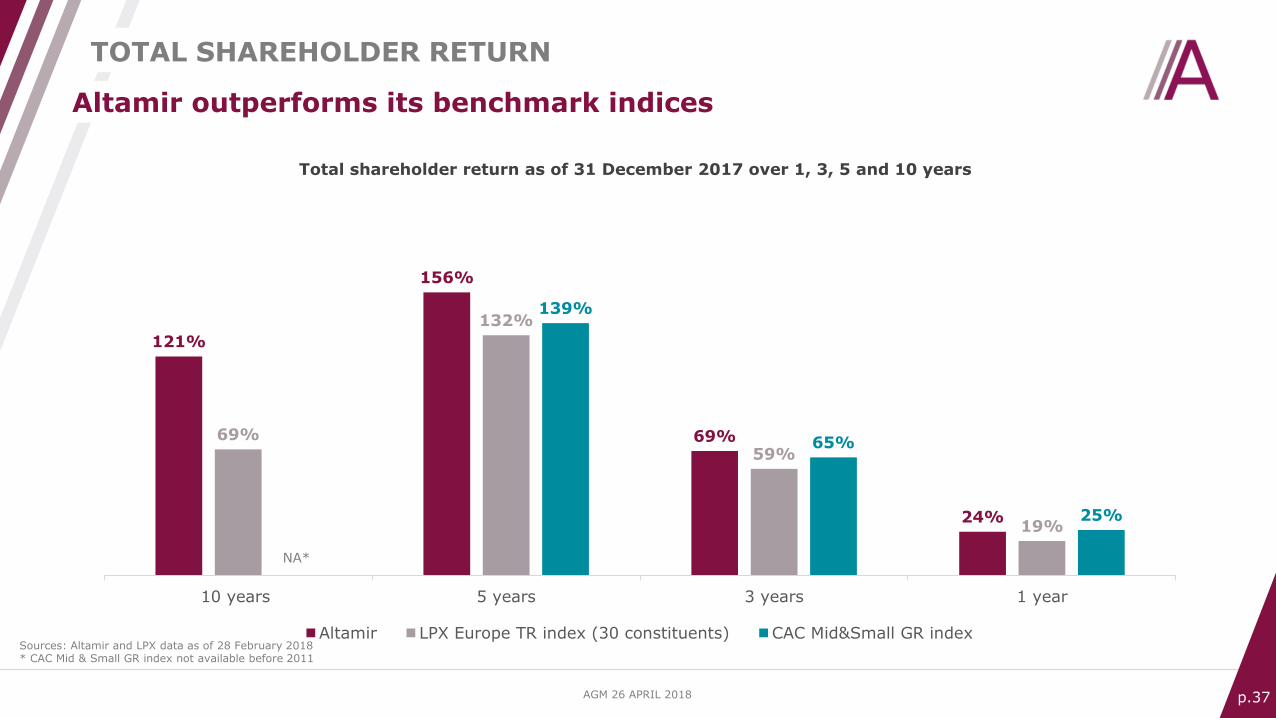
AGM 26 APRIL 2018 p.37
121%
156%
69%
24%
69%
132%
59%
19%
139%
65%
25%
10 years 5 years 3 years 1 year
Altamir LPX Europe TR index (30 constituents) CAC Mid&Small GR index
NA*
Total shareholder return as of 31 December 2017 over 1, 3, 5 and 10 years
Altamir outperforms its benchmark indices
TOTAL SHAREHOLDER RETURN
Sources: Altamir and LPX data as of 28 February 2018* CAC Mid & Small GR index not available before 2011
AGM 26 APRIL 2018 p.38
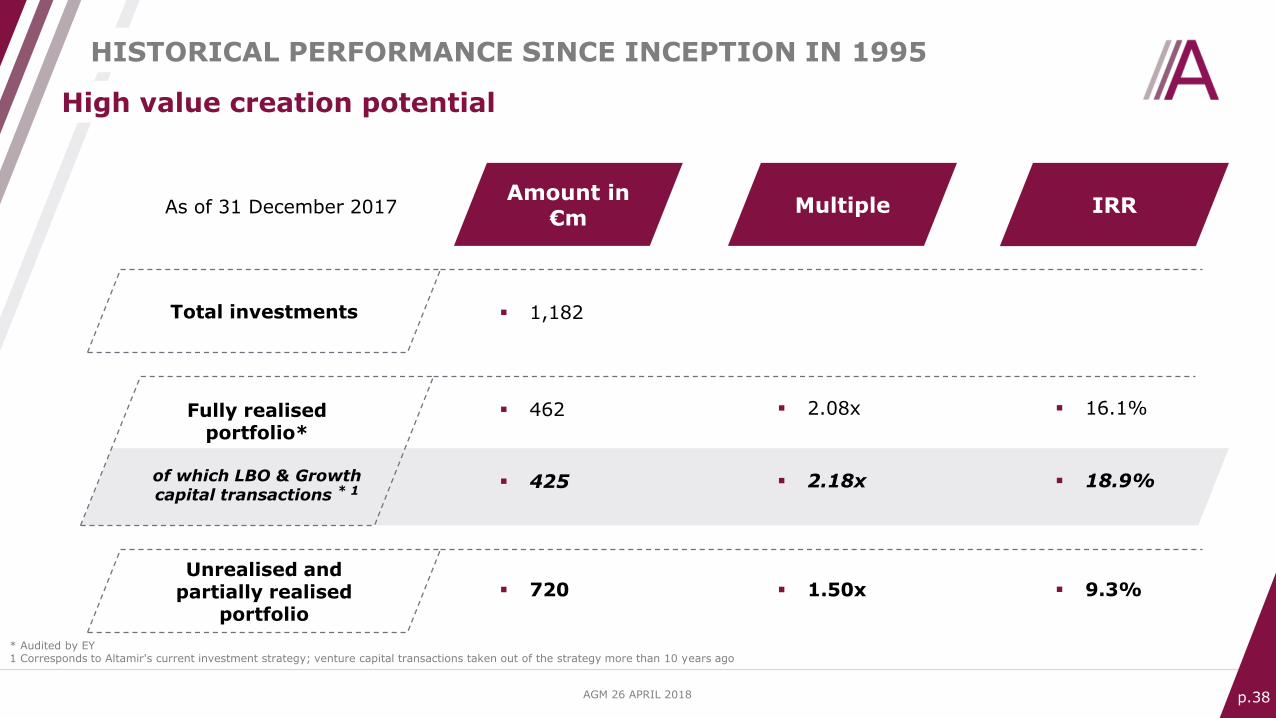
High value creation potential
HISTORICAL PERFORMANCE SINCE INCEPTION IN 1995
Total investments
Fully realisedportfolio*
of which LBO & Growthcapital transactions * 1
Unrealised and partially realised
portfolio
Amount in €m
Multiple IRR
▪ 1,182
▪ 462
▪ 425
▪ 720
▪ 2.08x ▪ 16.1%
▪ 2.18x ▪ 18.9%
▪ 1.50x ▪ 9.3%
* Audited by EY1 Corresponds to Altamir's current investment strategy; venture capital transactions taken out of the strategy more than 10 years ago
As of 31 December 2017
AGM 26 APRIL 2018 p.39
The private equity market
2017 operating highlights
A quality portfolio
NAV and share price performance
Objectives
Conclusion
Presentation of Altamir
2017 RESULTS
AGM 26 APRIL 2018 p.40
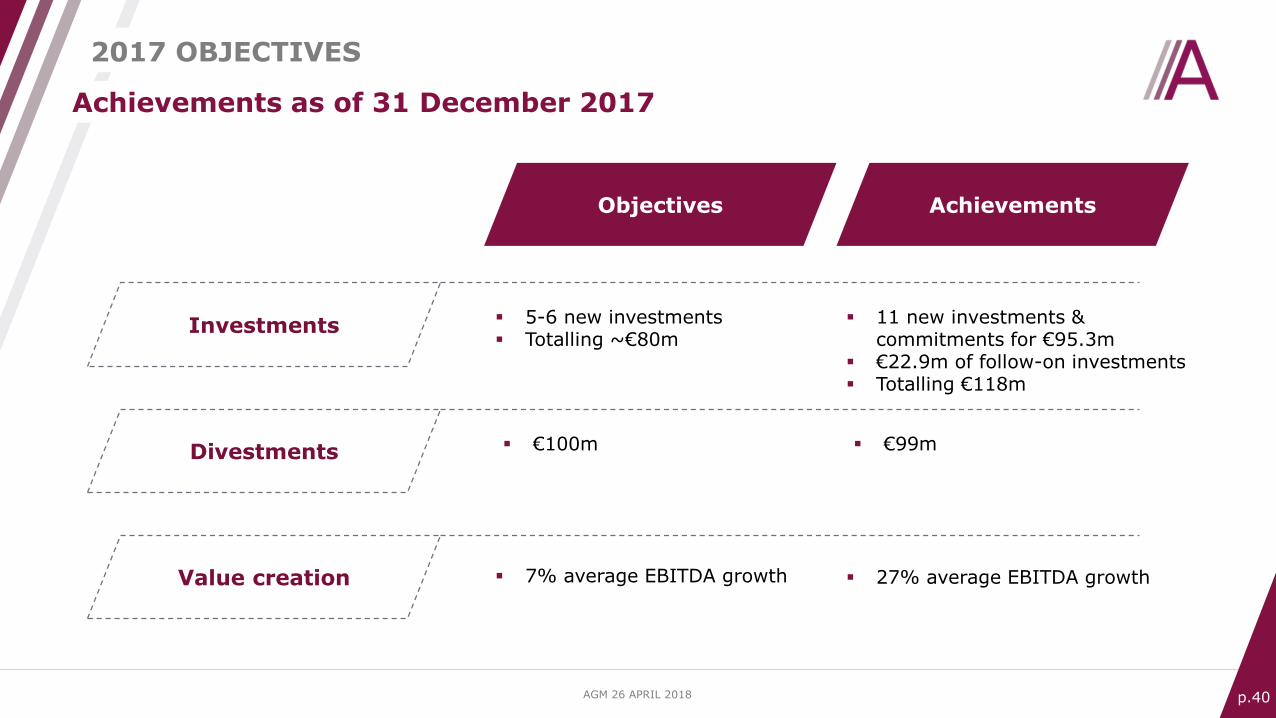
Investments
Divestments
Value creation
Objectives Achievements
▪ 11 new investments & commitments for €95.3m
▪ €22.9m of follow-on investments▪ Totalling €118m
▪ €99m
▪ 27% average EBITDA growth
▪ 5-6 new investments▪ Totalling ~€80m
▪ €100m
▪ 7% average EBITDA growth
Achievements as of 31 December 2017
2017 OBJECTIVES
AGM 26 APRIL 2018 p.41
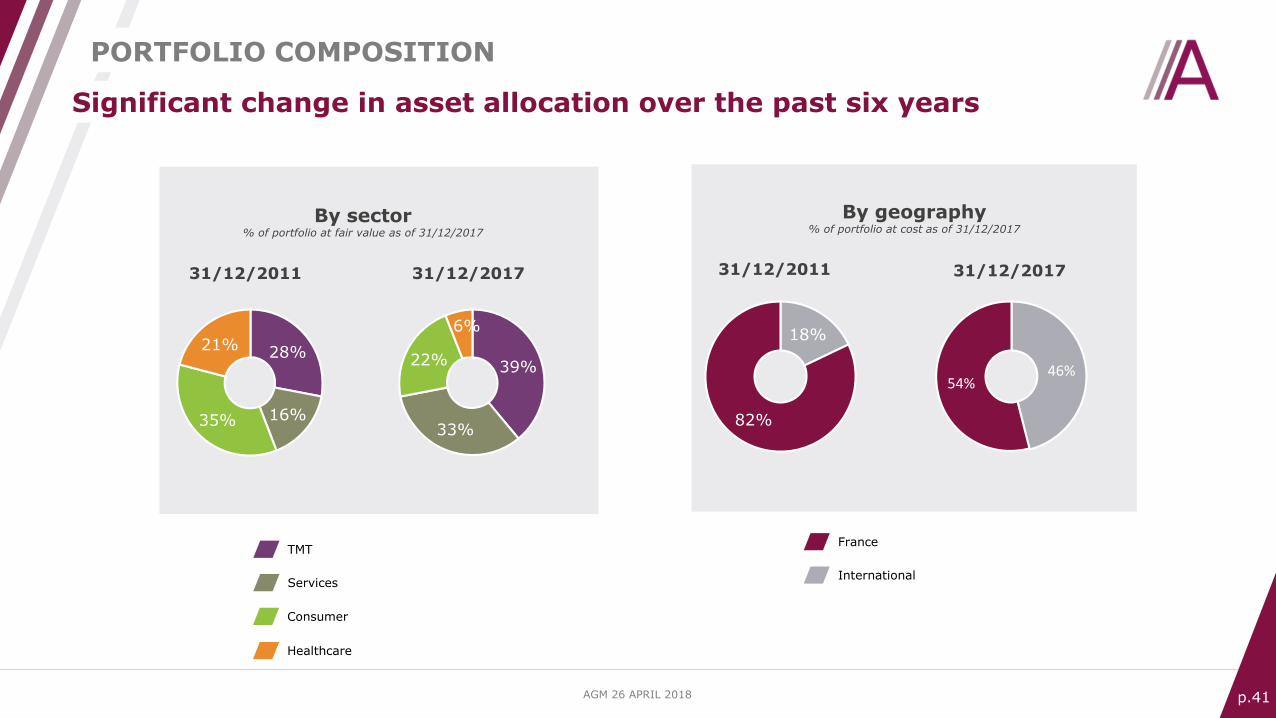
39%
33%
22%
6%
Significant change in asset allocation over the past six years
46%54%
18%
82%
By sector% of portfolio at fair value as of 31/12/2017
By geography% of portfolio at cost as of 31/12/2017
31/12/2011 31/12/2017
France
International
PORTFOLIO COMPOSITION
TMT
Services
Consumer
Healthcare
28%
16%35%
21%
31/12/2011 31/12/2017
AGM 26 APRIL 2018 p.42
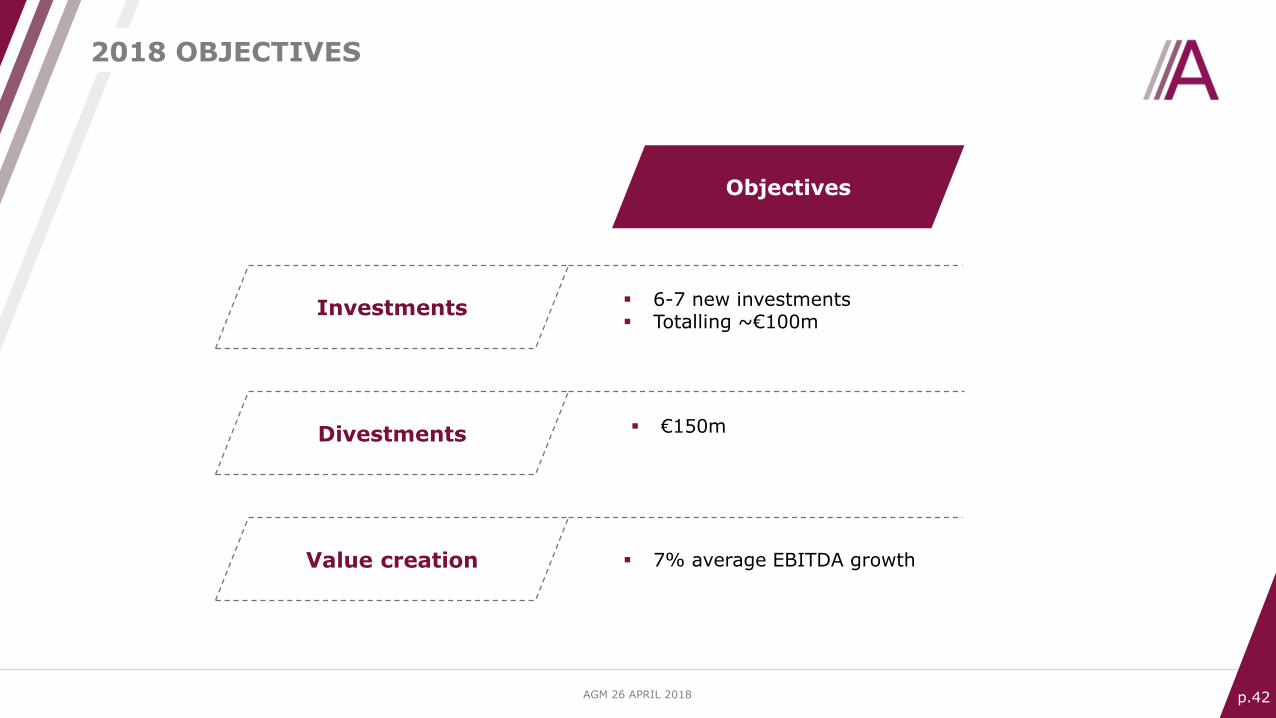
Investments
Divestments
Value creation
Objectives
▪ 6-7 new investments▪ Totalling ~€100m
▪ €150m
▪ 7% average EBITDA growth
2018 OBJECTIVES
AGM 26 APRIL 2018 p.43
The private equity market
2017 operating highlights
A quality portfolio
NAV and share price performance
Objectives
Conclusion
Presentation of Altamir
2017 RESULTS
AGM 26 APRIL 2018 p.44
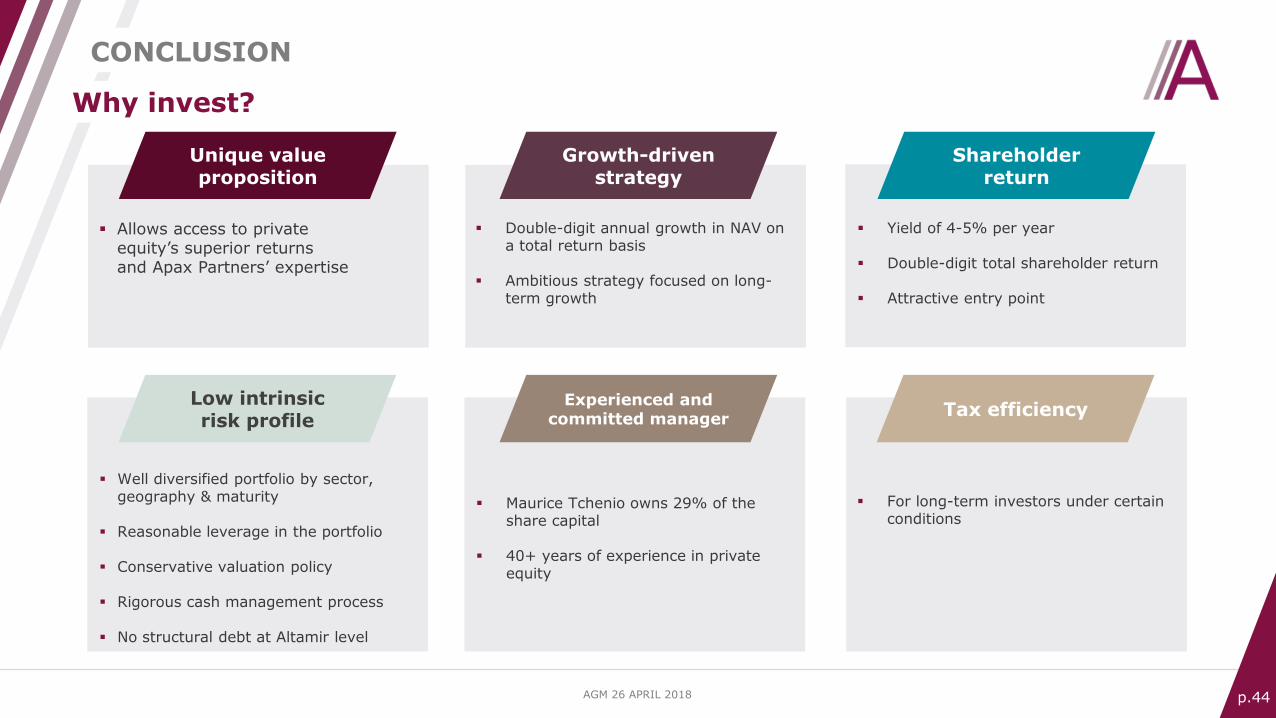
Unique value proposition
▪ Allows access to privateequity’s superior returnsand Apax Partners’ expertise
▪ Double-digit annual growth in NAV on a total return basis
▪ Ambitious strategy focused on long-term growth
▪ Well diversified portfolio by sector, geography & maturity
▪ Reasonable leverage in the portfolio
▪ Conservative valuation policy
▪ Rigorous cash management process
▪ No structural debt at Altamir level
▪ Maurice Tchenio owns 29% of the share capital
▪ 40+ years of experience in privateequity
▪ Yield of 4-5% per year
▪ Double-digit total shareholder return
▪ Attractive entry point
▪ For long-term investors under certain conditions
Growth-drivenstrategy
Shareholderreturn
Low intrinsicrisk profile
Experienced and committed manager
Tax efficiency
Why invest?
CONCLUSION
AGM 26 APRIL 2018 p.45
This document has been prepared by Altamir SCA (“Altamir”) for meetings to be held in April 2018.
▪ No warranty is made as to the fairness, accuracy, completeness or correctness of the information or opinions contained herein. Altamir isunder no obligation to keep current the information contained in this presentation and any opinions expressed in this representation aresubject to change without notice.
▪ This document may include forward-looking statements. These forward-looking statements relate to the future prospects, developmentand business strategies of Altamir and its portfolio companies and are based on estimates. By their nature, any forward-lookingstatement involves risks and uncertainties. Altamir cautions that forward-looking statements are not guarantees of future performanceand that its actual financial condition, actual results of operations and cash flows and the development of the industries in which Altamiror its portfolio companies operate may differ materially from those made in or suggested by any forward-looking statement contained inthis presentation. Altamir does not undertake any obligation to review or confirm analysts’ expectations or estimates or to releasepublicly any revisions to any forward-looking statements to reflect events that occur or circumstances that arise after the date of thisdocument, unless required by law or any applicable regulation.
▪ Altamir accepts no liability for the consequences of any reliance upon any statement of any kind (including statements of fact or opinion)contained herein.
▪ This presentation includes only summary information and must be read in conjunction with Altamir’s financial statements, which are orwill be available on Altamir’s website (www.altamir.fr)
▪ The information contained in this presentation may not be considered an invitation to invest. No information provided on this documentconstitutes, or should be used or considered as, an offer to sell or a solicitation of any offer to buy the securities of Altamir or any otherissuer.
DISCLAIMER
AGM 26 APRIL 2018 p.46
Présentation des résultats 2017
Ordre du jour des résolutions
Questions-Réponses
Vote des résolutions
Rapport du Conseil de Surveillance et rapports des CAC
SOMMAIRE
AGM 26 APRIL 2018 p.47
Rapport du Conseil de Surveillance et rapports des CAC
Présentation des résultats 2017
Questions-Réponses
Vote des résolutions
Ordre du jour des résolutions
SOMMAIRE
AGM 26 APRIL 2018 p.48
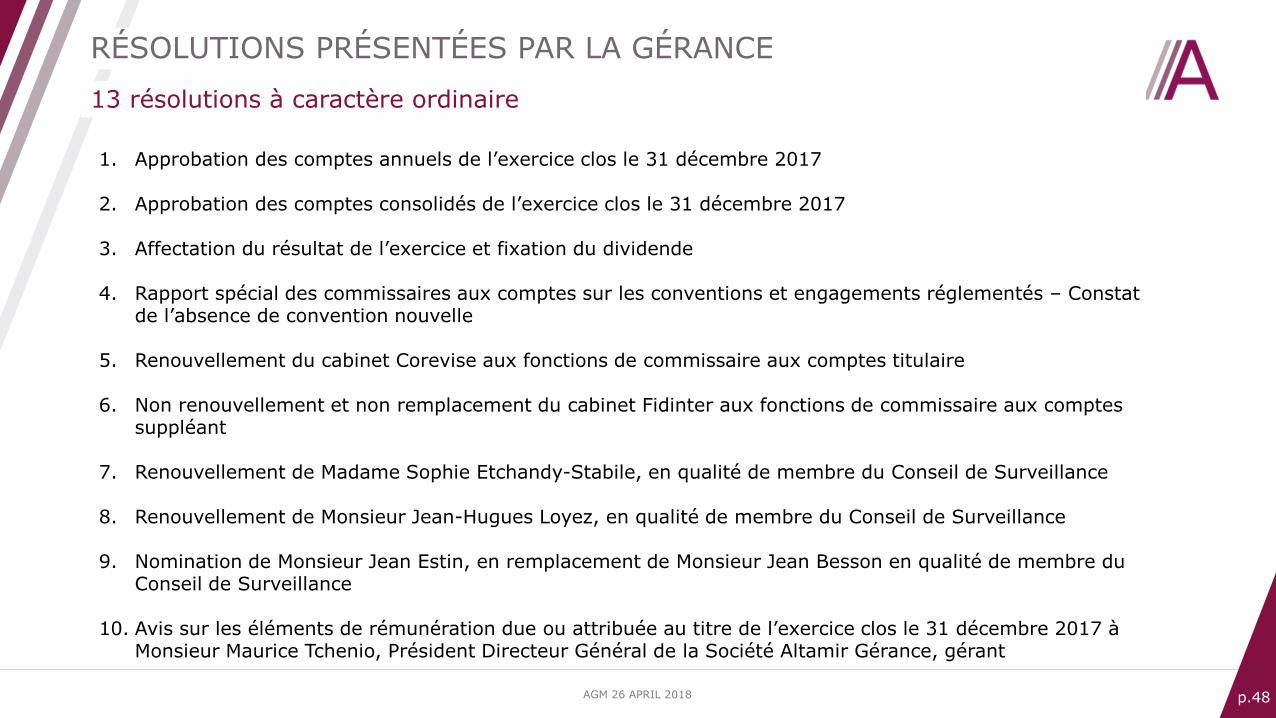
13 résolutions à caractère ordinaire
RÉSOLUTIONS PRÉSENTÉES PAR LA GÉRANCE
1. Approbation des comptes annuels de l’exercice clos le 31 décembre 2017
2. Approbation des comptes consolidés de l’exercice clos le 31 décembre 2017
3. Affectation du résultat de l’exercice et fixation du dividende
4. Rapport spécial des commissaires aux comptes sur les conventions et engagements réglementés – Constat de l’absence de convention nouvelle
5. Renouvellement du cabinet Corevise aux fonctions de commissaire aux comptes titulaire
6. Non renouvellement et non remplacement du cabinet Fidinter aux fonctions de commissaire aux comptes suppléant
7. Renouvellement de Madame Sophie Etchandy-Stabile, en qualité de membre du Conseil de Surveillance
8. Renouvellement de Monsieur Jean-Hugues Loyez, en qualité de membre du Conseil de Surveillance
9. Nomination de Monsieur Jean Estin, en remplacement de Monsieur Jean Besson en qualité de membre du Conseil de Surveillance
10. Avis sur les éléments de rémunération due ou attribuée au titre de l’exercice clos le 31 décembre 2017 à Monsieur Maurice Tchenio, Président Directeur Général de la Société Altamir Gérance, gérant
AGM 26 APRIL 2018 p.49
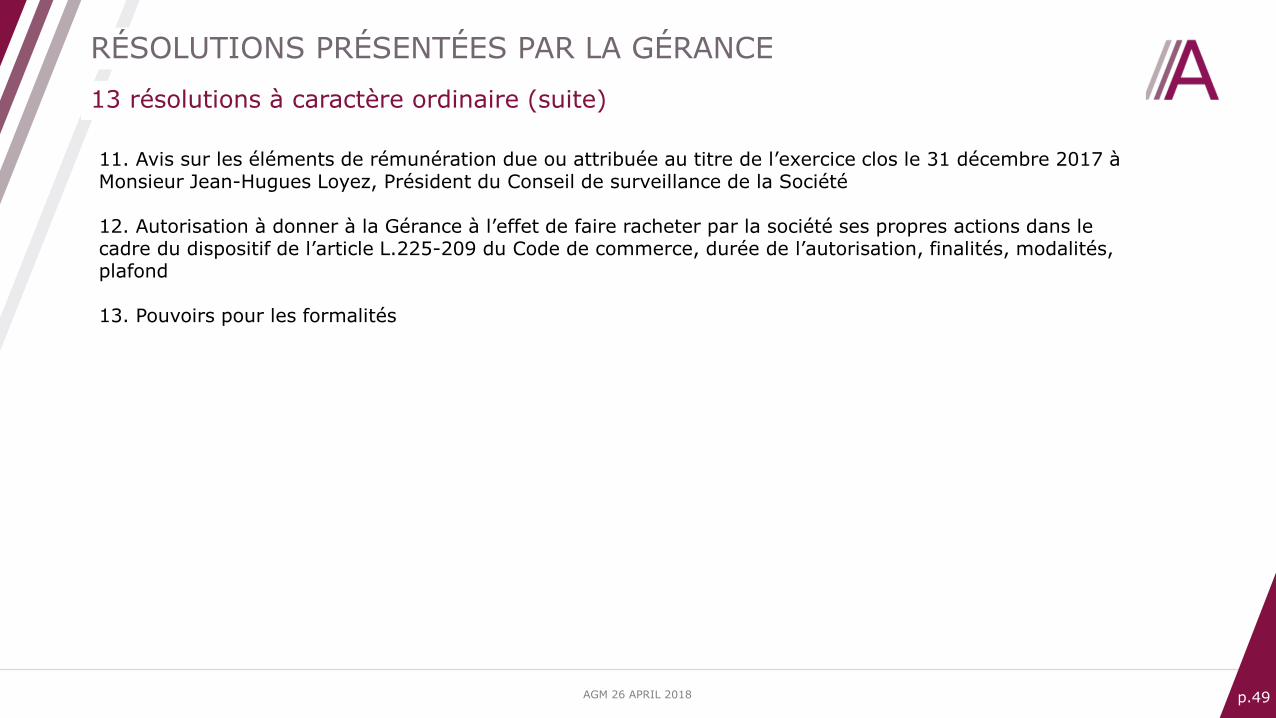
13 résolutions à caractère ordinaire (suite)
RÉSOLUTIONS PRÉSENTÉES PAR LA GÉRANCE
11. Avis sur les éléments de rémunération due ou attribuée au titre de l’exercice clos le 31 décembre 2017 à Monsieur Jean-Hugues Loyez, Président du Conseil de surveillance de la Société
12. Autorisation à donner à la Gérance à l’effet de faire racheter par la société ses propres actions dans le cadre du dispositif de l’article L.225-209 du Code de commerce, durée de l’autorisation, finalités, modalités, plafond
13. Pouvoirs pour les formalités
AGM 26 APRIL 2018 p.50
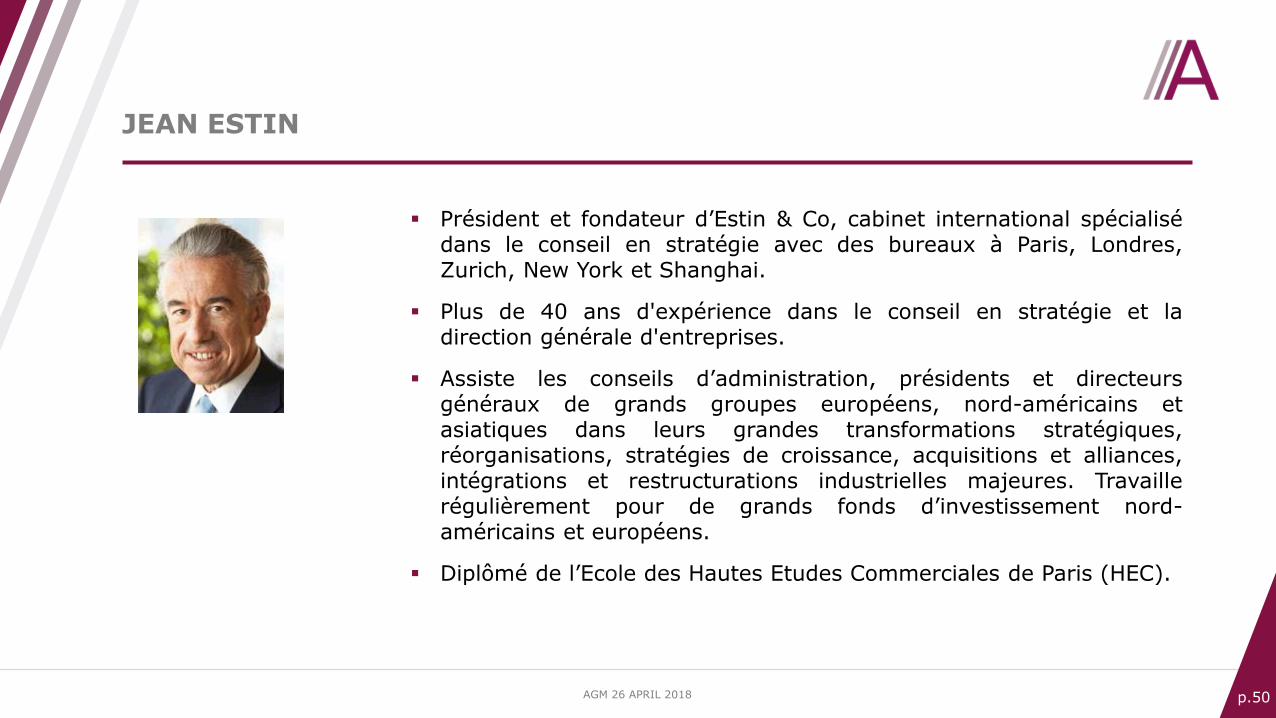
▪ Président et fondateur d’Estin & Co, cabinet international spécialisédans le conseil en stratégie avec des bureaux à Paris, Londres,Zurich, New York et Shanghai.
▪ Plus de 40 ans d'expérience dans le conseil en stratégie et ladirection générale d'entreprises.
▪ Assiste les conseils d’administration, présidents et directeursgénéraux de grands groupes européens, nord-américains etasiatiques dans leurs grandes transformations stratégiques,réorganisations, stratégies de croissance, acquisitions et alliances,intégrations et restructurations industrielles majeures. Travaillerégulièrement pour de grands fonds d’investissement nord-américains et européens.
▪ Diplômé de l’Ecole des Hautes Etudes Commerciales de Paris (HEC).
JEAN ESTIN
AGM 26 APRIL 2018 p.51
Rapport du Conseil de Surveillance et rapports des CAC
Ordre du jour des résolutions
Présentation des résultats 2017
Vote des résolutions
Questions-Réponses
SOMMAIRE

AGM 26 APRIL 2018 p.52
Questions écrites adressées par
l’ADAM
AGM 26 APRIL 2018 p.53
Réponses aux questions écrites de l’ADAM
I – Questions se rapportant au rapport de la gérance
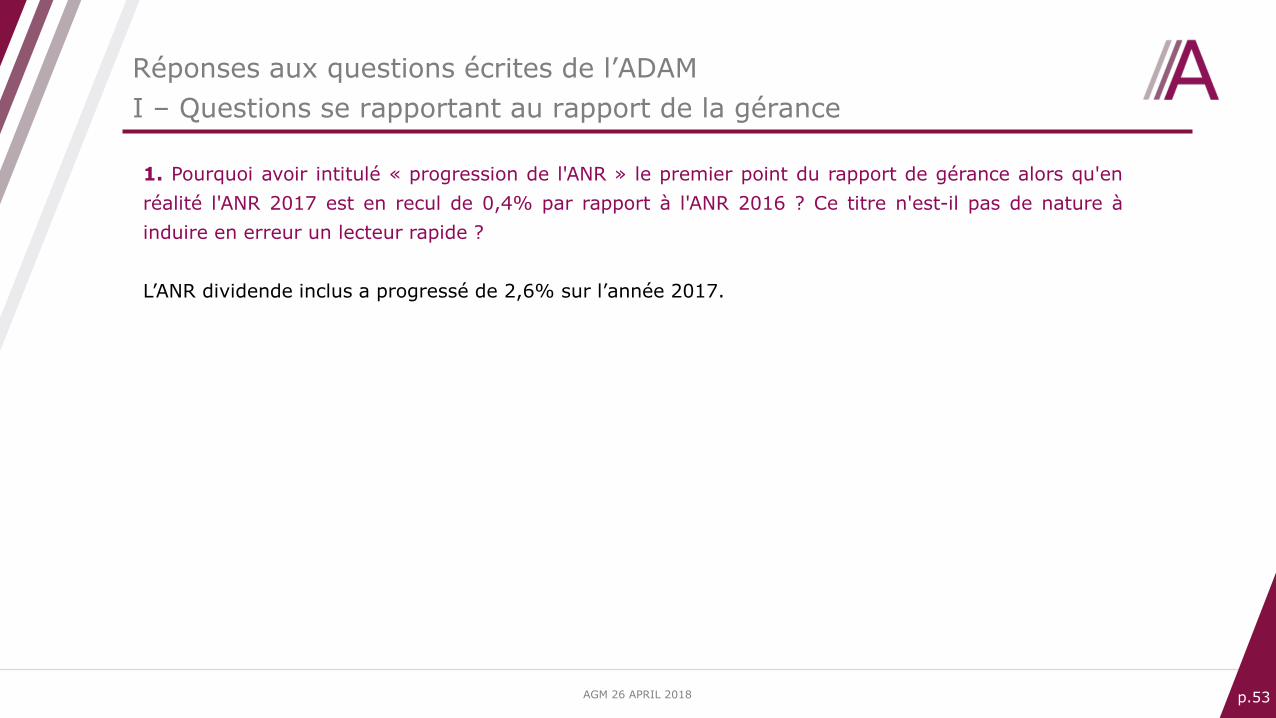
1. Pourquoi avoir intitulé « progression de l'ANR » le premier point du rapport de gérance alors qu'en
réalité l'ANR 2017 est en recul de 0,4% par rapport à l'ANR 2016 ? Ce titre n'est-il pas de nature à
induire en erreur un lecteur rapide ?
L’ANR dividende inclus a progressé de 2,6% sur l’année 2017.
AGM 26 APRIL 2018 p.54
Réponses aux questions écrites de l’ADAM
I – Questions se rapportant au rapport de la gérance
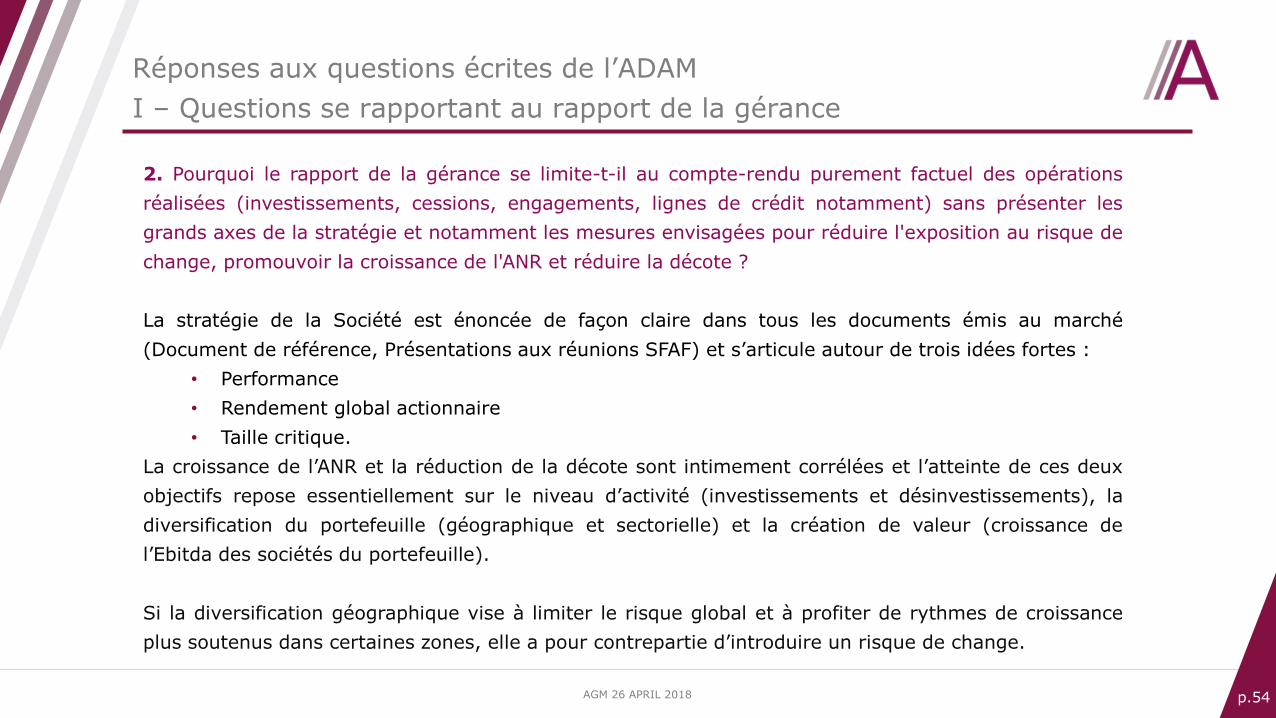
2. Pourquoi le rapport de la gérance se limite-t-il au compte-rendu purement factuel des opérations
réalisées (investissements, cessions, engagements, lignes de crédit notamment) sans présenter les
grands axes de la stratégie et notamment les mesures envisagées pour réduire l'exposition au risque de
change, promouvoir la croissance de l'ANR et réduire la décote ?
La stratégie de la Société est énoncée de façon claire dans tous les documents émis au marché
(Document de référence, Présentations aux réunions SFAF) et s’articule autour de trois idées fortes :
• Performance
• Rendement global actionnaire
• Taille critique.
La croissance de l’ANR et la réduction de la décote sont intimement corrélées et l’atteinte de ces deux
objectifs repose essentiellement sur le niveau d’activité (investissements et désinvestissements), la
diversification du portefeuille (géographique et sectorielle) et la création de valeur (croissance de
l’Ebitda des sociétés du portefeuille).
Si la diversification géographique vise à limiter le risque global et à profiter de rythmes de croissance
plus soutenus dans certaines zones, elle a pour contrepartie d’introduire un risque de change.
AGM 26 APRIL 2018 p.55
Réponses aux questions écrites de l’ADAM
I – Questions se rapportant au rapport de la gérance
3. Pourquoi le rapport de la gérance ne fait-il pas état dans la rubrique consacrée aux « Evènements
post-clôture » du rapport remis le 18 février 2018 par l'expert désigné par le tribunal de commerce de
Paris ?
Le document de référence 2017 déposé à l’AMF en date du 11 avril 2018 y fait référence en page 65.
AGM 26 APRIL 2018 p.56
Réponses aux questions écrites de l’ADAM
I – Questions se rapportant au rapport de la gérance
4. Pourquoi, omet-il ainsi d'informer les actionnaires des conclusions de cet expert, pourtant du plus
grand intérêt pour eux puisqu'il s'agit de constater :
(i) que la note de Moneta n'a pas eu d'influence négative sur le cours de Moneta comme le
prétendait Altamir mais qu'« il apparaît cependant une importante décote du titre par rapport à son
actif net » ;
(ii) que parmi les causes endogènes qui peuvent expliquer la décote, l'expert conclut que « les
différents mandats exercés par M. Tchenio autour de la société Altamir, générant pour lui différentes
sources de revenus plus importantes que les dividendes obtenus en tant qu'actionnaire ordinaire à 27%
d'Altamir, le mettent dans une situation favorisant les conflits d'intérêt. La mise en réserve des
résultats d'Altamir au détriment de la distribution de dividendes augmente la situation nette de la
société qui est une des bases de la rémunération statutaire ».
Votre question procède d’une lecture interprétative des conclusions de l’expert, lecture que la gérance
d’Altamir et le Conseil de Surveillance ne partagent pas. Nous avons mis sur notre site internet notre
lecture des conclusions de l’expert (notre communiqué du 14 février 2018), ainsi que le rapport de
l’expert.
AGM 26 APRIL 2018 p.57
Réponses aux questions écrites de l’ADAM
I – Questions se rapportant au rapport de la gérance
5. Quelles suites la gérance entend-elle donner au rapport de l'expert, en particulier quelles sont les
mesures envisagées pour réduire, voire supprimer, les causes endogènes de la décote ?
Nous pensons que l’expert a conclu de manière erronée
- « que la décote du titre est liée en partie au niveau faible de distribution de dividendes aux
investisseurs (actions ordinaires) » ;
alors que notre niveau de distribution est tout à fait en ligne, voire meilleur, que celui des sociétés
comparables ;
- « que le système de rémunération fait écho à une structure de la société qui pourrait favoriser les
conflits d’intérêts » ;
alors que depuis la mise en œuvre de la nouvelle politique d’investissement en 2012, les honoraires de
gestion et le carried interest reviennent totalement à Apax Partners SAS et Apax Partners LLP dans
lesquels le gérant n’a aucun intérêt financier, ni direct, ni indirect,
et qu’avec 29% du capital, les intérêts d’Amboise SAS sont parfaitement alignés avec ceux des
actionnaires.
AGM 26 APRIL 2018 p.58
Réponses aux questions écrites de l’ADAM
I – Questions se rapportant au rapport de la gérance
6. (Question se rapportant aux rémunérations des dirigeants et mandataires sociaux)
Est-ce en raison du constat de ce conflit d'intérêt qu'Altamir a refusé de présenter à l'approbation des
actionnaires les critères et principes retenus pour déterminer la rémunération des dirigeants, comme le
lui avait demandé l'ADAM dans une lettre du 26 mars ?
Altamir justifie son refus en faisant valoir que la loi Sapin 2 n'impose pas ce vote dans les sociétés en
commandite, mais la loi ne l'interdit en rien. Alors, pourquoi Altamir refuse-t-elle à ses actionnaires la
possibilité de faire savoir par un vote s'ils approuvent, ou pas, un principe de rémunération qui incite le
dirigeant à mettre les résultats en réserve plutôt qu'à les distribuer ?
Le Conseil de Surveillance rappelle qu’en tant que Société en Commandite par Actions, Altamir n’est
pas soumise à la législation Sapin II.
Pour rappel, les objectifs poursuivis par la Gérance et approuvé par le Conseil de surveillance consistent
à maintenir la politique de distribution actuelle qui permet de servir un rendement attractif, tout en
permettant à la société de réinvestir une grande partie de ses ressources pour faire croître l’ANR et
atteindre la taille critique de €1Md.
Voir également notre réponse à la question n°5.
AGM 26 APRIL 2018 p.59
Réponses aux questions écrites de l’ADAM
I – Questions se rapportant au rapport de la gérance
7. Pourquoi le rapport ne fait-il aucune mention du litige en cours à propos des conventions de services
(comptables) et d'assistance (notamment relations investisseurs) conclues avec Altamir Gérance et
appliquée depuis 2013 alors que l'assemblée générale a émis un vote négatif lorsqu'elles ont été
soumises à son approbation ?
Concernant la contre-procédure intentée par Moneta, aucune audience de plaidoiries n’est encore fixée
à ce jour.
AGM 26 APRIL 2018 p.60
Réponses aux questions écrites de l’ADAM
II – Questions se rapportant au rapport du Conseil de Surveillance
8. Selon la loi (article L226-9 du code des sociétés), le conseil de surveillance « assume le contrôle
permanent de la gestion de la société ». D'après le spécialiste du droit des sociétés, Francis Lefebvre, il
s’ensuit que le conseil de surveillance a d'une part, des obligations de contrôle des opérations et des
comptes de la société, et d'autre part « l'obligation de porter un jugement sur la conduite des
affaires sociales. Le conseil de surveillance doit apprécier l'opportunité de la gestion ».
8.1. Sur quoi le conseil de surveillance se base- t-il pour ne consacrer dans son rapport qui fait 30
pages, qu'une demie ligne seulement à son contrôle de la gestion, se bornant à dire en tout et pour
tout que « sans s'immiscer dans la gestion, il n'a pas d'observation à formuler » ?
8.2. A quoi sert l'indépendance, à laquelle le rapport du conseil de surveillance consacre de longs
développements, si le contrôle de la gestion qui incombe au conseil se borne à « se tenir informé de
l'ensemble des opérations d'investissement et désinvestissements intervenus au cours de l'exercice »,
sans porter de jugement sur leur efficacité et leur conformité à l'intérêt de la société et de ses
actionnaires ?
Pourquoi le conseil n'a-t-il pas d'observation sur notamment la stagnation de l'ANR, les risques de
change, l'asséchement de la trésorerie ?
AGM 26 APRIL 2018 p.61
Réponses aux questions écrites de l’ADAM
II – Questions se rapportant au rapport du Conseil de Surveillance
Le Conseil de Surveillance assisté de son comité d’audit a accompli sa mission de contrôle de gestion.
A cet effet, il a obtenu toutes les informations qu’il a estimé utiles. Il s’est réuni autant de fois qu’il a
jugé nécessaire et s’est entretenu avec la Gérance, la direction financière et les commissaires aux
comptes (voir pages 89 à 91 du document de référence 2017).
Sur la base de ces travaux, le Conseil de Surveillance n’a pas d’observation à formuler sur la gestion de
la société.
AGM 26 APRIL 2018 p.62
Réponses aux questions écrites de l’ADAM
II – Questions se rapportant au rapport du Conseil de Surveillance
9. Pourquoi le rapport du conseil de surveillance, à l'instar de celui de la gérance, ne fait-il aucunement
état du rapport de l'expert indépendant qui traite pourtant d'un certain nombre de problèmes qui
relèvent de la compétence du conseil comme les frais de gestion, les conventions réglementées et
surtout la situation de conflit d'intérêt dans laquelle se trouve le gérant et le rôle qui revient au conseil
de surveillance en la matière ?
Le document de référence 2017 déposé à l’AMF en date du 11 avril 2018, et qui intègre à la fois le
rapport de gestion et le rapport du Conseil de Surveillance, y fait référence en page 65.
L’avis du Conseil de Surveillance sur l’absence de conflit d’intérêts est mentionné page 95 du document
de référence 2017.
AGM 26 APRIL 2018 p.63
Questions écrites adressées par
MONETA AM
AGM 26 APRIL 2018 p.64
1. Dans le rapport d'expertise commandée par le Président du Tribunal de Commerce de Paris, l'Expert
Judiciaire nommé par le Tribunal, Monsieur Thierry Bergeras, constate, en particulier que « le faible
niveau de distribution des dividendes d'Altamir reste une cause endogène de décote du titre » (page 70
du rapport). Le faible partage des résultats de la société avec les actionnaires est un élément que
Moneta AM souligne depuis longtemps. Que comptent faire concrètement les organes de direction et de
contrôle pour répondre à ce grief très précis ?
2. Pourquoi le rapport de gestion n'indique-t-il pas que l'Expert Judiciaire, a confirmé, dans son rapport
final en date du 9 février 2018, et en dépit de tout ce que vous aviez affirmé lors des précédentes
assemblées générales que l'analyse réalisée par Moneta sur la société Altamir en avril 2015 n'a causé
aucun préjudice à Altamir (page 56 du rapport :« il n'existe pas de préjudice pour la société Altamir lié
à la dégradation du titre (…) comme soutenu par Altamir ») et, qu'au contraire, la décote structurelle
dont souffre le titre de la société Altamir est consécutive à des causes endogènes liées notamment à
l'existence de conflits d'intérêts entre l'équipe dirigeante et d'autres sociétés du groupe Apax (page 75
du rapport) et à une grande opacité sur les frais de gestion (page 28 du rapport), eux-mêmes en nette
augmentation (page 25 du rapport) ?
Réponses aux questions écrites de Moneta AM
AGM 26 APRIL 2018 p.65
3. L'Expert (page 28 du rapport) a également souligné la redondance entre les prestations
administratives incombant à Altamir Gérance au titre de sa rémunération statutaire (article 17.1) et
celles découlant de la convention réglementée « déclassée » du 9 juillet 2013 (ayant remplacé les
conventions réglementées du 29 novembre 2012 rejetées par les actionnaires). Cette convention de
2013 a-t-elle été résiliée et la gérance prévoit-elle de rembourser à notre société les sommes indûment
perçues ?
4. Plus généralement, quelle a été la réaction du conseil de surveillance face à la confirmation de la
défaillance de la gouvernance et quelles mesures correctives ont été prises ?
5. Enfin, pourquoi avoir attendu que Moneta informe l'AMF de la publication incomplète du rapport
Bergeras sur votre site pour le mettre en ligne et pourquoi y maintenir à ce jour le rapport de Didier
Kling que vous aviez vous-même commandé en 2015 alors qu'il est très largement contredit par le
Rapport de l'Expert Judiciaire indépendant ? »
Réponses aux questions écrites de Moneta AM
AGM 26 APRIL 2018 p.66
Réponse aux questions 1 – 2 – 3 – 4 – 5
La gérance d’Altamir et le Conseil de Surveillance ne partagent absolument pas votre lecture du rapport
de l’expert Bergeras. Les deux allégations de la note du 17 avril 2015 qui sont à l’origine de notre
action en justice, à savoir que les coûts d’Altamir seraient 30% supérieurs et notre performance 32%
inférieure à celle de sociétés d’un échantillon non représentatif, sont clairement écartés par l’Expert
dans son rapport :
« La note publiée par Moneta les 15 et 17 avril 2015 a été rédigée rapidement dans un style
lapidaire et supportée par des exemples insuffisants pour permettre à Moneta Asset Management
d’en déduire une généralité sur les frais de gestion d’Altamir. La conclusion que « chacune des
composantes des frais de gestion et de performance d’Altamir est plus élevée que celle des
comparables », prise dans son ensemble, n’est pas justifiée. »
« La performance de la société Altamir est d’un bon niveau par rapport aux sociétés du secteur ».
En tout état de cause, la présente Assemblée Générale n’est pas le lieu pour analyser et débattre du
contenu d’un rapport d’expertise.
Réponses aux questions écrites de Moneta AM
AGM 26 APRIL 2018 p.67
6. Ne trouvez-vous pas la hausse de 2,6% de l'ANR par action (en incluant le dividende de 0,65 € versé
en mai 2017) particulièrement décevante dans un contexte de forte hausse des marchés mondiaux et
des petites et moyennes valeurs françaises en particulier (hausse de 24,1% de l'indice CAC Mid 60 NR
et de 22,1% du CAC Small NR en 2017) ?
La croissance de 2,6% de l’ANR en 2017 est effectivement décevante compte tenu de l’augmentation de
27% de l’Ebitda des sociétés du portefeuille mais elle suit une croissance de 19,1% de l’ANR en 2015 et
de 19,2% en 2016.
Par ailleurs, le rendement global actionnaire (TSR) sur 2017 est de 24% donc tout à fait en ligne avec
les 2 indices cités dans la question.
Rappelons que les indices de référence choisis par Altamir sont le CAC Mid & Small et le LPX Europe.
Réponses aux questions écrites de Moneta AM
AGM 26 APRIL 2018 p.68
7. Le rapport de la gérance fait un point sur la situation de liquidité et sur les engagements d'investissement.
Il est difficile pour les actionnaires d'en tirer une vision précise de la situation de trésorerie. Pourtant le
recours par les fonds au financement par crédit permet d'augmenter la visibilité sur les décaissements à venir.
La gérance ne pourrait-elle pas présenter aux actionnaires un tableau de financement sur l'année pour leur
donner une image plus claire de la situation de trésorerie prévisionnelle ? Quels sont les tableaux dont dispose
le conseil de surveillance à cet effet ?
Les actionnaires disposent aujourd’hui des principaux agrégats qui leur permettent de se faire une opinion sur
la trésorerie à savoir :
a) Les montants engagés par les fonds Apax France IX-B, Apax IX LP et sur les co-investissements, et
non appelés au 31.12.2017 ;
b) Les règles d’appel des engagements par les fonds, à savoir, en général, 12 mois par rapport à la date
d’investissement initial ;
c) Les dividendes pour les actions ordinaires (3% de l’ANR) et les actions B, dont les montants sont
indiqués en page 101 du document de référence 2017 ainsi que la date de paiement du 25 mai.
d) Les frais de gestion directs qui sont dus au début de chaque trimestre.
e) La situation de trésorerie au 31.12 aussi bien en social, qu’en consolidé, et le taux de disponibilité de
la ligne de crédit.
Réponses aux questions écrites de Moneta AM
AGM 26 APRIL 2018 p.69
Enfin, comme chaque année, sont communiqués de manière globale les objectifs d’investissements et
de désinvestissements, à savoir pour 2018, 100M€ et 150M€ respectivement.
Le comité d’audit et le Conseil de Surveillance revoient chaque trimestre un plan de trésorerie détaillé.
Réponses aux questions écrites de Moneta AM
AGM 26 APRIL 2018 p.70
8. Les organes de direction et de contrôle ne partagent-ils pas notre opinion qu'une gestion
structurellement prudente de la trésorerie de la société serait de nature à rassurer les actionnaires et
investisseurs potentiels et de conduire à une réduction de la décote ? Ne pensent-ils pas que la gestion
de la trésorerie d'Altamir a été dans le passé une source de stress boursier intense comme l'a montré le
plongeon du titre à des niveaux dérisoires en 2009 ? L'univers financier pouvant redevenir plus volatile
qu'il l'a été ces dernières années quelles sont les mesures qui sont prises au niveau d'Altamir pour
pouvoir y faire face de manière sereine ?
La gestion de la trésorerie d’Altamir a toujours été particulièrement prudente. La Gérance et le Conseil
de Surveillance rappellent ici les 3 règles qui figurent dans toutes les présentations faites au marché :
- Pas d’effet de levier au niveau d’Altamir (la ligne de crédit n’a pour objet que de faire face à des
décalages temporaires entre encaissements et décaissements) ;
- Pas de sur-engagement dans les fonds (avec, de plus, une clause d’ajustement de 80M€ dans
les fonds d’Apax France) ;
- Les engagements dans les fonds sont tous pris en euros et ne comportent donc pas de risque de
change.
Réponses aux questions écrites de Moneta AM
AGM 26 APRIL 2018 p.71
La chute du titre en mars 2009 était liée à l’existence d’un financement de type « margin loan » sur
Financière Hélios (holding de détention des titres Albioma) qui était à l’époque la principale valeur du
portefeuille. Il ne demeure plus aujourd’hui qu’un seul financement de ce type sur Altrafin, la holding
qui détient les titres Altran. Le seuil de déclenchement des appels de marge est assez conservateur par
rapport au cours de bourse actuel et Altran ne représentait que 5% du portefeuille au 31 décembre
2017.
9. Le conseil de surveillance précise dans son rapport avoir examiné le 6 mars 2017 « la cohérence des
frais d'Altamir par rapport à ses principaux comparables européens ». Quels ont été les comparables
utilisés, la méthodologie suivie et les conclusions qu'en a tiré le conseil de surveillance ? Qui a réalisé
ces travaux ? Ceux-ci ne devraient-ils pas être portés à la connaissance des actionnaires ?
Le Conseil de Surveillance s’est penché sur une analyse comparative des frais directs autres que les
honoraires de gestion. Cette étude, faite par l’équipe d’Apax Partners SA (Amboise Partners SA
aujourd’hui), a permis au Conseil de Surveillance de constater que ces frais directs étaient en ligne avec
ceux des principaux comparables.
Réponses aux questions écrites de Moneta AM
AGM 26 APRIL 2018 p.72
10. Le rapport de la gérance chiffre l'effet de la baisse du $ à 0,48 €/action. Ce n'est que 2% de l'ANR.
Quels sont les autres éléments spécifiques aux sociétés du portefeuille qui ont justifié d'avoir dû
appliquer selon vous (cf. page 6 du document de référence) des multiples en baisse dans contexte
général de hausse des multiples des actions cotées et non cotées ?
Les sociétés non cotées, conformément aux principes de l’IPEV, sont valorisées en utilisant les multiples
de sociétés cotées comparables. La baisse des multiples constatée au 31.12.2017 telle que reflétée
p21 de notre présentation SFAF rendue publique, n’est pas liée à la performance des sociétés de notre
portefeuille mais à la baisse des multiples de sociétés comparables qui sont dans l’échantillon retenu au
moment de notre décision d’investissement.
11. Quelle a été la performance de l'lNSEEC pour l'exercice 30/06/2016-30/06/2017, comment se
compare-t-elle aux prévisions de croissance à deux chiffres de l'EBITDA, et pourquoi n'est elle pas
indiquée dans le document de référence (contrairement aux exercices passés) ?
La valorisation de l’investissement dans INSEEC U. s’est accrue de 17,8M€ sur l’exercice 2017. Cet
accroissement de valorisation est la résultante de l’amélioration de la rentabilité de la société et
l’accroissement des multiples de comparables (voir présentation SFAF p21).
Réponses aux questions écrites de Moneta AM
AGM 26 APRIL 2018 p.73
12. Qu'est-ce qui explique la très forte baisse de valorisation de Nowo/Oni, (-68% en 2017 pour une
ligne valorisée à 33m€ fin 2016 soit 4% de l'ANR) ? Pourquoi n'y-a-t-il aucun commentaire sur cette
évolution dans le Document de Référence 2017 ?
La baisse de la valorisation de Nowo/Oni au 31.12.2017 a été expliquée lors de la réunion SFAF du 9
mars dernier sur la base de la slide 21 présentée ce jour là et en ligne sur notre site Internet.
Elle est la résultante d’une situation de marché extrêmement compétitive au Portugal et du non-respect
de ses engagements par l’opérateur téléphonique ayant cédé à Apax cette entreprise. Pour tenir compte
de cette situation, le gérant du fonds a déprécié cette participation à 50% de son prix de revient contre
une valorisation de 150% au 30 juin 2017.
La société a pour politique dans le Document de Référence de ne communiquer que sur les
performances de la dizaine de sociétés dont la valeur cumulée représente 80% du portefeuille en juste
valeur.
Réponses aux questions écrites de Moneta AM
AGM 26 APRIL 2018 p.74
13. Il est affirmé que la croissance de l'EBITDA moyen de 2017 a été de 27% "tant organique que par
build-up", alors que l'objectif était de 7% en organique. Pourrait-on connaitre avec précision le niveau
de la croissance organique de 2017 à comparer aux 7% prévus ?
Le reporting que la société reçoit des fonds n’est pas détaillé au point de permettre de communiquer un
taux de croissance organique synthétique précis.
Il est néanmoins possible d’affirmer que, pour 2017, ce taux de croissance organique est supérieur à
7%.
14. L'objectif de croissance organique de l'EBITDA moyen pondéré est de 7% pour 2018. La croissance
organique réalisée de 2018 sera-t-elle communiquée aux actionnaires ? Pourquoi n'est-ce pas
spontanément le cas en 2017 ?
Voir réponse à la question 13.
Altamir s’efforce en permanence d’obtenir l’information précise pour le suivi de cet indicateur clé de
performance du métier du private equity.
Réponses aux questions écrites de Moneta AM
AGM 26 APRIL 2018 p.75
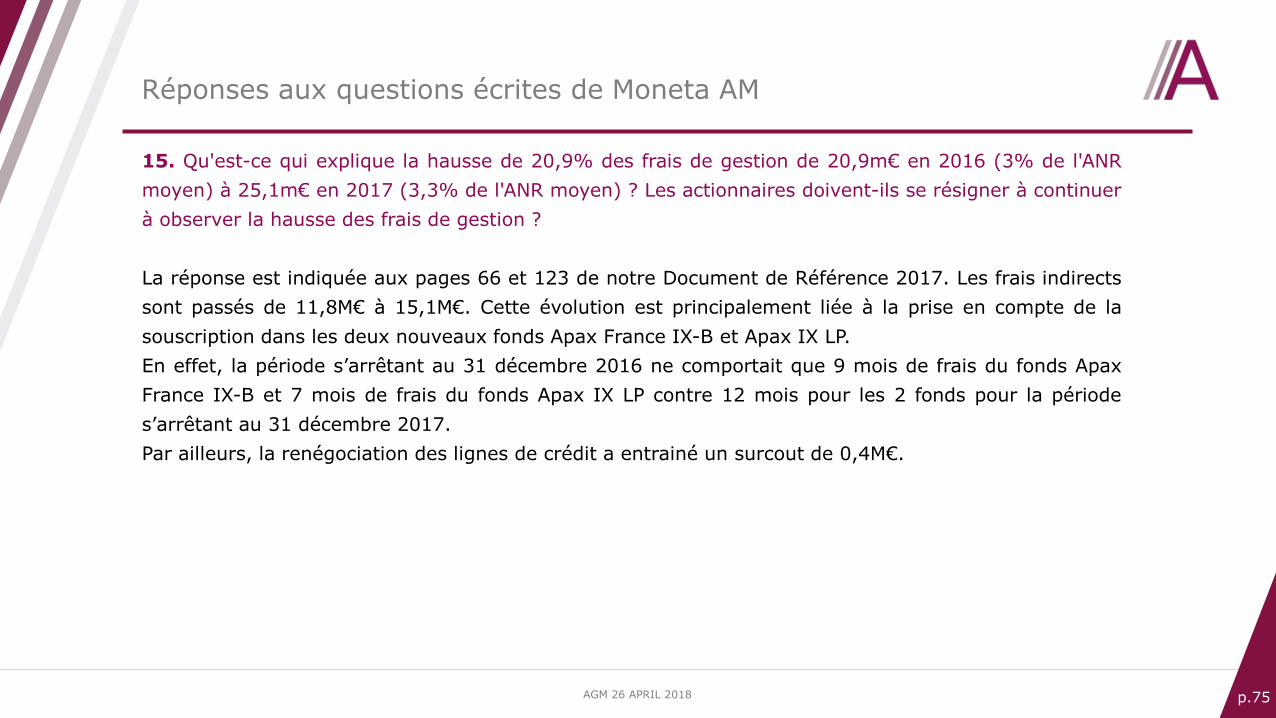
15. Qu'est-ce qui explique la hausse de 20,9% des frais de gestion de 20,9m€ en 2016 (3% de l'ANR
moyen) à 25,1m€ en 2017 (3,3% de l'ANR moyen) ? Les actionnaires doivent-ils se résigner à continuer
à observer la hausse des frais de gestion ?
La réponse est indiquée aux pages 66 et 123 de notre Document de Référence 2017. Les frais indirects
sont passés de 11,8M€ à 15,1M€. Cette évolution est principalement liée à la prise en compte de la
souscription dans les deux nouveaux fonds Apax France IX-B et Apax IX LP.
En effet, la période s’arrêtant au 31 décembre 2016 ne comportait que 9 mois de frais du fonds Apax
France IX-B et 7 mois de frais du fonds Apax IX LP contre 12 mois pour les 2 fonds pour la période
s’arrêtant au 31 décembre 2017.
Par ailleurs, la renégociation des lignes de crédit a entrainé un surcout de 0,4M€.
Réponses aux questions écrites de Moneta AM
AGM 26 APRIL 2018 p.76
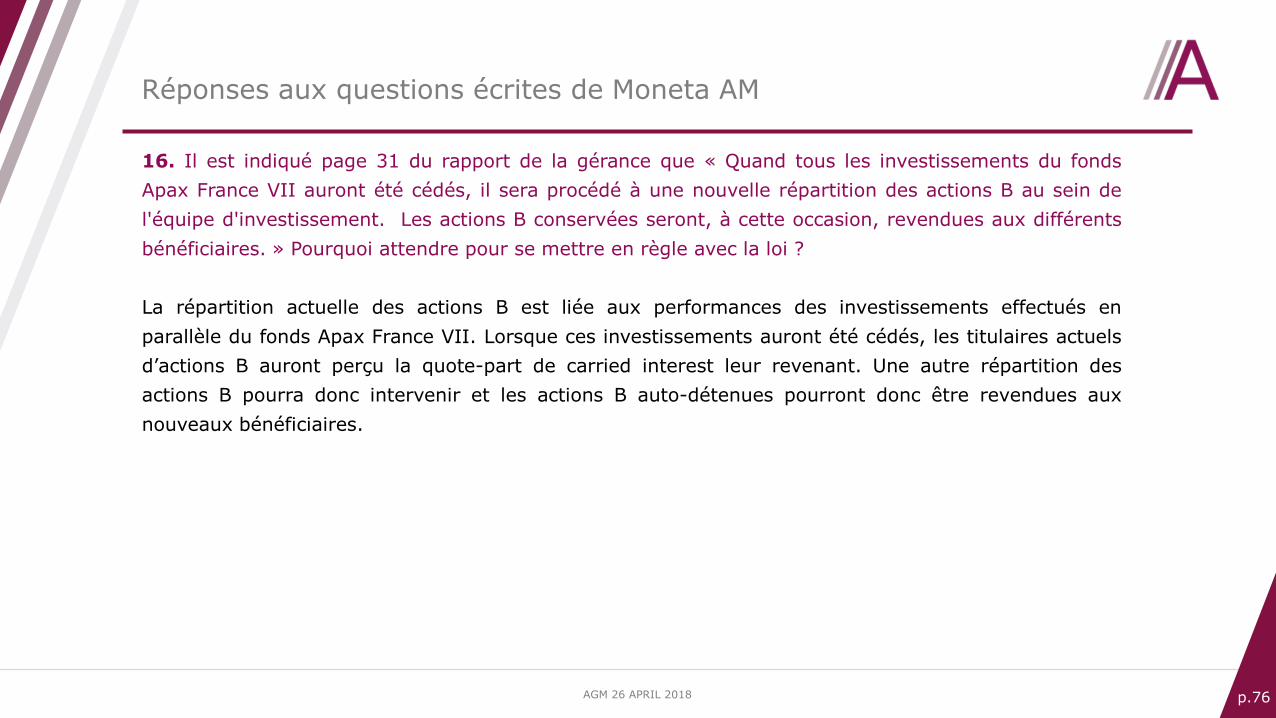
16. Il est indiqué page 31 du rapport de la gérance que « Quand tous les investissements du fonds
Apax France VII auront été cédés, il sera procédé à une nouvelle répartition des actions B au sein de
l'équipe d'investissement. Les actions B conservées seront, à cette occasion, revendues aux différents
bénéficiaires. » Pourquoi attendre pour se mettre en règle avec la loi ?
La répartition actuelle des actions B est liée aux performances des investissements effectués en
parallèle du fonds Apax France VII. Lorsque ces investissements auront été cédés, les titulaires actuels
d’actions B auront perçu la quote-part de carried interest leur revenant. Une autre répartition des
actions B pourra donc intervenir et les actions B auto-détenues pourront donc être revendues aux
nouveaux bénéficiaires.
Réponses aux questions écrites de Moneta AM

AGM 26 APRIL 2018 p.77
Rapport du Conseil de Surveillance et rapports des CAC
Ordre du jour des résolutions
Présentation des résultats 2017
Vote des résolutions
Questions-Réponses
SOMMAIRE
AGM 26 APRIL 2018 p.78
Rapport du Conseil de Surveillance et rapports des CAC
Ordre du jour des résolutions
Questions-Réponses
Présentation des résultats 2017
Vote des résolutions
SOMMAIRE

AGM 26 APRIL 2018 p.79
Approbation des comptes annuels
PREMIERE RESOLUTION
• Approbation des comptes sociaux de l’exercice clos le 31 décembre 2017 se soldant par un bénéfice de 69 886 629 euros
AGM 26 APRIL 2018 p.80
Approbation des comptes consolidés
DEUXIEME RESOLUTION
• Approbation des comptes consolidés de l’exercice clos le 31 décembre 2017 se soldant par un bénéfice de 20 888 547 euros
AGM 26 APRIL 2018 p.81
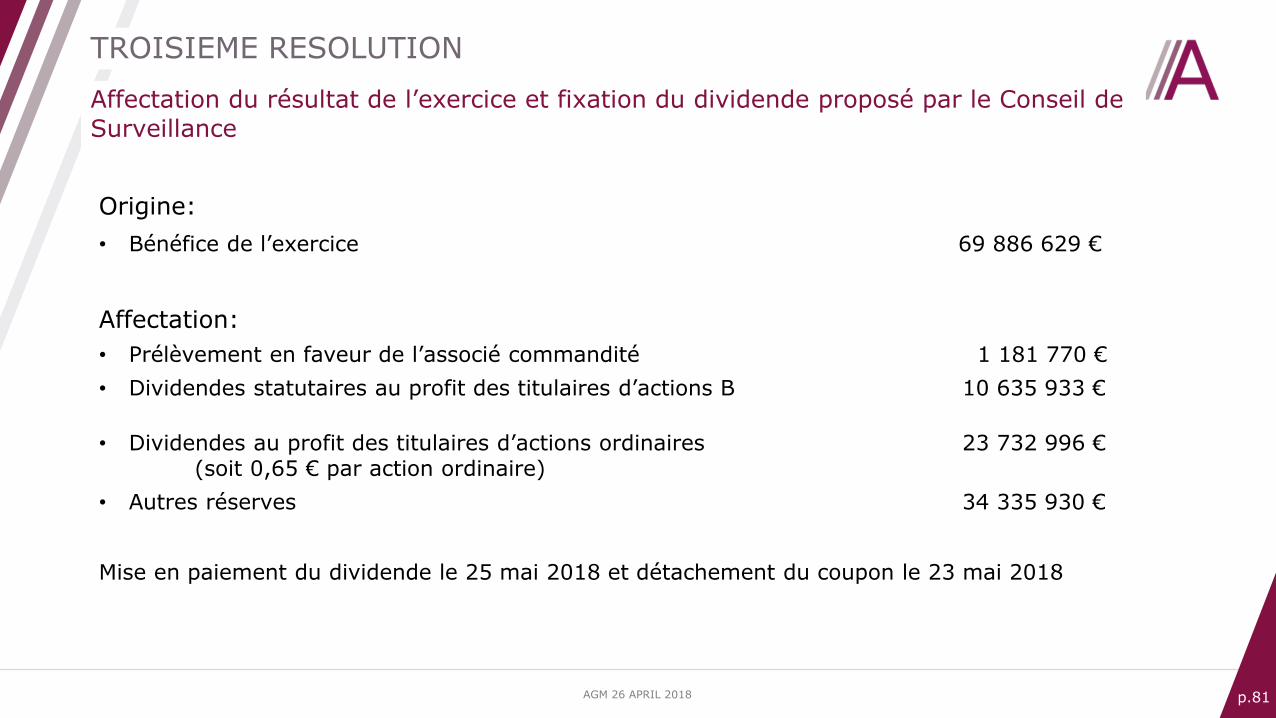
Affectation du résultat de l’exercice et fixation du dividende proposé par le Conseil de
Surveillance
TROISIEME RESOLUTION
Origine:
• Bénéfice de l’exercice 69 886 629 €
Affectation:
• Prélèvement en faveur de l’associé commandité 1 181 770 €
• Dividendes statutaires au profit des titulaires d’actions B 10 635 933 €
• Dividendes au profit des titulaires d’actions ordinaires 23 732 996 €(soit 0,65 € par action ordinaire)
• Autres réserves 34 335 930 €
Mise en paiement du dividende le 25 mai 2018 et détachement du coupon le 23 mai 2018
AGM 26 APRIL 2018 p.82
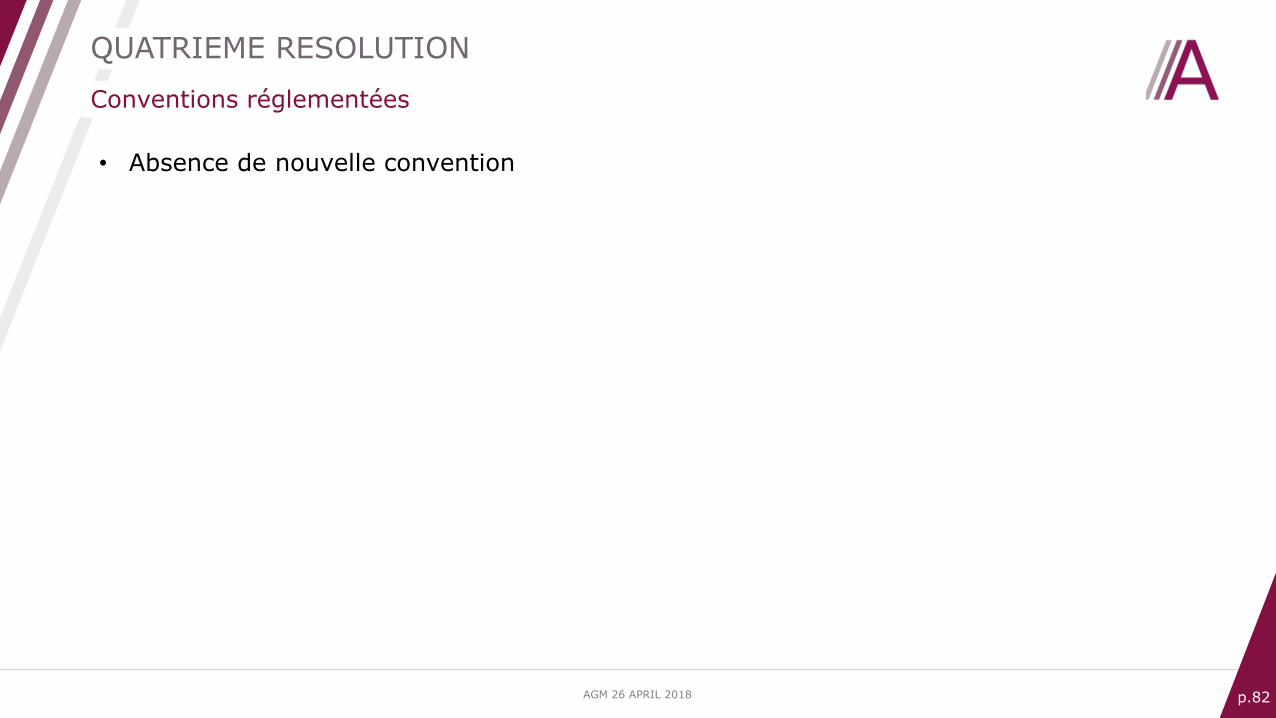
Conventions réglementées
QUATRIEME RESOLUTION
• Absence de nouvelle convention
AGM 26 APRIL 2018 p.83
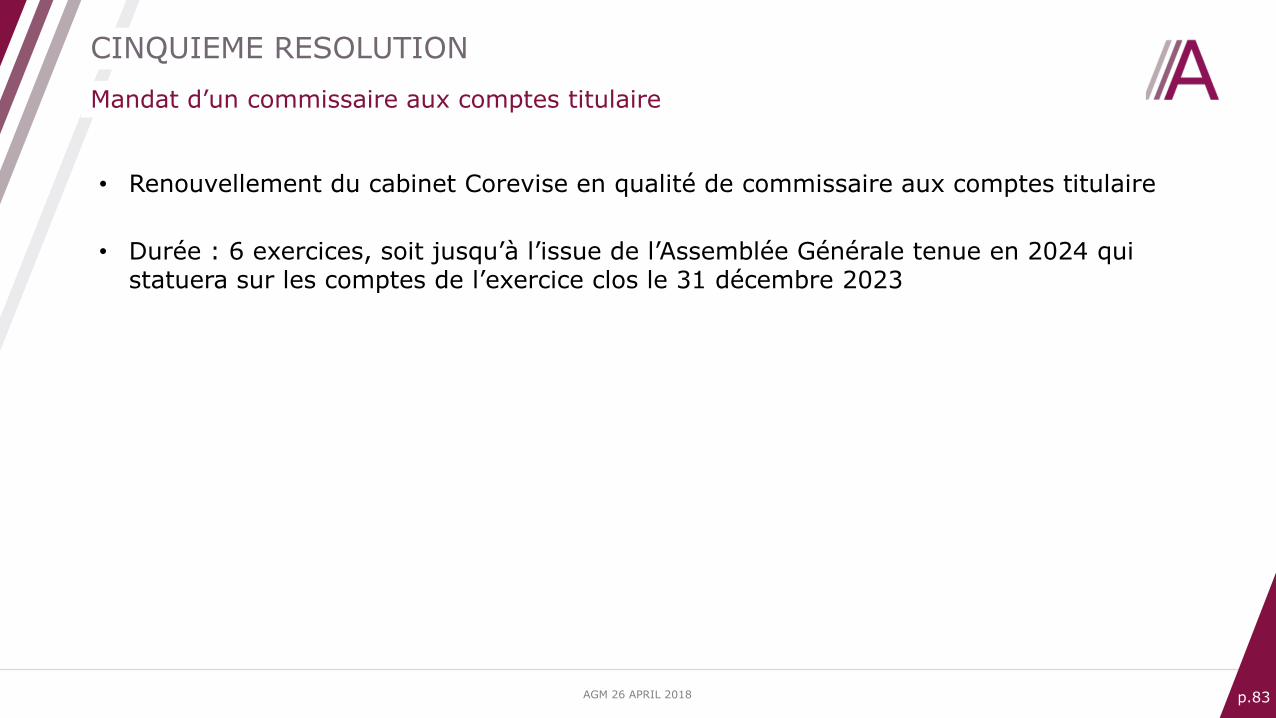
Mandat d’un commissaire aux comptes titulaire
CINQUIEME RESOLUTION
• Renouvellement du cabinet Corevise en qualité de commissaire aux comptes titulaire
• Durée : 6 exercices, soit jusqu’à l’issue de l’Assemblée Générale tenue en 2024 qui statuera sur les comptes de l’exercice clos le 31 décembre 2023
AGM 26 APRIL 2018 p.84
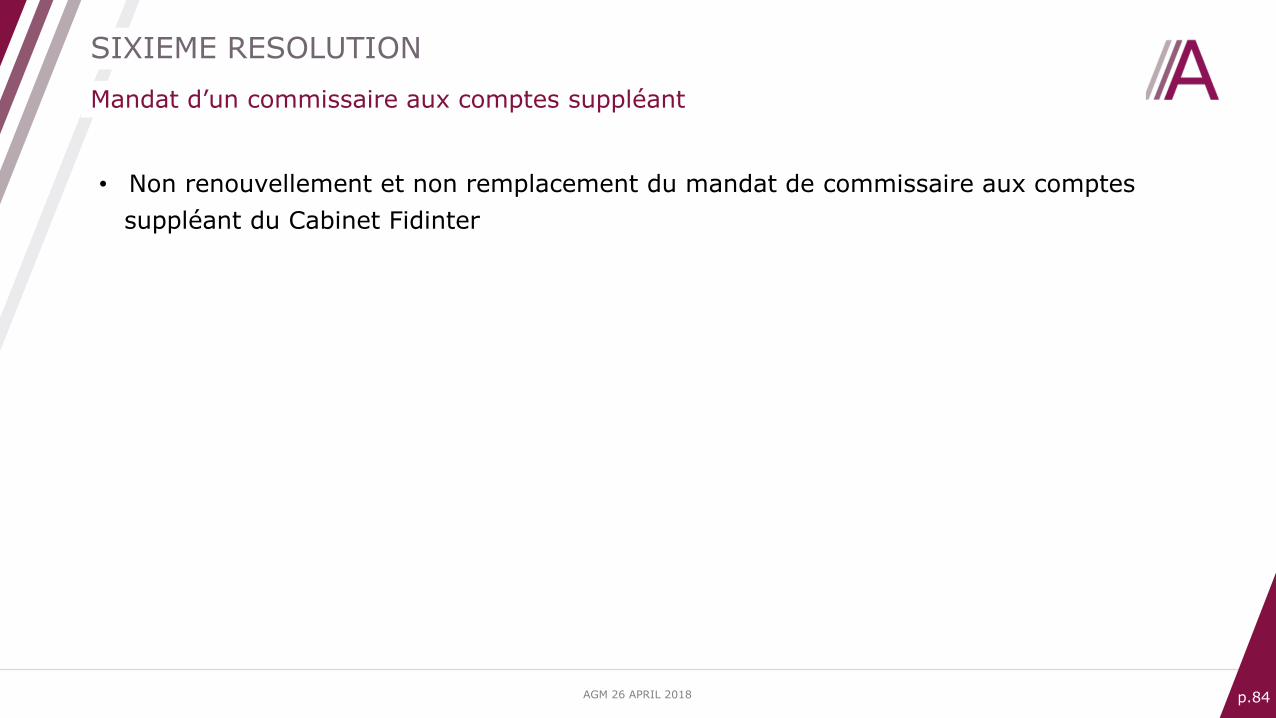
Mandat d’un commissaire aux comptes suppléant
SIXIEME RESOLUTION
• Non renouvellement et non remplacement du mandat de commissaire aux comptes
suppléant du Cabinet Fidinter
AGM 26 APRIL 2018 p.85
Renouvellement d’un membre du Conseil de Surveillance
SEPTIEME RESOLUTION
• Renouvellement de Madame Sophie ETCHANDY-STABILE en qualité de membre du Conseil de Surveillance
• Le Conseil de Surveillance considère que Madame Sophie ETCHANDY-STABILE peut être qualifiée de membre indépendant au regard des critères du Code AFEP/MEDEF
• Durée : 2 années, soit jusqu’à l’issue de l’Assemblée Générale tenue en 2020 qui statuera sur les comptes de l’exercice écoulé
AGM 26 APRIL 2018 p.86
Renouvellement d’un membre du Conseil de Surveillance
HUITIEME RESOLUTION
• Renouvellement de Monsieur Jean-Hugues LOYEZ en qualité de membre du Conseil
de Surveillance
• Le Conseil de Surveillance considère que Monsieur Jean-Hugues LOYEZ peut êtrequalifié de membre indépendant au regard des critères du Code AFEP/MEDEF
• Durée : 2 années, soit jusqu’à l’issue de l’Assemblée Générale tenue en 2020 quistatuera sur les comptes de l’exercice écoulé
AGM 26 APRIL 2018 p.87
Nomination d’un membre du Conseil de Surveillance
NEUVIEME RESOLUTION
• Nomination de Monsieur Jean ESTIN en qualité de membre du Conseil du Surveillanceen remplacement de Monsieur Jean BESSON
• Le Conseil de Surveillance considère que Monsieur Jean ESTIN peut être qualifié demembre indépendant au regard des critères du Code AFEP/MEDEF
• Durée : 2 années, soit jusqu’à l’issue de l’Assemblée Générale tenue en 2020 quistatuera sur les comptes de l’exercice écoulé
AGM 26 APRIL 2018 p.88
Avis sur les éléments de la rémunération due ou attribuée au titre de l’exercice clos le
31 décembre 2017 à Monsieur Maurice Tchenio, PDG d’Altamir Gérance, Gérant
DIXIEME RESOLUTION
• Document de Référence 2017 (page 103)
AGM 26 APRIL 2018 p.89
Avis sur les éléments de la rémunération due ou attribuée au titre de l’exercice clos le
31 décembre 2017 à Monsieur Jean-Hugues Loyez, Président du Conseil de
Surveillance
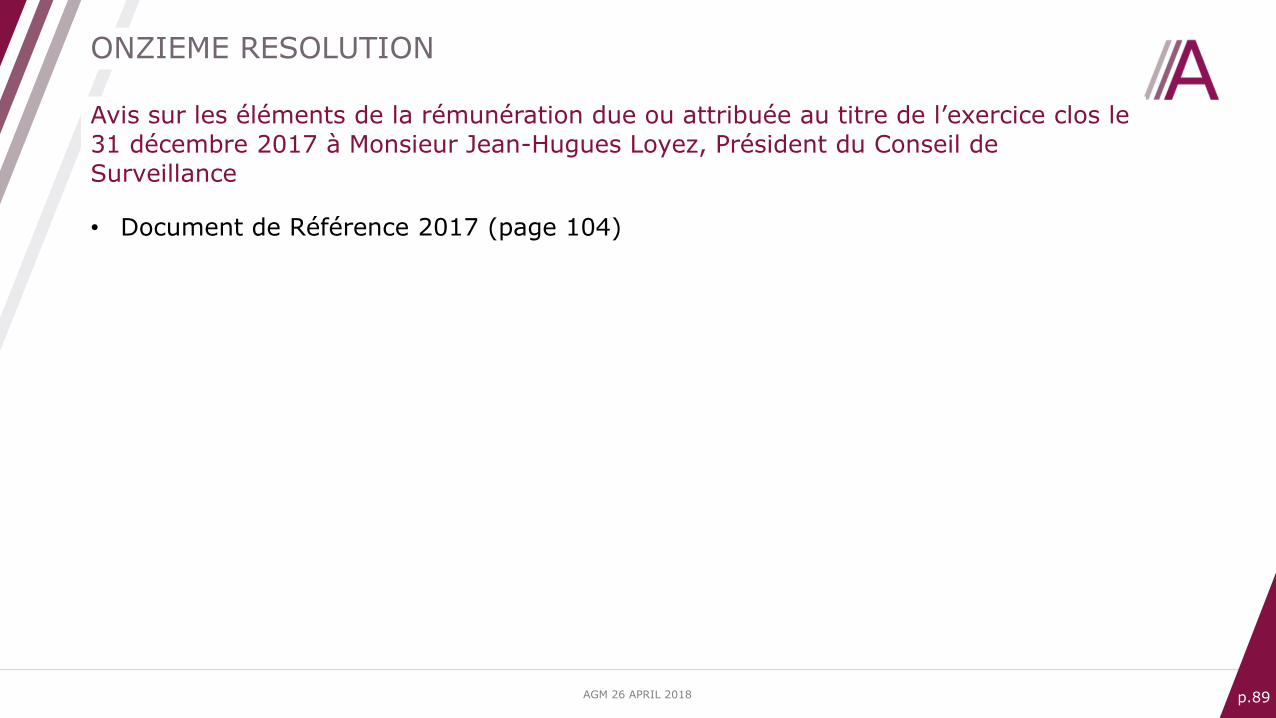
ONZIEME RESOLUTION
• Document de Référence 2017 (page 104)
AGM 26 APRIL 2018 p.90
Programme de rachat d’actions
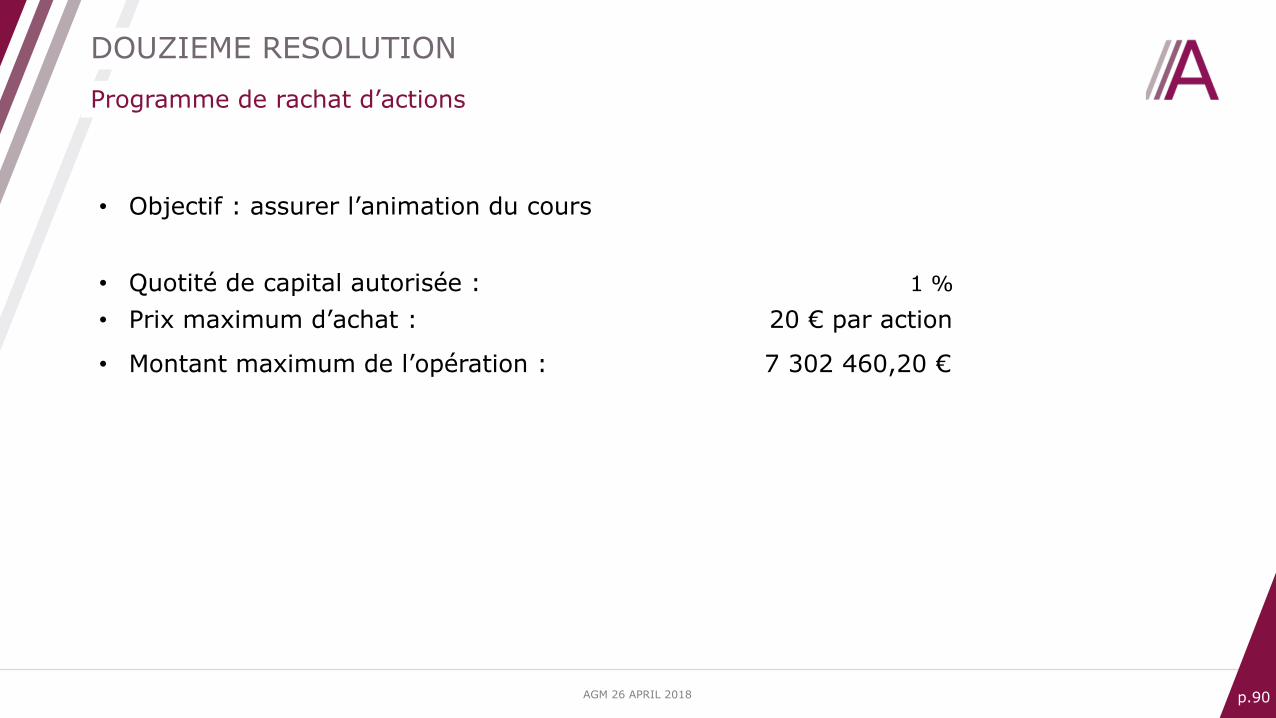
DOUZIEME RESOLUTION
• Objectif : assurer l’animation du cours
• Quotité de capital autorisée : 1 %
• Prix maximum d’achat : 20 € par action
• Montant maximum de l’opération : 7 302 460,20 €
AGM 26 APRIL 2018 p.91
Pouvoirs pour les formalités
TREIZIEME RESOLUTION