Embed Size (px)
Citation preview
Vol.:(0123456789)1 3
Journal of Petroleum Exploration and Production Technology https://doi.org/10.1007/s13202-018-0504-x
ORIGINAL PAPER - PRODUCTION ENGINEERING
Assessing the application of miscible CO2 flooding in oil reservoirs: a case study from Pakistan
Amanat Ali Bhatti1 · Arshad Raza1 · Syed Mohammad Mahmood2 · Raoof Gholami3
Received: 14 February 2018 / Accepted: 4 June 2018 © The Author(s) 2018
AbstractMiscible carbon dioxide (CO2) flooding has been recognized as a promising approach to enhance the recovery of oil reser-voirs. However, depending on the injection strategy and rock/fluid characteristics, efficiency of the miscible CO2 flooding varies from reservoir to reservoir. Although, many studies have been carried out to evaluate the performance of the miscible CO2 flooding, a specific strategy which can be strictly followed for a hydrocarbon reservoir has not been established yet. The aim of this study is to assess one of Pakistan’s oil reservoirs for miscible CO2 flooding by applying a modified screening criterion and numerical modeling. As such, the most recent miscible CO2 screening criteria were modified, and a numerical modeling was applied on the prospective reservoir. Based on the results obtained, South oil reservoir (S3) is chosen for a detailed assessment of miscible CO2 flooding. It was also found that implementation of CO2 water-alternating gas (CO2-WAG) injection at early stages of production can increase the production life of the reservoir.
Keywords Miscible CO2-EOR · Screening criteria · Injection strategy · Oil reservoirs · Numerical modeling
Introduction
Major oil reservoirs around the globe have an average recov-ery factor of 20–40% (International 2006; Sandrea 2007). As such, their complete development often requires secondary recovery (injection of gas or water), and tertiary/enhanced oil recovery (EOR) methods (injection of miscible/immis-cible fluids, chemical or thermal) (Orr et al. 1982). Unlike the secondary methods, which are known as physical pro-cesses, in the tertiary recovery, microscopic displacement and macroscopic sweep efficiency are improved by oil swelling, variation of interfacial tension (IFT), oil viscosity and wettability (Bayat et al. 2016; Brashear and Kuuskraa 1978; Sun et al. 2017). The most common EOR methods were established in the early 1970s (Muggeridge et al. 2014) and are further classified into gas, chemical and thermal
technologies. Table 1 summarizes methods, phenomenon and challenges of different EOR technologies (Alvarado and Manrique 2010; Ayatollahi and Zerafat 2012; Kong and Ohadi 2010; Silva et al. 2007; Souza et al. 2005; Thomas 2008).
Among these three, the gas technology using CO2 is per-haps the best method as it helps to achieve the minimum miscible pressure (MMP)—the lowest pressure for CO2 phase to reach the multiple contact miscibility (MCM) under dynamic conditions (Bachu 2016; Gao et al. 2013). As such, CO2 can be applied for miscible EOR or immiscible EOR operation depending on the MMP (Gao et al. 2013).
To optimize recovery of miscible CO2 flooding, continu-ous CO2 injection (CCO2) and CO2 water-alternating gas (CO2-WAG) injection are often used as well-known injection strategies (Caudle and Dyes 1958). There have been many studies indicating the application of CCO2 or CO2-WAG. For instance, Caudle and Dyes (1958) carried out an experimen-tal investigation and reported that the CO2-WAG process is far better than the CCO2 in terms of cost and performance due to the improvement of displacement. John et al. (1990) carried out numerical modeling for probabilistic cash flow analysis of the miscible CO2 flooding in West Virginia. The results of statistical analysis showed that the CO2-WAG is very suitable and cost effective compared to the CCO2.
* Arshad Raza [email protected]
1 Department of Petroleum Engineering, UET Lahore, Lahore, Pakistan
2 Department of Petroleum Engineering, Universiti Teknologi Petronas, Seri Iskander, Malaysia
3 Department of Petroleum Engineering, Curtin University, Miri, Malaysia
Journal of Petroleum Exploration and Production Technology
1 3
Heidari et al. (2013) carried out comparison experimentally and numerically between CO2-WAG and CO2 simultaneous water-and-gas (CO2-SWAG) injection. They concluded that the CO2-SWAG enhanced oil production as compared to CO2-WAG in immiscible, near-miscible, and miscible modes of injection, and miscible CO2-SWAG produces more than 74% of original oil in place. Inaloo et al. (2014) performed numerical analysis for one of the Iranian oil reservoirs to determine the optimal production strategy through water flooding, gas injection and WAG. The results obtained indi-cated that water injection gives a better recovery than gas or WAG injections. In a similar study, Song et al. (2014) numerically investigated the reservoir parameters to evaluate the efficiency of CO2 flooding. It was found that a five-spot injection well pattern is more feasible than inverted nine-spot and seven-spot patterns for CO2-WAG flooding. They also indicated that CO2-WAG flooding is much feasible than CCO2 if cost and tax credit per ton of CO2 are considered. Ahmadi et al. (2016) numerically studied three different CO2 injection scenarios including CO2 injection into an aquifer, CO2 injection into the pay zone, and simultaneous CO2 injection into the aquifer and pay zone. Their study showed that simultaneous CO2 injection into the aquifer and pay zone gives a better oil recovery compared to other scenarios. In a recent study, Jaber and Awang (2017) numerically eval-uated the injection strategies during miscible CO2-SWAG injection in a highly heterogeneous clastic reservoir. The results indicated that the CO2-SWAG injection with the ratio of 2:1 provides the maximum oil recovery compared to other injection modes. It seems that the efficiency of miscible CO2 flooding varies from reservoir to reservoir and more studies are required to have a deeper understanding of how miscible
CO2 flooding can be successfully employed to improve the recovery in oil reservoirs.
The aim of this paper is to show how oil fields can be screened for miscible CO2 flooding and why an optimum injection strategy must be chosen for production enhance-ment. A case study from Pakistan is also brought to highlight the application of the methodology proposed.
Preliminary screening
To select a particular EOR technology/method for oil res-ervoirs, a few essential steps must be taken including: (1) preliminary screening for suitability of EOR method, (2) a comprehensive laboratory and simulation study, (3) pilot tests, and (4) field study (Bourdarot and Ghedan 2011). In this paper, attempts are made to show how these steps must be taken and carefully followed for a successful implementa-tion of miscible CO2 flooding.
Preliminary screening for suitability of EOR
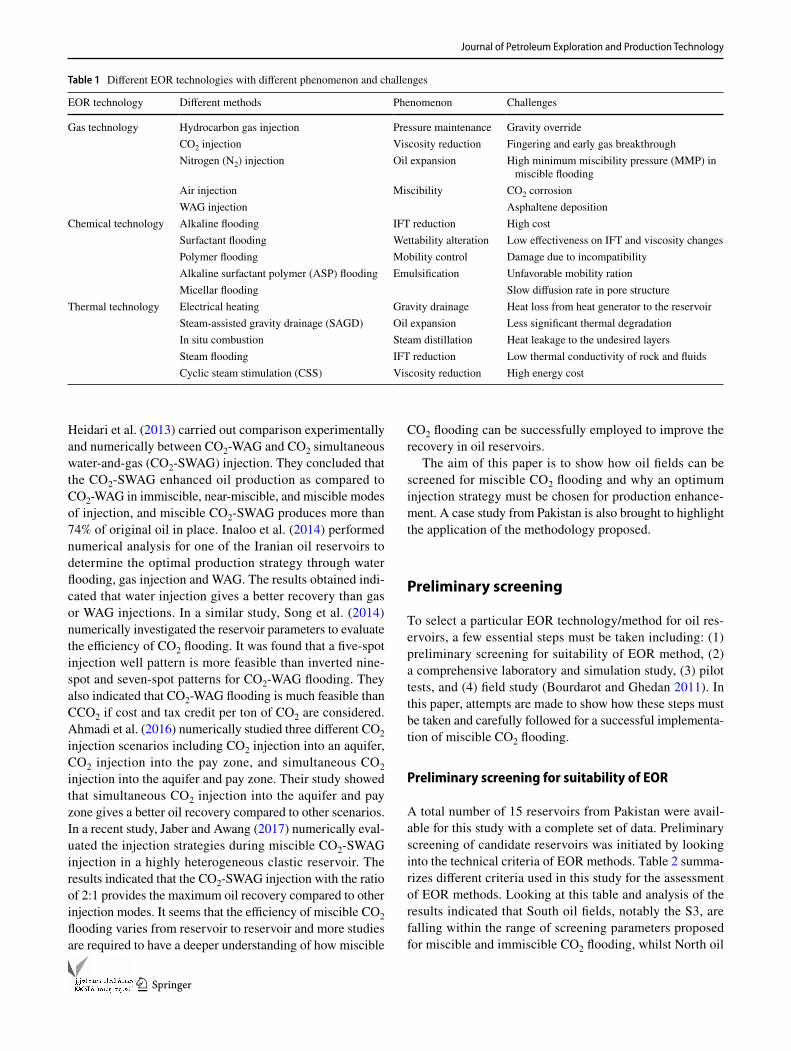
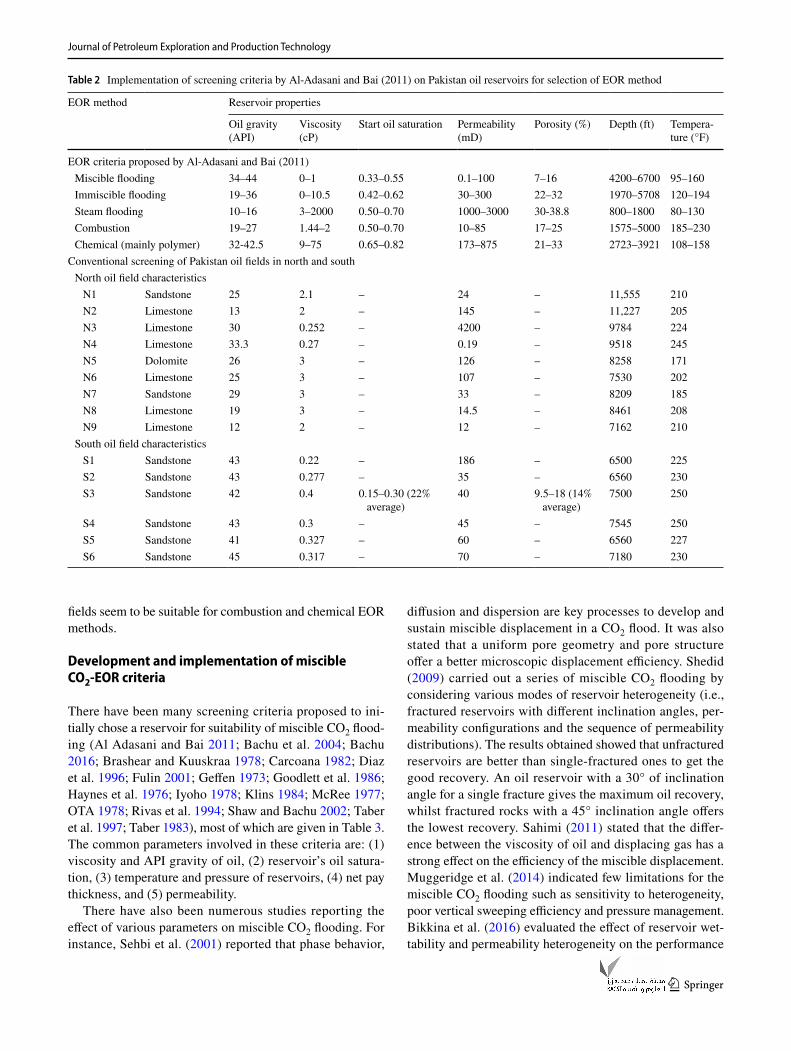
A total number of 15 reservoirs from Pakistan were avail-able for this study with a complete set of data. Preliminary screening of candidate reservoirs was initiated by looking into the technical criteria of EOR methods. Table 2 summa-rizes different criteria used in this study for the assessment of EOR methods. Looking at this table and analysis of the results indicated that South oil fields, notably the S3, are falling within the range of screening parameters proposed for miscible and immiscible CO2 flooding, whilst North oil
Table 1 Different EOR technologies with different phenomenon and challenges
EOR technology Different methods Phenomenon Challenges
Gas technology Hydrocarbon gas injection Pressure maintenance Gravity overrideCO2 injection Viscosity reduction Fingering and early gas breakthroughNitrogen (N2) injection Oil expansion High minimum miscibility pressure (MMP) in
miscible floodingAir injection Miscibility CO2 corrosionWAG injection Asphaltene deposition
Chemical technology Alkaline flooding IFT reduction High costSurfactant flooding Wettability alteration Low effectiveness on IFT and viscosity changesPolymer flooding Mobility control Damage due to incompatibilityAlkaline surfactant polymer (ASP) flooding Emulsification Unfavorable mobility rationMicellar flooding Slow diffusion rate in pore structure
Thermal technology Electrical heating Gravity drainage Heat loss from heat generator to the reservoirSteam-assisted gravity drainage (SAGD) Oil expansion Less significant thermal degradationIn situ combustion Steam distillation Heat leakage to the undesired layersSteam flooding IFT reduction Low thermal conductivity of rock and fluidsCyclic steam stimulation (CSS) Viscosity reduction High energy cost
Journal of Petroleum Exploration and Production Technology
1 3
fields seem to be suitable for combustion and chemical EOR methods.
Development and implementation of miscible CO2‑EOR criteria
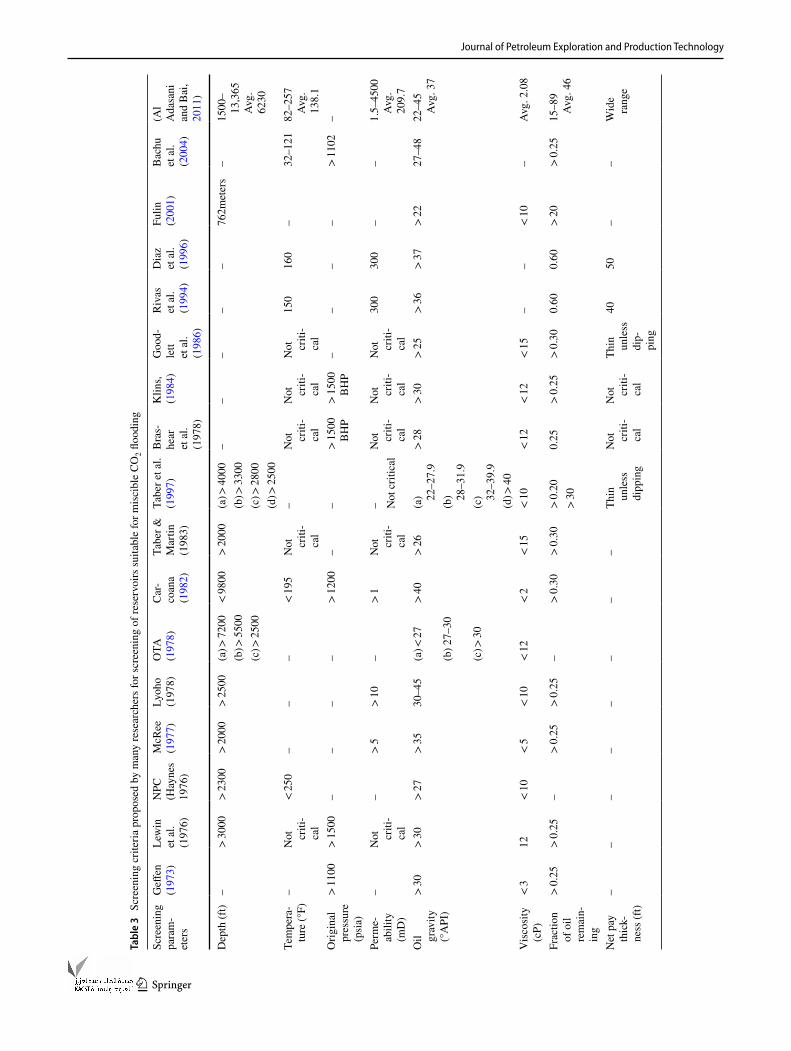
There have been many screening criteria proposed to ini-tially chose a reservoir for suitability of miscible CO2 flood-ing (Al Adasani and Bai 2011; Bachu et al. 2004; Bachu 2016; Brashear and Kuuskraa 1978; Carcoana 1982; Diaz et al. 1996; Fulin 2001; Geffen 1973; Goodlett et al. 1986; Haynes et al. 1976; Iyoho 1978; Klins 1984; McRee 1977; OTA 1978; Rivas et al. 1994; Shaw and Bachu 2002; Taber et al. 1997; Taber 1983), most of which are given in Table 3. The common parameters involved in these criteria are: (1) viscosity and API gravity of oil, (2) reservoir’s oil satura-tion, (3) temperature and pressure of reservoirs, (4) net pay thickness, and (5) permeability.
There have also been numerous studies reporting the effect of various parameters on miscible CO2 flooding. For instance, Sehbi et al. (2001) reported that phase behavior,
diffusion and dispersion are key processes to develop and sustain miscible displacement in a CO2 flood. It was also stated that a uniform pore geometry and pore structure offer a better microscopic displacement efficiency. Shedid (2009) carried out a series of miscible CO2 flooding by considering various modes of reservoir heterogeneity (i.e., fractured reservoirs with different inclination angles, per-meability configurations and the sequence of permeability distributions). The results obtained showed that unfractured reservoirs are better than single-fractured ones to get the good recovery. An oil reservoir with a 30° of inclination angle for a single fracture gives the maximum oil recovery, whilst fractured rocks with a 45° inclination angle offers the lowest recovery. Sahimi (2011) stated that the differ-ence between the viscosity of oil and displacing gas has a strong effect on the efficiency of the miscible displacement. Muggeridge et al. (2014) indicated few limitations for the miscible CO2 flooding such as sensitivity to heterogeneity, poor vertical sweeping efficiency and pressure management. Bikkina et al. (2016) evaluated the effect of reservoir wet-tability and permeability heterogeneity on the performance
Table 2 Implementation of screening criteria by Al-Adasani and Bai (2011) on Pakistan oil reservoirs for selection of EOR method
EOR method Reservoir properties
Oil gravity (API)
Viscosity (cP)
Start oil saturation Permeability (mD)
Porosity (%) Depth (ft) Tempera-ture (°F)
EOR criteria proposed by Al-Adasani and Bai (2011) Miscible flooding 34–44 0–1 0.33–0.55 0.1–100 7–16 4200–6700 95–160 Immiscible flooding 19–36 0–10.5 0.42–0.62 30–300 22–32 1970–5708 120–194 Steam flooding 10–16 3–2000 0.50–0.70 1000–3000 30-38.8 800–1800 80–130 Combustion 19–27 1.44–2 0.50–0.70 10–85 17–25 1575–5000 185–230 Chemical (mainly polymer) 32-42.5 9–75 0.65–0.82 173–875 21–33 2723–3921 108–158
Conventional screening of Pakistan oil fields in north and south North oil field characteristics N1 Sandstone 25 2.1 – 24 – 11,555 210 N2 Limestone 13 2 – 145 – 11,227 205 N3 Limestone 30 0.252 – 4200 – 9784 224 N4 Limestone 33.3 0.27 – 0.19 – 9518 245 N5 Dolomite 26 3 – 126 – 8258 171 N6 Limestone 25 3 – 107 – 7530 202 N7 Sandstone 29 3 – 33 – 8209 185 N8 Limestone 19 3 – 14.5 – 8461 208 N9 Limestone 12 2 – 12 – 7162 210
South oil field characteristics S1 Sandstone 43 0.22 – 186 – 6500 225 S2 Sandstone 43 0.277 – 35 – 6560 230 S3 Sandstone 42 0.4 0.15–0.30 (22%
average)40 9.5–18 (14%
average)7500 250
S4 Sandstone 43 0.3 – 45 – 7545 250 S5 Sandstone 41 0.327 – 60 – 6560 227 S6 Sandstone 45 0.317 – 70 – 7180 230
Journal of Petroleum Exploration and Production Technology
1 3
Tabl
e 3
Scr
eeni
ng c
riter
ia p
ropo
sed
by m
any
rese
arch
ers f
or sc
reen
ing
of re
serv
oirs
suita
ble
for m
isci
ble
CO2 fl
oodi
ng
Scre
enin
g pa
ram
-et
ers
Geff
en
(197
3)Le
win
et
al.
(197
6)
NPC
(H
ayne
s 19
76)
McR
ee
(197
7)Ly
oho
(197
8)O
TA
(197
8)C
ar-
coan
a (1
982)
Tabe
r &
Mar
tin
(198
3)
Tabe
r et a
l. (1
997)
Bra
s-he
ar
et a
l. (1
978)
Klin
s, (1
984)
Goo
d-le
tt et
al.
(198
6)
Riv
as
et a
l. (1
994)
Dia
z et
al.
(199
6)
Fulin
(2
001)
Bac
hu
et a
l. (2
004)
(Al
Ada
sani
an
d B
ai,
2011
)
Dep
th (f
t)–
> 30
00>
2300
> 20
00>
2500
(a) >
7200
< 98
00>
2000
(a) >
4000
––
––
–76
2met
ers
–15
00–
13,3
65
Avg
. 62
30
(b) >
5500
(b) >
3300
(c) >
2500
(c) >
2800
(d) >
2500
Tem
pera
-tu
re (°
F)–
Not
cr
iti-
cal
< 25
0–
––
< 19
5N
ot
criti
-ca
l
–N
ot
criti
-ca
l
Not
cr
iti-
cal
Not
cr
iti-
cal
150
160
–32
–121
82–2
57
Avg
. 13
8.1
Orig
inal
pr
essu
re
(psi
a)
> 11
00>
1500
––
––
> 12
00–
–>
1500
B
HP
> 15
00
BH
P–
––
–>
1102
–
Perm
e-ab
ility
(m
D)
–N
ot
criti
-ca
l
–>
5>
10–
> 1
Not
cr
iti-
cal
–N
ot
criti
-ca
l
Not
cr
iti-
cal
Not
cr
iti-
cal
300
300
––
1.5–
4500
A
vg.
209.
7N
ot c
ritic
al
Oil gr
avity
(°
API
)
> 30
> 30
> 27
> 35
30–4
5(a
) < 27
> 40
> 26
(a) 22
–27.
9>
28>
30>
25>
36>
37>
2227
–48
22–4
5 A
vg. 3
7(b
) 27–
30(b
) 28–3
1.9
(c) >
30(c
) 32–3
9.9
(d) >
40V
isco
sity
(c
P)<
312
< 10
< 5
< 10
< 12
< 2
< 15
< 10
< 12
< 12
< 15
––
< 10
–A
vg. 2
.08
Frac
tion
of o
il re
mai
n-in
g
> 0.
25>
0.25
–>
0.25
> 0.
25–
> 0.
30>
0.30
> 0.
200.
25>
0.25
> 0.
300.
600.
60>
20>
0.25
15–8
9 A
vg. 4
6>
30
Net
pay
th
ick-
ness
(ft)
––
––
––
––
Thin
un
less
di
ppin
g
Not
cr
iti-
cal
Not
cr
iti-
cal
Thin
un
less
di
p-pi
ng
4050
––
Wid
e ra
nge
Journal of Petroleum Exploration and Production Technology
1 3
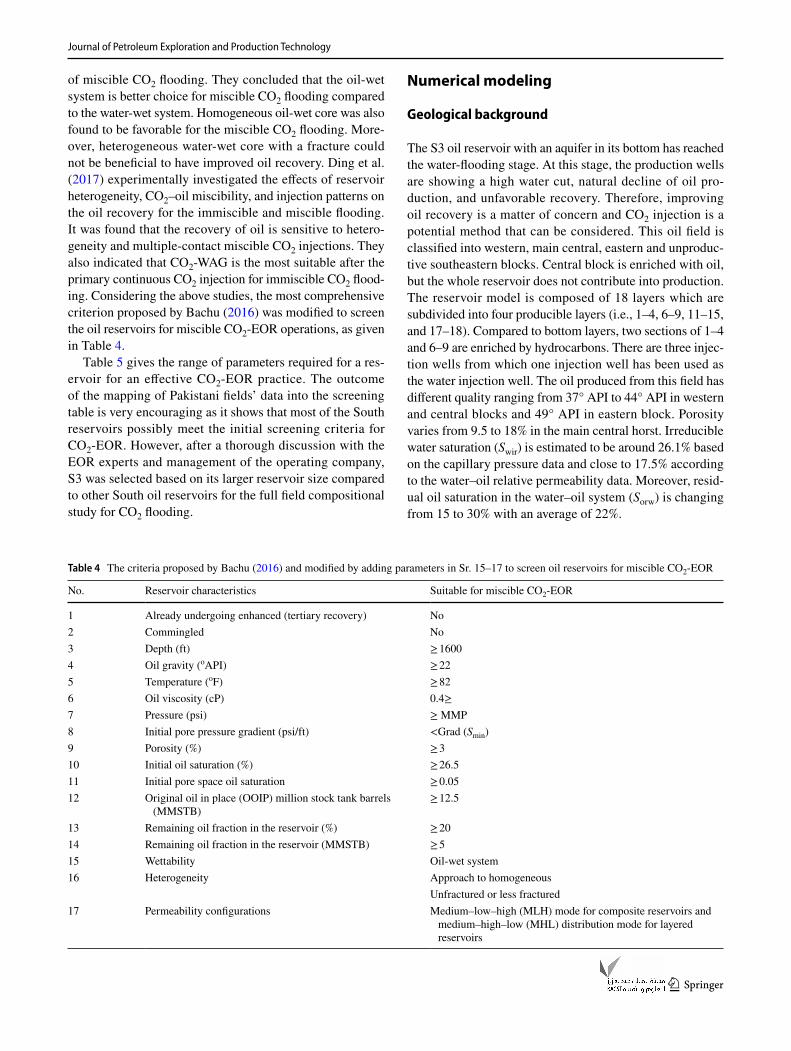
of miscible CO2 flooding. They concluded that the oil-wet system is better choice for miscible CO2 flooding compared to the water-wet system. Homogeneous oil-wet core was also found to be favorable for the miscible CO2 flooding. More-over, heterogeneous water-wet core with a fracture could not be beneficial to have improved oil recovery. Ding et al. (2017) experimentally investigated the effects of reservoir heterogeneity, CO2–oil miscibility, and injection patterns on the oil recovery for the immiscible and miscible flooding. It was found that the recovery of oil is sensitive to hetero-geneity and multiple-contact miscible CO2 injections. They also indicated that CO2-WAG is the most suitable after the primary continuous CO2 injection for immiscible CO2 flood-ing. Considering the above studies, the most comprehensive criterion proposed by Bachu (2016) was modified to screen the oil reservoirs for miscible CO2-EOR operations, as given in Table 4.
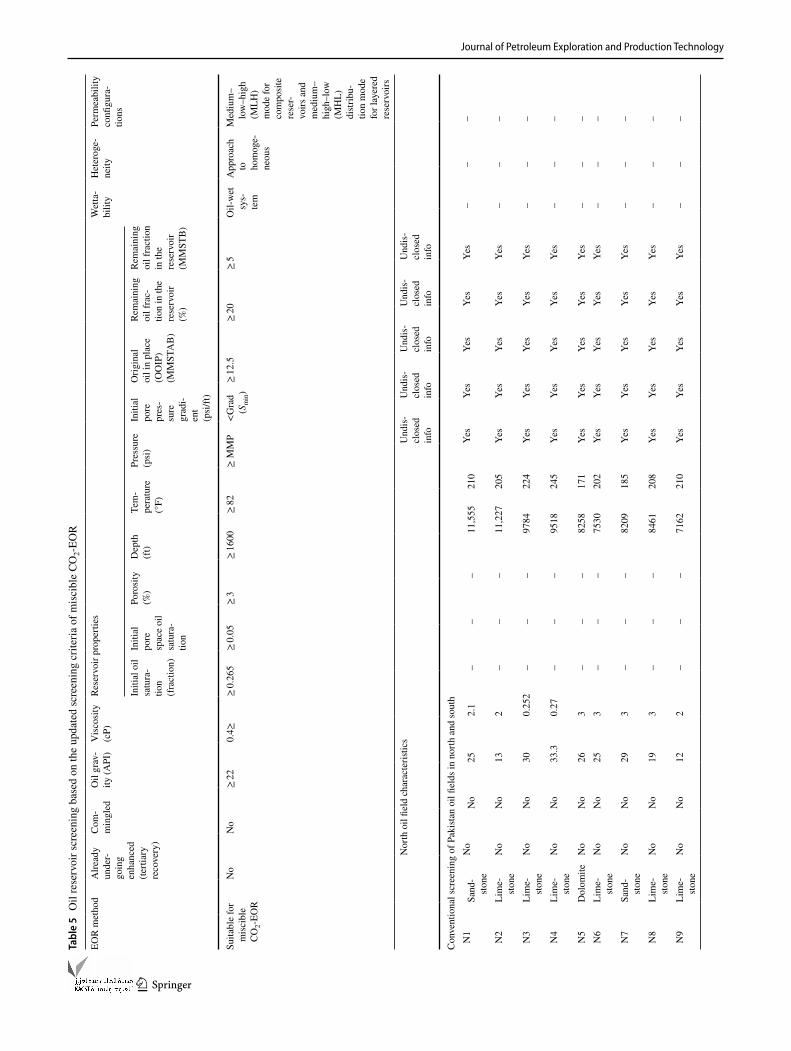
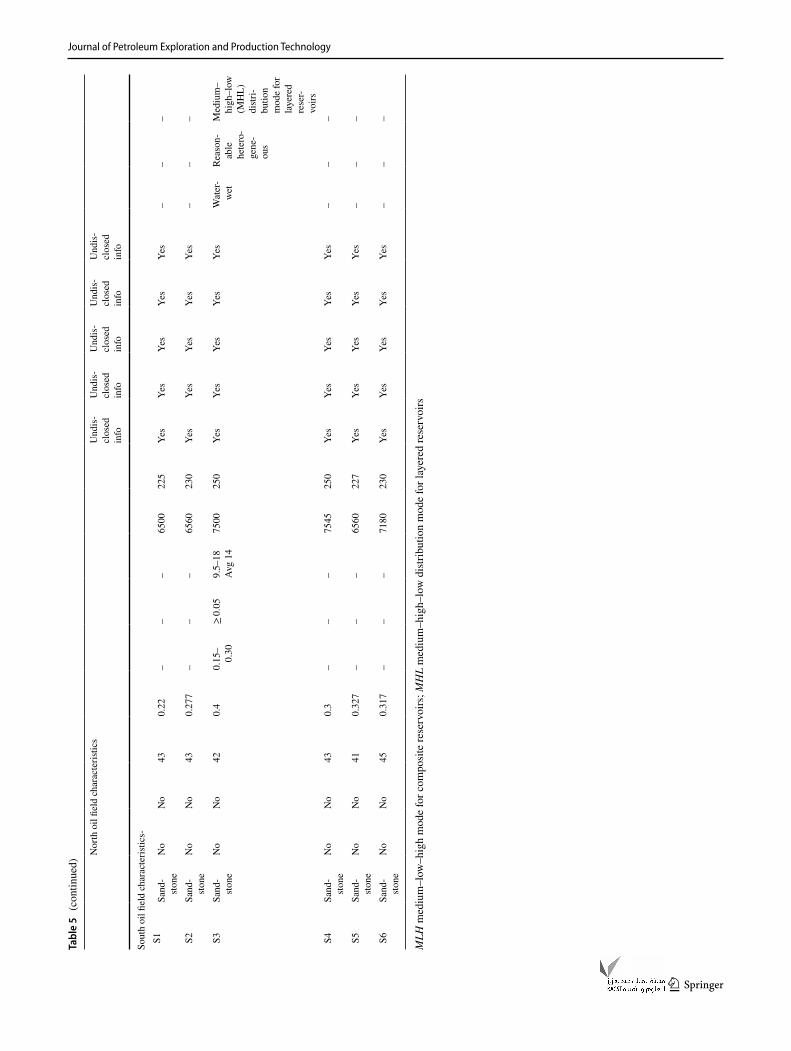
Table 5 gives the range of parameters required for a res-ervoir for an effective CO2-EOR practice. The outcome of the mapping of Pakistani fields’ data into the screening table is very encouraging as it shows that most of the South reservoirs possibly meet the initial screening criteria for CO2-EOR. However, after a thorough discussion with the EOR experts and management of the operating company, S3 was selected based on its larger reservoir size compared to other South oil reservoirs for the full field compositional study for CO2 flooding.
Numerical modeling
Geological background
The S3 oil reservoir with an aquifer in its bottom has reached the water-flooding stage. At this stage, the production wells are showing a high water cut, natural decline of oil pro-duction, and unfavorable recovery. Therefore, improving oil recovery is a matter of concern and CO2 injection is a potential method that can be considered. This oil field is classified into western, main central, eastern and unproduc-tive southeastern blocks. Central block is enriched with oil, but the whole reservoir does not contribute into production. The reservoir model is composed of 18 layers which are subdivided into four producible layers (i.e., 1–4, 6–9, 11–15, and 17–18). Compared to bottom layers, two sections of 1–4 and 6–9 are enriched by hydrocarbons. There are three injec-tion wells from which one injection well has been used as the water injection well. The oil produced from this field has different quality ranging from 37° API to 44° API in western and central blocks and 49° API in eastern block. Porosity varies from 9.5 to 18% in the main central horst. Irreducible water saturation (Swir) is estimated to be around 26.1% based on the capillary pressure data and close to 17.5% according to the water–oil relative permeability data. Moreover, resid-ual oil saturation in the water–oil system (Sorw) is changing from 15 to 30% with an average of 22%.
Table 4 The criteria proposed by Bachu (2016) and modified by adding parameters in Sr. 15–17 to screen oil reservoirs for miscible CO2-EOR
No. Reservoir characteristics Suitable for miscible CO2-EOR
1 Already undergoing enhanced (tertiary recovery) No2 Commingled No3 Depth (ft) ≥ 16004 Oil gravity (oAPI) ≥ 225 Temperature (oF) ≥ 826 Oil viscosity (cP) 0.4≥7 Pressure (psi) ≥ MMP8 Initial pore pressure gradient (psi/ft) <Grad (Smin)9 Porosity (%) ≥ 310 Initial oil saturation (%) ≥ 26.511 Initial pore space oil saturation ≥ 0.0512 Original oil in place (OOIP) million stock tank barrels
(MMSTB)≥ 12.5
13 Remaining oil fraction in the reservoir (%) ≥ 2014 Remaining oil fraction in the reservoir (MMSTB) ≥ 515 Wettability Oil-wet system16 Heterogeneity Approach to homogeneous
Unfractured or less fractured17 Permeability configurations Medium–low–high (MLH) mode for composite reservoirs and
medium–high–low (MHL) distribution mode for layered reservoirs
Journal of Petroleum Exploration and Production Technology
1 3
Tabl
e 5
Oil
rese
rvoi
r scr
eeni
ng b
ased
on
the
upda
ted
scre
enin
g cr
iteria
of m
isci
ble
CO2-
EOR
EOR
met
hod
Alre
ady
unde
r-go
ing
enha
nced
(te
rtiar
y re
cove
ry)
Com
-m
ingl
edO
il gr
av-
ity (A
PI)
Vis
cosi
ty
(cP)
Rese
rvoi
r pro
perti
esW
etta
-bi
lity
Het
erog
e-ne
ityPe
rmea
bilit
y co
nfigu
ra-
tions
Initi
al o
il sa
tura
-tio
n (f
ract
ion)
Initi
al
pore
sp
ace
oil
satu
ra-
tion
Poro
sity
(%
)D
epth
(f
t)Te
m-
pera
ture
(°
F)
Pres
sure
(p
si)
Initi
al
pore
pr
es-
sure
gr
adi-
ent
(psi
/ft)
Orig
inal
oi
l in
plac
e (O
OIP
) (M
MST
AB
)
Rem
aini
ng
oil f
rac-
tion
in th
e re
serv
oir
(%)
Rem
aini
ng
oil f
ract
ion
in th
e re
serv
oir
(MM
STB
)
Suita
ble
for
mis
cibl
e CO
2-EO
R
No
No
≥ 22
0.4≥
≥ 0.
265
≥ 0.
05≥
3≥
1600
≥ 82
≥ M
MP
<G
rad
(Sm
in)
≥ 12
.5≥
20≥
5O
il-w
et
sys-
tem
App
roac
h to
ho
mog
e-ne
ous
Med
ium
–lo
w–h
igh
(MLH
) m
ode
for
com
posi
te
rese
r-vo
irs a
nd
med
ium
–hi
gh–l
ow
(MH
L)
distr
ibu-
tion
mod
e fo
r lay
ered
re
serv
oirs
Nor
th o
il fie
ld c
hara
cter
istic
sU
ndis
-cl
osed
in
fo
Und
is-
clos
ed
info
Und
is-
clos
ed
info
Und
is-
clos
ed
info
Und
is-
clos
ed
info
Con
vent
iona
l scr
eeni
ng o
f Pak
istan
oil
field
s in
north
and
sout
h N
1Sa
nd-
stone
No
No
252.
1–
––
11,5
5521
0Ye
sYe
sYe
sYe
sYe
s–
––
N2
Lim
e-sto
neN
oN
o13
2–
––
11,2
2720
5Ye
sYe
sYe
sYe
sYe
s–
––
N3
Lim
e-sto
neN
oN
o30
0.25
2–
––
9784
224
Yes
Yes
Yes
Yes
Yes
––
–
N4
Lim
e-sto
neN
oN
o33
.30.
27–
––
9518
245
Yes
Yes
Yes
Yes
Yes
––
–
N5
Dol
omite
No
No
263
––
–82
5817
1Ye
sYe
sYe
sYe
sYe
s–
––
N6
Lim
e-sto
neN
oN
o25
3–
––
7530
202
Yes
Yes
Yes
Yes
Yes
––
–
N7
Sand
-sto
neN
oN
o29
3–
––
8209
185
Yes
Yes
Yes
Yes
Yes
––
–
N8
Lim
e-sto
neN
oN
o19
3–
––
8461
208
Yes
Yes
Yes
Yes
Yes
––
–
N9
Lim
e-sto
neN
oN
o12
2–
––
7162
210
Yes
Yes
Yes
Yes
Yes
––
–
Journal of Petroleum Exploration and Production Technology
1 3
Tabl
e 5
(con
tinue
d)
Nor
th o
il fie
ld c
hara
cter
istic
sU
ndis
-cl
osed
in
fo
Und
is-
clos
ed
info
Und
is-
clos
ed
info
Und
is-
clos
ed
info
Und
is-
clos
ed
info
Sout
h oi
l fiel
d ch
arac
teris
tics-
S1
Sand
-sto
neN
oN
o43
0.22
––
–65
0022
5Ye
sYe
sYe
sYe
sYe
s–
––
S2
Sand
-sto
neN
oN
o43
0.27
7–
––
6560
230
Yes
Yes
Yes
Yes
Yes
––
–
S3
Sand
-sto
neN
oN
o42
0.4
0.15
–0.
30≥
0.05
9.5–
18A
vg 1
475
0025
0Ye
sYe
sYe
sYe
sYe
sW
ater
-w
etRe
ason
-ab
le
hete
ro-
gene
-ou
s
Med
ium
–hi
gh–l
ow
(MH
L)
distr
i-bu
tion
mod
e fo
r la
yere
d re
ser-
voirs
S4
Sand
-sto
neN
oN
o43
0.3
––
–75
4525
0Ye
sYe
sYe
sYe
sYe
s–
––
S5
Sand
-sto
neN
oN
o41
0.32
7–
––
6560
227
Yes
Yes
Yes
Yes
Yes
––
–
S6
Sand
-sto
neN
oN
o45
0.31
7–
––
7180
230
Yes
Yes
Yes
Yes
Yes
––
–
MLH
med
ium
–low
–hig
h m
ode
for c
ompo
site
rese
rvoi
rs; M
HL
med
ium
–hig
h–lo
w d
istrib
utio
n m
ode
for l
ayer
ed re
serv
oirs
Journal of Petroleum Exploration and Production Technology
1 3
Data sources and model setup
A reservoir model was built for the purpose of this study consisting of 43,200 grid cells with 30, 80 and 18 grids in X-, Y- and Z-directions, respectively. The reservoir with a total number of 18 layers with the thickness of 240 m, an initial reservoir pressure of 3238 psia, oil saturation of 80% and connate water saturation of 20% was considered. The bubble point pressure obtained from the pressure–vol-ume–temperature (PVT) analysis was set to be 1722 psia at 246 °F. An aquifer was put at the bottom of the reservoir using the Carter–Tracy analytical model. Characterization of the reservoir fluid was done before simulating the phase behavior. Component characterization including the lump-ing and splitting theory was modeled to observe the labora-tory phase behavior so that a representative PVT fluid model could be developed based on a reliable match between the observed and the calculated data. Widely accepted three-parameter Peng–Robinson (PR) Equation of State (EoS) (O’Reilly 2009) was calibrated/regressed to represent the fluid model in the compositional simulation. Initial bottom-hole sample data are listed in Table 6.
In the very first step, fluid systems (mixtures) represented by pure and pseudocomponents (Whitson and Brulé 2000) were initially assessed for critical volume, critical tempera-ture, critical pressure, acentric factor, volume shift param-eter, and binary interaction coefficients. The observed and experimental data were compared by regression for tuning the properties for compositional modeling and to accu-rately estimate the fluid phase behavior as well as the vapor liquid equilibria (VLE). To decrease the simulation time, C1–C3 and multiple isomers were clustered into a single or
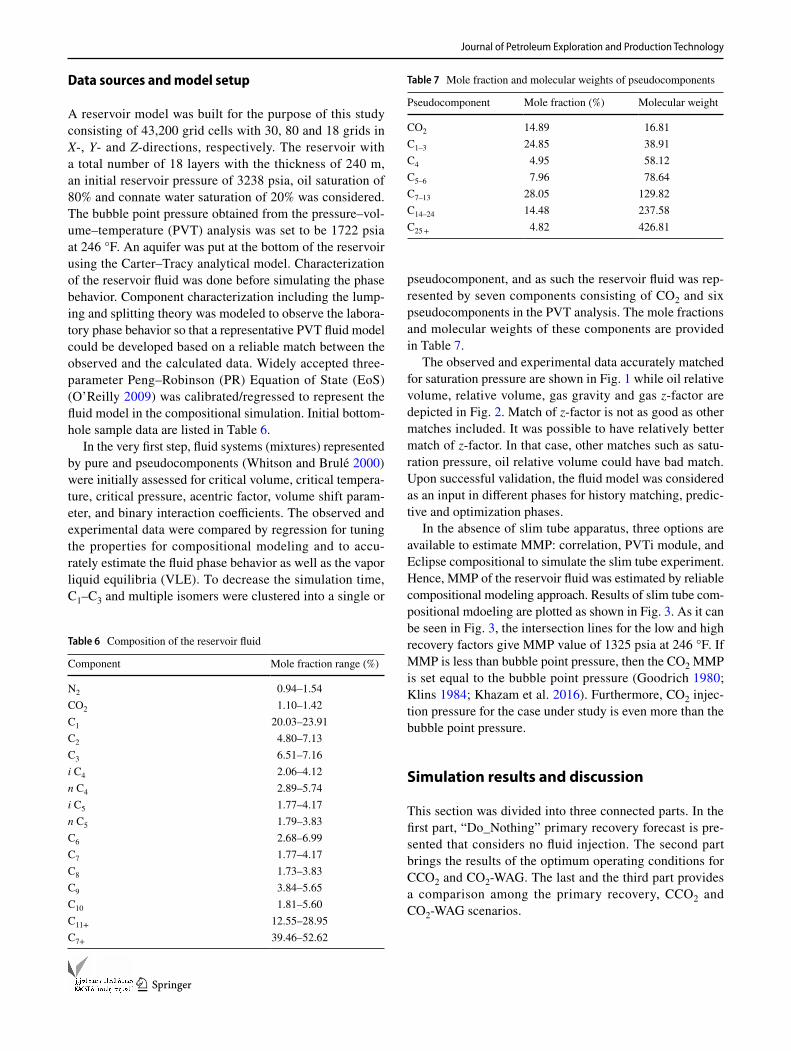
pseudocomponent, and as such the reservoir fluid was rep-resented by seven components consisting of CO2 and six pseudocomponents in the PVT analysis. The mole fractions and molecular weights of these components are provided in Table 7.
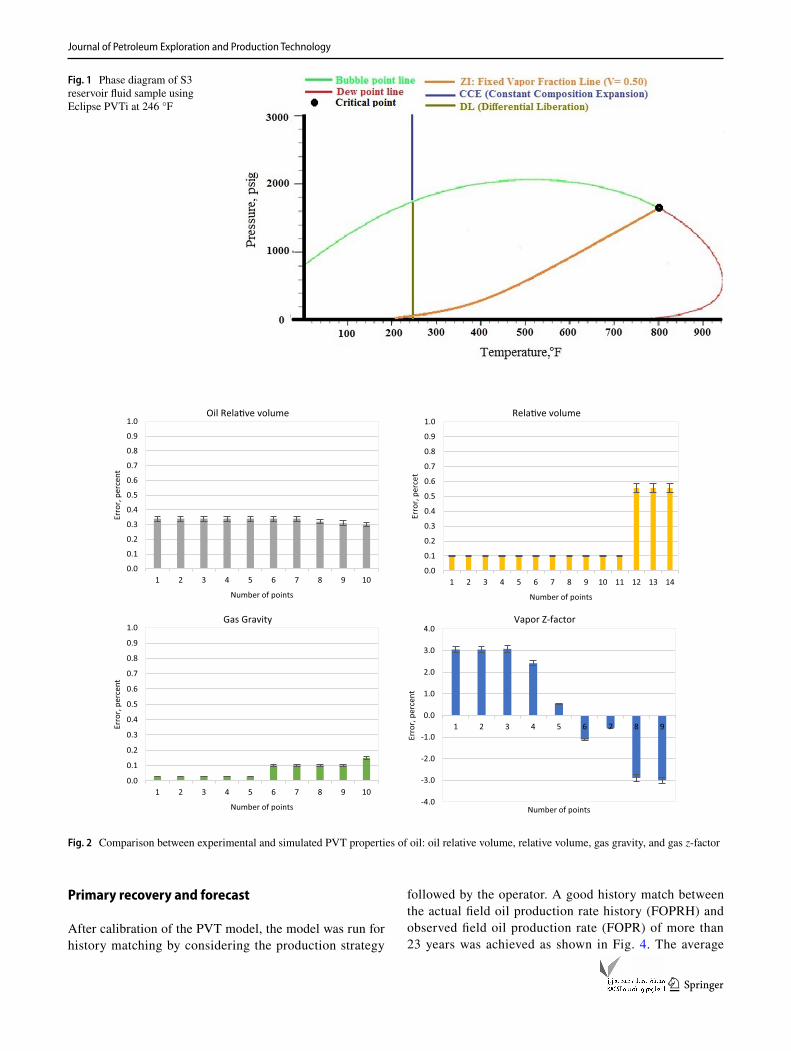
The observed and experimental data accurately matched for saturation pressure are shown in Fig. 1 while oil relative volume, relative volume, gas gravity and gas z-factor are depicted in Fig. 2. Match of z-factor is not as good as other matches included. It was possible to have relatively better match of z-factor. In that case, other matches such as satu-ration pressure, oil relative volume could have bad match. Upon successful validation, the fluid model was considered as an input in different phases for history matching, predic-tive and optimization phases.
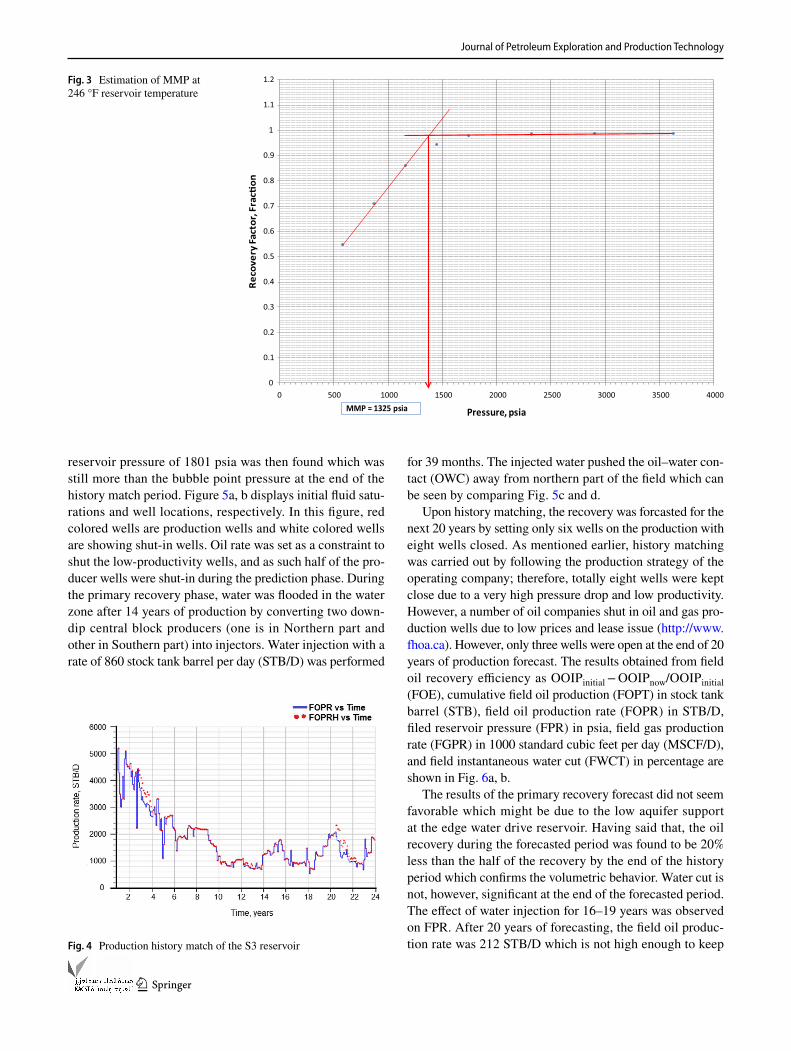
In the absence of slim tube apparatus, three options are available to estimate MMP: correlation, PVTi module, and Eclipse compositional to simulate the slim tube experiment. Hence, MMP of the reservoir fluid was estimated by reliable compositional modeling approach. Results of slim tube com-positional mdoeling are plotted as shown in Fig. 3. As it can be seen in Fig. 3, the intersection lines for the low and high recovery factors give MMP value of 1325 psia at 246 °F. If MMP is less than bubble point pressure, then the CO2 MMP is set equal to the bubble point pressure (Goodrich 1980; Klins 1984; Khazam et al. 2016). Furthermore, CO2 injec-tion pressure for the case under study is even more than the bubble point pressure.
Simulation results and discussion
This section was divided into three connected parts. In the first part, “Do_Nothing” primary recovery forecast is pre-sented that considers no fluid injection. The second part brings the results of the optimum operating conditions for CCO2 and CO2-WAG. The last and the third part provides a comparison among the primary recovery, CCO2 and CO2-WAG scenarios.
Table 6 Composition of the reservoir fluid
Component Mole fraction range (%)
N2 0.94–1.54CO2 1.10–1.42C1 20.03–23.91C2 4.80–7.13C3 6.51–7.16i C4 2.06–4.12n C4 2.89–5.74i C5 1.77–4.17n C5 1.79–3.83C6 2.68–6.99C7 1.77–4.17C8 1.73–3.83C9 3.84–5.65C10 1.81–5.60C11+ 12.55–28.95C7+ 39.46–52.62
Table 7 Mole fraction and molecular weights of pseudocomponents
Pseudocomponent Mole fraction (%) Molecular weight
CO2 14.89 16.81C1–3 24.85 38.91C4 4.95 58.12C5–6 7.96 78.64C7–13 28.05 129.82C14–24 14.48 237.58C25 + 4.82 426.81
Journal of Petroleum Exploration and Production Technology
1 3
Primary recovery and forecast
After calibration of the PVT model, the model was run for history matching by considering the production strategy
followed by the operator. A good history match between the actual field oil production rate history (FOPRH) and observed field oil production rate (FOPR) of more than 23 years was achieved as shown in Fig. 4. The average
Fig. 1 Phase diagram of S3 reservoir fluid sample using Eclipse PVTi at 246 °F
0.0
0.1
0.2
0.3
0.4
0.5
0.6
0.7
0.8
0.9
1.0
1 2 3 4 5 6 7 8 9 10
Erro
r, pe
rcen
t
Number of points
Oil Rela�ve volume
0.0
0.1
0.2
0.3
0.4
0.5
0.6
0.7
0.8
0.9
1.0
1 2 3 4 5 6 7 8 9 10 11 12 13 14
Erro
r, pe
rcet
Number of points
Rela�ve volume
0.0
0.1
0.2
0.3
0.4
0.5
0.6
0.7
0.8
0.9
1.0
1 2 3 4 5 6 7 8 9 10
Erro
r, pe
rcen
t
Number of points
Gas Gravity
-4.0
-3.0
-2.0
-1.0
0.0
1.0
2.0
3.0
4.0
1 2 3 4 5 6 7 8 9
Erro
r, pe
rcen
t
Number of points
Vapor Z-factor
Fig. 2 Comparison between experimental and simulated PVT properties of oil: oil relative volume, relative volume, gas gravity, and gas z-factor
Journal of Petroleum Exploration and Production Technology
1 3
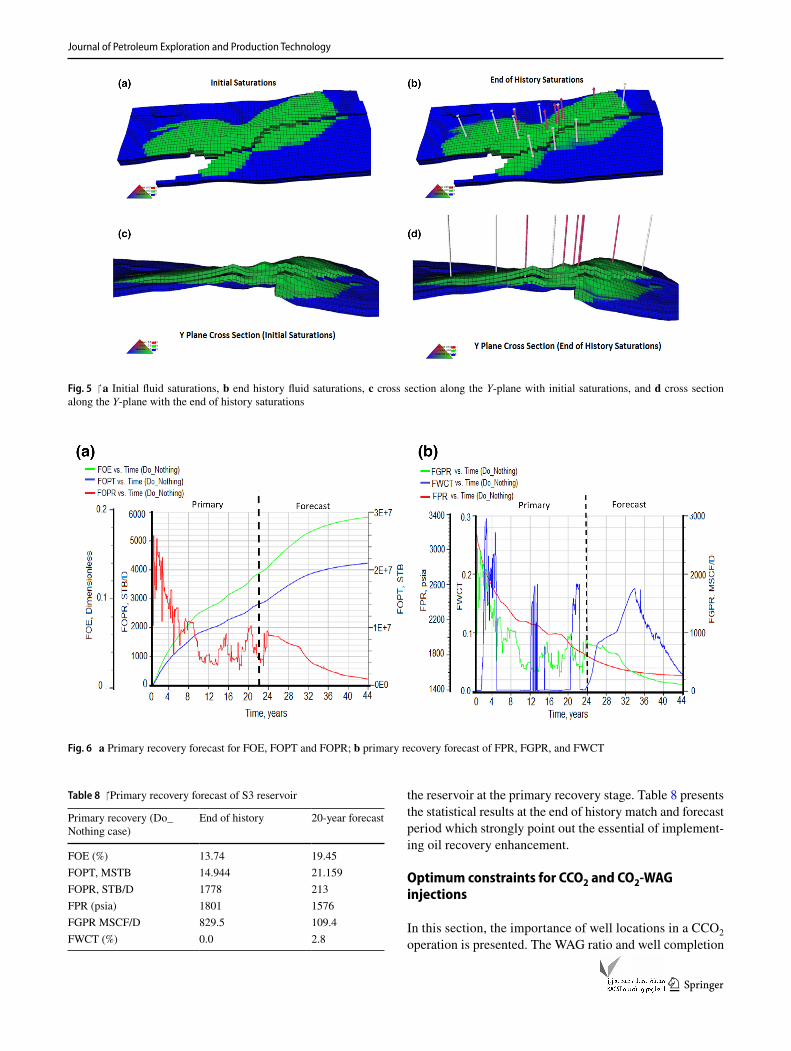
reservoir pressure of 1801 psia was then found which was still more than the bubble point pressure at the end of the history match period. Figure 5a, b displays initial fluid satu-rations and well locations, respectively. In this figure, red colored wells are production wells and white colored wells are showing shut-in wells. Oil rate was set as a constraint to shut the low-productivity wells, and as such half of the pro-ducer wells were shut-in during the prediction phase. During the primary recovery phase, water was flooded in the water zone after 14 years of production by converting two down-dip central block producers (one is in Northern part and other in Southern part) into injectors. Water injection with a rate of 860 stock tank barrel per day (STB/D) was performed
for 39 months. The injected water pushed the oil–water con-tact (OWC) away from northern part of the field which can be seen by comparing Fig. 5c and d.
Upon history matching, the recovery was forcasted for the next 20 years by setting only six wells on the production with eight wells closed. As mentioned earlier, history matching was carried out by following the production strategy of the operating company; therefore, totally eight wells were kept close due to a very high pressure drop and low productivity. However, a number of oil companies shut in oil and gas pro-duction wells due to low prices and lease issue (http://www.fhoa.ca). However, only three wells were open at the end of 20 years of production forecast. The results obtained from field oil recovery efficiency as OOIPinitial − OOIPnow/OOIPinitial (FOE), cumulative field oil production (FOPT) in stock tank barrel (STB), field oil production rate (FOPR) in STB/D, filed reservoir pressure (FPR) in psia, field gas production rate (FGPR) in 1000 standard cubic feet per day (MSCF/D), and field instantaneous water cut (FWCT) in percentage are shown in Fig. 6a, b.
The results of the primary recovery forecast did not seem favorable which might be due to the low aquifer support at the edge water drive reservoir. Having said that, the oil recovery during the forecasted period was found to be 20% less than the half of the recovery by the end of the history period which confirms the volumetric behavior. Water cut is not, however, significant at the end of the forecasted period. The effect of water injection for 16–19 years was observed on FPR. After 20 years of forecasting, the field oil produc-tion rate was 212 STB/D which is not high enough to keep
Fig. 3 Estimation of MMP at 246 °F reservoir temperature
0
0.1
0.2
0.3
0.4
0.5
0.6
0.7
0.8
0.9
1
1.1
1.2
0 500 1000 1500 2000 2500 3000 3500 4000
Reco
very
Fact
or, F
rac�
on
Pressure, psiaMMP = 1325 psia
Fig. 4 Production history match of the S3 reservoir
Journal of Petroleum Exploration and Production Technology
1 3
the reservoir at the primary recovery stage. Table 8 presents the statistical results at the end of history match and forecast period which strongly point out the essential of implement-ing oil recovery enhancement.
Optimum constraints for CCO2 and CO2‑WAG injections
In this section, the importance of well locations in a CCO2 operation is presented. The WAG ratio and well completion
Fig. 5 a Initial fluid saturations, b end history fluid saturations, c cross section along the Y-plane with initial saturations, and d cross section along the Y-plane with the end of history saturations
Fig. 6 a Primary recovery forecast for FOE, FOPT and FOPR; b primary recovery forecast of FPR, FGPR, and FWCT
Table 8 Primary recovery forecast of S3 reservoir
Primary recovery (Do_Nothing case)
End of history 20-year forecast
FOE (%) 13.74 19.45FOPT, MSTB 14.944 21.159FOPR, STB/D 1778 213FPR (psia) 1801 1576FGPR MSCF/D 829.5 109.4FWCT (%) 0.0 2.8
Journal of Petroleum Exploration and Production Technology
1 3
strategy, in different layers for CO2-WAG, are also discussed by numerical modeling using the data given in Table 9.
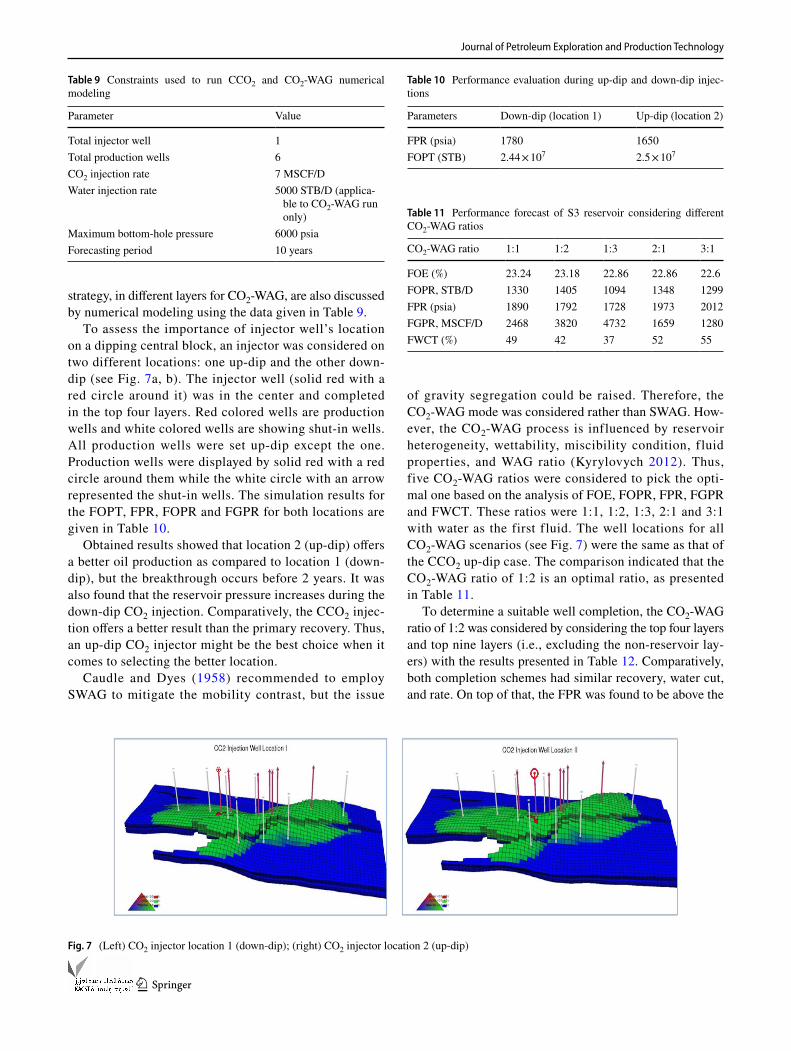
To assess the importance of injector well’s location on a dipping central block, an injector was considered on two different locations: one up-dip and the other down-dip (see Fig. 7a, b). The injector well (solid red with a red circle around it) was in the center and completed in the top four layers. Red colored wells are production wells and white colored wells are showing shut-in wells. All production wells were set up-dip except the one. Production wells were displayed by solid red with a red circle around them while the white circle with an arrow represented the shut-in wells. The simulation results for the FOPT, FPR, FOPR and FGPR for both locations are given in Table 10.
Obtained results showed that location 2 (up-dip) offers a better oil production as compared to location 1 (down-dip), but the breakthrough occurs before 2 years. It was also found that the reservoir pressure increases during the down-dip CO2 injection. Comparatively, the CCO2 injec-tion offers a better result than the primary recovery. Thus, an up-dip CO2 injector might be the best choice when it comes to selecting the better location.
Caudle and Dyes (1958) recommended to employ SWAG to mitigate the mobility contrast, but the issue
of gravity segregation could be raised. Therefore, the CO2-WAG mode was considered rather than SWAG. How-ever, the CO2-WAG process is influenced by reservoir heterogeneity, wettability, miscibility condition, fluid properties, and WAG ratio (Kyrylovych 2012). Thus, five CO2-WAG ratios were considered to pick the opti-mal one based on the analysis of FOE, FOPR, FPR, FGPR and FWCT. These ratios were 1:1, 1:2, 1:3, 2:1 and 3:1 with water as the first fluid. The well locations for all CO2-WAG scenarios (see Fig. 7) were the same as that of the CCO2 up-dip case. The comparison indicated that the CO2-WAG ratio of 1:2 is an optimal ratio, as presented in Table 11.
To determine a suitable well completion, the CO2-WAG ratio of 1:2 was considered by considering the top four layers and top nine layers (i.e., excluding the non-reservoir lay-ers) with the results presented in Table 12. Comparatively, both completion schemes had similar recovery, water cut, and rate. On top of that, the FPR was found to be above the
Table 9 Constraints used to run CCO2 and CO2-WAG numerical modeling
Parameter Value
Total injector well 1Total production wells 6CO2 injection rate 7 MSCF/DWater injection rate 5000 STB/D (applica-
ble to CO2-WAG run only)
Maximum bottom-hole pressure 6000 psiaForecasting period 10 years
Fig. 7 (Left) CO2 injector location 1 (down-dip); (right) CO2 injector location 2 (up-dip)
Table 10 Performance evaluation during up-dip and down-dip injec-tions
Parameters Down-dip (location 1) Up-dip (location 2)
FPR (psia) 1780 1650FOPT (STB) 2.44 × 10⁷ 2.5 × 10⁷
Table 11 Performance forecast of S3 reservoir considering different CO2-WAG ratios
CO2-WAG ratio 1:1 1:2 1:3 2:1 3:1
FOE (%) 23.24 23.18 22.86 22.86 22.6FOPR, STB/D 1330 1405 1094 1348 1299FPR (psia) 1890 1792 1728 1973 2012FGPR, MSCF/D 2468 3820 4732 1659 1280FWCT (%) 49 42 37 52 55
Journal of Petroleum Exploration and Production Technology
1 3
bubble point pressure which indicated that the top four layers must be chosen for recovery optimization.
Optimized field oil recovery
To evaluate the scenario of an optimized recovery in the reservoir understudy, in terms of a suitable recovery phase (i.e., Do_Nothing for primary, while CCO2, and CO2-WAG for tertiary), three models were run. The well locations for producers and injector were similar to that of CCO2 case. The run details of the models are given in Table 13.
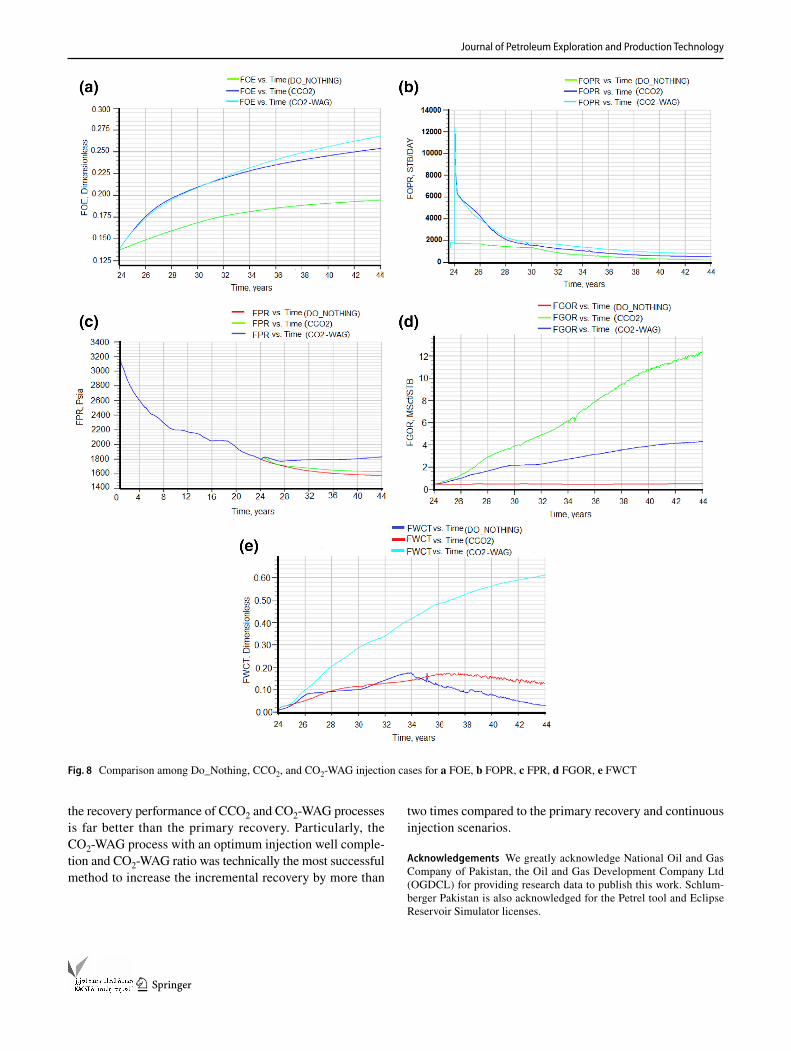
The field was put on production for 23 years and fore-casting the performance was made for the next 20 years. Figure 8a shows the FOE for all three cases. As it is shown in Fig. 8, it seems that the recovery performance of both CCO2 and CO2-WAG cases is more promising than the pri-mary recovery for the first 6 years. The CO2-WAG model is then resulting in a favorable recovery which is twofold better than Do_Nothing and CCO2 cases. Figure 8b compares the FOPR of different recovery phases. Likewise, the overall performance of CO2-WAG is more favorable than CCO2 and Do_Nothing. FPR versus time by various processes is shown in Fig. 8c.
It is observed that there is a depletion mechanism under the primary recovery phase (Do_Nothing). The pressure drop of 225 psi and a total pressure of 1576 psia were observed at the end of the forecasting period. It seems from the pressure trends that CO2 injection process slightly
contributes to stabilizing the pressure, and as such the reser-voir pressure in the forecasting period is following the same trend as that of the Do_Nothing case. A pressure drop of 172 psi and a total pressure of 1629 psia were observed at the end of forecasting period. On the contrary, the CO2-WAG pro-cess was found to be a successful injection strategy to main-tain the field pressure at 1830 psi at the end of the forecast-ing period. These results are aligned with the performance of CO2-WAG published earlier by Caudle and Dyes (1958) and Mousavifar et al. (2012). The field gas oil ratios (FGOR) in MSCF/STB of all three cases are plotted in Fig. 8d.
It is interesting to see high and elevated gas oil ratios (GOR) in the field by the CO2 injection compared to other two cases, which could be due to the position of well loca-tions. The CO2-WAG injection, on the other hand, was offering an acceptable FGOR by enhancing the frontal pro-file via reducing channeling, gravity override, and relative permeability to gas. In the beginning of the simulation (at 24 years), the water cut was negligible and close to 1% as shown in Fig. 8e.
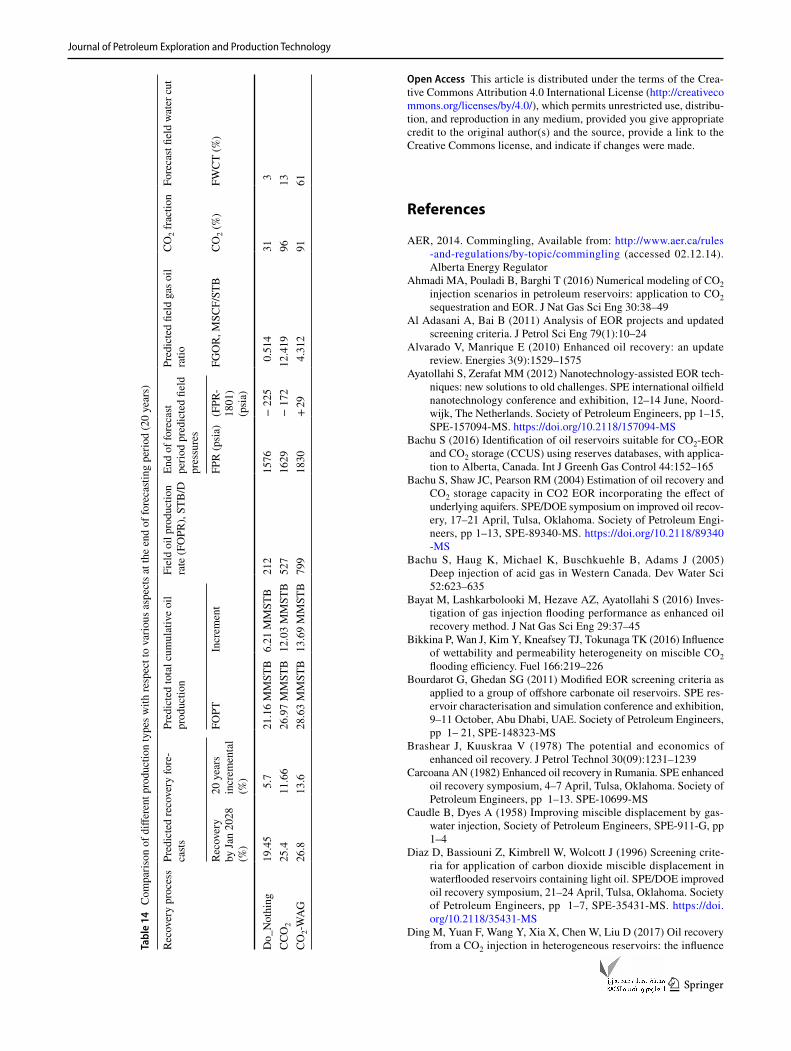
Form Fig. 8e, it can be concluded that the FWCT by the primary (Do_Nothing) process gradually increases to almost 0.18 and then started to decrease with the same rate until the value of 0.03 is reached at the end of fore-casting period. The trend of the FWCT in of the CCO2 was like Do_Nothing case between 24 and 35 years, but its decline rate was much slower, reaching 0.13 at the end of simulation run. The FWCT in the CO2-WAG case increased at a higher rate compared to the other two cases. However, it gave a manageable FWCT level during the forecasting period, thereby not affecting the superior recovery performance of the process. Table 14 compares simulated vectors of all three cases at the end of forecast-ing period (20 years). By taking this comparison into con-sideration, the CO2-WAG process was technically found highly suitable to enhance the recovery compared to other two cases.
Conclusion
Oil reservoirs have a naturally low recovery factor. The mis-cible CO2 displacement mechanism is one of the methods in this scenario which can assist to improve the recovery sig-nificantly. Preliminary screening for CO2-EOR is an essen-tial step to determine a suitable oil reservoir for a detailed assessment. However, wettability, heterogeneity and perme-ability configurations are important parameters that should be included in the screening criteria of miscible CO2 flood-ing. The S3 reservoir was found to be a potential candidate based on the updated screening criteria. Numerical modeling of injection strategy for miscible CO2 flooding shows that
Table 12 CO2-WAG performance in case of different completion schemes of the injector well
CO2-WAG completion layers Top four layers Top nine layers
FOE (%) 23 24FOPR, STB/D 1406 1271FPR (psia) 1792 1698FGPR, MSCF/D 3816 4761FWCT (%) 41.9 42
Table 13 Constraints used to run CCO2 and CO2-WAG modeling
Parameter Value
Total injector well 1Total production wells 6CO2 injection rate 7 MSCF/DWater injection rate 5000 STB/D (applica-
ble to CO2-WAG run only)
CO2-WAG ratio 1:2 (water as first fluid)Maximum bottom-hole pressure 6000 psiaForecasting period 20 years
Journal of Petroleum Exploration and Production Technology
1 3
the recovery performance of CCO2 and CO2-WAG processes is far better than the primary recovery. Particularly, the CO2-WAG process with an optimum injection well comple-tion and CO2-WAG ratio was technically the most successful method to increase the incremental recovery by more than
two times compared to the primary recovery and continuous injection scenarios.
Acknowledgements We greatly acknowledge National Oil and Gas Company of Pakistan, the Oil and Gas Development Company Ltd (OGDCL) for providing research data to publish this work. Schlum-berger Pakistan is also acknowledged for the Petrel tool and Eclipse Reservoir Simulator licenses.
Fig. 8 Comparison among Do_Nothing, CCO2, and CO2-WAG injection cases for a FOE, b FOPR, c FPR, d FGOR, e FWCT
Journal of Petroleum Exploration and Production Technology
1 3
Open Access This article is distributed under the terms of the Crea-tive Commons Attribution 4.0 International License (http://creat iveco mmons .org/licen ses/by/4.0/), which permits unrestricted use, distribu-tion, and reproduction in any medium, provided you give appropriate credit to the original author(s) and the source, provide a link to the Creative Commons license, and indicate if changes were made.
References
AER, 2014. Commingling, Available from: http://www.aer.ca/rules -and-regul ation s/by-topic /commi nglin g (accessed 02.12.14). Alberta Energy Regulator
Ahmadi MA, Pouladi B, Barghi T (2016) Numerical modeling of CO2 injection scenarios in petroleum reservoirs: application to CO2 sequestration and EOR. J Nat Gas Sci Eng 30:38–49
Al Adasani A, Bai B (2011) Analysis of EOR projects and updated screening criteria. J Petrol Sci Eng 79(1):10–24
Alvarado V, Manrique E (2010) Enhanced oil recovery: an update review. Energies 3(9):1529–1575
Ayatollahi S, Zerafat MM (2012) Nanotechnology-assisted EOR tech-niques: new solutions to old challenges. SPE international oilfield nanotechnology conference and exhibition, 12–14 June, Noord-wijk, The Netherlands. Society of Petroleum Engineers, pp 1–15, SPE-157094-MS. https ://doi.org/10.2118/15709 4-MS
Bachu S (2016) Identification of oil reservoirs suitable for CO2-EOR and CO2 storage (CCUS) using reserves databases, with applica-tion to Alberta, Canada. Int J Greenh Gas Control 44:152–165
Bachu S, Shaw JC, Pearson RM (2004) Estimation of oil recovery and CO2 storage capacity in CO2 EOR incorporating the effect of underlying aquifers. SPE/DOE symposium on improved oil recov-ery, 17–21 April, Tulsa, Oklahoma. Society of Petroleum Engi-neers, pp 1–13, SPE-89340-MS. https ://doi.org/10.2118/89340 -MS
Bachu S, Haug K, Michael K, Buschkuehle B, Adams J (2005) Deep injection of acid gas in Western Canada. Dev Water Sci 52:623–635
Bayat M, Lashkarbolooki M, Hezave AZ, Ayatollahi S (2016) Inves-tigation of gas injection flooding performance as enhanced oil recovery method. J Nat Gas Sci Eng 29:37–45
Bikkina P, Wan J, Kim Y, Kneafsey TJ, Tokunaga TK (2016) Influence of wettability and permeability heterogeneity on miscible CO2 flooding efficiency. Fuel 166:219–226
Bourdarot G, Ghedan SG (2011) Modified EOR screening criteria as applied to a group of offshore carbonate oil reservoirs. SPE res-ervoir characterisation and simulation conference and exhibition, 9–11 October, Abu Dhabi, UAE. Society of Petroleum Engineers, pp 1– 21, SPE-148323-MS
Brashear J, Kuuskraa V (1978) The potential and economics of enhanced oil recovery. J Petrol Technol 30(09):1231–1239
Carcoana AN (1982) Enhanced oil recovery in Rumania. SPE enhanced oil recovery symposium, 4–7 April, Tulsa, Oklahoma. Society of Petroleum Engineers, pp 1–13. SPE-10699-MS
Caudle B, Dyes A (1958) Improving miscible displacement by gas-water injection, Society of Petroleum Engineers, SPE-911-G, pp 1–4
Diaz D, Bassiouni Z, Kimbrell W, Wolcott J (1996) Screening crite-ria for application of carbon dioxide miscible displacement in waterflooded reservoirs containing light oil. SPE/DOE improved oil recovery symposium, 21–24 April, Tulsa, Oklahoma. Society of Petroleum Engineers, pp 1–7, SPE-35431-MS. https ://doi.org/10.2118/35431 -MS
Ding M, Yuan F, Wang Y, Xia X, Chen W, Liu D (2017) Oil recovery from a CO2 injection in heterogeneous reservoirs: the influence Ta
ble
14
Com
paris
on o
f diff
eren
t pro
duct
ion
type
s with
resp
ect t
o va
rious
asp
ects
at t
he e
nd o
f for
ecas
ting
perio
d (2
0 ye
ars)
Reco
very
pro
cess
Pred
icte
d re
cove
ry fo
re-
casts
Pred
icte
d to
tal c
umul
ativ
e oi
l pr
oduc
tion
Fiel
d oi
l pro
duct
ion
rate
(FO
PR),
STB
/DEn
d of
fore
cast
perio
d pr
edic
ted
field
pr
essu
res
Pred
icte
d fie
ld g
as o
il ra
tioCO
2 fra
ctio
nFo
reca
st fie
ld w
ater
cut
Reco
very
by
Jan
2028
(%
)
20 y
ears
in
crem
enta
l (%
)
FOPT
Incr
emen
tFP
R (p
sia)
(FPR
-18
01)
(psi
a)
FGO
R, M
SCF/
STB
CO2 (
%)
FWC
T (%
)
Do_
Not
hing
19.4
55.
721
.16
MM
STB
6.21
MM
STB
212
1576
− 2
250.
514
313
CCO
225
.411
.66
26.9
7 M
MST
B12
.03
MM
STB
527
1629
− 1
7212
.419
9613
CO2-W
AG
26
.813
.628
.63
MM
STB
13.6
9 M
MST
B79
918
30+
294.
312
9161
Journal of Petroleum Exploration and Production Technology
1 3
of permeability heterogeneity, CO2-oil miscibility and injection pattern. J Nat Gas Sci Eng 44:140–149
Edwards K (2000) CO in Alberta: a vision of the future. J Can Pet Technol 39(09):1–6. https ://doi.org/10.2118/00-09-04
Fulin Z (2001) The principle of EOR. Petroleum University Press, Chengdu, pp 155–164
Gao C, Li X, Guo L, Zhao F (2013) Heavy oil production by carbon dioxide injection. Greenhouse Gases Sci Technol 3(3):185–195
Geffen TM (1973) Improved oil recovery could help ease energy short-age. World Oil 177(5):84–88
Goodlett GO, Honarpour MM, Chung FT, Sarathi PS (1986) The role of screening and laboratory flow studies in EOR process evalu-ation. SPE rocky mountain regional meeting, 19–21 May, Bill-ings, Montana. Society of Petroleum Engineers, pp 1–28, SPE-15172-MS. https ://doi.org/10.2118/15172 -MS
Goodrich JH (1980) Target reservoirs for CO2 miscible flooding: final report, vol 8341. US Department of Energy, Virginia, USA
Haynes HJ, Thrasher LW, Katz ML, Eck TR (1976) Enhanced Oil Recovery, Department of Interior. Committee on enhanced recovery techniques. Enhanced oil recovery, EOR: an analysis of the potential for enhanced oil recovery from known fields in the United States, 1976 to 2000. National Petroleum Council, USA, pp 1–200
Heidari P, Kharrat R, Alizadeh N, Ghazanfari MH (2013) A com-parison of WAG and SWAG processes: laboratory and simula-tion studies energy sources, part a: recovery. Util Environ Effects 35:2225–2232. https ://doi.org/10.1080/15567 036.2010.53218 9
Inaloo MB, Jafari F, Helalizadeh A (2014) Comparison of water flood-ing, gas injection and wag injection scenarios performance in a five spot pattern. World Appl Sci J 31(1):96–103
International AR (2006) Undeveloped domestic oil resources: the foundation for increased oil production and a viable domestic oil industry. US Department of Energy, Office of Fossil Energy—Office of Oil and Natural Gas. http://www.fossi l.energ y.gov/progr ams/oilga s/publi catio ns/eor_co2/Undev elope d_Oil_Docum ent.Pdf
Iyoho A (1978) Selecting enhanced oil recovery processes. World Oil (US) 187(6):61–64
Jaber AK, Awang MB (2017) Field-scale investigation of different miscible CO2-injection modes to improve oil recovery in a clas-tic highly heterogeneous reservoir. J Pet Explor Prod Technol 7(1):125–146
John PY, Zhuang Z, Kumar KH, Watts RJ (1990) A simulation approach in economic assessment and risk analysis of the CO2 miscible flooding process. J Petrol Sci Eng 4(4):359–374
Khazam M, Arebi T, Mahmoudi T, Froja M (2016) A new simple CO2 minimum miscibility pressure correlation. Oil Gas Res 2:2472-0518
Klins MA (1984) Carbon dioxide flooding: basic mechanisms and pro-ject design. Springer, Amsterdam
Kong X, Ohadi M (2010) Applications of micro and nano technolo-gies in the oil and gas industry-overview of the recent progress. Abu Dhabi international petroleum exhibition and conference, 1–4 November, Abu Dhabi, UAE. Society of Petroleum Engineers, pp 1–11, SPE-138241-MS. https ://doi.org/10.2118/13824 1-MS
Kovscek AR (2002) Screening criteria for CO2 storage in oil reservoirs. Pet Sci Technol 20(7–8):841–866
Kyrylovych M (2012) Applicability of hot water-alternate-CO2 flood-ing in heavy oil reservoirs
McRee BC (1977) CO2: how it works, where it works. Pet Eng 49(12):52–63
Monson CC, Korose CP, Frailey SM (2014) Screening methodology for regional-scale CO2 EOR and storage using economic criteria. Energy Procedia 63:7796–7808
Mousavifar MA, Kharrat R, Parchizadeh A, Mahdavi S (2012) Com-parison between EOR methods (gas injection, water injection and WAG processes) in one of Iranian Fractured Oil Reservoirs
Muggeridge A, Cockin A, Webb K, Frampton H, Collins I, Moulds T, Salino P (2014) Recovery rates, enhanced oil recovery and technological limits. Philos Trans Ser A Math Phys Eng Sci 372(2006):20120320
Núñez-López V, Holtz MH, Wood DJ, Ambrose WA, Hovorka SD (2008) Quick-look assessments to identify optimal CO2 EOR stor-age sites. Environ Geol 54(8):1695–1706
O’Reilly D (2009) Comparative PVT simulation: an application to Australasian fluid samples. SPE annual technical conference and exhibition, 4–7 October, New Orleans, Louisiana. Society of Petroleum Engineers, pp 1–17, SPE-129517-STU. https ://doi.org/10.2118/12951 7-STU
Orr FM, Heller JP, Taber JJ (1982) Carbon dioxide flooding for enhanced oil recovery: promise and problems. J Am Oil Chem Soc 59(10):810A–817A
OTA (Office of Technology Assessment) (1978) Enhanced oil recov-ery potential in United States; Congress of the United States. US Government printing Office, Washington DC, p 235
Rivas O, Embid S, Bolivar F (1994) Ranking reservoirs for carbon dioxide flooding processes. Soc Pet Eng 2(1):1–9. https ://doi.org/10.2118/23641 -PA
Sahimi M (2011) Miscible displacements, flow and transport in porous media and fractured rock. Wiley, New York, 467–518
Sandhu K (2012) Canadian CO2-EOR project reserves/appraisal. In: Presented at “Putting the Business Elements together for CO2 EOR using Captured Carbon” conference. 4–5 April, 2012, Golden, CO, USA
Sandrea I (2007) Global oil reserves-1: recovery factors leave vast target for EOR technologies. Oil Gas J 105(41):44
Sehbi BS, Frailey SM, Lawal AS (2001) Analysis of factors affecting microscopic displacement efficiency in CO2 floods. SPE permian basin oil and gas recovery conference, 15–17 May, Midland, Texas. Society of Petroleum Engineers, pp 1–8, SPE-70022-MS. https ://doi.org/10.2118/70022 -MS
Shaw J, Bachu S (2002) Screening, evaluation, and ranking of oil res-ervoirs suitable for CO2-flood EOR and carbon dioxide sequestra-tion. J Can Pet Technol. https ://doi.org/10.2118/02-09-05
Shedid SA (2009) Influences of different modes of reservoir heteroge-neity on performance and oil recovery of carbon dioxide miscible flooding. J Can Pet Technol. https ://doi.org/10.2118/09-02-29
Silva IG, de Melo MA, Luvizotto JM, Lucas EF (2007) Polymer flooding: a sustainable enhanced oil recovery in the current sce-nario. Latin American & caribbean petroleum engineering confer-ence, 15–18 April, Buenos Aires, Argentina. Society of Petroleum Engineers, SPE-107727-MS. https ://doi.org/10.2118/10772 7-MS
Song C, Yang D (2017) Experimental and numerical evaluation of CO2 huff-n-puff processes in Bakken formation. Fuel 190:145–162
Song Z, Li Z, Wei M, Lai F, Bai B (2014) Sensitivity analysis of water-alternating-CO2 flooding for enhanced oil recovery in high water cut oil reservoirs. Comput Fluids 99(Supplement C):93–103
Souza Jr , Cursino D, Padua K (2005) Twenty years of steam injection in heavy-oil fields. Proceedings of the SPE latin american and caribbean petroleum engineering conference, 20–23 June, Rio de Janeiro, Brazil, pp 20–23
Sun X, Zhang Y, Chen G, Gai Z (2017) Application of nanoparticles in enhanced oil recovery: a critical review of recent progress. Ener-gies 10(3):345
Taber JJ (1983) Technical screening guides for the enhanced recovery of oil. SPE annual technical conference and exhibition, 5–8 Octo-ber, San Francisco, California. Society of Petroleum Engineers, SPE-12069-MS. https ://doi.org/10.2118/12069 -MS

Journal of Petroleum Exploration and Production Technology
1 3
Taber JJ, Martin F, Seright R (1997) EOR screening criteria revisited-Part 1: Introduction to screening criteria and enhanced recovery field projects. SPE Reserv Eng 12(03):189–198
Thomas S (2008) Enhanced oil recovery-an overview. Oil Gas Sci Technol Revue de l’IFP 63(1):9–19
Todd M, Grand G (1993) Enhanced oil recovery using carbon dioxide. Energy Convers Manag 34(9):1157–1164
Whitson CH, Brulé MR (2000) Phase behavior, vol. 20. Society of Petroleum Engineers, USA, pp 1–120
Publisher’s Note Springer Nature remains neutral with regard to jurisdictional claims in published maps and institutional affiliations.