Embed Size (px)
Citation preview
Working Paper No. 102 CORRUPTION AND TRUST IN POLITICAL INSTITUTIONS IN SUB-SAHARAN AFRICA
by Emmanuelle Lavallée, Mireille Razafindrakoto and François Roubaud
ii
Copyright Afrobarometer
AFROBAROMETER WORKING PAPERS
Working Paper No. 102
CORRUPTION AND TRUST IN
POLITICAL INSTITUTIONS IN SUB-SAHARAN AFRICA
by Emmanuelle Lavallée, Mireille Razafindrakoto and François Roubaud
October 2008 Emmanuelle Lavallée is an Associate Professor of Economics at the University of Paris Dauphine and associated researcher at Développement Institutions and Analyses de Long Terme (DIAL) in Paris, France. Mireille Razafindrakoto is a researcher at Développement Institutions and Analyses de Long Terme (DIAL) of L’Institut de Recherche pour le Développment (IRD) in Paris, France. Francois Roubaud is a researcher at Développement Institutions and Analyses de Long Terme (DIAL) of L’Institut de Recherche pour le Développment (IRD) in Paris, France.
AFROBAROMETER WORKING PAPERS
iii
Copyright Afrobarometer
Editor Michael Bratton
Editorial Board
E. Gyimah-Boadi Carolyn Logan Robert Mattes
Leonard Wantchekon Afrobarometer publications report the results of national sample surveys on the attitudes of citizens in selected African countries towards democracy, markets, civil society, and other aspects of development. The Afrobarometer is a collaborative enterprise of the Centre for Democratic Development (CDD, Ghana), the Institute for Democracy in South Africa (IDASA), and the Institute for Empirical Research in Political Economy (IREEP) with support from Michigan State University (MSU) and the University of Cape Town, Center of Social Science Research (UCT/CSSR). Afrobarometer papers are simultaneously co-published by these partner institutions and the Globalbarometer.
Working Papers and Briefings Papers can be downloaded in Adobe Acrobat format from www.afrobarometer.org.
Idasa
co-published with:
iv
Copyright Afrobarometer
Corruption and Trust in Political Institutions in s ub-Saharan Africa
Abstract
This paper analyzes the impact of corruption on the extent of trust in political institutions using a rich collection of comparable data provided by the Afrobarometer surveys conducted in 18 sub-Saharan African countries. More specifically, we set out to test the “efficient grease” hypothesis that corruption can strengthen citizens’ trust since bribe paying and clientelism open the door to otherwise scarce and inaccessible services and subsidies, and that this increases institutional trust. Our findings reject this theoretical argument. We show that corruption never produces trust-enhancing effects regardless of the evaluation of public service quality. The results reveal how perceived and experienced corruption impact negatively, but differently, on citizens’ trust in political institutions. The adverse effect of perceived corruption decreases with the fall in public service quality. On the contrary, the negative effect of experienced corruption decreases as public service quality increases.
1
Copyright Afrobarometer
Introduction Corruption, defined as the abuse of public office for private gain, is widely seen today as a threat to democratic regimes. This view of corruption is one of the core motives underlying the United Nations Convention against Corruption. The first line of its preamble states that corruption is a threat “to the stability and security of societies, undermining the institutions and values of democracy, ethical values and justice and jeopardizing sustainable development and the rule of law.” The African Union Convention on Preventing and Combating Corruption also recognises the devastating effects of corruption on “the political, economic, social and cultural stability of African States.” Numerous World Development reports stress that corruption undermines state legitimacy. The 1997 report states that, “Unchecked, the creeping accumulation of seemingly minor infractions can slowly erode political legitimacy to the point where even non-corrupt officials and members of the public see little point in playing by the rules” (World Bank, 1997, p. 102). The 2002 report says, “Good governance also means the absence of corruption, which can subvert the goals of policy and undermine the legitimacy of the public institutions that support markets” (World Bank, 2002, p. 99). An increasing number of empirical studies show the negative impact of corruption on trust in political institutions. Della Porta (2000) finds that corruption greatly reduces trust in governments in Italy, France and Germany. Anderson and Tverdova (2003) conclude that citizens living in the most corrupt countries of Eastern and Western Europe exhibit less trust in their political systems. A number of studies of the situation in Latin America (Seligson, 2002), East Asia (Chang and Chu, 2006) and Africa (Cho and Kirwin, 2007) come to the same conclusion. Such conclusions contrast sharply with an earlier body of political science and economic literature on corruption. “Efficient grease” and “second-best” theories long prevailed in the political science and economic analysis of corruption. They argue that bribery is an efficient way to reduce effective red tape in an environment of heavy bureaucratic burden and long delays, and therefore that corruption can boost economic and political development (Leff, 1964; Huntington, S. 1968). For instance in political science, corruption is presented as facilitating the development of political parties and the emergence of a stable political environment. Corruption could also increase citizens’ loyalty to and trust in their political institutions (Bayley, 1967; Becquart-Leclerq, 1989). Strictly speaking, the new body of literature on the nexus between corruption and trust does not reject the “grease the wheels” hypothesis and can even agree with it. To be more precise, the mere observation that corruption generally undermines trust in political institutions does not prevent the correlation from being positive for individuals faced with red tape or ill-functioning public services. To the best of our knowledge, attempts to specifically test the “grease the wheels” hypothesis remain scarce in political science. In economics, the testing of these theories has prompted intense debate. Méon and Sekkat (2005) address the hypothesis from a macroeconomic standpoint. They observe that corruption is detrimental to investment and growth everywhere, and especially so in countries with some other institutional deficiency. This invalidates the “grease the wheels” hypothesis, but could correspond to a “sand the wheels” effect of corruption. Using various measures of corruption and other aspects of governance, Méon and Weill (2006) repeatedly observe that corruption is always detrimental in countries where institutions are effective, but that it may be positively associated with efficiency in countries where institutions are ineffective. In the area of international trade, Lavallée (2006b) rejects the second-best theories that see corruption as a way “to grease the wheels of trade” whereas Dutt and Traca (2007) show that, while corruption impedes trade in an environment of low tariffs, it can create trade-enhancing effects when nominal tariffs are high. This paper sets out to empirically test the “efficient grease” theory using a rich collection of comparable household surveys conducted in 18 sub-Saharan African countries (Afrobarometer Survey). The paper is structured as follows. Section 2 briefly describes the “grease the wheels” and “sand the wheels” hypotheses.
2
Copyright Afrobarometer
Section 3 presents our data and some descriptive statistics on corruption, trust in political institutions and public service delivery in sub-Saharan Africa. We lay out our empirical results in section 4 and our concluding comments are contained in section 5. “Efficient Grease” Theory and Its Critics Efficient grease theory long prevailed in political science. For many years, corruption was largely viewed as the “grease” that gets bureaucracy moving and, in so doing, increases the loyalty of the citizens (Merton, 1957; Abueva Veloso, 1966; Bayley, 1967; Nye, 1967). Corruption was seen as binding the society together. In a study on France, Becquart-Leclerq (1989) stated that corruption works like grease in the gears; it has substantial redistributive effects and is a functional substitute for direct participation in power. The main premise of “efficient grease” theory is that corruption can strengthen citizen trust since bribe paying and clientelism open the door to otherwise scarce and inaccessible services and subsidies, and that this increases institutional trust. Corruption is seen as an informal institution that helps the functioning of formal institutions. In other words, the theory suggests that a citizen faced with ill-functioning institutions will place greater trust in the political institutions if he knows (based on perception or experience) that corruption is a way to get what he wants. In the case of Honduras, Taylor-Robinson (2006) explains how a particular form of corruption, clientelism, has some positive effects on political representation. She argues that electoral incentives for legislators to represent local interests are weak due to Honduras’ closed-list proportional representation system. She finds that elected representatives from poor rural areas who sponsor pork barrel legislation do so mainly in response to established norms of clientelism. Without these norms, the legislative process might ignore poor rural districts entirely. Since 1990, “efficient grease” theory has been increasing challenged by both the theoretical end empirical literature. Critics focus mainly on the origins of political trust and the hypothesis behind “efficient grease” theory. Institutional theories suggest that political trust is a consequence, not a cause, of institutional performance. Trust in institutions is rationally based; it hinges on citizen evaluations of institutional performance. Institutions that perform well generate trust; untrustworthy institutions generate scepticism and distrust (Mishler and Rose, 2002). Therefore corruption, seen as a symptom of ill-functioning institutions, can affect institutional trust either directly, via the citizen’s experience or perception of corruption, or indirectly, via its adverse effects on economic growth (Mauro, 1995; Méon and Sekkat, 2005) and development outcomes (Kaufmann, Kraay and Zoido Lobaton, 1999). Empirical studies of different world regions confirm the negative impact of corruption on institutional trust. Della Porta (2000) demonstrates a strong relationship in Western European countries between a high level of corruption and low satisfaction with democracy. Anderson and Tverdova (2003) study 16 democracies in Eastern and Western Europe and conclude that citizens in highly corrupt countries value and trust their political systems less. Seligson (2002) presents similar findings based on household surveys in four Latin American democracies (El Salvador, Nicaragua, Paraguay and Bolivia). Lastly, Chang and Chu (2006) find the same negative relationship in four East Asian countries (Japan, South Korea, Thailand and Taiwan) and hence reject the Asian corruption exceptionalism hypothesis. Moreover, the central assumption of efficient grease theory that corruption can speed up an otherwise sluggish bureaucracy can be overturned. Myrdal (1968) argues that corrupt civil servants can cause delays that would not otherwise occur just to give themselves an opportunity to extract a bribe. Kaufman and Wei
3
Copyright Afrobarometer
(1999) demonstrate that corruption is an endogenous element of the regulatory burden set-up. Drawing on a survey of firms, they show a positive and significant correlation between effective red tape and the value of the bribe paid by firms. Using household surveys, Hunt and Lazlo (2006) and Lavallée, Razafindrakoto and Roubaud (2006) report similar findings respectively for Peru and sub-Saharan African countries. Lastly, corruption is seen as an informal institution that helps the functioning of public services, especially as a mechanism for the allocation of scarce public services. Yet such a mechanism can erode a citizen’s institutional trust. It may well be perceived as unfair or altering the rules or norms that govern how individuals act in society (Bratton, 2007). As informal institutions replace formal rules, citizens realize that respecting the formal rules is inefficient. Cho and Kirwin (2007) find a vicious circular relationship between mistrust in the state and experiences with corruption. Their results suggest that citizens’ experience of corruption lowers their trust in political institutions and that lower levels of trust are likely to increase the experience of corruption. Recent studies addressing the link between trust and corruption conclude that corruption alters trust in political institutions. To the best of our knowledge, none of them tests the central hypothesis of “efficient grease” theory whereby corruption can offset the adverse effects on trust of ill-functioning bureaucracies and public services. Data and Descriptive Statistics Presentation of the Data Sets The paper’s empirical basis is found in the Afrobarometer surveys. Afrobarometer is an independent, non-partisan research project that measures the social and political atmosphere in Africa. The Afrobarometer surveys are conducted in more than a dozen African countries and are repeated on a regular basis. This study uses Round 2 and Round 3. The Round 2 surveys were conducted from May 2002 to October 2003 in 15 countries: six southern African countries (Botswana, Lesotho, Malawi, Namibia, South Africa and Zambia), four eastern African countries (Uganda, Tanzania, Mozambique, and Kenya) and five western African countries (Senegal, Mali, Cape Verde, Ghana and Nigeria). The Round 3 surveys were conducted from March 2005 to February 2006 in the same countries as in 2002, but the coverage was extended to three new countries (Benin, Madagascar and Zimbabwe). These data sets are particularly interesting for four main reasons. Firstly, to the best of our knowledge, the corruption and trust nexus has not really been explored in full empirical fashion in these countries despite the fact that corruption is widespread in this area of the world1. Secondly, these countries are young democracies, so an analysis of corruption’s repercussions on the consolidation of these regimes consolidation is particularly relevant since institutional trust and state legitimacy are key elements to political stability (Mishler and Rose, 2001; O’Donnell, 1999). Thirdly, the survey includes questions about both experiences and perceptions of corruption. So we can analyse the effects of these two aspects on institutional trust. Lastly, the survey also contains information about the citizens’ perceptions of the quality of public services. This means that we can explore the impact of corruption on institutional trust by extent of red tape and then rigorously test the “efficient grease” theory.
1 The Afrobarometer surveys cover an area of the world where corruption is widespread. None of the abovementioned countries appear among the world’s 20 least corrupt countries as ranked by the Corruption Perception Index produced by Transparency International in 2006. The highest ranking is Botswana, in 37th place out of 158 countries. About half of the countries studied come in somewhere between 70th and 105th place. On the basis of the Transparency International rating, the most corrupt countries in our sample are Zambia, Benin, Kenya and Nigeria.
4
Copyright Afrobarometer
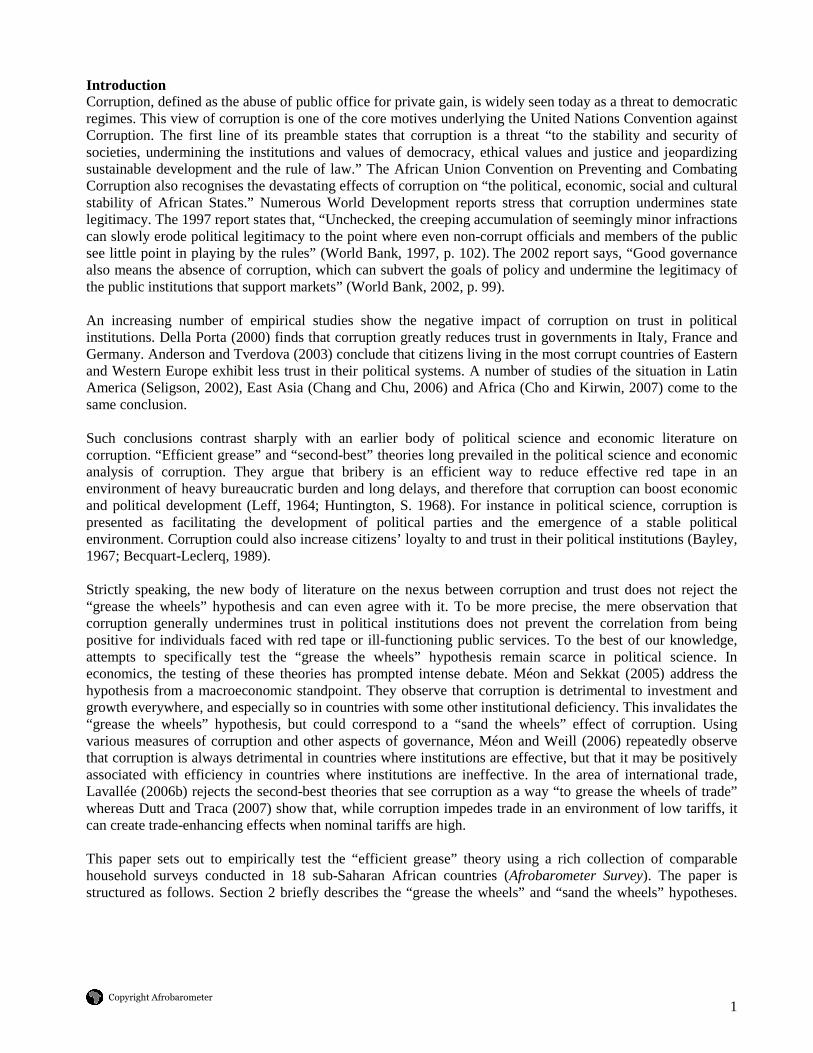
Trust in Political Institutions, Perception and Experience of Corruption, and Public Service Delivery: Some Descriptive Statistics. In a first step, we want to know whether ordinary people express trust in their country’s political institutions. In the Afrobarometer surveys, citizens were asked, “How much do you trust each of the following institutions, or haven’t you heard enough about them to say?” We only consider here the answers given for the political institutions (i.e. the president, parliament, the independent electoral commission, the ruling party and the opposition parties). Figure 1: Percentage of the population who express no trust in political institutions
0
10
20
30
40
50
60
70
80
Nigeria
Benin
Zambia
Cape ve
rde
Zimba
bwe
Mad
agas
car
Total
South africa
Kenya
Malaw
i
Botsw
ana
Seneg
al
Namibia
Leso
tho
Mali
Moz
ambiqu
e
Gha
na
Ugand
a
Tanz
ania
R2 (2002-2003) R3 (2005)
Sources: Afrobarometer surveys. Authors’calculations. Figure 1 shows that the people exhibit a low level of trust in their political institutions. The Round 2 surveys reveal that a quarter of the population does not trust any political institution (i.e. they trust neither the president, nor parliament, the independent electoral commission, the ruling party, nor the opposition parties). Three years later, this proportion had fallen to 16% of the population. This positive development is observed in every country. But there are still major cross-national variations. Nigeria shows the least trust in political institutions with, in Round 2, 67% and, in Round 3, 54% of the population trusting none of the political institutions. In the other countries, the situation is admittedly less alarming. Yet even in Round 3, almost one-third of the population in Benin and Zambia trusts none of the political institutions. This percentage ranges from 20% to 25% in Cape Verde, Zimbabwe and Madagascar. Conversely, in Mozambique, Ghana, Uganda and Tanzania, less than 6% of the population have this negative opinion of political institutions. The least trustworthy institutions appear to be the opposition political parties. More than 60% of the population expressed little or no trust in this institution compared with 40% for the ruling party and parliament and only 33% for the president. This relative ranking of the institutions is pretty much the same for all the countries studied. Except in Nigeria, Zambia and Zimbabwe where a high level of distrust applies for all the institutions, the highest rates of distrust are generally observed for the opposition parties (the rates are extremely high in some countries, such as in Madagascar where more than 80% of the population said they had little or no confidence in the opposition political parties).
5
Copyright Afrobarometer
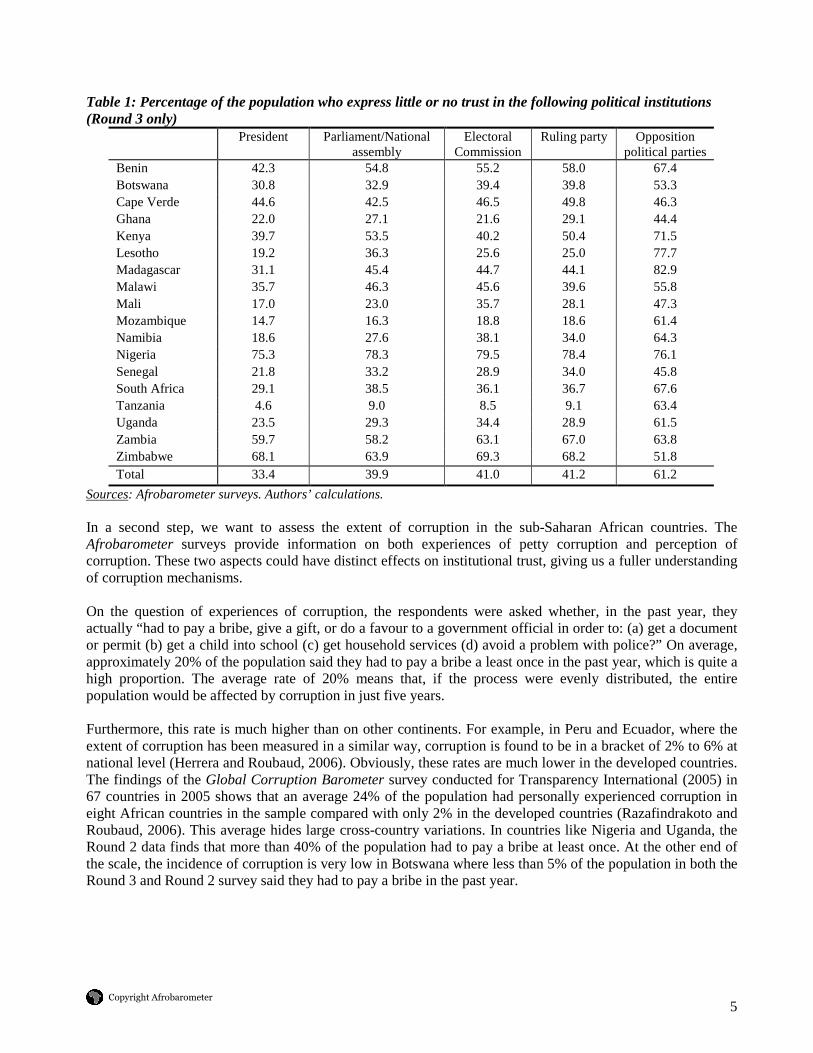
Table 1: Percentage of the population who express little or no trust in the following political institutions (Round 3 only)
President Parliament/National assembly
Electoral Commission
Ruling party Opposition political parties
Benin 42.3 54.8 55.2 58.0 67.4 Botswana 30.8 32.9 39.4 39.8 53.3 Cape Verde 44.6 42.5 46.5 49.8 46.3 Ghana 22.0 27.1 21.6 29.1 44.4 Kenya 39.7 53.5 40.2 50.4 71.5 Lesotho 19.2 36.3 25.6 25.0 77.7 Madagascar 31.1 45.4 44.7 44.1 82.9 Malawi 35.7 46.3 45.6 39.6 55.8 Mali 17.0 23.0 35.7 28.1 47.3 Mozambique 14.7 16.3 18.8 18.6 61.4 Namibia 18.6 27.6 38.1 34.0 64.3 Nigeria 75.3 78.3 79.5 78.4 76.1 Senegal 21.8 33.2 28.9 34.0 45.8 South Africa 29.1 38.5 36.1 36.7 67.6 Tanzania 4.6 9.0 8.5 9.1 63.4 Uganda 23.5 29.3 34.4 28.9 61.5 Zambia 59.7 58.2 63.1 67.0 63.8 Zimbabwe 68.1 63.9 69.3 68.2 51.8 Total 33.4 39.9 41.0 41.2 61.2
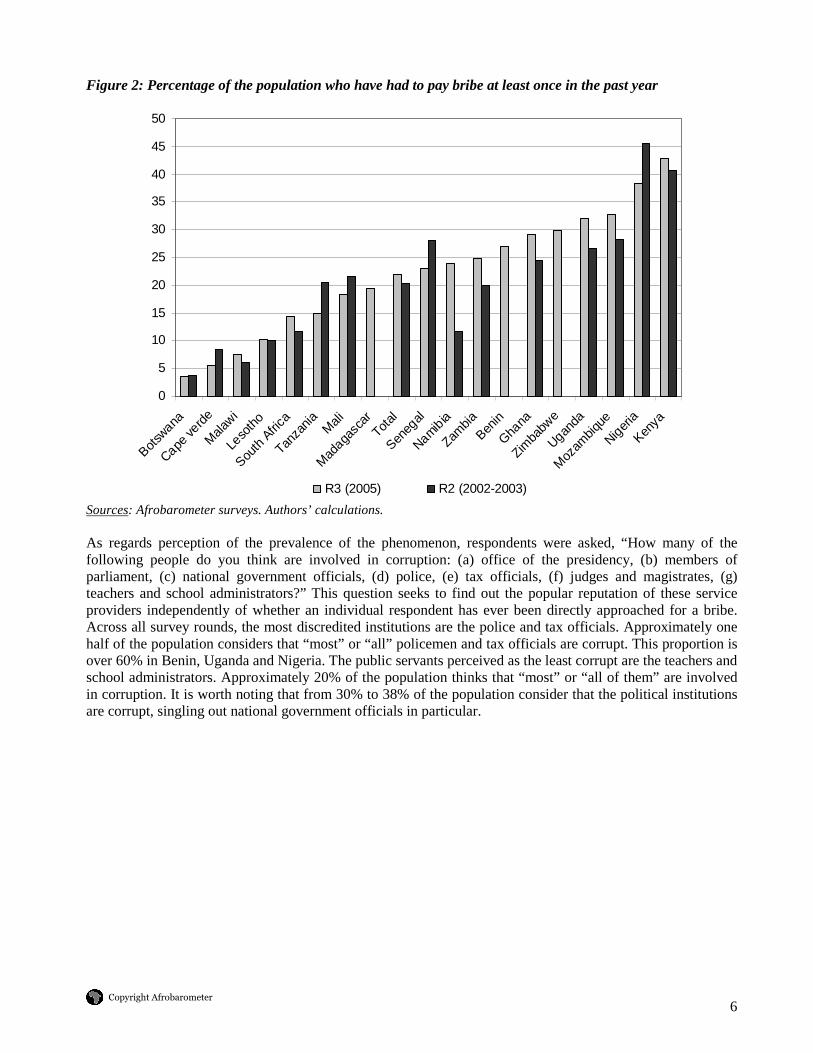
Sources: Afrobarometer surveys. Authors’ calculations. In a second step, we want to assess the extent of corruption in the sub-Saharan African countries. The Afrobarometer surveys provide information on both experiences of petty corruption and perception of corruption. These two aspects could have distinct effects on institutional trust, giving us a fuller understanding of corruption mechanisms. On the question of experiences of corruption, the respondents were asked whether, in the past year, they actually “had to pay a bribe, give a gift, or do a favour to a government official in order to: (a) get a document or permit (b) get a child into school (c) get household services (d) avoid a problem with police?” On average, approximately 20% of the population said they had to pay a bribe a least once in the past year, which is quite a high proportion. The average rate of 20% means that, if the process were evenly distributed, the entire population would be affected by corruption in just five years. Furthermore, this rate is much higher than on other continents. For example, in Peru and Ecuador, where the extent of corruption has been measured in a similar way, corruption is found to be in a bracket of 2% to 6% at national level (Herrera and Roubaud, 2006). Obviously, these rates are much lower in the developed countries. The findings of the Global Corruption Barometer survey conducted for Transparency International (2005) in 67 countries in 2005 shows that an average 24% of the population had personally experienced corruption in eight African countries in the sample compared with only 2% in the developed countries (Razafindrakoto and Roubaud, 2006). This average hides large cross-country variations. In countries like Nigeria and Uganda, the Round 2 data finds that more than 40% of the population had to pay a bribe at least once. At the other end of the scale, the incidence of corruption is very low in Botswana where less than 5% of the population in both the Round 3 and Round 2 survey said they had to pay a bribe in the past year.
6
Copyright Afrobarometer
Figure 2: Percentage of the population who have had to pay bribe at least once in the past year
0
5
10
15
20
25
30
35
40
45
50
Botsw
ana
Cape ve
rde
Mala
wi
Leso
tho
South
Afri
ca
Tanza
nia Mali
Mad
agasc
arTot
al
Seneg
al
Namibia
Zambia
Benin
Ghana
Zimba
bwe
Uganda
Moz
ambiq
ue
Niger
ia
Kenya
R3 (2005) R2 (2002-2003)
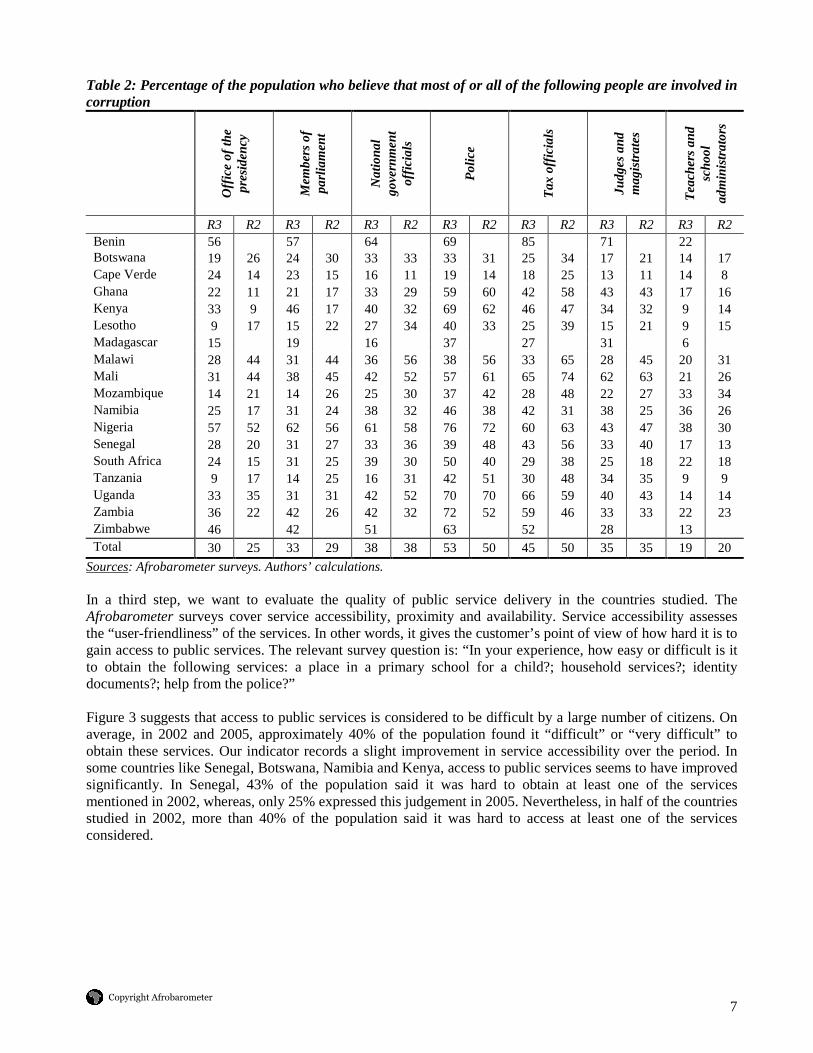
Sources: Afrobarometer surveys. Authors’ calculations. As regards perception of the prevalence of the phenomenon, respondents were asked, “How many of the following people do you think are involved in corruption: (a) office of the presidency, (b) members of parliament, (c) national government officials, (d) police, (e) tax officials, (f) judges and magistrates, (g) teachers and school administrators?” This question seeks to find out the popular reputation of these service providers independently of whether an individual respondent has ever been directly approached for a bribe. Across all survey rounds, the most discredited institutions are the police and tax officials. Approximately one half of the population considers that “most” or “all” policemen and tax officials are corrupt. This proportion is over 60% in Benin, Uganda and Nigeria. The public servants perceived as the least corrupt are the teachers and school administrators. Approximately 20% of the population thinks that “most” or “all of them” are involved in corruption. It is worth noting that from 30% to 38% of the population consider that the political institutions are corrupt, singling out national government officials in particular.
7
Copyright Afrobarometer
Table 2: Percentage of the population who believe that most of or all of the following people are involved in corruption
Off
ice
of th
e pr
esid
ency
Mem
bers
of
parl
iam
ent
Nat
iona
l go
vern
men
t of
fici
als
Pol
ice
Tax
off
icia
ls
Judg
es a
nd
mag
istr
ates
Tea
cher
s an
d sc
hool
ad
min
istr
ator
s
R3 R2 R3 R2 R3 R2 R3 R2 R3 R2 R3 R2 R3 R2 Benin 56 57 64 69 85 71 22 Botswana 19 26 24 30 33 33 33 31 25 34 17 21 14 17 Cape Verde 24 14 23 15 16 11 19 14 18 25 13 11 14 8 Ghana 22 11 21 17 33 29 59 60 42 58 43 43 17 16 Kenya 33 9 46 17 40 32 69 62 46 47 34 32 9 14 Lesotho 9 17 15 22 27 34 40 33 25 39 15 21 9 15 Madagascar 15 19 16 37 27 31 6 Malawi 28 44 31 44 36 56 38 56 33 65 28 45 20 31 Mali 31 44 38 45 42 52 57 61 65 74 62 63 21 26 Mozambique 14 21 14 26 25 30 37 42 28 48 22 27 33 34 Namibia 25 17 31 24 38 32 46 38 42 31 38 25 36 26 Nigeria 57 52 62 56 61 58 76 72 60 63 43 47 38 30 Senegal 28 20 31 27 33 36 39 48 43 56 33 40 17 13 South Africa 24 15 31 25 39 30 50 40 29 38 25 18 22 18 Tanzania 9 17 14 25 16 31 42 51 30 48 34 35 9 9 Uganda 33 35 31 31 42 52 70 70 66 59 40 43 14 14 Zambia 36 22 42 26 42 32 72 52 59 46 33 33 22 23 Zimbabwe 46 42 51 63 52 28 13 Total 30 25 33 29 38 38 53 50 45 50 35 35 19 20
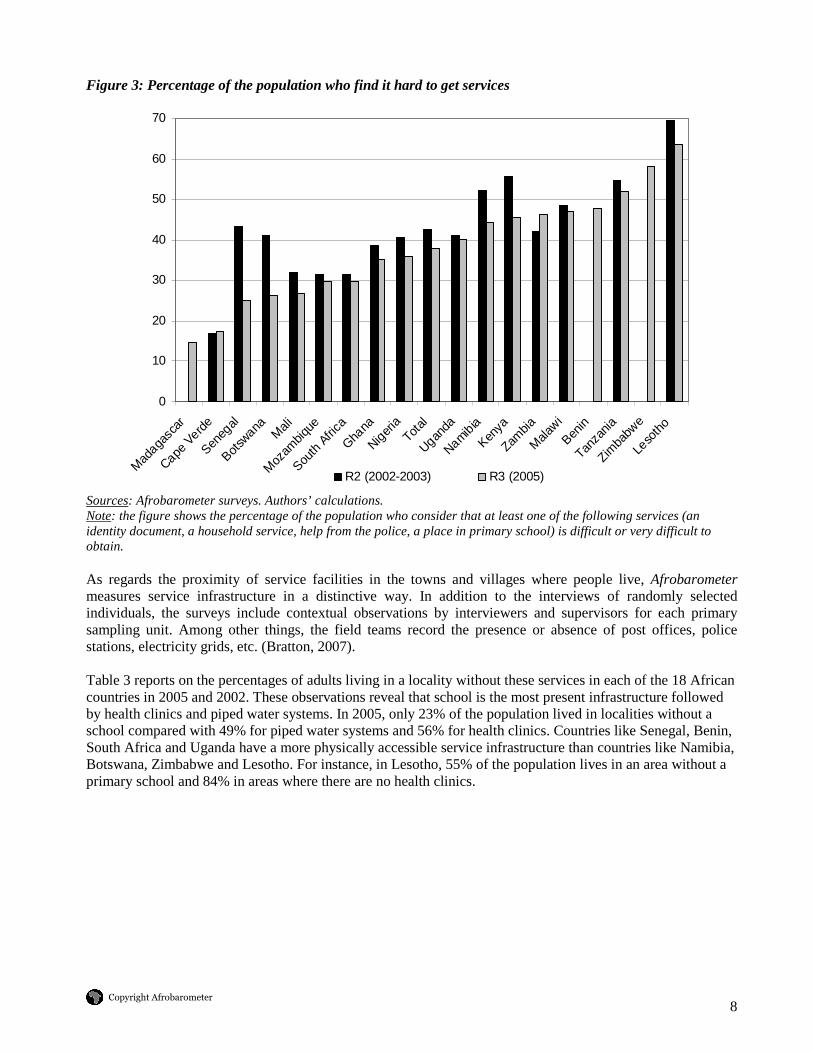
Sources: Afrobarometer surveys. Authors’ calculations. In a third step, we want to evaluate the quality of public service delivery in the countries studied. The Afrobarometer surveys cover service accessibility, proximity and availability. Service accessibility assesses the “user-friendliness” of the services. In other words, it gives the customer’s point of view of how hard it is to gain access to public services. The relevant survey question is: “In your experience, how easy or difficult is it to obtain the following services: a place in a primary school for a child?; household services?; identity documents?; help from the police?” Figure 3 suggests that access to public services is considered to be difficult by a large number of citizens. On average, in 2002 and 2005, approximately 40% of the population found it “difficult” or “very difficult” to obtain these services. Our indicator records a slight improvement in service accessibility over the period. In some countries like Senegal, Botswana, Namibia and Kenya, access to public services seems to have improved significantly. In Senegal, 43% of the population said it was hard to obtain at least one of the services mentioned in 2002, whereas, only 25% expressed this judgement in 2005. Nevertheless, in half of the countries studied in 2002, more than 40% of the population said it was hard to access at least one of the services considered.
8
Copyright Afrobarometer
Figure 3: Percentage of the population who find it hard to get services
0
10
20
30
40
50
60
70
Mad
agasc
ar
Cape V
erde
Seneg
al
Botsw
ana Mali
Moz
ambiq
ue
South
Afri
ca
Ghana
Niger
iaTot
al
Uganda
Namibia
Kenya
Zambia
Mala
wi
Benin
Tanza
nia
Zimba
bwe
Leso
tho
R2 (2002-2003) R3 (2005)
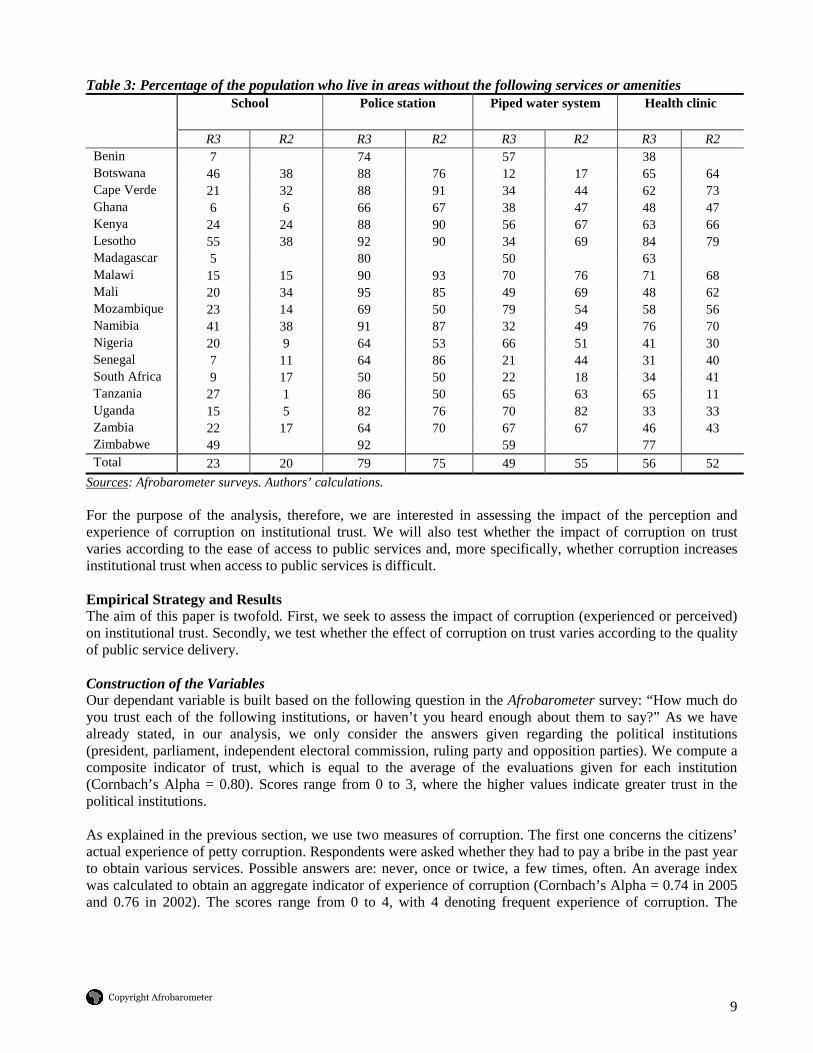
Sources: Afrobarometer surveys. Authors’ calculations. Note: the figure shows the percentage of the population who consider that at least one of the following services (an identity document, a household service, help from the police, a place in primary school) is difficult or very difficult to obtain. As regards the proximity of service facilities in the towns and villages where people live, Afrobarometer measures service infrastructure in a distinctive way. In addition to the interviews of randomly selected individuals, the surveys include contextual observations by interviewers and supervisors for each primary sampling unit. Among other things, the field teams record the presence or absence of post offices, police stations, electricity grids, etc. (Bratton, 2007). Table 3 reports on the percentages of adults living in a locality without these services in each of the 18 African countries in 2005 and 2002. These observations reveal that school is the most present infrastructure followed by health clinics and piped water systems. In 2005, only 23% of the population lived in localities without a school compared with 49% for piped water systems and 56% for health clinics. Countries like Senegal, Benin, South Africa and Uganda have a more physically accessible service infrastructure than countries like Namibia, Botswana, Zimbabwe and Lesotho. For instance, in Lesotho, 55% of the population lives in an area without a primary school and 84% in areas where there are no health clinics.
9
Copyright Afrobarometer
Table 3: Percentage of the population who live in areas without the following services or amenities School Police station Piped water system Health clinic
R3 R2 R3 R2 R3 R2 R3 R2 Benin 7 74 57 38 Botswana 46 38 88 76 12 17 65 64 Cape Verde 21 32 88 91 34 44 62 73 Ghana 6 6 66 67 38 47 48 47 Kenya 24 24 88 90 56 67 63 66 Lesotho 55 38 92 90 34 69 84 79 Madagascar 5 80 50 63 Malawi 15 15 90 93 70 76 71 68 Mali 20 34 95 85 49 69 48 62 Mozambique 23 14 69 50 79 54 58 56 Namibia 41 38 91 87 32 49 76 70 Nigeria 20 9 64 53 66 51 41 30 Senegal 7 11 64 86 21 44 31 40 South Africa 9 17 50 50 22 18 34 41 Tanzania 27 1 86 50 65 63 65 11 Uganda 15 5 82 76 70 82 33 33 Zambia 22 17 64 70 67 67 46 43 Zimbabwe 49 92 59 77 Total 23 20 79 75 49 55 56 52
Sources: Afrobarometer surveys. Authors’ calculations. For the purpose of the analysis, therefore, we are interested in assessing the impact of the perception and experience of corruption on institutional trust. We will also test whether the impact of corruption on trust varies according to the ease of access to public services and, more specifically, whether corruption increases institutional trust when access to public services is difficult. Empirical Strategy and Results The aim of this paper is twofold. First, we seek to assess the impact of corruption (experienced or perceived) on institutional trust. Secondly, we test whether the effect of corruption on trust varies according to the quality of public service delivery. Construction of the Variables Our dependant variable is built based on the following question in the Afrobarometer survey: “How much do you trust each of the following institutions, or haven’t you heard enough about them to say?” As we have already stated, in our analysis, we only consider the answers given regarding the political institutions (president, parliament, independent electoral commission, ruling party and opposition parties). We compute a composite indicator of trust, which is equal to the average of the evaluations given for each institution (Cornbach’s Alpha = 0.80). Scores range from 0 to 3, where the higher values indicate greater trust in the political institutions. As explained in the previous section, we use two measures of corruption. The first one concerns the citizens’ actual experience of petty corruption. Respondents were asked whether they had to pay a bribe in the past year to obtain various services. Possible answers are: never, once or twice, a few times, often. An average index was calculated to obtain an aggregate indicator of experience of corruption (Cornbach’s Alpha = 0.74 in 2005 and 0.76 in 2002). The scores range from 0 to 4, with 4 denoting frequent experience of corruption. The
10
Copyright Afrobarometer
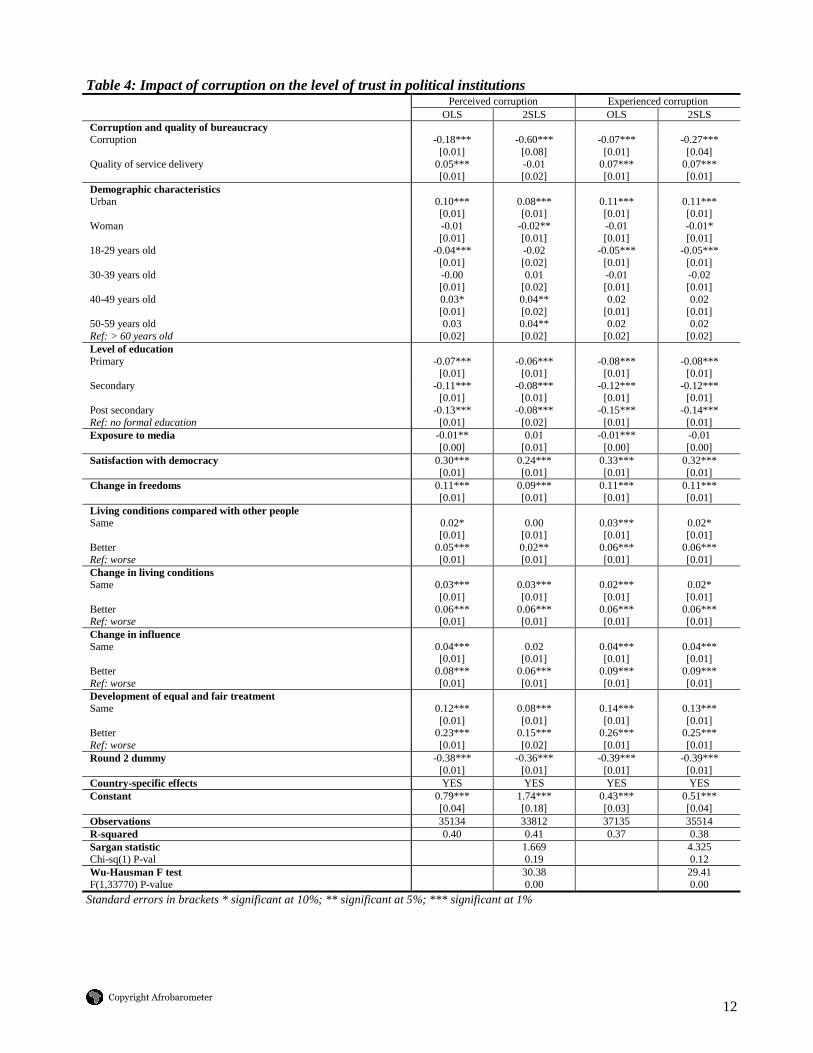
second corruption index covers popular perceptions of the general prevalence of corruption among politicians and public officials. The scores are also on a 0 to 4 scale, with 4 indicating a high degree of perceived corruption2. We also calculate an indicator that captures the ease of access to public services for each citizen based on the questions concerning service “user-friendliness” and proximity (Cornbach’s Alpha = 0.70). Greater values mean easier access to public services. We control the relationship between trust, corruption and public service quality with other covariates. First, we introduce a time and country dummy to take into account unobservable particularities. Secondly, we add in a set of demographic variables such as age, gender and level of education. Age could be an important explanatory element of trust in political institutions. Younger people might be expected to exhibit greater institutional trust because, unlike their elders, their experience of political life is recent. This means that they might not have accumulated years of disappointment in the political institutions and may still have an idyllic vision of democracy (Seligson, 2002). In most of the studies on institutional trust, gender is a key determinant of trust, with women expressing less trust in political institutions (Seligson, 2002; Chang and Chu, 2006). Level of education is important too. Seligson (2002) points out that the most educated people are more likely to have a good knowledge of their political system and to criticize it. In addition, we introduce a variable that reflects exposure to the media. Thirdly, we introduce variables to represent the citizens’ living conditions. This choice is driven by the theory of “economic vote” (Lewis-Beck and Stegmaier, 2000), which suggests that living conditions influence voting behaviour and attitudes towards governments. They consider that voters vote rationally and that they give their support to governments perceived as the most likely to improve their own living conditions. Given this, trust in political institutions depends on the citizens’ evaluations of their economic situation. More specifically, citizens may display higher trust in political institutions when they reckon that their living conditions are good or have improved. To capture the citizens’ living conditions, we use three Afrobarometer questions asking respondents about their expectations of changes in their living conditions and how they rate their living conditions compared with their fellow citizens and compared with twelve months previously. Fourthly, we look at the citizens’ satisfaction with democracy and their evaluation of changes in the amount of freedom they have, of ordinary people’s influence on political decisions, and of equality. Citizens’ attitudes are not driven purely by their living conditions, but also by “political goods” such as political rights and liberties. Results In a first step, we assess the basic effect of corruption on institutional trust. Table 4 presents the results of the estimations performed on the entire sample of Afrobarometer countries. Columns 1 and 3 report on the results of the ordinary least squares estimation. Some findings are in keeping with our expectations. The higher their level of education, the less the people trust the political institutions. For instance, having a post-secondary level of education rather than no formal education reduces institutional trust by 13% whereas having a primary school education only reduces trust by 7%. Our estimations show that the African citizens’ opinions of their political institutions are driven by both material needs and democratic values. All the variables describing the citizens’ living conditions and attitudes towards democracy and its outcome have a significant influence on institutional trust. As regards material needs, our findings suggest that the better the perception of living conditions and their development, the greater the trust in the political institutions. In terms of democratic values, our results indicate that a high level of satisfaction with democracy, a positive evaluation of changes in freedoms, of equality of treatment of
2 This is computed on the basis of questions on perceptions of corruption, as described in the previous section (Cornbach’s Alpha equals 0.87).
11
Copyright Afrobarometer
citizens and of the influence of ordinary people on government decisions increase trust in the political institutions. For instance, the view that equality and fairness are improving raises trust by more than 20%. However, other findings are quite surprising, especially the demographic variable coefficients. For instance, we find that gender has no influence on the level of trust, but that citizens who live in urban areas display greater trust in political institutions. The former suggests that women have as much trust as their male counterparts, which is quite new in the literature. The latter is counter-intuitive as individuals in urban areas are more likely to have a more critical point of view. Yet this finding can be interpreted by the fact that policy measures are often more beneficial to urban areas. Our regressions also reveal that age has little influence on trust. Only one age bracket dummy, for 18-29 year olds, is significant. The coefficient is negative, meaning that young people express less trust in political institutions. As regards our variables of interest, our results clearly show that perception and experience of corruption undermine institutional trust, and that perceived corruption has a larger negative impact than experienced corruption. The marginal effect (at the means) of the perception of corruption is -18% as opposed to -7% for experience of corruption. Our estimations also confirm that the quality of public service delivery increases institutional trust. Easy access to public services increases the level of citizens’ trust in political institutions. Columns 2 and 4 report on the coefficient estimates using the two-stage least squares procedure. The choice of this estimation technique is driven by the fact that trust in political institutions may also be a determinant of corruption (perceived and experienced). As explained by Cho and Kirwin (2007), institutional mistrust is likely to lead people to pay bribes in order to access public resources. It could hence increase experiences of corruption and foster the perception that corruption is widespread3. We use two instruments to study the perceived level of corruption. A dummy variable, called “solution”, taking the value of one if the respondent says he would pay a bribe to speed up the delivery of a government permit or licence. Another dummy variable taking the value of one if the respondent is the head of household. A few different instruments are used to study experiences of corruption: an indicator of vulnerability to illness, a variable capturing the respondent’s intensity of religious practice and the “solution” variable. The choice of these instruments is based on the literature on the causes of corruption. A respondent who considers that paying a bribe is a solution in the event of a problem with the administration reveals that he has no moral barriers to corruption and that his propensity to bribe is high. The less adverse to corruption an individual is, the more likely he is to pay a bribe and then to perceive that bribery is widespread. Similarly, the head of household is generally more in contact with the public services and therefore has a greater chance of being a victim of or witnessing corruption and to hence believing it is common practice. Hunt (2006) and Guiso et al. (2003) emphasise that vulnerability and a low intensity of religious practice increase the occurrence of corruption. In both cases, the Durbin-Wu-Hausman test finds significant endogenous regressor (i.e. corruption) effects on the estimates and instrumental variables techniques are required. Furthermore, in both cases the Sargan test confirms that the instruments are valid (i.e. uncorrelated with the error term) and that the instruments chosen are appropriate for the estimated equation.
3 Numerous studies state that perception and experience of corruption are interlinked and self-reinforcing.
12
Copyright Afrobarometer
Table 4: Impact of corruption on the level of trust in political institutions Perceived corruption Experienced corruption
OLS 2SLS OLS 2SLS Corruption and quality of bureaucracy Corruption -0.18*** -0.60*** -0.07*** -0.27*** [0.01] [0.08] [0.01] [0.04] Quality of service delivery 0.05*** -0.01 0.07*** 0.07*** [0.01] [0.02] [0.01] [0.01] Demographic characteristics Urban 0.10*** 0.08*** 0.11*** 0.11*** [0.01] [0.01] [0.01] [0.01] Woman -0.01 -0.02** -0.01 -0.01* [0.01] [0.01] [0.01] [0.01] 18-29 years old -0.04*** -0.02 -0.05*** -0.05*** [0.01] [0.02] [0.01] [0.01] 30-39 years old -0.00 0.01 -0.01 -0.02 [0.01] [0.02] [0.01] [0.01] 40-49 years old 0.03* 0.04** 0.02 0.02 [0.01] [0.02] [0.01] [0.01] 50-59 years old 0.03 0.04** 0.02 0.02 Ref: > 60 years old [0.02] [0.02] [0.02] [0.02] Level of education Primary -0.07*** -0.06*** -0.08*** -0.08*** [0.01] [0.01] [0.01] [0.01] Secondary -0.11*** -0.08*** -0.12*** -0.12*** [0.01] [0.01] [0.01] [0.01] Post secondary -0.13*** -0.08*** -0.15*** -0.14*** Ref: no formal education [0.01] [0.02] [0.01] [0.01] Exposure to media -0.01** 0.01 -0.01*** -0.01 [0.00] [0.01] [0.00] [0.00] Satisfaction with democracy 0.30*** 0.24*** 0.33*** 0.32*** [0.01] [0.01] [0.01] [0.01] Change in freedoms 0.11*** 0.09*** 0.11*** 0.11*** [0.01] [0.01] [0.01] [0.01] Living conditions compared with other people Same 0.02* 0.00 0.03*** 0.02* [0.01] [0.01] [0.01] [0.01] Better 0.05*** 0.02** 0.06*** 0.06*** Ref: worse [0.01] [0.01] [0.01] [0.01] Change in living conditions Same 0.03*** 0.03*** 0.02*** 0.02* [0.01] [0.01] [0.01] [0.01] Better 0.06*** 0.06*** 0.06*** 0.06*** Ref: worse [0.01] [0.01] [0.01] [0.01] Change in influence Same 0.04*** 0.02 0.04*** 0.04*** [0.01] [0.01] [0.01] [0.01] Better 0.08*** 0.06*** 0.09*** 0.09*** Ref: worse [0.01] [0.01] [0.01] [0.01] Development of equal and fair treatment Same 0.12*** 0.08*** 0.14*** 0.13*** [0.01] [0.01] [0.01] [0.01] Better 0.23*** 0.15*** 0.26*** 0.25*** Ref: worse [0.01] [0.02] [0.01] [0.01] Round 2 dummy -0.38*** -0.36*** -0.39*** -0.39*** [0.01] [0.01] [0.01] [0.01] Country-specific effects YES YES YES YES Constant 0.79*** 1.74*** 0.43*** 0.51*** [0.04] [0.18] [0.03] [0.04] Observations 35134 33812 37135 35514 R-squared 0.40 0.41 0.37 0.38 Sargan statistic 1.669 4.325 Chi-sq(1) P-val 0.19 0.12 Wu-Hausman F test 30.38 29.41 F(1,33770) P-value 0.00 0.00
Standard errors in brackets * significant at 10%; ** significant at 5%; *** significant at 1%
13
Copyright Afrobarometer
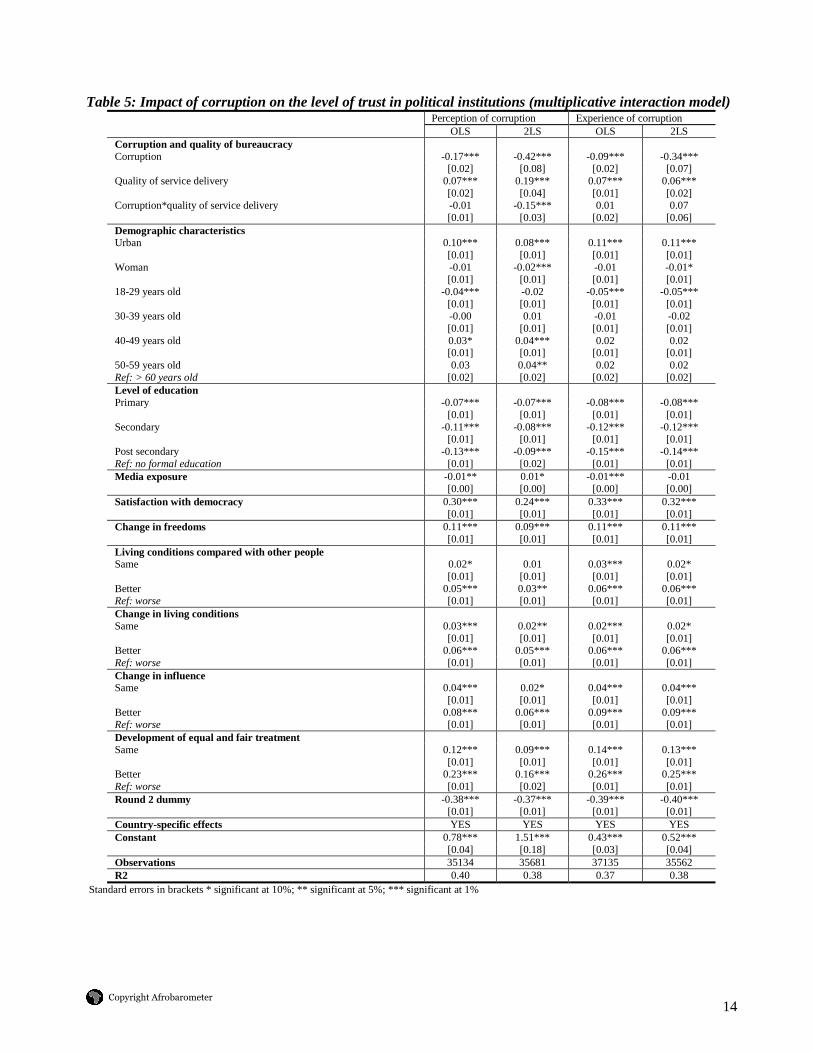
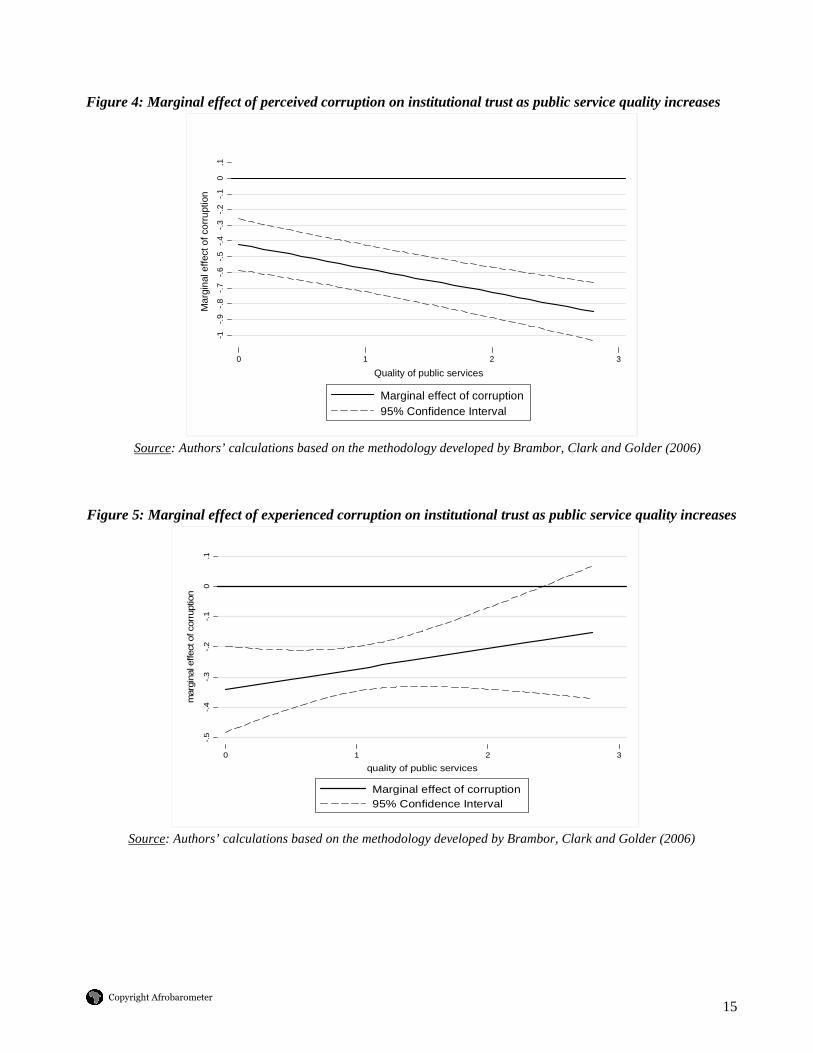
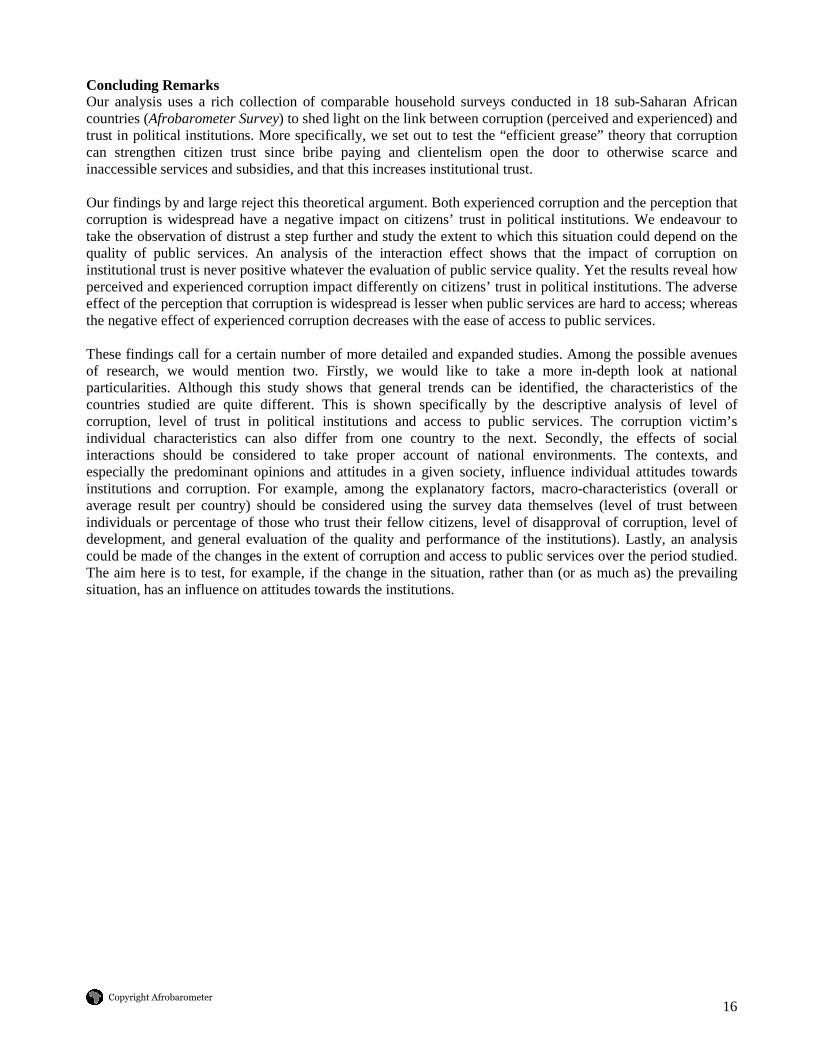
This estimation technique does not make any great difference to our findings: the sign and significance of the coefficient estimates for most of our variables are similar to before. The coefficients of the corruption variables are still negative and significant, but they are larger. The marginal effects of the perception and experience of corruption are respectively -60% and -27% compared with -18% and -7% for the OLS estimations. In a second step, we want to specifically test the “efficient grease” theory. We use a multiplicative interaction model to analyse the trust-corruption nexus. The “efficient grease” hypothesis implies that the relationship between institutional trust and corruption varies with the level of red tape. Now it has been well established that the intuition behind conditional hypotheses is captured rather well by multiplicative interaction models (Brambor, Clark, and Golder, 2006). In other words, we include in our regressions one corruption variable (perception of the level of corruption or experience of corruption), one public service quality variable and a “corruption*service quality” interaction term (the product of these two continuous variables). In this step, we use the same model specification as previously (with the same set of control variables), but the discussion here will focus mainly on the interaction effect. Table 5 reports on the coefficient estimates, but figures 4 and 5 give a clearer illustration of how the marginal effect of corruption on institutional trust changes with the assessment of public service quality. Our results never find a positive impact of corruption on institutional trust. Nevertheless, the effect of the perception that corruption is widespread and the effect of having experienced corruption are quite different. In effect, our findings indicate that the perceived level of corruption has a strong adverse effect on citizens’ trust in political institutions and that the scope of its negative effect increases with the quality of public services. This result can be seen as a partial validation of the “grease the wheels” hypothesis, since it shows that the negative impact of perceived corruption on institutional trust is lower in environments where the quality of public service delivery is low. However, this finding could be said to be driven by the citizens’ attrition of preferences. In other words, when public institutions are not performing well, corruption could be viewed as one institutional deficiency among others, so its impact is lesser. Conversely, when public services are deemed efficient, perceived corruption has a more negative effect on the citizens’ attitudes toward the institutions. In this case, corruption is considered to be a real problem that prevents the administration from being more effective and an issue that the political institutions have to address. The adverse impact of experienced corruption on citizens’ trust in political institutions is not as strong. Moreover, this negative effect falls as the level of satisfaction with public service quality increases and it even becomes insignificant when public services are considered quite efficient (a score of more than 2.5.on a 3-point scale). This result suggests that the experience of corruption is considered all the more negative by individuals who find it hard to access public services. These findings underline the fact that the “objective” corruption variable (practice and actual experience of corruption) and the “subjective” corruption variable (perception of the level of corruption) reflect two different aspects of this phenomenon, and that their respective impacts merit separate analysis.
14
Copyright Afrobarometer
Table 5: Impact of corruption on the level of trust in political institutions (multiplicative interaction model)
Perception of corruption Experience of corruption OLS 2LS OLS 2LS
Corruption and quality of bureaucracy Corruption -0.17*** -0.42*** -0.09*** -0.34***
[0.02] [0.08] [0.02] [0.07] Quality of service delivery 0.07*** 0.19*** 0.07*** 0.06***
[0.02] [0.04] [0.01] [0.02] Corruption*quality of service delivery -0.01 -0.15*** 0.01 0.07
[0.01] [0.03] [0.02] [0.06] Demographic characteristics Urban 0.10*** 0.08*** 0.11*** 0.11***
[0.01] [0.01] [0.01] [0.01] Woman -0.01 -0.02*** -0.01 -0.01*
[0.01] [0.01] [0.01] [0.01] 18-29 years old -0.04*** -0.02 -0.05*** -0.05***
[0.01] [0.01] [0.01] [0.01] 30-39 years old -0.00 0.01 -0.01 -0.02
[0.01] [0.01] [0.01] [0.01] 40-49 years old 0.03* 0.04*** 0.02 0.02
[0.01] [0.01] [0.01] [0.01] 50-59 years old 0.03 0.04** 0.02 0.02 Ref: > 60 years old [0.02] [0.02] [0.02] [0.02] Level of education Primary -0.07*** -0.07*** -0.08*** -0.08***
[0.01] [0.01] [0.01] [0.01] Secondary -0.11*** -0.08*** -0.12*** -0.12***
[0.01] [0.01] [0.01] [0.01] Post secondary -0.13*** -0.09*** -0.15*** -0.14*** Ref: no formal education [0.01] [0.02] [0.01] [0.01] Media exposure -0.01** 0.01* -0.01*** -0.01
[0.00] [0.00] [0.00] [0.00] Satisfaction with democracy 0.30*** 0.24*** 0.33*** 0.32***
[0.01] [0.01] [0.01] [0.01] Change in freedoms 0.11*** 0.09*** 0.11*** 0.11***
[0.01] [0.01] [0.01] [0.01] Living conditions compared with other people Same 0.02* 0.01 0.03*** 0.02*
[0.01] [0.01] [0.01] [0.01] Better 0.05*** 0.03** 0.06*** 0.06*** Ref: worse [0.01] [0.01] [0.01] [0.01] Change in living conditions Same 0.03*** 0.02** 0.02*** 0.02*
[0.01] [0.01] [0.01] [0.01] Better 0.06*** 0.05*** 0.06*** 0.06*** Ref: worse [0.01] [0.01] [0.01] [0.01] Change in influence Same 0.04*** 0.02* 0.04*** 0.04***
[0.01] [0.01] [0.01] [0.01] Better 0.08*** 0.06*** 0.09*** 0.09*** Ref: worse [0.01] [0.01] [0.01] [0.01] Development of equal and fair treatment Same 0.12*** 0.09*** 0.14*** 0.13***
[0.01] [0.01] [0.01] [0.01] Better 0.23*** 0.16*** 0.26*** 0.25*** Ref: worse [0.01] [0.02] [0.01] [0.01] Round 2 dummy -0.38*** -0.37*** -0.39*** -0.40***
[0.01] [0.01] [0.01] [0.01] Country-specific effects YES YES YES YES Constant 0.78*** 1.51*** 0.43*** 0.52***
[0.04] [0.18] [0.03] [0.04] Observations 35134 35681 37135 35562 R2 0.40 0.38 0.37 0.38
Standard errors in brackets * significant at 10%; ** significant at 5%; *** significant at 1%
15
Copyright Afrobarometer
Figure 4: Marginal effect of perceived corruption on institutional trust as public service quality increases
-1-.
9-.
8-.
7-.
6-.
5-.
4-.
3-.
2-.
10
.1
Mar
gina
l effe
ct o
f cor
rupt
ion
0 1 2 3
Quality of public services
Marginal effect of corruption95% Confidence Interval
Source: Authors’ calculations based on the methodology developed by Brambor, Clark and Golder (2006)
Figure 5: Marginal effect of experienced corruption on institutional trust as public service quality increases
-.5
-.4
-.3
-.2
-.1
0.1
mar
gina
l effe
ct o
f cor
rupt
ion
0 1 2 3
quality of public services
Marginal effect of corruption95% Confidence Interval
Source: Authors’ calculations based on the methodology developed by Brambor, Clark and Golder (2006)
16
Copyright Afrobarometer
Concluding Remarks Our analysis uses a rich collection of comparable household surveys conducted in 18 sub-Saharan African countries (Afrobarometer Survey) to shed light on the link between corruption (perceived and experienced) and trust in political institutions. More specifically, we set out to test the “efficient grease” theory that corruption can strengthen citizen trust since bribe paying and clientelism open the door to otherwise scarce and inaccessible services and subsidies, and that this increases institutional trust. Our findings by and large reject this theoretical argument. Both experienced corruption and the perception that corruption is widespread have a negative impact on citizens’ trust in political institutions. We endeavour to take the observation of distrust a step further and study the extent to which this situation could depend on the quality of public services. An analysis of the interaction effect shows that the impact of corruption on institutional trust is never positive whatever the evaluation of public service quality. Yet the results reveal how perceived and experienced corruption impact differently on citizens’ trust in political institutions. The adverse effect of the perception that corruption is widespread is lesser when public services are hard to access; whereas the negative effect of experienced corruption decreases with the ease of access to public services. These findings call for a certain number of more detailed and expanded studies. Among the possible avenues of research, we would mention two. Firstly, we would like to take a more in-depth look at national particularities. Although this study shows that general trends can be identified, the characteristics of the countries studied are quite different. This is shown specifically by the descriptive analysis of level of corruption, level of trust in political institutions and access to public services. The corruption victim’s individual characteristics can also differ from one country to the next. Secondly, the effects of social interactions should be considered to take proper account of national environments. The contexts, and especially the predominant opinions and attitudes in a given society, influence individual attitudes towards institutions and corruption. For example, among the explanatory factors, macro-characteristics (overall or average result per country) should be considered using the survey data themselves (level of trust between individuals or percentage of those who trust their fellow citizens, level of disapproval of corruption, level of development, and general evaluation of the quality and performance of the institutions). Lastly, an analysis could be made of the changes in the extent of corruption and access to public services over the period studied. The aim here is to test, for example, if the change in the situation, rather than (or as much as) the prevailing situation, has an influence on attitudes towards the institutions.
17
Copyright Afrobarometer
References: Anderson, C. and Y. Tverdova (2003), “Corruption, Political Allegiances, and Attitudes Toward Government
in Contemporary Democracies”, American Journal of Political Science, No. 47(1), pp. 91-109. Abueva Veloso, J. (1966), “The Contribution of Nepotism, Spoils, and Graft to Political Development”, East-
West Center Review 1966(1), pp. 45-54. Bayley, D. (1967), “The Effects of Corruption in a Developing Nation”, Western Political Quarterly, No. 19
(4), pp. 719-732. Becquart-Leclerq, J. (1989), “Paradoxes of Political Corruption: A French View”, in Arnold J. Heidenheimer,
Victor T. LeVine and Michael Johnston (eds), Political Corruption: A Handbook, New Brunswick, NJ, Transaction.
Brambor, T., Clark, W.R. And M. Golder (2006), “Understanding Interaction Models: Improving Empirical
Analysis”, Political Analysis, 14, pp. 63-82. Bratton, M. (2007) “Are You Being Served? Popular Satisfaction with Health and Education Services in
Africa.” AB working papers No. 65, 2007 Chang, E. And Chu, Y.H. (2006), “Corruption and Trust: Exceptionalism in Asian Democracies?”, The
Journal of Politics, Vol. 68, 2. Cho W. And M.F.Kirwin (2007), “A Vicious Circle of Corruption and Mistrust in Institutions in Sub-Saharan
Africa: a micro-level analysis”, Afrobarometer Working Paper No. 71, September. Della Porta, D. (2000), “Social Capital, Beliefs in Government, and Political Corruption”, in Susan Pharr and
Robert Putnam (Eds), Disaffected Democracies: What’s Troubling the Trilateral Countries? Princeton, Princeton University Press.
Dutt P. And D.Traca (2007), “Corruption and Bilateral Trade Flows: Extortion or Evasion?”, INSEAD No.
2007/37/EPS. Guiso, L., Sapienza, P., Zingales, L. (2003), “People’s Opium? Religion and Economic Attitudes,” Journal of
Monetary Economics, Vol. 50(1), January, pp. 225-282 Herrera J., Roubaud F. (2006), « Gouvernance, démocratie et pauvreté dans les pays andins : Bolivie,
Equateur, Pérou », mimeo, DIAL, Paris. Huntington, S. (1968), Political Order in Changing Societies, New Haven, Yale University Press. Hunt J., Lazlo, S. (2006) “Bribery: Who Pays, Who Refuses, What Are The Payoffs?” NBER Working Paper
No. W11635, September. Kaufmann, D.Kraay And Zoido Lobaton (1999), “Aggregating Governance Indicators”, World Bank Policy
Research Working Paper, No. 2195, The World Bank, October. Kaufmann, D. And Wei, S-J. (1999), “Does ‘Grease Money’ Speed Up the Wheels of Commerce?”, NBER
18
Copyright Afrobarometer
Working Paper, No. 7093. Lavallee, E. (2006a), «Corruption et confiance dans les institutions politiques : test des théories
fonctionnalistes dans les démocraties africaines », Afrique Contemporaine, n° 220, pp. 163-190. Lavallee, E. (2006b) “Similarité institutionnelle, qualité des institutions et commerce international”, Economie
Internationale, Vol. 108, pp. 27-58. Lavallee, E, Razafindrakoto, M. And Roubaud, F. (2007) “Les mécanismes à l’origine de la corruption”
mimeo DIAL. Leff, N. (1964), “Economic Development though Bureaucratic Corruption”, The American Behavioural
Scientist, 8, 2, p. 8-14. Lewis-Beck, M. And Stegmaier, M. (2000) “Economic Determinants of Electoral Outcomes”, Annual Review
of Political Science, No. 3, pp. 183-219. Mauro, P. (1995), “Corruption and Growth”, Quarterly Journal of Economics, 60(3), pp.681-712. Méon, P.-G. And Sekkat, K. (2005), “Does Corruption Grease or Sand the Wheels of Growth?”, Public
Choice, 122, 1-2, pp. 69-97. Méon, P.-G. And Weill. L. (2006), “Does better governance foster efficiency? An aggregate frontier analysis”.
Economics of Governance, Vol. 6, pp. 75–90. Merton, R. (1968), Social Theory and Social Structure, New York, Free Press. Mishler, W. And Rose, R. (2002), “What are the Political Consequences of Trust? A Test of Cultural and
Institutional Theories in Russia”, Paper presented at the conference on Democracy in Russia, Uppsala University, Sweden.
Myrdal, G. (1968), Asian Drama: An inquiry into poverty of nations, New York, Pantheon Books. Nye J.S. (1967), “Corruption and Political Development: A Case-Benefit Analysis”, American Political
Science Review, 61(2), pp. 417-427 O’Donnell G. (1999), “Horizontal Accountability in New Democracies.” in The Self-Restraining State, eds.
Schedler, Andreas, Larry Diamond and Marc F. Plattner. Boulder: Lynne Rienner Razafindrakoto, M., Roubaud, F. (2006), Are International Databases on Corruption Reliable? A Comparison
of Expert Opinion Surveys and Household Surveys in Sub-Saharan Africa, DIAL, DT2006/17, Paris. Seligson, M. (2002), “The Impact of Corruption on Regime Legitimacy: A Comparative Study of Four Latin
American Countries”, Journal of Politics, No. 64 (2), pp. 408-433. Taylor–Robinson M. (2007), “Presidential and congressional elections in Honduras, November 2005”,
electoral studies, Volume 26, Issue 2, June 2007, pp. 521-524 World Bank (1997), World Development Report, Washington D.C.
19
Copyright Afrobarometer
World Bank (2002), World Development Report, Washington D.C.
20
Copyright Afrobarometer
Publications List
AFROBAROMETER WORKING PAPERS No. 102 Lavallée, Emmanuell, Mireille Razafindrakoto and François Roubaud. “Corruption and Trust in Political
Institutions in sub-Saharan Africa.” 2008. No. 101 Koussihouèdé, Oswald and Damase Sossou. “Frustration Relative de Démocratie
en Afrique.” 2008. No. 100 Nunn, Nathan and Leonard Wantchekon. “The Trans-Atlantic Slave Trade and the Evolution of Mistrust in
Africa: An Empirical Investigation.” 2008. No. 99 Bratton, Michael. “Voting Buying and Violence in Nigerian Election Campaigns.” 2008. No. 98 Mattes, Robert. “The Material and Political Bases of Lived Poverty in Africa: Insights from the Afrobarometer.”
2008. No. 97 Sarsfield, Rodolfo and Fabián Echegaray. “Looking Behind the Window: Measuring Instrumental and Normative
Reasoning in Support for Democracy.” 2008. No. 96 Kuenzi, Michelle T. “Social Capital And Political Trust In West Africa.” 2008. No. 95 Bratton, Michael and Mwangi S. Kimenyi. “Voting in Kenya: Putting Ethnicity in Perspective.” 2008. No. 94 Logan, Carolyn. “Rejecting the Disloyal Opposition? The Trust Gap in Mass Attitudes Toward Ruling and
Opposition Parties in Africa.” 2008. No. 93 Logan, Carolyn. “Traditional Leaders In Modern Africa: Can Democracy And The Chief Co-Exist?” 2008. No. 92 Dowd, Robert A. and Michael Driessen. “Ethnically Dominated Party Systems And The Quality Of Democracy:
Evidence From Sub-Saharan Africa.” 2008. No. 91 Mattes, Robert and Carlos Shenga. “’Uncritical Citizenship’” in a ‘Low-Information’ Society: Mozambicans in
Comparative Perspective.” 2007. No. 90 Bhavnani, Ravi and David Backer. “Social Capital and Political Violence in Sub-Saharan Africa.” 2007. No. 89 Eiffert, Ben, Edward Miguel and Daniel Posner. “Political Sources of Ethnic Identification in Africa.” 2007. No. 88 Moehler, Devra C. and Staffan I. Lindberg. “More than Huntington's 'Test': Turnovers as Antidotes to
Polarization.” 2007. No. 87 Chikwanha, Annie and Eldred Masunungure. “Young and Old in Sub-Saharan Africa: Who Are the Real
Democrats?” 2007. No. 86 Razafindrakoto, Mireille and Francois Roubaud. “Corruption, Institutional Discredit and Exclusion of the Poor:
A Poverty Trap.” 2007. No. 85 Konold, Carrie. “Perceived Corruption, Public Opinion and Social Influence in Senegal.” 2007. No. 84 Alemika,Etannibi. “Quality of Elections, Satisfaction with Democracy and Political Trust in Africa.” 2007.
21
Copyright Afrobarometer
No. 83 Cheeseman, Nicholas And Robert Ford. “Ethnicity As A Political Cleavage.” 2007. No. 82 Mattes, Robert. “Democracy Without People: Political Institutions And Citizenship In The New South Africa.”
2007. No. 81 Armah-Attoh, Daniel, E Gyimah-Boadi And Annie Barbara Chikwanha. “Corruption And Institutional Trust In
Africa: Implications For Democratic Development.” 2007. No. 80 Wantchekon, Leonard and Gwendolyn Taylor. “Political Rights versus Public Goods: Uncovering the
Determinants of Satisfaction with Democracy in Africa.” 2007. No. 79 Chang, Eric. “Political Transition, Corruption, and Income Inequality in Third Wave Democracies.” 2007. No. 78 Battle, Martin and Seely, Jennifer C. “It’s All Relative: Competing Models of Vote Choice in Benin.” 2007. No.77 Wantchekon, Leonard, Paul-Aarons Ngomo, Babaly Sall and Mohamadou Sall. “Support for Competitive
Politics and Government Performance: Public Perceptions of Democracy in Senegal.” 2007. No.76 Graham, Carol and Matthew Hoover. “Optimism and Poverty in Africa: Adaptation or a Means to Survival?”
2007. No.75 Evans, Geoffrey and Pauline Rose. “Education and Support for Democracy in Sub-Saharan Africa: Testing
Mechanisms of Influence.” 2007. No.74 Levi, Margaret and Audrey Sacks. “Legitimating Beliefs: Sources and Indicators.” 2007. No.73 McLean, Lauren Morris. “The Micro-Dynamics of Welfare State Retrenchment and the Implications for Citizenship in Africa.” 2007. No.72 Ferree, Karen and Jeremy Horowitz. “Identity Voting and the Regional Census in Malawi.” 2007. No.71 Cho, Wonbin and Matthew F. Kirwin. “A Vicious Circle of Corruption and Mistrust in Institutions in sub-
Saharan Africa: A Micro-level Analysis.” 2007. No.70 Logan, Carolyn, Thomas P. Wolf and Robert Sentamu. “Kenyans and Democracy: What Do They Really Want
From It Anyway?” 2007. No.69 Uslaner, Eric. “Corruption and the Inequality Trap in Africa.” 2007. No.68 Lewis, Peter. “Identity, Institutions and Democracy in Nigeria.” 2007. No.67 Mattes, Robert. “Public Opinion Research in Emerging Democracies: Are the Processes Different?” 2007. No.66 Cho, Wonbin. “Ethnic Fractionalization, Electoral Institutions, and Africans’ Political Attitudes.” 2007. No.65 Bratton, Michael. “Are You Being Served? Popular Satisfaction with Health and Education Services in Africa.”
2006. No.64 Fernandez, Kenneth E. and Michelle Kuenzi. “Crime and Support for Democracy: Revisiting Modernization
Theory.” 2006. No.63 Bratton, Michael and Carolyn Logan. “Voters But Not Yet Citizens: The Weak Demand for Vertical
Accountability in Africa’s Unclaimed Democracies.” 2006.
22
Copyright Afrobarometer
No.62 Bratton, Michael and Mxolisi Sibanyoni. “Delivery or Responsiveness? A Popular Scorecard of Local Government Performance in South Africa.” 2006.
No.61 The Afrobarometer Network. “Citizens and the State in Africa: New Results From Afrobarometer Round 3.”
2006.
No.60 The Afrobarometer Network. “Where is Africa going? Views From Below: A Compendium of Trends in Public Opinion in 12 African Countries, 1999-2006.” 2006.
No.59 Bratton, Michael and Eldred Masunungure. “Popular Reactions to State Repression: Operation Murambatsvina in Zimbabwe.” 2006.
No.58 Logan, Carolyn and Michael Bratton. “The Political Gender Gap in Africa: Similar Attitudes, Different
Behaviors.” 2006. No.57 Evans, Geoffrey and Pauline Rose. “Support for Democracy in Malawi: Does Schooling Matter?” 2006. No.56 Bratton, Michael. “Poor People and Democratic Citizenship in Africa.” 2006. No.55 Moehler, Devra C. “Free and Fair or Fraudulent and Forged: Elections and Legitimacy in Africa.” 2005. No.54 Stasavage, David. “Democracy and Primary School Attendance: Aggregate and Individual Level Evidence from
Africa.” 2005. No. 53 Reis, Deolinda, Francisco Rodrigues and Jose Semedo. “ Atitudes em Relação à Qualidade da Democracia em
Cabo Verde.” 2005. No. 52 Lewis, Peter and Etannibi Alemika. “Seeking the Democratic Dividend: Public Attitudes and Attempted Reform
in Nigeria.” 2005. No. 51 Kuenzi, Michelle and Gina Lambright. “Who Votes in Africa? An Examination of Electoral Turnout in 10
African Countries.” 2005. No.50 Mattes, Robert and Doh Chull Shin. “The Democratic Impact of Cultural Values in Africa and Asia: The Cases
of South Korea and South Africa.” 2005. No.49 Cho, Wonbin and Michael Bratton. “Electoral Institutions, Partisan Status, and Political Support: A Natural
Experiment from Lesotho.” 2005. No.48 Bratton, Michael and Peter Lewis. “The Durability of Political Goods? Evidence from Nigeria’s New
Democracy.” 2005.
No.47 Keulder, Christiaan and Tania Wiese. “Democracy Without Democrats? Results from the 2003 Afrobarometer Survey in Namibia.” 2005.
No.46 Khaila, Stanley and Catherine Chibwana. “Ten Years of Democracy in Malawi: Are Malawians Getting What
They Voted For?” 2005. No.45 Schedler, Andreas and Rodolfo Sarsfield. “Democrats with Adjectives: Linking Direct and Indirect Measures of
Democratic Support.” 2004. No.44 Bannon, Alicia, Edward Miguel, and Daniel N. Posner. “Sources of Ethnic Identification in Africa.” 2004. No.43 Bratton, Michael. “State Building and Democratization in Sub-Saharan Africa: Forwards, Backwards, or
Together?” 2004.
23
Copyright Afrobarometer
No.42 Chikwanha, Annie, Tulani Sithole, and Michael Bratton. “The Power of Propaganda: Public Opinion in
Zimbabwe, 2004.” 2004. No.41 Mulenga, Chileshe L., Annie Barbara Chikwanha, and Mbiko Msoni. “Satisfaction with Democracy and
Performance of the New Deal Government: Attitudes and Perceptions of Zambians.” 2004. No.40 Ferree, Karen E. “The Micro-Foundations of Ethnic Voting: Evidence from South Africa.” 2004. No.39 Cho, Wonbin. “Political Institutions and Satisfaction with Democracy in Sub-Saharan Africa.” 2004. No.38 Mattes, Robert. “Understanding Identity in Africa: A First Cut.” 2004. No.37 Leysens, Anthony J. “Marginalisation in Southern Africa: Transformation from Below?” 2004. No.36 Sall, Babaly and Zeric Kay Smith, with Mady Dansokho. “Libéralisme, Patrimonialisme ou Autoritarisme
Atténue : Variations autour de la Démocratie Sénégalaise.” 2004. No.35 Coulibaly, Massa and Amadou Diarra. “Démocratie et légtimation du marché: Rapport d’enquête
Afrobaromètre au Mali, décembre 2002.” 2004.
No.34 The Afrobarometer Network. “Afrobarometer Round 2: Compendium of Results from a 15-Country Survey.” 2004.
No.33 Wolf, Thomas P., Carolyn Logan, and Jeremiah Owiti. “A New Dawn? Popular Optimism in Kenya After the
Transition.” 2004.
No.32 Gay, John and Robert Mattes. “The State of Democracy in Lesotho.” 2004.
No.31 Mattes, Robert and Michael Bratton. “Learning about Democracy in Africa: Awareness, Performance, and Experience.” 2003
No.30 Pereira, Joao, Ines Raimundo, Annie Chikwanha, Alda Saute, and Robert Mattes. “Eight Years of Multiparty Democracy in Mozambique: The Public’s View.” 2003
No.29 Gay, John. “Development as Freedom: A Virtuous Circle?” 2003. No.28 Gyimah-Boadi, E. and Kwabena Amoah Awuah Mensah. “The Growth of Democracy in Ghana. Despite
Economic Dissatisfaction: A Power Alternation Bonus?” 2003.
No.27 Logan, Carolyn J., Nansozi Muwanga, Robert Sentamu, and Michael Bratton. “Insiders and Outsiders: Varying Perceptions of Democracy and Governance in Uganda.” 2003.
No.26 Norris, Pippa and Robert Mattes. “Does Ethnicity Determine Support for the Governing Party?” 2003. No.25 Ames, Barry, Lucio Renno and Francisco Rodrigues. “Democracy, Market Reform, and Social Peace in Cape
Verde.” 2003. No.24 Mattes, Robert, Christiaan Keulder, Annie B. Chikwana, Cherrel Africa and Yul Derek Davids. “Democratic
Governance in South Africa: The People’s View.” 2003. No.23 Mattes, Robert, Michael Bratton and Yul Derek Davids. “Poverty, Survival, and Democracy in Southern
Africa.” 2003.
24
Copyright Afrobarometer
No.22 Pereira, Joao C. G., Yul Derek Davids and Robert Mattes. “Mozambicans’ Views of Democracy and Political Reform: A Comparative Perspective.” 2003.
No.21 Whiteside, Alan, Robert Mattes, Samantha Willan and Ryann Manning. “Examining HIV/AIDS in Southern Africa Through the Eyes of Ordinary Southern Africans.” 2002.
No.20 Lewis, Peter, Etannibi Alemika and Michael Bratton. “Down to Earth: Changes in Attitudes Towards
Democracy and Markets in Nigeria.” 2002.
No.19 Bratton, Michael. “Wide but Shallow: Popular Support for Democracy in Africa.” 2002. No.18 Chaligha, Amon, Robert Mattes, Michael Bratton and Yul Derek Davids. “Uncritical Citizens and Patient
Trustees? Tanzanians’ Views of Political and Economic Reform.” 2002. No.17 Simutanyi, Neo. “Challenges to Democratic Consolidation in Zambia: Public Attitudes to Democracy and the
Economy.” 2002.
No.16 Tsoka, Maxton Grant. “Public Opinion and the Consolidation of Democracy in Malawi.” 2002. No.15 Keulder, Christiaan. “Public Opinion and Consolidation of Democracy in Namibia.” 2002.
No.14 Lekorwe, Mogopodi, Mpho Molomo, Wilford Molefe, and Kabelo Moseki. “Public Attitudes Toward
Democracy, Governance, and Economic Development in Botswana.” 2001. No.13 Gay, John and Thuso Green. “Citizen Perceptions of Democracy, Governance, and Political Crisis in Lesotho.”
2001. No.12 Chikwanha-Dzenga, Annie Barbara, Eldred Masunungure, and Nyasha Madingira. “Democracy and National
Governance in Zimbabwe: A Country Survey Report.” 2001. No. 11 The Afrobarometer Network. “Afrobarometer Round I: Compendium of Comparative Data from a Twelve-
Nation Survey.” 2002 No.10 Bratton, Michael and Robert Mattes. “Popular Economic Values and Economic Reform in Southern Africa.”
2001. No. 9 Bratton, Michael, Massa Coulibaly, and Fabiana Machado. “Popular Perceptions of Good Governance in Mali.”
March 2000.
No.8 Mattes, Robert, Yul Derek Davids, and Cherrel Africa. “Views of Democracy in South Africa and the Region: Trends and Comparisons.” October 2000.
No.7 Mattes, Robert, Yul Derek Davids, Cherrel Africa, and Michael Bratton. “Public Opinion and the Consolidation
of Democracy in Southern Africa.” July 2000. No.6 Bratton, Michael and Gina Lambright. “Uganda’s Referendum 2000: The Silent Boycott.” 2001. No.5 Bratton, Michael and Robert Mattes. “Democratic and Market Reforms in Africa: What ‘the People’ Say.” 2000. No.4 Bratton, Michael, Gina Lambright, and Robert Sentamu. “Democracy and Economy in Uganda: A Public
Opinion Perspective.” 2000. No.3 Lewis, Peter M. and Michael Bratton. “Attitudes to Democracy and Markets in Nigeria.” 2000. No.2 Bratton, Michael, Peter Lewis, and E. Gyimah-Boadi. “Attitudes to Democracy and Markets in Ghana. 1999.
25
Copyright Afrobarometer
No.1 Bratton, Michael and Robert Mattes. “Support for Democracy in Africa: Intrinsic or
Instrumental?” 1999.