Embed Size (px)
Citation preview

REVUE TECHNIQUELUXEMBOURGEOISECAHIER SCIENTIFIQUE BIANNUEL DE LA REVUE TECHNIQUE LUXEMBOURGEOISE 2 | 2010
CAHIER SCIENTIFIQUE
L’A.L.I.A.I. dans l’origine remonte à 1897, et qui regroupe plusieurs organismes apparentés, édite quatre fois par an la Revue Technique, sa publication principale, dédiée à des articles se rapportant aux sujets traités par les profession-nels qu’elle regroupe.
Pour l’ALIAI la Revue Technique Luxembourgeoise et son site Internet sont des moyens de communication essen-tiels donnant à ses membres le contact immédiat avec l’organisation à laquelle ils sont affi liés.
Ces instruments offrent aux entreprises de présenter leur travail devant un public ciblé. La Revue Technique Luxem-bourgeoise possède un passé prestigieux qui lui confère une légitimité auprès des affi liés de l’ALIAI.
La Revue Technique Luxembourgeoise et le site Internet off-rent aux Partenaires de la Revue Technique de l’Association des Ingénieurs, Architectes et Industriels la possibilité de faire connaître leurs produits ou d’informer de cette manière sur la structure de leur entreprise et de toucher un public ciblé de lecteurs intéressés.
Le cahier scientifi que, a pour mission de promouvoir le développement de la recherche et de la culture scientifi que, en contribuant à la diffusion et à la valorisation des connais-sances et des méthodes scientifi ques en vue de soutenir un dialogue entre la science et la société.
Le cahier scientifi que est publié 2 fois par an par la rédac-tion de la Revue Technique. C’est un instrument profession-nel pour scientifi ques, techniciens, étudiants et intéressés professionnels dans le domaine de l’ingénierie, de la tech-nologie, de la recherche, des énergies renouvelables et de l’industrie.
Des articles sur des recherches approfondies par nos col-laborateurs des instituts, des partenaires ou industriels sont publiés dans chaque exemplaire des cahiers scientifi ques.
REVUE TECHNIQUE LUXEMBOURGEOISE
www.revue-technique.lu
revue trimestrielle éditée par
L’Association Luxembourgeoise des Ingénieurs, Architectes et IndustrielsL- 1330 Luxembourg – 6, boulevard Grande-Duchesse Charlottetel 45 13 54 fax 45 09 32
Rédacteur en Chef Michel PetitResponsable Revue Technique Sonja Reicherttel 26 11 46 42 email [email protected] Bohumil Kostohryz
22 CAHIER SCIENTIFIQUECAHIER SCIENTIFIQUE | REVUE TECHNIQUE LUXEMBOURGEOISE 2 | 2010 | REVUE TECHNIQUE LUXEMBOURGEOISE 2 | 2010
Chers lecteurs,
Bonne lecture,
Paul HeuschlingUNI
EDITO_
3CAHIER SCIENTIFIQUECAHIER SCIENTIFIQUE | REVUE TECHNIQUE LUXEMBOURGEOISE 2 | 2010 | REVUE TECHNIQUE LUXEMBOURGEOISE 2 | 2010
Ingénieur dipl. Pierre DornseifferReprésentant membre ALIMinistère du Développement durable et des Infrastructures
Ing. Dipl. Marc FeiderAdministrateur et chef de service Bâtiments / OuvragesSchroeder & Associés
Prof. Dr. Ing. Jean-Régis Hadji-MinaglouUniversité du Luxembourg, Unité de recherche: IngénierieFaculté des Sciences, de la Technologie et de la Communication
Informaticien dipl. Patrick HitzelbergerCentre de Recherche Public - Gabriel LippmannDépartement ISC
_comité de lecture
_INDEX
44 CAHIER SCIENTIFIQUECAHIER SCIENTIFIQUE | REVUE TECHNIQUE LUXEMBOURGEOISE 2 | 2010 | REVUE TECHNIQUE LUXEMBOURGEOISE 2 | 2010
06_ FRANÇOIS HILGER, À LA MÉMOIRE D’UN GRAND HOMME DE SCIENCE LUXEMBOURGEOIS Micheline Vandenbol
08_ VERBESSERUNG DES FERTIGUNGSABLAUFS VON SPEZIAL WERKZEUGEN Prof. Ing. Peter Plapper / Christian André
11_ A POWERFUL TOOL TO CONNECT YOUNG RESEARCHERS IN LUXEMBOURG BioLux Networking Team12_ XENOBIOTIKA IN LUXEMBURGER FLIESSGEWÄSSERN KONZENTRATIONEN, HERKUNFT, WIRKUNG, MINDERUNGSMASSNAHMEN Dr rer nat habil Andreas Krein
18_ ENTWICKLUNG EINER SPEZIELLEN HÜFTINTERIMSPROTHESE PD Dr. med. Jens Kelm, Dr.-Ing. Thomas Thielen, Prof. Dr.-Ing. Stefan Maas, Prof. Dr.-Ing. Arno Zürbes,
Ass.-Prof. Dr.-Ing. Danièle Waldmann, Prof. Dr .med. Eduard Schmitt, Dr. med. Konstantinos Anagnostakos
24_ MECHATRONISCHE PRODUKTENTWICKLUNG Dr. Thomas Andreas
30_ DISTRIBUTED OPTIMISATION BASED AGENTS FOR THE INTEGRATION OF SMART POWER GRIDS Dipl. phys Ralf Hoben
32_ TIMELINE BASED ASSET BROWSING Jérôme Wagener
34_ CONTRIBUTION À LA SIMULATION DES PROCESSUS INDUSTRIELS Ing. dipl. Henri Muller
38_ DISTRIBUTION OF TEMPERATURE IN STEEL AND COMPOSITE BEAMS AND JOINTS UNDER NATURAL FIRE Dr. Ing. F. Hanus, Prof. Dr. Ing. J.-M. Franssen
44_ A CONTROLLED HYBRID MULTI-BODY SIMULATION MODEL OF A GALILEO GROUND ANTENNA Laurent Breyer, Prof. Dr. Jean-Régis Hadji Minaglou,Prof. Dr. Stefan Maas, Prof. Dr. Arno Zürbes
48_ NEW WAYS TO GREEN PATENTS Sigrid Kohll, Serge Quazzotti
Ing. Dipl. Dr. en méchanique Alain LougeDirecteur de Recherches et de DéveloppementsGroupe Eurobéton
Prof. Dr. Ing. Michel MarsoProfesseur en Technologie de TélécommunicationsUniversité du Luxembourg, Unité de recherche: IngénierieFaculté des Sciences, de la Technologie et de la Communication
Dr. Paul SchosselerDirecteurCRTE / CRP Henri Tudor
38 CAHIER SCIENTIFIQUE | REVUE TECHNIQUE LUXEMBOURGEOISE 2 | 2010
DISTRIBUTION OF TEMPERATURE IN STEEL AND COM-POSITE BEAMS AND JOINTS UNDER NATURAL FIRE_
The control of fire by mankind has definitely enabled it to improve its level of well-being and its conditions of life but fire has also been a source of danger for humans in numerous dramatic cases. By the consequence of evil-minded acts or off-guard moments, fire causes the death of persons and the destruction of material goods. During the second part of the 20th century, an effort was made in Europe to develop and apply more active as well as passive measures in order to limit the damages caused by fire.
Dr. Ing. F. HanusProf. Dr. Ing. J.-M. Franssen
Structural Fire Engineering is one of the disciplines of Fire Safety Engineering. That latter one is a science aimed at limiting the death of people and damages in buildings sub-jected to fi re, by application of engineering. Structural Fire Engineering is one of these disciplines and is aimed at ana-lyzing the effects of fi re on a structure and designing mem-bers under the combination of thermal and mechanical loa-dings applied in case of fi re. A general analysis of Structural Fire Engineer consists of three basic steps: the modeling of the fi re, the thermal analysis and the structural analysis.
In comparison with other types of constructions, unpro-tected steel structures lose rather quickly their stability when submitted to elevated temperatures: the relative thinness of individual elements causes a fast heating of structural ele-ments and a rapid reduction of their mechanical properties. Consequently, steel structures are often thermally-protected by insulating materials or intumescent paints [1]. However, the cost of fi re protection is considerable: the increase of cost may reach 30% of the bare steelwork [2]. Consequent-ly, architects and engineers try to adapt the design of steel structures or to use composite action in order to optimize or avoid the use of fi re-protecting materials [3 & 4].
Until recently [5], the analysis of the behaviour of steel and composite structures subjected to fi re conditions has not been focused on joints because the less severe exposition and the presence of more material in the joint zone indu-ce lower temperatures in that zone than in the connected members. The large amount of joints typologies, the large number of parameters infl uencing their behaviour and the diffi culty to realize experimental tests have lead to a lack of suffi cient knowledge about joints behaviour under fi re conditions.
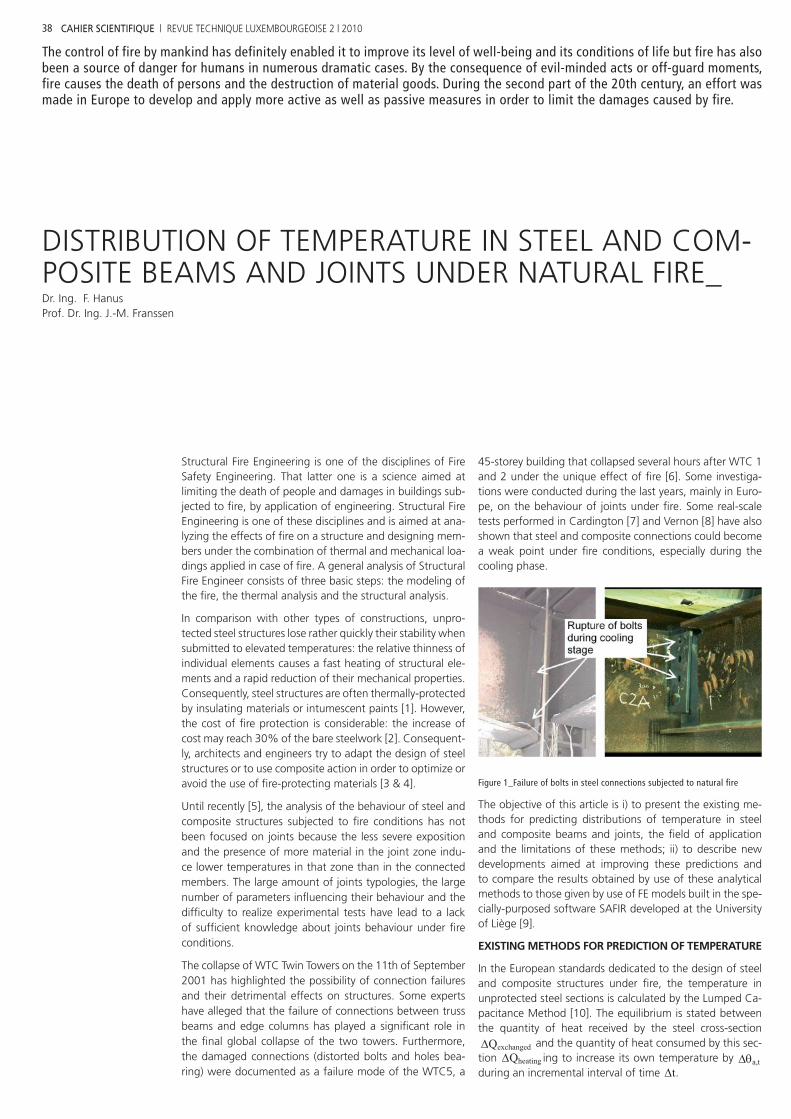
The collapse of WTC Twin Towers on the 11th of September 2001 has highlighted the possibility of connection failures and their detrimental effects on structures. Some experts have alleged that the failure of connections between truss beams and edge columns has played a signifi cant role in the fi nal global collapse of the two towers. Furthermore, the damaged connections (distorted bolts and holes bea-ring) were documented as a failure mode of the WTC5, a
45-storey building that collapsed several hours after WTC 1 and 2 under the unique effect of fi re [6]. Some investiga-tions were conducted during the last years, mainly in Euro-pe, on the behaviour of joints under fi re. Some real-scale tests performed in Cardington [7] and Vernon [8] have also shown that steel and composite connections could become a weak point under fi re conditions, especially during the cooling phase.
Figure 1_Failure of bolts in steel connections subjected to natural fire
The objective of this article is i) to present the existing me-thods for predicting distributions of temperature in steel and composite beams and joints, the fi eld of application and the limitations of these methods; ii) to describe new developments aimed at improving these predictions and to compare the results obtained by use of these analytical methods to those given by use of FE models built in the spe-cially-purposed software SAFIR developed at the University of Liège [9].
EXISTING METHODS FOR PREDICTION OF TEMPERATURE
In the European standards dedicated to the design of steel and composite structures under fi re, the temperature in unprotected steel sections is calculated by the Lumped Ca-pacitance Method [10]. The equilibrium is stated between the quantity of heat received by the steel cross-section
Qexchanged and the quantity of heat consumed by this sec-tion Qheating ing to increase its own temperature by a,t during an incremental interval of time t.
(Eq. 1)
Am and V are the surface area and the volume of steel per unit length of the member, ca and a are the specifi c heat and the unit mass of steel and hnet,d is the design value of the net heat fl ux accounting for thermal exchanges by convection and radiation. The correction factor for shadow effect ksh accounts for the reduced exposure of concave-shaped sections to heat fl uxes compared to convex sections with a same section factor Am/V.
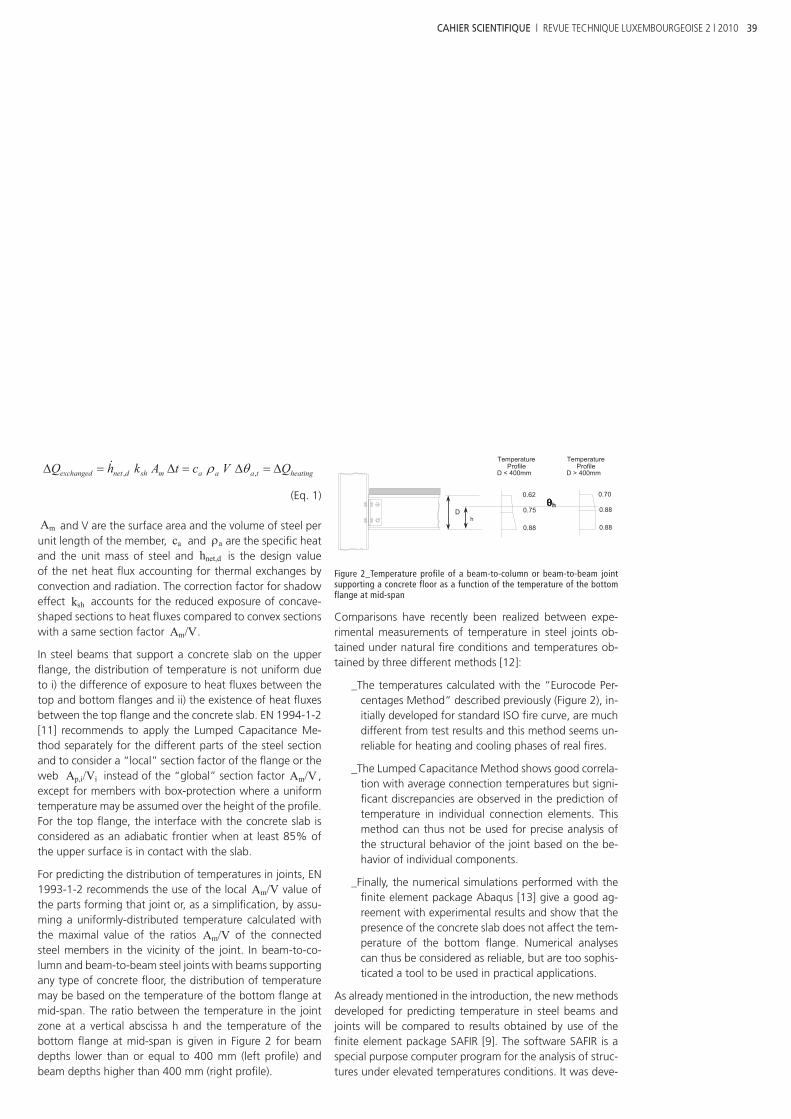
In steel beams that support a concrete slab on the upper fl ange, the distribution of temperature is not uniform due to i) the difference of exposure to heat fl uxes between the top and bottom fl anges and ii) the existence of heat fl uxes between the top fl ange and the concrete slab. EN 1994-1-2 [11] recommends to apply the Lumped Capacitance Me-thod separately for the different parts of the steel section and to consider a “local” section factor of the fl ange or the web Ap,i/Vi instead of the “global” section factor Am/V , except for members with box-protection where a uniform temperature may be assumed over the height of the profi le. For the top fl ange, the interface with the concrete slab is considered as an adiabatic frontier when at least 85% of the upper surface is in contact with the slab.
For predicting the distribution of temperatures in joints, EN 1993-1-2 recommends the use of the local Am/V value of the parts forming that joint or, as a simplifi cation, by assu-ming a uniformly-distributed temperature calculated with the maximal value of the ratios Am/V of the connected steel members in the vicinity of the joint. In beam-to-co-lumn and beam-to-beam steel joints with beams supporting any type of concrete fl oor, the distribution of temperature may be based on the temperature of the bottom fl ange at mid-span. The ratio between the temperature in the joint zone at a vertical abscissa h and the temperature of the bottom fl ange at mid-span is given in Figure 2 for beam depths lower than or equal to 400 mm (left profi le) and beam depths higher than 400 mm (right profi le).
Figure 2_Temperature profile of a beam-to-column or beam-to-beam joint supporting a concrete floor as a function of the temperature of the bottom flange at mid-span
Comparisons have recently been realized between expe-rimental measurements of temperature in steel joints ob-tained under natural fi re conditions and temperatures ob-tained by three different methods [12]:
_The temperatures calculated with the “Eurocode Per-centages Method” described previously (Figure 2), in-itially developed for standard ISO fi re curve, are much different from test results and this method seems un-reliable for heating and cooling phases of real fi res.
_The Lumped Capacitance Method shows good correla-tion with average connection temperatures but signi-fi cant discrepancies are observed in the prediction of temperature in individual connection elements. This method can thus not be used for precise analysis of the structural behavior of the joint based on the be-havior of individual components.
_Finally, the numerical simulations performed with the fi nite element package Abaqus [13] give a good ag-reement with experimental results and show that the presence of the concrete slab does not affect the tem-perature of the bottom fl ange. Numerical analyses can thus be considered as reliable, but are too sophis-ticated a tool to be used in practical applications.
As already mentioned in the introduction, the new methods developed for predicting temperature in steel beams and joints will be compared to results obtained by use of the fi nite element package SAFIR [9]. The software SAFIR is a special purpose computer program for the analysis of struc-tures under elevated temperatures conditions. It was deve-
39CAHIER SCIENTIFIQUE | REVUE TECHNIQUE LUXEMBOURGEOISE 2 | 2010
heatingtaaamshdnetexchanged QVctAkhQ ,, Temperature
ProfileD > 400mm
TemperatureProfile
D < 400mm
0.88
0.75
0.62
0.88
0.88
0.70
Dh
θθθθh
40 CAHIER SCIENTIFIQUE | REVUE TECHNIQUE LUXEMBOURGEOISE 2 | 2010
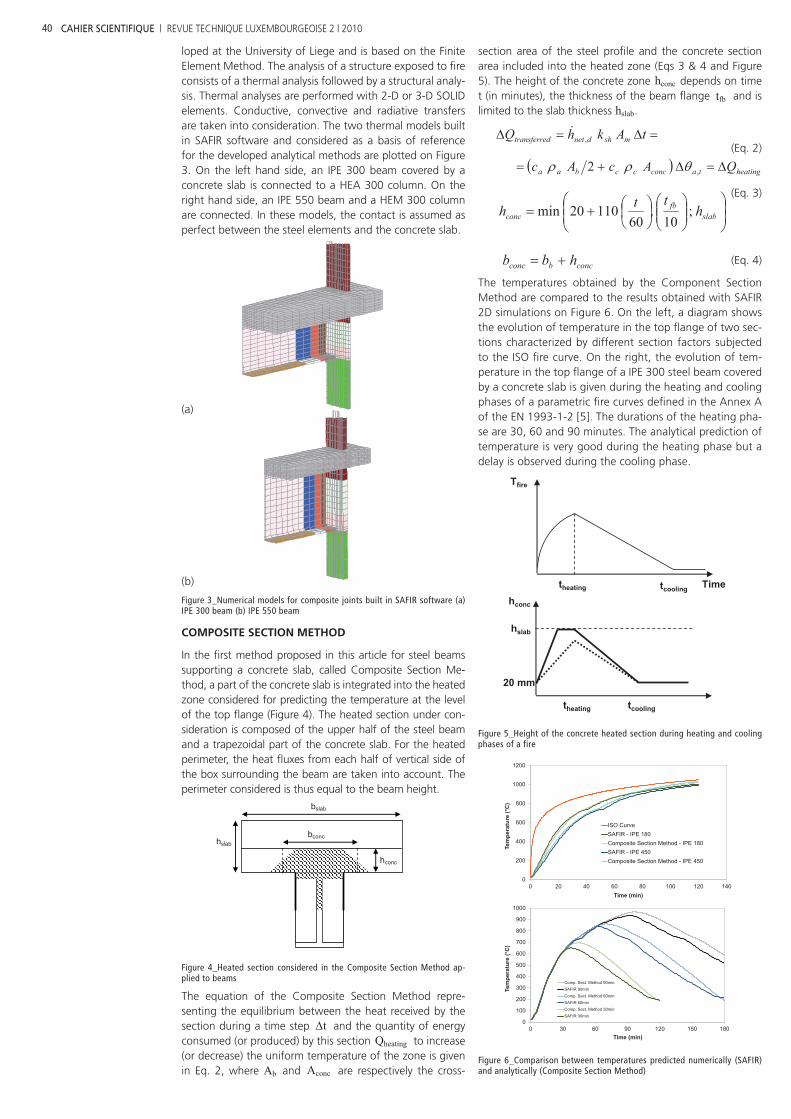
loped at the University of Liege and is based on the Finite Element Method. The analysis of a structure exposed to fi re consists of a thermal analysis followed by a structural analy-sis. Thermal analyses are performed with 2-D or 3-D SOLID elements. Conductive, convective and radiative transfers are taken into consideration. The two thermal models built in SAFIR software and considered as a basis of reference for the developed analytical methods are plotted on Figure 3. On the left hand side, an IPE 300 beam covered by a concrete slab is connected to a HEA 300 column. On the right hand side, an IPE 550 beam and a HEM 300 column are connected. In these models, the contact is assumed as perfect between the steel elements and the concrete slab.
(a)
(b)
Figure 3_Numerical models for composite joints built in SAFIR software (a) IPE 300 beam (b) IPE 550 beam
COMPOSITE SECTION METHOD
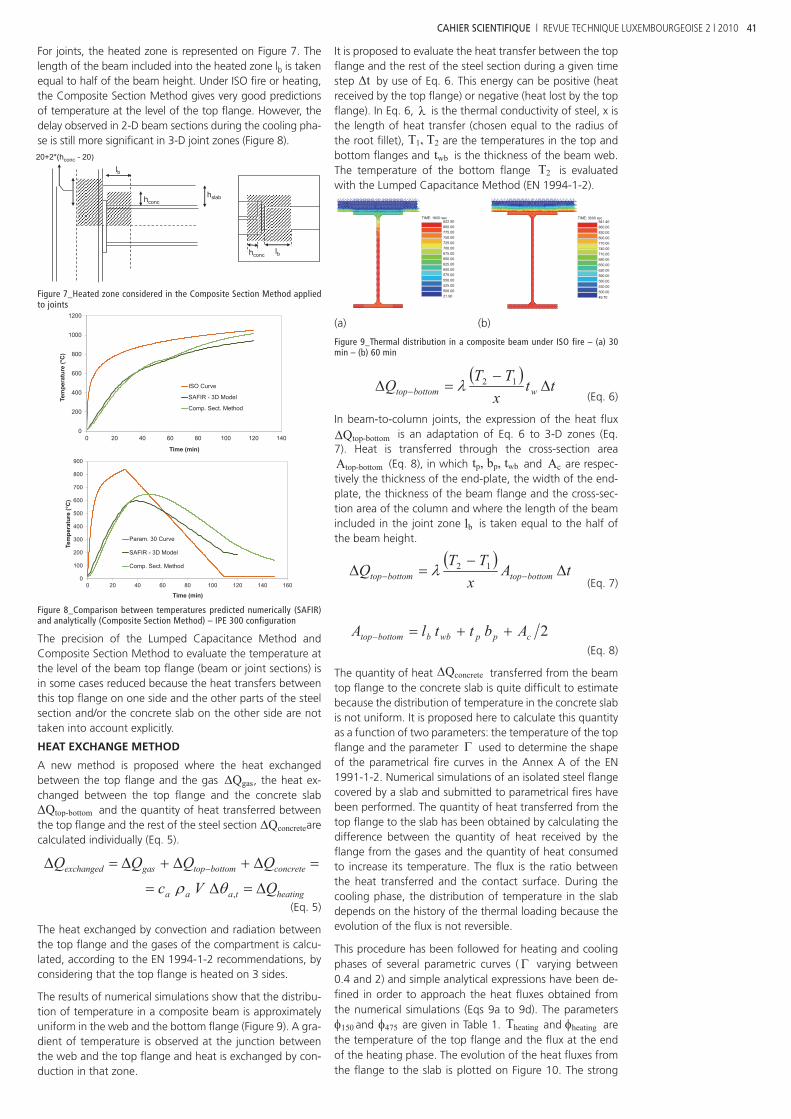
In the fi rst method proposed in this article for steel beams supporting a concrete slab, called Composite Section Me-thod, a part of the concrete slab is integrated into the heated zone considered for predicting the temperature at the level of the top fl ange (Figure 4). The heated section under con-sideration is composed of the upper half of the steel beam and a trapezoidal part of the concrete slab. For the heated perimeter, the heat fl uxes from each half of vertical side of the box surrounding the beam are taken into account. The perimeter considered is thus equal to the beam height.
Figure 4_Heated section considered in the Composite Section Method ap-plied to beams
The equation of the Composite Section Method repre-senting the equilibrium between the heat received by the section during a time step t and the quantity of energy consumed (or produced) by this section Qheating to increase (or decrease) the uniform temperature of the zone is given in Eq. 2, where Ab and Aconc are respectively the cross-
section area of the steel profi le and the concrete section area included into the heated zone (Eqs 3 & 4 and Figure 5). The height of the concrete zone hconc depends on time t (in minutes), the thickness of the beam fl ange tfb and is limited to the slab thickness hslab.
(Eq. 2)
(Eq. 3)
(Eq. 4)
The temperatures obtained by the Component Section Method are compared to the results obtained with SAFIR 2D simulations on Figure 6. On the left, a diagram shows the evolution of temperature in the top fl ange of two sec-tions characterized by different section factors subjected to the ISO fi re curve. On the right, the evolution of tem-perature in the top fl ange of a IPE 300 steel beam covered by a concrete slab is given during the heating and cooling phases of a parametric fi re curves defi ned in the Annex A of the EN 1993-1-2 [5]. The durations of the heating pha-se are 30, 60 and 90 minutes. The analytical prediction of temperature is very good during the heating phase but a delay is observed during the cooling phase.
Figure 5_Height of the concrete heated section during heating and cooling phases of a fire
Figure 6_Comparison between temperatures predicted numerically (SAFIR) and analytically (Composite Section Method)
hconc
bconc
bslab
hslab
slabfb
conc htth ;10
.60
11020min
mshdnetdtransferre tAkhQ ,
heatingtaconcccbaa QAcAc ,2
concbconc hbb
0
200
400
600
800
1000
1200
0 20 40 60 80 100 120 140
Tem
pera
ture
(°C
)
Time (min)
ISO CurveSAFIR - IPE 180Composite Section Method - IPE 180SAFIR - IPE 450Composite Section Method - IPE 450
0
100
200
300
400
500
600
700
800
900
1000
0 30 60 90 120 150 180
Tem
pera
ture
(°C
)
Time (min)
Comp. Sect. Method 90minSAFIR 90minComp. Sect. Method 60minSAFIR 60minComp. Sect. Method 30minSAFIR 30min
Time
Tfire
theating tcooling
hconc
hslab
20 mm
theating tcooling
41CAHIER SCIENTIFIQUE | REVUE TECHNIQUE LUXEMBOURGEOISE 2 | 2010
For joints, the heated zone is represented on Figure 7. The length of the beam included into the heated zone lb is taken equal to half of the beam height. Under ISO fi re or heating, the Composite Section Method gives very good predictions of temperature at the level of the top fl ange. However, the delay observed in 2-D beam sections during the cooling pha-se is still more signifi cant in 3-D joint zones (Figure 8).
Figure 7_Heated zone considered in the Composite Section Method applied to joints
Figure 8_Comparison between temperatures predicted numerically (SAFIR) and analytically (Composite Section Method) – IPE 300 configuration
The precision of the Lumped Capacitance Method and Composite Section Method to evaluate the temperature at the level of the beam top fl ange (beam or joint sections) is in some cases reduced because the heat transfers between this top fl ange on one side and the other parts of the steel section and/or the concrete slab on the other side are not taken into account explicitly.
HEAT EXCHANGE METHOD
A new method is proposed where the heat exchanged between the top fl ange and the gas Qgas, the heat ex-changed between the top fl ange and the concrete slab
Qtop-bottom and the quantity of heat transferred between the top fl ange and the rest of the steel section Qconcrete are calculated individually (Eq. 5).
(Eq. 5)
The heat exchanged by convection and radiation between the top fl ange and the gases of the compartment is calcu-lated, according to the EN 1994-1-2 recommendations, by considering that the top fl ange is heated on 3 sides.
The results of numerical simulations show that the distribu-tion of temperature in a composite beam is approximately uniform in the web and the bottom fl ange (Figure 9). A gra-dient of temperature is observed at the junction between the web and the top fl ange and heat is exchanged by con-duction in that zone.
It is proposed to evaluate the heat transfer between the top fl ange and the rest of the steel section during a given time step t by use of Eq. 6. This energy can be positive (heat received by the top fl ange) or negative (heat lost by the top fl ange). In Eq. 6, is the thermal conductivity of steel, x is the length of heat transfer (chosen equal to the radius of the root fi llet), T1, T2 are the temperatures in the top and bottom fl anges and twb is the thickness of the beam web. The temperature of the bottom fl ange T2 is evaluated with the Lumped Capacitance Method (EN 1994-1-2).
(a) (b)
Figure 9_Thermal distribution in a composite beam under ISO fire – (a) 30 min – (b) 60 min
(Eq. 6)
In beam-to-column joints, the expression of the heat fl ux
Qtop-bottom is an adaptation of Eq. 6 to 3-D zones (Eq. 7). Heat is transferred through the cross-section area Atop-bottom (Eq. 8), in which tp, bp, twb and Ac are respec-tively the thickness of the end-plate, the width of the end-plate, the thickness of the beam fl ange and the cross-sec-tion area of the column and where the length of the beam included in the joint zone lb is taken equal to the half of the beam height.
(Eq. 7)
(Eq. 8)
The quantity of heat Qconcrete transferred from the beam top fl ange to the concrete slab is quite diffi cult to estimate because the distribution of temperature in the concrete slab is not uniform. It is proposed here to calculate this quantity as a function of two parameters: the temperature of the top fl ange and the parameter used to determine the shape of the parametrical fi re curves in the Annex A of the EN 1991-1-2. Numerical simulations of an isolated steel fl ange covered by a slab and submitted to parametrical fi res have been performed. The quantity of heat transferred from the top fl ange to the slab has been obtained by calculating the difference between the quantity of heat received by the fl ange from the gases and the quantity of heat consumed to increase its temperature. The fl ux is the ratio between the heat transferred and the contact surface. During the cooling phase, the distribution of temperature in the slab depends on the history of the thermal loading because the evolution of the fl ux is not reversible.
This procedure has been followed for heating and cooling phases of several parametric curves ( varying between 0.4 and 2) and simple analytical expressions have been de-fi ned in order to approach the heat fl uxes obtained from the numerical simulations (Eqs 9a to 9d). The parameters
150 and 475 are given in Table 1. Theating and heating are the temperature of the top fl ange and the fl ux at the end of the heating phase. The evolution of the heat fl uxes from the fl ange to the slab is plotted on Figure 10. The strong
hconc lb
lb
hconc hslab
20+2*(hconc - 20)
0
200
400
600
800
1000
1200
0 20 40 60 80 100 120 140
Tem
pera
ture
(°C
)
Time (min)
ISO Curve
SAFIR - 3D Model
Comp. Sect. Method
0
100
200
300
400
500
600
700
800
900
0 20 40 60 80 100 120 140 160
Tem
pera
ture
(°C
)
Time (min)
Param. 30 Curve
SAFIR - 3D Model
Comp. Sect. Method
(a)
TIME: 1800 sec822.90800.00775.00750.00725.00700.00675.00650.00625.00600.00575.00550.00525.00500.0021.90
(b)
TIME: 3600 sec941.40860.00830.00800.00770.00740.00710.00680.00650.00620.00590.00560.00530.00500.0049.70
concretebottomtopgasexchanged QQQQ
heatingtaaa QVc ,
ttx
TTQ wbottomtop12
tAx
TTQ bottomtopbottomtop12
2cppwbbbottomtop AbttlA
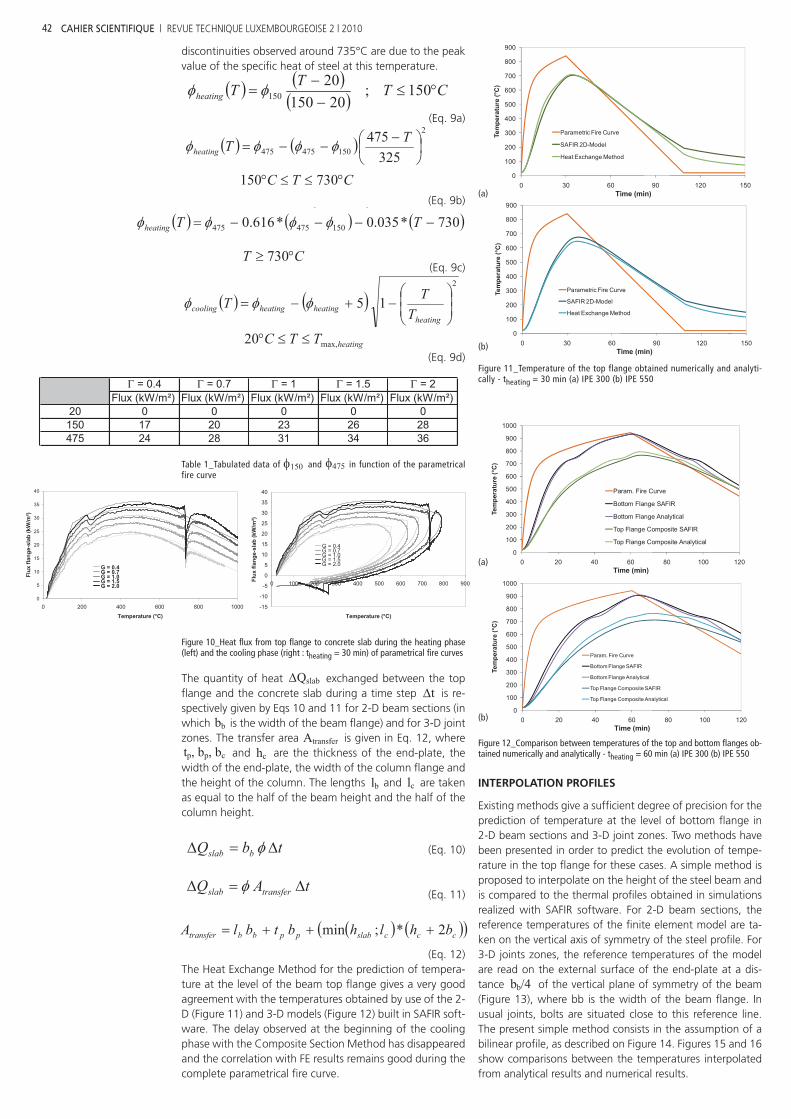
discontinuities observed around 735°C are due to the peak value of the specifi c heat of steel at this temperature.
(Eq. 9a)
(Eq. 9b)
(Eq. 9c)
(Eq. 9d)
Table 1_Tabulated data of 150 and 475 in function of the parametrical fire curve
Figure 10_Heat fl ux from top fl ange to concrete slab during the heating phase (left) and the cooling phase (right : theating = 30 min) of parametrical fi re curves
The quantity of heat Qslab exchanged between the top fl ange and the concrete slab during a time step t is re-spectively given by Eqs 10 and 11 for 2-D beam sections (in which bb is the width of the beam fl ange) and for 3-D joint zones. The transfer area Atransfer is given in Eq. 12, where tp, bp, bc and hc are the thickness of the end-plate, the width of the end-plate, the width of the column fl ange and the height of the column. The lengths lb and lc are taken as equal to the half of the beam height and the half of the column height.
(Eq. 10)
(Eq. 11)
(Eq. 12)The Heat Exchange Method for the prediction of tempera-ture at the level of the beam top fl ange gives a very good agreement with the temperatures obtained by use of the 2-D (Figure 11) and 3-D models (Figure 12) built in SAFIR soft-ware. The delay observed at the beginning of the cooling phase with the Composite Section Method has disappeared and the correlation with FE results remains good during the complete parametrical fi re curve.
(a)
(b)
Figure 11_Temperature of the top flange obtained numerically and analyti-cally - theating = 30 min (a) IPE 300 (b) IPE 550
(a)
(b)
Figure 12_Comparison between temperatures of the top and bottom fl anges ob-tained numerically and analytically - theating = 60 min (a) IPE 300 (b) IPE 550
INTERPOLATION PROFILES
Existing methods give a suffi cient degree of precision for the prediction of temperature at the level of bottom fl ange in 2-D beam sections and 3-D joint zones. Two methods have been presented in order to predict the evolution of tempe-rature in the top fl ange for these cases. A simple method is proposed to interpolate on the height of the steel beam and is compared to the thermal profi les obtained in simulations realized with SAFIR software. For 2-D beam sections, the reference temperatures of the fi nite element model are ta-ken on the vertical axis of symmetry of the steel profi le. For 3-D joints zones, the reference temperatures of the model are read on the external surface of the end-plate at a dis-tance bb/4 of the vertical plane of symmetry of the beam (Figure 13), where bb is the width of the beam fl ange. In usual joints, bolts are situated close to this reference line. The present simple method consists in the assumption of a bilinear profi le, as described on Figure 14. Figures 15 and 16 show comparisons between the temperatures interpolated from analytical results and numerical results.
42 CAHIER SCIENTIFIQUE | REVUE TECHNIQUE LUXEMBOURGEOISE 2 | 2010
CTTTheating 150;20150
20150
TTheating 325475 2
150475475
heatingTTC max,20
CTC 730150
TTheating 730*035.0*616.0 150475475
CT 730
heatingheatingheatingcooling T
TT2
15
= 0.4 = 0.7 = 1 = 1.5 = 2Flux (kW/m²) Flux (kW/m²) Flux (kW/m²) Flux (kW/m²) Flux (kW/m²)
20 0 0 0 0 0150 17 20 23 26 28475 24 28 31 34 36
0
5
10
15
20
25
30
35
40
0 200 400 600 800 1000
Temperature (°C)
Flux
flan
ge-s
lab
(kW
/m²)
G = 0.4G = 0.7G = 1.0G = 1.5G = 2.0
-15
-10
-5
0
5
10
15
20
25
30
35
40
0 100 200 300 400 500 600 700 800 900
Temperature (°C)
Flux
flan
ge-s
lab
(kW
/m²)
G = 0.4G = 0.7G = 1.0G = 1.5G = 2.0
tbQ bslab
tAQ transferslab
cccslabppbbtransfer bhlhbtblA 2*;min
0
100
200
300
400
500
600
700
800
900
0 30 60 90 120 150
Tem
pera
ture
(°C
)
Time (min)
Parametric Fire Curve
SAFIR 2D-Model
Heat Exchange Method
0
100
200
300
400
500
600
700
800
900
0 30 60 90 120 150
Tem
pera
ture
(°C
)
Time (min)
Parametric Fire Curve
SAFIR 2D-Model
Heat Exchange Method
0
100
200
300
400
500
600
700
800
900
1000
0 20 40 60 80 100 120
Tem
pera
ture
(°C
)
Time (min)
Param. Fire Curve
Bottom Flange SAFIR
Bottom Flange Analytical
Top Flange Composite SAFIR
Top Flange Composite Analytical
0
100
200
300
400
500
600
700
800
900
1000
0 20 40 60 80 100 120
Tem
pera
ture
(°C
)
Time (min)
Param. Fire Curve
Bottom Flange SAFIR
Bottom Flange Analytical
Top Flange Composite SAFIR
Top Flange Composite Analytical
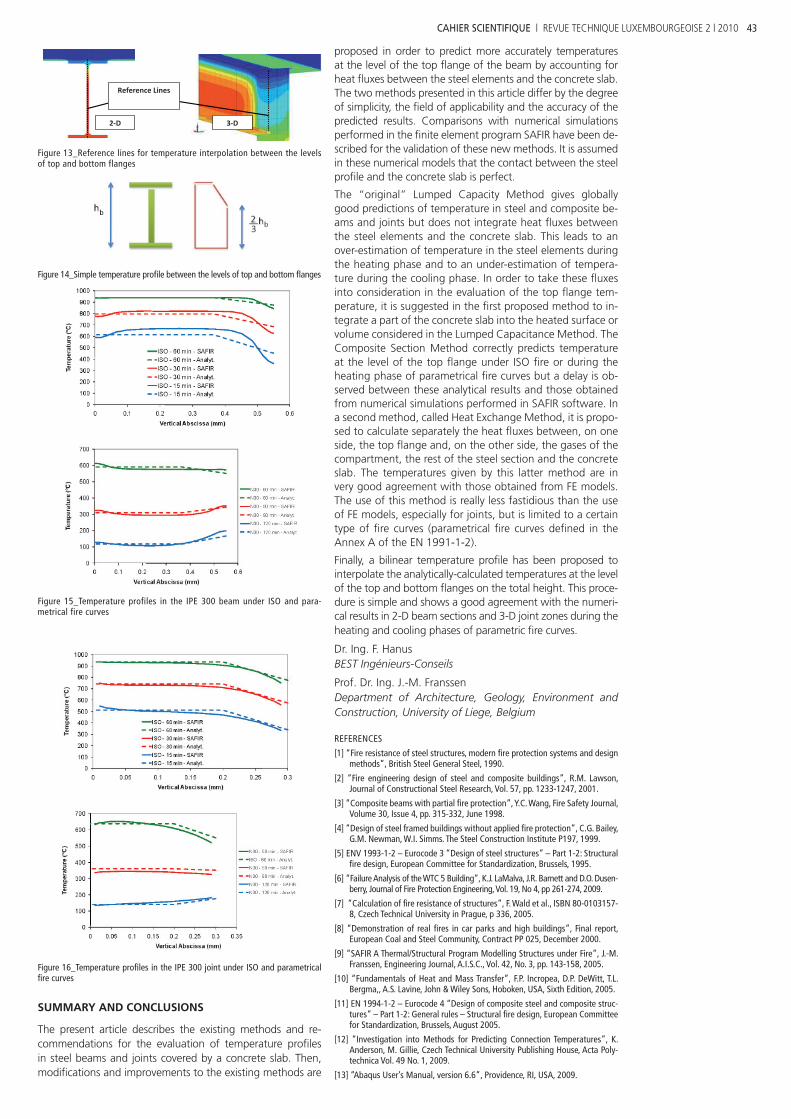
Figure 13_Reference lines for temperature interpolation between the levels of top and bottom flanges
Figure 14_Simple temperature profi le between the levels of top and bottom fl anges
Figure 15_Temperature profiles in the IPE 300 beam under ISO and para-metrical fire curves
Figure 16_Temperature profi les in the IPE 300 joint under ISO and parametrical fi re curves
SUMMARY AND CONCLUSIONS
The present article describes the existing methods and re-commendations for the evaluation of temperature profi les in steel beams and joints covered by a concrete slab. Then, modifi cations and improvements to the existing methods are
proposed in order to predict more accurately temperatures at the level of the top fl ange of the beam by accounting for heat fl uxes between the steel elements and the concrete slab. The two methods presented in this article differ by the degree of simplicity, the fi eld of applicability and the accuracy of the predicted results. Comparisons with numerical simulations performed in the fi nite element program SAFIR have been de-scribed for the validation of these new methods. It is assumed in these numerical models that the contact between the steel profi le and the concrete slab is perfect.
The “original” Lumped Capacity Method gives globally good predictions of temperature in steel and composite be-ams and joints but does not integrate heat fl uxes between the steel elements and the concrete slab. This leads to an over-estimation of temperature in the steel elements during the heating phase and to an under-estimation of tempera-ture during the cooling phase. In order to take these fl uxes into consideration in the evaluation of the top fl ange tem-perature, it is suggested in the fi rst proposed method to in-tegrate a part of the concrete slab into the heated surface or volume considered in the Lumped Capacitance Method. The Composite Section Method correctly predicts temperature at the level of the top fl ange under ISO fi re or during the heating phase of parametrical fi re curves but a delay is ob-served between these analytical results and those obtained from numerical simulations performed in SAFIR software. In a second method, called Heat Exchange Method, it is propo-sed to calculate separately the heat fl uxes between, on one side, the top fl ange and, on the other side, the gases of the compartment, the rest of the steel section and the concrete slab. The temperatures given by this latter method are in very good agreement with those obtained from FE models. The use of this method is really less fastidious than the use of FE models, especially for joints, but is limited to a certain type of fi re curves (parametrical fi re curves defi ned in the Annex A of the EN 1991-1-2).
Finally, a bilinear temperature profi le has been proposed to interpolate the analytically-calculated temperatures at the level of the top and bottom fl anges on the total height. This proce-dure is simple and shows a good agreement with the numeri-cal results in 2-D beam sections and 3-D joint zones during the heating and cooling phases of parametric fi re curves.
Dr. Ing. F. Hanus BEST Ingénieurs-Conseils
Prof. Dr. Ing. J.-M. Franssen Department of Architecture, Geology, Environment and Construction, University of Liege, Belgium
REFERENCES
[1] “Fire resistance of steel structures, modern fi re protection systems and design methods”, British Steel General Steel, 1990.
[2] “Fire engineering design of steel and composite buildings”, R.M. Lawson, Journal of Constructional Steel Research, Vol. 57, pp. 1233-1247, 2001.
[3] “Composite beams with partial fi re protection”, Y.C. Wang, Fire Safety Journal, Volume 30, Issue 4, pp. 315-332, June 1998.
[4] “Design of steel framed buildings without applied fi re protection”, C.G. Bailey, G.M. Newman, W.I. Simms. The Steel Construction Institute P197, 1999.
[5] ENV 1993-1-2 – Eurocode 3 “Design of steel structures” – Part 1-2: Structural fi re design, European Committee for Standardization, Brussels, 1995.
[6] “Failure Analysis of the WTC 5 Building”, K.J. LaMalva, J.R. Barnett and D.O. Dusen-berry, Journal of Fire Protection Engineering, Vol. 19, No 4, pp 261-274, 2009.
[7] “Calculation of fi re resistance of structures”, F. Wald et al., ISBN 80-0103157-8, Czech Technical University in Prague, p 336, 2005.
[8] “Demonstration of real fi res in car parks and high buildings”, Final report, European Coal and Steel Community, Contract PP 025, December 2000.
[9] “SAFIR A Thermal/Structural Program Modelling Structures under Fire”, J.-M. Franssen, Engineering Journal, A.I.S.C., Vol. 42, No. 3, pp. 143-158, 2005.
[10] “Fundamentals of Heat and Mass Transfer”, F.P. Incropea, D.P. DeWitt, T.L. Bergma,, A.S. Lavine, John & Wiley Sons, Hoboken, USA, Sixth Edition, 2005.
[11] EN 1994-1-2 – Eurocode 4 “Design of composite steel and composite struc-tures” – Part 1-2: General rules – Structural fi re design, European Committee for Standardization, Brussels, August 2005.
[12] “Investigation into Methods for Predicting Connection Temperatures”, K. Anderson, M. Gillie, Czech Technical University Publishing House, Acta Poly-technica Vol. 49 No. 1, 2009.
[13] “Abaqus User’s Manual, version 6.6”, Providence, RI, USA, 2009.
43CAHIER SCIENTIFIQUE | REVUE TECHNIQUE LUXEMBOURGEOISE 2 | 2010
Reference Lines
2‐D 3‐D