Embed Size (px)
Citation preview
R.D. Josephs Final Report CCQM‐K115 18.01.2017
1 / 39
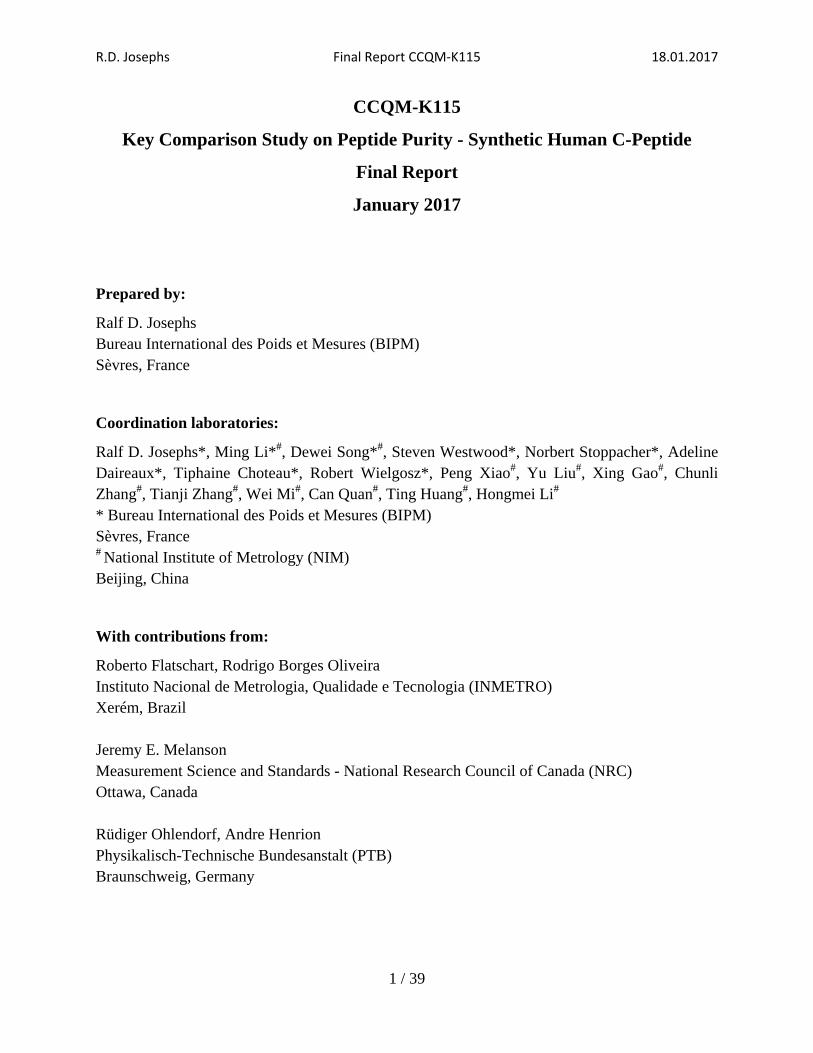
CCQM-K115
Key Comparison Study on Peptide Purity - Synthetic Human C-Peptide
Final Report
January 2017
Prepared by:
Ralf D. Josephs Bureau International des Poids et Mesures (BIPM) Sèvres, France Coordination laboratories:
Ralf D. Josephs*, Ming Li*#, Dewei Song*#, Steven Westwood*, Norbert Stoppacher*, Adeline Daireaux*, Tiphaine Choteau*, Robert Wielgosz*, Peng Xiao#, Yu Liu#, Xing Gao#, Chunli Zhang#, Tianji Zhang#, Wei Mi#, Can Quan#, Ting Huang#, Hongmei Li# * Bureau International des Poids et Mesures (BIPM) Sèvres, France # National Institute of Metrology (NIM) Beijing, China With contributions from:
Roberto Flatschart, Rodrigo Borges Oliveira Instituto Nacional de Metrologia, Qualidade e Tecnologia (INMETRO) Xerém, Brazil Jeremy E. Melanson Measurement Science and Standards - National Research Council of Canada (NRC) Ottawa, Canada Rüdiger Ohlendorf, Andre Henrion Physikalisch-Technische Bundesanstalt (PTB) Braunschweig, Germany
R.D. Josephs Final Report CCQM‐K115 18.01.2017
2 / 39
Tomoya Kinumi National Metrology Institute of Japan (NMIJ), National Institute of Advanced Industrial Science and Technology (AIST) Tsukuba, Japan Lingkai Wong, Qinde Liu Health Sciences Authority (HSA) Singapore, Singapore Merve Oztug Senal, Bilgin Vatansever, Ilker Ün, Ahmet Ceyhan Gören, Müslüm Akgöz National Metrology Institute of Turkey (TUBITAK UME) Gebze-Kocaeli, Turkey Milena Quaglia, John Warren LGC Limited (LGC) Teddington, United Kingdom Coordinating laboratory contact: Ralf D. Josephs ([email protected])
R.D. Josephs Final Report CCQM‐K115 18.01.2017
3 / 39
TABLE OF CONTENT INTRODUCTION RATIONALE/PURPOSE CHARACTERIZATION OF STUDY MATERIAL CHARACTERIZATION STUDIES HOMOGENEITY STUDIES STABILITY STUDIES SORPTION MEASUREMENTS SAMPLE DISTRIBUTION QUANTITIES AND UNITS REPORTED MASS FRACTIONS OF HCP AND IMPURITIES IN CCQM-K115
Peptide Related Impurity Profile of CCQM-K115
Hydrolysis Efficiency Study KEY COMPARISON REFERENCE VALUES (KCRVS) FOR CCQM-K115
Impurity Profile and Key Comparison Reference Value (KCRV) for the Mass Fraction of Peptide Related Impurities in CCQM-K115
Key Comparison Reference Value (KCRV) for the Mass Fraction of hCP in CCQM-K115
CONCLUSIONS HOW FAR THE LIGHT SHINES STATEMENT (HFTLS) ACKNOWLEDGEMENTS REFERENCES
R.D. Josephs Final Report CCQM‐K115 18.01.2017
4 / 39
INTRODUCTION Comparability of (bio)chemical measurements is a prerequisite of any measurement undertaken in support of legislative purposes. For most chemical analysis this can be achieved by ensuring that measurement results are traceable to a known reference such as the base units of the Système International d'Unités (SI). By maintaining such a link, results can be compared over time and space enabling informed decisions to be made and improving our overall knowledge of a subject area. The importance of traceable measurement results can be inferred by its requirement in quality standards (ISO 17025) and in the formation of specialized committees as the Joint Committee on Traceability in Laboratory Medicine (JCTLM). However, whilst the required metrological tools, such as higher order reference measurements procedures, pure substance and matrix certified reference materials, are established for small well defined molecules difficulties still remain in the provision of such standards in the area of larger biomolecules such as peptides/proteins. The provision of Primary Calibration Reference Services has been identified as a core technical competency for NMIs [1]. NMIs providing measurement services in peptide/protein analysis are expected to participate in a limited number of comparisons that are intended to test and demonstrate their capabilities in this area. Primary Calibration Reference Services refers to a technical capability for composition assignment, usually as the mass fraction content, of a peptide/protein in the form of high purity solids or standard solutions thereof. The assignment of the mass fraction content of high purity materials is the subject of the CCQM-K115 comparison [2]. With the aim of leveraging the work required for the CCQM-K115 comparison and thereby minimising the workload for NMIs and simultaneously focussing on a material directly relevant to existing CMC claims, human C-peptide (hCP) was proposed as the most appropriate choice for a study material for a first CCQM key comparison and parallel pilot study looking at competencies to perform peptide purity mass fraction assignment.
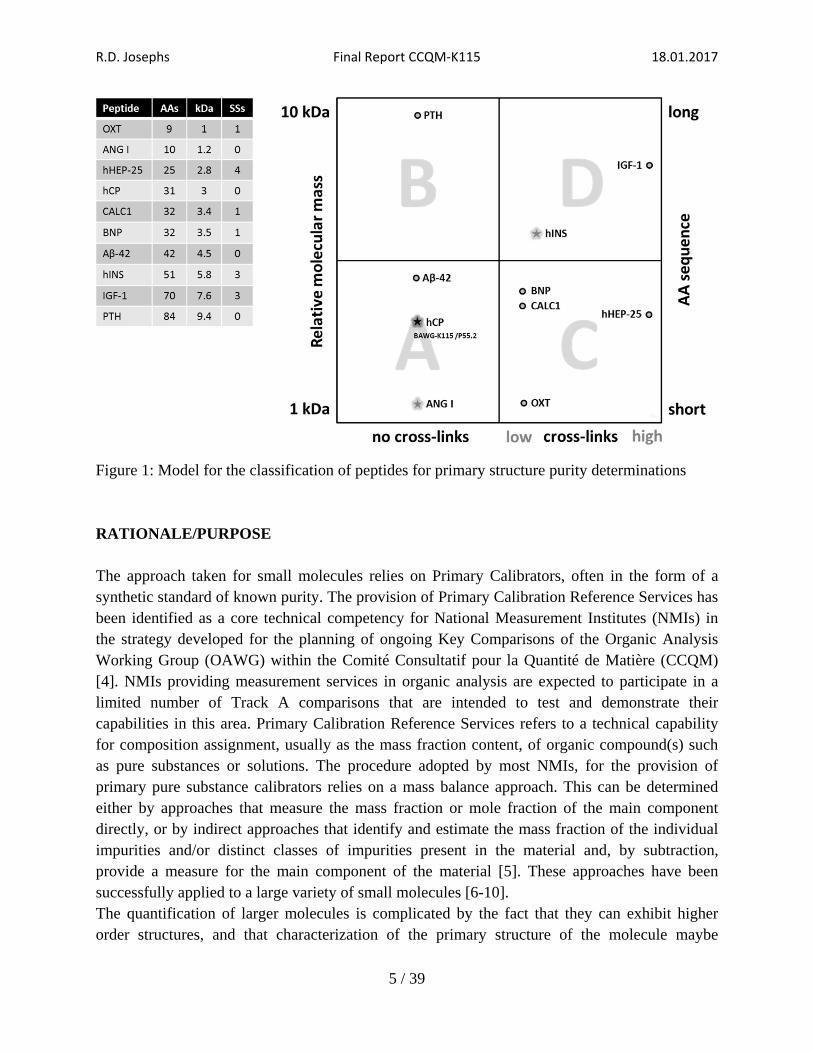
The CCQM-K115 comparison for hCP (marked as black star) and other peptides of current interest to NMIs (marked in black) are marked in the model for the classification of peptides for primary structure purity determinations (Figure 1). CCQM-K115 covers the space of quadrant A for short (1 kDa to 5 kDa), non-cross-linked synthetic peptides [3].
R.D. Josephs Final Report CCQM‐K115 18.01.2017
5 / 39
Figure 1: Model for the classification of peptides for primary structure purity determinations
RATIONALE/PURPOSE The approach taken for small molecules relies on Primary Calibrators, often in the form of a synthetic standard of known purity. The provision of Primary Calibration Reference Services has been identified as a core technical competency for National Measurement Institutes (NMIs) in the strategy developed for the planning of ongoing Key Comparisons of the Organic Analysis Working Group (OAWG) within the Comité Consultatif pour la Quantité de Matière (CCQM) [4]. NMIs providing measurement services in organic analysis are expected to participate in a limited number of Track A comparisons that are intended to test and demonstrate their capabilities in this area. Primary Calibration Reference Services refers to a technical capability for composition assignment, usually as the mass fraction content, of organic compound(s) such as pure substances or solutions. The procedure adopted by most NMIs, for the provision of primary pure substance calibrators relies on a mass balance approach. This can be determined either by approaches that measure the mass fraction or mole fraction of the main component directly, or by indirect approaches that identify and estimate the mass fraction of the individual impurities and/or distinct classes of impurities present in the material and, by subtraction, provide a measure for the main component of the material [5]. These approaches have been successfully applied to a large variety of small molecules [6-10]. The quantification of larger molecules is complicated by the fact that they can exhibit higher order structures, and that characterization of the primary structure of the molecule maybe
R.D. Josephs Final Report CCQM‐K115 18.01.2017
6 / 39
insufficient to correlate the amount of the molecule to its biological activity. Nevertheless, the quantification of the primary structure purity of a larger molecule is the first step in establishing a primary calibrator material for that molecule, where the quantity of interest is the mass fraction of the large molecule. The current discussion is limited to the measurement of the primary structure mass fraction of the molecule within a material. Another complication for the provision of traceable peptide/protein measurements is that pure peptides/proteins can usually not be obtained in sufficiently large quantities. This has resulted in the harmonisation of many large molecule measurements by the provision of accepted practices, methods and/or standards. However, the increased use of targeted hydrolysis based digestion and peptide quantification strategies has enabled the determination of protein amounts via prototypic peptides [11-13]. These approaches have been investigated for example for the routine analysis of human growth hormone and its biomarkers [14-15]. A number of NMIs have been developing higher order measurement procedures for the analysis of purified protein calibrators [16] and serum based matrix materials [15]. These approaches show great promise for the standardisation of priority protein measurands. However, the mass fractions value assignment of proteins requires proteotypic peptides of known purity. The purity of proteotypic peptides and peptides that show direct bioactivity by themselves can be assessed by use of the full mass balance approach. However, a full mass balance approach could require unviably large quantities of peptide material. A simpler alternative to the full mass balance approach is a peptide impurity corrected amino acid (PICAA) analysis, requiring quantification of constituent amino acids following hydrolysis of the material and correction for amino acids originating from impurities [17-18]. It requires identification and quantification of peptide impurities for the most accurate results. Traceability of the amino acid analysis results is to pure amino acid certified reference materials (CRMs). Few pure amino acid CRMs are commercially available. Alternatively, traceability could be established through in-house or NMI purity capabilities for amino acids. NMI capabilities to determine the purity of L-valine, were recently assessed in the CCQM‐K55.c comparison in the frame of the OAWG [10]. In addition, amino acid analysis and peptide hydrolysis capabilities for the mass concentration assignment of peptide solutions are evaluated in the series of CCQM-P55 comparisons in the framework of the former BAWG using peptide materials of unknown purity [19]. The application of other approaches for the assessment of peptide purity that require only minor quantities of peptide material is conceivable, for example elemental analysis (CHN/O) with a correction for nitrogen originating from impurities or quantitative nuclear magnetic resonance (qNMR) spectroscopy. The timeline for the CCQM-K115 study ‘Key Comparison Study on Peptide Purity - Synthetic Human C-Peptide’ is summarized in Table 1.
R.D. Josephs Final Report CCQM‐K115 18.01.2017
7 / 39
Table 1: CCQM-K115 Timetable
Action Date Initial discussion April 2012 BAWG/OAWG meetings Approval of Study Proposal April 2013 BAWG meeting Draft protocol and confirmation April 2014 BAWG meeting Sample characterization completed August 2014 Call for participation October 1st, 2014 Final date to register October 31st, 2014 Sample distribution November 2014 (following BAWG meeting) Date due to coordinator September 1st, 2015 Justification for 10 months period 3 months for identification of impurities 3 - 4 months to obtain tailor-made impurities 3 months for quantification and calculation Initial report and discussion of results November 2015 PAWG meeting Draft A report and discussion April 2016 PAWG/OAWG meeting Draft B report October 2016 Final report to PAWG Chair January 2017
CHARACTERIZATION OF STUDY MATERIAL Human C-peptide is defined as human proinsulin [57-87] fragment with the amino acid sequence EAEDLQVGQVELGGGPGAGSLQPLALEGSLQ [relative molecular mass (Mr) 3020.3]. The study material was prepared by the BIPM/NIM by characterization of a commercially sourced sample of synthetic human C-peptide. The methods used to investigate, assign and confirm the quantitative composition of the CCQM-K115 candidate material by the BIPM are summarized below.
R.D. Josephs Final Report CCQM‐K115 18.01.2017
8 / 39
CHARACTERIZATION STUDIES Peptide related impurity content was evaluated by
• LC-hrMS/MS Water content was evaluated by
• Coulometric Karl Fischer titration with oven transfer of water from the sample • Thermogravimetric analysis (TGA) as a consistency check for the assigned value • Microanalysis (% C, H, N content) as a consistency check for assigned value
Residual solvent content was evaluated by • GC-MS by direct injection • 1H-NMR • Thermogravimetric analysis as a consistency check for the assigned value • Microanalysis (% C, H, N content) as a consistency check for the assigned value
Non-volatile/ inorganics content by • IC for common elements and counter ions (acetate, chloride, formate, nitrate, oxalate,
phosphate, sulfate, trifluoroacetate (TFA), ammonium, calcium, magnesium, potassium, sodium)
• Microanalysis (% C, H, N content) as a consistency check for the assigned values The BIPM/NIM have
• investigated the levels of within and between vial homogeneity of the main component and all significant minor components;
• identified a minimum sample size which reduces to an acceptable level the effect of between-bottle inhomogeneity of both the main component and the minor components;
• completed isochronous stability studies of both the main component and the minor components to confirm that the material is sufficiently stable within the proposed time scale of the study if stored at low temperature (4 °C to - 20 °C);
• determined appropriate conditions for its storage (4 °C to - 20 °C), transport (cooled and temperature controlled) and handling;
• studied the impact of the relative humidity and temperature on the water content and provide a correction function for the gravimetric preparation of the comparison sample.
R.D. Josephs Final Report CCQM‐K115 18.01.2017
9 / 39
HOMOGENEITY STUDIES The BIPM/NIM have investigated the levels of within and between vial homogeneity of the main component and selected significant minor components, and have identified a minimum sample size which reduces to an acceptable level the effect of between bottle inhomogeneity of both the main component and the minor components. The results of the ANOVA are summarised in Table 2. No differences in the within- and between-sample variances could be detected by the F-tests at the 95 % confidence level. The material could be regarded as homogeneous. For all species being tested, the sbb could not be calculated due to the fact that for all MSbetween was smaller than MSwithin. Therefore, the u*bb of 1.65 %, 1.42%, and 3.92 % was adopted as an estimate for the uncertainty contribution due to potential inhomogeneity for acetyl-hCP(9-31), phCP, and hCP(1-28), respectively. Acetyl-hCP(9-31), phCP, and hCP(1-28) represent high (9.67 mg/g), medium (3.129 mg/g) and small (1.226 mg/g) mass fractions level impurities, respectively. Table 2: Homogeneity results of representative hCP impurities
Water Acetyl-hCP(9-31)
High mass fraction phCP
Medium mass fractionhCP(1-28)
Small mass fraction N 30 29 29 29
swb (%) 8.15 5.09 4.37 12.08 sbb (%) -(1) -(1) -(1) -(1)
u*bb (%) 2.65 1.65 1.42 3.92 ubb
(2) (%) 2.65 1.65 1.42 3.92
F 0.928 0.764 0.876 0.948 Fcrit 2.393 2.393 2.393 2.393
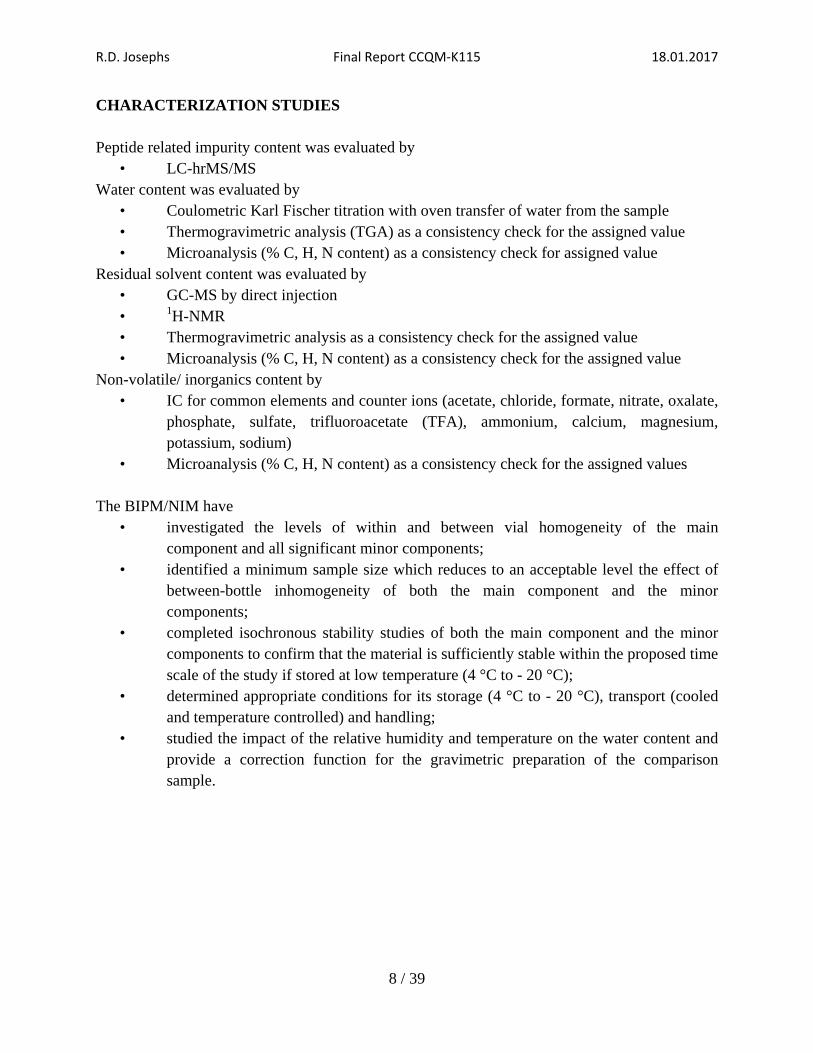
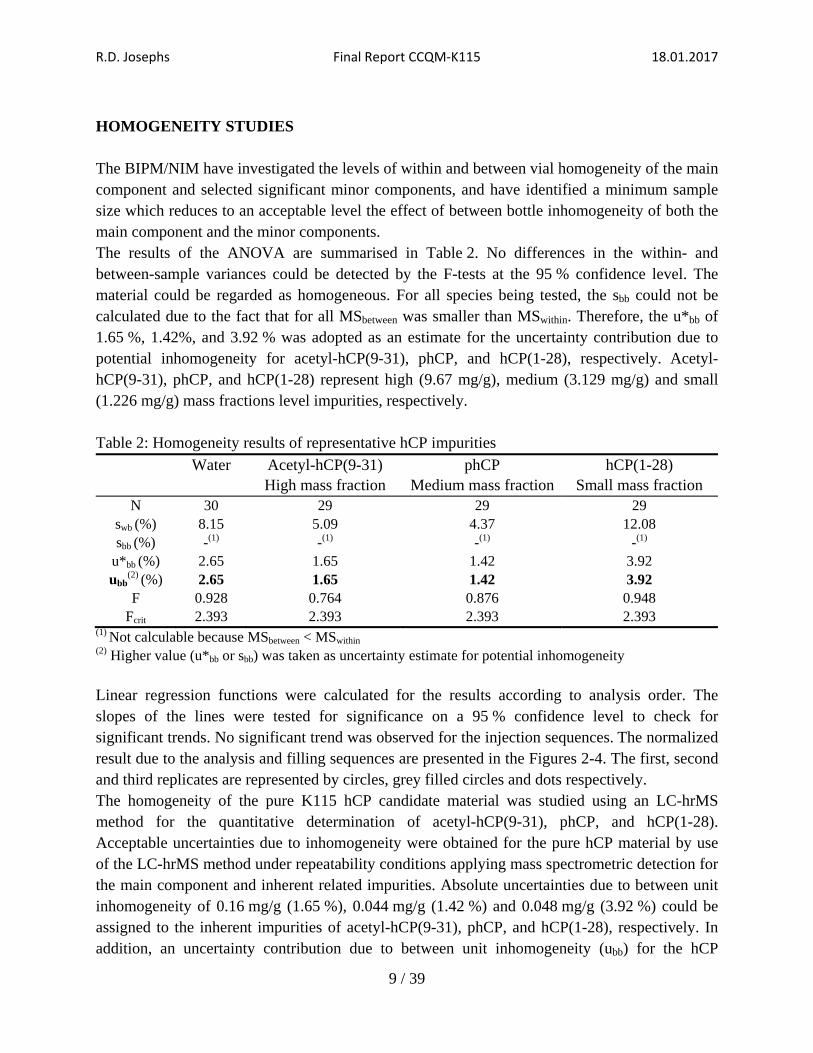
(1) Not calculable because MSbetween < MSwithin (2) Higher value (u*bb or sbb) was taken as uncertainty estimate for potential inhomogeneity Linear regression functions were calculated for the results according to analysis order. The slopes of the lines were tested for significance on a 95 % confidence level to check for significant trends. No significant trend was observed for the injection sequences. The normalized result due to the analysis and filling sequences are presented in the Figures 2-4. The first, second and third replicates are represented by circles, grey filled circles and dots respectively. The homogeneity of the pure K115 hCP candidate material was studied using an LC-hrMS method for the quantitative determination of acetyl-hCP(9-31), phCP, and hCP(1-28). Acceptable uncertainties due to inhomogeneity were obtained for the pure hCP material by use of the LC-hrMS method under repeatability conditions applying mass spectrometric detection for the main component and inherent related impurities. Absolute uncertainties due to between unit inhomogeneity of 0.16 mg/g (1.65 %), 0.044 mg/g (1.42 %) and 0.048 mg/g (3.92 %) could be assigned to the inherent impurities of acetyl-hCP(9-31), phCP, and hCP(1-28), respectively. In addition, an uncertainty contribution due to between unit inhomogeneity (ubb) for the hCP
R.D. Josephs Final Report CCQM‐K115 18.01.2017
10 / 39
content was verified by use of direct mass spectrometric detection. Therefore, this candidate material is appropriate to serve in the K115 study to evaluate mass fraction range of inherent impurities, provided a suitable sample intake of more than 2.5 mg is used for analysis of the material.
Figure 2: Homogeneity of hCP(1-28) - Small level mass fraction impurity - Injection and filling sequence
Figure 3: Homogeneity of phCP - Medium level mass fraction impurity - Injection and filling sequence
R.D. Josephs Final Report CCQM‐K115 18.01.2017
11 / 39
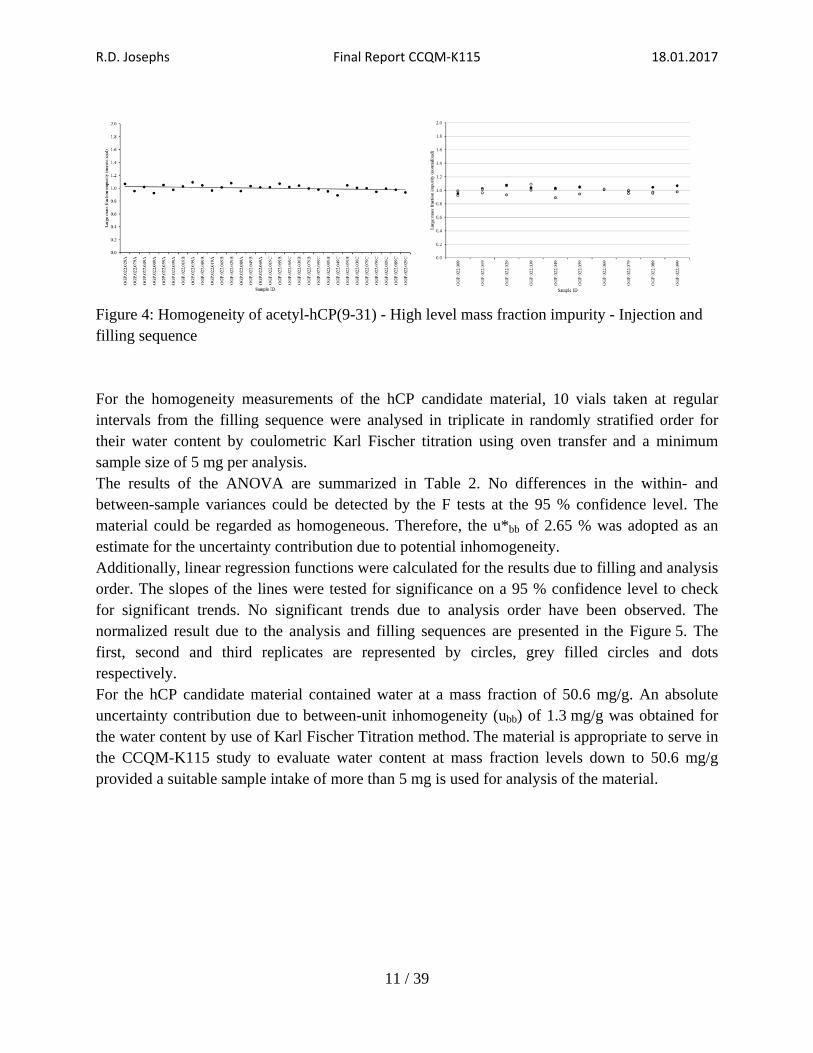
Figure 4: Homogeneity of acetyl-hCP(9-31) - High level mass fraction impurity - Injection and filling sequence For the homogeneity measurements of the hCP candidate material, 10 vials taken at regular intervals from the filling sequence were analysed in triplicate in randomly stratified order for their water content by coulometric Karl Fischer titration using oven transfer and a minimum sample size of 5 mg per analysis. The results of the ANOVA are summarized in Table 2. No differences in the within- and between-sample variances could be detected by the F tests at the 95 % confidence level. The material could be regarded as homogeneous. Therefore, the u*bb of 2.65 % was adopted as an estimate for the uncertainty contribution due to potential inhomogeneity. Additionally, linear regression functions were calculated for the results due to filling and analysis order. The slopes of the lines were tested for significance on a 95 % confidence level to check for significant trends. No significant trends due to analysis order have been observed. The normalized result due to the analysis and filling sequences are presented in the Figure 5. The first, second and third replicates are represented by circles, grey filled circles and dots respectively. For the hCP candidate material contained water at a mass fraction of 50.6 mg/g. An absolute uncertainty contribution due to between-unit inhomogeneity (ubb) of 1.3 mg/g was obtained for the water content by use of Karl Fischer Titration method. The material is appropriate to serve in the CCQM-K115 study to evaluate water content at mass fraction levels down to 50.6 mg/g provided a suitable sample intake of more than 5 mg is used for analysis of the material.

R.D. Josephs Final Report CCQM‐K115 18.01.2017
12 / 39
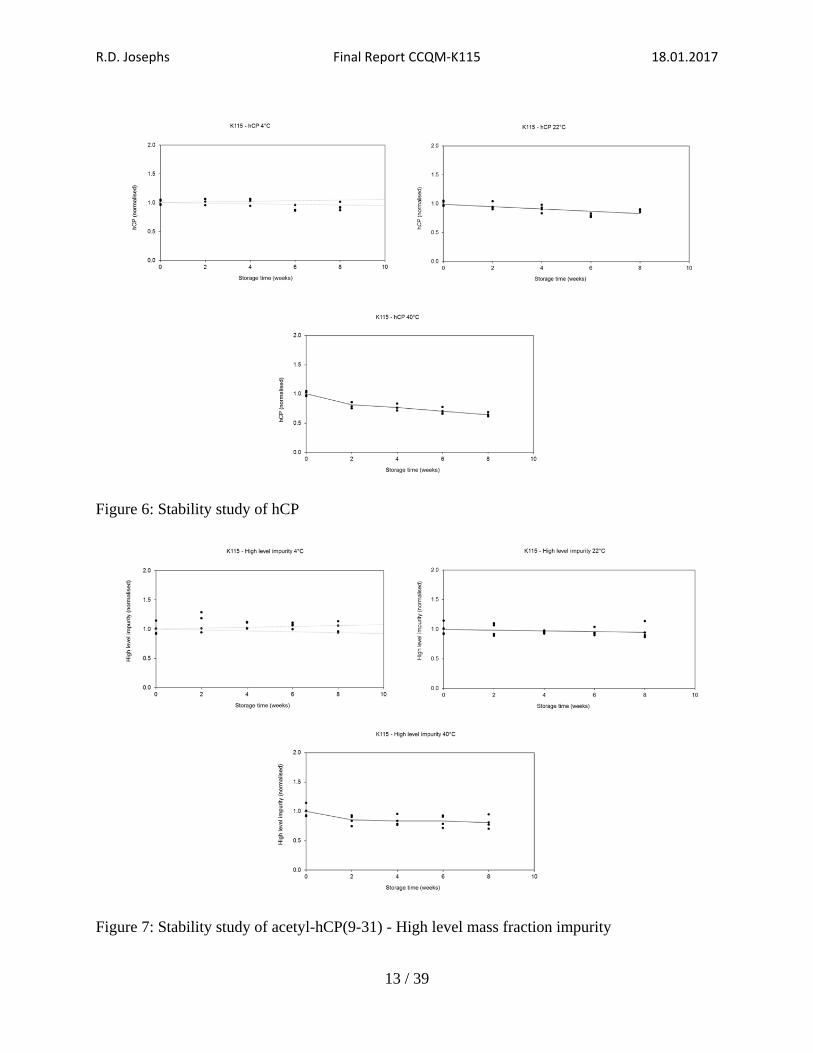
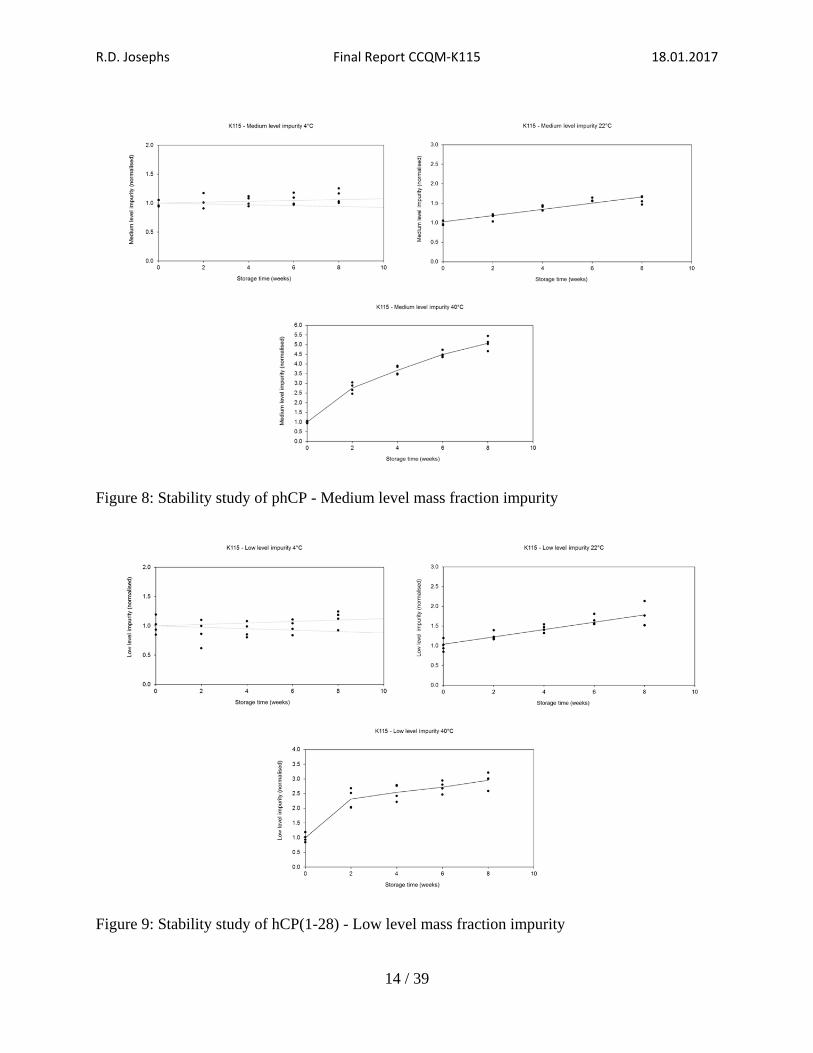
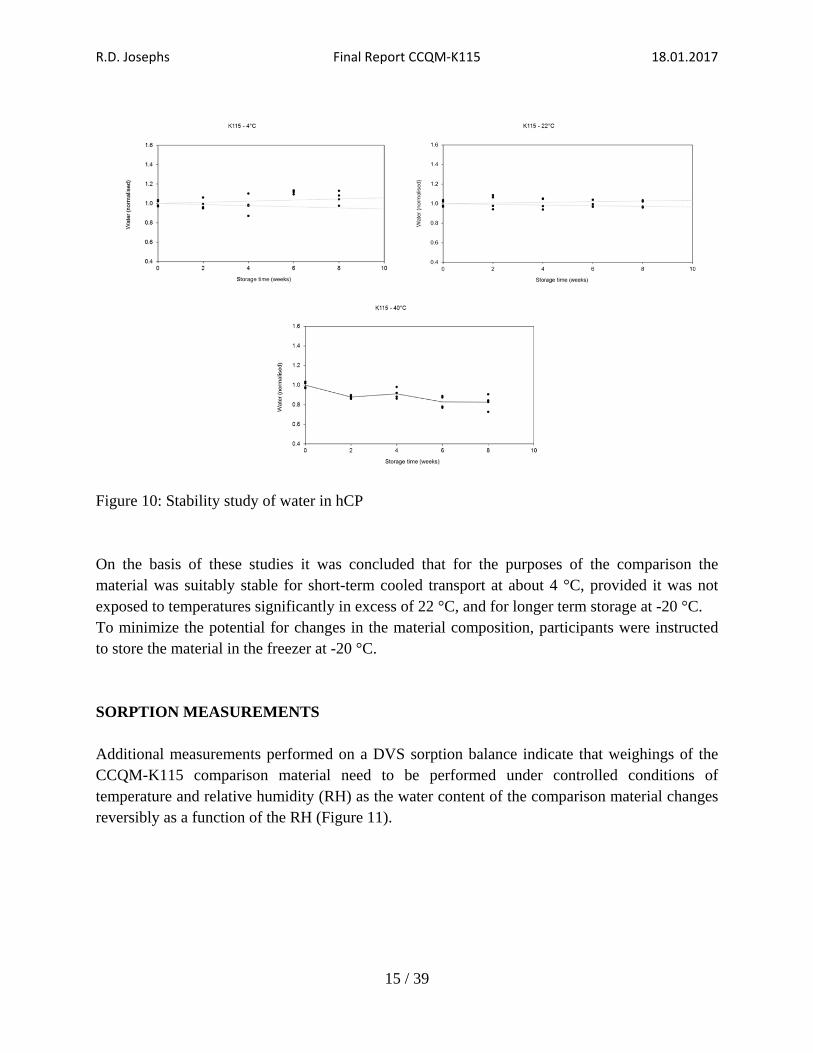
Figure 5: Homogeneity of water in hCP - Injection and filling sequence STABILITY STUDIES Isochronous stability studies were performed using a reference storage temperature of -20 °C and test temperatures of 4°C, 22 °C and 40 °C. A set of units from the production batch were stored at each selected temperature over 8 weeks, with units transferred to reference temperature storage at 2 week intervals. Trend analysis of the data obtained by LC-hrMS analysis of the stability test samples under repeatability conditions indicated no significant changes in the relative composition of hCP or of the related peptide impurities over longer time and at elevated temperatures. The hCP mass fraction of the material was stable on storage at 4 °C and 22 °C but did decrease significantly after storage beyond 6 weeks at 22 °C or 2 weeks at 40 °C. The acetyl-hCP(9-31) mass fraction of the material, representing high mass fraction level impurities, was stable on storage at 4 °C and 22 °C but did decrease significantly after storage beyond 2 weeks at 40 °C. The phCP mass fraction of the material, representing medium mass fraction level impurities, was stable on storage at 4 °C but did increase significantly after storage beyond 2 weeks at both 22 °C and 40 °C. The hCP(1-28) mass fraction of the material, representing low mass fraction level impurities, was stable on storage at 4 °C but did increase significantly after storage beyond 2 weeks at both 22 °C and 40 °C. No significant changes in water mass fraction were observed after storage at 4 °C or 22 °C. There was some evidence of loss of water but only after prolonged storage at 40 °C. The effect of storage temperature on the mass fractions of hCP, related peptide impurities and water of the comparison material is shown in Figures 6-10.
R.D. Josephs Final Report CCQM‐K115 18.01.2017
13 / 39
Figure 6: Stability study of hCP
Figure 7: Stability study of acetyl-hCP(9-31) - High level mass fraction impurity
R.D. Josephs Final Report CCQM‐K115 18.01.2017
14 / 39
Figure 8: Stability study of phCP - Medium level mass fraction impurity
Figure 9: Stability study of hCP(1-28) - Low level mass fraction impurity
R.D. Josephs Final Report CCQM‐K115 18.01.2017
15 / 39
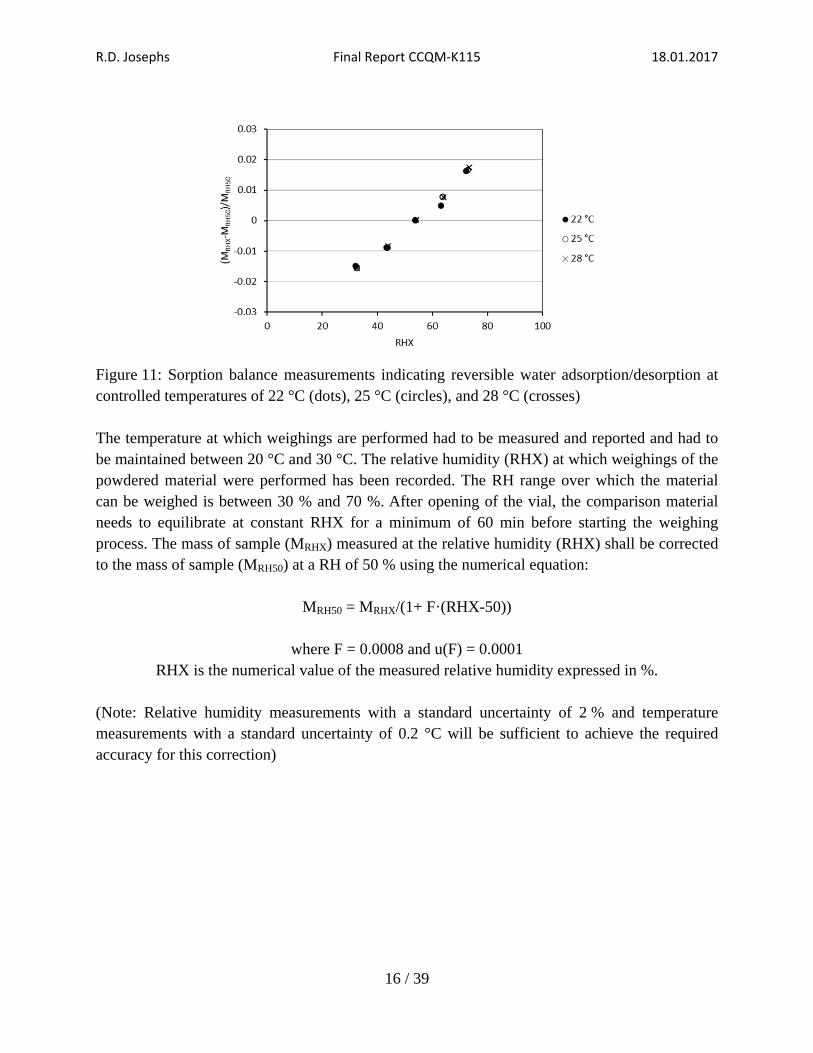
Figure 10: Stability study of water in hCP On the basis of these studies it was concluded that for the purposes of the comparison the material was suitably stable for short-term cooled transport at about 4 °C, provided it was not exposed to temperatures significantly in excess of 22 °C, and for longer term storage at -20 °C. To minimize the potential for changes in the material composition, participants were instructed to store the material in the freezer at -20 °C. SORPTION MEASUREMENTS Additional measurements performed on a DVS sorption balance indicate that weighings of the CCQM-K115 comparison material need to be performed under controlled conditions of temperature and relative humidity (RH) as the water content of the comparison material changes reversibly as a function of the RH (Figure 11).
R.D. Josephs Final Report CCQM‐K115 18.01.2017
16 / 39
Figure 11: Sorption balance measurements indicating reversible water adsorption/desorption at controlled temperatures of 22 °C (dots), 25 °C (circles), and 28 °C (crosses) The temperature at which weighings are performed had to be measured and reported and had to be maintained between 20 °C and 30 °C. The relative humidity (RHX) at which weighings of the powdered material were performed has been recorded. The RH range over which the material can be weighed is between 30 % and 70 %. After opening of the vial, the comparison material needs to equilibrate at constant RHX for a minimum of 60 min before starting the weighing process. The mass of sample (MRHX) measured at the relative humidity (RHX) shall be corrected to the mass of sample (MRH50) at a RH of 50 % using the numerical equation:
MRH50 = MRHX/(1+ F·(RHX-50))
where F = 0.0008 and u(F) = 0.0001 RHX is the numerical value of the measured relative humidity expressed in %.
(Note: Relative humidity measurements with a standard uncertainty of 2 % and temperature measurements with a standard uncertainty of 0.2 °C will be sufficient to achieve the required accuracy for this correction)
R.D. Josephs Final Report CCQM‐K115 18.01.2017
17 / 39
SAMPLE DISTRIBUTION One unit of the study sample, each containing a minimum of 25 mg of material, was distributed to each participant by express mail service in insulated and cooled boxes equipped with an electronic temperature data logger. Participants were asked to return the temperature data logger form acknowledging receipt of the samples and to advise the coordinator if any obvious damage had occurred to the vials during shipping. The coordinator verified that the temperature data logger inside the shipping container had not registered a temperature in excess of 22 °C during the transport process. The temperature data loggers indicated that the units originally supplied to HSA, Singapore was exposed to temperatures in excess of 22 °C during shipping. A replacement unit was provided which was delivered without incident. There was also a prolonged delay in delivery (10 days) of the original sample sent to Brazil (INMETRO) and exposure to high temperatures (34 °C) due to customs clearance and delivery problems. A replacement sample set was issued in this case which was delivered without difficulties. Otherwise all samples were delivered to the comparison participants without incident. With the exception of NMIT, Thailand and NMISA, South Africa all other registered participants in the CCQM-K115 comparison provided a result for their sample. QUANTITIES AND UNITS Participants were required to report the mass fraction of hCP, the major component of the comparison sample. In addition, all participants who used a PICAA or qNMR procedure to determine the hCP content were required to report the combined mass fraction assignment and corresponding uncertainty for total related peptide impurities In addition, the BIPM and NIM, China who employed a mass balance (summation of impurities) procedure to determine the hCP content were required to report the combined mass fraction assignment and corresponding uncertainty for the sub-classes of total related peptide impurities, water, total residual organic solvent / volatile organic compounds (VOCs) and total non-volatile organics & inorganics. Participants were encouraged to also provide mass fraction estimates for the main impurity components they identified in the comparison sample.
R.D. Josephs Final Report CCQM‐K115 18.01.2017
18 / 39
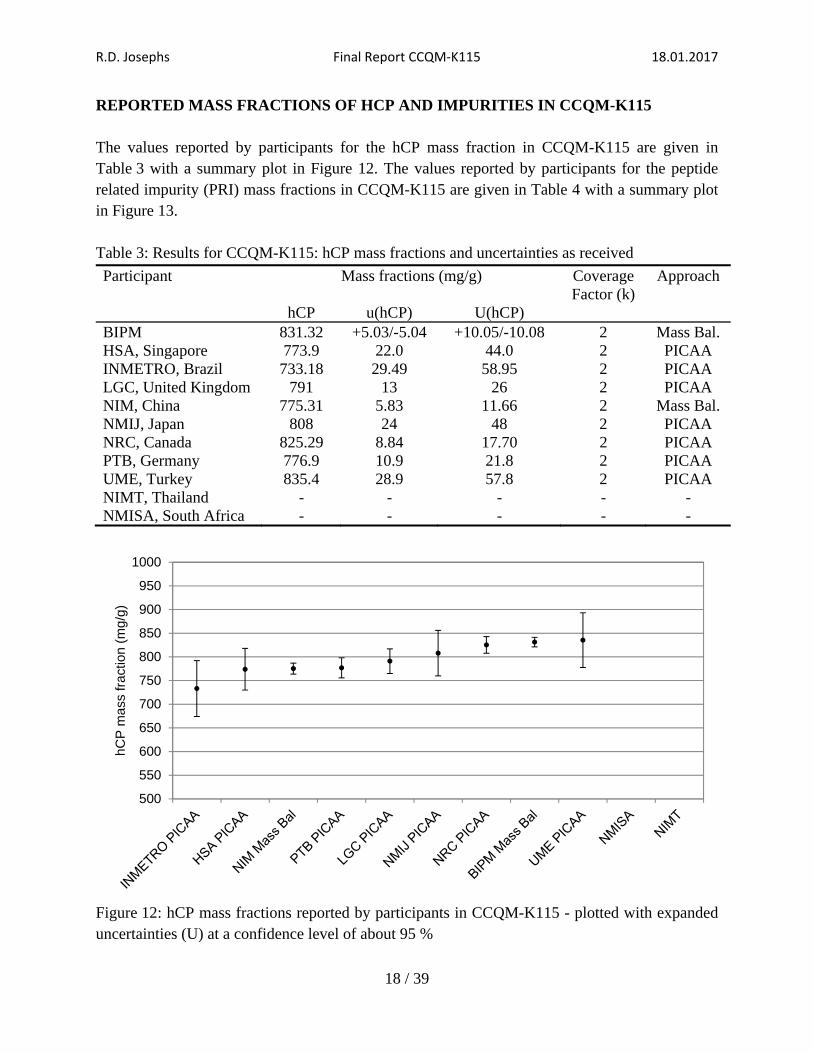
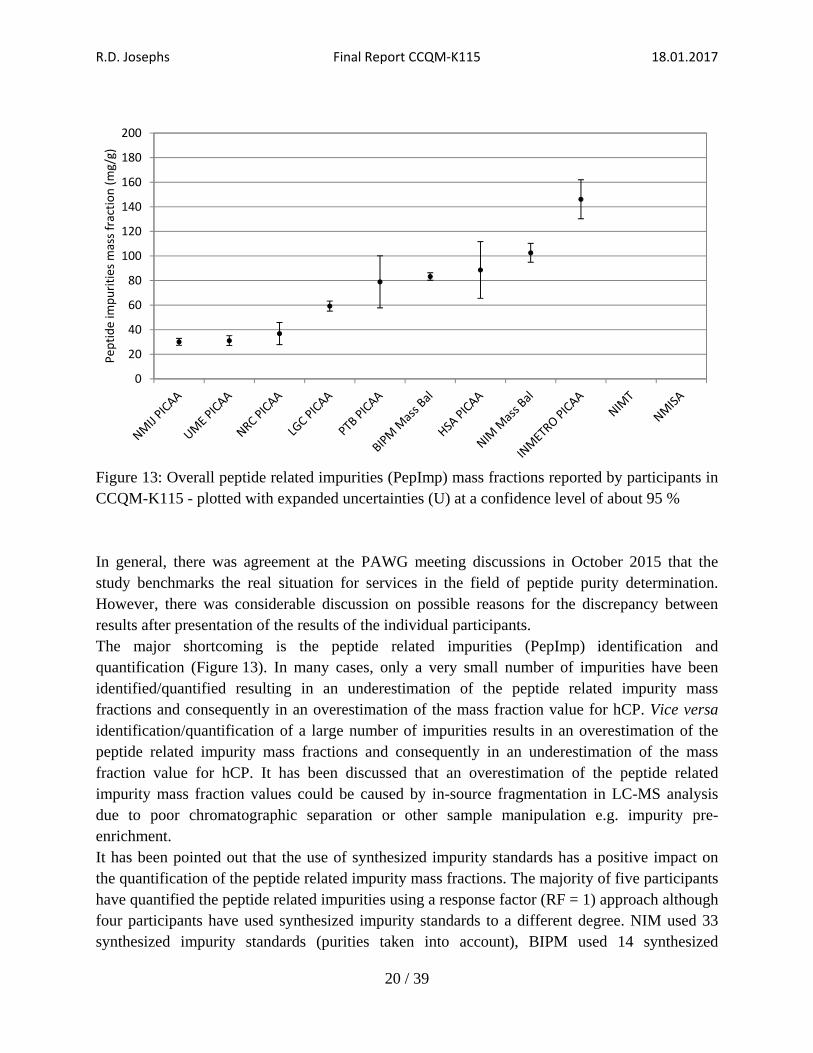
REPORTED MASS FRACTIONS OF HCP AND IMPURITIES IN CCQM-K115 The values reported by participants for the hCP mass fraction in CCQM-K115 are given in Table 3 with a summary plot in Figure 12. The values reported by participants for the peptide related impurity (PRI) mass fractions in CCQM-K115 are given in Table 4 with a summary plot in Figure 13. Table 3: Results for CCQM-K115: hCP mass fractions and uncertainties as received
Participant Mass fractions (mg/g) Coverage Factor (k)
Approach
hCP u(hCP) U(hCP) BIPM 831.32 +5.03/-5.04 +10.05/-10.08 2 Mass Bal. HSA, Singapore 773.9 22.0 44.0 2 PICAA INMETRO, Brazil 733.18 29.49 58.95 2 PICAA LGC, United Kingdom 791 13 26 2 PICAA NIM, China 775.31 5.83 11.66 2 Mass Bal. NMIJ, Japan 808 24 48 2 PICAA NRC, Canada 825.29 8.84 17.70 2 PICAA PTB, Germany 776.9 10.9 21.8 2 PICAA UME, Turkey 835.4 28.9 57.8 2 PICAA NIMT, Thailand - - - - - NMISA, South Africa - - - - -
Figure 12: hCP mass fractions reported by participants in CCQM-K115 - plotted with expanded uncertainties (U) at a confidence level of about 95 %
500
550
600
650
700
750
800
850
900
950
1000
hCP
mas
s fr
actio
n (m
g/g)
R.D. Josephs Final Report CCQM‐K115 18.01.2017
19 / 39
The reported values for the hCP mass fractions in CCQM-K115 can be divided into two main groups - one group with both the BIPM and NIM using mass balance approaches and a second group with all other participants using PICAA approaches. The hCP mass fraction values obtained by mass balance approaches show generally smaller uncertainties than the values obtained by PICAA approaches.
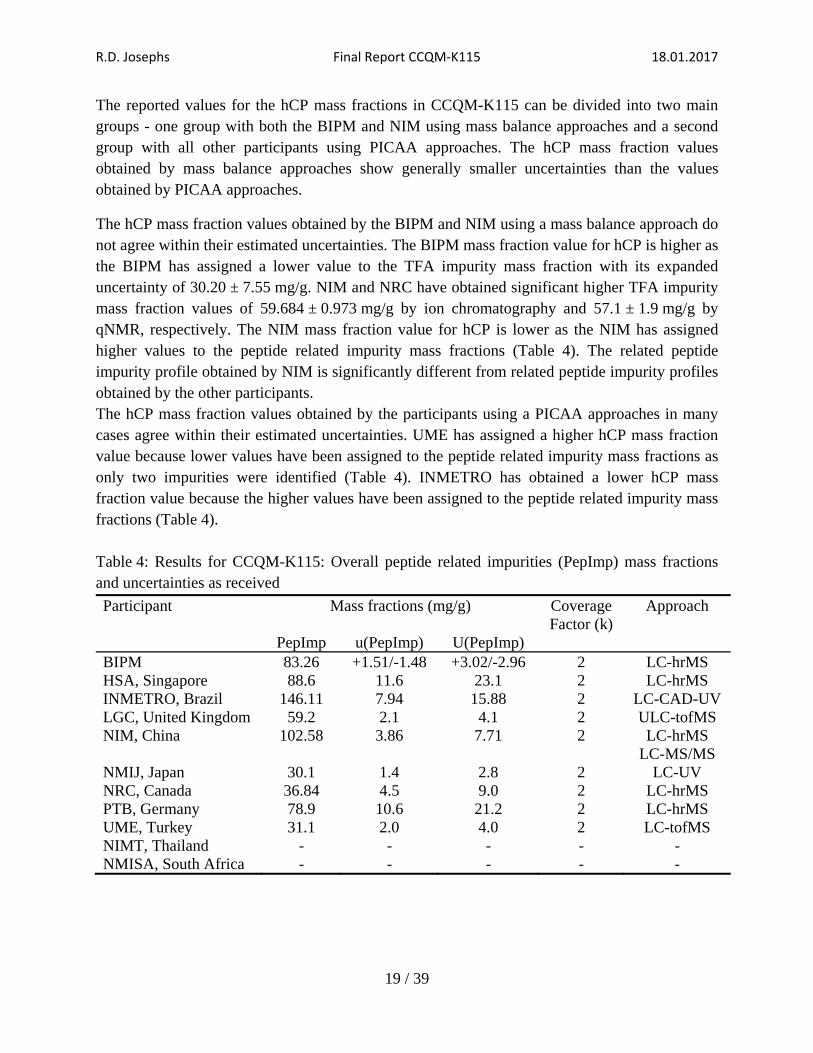
The hCP mass fraction values obtained by the BIPM and NIM using a mass balance approach do not agree within their estimated uncertainties. The BIPM mass fraction value for hCP is higher as the BIPM has assigned a lower value to the TFA impurity mass fraction with its expanded uncertainty of 30.20 ± 7.55 mg/g. NIM and NRC have obtained significant higher TFA impurity mass fraction values of 59.684 ± 0.973 mg/g by ion chromatography and 57.1 ± 1.9 mg/g by qNMR, respectively. The NIM mass fraction value for hCP is lower as the NIM has assigned higher values to the peptide related impurity mass fractions (Table 4). The related peptide impurity profile obtained by NIM is significantly different from related peptide impurity profiles obtained by the other participants. The hCP mass fraction values obtained by the participants using a PICAA approaches in many cases agree within their estimated uncertainties. UME has assigned a higher hCP mass fraction value because lower values have been assigned to the peptide related impurity mass fractions as only two impurities were identified (Table 4). INMETRO has obtained a lower hCP mass fraction value because the higher values have been assigned to the peptide related impurity mass fractions (Table 4). Table 4: Results for CCQM-K115: Overall peptide related impurities (PepImp) mass fractions and uncertainties as received
Participant Mass fractions (mg/g) Coverage Factor (k)
Approach
PepImp u(PepImp) U(PepImp) BIPM 83.26 +1.51/-1.48 +3.02/-2.96 2 LC-hrMS HSA, Singapore 88.6 11.6 23.1 2 LC-hrMS INMETRO, Brazil 146.11 7.94 15.88 2 LC-CAD-UV LGC, United Kingdom 59.2 2.1 4.1 2 ULC-tofMS NIM, China 102.58 3.86 7.71 2 LC-hrMS
LC-MS/MS NMIJ, Japan 30.1 1.4 2.8 2 LC-UV NRC, Canada 36.84 4.5 9.0 2 LC-hrMS PTB, Germany 78.9 10.6 21.2 2 LC-hrMS UME, Turkey 31.1 2.0 4.0 2 LC-tofMS NIMT, Thailand - - - - - NMISA, South Africa - - - - -
R.D. Josephs Final Report CCQM‐K115 18.01.2017
20 / 39
Figure 13: Overall peptide related impurities (PepImp) mass fractions reported by participants in CCQM-K115 - plotted with expanded uncertainties (U) at a confidence level of about 95 % In general, there was agreement at the PAWG meeting discussions in October 2015 that the study benchmarks the real situation for services in the field of peptide purity determination. However, there was considerable discussion on possible reasons for the discrepancy between results after presentation of the results of the individual participants. The major shortcoming is the peptide related impurities (PepImp) identification and quantification (Figure 13). In many cases, only a very small number of impurities have been identified/quantified resulting in an underestimation of the peptide related impurity mass fractions and consequently in an overestimation of the mass fraction value for hCP. Vice versa identification/quantification of a large number of impurities results in an overestimation of the peptide related impurity mass fractions and consequently in an underestimation of the mass fraction value for hCP. It has been discussed that an overestimation of the peptide related impurity mass fraction values could be caused by in-source fragmentation in LC-MS analysis due to poor chromatographic separation or other sample manipulation e.g. impurity pre-enrichment. It has been pointed out that the use of synthesized impurity standards has a positive impact on the quantification of the peptide related impurity mass fractions. The majority of five participants have quantified the peptide related impurities using a response factor (RF = 1) approach although four participants have used synthesized impurity standards to a different degree. NIM used 33 synthesized impurity standards (purities taken into account), BIPM used 14 synthesized
0
20
40
60
80
100
120
140
160
180
200
Pep
tide im
purities m
ass fraction (mg/g)
R.D. Josephs Final Report CCQM‐K115 18.01.2017
21 / 39
impurities standards (purities taken into account) to quantify the individual impurities and closely structurally related impurities and a RF = 1 approach with hCP for other impurities, LGC used 2 synthesized impurities standards and has quantified others with RF = 1 and PTB used 1 synthesized labelled impurity standard and has quantified others also with the labelled impurity standard. It was highlighted that the use of the response factor (RF = 1) approach could lead to an overestimation of the peptide related impurity mass fractions. It was discussed that the impact of the hydrolysis methods employed for PICAA on the quantification of the hCP mass fraction is not clear. In addition, previous pilot studies on peptide hydrolysis have shown discrepancies in hydrolysis efficiencies for a certain peptide [19]. Seven participants have used the PICAA approach in CCQM-K115. LGC and NMIJ have used microwave assisted hydrolysis. INMETRO, NRC, PTB, HSA and UME have employed gas/liquid phase hydrolysis. However, all participants that have used PICAA have performed an efficiency correction for the hydrolysis methods. To attempt to resolve the issues additional work was requested in the following areas:
• Revision of the TFA impurity mass fraction by the BIPM; • Breaking down the peptide related impurities values and to establish a means to
visualize identification and quantification issues for the peptide related impurities; • Calculation of the hydrolysis efficiency performance through a recalculation of all
PICAA results with one consistent peptide related impurity data set. The mass fraction value and corresponding expanded uncertainty of 30.20 ± 7.55 mg/g for the counter ion trifluoroacetate (TFA) provided by the BIPM was significantly lower than the values provided by NIM (CCQM-K115 submission) and NRC (CCQM-P55.2 submission) with mass fractions and corresponding expanded uncertainties of 59.684 ± 0.973 mg/g and 57.1 ± 1.9 mg/g, respectively. The BIPM has completed the establishment of an ion chromatography (IC) method for the determination of TFA subsequent to the discussions of October 2015 in the PAWG meeting. The BIPM has used sodium trifluoroacetate as a standard because trifluoroacetic acid is volatile and difficult to handle as standard for quantification. The BIPM has obtained a TFA mass fraction and corresponding expanded uncertainties of 54.58 +1.05/-1.06 mg/g for the CCQM-K115 study material. The new value obtained by the BIPM is much closer to the values obtained by NRC (19F-qNMR) and NIM (IC using trifluoroacetic acid as standard). However, the hCP mass fraction values obtained by the BIPM and NIM using a mass balance approaches still do not agree within their estimated uncertainties (Table 5). Consequently, the PAWG has decided in April 2016 to use the TFA mass fraction and corresponding combined uncertainty of 59.68 ± 0.48 mg/g obtained by the NIM for the calculation of the key comparison reference value for the mass fraction of hCP. The TFA mass fraction value obtained by the NIM in CCQM-K115 has been confirmed by the NRC through 19F-qNMR in CCQM-P55.2.
R.D. Josephs Final Report CCQM‐K115 18.01.2017
22 / 39
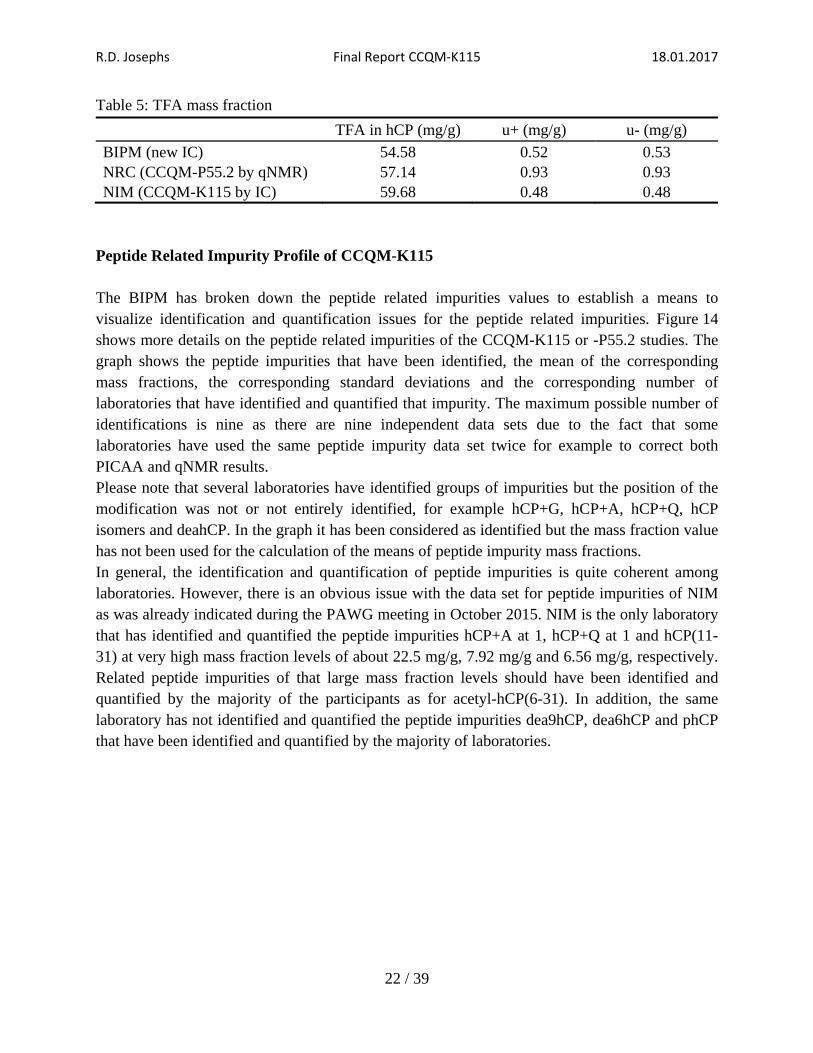
Table 5: TFA mass fraction
TFA in hCP (mg/g) u+ (mg/g) u- (mg/g)
BIPM (new IC) 54.58 0.52 0.53 NRC (CCQM-P55.2 by qNMR) 57.14 0.93 0.93 NIM (CCQM-K115 by IC) 59.68 0.48 0.48
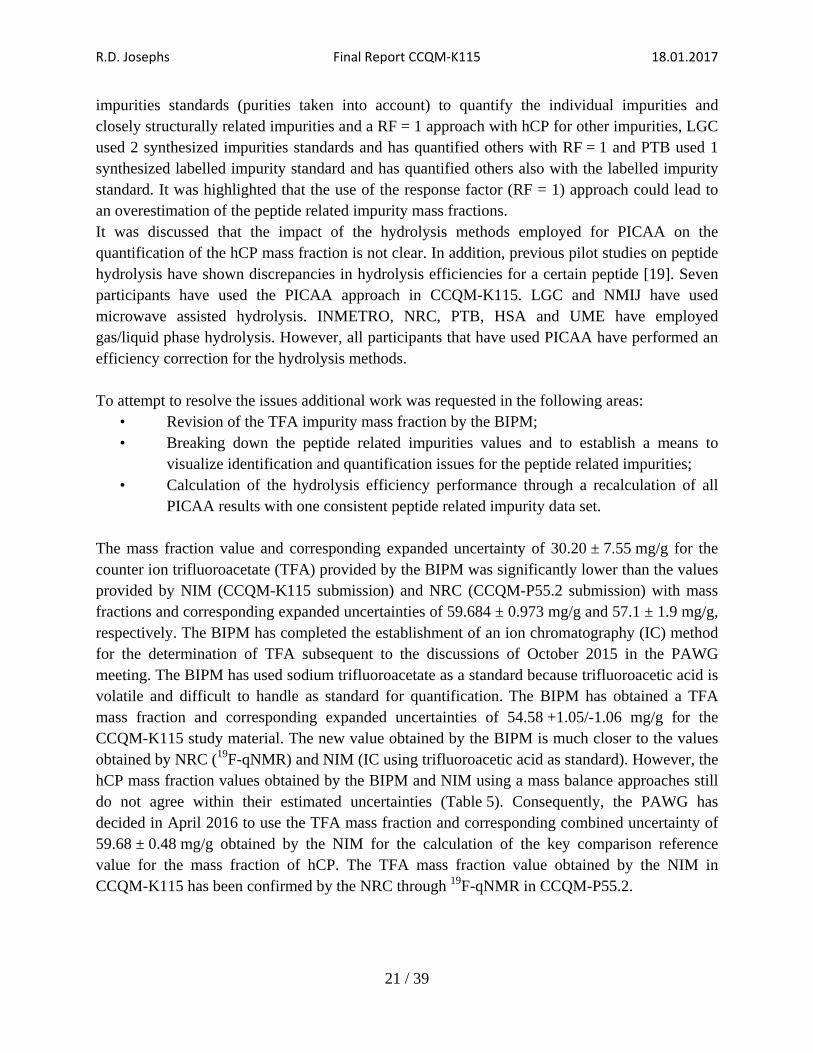
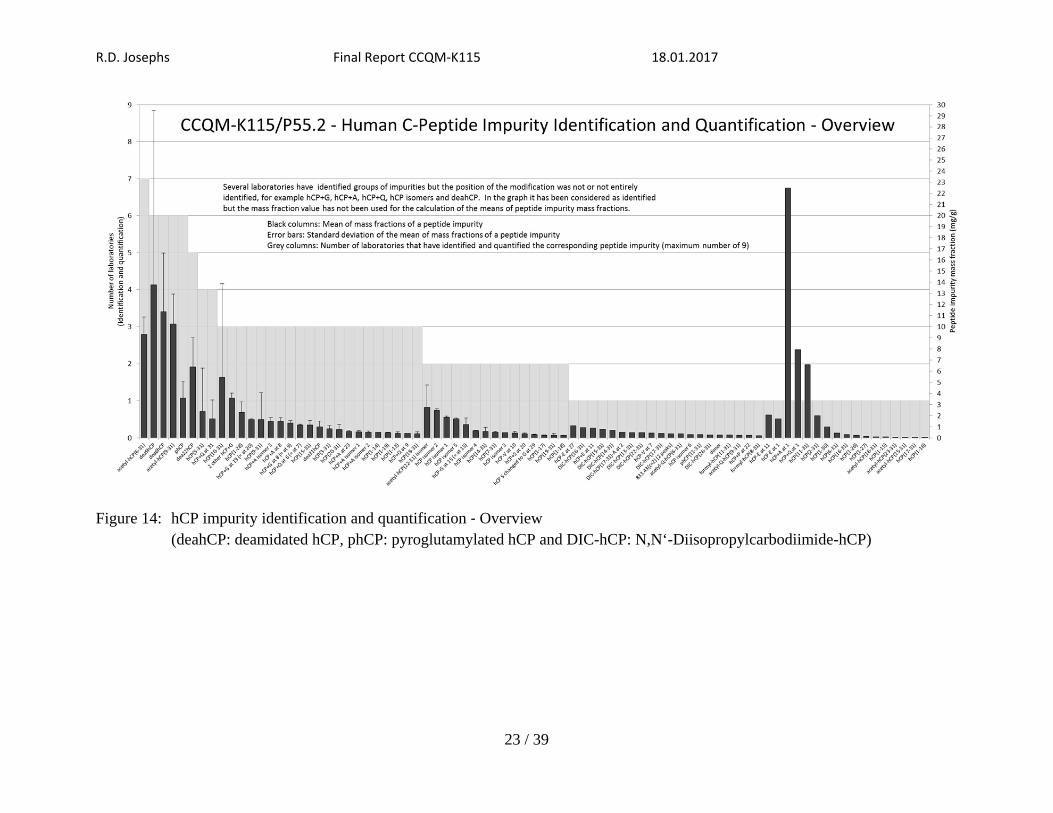
Peptide Related Impurity Profile of CCQM-K115 The BIPM has broken down the peptide related impurities values to establish a means to visualize identification and quantification issues for the peptide related impurities. Figure 14 shows more details on the peptide related impurities of the CCQM-K115 or -P55.2 studies. The graph shows the peptide impurities that have been identified, the mean of the corresponding mass fractions, the corresponding standard deviations and the corresponding number of laboratories that have identified and quantified that impurity. The maximum possible number of identifications is nine as there are nine independent data sets due to the fact that some laboratories have used the same peptide impurity data set twice for example to correct both PICAA and qNMR results. Please note that several laboratories have identified groups of impurities but the position of the modification was not or not entirely identified, for example hCP+G, hCP+A, hCP+Q, hCP isomers and deahCP. In the graph it has been considered as identified but the mass fraction value has not been used for the calculation of the means of peptide impurity mass fractions. In general, the identification and quantification of peptide impurities is quite coherent among laboratories. However, there is an obvious issue with the data set for peptide impurities of NIM as was already indicated during the PAWG meeting in October 2015. NIM is the only laboratory that has identified and quantified the peptide impurities hCP+A at 1, hCP+Q at 1 and hCP(11-31) at very high mass fraction levels of about 22.5 mg/g, 7.92 mg/g and 6.56 mg/g, respectively. Related peptide impurities of that large mass fraction levels should have been identified and quantified by the majority of the participants as for acetyl-hCP(6-31). In addition, the same laboratory has not identified and quantified the peptide impurities dea9hCP, dea6hCP and phCP that have been identified and quantified by the majority of laboratories.
R.D. Josephs Final Report CCQM‐K115 18.01.2017
23 / 39
Figure 14: hCP impurity identification and quantification ‐ Overview (deahCP: deamidated hCP, phCP: pyroglutamylated hCP and DIC-hCP: N,N‘-Diisopropylcarbodiimide-hCP)
R.D. Josephs Final Report CCQM‐K115 18.01.2017
24 / 39
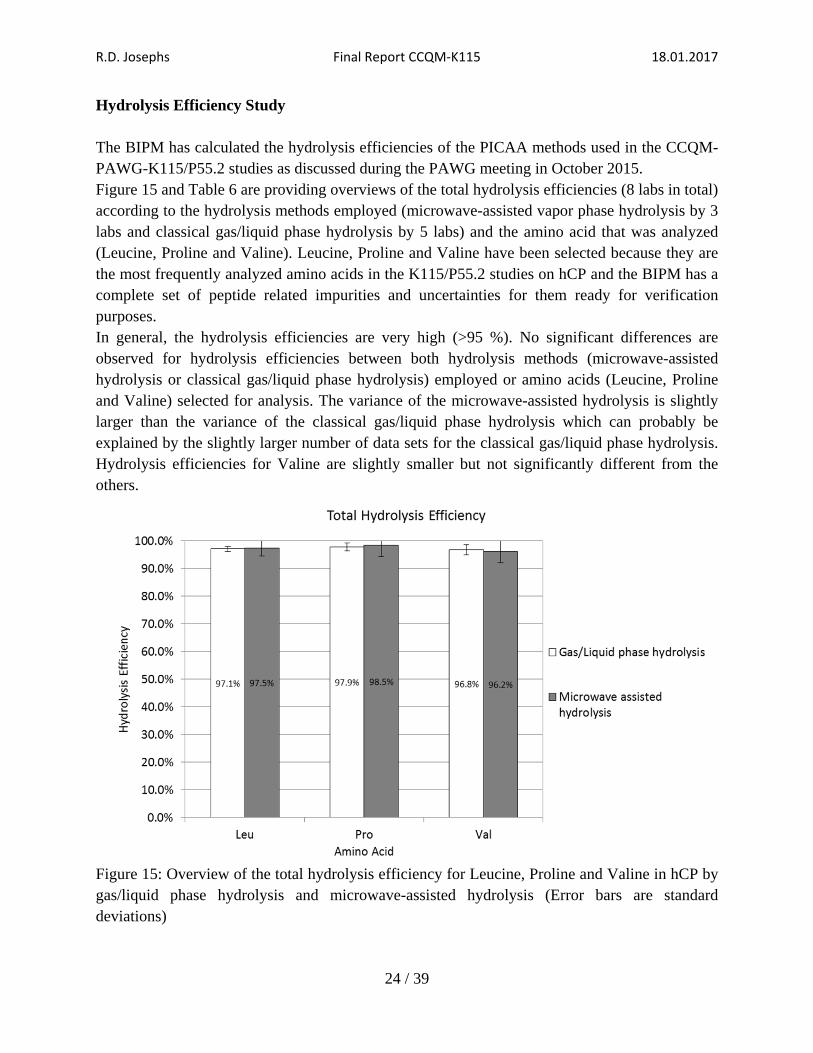
Hydrolysis Efficiency Study The BIPM has calculated the hydrolysis efficiencies of the PICAA methods used in the CCQM-PAWG-K115/P55.2 studies as discussed during the PAWG meeting in October 2015. Figure 15 and Table 6 are providing overviews of the total hydrolysis efficiencies (8 labs in total) according to the hydrolysis methods employed (microwave-assisted vapor phase hydrolysis by 3 labs and classical gas/liquid phase hydrolysis by 5 labs) and the amino acid that was analyzed (Leucine, Proline and Valine). Leucine, Proline and Valine have been selected because they are the most frequently analyzed amino acids in the K115/P55.2 studies on hCP and the BIPM has a complete set of peptide related impurities and uncertainties for them ready for verification purposes. In general, the hydrolysis efficiencies are very high (>95 %). No significant differences are observed for hydrolysis efficiencies between both hydrolysis methods (microwave-assisted hydrolysis or classical gas/liquid phase hydrolysis) employed or amino acids (Leucine, Proline and Valine) selected for analysis. The variance of the microwave-assisted hydrolysis is slightly larger than the variance of the classical gas/liquid phase hydrolysis which can probably be explained by the slightly larger number of data sets for the classical gas/liquid phase hydrolysis. Hydrolysis efficiencies for Valine are slightly smaller but not significantly different from the others.
Figure 15: Overview of the total hydrolysis efficiency for Leucine, Proline and Valine in hCP by gas/liquid phase hydrolysis and microwave-assisted hydrolysis (Error bars are standard deviations)
R.D. Josephs Final Report CCQM‐K115 18.01.2017
25 / 39
Table 6: Total hydrolysis efficiency means and standard deviations for Leucine, Proline and Valine in hCP for both gas/liquid phase hydrolysis and microwave-assisted hydrolysis methods
Total Hydrolysis Efficiency
Gas/Liquid phase hydrolysis Microwave‐assisted hydrolysis
Mean (%) SD (%) Mean (%) SD (%)
Leucine 97.1 0.8 97.5 3.0
Proline 97.9 1.4 98.5 4.2
Valine 96.8 1.8 96.2 4.0
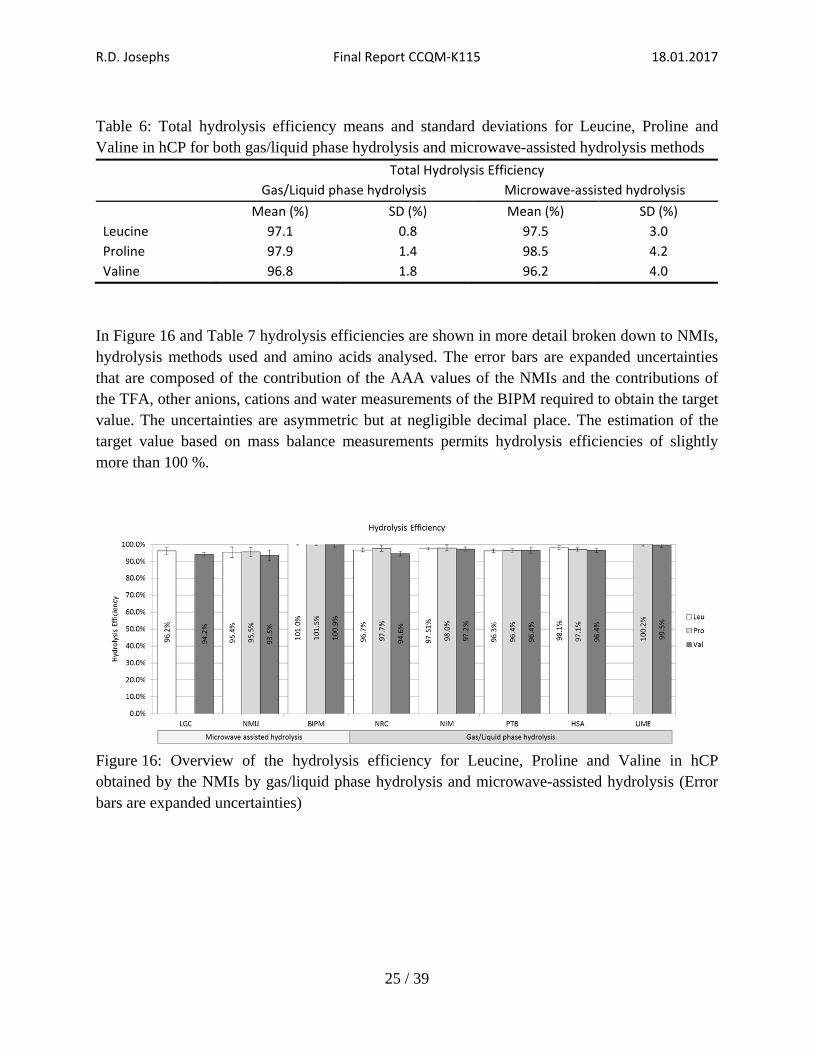
In Figure 16 and Table 7 hydrolysis efficiencies are shown in more detail broken down to NMIs, hydrolysis methods used and amino acids analysed. The error bars are expanded uncertainties that are composed of the contribution of the AAA values of the NMIs and the contributions of the TFA, other anions, cations and water measurements of the BIPM required to obtain the target value. The uncertainties are asymmetric but at negligible decimal place. The estimation of the target value based on mass balance measurements permits hydrolysis efficiencies of slightly more than 100 %.
Figure 16: Overview of the hydrolysis efficiency for Leucine, Proline and Valine in hCP obtained by the NMIs by gas/liquid phase hydrolysis and microwave-assisted hydrolysis (Error bars are expanded uncertainties)
R.D. Josephs Final Report CCQM‐K115 18.01.2017
26 / 39
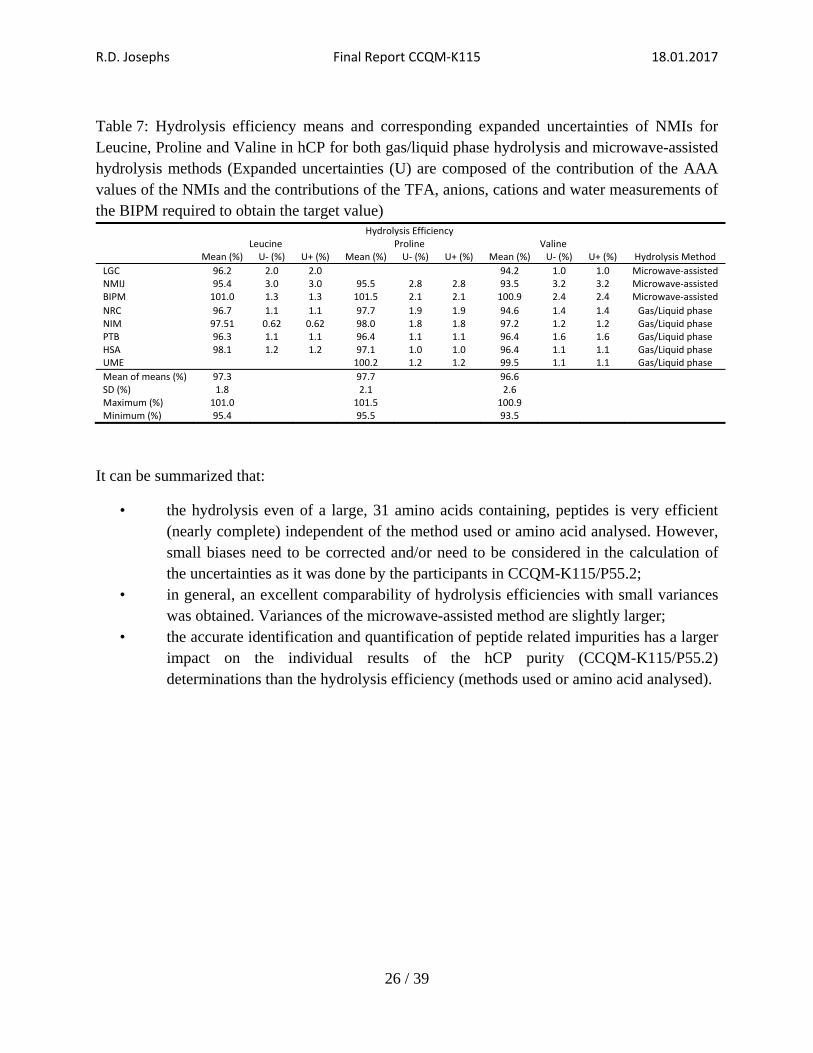
Table 7: Hydrolysis efficiency means and corresponding expanded uncertainties of NMIs for Leucine, Proline and Valine in hCP for both gas/liquid phase hydrolysis and microwave-assisted hydrolysis methods (Expanded uncertainties (U) are composed of the contribution of the AAA values of the NMIs and the contributions of the TFA, anions, cations and water measurements of the BIPM required to obtain the target value) Hydrolysis Efficiency Leucine Proline Valine
Mean (%) U‐ (%) U+ (%) Mean (%) U‐ (%) U+ (%) Mean (%) U‐ (%) U+ (%) Hydrolysis Method
LGC 96.2 2.0 2.0 94.2 1.0 1.0 Microwave‐assistedNMIJ 95.4 3.0 3.0 95.5 2.8 2.8 93.5 3.2 3.2 Microwave‐assistedBIPM 101.0 1.3 1.3 101.5 2.1 2.1 100.9 2.4 2.4 Microwave‐assisted
NRC 96.7 1.1 1.1 97.7 1.9 1.9 94.6 1.4 1.4 Gas/Liquid phaseNIM 97.51 0.62 0.62 98.0 1.8 1.8 97.2 1.2 1.2 Gas/Liquid phasePTB 96.3 1.1 1.1 96.4 1.1 1.1 96.4 1.6 1.6 Gas/Liquid phaseHSA 98.1 1.2 1.2 97.1 1.0 1.0 96.4 1.1 1.1 Gas/Liquid phaseUME 100.2 1.2 1.2 99.5 1.1 1.1 Gas/Liquid phase
Mean of means (%) 97.3 97.7 96.6SD (%) 1.8 2.1 2.6Maximum (%) 101.0 101.5 100.9Minimum (%) 95.4 95.5 93.5
It can be summarized that:
• the hydrolysis even of a large, 31 amino acids containing, peptides is very efficient (nearly complete) independent of the method used or amino acid analysed. However, small biases need to be corrected and/or need to be considered in the calculation of the uncertainties as it was done by the participants in CCQM-K115/P55.2;
• in general, an excellent comparability of hydrolysis efficiencies with small variances was obtained. Variances of the microwave-assisted method are slightly larger;
• the accurate identification and quantification of peptide related impurities has a larger impact on the individual results of the hCP purity (CCQM-K115/P55.2) determinations than the hydrolysis efficiency (methods used or amino acid analysed).
R.D. Josephs Final Report CCQM‐K115 18.01.2017
27 / 39
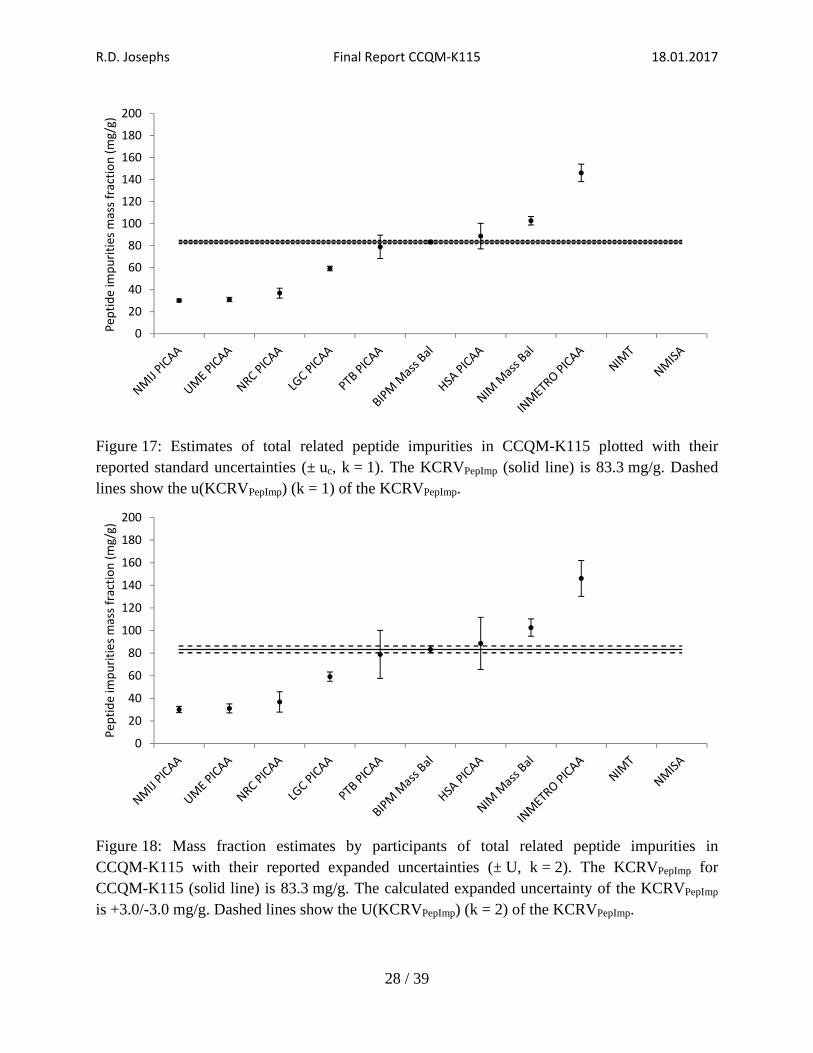
KEY COMPARISON REFERENCE VALUES (KCRVS) FOR CCQM-K115 The values used to establish the Key Comparison Reference Values (KCRVs) for CCQM-K115 are summarized in Table 3 and Table 4 for the hCP mass fraction and the peptide related impurity mass fractions, respectively. All participants in CCQM-K115 were required to give estimates for the mass fraction of the sub-class of peptide related impurities they quantified to obtain their final hCP mass fraction estimate. The coordinator has calculated the overall KCRV for hCP mass fraction and separate KCRV for the peptide related impurities as the peptide related impurity profile and quantification is of utmost importance. Impurity Profile and Key Comparison Reference Value (KCRV) for Mass Fraction of Peptide Related Impurities in CCQM-K115 The KCRVPepImp for the mass fraction of peptide impurities is based on the assumption that only the set of results obtained by the BIPM is taken for the calculation of the KCRVPepImp. The sum of the individual mass fractions of peptide related impurities that have been identified by the BIPM (impurities starting with acetyl-hCP(6-31) until formyl-hCP(8-18) inclusive according to Figure 14) have been used to establish the KCRVPepImp. The corresponding standard uncertainty (u(KCRVPepImp)) of the KCRVPepImp is the combined uncertainty of the standard uncertainties of the individual peptide impurities that have been considered. The BIPM Set of Results is the most exhaustive and elaborate set of related peptide impurities that shows the largest number of overlaps with the results obtained by the other participants. In addition, this approach minimizes the overestimation of peptide impurity mass fraction values as authentic standards have been used for the quantification of the peptide related impurities with the largest mass fraction values rather than an approach based on a response factor of 1. KCRVPepImp = 83.3 mg/g u+(KCRVPepImp) = 1.5 mg/g u-(KCRVPepImp) = 1.5 mg/g The results reported by participants with their corresponding standard uncertainties (k = 1) plotted against the proposed KCRVPepImp are presented in Figure 17. Figure 18 shows the same results with their expanded uncertainties and the KCRVPepImp with the corresponding expanded uncertainty at a confidence level of about 95 % (dashed lines).
R.D. Josephs Final Report CCQM‐K115 18.01.2017
28 / 39
Figure 17: Estimates of total related peptide impurities in CCQM-K115 plotted with their reported standard uncertainties (± uc, k = 1). The KCRVPepImp (solid line) is 83.3 mg/g. Dashed lines show the u(KCRVPepImp) (k = 1) of the KCRVPepImp.
Figure 18: Mass fraction estimates by participants of total related peptide impurities in CCQM-K115 with their reported expanded uncertainties (± U, k = 2). The KCRVPepImp for CCQM-K115 (solid line) is 83.3 mg/g. The calculated expanded uncertainty of the KCRVPepImp is +3.0/-3.0 mg/g. Dashed lines show the U(KCRVPepImp) (k = 2) of the KCRVPepImp.
0
20
40
60
80
100
120
140
160
180
200Pep
tide im
purities m
ass fraction (mg/g)
0
20
40
60
80
100
120
140
160
180
200
Pep
tide im
purities m
ass fraction (mg/g)
R.D. Josephs Final Report CCQM‐K115 18.01.2017
29 / 39
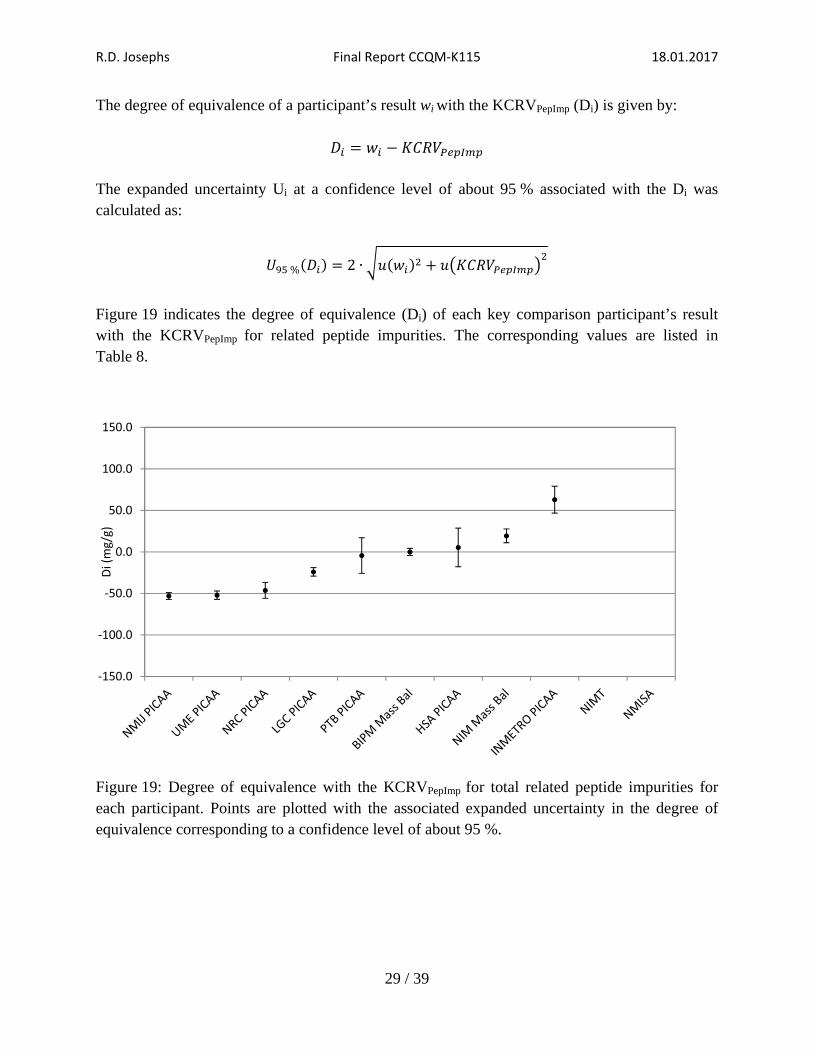
The degree of equivalence of a participant’s result wi with the KCRVPepImp (Di) is given by:
The expanded uncertainty Ui at a confidence level of about 95 % associated with the Di was calculated as:
% 2 ∙
Figure 19 indicates the degree of equivalence (Di) of each key comparison participant’s result with the KCRVPepImp for related peptide impurities. The corresponding values are listed in Table 8.
Figure 19: Degree of equivalence with the KCRVPepImp for total related peptide impurities for each participant. Points are plotted with the associated expanded uncertainty in the degree of equivalence corresponding to a confidence level of about 95 %.
‐150.0
‐100.0
‐50.0
0.0
50.0
100.0
150.0
Di (mg/g)
R.D. Josephs Final Report CCQM‐K115 18.01.2017
30 / 39
Table 8: Degrees of equivalence Di and expanded uncertainties U(Di) at a confidence level of about 95 % in mg/g for the KCRVPepImp for total related peptide impurities Di U+(Di) U-(Di) INMETRO PICAA 62.0 16.2 16.2 HSA PICAA 5.3 23.3 23.3 NIM Mass Bal 19.3 8.3 8.3 PTB PICAA -4.4 21.4 21.4 LGC PICAA -24.1 5.1 5.1 NMIJ PICAA -53.2 4.1 4.1 NRC PICAA -46.4 9.5 9.5 BIPM Mass Bal 0.0 4.3 4.3 UME PICAA -52.2 5.5 5.0
Key Comparison Reference Value (KCRV) for the Mass Fraction of hCP in CCQM-K115
The KCRVhCP for the mass fraction of hCP is based on a mass balance calculation that takes into account the most exhaustive and elaborate BIPM set of results for the peptide related impurities KCRVPepImp, the revised TFA mass fraction value from the NIM, water and other minor counter ions. The measurement equation to assign the KCRVhCP of hCP in CCQM-K115 (in mg/g) is:
1000
whCP = KCRVhCP for mass fraction of hCP in CCQM-K115 wPepImp = KCRVPepImp for mass fraction of peptide related impurities in CCQM-K115 wWater = Mass fraction of water in CCQM-K115 obtained by the BIPM wTFA = Revised mass fraction of TFA in CCQM-K115 obtained by the NIM wCat = Mass fraction of cations in CCQM-K115 obtained by the BIPM wAni = Mass fraction of anions (other than TFA) in CCQM-K115 obtained by the BIPM wVOC = Mass fraction of volatile organic solvents in CCQM-K115 obtained by the BIPM
The standard uncertainty (u(KCRVhCP)) associated with the mass fraction estimate for KCRVhCP is calculated from the equation:
The input values for impurities used for the calculation of KCRVhCP and the corresponding combined standard uncertainty in CCQM-K115 are given in Table 9.
R.D. Josephs Final Report CCQM‐K115 18.01.2017
31 / 39
Table 9: Input values for impurities used for the calculation of KCRVhCP and corresponding combined standard uncertainty in CCQM-K115
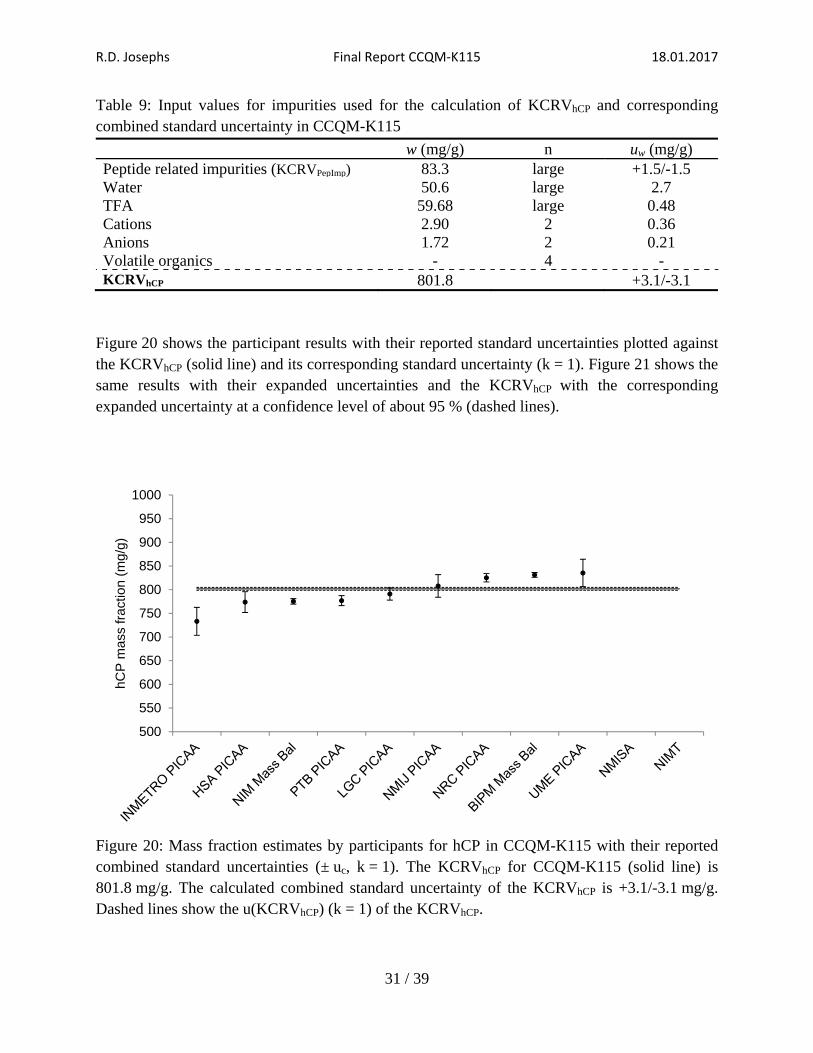
w (mg/g) n uw (mg/g) Peptide related impurities (KCRVPepImp) 83.3 large +1.5/-1.5 Water 50.6 large 2.7 TFA 59.68 large 0.48 Cations 2.90 2 0.36 Anions 1.72 2 0.21 Volatile organics - 4 - KCRVhCP 801.8 +3.1/-3.1
Figure 20 shows the participant results with their reported standard uncertainties plotted against the KCRVhCP (solid line) and its corresponding standard uncertainty (k = 1). Figure 21 shows the same results with their expanded uncertainties and the KCRVhCP with the corresponding expanded uncertainty at a confidence level of about 95 % (dashed lines).
Figure 20: Mass fraction estimates by participants for hCP in CCQM-K115 with their reported combined standard uncertainties (± uc, k = 1). The KCRVhCP for CCQM-K115 (solid line) is 801.8 mg/g. The calculated combined standard uncertainty of the KCRVhCP is +3.1/-3.1 mg/g. Dashed lines show the u(KCRVhCP) (k = 1) of the KCRVhCP.
500
550
600
650
700
750
800
850
900
950
1000
hCP
mas
s fr
actio
n (m
g/g)
R.D. Josephs Final Report CCQM‐K115 18.01.2017
32 / 39
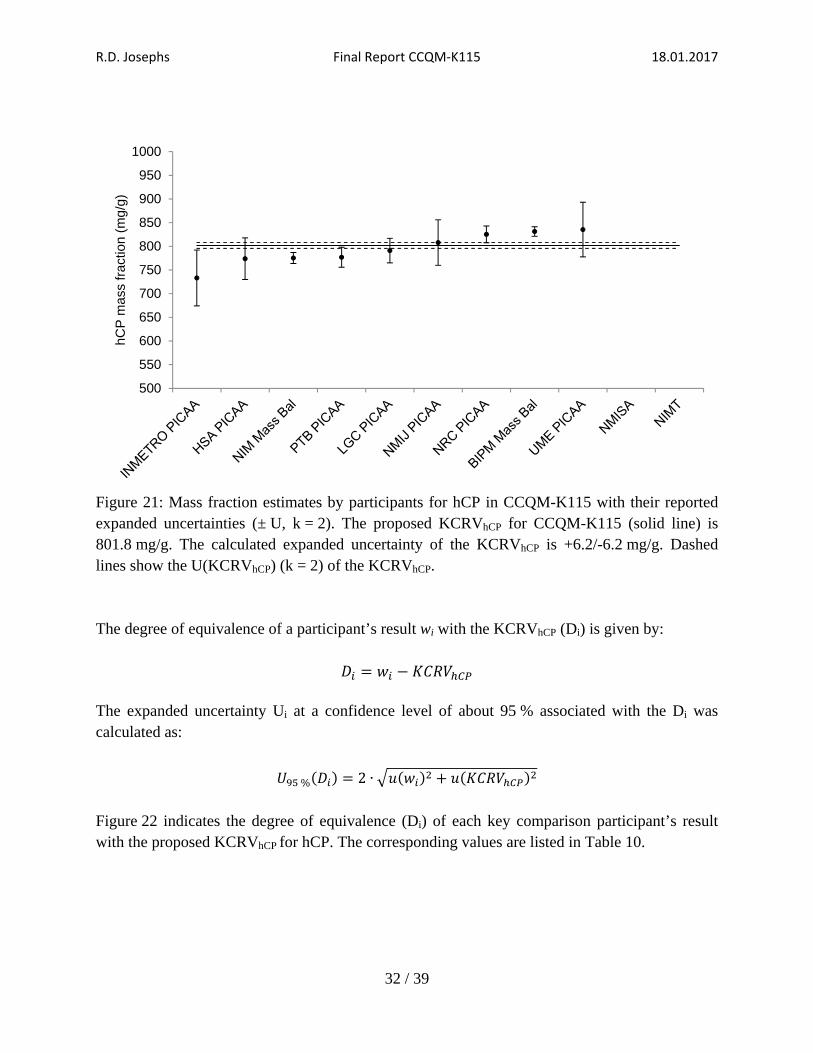
Figure 21: Mass fraction estimates by participants for hCP in CCQM-K115 with their reported expanded uncertainties (± U, k = 2). The proposed KCRVhCP for CCQM-K115 (solid line) is 801.8 mg/g. The calculated expanded uncertainty of the KCRVhCP is +6.2/-6.2 mg/g. Dashed lines show the U(KCRVhCP) (k = 2) of the KCRVhCP. The degree of equivalence of a participant’s result wi with the KCRVhCP (Di) is given by:
The expanded uncertainty Ui at a confidence level of about 95 % associated with the Di was calculated as:
% 2 ∙
Figure 22 indicates the degree of equivalence (Di) of each key comparison participant’s result with the proposed KCRVhCP for hCP. The corresponding values are listed in Table 10.
500
550
600
650
700
750
800
850
900
950
1000
hCP
mas
s fr
actio
n (m
g/g)
R.D. Josephs Final Report CCQM‐K115 18.01.2017
33 / 39
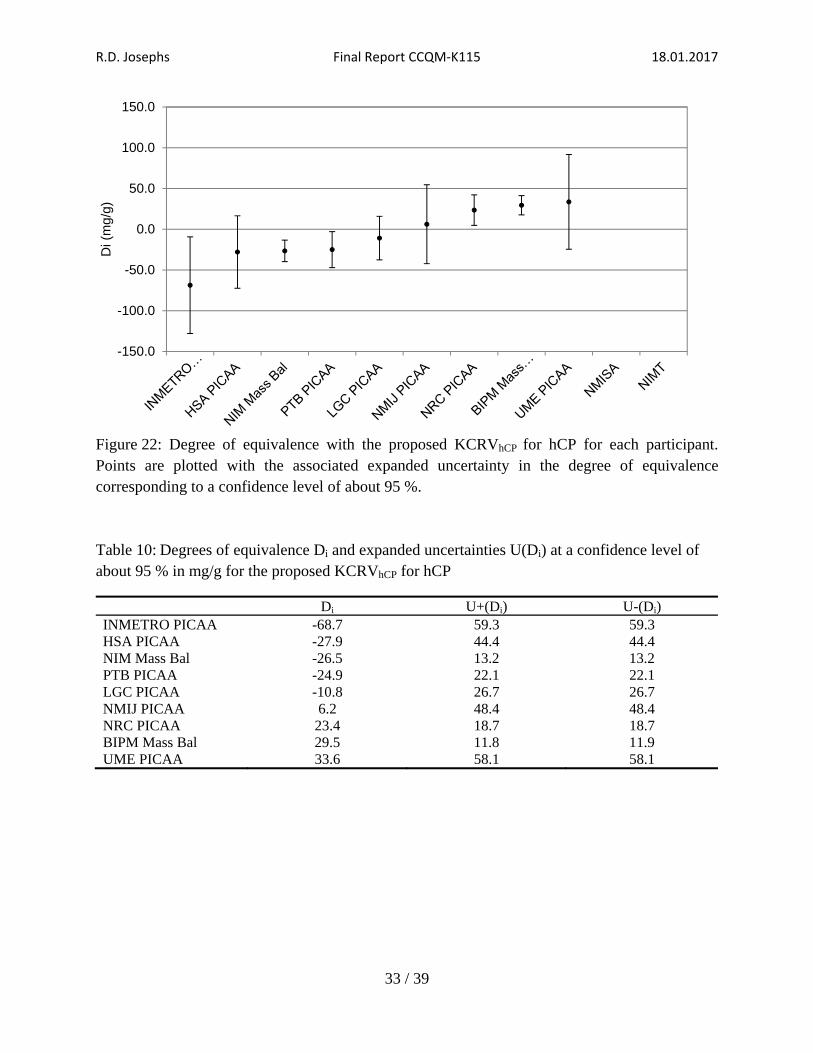
Figure 22: Degree of equivalence with the proposed KCRVhCP for hCP for each participant. Points are plotted with the associated expanded uncertainty in the degree of equivalence corresponding to a confidence level of about 95 %. Table 10: Degrees of equivalence Di and expanded uncertainties U(Di) at a confidence level of about 95 % in mg/g for the proposed KCRVhCP for hCP
Di U+(Di) U-(Di) INMETRO PICAA -68.7 59.3 59.3 HSA PICAA -27.9 44.4 44.4 NIM Mass Bal -26.5 13.2 13.2 PTB PICAA -24.9 22.1 22.1 LGC PICAA -10.8 26.7 26.7 NMIJ PICAA 6.2 48.4 48.4 NRC PICAA 23.4 18.7 18.7 BIPM Mass Bal 29.5 11.8 11.9 UME PICAA 33.6 58.1 58.1
-150.0
-100.0
-50.0
0.0
50.0
100.0
150.0D
i (m
g/g)
R.D. Josephs Final Report CCQM‐K115 18.01.2017
34 / 39
CONCLUSIONS hCP was selected to be representative of chemically synthesized linear peptides of known sequence, without cross-links, up to 5 kDa. It was anticipated to provide an analytical measurement challenge representative for the value-assignment of compounds of broadly similar structural characteristics. The majority of participants used a PICAA approach as the amount of material that has been provided to each participant (25 mg) is insufficient to perform a full mass balance based characterization of the material by a participating laboratory. The coordinators, both the BIPM and the NIM, were the laboratories to use the mass balance approach as they had more material available. It was decided to propose KCRVs for both the hCP mass fraction and the mass fraction of the peptide related impurities as indispensable contributor regardless of the use of PICAA, mass balance or any other approach to determine the hCP purity. This allows participants to demonstrate the efficacy of their implementation of the approaches used to determine the hCP mass fraction. In particular it allows participants to demonstrate the efficacy of their implementation of peptide related impurity identification and quantification. More detailed studies on the identification/quantification of peptide related impurities and the hydrolysis efficiency revealed that the integrity of the impurity profile of the related peptide impurities obtained by the participant is crucial for the impact on accuracy of the hCP mass fraction assignment. The assessment of the mass fraction of peptide impurities is based on the assumption that only the set of results obtained by the BIPM is taken for the calculation of the KCRVPepImp. The BIPM Set of Results is the most exhaustive and elaborate set of related peptide impurities that shows the largest number of overlaps with the results obtained by other participants. This approach has the advantage that it minimizes the potential overestimation of the proposed KCRVPepImp as many authentic standards have been used for the quantification of the peptide related impurities with the larger mass fraction values rather than an approach solely based on a response factor of 1. Consequently, the KCRVPepImp is associated with small uncertainties providing a more realistic basis of evaluation for the capabilities of the participants to identify/quantify peptide related impurities. Inspection of the degree of equivalence plots for the mass fraction of peptide impurities and additional information obtained from the peptide related impurity profile indicates that in many cases only a very small number of impurities have been identified and quantified resulting in an underestimation of the peptide related impurity mass fractions. The few cases of overestimation of the peptide related impurity mass fraction values could be caused by poor chromatographic separation and subsequent in-source fragmentation in mass spectrometry and by applying RF = 1 for quantification.
R.D. Josephs Final Report CCQM‐K115 18.01.2017
35 / 39
The approach to obtain a KCRVhCP for the mass fraction of hCP is based on a mass balance calculation that takes into account the most exhaustive and elaborate BIPM Set of Results for the peptide related impurities KCRVPepImp, the revised TFA mass fraction value from the NIM, water and other minor counter ions. Differences in the quality of the results obtained for both peptides related impurity mass fractions and hCP mass fractions are better weighted and reflected in smaller uncertainties. The KCRVhCP for CCQM-K115 is 801.8 mg/g with a corresponding expanded uncertainty of the KCRVhCP of +6.2/-6.2 mg/g. In general, mass balance approaches show smaller uncertainties than PICAA approaches. However, the mass fraction of hCP has been overestimated by the BIPM mass balance approach because of the underestimation of the TFA mass fraction. The NIM mass balance approach had underestimated the mass fraction of hCP as a result of an overestimation of the peptide related impurity mass fractions. The majority of results obtained by the PICAA approach are in agreement because of larger corresponding uncertainties.
R.D. Josephs Final Report CCQM‐K115 18.01.2017
36 / 39
HOW FAR THE LIGHT SHINES STATEMENT (HFTLS)
Successful participation in the CCQM-K115 comparison will support CMCs for:
Pure peptide primary reference materials value assigned for the mass fraction of the main component peptide within the material,
Methods for the value assignment of the mass fraction of the main component peptide within the material,
the identification and quantification of minor component peptide impurities within the material.
The HFTLS statement is applicable to chemically synthesized linear peptides of known sequence, without cross-links, up to 5 kDa. Additional evidence is required to support claims related to peptides that are larger than 5 kDa, or include cross-links, or have been produced using a recombinant process. In addition, the comparison will support traceability statements of CMCs for peptide/protein quantification which are dependent on pure peptide reference materials or methods for their value assignment for peptides meeting the above criteria. The hCP has been proposed as the comparison material, since:
it allows the generic capabilities listed above to be demonstrated for linear peptides without cross links and up to 5 kDa molecular mass;
it could be obtained in sufficiently large quantities required for the comparison;
it directly supports NMI services and certified reference materials currently being provided by NMIs [20];
it is an important analyte for which reference methods have been developed in laboratory medicine [21-24].
ACKNOWLEDGEMENTS The study coordinators thank all of the participating laboratories for providing all the requested information and excellent collaboration during the course of these studies.
R.D. Josephs Final Report CCQM‐K115 18.01.2017
37 / 39
REFERENCES [1] J. Marriott, G. O’Connor, H. Parkes: Final Report - Study of Measurement Service and
Comparison Needs for an International Measurement Infrastructure for the Biosciences and Biotechnology: Input for the BIPM Work Programme, Rapport BIPM-2011/02 (2011) http://www.bipm.org/utils/common/pdf/rapportBIPM/2011/02.pdf
[2] R. D. Josephs, M. Li, H. Li, R.I. Wielgosz: CCQM-K115/P55.2: Key Comparison on Peptide Purity: Protocol Proposal (NIM and BIPM) BAWG/xx-xx and OAWG/13-43 and (2013) BIPM webpage, CCQM BAWG/OAWG working documents.
[3] R. D. Josephs, N. Stoppacher, M. Li: Input for BAWG Drafting Group for CON 3: Routes to Macromolecular / Biomolecular Purity - Concept Paper on SI Value Assignment of Purity: Model for the classification of peptides for primary structure purity determinations, circulated for BAWG 13, Pretoria (2013) 1-10. (http://www.bipm.org/wg/CCQM/BAWG/Restricted/November_2013/BAWG_13_49_RJ_Con003.pdf)
[4] L. Mackay: CCQM OAWG Strategy Document for Rolling Programme Development, OAWG/13-02 (2013) BIPM webpage, CCQM OAWG working documents.
[5] S. Westwood, T. Choteau, A. Daireaux, R. D. Josephs, R. I. Wielgosz: Mass Balance Method for the SI Value Assignment of the Purity of Organic Compounds, Anal. Chem. 85 (2013) 3118-3126.
[6] S. Westwood, R. D. Josephs, T. Choteau, A. Daireaux, C. Mesquida, R. I. Wielgosz, A. Rosso, M. Ruiz de Arechavaleta, S. Davies, H. Wang, E. C. Pires do Rego, J. Marques Rodrigues, E. de Freitas Guimarães, M. V. Barreto Sousa, T. M. Monteiro, L. Alves das Neves Valente, F. G. Marques Violante, R. R. Ribeiro Almeida, M. C. Baptista Quaresma, R. Nogueira, A. Windust, X. Dai, X. Li, W. Zhang, M. Li, M. Shao, C. Wei, S.-K. Wong, J. Cabillic, F. Gantois, R. Philipp, D. Pfeifer, S. Hein, U.-A. Klyk-Seitz, K. Ishikawa, E. Castro, N. Gonzalez, A. Krylov, T. Tang Lin, L. Tong Kooi, M. Fernandes-Whaley, D. Prévoo, M. Archer, R. Visser, N. Nlhapo, B.J. de Vos, S. Ahn, P. Pookrod, K. Wiangnon, N. Sudsiri, K. Muaksang, C. Cherdchu, A. C. Gören, M. Bilsel, T. LeGoff, D. Bearden, M. Bedner, D. Duewer, D. Hancock, B. Lang, K. Lippa, M. Schantz, J. Sieber: Final report on key comparison CCQM-K55.b (aldrin): An international comparison of mass fraction purity assignment of aldrin, Metrologia 49 (2012) Tech. Suppl., 1A, 08014.
[7] S. Westwood, R. D. Josephs, A. Daireaux, R. I. Wielgosz, S. Davies, H. Wang, J. Rodrigues, W. Wollinger, A. Windust, M. Kang, S. Fuhai, R. Philipp, P. Kuhlich, S.-K. Wong, Y. Shimizu, M. Pérez, M. Avila, M. Fernandes-Whaley, D. Prevoo, B.J. de Vos, R. Visser, M. Archer, T. LeGoff, S. Wood, D. Bearden, M. Bedner, A. Boroujerdi, D. Duewer, D. Hancock, B. Lang, B. Porter, M. Schantz, J. Sieber, E. White, S. A. Wise: Final report on key comparison CCQM-K55.a (estradiol): An international comparison of mass fraction purity assignment of estradiol, Metrologia 49 (2012) Tech. Suppl., 1A, 08009.
R.D. Josephs Final Report CCQM‐K115 18.01.2017
38 / 39
[8] S. Westwood, R. D. Josephs, T. Choteau, C. Mesquida, A. Daireaux, R. Wielgosz, S. Davies, A. Windust, M. Kang, H. Ting, K. Kato, E. Frias, M. Pérez, P. Apps, M. Fernandes-Whaley, K. Wiangnon, N. Ruangrittinon, S. Wood, T. LeGoff, D. Duewer, M. Schantz, L. Siekmann, J. Esker: An international comparison of mass fraction purity assignment of digoxin: CCQM Pilot Study CCQM-P20.f (Digoxin), Metrologia 48 (2011) Tech. Suppl., 08013.
[9] S. Westwood, R. D. Josephs, A. Daireaux, R. Wielgosz, S. Davies, M. Kang, H. Ting, R. Phillip, F. Malz, Y. Shimizu, E. Frias, M. Pérez, P. Apps, M. Fernandes-Whaley, B. De Vos, K. Wiangnon, N. Ruangrittinon, S. Wood, D. Duewer, M. Schantz, M. Bedner, D. Hancock, J. Esker: An international comparison of mass fraction purity assignment of theophylline: CCQM Pilot Study CCQM-P20.e (Theophylline), Metrologia 46 (2009) 1A, 08019.
[10] S. Westwood, R. D. Josephs, T. Choteau, A. Daireaux, R. Wielgosz, S. Davies, M. Moad, B. Chan, A. Muñoz, P. Conneely, M. Ricci, E. C. Pires do Rego, B. C. Garrido, F. G. M. Violante, A. Windust, X. Dai, T. Huang, W. Zhang, F. Su, C. Quan, H. Wang, M.-F. Lo, W.-F. Wong, F. Gantois, B. Lalere, U. Dorgerloh, M. Koch, U.-A. Klyk-Seitz, D. Pfeifer, R. Philipp, C. Piechotta, S. Recknagel, R. Rothe, T. Yamazaki, O. B. Zakaria, E. Castro, M. Balderas, N. González, C. Salazar, L. Regalado, E. Valle, L. Rodríguez, L. Á. Laguna, P. Ramírez, M. Avila, J. Ibarra, L. Valle, M. Pérez, M. Arce, Y. Mitani, L. Konopelko, A. Krylov, E. Lopushanskaya, T. T. Lin, Q. Liu, L. T. Kooi, M. Fernandes-Whaley, D. Prevoo-Franzsen, N. Nhlapo, R. Visser, B. Kim, H. Lee, P. Kankaew, P. Pookrod, N. Sudsiri, K. Shearman, A. C. Gören, G. Bilsel, H. Yilmaz, M. Bilsel, M. Çergel, F. G. Çoskun, E. Uysal, S. Gündüz, I. Ün, J. Warren, D. W. Bearden, M. Bedner, D. L. Duewer, B. E. Lang, K. A. Lippa, M. M. Schantz, J. R. Sieber: Final report on key comparison CCQM-K55.c (L-(+)-Valine): Characterization of organic substances for chemical purity, Metrologia 51 (2014) Tech. Suppl., 1A, 08010.
[11] C. Pritchard, F. A. Torma, C. Hopley, M. Quaglia, G. O’Connor: Investigating microwave hydrolysis for the traceable quantification of peptide standards using gas chromatography-mass spectrometry, Anal. Biochem. 412 (2011) 1, 40-46.
[12] C. Pritchard, M. Quaglia, C. Mussell, W. I. Burkitt, H. Parkes, G. O’Connor: Fully traceable absolute protein quantification of somatropin that allows independent comparison of somatropin standards, Clin. Chem. 55 (2009) 11, 1984-1990.
[13] W. I. Burkitt, C. Pritchard, C. Arsene, A. Henrion, D. Bunk, G. O’Connor: Toward Systeme International d'Unite-traceable protein quantification: From amino acids to proteins, Anal. Biochem. 376 (2008) 2, 242-251.
[14] C. G. Arsene, R. Ohlendorf, W. Burkitt, C. Pritchard, A. Henrion, G. O’Connor, D. M. Bunk, B.Guettler: Protein Quantification by Isotope Dilution Mass Spectrometry of Proteolytic Fragments: Cleavage Rate and Accuracy, Anal. Chem. 80 (2008) 11, 4154-4160.
R.D. Josephs Final Report CCQM‐K115 18.01.2017
39 / 39
[15] C. G. Arsene, A. Henrion, N. Diekmann, J. Manolopoulou, M. Bidlingmaier: Quantification of growth hormone in serum by isotope dilution mass spectrometry, Anal. Biochem. 401 (2010) 2, 228-235.
[16] A. Munoz, R. Kral, H. Schimmel: Quantification of protein calibrants by amino acid analysis using isotope dilution mass spectrometry, Anal. Biochem. 408 (2011) 124-131.
[17] N. Stoppacher, R. D. Josephs, A. Daireaux, S. Westwood, R. I. Wielgosz: Impurity identification and determination for the peptide hormone angiotensin I by liquid chromatography – high resolution tandem mass spectrometry and the metrological impact on value assignments by amino acid analysis, Anal. Bioanal. Chem. 405 (2013) 8039–8051.
[18] R. D. Josephs, N. Stoppacher, A. Daireaux, T. Choteau, I. McEwan, K. Lippa, K. Phinney, S. Westwood, R. Wielgosz: A Comparison of Approaches for the SI Value Assignment of the Purity of Peptides Using the Model Compound Angiotensin I (2017) [in preparation].
[19] D. Bunk: P55.1 Scope of applicability BAWG/12-54 and Hydrolysis investigation study BAWG/12-59 (2012) BIPM webpage, CCQM BAWG working documents.
[20] T. Kinumi, M. Goto, S. Eyama, M. Kato, T. Kasama, A. Takatsu: Development of SI-traceable C-peptide certified reference material NMIJ CRM 6901-a using isotope-dilution mass spectrometry-based amino acid analyses, Anal. Bioanal. Chem. 404 (2012) 13-21.
[21] R. R. Little, C. L. Rohlfing, A. L. Tennill, R. W. Madsen, K. S. Polonsky, G. L. Myers, C. J. Greenbaum, J. P. Palmer, E. Rogatsky, D. T. Stein: Standardization of C-Peptide Measurements, Clin. Chem. 54 (2008) 1023-1026.
[22] C. Fierens, D. Stockl, D. Baetens, A. P. De Leenheer, L. M. Thienpont: Application of a C-peptide electrospray ionization-isotope dilution-liquid chromatography tandem mass spectrometry measurement procedure for the evaluation of five C-peptide immunoassays for urine, J. Chromatogr. B Analyt. Technol. Biomed. Life Sci. 792 (2003) 249-259.
[23] D. Rodrıguez-Cabaleiro, D. Stockl, L. M. Thienpont: Improvement of sample pretreatment prior to analysis of C-peptide in serum by isotope dilution-liquid chromatography-tandem mass spectrometry, Rapid Commun. Mass Spectrom. 19 (2005) 3600-3602.
[24] D. Rodríguez Cabaleiro, D. Stöckl, J. M. Kaufman, T. Fiers, L. M. Thienpont, Feasibility of Standardization of Serum C-Peptide Immunoassays with Isotope-Dilution Liquid Chromatography–Tandem Mass Spectrometry, Clin. Chem. 52 (2006) 1193-1196.