Embed Size (px)
Citation preview
CELLULOSE NANOFIBRIL
NETWORKS AND COMPOSITES
PREPARATION, STRUCTURE AND PROPERTIES
Marielle Henriksson
AKADEMISK AVHANDLING
Som med tillstånd av Kungliga Tekniska Högskolan i Stockholm framlägges till offentlig granskning för avläggande av teknisk doktorsexamen fredagen den 8 februari 2008, kl 10.00 i sal F3, Lindstedtsvägen 26, KTH, Stockholm. Avhandlingen försvaras på engelska.
Copyright © 2008 Marielle Henriksson All rights reserved Paper I © 2007 American Chemical Society Publications Paper II © 2007 Elsevier Paper III © 2007 Wiley Periodicals, Inc. TRITA-CHE-Report 2008:3 ISSN 1654-1081 ISBN 978-91-7178-849-8
For my grandmothers, Lilly and Sigrid

ABSTRACT The cellulose nanofibril from wood is an interesting new material
constituent that can provide strong reinforcement in polymer nanocomposites due to the high stiffness of the cellulose crystals and the network formation characteristics of the nanofibrils. Cellulose nanofibrils can be used either in the form of low aspect ratio microcrystalline cellulose, MCC, or as high aspect ratio microfibrillated cellulose, MFC. The objective is to study structure-property relationships for cellulose nanofibril networks and composites.
Nanocomposites based on MCC and thermoplastic polyurethane were prepared by in-situ polymerization. The cellulose nanofibrils were successfully dispersed in the matrix and the composites showed improvements in stiffness, strength, as well as in strain-to-failure. Cellulose nanofibrils reinforce the physical rubber network by strong molecular interaction with the rubber.
A method that facilitates microfibrillation of the pulp cell wall during homogenization has been developed. The pulps were treated with a combination of beating and enzymatic treatment prior to homogenization. The enzymatic pretreatment was found to facilitate the microfibrillation and the mechanisms are discussed. The resulting MFC nanofibrils were of high aspect ratio.
Cellulose nanofibril networks of high toughness were prepared from MFC and studied with respect to the structure and mechanical properties. These films have a porous structure and the nanofibrils are more in-plane than in-space oriented. Tensile testing showed that the strength is dependent on the average molecular weight of the cellulose. The MFC of the highest molecular weight showed a modulus of 13.2 GPa, tensile strength as high as 214 MPa and 10.1% strain-to-failure, at a porosity of 28%.
Composites of high fiber content have been prepared by addition of melamine formaldehyde to MFC films. These composites show increased stiffness and strength, at the cost of strain-to-failure. Composites were also prepared by impregnating MFC nanofibril networks with a hyperbranched polymer. The matrix was crosslinked and strong interactions with the nanofibrils were formed. By DMA two Tg’s were observed for the composites with 0.26 and 0.43 volume fraction nanofibrils. The Tg of the matrix was observed as well as a Tg at higher temperatures. This corresponds to molecules with constrained mobility by increased interactions with the cellulose nanofibril surfaces.
SAMMANFATTNING Träbaserade cellulosananofibriller är intressanta som förstärkande fas i
polymera nanokompositer; detta främst på grund av den kristallina cellulosans höga styvhet och på grund av nanofibrillernas förmåga att bilda nätverk. Cellulosananofibriller kan användas i form av mikrokristallin cellulosa, MCC, som har lågt längd/diameter förhållande, eller i form av mikrofibrillerad cellulosa, MFC, med högt längd/diameter förhållande. Målet med det här arbetet är att studera struktur-egenskapsförhållanden för nanofibrillnätverk och kompositer.
Nanokompositer baserade på MCC och termoplastisk polyuretan tillverkades genom in-situ polymerisation. Cellulosafibrillerna var väl dispergerade i matrisfasen och kompositen visade ökad styvhet, styrka samt brottöjning. Dessa förbättningar antas bero på stark interaktion mellan polyuretan och cellulosananofibrillerna.
En metod som underlättar mikrofibrillering av massafiberns cellvägg under homogenisering har utvecklats. Massan förbehandlades med ett enzym innan homogenisering. Den här metoden förenklade mikrofibrilleringen och mekanismerna diskuteras. De resulterande MFC-nanofibrillerna hade högt längd/diameter förhållande.
Filmer har tillverkats av MFC-nanofibriller och filmernas struktur samt mekaniska egenskaper har studerats. Röntgendiffraktion och SEM visar att nanofibrilerna är mer orienterade i planet än i rymden. SEM och densitetsmätningar visar även att filmerna har en porös struktur. Resultaten från dragprovning visade att filmernas brottstyrka är beroende av molekylvikten för cellulosan. Nanofibrillerna med högst molekylvikt visade en E-modul på 13.2 GPa, brottstyrkan var 214 MPa och brottöjningen 10.1%.
Kompositer med hög fiberhalt har tillverkats genom tillsats av melaminformaldehyd till MFC-filmer. Dessa kompositer visar ökad styvhet och styrka på bekostnad av brottöjningen. Kompositer har också tillverkats genom impregnering av MFC-nätverk med en hyperförgrenad polymer som tvärbands. DMA visar två Tg för kompositerna med 0.26 och 0.43 volymfraktion nanofibriller; matrisens Tg samt ytterligare ett Tg vid högre temperatur. Detta motsvarar molekyler med lägre mobilitet på grund av ökad interaktion med nanofibrillernas ytor.
LIST OF PAPERS This thesis is a summary of the following papers:
I. “A High Strength Nanocomposite Based on Microcrystalline Cellulose and Polyurethane” Q. Wu, M. Henriksson, X. Liu, and L. A. Berglund, Biomacromolecules, 2007, 8, 3687-3692.
II. “An environmentally friendly method for enzyme-assisted preparation of microfibrillated cellulose (MFC) nanofibers”, M. Henriksson, G. Henriksson, L. A. Berglund, T. Lindström, European Polymer Journal, 2007, 43, 3434–3441.
III. “Structure and Properties of Cellulose Nanocomposite Films Containing Melamine Formaldehyde”, M. Henriksson, L. A. Berglund, Journal of Applied Polymer Science, 2007, 106, 2817–2824.
IV. “Cellulose nanopaper structures of high toughness” M. Henriksson, L. A. Berglund, P. Isaksson, T. Lindström, T. Nishino, Biomacromolecules submitted.
V. “A new nanocomposites approach for strong attachment of polymer matrices to cellulose nanofibril networks” M. Henriksson, L. Fogelström, M. Johansson, A. Hult, L. A. Berglund, manuscript.
The contribution of the author of this thesis to the appended papers is: I. Some parts of the experimental work and preparation of the manuscript.
Took part in the evaluation of the results.
II. All the experimental work and most of the preparation of the manuscript, the original concept is due to prof. T. Lindström.
III. All the experimental work and most of the preparation of the manuscript.
IV. A majority of the experimental work and most of the preparation of the
manuscript. Involved in all parts of the work.
V. About half of the experimental work and preparation of the manuscript. Took part in outlining the experimental work and in the evaluation of the results. Involved in all parts of the work.
TABLE OF CONTENTS 1 INTRODUCTION ...................................................................................... 1
1.1 BACKGROUND....................................................................................... 1 1.2 OBJECTIVE.............................................................................................. 2 1.3 PREPARATION OF CELLULOSE NANOFIBRILS ....................................... 2 1.4 FILMS OF CELLULOSE NANOFIBRILS ..................................................... 4 1.5 CELLULOSE NANOCOMPOSITES............................................................ 5 1.6 APPLICATION OF CELLULOSE NANOFIBRIL FILMS AND COMPOSITES. 7
2 EXPERIMENTAL ........................................................................................ 9
2.1 PREPARATION OF MFC (PAPER II-V) .................................................. 9 2.2 PREPARATION OF MFC FILMS (PAPER III-V) .................................... 10 2.3 PREPARATION OF NANOCOMPOSITES................................................ 11
2.3.1 Polyurethane reinforced with MCC (Paper I) ................................. 11 2.3.2 MFC and melamine formaldehyde composites (Paper III) .............. 11 2.3.3 MFC and a matrix based on a hyperbranched polymer (Paper V) .. 11
2.4 VISCOSITY AND DEGREE OF POLYMERIZATION (PAPER II-V) ........... 12 2.5 SIZE EXCLUSION CHROMATOGRAPHY (PAPER II, IV) ....................... 13 2.6 DENSITY AND POROSITY (PAPER III-V).............................................. 13 2.7 X-RAY DIFFRACTION AND ORIENTATION (PAPER IV)....................... 13 2.8 ATOMIC FORCE MICROSCOPY (PAPER II) ........................................... 14 2.9 SCANNING ELECTRON MICROSCOPY (PAPER II-V) ........................... 14 2.10 TENSILE TESTING (PAPER I, III-V) ...................................................... 14 2.11 ACOUSTIC EMISSION (PAPER IV)........................................................ 15 2.12 DYNAMIC MECHANICAL ANALYSIS (PAPER I, III, V) ........................ 15 2.13 SORPTION-DESORPTION (PAPER III) .................................................. 16
3 RESULTS AND DISCUSSION.............................................................. 17
3.1 CELLULOSE REINFORCED POLYURETHANE NANOCOMPOSITE (PAPER I) .................................................................................................. 17
3.1.1 Composite preparation..................................................................... 17 3.1.2 Nanocomposite structure................................................................. 17 3.1.3 Mechanical properties...................................................................... 18
3.2 PREPARATION OF MICROFIBRILLATED CELLULOSE (PAPER II) ......... 22 3.2.1 Physical appearance of pretreated pulp............................................ 22 3.2.2 Ease of homogenization.................................................................... 24 3.2.3 After homogenization ...................................................................... 25 3.2.4 Mechanisms facilitating disintegration of MFC nanofibrils ........... 27 3.2.5 Evaluation of the homogenization process....................................... 28
3.3 FILMS FROM MICROFIBRILLATED CELLULOSE (PAPER III, IV) .......... 29 3.3.1 Structure of MFC nanofibril films .................................................. 29 3.3.2 Properties of MFC nanofibril films.................................................. 31 3.3.3 Deformation mechanisms ................................................................ 35
3.4 COMPOSITES REINFORCED WITH MFC (PAPER III, V) ...................... 37 3.4.1 MFC films containing melamine formaldehyde (Paper III) ............ 37 3.4.2 Cross-linked hyprebranched matrix reinforced with MFC
(Paper V).......................................................................................... 42
4 CONCLUSIONS ....................................................................................... 45
5 ACKNOWLEDGEMENTS...................................................................... 47
6 REFERENCES ............................................................................................ 48
1
1 INTRODUCTION 1.1 BACKGROUND
A composite consists of two or more physically distinct and mechanically separable constituents. When one of these constituents is dispersed in the other, the new material achieves superior properties compared with the individual components.1 Conventional composites are typically reinforced by fillers with dimensions at the µm or mm scale. In 1990 a research team at Toyota, Japan, published a study where they utilized clay mineral sheets in layered silica as reinforcement in nylon 6.2 These layers are 1 nm thick and about 100 nm wide. Nylon 6 was polymerized in the interlayer spacing and, after injection molding, the prepared material showed dramatically improved stiffness, strength and increased heat distortion temperature compared with unfilled nylon 6. This improvement occurred at as low filler contents as 5%, by weight. This kind of composite, where the reinforcing particles have at least one dimension at the nanoscale, is termed a nanocomposite.
Since the Japanese study was published, many more studies on clay nanocomposites have been reported, see for example the reviews by Alexandre et al.3 and Okada et al.4 Also fiber-shaped fillers function well as nanocomposite reinforcement. Studies on carbon nanotube composites are numerous.5,6
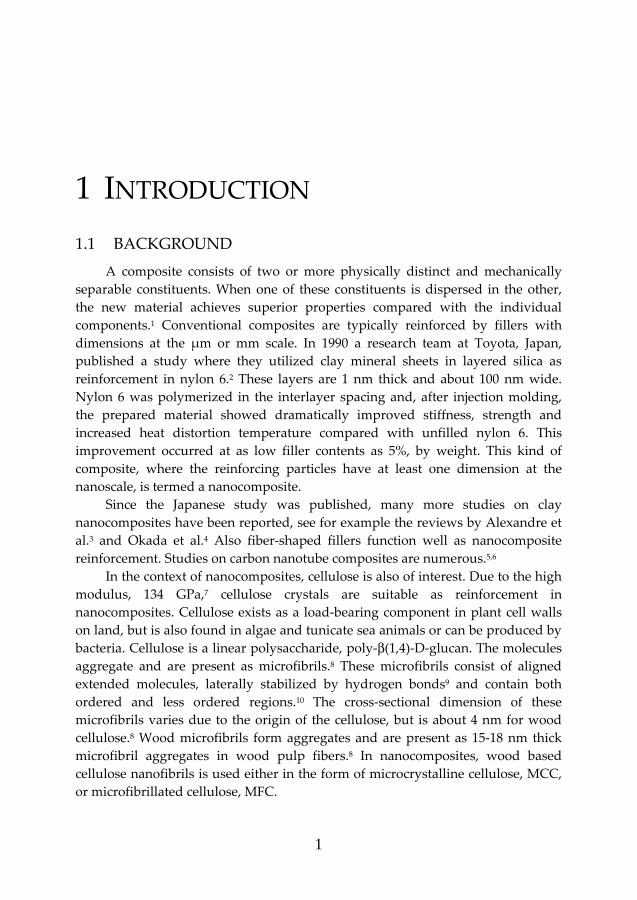
In the context of nanocomposites, cellulose is also of interest. Due to the high modulus, 134 GPa,7 cellulose crystals are suitable as reinforcement in nanocomposites. Cellulose exists as a load-bearing component in plant cell walls on land, but is also found in algae and tunicate sea animals or can be produced by bacteria. Cellulose is a linear polysaccharide, poly-β(1,4)-D-glucan. The molecules aggregate and are present as microfibrils.8 These microfibrils consist of aligned extended molecules, laterally stabilized by hydrogen bonds9 and contain both ordered and less ordered regions.10 The cross-sectional dimension of these microfibrils varies due to the origin of the cellulose, but is about 4 nm for wood cellulose.8 Wood microfibrils form aggregates and are present as 15-18 nm thick microfibril aggregates in wood pulp fibers.8 In nanocomposites, wood based cellulose nanofibrils is used either in the form of microcrystalline cellulose, MCC, or microfibrillated cellulose, MFC.
2
Strong interactions are formed between adjacent nanofibrils due to the surface hydroxyl groups. This in combination with the high stiffness results in a rigid network that improves the stiffness and strength of polymer based nanocomposites. In addition to improved mechanical properties, the advantages with cellulose nanofibrils as reinforcement in composites are increased thermal stability,11,12 decreased thermal expansion,13 and increased thermal conductivity.14 At the same time, if a transparent matrix is used, it is possible to maintain most of the transparency due to the fine scale of the fibrils, even at fiber contents as high as 70%.13,15
1.2 OBJECTIVE The main objective of this thesis is to prepare cellulose nanofibril networks
and composites and study the structure-property relationships. Neat films are prepared from microfibrillated cellulose, MFC, nanofibrils and the mechanical behavior of the network during tensile testing is of particular interest.
The first aim was to develop a method that facilitates preparation of MFC nanofibrils. Wood pulp is microfibrillated by high shearing forces in a homogenizer. A combination of enzymatic degradation and beating is evaluated as a pretreatment method.
The potential of how cellulose nanofibrils can be utilized in high performance nanocomposites is also studied. The reinforcing effect of nanofibrils in a rubbery matrix is studied, particular at high strains, and possible reinforcing mechanisms are discussed. The effects on mechanical properties by addition of a thermoset matrix are also investigated. Finally, a matrix system based on a hyperbranched polymer is used for impregnation of cellulose nanofibril networks. The matrix is crosslinked after impregnation and the matrix characteristics after curing and the mechanical properties are of interest.
1.3 PREPARATION OF CELLULOSE NANOFIBRILS Cellulose nanofibrils can be disintegrated from plant cell walls by chemical
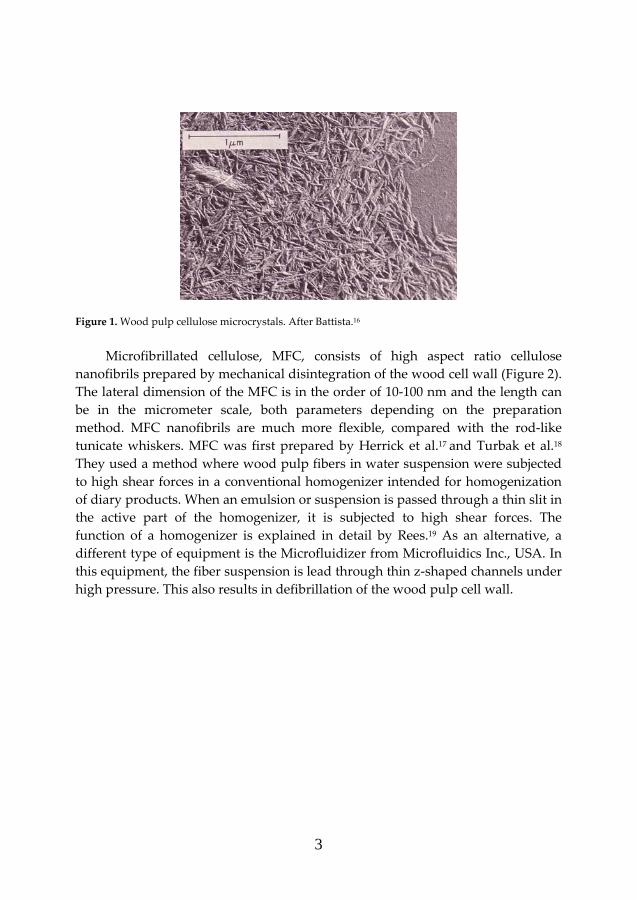
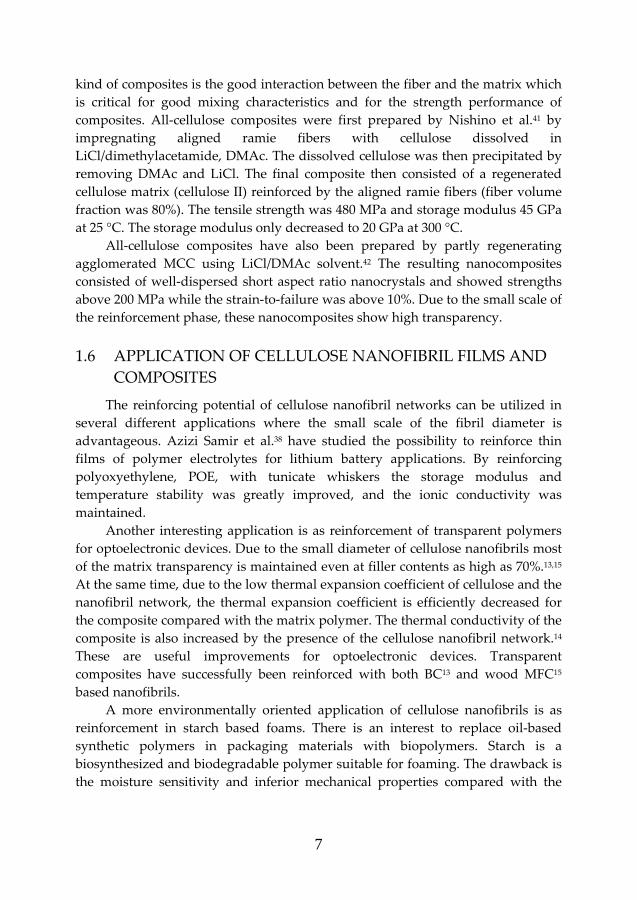
or mechanical treatments. Microcrystalline cellulose, MCC, is prepared by removing the amorphous regions by acid degradation leaving the less accessible crystalline regions as fine crystals of typically 200-400 nm in length and an aspect ratio of about 10. Degree of polymerisation, DP, depends on the cellulose source and treatment procedure and is about 140-400.16 Upon drying the crystals tend to aggregate. MCC is commercially available as a powder with a high level of purity. It is used industrially as a pharmaceutical tablet binder and rheology modifier. A SEM image of MCC is presented in Figure 1.
3
Figure 1. Wood pulp cellulose microcrystals. After Battista.16
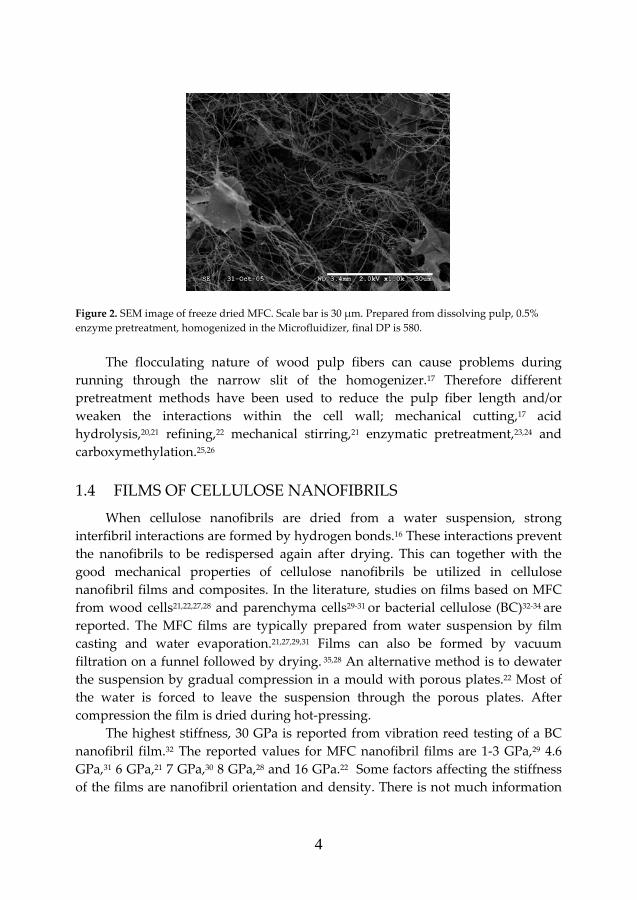
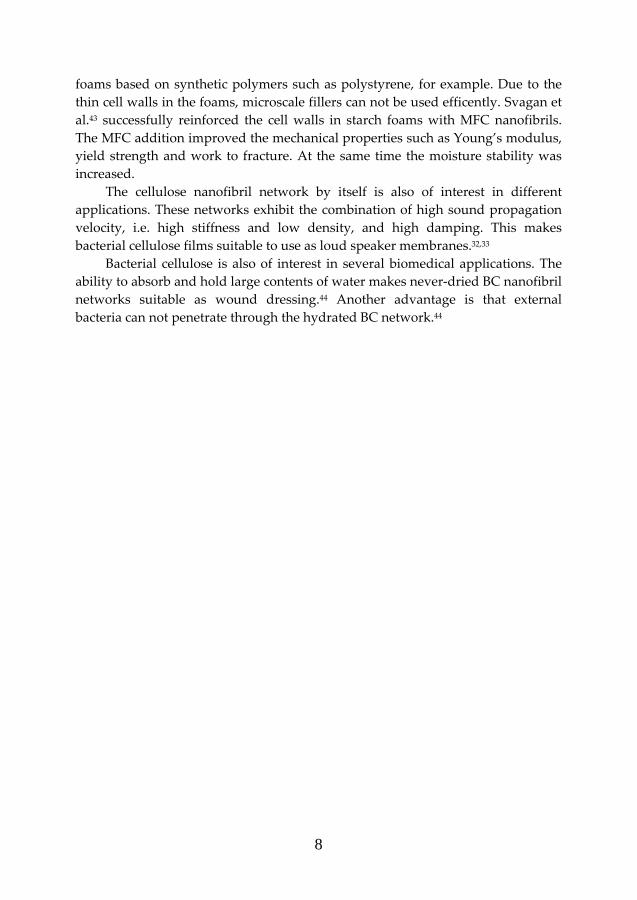
Microfibrillated cellulose, MFC, consists of high aspect ratio cellulose
nanofibrils prepared by mechanical disintegration of the wood cell wall (Figure 2). The lateral dimension of the MFC is in the order of 10-100 nm and the length can be in the micrometer scale, both parameters depending on the preparation method. MFC nanofibrils are much more flexible, compared with the rod-like tunicate whiskers. MFC was first prepared by Herrick et al.17 and Turbak et al.18 They used a method where wood pulp fibers in water suspension were subjected to high shear forces in a conventional homogenizer intended for homogenization of diary products. When an emulsion or suspension is passed through a thin slit in the active part of the homogenizer, it is subjected to high shear forces. The function of a homogenizer is explained in detail by Rees.19 As an alternative, a different type of equipment is the Microfluidizer from Microfluidics Inc., USA. In this equipment, the fiber suspension is lead through thin z-shaped channels under high pressure. This also results in defibrillation of the wood pulp cell wall.
4
Figure 2. SEM image of freeze dried MFC. Scale bar is 30 µm. Prepared from dissolving pulp, 0.5% enzyme pretreatment, homogenized in the Microfluidizer, final DP is 580.
The flocculating nature of wood pulp fibers can cause problems during
running through the narrow slit of the homogenizer.17 Therefore different pretreatment methods have been used to reduce the pulp fiber length and/or weaken the interactions within the cell wall; mechanical cutting,17 acid hydrolysis,20,21 refining,22 mechanical stirring,21 enzymatic pretreatment,23,24 and carboxymethylation.25,26
1.4 FILMS OF CELLULOSE NANOFIBRILS When cellulose nanofibrils are dried from a water suspension, strong
interfibril interactions are formed by hydrogen bonds.16 These interactions prevent the nanofibrils to be redispersed again after drying. This can together with the good mechanical properties of cellulose nanofibrils be utilized in cellulose nanofibril films and composites. In the literature, studies on films based on MFC from wood cells21,22,27,28 and parenchyma cells29-31 or bacterial cellulose (BC)32-34 are reported. The MFC films are typically prepared from water suspension by film casting and water evaporation.21,27,29,31 Films can also be formed by vacuum filtration on a funnel followed by drying. 35,28 An alternative method is to dewater the suspension by gradual compression in a mould with porous plates.22 Most of the water is forced to leave the suspension through the porous plates. After compression the film is dried during hot-pressing.
The highest stiffness, 30 GPa is reported from vibration reed testing of a BC nanofibril film.32 The reported values for MFC nanofibril films are 1-3 GPa,29 4.6 GPa,31 6 GPa,21 7 GPa,30 8 GPa,28 and 16 GPa.22 Some factors affecting the stiffness of the films are nanofibril orientation and density. There is not much information
5
regarding the film structure in the literature, but it seems as if the films showing the lowest stiffness are prepared by solvent casting21,29-30 while the stiffest films are dried during by hot-pressing.22 The hot-pressing resulted in a film of very high density, 1480 kg/m3.
In general, with a few exceptions, the structural information in the literature is poor for these materials. Proper structural information is necessary for improved understanding of structure-mechanical property relationships. Parameters that are, for example, likely to affect the properties are fibril orientation, density, degree of fibrillation, degree of crystallinity, molecular weight, hemicellulose content and solvents used during film forming.
1.5 CELLULOSE NANOCOMPOSITES Cellulose nanofibrils from different sources and in different forms have been
used in nanocomposites in combination with several different polymer matrices. Here a short summary is given of a few cellulose nanofibril-polymer systems reported in the literature.
In composites, wood based nanofibrils have been used in the form of microfibrillated cellulose, MFC.15,20,21,35 Short aspect ratio cellulose nanofibrils, in the form of microcrystalline cellulose, MCC, have been prepared from cotton36 and flax.37 Parenchyma cell wall nanofibrils,29-31,38 which is similar to MFC and degraded parenchyma cell wall nanofibrils,38 have also been studied. A group at CERMAV-CNRS, in Grenoble, France, has used tunicate cellulose in extensive studies. Due to its geometrical shape, in the form of rigid rods, tunicate whiskers are more well-defined and more suitable as a model reinforcement phase in studies of reinforcing effect than infinitely long and flexible fibrils. The whiskers have lengths from 100 nm to several µm, and widths in the order of 10-20 nm.11,12 Sheets of bacterial cellulose have also been used in high performance composites.13,34
As mentioned previously, cellulose nanofibrils form interfibril bonds and rigid networks. There are two major routes to prepare cellulose reinforced nanocomposites where this cellulose network can be utilized. Composites can be prepared from a water suspension of cellulose nanofibrils and a water soluble polymer or water based latex. Favier et al. 11-12 have shown that the addition of as little as 6% tunicate whiskers is sufficient to form a network that will significantly increase and stabilize the storage modulus for the composite at temperatures well above the glass transition temperature. If the network formation is prevented, the modulus will still be improved with increased cellulose whisker content. However, due to the absence of the network a significant decrease in modulus will be observed with increasing temperatures.39
6
The second route for nanocomposite preparation is to first prepare a film of either microfibrillated cellulose, MFC, or bacterial cellulose, BC. In a second step this film can be impregnated with a monomer, followed by curing. By using this method it is possible to prepare composites with fiber contents above 90% , by weight.34,35
Nakagaito et al.35 have prepared composites following this second route. They impregnated MFC nanofibril films with phenol formaldehyde, PF, followed by thermal curing. The reported stiffness is 19 GPa for the composites with 14% PF. The strength was as high as 370 MPa. The mechanical properties were determined by three-point bending with a short beam length. This probably resulted in an overestimation of the stiffness and strength. This is supported by the results in a more recent study by the same researchers where the mechanical properties are evaluated by tensile tests.40 The reported stiffness was about 14 GPa and the strength was 200 MPa for PF contents of 5%-20%, by weight. The 5% PF composite showed 8% strain-to-failure.
Bacterial cellulose films impregnated with PF have also been studied.34 This composite showed stiffness as high as 28 GPa in three-point bending (compared with 19 GPa for MFC based composite). This is believed to be due to larger extent of in-plane orientation as well as the “straight and continuous alignment” of the BC cellulose nanofibrils.34
PF reinforced with sugar beet nanofibrils have been studied by Leitner et al.31 The nanocomposite with 10% PF had a modulus of 9.5 GPa and tensile strength of 127 MPa. The reported strain-to-failure was 2.9%. This composite was prepared by mixing of cellulose nanofibrils and PF followed by solvent casting and slow drying. The composite was cured by hot-pressing. This preparation method probably resulted in a more out-of-plane fiber orientation, which explains the somewhat lower modulus.
The PF/MFC nanocomposites are fairly brittle. By subjecting the MFC nanofibrils to strong alkali treatment (20% NaOH) the strain-to-failure and work to fracture was increased for the PF impregnated MFC composites.40 The increase in ductility is ascribed to the increase in strain-to-failure for the MFC nanofibril network (increased from 4-5% to 10-13%). This treatment partly converted the native cellulose I to cellulose II. It was also believed that the entropy increased in the less ordered regions along the microfibrils. When subjecting the network to tensile loads the molecular chains in the amorphous regions are stretched, resulting in increased ductility of the nanofibrils and hence the network. The possibility that the modification of the nanofibril interface is affecting the increased ductility is also discussed.
“All-cellulose composites” is a new interesting group of composites were both the reinforcing fiber and the matrix is cellulose based. The advantage of this
7
kind of composites is the good interaction between the fiber and the matrix which is critical for good mixing characteristics and for the strength performance of composites. All-cellulose composites were first prepared by Nishino et al.41 by impregnating aligned ramie fibers with cellulose dissolved in LiCl/dimethylacetamide, DMAc. The dissolved cellulose was then precipitated by removing DMAc and LiCl. The final composite then consisted of a regenerated cellulose matrix (cellulose II) reinforced by the aligned ramie fibers (fiber volume fraction was 80%). The tensile strength was 480 MPa and storage modulus 45 GPa at 25 °C. The storage modulus only decreased to 20 GPa at 300 °C.
All-cellulose composites have also been prepared by partly regenerating agglomerated MCC using LiCl/DMAc solvent.42 The resulting nanocomposites consisted of well-dispersed short aspect ratio nanocrystals and showed strengths above 200 MPa while the strain-to-failure was above 10%. Due to the small scale of the reinforcement phase, these nanocomposites show high transparency.
1.6 APPLICATION OF CELLULOSE NANOFIBRIL FILMS AND COMPOSITES
The reinforcing potential of cellulose nanofibril networks can be utilized in several different applications where the small scale of the fibril diameter is advantageous. Azizi Samir et al.38 have studied the possibility to reinforce thin films of polymer electrolytes for lithium battery applications. By reinforcing polyoxyethylene, POE, with tunicate whiskers the storage modulus and temperature stability was greatly improved, and the ionic conductivity was maintained.
Another interesting application is as reinforcement of transparent polymers for optoelectronic devices. Due to the small diameter of cellulose nanofibrils most of the matrix transparency is maintained even at filler contents as high as 70%.13,15 At the same time, due to the low thermal expansion coefficient of cellulose and the nanofibril network, the thermal expansion coefficient is efficiently decreased for the composite compared with the matrix polymer. The thermal conductivity of the composite is also increased by the presence of the cellulose nanofibril network.14 These are useful improvements for optoelectronic devices. Transparent composites have successfully been reinforced with both BC13 and wood MFC15 based nanofibrils.
A more environmentally oriented application of cellulose nanofibrils is as reinforcement in starch based foams. There is an interest to replace oil-based synthetic polymers in packaging materials with biopolymers. Starch is a biosynthesized and biodegradable polymer suitable for foaming. The drawback is the moisture sensitivity and inferior mechanical properties compared with the
8
foams based on synthetic polymers such as polystyrene, for example. Due to the thin cell walls in the foams, microscale fillers can not be used efficently. Svagan et al.43 successfully reinforced the cell walls in starch foams with MFC nanofibrils. The MFC addition improved the mechanical properties such as Young’s modulus, yield strength and work to fracture. At the same time the moisture stability was increased.
The cellulose nanofibril network by itself is also of interest in different applications. These networks exhibit the combination of high sound propagation velocity, i.e. high stiffness and low density, and high damping. This makes bacterial cellulose films suitable to use as loud speaker membranes.32,33
Bacterial cellulose is also of interest in several biomedical applications. The ability to absorb and hold large contents of water makes never-dried BC nanofibril networks suitable as wound dressing.44 Another advantage is that external bacteria can not penetrate through the hydrated BC network.44
9
2 EXPERIMENTAL A brief description of the experimental part is given here. For details, please
see the appended papers. All fiber contents discussed are based on weight, if nothing else is written.
2.1 PREPARATION OF MFC (PAPER II-V) The MFC was prepared from softwood dissolving pulp (paper II-V) or
special paper pulp (paper II) kindly provided by Domsjö Fabriker AB, Sweden. Carbohydrate analysis showed that the dissolving pulp contained 93% cellulose and the sulphite pulp 85% cellulose. The pulp was subjected to a pretreatment step followed by disintegration into MFC by a homogenization process. In the pretreatment step the pulp is subjected to a combination of enzymatic degradation and beating in a laboratory beater. The enzyme used is an endoglucanase, Novozym 476, manufactured by Novozymes A/S, Denmark, which preferably degrades cellulose in the disordered regions. Different concentrations of enzymes used in the pretreatment step result in different degrees of polymerization for the resulting MFC. The enzyme concentrations used are reported in Table 2 in the results and discussion section. This pretreatment method is referred to as enzymatic pretreatment.
Alternative pretreatment methods were also used on the dissolving pulp (paper II). In order to evaluate the effect of enzymatic degradation on the microfibrillation of the pulp, a no-enzyme reference was prepared. In this case the pulp was pretreated in the same way as above, but the enzymes were excluded. In a second reference method, the enzymatic degradation was replaced by a mild hydrolysis with HCl, pH 1, at 50 °C for 1 h. This method is referred to as mild hydrolysis. Finally, a strong hydrolysis was performed on the dissolving pulp. The pulp was first swollen in 3% NaOH at 50 °C for 10 minutes; thereafter the hydrolysis was performed with 2.5 M HCl at 90 °C for 2 h. This pretreatment method did not include any beating.
After pretreatment the pulp fibers were disintegrated by passing a 2% water suspension 20 times through a Laboratory homogenizer 15M, Gaulin Corp., MA, USA (paper II, III) or 12 times through a Microfluidizer M-110EH, Microfluidics Inc., USA (paper IV, V).
10
I addition, two kinds of MFC, were kindly provided by STFI-Packforsk AB, Sweden. The MFC nanofibrils referred to as DP-800 (used in paper IV,V) is prepared with a similar method as above, but the pulp used was bleached sulphite softwood (Domsjö ECO Bright). This pulp has a higher hemicellulose content than the dissolving pulp. Details on the preparation method are reported by Pääkkö et al.24 The MFC nanofibrils referred to as DP-1100 (paper IV) is prepared from the same softwood dissolving pulp as above. The pulp is carboxymethylated in a pretreatment step and then run once through the Microfluidizer.26
MFC can not be dried without significant changes in the morphology. Dried MFC is not possible to disperse in water again. Therefore the starting form of MFC for materials preparation in the present study is in the form of a water suspension.
2.2 PREPARATION OF MFC FILMS (PAPER III-V) Films of MFC were prepared by vacuum filtration of a diluted MFC
suspension on a funnel. In paper III 2 g MFC (dry weight) was diluted to 0.5% and stirred for 45 minutes. The suspension was then filtrated on a Büchner funnel (18.5 cm in diameter) using Munktell filter paper, grade OOH, Munktell Filter AB, Sweden. After filtration, the wet films were stacked between filter papers and everything was placed between two metal plates and dried at 80 °C for 24 h. This resulted in MFC films with thickness of about 70 µm.
In paper IV and V, 0.2% MFC was stirred for 48 hours prior to filtration on a glass filter funnel. In paper IV, two different funnels were used. 1.2 g MFC (dry weight) was filtrated on a glass filter funnel (11.5 cm diameter) using Munktell filter paper, grade OOH, Munktell Filter AB, Sweden. 0.4 g MFC (dry weight) were filtrated on a glass filter funnel (7.2 cm in diameter) using filter membrane 0.65 µm DVPP, Millipore, USA. The smaller glass filter funnel was also used for making MFC films in paper V. The films were dried as above but at 55 °C for 48 h. This resulted in MFC films with thicknesses of about 60-80 µm.
Porous films (paper IV) are prepared by solvent exchange in the filtered film before drying. After filtration, the wet film was immersed in methanol, ethanol or acetone for 2 h. Then the solvent was replaced by fresh solvent and the film was left for another 24 h. Then the films were dried in the same way as described above. This resulted in films of various porosities and thicknesses in the range of 70-90 µm.
All films are dried from water if nothing else is written.
11
2.3 PREPARATION OF NANOCOMPOSITES
2.3.1 Polyurethane reinforced with MCC (Paper I) The pure polyurethane, PU, is synthesized from 9 g 4,4´-diphenyl-methane
diisocyanate, MDI, and 18 g polytetramethylene glycol, PTMEG, at a molar ratio of 2:1 dissolved in dimethylformamide, DMF and then heated to 90 °C with stirring to form a pre-polymer. 1.62 1,4-butanediol, 1,4-BG, is added to the pre-polymer with stirring at room temperature for 3 h to complete the reaction. The PU films were formed by casting the solution in a mold, and then removing the solvent at 80 °C. Slow solvent evaporation is essential for the production of void-free films.
The conventional composite of polyurethane/cellulose is prepared as follows. Cellulose pulp fiber (5%, 1-2 mm in length), MDI (9 g), and PTMEG (18 g) were mixed with DMF, and then stirred and heated to 90 °C to form a pre-polymer. 1.563 g of 1,4-BG is added to the pre-polymer with stirring at room temperature for 3 h.
The preparation of polyurethane/cellulose nanocomposite is as follows; Different amounts of MCC and trace amounts (<0.3%) of LiCl were mixed with DMF, keeping stirring at 80 °C for 6 h, then MDI (9 g) and PTMEG (18 g) at 2:1 molar ratio were added. A prepolymer was obtained after stirring at 90 °C for 3 h. Then 1,600 g, 1.544 g, 1.541 g, 1.541 g of 1,4-BG was added into the pre-polymer systems with 1, 3, 5, 10% cellulose, respectively. After stirring at room temperature for 3 h and removal of solvent at 80 °C, elastic films were obtained.
2.3.2 MFC and melamine formaldehyde composites (Paper III) Cellulose and melamine formaldehyde, MF, composites were prepared by
vacuum impregnation of MFC films. A commercial melamine formaldehyde resin was used, Madurit SMW 818 75% WA, provided by Surface Specialties Nordic A/S, Denmark. Dried MFC films were immersed in MF at 2, 4, and 6% MF concentration. After immersion, the films were dried at 50 °C and then hot-pressed at 160 °C for 10 min. The MF was polymerized at the elevated temperature, resulting in a stiff semitransparent film with 5, 9, and 13% MF, respectively.
2.3.3 MFC and a matrix based on a hyperbranched polymer (Paper V)
Boltorn H30 (9.75 g) was added to a round-bottomed flask and preheated in an oven at 140 °C until it melted. The preheating was performed in order to break
12
the hydrogen bonds in the material, and thereby enabling the material to be dissolved. An appropriate amount of methanol (135 mL, 85 mL and 50 mL for the 10 w/v%, 15 w/v%, and 30 w/v% matrix solution, respectively) was added and the flask was put in an oil bath at 60 °C, and the mixture was kept under stirring. When the polymer was completely dissolved, HMMM (2.25 g) and TONE polyol 0301 (3 g) were added and dissolved.
By using different concentrations of matrix solution it was possible to prepare composites of different nanofibril content. The composites were prepared by impregnating un-dried cellulose films containing methanol in a matrix solution. The un-dried films were immersed in the matrix solution and kept in a vacuum desiccator for 24 h. The films were removed from the matrix solution, dried between metal plates at 55 °C for 24 h in order to remove the methanol. Finally the films were hot-pressed at 140 °C and 5 PHI for 20 minutes, during this step the matrix was cured. The nanofibril content was calculated from the final weight of the composite. The amount of nanofibril was estimated to 0.4 g. The concentrations of the matrix solution used was 30 w/v%, 15 w/v %, and 10 w/v % and resulted in composites with 33 wt%, 51 wt%, and 63 wt% cellulose nanofibrils, respectively (weight percent). This fibril content corresponds to a fibril volume fraction, Vf, of 0.26, 0.43, and 0.55, respectively. The final composite have a diameter of 70 mm and the thickness varies between 80 µm and 230 µm. The nanofibril amount used was constant, 0.4 g, and the variations in the final composite thickness will be due to the final nanofibril/matrix composition.
2.4 VISCOSITY AND DEGREE OF POLYMERIZATION (PAPER II-V)
The average molecular weight of polymers can be estimated from an average intrinsic viscosity value. The measurements were performed on cellulosic fibers dissolved in 0.5 M cupriethylendiamine, CED, according to SCAN-CM 15:99.45 This standard method was slightly modified for pretreated pulp fibers and microfibrillated cellulose. Since it is difficult or impossible to redisperse the dried fibers, they were weighed in the wet state. The water already present in the sample was taken into account when diluting the solvent to 0.5 M. Two samples were made for each set of fibers.
The intrinsic viscosity, [η] (ml/g), is related to the average degree of polymerization, DP, by the Staudinger-Mark-Houwink equation: [η]=K*DPa, where the constants K and a are dependent on the polymer-solvent system used and the DP for the cellulose. For cellulose dissolved in CED these constants are determined as K=0.42 and a=1 for DP<950 and K=2.28 and a=0.76 for DP>950.46
13
This procedure has been applied in the result and discussion part below. In paper II all DP data are calculated with the second set of constants.
The presence of any hemicelluloses is not considered when calculating DP.
2.5 SIZE EXCLUSION CHROMATOGRAPHY (PAPER II, IV) Molecular weight distribution can be estimated by size exclusion
chromatography, SEC. The solvent system used was dimethylacetamide (DMAc)/LiCl. Pullulan was used for calibration and a refractive index detector was used. Water was removed from the MFC suspensions by solvent exchange with methanol and DMAc before being dissolved in DMAc/LiCl containing ethylisocyanate. Sample preparation and measurements were carried out by MoRe Research AB, Sweden.
2.6 DENSITY AND POROSITY (PAPER III-V) The density was determined for dry MFC films. The volume of the sample
was either measured manually with a caliper and thickness meter (paper III) or by displacement in mercury (paper IV, V). The porosity for each sample is calculated from the density by assuming a density of 1500 kg/m3 for cellulose.
2.7 X-RAY DIFFRACTION AND ORIENTATION (PAPER IV) X-ray diffraction photographs were taken by an imaging plate (IP) having a
camera length of 38.3 mm. The Cu Kα radiation, generated with a Rigaku RINT-2000 at 40 kV, 20 mA, was irradiated on the specimen perpendicular or parallel to the film surface.
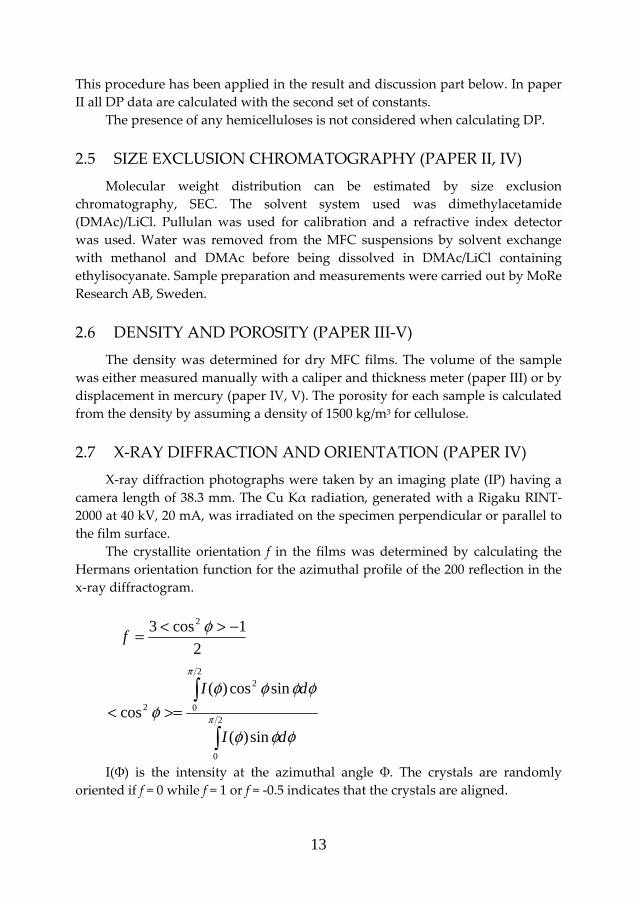
The crystallite orientation f in the films was determined by calculating the Hermans orientation function for the azimuthal profile of the 200 reflection in the x-ray diffractogram.
21cos3 2 −><= φf
φφφ
φφφφφ π
π
dI
dI
sin)(
sincos)(cos 2
0
22
02
∫
∫>=<
I(Φ) is the intensity at the azimuthal angle Φ. The crystals are randomly
oriented if f = 0 while f = 1 or f = -0.5 indicates that the crystals are aligned.
14
2.8 ATOMIC FORCE MICROSCOPY (PAPER II) In paper II an atomic force microscope, AFM, Nanoscope IIIa from Vecco
Inc., USA, was used in the tapping mode in order to make images of MFC. The MFC was mounted on a silica plate coated with poly-DADMAC.
2.9 SCANNING ELECTRON MICROSCOPY (PAPER II-V) Scanning electron microscopy, SEM, images was used to study freeze dried
MFC and MFC film surfaces and cross-sections. A Hitatchi s-4300 field-emission electron microscope operating at 2 kV was used to obtain the images in paper II, IV and V. A Jeol JSM-820 Scanning Microscope operating at 5 kV was used for obtaining the images in paper III. The samples were mounted on a substrate with carbon tape and coated with a thin layer of gold (paper II-V) or carbon (paper III).
2.10 TENSILE TESTING (PAPER I, III-V) In paper I the tensile tests were carried out with on an Instron 4411. The
samples were cut to 100×10×1 mm3 in size, and the crosshead speed was set at 100 mm/min. For each data point, five samples were tested, and the average value was taken.
In paper III the tensile tests were performed with a servohydraulic MTS 448 material test system. Specimens of 60 mm length and about 70 µm thickness and 6 mm width were tested with 10% min-1 strain rate. The relative humidity was kept at 50% and the temperature at 23 °C. The specimens were conditioned for at least 48 hours in this environment prior to testing. The films containing MF were brittle and it was difficult to cut the specimens without introducing flaws at the edges. The results for each material are base on at least 11 specimens.
In paper IV and V the tensile tests of the films were performed with a Universal Materials Testing Machine from Instron, USA, equipped with a 500 N load cell. Specimens of 40 mm (paper IV) or 20 mm (paper V) length and about 60-80 µm thickness and 5 mm width were tested with 10% min-1 strain rate. The relative humidity was kept at 50% and the temperature at 23°C. The specimens were conditioned for at least 48 hours in this environment prior to testing. The displacement was measured by Digital Speckle Photography (DSP). A pattern was prepared for the DSP by applying printer toner to the sample surface. During tensile test images of the whole specimen was taken. The frame rate was set to 5 fps. The results for each material are based on at least 6 specimens, if nothing else is mentioned.
The modulus was determined in the small strain region. Engineering stress,σeng, was calculated from σeng=F/A0, where F was applied load and A0 initial
15
cross-sectional area. Engineering strain, εeng, was calculated from εeng=ΔL/L0, where ΔL was the extension of the sample and L0 was initial sample length. True stress, σtrue, was calculated from σtrue=F/A, where A=A0(L0/L). True strain, εtrue, was calculated as εtrue=ln(L/L0). True stress and strain were calculated assuming no change in sample volume during the test.47 If nothing else is mentioned, engineering stress and strain is reported. Toughness is defined as work to fracture and is calculated as the area under the stress-strain curve.48 The Yield strength, σ0.2, was determined at the intersection of a 0.2% offset line and the stress strain curve.47
2.11 ACOUSTIC EMISSION (PAPER IV) Acoustic Emission (AE) monitoring was used at Mittuniversitet while
loading slender specimens in tension to study evolution of the micro-fracture processes. A MTS servo-hydraulic testing machine was employed which has been modified to reduce its mechanical noise to better fit AE testing. The geometry of the specimens was 50 mm (gauge length) and 8 mm (width) and the tests were performed at a displacement rate of 0.5 mm/min. The AE sensor is a small, lightweight, piezoelectric resonance frequency sensor produced by the Acoustic Emission Technology company (AET) and modified by Vallen Systeme GmbH, Germany. The sensor is 3 mm in diameter and encapsulated in a shelter having a diameter of 6 mm.49 It was positioned in the center point of each specimen and kept in place by a small magnet. Since the resonance frequency of the sensor is around 300 kHz it is unlikely that noise from the testing machine influences AE measurements during the experiments. The AE signals were recorded by using a system manufactured by Vallen Systeme GmbH, Germany. The relative humidity was kept at 50% and the temperature was 23 °C.
2.12 DYNAMIC MECHANICAL ANALYSIS (PAPER I, III, V) In paper I dynamic mechanical analysis, DMA, was performed on a DMTA
Mark II spectrometer in tension mode. The specimen was a thin rectangular strip with dimensions of 10×5×1 mm3. Measurements were performed in isochronal conditions at 1 Hz, and the heating rate was 2 °C/min.
In paper III dynamic mechanic thermal analysis, DMTA, measurements were performed on a Perkin-Elmer DMA 7e in tensile mode. Sample specimens were 6 mm long, 4 mm wide and 70 µm thick.
In paper V the properties of the films were measured with TA Instruments Q800 in tensile mode. The distance between the grips were 10 mm and the test was carried out at 2 °C min-1 heating rate. The specimens, 5 mm wide and with a
16
thickness varying between 50 µm and 200 µm, were dried in a vacuum oven at 50 °C prior to the analysis.
2.13 SORPTION-DESORPTION (PAPER III) The water sorption isotherms were measured gravimetrically using a
Dynamic Vapor Sorption apparatus, from Surface Measurement Systems, for MFC films and composites in paper III.
17
3 RESULTS AND DISCUSSION 3.1 CELLULOSE REINFORCED POLYURETHANE
NANOCOMPOSITE (PAPER I) Nanocomposites based on microcrystalline cellulose, MCC, and
thermoplastic polyurethane, PU, were prepared by in-situ polymerization and solvent casting (paper I). The objective of this study was to evaluate the reinforcing effect of dispersed MCC nanofibrils in an elastomeric matrix. An additional objective was to try to understand the reinforcing mechanisms.
3.1.1 Composite preparation Dry MCC consists of highly aggregated cellulose nanofibrils. The average
particle size for the MCC used in this study was 50 µm, reported by the supplier. The cellulose nanofibrils were dispersed in the nanocomposite by weakening the hydrogen bonds using the solvent system dimethylformamide, DMF, and LiCl. LiCl in combination with DMF50 or dimethylacetamide, DMAc,51,52 acts as a solvent for cellulose. Since the idea of this work is to utilize the high stiffness of the crystalline cellulose, efforts was made not to dissolve the cellulose by using only a small amount of LiCl (<0.3%).
3.1.2 Nanocomposite structure Good dispersion of the cellulose nanofibrils within the PU matrix were
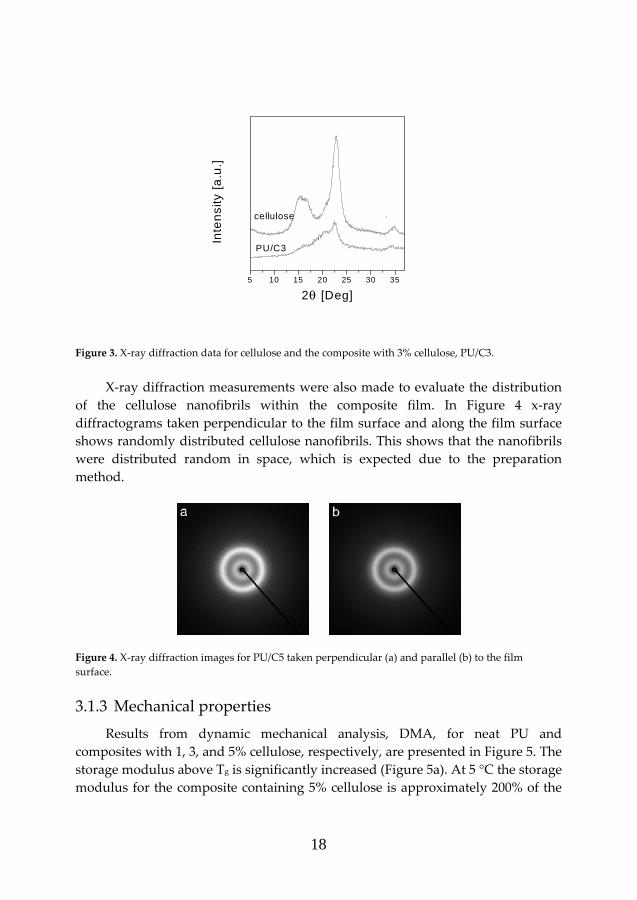
confirmed by transmission electron microscopy, TEM. The preservation of the native cellulose crystal structure was also confirmed by x-ray diffraction (Figure 3). The pure MCC sample shows a peak at 22.7° which is characteristic for cellulose I.53 This peak is still present in the composite with 3% cellulose, PU/C3, despite the low cellulose content. This proves that complete dissolution of cellulose was avoided. Instead, the nanofibril surfaces and disordered regions are probably swollen without any influence on the interior of the crystalline region.
18
Figure 3. X-ray diffraction data for cellulose and the composite with 3% cellulose, PU/C3.
X-ray diffraction measurements were also made to evaluate the distribution
of the cellulose nanofibrils within the composite film. In Figure 4 x-ray diffractograms taken perpendicular to the film surface and along the film surface shows randomly distributed cellulose nanofibrils. This shows that the nanofibrils were distributed random in space, which is expected due to the preparation method.
Figure 4. X-ray diffraction images for PU/C5 taken perpendicular (a) and parallel (b) to the film surface.
3.1.3 Mechanical properties Results from dynamic mechanical analysis, DMA, for neat PU and
composites with 1, 3, and 5% cellulose, respectively, are presented in Figure 5. The storage modulus above Tg is significantly increased (Figure 5a). At 5 °C the storage modulus for the composite containing 5% cellulose is approximately 200% of the
5 10 15 20 25 30 35
040
002
101
PU/C3
cellulose
Inte
nsity
[a.u
.]
2θ [Deg]
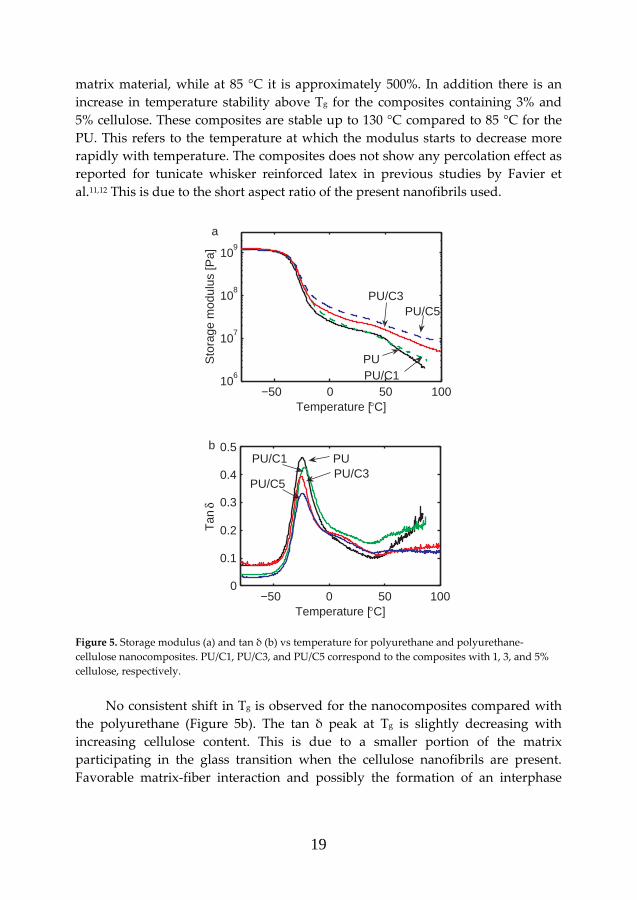
19
matrix material, while at 85 °C it is approximately 500%. In addition there is an increase in temperature stability above Tg for the composites containing 3% and 5% cellulose. These composites are stable up to 130 °C compared to 85 °C for the PU. This refers to the temperature at which the modulus starts to decrease more rapidly with temperature. The composites does not show any percolation effect as reported for tunicate whisker reinforced latex in previous studies by Favier et al.11,12 This is due to the short aspect ratio of the present nanofibrils used.
−50 0 50 10010
6
107
108
109
Temperature [°C]
Sto
rage
mod
ulus
[Pa]
PUPU/C1
PU/C3PU/C5
a
−50 0 50 100
0
0.1
0.2
0.3
0.4
0.5
Temperature [°C]
Tan
δ
PUPU/C1PU/C3
PU/C5
b
Figure 5. Storage modulus (a) and tan δ (b) vs temperature for polyurethane and polyurethane-cellulose nanocomposites. PU/C1, PU/C3, and PU/C5 correspond to the composites with 1, 3, and 5% cellulose, respectively.
No consistent shift in Tg is observed for the nanocomposites compared with
the polyurethane (Figure 5b). The tan δ peak at Tg is slightly decreasing with increasing cellulose content. This is due to a smaller portion of the matrix participating in the glass transition when the cellulose nanofibrils are present. Favorable matrix-fiber interaction and possibly the formation of an interphase
20
matrix layer, either immobilized or of reduced molecular mobility, might be the reason for this.54
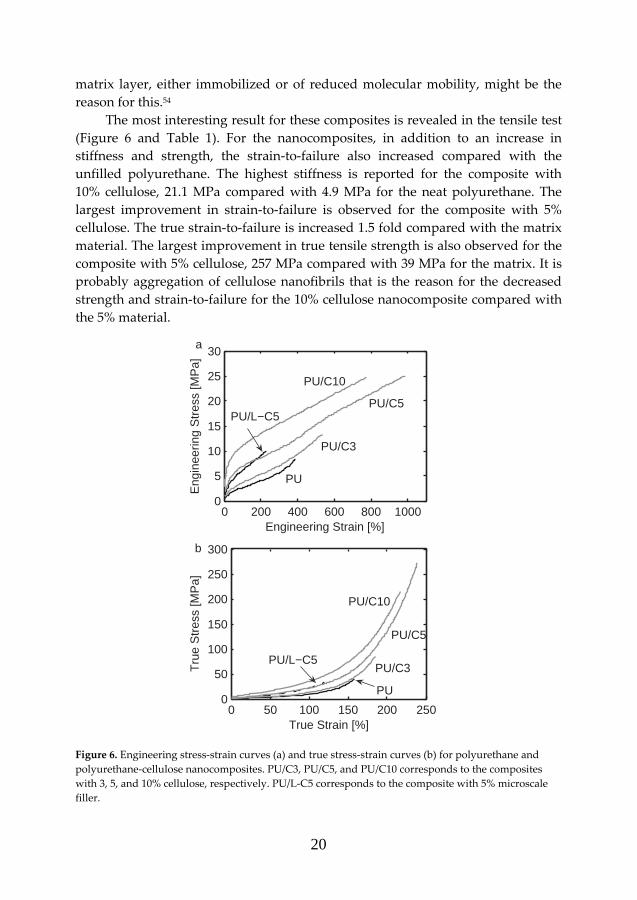
The most interesting result for these composites is revealed in the tensile test (Figure 6 and Table 1). For the nanocomposites, in addition to an increase in stiffness and strength, the strain-to-failure also increased compared with the unfilled polyurethane. The highest stiffness is reported for the composite with 10% cellulose, 21.1 MPa compared with 4.9 MPa for the neat polyurethane. The largest improvement in strain-to-failure is observed for the composite with 5% cellulose. The true strain-to-failure is increased 1.5 fold compared with the matrix material. The largest improvement in true tensile strength is also observed for the composite with 5% cellulose, 257 MPa compared with 39 MPa for the matrix. It is probably aggregation of cellulose nanofibrils that is the reason for the decreased strength and strain-to-failure for the 10% cellulose nanocomposite compared with the 5% material.
0 200 400 600 800 10000
5
10
15
20
25
30
Engineering Strain [%]
Eng
inee
ring
Str
ess
[MP
a]
PU
PU/L−C5
PU/C3
PU/C5
PU/C10
a
0 50 100 150 200 2500
50
100
150
200
250
300
True Strain [%]
Tru
e S
tres
s [M
Pa]
PU
PU/L−C5PU/C3
PU/C5
PU/C10
b
Figure 6. Engineering stress-strain curves (a) and true stress-strain curves (b) for polyurethane and polyurethane-cellulose nanocomposites. PU/C3, PU/C5, and PU/C10 corresponds to the composites with 3, 5, and 10% cellulose, respectively. PU/L-C5 corresponds to the composite with 5% microscale filler.
21
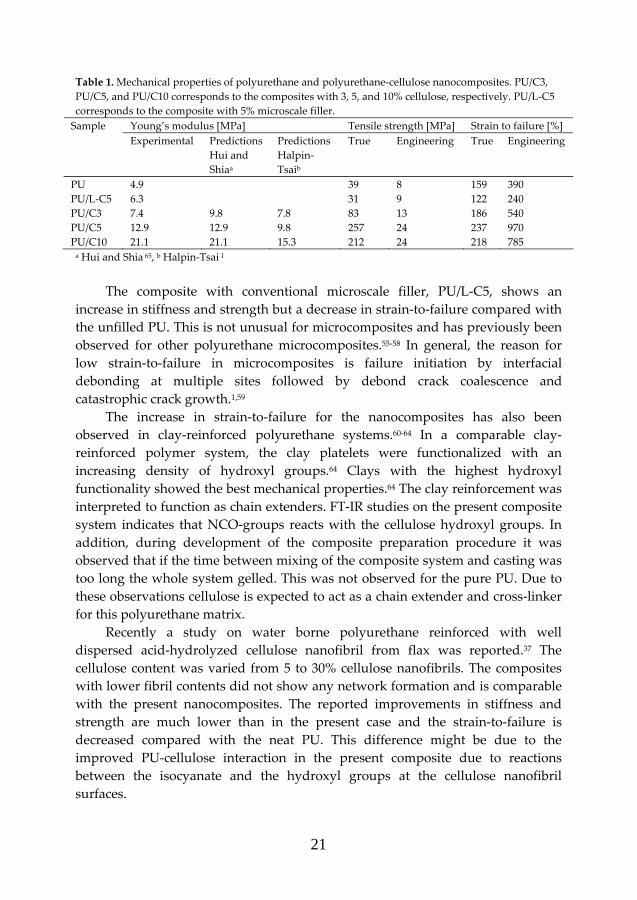
Table 1. Mechanical properties of polyurethane and polyurethane-cellulose nanocomposites. PU/C3, PU/C5, and PU/C10 corresponds to the composites with 3, 5, and 10% cellulose, respectively. PU/L-C5 corresponds to the composite with 5% microscale filler.
Young’s modulus [MPa] Tensile strength [MPa] Strain to failure [%] Sample Experimental Predictions
Hui and Shiaa
Predictions Halpin-Tsaib
True Engineering True Engineering
PU 4.9 39 8 159 390 PU/L-C5 6.3 31 9 122 240 PU/C3 7.4 9.8 7.8 83 13 186 540 PU/C5 12.9 12.9 9.8 257 24 237 970 PU/C10 21.1 21.1 15.3 212 24 218 785
a Hui and Shia 65, b Halpin-Tsai 1 The composite with conventional microscale filler, PU/L-C5, shows an
increase in stiffness and strength but a decrease in strain-to-failure compared with the unfilled PU. This is not unusual for microcomposites and has previously been observed for other polyurethane microcomposites.55-58 In general, the reason for low strain-to-failure in microcomposites is failure initiation by interfacial debonding at multiple sites followed by debond crack coalescence and catastrophic crack growth.1,59
The increase in strain-to-failure for the nanocomposites has also been observed in clay-reinforced polyurethane systems.60-64 In a comparable clay-reinforced polymer system, the clay platelets were functionalized with an increasing density of hydroxyl groups.64 Clays with the highest hydroxyl functionality showed the best mechanical properties.64 The clay reinforcement was interpreted to function as chain extenders. FT-IR studies on the present composite system indicates that NCO-groups reacts with the cellulose hydroxyl groups. In addition, during development of the composite preparation procedure it was observed that if the time between mixing of the composite system and casting was too long the whole system gelled. This was not observed for the pure PU. Due to these observations cellulose is expected to act as a chain extender and cross-linker for this polyurethane matrix.
Recently a study on water borne polyurethane reinforced with well dispersed acid-hydrolyzed cellulose nanofibril from flax was reported.37 The cellulose content was varied from 5 to 30% cellulose nanofibrils. The composites with lower fibril contents did not show any network formation and is comparable with the present nanocomposites. The reported improvements in stiffness and strength are much lower than in the present case and the strain-to-failure is decreased compared with the neat PU. This difference might be due to the improved PU-cellulose interaction in the present composite due to reactions between the isocyanate and the hydroxyl groups at the cellulose nanofibril surfaces.
22
The slope of the true stress-strain curve (Figure 6b) increases at high strains. This stiffening effect is due to reorientation of the polyurethane network and cellulose nanofibrils in the loading direction.
Modulus prediction based on Halpin-Tsai1 or Hui and Shia65 with an assumption of random-in-plane fiber orientation are also presented in Table 1. The modulus was assumed to be 100 GPa along the nanofibril and 4 GPa transverse. The Halpin-Tsai prediction is significantly lower due to that the large modulus difference between matrix and filler is not properly taken into account, as discussed by Hui and Shia. The Hui and Shia predictions give a reasonable good fit at an assumed aspect ratio of 22.5. As proven by x-ray diffraction, the cellulose nanofibril orientation is random-in-space which should result in lower predicted values. According to Sternstein and Zhou66 the improvements in stiffness of nanocomposite rubbers can not be explained only by the contribution from the presence of stiff fillers. In addition, the behavior of the polyurethane network is probably affected by the interaction with the cellulose nanofibrils. Sternstein and Zhou point out the limitation with micromechanics models for the prediction of increased modulus with filler content. They argue that the reinforcing effect is also due to chains bonding to the filler surfaces. Interaction between the polymer and the filler surface decreases the effective average molar mass between chain entanglements by trapped entanglements. The stiffness is then enhanced due to entropy effects. In the present polyurethane-cellulose nanofibril system the polyurethane molecules may interact with the cellulose nanofibril surface by both covalent bonding and secondary interactions such as hydrogen bonding.
3.2 PREPARATION OF MICROFIBRILLATED CELLULOSE (PAPER II)
Cellulose nanofibrils of higher aspect ratio than the MCC used in the previous section was prepared by disintegration of wood pulp fibers using a homogenizer. In this section a pretreatment method using enzymatic degradation is evaluated. The objective was to evaluate if enzymes could facilitate the homogenization process when preparing MFC of high quality. The MFC was intended to be used in high-performance cellulose films and nanocomposites.
3.2.1 Physical appearance of pretreated pulp Special paper pulp and dissolving pulp were pretreated by two different
methods in order to facilitate homogenization. Both pulps were treated with enzymes (a commercial endoglucanase) at different concentrations (for details please see Table 2 and the experimental section). They were also pretreated with a no-enzyme reference method. In this case the enzyme was excluded but otherwise
23
the pulps were treated in the same way as the enzymatic pretreated pulp. Finally the dissolving pulp was also pretreated with either mild or strong acid hydrolysis.
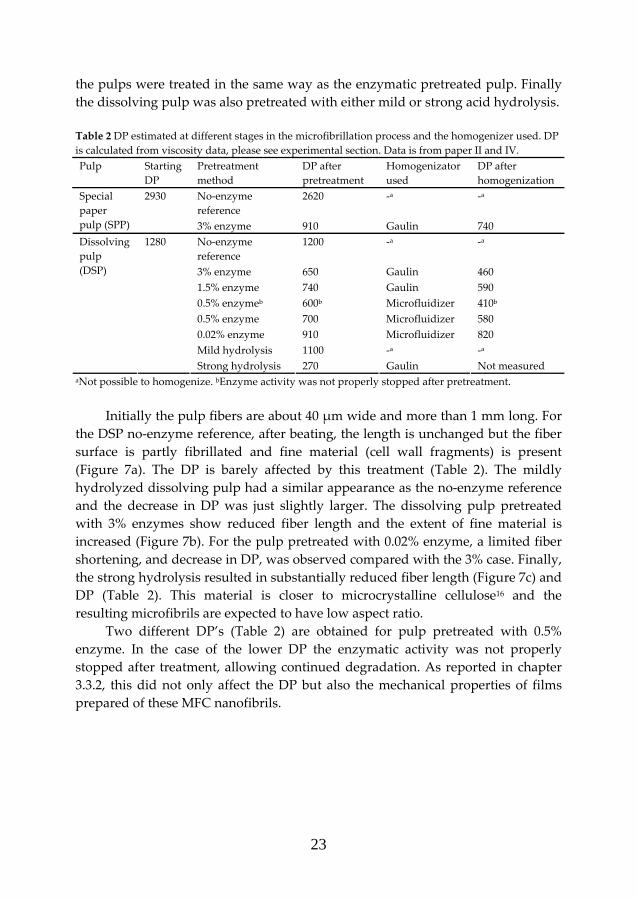
Table 2 DP estimated at different stages in the microfibrillation process and the homogenizer used. DP is calculated from viscosity data, please see experimental section. Data is from paper II and IV. Pulp Starting
DP Pretreatment method
DP after pretreatment
Homogenizator used
DP after homogenization
No-enzyme reference
2620 -a -a Special paper pulp (SPP)
2930
3% enzyme 910 Gaulin 740 No-enzyme reference
1200 -a -a
3% enzyme 650 Gaulin 460 1.5% enzyme 740 Gaulin 590 0.5% enzymeb 600b Microfluidizer 410b
0.5% enzyme 700 Microfluidizer 580 0.02% enzyme 910 Microfluidizer 820 Mild hydrolysis 1100 -a -a
Dissolving pulp (DSP)
1280
Strong hydrolysis 270 Gaulin Not measured aNot possible to homogenize. bEnzyme activity was not properly stopped after pretreatment.
Initially the pulp fibers are about 40 µm wide and more than 1 mm long. For
the DSP no-enzyme reference, after beating, the length is unchanged but the fiber surface is partly fibrillated and fine material (cell wall fragments) is present (Figure 7a). The DP is barely affected by this treatment (Table 2). The mildly hydrolyzed dissolving pulp had a similar appearance as the no-enzyme reference and the decrease in DP was just slightly larger. The dissolving pulp pretreated with 3% enzymes show reduced fiber length and the extent of fine material is increased (Figure 7b). For the pulp pretreated with 0.02% enzyme, a limited fiber shortening, and decrease in DP, was observed compared with the 3% case. Finally, the strong hydrolysis resulted in substantially reduced fiber length (Figure 7c) and DP (Table 2). This material is closer to microcrystalline cellulose16 and the resulting microfibrils are expected to have low aspect ratio.
Two different DP’s (Table 2) are obtained for pulp pretreated with 0.5% enzyme. In the case of the lower DP the enzymatic activity was not properly stopped after treatment, allowing continued degradation. As reported in chapter 3.3.2, this did not only affect the DP but also the mechanical properties of films prepared of these MFC nanofibrils.
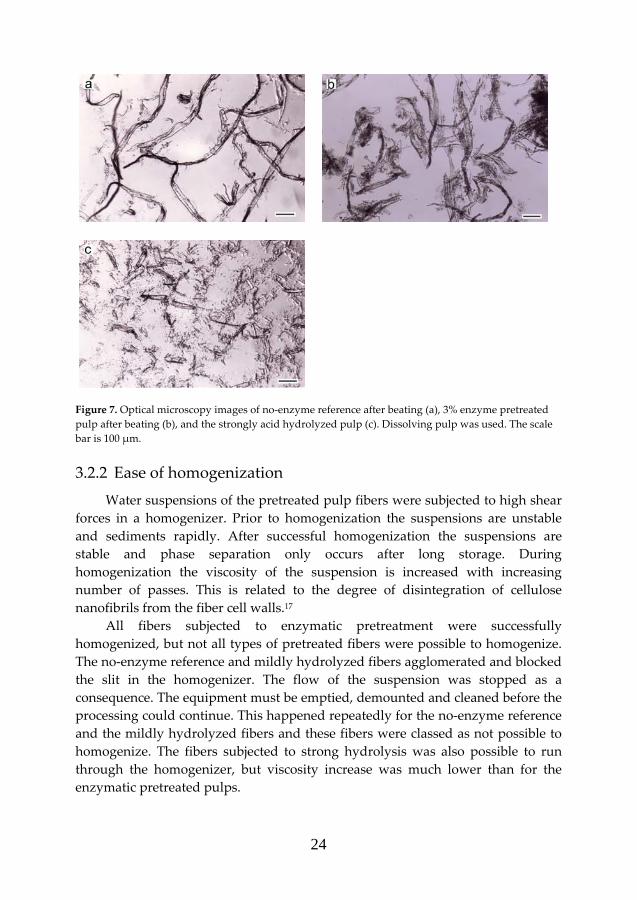
24
Figure 7. Optical microscopy images of no-enzyme reference after beating (a), 3% enzyme pretreated pulp after beating (b), and the strongly acid hydrolyzed pulp (c). Dissolving pulp was used. The scale bar is 100 µm.
3.2.2 Ease of homogenization Water suspensions of the pretreated pulp fibers were subjected to high shear
forces in a homogenizer. Prior to homogenization the suspensions are unstable and sediments rapidly. After successful homogenization the suspensions are stable and phase separation only occurs after long storage. During homogenization the viscosity of the suspension is increased with increasing number of passes. This is related to the degree of disintegration of cellulose nanofibrils from the fiber cell walls.17
All fibers subjected to enzymatic pretreatment were successfully homogenized, but not all types of pretreated fibers were possible to homogenize. The no-enzyme reference and mildly hydrolyzed fibers agglomerated and blocked the slit in the homogenizer. The flow of the suspension was stopped as a consequence. The equipment must be emptied, demounted and cleaned before the processing could continue. This happened repeatedly for the no-enzyme reference and the mildly hydrolyzed fibers and these fibers were classed as not possible to homogenize. The fibers subjected to strong hydrolysis was also possible to run through the homogenizer, but viscosity increase was much lower than for the enzymatic pretreated pulps.
25
The tendency of fiber agglomeration is reduced with reduced fiber length but it also seems that the presence of fine material stabilizes the suspension, and hence decreases the sedimentation and agglomeration in the inlet reservoir. This is in line with previous observations. Herrick et al.17 showed that pre-cut pulp fibers were easier to disintegrate due to less interference with the homogenizer. In addition, it was also believed to increase the degree of fibrillation by exposing increased fiber cross-section area. Herrick et al. also observed that an addition of already microfibrillated cellulose nanofibril to uncut pulp fibers increased the stability of the pulp suspension facilitating homogenization.
In this study there was no observed difference in ease of homogenization observed between the special paper pulp (85% cellulose) and dissolving pulp (93% cellulose).
3.2.3 After homogenization For the pulps that were possible to homogenize, an additional decrease in DP
was observed after homogenization (Table 2). During homogenization, the fiber cell wall is not only disintegrated but also some mechanical cutting of the cellulose nanofibrils seem to occur. The decrease in the present study was 10-29% (32% reduction for the 0.5% enzyme, low DP case) compared with the measured DP after pretreatment. The lowest degradation value is reported for the 0.02% enzyme pretreated MFC nanofibrils. Herrick et al.17 observed up to 27% reduction in DP due to homogenization. DP was decreased with increasing number of passes through the homogenizer. The cellulose crystals are also probably affected by the mechanical forces during homogenization. Iwamoto et al.28 measured a decrease in degree of crystallinity for increasing number of passes through a grinding type of homogenization equipment when preparing MFC nanofibrils.
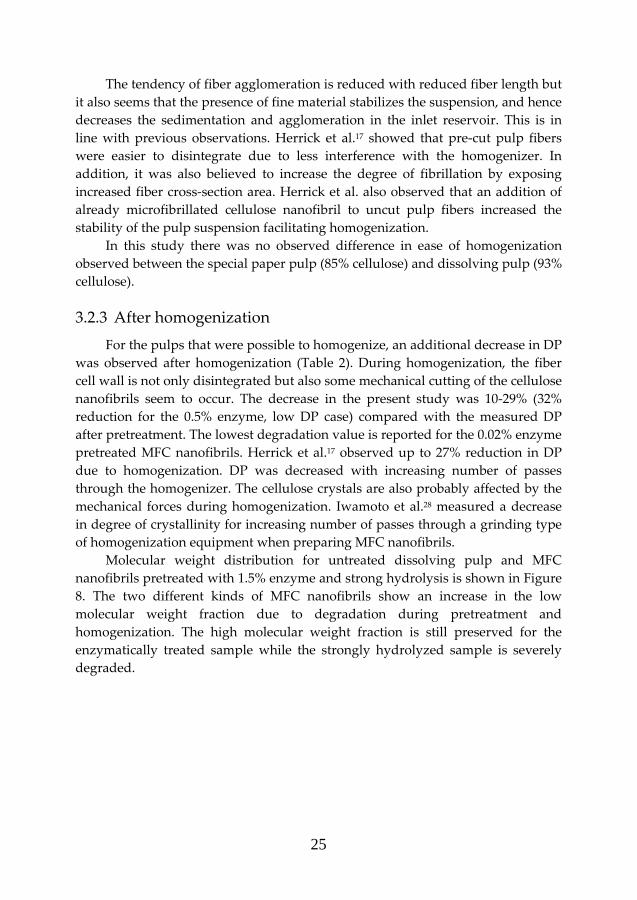
Molecular weight distribution for untreated dissolving pulp and MFC nanofibrils pretreated with 1.5% enzyme and strong hydrolysis is shown in Figure 8. The two different kinds of MFC nanofibrils show an increase in the low molecular weight fraction due to degradation during pretreatment and homogenization. The high molecular weight fraction is still preserved for the enzymatically treated sample while the strongly hydrolyzed sample is severely degraded.
26
3 4 5 6 70
0.2
0.4
0.6
0.8
Log Mol Wt
dwt/d
(logM
)
Figure 8. Molecular weight distribution for MFC nanofibrils based on dissolving pulp. Dissolving pulp as delivered (solid line), pretreated with 1.5% enzyme (dashes line), and strongly acid hydrolyzed (circles). The weight average molecular weights are 285700, 280000, and 63600, respectively.
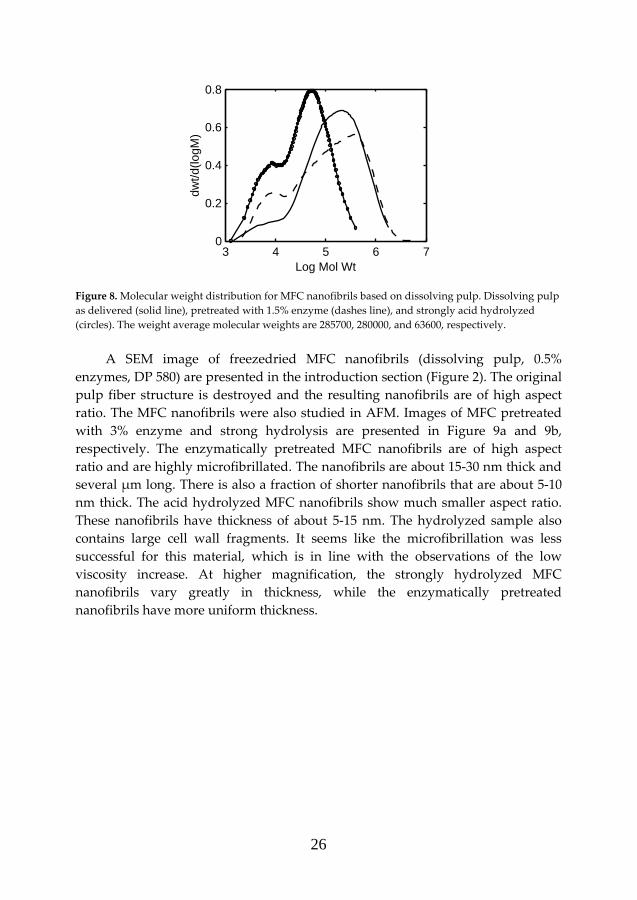
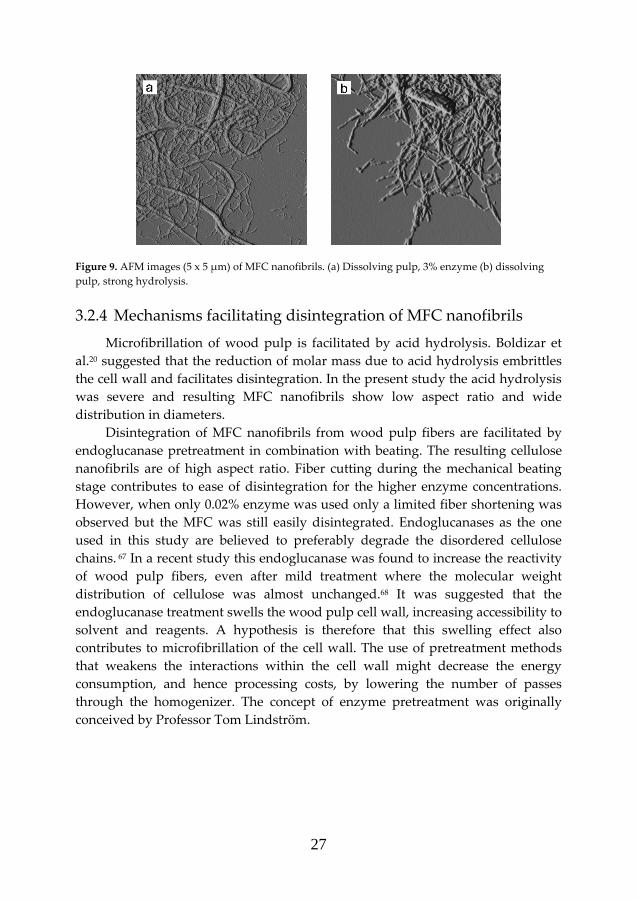
A SEM image of freezedried MFC nanofibrils (dissolving pulp, 0.5%
enzymes, DP 580) are presented in the introduction section (Figure 2). The original pulp fiber structure is destroyed and the resulting nanofibrils are of high aspect ratio. The MFC nanofibrils were also studied in AFM. Images of MFC pretreated with 3% enzyme and strong hydrolysis are presented in Figure 9a and 9b, respectively. The enzymatically pretreated MFC nanofibrils are of high aspect ratio and are highly microfibrillated. The nanofibrils are about 15-30 nm thick and several µm long. There is also a fraction of shorter nanofibrils that are about 5-10 nm thick. The acid hydrolyzed MFC nanofibrils show much smaller aspect ratio. These nanofibrils have thickness of about 5-15 nm. The hydrolyzed sample also contains large cell wall fragments. It seems like the microfibrillation was less successful for this material, which is in line with the observations of the low viscosity increase. At higher magnification, the strongly hydrolyzed MFC nanofibrils vary greatly in thickness, while the enzymatically pretreated nanofibrils have more uniform thickness.
27
Figure 9. AFM images (5 x 5 µm) of MFC nanofibrils. (a) Dissolving pulp, 3% enzyme (b) dissolving pulp, strong hydrolysis.
3.2.4 Mechanisms facilitating disintegration of MFC nanofibrils Microfibrillation of wood pulp is facilitated by acid hydrolysis. Boldizar et
al.20 suggested that the reduction of molar mass due to acid hydrolysis embrittles the cell wall and facilitates disintegration. In the present study the acid hydrolysis was severe and resulting MFC nanofibrils show low aspect ratio and wide distribution in diameters.
Disintegration of MFC nanofibrils from wood pulp fibers are facilitated by endoglucanase pretreatment in combination with beating. The resulting cellulose nanofibrils are of high aspect ratio. Fiber cutting during the mechanical beating stage contributes to ease of disintegration for the higher enzyme concentrations. However, when only 0.02% enzyme was used only a limited fiber shortening was observed but the MFC was still easily disintegrated. Endoglucanases as the one used in this study are believed to preferably degrade the disordered cellulose chains. 67 In a recent study this endoglucanase was found to increase the reactivity of wood pulp fibers, even after mild treatment where the molecular weight distribution of cellulose was almost unchanged.68 It was suggested that the endoglucanase treatment swells the wood pulp cell wall, increasing accessibility to solvent and reagents. A hypothesis is therefore that this swelling effect also contributes to microfibrillation of the cell wall. The use of pretreatment methods that weakens the interactions within the cell wall might decrease the energy consumption, and hence processing costs, by lowering the number of passes through the homogenizer. The concept of enzyme pretreatment was originally conceived by Professor Tom Lindström.
28
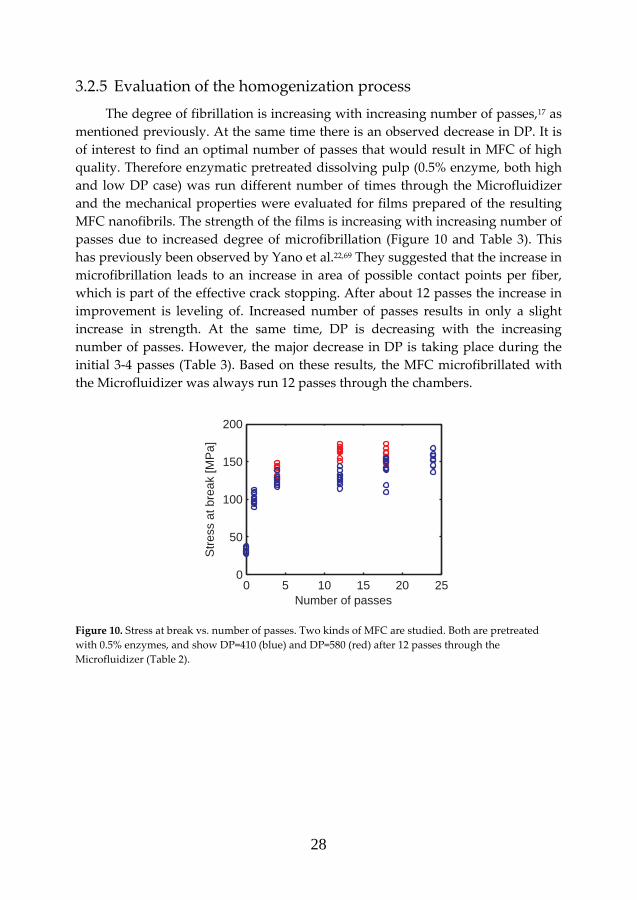
3.2.5 Evaluation of the homogenization process The degree of fibrillation is increasing with increasing number of passes,17 as
mentioned previously. At the same time there is an observed decrease in DP. It is of interest to find an optimal number of passes that would result in MFC of high quality. Therefore enzymatic pretreated dissolving pulp (0.5% enzyme, both high and low DP case) was run different number of times through the Microfluidizer and the mechanical properties were evaluated for films prepared of the resulting MFC nanofibrils. The strength of the films is increasing with increasing number of passes due to increased degree of microfibrillation (Figure 10 and Table 3). This has previously been observed by Yano et al.22,69 They suggested that the increase in microfibrillation leads to an increase in area of possible contact points per fiber, which is part of the effective crack stopping. After about 12 passes the increase in improvement is leveling of. Increased number of passes results in only a slight increase in strength. At the same time, DP is decreasing with the increasing number of passes. However, the major decrease in DP is taking place during the initial 3-4 passes (Table 3). Based on these results, the MFC microfibrillated with the Microfluidizer was always run 12 passes through the chambers.
0 5 10 15 20 250
50
100
150
200
Number of passes
Str
ess
at b
reak
[MP
a]
Figure 10. Stress at break vs. number of passes. Two kinds of MFC are studied. Both are pretreated with 0.5% enzymes, and show DP=410 (blue) and DP=580 (red) after 12 passes through the Microfluidizer (Table 2).
29
Table 3. Two kinds of MFC are studied. Both are pretreated with 0.5% enzymes, and show DP=410 and DP=580 after 12 passes through the Microfluidizer (Table 2). They are presented as low-DP and high-DP, respectively, in this table.
MFC type Number of passes
Modulus [GPa]
Tensile strength [MPa]
Strain-to-failure [%]
Density [kg/m3]
Porosity [%]
DP
0 6.4 32 0.9 940 37 600 1 10.1 100 3.1 1110 26 - 4 12.1 125 3.8 - - 460a 12 13.9 129 3.3 1200 20 410 18 13.9 140 4.2 - - 360
0.5% enzyme, low DP
24 14.6 145 3.9 1070 29 360 0 - - - - - 700 4 9.8 137 6.2 1100 27 610 12 11.0 159 6.4 1140 24 580
0.5% enzyme, high DP
18 11.3 153 6.2 1090 27 560 a Data is for MFC run 3 times through the Microfluidizer.
3.3 FILMS FROM MICROFIBRILLATED CELLULOSE (PAPER III, IV)
When MFC nanofibrils are dried, a porous network with strong fibril-fibril interaction and interesting properties is formed. This network can be utilized in composites but pure cellulose nanofibril films are also of interest. The knowledge of the behavior of MFC films is also useful in understanding cellulose nanocomposites.
Several different kinds of MFC nanofibrils have been used. They will be termed DP-X, where X corresponds to the average DP calculated from measured intrinsic viscosity of the microfibrillated cellulose. Information about DP-410, -580, -820, and -590 are found in Table 2. DP-800 and DP-1100 were kindly provided by STFI-Packforsk and information can be found in the experimental part.
3.3.1 Structure of MFC nanofibril films In this study films are prepared from MFC suspensions by vacuum filtration.
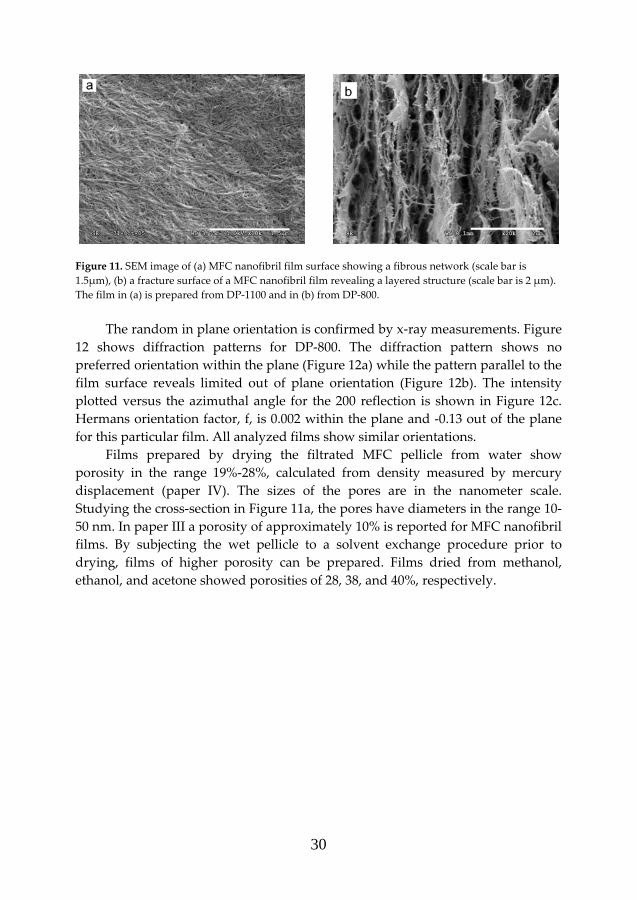
During filtration the nanofibrils are deposited on a filter paper or membrane. After filtration the films are dried and a stiff and strong film is formed. Since the films are prepared from water suspension, strong secondary interfibril interaction is expected. Figure 11 shows SEM images of the surface and cross-section of an MFC film. In Figure 11a the nanofibrils can clearly be seen and the predominant orientation seems to be random-in-plane. The cross-section of the MFC film (Figure 11b) reveals a layered structure. The nanofibrils are apparently deposited flatly in swirled conformation during filtration. In general, typical lateral dimensions of the MFC nanofibrils are in the range of 10-40 nm.
30
Figure 11. SEM image of (a) MFC nanofibril film surface showing a fibrous network (scale bar is 1.5µm), (b) a fracture surface of a MFC nanofibril film revealing a layered structure (scale bar is 2 µm). The film in (a) is prepared from DP-1100 and in (b) from DP-800.
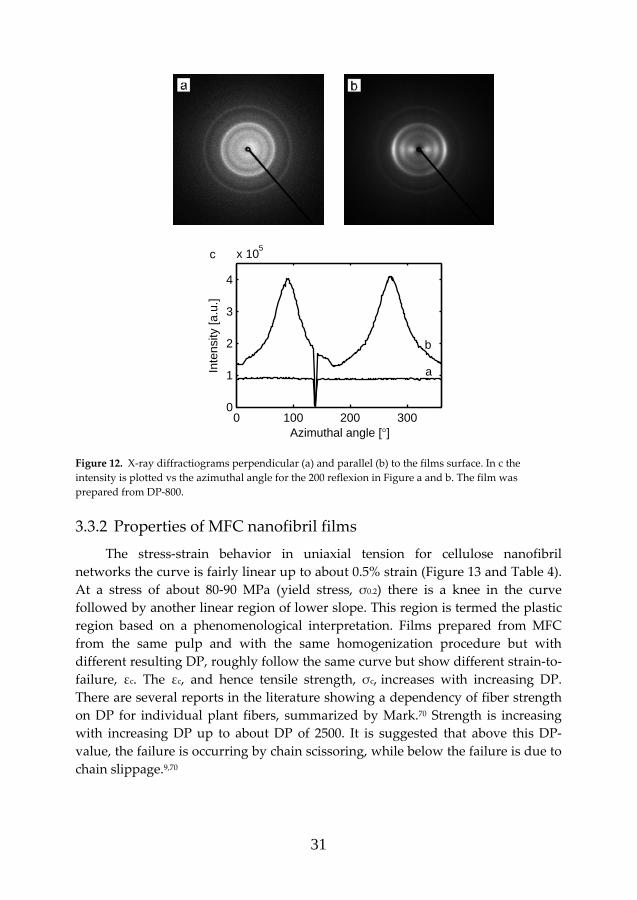
The random in plane orientation is confirmed by x-ray measurements. Figure
12 shows diffraction patterns for DP-800. The diffraction pattern shows no preferred orientation within the plane (Figure 12a) while the pattern parallel to the film surface reveals limited out of plane orientation (Figure 12b). The intensity plotted versus the azimuthal angle for the 200 reflection is shown in Figure 12c. Hermans orientation factor, f, is 0.002 within the plane and -0.13 out of the plane for this particular film. All analyzed films show similar orientations.
Films prepared by drying the filtrated MFC pellicle from water show porosity in the range 19%-28%, calculated from density measured by mercury displacement (paper IV). The sizes of the pores are in the nanometer scale. Studying the cross-section in Figure 11a, the pores have diameters in the range 10-50 nm. In paper III a porosity of approximately 10% is reported for MFC nanofibril films. By subjecting the wet pellicle to a solvent exchange procedure prior to drying, films of higher porosity can be prepared. Films dried from methanol, ethanol, and acetone showed porosities of 28, 38, and 40%, respectively.
31
0 100 200 3000
1
2
3
4
x 105
Azimuthal angle [°]
Inte
nsity
[a.u
.]
a
b
c
Figure 12. X-ray diffractiograms perpendicular (a) and parallel (b) to the films surface. In c the intensity is plotted vs the azimuthal angle for the 200 reflexion in Figure a and b. The film was prepared from DP-800.
3.3.2 Properties of MFC nanofibril films The stress-strain behavior in uniaxial tension for cellulose nanofibril
networks the curve is fairly linear up to about 0.5% strain (Figure 13 and Table 4). At a stress of about 80-90 MPa (yield stress, σ0.2) there is a knee in the curve followed by another linear region of lower slope. This region is termed the plastic region based on a phenomenological interpretation. Films prepared from MFC from the same pulp and with the same homogenization procedure but with different resulting DP, roughly follow the same curve but show different strain-to-failure, εc. The εc, and hence tensile strength, σc, increases with increasing DP. There are several reports in the literature showing a dependency of fiber strength on DP for individual plant fibers, summarized by Mark.70 Strength is increasing with increasing DP up to about DP of 2500. It is suggested that above this DP-value, the failure is occurring by chain scissoring, while below the failure is due to chain slippage.9,70
32
0 2 4 6 8 10 120
50
100
150
200
250
DP−580DP−410
DP−1100
Strain [%]
Str
ess
[MP
a]
DP−820
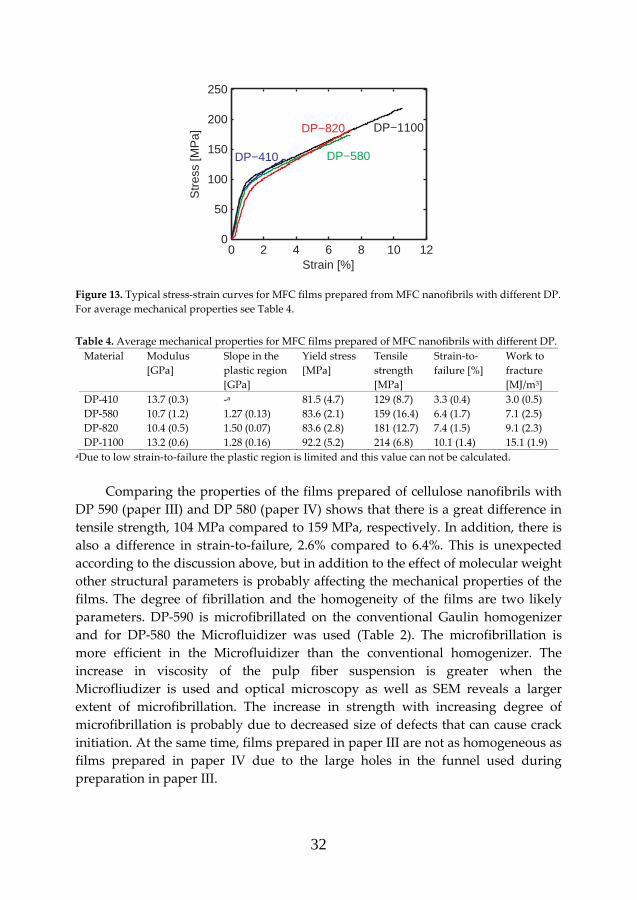
Figure 13. Typical stress-strain curves for MFC films prepared from MFC nanofibrils with different DP. For average mechanical properties see Table 4.
Table 4. Average mechanical properties for MFC films prepared of MFC nanofibrils with different DP.
Material Modulus [GPa]
Slope in the plastic region [GPa]
Yield stress [MPa]
Tensile strength [MPa]
Strain-to-failure [%]
Work to fracture [MJ/m3]
DP-410 13.7 (0.3) -a 81.5 (4.7) 129 (8.7) 3.3 (0.4) 3.0 (0.5) DP-580 10.7 (1.2) 1.27 (0.13) 83.6 (2.1) 159 (16.4) 6.4 (1.7) 7.1 (2.5) DP-820 10.4 (0.5) 1.50 (0.07) 83.6 (2.8) 181 (12.7) 7.4 (1.5) 9.1 (2.3) DP-1100 13.2 (0.6) 1.28 (0.16) 92.2 (5.2) 214 (6.8) 10.1 (1.4) 15.1 (1.9)
aDue to low strain-to-failure the plastic region is limited and this value can not be calculated. Comparing the properties of the films prepared of cellulose nanofibrils with
DP 590 (paper III) and DP 580 (paper IV) shows that there is a great difference in tensile strength, 104 MPa compared to 159 MPa, respectively. In addition, there is also a difference in strain-to-failure, 2.6% compared to 6.4%. This is unexpected according to the discussion above, but in addition to the effect of molecular weight other structural parameters is probably affecting the mechanical properties of the films. The degree of fibrillation and the homogeneity of the films are two likely parameters. DP-590 is microfibrillated on the conventional Gaulin homogenizer and for DP-580 the Microfluidizer was used (Table 2). The microfibrillation is more efficient in the Microfluidizer than the conventional homogenizer. The increase in viscosity of the pulp fiber suspension is greater when the Microfliudizer is used and optical microscopy as well as SEM reveals a larger extent of microfibrillation. The increase in strength with increasing degree of microfibrillation is probably due to decreased size of defects that can cause crack initiation. At the same time, films prepared in paper III are not as homogeneous as films prepared in paper IV due to the large holes in the funnel used during preparation in paper III.
33
The present films show favorable mechanical properties compared with data reported in the literature. The present average modulus is 10-15 GPa (Table 4-6). In the literature the reported modulus are commonly in the range of 1 to 9 GPa.21,28-31 However, Yano et al.22 reported 16 GPa for a MFC nanofibril film with very high density (1480 kg/m3). For this film they also reported a strength as high as 250 MPa, measured by three-point bending. Otherwise the reported tensile strengths are normally about 100 MPa.21,28,30,31 In comparison, the average tensile strengths for the present films are ranging from 104 MPa to 214 MPa (Table 4-6). There is a lack in information regarding strain-to-failure but, to our knowledge, the previous highest reported strain-to-failure for cellulose nanofibril films are 4-6%.40 This value is lower than for the present -820, -1100, and -800. Strain-to-failure is as high as 10% for the DP-1100 film.
Dufresne et al.29 did not report strength and strain data for their sugar beet pulp nanofibril films due to failures initiated by the grips. However, one stress-strain curve is presented in the paper. This curve shows a strain-to-failure as high as 11%. Due to the low modulus (1.3 GPa), the film is probably quite porous.
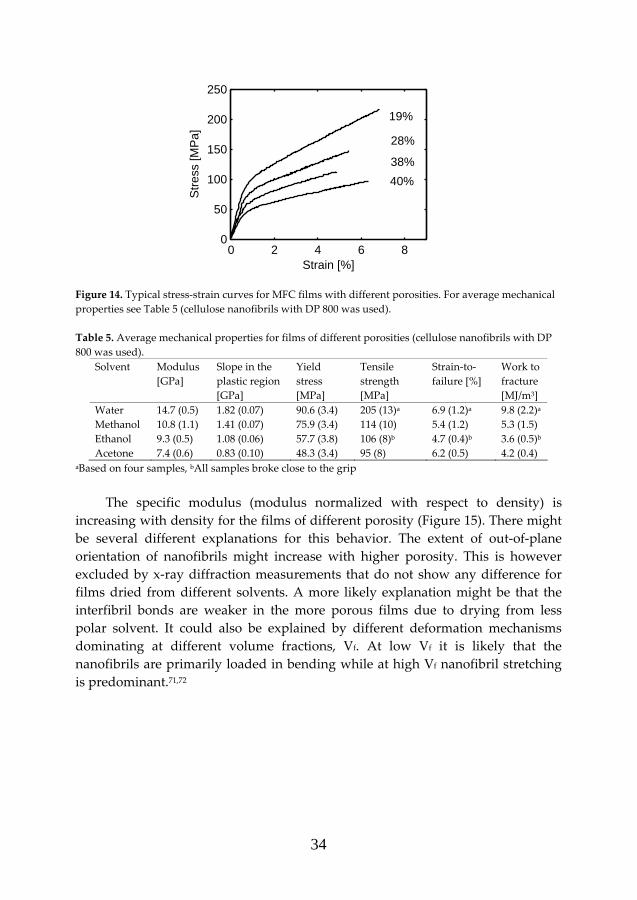
In Figure 14 stress-strains curves are presented for films dried from different solvents and hence with different porosities. The solvents used and average properties are presented in Table 5. As expected, stiffness and strength decreases with increasing porosity but films with as high as 40% porosity still shows remarkable properties. Compared with the film dried from water with 19% porosity the average modulus is reduced from 14.7 GPa to 7.4 GPa and average strength is reduced from 205 MPa to 95 MPa. Meanwhile, the strain-to-failure is fairly insensitive to the degree of porosity. The samples for the 38% porosity film all failed close the grips during tensile testing. This has probably caused premature failure, resulting in reduced strain-to-failure and consequently strength. The slope in the plastic region is also affected by the porosity and decreases with increasing porosity.
34
0 2 4 6 80
50
100
150
200
250
Strain [%]
Str
ess
[MP
a]
19%
40%
38%
28%
Figure 14. Typical stress-strain curves for MFC films with different porosities. For average mechanical properties see Table 5 (cellulose nanofibrils with DP 800 was used). Table 5. Average mechanical properties for films of different porosities (cellulose nanofibrils with DP 800 was used).
Solvent Modulus [GPa]
Slope in the plastic region [GPa]
Yield stress [MPa]
Tensile strength [MPa]
Strain-to-failure [%]
Work to fracture [MJ/m3]
Water 14.7 (0.5) 1.82 (0.07) 90.6 (3.4) 205 (13)a 6.9 (1.2)a 9.8 (2.2)a
Methanol 10.8 (1.1) 1.41 (0.07) 75.9 (3.4) 114 (10) 5.4 (1.2) 5.3 (1.5) Ethanol 9.3 (0.5) 1.08 (0.06) 57.7 (3.8) 106 (8)b 4.7 (0.4)b 3.6 (0.5)b
Acetone 7.4 (0.6) 0.83 (0.10) 48.3 (3.4) 95 (8) 6.2 (0.5) 4.2 (0.4) aBased on four samples, bAll samples broke close to the grip
The specific modulus (modulus normalized with respect to density) is
increasing with density for the films of different porosity (Figure 15). There might be several different explanations for this behavior. The extent of out-of-plane orientation of nanofibrils might increase with higher porosity. This is however excluded by x-ray diffraction measurements that do not show any difference for films dried from different solvents. A more likely explanation might be that the interfibril bonds are weaker in the more porous films due to drying from less polar solvent. It could also be explained by different deformation mechanisms dominating at different volume fractions, Vf. At low Vf it is likely that the nanofibrils are primarily loaded in bending while at high Vf nanofibril stretching is predominant.71,72
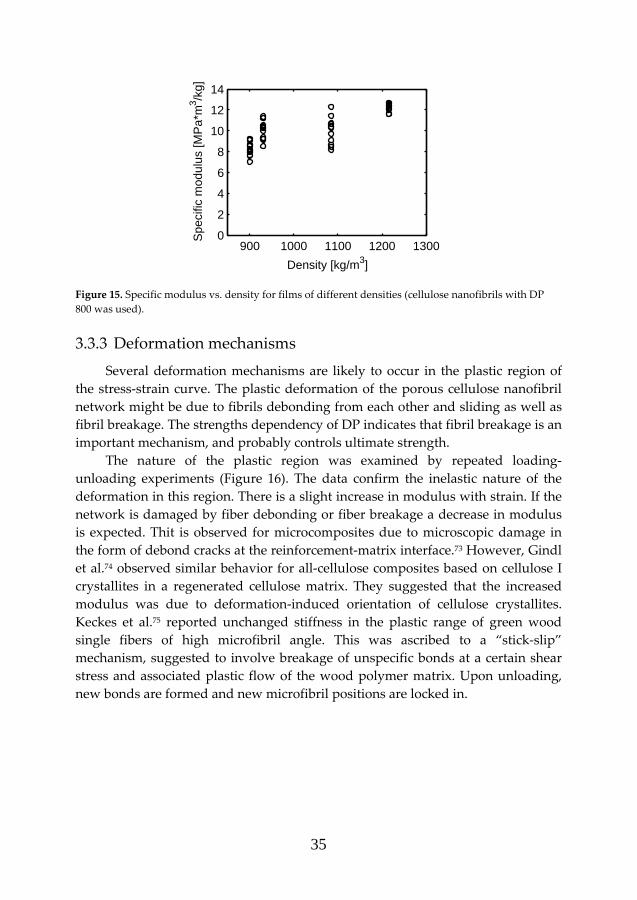
35
900 1000 1100 1200 13000
2
4
6
8
10
12
14
Density [kg/m3]
Spe
cific
mod
ulus
[MP
a*m
3 /kg]
Figure 15. Specific modulus vs. density for films of different densities (cellulose nanofibrils with DP 800 was used).
3.3.3 Deformation mechanisms Several deformation mechanisms are likely to occur in the plastic region of
the stress-strain curve. The plastic deformation of the porous cellulose nanofibril network might be due to fibrils debonding from each other and sliding as well as fibril breakage. The strengths dependency of DP indicates that fibril breakage is an important mechanism, and probably controls ultimate strength.
The nature of the plastic region was examined by repeated loading-unloading experiments (Figure 16). The data confirm the inelastic nature of the deformation in this region. There is a slight increase in modulus with strain. If the network is damaged by fiber debonding or fiber breakage a decrease in modulus is expected. Thit is observed for microcomposites due to microscopic damage in the form of debond cracks at the reinforcement-matrix interface.73 However, Gindl et al.74 observed similar behavior for all-cellulose composites based on cellulose I crystallites in a regenerated cellulose matrix. They suggested that the increased modulus was due to deformation-induced orientation of cellulose crystallites. Keckes et al.75 reported unchanged stiffness in the plastic range of green wood single fibers of high microfibril angle. This was ascribed to a “stick-slip” mechanism, suggested to involve breakage of unspecific bonds at a certain shear stress and associated plastic flow of the wood polymer matrix. Upon unloading, new bonds are formed and new microfibril positions are locked in.
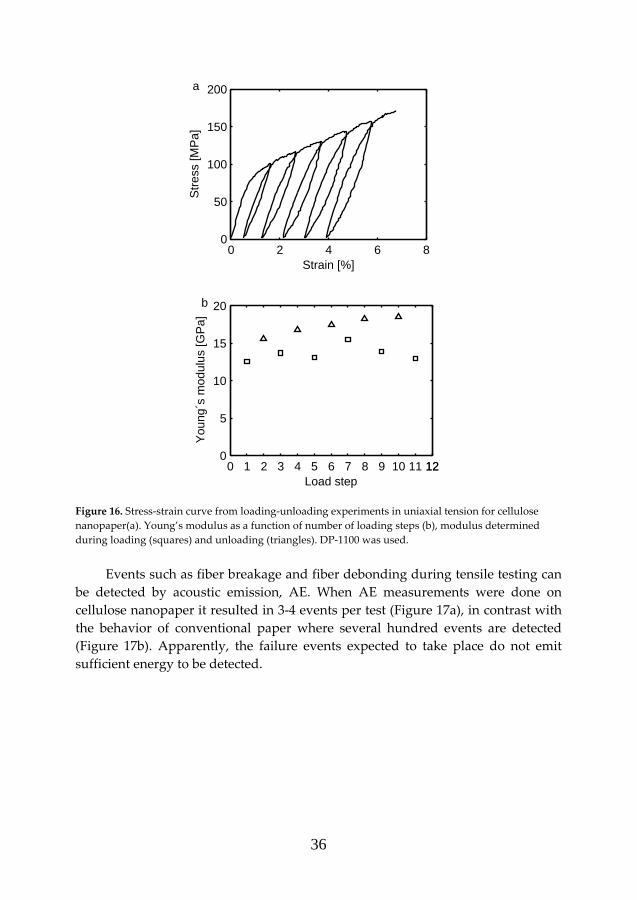
36
0 2 4 6 80
50
100
150
200
Strain [%]
Str
ess
[MP
a]
a
0 1 2 3 4 5 6 7 8 9 10 11 1212
0
5
10
15
20
Load step
You
ng´s
mod
ulus
[GP
a]
b
Figure 16. Stress-strain curve from loading-unloading experiments in uniaxial tension for cellulose nanopaper(a). Young’s modulus as a function of number of loading steps (b), modulus determined during loading (squares) and unloading (triangles). DP-1100 was used.
Events such as fiber breakage and fiber debonding during tensile testing can
be detected by acoustic emission, AE. When AE measurements were done on cellulose nanopaper it resulted in 3-4 events per test (Figure 17a), in contrast with the behavior of conventional paper where several hundred events are detected (Figure 17b). Apparently, the failure events expected to take place do not emit sufficient energy to be detected.

37
Figure 17. Acoustic emission for cellulose nanopaper (a) and paper (b). DP-800 was used.
3.4 COMPOSITES REINFORCED WITH MFC (PAPER III, V) Dry films prepared of cellulose nanofibrils do not loose its structure when
immersed in water. This is utilized when preparing nanocomposites of high fiber content by impregnating films with the matrix. If the wet film is impregnated directly after filtration or exchange to a more suitable solvent it is possible to prepare composites with a wider range in fiber content.76
3.4.1 MFC films containing melamine formaldehyde (Paper III) Previously high fiber content nanocomposites have been prepared from MFC
nanofibrils and phenol formaldehyde, PF.31,35,40 The disadvantage by using PF as a matrix is the dark color of the system. In this study melamine formaldehyde, MF, was chosen as a matrix material due to its small water soluble pre-polymer
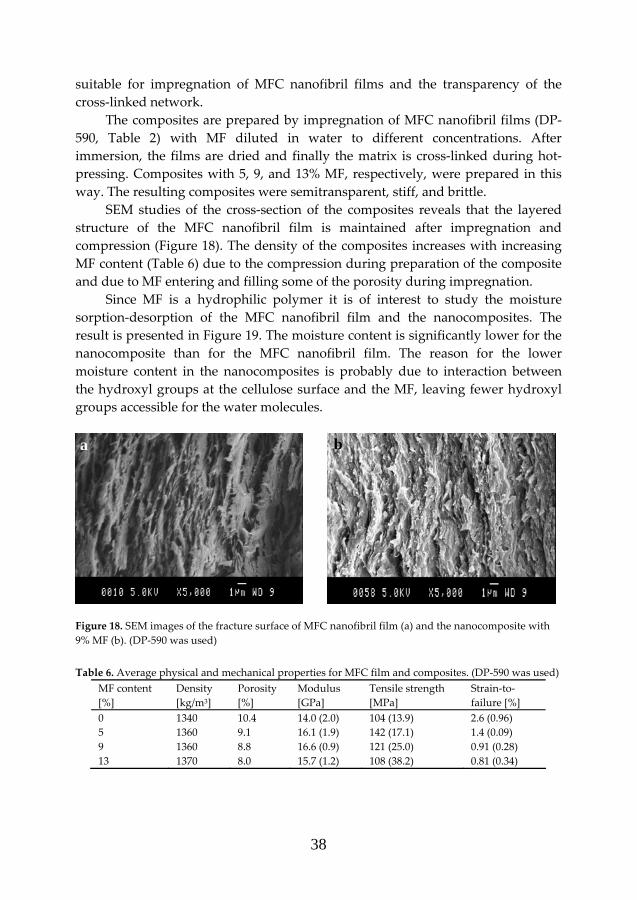
38
suitable for impregnation of MFC nanofibril films and the transparency of the cross-linked network.
The composites are prepared by impregnation of MFC nanofibril films (DP-590, Table 2) with MF diluted in water to different concentrations. After immersion, the films are dried and finally the matrix is cross-linked during hot-pressing. Composites with 5, 9, and 13% MF, respectively, were prepared in this way. The resulting composites were semitransparent, stiff, and brittle.
SEM studies of the cross-section of the composites reveals that the layered structure of the MFC nanofibril film is maintained after impregnation and compression (Figure 18). The density of the composites increases with increasing MF content (Table 6) due to the compression during preparation of the composite and due to MF entering and filling some of the porosity during impregnation.
Since MF is a hydrophilic polymer it is of interest to study the moisture sorption-desorption of the MFC nanofibril film and the nanocomposites. The result is presented in Figure 19. The moisture content is significantly lower for the nanocomposite than for the MFC nanofibril film. The reason for the lower moisture content in the nanocomposites is probably due to interaction between the hydroxyl groups at the cellulose surface and the MF, leaving fewer hydroxyl groups accessible for the water molecules.
Figure 18. SEM images of the fracture surface of MFC nanofibril film (a) and the nanocomposite with 9% MF (b). (DP-590 was used)
Table 6. Average physical and mechanical properties for MFC film and composites. (DP-590 was used)
MF content [%]
Density [kg/m3]
Porosity [%]
Modulus [GPa]
Tensile strength [MPa]
Strain-to-failure [%]
0 1340 10.4 14.0 (2.0) 104 (13.9) 2.6 (0.96) 5 1360 9.1 16.1 (1.9) 142 (17.1) 1.4 (0.09) 9 1360 8.8 16.6 (0.9) 121 (25.0) 0.91 (0.28) 13 1370 8.0 15.7 (1.2) 108 (38.2) 0.81 (0.34)
a b
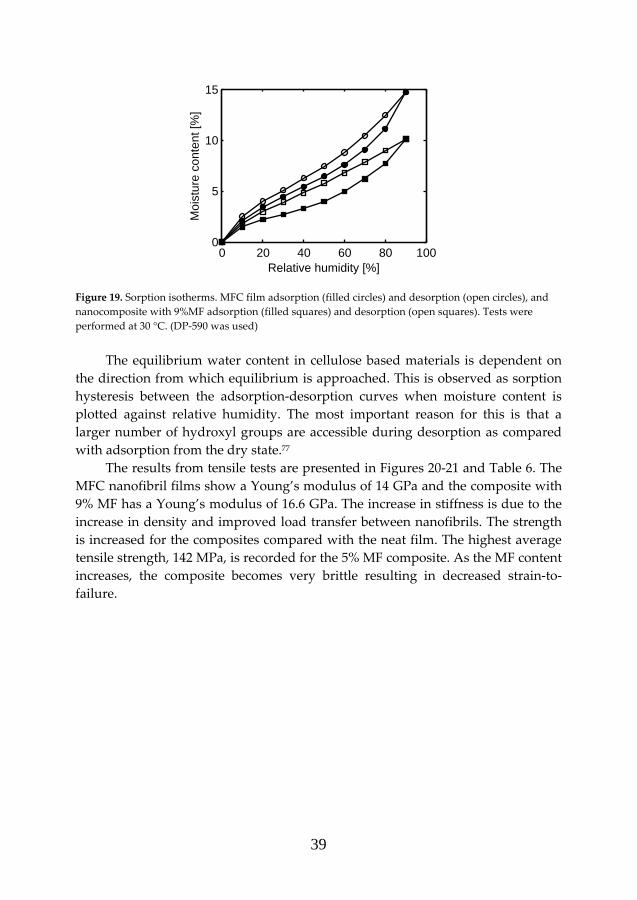
39
0 20 40 60 80 1000
5
10
15
Relative humidity [%]
Moi
stur
e co
nten
t [%
]
Figure 19. Sorption isotherms. MFC film adsorption (filled circles) and desorption (open circles), and nanocomposite with 9%MF adsorption (filled squares) and desorption (open squares). Tests were performed at 30 °C. (DP-590 was used)
The equilibrium water content in cellulose based materials is dependent on
the direction from which equilibrium is approached. This is observed as sorption hysteresis between the adsorption-desorption curves when moisture content is plotted against relative humidity. The most important reason for this is that a larger number of hydroxyl groups are accessible during desorption as compared with adsorption from the dry state.77
The results from tensile tests are presented in Figures 20-21 and Table 6. The MFC nanofibril films show a Young’s modulus of 14 GPa and the composite with 9% MF has a Young’s modulus of 16.6 GPa. The increase in stiffness is due to the increase in density and improved load transfer between nanofibrils. The strength is increased for the composites compared with the neat film. The highest average tensile strength, 142 MPa, is recorded for the 5% MF composite. As the MF content increases, the composite becomes very brittle resulting in decreased strain-to-failure.
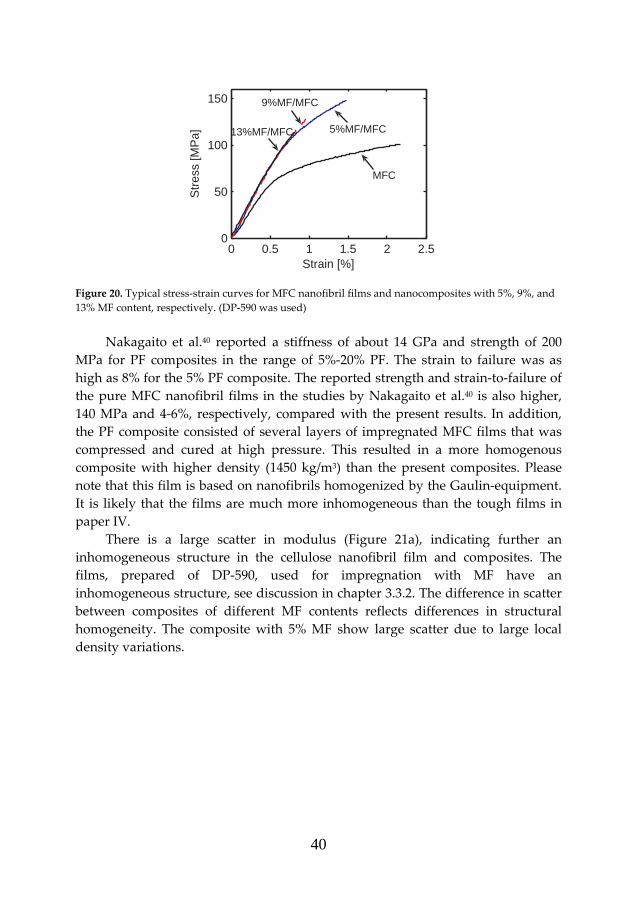
40
0 0.5 1 1.5 2 2.50
50
100
150
Strain [%]
Str
ess
[MP
a] 13%MF/MFC
9%MF/MFC
5%MF/MFC
MFC
Figure 20. Typical stress-strain curves for MFC nanofibril films and nanocomposites with 5%, 9%, and 13% MF content, respectively. (DP-590 was used)
Nakagaito et al.40 reported a stiffness of about 14 GPa and strength of 200
MPa for PF composites in the range of 5%-20% PF. The strain to failure was as high as 8% for the 5% PF composite. The reported strength and strain-to-failure of the pure MFC nanofibril films in the studies by Nakagaito et al.40 is also higher, 140 MPa and 4-6%, respectively, compared with the present results. In addition, the PF composite consisted of several layers of impregnated MFC films that was compressed and cured at high pressure. This resulted in a more homogenous composite with higher density (1450 kg/m3) than the present composites. Please note that this film is based on nanofibrils homogenized by the Gaulin-equipment. It is likely that the films are much more inhomogeneous than the tough films in paper IV.
There is a large scatter in modulus (Figure 21a), indicating further an inhomogeneous structure in the cellulose nanofibril film and composites. The films, prepared of DP-590, used for impregnation with MF have an inhomogeneous structure, see discussion in chapter 3.3.2. The difference in scatter between composites of different MF contents reflects differences in structural homogeneity. The composite with 5% MF show large scatter due to large local density variations.
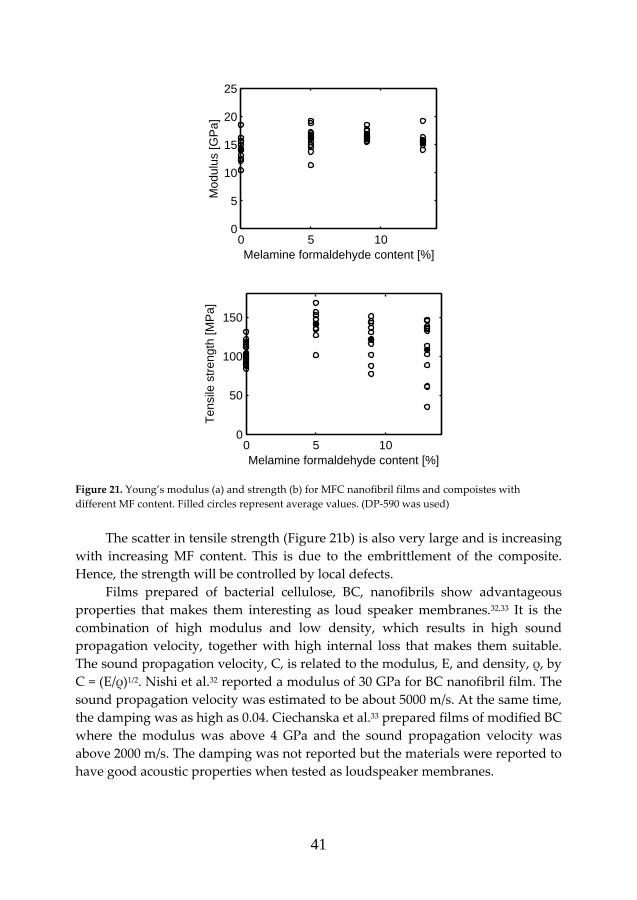
41
0 5 100
5
10
15
20
25
Melamine formaldehyde content [%]
Mod
ulus
[GP
a]
0 5 100
50
100
150
Melamine formaldehyde content [%]
Ten
sile
str
engt
h [M
Pa]
Figure 21. Young’s modulus (a) and strength (b) for MFC nanofibril films and compoistes with different MF content. Filled circles represent average values. (DP-590 was used)
The scatter in tensile strength (Figure 21b) is also very large and is increasing
with increasing MF content. This is due to the embrittlement of the composite. Hence, the strength will be controlled by local defects.
Films prepared of bacterial cellulose, BC, nanofibrils show advantageous properties that makes them interesting as loud speaker membranes.32,33 It is the combination of high modulus and low density, which results in high sound propagation velocity, together with high internal loss that makes them suitable. The sound propagation velocity, C, is related to the modulus, E, and density, ρ, by C = (E/ρ)1/2. Nishi et al.32 reported a modulus of 30 GPa for BC nanofibril film. The sound propagation velocity was estimated to be about 5000 m/s. At the same time, the damping was as high as 0.04. Ciechanska et al.33 prepared films of modified BC where the modulus was above 4 GPa and the sound propagation velocity was above 2000 m/s. The damping was not reported but the materials were reported to have good acoustic properties when tested as loudspeaker membranes.
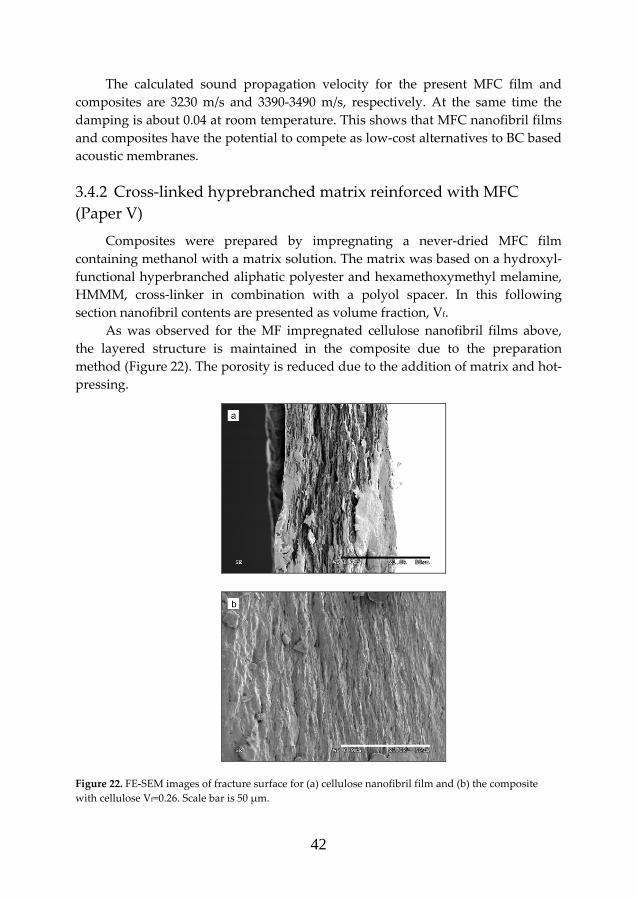
42
The calculated sound propagation velocity for the present MFC film and composites are 3230 m/s and 3390-3490 m/s, respectively. At the same time the damping is about 0.04 at room temperature. This shows that MFC nanofibril films and composites have the potential to compete as low-cost alternatives to BC based acoustic membranes.
3.4.2 Cross-linked hyprebranched matrix reinforced with MFC (Paper V)
Composites were prepared by impregnating a never-dried MFC film containing methanol with a matrix solution. The matrix was based on a hydroxyl-functional hyperbranched aliphatic polyester and hexamethoxymethyl melamine, HMMM, cross-linker in combination with a polyol spacer. In this following section nanofibril contents are presented as volume fraction, Vf.
As was observed for the MF impregnated cellulose nanofibril films above, the layered structure is maintained in the composite due to the preparation method (Figure 22). The porosity is reduced due to the addition of matrix and hot-pressing.
Figure 22. FE-SEM images of fracture surface for (a) cellulose nanofibril film and (b) the composite with cellulose Vf=0.26. Scale bar is 50 µm.
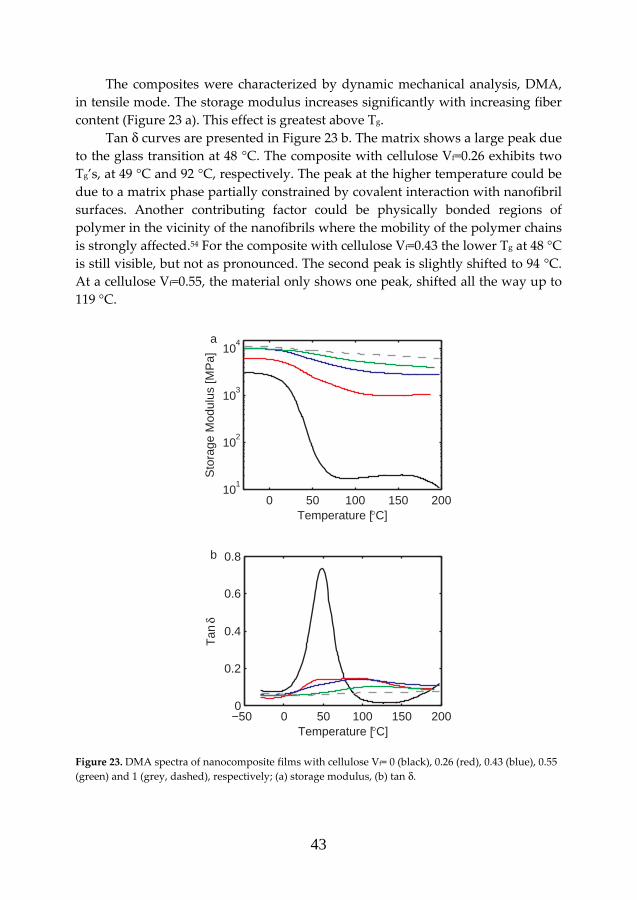
43
The composites were characterized by dynamic mechanical analysis, DMA, in tensile mode. The storage modulus increases significantly with increasing fiber content (Figure 23 a). This effect is greatest above Tg.
Tan δ curves are presented in Figure 23 b. The matrix shows a large peak due to the glass transition at 48 °C. The composite with cellulose Vf=0.26 exhibits two Tg’s, at 49 °C and 92 °C, respectively. The peak at the higher temperature could be due to a matrix phase partially constrained by covalent interaction with nanofibril surfaces. Another contributing factor could be physically bonded regions of polymer in the vicinity of the nanofibrils where the mobility of the polymer chains is strongly affected.54 For the composite with cellulose Vf=0.43 the lower Tg at 48 °C is still visible, but not as pronounced. The second peak is slightly shifted to 94 °C. At a cellulose Vf=0.55, the material only shows one peak, shifted all the way up to 119 °C.
0 50 100 150 20010
1
102
103
104
Temperature [°C]
Sto
rage
Mod
ulus
[MP
a]
a
−50 0 50 100 150 2000
0.2
0.4
0.6
0.8
Temperature [°C]
Tan
δ
b
Figure 23. DMA spectra of nanocomposite films with cellulose Vf= 0 (black), 0.26 (red), 0.43 (blue), 0.55 (green) and 1 (grey, dashed), respectively; (a) storage modulus, (b) tan δ.
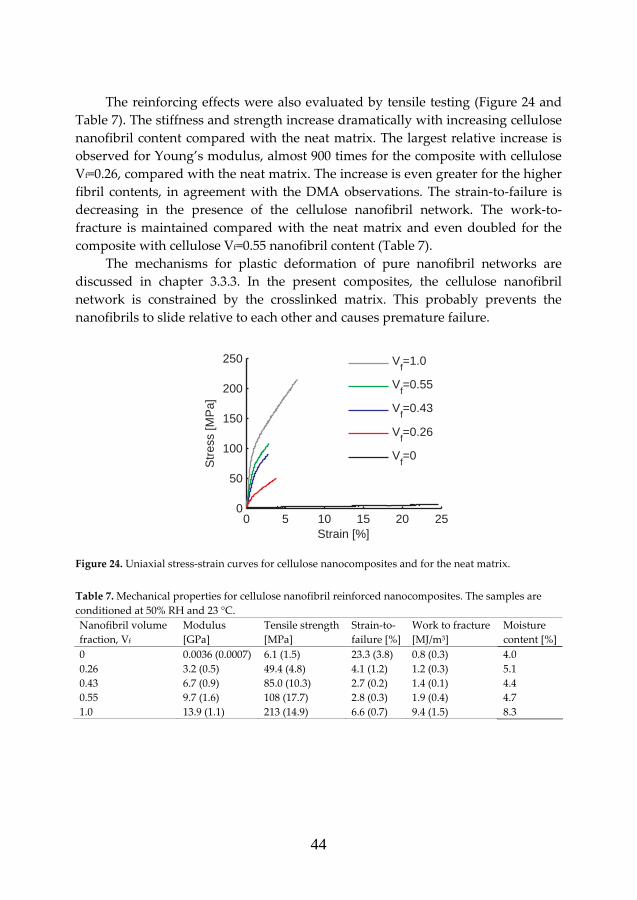
44
The reinforcing effects were also evaluated by tensile testing (Figure 24 and
Table 7). The stiffness and strength increase dramatically with increasing cellulose nanofibril content compared with the neat matrix. The largest relative increase is observed for Young’s modulus, almost 900 times for the composite with cellulose Vf=0.26, compared with the neat matrix. The increase is even greater for the higher fibril contents, in agreement with the DMA observations. The strain-to-failure is decreasing in the presence of the cellulose nanofibril network. The work-to-fracture is maintained compared with the neat matrix and even doubled for the composite with cellulose Vf=0.55 nanofibril content (Table 7).
The mechanisms for plastic deformation of pure nanofibril networks are discussed in chapter 3.3.3. In the present composites, the cellulose nanofibril network is constrained by the crosslinked matrix. This probably prevents the nanofibrils to slide relative to each other and causes premature failure.
0 5 10 15 20 250
50
100
150
200
250
Strain [%]
Str
ess
[MP
a]
Vf=1.0
Vf=0.55
Vf=0.43
Vf=0.26
Vf=0
Figure 24. Uniaxial stress-strain curves for cellulose nanocomposites and for the neat matrix.
Table 7. Mechanical properties for cellulose nanofibril reinforced nanocomposites. The samples are conditioned at 50% RH and 23 °C. Nanofibril volume fraction, Vf
Modulus [GPa]
Tensile strength [MPa]
Strain-to-failure [%]
Work to fracture [MJ/m3]
Moisture content [%]
0 0.0036 (0.0007) 6.1 (1.5) 23.3 (3.8) 0.8 (0.3) 4.0 0.26 3.2 (0.5) 49.4 (4.8) 4.1 (1.2) 1.2 (0.3) 5.1 0.43 6.7 (0.9) 85.0 (10.3) 2.7 (0.2) 1.4 (0.1) 4.4 0.55 9.7 (1.6) 108 (17.7) 2.8 (0.3) 1.9 (0.4) 4.7 1.0 13.9 (1.1) 213 (14.9) 6.6 (0.7) 9.4 (1.5) 8.3
45
4 CONCLUSIONS High strength and high strain-to-failure elastomeric nanocomposites with
strongly improved modulus have been synthesized based on microcrystalline cellulose, MCC, and polyurethane, PU. The nanofibrils from dry MCC were successfully dispersed during polymerization of the matrix. The reinforcing effects are due to micromechanical effects from stiff nanofibrils in a rubbery matrix but also due to entopic effects from both covalent and secondary interactions between the matrix and the fibrils. The improvements in strength and strain-to-failure are ascribed to the nanofibrils acting as a chain extender and cross-linker.
A method for facilitating microfibrillation of wood pulp fibers by homogenization was developed based on enzymatic hydrolysis with endoglucanase. The microfibrillation in the homogenizer was facilitated by shortened fiber length and increased fine content due to the decreased molecular weight that embrittled the pulp fiber cell wall. However, microfibrillation was also assisted by the lowest enzyme concentration (0.02%) with no apparent influence on fiber length and only small decrease in DP (1280 to 910). This indicates additional mechanisms. It is suggested that enzymatic treatment increases cellulose fiber swelling in water, which also facilitates microfibrillation. This is an environmental friendly process without solvents or chemical reactants.
Structure and mechanical behavior have been studied for MFC nanofibril films. The films were prepared by filtration of a diluted MFC nanofibril water suspension. SEM and x-ray studies showed that the nanofibrils were distributed in a more random-in-plane than random-in-space conformation within the films. In addition, density measurements and SEM show that these films are highly porous. Tensile testing revealed that the strength is dependent on the average molecular weight for the cellulose nanofibrils. The strongest film was the one with highest DP (DP-1100), this even though the porosity was as high as 28%. The average tensile strength was 214 MPa and strain-to-failure was 10%. This in combination with the high stiffness (13.2 GPa) resulted in very high toughness, WA=15 MJ/m3.
The cellulose nanofibril network has been utilized in nanocomposites. Films of MFC were impregnated with melamine formaldehyde, MF. The MF was cured during hot-pressing and resulting composites had matrix contents of 5, 9, and 13% by weight, respectively. These composites showed high stiffness (16.6 GPa for 9% MF) and strength (142 MPa for 5% MF). Even though MF is moisture sensitive the
46
equilibrium moisture content was decreased for the 9% MF composite compared with the neat cellulose film. This is probably due to the interaction between the hydroxyl groups at the cellulose nanofibril surfaces and the MF, leaving fewer hydroxyls accessible for moisture.
Composites with lower fibril fractions and strong fibril-matrix interactions have been prepared by impregnating a cellulose nanofibril network containing methanol with hydroxy-functional hyperbranched aliphatic polyester and hexamethoxymethyl melamine, HMMM, as cross-linker in combination with a polyol spacer. In the presence of cellulose nanofibrils at Vf=0.26 and 0.43 the matrix showed two Tg’s. The lower corresponding to the Tg of the neat matrix, the upper corresponding to a more crosslinked matrix or constrained region due to strong interactions with the nanofibrils. Tensile testing revealed strong improvements in stiffness and strength of the neat matrix with addition of cellulose nanofibrils.
47
5 ACKNOWLEDGEMENTS This work was financed by the Swedish Research Council and has been part
of the Biofibre Materials Centre (BiMaC) as the NaBio B project. First I would like to express my gratitude to my supervisor Prof. Lars
Berglund for giving me the opportunity to do this work and for believing in me. You have been an inspiring supervisor and it has been a lot of fun working with you! I would also like to acknowledge Prof. Gunnar Henriksson for supervising and inspiring me during parts of this work.
I would like to thank Prof. Tom Lindström and Mikael Ankerfors for interesting discussions and help regarding preparation of microfibrillated cellulose. Prof. Takashi Nishino is thanked for kind help with x-ray diffraction and answering my endless questions.
The former and present members of the Biocomposite group are thanked for valuable help and interesting discussions. I have really enjoyed working with you and will remember all the fun during our trips. Anna Svagan, Carl Modén and Malin Bergenstråhle are in particular thanked for being fun people to share offices with and for their invaluable knowledge of MatLab. Carl is also thanked for his great support during DSP work.
During my years as a PhD student at KTH I have been a member of two different departments; Fibre and Polymer Technology and Aeronautic and Vehicle Engineering. My colleagues at both departments are acknowledged for their kind help and fun discussions, more or less serious, during numerous lunches. The administrative staffs, in particular Inga and Brita, are thanked for their invaluable help. Mona, Anders and Peter: thank you for your great support in the labs.
My parents, Birgitta and Christer, as well as the Larsson, Åkerud and Svagan/Hanner families are gratefully thanked for their support and help.
Finally I would like to thank Mattias and Alvin. Mattias, without your endless support this would never have been possible! Alvin, thanks for the deliveries of cinnamon buns!
48
6 REFERENCES 1. Hull, D. An Introduction to Composite Materials, 1st ed.; Cambridge Solid State
Science Series; Cambridge University Press: Cambridge, U.K., 1993. 2. Okada, A.; Kawasumi, M.; Usuki, A.; Kojima, Y.; Kurauchi, T.; Kamigaito, O.;
Mat. Res. Symp. Proc., 1990, 171, 45. 3. Alexandre, M.; Dubois, P. Mat. Sci. Eng., 2000, 28, 1. 4. Okada, A.; Usuki, A. Macromol. Mater. Eng. 2006, 291, 1449. 5. Harris, P. J. F. Inter. Mater. Rev. 2004, 49, 31. 6. Lau, K. T.; Gu, C.; Hui, D. Compos. Part B 2006, 37, 425. 7. Sakurada, I.; Nukushina, Y.; Ito, T. J. Polym. Sci. 1962, 57, 651. 8. Hult, E. L.; Iversen, T.; Sugiyama, J. Cellulose 2003, 10, 103. 9. Wainwright, S. A.; Biggs, W. D.; Currey, J. D.; Gosline, J. M. Mechanical design
in organisms, Princeton University Press: Princeton, 1982. 10. Fengel, D. ; Wegener, G. Wood Chemistry, Ultrastructure, Reactions Walter de
Gruyter: Berlin, 1984. 11. Favier, V.; Canova, G. R.; Cavaillé, J. Y. ; Chanzy, H. ; Dufresne, A. ; Gauthier,
C. Polym. Adv. Techn. 1995, 6, 351. 12. Favier, V.; Chanzy, H.; Cavaillé, J.-Y. Macromol. 1995, 28, 6365. 13. Yano, H.; Sugiyama, J.; Nakagaito, A. N.; Nogi, M.; Matsuura, T.; Hikita, M.;
Handa, K. Adv. Mater. 2005, 17, 153. 14. Shimazaki, Y.; Miyazaki, Y.; Takezawa, Y.; Nogi, M.; Abe, K.; Ifuku, S.; Yano,
H. Biomacromol. 2007, 8, 2976. 15. Iwamoto, S.; Nakagaito, A. N.; Yano, H.; Nogi, M. Appl. Phys. A 2005, 81,
1109. 16. Battista O. A. Microcrystal polymer science. New York:McGraw Hill Inc.;
1975. 17. Herrick, F. W.; Casebier, R. L.; Hamilton, J.K.; Sandberg, K. R.
Microfibrillated cellulose: morphology and accessibility. J. Appl. Polym. Sci., Appl. Polym. Symp. 1983, 37, 797.
18. Turbak, A. F.; Snyder, F. W.; Sandberg, K. R. J. Appl. Polym. Sci., Appl. Polym. Symp. 1983, 37, 815.
19. Rees, L. H. Chem. Eng. 1974, 13, 86. 20. Boldizar, A.; Klason, C.; Kubát, J.; Näslund, P.; Sáha, P. Int. J. Polym. Mater.
1987, 11, 229.
49
21. Zimmerman, T.; Pöhler, E.; Geiger, T. C Adv. Eng. Mat. 2004, 6, 754. 22. Yano, H.; Nakahara, S. J. Mat. Sci. 2004, 39, 1635. 23. Henriksson, M. “Cellulose nanocomposite films – processing, structure and
properties”, Licentiate thesis, Kungliga Tekniska högskolan, Stockholm, Sweden, 2004.
24. Pääkkö, M.; Ankerfors, M.; Kosonen H.; Nykänen, A.; Ahola, S.; Östberg, M.; Ruokolainen, J.; Laine, J.; Larsson, P. T.; Ikkala, O.; Lindström, T.; Biomacromol. 2007, 8, 1934.
25. Saito, T.; Nishiyama, Y.; Putaux, J.-L.; Vignon, M.; Isogai, A. Biomacromol. 2007, 7, 1687.
26. Wågberg, L.; Decher, G.; Norgren, M.; Lindström, T.; Ankerfors, M.; Axnäs, K. Langmuir, In press.
27. Taniguchi, T.; Okamura, K. Polym. Int. 1998, 47, 291. 28. Iwamoto, S.; Nakagaito, A. N.; Yano, H. Appl. Phys. A 2007, 89, 461. 29. Dufresne, A.; Cavaille, J. Y.; Vignon, M. R. J. Appl. Pol. Sci. 1997 64, 1185. 30. Bruce, D. M.; Hobson, R. N.; Farrent, J. W.; Hepworth, D. G. Compos. Part A,
2005, 36, 1486. 31. Leitner, J.; Hinterstoisser, B.; Wastyn, M.; Keckes, J.; Gindl, W. Cellulose 2007,
14, 419. 32. Nishi, Y.; Uryu, M.; Yamanaka, S.; Watanabe, K.; Kitamura, N.; Iguchi, M.;
Mitsuhashi, S.; J. Mater. Sci. 1990, 25, 2997. 33. Ciechańska, D.; Struszczyk, H.; Kazimierczak, J.; Guzińska, K.; Pawlak, M.;
Kozłowska, E.; Matusiak, G.; Dutkiewicz, M. Fibres Text. East. Eur. 2002, 10, 27.
34. Nakagaito, A. N.; Iwamoto, S.; Yano, H. Appl. Phys. A 2005, 80, 93. 35. Nakagaito, A. N.; Yano, H. Appl. Phys. A 2005, 80, 155. 36. Petersson, L.; Kvien, I.; Oksman, K. Compos. Sci. Technol. 2007, 67, 2535. 37. Cao, X.; Dong, H.; Li, C. M. Biomacromol. 2007, 8, 899. 38. Azizi Samir, M. A. S.; Alloin, F.; Sanchez, J.-Y.; Dufresne, A. Macromol. 2004,
37, 4839. 39. Chazeau, L.; Cavaillé, J.-Y.; Canova, G.; Dendievel, R.; Boutherin, B. J. Appl.
Polym. Sci. 1999, 71, 1797. 40. Nakagaito, A. N.; Yano, H. Cellulose, In press. 41. Nishino, T.; Matsuda, I.; Hirao, K.; Macromol. 2004, 37, 7683. 42. Gindl, W.; Keckes, J. Polymer 2005, 46, 10221. 43. Svagan, A. Azizi Samir; M. A. S; Berglund, L. A. Adv. Mater., In press. 44. Czaja, W. K.; Young, D. J.; Kawecki, M.; Brown, R. M. Jr. Biomacromol. 2007, 8,
1. 45. SCAN-CM 15:99. SCAN Standard. SCAN-test methods are published and
recommended by central laboratories for the pulp and paper industry in
50
Denmark, Finland, Norway and Sweden. They can be obtained from Scandinavian Pulp, Paper and Board Testing Committee, Box 5604, SE-114 86 Stockholm, Sweden.
46. Marx-Figini, M. Angew. Makromol. Chem. 1978, 72, 161. 47. Hertzberg, R. W. Deformation and Fracture Mechanics of Engineering Matierials,
3rd edition; John Wiley & Sons: New York, 1989. 48. Vogel, S. Comparative Biomechanics - Life’s physical world; Princeton
University Press: New Jersey, 2003. 49. Isaksson, P.; Hägglund, R. Int. J. Solids Struct. 2007, 44, 6135. 50. Morgenstern, B.; Berger, W. Acta Polym. 1993, 44, 100. 51. Potthast, A.; Rosenau, T.; Buchner, R.; Röder, T.; Ebner, G.; Bruglachner, H.;
Sixta, H.; Kosma, P. Cellulose 2002, 9, 41. 52. Rosenau, T.; Potthast, A.; Hofinger, A.; Sixta, H.; Kosma, P. Holzforschung
2001, 55, 661. 53. Wada, M.; Sugiyama, J.; Okano, T. J. Appl. Polym. Sci. 1993, 49, 1491. 54. Tsagaropoulos, G.; Eisenberg, A. Macromol. 1995, 28, 6067. 55. Demharter, S.; Rösch, J.; Mülhaupt, R. Polym. Bull. 1993, 31, 421. 56. Hiljanen-Vainio, M.; Heino, M.; Seppälä, J. V. Polymer 1998, 39, 865. 57. Torro-Palau, A.; Fernandez-Garcia, J. C.; Orgiles-Barcelo, A. C.; Pastor-Blas,
M. M.; Martin-Martinez, J. M. J. Adhes. Sci. Technol. 1997, 11, 247. 58. Woods, G. The ICI Polyurethanes Book, 2nd ed.; John Wiley & Sons:New York,
1990. 59. Sjögren, B. A.; Berglund, L. A. Polym. Composite 1999, 20, 705. 60. Zilg, C.; Thomann, R.; Mülhaupt, R.; Finter, J. Adv. Mater. 1999, 11, 49. 61. Chen, T. K.; Tien, Y. I.; Wei, K. H. Polymer 2000, 41, 1345. 62. Wang, Z.; Pinnavaia, T. J. Chem. Mater. 1998, 10, 3769. 63. Tien, Y. I.; Wei, K. H. Polymer 2001, 42, 3213. 64. Tien, Y. I.; Wei, K. H. Macromol. 2001, 34, 9045. 65. Hui, C. Y.; Shia, D. Polym. Eng. Sci. 1998, 38, 774. 66. Sternstein, S. S.; Zhu, A. J. Macromol. 2002, 35, 7262. 67. Henriksson, G.; Nutt, A.; Henriksson, H.; Pettersson, B.; Ståhlberg, J.;
Johansson, G. Eur. J. Biochem. 1999, 259, 88. 68. Engström, A. C.; Ek, M.; Henriksson, G. Biomacromol. 2006, 7, 2027. 69. Nakagaito, A. N.; Yano, H. Appl. Phys. A 2004, 78, 547. 70. Mark, R. E., Cell wall mechanics of tracheids; Yale University Press: New
Haven, 1967. 71. Masters, I.; Evans, K. Compos. Struct. 1996, 35, 403. 72. Modén, C. S.; Berglund, L. A. Holzforschung, In press. 73. Sjögren, B. A.; Berglund, L. A. Polym. Compos. 1997, 18, 1.
51
74. Gindl, W.; Martinschitz, K. J.; Boesecke, P.; Keckes, J. Compos. Sci. Tech. 2006, 66, 2639.
75. Keckes, J.; Burgert, I.; Frühmann, K.; Müller, M.; Kölln, K.; Hamilton, M.; Burghammer, M.; Roth, S. V.; Stanzl-Tschegg, S.; Fratzl, P. Nat. Mater. 2003, 2, 810.
76. Nogi, M.; Ifuku, S.; Abe, K.; Handa, K.; Nakagaito, A. N. Yano, H. Appl. Phys. Letters 2006, 88, 133124.
77. Stamm, A. J. Wood and Cellulose Science; The Royal Press Company: New York, 1964, p 142.