Embed Size (px)
Citation preview
YkUoA^LS r~pi\i r ^ STRASBOURG J " ^ ^ ^ ^ ^ B ^ k B I
CRN/PN 87-23 N. d'ordre 302
THESE
présentée
pour obtenir le grade de
DOCTEUR DE L'UNIVERSITE LOUIS PASTEUR DE STRASBOURG I
par
Philippe DESSAGNE
ETUDE DE NOYAUX LOIN DE LA LIGNE DE STABILITE MESURES DE MASSE ET ANALYSE DE L'EMISSION DE
PARTICULES RETARDEES.
CENTRE DE RECHERCHES NUCLEAIRES
STRASBOURG
I N 2 P 3 UNIVERSITE
CNRS LOUIS P A S T E U R
CRN/PN 87-23. N. d'ordre 302
THESE Présentée
•at
A L'U.E.R. DES SCIENCES DE LA MATIERE DE L'UNIVERSITE LOUIS PASTEUR DE STRASBOURG
par Philippe DESSAGNE
ETUDE DE NOYAUX LOIN DE LA LIGNE DE STABILITE. MESURES DE MASSE ET ANALYSE DE L'EMISSION DE
PARTICULES RETARDEES.
Soutenue le!2 novembre 1987 devant la Commission d'examen
M.M. P. Chevallier J. Dudek P.G. Hansen H. Sergolle G. Walter
Mme M. Bernas M. A. Knipper
Président Examinateurs
Membres invités
REMERCIEMENTS
J'exprime ma reconnaissance à Monsieur R. Seltz directeur du Centre de Recherches Nucléaires
de m'avoir acceuilli dans son laboratoire.
Je remercie Monsieur le professeur P. Chevallier d'avoir bien voulu accepter de présider le jury
de cette thèse, Messieurs les professeurs H. Sergolle, P.G. Hansen et J.Dudek d'y participer et
Madame M. Bernas et Monsieur A. Knipper pour avoir répondu à mon invitation.
Je remercie Monsieur G. Walter de m'avoir acceuilli dans son équipe de recherche.
Je tiens à expimer ma gratitude à Madame Ch. Miehé pour avoir suivi et participé pleinement à ce
travail.
Mesdames P. Baumann, C. Richard-Serre et Messieurs A. Huck, G. Klotz et A. Knipper ont
collaboré aux expériences réalisées auprès du séparateur ISOLDE du CERN et auprès du Tandem
de Strasbourg, je les en remercie.
Messieurs J.G. Schmidt, M. Tourelle, PH. Bordet, W. Bader et R. Dissert ont réalisé et assuré
le bon fonctionnement de divers dispositifs expérimentaux, qu'ils trouvent ici l'expression de ma
reconnaissance.
J'adresse mes remerciements à Madame D. Ubeda-Magnier et Messieurs M. Klipfel et S. Liess
pour leur collaboration lors de la réalisation de ce manuscrit.
Mes remerciements vont enfin aux différentes équipes de physiciens avec lesquelles j'ai travaillé
à G.S.I., GANIL, Orsay et ISOLDE, ainsi qu'aux équipes techniques de l'accélérateur, de
l'acquisition et du traitement des données auprès du Tandem de Strasbourg.
TABLE DES MATIERES
Liste des publications 1
INTRODUCTION. 3
CHAPITRE I. Spectroscopie de noyaux émetteurs de protons et de neutrons retardés. 5
A) Noyaux riches en protons. 5
1 ) La décroissance de ^<"M. 5
2 ) La décroissance de °^Ge et °^Se. 11
3 ) Expériences test menées au GANIL. 31
B ) Noyaux riches en neutrons 2"Na et 3"Na. 37
1 ) Le noyau 2 9 Na. 38
2 ) Le noyau 3 0 Na. 45
C ) Calcul des logf0 et logf des transitions B d'énergie
comprises entre 10 et 25 MeV des éléments 6 < Z < 38. 48
CHAPITRE II. Mesures des excès de masse de 4 9 - 5 0 K , 40,42 C 1 e t 1 4 7 G d 5 j
A ) Mesure des bilans d'énergie Og pour 49,50^ e t 40,42çj 5 j
1 ) Excès de masse de 49 ,50K 51
2)Excèsdemassede 4 0 ' 4 2 Cl. 57
B ) Mesure de l'excès de masse de * 4 'Gd
par la réaction ( 1 2 C . 9 Be ) . 62
CHAPITRE III. Spectroscopie des noyaux riches en neutrons allant du chrome au zinc. 65
A ) Etude de 6 2 F e et 6 7 - 6 8 N i . 65
1 ) Schéma des niveaux de ° 2Fe et 6 7 - 6 8 N i . 65
2 ) Transition monopolaire 0 +
2 - 0 + j dans 6 8 N i . 71
B ) Etude de la décroissance B des noyaux riches en neutrons allant du chrome au zinc. 75
CONCLUSION 77
REFERENCES 79
APPENDICE 83
1
PUBLICATIONS
Le travail constituant cette thèse à fait l'objet de publications, jointes en appendice, et qui sont
référencées dans le texte par les numéros suivants :
I. Study of the giant Gamow-Teller resonance in nuclear beta decay : the case of ^Ar. Nucl.
Phys. A443, 283 ( 1985 ).
II. Study of the giant Gamow-Teller resonance in nuclear beta decay : the case of "Ar . Phys.
Scripta. Vol. 36, 218 ( 1987 ).
m. Shape coexistence phenomena following electronic capture processes of ""Se. En cours de
rédaction.
Contribution à la 5 t n International Conference on nuclei far from Stability. Sep.1987, Rosseau
Lake CANADA.
IV. Gamow-Teller beta decay of 29 N a and comparison with shell-model predictions. Phys. Rev.
C36, 765 ( 1987 ).
V. Gamow-Teller beta decay of 29-31 jvja comparison with shell-model estimates. Contribution à
la 5 t h International Conference on nuclei far from Stability. Sep. 1987,
Rossean Lake CANADA.
VI. Tables des valeurs de logfg et logfj pour les transitions beta d'énergie comprise entre 10 et
25 MeV des éléments 6 < Z < 38. Rapport Interne C.R.N. PN 87-08.
VII.'j Experimental mass excess o f 4 9 K a n d 5 0 K .
Phys. Rev. C33, 1736 (1986).
Vll.b Experimental mass excess of 49,50^ a n ( j 4 0 , 4 2 Q Contribution à la 5 t n International
Conference on nuclei far from Stability. Sep.1987, Rosseau Lake CANADA.
VIII. Measurement of the mass excess by the ( 1 2 C , 9 Be ) reaction.
Z.Phys.A321,435 (1985).
DC. Spectroscopy of neutron-rich isotopes of Nickel and Iron.
Rapport interne IPNO DRE 87-15.
X. Halflife of the first excited state ( 0+ ) of 6 8 Ni . J. Phys. Lett. 45, L-851 ( 1984 ).
XI. Decay studies of neutron-rich isotopes of Manganese, Iron, Cobalt, Nickel, Copper and Zinc. Nucl. Phys. A441, 237 ( 1985 ).
XII. Beta-decay half-lives of new neutron-rich Chromium-to-Nickel isotopes and their consequences for the astrophysical R-process.Phys. Lett. 164B, 22 ( 1985 ).
3
INTRODUCTION
Parmi les deux cent quatre vingt sept noyaux qui existent dans la nature deux cent soixante
trois sont stables, dans le sens qu'ils ont une durée de vie infinie. Ils constituent "la ligne de
stabilité" et les noyaux situés de part et d'autre de cette ligne ont des durées de vie allant de
quelques 10 1 5 ans à quelques millisecondes. Ceux que l'on dit "loin de la vallée de stabilité" ont
des durées de vie inférieures à quelques minutes et l'on qualifie d'exotiques ceux situés aux
frontières de nos connaissances. Les deux mille isotopes connus à ce jour représentent moins de la
moitié des espèces nucléaires susceptibles d'exister. Commencée voici plus de cinquante ans,
l'étude de la matière loin de la vallée de stabilité permet d'obtenir de nouvelles informations sur la
structure nucléaire, comme le comportement des couches magiques et l'identification de noyaux
sphériques ou très déformés. Plusieurs motivations théoriques justifient les recherches
expérimentales menées sur ces noyaux pour étudier les caractéristiques de leur état
fondamental ( masse, moment magnétique, propriétés de désintégration, rayon carré moyen de
charge ) et celles des premiers états excités, en particulier une meilleure caractérisation de la force
nucléaire dont seuls les traits principaux sont connus. Enfin, l'étude des noyaux exotiques présente
un intérêt croissant dans les calculs de nucléosynthèse par lesquels on tente de rendre compte de la
courbe d'abondance isotopique des éléments présents dans la nature. Le développement constant de
nouvelles techniques de production et d'identification offre la possibilité d'étudier des noyaux de
plus en plus éloignés de la ligne de stabilité.
Le travail expérimental que nous avons mené a été effectué auprès du séparateur en ligne
ISOLDE du CERN et celui de GSI ( Darmstadt ), auprès des tandems de Strasbourg et d'Orsay,
ainsi qu'au GANIL. Nous avons étudié le mode de décroissance de noyaux émetteurs de protons
et de neutrons retardés au voisinage des masses 30 et 70. Dans la désexcitation de ces isotopes
( 32,33^ r j 65Q e ) 69g e e t 29,30]sja ) o n obtient l'énergie et des informations sur la structure des
états liés des noyaux fils et, compte tenu des valeurs élevées du bilan Qg, la force de transition
Gamow-Teller sur un grand domaine d'énergie d'excitation. L'analyse par la méthode
d'autocorrélation des spectres en énergie des protons retardés de 6 5 G e et 6 9 S e permettra d'établir la
densité d'états au dessus de l'énergie de séparation de la particule dans le noyau émetteur. La durée
de vie des niveaux non liés dans le domaine de 10" 1 6 seconde dans ""As pourra être estimée à
partir des mesures de coïncidences proton-rayon X, l'émission de protons retardés étant
consécutive au processus de capture électronique. Nous appuyant sur des travaux antérieurs
réalisés au CERN par notre équipe nous avons effectué une première détermination expérimentale
de l'excès de masse de 4 9 K , 50j^ e t 4 2 ^ e t u n e n o u v e u e mesure pour ^ C l . L'excès de masse de
' ^ G d a été remesuré à l'aide de la réaction à deux corps 1 4 4 S m ( 1 2 C , 9 B e ) 1 4 7 G d . Les
4
prolongements théoriques et expérimentaux auquels ont donné lieu les travaux effectués au cours de
ma thèse de troisième cycle à l'I.P.N d'Orsay concernent les isotopes lourds du fer et du nickel.
En particulier, pour le noyau doublement magique 68 N i
nous avons mesuré la durée de vie du
premier état excité ( 0 + ) et comparé cette quantité à celle prédite par un calcul microscopique dans
le formalisme Hartree Fock Bogoliubov. Enfin j'ai participé à une étude systématique de la
décroissance beta des isotopes lourds de l'élément chrome à l'élément zinc, réalisée dans le but de
déterminer leur durée de vie et si possible un schéma de désexcitation préliminaire des noyaux fils.
CHAPITRE I
SPECTROSCOPIE DE NOYAUX EMETTEURS
DE PROTONS ET DE NEUTRONS RETARDES
En 1930, Gamow montra que les particules alpha de grande énergie observées dix ans plus tôt
par Rutherford étaient consécutives à l'émission 8 de ^IZgi. En 1937, Lewis et al. ( Lew.37 )
produisaient le premier noyau artificiel émetteur d'alpha retardés ,1e noyau °Li, et en 1939 Roberts
et al. ( Rob.39 ) détectaient les premiers neutrons différés, formés par bombardement de l'Uranium
par des neutrons lents. Vingt ans plus tard ont été identifiés les premiers noyaux émetteurs de
protons retardés ( Kar.63, Bar.63 ). On connaît à l'heure actuelle environ une centaine de noyaux
émetteurs de particules retardées, les modèles théoriques en prévoient environ un millier et il existe
plusieurs revues sur ce sujet de recherche ( Har.74, Har.76a, Kar.75, Jon.76, Cer.77, Han.79,
Han.87 ). Durant ces quinze dernières années, l'émission de protons, de neutrons et de particule
alpha consécutive à l'émission 6 a été intensivement étudiée pour un grand nombre d'isotopes. De
nouveaux modes de décroissance comme l'émission retardée de deux protons ( Cab.82, Cab.83,
Ays.85, Bor.87 ), de deux et trois neutrons ( Azu.79, Jon.81, Det.80 ), de triton dans la
désexcitation de °He ( Lan.84 ) et de particule alpha pour des noyaux légers riches en neutrons
( Lan.81, Det.83 ) ont également été observées.
L'étude de l'émission de particules retardées permet d'établir la force de transition G.T. vers les
niveaux non liés sur un grand domaine d'énergie d'excitation dans le noyau fils, la localisation des
états isobariques analogues dans le cas des transitions B + , et d'obtenir des informations sur la
densité de niveaux à haute énergie d'excitation. Dans le cas particulier de l'émission de protons
consécutive à la capture électronique il a été montré par Hardy ( Har.76b ) que par des mesures de
coïncidence proton-rayonnement X ,on pouvait atteindre la durée de vie des niveaux émetteurs dans
le domaine de 10" 1 6 seconde, temps de rearrangement du cortège électronique. Par ailleurs le
processus d'émission de particules retardées peut être mis à profit pour mesurer la masse du noyau
précurseur par des mesures de coïncidence rayonnement B-particules ( Chapitre.II ).
En astrophysique l'émission de neutrons retardés joue un rôle important dans les étapes finales
du processus de capture rapide de neutrons et par là, intervient dans l'interprétation de la courbe
d'abondance des isotopes du système solaire ( Kod.75 ).
A ) Noyaux riches en protons.
1) La décroissance de 32,33 A r .
La décroissance B + des isotopes ^ A r e t ^AT présente la singularité intéressante d'être dominée
par la transition B + superpermise AT = AJ = 0 vers le niveau analogue dans le noyau fils ( T = 2,
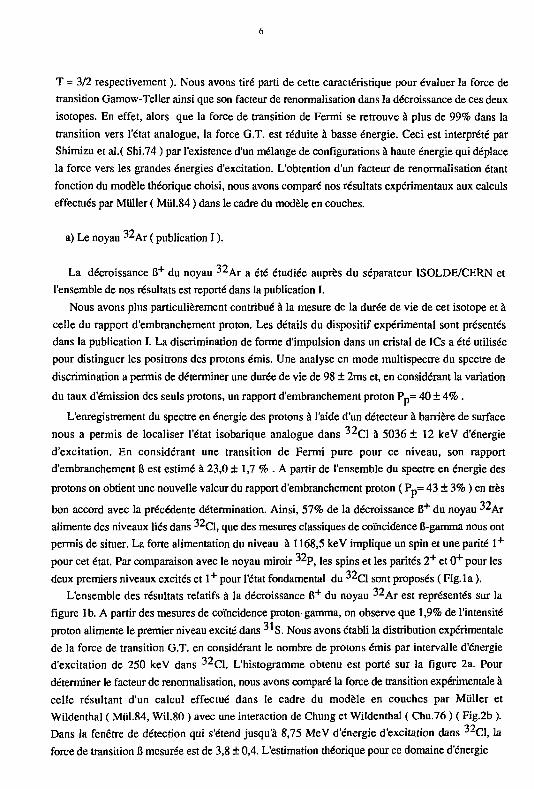
6
T = 3/2 respectivement ). Nous avons tiré parti de cette caractéristique pour évaluer la force de
transition Gamow-Teller ainsi que son facteur de renormalisation dans la décroissance de ces deux
isotopes. En effet, alors que la force de transition de Fermi se retrouve à plus de 99% dans la
transition vers l'état analogue, la force G.T. est réduite à basse énergie. Ceci est interprété par
Shimizu et al.( Shi.74 ) par l'existence d'un mélange de configurations à haute énergie qui déplace
la force vers les grandes énergies d'excitation. L'obtention d'un facteur de renormalisation étant
fonction du modèle théorique choisi, nous avons comparé nos résultats expérimentaux aux calculs
effectués par Miiller ( Miil.84 ) dans le cadre du modèle en couches.
a) Le noyau ( publication I ).
La décroissance B + du noyau 32 A r a été étudiée auprès du séparateur ISOLDE/CERN et
l'ensemble de nos résultats est reporté dans la publication I.
Nous avons plus particulièrement contribué à la mesure de la durée de vie de cet isotope et à
celle du rapport d'embranchement proton. Les détails du dispositif expérimental sont présentés
dans la publication I. La discrimination de forme d'impulsion dans un cristal de ICs a été utilisée
pour distinguer les positrons des protons émis. Une analyse en mode multispectre du spectre de
discrimination a permis de déterminer une durée de vie de 98 ± 2ms et, en considérant la variation
du taux d'émission des seuls protons, un rapport d'embranchement proton P p = 40 ± 4% .
L'enregistrement du spectre en énergie des protons à l'aide d'un détecteur à barrière de surface
nous a permis de localiser l'état isobarique analogue dans 32 C1 à 5036 ± 1 2 keV d'énergie
d'excitation. En considérant une transition de Fermi pure pour ce niveau, son rapport
d'embranchement B est estimé à 23,0 + 1,7 % . A partir de l'ensemble du spectre en énergie des
protons on obtient une nouvelle valeur du rapport d'embranchement proton ( P p= 43 ± 3% ) en très
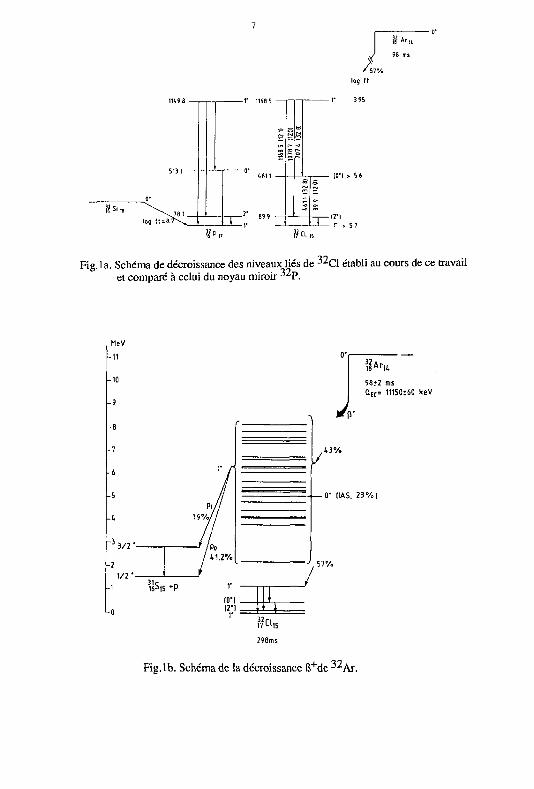
bon accord avec la précédente détermination. Ainsi, 57% de la décroissance B + du noyau 32Ar
alimente des niveaux liés dans 32C1 , que des mesures classiques de coïncidence B-gamma nous ont
permis de situer. La forte alimentation du niveau à 1168,5 keV implique un spin et une parité 1 +
pour cet état. Par comparaison avec le noyau miroir 32p, i e s spins et les parités 2 + et 0 + pour les
deux premiers niveaux excités et 1 + pour l'état fondamental du 32ci sont proposés ( Fig. la ).
L'ensemble des résultats relatifs à la décroissance B + du noyau 32 A r est représentés sur la
figure lb. A partir des mesures de coïncidence proton-gamma, on observe que 1,9% de l'intensité
proton alimente le premier niveau excité dans 3ls. Nous avons établi la distribution expérimentale
de la force de transition G.T. en considérant le nombre de protons émis par intervalle d'énergie
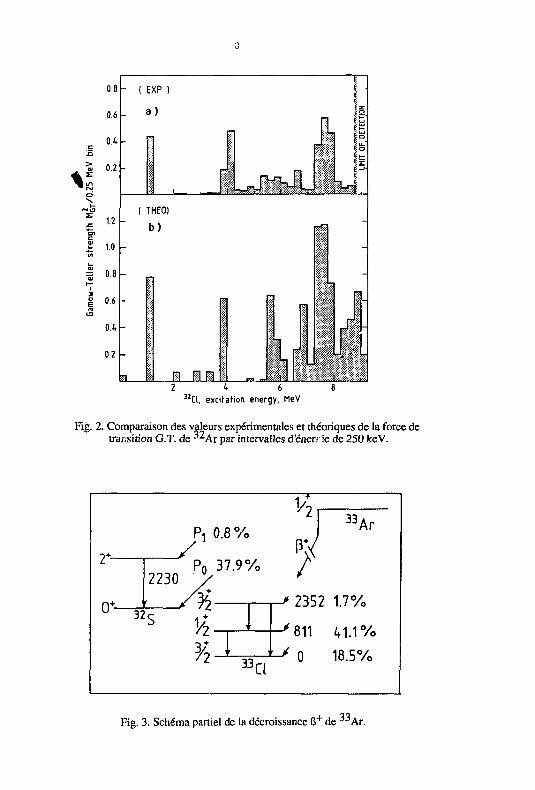
d'excitation de 250 keV dans 3 2 Q . L'histogramme obtenu est porté sur la figure 2a. Pour
déterminer le facteur de renormalisation, nous avons comparé la force de transition expérimentale à
celle résultant d'un calcul effectué dans le cadre du modèle en couches par Miiller et
Wildenthal ( Miil.84, Wil.80 ) avec une interaction de Chung et Wildenthal ( Chu.76 ) ( Fig.2b ).
Dans la fenêtre de détection qui s'étend jusqu'à 8,75 MeV d'énergie d'excitation dans 3 2 C1, la
force de transition 6 mesurée est de 3,8 ± 0,4. L'estimation théorique pour ce domaine d'énergie
An log ft
98 ms
»*.. log 11 =
1168
5
1121
1
1078
7
I1Z0
]
70
7.4
I3
2 8]
S
s § s
1 8 P , , ï# CL , s
Fig.la. Schéma de décroissance des niveaux liés de 3 2 C1 établi au cours de ce travail et comparé à celui du noyau miroir iiV.
•11
3 / 2 * -
1 1oS,5 *P
17 L l 15
3 2 A r
98*2 ms a E C = 11150160 heV
rP-
- 0 - HAS. 2 3 % )
. 1 - •-4
Fig.lb. Schéma de la décroissance 6 +de -^Ar.
3
= o.a
2 <. 6 32Cl, excitation energy, MeV
Fig. 2. Comparaison des valeurs expérimentales et théoriques de la force de transition G.T. de ^ 2Ar par intervalles d'énen ie de 250 keV.
r-
o + -
y ?y 0.8%
2230
32<
P0 37.9%
i 3 / 2 -
33 Ar
-> 2352 1.7%
33 Cl
'811 41.1%
ï-S 0 18.5%
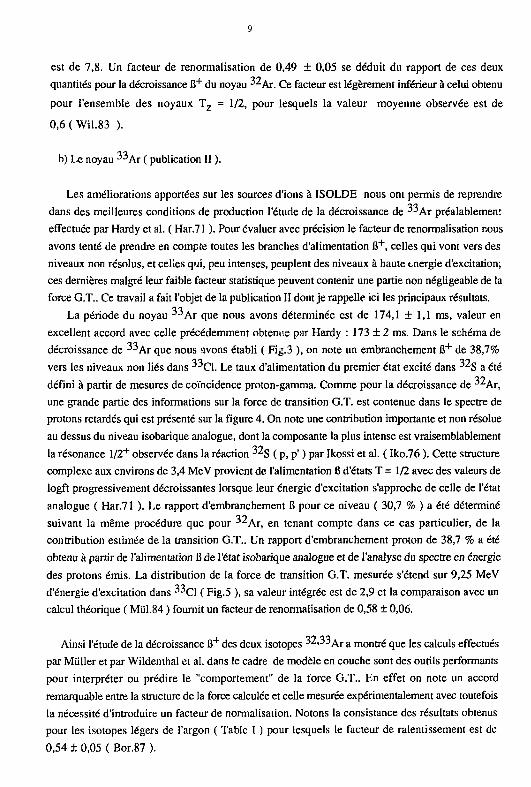
Fig. 3. Schéma partiel de la décroissance 6 + de ^Ar .
9
est de 7,8. Un facteur de renormalisation de 0,49 ± 0,05 se déduit du rapport de ces deux
quantités pour la décroissance B + du noyau 32AT . Ce facteur est légèrement inférieur à celui obtenu
pour l'ensemble des noyaux T z = 1/2, pour lesquels la valeur moyenne observée est de
0,6(Wil.83 ).
b) Le noyau -"Ar ( publication II ).
Les améliorations apportées sur les sources d'ions à ISOLDE nous ont permis de reprendre
dans des meilleures conditions de production l'étude de la décroissance de 3 3 A r
préalablement
effectuée par Hardy et al. ( Har.71 ). Pour évaluer avec précision le facteur de renormalisation nous
avons tenté de prendre en compte toutes les branches d'alimentation B + , celles qui vont vers des
niveaux non résolus, et celles qui, peu intenses, peuplent des niveaux à haute énergie d'excitation;
ces dernières malgré leur faible facteur statistique peuvent contenir une partie non négligeable de la
force G.T.. Ce travail a fait l'objet de la publication II dont je rappelle ici les principaux résultats.
La période du noyau " A r que nous avons déterminée est de 174,1 ± 1,1 ms, valeur en
excellent accord avec celle précédemment obtenue par Hardy : 173 + 2 ms. Dans le schéma de
décroissance de 3 3 A r
que nous avons établi ( Fig.3 ), on note un embranchement B + de 38,7%
vers les niveaux non liés dans 33 Ci . Le taux d'alimentation du premier état excité dans 3 2 S a été
défini à partir de mesures de coïncidence proton-gamma. Comme pour la décroissance de
une grande partie des informations sur la force de transition G.T. est contenue dans le spectre de
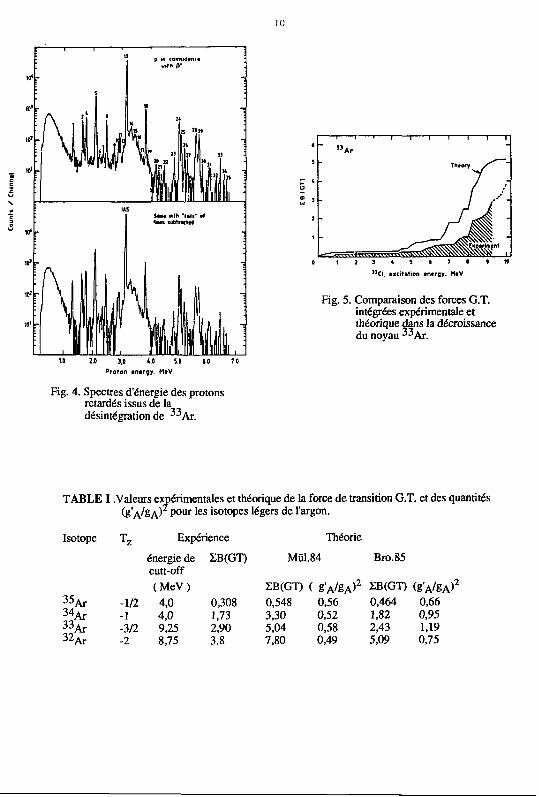
protons retardés qui est présenté sur la figure 4. On note une contribution importante et non résolue
au dessus du niveau isobarique analogue, dont la composante la plus intense est vraisemblablement
la résonance l /2 + observée dans la réaction 32 S ( p, p1 ) par Ikossi et al. ( Iko.76 ). Cette structure
complexe aux environs de 3,4 MeV provient de l'alimentation B d'états T = 1/2 avec des valeurs de
logft progressivement décroissantes lorsque leur énergie d'excitation s'approche de celle de l'état
analogue ( Har.71 ). Le rapport d'embranchement B pour ce niveau ( 30,7 % ) a été déterminé
suivant la même procédure que pour 32Ar, en tenant compte dans ce cas particulier, de la
contribution estimée de la transition G.T.. Un rapport d'embranchement proton de 38,7 % a été
obtenu à partir de l'alimentation B de l'état isobarique analogue et de l'analyse du spectre en énergie
des protons émis. La distribution de la force de transition G.T. mesurée s'étend sur 9,25 MeV
d'énergie d'excitation dans 33ci ( Fig.5 ), sa valeur intégrée est de 2,9 et la comparaison avec un
calcul théorique ( Miil.84 ) fournit un facteur de renormalisation de 0,58 + 0,06.
Ainsi l'étude de la décroissance B + des deux isotopes 32,33 A r a m 0 n t ré que les calculs effectués
par Millier et par Wildenthal et al. dans le cadre de modèle en couche sont des outils performants
pour interpréter ou prédire le "comportement" de la force G.T.. En effet on note un accord
remarquable entre la structure de la force calculée et celle mesurée expérimentalement avec toutefois
la nécessité d'introduire un facteur de normalisation. Notons la consistance des résultats obtenus
pour les isotopes légers de l'argon ( Table I ) pour lesquels le facteur de ralentissement est de 0,54 ± 0,05 ( Bor.87 ).
10
p in toincidinc* with (1*
S w with - M i " •! 'jms subtracts
Fig. 4. Spectres d'énergie des protons retardés issus de la désintégration de ^Ar.
-> 1 1 1 1 1 1 r
Fig. 5. Comparaison des forces G.T. intégrées expérimentale et théorique dans la décroissance du noyau 3 3 Ar.
TABLE I .Valeurs expérimentales et théorique de la force de transition G.T. et des quantités (S'A^SA) P o u r ' e s isotopes légers de l'argon.
Isotope
3 5 A r 34Ar 33Ar 32 A r
T z Expérience
énergie de SB(GT) cutt-off (MeV)
-1/2 4,0 0,308 -1 4,0 1,73 -3/2 9,25 2,90 -2 8,75 3,8
Théorie
Miil.84 Bro.85
2B(GT) ( g ' A / g A ) 2 £B(GT) (gVêA) 2
0,548 0,56 0,464 0,66 3,30 0,52 1,82 0,95 5,04 0,58 2,43 1,19 7,80 0,49 5,09 0,75
11
2 ) La décroissance de "-*Ge e t "^Se.
L'étude de la désintégration radioactive de ces deux isotopes constitue une part importante de
mon travail de thèse.
L'émission de particules retardées ( Har.76a, Har.81> Mac.77, Jon.76 ) se manifeste
différemment pour les précurseurs légers et lourds. Pour les premiers, les particules sont émises à
partir de niveaux bien séparés en énergie et des transitions individuelles peuvent être clairement
identifiées. Pour les noyaux plus lourds ( A > 65 ), la région d'énergie d'excitation Qg-Sp possède
une densité de niveau à priori trop élevée pour que l'on puisse analyser des transitions
individuelles. Les spectres en énergie des particules émises à partir de ces noyaux, présentent une
forme générale en cloche de plusieurs MeV de large.
Bien que le comportement statistique domine dans les spectres de particules des émetteurs
"lourds", on observe au voisinage des couches magiques, une importante modification de la
structure globale du spectre en énergie des protons ( Elm.78, Scha.84, Ays.83, Kle.82 ), et des
particules alpha retardées ( Roe.80 ); des structures fines peuvent émerger dans des cas particuliers
comme 9 9 C d ( Elm.78 ), 9 3 m R u ( Ays.81 ), 1 4 9 E r e t 1 4 7 D y ( Scha.84 ).
Ce processus de désintégration dans la région des masses intermédiaires a été peu étudié. On
peut citer les travaux effectués sur les noyaux "•'Ge ( Vie.87, Har.81a), "*Ge ( Hot.87 ), 4°Mn
( Sek.87 ), -"K ( Ewa.80 ) et ^Cl , 28p ( Hon.79 ) ainsi que ceux sur l'émission de deux protons
retardés dans 3 l A r et 3 5 C a ( Bor.87, Ays.85 ). Dans ce domaine de masse on a montré cependant
que les structures fines dans les spectres de particules ne peuvent pas simplement être attribuées à
de fortes transitions individuelles mais qu'elles résultent de phénomènes de fluctuation dans les
probabilités de transition suivant une loi de distribution de Porter Thomas ( Por.65 ). Ces structures
sont utilisées pour extraire la densité de niveaux dans les noyaux loin de la stabilité
( Elm.78, Jon.76 ).
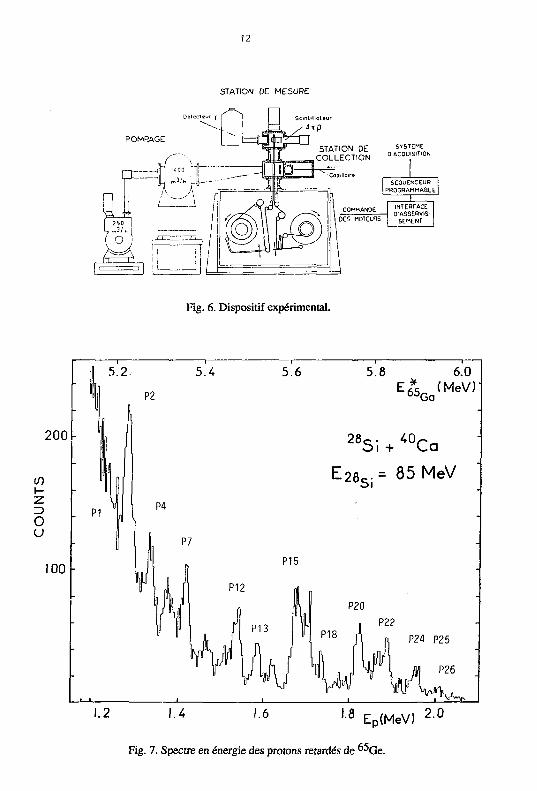
La radioactivité B +- EC des noyaux T z = 1/2 "-'Ge et o 9 S e produits auprès du Tandem du
C.R.N. de Strasbourg par les réactions de fusion-évaporation 4 "Ca ( ^ 'Si , 2pn ) "-'Ge et
40Ca ( 32s, 2pn ) ""Se a été étudiée en utilisant la technique du jet d'hélium associé à un
dérouleur de bande ( Fig. 6 ) et un ensemble de détecteurs de rayons gamma, de rayons X et de
particules. Ce travail fait suite à l'investigation de l'émission de protons retardés des noyaux
T z = 1/2 effectuée par Hardy et al. ( Har.76 ) dans le but de déterminer la durée de vie des niveaux
émetteurs protons et d'obtenir des informations sur la densité de niveaux dans ce domaine de
masse. Le rapport d'embranchement proton est souvent très faible, environ 10"4 pour les noyaux
de masse supérieure ou égale à 65, il est donc difficile expérimentalement d'obtenir des données sur
le processus d'émission de proton retardé. Des progrès importants dans le domaine de la détection
de particules et surtout dans le taux de production de noyaux émetteurs ont cependant été réalisés
ces dix dernières années.
12
STATION DE MESURE
POMRAGE STATION DE S V S T E M
r
E „ COLLECTION D«OUIS.TION
SEOUENCEUR PROGRAMMABLE
I i DES MOTEURS
iNTERrACE D'ASSERVIS
SEMENf
Fig. 6. Dispositif expérimental.
200
5.2 5.4
. PI
100
P2
P4
5.6 5.8 6.0 E & (MeV)' •65, Ga
28c. ^ 4 0 r r i o i + L a
E 2 8 o = 85 MeV
1.2 1.4 1.6
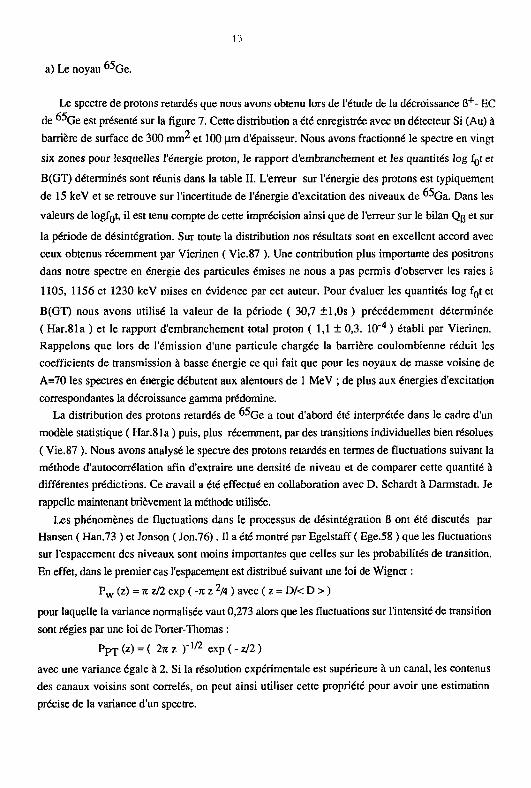
Fig. 7. Spectre en énergie des protons retardés de ^Ge.
1 8 Ep(MeV) 2 0
13
a) Le noyau 6 5 G e .
Le spectre de protons retardés que nous avons obtenu lors de l'étude de la décroissance B +- EC
de "-'Ge est présenté sur la figure 7. Cette distribution a été enregistrée avec un détecteur Si (Au) à
barrière de surface de 300 mwr et 100 |im d'épaisseur. Nous avons fractionné le spectre en vingt
six zones pour lesquelles l'énergie proton, le rapport d'embranchement et les quantités log fgt et
B(GT) déterminés sont réunis dans la table II. L'erreur sur l'énergie des protons est typiquement
de 15 keV et se retrouve sur l'incertitude de l'énergie d'excitation des niveaux de 6 5 Ga. Dans les
valeurs de logfgt, il est tenu compte de cette imprécision ainsi que de l'erreur sur le bilan Qg et sur
la période de désintégration. Sur toute la distribution nos résultats sont en excellent accord avec
ceux obtenus récemment par Vierinen ( Vie.87 ). Une contribution plus importante des positrons
dans notre spectre en énergie des particules émises ne nous a pas permis d'observer les raies i
1105, 1156 et 1230 keV mises en évidence par cet auteur. Pour évaluer les quantités log f0t et
B(GT) nous avons utilisé la valeur de la période ( 30,7 ±l,0s ) précédemment déterminée
( Har.81a ) et le rapport d'embranchement total proton ( 1,1 ± 0,3. 10"4 ) établi par Vierinen.
Rappelons que lors de l'émission d'une particule chargée la barrière coulombienne réduit les
coefficients de transmission à basse énergie ce qui fait que pour les noyaux de masse voisine de
A=70 les spectres en énergie débutent aux alentours de 1 MeV ; de plus aux énergies d'excitation
correspondantes la décroissance gamma prédomine.
La distribution des protons retardés de 65 G e a tout d'abord été interprétée dans le cadre d'un
modèle statistique ( Har.81a ) puis, plus récemment, par des transitions individuelles bien résolues
( Vie.87 ). Nous avons analysé le spectre des protons retardés en termes de fluctuations suivant la
méthode d'autocorrélation afin d'extraire une densité de niveau et de comparer cette quantité à
différentes prédictions. Ce travail a été effectué en collaboration avec D. Schardt à Darmstadt. Je
rappelle maintenant brièvement la méthode utilisée.
Les phénomènes de fluctuations dans le processus de désintégration 6 ont été discutés par
Hansen ( Han.73 ) et Jonson ( Jon.76). Il a été montré par Egelstaff ( Ege.58 ) que les fluctuations
sur l'espacement des niveaux sont moins importantes que celles sur les probabilités de transition.
En effet, dans le premier cas l'espacement est distribué suivant une loi de Wigner :
P w (z) = K z/2 exp ( -K z 2/4 ) avec ( z = D/< D > )
pour laquelle la variance normalisée vaut 0,273 alors que les fluctuations sur l'intensité de transition
sont régies par une loi de Porter-Thomas :
Pp j (z) = ( 2re z ) " 1 / 2 exp ( - z/2 )
avec une variance égale à 2. Si la résolution expérimentale est supérieure à un canal, les contenus
des canaux voisins sont correlés, on peut ainsi utiliser cette propriété pour avoir une estimation
précise de la variance d'un spectre.
14
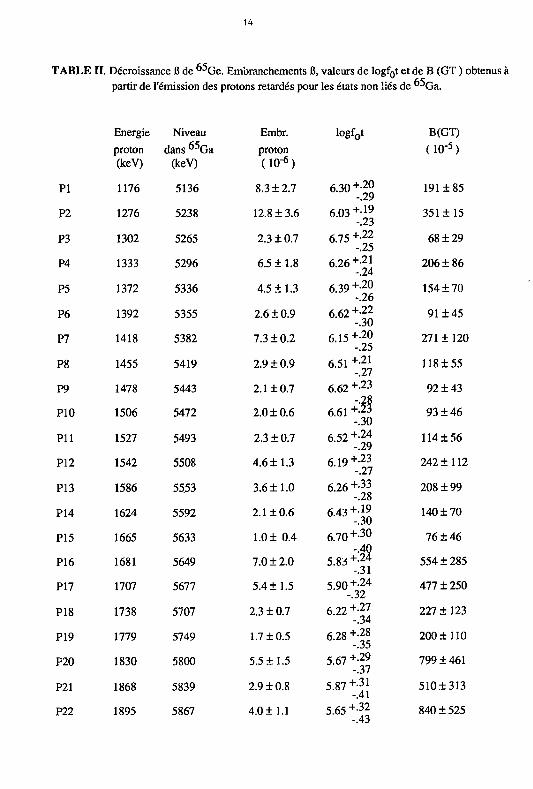
TABLE II. Décroissance B de ^ G e . Embranchements B, valeurs de logfgt et de B (GT ) obtenus à partir de l'émission des protons retardés pour les états non liés de "-*Ga.
Energie Niveau Embr. logf0t B(GT) proton dans "->Ga proton (HT 5) (keV) (keV) do-6)
PI 1176 5136 8.3 ±2.7 6.30 +- 2 0
-.29 1911 85
P2 1276 5238 12.8 + 3.6 6.03 +- 1 9
-.23 351115
P3 1302 5265 2.3 ±0.7 6.75+-22 -.25 68129
P4 1333 5296 6.5 ±1.8 6.26+-21 -.24 206 ± 86
P5 1372 5336 4.511.3 6.39 +-20 -.26 154 ±70
P6 1392 5355 2.6 + 0.9 6.62 +-22 -.30 91145
P7 1418 5382 7.310.2 6.15 +- 2 0
-.25 2711120
P8 1455 5419 2.910.9 6.51 +'21 -.27 118155
P9 1478 5443 2.1+0.7 6.62+-23 -.28
92 + 43 P10 1506 5472 2.0 ±0.6 6.61 +-23 -.30 93146
Pli 1527 5493 2.3 ±0.7 6-52+-24 -.29 114156 P12 1542 5508 4.611.3 6.19+-23
-.27 2421112
P13 1586 5553 3.611.0 6-26 + - H -.28 208 + 99
P14 1624 5592 2.110.6 6-43 +-\î -.30 140170
P15 1665 5633 1.0 ± 0.4 6.70+-30 76146
P16 1681 5649 7.0 ±2.0 -.40
5.83 +-24 -.31 5541285
P17 1707 5677 5.4 ±1.5 5.90 +- 2 4
-.32 4771250
P18 1738 5707 2.3 ±0.7 6.22+-27 -.34 2271123
P19 1779 5749 1.7 ±0.5 6.28 +- 2 8
-.35 200+110
P20 1830 5800 5.5 ±1.5 5.67 +-29 -.37 7991461
P21 1868 5839 2.9 ±0.8 5.87+-31 -.41 5101313
P22 1895 5867 4.011.1 5.65+-32 -.43 8401525
15
TABLE II ( suite )
P23 1930 5902 0.6 + 0.2 6.42
P24 1953 5926 0.8 + 0.3
P25 1969 5942 1.8 ±0.5
P26 2021 5994 0.9 ±0.3 5.95
+.35 -.49
6.20 +-38 -.54
5.81 +-37 -.51 +.43 -.64
143 ±97
241 ± 172
586 + 406
428 ± 330
C H A N N E L N U M B E R
1 30-t>)
1.20- -
1 . 10-•
i 00-
•
0 90"
•
• ' • 1 ' ' • A ' i'i • ' • 6 70 7* 38
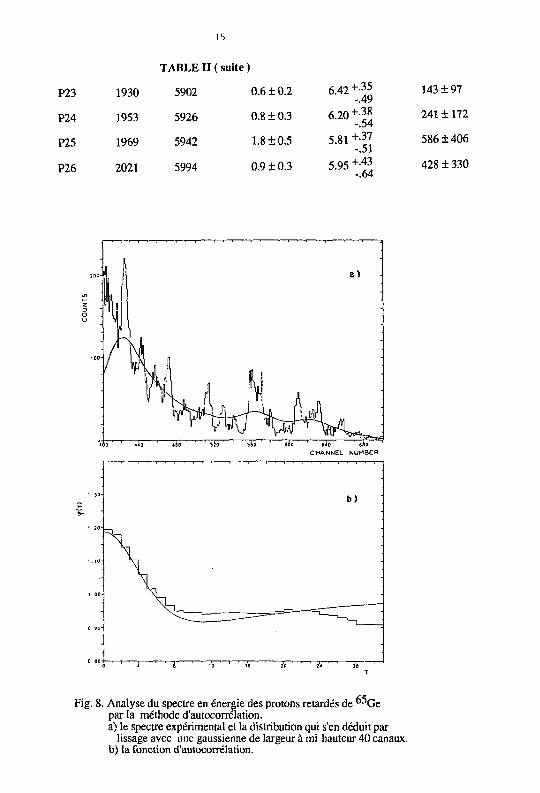
Fig. 8. Analyse du spectre en énergie des protons retardés de "^Ge par la méthode d'autocorrélation. a) le spectre expérimental et la distribution qui s'en déduit par
lissage avec une gaussienne de largeur à mi-hauteur 40 canaux. b) la fonction d'autocorrélation.
16
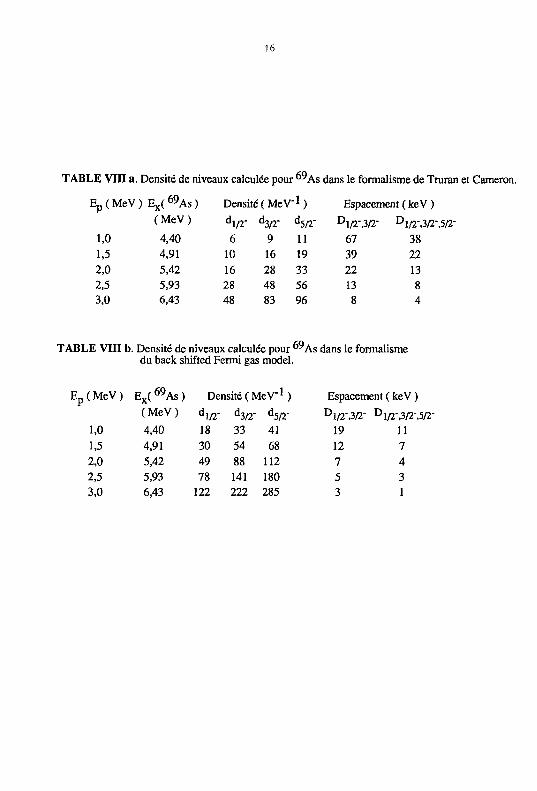
TABLE Vin a. Densité de niveaux calculée pour °^As dans le formalisme de Truran et Cameron.
E p ( MeV ) E x ( 6 9 A s ) Densité (MeV" 1) Espacement ( keV ) (MeV) dl/2" d3/2_ d5/2" Dl/T,3/2- Dl/2-,3/2-,5/2-
1,0 4,40 6 9 11 67 38 1,5 4,91 10 16 19 39 22 2,0 5,42 16 28 33 22 13 2,5 5,93 28 48 56 13 8 3,0 6,43 48 83 96 8 4
TABLE VIII b. Densité de niveaux calculée pour 6 9 A s dans le formalisme du back shifted Fermi gas model.
Ep(MeV) E x ( 0 V As ) Densité (MeV"1 ) Espacement ( keV ) (MeV) dl/2" d3/2" d5/2" Dl/2%3/2- Dl/2",3/2-,5/2-
1,0 4,40 18 33 41 19 11 1,5 4,91 30 54 68 12 7 2,0 5,42 49 88 112 7 4 2,5 5,93 78 141 180 5 3 3,0 6,43 122 222 285 3 1
17
On forme pour cela la fonction d'autocorrélation *F ( x )= < f(x) f(x+x) > où f( x ) est la
distribution expérimentale ; la variance est obtenue pour x = 0 (4 '(x = 0) = l + Var f ). Dans un
spectre de particule la forme globale et les structures fines contribuent à la variance. Pour une
analyse en termes de fluctuations seule est d'intérêt la partie de la variance reliée aux structures
fines. Pour reproduire l'allure générale du spectre f>(x) on lisse la distribution expérimentale f(x)
avec une gaussienne ayant une largeur o > très supérieure à la résolution o du détecteur. On
constitue ensuite le spectre g (x)=f(x) / fj,(x) qui fait ressortir les structures fines, pour lequel on
forme la fonction d'autocorrélation expérimentale ¥ ( x ) = <g (x) g (x + x) >. Cette nouvelle
distribution comparée à la forme analytique ( Jon.76 )
Y (x = 0) = 1 + ( a D / 2a J C 1 / 2 ) ( 1+ 1/y - ( 8/ ( 1+y2) ) 1 / 2 ) permet d'obtenir l'espacement
moyen des niveaux D. Dans cette expression, a est la variance normalisée ( 2 dans le cas des
protons ) et y le rapport ov/a. Les résultats de ce type d'analyse statistique sont illustrés sur la
figure 8. La fonction d'autocorrélation expérimentale comparée à l'expression théorique ( Fig.8b )
donne pour X = 0, ¥ ( x )=1,19 ce qui correspond à un espacement moyen des niveaux
D = 3,9 keV.
Nous avons porté dans les tables Ilia et Mb les résultats des calculs de l'espacement des
niveaux dans les formalismes de Truran et Cameron ( Tru.70 ) et W. Dilg ( Dil.73 ) pour les états
de spin et parité 1/2", 3/2" et 5/2" dans 6 5 Ga, que nous retenons en considérant le caractère permis
des transitions B + observées à partir du niveau fondamental 3/2" de . La désexcitation de ces
états procède par émission d'un proton vers le niveau fondamental 0 + du "^Zn; le changement de
parité implique un moment angulaire impair pour la particule émise. Le coefficient de transmission
d'un proton avec 1 = 1 est très supérieur à celui d'un proton avec 1 = 3,5.. dans la fenêtre Qg-Sp, et
de ce fait l'émission de particules à partir d'états 1/2" ou 3/2" est fortement favorisée. On note que
dans la fenêtre en énergie proton comprise entre 1 et 3 MeV, l'espacement calculé des niveaux est
voisin de la valeur expérimentale avec toutefois un meilleur accord pour le back shifted Fermi gas
model ( Dil.73 ). De plus la largeur gamma calculée pour les niveaux excités dans ce formalisme
est très proche des valeurs expérimentales ( Har.81a ).
b ) Le noyau ""Se ( publication I!I ).
Pour cet isotope l'ensemble de la décroissance B+-EC à été analysé. Compte tenu de son taux
de production dans la réaction de fusion evaporation 4^Ca ( ^2S,2pn ) °"Se, le travail effectué a pu
être étendu à la mesure de la durée de vie des niveaux émetteurs proton.
1R
L'élude de la désexcitation des niveaux liés et non liés de l'isotope , alimentés lors de la
décroissance B +- EC de ""Se, a permis d'obtenir la force de transition G.T. sur un grand domaine
d'énergie.
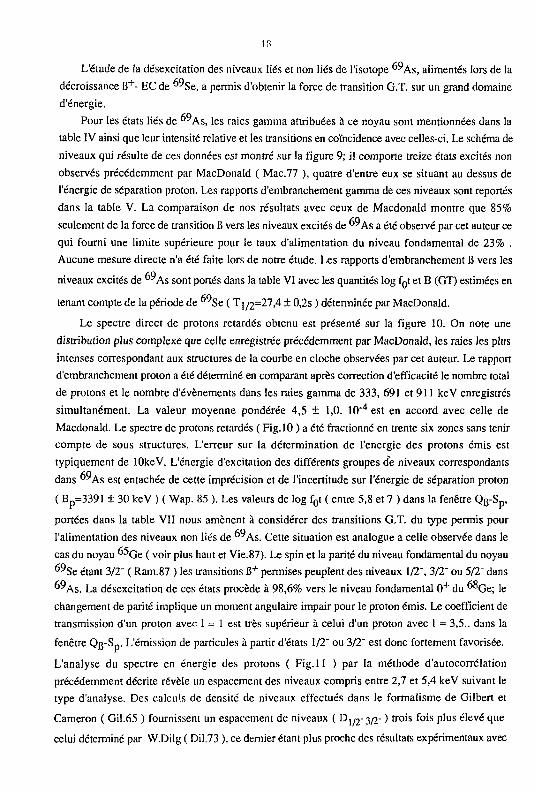
Pour les états liés de "^As, les raies gamma attribuées à ce noyau sont mentionnées dans la
table IV ainsi que leur intensité relative et les transitions en coïncidence avec celles-ci. Le schéma de
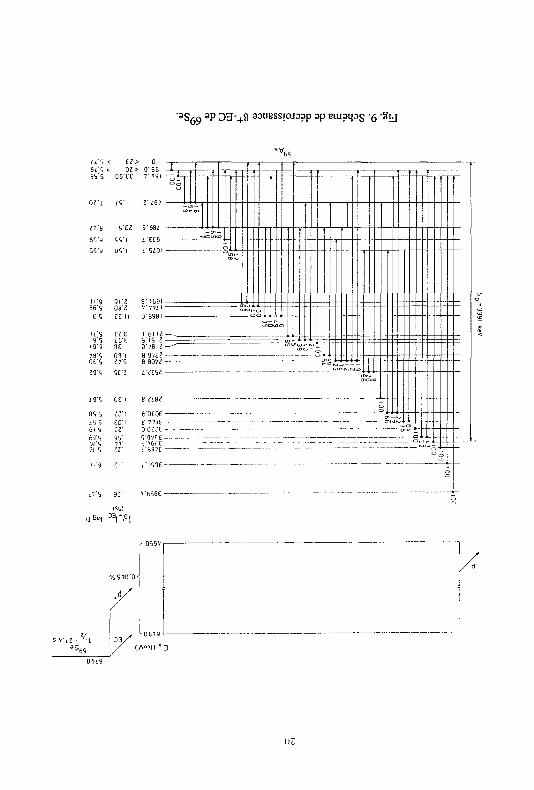
niveaux qui résulte de ces données est montré sur la figure 9; il comporte treize états excités non
observés précédemment par MacDonald ( Mac.77 ), quatre d'entre eux se situant au dessus de
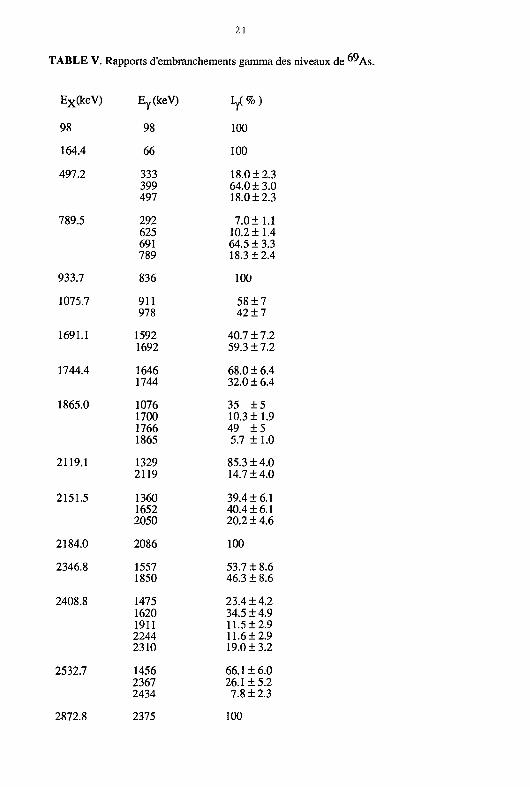
l'énergie de séparation proton. Les rapports d'embranchement gamma de ces niveaux sont reportés
dans la table V. La comparaison de nos résultats avec ceux de Macdonald montre que 85%
seulement de la force de transition B vers les niveaux excités de a été observé par cet auteur ce
qui fourni une limite supérieure pour le taux d'alimentation du niveau fondamental de 23% .
Aucune mesure directe n'a été faite lors de notre étude. Les rapports d'embranchement 6 vers les
niveaux excités de °"As sont portés dans la table VI avec les quantités log fQt et B (GT) estimées en
tenant compte de la période de °^Se ( Tj/2=27,4 ± 0,2s ) déterminée par MacDonald.
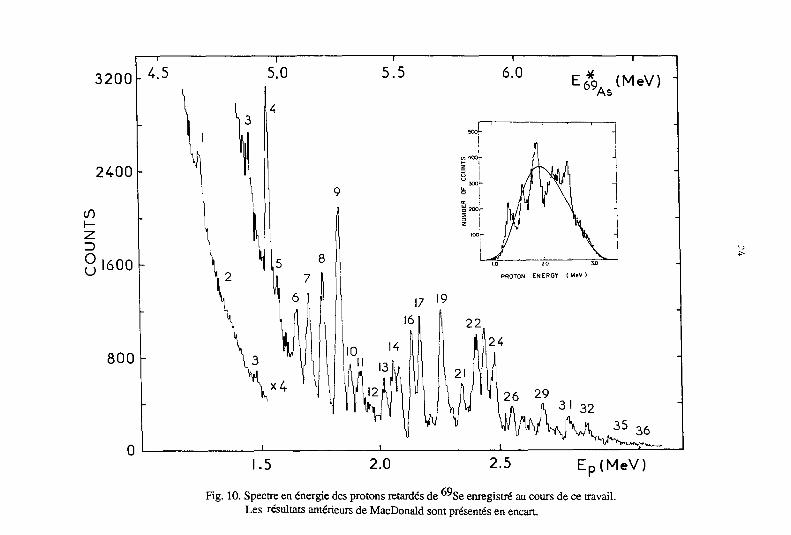
Le spectre direct de protons retardés obtenu est présenté sur la figure 10. On note une
distribution plus complexe que celle enregistrée précédemment par MacDonald, les raies les plus
intenses correspondant aux structures de la courbe en cloche observées par cet auteur. Le rapport
d'embranchement proton a été déterminé en comparant après correction d'efficacité le nombre total
de protons et le nombre d'événements dans les raies gamma de 333, 691 et 911 keV enregistrés
simultanément. La valeur moyenne pondérée 4,5 ± 1,0. 10"4 est en accord avec celle de
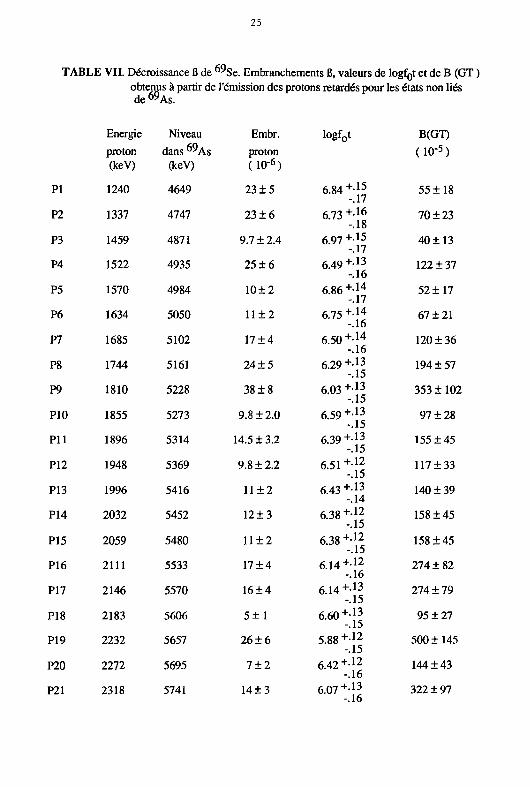
Macdonald. Le spectre de protons retardés ( Fig. 10 ) a été fractionné en trente six zones sans tenir
compte de sous structures. L'erreur sur la détermination de l'énergie des protons émis est
typiquement de lOkeV. L'énergie d'excitation des différents groupes de niveaux correspondants
dans est entachée de cette imprécision et de l'incertitude sur l'énergie de séparation proton
( Bp=3391 ± 30 keV ) ( Wap. 85 ). Les valeurs de log f0t ( entre 5,8 et 7 ) dans la fenêtre Qg-Sp,
portées dans la table VII nous amènent à considérer des transitions G.T. du type permis pour
l'alimentation des niveaux non liés de "^As. Cette situation est analogue a celle observée dans le
cas du noyau "^Ge ( voir plus haut et Vie.87). Le spin et la parité du niveau fondamental du noyau
""Se étant 3/2" ( Ram.87 ) les transitions B + permises peuplent des niveaux 1/2", 3/2" ou 5/2" dans
""As. La désexcitation de ces états procède à 98,6% vers le niveau fondamental 0 + du "°Ge; le
changement de parité implique un moment angulaire impair pour le proton émis. Le coefficient de
transmission d'un proton avec 1 = 1 est très supérieur à celui d'un proton avec 1 = 3,5.. dans la
fenêtre Qg-Sp. L'émission de particules à partir d'états 1/2" ou 3/2" est donc fortement favorisée.
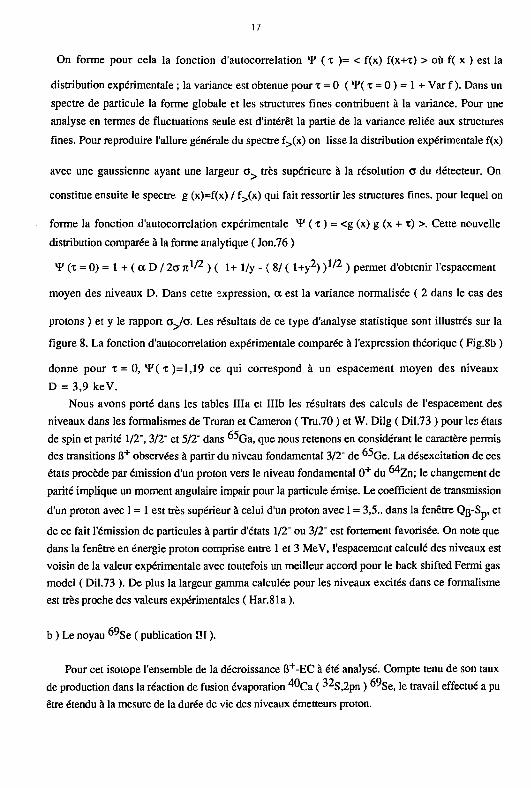
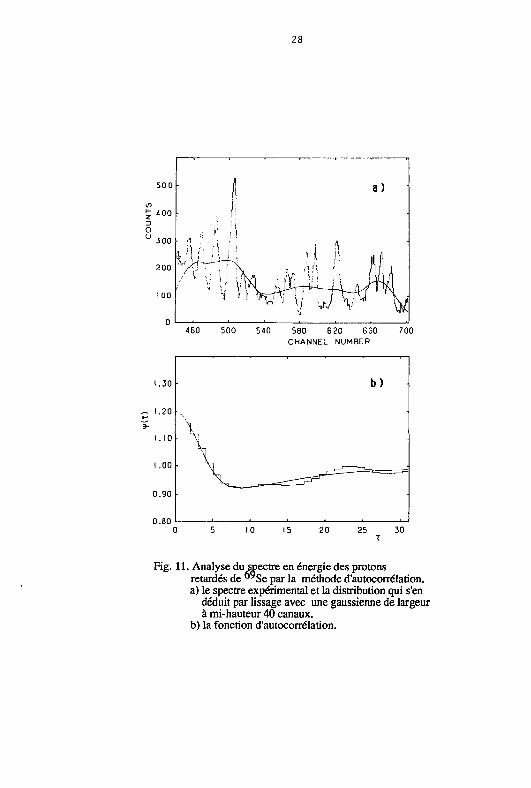
L'analyse du spectre en énergie des protons ( Fig.ll ) par la méthode d'autocorrélation
précédemment décrite révèle un espacement des niveaux compris entre 2,7 et 5,4 keV suivant le
type d'analyse. Des calculs de densité de niveaux effectués dans le formalisme de Gilbert et
Cameron ( Gil.65 ) fournissent un espacement de niveaux ( D|/ 2- 3/2- ) trois fois plus élevé que
celui déterminé par W.Dilg ( Dil.73 ), ce dernier étant plus proche des résultats expérimentaux avec
19
TABLE IV . Transitions gamma attribuées à la décroissance radioactive de ° ySe.
E.u(keV) ly Transitions en coïncidence E;(keV) EfkeV)
66.4 ±0.1 37.6+3.7 98,333,625,911,1700,1911 164 98 2244,2368,2866,3182,3230 3304,3486,3836
97.98 ± .05 100 toutes les transitions sauf celles marquées*
98 0
291.9 ±0.3 2.7 ± 0.3 789 497 332.6 ± 0.4 1.5 ±0.2 66,98,1557 497 164 399.3 ±0.3 5.3±0.3a) 98,1329,1911,1557,2375 497 98 497.4 ±0.5*) 1.5 ±0.2 497 0 625.0 ±0.3 4.0 + 0.4 66,98,164,1329 789 164 691.8 ±0.5 25.2 ±2.5 98,1329 789 98 789.7 ±0.5*) 7.15 ±0.80 789 0 835.7 ± 0.4 2.4 ±0.4 98,1475 934 98 911.2 ±0.4 2.5 ±0.4 66,98 1076 164 977.8 ± 0.4 1.8 + 0.3 98,1457 1076 98 1075.8 ±1.0 4.4 ±0.6 98,333,399 1865 789 1202.3+1.0 0.4 ±0.1 98 1329.6 ±1.0 3.07 ± 0.50 66,98 2119 789 1362.3 ±0.7 1.75 ±0.30 66,98 2151 789 1456.9 ± 0.5 1.72 ±0.30 66,98 2532 1076 1475.9 ± 0.5 1.63 ±0.30 98,836 2408 934 1557.6 ±0.:, ..08 ±0.20 66,98 2346 789 1563.0 ±1.0 0.4 ±0.1 98 1593.0 ±1.0 .98 ± 0.20 98 1691 98 1620.0 ±1.5 2.4 ±0.4 98 2408 789 1646.4 ±1.0 2.13 ±0.30 98 1744 98 1654.5 ± 1.0 1.8 + 0.3 66,98,399,497 2151 497 1691.2 ±1.0*) 1.43 ±0.20 1691 0 1700.5 ± 0.5 1.3 ±0.2 66,98,164 1864 164 1744.4 ±1.0*) 1.0 ±0.2 1744 0 1766.8 ±0.5 6.2 ±0.9 98 1864 98 1848.6+ 1.0 .93 ± 0.20 98 2346 497 1866.0 ±1.0*) .72 ±0.10 1866 0 1911.6 ±1.0 0.8 ±0.2 66,98,399 2408 497 1955.8 ±1.0 0.9 ±0.2 66,98 3030 1076 2052.8 ± 1.0 0.9 ±0.2 98 2151 98 2069.1 ± 1.0 0.4 ±0.1 66,98 3144 1076 2086.0+1.0 .42 ±0.10 98 2188 98 2119.2 ±1.0*) .53 + 0.10 2119 0 2244.6 ± 0.5 .81 ±0.20 66,98 2408 164 2310.2 ±0.5 1.32 + 0.20 98 2408 98 2368.6 ±1.0 .68 ±0.10 66,98 2532 164 2375.6 ±1.0 1.44 ±0.20 2872 497 2435.0 ± 0.5 .20 ±0.05 2352 98 2866.5 ± 0.5 .16 ±0.04 3030 164 2932.4 ±1.0 .3 ±0.06 98 3030 98 3045.9 ±1.0 .72 ±0.10 98 3144 98 3122.0 ±0.7 .35 ±0.07 3220 98 3181.9 ±0.5 .32 ±0.05 66,98 3346 164 3230.0 ± 0.5 .50 ±0.08 66,98 3394 164 3248.7 ±0.7 .30 ±0.05 3346 98 3304.3 ±0.7 .25 ±0.04 66,98 3469 164 3487.0 ±1.0 .13 + 0.03 3651 164 3835.0 ±0.7 .30 ± 0.05 3999 164
3 S c q 3 P O3~+0 33UBSSIOJ33P ap EUisipg -5 - S y
£ i ' 5 < il> 0 64'5 < Oi> 0 '86 55'S 06'E£ 7' 791
£7'S 9'EZ S'684
69'9 5S'I i 'EE6
S5'9 05 ' l 4'SiOI
n'9 86'S 2i'-I 8" 169
7 '774
IE 9 EE'n 0 'S98
li '5 I9'S I9'9 IP l ' 6 l 1
o 've i i 78'5 M S 5? ;
5
8'97E! 8 B072
4 9'5 Û£"
89 5 IV £9 5 EO' 619 II 69'5 K 'ai'S ?::
6'OEoe £ ' 7 7 I E QOZZE
1 t - L. 1 1 - t 1 t....
o ô
»""
-lôSlœ -c ;
-
«"• 0 . - - -S£
- - -
—~ O i l "S£~3
.-Op ^zz^ T SSi»
Q
O * - ^
-- • » si - -- - - -M .-J,-
° t
1%:
i j 6 o | D 3 I + .«*I
3 3 / ^ 0 8 7 9
02
21
TABLE V. Rapports d'embranchements gamma des niveaux de 6 9 A s .
Ex(keV) Ey(keV) L/%) 98 98 100
164.4 66 100
497.2 333 399 497
18.0 ±2.3 64.0 ±3.0 18.0 ±2.3
789.5 292 625 691 789
7.0±1.1 10.211.4 64.513.3 18.3 + 2.4
933.7 836 100
1075.7 911 978
5817 4217
1691.1 1592 1692
40.717.2 59.317.2
1744.4 1646 1744
68.016.4 32.0 ± 6.4
1865.0 1076 1700 1766 1865
35 ±5 10.3 ±1.9 49 ±5 5.7 ± 1.0
2119.1 1329 2119
85.3 ±4.0 14.7 ± 4.0
2151.5 1360 1652 2050
39.4 ±6.1 40.4 ±6.1 20.2 ± 4.6
2184.0 2086 100
2346.8 1557 1850
53.7 + 8.6 46.3 ± 8.6
2408.8 1475 1620 1911 2244 2310
23.4 ±4.2 34.5 ±4.9 11.5 ±2.9 11.6 + 2.9 19.0 ±3.2
2532.7 1456 2367 2434
66.1 ±6.0 26.1 ±5.2 7.8 ±2.3
2872.8 2375 100
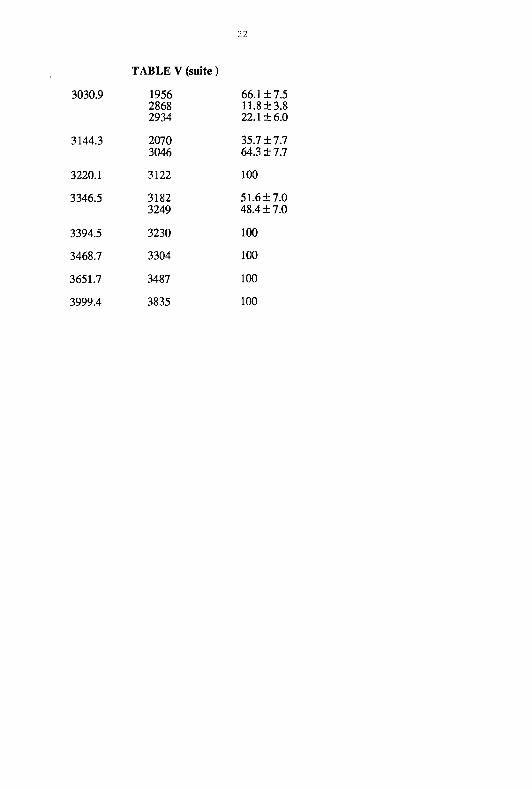
T A B L E V (suite ) 3030.9 1956
2868 2934
66.1 ±7.5 11.8±3.8 22.1 ±6.0
3144.3 2070 3046
35.7 ±7.7 64.3 ±7.7
3220.1 3122 100 3346.5 3182
3249 51.6 ±7.0 48.4 ±7.0
3394.5 3230 100 3468.7 3304 100 3651.7 3487 100 3999.4 3835 100

23
5
TABLE VI. Décroissance B de ""Se. Embranchements B, valeurs de logfgt et de B ( GT ) obtenus pour les niveaux émetteurs gamma de " 9 As.
E x(keV) % B log f0t B(GT) 10
0 <23 >5.77 <613
98 <20 > -.79 <614
164.4 33.9 ±3.3 5 .55 + 0 5 1068+170 -.06
497.2 0.57 ±0.50 7 . 2 0 + - 3 7 24 ±21 -.97
789.5 23.5 ±2.0 5.47+- 0 5 1284 ±120 -.04
933.7 1.55 ±0.30 6 . 5 9 + - 1 0 97 ±22 -.11
1075.7 1.5 +0.5 6 . 5 5 + - 1 3 107 ±40 -.18
1691.1 2.16±0.25 6 . 1 1 + 0 6 294±50 -.07
1744.4 2.8 ±0.3 5 . 9 8 + - 0 6 397 ±70 -.08
1865.0 11.33 + 1.10 5 . 3 1 + - 0 6 1856 ±260 -.06
2119.1 3.23 + 0.42 5 . 7 1 + - 0 7 739 ±120 -.08
2151.5 3.97+ .35 5 . 6 1 + - 0 6 930 ±120
2184.0 .38 ±0.06 6.61 + 0 9 93 ±20 -.10
2346.8 1.8 ±0.2 5 .84 + - 0 7 548 ±86 -.07
2408.8 5.42 ±0.52 5.30 + 0 6 1899 + 270 -.07
2532.7 2.35 ±0.28 5.62 + 0 8 909 ±145 -.08
2872.8 1.3 ±0.2 5 . 6 7 + ' 0 9 810 ±170 -.10
3030.9 1.22 ±0.15 5 .58 + 0 8 997 ±176 -.09
3144.3 1.03 + 0.13 5 .57 + 0 9 1020±188 -.09
3220.1 0.22 ±0.06 6 . 1 9 + - 2 1 244 ±81 -.18
3346.5 0.56 ±0.07 5 .69 + 0 9 774 ±142 -.09
3394.5 0.44 ±0.07 5 . 7 6 + - 1 0 658 ±149 -.11
3468.7 0.22 ±0.04 5 . 9 9 + - 1 0 388 ±86 -.11
3651.7 J.12±0.3 6.11 + n 294 + 75 -.13
3999.4 0.26 ±0.04 5 . 4 7 + - 1 0 1284 ±302
3200 U.5
2400
</)
g 1600 l-
800
E 6* 9 A s(MeV)
Ep(MeV)
Fig. 10. Spectre en énergie des protons retardés de ""Se enregistré au cours de ce travail. Les résultats antérieurs de MacDonald sont présentés en encart.
25
TABLE VII. Décroissance B de w S e . Embranchements B, valeurs de logf0t et de B (GT ) obtenus à partir de l'émission des protons retardés pour les états non liés de 6 9 As .
Energie Niveau Embr. logf0t B(GT)
proton (keV)
dans ""As (keV)
proton (HT 6)
( 10"5 )
PI 1240 4649 23 + 5 6.84+15 -.17
55+18
P2 1337 4747 23 + 6 6.73 +- 1 6
-.18 70 ±23
P3 1459 4871 9.7 ±2.4 6.97+ 1 5
-.17 40 ±13
P4 1522 4935 25 ± 6 6 4 9 + . 1 3 -.16
122 ±37
P5 1570 4984 10+2 6.86 +•" -.17
52 ±17
P6 1634 5050 11 + 2 6-75+-Aâ 67 ±21
P7 1685 5102 17±4 6.50+- 1 4
-.16 120 ±36
P8 1744 5161 24 + 5 6.29+-!3 -.15
194 ±57
P9 1810 5228 38 ±8 6.03 +•« 353 ±102
P10 1855 5273 9.8 ± 2.0 6.59+'13
-.15 97 ±28
Pli 1896 5314 14.5 + 3.2 6.39 +-Ï3 -.15
155 ±45
P12 1948 5369 9.8 + 2.2 6 5 1 '.il 117±33
P13 1996 5416 11+2 6.43+- 1 3
-.14 140 ±39
P14 2032 5452 12±3 6.38+- 1 2
-.15 158 ±45
P15 2059 5480 11 ±2 6.38 +-12 158 ±45
P16 2111 5533 17±4 6.14+-12 -.16
274 ± 82
P17 2146 5570 16 + 4 6.14+!3 -.15
274 ± 79
P18 2183 5606 5±1 6.60+J3 95 + 27
P19 2232 5657 26±6 5.88+- 1 2
-.15 500 ±145
P20 2272 5695 7±2 6.42+- 1 2
-.16 144 + 43
P21 2318 5741 14±3 6.07 +-13 -.16
322 ± 97
26
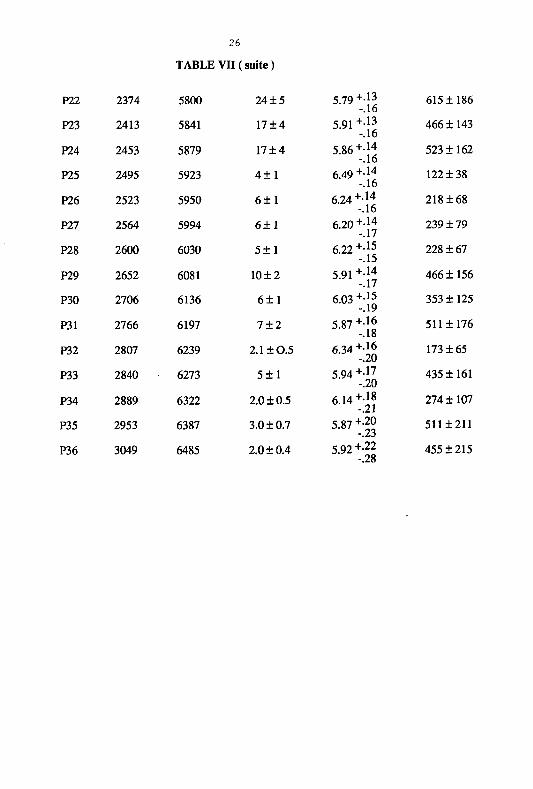
TABLE VII (suite)
P22 2374 5800 24 + 5 5.79+-3 -.16 615+186
P23 2413 5841 17±4 5.91 +•« -.16 466 ±143
P24 2453 5879 17±4 5.86 +-Jj -.16 523 ±162
P25 2495 5923 4±1 6.49+-Jj -.16 122 ± 38
P26 2523 5950 6±1 6 M t : i 4 6 218 + 68
P27 2564 5994 6±1 6.20 +- 1 4
-.17 239 ± 79
P28 2600 6030 5±1 6.22 +-J5 228 ±67
P29 2652 6081 10±2 5.91 +- 1 4
-.17 466 ±156
P30 2706 6136 6±1 6.03 +- 1 5
-.19 353 ±125
P31 2766 6197 7±2 5.87 ^ 511 ±176
P32 2807 6239 2.1±0.5 6 - M + l o 173 ± 65
P33 2840 6273 5±1 5.94+-17 -.20 435 ±161
P34 2889 6322 2.0 ±0.5 6.14+18 -.21
274 ±107
P35 2953 6387 3.0 ± 0.7 5.87+-20 -.23 511 ±211
P36 3049 6485 2.0 ±0.4 5.92 +-22 -.28 455 ±215
27
D j/2" 3/2- = 18 et 3 keV pour 4,5 et 6,5 MeV d'énergie d'excitation dans le noyau ° y As
( Table VIII ).
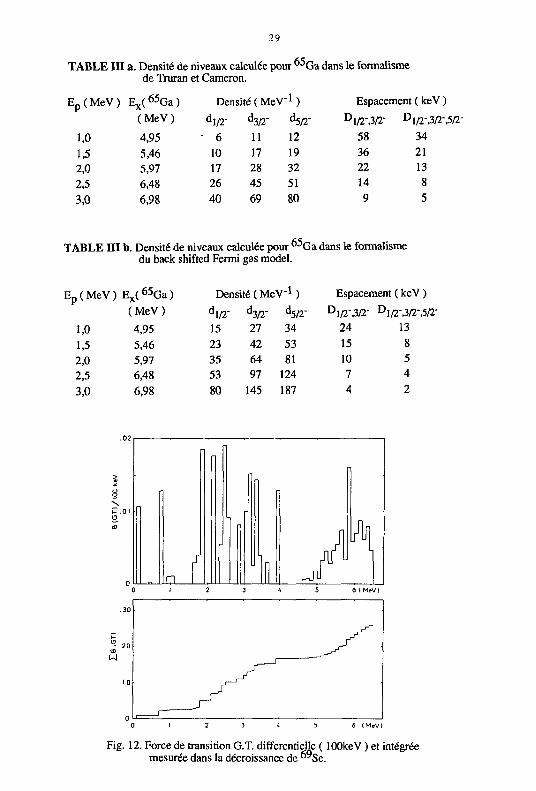
La force de transition G.T. a été établie sur 6,5 Mev d'énergie dans 69 A s ( Fig. 12 ) avec
XB( GT ) = 0,26 ce qui représente 8,6% de la règle de somme Sg_ - S g + = 3. Des valeurs
voisines ont été déterminées par Vierinen ( Vie. 87 ) pour le noyau "->Ge a u t re isotope T z = 1/2.
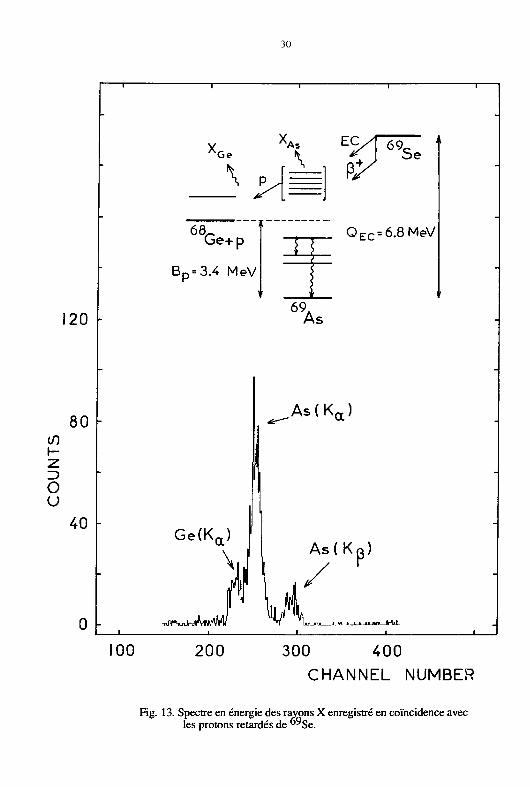
La technique de mesures de coincidence proton - rayon X, pour la détermination de la durée de
vie des niveaux émetteurs proton dans le domaine de 10" 1 6 seconde, a été initiée par Hardy et
développée à Chalk River; elle a été utilisée depuis par différents auteurs ( Asb.78, Asb.81 ). Le
principe de la méthode est illustré sur la figure 13. La décroissance B + de °^Se est en compétition
avec le processus de capture électronique qui prédomine pour les transitions de faible énergie. Les
niveaux non liés dans sont ainsi peuplés par capture électronique, une lacune électronique
étant alors crée dans le cortège du noyau émetteur. Si le rayon X de réarrangement est émis avant le
proton son énergie correspond à celle de l'élément émetteur et si le rayon X est émis après le proton
son énergie signe la réorganisation du cortège de l'élément fils. Si le temps de remplissage de la
lacune et la durée de vie du niveau émetteur proton sont comparables, les intensités d'émission des
deux raies X sont voisines, on peut alors extraire la durée de vie du niveau non lié du rapport
d'intensité des deux raies. Ces données permettent également d'obtenir des informations sur les
largeurs gamma et proton des niveaux émetteurs offrant ainsi une contrainte importante aux
prévisions théoriques pour l'interprétation du spectre de particules.
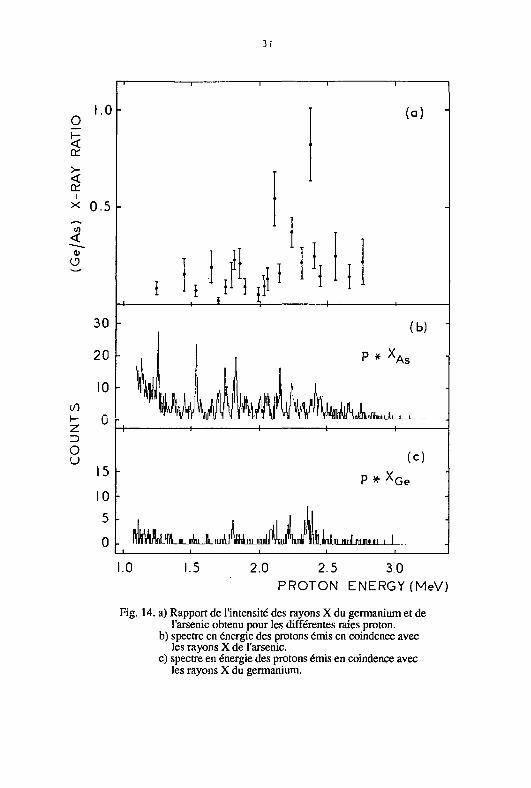
L'enregistrement du spectre en énergie des protons en coïncidence avec les rayons X consécutifs
à la capture électronique dans °^Se a permis de déterminer le rapport
( K a +Kg ) Ge / ( K a + Kg ) As en fonction de l'énergie proton ( Fig. 14a ). Sur les figures
14b et 14c sont présentés les spectres de protons en coïncidence avec les rayons X de l'arsenic et
du germanium émis lors du réarrangement du cortège électronique. On remarque que quatre
groupes de raies protons sont issus de niveaux émetteurs ayant une durée de vie plus courte que
l'ensemble des états non liés ( publication III ). En effet on montre que lors de la compétition de
deux lois de désintégration exponentielles, l'une concernant la durée de vie du niveau émetteur T
l'autre le remplissage de la lacune x on a la relation T. = t X^ s /XQ e . La durée de vie de la lacune
étant connue ( x x= 2,86.10"16s ) une contribution importante des rayons X du germanium indique
que les protons sont issus de niveaux de durée de vie plus courte que 3.10~16s. Si le rapport
X Q C / X ^ s résulte de la contribution de plusieurs niveaux la valeur élevée de celui-ci indique la
présence d'au moins un niveau à vie courte.
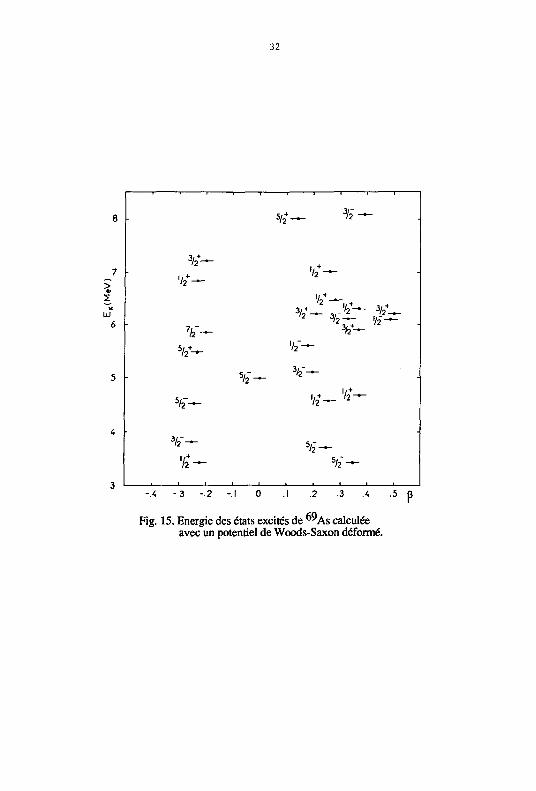
Des calculs effectués par J. Dudek dans le cadre du modèle en couche avec un potentiel de
Woods-Saxon déformé pour les états excités de 6 9 A s indiquent la présence de deux catégories de
28
460 500 540 580 620 S60 700 CHANNEL NUMBER
Fig. 11. Analyse du spectre en énergie des protons retardés de ""Se par la méthode d'autocorrélation. a) le spectre expérimental et la distribution qui s'en
déduit par lissage avec une gaussienne de largeur à mi-hauteur 40 canaux.
b) la fonction d'autocorrélation.
29
TABLE i n a. Densité de niveaux calculée pour 6 5 G a dans le formalisme de Truran et Cameron.
E p ( M e V ) E x ( 6 5 G a ) Densité ( MeV - 1 ) Espacement ( keV ) (MeV) dl/2" d3/2" d5/2" Dl/2",3/2- Dl/2-,3/2-,5/2
1,0 4,95 - 6 11 12 58 34 1,5 5,46 10 17 19 36 21 2,0 5,97 17 28 32 22 13 2,5 6,48 26 45 51 14 8 3,0 6,98 40 69 80 9 5
TABLE m b. Densité de niveaux calculée pour 6 5 G a dans le formalisme du back shifted Fermi gas model.
E p ( MeV ) E x ( 6 5 G a ) Densité (MeV" 1) Espacement ( keV ) (MeV) dl/2" d3/2" d5/2" Dl/2",3/2- Dl/2-,3/2-,5/2
1,0 4,95 15 27 34 24 13 1,5 5,46 23 42 53 15 8 2,0 5,97 35 64 81 10 5 2,5 6,48 53 97 124 7 4 3,0 6,98 80 145 187 4 2
V. o i n
n f [ 1 y rill.
Fig. 12. Force de transition G.T. différentielle ( lOOkeV ) et intégrée mesurée dans la décroissance de ""Se.
30
y XAs EC 69,
?y Se
68-Ge+p
Bp=3.4 MeV
i
68-Ge+p
Bp=3.4 MeV S l
î
Q E C = 6.8MeV
69.
Ge(K a ) [
A s ( K „ ) a '
As (Ko )
100 200 300 400
CHANNEL NUMBER
Fig. 13. Spectre en énergie des rayons X enregistré en coïncidence avec les protons retardés de "^Se.
31
I.O
g < a: >-<
>< 0.5
10
il O
30
20
10 i/)
£ ° o u
15
10
5
0
(a)
i J I ' M y • l 'un (b)
P * X ,
(c)
P * X Ge
EMMLuUb iJ^^ nUnAiujiiJjujiuLj_L
1.0 1.5 2.0 2.5 3.0 PROTON ENERGY(MeV)
Fig. 14. a) Rapport de l'intensité des rayons X du germanium et de l'arsenic obtenu pour les différentes raies proton.
b) spectre en énergie des protons émis en coindence avec les rayons X de l'arsenic.
c) spectre en énergie des protons émis en coindence avec les rayons X du germanium.
32
-
1 1 r 1 1 1 1
3 /2 — ' / 2 + -
7k- K-5 / 2 + - %'-
. ¥ - V—
5 / 2 " - ' t f - ' ^
3/2"— 5 £ — '£-
1 1 1 1 1
-.4 -.3 -.2 -.1 0 .1 .2 .3 .4
Fig. 15. Energie des états excités de ""As calculée avec un potentiel de Woods-Saxon déformé.
33
niveaux. Dans la fenêtre Qjj-Sp on observe des états moyennement déformés 161=0,2 et très
déformés 6=0.5, qui résulteraient de la coexistence de deux formes dans ""As ( Fig. 15 ). Des
calculs en cours sur les coefficients de transmission des protons issus de ces niveaux fortement
déformés devraient faire apparaître une durée de vie plus courte que celle des autres niveaux
émetteurs. On peut envisager d'étendre cette étude aux noyaux "Ga , ^ K r pour lesquels de fortes
déformations sont prévues dans ce formalisme diéorique. Une situation analogue existe pour les
noyaux N=Z de nombre de masse compris entre soixante et quatre vingt comme 6 4 G e , 6 8 S e , 7 2 K r , 7 6 S r ( Sah.87 ) et 7 4 - 7 6 K r ( Pie.81, Ham.81 ). La présence de grandes déformations
prolate est due à l'existence d'un "gap" en énergie pour les couches avec N ou Z=38, et pour Z plus
faible ( Z=36 ) l'apparition de la forme oblate entraine la coexistence de deux formes.
3) Expériences test menées au GANIL.
Ce paragraphe décrit deux mesures exploratoires menées au GANIL pour tenter d'observer, à
l'aide de la technique du jet d'hélium, des noyaux émetteurs de protons au voisinage de la masse 60
produits par la fragmentation de la cible .
Pour mener cette étude nous avons effectué deux expériences tests 4 "Ar ( 44 A.MeV ) et ^"Ne
( 60 A.MeV ) sur les cibles de 1 8 1 Ta et 5 8 Ni .
Lors de la première expérience ( 44 A.MeV ), nous avons utilisé une chambre à réaction
réalisée à Orsay comprenant une fenêtre en nickel ( lOjim ) et un ensemble de trois cibles identiques
d'épaisseur 10|im pour ™Ni et 5 Jim pour *°'Ta. Un capillaire de 10 m de long et de diamètre
intérieur 1mm reliait la chambre de réaction au dérouleur de bande ( CRN Strasbourg ) équipé
d'une station de mesure. Un compteur à barrière de surface ( 150 (im, 300 mm 2 ) détectait les
particules dans un angle solide de 30% de 4TC en regard d'un compteur 6 mince et d'un détecteur de
germanium intrinsèque.
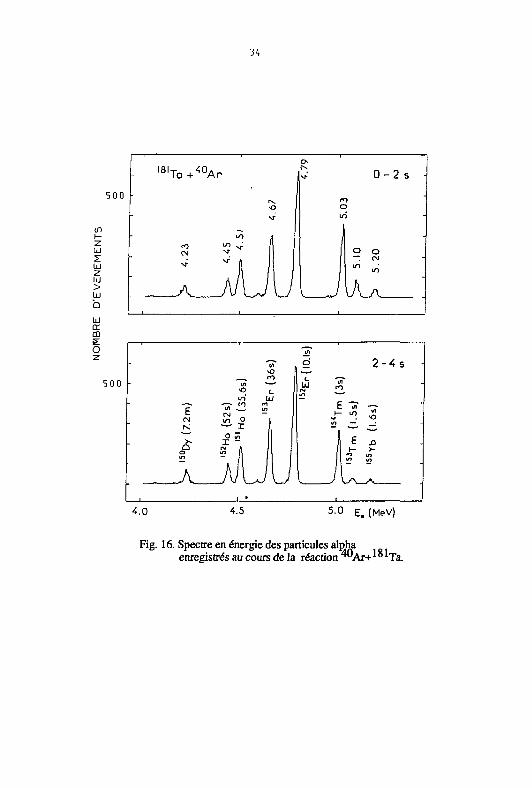
Avec les cibles de ' ^ T a ( temps d'irradiation : 100 mn ), les spectres de particules alpha
enregistrés en mode multispectre 2x2s que nous avons obtenus sont reportés sur la figure 16. Les
raies observées sont attribuées aux noyaux de masse 150 < A <155 mis en évidence précédemment
(Del .82) ,e tà 1 5 5 Yb.
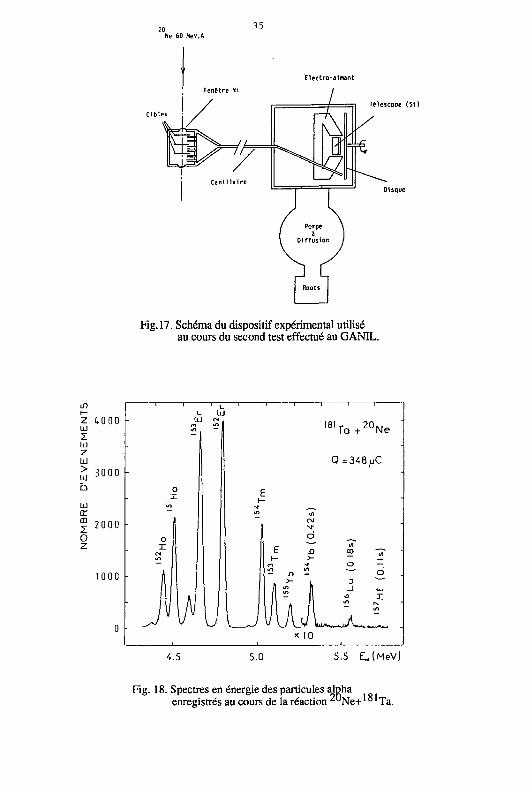
L'ensemble du dispositif expérimental utilisé lors de la seconde expérience ( "Ne 60 A.MeV )
est présenté schématiquement sur la figure 17. La chambre à réaction est reliée à l'aide d'un
capillaire en téflon de diamètre intérieur 1,06 mm et de longeur 1,8 m à une chambre de détection.
Celle-ci comporte un système de collection appelé "roue" ( réalisé à Strasbourg ) qui se compose
d'un disque en aluminium, mis en mouvement par un moteur pas à pas ( déplacement angulaire de
60° en
125 ms ) commandé par un microprocesseur. Sur le disque sont fixés six collecteurs en
mylar de 2,5 u.m d'épaisseur à 60° les uns des autres. A 60° du point de collection, se trouve le
34
l 8 l Ta +
4 0 A r
1 *«" - V . o 2 - 4 s •
-o h
_ m —»
5.6s
LU to
m
£ v^2 H- m
7.2 o o |
X»
m —
0 ^ 0 ^ J £ >. x - | J £ J3
50C
- I\ 1 [ I m JI m >-
A
_A_ A M J u . • •
4.0 4.5 5.0 E > (M eV)
Fig. 16. Spectre en énergie des particules alpha enregistrés au cours de la réaction ^"Ar+'°'Ta.
T5
Electro-aimant
Télescoce i
Disque
Fig. 17. Schéma du dispositif expérimental utilisé au cours du second test effectué au GANIL.
~i r~
o X
4.5
Ta + Ne
Q=348^iC
x 10
5.0 5.5 EjMeV)
Fig. 18. Spectres en énergie des particules alpha enregistrés au cours de la réaction 2 0 Ne+'° 'Ta .
36
100
58.. . 20 . . Ni + Ne
O = 571 / J C
60 2 - 4 :
E« = 3.97 MeV
' " T b f T ^ . l h )
NMI UHkiVjMMii^M^^L
~i 1 r-
8 B - 8 B e - 2 o
E« = 3.97 MeV
_ l L_
200 i.00 600 800 NUMERO DU CANAL
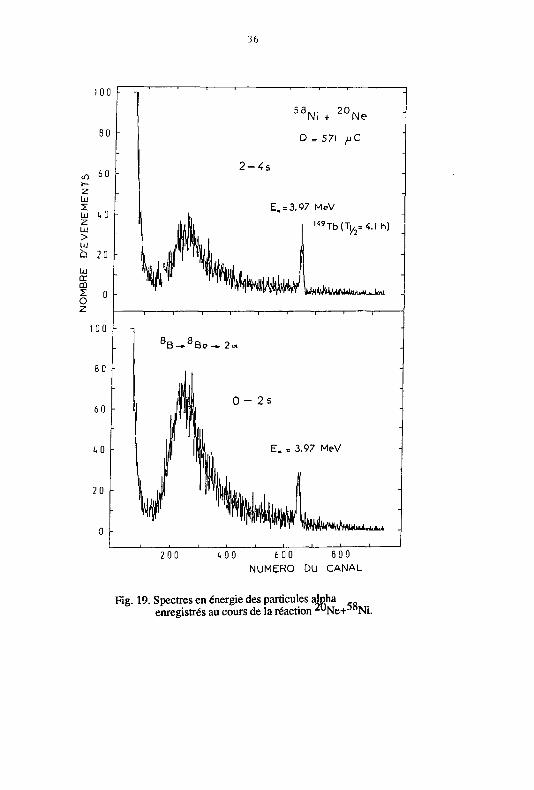
Fig. 19. Spectres en énergie des particules alpha enregistrés au cours de la réaction 2 UNe+- ) 8Ni.
37
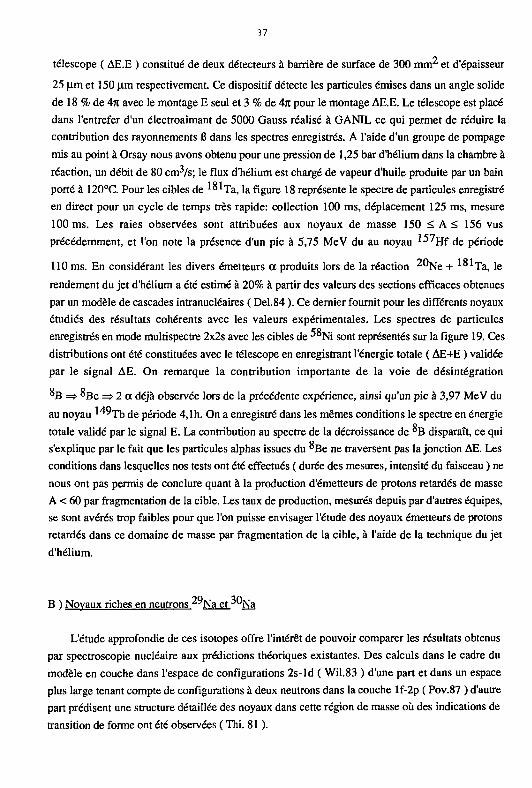
télescope ( AE.E ) constitué de deux détecteurs à barrière de surface de 300 mm^ et d'épaisseur
25 \im et 150 |j.m respectivement. Ce dispositif détecte les particules émises dans un angle solide
de 18 % de 47t avec le montage E seul et 3 % de 4TC pour le montage AE.E. Le télescope est placé
dans l'entrefer d'un électroaimant de 5000 Gauss réalisé à GANIL ce qui permet de réduire la
contribution des rayonnements B dans les spectres enregistrés. A l'aide d'un groupe de pompage
mis au point à Orsay nous avons obtenu pour une pression de 1,25 bar d'hélium dans la chambre à
réaction, un débit de 80 cm-tys; le flux d'hélium est chargé de vapeur d'huile produite par un bain
porté à 120°C. Pour les cibles de l°*Ta, la figure 18 représente le spectre de particules enregistré
en direct pour un cycle de temps très rapide: collection 100 ms, déplacement 125 ms, mesure
100 ms. Les raies observées sont attribuées aux noyaux de masse 150 < A < 156 vus
précédemment, et l'on note la présence d'un pic à 5,75 MeV du au noyau 1 5 7 H f
de période 110 ms. En considérant les divers émetteurs a produits lors de la réaction ^ N e + lol-pa, le
rendement du jet d'hélium a été estimé à 20% à partir des valeurs des sections efficaces obtenues
par un modèle de cascades intranucléaires ( Del.84 ). Ce dernier fournit pour les différents noyaux
étudiés des résultats cohérents avec les valeurs expérimentales. Les spectres de particules
enregistrés en mode multispectre 2x2s avec les cibles de " N i sont représentés sur la figure 19. Ces
distributions ont été constituées avec le télescope en enregistrant l'énergie totale ( AE+E ) validée
par le signal AE. On remarque la contribution importante de la voie de désintégration
°B => °Be =>2a déjà observée lors de la précédente expérience, ainsi qu'un pic à 3,97 MeV du
au noyau ^"Tb de période 4,lh. On a enregistré dans les mêmes conditions le spectre en énergie
totale validé par le signal E. La contribution au spectre de la décroissance de °B disparaît, ce qui
s'explique par le fait que les particules alphas issues du °Be ne traversent pas la jonction AE. Les
conditions dans lesquelles nos tests ont été effectués ( durée des mesures, intensité du faisceau ) ne
nous ont pas permis de conclure quant à la production d'émetteurs de protons retardés de masse
A < 60 par fragmentation de la cible. Les taux de production, mesurés depuis par d'autres équipes,
se sont avérés trop faibles pour que l'on puisse envisager l'étude des noyaux émetteurs de protons
retardés dans ce domaine de masse par fragmentation de la cible, à l'aide de la technique du jet
d'hélium.
B ) Noyaux riches en neutrons ^"Na et % a
L'étude approfondie de ces isotopes offre l'intérêt de pouvoir comparer les résultats obtenus
par spectroscopic nucléaire aux prédictions théoriques existantes. Des calculs dans le cadre du
modèle en couche dans l'espace de configurations 2s-ld ( Wil.83 ) d'une part et dans un espace
plus large tenant compte de configurations à deux neutrons dans la couche lf-2p ( Pov.87 ) d'autre
part prédisent une structure détaillée des noyaux dans cette région de masse où des indications de
transition de forme ont été observées ( Thi. 81 ).
3-1
Un travail expérimental partiel a été effectué par différents auteurs ( Det.79, Gui.84, Zie.81 )
sur la décroissance des noyaux 27-31jj a < Auprès du séparateur ISOLDE ( CERN ) nous avons
étudié l'émission de rayons gamma et de neutrons consécutifs à la désintégration B" de 2^Na et
™Na. Ainsi, la mesure de la force de transition Gamow-Teller limitée jusqu'ici aux noyaux riches
en protons a pu être étendue aux noyaux riches en neutrons.
1) Le noyau 2 9 N a ( publications IV etV).
Pour cet isotope des mesures de coïncidence beta-gamma et gamma-gamma-temps ont été
réalisées afin établir un schéma complet des états liés peuplés dans la décroissance de 2^Na. La
durée de vie des tniveaux de basse énergie a été déterminée par la technique des coïncidences
retardées à l'aide de deux compteurs BaF^. Les détails de la procédure employée sont décrits dans
la publication IV. Nos mesures ont établi clairement l'existence d'un niveau à 54,6 ± 1,0 keV dans
le noyau 2 9 M g , alimenté par plusieurs transitions y ( 1040, 2129, 2560 et 3169 keV ), avec une
durée de vie de 1,83 ± 0,10 ns confirmant ainsi l'hypothèse formulée par Fifield ( Fif.85 ) dans
son interprétation de résultats antérieurs ( Gui.84 ).
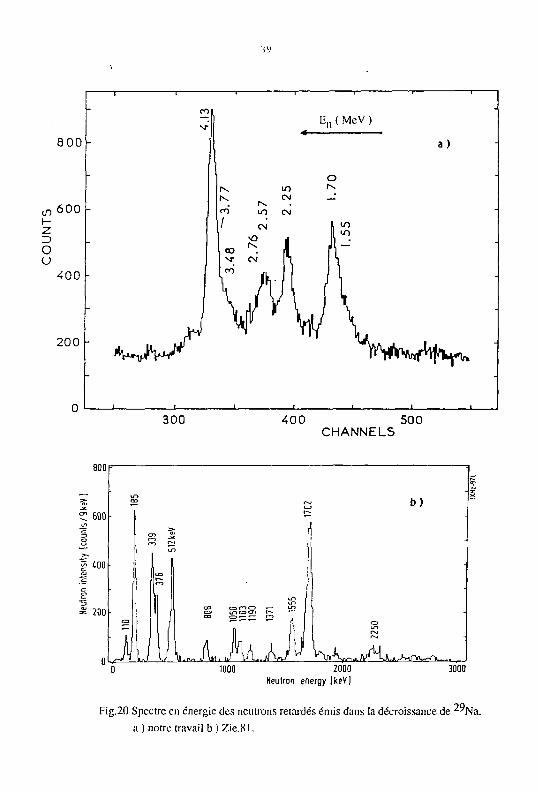
Le spectre à", temps de vol des neutrons obtenu au cours de nos mesures est présenté sur la
figure 20a. En plus des deux raies à 1,7 et 2,25 MeV qui peuvent être reliés à celles obervées à
1,702 et 2,250 par Ziegert ( Fig.20b ) on remarque des structures à plus haute énergie avec en
particulier une forte transition à 4,13 MeV. Toutes les transitions neutron alimentent le niveau
fondamental de 2 °Mg sauf celle de 2,57 MeV détectée en coïncidence avec la raie gamma à
1,47 MeV de désexcitation du premier niveau de 2 °Mg. La comparaison quantitative de nos
résultats avec ceux de Ziegert montre que 50,6% des embranchements neutrons conespondent à
des particules d'énergie supérieure à 1,7 MeV.
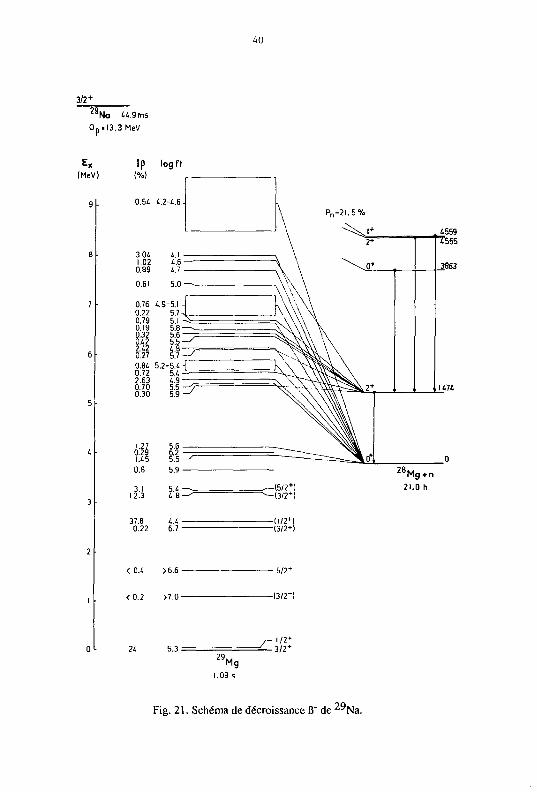
Le schéma de décroissance du 2 9 N a vers les niveaux liés et non liés de 2 9 M g e s t porté sur la
figure 21. Pour établir l'énergie d'excitation et les rapports d'embranchements 6 des niveaux non
liés dans 2 9 M g , nous avons utilisé la partie basse énergie du spectre neutron observée par Ziegert et
la partie haute énergie déterminée dans nos mesures, les deux domaines étant normalisés par
l'intensité de la raie à 1,7 MeV présente dans les deux expériences. L'intensité d'alimentation B des
niveaux émetteurs est obtenue en normalisant l'intensité totale neutron à la probabilité d'émission
d'un neutron P l n = 21,5% ( Gui.84 ).
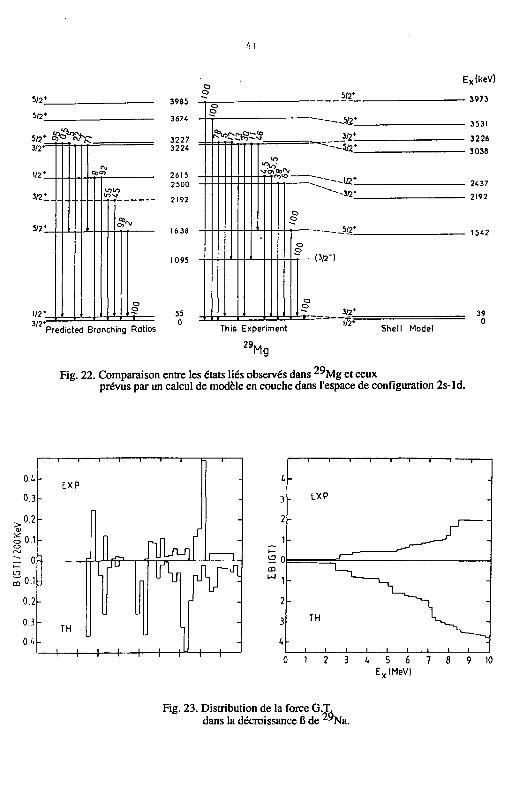
Les schémas de désexcitation radiative expérimentaux et calculés ( Wil.83 ) pour les niveaux liés
de 2 "Mg sont indiqués sur la figure 22; on observe un accord remarquable pour l'énergie
d'excitation et les rapports d'embranchement gamma. Le niveau à 1095 keV non reproduit par le
calcul est vraisemblablement de parité négative car il n'est pas alimenté par désintégration B de 2 "Na mais observé dans la voie un neutron de ™Na ( voir plus loin ). Les spins et les parités des
niveaux fondamentaux des noyaux 2 "Na et 2^Mg étant iK = 3/2 + ( Gui.84 ), le caractère permis de
la transition B qui alimente l'état à 55 keV implique un spin et une parité l /2 + , 3/2 + ou 5/2+ pour ce
niveau; la mesure de la durée de vie permet d'exclure la valeur 5/2 ( publication IV ). Les calculs
39
8 0 0
to Z
o u
600 -
400
200 -
300 400 500 CHANNELS
1000 2000 Neutron energy IkeV)
3000
Fig.20 Spectre en énergie des neutrons retardés émis dans la décroissance de 29Na. a ) notre travail b ) Zie.81.
40
3/2 +
2 9 N o U.9ms Op.l3.3MeV
Ip log ft
Fig. 21. Schéma de décroissance B" de ^"Na.
«1
5/2*.
5/2*
S/2* ftSfoy 3/2'
1/2 *_
3/21
5/2*
1/2*. 3/2
Predicted Branching Ratios
3965
3674
3227 3224
2615 2 500
55 0
5/2*
&o£3§::$_ - 1 :~~-U2.*_ "~"^-3l2.*_
5^*_
- (3/2")
L 3/2*
This Experiment 1/2*
29 Mg
Shell Model
Ex(keV)
- 3973
3531
3226 3038
2437
2192
1542
39 0
Fig. 22. Comparaison entre les états liés observés dans ^Mg et ceux prévus par un calcul de modèle en couche dans l'espace de configuration 2s-ld.
O.i.
• • r - i 1 l l l i
EXP
1
0.3 - -
> 0 2
eu
S o.i o
-
JW 1 1
50.1 Ll V\n nf \n
0.2 r1
0.3 TH
-
OA — H 1 1 1 1 1 1- u—\—1—
L , t ,...,.....,.. i i • - i 1
3 EXP -
2
_ 1
2
_ 1 J _ _ - — S
1= n i—"~
J _ _ - — S
IB
-
2 * ~ ^ - i
3 TH ^ ^
U i i i i i t 1 1
1 2 3 7 8
Fig. 23. Distribution de la force G.T. dans la décroissance 8 de ^Na .
42
100
\2 80 z D o U 6 0
40
20
a)
E n (MeV)
300 400 500 CHANNELS
BOO - •
- f= b) -
600 - 1 •
400 - CD
- f l 1 200 - ~
co u-> to en r-. us r—. ira
J W [jt^ %7V^IJUMA^ ' 500 1000 1500 2000
Heutron energy [keVJ
Fig.24 Spectre en énergie des neutrons retardés émis dans la décroissance de ^Na. a ) notre travail b ) Zie.81.

43
Ex(Mev) logft Ex (liev) logft
5.41 509 5.02 497 4.41
3.54 3.46
2.47
1.82 1.79
5.3 5.5 5.3 5.0 6.0
6.5 5.8
6.0
6.1 >70
5.24 5.19 4.80 4.69
63 46 5 1 6 1
1.48 6 0
3.44 5.0
1.67 5.4
30
0.0
Mg (this work) 30
o.o
Mg (sd shell calculation)
Fig. 25. Comparaison entre les états liés observés dans ™Mg et ceux prévus par un calcul de modèle en couche dans l'espace de configuration 2s-ld.
8 9 10 11 12 13 \A 15 Z
GROUND STATE DOMINATED BY MORE THAN 60X
BY CONFIGURATIONS WITH TWO NEUTRONS IN THE t 7 / 2 SHELL
REGION OF TRANSITION.
GROUND 5TATE DOMINATED BY MORE THAN 60!t
BY s d 5HELL CONFIGURATION
Fig. 26. Carte des configurations des états fondamentaux dans la région de ^"Na établie par Povès ( Pov.87 ).
44
Ex (MeV)
4
3
i l
i
3/2"
7/2" '*•
3 / 2 ; . . -
3 / 2 > " 7/2 ..--"
3/2"
3/2" 7/2',
i l «,
'. 2266(1/2.3/2") k 2
3/2"
3/2" 7/2',
i l «,
'. 2266(1/2.3/2") k
1
\\K31 (7 /2 - ) \I095 (3/2")
0 3/2 +
3 5 A r 18 17
3/2 +
33-16 17
3 ,s 3/2 + 3/2^
29 KX 1 Mg 17 12 17
Fig. 27. Evolution de l'énergie d'excitation du doublet He narité nésative 3/2",7/2" dans les isotones N=17.
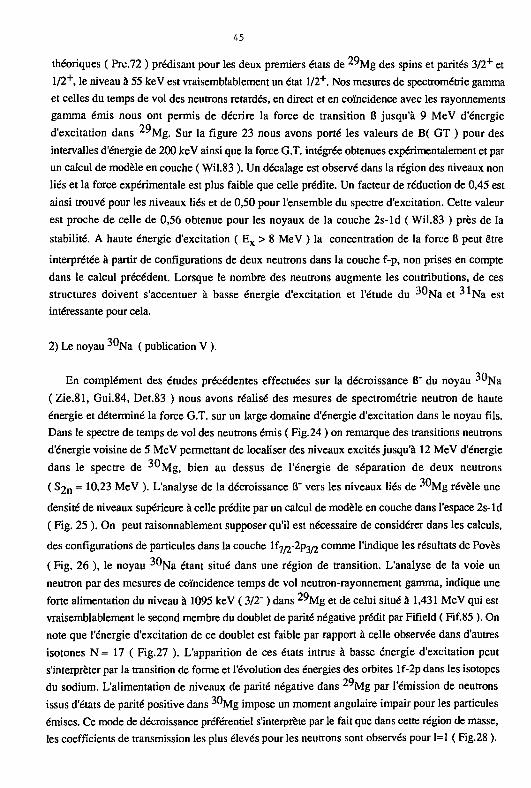
Fig. 28. Variation avec l'énergie et le moment angulaire des coefficients de transmission des neutrons émis pour A=29,30 ( Aue.62 ).
45
théoriques ( Pre.72 ) prédisant pour les deux premiers états de ^ M g des spins et parités 3/2 + et
l /2 + , le niveau à 55 keV est vraisemblablement un état l /2 + . Nos mesures de spectrométrie gamma
et celles du temps de vol des neutrons retardés, en direct et en coïncidence avec les rayonnements
gamma émis nous ont permis de décrire la force de transition B jusqu'à 9 MeV d'énergie
d'excitation dans ^ M g . Sur la figure 23 nous avons porté les valeurs de B( GT ) pour des
intervalles d'énergie de 200 keV ainsi que la force G.T. intégrée obtenues expérimentalement et par
un calcul de modèle en couche ( Wil.83 ). Un décalage est observé dans la région des niveaux non
liés et la force expérimentale est plus faible que celle prédite. Un facteur de réduction de 0,45 est
ainsi trouvé pour les niveaux liés et de 0,50 pour l'ensemble du spectre d'excitation. Cette valeur
est proche de celle de 0,56 obtenue pour les noyaux de la couche 2s-ld ( Wil.83 ) près de la
stabilité. A haute énergie d'excitation ( E x > 8 MeV ) la concentration de la force B peut être
interprétée à partir de configurations de deux neutrons dans la couche f-p, non prises en compte
dans le calcul précédent. Lorsque le nombre des neutrons augmente les contributions, de ces
structures doivent s'accentuer à basse énergie d'excitation et l'étude du -'"Na et -''Na est
intéressante pour cela.
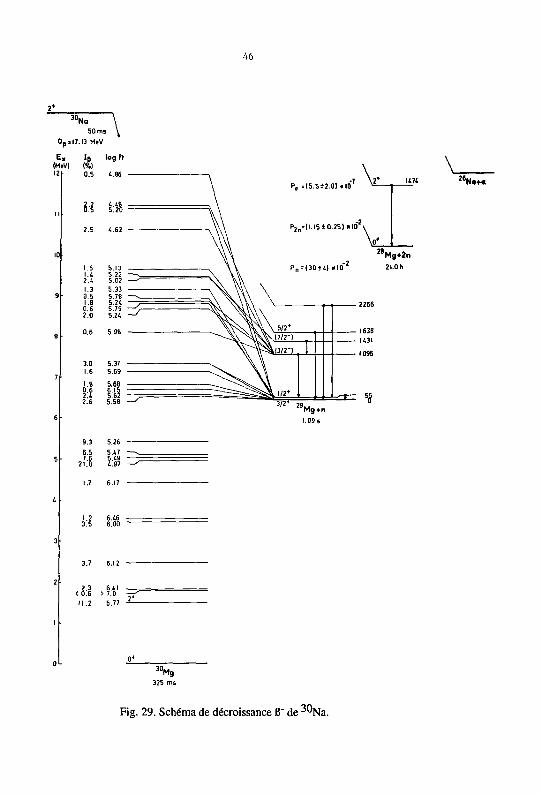
2) Le noyau 3°Na ( publication V ).
En complément des études précédentes effectuées sur la décroissance B" du noyau ™Na
( Zie.81, Gui.84, Det.83 ) nous avons réalisé des mesures de spectrométrie neutron de haute
énergie et déterminé la force G.T. sur un large domaine d'énergie d'excitation dans le noyau fils.
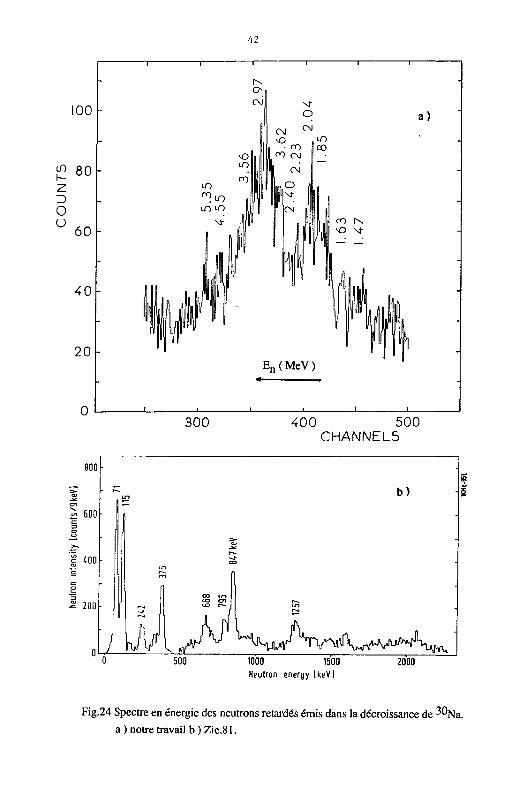
Dans le spectre de temps de vol des neutrons émis ( Fig.24 ) on remarque des transitions neutrons
d'énergie voisine de 5 MeV permettant de localiser des niveaux excités jusqu'à 12 MeV d'énergie
dans le spectre de ™Mg, bien au dessus de l'énergie de séparation de deux neutrons
( S2 n = 10,23 MeV ). L'analyse de la décroissance B" vers les niveaux liés de ^"Mg révèle une
densité de niveaux supérieure à celle prédite par un calcul de modèle en couche dans l'espace 2s-ld
( Fig. 25 ). On peut raisonnablement supposer qu'il est nécessaire de considérer dans les calculs,
des configurations de particules dans la couche lf-j/2-2py2 c o m m e l'indique les résultats de Povès
( Fig. 26 ), le noyau ™Na étant situé dans une région de transition. L'analyse de la voie un
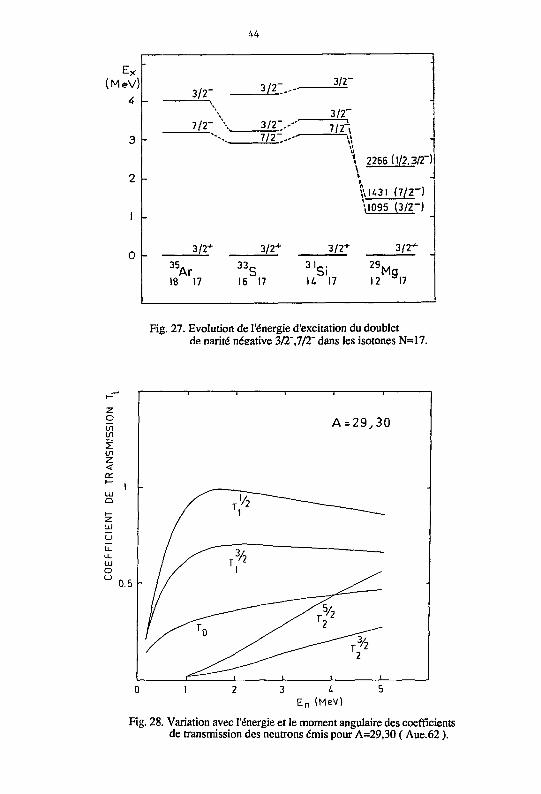
neutron par des mesures de coïncidence temps de vol neutron-rayonnement gamma, indique une
forte alimentation du niveau à 1095 keV ( 3/2" ) dans ^ M g e t de celui situé à 1,431 MeV qui est
vraisemblablement le second membre du doublet de parité négative prédit par Fifield ( Fif.85 ). On
note que l'énergie d'excitation de ce doublet est faible par rapport à celle observée dans d'autres
isotones N= 17 ( Fig.27 ). L'apparition de ces états intrus à basse énergie d'excitation peut
s'interpréter par la transition de forme et l'évolution des énergies des orbites lf-2p dans les isotopes
du sodium. L'alimentation de niveaux de parité négative dans 2 9 M g par l'émission de neutrons
issus d'états de parité positive dans ™Mg impose un moment angulaire impair pour les particules
émises. Ce mode de décroissance préférentiel s'interprète par le fait que dans cette région de masse,
les coefficients de transmission les plus élevés pour les neutrons sont observés pour 1=1 ( Fig.28 ).
46
2* 3°Na \
50 ms ^ Op » 17.13 MeV
E (M 12
> IB log « tV) | * |
0.5 4.86
II 2.2 4.48 0.5 5.20
2.5 4.62
1.3
3.0 1.6
8
M §
4:1 S3
2.3 6.41 < 0.6 > 7.0
*»n1.in « —
V °N*+«
J U M g 325 ms
Fig. 29. Schéma de décroissance B" de ^"Na.
47
1
Na — * Mg
1 i
- _ TH.
•
EXP. _
-
-2 +
-r -V
-' -----
-
2 2 +
::...
2 +
"
2 +
::...
2 +
" i l " 1 I I I l _ .20 10 0 10 20
% BRANCHING STRENGTH
Fig. 30. Comparaison de la force de transition 6 expérimentale et calculée dans l'espace 2s-ld pour la décroissance de ^"Na.
4H
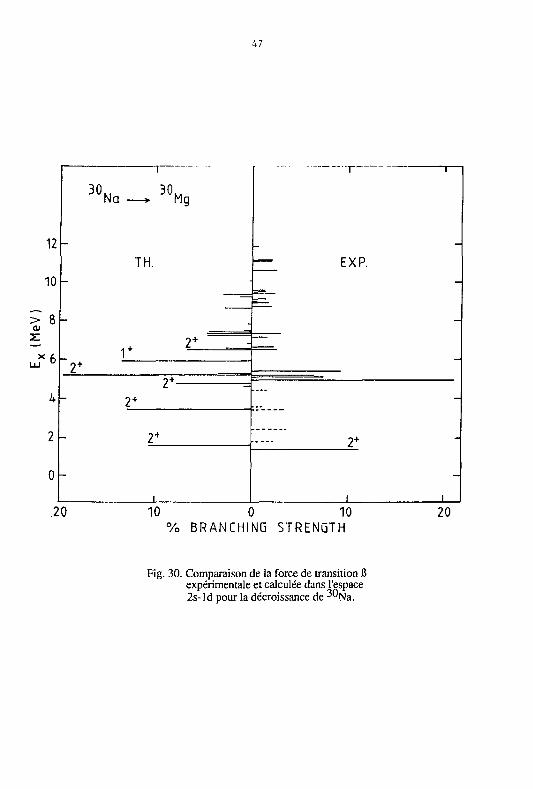
L'ensemble des résultats obtenus sur la décroissance 8" de ™Na est présenté sur la figure 29. Nous avons porté sur la figure 30 les valeurs expérimentales et calculées ( Wil.83 ) de la force de transition B. Dans l'espace de configuration 2s-ld la force calculée est surestimée à basse énergie d'excitation et ne reproduit pas la force expérimentale au dessus de 10 MeV dans ™Mg.
C) Calcul des logfp et logf | des transitions B d'énergie comprise entre 10 et 25 MeV
des éléments 6 < Z < 38. ( publication VI )
Le domaine d'investigation des noyaux exotiques ne cesse de s'élargir, comme en témoignent les nombreux résultats obtenus récemment dans différents laboratoires ( CERN, GANIL, GSI...). Lorsqu'on s'éloigne de la ligne de stabilité, l'énergie mise en jeu dans les transitions radioactives B + et B" va en augmentant ( Wap.85 ). Ainsi, dans l'étude de la décroissance des isotopes 29,30^., ( Bau.87 ) et 4 9 > 5 0 K ( Mie.86 ), nous avons été conduits à évaluer les quantités log f pour des transitions d'énergie supérieure à 10 MeV, au delà des valeurs tabulées par N.B. Gove et M.J. Martin ( Gov.71 ). Reprenant le formalisme développé par ces auteurs, nous avons étendu le calcul
des valeurs de log f0 et log fj pour les décroissances B jusqu'à une énergie de 25 MeV.
Les expressions analytiques de la fonction f incluant les effets d'écran et de taille finie du noyau utilisées sont les suivantes : - pour les transitions permises :
f Q'K Z, W 0 ) = j , W 0 p' W (W 0 -W) 2 à*' ( Z.W ) dW
-pour les transitions interdites au premier ordre :
f / " ( Z ,W 0) - I , W 0 p' W (W 0 -W) 2
[( wr,-w ) 2 y~ ( z,w ) • p1 y~( l y )] dw
avec
W = (E c + m 0 c 2 ) / m 0 c 2
W = W + V pour 13* ,V étant la correction d'écran
p' = / ( W ' 2 - l )
f et g étant les fonctions d'ondes radiales du continuum de l'électron et du positron évaluées au rayon nucléaire donné par :

R = (0,002908 A 1 / 3 - 0,002437 A " 1 / 3 )li /m 0 c
où A est le nombre de masse.
Les valeurs de log f0 et de log f i des transitions 6 + et B" ont été tabulées ( publication VI ) pour
les éléments situés entre le carbone et le strontium, ceci pour des énergies 6 comprises entre 0,1 et
25 MeV. Le nombre de masse pour chaque élément est choisi au milieu du domaine d'instabilité par
rapport à l'émission S + ou 6". Une variation de ± 10% de ce paramètre ne modifie pas de manière
significative les valeurs calculées.
51
CHAPITRE n
MESURES DES EXCES DE MASSE DE 4 9 - 5 0 K , 40,42 c l e t 1 4 7 G d
La connaissance de la masse des noyaux loin de la stabilité intéresse des disciplines
extranucléaires comme l'astrophysique et constitue dans notre domaine une contrainte forte pour les
calculs macroscopiques et microscopiques de cohésion nucléaire et de ce fait la modélisation du
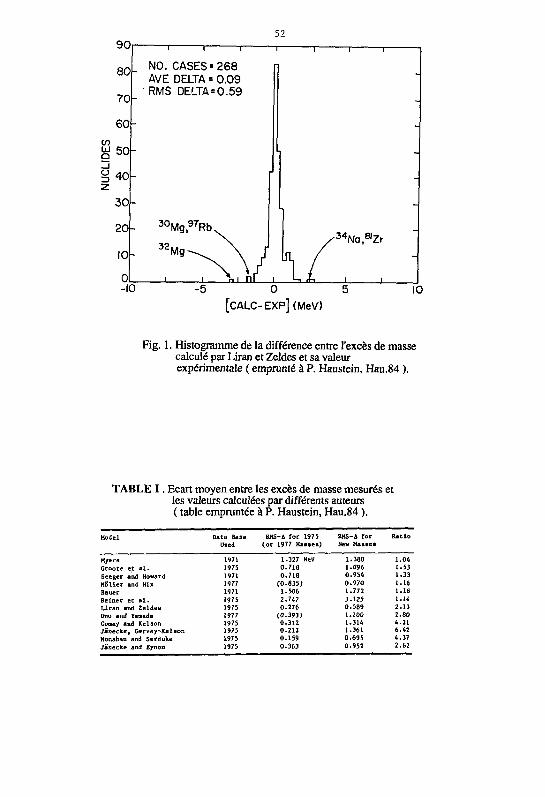
noyau atomique. Ainsi que le montre une analyse de P. Haustein ( Hau.84 ) concernant le pouvoir
prédictif des différents modèles élaborés jusqu'ici, des écarts sensibles ( Fig.l ) et dépendant du
modèle ( Table I ) sont observés entre les excès de masse calculés et leurs valeurs expérimentales,
lorqu'on s'éloigne de la stabilité.
La méthode la plus directe pour mesurer la masse du noyau atomique consiste à utiliser un
séparateur de masse à haute résolution ( Kla.73, Thi.76, Eph.80 ), mais des limitations sont
introduites par la sélectivité chimique des sources et par le faible rendement lorsque l'on se situe
loin de la stabilité. Au cours de ce travail nous avons utilisé deux autres méthodes de mesure de
masse, la première consiste à déterminer le bilan d'énergie de la désintégration 6" ( Qg ), la seconde
met à profit les mesures de cinématique dans les reactions de transfert de quelques nucléons.
A ) Mesure des bilans d'énergie Og pour^""^"K et 40-42g.
Les mesures des bilans d'énergie Qg pour ces isotopes ont été effectuées auprès du séparateur
ISOLDE au CERN et font suite à un travail de spectroscopie effectué par notre équipe sur les
noyaux riches en neutrons 47-52 K ( HUC.81, Huc.85, Rac.83, Car.82 ) et 40 -43 c l ( Rlo.72,
Huc.81 ). Les isotopes issus du séparateur sont guidés vers une station de mesure équipée d'un
dérouleur de bande. L'énergie des rayonnements 6" est enregistrée à l'aide d'un télescope constitué
d'une feuille de scindllateur d'épaiseur 0,5 mm ( AE ) et d'un scintillateur cylindrique ( NE 102 ) de
110 mm de diamètre et 100 mm de long ( E ). Les électrons sélectionnés par le compteur AE sont
détectés sous un angle solide de 640 msr et leur énergie est mesurée avec une résolution de 300 keV
à une énergie de 973 keV ( 2 0 7 B i ).
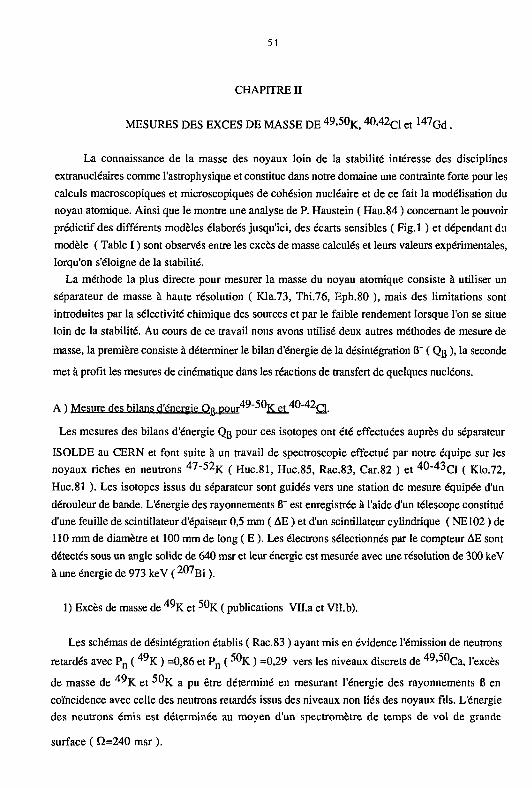
1) Excès de masse de 4 9 K et 5 0 K ( publications Vll.a et Vll.b).
Les schémas de désintégration établis ( Rac.83 ) ayant mis en évidence l'émission de neutrons
retardés avec P n ( 4 9 K ) =0,86 et P n ( 5 0 K ) =0,29 vers les niveaux discrets de 4 9 > 5 0 Ca, l'excès
de masse de 4 " K et ->"K a pu être déterminé en mesurant l'énergie des rayonnements 6 en
coïncidence avec celle des neutrons retardés issus des niveaux non liés des noyaux fils. L'énergie
des neutrons émis est déterminée au moyen d'un spectromètre de temps de vol de grande
surface ( Î2=240 msr ).
52 90
80
70
60 V) ^ 50
3 2
30-
20
10-
-10
NO. CASES = 268 AVE DELTA = 0.09 RMS DELTA = 0.59
3 0Mg, 9 7Rb ' 3 4 Na, 8 l Zr
-5 0 5 [cALC-EXP](MeV)
10
Fig. 1. Histogramme de la différence entre l'excès de masse calculé par Liran et Zeldes et sa valeur expérimentale ( emprunté à P. Haustein, Hau.84 ).
TABLE I . Ecart moyen entre les excès de masse mesurés et les valeurs calculées par différents auteurs ( table empruntée à P. Haustein, Hau.84 ).
Model Data Base RHS-A for 1975 RHS-4 for Ratio Uaed (or 1977 Haaaea) New Maaaek
Hyers 1971 1.327 HeV 1.380 1.04 Groote et a l . 1975 0 .718 1.096 1.53 Seeger and Howard 1971 0 .718 0 .954 1.33 Hol ler and Mx 1977 (0 .835) 0 .970 1.16 Bauer 1971 1.506 1.772 1.18 Belner ec a l . 1975 2.747 3 .125 1.14 LLran and ZeldeB 1975 0 .276 0 .589 2 .13 Uno and Yanada 1977 ( 0 . 3 9 3 ) 1.100 2 . 8 0 Coaay and Kelaon 1975 0 .312 1.314 4.21 Jânecke, Garvey-Kelaon 1975 0 .212 1.361 6 .42 Monahan and Serduke 1975 0.159 0 .695 4.37 Janecke and Eynon 1975 0 .363 0 .952 2.62
53
Ces mesures de coïncidences particules retardées - rayonnement y font que la quantité Eg à
déterminer est faible et la précision relative de sa mesure est meilleure que celle qui serait obtenue
pour des transitions 6 de grande énergie. Compte tenu de la faible largeur gamma des niveaux non
liés dans le domaine d'énergie d'excitation considéré pour ces isotopes, il n'existe pas de
transitions radiatives entre les niveaux émetteurs de particules retardées. De ce fait la distribution B
enregistrée en coïncidence avec une raie neutron est pure et peut être analysée dans sa totalité. La
sélection de plusieurs raies neutron offre l'avantage de fournir différentes valeurs de Eg et autant de
déterminations indépendantes de Qg. L'étalonnage du télescope B est effectué avec les isotopes
2°Na, 46,47|ç produits au séparateur et d'une source radioactive de ^""Ru pour lesquels les
valeurs de Qg sont connues.
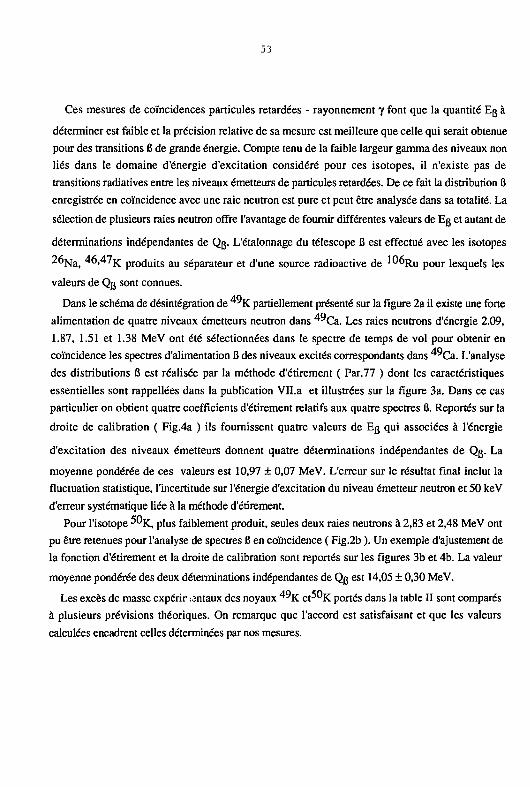
Dans le schéma de désintégration de ^ " K partiellement présenté sur la figure 2a il existe une forte
alimentation de quatre niveaux émetteurs neutron dans 4 9 C a . Les raies neutrons d'énergie 2.09,
1.87, 1.51 et 1.38 MeV ont été sélectionnées dans le spectre de temps de vol pour obtenir en
coïncidence les spectres d'alimentation B des niveaux excités correspondants dans *>Ca . L'analyse
des distributions B est réalisée par la méthode d'étirement ( Par.77 ) dont les caractéristiques
essentielles sont rappellées dans la publication VH.a et illustrées sur la figure 3a. Dans ce cas
particulier on obtient quatre coefficients d'étirement relatifs aux quatre spectres B. Reportés sur la
droite de calibration ( Fig.4a ) ils fournissent quatre valeurs de Eg qui associées à l'énergie
d'excitation des niveaux émetteurs donnent quatre déterminations indépendantes de Qg. La
moyenne pondérée de ces valeurs est 10,97 + 0,07 MeV. L'erreur sur le résultat final inclut la
fluctuation statistique, l'incertitude sur l'énergie d'excitation du niveau émetteur neutron et 50 keV
d'erreur systématique liée à la méthode d'étirement.
Pour l'isotope 5 0 K
, plus faiblement produit, seules deux raies neutrons à 2,83 et 2,48 MeV ont
pu être retenues pour l'analyse de spectres B en coïncidence ( Fig.2b ). Un exemple d'ajustement de
la fonction d'étirement et la droite de calibration sont reportés sur les figures 3b et 4b. La valeur
moyenne pondérée des deux déterminations indépendantes de Qg est 14,05 + 0,30 MeV.
Les excès de masse expérir untaux des noyaux portés dans la table II sont comparés
à plusieurs prévisions théoriques. On remarque que l'accord est satisfaisant et que les valeurs
calculées encadrent celles déterminées par nos mesures.
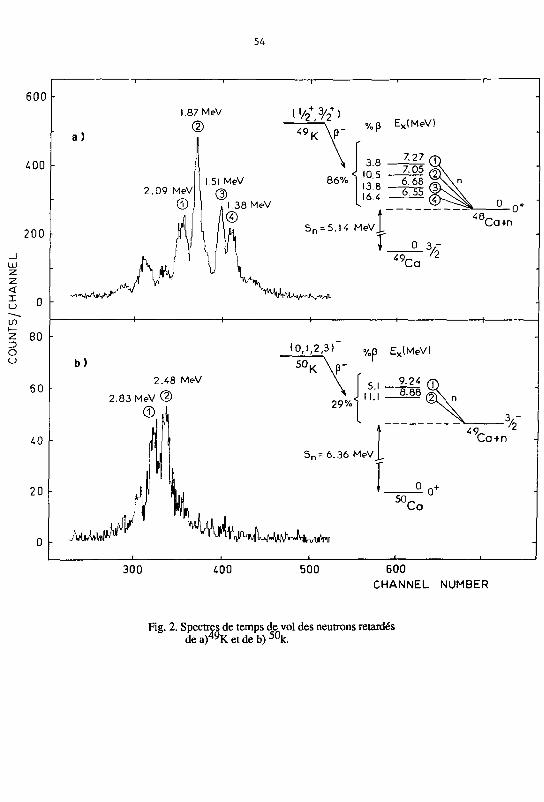
54
1.87 MeV l ' 0 2
+ J a ) 49
2.09 MeV ©
1.51 MeV
I 38 MeV ©
K \ P "
86%
%P ExIMeV]
16.4 — ^ ^ (4
W r ^ ^ / A j A ^ U ^
, 48, Ca+n
T _ o 49, 'Co
J/2
^^Wltfc^k-Jv^fl.
b) 2.48 MeV
2.83 MeV U
®i
(0,1.2,3)" 50 K \p-
29%
%p Ex(MeVl
5 1 9 2 < I I.I — ^ ® L \ n
S n =6.36 MeV J,
49, % Ca + n
50 0 +
Ca
300 400 500 600 CHANNEL NUMBER
Fig. 2. Spectres de temps de vol des neutrons retardés de a) 4 9 K et de b) 5 0 k .
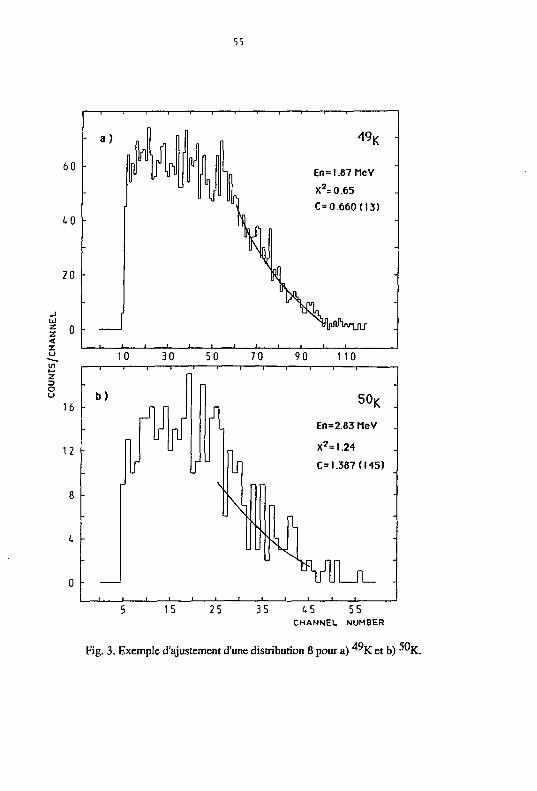
55
- a)
60
40
20 •
_i
i o <
z o
49,
En=l.87MeV
00.660(13)
_J l l l l - J I l _
10 30 50 70 90 110
16 b)
J" Jl nf \fl 5 ° K • L En=2.83 MeV
12 I l u X 2=l.24
IT If In C= 1.387(145)
8 • VU -
U - Î fJ T~n n n
0 i i ) i i i i i i i
15 25 35 45 55 CHANNEL NUMBER
Fig. 3. Exemple d'ajustement d'une distribution B poura ) 4 y Ketb) ; ) U K.
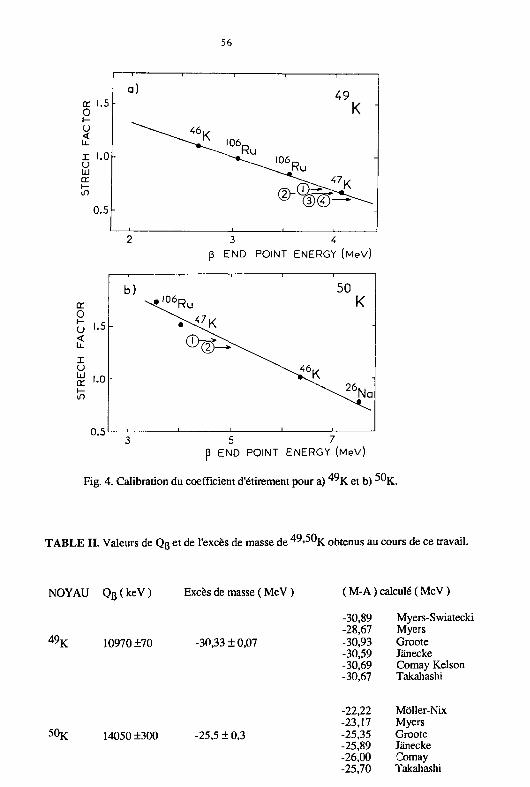
56
a)
i T • •
49 œ 1.5 O
" K " i -
< \ ^ K U-
I U 6 R u r l.O 106 u LU
-J^Ru tr
« ^ g f ^ h-
« ^ g f ^ 0.5
' 3 4
p END POINT ENERGY (MeV)
tr O U '-S < Lu I U
0.5
b) - < * R u
l l
50 K
- -
i i
5 7 p END POINT ENERGY (MeV)
Fig. 4. Calibration du coefficient d'étirement pour a) ^K et b) ^"K.
TABLE II. Valeurs de Q B et de l'excès de masse de 4 9 > 5 0 K obtenus au cours de ce travail.
NOYAU Qg(keV) Excès de masse ( MeV ) ( M-A ) calculé ( MeV )
49 K 10970 ±70 -30,33 ±0,07
-30,89 Myers-Swiatecki -28,67 Myers -30,93 Groote -30,59 Jânecke -30,69 Comay Kelson -30,67 Takahashi
5 0 K 14050 ±300 -25,5 ± 0,3
-22,22 Môller-Nix -23,17 Myers -25,35 Groote -25,89 Janecke -26,00 Comay -25,70 Takahashi
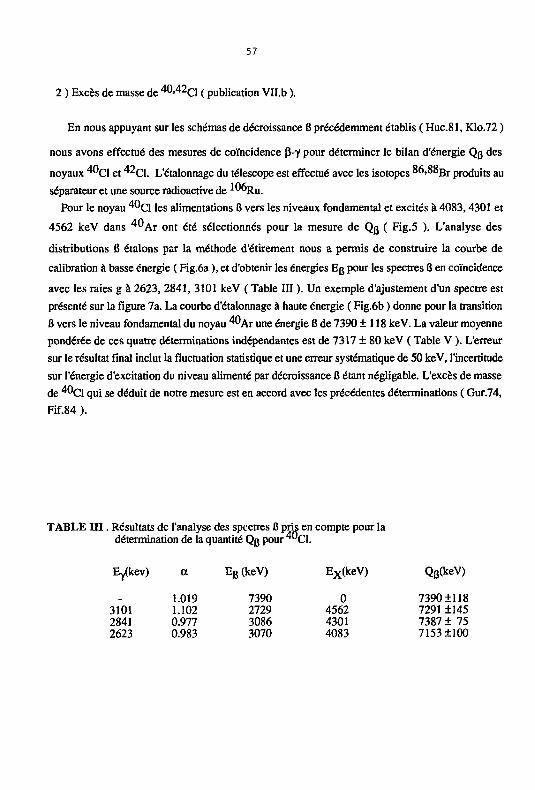
57
2 ) Excès de masse de 4 U> 4^CI ( publication VH.b ).
En nous appuyant sur les schémas de décroissance 8 précédemment établis ( Huc.81, Klo.72 )
nous avons effectué des mesures de coïncidence p-y pour déterminer le bilan d'énergie Qg des
noyaux ^ C l et ^ C l . L'étalonnage du télescope est effectué avec les isotopes 86,88 B r
produits au
séparateur et une source radioactive de *""Ru.
Pour le noyau ^"Cl les alimentations 8 vers les niveaux fondamental et excités à 4083,4301 et
4562 keV dans ^"Ar ont été sélectionnés pour la mesure de Qg ( Fig.5 ). L'analyse des
distributions 6 étalons par la méthode d'étirement nous a permis de construire la courbe de
calibration à basse énergie ( Fig.ôa ), et d'obtenir les énergies Eg pour les spectres 8 en coïncidence
avec les raies g à 2623, 2841, 3101 keV ( Table III ). Un exemple d'ajustement d'un spectre est
présenté sur la figure 7a. La courbe d'étalonnage à haute énergie ( Fig.6b ) donne pour la transition
8 vers le niveau fondamental du noyau une énergie 8 de 7390 ±118 keV. La valeur moyenne
pondérée de ces quatre déterminations indépendantes est de 7317 ± 80 keV ( Table V ). L'erreur
sur le résultat final inclut la fluctuation statistique et une erreur systématique de 50 keV, l'incertitude
sur l'énergie d'excitation du niveau alimenté par décroissance 8 étant négligable. L'excès de masse
de 40ci qui se déduit de notre mesure est en accord avec les précédentes déterminations ( Gur.74,
Fif.84 ).
TABLE i n . Résultats de l'analyse des spectres 8 pris en compte pour la détermination de la quantité Qg pour ^ O Q .
Ey(kev) a Eg(keV) E x(keV) Qg(keV)
1.019 7390 0 7390+118 3101 1.102 2729 4562 72911145 2841 0.977 3086 4301 7387 ± 75 2623 0.983 3070 4083 7153 ±100
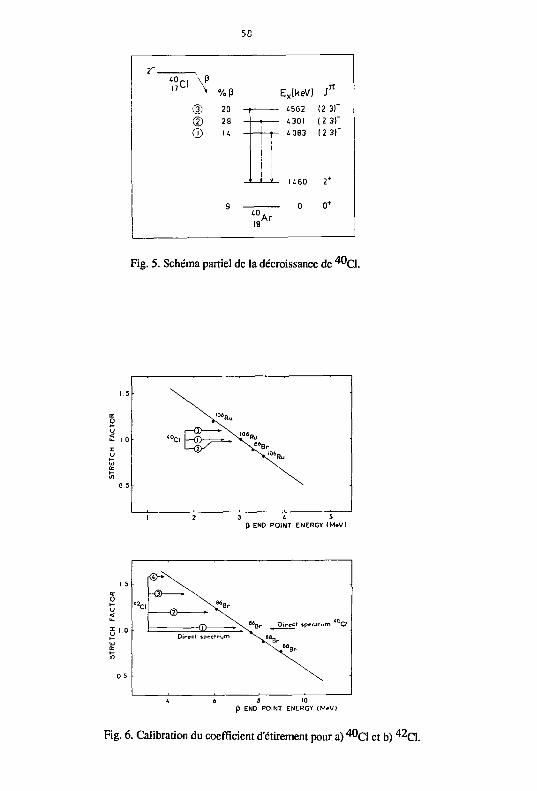
58
*?CI \ P
CD 20 (2) 28
CD It
Ex(keV) J" 1562 (2 3)" 1301 (2 3)" 4 063 (2 31"
!
* " i U60 2*
0 0 + 10 Ar
Fig. 5. Schéma partiel de la décroissance de ^"Cl.
V^ 6Hu
•
<°CI [ ^=^~ <°6Ru
X ™ R u
^
3 « 5 D END POINT ENERGY (McVl
r®-^
=at ^ f l 6 B r Direct spectrum *°CI
Direct spectrum
p END POINT ENERGY (MeV)
Fig. 6. Calibration du coefficient d'étirement pour a) "CI et b) ^ C l .
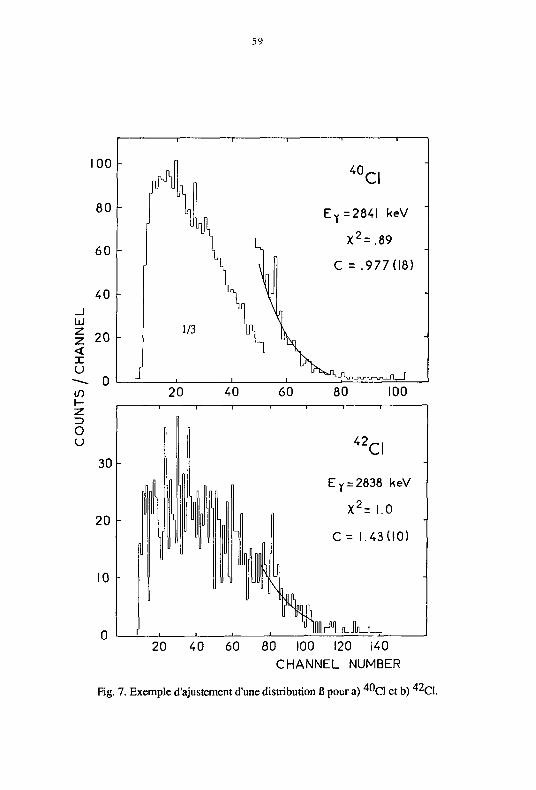
59
Ul
100
80
60
40
20 < x u if) z ID o u
30
20
977(18)
E Y = 2838 keV
X 2 = 1.0
C = 1.43(10)
JL kjL_ 20 40 60 80 100 120 140
CHANNEL NUMBER
Fig. 7. Exemple d'ajustement d'une distribution B pour a) 4 0 C1 et b) 4 2 C1.
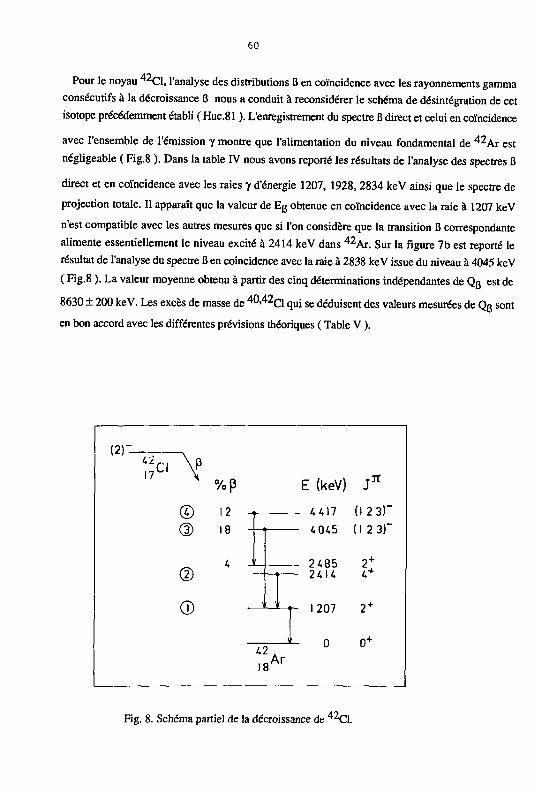
60
Pour le noyau 4 2 C 1 , l'analyse des distributions B en coïncidence avec les rayonnements gamma
consécutifs à la décroissance B nous a conduit à reconsidérer le schéma de désintégration de cet
isotope précédemment établi ( Huc.81 ). L'enregistrement du spectre B direct et celui en coïncidence
avec l'ensemble de l'émission y montre que l'alimentation du niveau fondamental de 4 2 A r est
négligeable ( Fig.8 ). Dans la table IV nous avons reporté les résultats de l'analyse des spectres B
direct et en coïncidence avec les raies y d'énergie 1207, 1928, 2834 keV ainsi que le spectre de
projection totale. Il apparaît que la valeur de E 6 obtenue en coïncidence avec la raie à 1207 keV
n'est compatible avec les autres mesures que si l'on considère que la transition B correspondante
alimente essentiellement le niveau excité à 2414 keV dans 4 2 Ar . Sur la figure 7b est reporté le
résultat de l'analyse du spectre B en coincidence avec la raie à 2838 keV issue du niveau à 4045 keV
( Fig.8 ). La valeur moyenne obtenu à partir des cinq déterminations indépendantes de Qg est de
8630 ± 200 keV. Les excès de masse de 4 0 ' 4 2 C 1 qui se déduisent des valeurs mesurées de Qg sont
en bon accord avec les différentes prévisions théoriques ( Table V ).
(2)-
> \ p
© 12 (D 18
©
E (keV) J*
- 4417 (I 23)"
- 4 045 (I 2 3)"
- 2485 2 +
• 2414 4 +
42
18
*-!- 1207 2 +
0 0 +
Ar
Fig. 8. Schéma partiel de la décroissance de 4 2 C1.
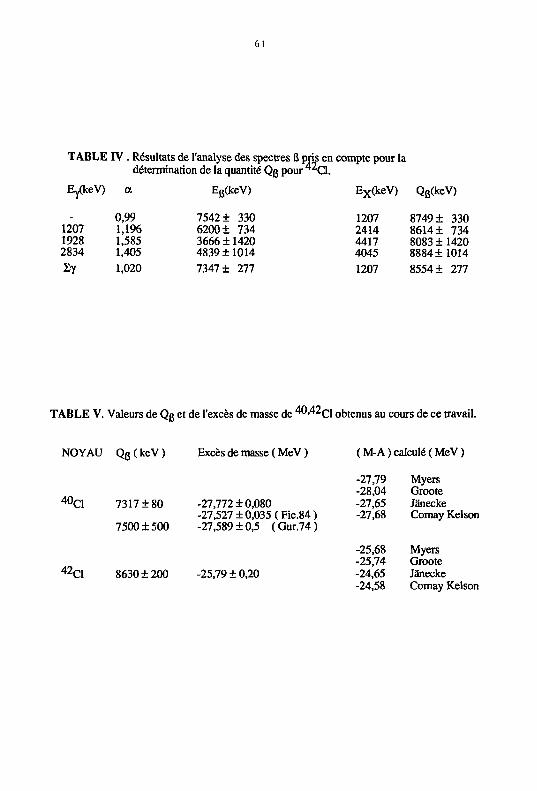
61
TABLE IV . Résultats de l'analyse des spectres B pris en compte pour la détermination de la quantité Qg pour ^ C l .
E/keV) a EB(keV) E x(keV) Q6(keV)
0,99 7542+ 330 1207 8749 ± 330 1207 1,196 6200 ± 734 2414 8614 ± 734 1928 1,585 3666+1420 4417 8083+1420 2834 1,405 4839 ±1014 4045 8884+1014 £y 1,020 7347 ± 277 1207 8554+ 277
TABLE V. Valeurs de Qg et de l'excès de masse de 40>42d obtenus au cours de ce travail.
NOYAU Q 6 (keV) Excès de masse ( MeV ) ( M-A ) calculé ( MeV )
-27,79 Myers -28,04 Groote
4 0 C1 7317 + 80 -27,772 + 0,080 -27,65 Janecke -27,527 ± 0,035 ( Fie.84 ) -27,68 Comay Kelson
7500 ±500 -27,589 ±0,5 (Gur.74)
-25,68 Myers -25,74 Groote
4 2 C1 8630 ±200 -25,79 ±0,20 -24,65 Janecke -24,58 Comay Kelson

62
B ) Mesure de l'excès de masse du noyau par réaction de transfert. ( publication VIII )
Dans la région Z=64 et N=82 ou s'amorce la radioactivité alpha, la connaissance de l'excès de
masse de noyaux comme ^°Gd et ' ^ G d offre un intérêt théorique par rapport au modèle en
couches et permet d'atteindre de proche en proche l'excès de masse des émetteurs alpha, plus
déficients, formés par réaction de fusion.
Le noyau * 4 'Gd a été formé par la réaction à deux corps ' 4 4 S m ( * 2 C, ^Be ) 1 4 ' G d . Le
faisceau de * 2C issu du Tandem d'Orsay est focalisé sur la cible de ' ^ S m ( 100 (ig/cm^ ). Les
produits de réaction analysés par un spectromètre magnétique à double focalisation ( n=l/2 ) sont
identifiés à l'aide d'une chambre d'ionisation. La reconstitution des trajectoires réalisée à partir des
informations délivrées par deux compteurs proportionnels permet d'obtenir la rigidité magnétique
et l'angle d'émission des ions 9 B e à l'intérieur d'un angle solide de 5 msr. La calibration du
dispositif est assurée par les réactions 1 4 4 S m ( 1 2 C, 1 0 Be ) 1 4 6 G d , 1 4 8 S m ( 1 2 C , 9 Be ) 1 5 1 G d
pour lesquelles l'excès de masse du noyau résiduel est connu.
Trois ensembles de mesures indépendantes ont été réalisées, l'un à un angle de réaction de 25° et
deux autres à 29° pour deux valeurs du champ magnétique ( Fig.9 ). Trois spectres en rigidité
magnétique pour les ions «Beetle sont alors obtenus et la valeur moyenne pondérée qui en
résulte pour l'excès de masse du noyau ' ^ G d e s t .75,401 ± 0,020 MeV. Cette quantité est
comparée aux précédentes valeurs obtenues expérimentalement ( Table VI ). L'accord avec les
mesures antérieures de L.G. Mann et U.J. Schrewe ( Man.84, Sch.84 ) est satisfaisant. Un écart
de 89 ± 55 keV existe cependant entre notre valeur et la détermination précédente à l'aide de la
m/ eme réaction ( Par.80 ). L' excès de masse du noyau ^ ' G d est proche des prédictions de Uno
et Yamada ( Uno.82 ) et de celles de Moller ( Môl.81 ) ( publication VIII ).
Au cours de ce travail la première valeur expérimentale de l'excès de masse de 4^C1, 4"K et 5 0 K
a été obtenue. Les excès de masse mesurés de 40,42c 49 .50K e t 1 4 7 G d
sont très voisins
des prédictions théoriques comme il est illustré sur la figure 10 empruntée à P. Haustein. Signalons
que pour les isotopes 4 2 C 1 e t 50j^ i e s mesures de Qg ont pu être effectuées avec des taux de
production faibles de l'ordre de 2.10 ' atomes par seconde.
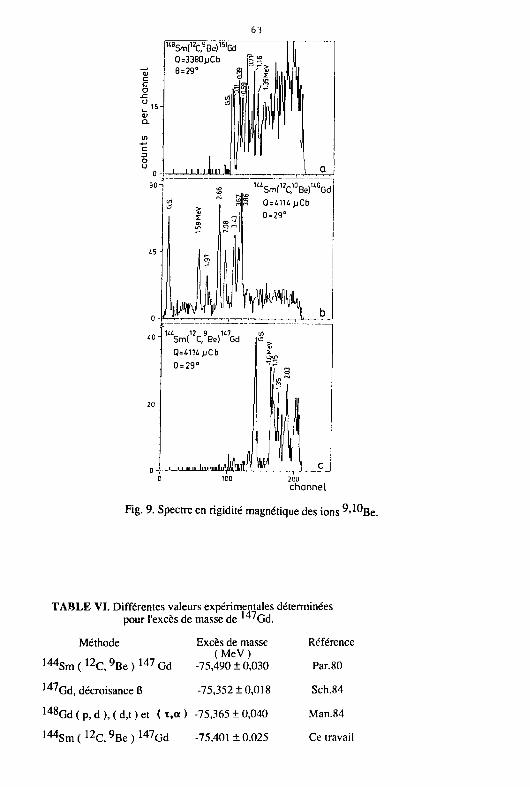
63
l u ,12 9 ,U7 ni
Sm( C, Be) Gd J .
Q-ùtUpCb
8 = 29°
:'_.. n i_cj 0 1D0 200
channel
Fig. 9. Spectre en rigidité magnétique des ions 9 - 1 0 B e .
TABLE VI. Différentes valeurs expérimentales déterminées pour l'excès de masse de ' 4 'Gd .
Méthode Excès de masse Référence (MeV)
I 4 4 S m ( 1 2 C , 9 Be ) 1 4 7 Gd -75,490 ± 0,030 Par.80
1 4 7Gd,décroisanceB -75,352 ±0,018 Sch.84
, 4 8 G d ( p, d ), ( d,t ) et ( i,o ) -75,365 + 0,040 Man.84
1 4 4 S m ( 1 2 C , 9 Be ) 1 4 7 G d -75,401 ± 0,025 Ce travail
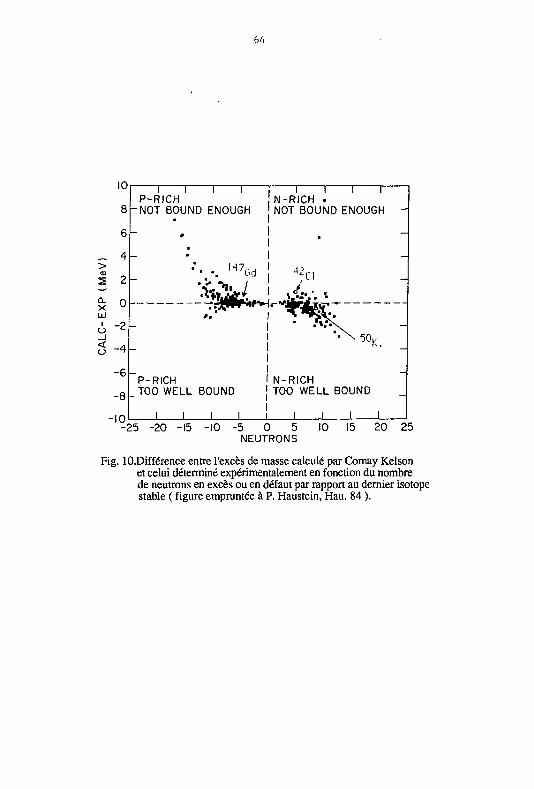
bh
10
8
6
_. 4 > I 2 Q_ X L±J
3 -4
-6
-8
-10
I I I I P-RICH NOT BOUND ENOUGH
I I I T N-RICH . NOT BOUND ENOUGH
P-RICH TOO WELL BOUND
-25 -20 -15 -10 -5 0 5 NEUTRONS
10 15 20 25
Fig. lO.Différence entre l'excès de masse calculé par Comay Kelson et celui déterminé expérimentalement en fonction du nombre de neutrons en excès ou en défaut par rapport au dernier isotope stable ( figure empruntée à P. Haustein, Hau. 84 ).
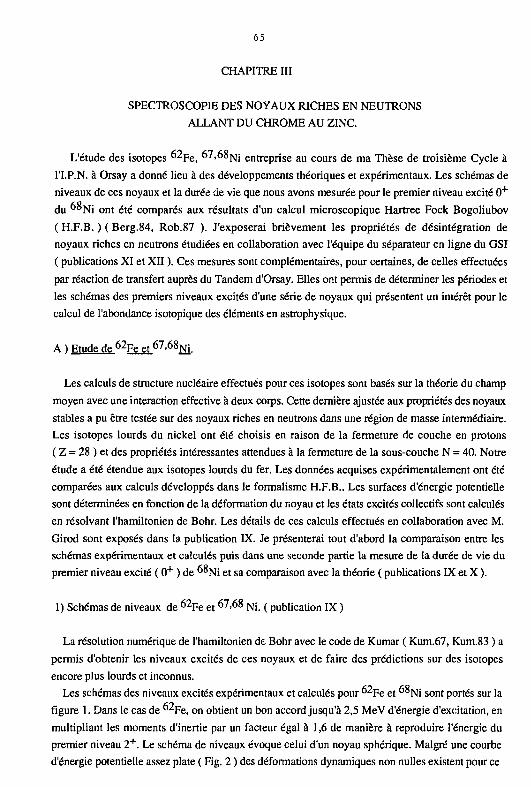
65
CHAPITRE III
SPECTROSCOPE DES NOYAUX RICHES EN NEUTRONS
ALLANT DU CHROME AU ZINC.
L'étude des isotopes "^Fe, " ' ' "°Ni entreprise au cours de ma Thèse de troisième Cycle à
l'I.P.N. à Orsay a donné lieu à des développements théoriques et expérimentaux. Les schémas de
niveaux de ces noyaux et la durée de vie que nous avons mesurée pour le premier niveau excité 0 +
du "*Ni ont été comparés aux résultats d'un calcul microscopique Hartree Fock Bogoliubov
( H.F.B. ) ( Berg.84, Rob.87 ). J'exposerai brièvement les propriétés de désintégration de
noyaux riches en neutrons étudiées en collaboration avec l'équipe du séparateur en ligne du GSI
( publications XI et XII ). Ces mesures sont complémentaires, pour certaines, de celles effectuées
par réaction de transfert auprès du Tandem d'Orsay. Elles ont permis de déterminer les périodes et
les schémas des premiers niveaux excités d'une série de noyaux qui présentent un intérêt pour le
calcul de l'abondance isotopique des éléments en astrophysique.
A ) Etude de 6 2 F e et 6 7 ' 6 8 N i .
Les calculs de structure nucléaire effectués pour ces isotopes sont basés sur la théorie du champ
moyen avec une interaction effective à deux corps. Cette dernière ajustée aux propriétés des noyaux
stables a pu être testée sur des noyaux riches en neutrons dans une région de masse intermédiaire.
Les isotopes lourds du nickel ont été choisis en raison de la fermeture de couche en protons
( Z = 28 ) et des propriétés intéressantes attendues à la fermeture de la sous-couche N = 40. Notre
étude a été étendue aux isotopes lourds du fer. Les données acquises expérimentalement ont été
comparées aux calculs développés dans le formalisme H.F.B.. Les surfaces d'énergie potentielle
sont déterminées en fonction de la déformation du noyau et les états excités collectifs sont calculés
en résolvant l'hamiltonien de Bohr. Les détails de ces calculs effectués en collaboration avec M.
Girod sont exposés dans la publication IX. Je présenterai tout d'abord la comparaison entre les
schémas expérimentaux et calculés puis dans une seconde partie la mesure de la durée de vie du
premier niveau excité ( 0 + ) de ^ N i e t sa comparaison avec la théorie ( publications DC et X ).
1) Schémas de niveaux de "^Fe et 67,68 ]\jj ( publication IX )
La résolution numérique de l'hamiltonien de Bohr avec le code de Kumar ( Kum.67, Kum.83 ) a
permis d'obtenir les niveaux excités de ces noyaux et de faire des prédictions sur des isotopes
encore plus lourds et inconnus.
Les schémas des niveaux excités expérimentaux et calculés pour °2pe et "°Ni sont portés sur la
figure 1. Dans le cas de "^Fe, on obtient un bon accord jusqu'à 2,5 MeV d'énergie d'excitation, en
multipliant les moments d'inertie par un facteur égal à 1,6 de manière à reproduire l'énergie du
premier niveau 2 + . Le schéma de niveaux évoque celui d'un noyau sphérique. Malgré une courbe
d'énergie potentielle assez plate ( Fig. 2 ) des déformations dynamiques non nulles existent pour ce
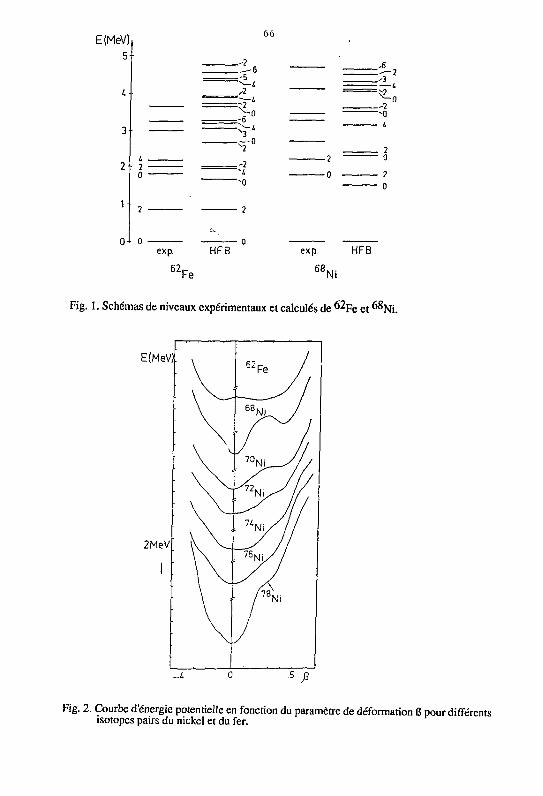
E(MeV)i 5-
66
OJ- 0 ex p.
62 r
- -2
"*0
HFB exp.
68 K
HFB
T e ""Ni
Fig. 1. Schémas de niveaux expérimentaux et calculés de 6 2 F e et ^ 8Ni.
E(MeV)
2MeV
Fig. 2. Courbe d'énergie potentielle en fonction du paramètre de déformation B pour différents isotopes pairs du nickel et du fer.
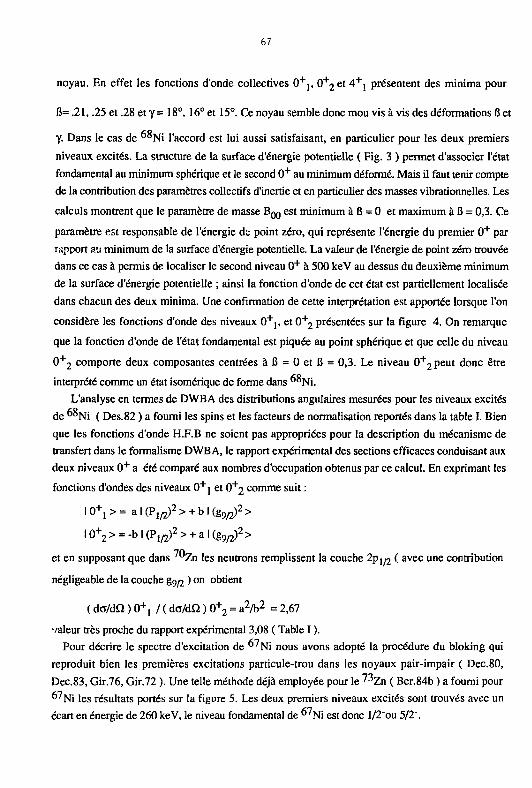
67
noyau. En effet les fonctions d'onde collectives 0 + ] , 0 +
2 et 4 + j présentent des minima pour
B=.21, .25 et .28ety= 18°, 16° et 15°. Ce noyau semble donc mou visa vis des déformations 8 et
Y. Dans le cas de 6 8 N i l'accord est lui aussi satisfaisant, en particulier pour les deux premiers
niveaux excités. La structure de la surface d'énergie potentielle ( Fig. 3 ) permet d'associer l'état
fondamental au minimum sphérique et le second 0 + au minimum déformé. Mais il faut tenir compte
de la contribution des paramètres collectifs d'inertie et en particulier des masses vibrationnelles. Les
calculs montrent que le paramètre de masse BQQ est minimum à B = 0 et maximum à B = 0,3. Ce
paramètre est responsable de l'énergie de point zéro, qui représente l'énergie du premier 0 + par
rapport au minimum de la surface d'énergie potentielle. La valeur de l'énergie de point zéro trouvée
dans ce cas à permis de localiser le second niveau 0 + à 500 keV au dessus du deuxième minimum
de la surface d'énergie potentielle ; ainsi la fonction d'onde de cet état est partiellement localisée
dans chacun des deux minima. Une confirmation de cette interprétation est apportée lorsque l'on
considère les fonctions d'onde des niveaux 0 + j , et 0 +
2 présentées sur la figure 4. On remarque
que la fonction d'onde de l'état fondamental est piquée au point sphérique et que celle du niveau
0 +
2 comporte deux composantes centrées à B = 0 et B = 0,3. Le niveau 0 +
2 peut donc être
interprété comme un état isomérique de forme dans °°Ni.
L'analyse en termes de DWBA des distributions angulaires mesurées pour les niveaux excités
de "*>Ni ( Des.82 ) a fourni les spins et les facteurs de normalisation reportés dans la table I. Bien
que les fonctions d'onde H.F.B ne soient pas appropriées pour la description du mécanisme de
transfert dans le formalisme DWBA, le rapport expérimental des sections efficaces conduisant aux
deux niveaux 0 + a été comparé aux nombres d'occupation obtenus par ce calcul. En exprimant les
fonctions d'ondes des niveaux 0 + j et 0 + 2 comme suit :
IO+,>= a l ( P 1 / 2 )2 > + b l ( g 9 / 2 )
2 >
10+2 > = -b I (P 1 / 2 )2 > + a I (g 9 / 2 )
2 >
et en supposant que dans '°Zn les neutrons remplissent la couche 2pj/ 2 ( avec une contribution
négligeable de la couche gg^ ) o n obtient
( do/dQ ) 0+j / ( dcy/dQ ) 0 +
2 = a 2 /b 2 = 2,67
valeur très proche du rapport expérimental 3,08 ( Table I ). Pour décrire le spectre d'excitation de
6 7 N i
nous avons adopté la procédure du bloking qui
reproduit bien les premières excitations particule-trou dans les noyaux pair-impair ( Dec.80,
Dec.83, Gir.76, Gir.72 ). Une telle méthode déjà employée pour le 73 Zn ( Ber.84b ) a fourni pour 6 7 N
i les résultats portés sur la figure 5. Les deux premiers niveaux excités sont trouvés avec un écart en énergie de 260 keV, le niveau fondamental de "'Ni est donc l/2~ou 5/2".
68
E(HeV)
Fig. 3. Surface d'énergie potentielle en fontion des paramètres de déformation P et 7 pour °°Ni.
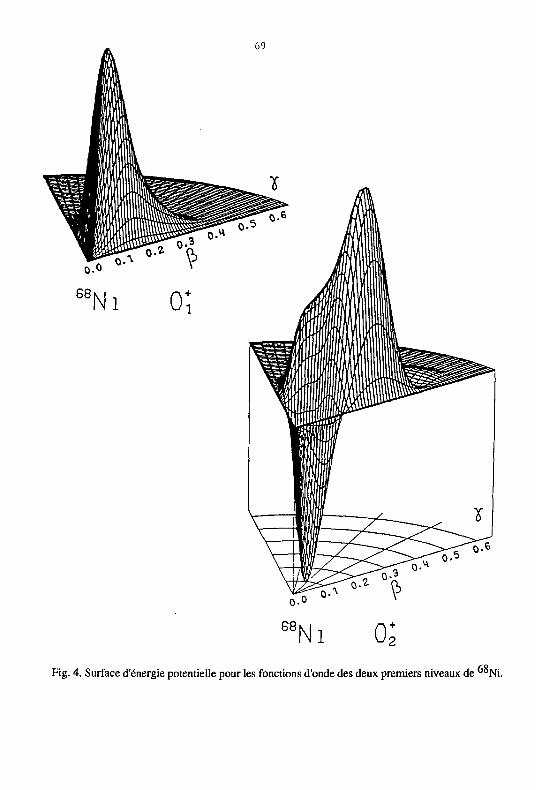
'Ni Os Fig. 4. Surface d'énergie potentielle pour les fonctions d'onde des deux premiers niveaux de "°Ni.
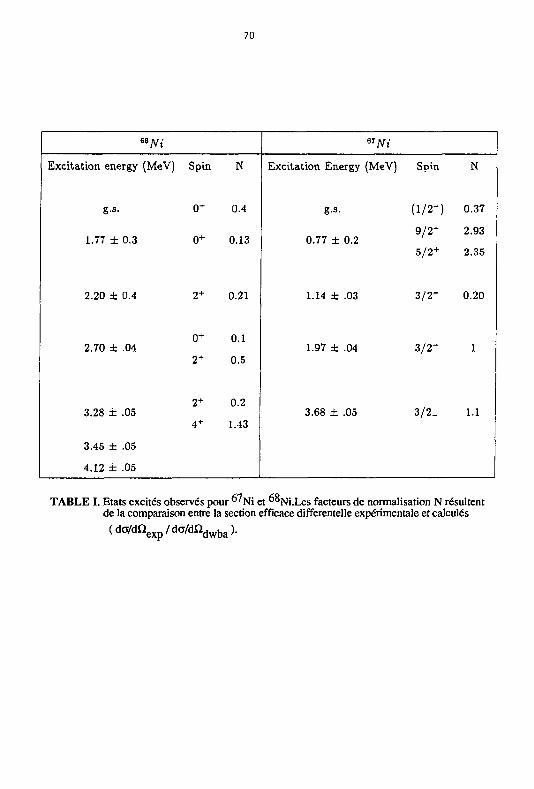
70
MNi "Ni
Excitation energy (MeV) Spin N Excitation Energy (MeV) Spin N
g.s. 0+ 0.4 g.s. (1 /2 - ) 0.37
1.77 ± 0.3 0+ 0.13 0.77 ± 0.2 9/2+
5/2+
2.93
2.35
2.20 ± 0.4 2+ 0.21 1.14 ± .03 3 / 2 " 0.20
2.70 ± .04 0+
2+
0.1
0.5 1.97 ± .04 3 / 2 " 1
3.28 ± .05 2+
4+
0.2
1.43 3.68 ± .05 3/2_ 1.1
3.45 ± .05
4.12 ± .05
TABLE I. Etats excités observés pour 6 7 N i
et "°Ni.Les facteurs de normalisation N résultent de la comparaison entre la section efficace differentelle expérimentale et calculés
(da/dQ /da /d£2 d w b a ) .
71
A titre de comparaison et pour tester la validité des prédictions, la même procédure de calcul a
été employée pour le noyau 6 5 N i
( Fig. 5 ); les deux premiers niveaux excités apparaissent très
proches conformément au résultat de l'expérience ( Led.78 ), mais avec une séquence de spin
inversée. L'analyse des distributions angulaires des premiers états excités de °'Ni et les facteurs
de normalisation qui s'en déduisent indique les valeurs possibles pour le spin et la parité des états
excités de cet isotope ( Table I ). Le niveau fondamental est vraisemblablement 1/2" comme le
montre les mesures de coïncidences B-y effectuées sur la décroissance B" du noyau " 'Co
( Run.83 ). Ce dernier résultat est en accord avec la comparaison de la distribution angulaire
expérimentale et calculée pour ce niveau ( Fig. 6 ). L'état 5/2" prédit par le calcul n'a put être
observé expérimentalement soit parce que trop proche en énergie du niveau fondamental, soit en
raison d'une section efficace de formation très inférieure à celle du niveau 1/2". Le premier état
excité observé est probablement 9/2 + bien que la section efficace mesurée soit plus grande que
prévue ( Table I ).
2 ) La transition monopolaire 0 +
2 - 0 + j dans °°Ni. ( Publications IX et X )
La spectrocopie du noyau °°Ni fournit une bonne illustration de l'effet de renforcement de
fermeture de la couche N = 40. L'excès de masse de cet isotope a été mesuré la première fois par
Bhatia ( Bha.77 ). Des mesures récentes avec la réaction '^Zn ( '^C, *°0 ) "°Ni ont permis de
préciser l'excès de masse et de mettre en évidence les deux premiers niveaux excités de "°Ni
( Ber.82 ). La mesure précise des distributions angulaires autour de 0° ( Des.82 ) a montré que le
premier état à 1,77 MeV d'énergie d'excitation possède un spin et une parité 0 + ; le second niveau
à 2,2 MeV est vraisemblablement un état 2 + . Seuls quelques noyaux pair-pair possèdent un état 0 +
comme premier niveau excité ( 1 6 0
, ^"Ca, ^ G e , ""Zr, "°Mo ) et l'étude de la décroissance de cet
état vers le niveau fondamental est intéressante. Interdite par émission y elle procède par conversion
interne ou par émission d'une paire e +e" lorsque l'énergie d'excitation du niveau est supérieure au
seuil de création de cette paire. Dans le noyau considéré, ces deux processus ont lieu dans la
proportion d'un événement pour deux ( Pas.80 ). Afin d'aller plus avant dans le test des fonctions
d'onde des niveaux 0 + de "°Ni, nous avons déterminé expérimentalement la durée de vie du
niveau 0 +2- Les détails de la procédure utilisée sont décrits dans publication IX. La réaction de transfert utilisée est
7 0 Z n ( 1 4 c , 1 6 0 ) 6 8 N i
avec un faisceau d'ions **C d'énergie 72 MeV puisé
à 2,5 MHz ( 400ns ) d'environ 3 ns de large pour une intensité moyenne de 10 nA. L'identification
et la mesure de l'énergie des noyaux 1 6 0
émis sont réalisées avec le dispositif utilisé lors de la
mesure de l'excès de masse de ^^Ni ( Ber.82 ), au cours de laquelle une section efficace de 20
nbarn/sr a été déterminée pour la formation du premier niveau excité 0 + de "°Ni. Pour obtenir une efficacité de détection raisonnable par rapport au taux de coïncidences fortuites nous avons adopté le dispositif expérimental schématisé sur la figure 7. La distribution en temps des électrons émis lors de la décroissance du niveau 0 +
2 est enregistrée par un convertisseur temps amplitude. Ce
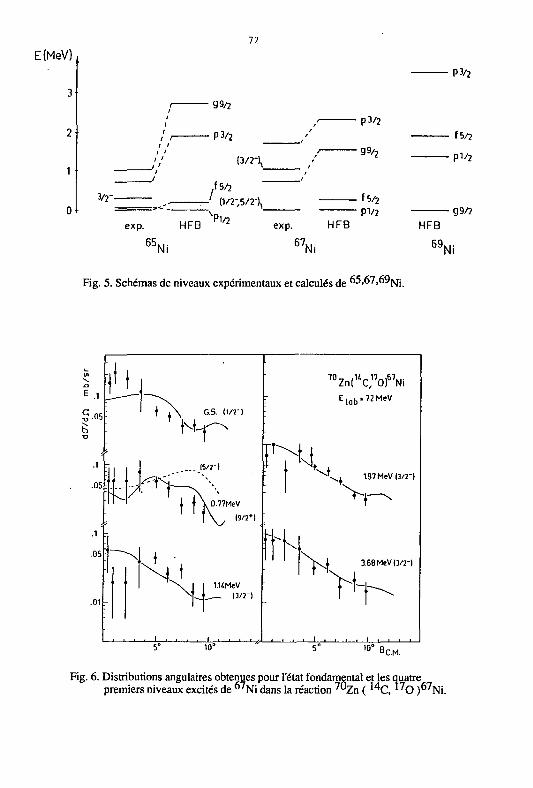
72
E(MeV)
3
2 / ; r
i i i i
99/2
. p3/ 2
13/2-),
3/2" (H
/ f 5/2
(1/2-,5/2"\
exp. HFB
65,
> i ^
/
\ /
p3/ 2
g 9 / 2
f 5 / 2
PV2 exp. HFB
67K JNi Ni
Fig. 5. Schémas de niveaux expérimentaux et calculés de 65,67,o9[sjj
HFB
69
P3/2
f5/2
pv 2
•g9/2
Ni
Y II .05
t i \ G.S. (1/2-)
7 0 Zn( 1 'c : 7 O) 6 7 Ni E , o b = 72MeV
N-p
/ *
(5/Z-) -n
NJ
Û.T7MeV
(9/2*1
l.UMeV _ (3/2-)
i , I i i , , I
W. 1.97 MeV 13/2")
V,-
v. 3.68 MeV (3/2-)
>h-'0° Br
Fig. 6. Distributions angulaires obtenues pour l'état fondamental et les quatre premiers niveaux excités de 6 7 N i dans la réaction 7"Zn ( 1 4 C , " O ) 6 7 Ni.
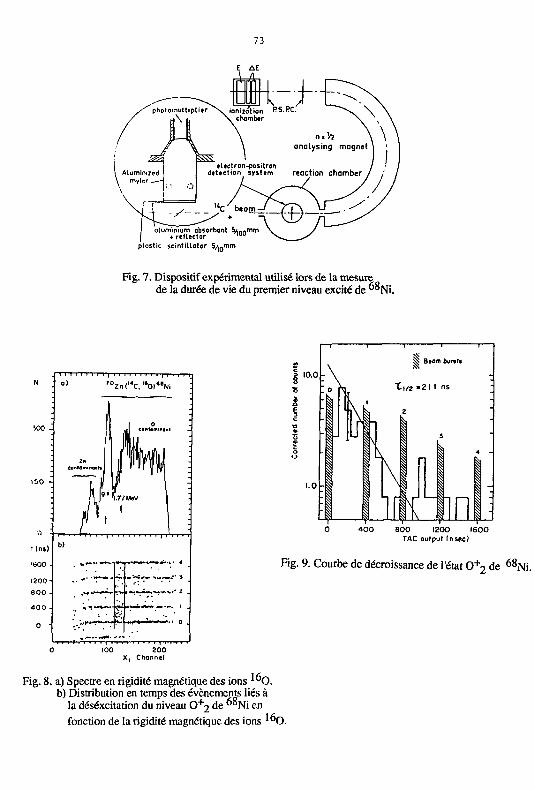
73
Fig. 7. Dispositif expérimental utilisé lors de la mesure de la durée de vie du premier niveau excité de °°Ni.
100 200 X, Channel
10.0
1.0
1200 1600 output fnsec)
Fig. 9. Courbe de décroissance de l'état 0+*> de
Fig. 8. a) Spectre en rigidité magnétique des ions I 6 o . b) Distribution en temps des événements liés à
la déséxcitation du niveau 0 + 2 de "°Ni en fonction de la rigidité magnétique des ions
74
dernier est déclenché par les ions traversant le premier compteur proportionnel et stoppé par le
signal provenant du photomultiplicateur ( le retard introduit dans cette voie tient compte du temps de
parcours des ions 1 6 0
dans l'aimant ). Le spectre en énergie des éjectiles '"O est porté sur la
figure 8a et la distribution bidimentionnelle temps-énergie sur la figure 8b. On observe une
accumulation d'événements en dehors des "puises" de faisceau, dans une région d'énergie
correspondant au premier niveau excité de "°Ni. A\ ec un taux de comptage pour les ions '"O de
l'ordre de deux événements par heure, la probabilité de détecter deux ions 1 6 0
dans l'intervalle de
temps du convertisseur ( 2\is ) est négligeable. Le fort taux de comptage au niveau du
photomultiplicateur introduit un bruit de fond aléatoire que l'on peut soustraire de la courbe de
décroissance en temps des électrons. Sur la figure 9 est porté le nombre d'événements intégré sur
67 ns en fonction du temps, pour la fenêtre en énergie centrée sur le niveau excité situé à 1,77 MeV
dans "°Ni. L'analyse de ce spectre à faible statistique a été faite en considérant une loi de
distribution de Poisson ( Par.85 ); la valeur obtenue pour la durée de vie du premier niveau excité
de "°Ni est de 211 + 6 0 .4n ns. Cette quantité a été comparée à celle déduite d'un calcul théorique
H.F.B ( publications X et IX ). La durée de vie de cet état, dépendante du recouvrement des
fonctions d'ondes des niveaux initial 0 +
2 et final 0 + , , est reliée à l'élément de matrice de transition monopolaire p par la relation l/i = Qp avec p=l/R < i I ItJ* I f >, li > et If > étant les états initial et final, r_ la position du p i e m e proton et R le rayon nucléaire moyen. Le terme £2 décrit les processus atomiques, £2 = £2_ + £2_ où £2„ caractérise la conversion interne dans les couches
K,L... et £2_ la production de paire e + e". En considérant les travaux de Church et
Weneser ( Chu.56 ) on trouve £2 =1,126 iï^r . Pour les isotopes du nickel les quantités £2 et
£2jr ont été calculés par Passoja ( Pas.80 ) en fonction de l'énergie d'excitation. La valeur
expérimentale déduite pour lp| est 0,076 ± 0,010. Les calculs effectués dans le formalisme H.F.B.
explicités dans la publication IX conduisent à une valeur de r égale à 0,1075 ce qui donne une durée
de vie de 152 ns pour l'état 0 +
2 . Compte tenu du fait que ces calculs sont purement microscopiques
et que les paramètres de l'interaction nucléaire D1SA sont fixés ( Berg.84, Rob.87 ) l'accord avec
la valeur expérimentale est remarquable.
75
B ) Etude de la décroissance B" des noyaux riches en neutron allant du Cr au Zn.
( publications XI et XII )
Dans une série d'expériences réalisées auprès du séparateur de masse en ligne à G.S.I. j'ai
participé à l'étude les propriétés de désintégration 6 de ces isotopes formés au moyen de réactions
de transfert de plusieurs nucléons.
La période de désintégration de ces noyaux est un paramètre important dans le calcul du
processus de nucléosynthese. La technique élaborée par Kirchner ( Kir. 82 ) permet d'atteindre des
noyaux au voisinage de l'isotope doublement magique "°Ni, comme " 'Ni ( Run.83 ), et l'on peut
espérer observer le noyau dans lequel la présence d'un état isomérique émetteur neutron est
prévue ( Pek.71 ). La méthode expérimentale utilisée est explicitée dans la publication XI ainsi que
les résultats obtenus sur la décroissance de ^ ^ M n , 6 3 > 6 4 Fe , 6 3 - 6 5 C o , 6 7 _ 6 9 N i , 6 9 C u et 7 3 Zn.
Les taux de production normalisés à un faisceau de 8 2 S e de 10 nA particules pour les isotopes
observés au cours de ce travail sont porté.s sur la figure 10. Le rapport des durées de vie
expérimentale et calculée pour l'ensemble des noyaux étudiés ( publications XI et XII et Run.83 ) a
été détermine; cette quantité voisine de 0,2 poor les noyaux lourds du Cr au Ni, et proche de 1 pour
les éléments plus lourds est reportée sur la figure 11. Le résultat du calcul de l'abondance
isotopique à partir des durées de vie mesurées s'écarte de celui obtenu à partir des périodes
estimées ( Kla.84 ) dans une limite de 20% ( Fig. 12 ). Des écarts plus importants sont attendus si
l'on extrapole les périodes des noyaux de T z supérieur à partir des valeurs expérimentales déjà
obtenues plus près de la stabilité.
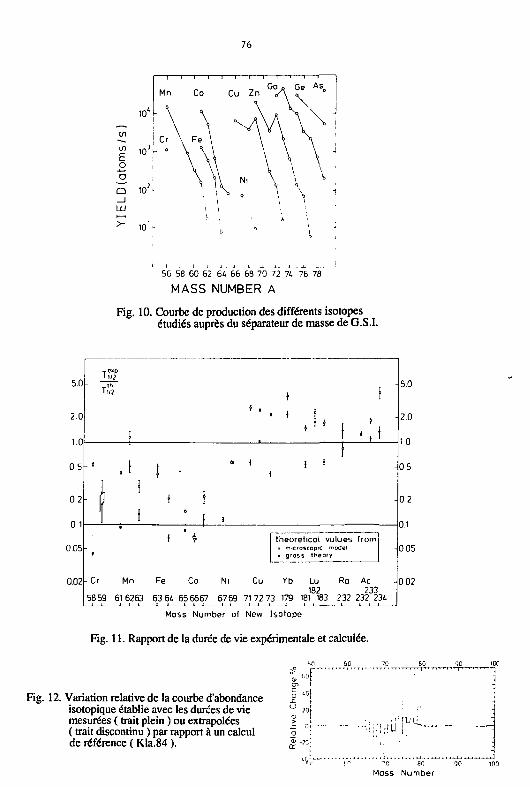
76
56 58 60 62 64 66 68 70 72 74 76 78
MASS NUMBER A
Fig. 10. Courbe de production des différents isotopes étudiés auprès du séparateur de masse de G.S.I.
5.0
2.0
0 .5 -
0.2
0 1
0.05
0.02
- th Tu? t f
-
• 1 i
s
I .1
I
1
1
S
1 1 1
1
-
- C r Mn
5859 616263
f
Fe
63 64
Co
65 6667
Ni
6769
- C r Mn
5859 616263
f
Fe
63 64
Co
65 6667
Ni
6769
theoretical values o miCroSCOprC model • gross theory
from -
- C r Mn
5859 616263
f
Fe
63 64
Co
65 6667
Ni
6769
Cu
7172 7
Yb Lu Ra 182
3 179 181 183 232
Ac 233
232 2
-34
5.0
2.0
0.5
0.2
0.1
- 0 05
- 0 02
Mass Number of New Isotope
Fig. 11. Rapport de la durée de vie expérimentale et calculée.
"•0
..of 60 70 80
Fig. 12. Variation relative de la courbe d'abondance isotopique établie avec les durées de vie mesurées ( trait plein ) ou extrapolées ( trait discontinu ) par rapport à un calcul de référence ( Kla.84 ).
• ,1 ru-LU - i . i . r ' r f l j i ^
Mass Number
11/n CONCLUSION
De l'ensemble de ce travail expérimental mené sur des noyaux loin de la stabilité dans les régions
de masse A=30 et A=70, plusieurs données fondamentales ont pu être établies et nous nous sommes
L.iCiCés de confronter l'ensemble de nos résultats expérimentaux aux diverses prédictions théoriques.
Il ressort de cette comparaison que des caractéristiques comme la masse, la structure des premiers
états excités et la distribution de la force de transition Gamow-Teller sont bien reproduites par des
calculs microscopiques et macroscopiques.
Le mode de décroissance particulier qu'est l'émission de particules retardées nous a permis
d'obtenir des informations précises sur la force de transition Gamow-Teller dans la fenêtre d'énergie
QQ. Pour les isotopes 2">-™Na, la comparaison de la force G.T. expérimentale avec celle obtenue par
un calcul dans le cadre du modèle en couche effectué dans l'espace de configuration 2s-ld révèle un
très bon accord en ce qui concerne sa distribution, avec toutefois la nécessité d'introduire un facteur
de normalisation de l'ordre de 0,5. Cette quantité est proche de celle déterminée pour les isotopes
riches en protons 32 ,33^ s u j v a n t j a même méthode et s'interprète par une renormalisation de la
constante de couplage vecteur-axial dans le noyau par rapport à la valeur correspondante pour un
nucléon libre. Un excellent accord entre l'expérience et la théorie est observé pour l'énergie et la
désexcitation radiative des niveaux liés de ^Mg, et les résultats que noi-s avons obtenu dans l'étude
de la décroissance de ™Na montrent qu'il est nécessaire de faire intervenir, dans la description
théorique de Mg, les orbites lf7/2 - 'i-V^n P o u r c e t t e région de transition de forme.
L'analyse des spectres en énergie des particules retardées nous a permis de localiser un grand
nombre d'états non liés dans les noyaux émetteurs. Pour les isotopes riches en protons "^Ga et ""As
nous avons déterminé la densité des états non liés, bien reproduite par un calcul effectué dans le
formalisme du back shifted Fermi gas model. Des indications sur la coexcitence de deux formes dans
ont été fournies par des mesures de coïncidences proton-rayon X.
Les excès de masse que nous avons déterminés pour les noyaux 4 9 , 5 0 K > 4 0 , 4 2 c l e t 1 4 7 G d
sont
en bon accord avec les différentes prédictions théoriques. Pour les isotopes 4 9 K , 5 0 K e t 4 2 c i ces
mesures constituent une première détermination expérimentale. Grâce à la bonne efficacité de
détection de notre dispositif de mesure du bilan Qg, l'excès de masse de 4 2 C1 et -™K dont le taux de
production n'excédait pas 2. 103 atomes par seconde a pu être obtenu.
Des calculs microscopiques effectués dans le formalisme Hartree Fock Bogoliubov ont permis de
rendre compte du schéma des premiers états excités des isotopes lourds " 2 Fe et " ' ' °°Ni . En
particulier un bon accord est observé entre la théorie et l'expérience pour l'élément de matrice de
transition monopolaire ( 0 + 2 - 0 + j ) entre le premier état excité et le niveau fondamental du noyau 6 8 N i .
Nous envisageons d'apporter des améliorations à nos ensembles de détection pour poursuivre ce
type d'études auprès des installations expérimentales en cours de réalisation : ISOLDE III, le
VIVITRONetSIS.
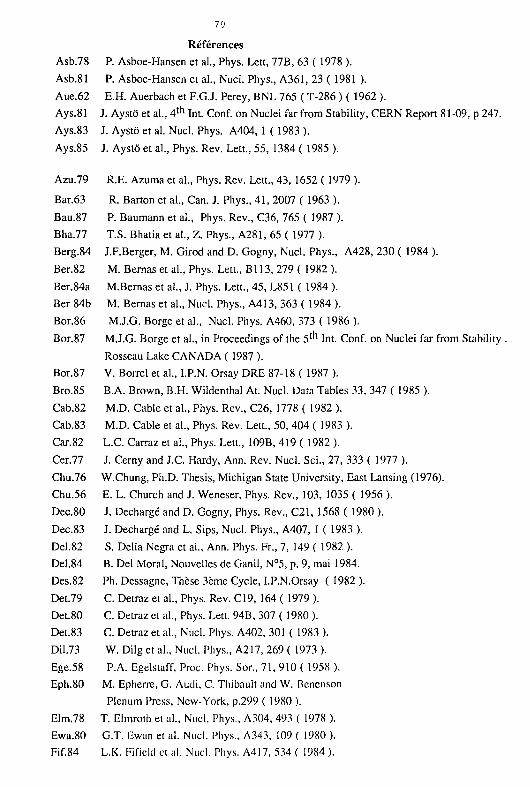
79
Références
Asb.78 P. Asboe-Hansen et al., Phys. Lett, 77B, 63 ( 1978 ).
Asb.81 P. Asboe-Hansen et al., Nucl. Phys., A361, 23 ( 1981 ).
Aue.62 E.H. Auerbach et F.G.J. Perey, BNL 765 ( T-286 ) ( 1962 ).
Ays.81 J. Aystô et al., 4 t h Int. Conf. on Nuclei far from Stability, CERN Report 81-09, p 247.
Ays.83 J. Aysto et al. Nucl. Phys. A404, 1 ( 1983 ).
Ays.85 J. Aystô et al., Phys. Rev. Lett., 55, 1384 ( 1985 ).
Azu.79 R.E. Azumaetal., Phys. Rev. Lett., 43, 1652 ( 1979 ).
Bar.63 R. Barton et al., Can. J. Phys., 41, 2007 ( 1963 ).
Bau.87 P. Baumann et al., Phys. Rev., C36, 765 ( 1987 ).
Bha.77 T.S. Bhatia et al., Z. Phys., A281, 65 ( 1977 ).
Berg.84 J.F.Berger, M. Girod and D. Gogny, Nucl. Phys., A428, 230 ( 1984 ).
Ber.82 M. Bernas et al., Phys. Lett., Bl 13, 279 ( 1982 ).
Ber.84a M.Bernas et al., J. Phys. Lett., 45, L851 ( 1984 ).
Ber 84b M. Bernas et al., Nucl. Phys., A413, 363 ( 1984 ).
Bor.86 M.J.G. Borge et al., Nucl. Phys. A460, 373 ( 1986 ).
Bor.87 M.J.G. Borge et al., in Proceedings of the 5 t n Int. Conf. on Nuclei far from Stability .
Rosseau Lake CANADA ( 1987 ).
Bor.87 V. Borrel et al., I.P.N. Orsay DRE 87-18 ( 1987 ).
Bro.85 B.A. Brown, B.H. Wildenthal At. Nucl. Data Tables 33, 347 ( 1985 ).
Cab.82 M.D. Cable et al., Phys. Rev., C26, 1778 ( 1982 ).
Cab.83 M.D. Cable et al., Phys. Rev. Lett., 50, 404 ( 1983 ).
Car.82 L.C. Carraz et al., Phys. Lett., 109B, 419 ( 1982 ).
Cer.77 J. Cerny and J.C. Hardy, Ann. Rev. Nucl. Sci., 27, 333 ( 1977 ).
Chu.76 W.Chung, Ph.D. Thesis, Michigan State University, East Lansing (1976).
Chu.56 E. L. Church and J. Weneser, Phys. Rev., 103, 1035 ( 1956 ).
Dec.80 J. Déchargé and D. Gogny, Phys. Rev., C21, 1568 ( 1980 ).
Dec.83 J. Déchargé and L. Sips, Nucl. Phys., A407, 1 ( 1983 ).
Del.82 S. Delia Negra et al., Ann. Phys. Fr., 7, 149 ( 1982 ).
Del.84 B. Del Moral, Nouvelles de Ganil, N°5, p. 9, mai 1984.
Des.82 Ph. Dessagne, Thèse 3ème Cycle, I.P.N.Orsay ( 1982 ).
Det.79 C. Detraz et al, Phys. Rev. C19, 164 ( 1979 ).
Det.80 C. Detraz et al., Phys. Lett. 94B, 307 ( 1980 ).
Det.83 C. Detraz et al., Nucl. Phys. A402, 301 ( 1983 ).
Dil.73 W. Dilg et al., Nucl. Phys., A217, 269 ( 1973 ).
Ege.58 P.A. Egelstaff, Proc. Phys. Sor., 71, 910 ( 1958 ).
Eph.80 M. Epherre, G. Audi, C. Thibault and W. Benenson
Plenum Press, New-York, p.299 ( 1980 ).
Elm.78 T. Elmroth et al., Nucl. Phys., A304, 493 ( 1978 ).
Ewa.80 G.T. Ewan et al. Nucl. Phys., A343, 109 ( 1980 ).
Fif.84 L.K. Fifield et al. Nucl. Phys. A417, 534 ( 1984 ).
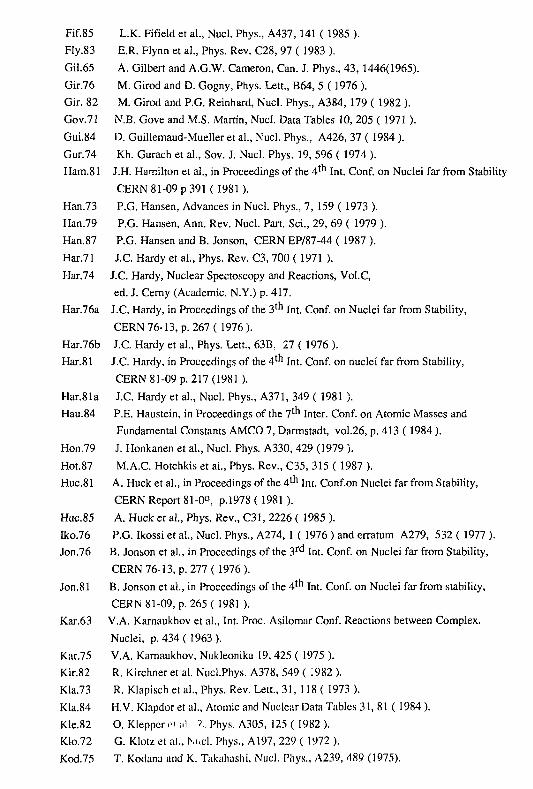
Fif.85 L.K. Fifield et al., Nucl. Phys., A437, 141 ( 1985 ). Fly.83 E.R. Flynn et al., Phys. Rev. C28, 97 ( 1983 ). Gil.65 A. Gilbert and A.G.W. Cameron, Can. J. Phys., 43, 1446(1965). Gir.76 M. Girod and D. Gogny, Phys. Lett., B64, 5 ( 1976 ). Gir. 82 M. Girod and P.G. Reinhard, Nucl. Phys., A384, 179 ( 1982 ). Gov.71 N.B. Gove and M.S. Martin, Nucl. Data Tables 10, 205 ( 1971 ). Gui.84 D. Guillemaud-Mueller et al., Nucl. Phys., A426, 37 ( 1984 ). Gur.74 Kh. Gurach et al., Sov. J. Nucl. Phys. 19, 596 ( 1974 ). Ham.81 J.H. Hamilton et al., in Proceedings of the 4 t n Int. Conf. on Nuclei far from Stability
CERN 81-09 p 391 (1981). Han.73 P.G. Hansen, Advances in Nucl. Phys., 7, 159 ( 1973 ). Han.79 P.G. Hansen, Ann. Rev. Nucl. Part. Sci., 29, 69 ( 1979 ). Han.87 P.G. Hansen and B. Jonson, CERN EP/87-44 ( 1987 ). Har.71 J.C. Hardy et al., Phys. Rev. C3, 700 ( 1971 ). Har.74 J.C. Hardy, Nuclear Spectoscopy and Reactions, Vol.C,
ed. J. Cerny (Academic. N.Y.) p. 417. Har.76a J.C. Hardy, in Proceedings of the 3" 1 Int. Conf. on Nuclei far from Stability,
CERN 76-13, p. 267 ( 1976). Har.76b J.C. Hardy et al., Phys. Lett., 63B, 27 ( 1976 ). Har.81 J.C. Hardy, in Proceedings of the 4" 1 Int. Conf. on nuclei far from Stability,
CERN 81-09 p. 217 (1981 ). Har.81 a J.C. Hardy et al., Nucl. Phys., A371, 349 ( 1981 ). Hau.84 P.E. Haustein, in Proceedings of the 7 t n Inter. Conf. on Atomic Masses and
Fundamental Constants AMCO 7, Darmstadt, vol.26, p. 413 ( 1984 ). Hon.79 J. Honkanen et al., Nucl. Phys. A330, 429 (1979 ). Hot.87 M.A.C. Hotchkis et al., Phys. Rev., C35, 315 ( 1987 ). Huc.81 A. Huck et al., in Proceedings of the 4 t " Int. Conf.on Nuclei far from Stability,
CERN Report 81-0", p. 1978 ( 1981 ). Huc.85 A. Huck et al., Phys. Rev., C31, 2226 ( 1985 ). Iko.76 P.G. Ikossi et al., Nucl. Phys., A274, 1 ( 1976 ) and erratum A279, 532 ( 1977 ). Jon.76 B. Jonson et al., in Proceedings of the 3 r d Int. Conf. on Nuclei far from Stability,
CERN 76-13, p. 277 (1976). Jon.81 B. Jonson et al., in Proceedings of the 4 1" Int. Conf. on Nuclei far from stability,
CERN 81-09, p. 265 ( 1981 ). Kar.63 V.A. Kamaukhov et al., Int. Proc. Asilomar Conf. Reactions between Complex.
Nuclei, p. 434 ( 1963 ). Kar.75 V.A. Kamaukhov, Nukleonika 19, 425 ( 1975 ). Kir.82 R. Kirchner et al. Nucl.Phys. A378, 549 ( 1982 ). Kla.73 R. Klapisch et al., Phys. Rev. Lett., 31, 118 ( 1973 ). Kla.84 H.V. Klapdor et al., Atomic and Nuclear Data Tables 31,81 ( 1984). Kle.82 O. Klepper n ;.l. '/.. Phys. A305, 125 ( 1982 ). Klo.72 G. Klotz et al., Nucl. Phys., A197, 229 ( 1972 ). Kod.75 T. Kodana and K. Takahashi, Nucl. Phys., A239, 489 (1975).
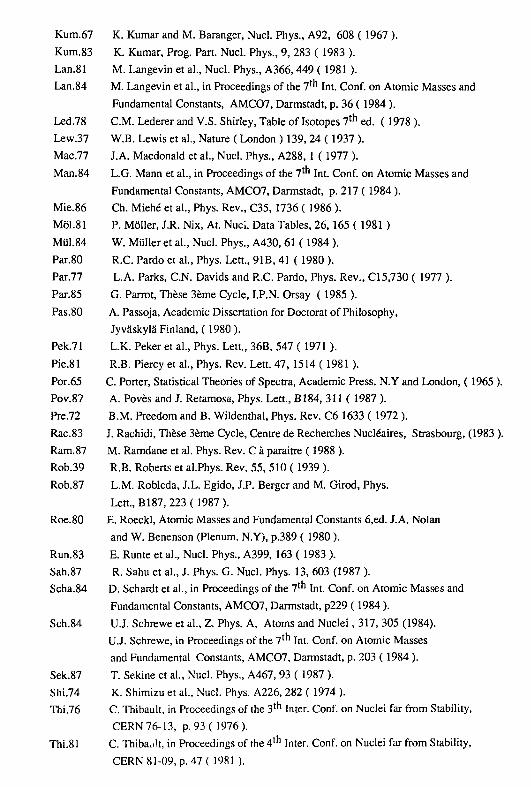
.67 K. Kumar and M. Baranger, Nucl. Phys., A92, 608 ( 1967 ).
Kum.83 K. Kumar, Prog. Pan. Nucl. Phys., 9, 283 ( 1983 ).
Lan.81 M. Langevin et al., Nucl. Phys., A366, 449 ( 1981 ).
Lan.84 M. Langevin et al., in Proceedings of the 7 t n Int. Conf. on Atomic Masses and
Fundamental Constants, AMC07, Darmstadt, p. 36 ( 1984 ).
Led.78 CM. Lederer and V.S. Shirley, Table of Isotopes 7 t h ed. ( 1978 ).
Lew.37 W.B. Lewis et al., Nature ( London ) 139, 24 ( 1937 ).
Mac.77 J.A. Macdonald et al., Nucl. Phys., A288, 1 ( 1977 ).
Man. 84 L.G. Mann et al., in Proceedings of the 7" 1 Int. Conf. on Atomic Masses and
Fundamental Constants, AMC07, Darmstadt, p. 217 ( 1984 ).
Mie.86 Ch. Miehé et al., Phys. Rev., C35, 1736 ( 1986 ).
Môl.81 P. Môller, J.R. Nix, At. Nuci. Data Tables, 26,165 ( 1981 )
Miil.84 W. Millier et al., Nucl. Phys., A430, 61 ( 1984 ).
Par.80 R.C. Pardo et al., Phys. Lett., 91B, 41 ( 1980 ).
Par.77 L.A. Parks, C.N. Davids and R.C. Pardo, Phys. Rev., CI5,730 ( 1977 ).
Par.85 G. Parrot, Thèse 3ème Cycle, I.P.N. Orsay ( 1985 ).
Pas.80 A. Passoja, Academic Dissertation for Doctorat of Philosophy,
Jyvaskyla Finland, ( 1980 ).
Pek.71 L.K. Peker et al., Phys. Lett., 36B, 547 ( 1971 ).
Pie.81 R.B. Piercy et al., Phys. Rev. Lett. 47, 1514 ( 1981 ).
Por.65 C. Porter, Statistical Theories of Spectra, Academic Press. N.Y and London, ( 1965 ).
Pov.87 A. Povès and J. Retamosa, Phys. Lett., B184, 311 ( 1987 ).
Pre.72 B.M. Preedom and B. Wildenthal, Phys. Rev. C6 1633 ( 1972 ).
Rac.83 J. Rachidi, Thèse 3ème Cycle, Centre de Recherches Nucléaires, Strasbourg, (1983 ).
Ram.87 M. Ramdane et al. Phys. Rev. C à paraître ( 1988 ).
Rob.39 R.B. Roberts et al.Phys. Rev. 55, 510 ( 1939 ).
Rob.87 L.M. Robleda, J.L. Egido, J.P. Berger and M. Girod, Phys.
Lett., B187, 223(1987).
Roe.80 E. Roeckl, Atomic Masses and Fundamental Constants 6,ed. J.A. Nolan
and W. Benenson (Plenum. N.Y), p.389 ( 1980 ).
Run.83 E. Runte et al., Nucl. Phys., A399, 163 ( 1983 ).
Sah.87 R. Sahu et al., J. Phys. G. Nucl. Phys. 13, 603 (1987 ).
Scha.84 D. Schardt et al., in Proceedings of the 7 t n Int. Conf. on Atomic Masses and
Fundamental Constants, AMC07, Darmstadt, p229 ( 1984 ).
Sch.84 U.J. Schrewe et al., Z. Phys. A, Atoms and Nuclei, 317, 305 (1984).
U.J. Schrewe, in Proceedings of the 7 t n Int. Conf. on Atomic Masses
and Fundamental Constants, AMC07, Darmstadt, p. 203 ( 1984 ).
Sek.87 T. Sekine et al, Nucl. Phys., A467, 93 ( 1987 ).
Shi.74 K. Shimizu et al., Nucl. Phys. A226, 282 ( 1974 ).
Thi.76 C. Thibault, in Proceedings of the 3 t h Inter. Conf. on Nuclei far from Stability,
CERN 76-13, p.93( 1976).
Thi.81 C. Thibaut, in Proceedings of the 4 t n Inter. Conf. on Nuclei far from Stability,
CERN 81-09, p. 47 ( 1981 ).
Tru.70 J.W. Truran, A.G.W. Cameron and E. Hilf, CERN Report 70-30, p. 275 ( 1970 ). Uno.82 M. Uno, M. Yamada, I.N.S. Report, NUMA ( 1982 ). Vie.87 K. Vierinen, Nucl.Phys., A463, 605 ( 1987 ). Wap.85 A. Wapstra and G. Audi, Nucl. Phys., A432, 1 ( 1985 ). Wil.80 B.H. Wildenthal and W. Chung, The ( pn ) Reactions and the
Nucleon-Nucleon Force ( ed. CD. Goodman et al. ), Pier >mN.Y. p. 89 ( 1980 ). Wil.83 B.H. Wildenthal et al., Phys. Rev., C28, 1343 ( 1983 ). Wil.83 B.H. Wildenthal, Progr. Part. Nucl. Phys. 11, 5 ( 1983 ). Zie.81 W. Ziegert et al., in Proceedings of the 4 1" Int. Conf. on Nuclei far from Stability,
CERN 81-09, p.327( 1981 ).

APPENDICE

PUBLICATION I
Nuclear Physics A443 (1985) 2X3-301 CERN © North-Holland Publishing Company SERVICE D'INFORMATION
SCIENTIFIQUE
STUDY OF THE GIANT GAMOW-TELLER RESONANCE IN NUCLEAR 0-DECAY;
The case of 1 2Ar
T. BJORNSTADJ, M.J.G. BORCJLhA', P. DESSAGNEd. R.-D. VON DINCKLAGE". G.T. EWANC, P.O. HANSEN', A. HUCK'', B. JONSON h j e, G. KLOTZ'1.
A. KNIPPER1', P.O. LARSSON*. G. NYMAN*. H.L. RAVNh, C. RICHARD-SFRRE", K. RIISAGER', D. SCHARDT' and G. WALTER"1
and The ISOLDE Collaboration
1 University of Bergen, Bergen, Norway h CERN, Geneva, Switzerland *•' Cat. de F, Atômica v Nuclear. Far. C. Fish-as. Univ. Complutense. Madrid, Spain '' Centre de Rechercher Nucléaires. Strasbourg. France e Department of Physics, Queen's University, Kingston. Ontario, Canada I Institute of Physics. University of Aarhus, Aarhus, Denmark * Department of Physics, Chalmers University of Technology. Giitehorg. Sweden II IN2P3, Strasbourg, France, and CFRN, Geneva, Switzerland ' Gesellschaft fiir Schwerionenforschung, Damstadt, Fed. Rep. Germany
Received 4 March 198? (Revised 6 May I9K5)
Abstract: Delayed prolon ! ammu emissions following Ihe 0-decay of i : Ar have been studied. The half-life of > ?Ar is M : - f is, and the T -2 analogue state in , ; CI lies al the excitation energy 5036 i 12 KCV. From .h. ••.-. nsity of the feeding to this stale the proton intensities can he converted to an ahsolute scale leat .g to a total proton branching ratio of (43 i 3)"«>. From proton-gamma coincidence measurements il emerges that (1.9 r 0.21".. of the protons lead to the first-excited stale in l | S . A level scheme up to 8.75 MeV excitation in , : ( ' l has hcen constructed and the Gamow-Teller strength function has heen deduced. The result is a renormalization of the axial-vector strength to (49 : ">)"•» of the free-nucléon value.
RADIOACTIVITY ''Ar (0*p) [from J"Ca (p,3p(>nl rciiciion]; measured /J-delayed /-",,. /,„ Fy, ty, py-eoin. '"Ar deduced T, ,, proton branching ratio, fi strength function. CaO target,
Cie. surface barrier Si. Csl detectors. On-line mass separation.
1. Introduction
The most proton-rich nuclei known have a proton excess of 4, corresponding to an isospin projection T/ - '( N - Z) = - 2 . In the following the first detailed investigation of such an excotic nucleus ') , ^;Ar, is presented. The special motivation behind this work is that it is essentially only in nuclei with Z > N that the main part of the allowed 0-decay strength, traditionally referred to as the super-allowed decay.
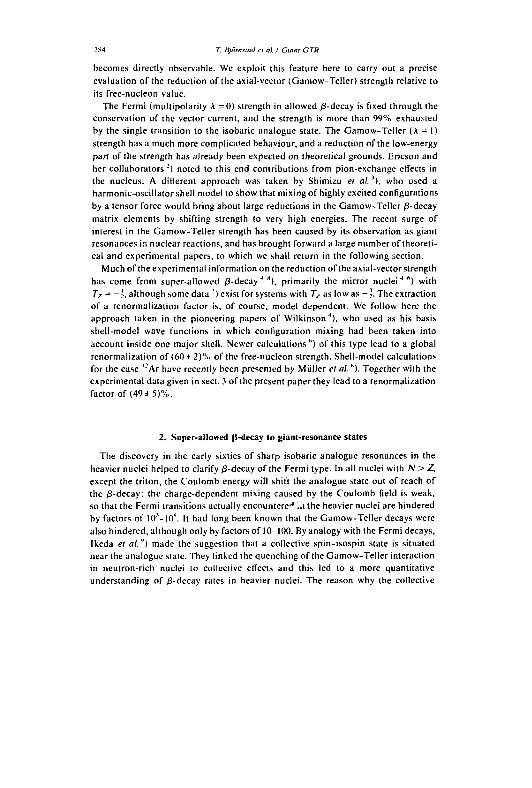
:X4 7: lljiirnsiad el al. I Giant GTR
becomes directly observable. We exploit this feature here to carry out a precise evaluation of the reduction of the axial-vector (Gamow-Teller) strength relative to its free-nucleon value.
The Fermi (multipolarity A =0) strength in allowed /3-decay is fixed through the conservation of the vector current, and the strength is more than 99% exhausted by the single transition to the isobaric analogue state. The Gamow-Teller (A = 1) strength has a much more complicated behaviour, and a reduction of the low-energy part of the strength has already been expected on theoretical grounds. Ericson and her collaborators 2) noted to this end contributions from pion-exchange effects in the nucleus. A different approach was taken by Shimizu et ai), who used a harmonic-oscillator shell model to show that mixing of highly excited configurations by a tensor force would bring about large reductions in the Gamow-Teller /3-decay matrix elements by shifting strength to very high energies. The recent surge of interest in the Gamow-Teller strength has been caused by its observation as giant resonances in nuclear reactions, and has brought forward a large number of theoretical and experimental papers, to which we shall return in the following section.
Much of the experimental information on the reduction of the axial-vector strength has come from super-allowed /3-decay 4*), primarily the mirror nucle i 4 ") with T7 - - i , although some data ') exist for systems with T, as low as - ]. The extraction of a renormalization factor is, of course, model dependent. We follow here the approach taken in the pioneering papers of Wilkinson 4), who used as his basis shell-model wave functions in which configuration mixing had been taken into account inside one major shell. Newer calculations1') of this type lead to a global renormalization of (60 12)% of the free-nucleon strength. Shell-model calculations for the case '"Ar have recently been presented by Miiller el al. "). Together with the experimental data given in sect. 3 of the present paper they lead to a renormalization factor of (49 ±5 )%.
2. Super-allowed (3-decay to giant-resonance states
The discovery in the early sixties of sharp isobaric analogue resonances in the heavier nuclei helped to clarify /3-decay of the Fermi type. In all nuclei with N > Z, except the triton, the Coulomb energy will shift the analogue state out of reach of the /3-decay: the charge-dependent mixing caused by the Coulomb field is weak, so that the Fermi transitions actually encounterc* ..i the heavier nuclei are hindered by factors of If)'-10*. It had long been known that the Gamow-Teller decays were also hindered, although only by factors of 10-100. By analogy with the Fermi decays, Ikeda el al.") made the suggestion that a collective spin-isospin state is situated near the analogue state. They linked the quenching of the Gamow-Teller interaction in neutron-rich nuclei to collective etlects and this led to a more quantitative understanding of /3-decay rates in heavier nuclei. The reason why the collective
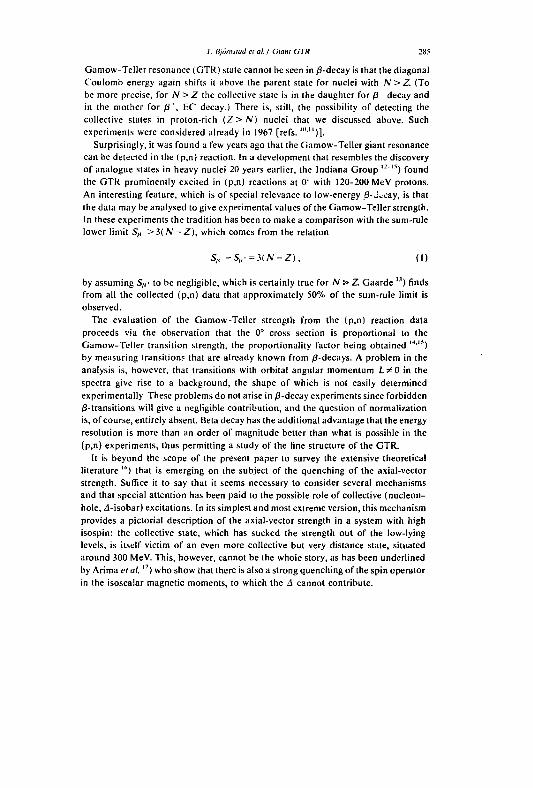
T. lijiirmlail el al. / Giant GTR 285
Gamow-Teller resonance (GTR) state cannot be seen in /3-decay is that the diagonal Coulomb energy again shifts it above the parent state for nuclei with N > Z. (To be more precise, for N > Z the collective slate is in the daughter for fi decay and in the mother for /', EC decay.) There is, still, the possibility of detecting the collective states in proton-rich (Z>N) nuclei that we discussed above. Such experiments were considered already in 1967 [refs. ' " ' " ) ] .
Surprisingly, it was found a few years ago that the Gamow-Teller giant resonance can be detected in the (p,n) reaction. In a development that resembles the discovery of analogue states in heavy nuclei 20 years earlier, the Indiana Group " " ) found the GTR prominently excited in (p,n) reactions at 0° with 120-200 MeV protons. An interesting feature, which is of special relevance to low-energy 3-Jccay, is that the data may be analysed to give experimental values of the Gamow-Teller strength. In these experiments the tradition has been to make a comparison with the sum-rule lower limit Sp > 3 ( / V - Z ) , which comes from the relation
S„ -S„-=MN-Z), (1)
by assuming S / ( ' to be negligible, which is certainly true for N» Z. Gaarde ") finds from all the collected (p,n) data that approximately 50% of the sum-rule limit is observed.
The evaluation of the Gamow-Teller strength from the (p,n) reaction data proceeds via the observation that the 0° cross section is proportional to the Gamow-Teller transition strength, the proportionality factor being obtained l 4 ' " ) by measuring transitions that are already known from /3-decays. A problem in the analysis is, however, that transitions with orbital angular momentum i * 0 in the spectra give rise to a background, the shape of which is not easily determined experimentally These problems do not arise in /8-decay experiments since forbidden ^-transitions will give a negligible contribution, and the question of normalization is, of course, entirely absent. Beta decay has the additional advantage that the energy resolution is more than an order of magnitude better than what is possible in the (p,n) experiments, thus permitting a study of the fine structure of the GTR.
It is beyond the scope of the present paper to survey the extensive theoretical literature l A ) that is emerging on the subject of the quenching of the axial-vector strength. Suffice it to say that it seems necessary to consider several mechanisms and that special attention has been paid to the possible role of collective (nucleon-hole, 4-isobar) excitations. In its simplest and most extreme version, this mechanism provides a pictorial description of the axial-vector strength in a system with high isospin: the collective state, which has sucked the strength out of the low-lying levels, is itself victim of an even more collective but very distance state, situated around 300 MeV. This, however, cannot be the whole story, as has been underlined by Arima et ai'1) who show that there is also a strong quenching of the spin operator in the isoscalar magnetic moments, to which the A cannot contribute.
2K6 T. Hjiinmud « al. I Giant GTR
3. Experimental techniques and results
.VI. PRODUCTION OH NiiUTRON-DhHClkNT ARGON ISOTOPES
Neutron-delicieni argon isotopes were obtained in spallation reactions in a target bombarded with a 2.4 u.A beam of 600 MeV protons from the CERN Synchrocyclotron and subsequently mass-separated in the ISOLDE on-line isotope separator facility. A major experimental difficulty was to have large enough yields for a detailed study, and the choice of the target material and its combination with the ion source was therefore crucial.
The first experimental ') study of the T, = - 2 nuclide l ; Ar was based on a target consisting of va.iadium carbide IVC) powder. The elfective thickness of vanadium was 38 g/cm 2 and the reaction M V(p,6pl4n) ' ; Ar, which has a relatively low cross section, gave an observed production yield of about 0.2 atoms per second. Phis can be improved by choosing a target with a higher cross section for production of Ar, such as K or Ca. Potassium and its compounds are too volatile to be used as target materials and only C'aB,, and CaO were found to be sufficiently refractory. The cross-section gain by using the 4"('a(p, 3p6n| l 2 Ar reaction was calculated '*) to be a factor of 10-100. A first test used a calcium hexaboride (CaB„l target matrix kept at a temperature of 1500T. With a thickness equivalent of4.9gC'a/cnV this design gave an improvement of the argon yield by two orders of magnitude. The best result was, however, obtained with a calcium oxide (CaOl target kept at 1900%". With 6.5 g C'a/cm 2, this material gave a maximum yield of 500 atoms per second of "Ar. The complete production yield curve normalized to a 1 u,A proton-beam current is shown in tig. 1. The design of Ihe hot C'aO target is very complex. As the target material is highly corrosive at I900°C it had to be kept in a tantalum cylinder lined on the inside with rhenium. The target ''') was connected to a plasma ion source of FEBIAD type via a line kept at a much lower temperature (250 "CI than the target and t; e ion source. In order to achieve this, the line was enclosed in a copper block acting as a heat sink, so that only argon nuclides could pass through the tube while all neighbouring elements were retained through condensation or chemical reactions. The beam of pure Ar' ions from the ion source was accelerated to 60 keV and separated into its constituent atomic masses by the ISOLDE electromagnetic isotope separator 2"). The ion beam was linally directed via an external beam-line into the measuring equipment.
3.:. MI:ASHRI;MI:NT OH HAI.I -I.in-, AMI) /',. VAUT.
In order to determine the "Ar half-life a C'sl crystal was used. In such a crystal the recorded 0 ' and proton pulses can be identified by pulse-shape discrimination, a technique which is described elsewhere : | | . The crystal used in the present experiment had a diameter of IS mm and a thickness of 2 mm. Its discrimination properties
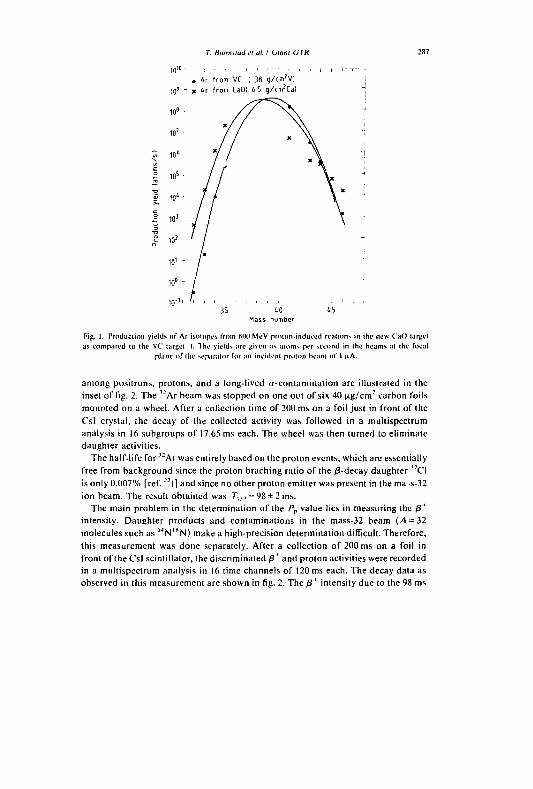
T. liiurtHtad VI ut I Giant GTR 287
i o " > - ••
. Ar from VC I 38 g /cm 2 VI 10' " x Ar from CaOl 6 5 g/cm 2Ca)
10s '
1 0 ' •
^ 10*
I ,()5 ' I 1o1" I 10J -•o
I 10* 10' -
io° -
10-'' 35 1.0 45
Mass number
Fig. 1. Production yields of Ar isotopes from odd MeV proton-induced rcalions in the new Cat) largel as compared lo the V f target ' ) . The yields are given as moms per second in the beams at the local
plane o f tlie separator for an incident proton beam of I u.A.
among positrons, protons, and a long-lived «-contamination are illustrated in the inset of fig. 2. The '"Ar beam was stopped on one out of six 40 |j.g/cm ; carbon foils mounted on a wheel. After a collection time of 200 ms on a foil just in front of the Csl crystal, the decay of the collected activity was followed in a multispectrum analysis in 16 subgroups of 17.65 ms each. The wheel was then turned to eliminate daughter activities.
The half-life for 1 2 Ar was entirely based on the proton events, which are essentially free from background since the proton braching ratio of the /3-decay daughter "CI is only 0.007% [ref. " ) ] and since no other proton emitter was present in the ma -s-32 ion beam. The result obtained was T, / :, = 98±2 ms.
The main problem in the determination of the Pp value lies in measuring the /? * intensity. Daughter products and contaminations in the mass-32 beam (/4 = 32 molecules such as '"N'*N) make a high-precision determination difficult. Therefore, this measurement was done separately. After a collection of 200 ms on a foil in front of the Csl scintillator, the discriminated (3 ' and proton activities were recorded in a multispectrum analysis in 16 time channels of 120 ms each. The decay data as observed in this measurement are shown in fig. 2. The /3 ' intensity due to the 98 ms
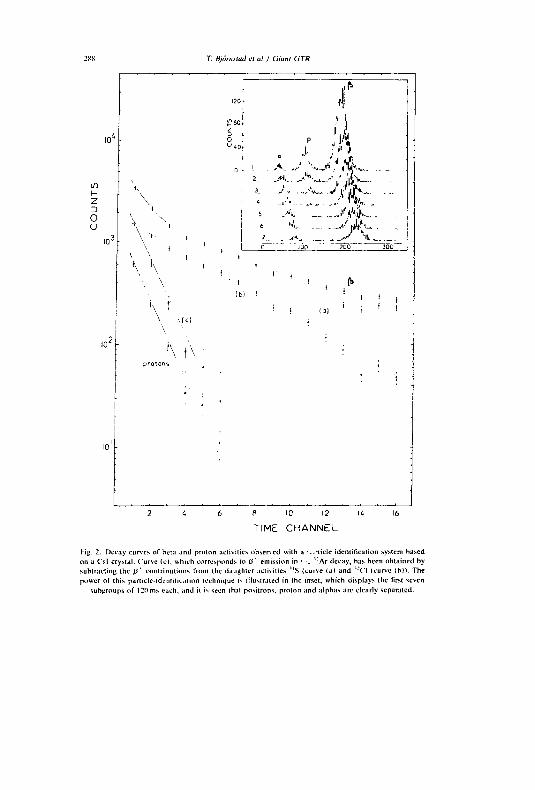
T. lijiirnMiul ft ni. / Giant GTR
Z D o (J
•
120 •
120 £ 1 £80 z
! M I i1
D 0 p Vi U 4 0 J- ;•'* 0 . . Jt 4.
D i A . J --.J*. /fe. 2. . H , . > v 1 . . y , - . ' ^ - — ^
t ,
\ f \ \ 5 > . , - , / ^ . _
V '. >.. . ..•*. ^ ^ V ^ t
i i
1 j
0 100 2 0 0 300 t i
i
1 j
t
\ \ 1 (b
\ r . . '•• ! l a ) ! • ' " t - .
\ ( c )
•\ t\
6 f1 10 12
TIME CHANNEL
Fig. 2. Decay curves of beta and proion activities ohserved with a : . . . t ic le identification system based on a ("si crystal. Curve (c), which corresponds lo fi ' emission in r . ' "Ar decay, has been obtained by subtracting the 8 ' contributions from the daughter activities " S (curve (a) and , ? ( ' l (curve lb)) . The power of this particle-idenrilicalion technique is illustrated in the inset, which displays (he first seven
subgroups of 121) ms each, and it is seen thai positrons, proton and alphas are clearly separated.
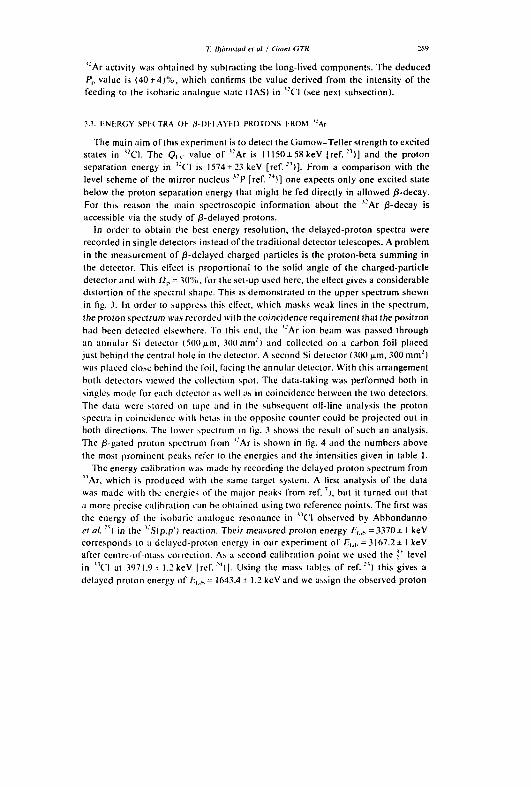
7. Hjânntad rt al. I (imnl CTR :89
'"'Ar activity was obtained by subtracting the long-l ived components. The deduced
P p value is ( 4 0 : t 4 ) % , which confirms the value derived f rom the intensity o f the
feeding to the isobaric analogue state I IAS) in , ? C I (see next subsection).
.1.3. KNhRGY SIM.CTRA OF 0-DH.AYM) PROTONS IROM , JAr
The main aim o f this experiment is to detect the Gamow-Tel le r strength to excited
states in " C I . The <?,< value of , ; A r is 11150±58keV [ r e f . : ' ) ] and the proton
separation energy in '"CI is 1574± 23 keV [ref. " ' ) ] . From a comparison wi th the
level scheme o f the mir ror nucleus , : P [ r e f . 2 4 ) ] one expects only one excited state
below the proton separation energy that might be fed directly in al lowed /3-decay.
For this reason the main spectroscopic in format ion about the , : A r /3-decay is
accessible via the study o f /3-delayed protons.
In order to obtain the best energy resolut ion, the delayed-proton spectra were
recorded in single detectors instead of the tradit ional detector telescopes. A problem
in the measurement of ^-delayed charged particles is the proton-beta summing in
the detector. This elfect is proport ional to the solid angle o f the charged-particle
detector and wi th i2t,~- 30'%», for the set-up used here, the effect gives a considerable
distort ion o f the spectral shape. This is demonstrated in the upper spectrum shown
in fig. 3. In order to suppress this elfect, which masks weak lines in the spectrum,
the proton spectrum was recorded wi th the coincidence requirement that the positron
had been detected elsewhere. To this end, the ' ' A r ion beam was passed through
an annular Si detector (500 (xm, 300 mm") and collected on a carbon fo i l placed
just behind the central hole in the detector. A second Si detector (300 | i m , 300 mm")
was placed close behind the fo i l , facing the annular detector. Wi th this arrangement
both detectors viewed the collection spot. The data-taking was performed both in
singles mode for each detector as well as in coincidence between the two detectors.
The data were stored on tape and in the subsequent off-l ine analysis the proton
spectra in coincidence wi th betas in the opposite counter could be projected out in
both directions. The lower spectrum in l ig. 3 shows the result o f such an analysis.
The /3-gated proton spectrum from '"Ar is shown in l ig. 4 and the numbers above
the most prominent peaks refer to the energies and the intensities given in table 1.
The energy cal ibrat ion was made by recording the delayed proton spectrum f rom
" A r , which is produced wi th the same target system. A first analysis o f the data
was made wi th the energies o f the major peaks f rom re f . 7 ) , but it turned out that
a more precise cal ibrat ion can be obtained using two reference points. The first was
the energy o f the isobaric analogue resonance in " C I observed by Abbondanno
et al. " ) in the , : S(p,p ' ) reaction. Their measured proton energy £,.,,, = 3370± 1 keV
corresponds to a delayed-proton energy in our experiment o f F.Lli, = 3167.2 ± 1 keV
after centre-of-mass correction. As a second cal ibrat ion point we used the ; ' level
in " C I at 3 9 7 1 . 9 i l . 2 k e V [ref. " ' ' ) ] . Using the mass tables of ref. "'') this gives a
delayed proton energy o f /?,.,,, - 1643.4 ± 1.2 keV and we assign the observed proton
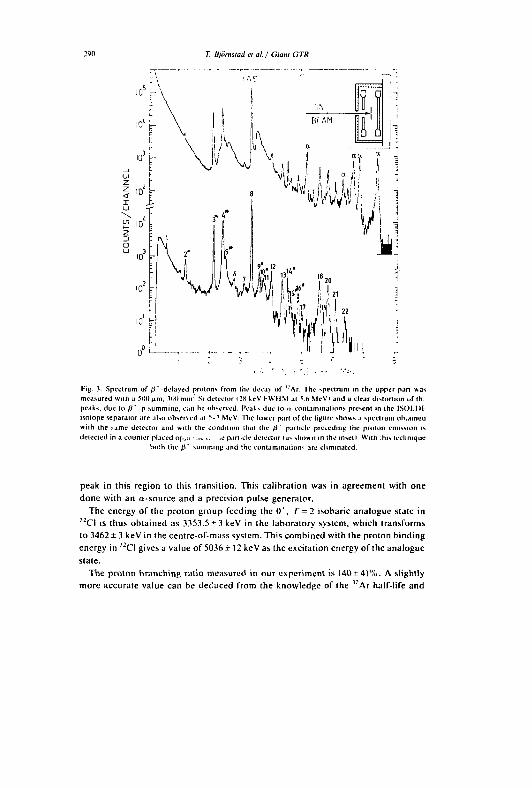
T. tljârmlad el al. / Ciaitl CTR
Ri AM 10 U | Il I , ». M
\f> MA' il :
1 n 1
9 .12
. i i .i j II;
Kig. .V Spectrum of fi ' -delayed proions from the decay of '" Ar. The spectrum in the upper pah was measured with a 500 ^m. .100 mm'" Si detector I 2X keV l-WMM at 5.6 MeVi and a clear distortion i.f th. peaks, due lo p' -p summing, can he observed. Peaks due lo o-conlammations present in ihc ISOLDf-isolope separaior are also ohserved al 5-7 MeV. The lower part of the ligure shows a spectrum obiainea with the Mine detector and with the condition thai the (i' particle preceding the proton emission is delected in a counter placed ori,;; •-:.- .. ..e panicle detector las shown in the insetl With :his technique
both the fi' summmy and the contaminations are eliminated.
peak in this region to this transition. This calibration was in agreement with one done with an «-source and a precision pulse generator.
The energy of the proton group feeding the 0 ' , 7~ = 2 isobaric analogue state in 3 2CI is thus obtained as 3353.5 + 3 keV in the laboratory system, which transforms to 3462 ±3 keV in the centre-of-mass system. This combined with the proton binding energy in 1 2CI gives a value of 5036 ± I2keVas the excitation energy of the analogue state.
The proton branching ratio measured in our experiment is (40±4)%. A slightly more accurate value can be deduced from the knowledge of the , : A r half-life and
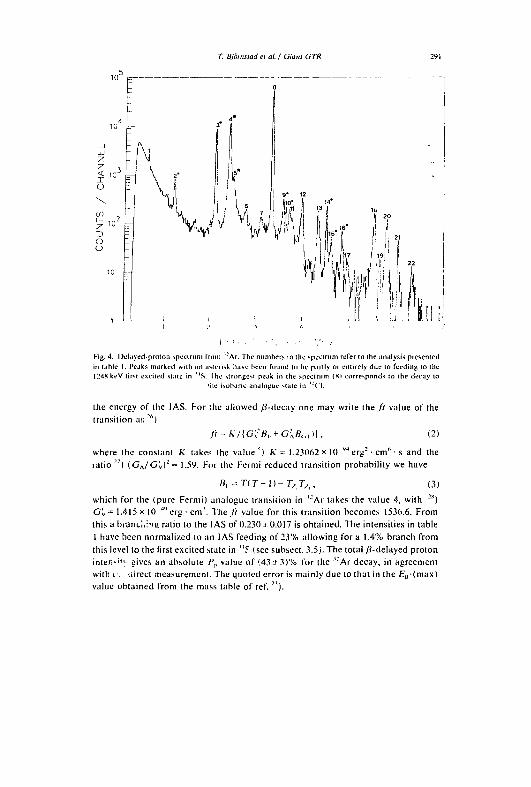
T. Bjôrnslad et al. / Giant GTR 291
Fig. 4. Pelayed-proton spectrum from ''Ar. The numbers in the spectrum refer to the analysis presented in table I. Peaks marked with an asterisk have been found to he partly or entirely due to feeding to the !24KkeV first exciled slate in "S. the strongest peak in the spectrum (SI corresponds to ihe decay to
'he isohurie analogue stale in W I.
the energy of the IAS. For the allowed /3-decay one may write t h e / / value of the transition as : ' ')
,/t = A:/C; rB,. + C;;B < , , ) l , (2)
where the constant K takes the value ') K = 1.23062 x 10 " 4 e rg 2 • cm" • s and the ra t io 2 7 ) ( G A / G V ) ; = 1.59. For the Fermi reduced transition probability we have
l)l^TT+])-T^Ty:, (3)
which for the (pure Fermi) analogue Iransition in '~*Ar takes the value 4, with !") Gv= 1.415x10 " e r g - c m ' . The ft value for this transition becomes 1536.6. From this a brancl.:nt> ratio to the IAS of 0.230x0.017 is obtained. The intensities in table 1 have been normalized to an IAS feeding of 23% allowing for a 1.4% branch from this level to the first excited state in "F (see subsect. 3.5;. The total /3-deIayed proton inten'-1'^ sives an absolute />, value of (43 ± 31% for the 1 : Ar decay, in agreement with i: '.iirect measurement. The quoted error is mainly due to that in the E„(max) value obtained from the mass table of ref . 3 < ) .
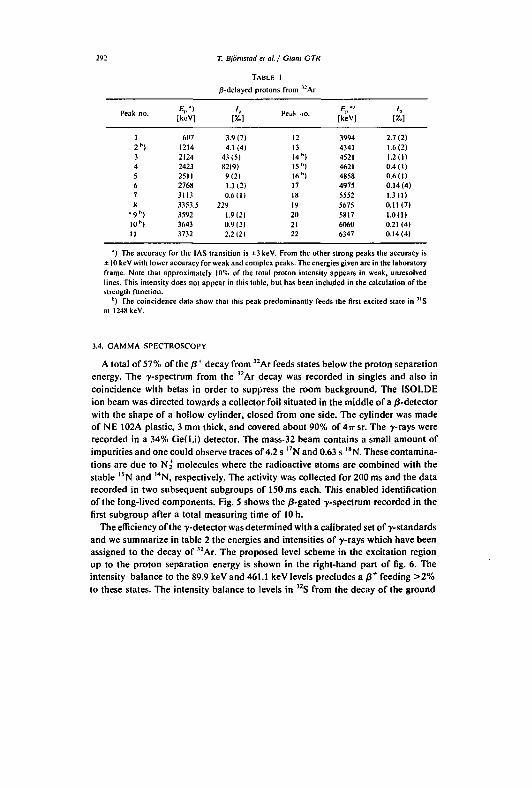
292 T. Bjôrnstad et al / Giant GTR
TABLE 1 /3-delayed protons from 3 2Ar
ak no. [keV] Peak co. V [keV] 1,
1 607 3.9(7) 12 3994 2.7(2) 2") 1214 4.1 (4) 13 4341 1.6(2) 3 2124 43(5) 14") 4521 1.2(1) 4 242.1 82(9) 15") 4621 0.4(1) 5 2SII 9(2) 16 h ) 4858 0.6(1) 6 2768 1.3(2) 17 4975 0.14(4) 7 3113 0.6 ( 11 18 5552 1.3(1) 8 3353.5 229 19 5675 0.11(7)
•9") 3592 1.9(2) 20 5817 1.0(1) 10 b ) 3643 0.9(2) 21 6060 0.21 (4) 11 3732 2.2(2) 22 6347 0.14(4)
") The accuracy for the IAS transition is ±3 keV. From the other strong peaks the accuracy is ±10 keV with lower accuracy for weak and complex peaks. The energies given are in the laboratory frame. Note that approximately 10% of the total proton intensity appears in weak, unresolved lines. This intensity does not appear in this table, but has been included in the calculation of the strength function.
h) The coincidence data show that this peak predominantly feeds the first excited state in 3 I S at 1248keV.
3.4. GAMMA SPECTROSCOPY
A total of 57% of the /8 + decay from , 2 Ar feeds states below the proton separation energy. The y-spectrum from the , 2Ar decay was recorded in singles and also in coincidence with betas in order to suppress the room background. The ISOLDE ion beam was directed towards a collector foil situated in the middle of a /3-detector with the shape of a hollow cylinder, closed from one side. The cylinder was made of NE 102A plastic, 3 mm thick, and covered about 90% of 4irsr. The y-rays were recorded in a 34% Ge(Li) detector. The mass-32 beam contains a small amount of impurities and one could observe traces of 4.2 s l 7 N and 0.63 s > 8 N. These contaminations are due to N j molecules where the radioactive atoms are combined with the stable l 5 N and , 4 N , respectively. The activity was collected for 200 ms and the data recorded in two subsequent subgroups of 150 ms each. This enabled identification of the long-lived components. Fig. 5 shows the jS-gated y-spectrum recorded in the first subgroup after a total measuring time of lOh.
The efficiency of the y-detector was determined with a calibrated set of y-standards and we summarize in table 2 the energies and intensities of y-rays which have been assigned to the decay of 1 2Ar. The proposed level scheme in the excitation region up to the proton separation energy is shown in the right-hand part of fig. 6. The intensity balance to the 89.9 keV and 461.1 keV levels precludes a / 3 + feeding >2% to these states. The intensity balance to levels in 3 2 S from the decay of the ground
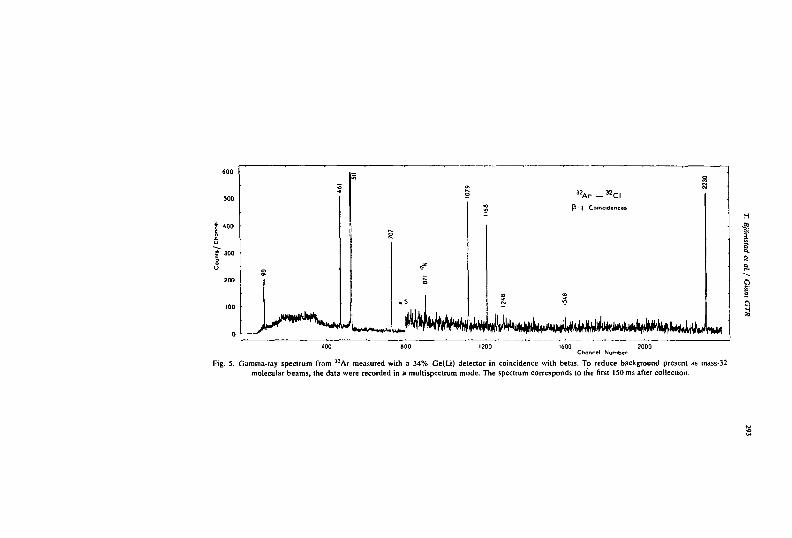
" A r — " C l
P J Coincidences
M^j4xk*Mi*y^^^:v.u^^ 1200 1600 2000
Channel Number
Fig. 5. Gamma-ray spectrum from ï 2 A r measured with a 34% Ge(Li) detector in coincidence with betas. To reduce background present as mass-32 molecular beams, the data were recorded in a multispectrum mode. The spectrum corresponds to the first 150 ms after collection.
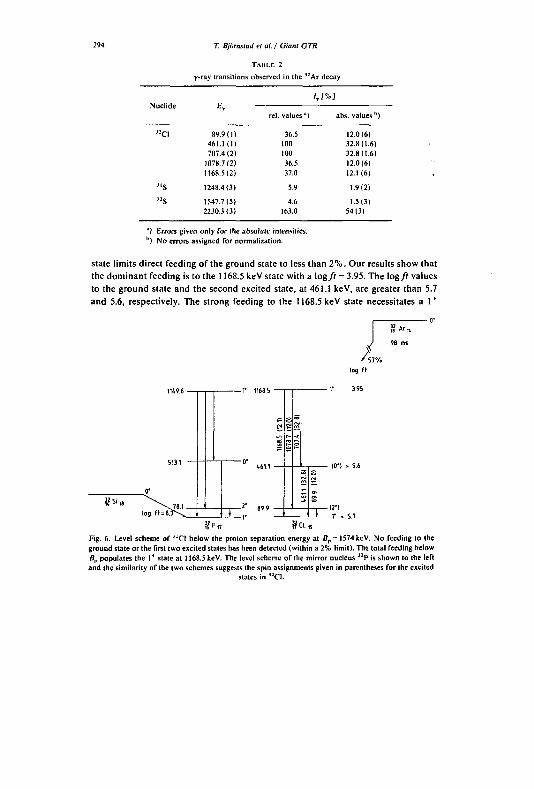
T. Bjàrnslad el al. / Giant OTR
TABLE 2
y-ray transitions observed in the ï 2 Ar decay
/ , [%] Nuclide E, Nuclide E,
rel. values ") abs. values h )
«CI 89.9(1) 36.5 12.0(6) 461.1 II) too 32.8(1.6) 707.4(2) 100 32.8(1.6)
1078.7(2) 36.5 12.0(61 1168.5(2) 37.0 12.1(6)
"S 1248.4(3) 5.9 1.9(2)
"S 1547.7(5) 4.6 1.5(3) 2230.3(3) 163.0 54(3)
u ) Errors given only for the absolute intensities. b ) No errors assigned for normalization.
state limits direct feeding of the ground state to less than 2%. Our results show that the dominant feeding is to the 1168.5 keV state with a log// = 3.95. The log/f values to the ground state and the second excited state, at 461.1 keV, are greater than 5.7 and 5.6, respectively. The strong feeding to the 1168.5 keV state necessitates a 1*
A log ft
«Si ,
£Pl7 r/CL,
(0*1 * 5.6
Fig. 6. Level scheme of -'-CI below the proton separation energy at Bp= 1574keV. No feeding to the ground state or the first two excited states has heen detected (within a 2% limit). The total feeding below Bp populates the 1 "* state at 1168.5 keV. The level scheme of the mirror nucleus ",2P is shown to the left and the similarity of the two schemes suggests the spin assignments given in parentheses for the excited
states in " C I .
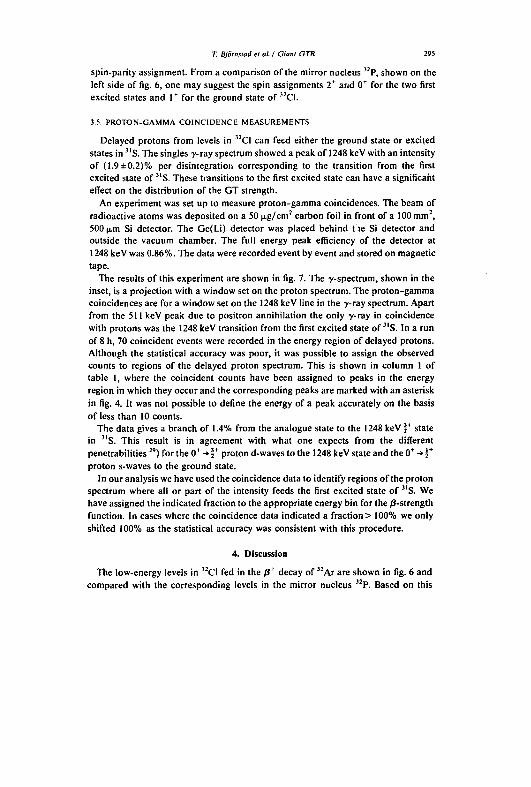
T. Bjômsiad el al. / Giant OTR 295
spin-parity assignment. From a comparison of the mirror nucleus 3 2 P, shown on the left side of fig. 6, one may suggest the spin assignments 2 + and 0 + for the two first excited states and 1 * for the ground state of 32C1.
3.5. PROTON-GAMMA COINCIDENCE MEASUREMENTS
Delayed protons from levels in 32C1 can feed either the ground state or excited states in 3 , S. The singles 7-ray spectrum showed a peak of 1248 keV with an intensity of (1.9±0.2)% per disintegration corresponding to the transition from the first excited state of 3 1S. These transitions to the first excited state can have a significant effect on the distribution of the GT strength.
An experiment was set up to measure proton-gamma coincidences. The beam of radioactive atoms was deposited on a 50 u,g/cm2 carbon foil in front of a 100 mm2, 500 u.m Si detector. The Ge(Li) detector was placed behind tie Si detector and outside the vacuum chamber. The full energy peak efficiency of the detector at 1248 keV was 0.86%. The data were recorded event by event and stored on magnetic tape.
The results of this experiment are shown in fig. 7. The •y-spectrum, shown in the inset, is a projection with a window set on the proton spectrum. The proton-gamma coincidences are for a window set on the 1248 keV line in the y-ray spectrum. Apart from the 511 keV peak due to positron annihilation the only y-ray in coincidence with protons was the 1248 keV transition from the first excited state of "S. In a run of 8 h, 70 coincident events were recorded in the energy region of delayed protons. Although the statistical accuracy was poor, it was possible to assign the observed counts to regions of the delayed proton spectrum. This is shown in column 1 of table 1, where the coincident counts have been assigned to peaks in the energy region in which they occur and the corresponding peaks are marked with an asterisk in fig. 4. It was not possible to define the energy of a peak accurately on the basis of less than 10 counts.
The data gives a branch of 1.4% from the analogue state to the 1248 keV \* state in "S. This result is in agreement with what one expects from the different penetrabilities2°) for the 0 + -» 1+ proton d-waves to the 1248 keV state and the 0 + -» \* proton s-waves to the ground state.
In our analysis we have used the coincidence data to identify regions of the proton spectrum where all or part of the intensity feeds the first excited state of 3 , S. We have assigned the indicated fraction to the appropriate energy bin for the ^-strength function. In cases where the coincidence data indicated a fraction > 100% we only shifted 100% as the statistical accuracy was consistent with this procedure.
4. Discussion
The low-energy levels in , 2CI fed in the /3 + decay of 3 2Ar are shown in fig. 6 and compared with the corresponding levels in the mirror nucleus 3 2P. Based on this
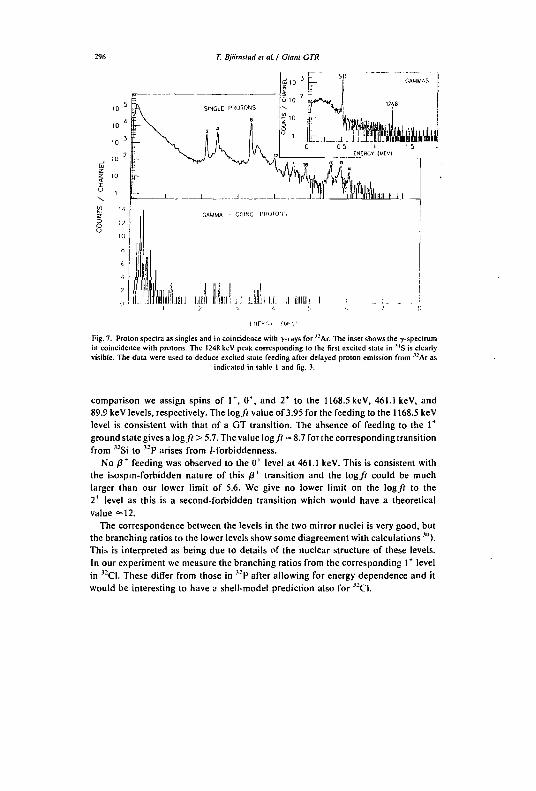
T. Bjornslad el al. / Oianl GTR
Fig. 7. Proton spcclra as singles and in coincidence with y-rays for '" Ar. The inset shows the y-spectrum in coincidence with protons. The 124R keV peak corresponding lo the first excited slate in "''S is clearly visible. The data were used to deduce excited state feeding after delayed proton emission from "12Ar as
indicated in table 1 and fig. 3.
comparison we assign spins of 1 +, 0', and 2* to the 1168.5 keV, 461.1 keV, and 89.9 keV levels, respectively. The log// value of 3.95 for the feeding to the 1168.5 keV level is consistent with that of a GT transition. The absence of feeding to the 1* ground state gives a log// > 5.7. The value log// = 8.7 for the corresponding transition from 12Si to 1 2 P arises from M'orbiddenness.
No /3 + feeding was observed to the 0* level at 461.1 keV. This is consistent with the isospm-forbidden nature of this fi* transition and the log// could be much larger than our lower limit of 5.6. Wc give no lower limit on the log/f to the 2* level as this is a second-forbidden transition which would have a theoretical value =12.
The correspondence between the levels in the two mirror nuclei is very good, but the branching ratios to the lower levels show some diagreement with calculations '"). This is interpreted as being due to details of the nuclear structure of these levels. In our experiment we measure the branching ratios from the corresponding 1* level in 12CI. These differ from those in , 2 P after allowing for energy dependence and it would be interesting to have a shell-model prediction also for "CI.
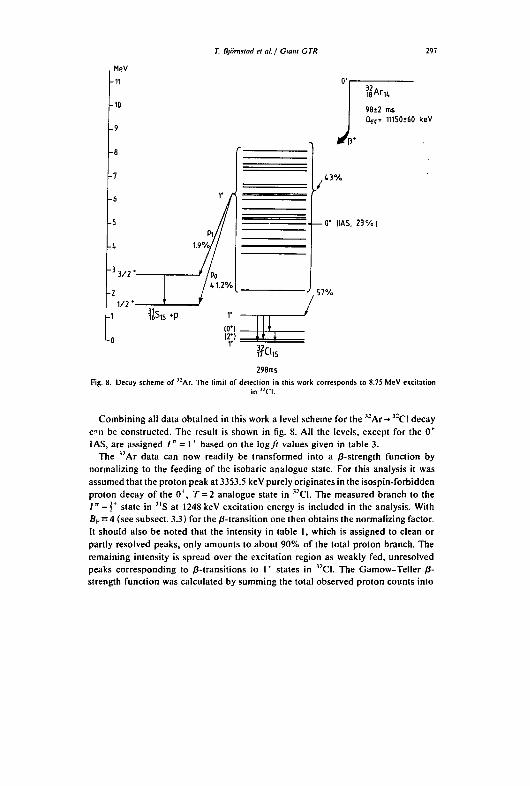
T. Bjârmlad et ai / Cianl CTR 297
MeV
a E C= 11150*60 keV
298ms Fig. 8. Decay scheme of "Ar. The limit of detection in this work corresponds to 8.75 MeV excitation
in "CI .
Combin ing al l data obtained in this work a level scheme for the , 2 A r - » , 2 C I decay e n be constructed. The result is shown in fig. 8. A l l the levels, except for the 0* IAS, are assigned / " = 1 ' based on the l o g / ) values given in table 3.
The " A r data can now readily be transformed into a ^-strength funct ion by normal iz ing to the feeding o f the isobaric analogue state. For this analysis it was assumed that the proton peak at 3353.5 keV purely originates in the isospin-forbidden proton decay o f the 0* , T = 2 analogue state in , 2 C I . The measured branch to the l" = i* state in " S at 1248 keV excitation energy is included in the analysis. Wi th B F = 4 (seesubsect. 3.3) f o r t h e ^- t ransi t ion one then obtains the normal iz ing factor. I t should also be noted that the intensity in table I , which is assigned to clean or part ly resolved peaks, only amounts to about 90% o f the total proton branch. The remaining intensity is spread over the excitation region as weakly fed, unresolved peaks corresponding to /3-transitions !o 1 + states in , 2 C I . The Gamow-Tel le r j8-strength funct ion was calculated by summing the total observed proton counts into
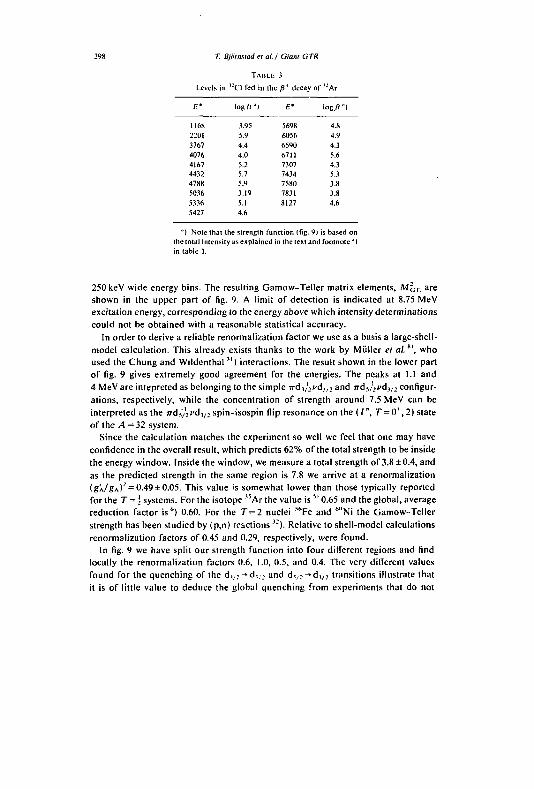
298 T. Bjtïmxtad et al. / Giant GTR
TABLE-: 3
Levels in 1 :CI fed in the J31 decay of-'*Ar
E* log/r'l g* log/r'l
116» 3.95 5698 4.8 2201 5.9 6056 4.9 3767 4.4 6590 4.3 4076 4.0 6711 5.6 4167 5.2 7.107 4.3 4432 5.7 74.14 5.3 4788 5.9 7580 3.8 5036 3.19 78.11 3.8 5336 5.1 8127 4.6 5427 4.6
J ) Noie thai the strength function (fig. 9) is based on Ihe total intensity as explained in the text and footnote '' I in table 1.
250 keV wide energy bins. The resulting Gamow-Teller matrix elements, MC.T. are shown in the upper part of fig. 9. A limit of detection is indicated at 8.75 MeV excitation energy, corresponding to the energy above which intensity determinations could not be obtained with a reasonable statistical accuracy.
In order to derive a reliable renormalization factor we use as a basis a large-shell-model calculation. This already exists thanks to the work by Miiller el a/.*', who used the Chung and Wildenthal ") interactions. The result shown in the lower part of fig. 9 gives extremely good agreement for the energies. The peaks at 1.1 and 4 MeV are intepreted as belonging to the simple 7rd v ' 3cd 1 ; ; and ird w ' ,vd v 2 configurations, respectively, while the concentration of strength around 7.5 MeV can be interpreted as the n-ds/icd,/, spin-isospin flip resonance on the (/", T = 0*\2) state of the A = 32 system.
Since the calculation matches the experiment so well we feel that one may have confidence in the overall result, which predicts 62% of the total strength to be inside the energy window. Inside the window, we measure a total strength of 3.8 ±0.4, and as the predicted strength in the same region is 7.8 we arrive at a renormalization (gÂ/gA)2 = 0.49±0.05. This value is somewhat lower than those typically reported for the T = \ systems. For the isotope "Ar the value is " 0.65 and the global, average reduction factor is") 0.60. For the 7 = 2 nuclei 5"Fe and ""Ni the Gamow-Teller strength has been studied by (p,n) reactions ") . Relative to shell-model calculations renormalization factors of 0.45 and 0.29, respectively, were found.
In fig. 9 we have split our strength function into four different regions and find locally the renormalization factors 0.6, 1.0, 0.5, and 0.4. The very different values found for the quenching of the d v ; -*d, , , and d< / ;->d v :. transitions illustrate that it is of little value to deduce the global quenching from experiments that do not
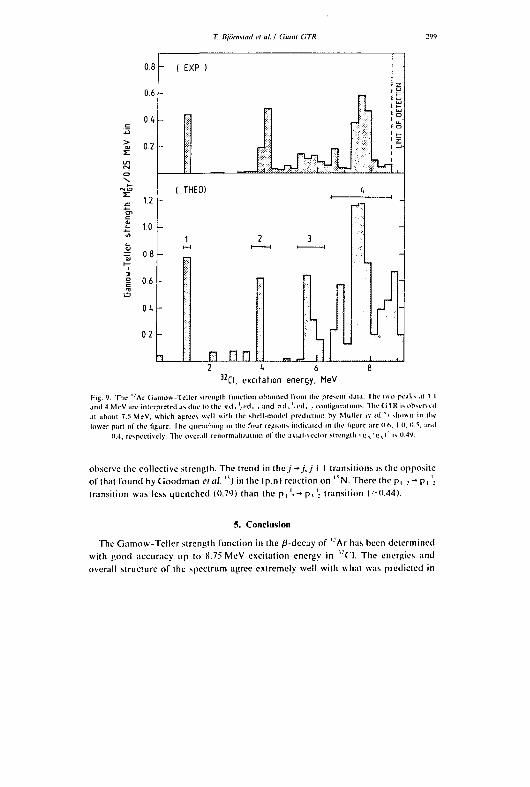
T. lîjornsfiul cl at. I Giant GTR
> at
0.8
0.6
0 .4 -
0.2
I ..
I" 04
02
1 - ( EXP ) | •
-
r 1 °
P, iï a
-
1 . . . . S *»TsJii:.fe:'45-J<
LIM
I THEO) 4
" •rn
1 2 3
-
- n n~ - ; J _
1 FI n n m rr W .. 1 2 <* 6 8
3 2 Cl , excitation energy, MeV
Hg. y. The l 'Ar (iamow-Teller strength function obtained from the present data. The iwn peaks at I I and 4 MeV are interpreted as due to the TTJ ,.'.. cd t , and wiK '.i-tK .. configurations. The Ci Ï'R is observed at iihout 7.5 MeV, which agrees well %sitli the shell-model prediction by Midler ci al. "i shown in the lower part of the figure. The quenching in the four regions indicated in the figure are 0(\ 1 (I. •*."**. and
0.4, respectively. The overall renormali/alion of the a\t.tl-\eclor strength i.s'VWx1 ' S " ^
observe the collective strength. The trend in the / - » / , / î I transitions is the opposite of that found by Goodman etui u ) in the (p,n ) reaction on | S N . There the p, ' ? -*p , ":
transition was less quenched (0.79) than the p, '>-»pi'; transition (-0.44).
5. Conclusion
The Gamow-Tellcr strength function in the jB-decay of ï ; Ar has been determined with good accuracy up to S.75 MeV excitation energy in , : ( ' l . The energies and overall structure of the spectrum agree extremely well with what was predicted in
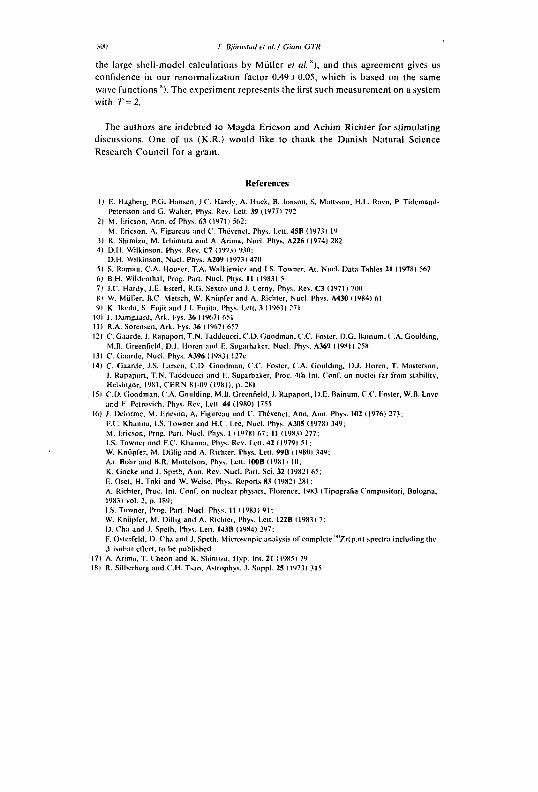
3011 T. lïjïmislad el (il. / Giant GTR
the large shell-model calculations by Miiller el al.'), and this agreement gives us
confidence in our renormalization factor U.49±0.05, which is based on the same
wave functions *). The experiment represents the first such measurement on a system
with T = 2 .
The authors are indebted to Magda Ericson and Achim Richter for stimulating
discussions. One of us (K.R.) would like to thank the Danish Natural Science
Research Council for a grant.
References
1) li. Haghcrg. P.G. Hansen, J.C Hardy, A. Huck, B. Jonson. S. Mattsson, H.L. Ravn, P. Tidemand-Pctcrsson and G. Waller, Phys. Rev. Letl. 39 (1977) 792
2) M. Fricson. Ann. of Phys. 63 11971) 562: M. Kricson. A. Figurcau and C. Thévcnel. Phys. Leu. 45B (19731 19
3) K. Shimizu, M. Ichimura and A. Arima. Nucl. Phys. A2Z6 (19741 282 4) D.H. Wilkinson. Phys. Rev. C7 (1973) 930;
D.H. Wilkinson, Nucl. Phys. A209 ( 19731 47(1 5) S. Raman, C.A. Houser. T.A. Walkiewicz and l.S. Towner, At. Nucl. Data Tables 21 (1978) 567 6) B.H. Wildenthal. Prog. Part. Nucl. Phys. II 119831 5 7) J.C. Hardy, J.F.. tstcrl. R.G. Sextro and J. Cerny, Phys. Rev. C3 ( 1971) 701) 81 W. Miiller. B.C. Metsch, W. Kniipfcr and A. Richter, Nucl. Phys. A430 (1984) 61 91 K. Ikeda. S. Fujii and J.I. Fujita. Phys. Lett. 3 (1963) 271
10) J. Damgaard, Ark. Fys. 36 11967) 651 11) R.A. Sorensen, Ark. Fys. 36 (19671 657 12) C. Gaarde, J. Rapapon. T.N. Taddeucci. CD. Goodman, C.C. Foster, D.G. Bainum. C.A. Goulding,
M.B. Greenfield, D.J. Horen and F. Sugarbaker, Nucl. Phys. A369 119811 258 131 C. Gaarde. Nucl. Phys. A396 (19831 127c 14) C. Gaarde. J.S. Larsen. CD. Goodman, C.C. Foster, C.A. Goulding, DJ. Horen, T. Masterson,
J. Rapaport, T.N. Taddeucci and F. Sugarbaker, Proc. 4lh Int. Conf. on nuclei far from stability, Helsingor. 1981, CERN 81-09 (1981), p. 281
151 CD. Goodman, CA. Goulding, M.B. Greenfield, J. Rapaport, D.F. Bainum. C.C. Foster, W.B, Love and F. Petrovich, Phys. Rev, Lett. 44 (1980) 1755
16) J. Delorme, M. Hricson, A. Figureau and C. Thévenet, Ann, Ann. Phys. 102 (1976) 273: F.C Khanna, l.S. Towner and U.C. Lee. Nucl. Phys. A30S (1978) 349: M. Fricson. Prog. Part. Nucl. Phys. I 119781 67; Il (19H3) 277: l.S. Towner and F.C. Khanna, Phys. Rev. Letl. 42 11979) 51 ; W. Kniipfer, M. Dillig and A. Riehtcr. Phys. Lett. 99B 119801 349; Aa. Bohr and B.R. Mottclson, Phys. Lett. I00B 119811 1(1; K. Cioeke and J. Spe'.h, Ann. Rev. Nucl. Part. Sci. 32 (19821 65; F.. Oset, H. Toki and W. Weise. Phys. Reports 83 ( 19821 2B1 : A. Richler, Proc. Int. Conf. on nuclear physics, Florence, 1983 (Tipografia Composilori, Bologna, 1983) vol. 2. p. 189; l.S. Towner, Prog. Part. Nucl. Phys. II ( 19831 91 ; W. Kniipfer, M. Dillig and A. Richter, Phys. Lett. 122B 119831 7: D. Cha and J. Speth. Phys. Lelt. 143B (19841 297: F. Osterfeld, D. Cha and J. Speth. Microscopic analysis of complete '"'Zrtp.nl spectra including the J isobar elïcct. lo he published
17) A. Arima, T. Cheon and K. Shinlizu. Hyp. Int. 21 ( 1985) 79 181 R. Silberherg and C.H. Tsao, Aslrophys. .1. Suppl. 25 (1973) 315
T. BjornMad et ai / Giam GTR 301
19) L.C. Carraz, S. Sundell, H.L. Ravn, M. Skarestad and L. Weslgaard, Nucl. Inslr. Melh. 158 (1979) 69
20) H.L. Ravn. Phys. Reports 54 11979I 201 211 R.B. Owen. IRE Trans. Nucl. Sci. NS9 (1962) 285 22) J.E. Sleigerwalt. J.W. Sunier and J.R. Richardson, Nucl. Phys. A137 (1969) 585 23) A.H. Wapslra, G. Audi and K. Bos, Nucl. Phys. A432 (1985) 1 24) P.M. Endl and C. van der Leun, Nucl. Phys. A310 (1978) 363 25) U. Abbondanno, M. Lagonegro, G. Pauli, G. Poiani and R.A. Ricci, Nuovo Cim. MA (19731 321 26) A. linhr and B.R. Motlelson, Nuclear struclure (Benjamin, New York, 1969) vol. 1, p. 349 27) D.H. Wilkinson, Nucl Phys. A377(1982) 474 28) V.T. Koslowsky, E. Hagherg, J.C Hardy, H. Schmeing. I.S. Towner, R.E. Azuma and S. Raman,
Proc. Int. C'onf. on nuclear physics, Florence, 1983 (Tipogralia compositori. Hologna, 1983) vol. 1, p. 712
29) O.S. Mani, M.A. Mclkanoll and I. lori, report CFA no. 2379 (1963) 30) G. van Middelkoop and C'.J.Th. Gunsing, Nucl. Phys. A147 ( 1970) 225 3D W. (hung, Ph.D. thesis. Michigan State University, East Lansing (1976);
II.H. Wildenthal and W. Chung, in The (p.n) reactions and the nucleon-nucleon force, ed. C D . Goodman « al. (Plenum, New York, 19801 p. 89
32) J. Rapaport, T. Taddeucci. T.p. Welch, C. Gaarde, J. Larsen, D.J. Horen. E. Sugarbaker, P. Koncz, C.C. Foster, C D . Goodman, C.A. Goulding and T. Maslerson, Nucl. Phys. A140 (1983) 371
33) CD. Goodman, R.C". Byrd, I.J. Van Heerden, T.A. Carey, D.J. Horen. J.S. Larsen, C Gaarde, J. Rapaport, T.P. Welch, E. Sugarbaker and T.N. Taddeucci. Phys. Rev. Lett. 54 ( 1985) 877

PUBLICATION II
Physica Scr ipta . Vol . 36, 218 -223 , 1987.
Study of The Giant Gamow-Teller Resonance in Nuclear Beta Decay: The Case of 3 3 Ar M J. G. B o r g e ' \ P . D e s s a g n e ' . G . T. E w a n 4 , P. G . H a n s e n 1 * , A. H u c k \ B. J o n s o n s , G . K l o t z ' , A . K n i p p e r ' , S. M a t t s s o n ' , G . N y m a n 5 , C . R icha rd -Se r re ' i , K. R i i sager '* . G . W a l t e r ' a n d the I S O L D E C o l l a b o r a t i o n 1
1 EP-Division, CERN. Geneva, Switzerland; : Insto. de Quimica-Fisica "Rocasolano". CSIC, Madrid. Spain: ' Centre de Recherches Nucléaires. Stra.siKjurg. France; 4 Department or Physics, Queen's University, Kingston. Ontario, Canada; s Department of Physics, Chalmers University or Technology, Goteborg. Sweden; 6 Institute of Physics. University of Aarhus. Aarhus, Denmark
Received December 15, 19S6; accepted February 3, 1987
Abstract
Delayed proton and gamma emissions following the beta decay of "Ar have been studied. From the calculated intensity of the feeding to the T = 3/2 analogue stale in "CI, the proton intensities have been put on an absolute scale leading to a proton branching ratio of 38.7 ± 1.0%. A proton branch to the first excited state in "S at 2230.2 keV (1" = 2* ) wilh an intensity of 0.77 + 0.10% was obtained from gamma singles and proton-gamma coincidence data. The complete spectroscopic information on "Ar allows the Gamow-Teller (GT) strength function from the gound state and up to 9.25 McV excitation energy in "CI to be deduced. The total strength observed in this interval is 2.90 in absolute units.
1. Introduction In a recent paper [1] we reported on the first detailed investigation of "Ar, a nucleus with isospin projection T. = (N - Z)/ 2 = — 2. The special motivation for this experiment was that is is essentially only in nuclei with Z > N that the main part of the allowed beta-decay strength, traditionally referred to as superallowed decay, becomes observable as transitions to the analogue state and the Gamow-Teller Giant Resonance (GTGR). In the present paper we report on a complete spectroscopic investigation of the next heavier argon isotope with mass number 33 and with T, T, = 3/2, — 3/2.
Although a remarkably precise and detailed study of "Ar has been carried our by Hardy el at. [2], we have two reasons for reverting to this problem. The first is that the development of a very powerful target-ion source system [3] at ISOLDE (CERN) allows us *.oday to investigate this isotope with mass-separated sarr jles. The second is that for the evaluation of the quenching factor it is essential to include all intensity in the decay and not only the part that is resolved, and to use coincidence information to correct for weak branches from high-lying states, which, owing to their small statistical weight factor, can carry appreciable strength. The data collected for "Ar give a detailed mapping of the Gamow-Teller (GT) strength up to 9.25 MeV excitation energy in "CI. Th • results are in striking agreement with a large shell-model calculation by Miiller el al. [4] except for an over-all scale factor changing the axial vector strength to 58 + 6% relative to the free-nucleon value. Although this is in agreement with other estimates of the axial-vector interaction in nuclei, in particular with the value of 0.58 + 0.04 obtained [5] from a comprehensive analysis of beta decay to (principally) low-lying final states in sd-shell nuclei, we underline that the
• On leave from the Institute of Physics, University of Aarhus ' Attached to IN2P3 Paris, France
reduction factor found here can only be a tentative conclusion based on a model that does not necessarily give the optimal description of the giant resonance states.
2. Experimental techniques and results 2.1. Production of"Ar The present study of "Ar was performed at the ISOLDE facility at CERN, where the radioactivity was produced in spallation reactions in a CaO target [3] bombarded with a 600 MeV proton beam of 2.4 uA from the CERN Synchrocyclotron. The target materia', which had an effective thickness of calcium of 6.5g/cm:, was kept at a temperature of 1900°C. The production yield of "Ar from the ™Ca(p, 3p5n) reaction was about 2 x 10⁴ atoms per second. The target was connected to a FEBIAD ion source via a cooled line, which assured the chemical selectivity since only the noble gas argon could pass through it hile neighbouring, less volatile, elements were retained by condensation. The pure Ar + beam from the ion source was accelerated to an energy of 60 keV and subsequently mass separated in the ISOLDE electromagnetic isotope separator [6]. The ion beam was finally directed to the measuring station via an external beam line. In order to minimize the background from contaminants of the heavy element» in the ISOLDE isotope separator, the experiments were performed at the beginning of a running period after a few months of cooling of the separator. No a contamination was observed in the charged-particle spectrum.
2.2. The half-life of'Ar The daughters after beta decay and beta-delayed proton emission from "Ar are "CI (Tm = 2.51 s) and "S (stable). Neither of these nuclides are precursors for beta-delayed proton emission, so a clean one-component decay curve can be obtained if the measurement is based on the protons only. The present experiment used a collection time of 200 ms, followed by a 2.2 s counting period, and the measuring cycle was repeated until a decay curve containing 36 500 events had been collected. At the beginning of each measuring cycle a ramp generator was started and each proton event triggered the ramp generator to create a pulse with an amplitude proportional to the time elapsed from the start of the cycle. These pulses were analysed in an analog-to-digital converter (ADC) and stored in the memory of a computer. The clock used for the timing as well as the linearity of the ramp generator and the ADC were carefully controlled. The half-life was determined from a x" fit l o the decay curve and the 'isult
Physica Scripla 36
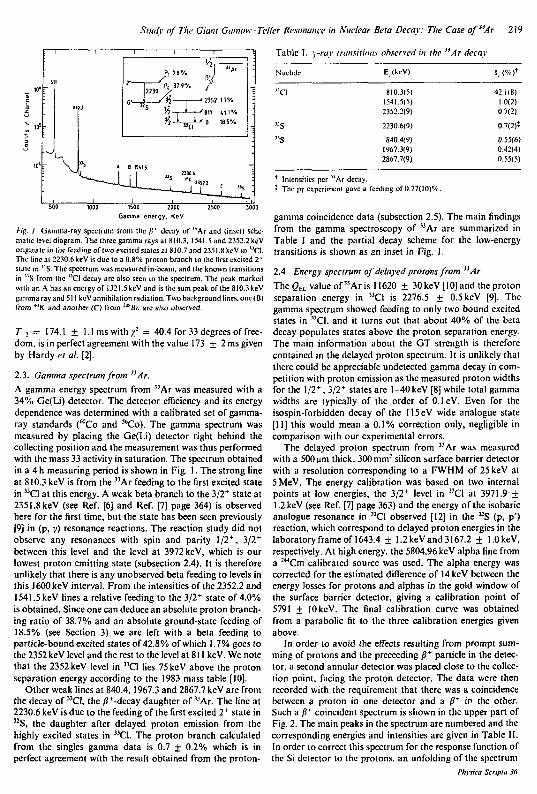
Study of The Giant Gumow-Tcller Resonance in Nuclear Beta Decay: The Case of"Ar 219
1 > 1 1 1 1
s
-
r u T
i
awj
p, oav. J A
r P, 37.9V. / 2230 > ' 1
]
s
-
r u T
i
awj "-**ZL _, 1
]
s
-
r u T ^ »s »
A ' 6 " " . ' „ '
1
]
s
-
r u T ^ »s »
?i „ c i „ . . . . .
1
]
s
-
r u T ^ »s » a « u s
" 5 P. I3S72
—*—' —*——J_JL_ " S
1
~l
Tabic I. y-rav transitions observed in the 3iAr decay
E..(keV) !,.(%)'
1500 2000 Gamma energy, KeV
Fig. I. G a m m a - r a y spcclrum from the (1* decay of " A r and (inset) schematic level d iagram. The three gamma rays al 810.3, 1541.5 and 2352.2 keV originate in the feeding of two excited states at 810.7 a n d 2351.8 keV in "CI . The line at 2230.6 keV is due to a 0 .8% pro ton branch to the first excited 2* stale in l : S . The spectrum was measured in-bcam, and the known transit ions in " S from the "CI decay arc also seen in the spectrum. The peak marked wilh an A has an energy of 1321 .5keVand is the sum peak of the 810.3 keV gamma ray and 511 keV annihilation radiation. Two background lines, one (B) from *'K and ano the r (C) from : i , l l Bi . a re also observed.
T,. = 174.1 + 1.1 ms with x2 = 40.4 for 33 degrees of freedom, is in perfect agreement with the value 173 + 2 ms given by Hardy et al. [2],
2.3. Gamma spectrum from nAr. A gamma energy spectrum from "Ar was measured with a 34% Ge(Li) detector. The detector efficiency and its energy dependence was determined with a calibrated set of gamma-ray standards ("Co and S6Co). The gamma spectrum was measured by placing the Ge(Li) detector right behind the collecting position and the measurement was thus performed wilh the mass 33 activity in saturation. The spectrum obtained in a 4 h measuring period is shown in Fig. 1. The strong line at 810.3keV is from the "Ar feeding to the first excited state in 33C1 at this energy. A weak beta branch to the 3/2+ state at 2351.8 keV (see Ref. [6] and Ref. [7] page 364) is observed here for the first time, but the state has been seen previously [9] in (p, y) resonance reactions. The reaction study did not observe any resonances with spin and parity l /2 + , 3/2+
between this level and the level at 3972 keV, which is our lowest proton emitting state (subsection 2.4). It is therefore unlikely that there is any unobserved beta feeding to levels in this 1600keV interval. From the intensities of the 2352.2 and 1541.5 keV lines a relative feeding to the 3/2+ state of 4.0% is obtained. Since one can deduce an absolute proton branching ratio of 38.7% and an absolute ground-state feeding of 18.5% (see Section 3) we are left with a beta feeding to particle-bound excited states of 42.8% of which 1.7% goes to the 2352 keV level and the rest to the level at 811 keV. We note that the 2352 keV level in "CI lies 75 keV above the proton separation energy according to the 1983 mass table [10].
Other weak lines at 840.4, 1967.3 and 2867.7 keV are from the decay of "CI. the /?+-decay daughter of "Ar. The line al 2230.6 keV is due to the feeding of the first excited 2* state in 5 2S, the daughter after delayed proton emission from the highly excited states in "CI. The proton branch calculated from the singles gamma data is 0.7 ± 0.2% which is in perfect agreement with the result obtained from the proton-
810.3(5) 1541.5(5) 2352.2(9)
2230.6(9)
840.4(9) 1967.3(9) 2867.7(9)
42.1(8) 1.0(2) 0.7(2)
0.7(2)t
0.55(6) 0.42(4) 0.55(5)
* Intensities per " A r decay. * The pi' experiment gave a feeding of 0.77(10)%.
gamma coincidence data (subsection 2.5). The main findings from the gamma spectroscopy of "Ar are summarized in Table I and the partial decay scheme for the low-energy transitions is shown as an inset in Fig. 1.
2.4. Energy spectrum of delayed protons from "Ar The Qkc value of "Ar is 11620 ± 30keV [10] and the proton separation energy in "CI is 2276.5 ± 0.5 keV [9]. The gamma spectrum showed feeding to only two bound excited states in "CI. and it turns out that about 40% of the beta decay populates states above the proton separation energy. The main information about the GT strength is therefore contained in the delayed proton spectrum. It is unlikely that there could be appreciable undetected gamma decay in competition with proton emission as the measured proton widths for the 1 , '2 + , 3/2+ states are 1-40 keV [8] while total gamma widths are typically of the order of 0.1 eV. Even for the isospin-forbidden decay of the 115eV wide analogue state [11] this would mean a 0.1% correction only, negligible in comparison with our experimental errors.
The delayed proton spectrum from "Ar was measured with a 500 urn thick, 300 mnr silicon surface barrier detector with a resolution corresponding to a FWHM of 25keV at 5MeV. The energy calibration was based on two internal points at low energies, the 3/2* level in "CI at 3971.9 + 1.2 keV (see Ref. [7] page 363) and the energy of the isobaric analogue resonance in "CI observed [12] in the 33S (p, p') reaction, which correspond to delayed proton energies in the laboratory frame of 1643.4 + 1.2 keV and 3167.2 ± I.OkeV, respectively. At high energy, the 5804.96 keV alpha line from a !,"Cm calibrated source was used. The alpha energy was corrected for the estimated difference of 14keV between the energy losses for protons and alphas in the gold window of the surface barrier detector, giving a calibration point of 5791 ± lOkeV. The final calibration curve was obtained from a parabolic fit to the three calibration energies given above.
In order to avoid the effects resulting from prompt summing of protons and the preceeding /?+ particle in the detector, a second annular detector was placed close to the collection point, facing the proton detector. The data were then recorded with the requirement that there was a coincidence between a proton in one detector and a fi* in the other. Such a P< coincident spectrum is shown in the upper part of Fig. 2. The main peaks in the spectrum are numbered and the corresponding energies and intensities are given in Table II. In order to correct this spectrum for the response function of the Si detector to the protons, an unfolding of the spectrum
Physica Scripta 36
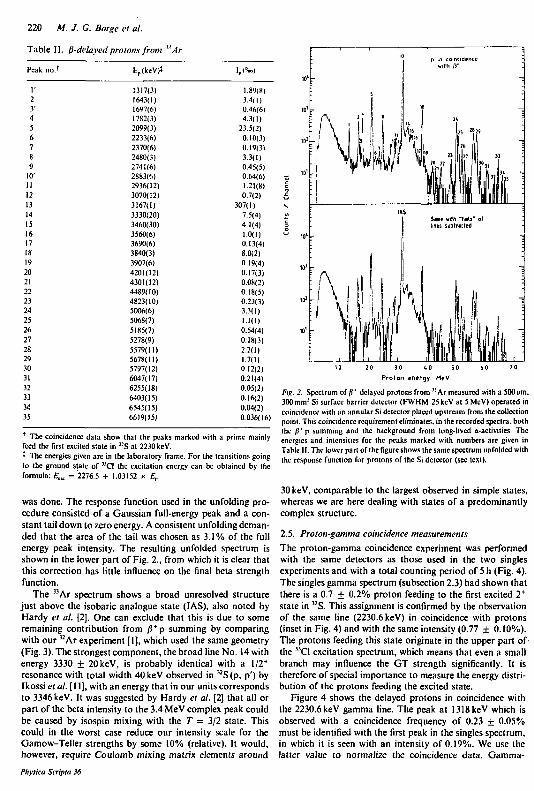
220 M. J. G. Borge el al.
Table II. ^-delayed proions from "Ar
Peak no.* E.(keV)* U%°)
1' 2 3' 4 5 6 7 8 9
10' II 12 13 14 15 16 17 18 19 20 21 22 23 24 25 26 27 28 29 30 31 32 33 34 35
1317(3) 1643(1) 1697(6) 1782(3) 2099(3) 2233(6) 2370(6) 2480(3) 2741(6) 2883(6) 2936(12) 3070(12) 3167(1) 3330(20) 3460(30) 3560(6) 3690(6) 3840(3) 3907(6) 4201(12) 4301(12) 4489(10) 4823(10) 5006(6) 5068(7) 5185(7) 5278(9) 5579(11) 5678(11) 5797(12) 6047(17) 6255(18) 6403(15) 6545(15) 6619(15)
1.89(8) 3.4(1) 0.46(6) 4.3(1)
23.5(2) 0.10(3) 0.19(3) 33(1) 0.45(51 0.64(61 1.21(8) 0.7(2)
307(1) 7.5(4) 4.1(4) 10(1) 0.13(4) 8.0(2) 0.19(4) 0.17(3) 0.08(2) 0.18(5) 0.23(3) 3.3(1) 11(1) 0.54(4) 0.1813) 2.2(1) 17(1) 0.12(2) 0.21(4) 0.05(2) 0.16(2) 0.04(2) 0.036(16)
The coincidence data show that the peaks marked with a prime mainly feed the first excited stale in "S at 2230 keV. + The energies given are in the laboratory frame. For the transitions going to the ground state of "CI the excitation energy can be obtained by the formula: £ „ = 2276.5 + 1.03152 x E.
was done. The response function used in the unfolding procedure consisted of a Gaussian full-energy peak and a constant tail down to zero energy. A consistent unfolding demanded that the area of the tail was chosen as 3.1% of the full energy peak intensity. The resulting unfolded spectrum is shown in the lower part of Fig. 2., from which it is clear that this correction has little influence on the final beta strength function.
The "Ar spectrum shows a broad unresolved structure just above the isobaric analogue state (IAS), also noted by Hardy el al. [2]. One can exclude that this is due to some remaining contribution from 0 + p summing by comparing with our K A r experiment [1], which used the same geometry (Fig. 3). The strongest component, the broad line No. 14 with energy 3330 + 20keV, is probably identical with a 1/2* resonance with total width 40 keV observed in "S (p, p') by Ikossi et al. [11], with an energy that in our units corresponds to 3346 keV. It was suggested by Hardy el al. [2] that all or part of the beta intensity to the 3.4 MeV complex peak could be caused by isospin mixing with the T = 3/2 state. This could in the worst case reduce our intensity scale for the Gamow-Teller strengths by some 10% (relative). It would, however, require Coulomb mixing matrix elements around
Sane with -tails" of lines subtracted
2 0 3.0 4 0 SO Proton energy. MeV
Ftg. 2. Spectrum of/?* delayed protons from "Ar measured with a 300 urn. 300mm-' Si surface barrier detector (FWHM 25keV at 5McV) operated in coincidence wilh an annular Si detector placed upstream from the collection point. This coincidence requirement eliminates, in the recorded spectra, both the /7'p summing and the background from long-lived a-activilies. The energies and intensities for the peaks marked with numbers are given in Table II. The lower part of the figure shows the same spectrum unfolded with the response function for protons of the Si detector (see text).
30 keV, comparable to the largest observed in simple states, whereas we are here dealing with states of a predominantly complex structure.
2.5. Proton-gamma coincidence measurements The proton-gamma coincidence experiment was performed with the same detectors as those used in the two singles experiments and with a total counting period of 5 h (Fig. 4). The singles gamma spectrum (subsection 2.3) had shown that there is a 0.7 ± 0.2% proton feeding to the first excited 2* state in " S . This assignment is confirmed by the observation of the same line (2230.6 keV) in coincidence with protons (inset in Fig. 4) and with the same intensity (0.77 + 0.10%). The protons feeding this state originate in the upper part of-the "CI excitation spectrum, which means that even a small branch may influence the GT strength significantly. It is therefore of special importance to measure the energy distribution of the protons feeding the excited state.
Figure 4 shows the delayed protons in coincidence with the 2230.6 keV gamma line. The peak at 1318 keV which is observed with a coincidence frequency of 0.23 + 0.05% must be identified with the first peak in the singles spectrum, in which it is seen with an intensity of 0.19%. We use the latter value to normalize the coincidence data. Gamma-
Physica Scripla 36
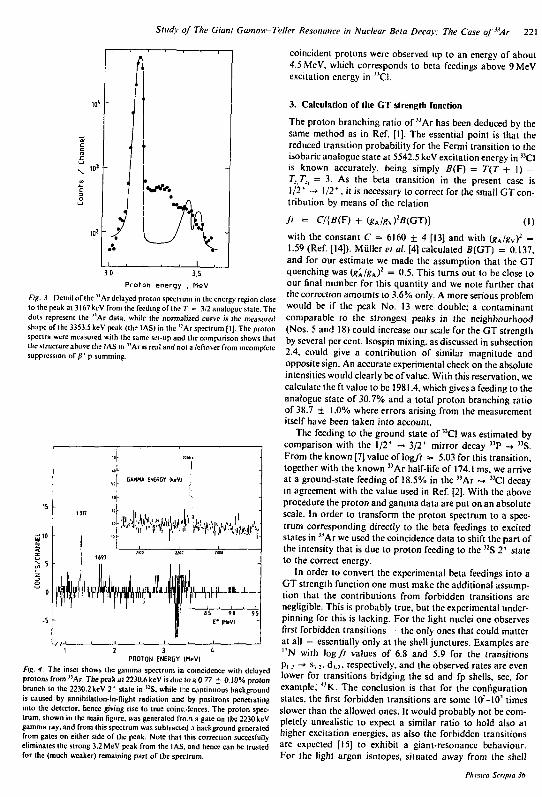
Study of The Giant Gamow-Teller Resonance in Nuclear Beta Decay: The Case of"Ar 221
1 '
•
-
" •
•j 7' H « •• l_v
1 - i 1 . • i L. 3 0 3,5
Proton energy , MeV Fig. 3. Detail of the "Ar delayed proton spectrum in the energy region close to the peak at 3167 keV from the feeding of the T = 3/2 analogue slate. The dots represent the 1 l Ar data, while the normalized curve is the measured shape of the 3353.5 kcV peak (the IAS) in the i : Ar spectrum [ I ]. The proton spectra were measured with the same sci-up and the comparison shows that the structure above the IAS in , l Ar is real and not a leftover from incomplete suppression of /î* p summing.
"7 GAMMA ENERGY IkeV)
-5 " I E * lM [ V I
Y / - J 1 1 1 1 1 1 1
1 2 3 1. PROTON ENERGY (MeVI
Fig. 4. The inset shows the gamma spectrum in coincidence with delayed protons from "Ar. The peak at 2230.6 keV is due to a 0.77 + 0.10% proton branch to the 2230.2 keV 2* state in "S . while tnc continuous background is caused by annihilation-in-flight radiation and by positrons penetrating into the detector, hence giving rise to true coinc.'iences. The proton spectrum, shown in the main figure, was generated fro.n a gale on the 2230keV gamma ray. and Crom this spectrum was subtracted a background generated from gales on either side of the peak. Note that this correction succesfully eliminates the strong 3.2 MeV peak from the IAS. and hence can be iruslcd for the (much weaker) remaining part of Ihe spectrum.
coincident protons were observed up to an energy of about 4.5 MeV. which corresponds to beta feedings above 9 MeV excitation energy in "CI.
3. Calculation of (he GT strength function
The proton branching ratio of "Ar has been deduced by the same method as in Ref. [)]. The essential point is that the reduced transition probability for the Fermi transition to the isobaric analogue state at 5542.5 keV excitation energy in "CI is known accurately, being simply fl(F) = TJ + 1) -T:T:i = 3. As the beta transition in the present case is 1/2* - . 1/2*, it is necessary to correct for the small GT contribution by means of the relation
/ / = CIB(F) + (gJg,)2BGT) (I)
with the constant C = 6160 + 4 [13] and with ( g A / g v ): =
1.59 (Ref. [14]). Millier et al. [4] calculated fl(GT) = 0.137, and for our estimate we made the assumption that the GT quenching was ( £ A / ? A ) ' = 0.5. This turns out to be close to our final number for this quantity and we note further that the correction amounts to 3.6% only. A more serious problem would be if the peak No. 13 were double; a contaminant comparable to the strongest peaks in the neighbourhood (Nos. 5 and 18) could increase our scale for the GT strength by several per cent. Isospin mixing, as discussed in subsection 2.4, could give a contribution of similar magnitude and opposite sign. An accurate experimental check on the absolute intensities would clearly be of value. With this reservation, we calculate the ft value to be 1981.4, which gives a feeding to the analogue slate of 30.7% and a total proton branching ratio of 38.7 + 1.0% where errors arising from the measurement itself have been taken into account.
The feeding to the ground state of "CI was estimated by comparison with the 1/2* -» 3/2 + mirror decay " P -» "S . From the known [7] value of log/r = 5.03 for this transition, together with the known "Ar half-life of 174.1 ms. we arrive at a ground-state feeding of 18.5% in the "Ar -> "CI decay in agreement with the value used in Ref. [2]. With the above procedure the proton and gamma data are put on an absolute scale. In order to transform the proton spectrum to a spectrum corresponding directly to the beta feedings to excited states in " A r we used the coincidence data to shift the part of the intensity that is due to proton feeding to the , : S 2* state to the correct energy.
In order to convert the experimental beta feedings into a GT strength function one must make the additional assumption that the contributions from forbidden transitions are negligible. This is probably true, but the experimental underpinning for this is lacking. For the light nuclei one observes first forbidden transitions - the only ones that could matter at all - essentially only at the shell junctures. Examples are i 7 N with l o g / ; values of 6.8 and 5.9 for the transitions Pi : -> s, ;, d, j . respectively, and the observed rates are even lower for transitions bridging the sd and fp shells, see, for example, "'K. The conclusion is that for the configuration states, the first forbidden transitions are some 10 ;-10' times slower than the allowed ones. It would probably not be completely unrealistic to expect a similar ratio to hold also at higher excitation energies, as also the forbidden transitions are expected [15] to exhibit a giant-resonance behaviour. For the light argon isotopes, situated away from the shell
Physua Scripia 3ft
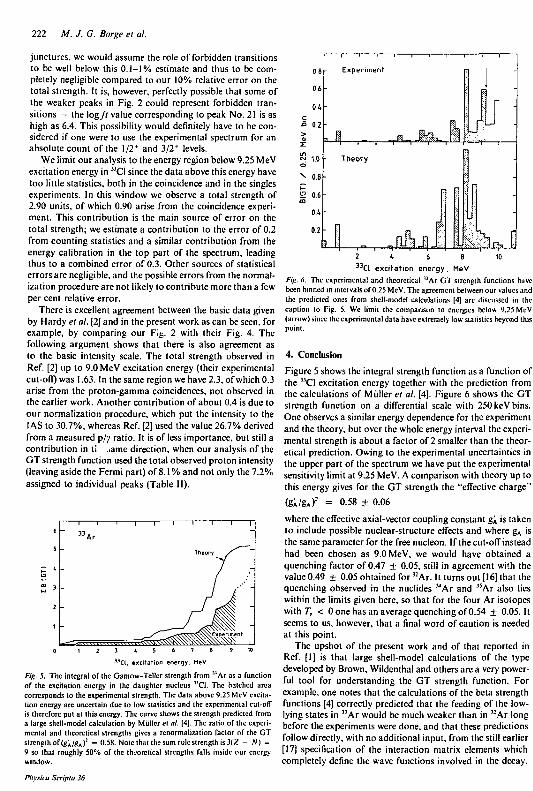
222 M. J. G. Borge et al.
junctures, we would assume the role of forbidden transitions to be well below this 0.1-1% estimate and thus to be completely negligible compared to our 10% relative error on the total strength. It is, however, perfectly possible that some of the weaker peaks in Fig. 2 could represent forbidden transitions — the log// value corresponding to peak No. 21 is as high as 6.4. This possibility would definitely have to be considered if one were to use the experimental spectrum for an absolute count of the 1/2* and 3/2* levels.
We limit our analysis to the energy region below 9.25 MeV excitation energy in "CI since the data above this energy have too little statistics, both in the coincidence and in the singles experiments. In this window we observe a total strength of 2.90 units, of which 0.90 arise from the coincidence experiment. This contribution is the main source of error on the total strength; we estimate a contribution to the error of 0.2 from counting statistics and a similar contribution from the energy calibration in the top part of the spectrum, leading thus to a combined error of 0.3. Other sources of statistical errors are negligible, and the possible errors from the normalization procedure are not likely to contribute more than a few per cent relative error.
There is excellent agreement between the basic data given by Hardy et al. [2] and in the present work as can be seen, for example, by comparing our Fig. 2 with their Fig. 4. The following argument shows that there is also agreement as to the basic intensity scale. The total strength observed in Ref. [2] up to 9.0 MeV excitation energy (their experimental cut-off) was 1.63. In the same region we have 2.3, of which 0.3 arise from the proton-gamma coincidences, not observed in the earlier work. Another contribution of about 0.4 is due to our normalization procedure, which put the intensity to the IAS to 30.7%, whereas Ref. [2] used the value 26.7% derived from a measured p/y ratio. It is of less importance, but still a contribution in li ..ame direction, when our analysis of the GT strength function used the total observed proton intensity (leaving aside the Fermi part) of 8.1 % and not only the 7.2% assigned to individual peaks (Table II).
3 3 Cl. excitation energy, MeV
Fig. 5. The integral of the Gamow-Tellcr strength from "Ar as a function of the excitation energy in the daughter nucleus "CI. The hatched area corresponds to the experimental strength. The data above 9.25 MeV excitation energy are uncertain due to low statistics and the experimental cut-off is therefore put at this energy. The curve shows the strength predicted from a large shell-model calculation by Mûllcr et at. [4]. The ratio of the experimental and theoretical strengths gives a rcnormalization factor of the GT strength of (g'AlgA)' = 0.58. Note that the sum rule strength is 1(7. - N) = 9 so that roughly 50% of the theoretical strengths falls inside our energy-window.
D
0.6
04 c n 0.2 >
LO M 1.0 o
^ 0.8
S 0.6 m
0.4
0.2
Experiment
Theory
u>
LEb_ 10 2 4 6 6
3 3 Cl excitation energy. MeV Fig. 6. The experimental and theoretical "Ar GT strength functions have been binned in intervals of 0.25 MeV. The agreement between our values and the predicted ones from shell-model calculations [4] arc discussed in the caption to Fig. 5. We limit the comparison to energies below 9.25 MeV (arrow) since the experimental data have extremely low statistics beyond this point.
4. Conclusion
Figure 5 shows the integral strength function as a function of the "CI excitation energy together with the prediction from the calculations of Millier et al. [4], Figure 6 shows the GT strength function on a differential scale with 250 kcV bins. One observes a similar energy dependence for the experiment and the theory, but over the whole energy interval the experimental strength is about a factor of 2 smaller than the theoretical prediction. Owing to the experimental uncertainties in the upper part of the spectrum we have put the experimental sensitivity limit at 9.25 MeV. A comparison with theory up to this energy gives for the GT strength the "effective charge"
(gWgA>: = 0.58 + 0.06
where the effective axial-vector coupling constant gi is taken to include possible nuclear-structure effects and where gA is the same parameter for the free nucléon. If the cut-off instead had been chosen as 9.0 MeV, we would have obtained a quenching factor of 0.47 + 0.05, still in agreement with the value0.49 + 0.05obtained for"Ar. It turnsout[16]that the quenching observed in the nuclides "Ar and "Ar also lies within the limits given here, so that for the four Ar isotopes with T, < 0 one has an average quenching of 0.54 + 0.05. It seems to us, however, that a final word of caution is needed at this point.
The upshot of the present work and of that reported in Ref. [1] is that large shell-model calculations of the type developed by Brown, Wildenthal and others are a very powerful tool for understanding the GT strength function. For example, one notes that the calculations of the beta strength functions [4] correctly predicted that the feeding of the low-lying states in "Ar would be much weaker than in "Ar long before the experiments were done, and that these predictions follow directly, with no additional input, from the still earlier [17] specification of the interaction matrix elements which completely define the wave functions involved in the decay.
Pliysica Scripia 36
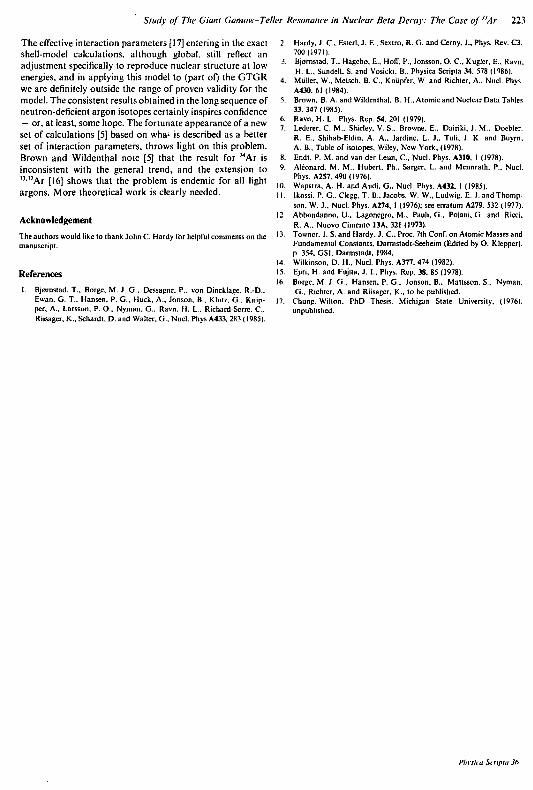
Study of The Giant Gamow-Teller Resonance in Nuclear Beta Decay: The Case of''Ar 223
The effective interaction parameters [ 17] entering in the exact shell-model calculations, although global, still reflect an adjustment specifically to reproduce nuclear structure at low energies, and in applying this model to (part of) the GTGR we are definitely outside the range of proven validity for the model. The consistent results obtained in the long sequence of neutron-deficient argon isotopes certainly inspires confidence - or, at least, some hope. The fortunate appearance of a new set of calculations [5] based on wha is described as a better set of interaction parameters, throws light on this problem. Brown and Wildenthal note [5] that the result for MAr is inconsistent with the general trend, and the extension to " ! ! A r [16] shows that the problem is endemic for all light argons. More theoretical work is clearly needed.
Acknowledgement
The authors would like to lhank John C. Hardy Tor helpful comments on the manuscript.
References I. Bjornstad. T., Borge. M. J. G.. Dcssagnc. P.. von Dincklage. R.-D..
Ewan. G. T., Hansen. P. G.. Huck. A.. Jonson. B.. Klolz. G.. Knip-per. A., Larsson. P. O.. Nyman. G.. Ravn. H. L... Richard-Scrrc. C . Riisager. K„ Schardt. D. and Walter. G.. Nucl. Phys A433. 283 (1985).
2. Hardy. J. C . Esterl. J. E.. Seitro. R. G. and Cerny. J., Phys. Rev. C3. 700(19711.
3. Bjornstad. T.. Hagcbo. E.. Hon". P.. Jonsson. O. C , Kuglcr, E.. Ravn. H. L.. Sundell. S. and Vosicki. B., Physica Scripla 34. 578 (1986).
4. Mûllcr. W.. Mcisch. B. C , Kniipfcr. W. and Richter, A.. Nucl. Phys. A430. 61 (1984).
5. Brown. B. A. and Wildcnthal. B. H.. Atomic and Nuclear Data Tables 33.347(1985).
6. Ravn. H. L.. Phys. Rep. S4. 201 (1979). 7. Lederer. C. M-. Shirley. V. S.. Browne, E-, Dairiki. J. M-, Doebler.
R. E.. Shihab-Eldin. A. A.. Jardine. L. J., Tuli. J. K. and Buyrn, A. B.. Table orisolopes. Wiley. New York, (1978).
8. Endl. P. M. and van der Leun. C , Nucl. Phys. A310. I (1978). 9. Alconard. M. M.. Hubert. Ph.. Sarger. L. and Mennrath. P.. Nucl.
Phys. A257. 490 (1976). 10. Wapslra. A. H. and Audi. G.. Nucl. Phys. A432. I (1985). 11. Ikossi. P. G.. Clegg. T. B.. Jacobs. W. W., Ludwig. E. J. and Thomp
son. W. J.. Nucl. Phys. A274. 1 (1976): see erratum A279. 532 (1977). 12. Abbondanno. U.. Lagonegro, M.. Pauli. G.. Poiani. G. and Ricci.
R. A.. Nuovo Cimento I3A. 321 (1973). 13. Towner. 1. S. and Hardy. J. C Proc. 7th Conf. on Atomic Masses and
Fundamental Constants. Darmstadt-Seeheim (Edited by O. Kleppcr). p. .154. GS1. Darmstadt. 1984.
14. Wilkinson. D. H.. Nucl. Phys. A377. 474 (1982). 15. Ejiri. H. and Fujita. J. I.. Phys. Rep. 38. 85 (1978). 16. Borge. M. J. G.. Hansen. P. G„ Jonson. B.. Maltsson. S.. Nyman.
G.. Richter. A. and Riisager. K., to be published. 17. Chung. Wilton. PhD Thesis. Michigan State University. (19761.
unpublished.
Physita Striplii J6

PUBLICATION III
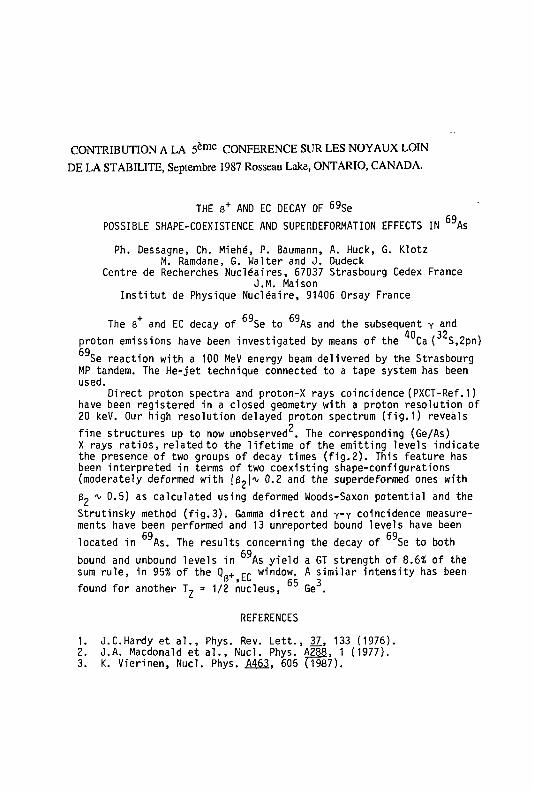
CONTRIBUTION A LA 5 è m e CONFERENCE SUR LES N O Y A U X LOIN
D E LA STABILITE, Septembre 1987 Rosseau Lake, ONTARIO, CANADA.
THE 8 + AND EC DECAY OF 6 9 S e
POSSIBLE SHAPE-COEXISTENCE AND SUPERDEFORMATION EFFECTS IN D : ;As
Ph. Dessagne, Ch. Miehé, P. Baumann, A. Huck, G. Klotz M. Ramdane, G. Walter and J. Dudeck
Centre de Recherches Nucléaires, 67037 Strasbourg Cedex France J.M. Maison
Institut de Physique Nucléaire, 91406 Orsay France
The B + and EC decay of Se to As and the subsequent y and proton emissions have been investigated by means of the Ca ( S,2pn) 69 Se reaction with a 100 MeV energy beam delivered by the Strasbourg MP tandem. The He-jet technique connected to a tape system has been used.
Direct proton spectra and proton-X rays coincidence (PXCT-Ref. 1) have been registered in a closed geometry with a proton resolution of 20 keV. Our high resolution delayed proton spectrum (fig.1) reveals
fine structures up to now unobserved . The corresponding (Ge/As) X rays ratios, related to the lifetime of the emitting levels indicate the presence of two groups of decay times (fig.2). This feature has been interpreted in terms of two coexisting shape-configurations (moderately deformed with ISoK 0-2 and the superdeformed ones with
Bo ^ 0.5) as calculated using deformed Woods-Saxon potential and the
Strutinsky method (fig.3). Gamma direct and y-y coincidence measurements have been performed and 13 unreported bound levels have been
located in As. The results concerning the decay of Se to both
bound and unbound levels in As yield a GT strength of 8.6% of the sum rule, in 95% of the Q. + r r window. A similar intensity has been
' 65 3 found for another T ? = 1/2 nucleus, Ge .
REFERENCES
1. J.C.Hardy et al., Phys. Rev. Lett., 37, 133 (1976). 2. J.A. Macdonald et al., Nucl. Phys. A288, 1 (1977). 3. K. Vierinen, Nucl. Phys. A463. 605 (T987).
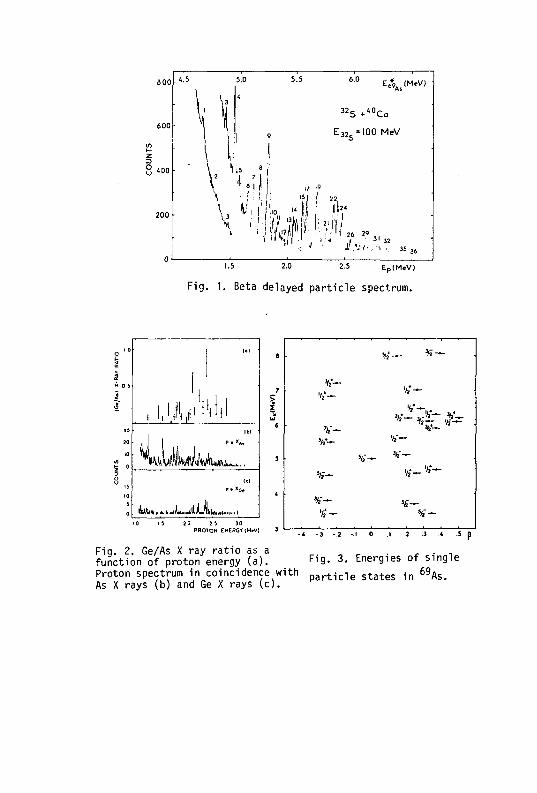
EA (MeV)
E 32 =100 MeV
(!«
> 'I'- if/!" M :'.'|ï'
1.5 2.0 2.5 Ep(MeV)
Fig. 1. Beta delayed particle spectrum.
jJi!z.l£
%M«ywwW .
&Mn.*iJu.JlJJIti 20 25 30
PROTON ENERGY|M«V]
• * 2 - ~ * -
V -V - 'tf—
V -^ ^
V - V—
. sh~ V—
%-— tf-*-
%-— »S— '**- %" —
-.« - J -.2 -.1 0 I 2 3 « .5 p
Fig. 3. Energies of single Fig. 2. Ge/As X ray ratio as a function of proton energy (a). Proton spectrum in coincidence with p a r t i c l e s t a t e s i n 6 9 A s >
As X rays (b) and Ge X rays (c).

PUBLICATION IV
PHYSICAL REVIEW C VOLUME 36, NUMBER 2 AUGUST 1987
Gamow-Teller beta decay of 2 9Na and comparison with shell-model predictions
P. Baumann,'»' Ph. Dessagne, , a ) A. Huck, l a l G. Klotz,'a> A. Knipper,'"1 G. Marguier,"" C. Miehé,1"1 M. Ramdane,' 0 1 C. Richard-Serre, 1 ' 1 G. Walter, ' a l and B. H. Wildenthal"1 1
'"'Centre de Recherches Nucléaires, 67037 Strasbourg, Franc? and the Isolde Collaboration, CERN, 1211 Geneva 23, Switzerland
lb>Institut de Physique Nucléaire, 69622 Villeurbanne, France and the Isolde Collaboration, CERN, 1211 Geneva 23, Switzerland
'"IN2P3 and the Isolde Collaboration, CERN, 1211 Geneva 23, Switzerland tdlDepartment of Physics and Atmospheric Science, Drexel University, Philadelphia, Pennsylvania 19104
(Received 23 March 1987)
Gamma radiation and delayed neutrons following the decay of 44.9 ms "Na have been studied in singles and coincidence mode with mass-separated sources. Evidence for a first excited state in 2 9Mg at 54.6 keV has been found, in good agreement with theoretical predictions. From the lifetime, r=1.83±O.IO ns, deduced from y-y delayed coincidences with BaF2 counters, a transition strength BM\)—0.\ Weisskopf units is found for the 55 keV y + )—»-g.s. ( | + ) transition. A level scheme built on the new state at 55 keV and involving five new transitions has been established for bound levels in 2 9Mg. The features of these levels are compared with predictions of shell-model calculations, with which they substantially agree. In the neutron time-of-flight spectra, high-energy neutron branches have been found in addition to the previously reported decays. The observed distribution of the Gamow-Teller transition strengths with excitation energy for particle-unbound levels in 2 9Mg is found to be shifted upward by about 1 MeV relative to shell-model predictions.
I. INTRODUCTION
As part of a study of the emission modes of 3 0 Na, we have been led to a new investigation of the level structure of 2 9 Mg. Several bound states of 2 , M g Ex < 3.78 MeV) are populated in the fi decay of 3 0 Na through delayed one-neutron emission. Unbound states of M M g ( £ , > 3 . 7 8 MeV) are involved in delayed two-neutron emission from 3 l , Na if this decay is a sequential process. Consequently, it is important to have a comprehensive description of the 2 9 Na beta decay to both bound and unbound states of 2 , Mg. Furthermore, knowledge of Gamow-Teller (GT) decays with large Q values is in itself of fundamental interest, as it provides a measure of the intrinsic strength of this operator in nuclei and tests for shell-model calculations very far from stability. In id-shell nuclei, the model space of the valence nucléons is relatively small and full-space shell-model calculations are possible. In the case of the neutron-rich Na and Mg nuclei, detailed predictions for the GT decay have been published.2
The decay modes of the heavy Na isotopes were studied extensively by Detraz et a!.' and Guillemaud et al.* High-resolution energy spectra of delayed neutrons have been measured by Ziegert et u/. s for 2 7 ~ 3 l N a . The level structure of the neutron-rich magnesium isotopes has been investigated with transfer reactions by Fifield el a/. 6 In the case of the level scheme of 2 9 Mg, these authors propose a new interpretation of the experimental data of Ref. 4 which involves a level at 54 keV in 2 9 Mg. A low-energy doublet ( y + , y + ) is predicted for this nucleus by shell model ca lcula t ions 1 - 2 , 7 - 9 which employ an empirically re-
normalized effective Hamiltonian. We have undertaken a study at the CERN on-line mass
separator ISOLDE of the neutron and gamma emission modes which follow the beta decay of 2 9 Na and 3 0 Na. The aim of the study was to obtain a complete description of the /? strength function to be compared to the srf-shell model predictions. In this paper, we report on the measurements of the 2 9 Na beta decay by neutron and gamma spectroscopy. In particular, we describe the experiments made to establish the existence of a level at low energy in 2 9 Mg and to measure its lifetime. The upper part of the beta strength function is deduced from the energy spectra of delayed neutrons obtained with the time-of-flight technique and from n-y coincidence measurements. The data obtained are then compared with theoretical predictions.
II. EXPERIMENTAL PROCEDURE
The 2 9 N a isotope is produced by bombarding a uranium carbide target with a 2 /zA proton beam of the 600 MeV CERN synchrocyclotron. The Na atoms are ionized by means of a tungsten surface-ionization source. The mass-separated ion beam is collected inside a thin cylindrical P detector on the Mylar tape of a transport system. The yield achieved at the ISOLDE facility for 2 9 Na was ~ 2 . 1 0 3 atoms/s/jA'"' in this experiment. The activity of this short-lived isotope [Tul =44.9±1.2 ms (Ref. 4)] is measured at the collection point. The descendants and contaminants are removed by driving the tape with a constant velocity of 30 cm/s. In order to detect low-energy gamma rays, we use an intrinsic germanium detector with a beryllium window placed in front of a
36 765 ©1987 The American Physical Society
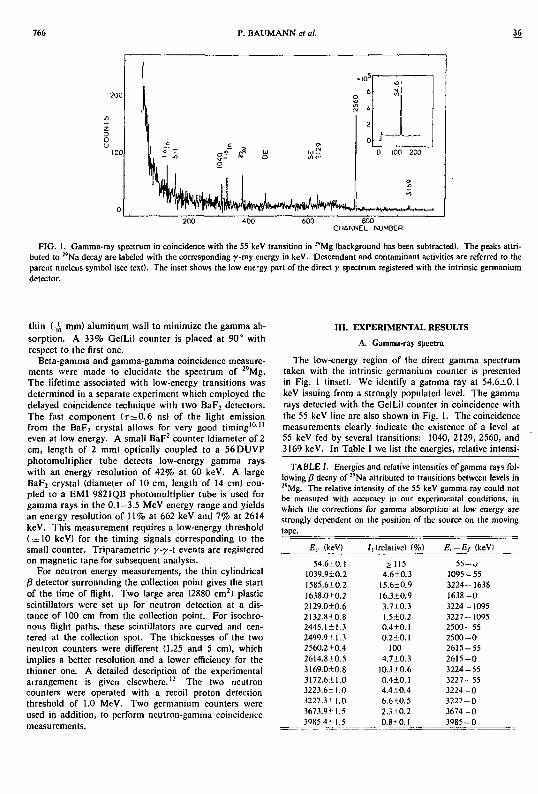
766 P. BAUMANN et al. 36
]*$^kto<Jto»>*k^
I 0 J
6 'I 4 | 2
0 ,JL
0 100 200
200 400 600 600 CHANNEL NUMBER
FIG. 1. Gamma-ray spectrum in coincidence with the 55 keV transition in :<)Mg (background has been subtracted). The peaks attributed to 2°Na decay are labeled with the corresponding y-ray energy in keV. Descendant and contaminant activities are referred to the parent nucleus symbol (see text). The inset shows the low ene-gy part of the direct y spectrum registered with the intrinsic germanium detector.
thin ( i mm) aluminum wall to minimize the gamma absorption. A 33% Ge(Li) counter is placed at 90° with respect to the first one.
Beta-gamma and gamma-gamma coincidence measurements were made to elucidate the spectrum of 2 , Mg. The lifetime associated with low-energy transitions was determined in a separate experiment which employed the delayed coincidence technique with two BaF 2 detectors. The fast component ( T = S 0 . 6 ns) of the light emission from the BaF 2 crystal allows for very good t i m i n g 1 0 " even at low energy. A small BaF 2 counter (diameter of 2 cm, length of 2 mm) optically coupled to a 56DUVP photomultiplier tube detects low-energy gamma rays with an energy resolution of 42% at 60 keV. A large BaF 2 crystal (diameter of 10 cm, length of 14 cm) coupled to a EMI 9821QB photomultiplier tube is used for gamma rays in the 0.1-3.5 MeV energy range and yields an energy resolution of 11% at 662 keV and 7% at 2614 keV. This measurement requires a low-energy threshold ( = 10 keV) for the timing signals corresponding to the small counter. Triparametric y-y-t events are registered on magnetic tape for subsequent analysis.
For neutron energy measurements, the thin cylindrical /? detector surrounding the collection point gives the start of the time of flight. Two large area (2880 cm 2) plastic scintillators were set up for neutron detection at a distance of 100 cm from the collection point. For isochronous flight paths, these scintillators are curved and centered at the collection spot. The thicknesses of the two neutron counters were different (1.25 and 5 cm), which implies a better resolution and a lower efficiency for the thinner one. A detailed description of the experimental arrangement is given elsewhere.1 2 The two neutron counters were operated with a recoil proton detection threshold of 1.0 MeV. Two germanium counters were used in addition, to perform neutron-gamma coincidence measurements.
III. EXPERIMENTAL RESULTS A. Gamma-ray spectra
The low-energy region of the direct gamma spectrum taken with the intrinsic germanium counter is presented in Fig. 1 (inset). We identify a gamma ray at 54.6+0.1 keV issuing from a strongly populated level. The gamma rays detected with the Ge(Li) counter in coincidence with the 55 keV line are also shown in Fig. 1. The coincidence measurements clearly indicate the existence of a level at 55 keV fed by several transitions: 1040, 2129, 2560, and 3169 keV. In Table I we list the energies, relative intensi-
TABLE I. Energies and relative intensities of gamma rays following P decay of !''Na attributed to transitions between levels in 2°Mg. The relative intensity of the 55 keV gamma ray could not be measured with accuracy in our experimental conditions, in which the corrections for gamma absorption at low energy are strongly dependent on the position of the source on the moving tape.
£,. (keV) /,.(relative) (%) E.-E, (keVI
54.6±0.1 >115 5 5 - j 1039.9±0.2 4.6+0.3 1095-55 1585.6±0.2 15.6+0.9 3224-1638 1638.0±0.2 16.3+0.9 1 6 3 8 - 0 2129.0±0.6 3.7+0.3 3224-1095 2132.810.8 1.5+0.2 3227-1095 2445.1 + 1.3 0.4+0.1 2 5 0 0 - 5 5 2499.9±1.3 0.2 ±0.1 2 5 0 0 - 0 2560.2+0.4 100 2 6 1 5 - 5 5 2614.8+0.5 4.7+0.3 2 6 1 5 - 0 3169.0+0.8 10.3+0.6 3 2 2 4 - 5 5 3172.6+1.0 0.4+0.1 3 2 2 7 - 5 5 3223.6+1.0 4.4+0.4 3 2 2 4 - 0 3227.3+1.0 6.6+0.5 3 2 2 7 - 0 3673.9+1.5 2.3+0.2 3 6 7 4 - 0 3985.4 < 1.5 0 ^ 0.1 3 9 8 5 - 0

36 GAMOW-TELLER BETA DECAY OF 2 9 Na AND COMPARISON . . . 767
imbalances of the y intensities feeding and emitting from the various levels. As we have no precise value for the relative intensity of the 55 keV transition, we indicate for the total /? feeding of the ground and 55 keV state the value given in Ref. 4 for the unobserved /? transitions.
The log/( values lifted in Table III for /S branches to bound levels in 2 'Mg are deduced from our results by making use of values given in Refs. 4 and 13 for 7"|/ 2, Qp, and P„. Among the lines attributed to the 2 9 N a decay are four which correspond to transitions between levels of " M g (Table IV). These allow us to determine the intensities of neutron branches to four excited states in the residual nucleus 2 8 Mg (1.47, 3.86, 4.55, and 4.56 MeV).
B. Lifetime measurement of the 55 keV level in 2 9Mg
The 2560 and 3169 keV gamma rays, which are the main branches to the 55 keV level, are well separated in energy (Fig. 2), so that energy selection can be done with the BaF 2 detectors. We have analyzed the time spectra corresponding to the windows on the full-energy peaks of the 2.56—0.055 and 3.17—0.055 MeV cascades. The resulting delayed curve in the first case is shown in Fig. 3 (curve A). The prompt curve (B) [full width at half maximum (FWHM) of 1.4 ns] if obtained with gates placed on the 1.29 MeV gamma ray ( l l 6 In) and in the 100 keV region of the spectrum (inset of Fig. 2). The calibration of the time axis has been obtained by registering the prompt curve with different calibrated delays. From a least-squares fit on the data we have deduced the value of 409±0.88 ps/channel. The analysis has been done on the delayed component of the coincidence curves. A weighted least squares fit on the experimental decay curve leads to the value of r = 1.84±0.12 ns, in very good agreement with the value deduced from the other weaker cascade ( r = 1.79±0.18 ns). For these values, the statistical error is dominant and the time-calibration error can be neglected. From these considerations we adopt for the lifetime
TABLE III. 0 branching, iog/7, and B(GTJ values jbserved for bound levels (29Mg) in the 2 9Na decay together with predicted fl(GT) values. As we have no precise value for the relative intensity of the 55 keV transition, we indicate, for the total B feeding of the ground and the 55 keV excited states, the value given in Ref- 4 for the unobserved B transitions.
£, b B(GT),hm
(keV) (%) log/ ' B(GT)„ P , (free nucléon)
0 0.0115 24+10 5.3+0.2 0.031
55 0.111 1095 <0.2 > 7 . 0 < 0.0006 1638 <0 .4 > 6 . 6 < 0.0015 0.003 2500 0.22+0.05 6.7+0.1 0.0012 0.005 2615 37.8+7.2 4.4+0.1 0.245 0.373 3224 12.3+2.4 4.8 + 0.1 0.097 0.261 3227 3.1+0.6 5.4+0.1 0.0245 0.074 3674 0.8 + 0.2 5.9 + 0.1 0.007 0.035 3985 0.29±0.06 6.2+0.1 0.004
2 =0.410
0.032
= 0.906
TABLE II. Gamma-ray branching ratios in ^Mg.
E, (keV) E, (keV) This work
55 0 100
1095 55 100
1638 0 100
2500 0 38±6 55 62 + 6
2615 0 4.5±0.3 55 95.5±0.3
3224 0 13+1 55 30+2
1095 11 + 1 1638 46±2
3227 0 78±2 55 5+1
1095 17±2
3674 0 100
3985 0 100
ties, and assignments of gamma rays following the beta decay of 2 , N a . Experimental branching ratios of the levels which give rise to these gamma rays are listed in Table II.
In the gamma spectra, we observe, in addition to these 2 9 Mg transitions, lines corresponding to the decay of contaminant nuclei " 6 A g and " ' In . These atoms (4 + , / f =116) are not separated from the singly charged A = 2 9 beam because they have the same energy-to-charge and mass-to-charge ratios.
The intensities of the fi branches are deduced from the
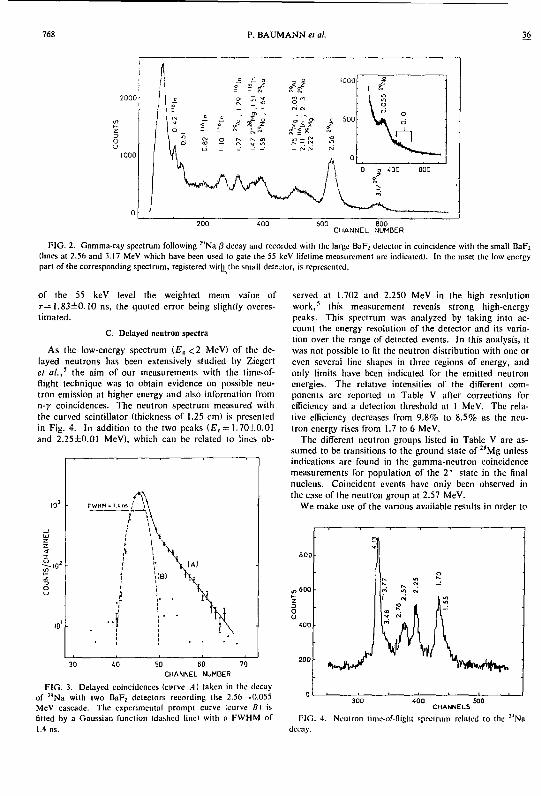
768 P. BAUMANN et al.
600 800 CHANNEL NUMBER
FIG. 2. Gamma-ray spectrum following *"'Na /? decay and recorded with the large BaF; detector in coincidence with the small BaF2 (lines at 2.56 and 3.17 MeV which have been used to gate the 55 keV lifetime measurement arc indicated). In the inset the low energy part of the corresponding spectrum, registered with the small detector, is represented.
of the 55 keV level the weighted mean value of T = 1 . 8 3 ± 0 . 10 ns, the quoted error being slightly overestimated.
C. Delayed neutron spectra
As the low-energy spectrum ( £ n < 2 MeV) of the delayed neutrons has been extensively studied by Ziegert el a/., 5 the aim of our measurements with the time-of-fiight technique was to obtain evidence on possible neutron emission at higher energy and also information from n-y coincidences. The neutron spectrum measured with the curved scintillator (thickness of 1.25 cm) is presented in Fig. 4. In addition to the two peaks (£„ = 1.7010.01 and 2.25+0.01 MeV), which can be related to lines ob-
50 60 CHANNEL NUMBER
FIG. 3. Delayed coincidences (curve A ) taken in the decay of 2 I ,Na with two BaF: detectors recording the 2.56—.0.055 MeV cascade. The experimental prompt curve (curve B\ is fitted by a Gaussian function (dashed lincl with a FWHM of 1.4 ns.
served at 1.702 and 2.250 MeV in the high resolution work, 5 this measurement reveals strong high-energy peaks. This spectrum was analyzed by taking into account the energy resolution of the detector and its variation over the range of detected events. In this analysis, it was not possible to fit the neutron distribution with one or even several line shapes in three regions of energy, and only limits have been indicated for the emitted neutron energies. The relative intensities of the different components are reported in Table V after corrections for efficiency and a detection threshold at 1 MeV. The relative efficiency decreases from 9.8% to 8.5% as the neutron energy rises from 1.7 to 6 MeV.
The different neutron groups listed in Table V are assumed to be transitions to the ground state of 2 8 Mg unless indications arc found in the gamma-neutron coincidence measurements for population of the 2 1 state in the final nucleus. Coincident events have only been observed in the case of the neutron group at 2.57 MeV.
We make use of the various available results in order to
8 0 0 5
600
<00
o
m m CM
' « HE • *• I ft" <r> A 1 J J I
200 *wJW* nAwtyip,
400 500 CHANNELS
FIG. 4. Neutron time-of-flight sped rum related to the :"Na decay.
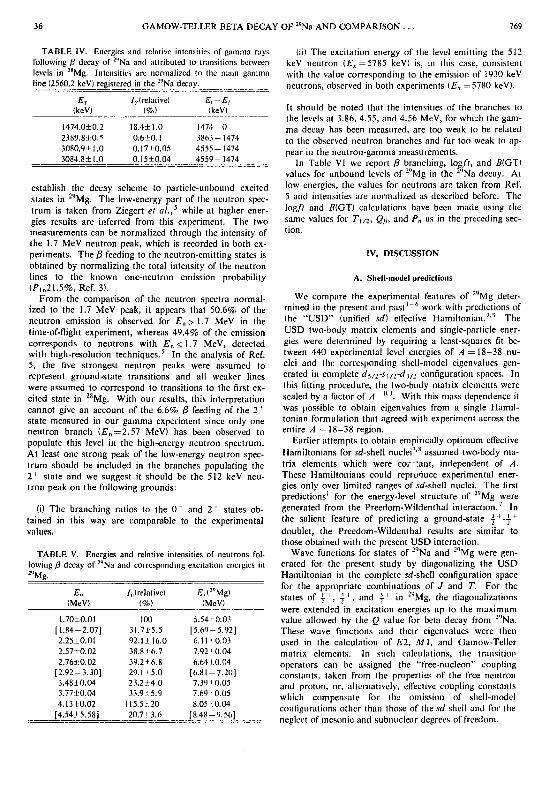
36 GAMOW-TELLER BETA DECAY OF 2 9Na AND COMPARISON . . . 769
TABLE IV. Energies and relative intensities of gamma rays following (3 decay of 2 l |Na and attributed to transitions between levels in 2*Mg. Intensities are normalized to the main gamma line (2560.2 keV) registered in the 2';Na decay.
£> /,.(relative) £ , - £ / (keV) <%) (keV)
1474.0±0.2 18.4+1.0 1474-0 2389.810. 0.6+0.1 3863-1474 3080.9+1.0 0.17+0.05 4555-1474 3084.8±1.0 0.15 + 0.04 4559-1474
establish the decay scheme to particle-unbound excited states in 2''Mg. The low-energy part of the neutron spectrum is taken from Ziegert el a/., 5 while at higher energies results are inferred from this experiment. The two measurements can be normalized through the intensity of the 1.7 MeV neutron peak, which is recorded in both experiments. The P feeding to the neutron-emitting states is obtained by normalizing the total intensity of the neutron lines to the known one-neutron emission probability (/>i„21.5%, Ref. 3).
From the comparison of the neutron spectra normalized to the 1.7 MeV peak, it appears that 50.6% of the neutron emission is observed for E„ > 1.7 MeV in the time-of-flight experiment, whereas 49.4% of the emission corresponds to neutrons with £ n < 1 . 7 MeV, detected with high-resolution techniques.5 In the analysis of Ref. 5, the five strongest neutron peaks were assumed to represent ground-state transitions and all weaker lines were assumed to correspond to transitions to the first excited state in 2 8 Mg. With our results, this interpretation cannot give an account of the 6.6% /? feeding of the 2 +
state measured in our gamma experiment since only one neutron branch (£,, = 2.57 MeV) has been observed to populate this level in the high-energy neutron spectrum. At least one strong peak of the low-energy neutron spectrum should be included in the branches populating the 2 + state and we suggest it should be the 512 keV neutron peak on the following grounds:
(i) The branching ratios to the 0 + and 2+ states obtained in this way are comparable to the experimental values.
TABLE V. Energies and relative intensities of neutrons following 13 decay of 2 l |Na and corresponding excitation energies in 2 ,Mg.
En /n(relative) £,( 2 "Mg) (MeV) (%> (MeV)
1.70+0.01 100 5.54+0.03 [1 .84 -2 .07 ] 31.7+5.5 [5 .69-5 .92] 2.25+0.01 92.1 + 16.0 6.11 10.03 2.57+0.02 38.8 + 6.7 7.92)0.04 2.76+0.02 39.2 + 6.8 6.64)0.04
[2 .92-3 .30] 29.1+5.0 [6 .81-7 .20] 3.48±0.04 23.2+4.0 7.39 i 0.05 3.77±0.04 33.9 + 5.9 7.69 • 0.05 4.13 10.02 115.5120 8.05 t.0.04
[4.5415.58] 20.71.3.6 [8 .48-9 .56]
(ii) The excitation energy of the level emitting the 512 keV neutron ( £ , = 5785 keV) is, in this case, consistent with the value corresponding to the emission of 1930 keV neutrons, observed in both experiments ( £ , =5780 keV).
It should be noted that the intensities of the branches to the levels at 3.86, 4.55, and 4.56 MeV, for which the gamma decay has been measured, are too weak to be related to the observed neutron branches and far too weak to appear in the neutron-gamma measurements.
In Table VI we report 13 branching, log/V, and B(GT) values for unbound levels of 2 q Mg in the 2 , )Na decay. At low energies, the values for neutrons are taken from Ref. 5 and intensities are normalized as described before. The log/7 and B(GT) calculations have been made using the same values for Ti/2, Qih and P„ as in the preceding section.
IV. DISCUSSION
A. Shell-model predictions
We compare the experimental features of 2 0 Mg determined in the present and p a s t ' - 6 work with predictions of the "USD" (unified sd) effective Hamiltonian. 2 ' 9 The USD two-body matrix elements and single-particle energies were determined by requiring a least-squares fit between 440 experimental level energies of A =18-38 nuclei and the corresponding shell-model eigenvalues generated in complete di/2-s\/2-d/2 configuration spaces. In this fitting procedure, the two-body matrix elements were scaled by a factor of A ( u . With this mass dependence it was possible to obtain eigenvalues from a single Hamiltonian formulation that agreed with experiment across the entire A = 18-38 region.
Earlier attempts to obtain empirically optimum effective Hamiltonians for .sd-shell nuclei 7 , 8 assumed two-body matrix elements which were cor r*ant, independent of A. These Hamiltonians could reproduce experimental energies only over limited ranges of .«/-shell nuclei. The first predictions' for the energy-level structure of 2 , M g were generated from the Preedom-Wildenthal interaction.' In the salient feature of predicting a ground-state y ' f - j +
doublet, the Preedom-Wildenthal results are similar to those obtained with the present USD interaction.
Wave functions for states of 2 9 Na and 2 9 Mg were generated for the present study by diagonaiizing the USD Hamiltonian in the complete .«/-shell configuration space for the appropriate combinations of J and T. For the states of I ' , -i + , and + in 2''Mg, the diagonalizations were extended in excitation energies up to the maximum value allowed by the Q value for beta decay from 2 < INa. These wave functions and their eigenvalues were then used in the calculation of £2 , Ml, and Gamow-Teller matrix elements. In such calculations, the transition operators can be assigned the "free-nucleon" coupling constants, taken from the properties of the free neutron and proton, or, alternatively, effective coupling constants which compensate for the omission of shell-model configurations other than those of the sd shell and for the neglect of mesonic and subnuclear degrees of freedom.
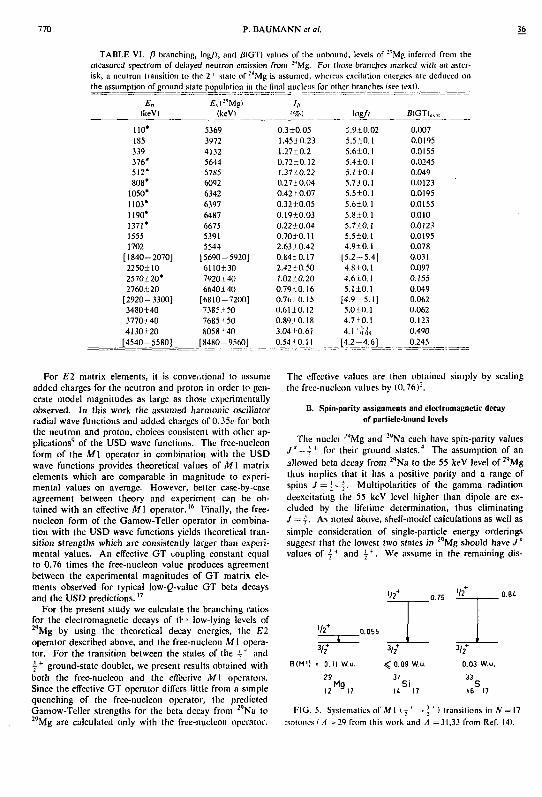
770 P. BAUMANN et al. 36
TABLE VI. P branching, log/'/, and /Ï(GT) values of the unbound, levels of :<>Mg inferred from the measured spectrum of delayed neutron emission from :"Mg. For those branches marked with an asterisk, a neutron transition to the 2 *" state of : t !Mg is assumed, whereas excitation energies are deduced on the assumption of ground state population in_the final nucleus for other branches (see text).
E„ EX "Mg> h (keV) (keVI 1%) log/) B(OT)„ r ,
110* 5369 0.3+0.05 ; .9±0.02 0.007 185 3972 1.45+0.23 5.5+0.1 0.0195 339 4132 1.27±0.2 5.610.1 0.0155 376* 5644 0.72+0.12 5.410.1 0.0245 512* 5785 1.3710.22 5.1+0.1 0.049 808* 6092 0.2710.04 5.710.1 0.0123
1050* 6342 0.42 + 0.07 5.5+0.1 0.0195
1103* 6397 0.32+0.05 5.610.1 0.0155
1190* 6487 0.19 + 0.03 5.810.1 0.010 1371* 6675 0.22+0.04 5.710.1 0.0123 1555 5391 0.70+0.11 5.510.1 0.0195 1702 5544 2.63+0.42 4.910.1 0.078
[1840-2070] [5690--5920] 0.8410.17 [ 5 . 2 - 5 . 4 ] 0.031 2250+10 6110+ 30 2.42+0.50 4.810.1 0.097
2570±20* 7920 + 40 1.0210.20 4.610.1 0.155 2760 + 20 6640.1 40 0.79+0.16 5.110.1 0.049
[2920-3300] [6810--7200] 0.76+0.15 [ 4 . 9 - 5 . 1 ] 0.062 3480+40 7385 + 50 0.6110.12 5.010.1 0.062 3770x40 7685 + 50 0.8910.18 4.710.1 0.123
4130 + 20 8058140 3.04+0.61 4.r Si 0.490
[4540-5580] [8480- 9560] 0.54+0.11 [ 4 . 2 - 4 . 6 ] 0.245
For E2 matrix elements, it is conveiitional to assume added charges for the neutron and proton in order to generate model magnitudes as large as those experimentally observed. In this work the assumed harmonic oscillator radial wave functions and added charges of 0.35c for both the neutron and proton, choices consistent with other applications' of the USD wave functions. The free-nucleon form of the Ml operator in combination with the USD wave functions provides theoretical values of M1 matrix elements which are comparable in magnitude to experimental values on average. However, better case-by-case agreement between theory and experiment can be obtained with an effective A/1 operator. 1 6 Finally, the free-nucleon form of the Gamow-Teller operator in combination with the USD wave functions yields theoretical transition strengths which are consistently larger than experimental values. An effective GT coupling constant equal to 0.76 times the free-nucleon value produces agreement between the experimental magnitudes of GT matrix elements observed for typical low-2-value GT beta decays and the USD predictions. I 7
For the present study we calculate the branching ratios for the electromagnetic decays of tr * low-lying levels of 2 , M g by using the theoretical decay energies, the El operator described above, and the free-nucleon M1 operator. For the transition between the states of the | i and + ground-state doublet, we present results obtained with both the free-nucleon and the effective MI operators. Since the effective GT operator differs little from a simple quenching of the free-nucleon operator, the predicted Gamow-Teller strengths for the beta decay from 2"Na to 2 , M g are calculated only with the frce-nucleon operator.
The effective values are then obtained simply by scaling the free-nucleon values by (0.76) :.
B. Spin-parity assignments and electromagnetic decay of particle-bound levels
The nuclei "Mg and 2"Na each have spin-parity values J'=l+ for their ground states. 4 The assumption of an allowed beta decay from 2 , Na to the 55 keV level of 2 , M g thus implies that it has a positive parity and a range of spins y = | - | . Multipolarities of the gamma radiation deexcitating the 55 keV level higher than dipole are excluded by the lifetime determination, thus eliminating J = T- As noted above, shell-model calculations as well as simple consideration of single-particle energy orderings suggest that the lowest two states in 2 , Mg should have J " values of i"1 and l" 1 . We assume in the remaining dis-
1/2* >I2
' / 2 +
I 0.055
1 3 / 2 +
0.055
3 / 2 + 3 / 2 *
B(M1) . 0.11 W.u. < 0.09 W.u. 0.03 W.u.
29 Mg
12 17
31 S
u i
17
33 i
16" 17
FIG. 5. Systematic* of M I I ' — 4 ' > transitions in N = 17 isoiones I A -29 from this work and A =31,33 from Ref. 14).
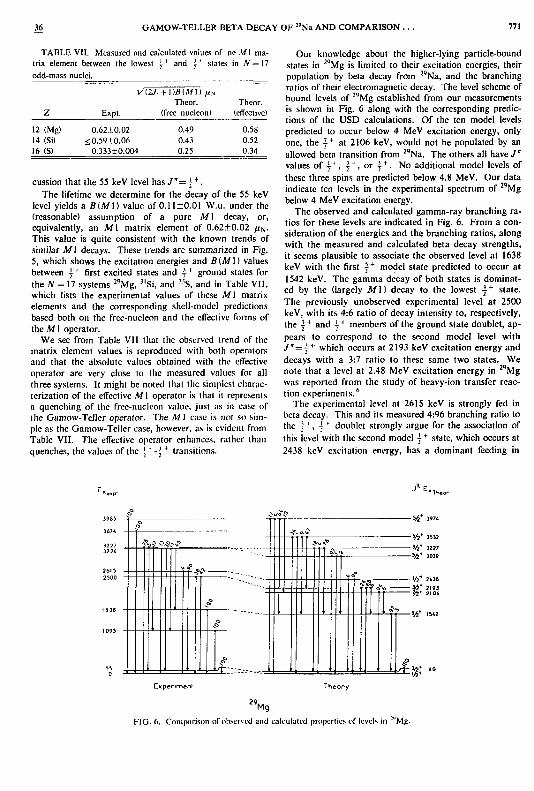
36 GAMOW-TELLER BETA DECAY OF 2 9Na AND COMPARISON . . . 771
TABLE VII. Measured and calculated values of ne M\ matrix element between the lowest ~+ and 4* stales in N = ]7 odd-mass nuclei.
l/(2y, + l)B(A/l) /IN Theor. Theor.
z Expt. (free nucléon) (effective)
12 (Mg) 0.62+0.02 0.49 0.58 14 (Si) < 0.59+0.06 0.43 0.52 16 (S) 0.333±0.004 0.25 0.34
cussion that the 55 keV level has J"=j*. The lifetime we determine for the decay of the 55 keV
level yields a BMl) value of 0.11 ±0.01 W.u. under the (reasonable) assumption of a pure Ml decay, or, equivalently, an Ml matrix element of 0.62+0.02 ftN. This value is quite consistent with the known trends of similar Ml decays. These trends are summarized in Fig. 5, which shows the excitation energies and B(Ml) values between ~+ first excited states and "• ground states for the N = 11 systems 2 9 Mg, 3 l Si, and "S , and in Table VII, which lists the experimental values of these Ml matrix elements and the corresponding shell-model predictions based both on the free-nucleon and the effective forms of the M1 operator.
We see from Table VII that the observed trend of the matrix element values is reproduced with both operators and that the absolute values obtained with the effective operator are very close to the measured values for all three systems. It might be noted that the simplest characterization of the effective M1 operator is that it represents a quenching of the free-nucleon value, just as in case of the Gamow-Teller operator. The M1 case is not so simple as the Gamow-Teller case, however, as is evident from Table VII. The effective operator enhances, rather than quenches, the values of the y 4 - | + transitions.
E
Our knowledge about the higher-lying particle-bound states in 2 'Mg is limited to their excitation energies, their population by beta decay from 2 9 Na, and the branching ratios of their electromagnetic decay. The level scheme of bound levels of 2 9 Mg established from our measurements is shown in Fig. 6 along with the corresponding predictions of the USD calculations. Of the ten model levels predicted to occur below 4 MeV excitation energy, only one, the T
+ at 2106 keV, would not be populated by an allowed beta transition from 2 , Na. The others all have J" values of I 4 , | + , or f + . No additional model levels of these three spins are predicted below 4.8 MeV. Our data indicate ten levels in the experimental spectrum of 2 9 Mg below 4 MeV excitation energy.
The observed and calculated gamma-ray branching ratios for these levels are indicated in Fig. 6. From a consideration of the energies and the branching ratios, along with the measured and calculated beta decay strengths, it seems plausible to associate the observed level at 1638 keV with the first \* model state predicted to occur at 1542 keV. The gamma decay of both states is dominated by the (largely Ml) decay to the lowest \ + state. The previously unobserved experimental level at 2500 keV, with its 4:6 ratio of decay intensity to, respectively, the | + and V members of the ground state doublet, appears to correspond to the second model level with j"=L+ which occurs at 2193 keV excitation energy and decays with a 3:7 ratio to these same two states. We note that a level at 2.48 MeV excitation energy in 2 9 Mg was reported from the study of heavy-ion transfer reaction experiments.''
The experimental level at 2615 keV is strongly fed in beta decay. This and its measured 4:96 branching ratio to the I ' , -I ' doublet strongly argue for the association of this level with the second model 7
+ state, which occurs at 2438 keV excitation energy, has a dominant feeding in
J" EM,
2615 2 500
* =p-?^»
0 . * • — . * • —
J?
^
4?
- 5 ^ 3974
-W 3532
-W 3227 -5/5"1 3039
- « * V? 2436 * £ e > *ft« 2193
'ft* 2)06
- % * 15*2
>T~ 3/2* <0
Experiment Theory
Mg
FIG. 6. Comparison of observed and calculated properties of levels in ;"Mg.
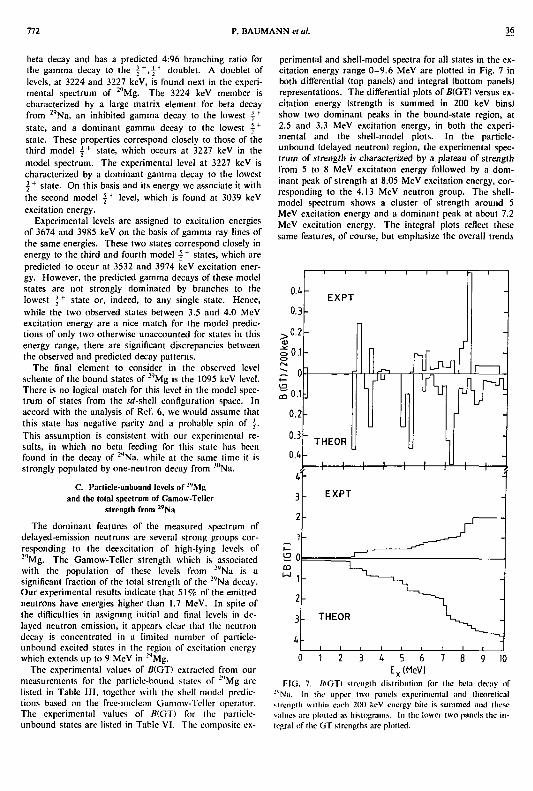
772 P. BAUMANN et al. 36
beta decay and has a predicted 4:96 branching ratio for the gamma decay to the T + »y + doublet. A doublet of levels, at 3224 and 3227 keV, is found next in the experimental spectrum of 2 , Mg. The 3224 keV member is characterized by a large matrix element for beta decay from 2 9 Na, an inhibited gamma decay to the lowest t +
state, and a dominant gamma decay to the lowest +
state. These properties correspond closely to those of the third model y + state, which occurs at 3227 keV in the model spectrum. The experimental level at 3227 keV is characterized by a dominant gamma decay to the lowest + state. On this basis and its energy we associate it with the second model ' level, which is found at 3039 keV excitation energy.
Experimental levels are assigned to excitation energies of 3674 and 3985 keV on the basis of gamma ray lines of the same energies. These two states correspond closely in energy to the third and fourth model 4 + states, which are predicted to occur at 3532 and 3974 keV excitation energy. However, the predicted gamma decays of these model states are not strongly dominated by branches to the lowest | 1 state or, indeed, to any single state. Hence, while the two observed states between 3.5 and 4.0 MeV excitation energy are a nice match for the model predictions of only two otherwise unaccounted for states in this energy range, there are significant discrepancies between the observed and predicted decay patterns.
The final element to consider in the observed level scheme of the bound states of 2''Mg is the 1095 keV level. There is no logical match for this level in the model spectrum of states from the .«/-shell configuration space. In accord with the analysis of Ref. 6, we would assume that this state has negative parity and a probable spin of ~. This assumption is consistent with our experimental results, in which no beta feeding for this stale has been found in the decay of 2''Na, while at the same lime it is strongly populated by one-neutron decay from l 0 Na.
C. Particle-unbound levels of 29Mj> and the total spectrum of Gamow-Tcllcr
strength from 2 9Na
The dominant features of the measured spectrum of delayed-emission neutrons are several strong groups corresponding to the deexcitation of high-lying levels of 2 < lMg. The Gamow-Teller strength which is associated with the population of these levels from 2"Na is a significant fraction of the total strength of the 2 g Na decay. Our experimental results indicate that 5 1 % of the emitted neutrons have energies higher than 1.7 MeV. In spite of the difficulties in assigning initial and final levels in delayed neutron emission, it appears clear that the neutron decay is concentrated in a limited number of particle-unbound excited states in the region of excitation energy which extends up to 9 MeV in 2 l |Mg.
The experimental values of fl(GT) extracted from our measurements for the particle-bound stales of 2''Mg arc listed in Table III, together with the shell-model predictions based on the frce-nucleon Gamow-Tcllcr operator. The experimental values of fl(GT) for the panicle-unbound states are listed in Table VI. The composite ex
perimental and shell-model spectra for all states in the excitation energy range 0-9.6 MeV are plotted in Fig. 7 in both differential (top panels) and integral (bottom panels) representations. The differential plots of fi(GT) versus excitation energy (strength is summed in 200 keV bins) show two dominant peaks in the bound-state region, at 2.5 and 3.3 MeV excitation energy, in both the experimental and the shell-model plots. In the particle-unbound (delayed neutron) region, the experimental spectrum of strength is characterized by a plateau of strength from 5 to 8 MeV excitation energy followed by a dominant peak of strength at 8.05 MeV excitation energy, corresponding to the 4.13 MeV neutron group. The shell-model spectrum shows a cluster of strength around 5 MeV excitation energy and a dominant peak at about 7.2 MeV excitation energy. The integral plots reflect these same features, of course, but emphasize the overall trends
0.4 EXPT
-, i
0.3 - --.0.2 - -0)
S o.i -rJ—1
JllLu, r
i i
nO.l ~j \f ""If AH 0.2 |J -0.3 " THEOR L -0.4 -C 3 EXPT
2
_ 1 i— ID fl r ~ - ^ ^ ^ m w 1
T - ^ _ _ ^ ^
2 ^ " ^ - , 3 . THEOR 4 . ^ ^
< 0
< 0 1 2 3 4 5 6 7 8 9 10
Ex(MeV) FIG. 7. /JlGTl strength distribution Tor the beta decay of
:"Na. In the upper two panels experimental and theoretical si length within each 200 keV energy bite is summed and these values are plotted as histograms. In the lower two panels the integral of the GT strengths are plotted.

36 GAMOW-TELLER BETA DECAY OF "Na AND COMPARISON . . . 773
of strength versus energy. The essential differences between the measured and
the predicted distributions of Gamow-Teller strength are the displacement, relative to experiment, of theoretical strength in the particle-unbound region to lower (about 1 MeV) excitation energies and the overall smaller magnitudes of observed strength relative to the shell-model predictions. The difference in the overall normalization of shell-model versus experimental Gamow-Teller strength is completely consistent with existing knowledge about «/-shell nuclear s t r u c t u r e . 1 5 _ n The ratio of observed Gamow-Teller strength to that predicted from the USD wave functions with the free-nucleon normalization is 0.45 for the states in the particle-bound region and 0.5 for the entire 9.6 MeV span of measurement and calculation. These quenching factors of experiment relative to theory are to be compared with the global average quenching factor for the low-lying beta decay in the sd shell of 0.56. " In the context of the uncertainties attendant to the present experimental normalization, the present quenching factor is consistent with this "standard" value.
It is worth noting that the Gamow-Teller strength from 2 9 Na that is located below 9.6 MeV excitation energy in 2 , M g amounts to only about i of the total decay strength from this parent state. Hence, the extracted ratio of ex-
'B. J. Cole, A. Watt, and R. R. Whitehead, J. Phys. A 7, 1399 (1974).
2B. H. Wildenthal, M. S. Curtin, and B. A. Brown, Phys. Rev. C 28, 1343(1983).
3C. Detraz, D. Guillemaud, G. Huber, R. Klapisch, M. Langevin, F. Naulin, C. Thibault, L. C. Carraz, and F. Touchard, Phys. Rev. C 19, 164 (1979).
4 D. Guillemaud-Mucllcr, C. Detraz, M. Langevin, F. Naulin, M. de Saint-Simon, C. Thibault, F. Touchard, and M. Epherre, Nucl. Phys. A426, 37 (1984); D. Guillemaud, Ph.D. thesis, Université Orsay, 1982 (unpublished).
5W. Ziegert, L. C. Carraz, P. G. Hansen, B. Jonson, K. L. Kratz, G. Nyman, H. Ohm, H. L. Ravn, and A. Schroder, in Proceedings of the 4th International Conference on Nuclei Far From Stability, Helsingor, 1981, CERN Report 81-09, 1981, p. 327.
6 L. K. Fifield, P. V. Drumm, M. A. C. Hotchkis, T. R. Ophel, and C. L. Woods, Nucl. Phys. A437, 141 (1985).
7B. M. Preedom and B. H. Wildenthal, Phys. Rev. C 6, 1633 (1972).
8W. Chung, Ph.D. thesis, Michigan State University, 1976 (unpublished).
9 B. H. Wildenthal, Prog. Part. Nucl. Phys. 11, 5 (1983). 1 0M. Laval, M. Moszynski, R. Allemand, E. Cormoreche, P.
périment to theory depends sensitively upon the detailed d energy distributions of this strength. The dislocation in e excitation energies of the strength concentrations in the il 4.0-9.6 MeV region between the model predictions and 1 the experimental results should be considered in this light. ;- Such discrepancies between experiment and theory are not ;1 outside the range of findings for nuclei closer to stability ii and perhaps represent no more than the intrinsic noise of r the present level of model accuracy. On the other hand, g the proximity of the presently studied systems to the onset e of strong deformations which invert the normal ordering
of the shell-model orbits, a symptom of which is provided i by the 1095 keV state, may underly this discrepancy in i the distribution of Gamow-Teller strength.
Further detailed study of the structure of neutron-rich nuclei near jV =20 should help clarify these questions.
ACKNOWLEDGMENTS
5 The authors are indebted to the Crystal Castle Collaboration of Strasbourg for the loan of the barium fluoride
i detectors and wish to thank P. Engelstein for helpful dis-' eussions concerning time measurements. The research
was supported in part (B.H.W.) by the U.S. National Science Foundation under Grant No. PHY-85-09736.
Guinel, R. Odru, and J. Vacher, Nucl. Instrum. Methods 206, 169(1983).
"F . A. Beck, Properties of Large BaFi Crystals. Application as Fast and Efficient Gamma-Ray Detectors in the 4-tr-Crystal Castle Array. Vol. 7 of Nuclear Science Research Conference Series, Oak Ridge, 1984 (Hardwood, New York, 1984).
I 2 A. Huck, G. Klotz, A. Knipper, C. Miehé, C. Richard-Serre, G. Walter, A. Povès, H. L. Ravn, and G. Marguier, Phys. Rev. C 31, 2226(1985).
"T. BjBrnstad, H. A. Gustafsson, P. G. Hansen, B. Jonson, V. Lindfors, S. Mattsson, A. M. Poskanzer, and H. L. Ravn, Nucl. Phys. A359, 1 (1981).
1 4 P. M. Endt, At. Data Nucl. Data Tables 23, 3 (1979); P. M. Endt and C. van der Lean, Nucl. Phys. A310, 1 (1978).
, 5 T. Bjôrnstad, M. J. G. Borge, P. Dessagne, R. D. von Dink-lage, G. T. Ewan, P. G. Hansen, A. Huck, B. Jonson, G. Klotz, A. Knipper, P. O. Larsson, G. Nyman, H. L. Ravn, C. Richard-Serre, K. Riisager, D. Schardl, and G. Walter, Nucl. Phys. A433, 283(1985).
I 6 B. A. Brown and B. H. Wildenthal, Phys. Rev. C 28, 2397 (1983).
"B. A. Brown and B. H. Wildenthal, At. Data Nucl. Data Tables 33, 347(1985).

PUBLICATION V
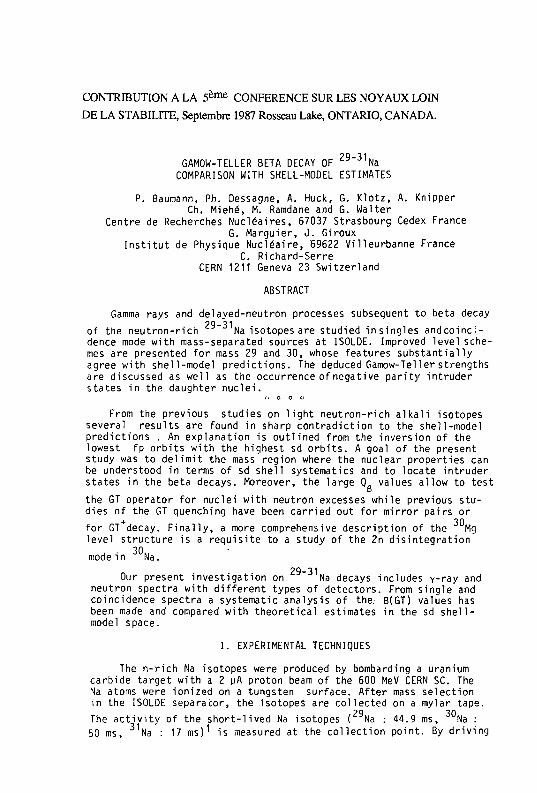
CONTRIBUTION A LA 5 è m e CONFERENCE SUR LES NOYAUX LOIN
DE LA STABILITE, Septembre 1987 Rosseau Lake, ONTARIO, CANADA.
GAMOW-TELLER BETA DECAY OF " J I Na COMPARISON WITH SHELL-MODEL ESTIMATES
P. Baumann, Ph. Dessagne, A. Huck, G. K lo tz , A. Knipper Ch. Miehé, M. Ramdane and G. waiter
Centre de Recherches Nucléaires, 67037 Strasbourg Cedex France G. Marguier, J . Giroux
I n s t i t u t de Physique Nucléaire, 69622 Villeurbanne France C. Richard-Serre
CERN 1211 Geneva 23 Switzerland
ABSTRACT
Gamma rays and delayed-neutron processes subsequent to beta decay 29-31
of the neutron-rich Na isotopes are studied in singles andcoinc-dence mode with mass-separated sources at ISOLDE. Improved level schemes are presented for mass 29 and 30, whose features substantially agree with shell-model predictions. The deduced Gamow-Tel 1er strengths are discussed as well as the occurrence of negative parity intruder states in the daughter nuclei.
f. O O Û
From the previous studies on light neutron-rich alkali isotopes several results are found in sharp contradiction to the shell-model predictions . An explanation is outlined from the inversion of the lowest fp orbits with the highest sd orbits. A goal of the present study was to delimit the mass region where the nuclear properties can be understood in terms of sd shell systematics and to locate intruder states in the beta decays. Moreover, the large Q. values allow to test
the GT operator for nuclei with neutron excesses while previous studies of the GT quenching have been carried out for mirror pairs or
for GT decay. Finally, a more comprehensive description of the Mg level structure is a requisite to a study of the 2n disintegration
30 mode in Na.
29-31 Our present investigation on Na decays includes y-ray and
neutron spectra with different types of detectors. From single and coincidence spectra a systematic analysis of the.- B(GT) values has been made and compared with theoretical estimates in the sd shell-model space.
I. EXPERIMENTAL TECHNIQUES
The n-rich Na isotopes were produced by bombarding a uranium carbide target with a 2 pA proton beam of the 600 MeV CERN SC. The Na atoms were ionized on a tungsten surface. After mass selection in the ISOLDE separator, the isotopes are collected on a mylar tape.
29 30 The activity of the short-lived Na isotopes ( Na : 44.9 ms, Na : 50 ms, Na : 17 ms) 1 is measured at the collection point. By driving
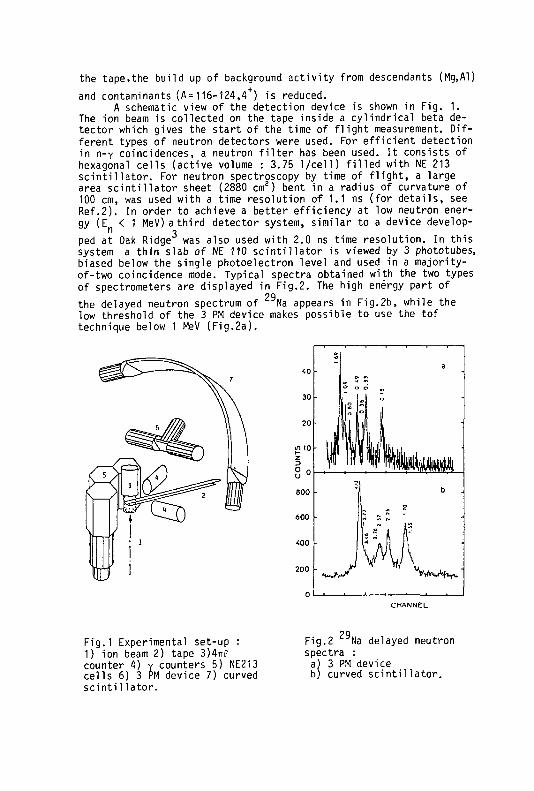
the tape,the build up of background activity from descendants (Mg.Al) and contaminants (A=116-124,4 ) is reduced.
A schematic view of the detection device is shown in Fig. 1. The ion beam is collected on the tape inside a cylindrical beta detector which gives the start of the time of flight measurement. Different types of neutron detectors were used. For efficient detection in n-y coincidences, a neutron filter has been used. It consists of hexagonal cells (active volume : 3.75 1/cell) filled with NE 213 scintillator. For neutron spectroscopy by time of flight, a large area scintillator sheet (2880 cm 2) bent in a radius of curvature of 100 cm, was used with a time resolution of 1.1 ns (for details, see Ref.2). In order to achieve a better efficiency at low neutron energy (E < 1 MeV)athird detector system, similar to a device develop-
n 3 ped at Oak Ridge was also used with 2.0 ns time resolution. In this system a thin slab of NE 110 scintillator is viewed by 3 phototubes, biased below the single photoelectron level and used in a majority-of-two coincidence mode. Typical spectra obtained with the two types of spectrometers are displayed in Fig.2. The high energy part of
29 the delayed neutron spectrum of Na appears in Fig.2b, while the low threshold of the 3 PM device makes possible to use the tof technique below 1 MeV (Fig.2a).
Fig.1 Experimental set-up : 1) ion beam 2) tape 3)4TTF counter 4) y counters 5) NE213 cells 6) 3 PM device 7) curved scintillator.
29 Fig.2 Na delayed neutron spectra : a) 3 PM device b) curved scintillator.
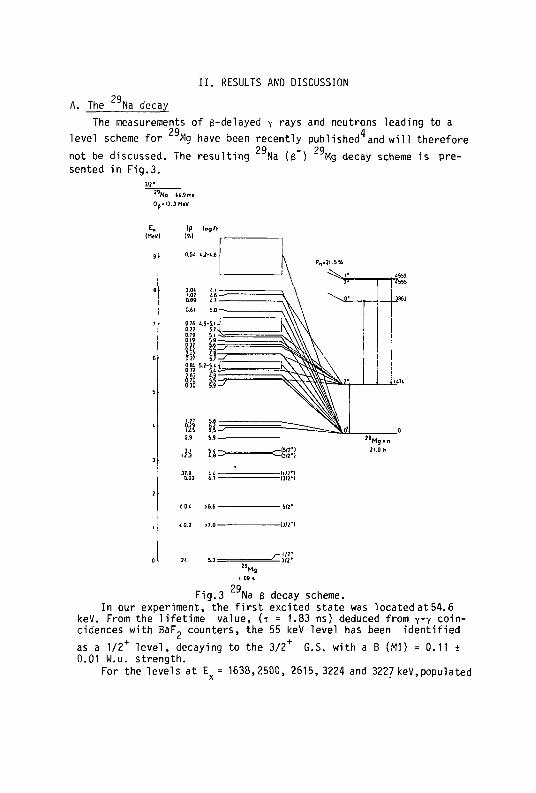
II. RESULTS AND DISCUSSION
29 A. The Na decay
The measurements of e-delayed y rays and neutrons leading to a 29 4
level scheme for Mg have been recently published and will therefore 29 - 29
not be discussed. The resulting Na (6 ) Mg decay scheme is presented in Fig.3.
O..I3.3MeV
Ip log H
< O.t >5.6 -
<û.ï > 7 . 0 -
I |/2*J
Mg
1.09,
29«,
" M g . n
21.0 h
Fig.3 Na B decay scheme. In our experiment, the first excited state was located at 54.6
keV. From the lifetime value, (T = 1.83 ns) deduced from y-Y coincidences with BaF ? counters, the 55 keV level has been identified
as a 1/2 + level, decaying to the 3/2 + G.S. with a B (M1) = 0.11 ± 0.01 W.u. strength.
For the levels at E = 1638,2500, 2615,3224 and 3227 keV,populated
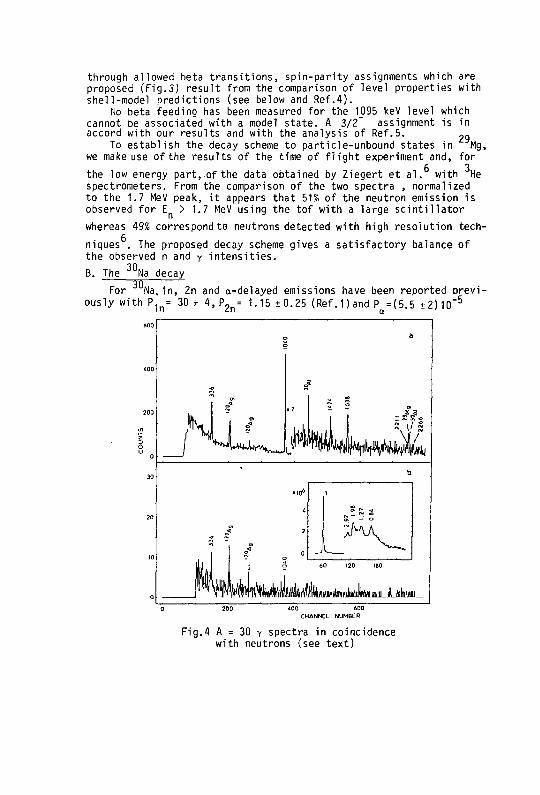
through allowed beta transitions, spin-parity assignments which are proposed (Fig.3) result from the comparison of level properties with shell-model predictions (see below and Ref.4).
No beta feeding has been measured for the 1095 keV level which cannot be associated with a model state. A 3/2" assignment is in accord with our results and with the analysis of Ref.5. „_
To establish the decay scheme to particle-unbound states in Mg, we make use of the results of the time of flight experiment and, for
fi 3 the low energy part,of the data obtained by Ziegert et al. with He spectrometers. From the comparison of the two spectra , normalized to the 1.7 MeV peak, it appears that 51% of the neutron emission is observed for E > 1.7 MeV using the tof with a large scintillator whereas 49% correspond to neutrons detected with high resolution techniques . The proposed decay scheme gives a satisfactory balance of the observed n and y intensities. B. The J UNa decay
3TJ For Na,1n, 2n and a-delayed emissions have been reported previously with P 1 n= 30 + 4,P 2 n= 1.15+0.25 (Ref.l)and P =(5.5 ±2)10" 5
c
_f\ a»
• 7
m -
- I 0 6
J* 7
< 1 1 ? ° °-
b
f%J 1* o 60 120 ISO
JiJLjLsklSIL 400 600
CHANNEL NUMBER
Fig.4 A = 30 y spectra in coincidence with neutrons (see text)
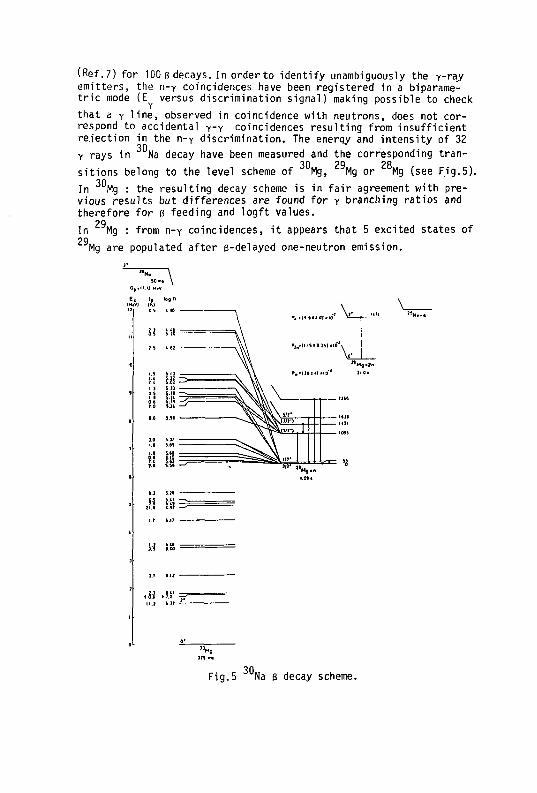
(Réf.7) for 100 B decays. In orderto identify unambiguously the y-ra_y emitters, the n-y coincidences have been registered in a biparame-tric mode (E versus discrimination signal) making possible to check that a y line, observed in coincidence with neutrons, does not correspond to accidental y-y coincidences resulting from insufficient rejection in the n-y discrimination. The enerqy and intensity of 32 y rays in Na decay have been measured and the corresponding tran-
30 29 28 sitions belong to the level scheme of Mg, Mg or Mg (see Fig.5). on
In Mg : the resulting decay scheme is in fair agreement with previous results but differences are found for y branching ratios and therefore for s feeding and logft values. In 29
29 Mg : from n-y coincidences, it appears that 5 excited states of Mg are populated after e-delayed one-neutron emission.
Fig.5 Na 8 decay scheme.
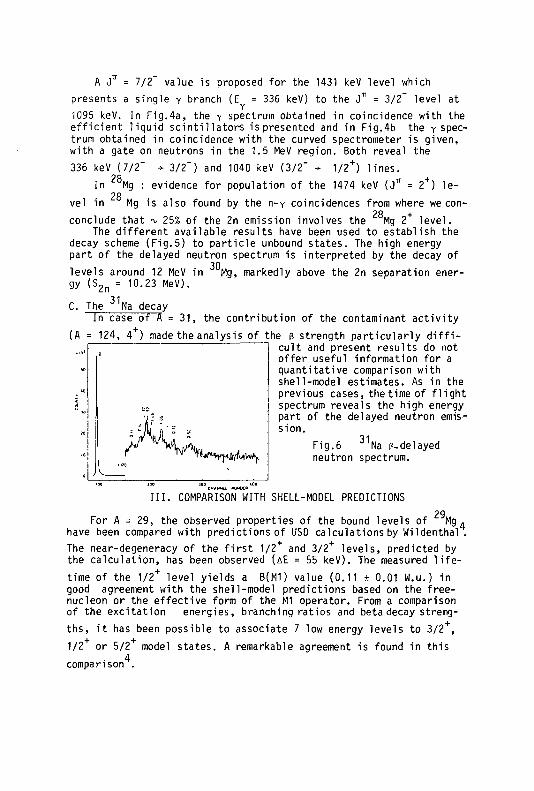
A J = 7/2 value is proposed for the 1431 keV level which presents a single Y branch (E = 336 keV) to the Jv = 3/2" level at 1095 keV. In Fig.4a, the y spectrum obtained in coincidence with the efficient liquid scintillators is presented and in Fig.4b the y spectrum obtained in coincidence with the curved spectrometer is given, with a gate on neutrons in the 1.5 MeV region. Both reveal the 336 keV (7/2" •>• 3/2") and 1040 keV (3/2" * 1/2+) lines.
oo . In Mg : evidence for population of the 1474 keV (J71 = 2 ) le-9p vel in Mg is also found by the n-y coincidences from where we con-28 + conclude that ^ 25% of the 2n emission involves the Mg 2 level.
The different available results have been used to establish the decay scheme (Fig.5) to particle unbound states. The high energy part of the delayed neutron spectrum is interpreted by the decay of
30 levels around 12 MeV in Mg, markedly above the 2n separation energy (s. 2n 10.23 MeV). C. The 3 1Na decay
In case of A = 31, the contribution of the contaminant activity (A = 124, 4 ) made the analysis of the 8 strength particularly diffi-
cult and present results do not offer useful information for a quantitative comparison with shell-model estimates. As in the previous cases, the time of flight spectrum reveals the high energy part of the delayed neutron emission. 31 Fig.6 Na p.delayed
neutron spectrum.
CHANNCL HOODC"
III. COMPARISON WITH SHELL-MODEL PREDICTIONS 29„ For A = 29, the observed properties of the bound levels of Mg .
have been compared with predictions of USD calculations by Wildenthal . The near-degeneracy of the first 1/2 and 3/2 levels, predicted by the calculation, has been observed (AE = 55 keV). The measured lifetime of the 1/2+ level yields a B(M1) value (0.11 ± 0.01 W.u.) in good agreement with the shell-model predictions based on the free-nucleon or the effective form of the M1 operator. From a comparison of the excitation energies, branching ratios and beta decay strengths, it has been possible to associate 7 low energy levels to 3/2 , 1/2 or 5/2 model states. A remarkable agreement is found in this
4 comparison .
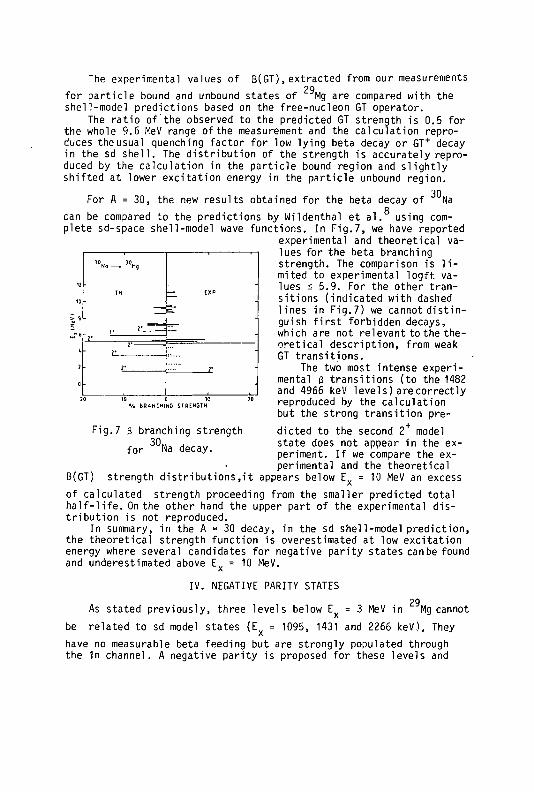
The experimental values of B(GT), extracted from our measurements 29 for particle bound and unbound states of Mg are compared with the
shell-model predictions based on the free-nucleon GT operator. The ratio of the observed to the predicted GT strength is 0.5 for
the whole 9.6 MeV range of the measurement and the calculation reproduces the usual quenching factor for low lying beta decay or GT + decay in the sd shell. The distribution of the strength is accurately reproduced by the calculation in the particle bound region and slightly shifted at lower excitation energy in the particle unbound region.
For A = 30, the new results obtained for the beta decay of Na o
can be compared to the predictions by Wildenthal et al. using complete sd-space shell-model wave functions. In Fig.7, we have reported
experimental and theoretical values for the beta branching strength. The comparison is limited to experimental logft values i 5.9. For the other transitions (indicated with dashed lines in Fig.7) we cannot distinguish first forbidden decays, which are not relevant to the theoretical description, from weak GT transitions.
The two most intense experimental (3 transitions (to the 1482 and 4966 keV levels) arecorrectly reproduced by the calculation but the strong transition predicted to the second 2 model state does not appear in the experiment. If we compare the experimental and the theoretical
B(GT) strength distributions,it appears below E = 10 MeV an excess of calculated strength proceeding from the smaller predicted total half-life. On the other hand the upper part of the experimental distribution is not reproduced.
In summary, in the A = 30 decay, in the sd shell-model prediction, the theoretical strength function is overestimated at low excitation energy where several candidates for negative parity states can be found
1
TH
1* ~
^_ fXP
ST
r
^_ fXP
ST
!• . J'
?•
-
Fig. 7
V. BRANCHING STRENGTH
6 branching strength 30.. .
for Na decay.
and underestimated above E„ 10 MeV. IV. NEGATIVE PARITY STATES
As stated previously, three levels below E = 3 MeV in 29, Mg cannot :E x = 1095, 1431 and 2266 keV). They be related to sd model states
have no measurable beta feeding but are strongly populated through the 1n channel. A negative parity is proposed for these levels and
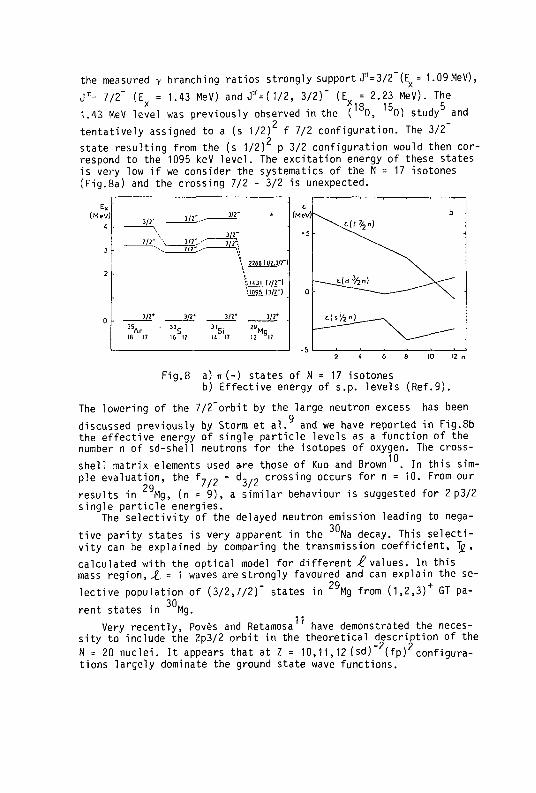
the measured y branching ratios strongly support =3/2 (E)(= 1.09MeV),
J ^ 7/2" (E = 1.43 MeV) and J M 1 / 2 , 3/2)" (E ¥ 2.23 MeV). The
15 n x ..,..5 1.43 MeV level was previously observed in the ( 0, 0) study and
tentatively assigned to a (s 1/2) f 7/2 configuration. The 3/2 ô
state resulting from the (s 1/2) p 3/2 configuration would then correspond to the 1095 keV level. The excitation energy of these states is very low if we consider the systematics of the N = 17 isotones (Fig.8a) and the crossing 7/2 - 3/2 is unexpected.
t * (Msv)
< - — 3/2-. .
3/2"..- 5 U
3 111'.-
\ 2266 < 1/2. W )
2 Ï .K3I (7/2-1 '.1095 (3/2")
0 3/2* Vi* 2!T 3/2*
Ar "s 3 ls i Mq IS 17 10 17 It 17 12 17
Fig.8 a) n (-) states of N = 17 isotones b) Effective energy of s.p. levels (Ref.9).
The lowering of the 7/2"orbit by the large neutron excess has been g
discussed previously by Storm et al. and we have reported in Fig.8b the effective energy of single particle levels as a function of the number n of sd-shell neutrons for the isotopes of oxygen. The cross-shell matrix elements used are those of Kuo and Brown . In this simple evaluation, the f-,/2 - d, .„ crossing occurs for n = 10. From our results in Mg, (n = 9), a similar behaviour is suggested for 2 p3/2 single particle energies.
The selectivity of the delayed neutron emission leading to nega-30
tive parity states is very apparent in the Na decay. This selectivity can be explained by comparing the transmission coefficient, Tg ,
calculated with the optical model for different Rvalues. In this mass region, ,£. = 1 waves are strongly favoured and can explain the se-
lective population of (3/2,7/2)" states in Mg from (1,2,3) GT pa-30 rent states in Mg.
Very recently, Povès and Retamosa have demonstrated the necessity to include the 2p3/2 orbit in the theoretical description of the N = 20 nuclei. It appears that at Z = 10,11,12 (sd)" 2(fp) 2 configurations largely dominate the ground state wave functions.
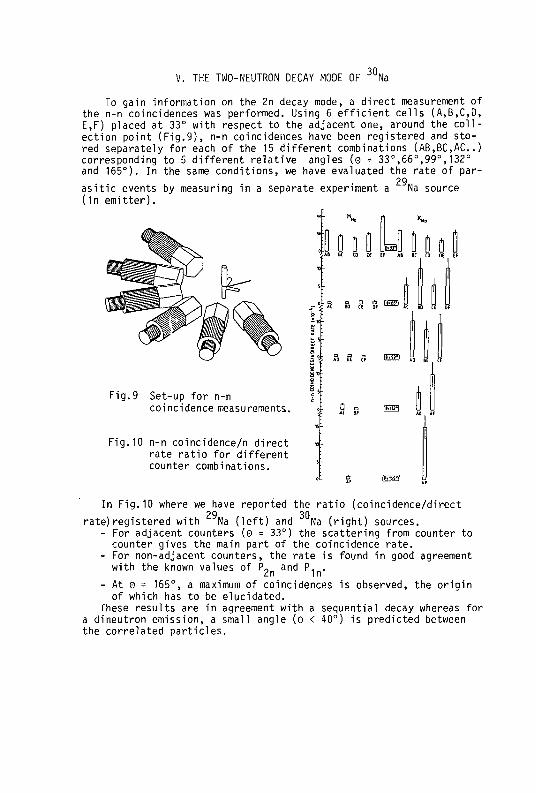
V. THE TWO-NEUTRON DECAY MODE OF J UNa To gain information on the 2n decay mode, a direct measurement of
the n-n coincidences was performed. Using 6 efficient cells (A,B,C,D, E,F) placed at 33° with respect to the adjacent one, around the collection point (Fig.9), n-n coincidences have been registered and stored separately for each of the 15 different combinations (AB,BC,AC.) corresponding to 5 different relative angles (e = 33°,66°,99°,132° and 165°). In the same conditions, we have evaluated the rate of parasitic events by measuring in a separate experiment a (1n emitter).
29 Na source
>v
"i*a BC to ot tF « BC fb « TF
Fig.9 Set-up for n-n coincidence measurements.
Fig. 10 n-n coincidence/n direct borate ratio for different counter combinations.
0 o *E BF
[S7*F)
tESS
E«D In Fig.10 where we have reported the ratio (coincidence/direct
29 30 rate)registered with Na (left) and Na (right) sources.
- For adjacent counters (9 = 33°) the scattering from counter to counter gives the main part of the coincidence rate.
- For non-adjacent counters, the rate is found in good agreement with the known values of P- and P, .
2n in - At e = 165°, a maximum of coincidences is observed, the origin of which has to be elucidated.
These results are in agreement with a sequential decay whereas for a dineutron emission, a small angle (e < 40°) is predicted between the correlated particles.
In conclusion, this work has led to s complete description of 29 the main GT transitions between positive parity states in Na and
30 Na decay. Due to the selectivity of the delayed neutron emission,
information has been obtained on the level structure of negative parity states whose relevant orbits play a major role near N = 20.
It is a pleasure to acknowledge the cooperation in data taking of H. Gabelmann and K. Schlosser throughout the course of this experiment.
REFERENCES
1. D. Guillemaud-Mueller et al., Nucl. Phys. A426 37 (1984)and references therein.
2. A. Huck et al., Phys. Rev. Ç3J. 2226 (1985). 3. N.W. Hill et al., IEEE Trans. Nucl. Sci. NS-32 367 (1985). 4. P. Baumann et al.Phys. Rev. C36 765 (1987T; 5. L.K. Fifield et al., Nucl. PTiys. A437 141 (1985). 6. W. Ziegert et al., Proc. 4th Int. Conf. on Nuclei far from
Stability, Helsingtfr, 1981, CERN 81-09 327 (1981). 7. C. Detraz at al., Nucl. Phys. A402 301 (1983). 8. B.H. wildenthal et al., Phys. 'Rev. Ç28 1343 (1983). 9. M.H. Storm et al., J. Phys. G : Nucl. Phys. 9 L165 (1983). 10. T.T.S. Kuo and G.E. Brown, Nucl. Phys. M 40 (1966). 11. A. Povès and J. Retamosa, Phys. Lett. 184B 311 (1987).

PUBLICATION VI
TABLES DES VALEURS DE LOGf0 ET LOG f, POUR LES TRANSITIONS BETA D" ENERGIE COMPRISE
ENTRE 10 ET 25 MeV DES ELEMENTS 6 i Z S 38
Ph. Dessagne et Ch. Mfehé
Centre de Recherches Nucléaires 67037 Strasbourg Cedex France
The. log r values for allowed and first forbidden unique 13* and 13" transitions for Z from 6 to 38 have been calculated as a function of transition energy up to 25 MeV, following the formalism worked out by N.B. Gove and M.J. Martin.
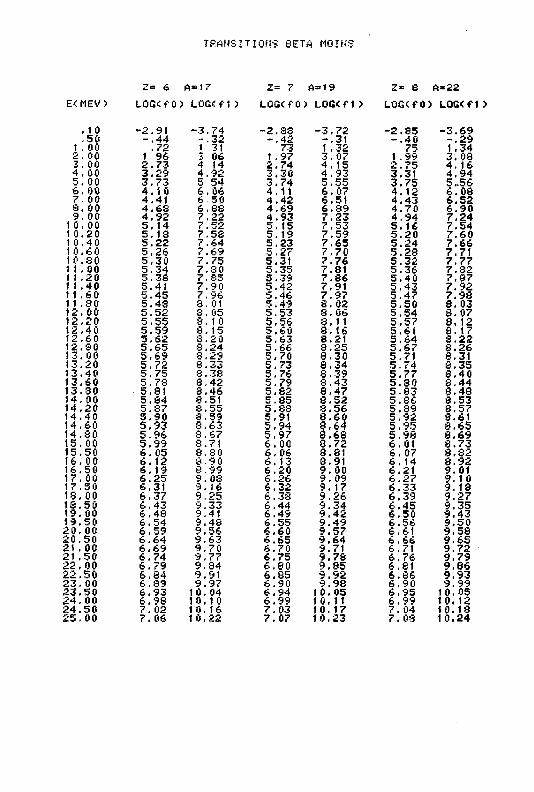
TRANSITIONS SETA MOINS
2= 6 A - 1 7 2= 7 A=19 2= 6 ft-22
E<MEV> L O G < f 0 ) L Û G T f l ) LOG<f0> L O G < f t > LOG<fO> LOG<f1>
, 1 0 - 2 . 9 1 - 3 . 7 4 - 2 . 8 3 - 3 . 7 2 - 2 . 8 5 - 3 . 6 9 . 5 0 - . 4 4 - . 3 2 - . 4 2 - . 3 1 - . 4 0 - . 2 9
1 . 0 0 . 7 2 1 31 73 1 . 3 2 75 1 . 3 4 2 . 00 1 96 5 06 1 . 9 7 3 . 07 1 . 9 9 3 . 0 8 3 . 0 0 2 . 7 3 4 14 2 , 7 4 4 . 1 5 2 . 7 5 4 . 1 6 4 . 0 0 3 , 2 9 4 . 9 2 3 , 3 0 4 . 9 3 3 , 3 1 4 . 9 4 5 . 0 0 3 . 7 3 5 54 3 , 7 4 5 . 5 5 3 . 7 5 5. .56 6 . 0 0 4 . 1 0 6 . 0 6 4 . 1 1 6 , 0 7 4 . 1 2 6 . 0 8 7 . 00 4 . 4 1 6 50 4 . 4 2 6 . 5 1 4 . 4 3 6 . 5 2 S . 00 4 . 6 8 6 . 8 S 4 . 6 9 6 . 3 9 4 . 7 0 6 . 9 0 9 , 0 0 4 . 9 2 7 . 2 2 4 . 9 3 7 . 2 3 4 , 9 4 7 . 2 4
1 0 . 00 5 . 14 7 . 5 2 5 . 15 7 . 5 3 5 . 1 6 7 . 5 4 1 0 . 2 0 5 . 1 3 7 . 5 3 5 . 1 9 7 . 5 9 5 . 2 0 7 . 6 0 1 0 . 4 0 5 . 2 2 7 . 6 4 5 . 2 3 7 . 6 5 5 . 2 4 7 . 6 6 1 0 . 6 0 5 . 2 6 7 . 6 9 5 . 2 7 7 , 7 0 5 . 2 8 7 , 7 1 1 0 . 8 0 5 . 3 0 7 . 7 5 5 . 3 1 7 , 7 6 5 . 3 2 7 . 7 7 1 1 . 0 0 5 . 3 4 7 . 3 0 5 . 3 5 7 . 8 1 5 . 3 6 7 . 3 2 1 1 . 2 0 5 . 3 S 7 . S 5 5 . 3 9 7 . 8 6 5 . 4 0 7 . 8 7 11 , 4 0 5 . 4 1 7 . 9 0 5 . 4 2 7 , 9 1 5 . 4 3 7 . 9 2 11 . 6 0 5 . 4 5 7 . 9 6 5 . 4 6 7 . 9 7 5 . 4 7 7 . 9 8 11 . 8 0 5 . 4 S 3 . 0 1 5 . 4 9 8 , 0 2 5 . 5 0 8 . 0 3 1 2 . 0 0 5 . 5 2 8 , 05 5 . 5 3 3 , 06 5 . 5 4 8 . 0 7 1 2 , 2 0 5 , 5 5 8 . 1 0 5 , 5 6 8 . 1 1 5 . 5 7 8 . 1 2 1 2 . 4 0 5 . 5 9 3 . 1 5 5 . 6 0 8 . 1 6 5 . 6 i 8 . 1 7 1 2 . 6 0 5 . 6 2 3 . 2 0 5 . 6 3 8 . 2 1 5 . 6 4 3 . 2 2 1 2 . 3 0 5 . 6 5 8 . 2 4 5 . 6 6 8 . 2 5 5 . 6 7 8 . 2 6 1 3 . 0 0 5 , 6 9 8 . 2 9 5 , 7 0 3 , 3 0 5 . 7 1 8 , 3 1 1 3 . 2 0 5 . 7 2 8 . 3 3 5 . 7 3 8 , 3 4 5 . 7 4 8 . 3 5 1 3 . 4 0 5 . 7 5 8 . 3 8 5 . 7 6 8 . 3 9 5 . 7 7 3 . 4 0 1 3 , 6 0 5 . 7 3 3 . 4 2 5 . 7 9 8 , 4 3 5 . 8 0 3 . 4 4 1 3 . 3 0 5 . 8 1 3 . 4 6 5 , 8 2 8 , 4 7 5 . 8 3 8 . 4 3 1 4 . 0 0 5 . 8 4 8 . 5 1 5 . 8 5 8 . 5 2 5 . 8 6 8 . 5 3 1 4 . 2 0 5 . 3 7 8 . 5 5 5 . 8 8 3 . 5 6 5 . 3 9 8 . 5 7 1 4 . 4 0 5 . 9 0 8 . 5 9 5 . 9 1 8 . 6 0 5 . 9 2 3 . 6 1 1 4 , 6 0 5 . 9 3 3 . 6 3 5 , 9 4 8 , 6 4 5 . 9 5 8 . 6 5 1 4 . 8 0 5 . 9 6 8 . 6 7 5 . 9 7 3 . 6 8 5 . 9 8 8 . 6 9 1 5 . 0 0 5 . 9 9 3 . 7 1 6 , 0 0 8 . 7 2 6 . 0 1 8 . 7 3 1 5 . 5 0 6 , 0 5 8 .SO 6 . 0 6 8 . 8 1 6 . 0 7 3 . 3 2 1 6 . 0 0 6 . 1 2 3 . 9 0 6 . 13 8 . 9 1 6 . 1 4 8 . 9 2 1 6 . 5 0 6 . 19 8 . 9 9 6 . 2 0 9 . 0 0 6 . 2 1 9 . 0 1 1 7 . 0 0 6 . 2 5 9 . OS 6 . 2 6 9 . 0 9 6 . 2 7 9 . 10 1 7 . 5 0 6 . 3 1 9 . 1 6 6 , 3 2 9 . 17 6 . 3 3 9 . 13 1 8 . 0 0 6 , 3 7 9 , 2 5 6 , 3 8 9 , 2 6 6 . 3 9 9 . 2 7 1 3 . 5 0 6 . 4 3 9 . 3 3 6 . 4 4 9 . 3 4 6 . 4 5 9 . 3 5 1 9 , 0 0 6 . 4 3 9 . 4 1 6 . 4 9 9 , 4 2 6 . 5 0 9 . 4 3 1 9 , 5 0 6 . 5 4 9 . 4 8 6 . 5 5 9 . 4 9 6 . 5 6 9 . 5 0 2 0 , 0 0 6 . 5 9 9 . 5 6 6 , 6 0 9 , 5 7 6 . 6 1 9 , 5 8 2 0 . 5 0 6 . 6 4 9 . 6 3 6 . 6 5 9 . 6 4 6 . 6 6 9 , 6 5 21 . 0 0 6 . 6 9 9 . 7 0 6 , 7 0 9 . 7 1 6 . 7 1 9 . 7 2 21 . 5 0 6 . 7 4 9 . 7 7 6 , 7 5 9 . 7 8 6 . 7 6 9 . 7 9 2 2 . 0 0 6 . 7 9 9 . 3 4 6 . 8 0 9 , 8 5 6 . 8 1 9 . 8 6 2 2 . 5 0 6 . 3 4 9 . 9 1 6 , 8 5 9 . 9 2 6 . 3 6 9 . 9 3 2 3 . 0 0 6 . 3 9 9 . 9 7 6 . 9 0 9 . 9 3 6 . 9 0 9 . 9 9 2 3 . 5 0 6 , 9 3 1 0 . 0 4 6 . 9 4 1 0 . 0 5 6 . 9 5 1 0 . 0 5 2 4 . 0 0 6 . 9 8 1 0 . 1 0 6 . 9 9 1 0 . 1 1 6 . 9 9 1 0 . 1 2 2 4 . 5 0 7 . 0 2 1 0 . 16 7 . 0 3 1 0 . 1 7 7 . 0 4 1 0 . 1 8 2 5 . 0 0 7 . 06 1 0 . 2 2 7 . 0 7 1 0 . 2 3 7 . 03 1 0 . 2 4
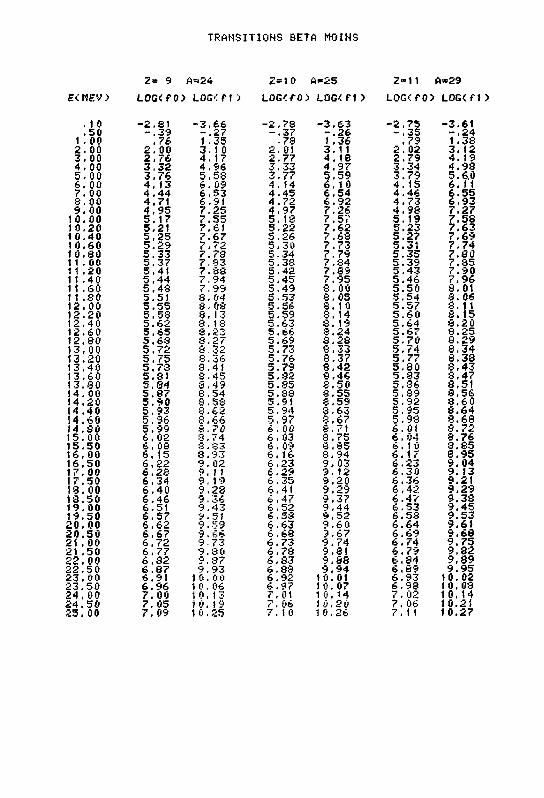
TRANSITIONS BETA MOINS
Z= 9 A=24 Z=10 A=25 2=11 A=29
E<MEV> LOG<f0> LOG<f1> LOG<f0> LOG<f1> UOG<f0) LOG<f1>
. 10 - 2 . 8 1 - 3 . 6 6 - 2 , 7 8 - 3 . 6 3 - 2 . 7 5 - 3 . 6 1
. 5 0 - . 3 9 - . 2 7 - . 3 7 - . 2 6 - . 3 5 - . 2 4 1 . 0 0 , 7 6 1 . 3 5 • 73 1 . 3 6 . 7 9 1 . 3 8 2 . 0 0 2 . 0 0 3 . 1 0 2 . 01 3 . 1 1 2 . 0 2 3 . 1 2 3 . 0 0 2 , 7 6 4 . 1 7 2 . 7 7 4 . 18 2 . 7 9 4 . 1 9 4 . 0 0 3 , 3 2 4 . 9 6 3 . 3 3 4 . 9 7 3 . 3 4 4 . 9 8 5 , 0 0 3 , 7 6 5 , 5 8 3 . 7 7 5 . 5 9 3 . 7 9 5 .6 .0 6 . 0 0 4 , 1 3 6 . 0 9 4 . 1 4 6 . 1 0 4 . 1 5 6 . 11 7 . 0 0 4 , 4 4 6 . 5 3 4 . 4 5 6 . 5 4 4 . 4 6 6 . 5 5 3 . 0 0 4 . 7 1 6 . 9 1 4 . 7 2 6 . 9 2 4 . 7 3 6 . 9 3 9 . 0 0 4 , 9 5 7 . 2 5 4 , 9 7 7 , 2 6 4 . 9 8 7 . 2 7
1 0 . 0 0 5 . 1 7 7 . 5 5 5 . 1 8 7.5".- 5 . 1 9 7 . 5 8 1 0 . 2 0 5 . 2 1 7 . 6 1 5 . 2 2 7 . 6 2 5 . 2 3 7 . 6 3 1 0 . 4 0 5 . 2 5 7 . 6 7 5 . 2 6 7 . 6 8 5 . 2 7 7 . 6 9 1 0 . 6 0 5 . 2 9 7 . 7 2 5 , 3 0 7 . 7 3 5 . 3 1 7 . 7 4 1 0 . 3 0 5 . 3 3 7 . 7 8 5 . 3 4 7 . 7 9 5 . 3 5 7 . 8 0 11 . 0 0 5 . 3 7 7 , S3 5 3P- 7 . 8 4 5 . 3 9 7 . 8 5 1 1 , 2 0 5 . 4 1 7 . 8 8 5 Ï 4 2 7 . 8 9 5 . 4 3 7 . 9 0 1 1 . 4 0 5 , 4 4 7 . 9 4 5 , 4 5 7 . 9 5 5 . 4 6 7 . 9 6 11 . 6 0 5 . 4 8 7 . 9 9 5 . 4 9 8 . 0 0 5 . 5 0 3 . 0 1 11 .SO 5 . 5 1 8 . 04 5 . 5 3 8 . 0 5 5 . 5 4 3 . 0 6 1 2 . 0 0 5 . 5 5 8 . OS 5 . 5 6 S . 1 0 5 . 5 7 3 . 1 1 1 2 . 2 0 5 . 5 8 8 . 13 5 . 5 9 8 , 1 4 5 . 6 0 8 . 1 5 1 2 . 4 0 5 . 6 2 8 . 1 8 5 . 6 3 8 . 1 9 5 . 6 4 3 . 2 0 1 2 . 6 0 5 . 6 5 3 , 2 3 5 . 6 6 8 . 2 4 5 . 6 7 8 . 2 5 1 2 . 8 0 5 , 6 8 8 . 2 7 5 . 6 9 3 . 2 8 5 . 7 0 8 . 2 9 1 3 . 0 0 5 , 7 2 8 . 3 2 5 . 7 3 S , 3 3 5 . 7 4 8 , 3 4 1 3 . 2 0 5 . 7 5 8 , 3 6 5 , 7 6 8 . 3 7 5 , 7 7 3 , 3 3 1 3 . 4 0 5 . 7 3 8 . 4 1 5 . 7 9 8 . 4 2 5 , 8 0 3 , 4 3 1 3 , 6 0 5 , 8 1 8 . 4 5 5 . 3 2 8 . 4 6 5 . 3 3 8 , 4 7 1 3 . 3 0 5 , 8 4 3 , 4 9 5 . 8 5 8 . 5 0 5 . 3 6 8 , 5 1 1 4 , 00 5 . 8 7 8 . 5 4 5 . 8 9 8 , 5 5 5 . 8 9 8 , 5 6 1 4 , 2 0 5 , 9 0 8 . 5 8 5 . 9 1 8 . 5 9 5 . 9 2 8 , 6 0 1 4 . 4 0 5 , 9 3 8 . 6 2 5 . 9 4 8 . 6 3 5 . 9 5 8 . 6 4 1 4 . 6 0 5 , 3 6 8 . 6 6 5 . 9 7 8 , 6 7 5 . 9 3 8 . 6 8 1 4 . 3 0 5 . 9 9 8 . 7 0 6 . Où 8 . 7 1 6 . Oi 3 . 7 2 1 5 . 0 0 6 . 0 2 8 , 7 4 6 . 0 3 8 . 7 5 6 , 0 4 3 . 7 6 1 5 . 5 0 6 , 08 8 . S3 6 . 09 8 . 3 5 6 , 1 0 3 . 8 5 1 6 . 0 0 6 . 1 5 8 . 9 3 6 , 1 6 R. 94 6 . 1 7 8 . 9 5 1 6 . 5 0 6 . 2 2 9 . 0 2 6 . 2 3 9 . 0 3 6 . 2 3 9 . 0 4 1 7 . 0 0 6 , 2 8 9 . 1 1 6 . 2 9 9 . 1 2 6 . 3 0 9 . 1 3 1 7 . 5 0 6 . 3 4 9 , 1 9 6 . 3 5 9 . 2 0 6 . 3 6 9 . 2 1 1 3 , 0 0 6 . 4 0 9 . 2 8 6 . 4 1 9 , 2 9 6 , 4 2 9 . 2 9 1 3 . 5 0 6 . 4 6 9 . 3 6 6 . 4 7 9 . 3 7 6 . 4 V 9 . 3 3 1 9 . 0 0 6 . 5 1 9 . 4 3 6 , 5 2 9 . 4 4 6 . 5 3 9 . 4 5 1 9 . 5 0 6 . 5 7 9 . 5 1 6 , 5 8 9 . 5 2 6 . S3 9 . 5 3 2 0 . 0 0 6 . 6 2 9 . 5 9 6 . 6 3 9 . 6 0 6 . 6 4 9 . 6 1 2 0 . 5 0 6 . 6 7 9 . 66 6 . 6 8 9 . 6 7 6 . 6 9 9 , 6 8 2 1 . 0 0 6 . 7 2 9 . 7 3 6 . 7 3 9 . 7 4 6 . 7 4 9 . 7 5 21 . 5 0 6 . 7 7 9 . 8 0 6 . 7 8 9 . 3 1 6 . 7 9 9 , 3 2 2 2 . 0 0 6 , 3 2 9 . 8 7 6 . 8 3 9 . 8 8 6 . 8 4 9 , 8 9 2 2 . 5 0 6 , 8 7 9 . 9 3 6 . 8 8 9 . 94 6 . 8 9 9 . 9 5 2 3 . 0 0 6 . 9 1 1 0 , 0 0 6 . 9 2 1 0 . 01 6 . 9 3 1 0 . 0 2 2 3 . 5 0 6 , 9 6 1 0 . 06 6 . 9 7 1 0 . 0 7 6 . 9 3 1 0 . 0 3 2 4 . 0 0 7 . 0 0 1 0, 13 7 . 0 1 1 0, 14 7 , 0 2 1 0 , 1 4 2 4 . 5 0 7 . 0 5 1 0 . 1 9 7 , 06 1 Û.2Û 7 . 06 1 0 . 2 1 2 5 . 0 0 7 , 0 9 1 0 . 2 5 7 . 10 1 0 . 2 6 7 , 1 1 1 0 . 2 7
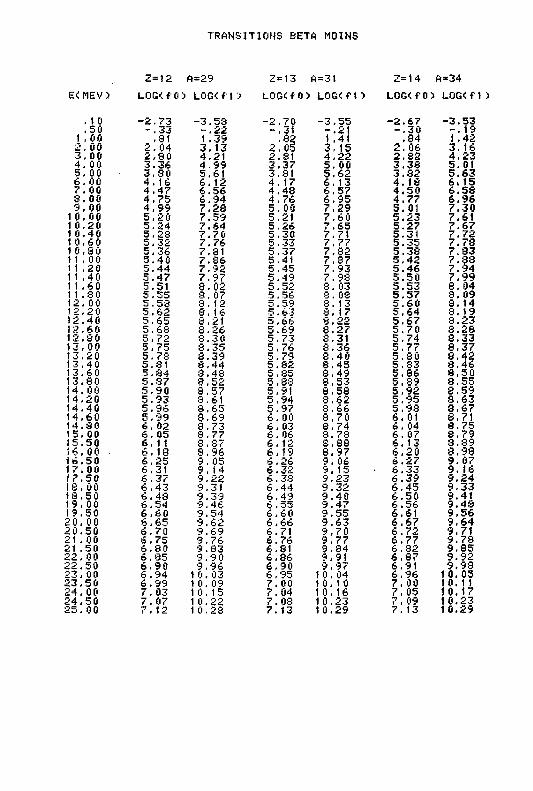
TRANSITIONS BETA MOINS
2=12 A=29 2=13 A=31 2=14 ft=34 E<MEV> LOG<fO) LOG<f) ' ; LGG<fO> LOG<ft> LOG<fO> LOG<f1)
. 10 - 2 . 7 3 - 3 . 5 5 - 2 . 7 0 - 3 . 5 5 - 2 . 6 7 - 3 . 5 3
. 5 0 - . 3 3 - . 2 2 - . 3 1 - . 2 1 - . 3 0 - . 1 9 1 ,00 . 8 1 1 .39 . 8 2 1 ,41 , 8 4 1.42 2 . 0 0 2 ,04 3 .13 2 ,05 3 ,15 2 .06 3 .16 3 . 00 2.SO 4 .21 2 .81 4 , 2 2 2 . 8 2 4 ,23 4 , 00 3 .36 4 .99 3 ,37 5. 00 3 .38 5.01 5 ,00 3 .80 5 .61 3,81 5 ,62 3 .82 5 ,63 6 .00 4 .16 6 .12 4 .17 6 , 1 3 4 .13 6 .15 7 .00 4 . 4 7 6 .56 4 .48 6 ,57 4 .50 6 .58 8 .00 4 ,75 6 .94 4 .76 6 ,95 4 .77 6 ,96 9 ,00 4 , 9 9 7 ,28 5 ,00 7 ,29 5.01 7 ,30
10.00 5 , 2 0 7 .59 5 .21 7 .60 5 .23 7.61 10.20 5 .24 7 .64 5 .26 7 .65 5 .27 7 .67 10 .40 5 .28 7 .70 5 .30 7 .71 5 .31 7 .72 10 ,60 5 ,32 7 .76 5 .33 7 .77 5 .35 7 .78 1 0,80 5 .36 7.81 5 .37 7 .82 5 .38 7 .33 11 . 00 5 .40 7 .86 5 .41 7 ,87 5 .42 7 .38 11 ,20 5 .44 7 .92 5 .45 7 .93 5 .46 7.94 11 .40 5 ,47 7 .97 5 .49 7 .98 5 .50 7 .99 11 .60 5 .51 8 .02 5 .52 8 . 03 5 .53 8 .04 1 1 .80 5 .55 8. 07 5 .56 8 . 08 5 .57 3 .09 12,00 5 .58 8 . ( 2 5 .59 8. 13 5 . 6 0 3. 14 12,20 5 ,62 8, 16 5 ,63 8 ,17 5 ,64 8. 19 12.40 5 .65 8 ,21 5 ,66 8 .22 5 ,67 8 .23 12.60 5 .68 8 .26 5 .69 8 .27 5 .70 8 .28 12.80 5 .72 8 .30 5 ,73 8 .31 5 .74 3 .33 13,00 5 .75 8 .35 5 ,76 8 ,36 5 .77 3 .37 13.20 5 .78 8 .39 5 .79 8 , 4 0 5 , 8 0 8 .42 13.40 5.S1 8 .44 5 .82 8 ,45 5 .83 8 .46 13,60 5 .84 8 ,48 5 .85 8 ,49 5 .36 8 ,50 13,80 5.S7 8 ,52 5 ,88 8 ,53 5 .89 3 .55 14,00 5 .90 8 .57 5.91 8 .58 5 .92 8 .59 14,20 5 ,93 8.61 5 ,94 3 .62 5 .95 8 .63 14,40 5 .96 8 .65 5 ,97 8 .66 5 .98 3 .67 14,60 5 ,99 3 .69 6 ,00 8 .70 6 .01 8,71 14 ,30 6 , 02 3 .73 6 , 03 8 .74 6 .04 8 .75 15, 00 6 . 05 8 .77 6 . 06 3 .78 6 . 07 8 .79 15.50 6. 1 1 8 .87 6 ,12 8 .38 6 .13 3 .39 16,00 6 .18 8 ,96 6 ,19 8 ,97 6 .20 3 .98 16.50 6 ,25 9. 05 6,26 9 . 06 6 .27 9. 07 17.00 6 .31 9 ,14 6 .32 9 . 15 6 . 3 3 9 ,16 17.50 6 , 37 9 .22 6 .38 9 .23 6 .39 9 .24 18, 00 6 , 4 3 9 .31 6 .44 9 .32 6 ,45 9 .33 18.50 6 . 48 9 .39 6 .49 9 .40 6 .50 9.41 19. 00 6 .54 9. 46 6 .55 9 .47 6 .56 9 .48 19,50 6 .60 9 .54 6 .60 9 .55 6 .61 9 ,56 2 0 , 0 0 6 .65 9 .62 6 ,66 9 ,63 6 ,67 9 ,64 2 0 , 5 0 6 .70 9 .69 6 .71 9 .70 6 .72 9 .71 21 .00 6 .75 9 .76 6 .76 9 ,77 6 .77 9 .78 21 .50 6 .80 9. S3 6.81 9 .34 6 .32 9 .85 2 2 , 0 0 6 ,35 9 .90 6 ,86 9 .91 6 , 8 7 9 .92 22 ,50 6 .90 9 .96 6 ,90 9 , 97 6 .91 9 ,93 2 3 , 0 0 6 .94 10.03 6 ,95 10, 04 6 .96 10.05 2 3 , 5 0 6 .99 10.09 7,00 10 .10 7 .00 10.11 24 .00 7 .03 10,15 7.04 10.16 7 ,05 10.17 2 4 , 5 0 7 .07 10.22 7.08 10 .23 7 , 09 10.23 25 . 00 7 . 12 1 0.28 7. 13 10 .29 7, 13 10.29
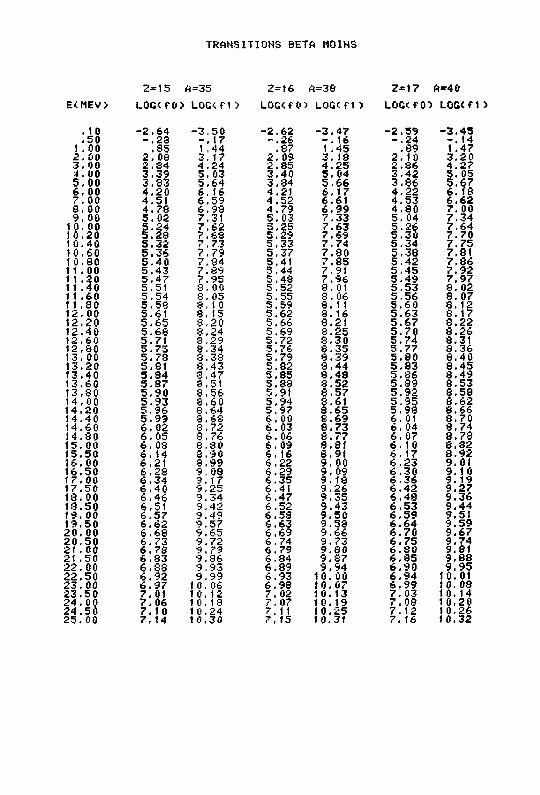
TRANSIT
2« IS A=35
E<MEV> LOG<fO> L 0 G < f O
.10 - 2 . 6 4 - 3 , 5 0 • 50 - . 2 3 - . 1 7
1 .00 .85 1 ,44 2 . 0 0 2 . 0 8 3 .17 3 .00 2 .34 4 .24 4 .00 3 .39 5. 03 5 , 0 0 3 ,83 5 ,64 6 . 0 0 4 . 2 0 6 ,16 7 .00 4 .51 6 .59 8 . 0 0 4 .78 6 .98 9 , 0 0 5 .02 7.31
10 .00 5 . 2 4 7 .62 10 .20 5 .28 7 .68 10 .40 5 .32 7 .73 10 ,60 5 .36 7.79 10 .80 5 . 4 0 7 .84 1 1 . 00 5 .43 7 .89 1 1 .20 5 .47 7 .95 11 ,40 5 ,51 8 ,00 11 .60 5 .54 8 . 05 11 ,80 5 .58 8, 1 0 12 .00 5 .61 8, 15 12 ,20 5 .65 8 ,20 12 .40 5 .68 8 .24 12 .60 5 .71 8 .29 12.80 5 .75 8 .34 13.00 5 ,78 8 .33 13.20 5 .81 8 ,43 13.40 5 , 8 4 8 . 4 7 13.60 5 ,87 8 ,51 13.80 5 . 9 0 3 .56 14.00 5 .93 8 ,60 14 ,20 5 , 9 6 3 .64 14.40 5 .99 8 .68 14,60 6 . 0 2 8 ,72 14.30 6 .05 3 ,76 15 .00 6 . 0 8 8 .30 15.50 6 . 1 4 3 ,90 16 .00 6 ,21 3 ,99 16.50 6 . 2 3 9 ,08 17 .00 6 , 3 4 9 ,17 17.50 6 ,40 9 .25 13 .00 6 .46 9 ,34 1:3.50 6 .51 9 .42 19 .00 6 . 5 7 9 .49 19 .50 6 .62 9 .57 2 0 . 0 0 6 .63 9 .65 2 0 . 5 0 6 .73 9 .72 21 .00 6 . 7 9 9 .79 21 .50 6 , 8 3 9 ,36 2 2 . 0 0 6 ,33 9 ,93 2 2 . 5 0 6 .92 9 .99 2 3 . 0 0 6 . 9 7 10, 06 2 3 . 5 0 7 ,01 10, 12 2 4 . 0 0 7 .06 10. 13 2 4 . 5 0 7 ,10 10.24 2 5 . 0 0 7 .14 10 ,30
QHS BETA MOINS
2=16 A=38 Z=17 A-40
LÛG<fCO LOG<fD LOG<fO> LOG<f1>
- 2 . 6 2 - 3 . 4 7 - 2 . 5 9 - 3 . 4 5 - . 2 6 - . 1 6 - . 2 4 - . 1 4
.87 1 .45 .89 1.47 2 .09 3 . 13 2 .10 3 .20 2 .85 4 , 2 5 2 .86 4 .27 3 .40 5 .04 3 .42 5 .05 3 .34 5 ,66 3 .86 5 .67 4 .21 6 . 1 7 4 . 2 2 6 . 18 4 .52 6 .61 4 .53 6 .62 4 .79 6 .99 4 . 8 0 7 .00 5 .03 7 .33 5 .04 7 .34 5 .25 7 .63 5 .26 7 .64 5 .29 7 .69 5 ,30 7 .70 5 .33 7 .74 5 .34 7 .75 5 ,37 7 .80 5 ,38 7.81 5 .41 7 .85 5 , 4 2 7 .86 5 .44 7.91 5 .45 7 .92 5 .43 7 .96 5 .49 7 .97 5 .52 8 .01 5 .53 8 .02 5 .55 3 .06 5 .56 8 .07 5 .59 8 . 1 1 5 .60 8 .12 5 .62 8 .16 5 .63 8 .17 5 .66 8 .21 5 .67 8 .22 5 ,69 3 .25 5 .70 8 .26 S. 72 3 .30 5 .74 8 .31 5 .76 8 .35 5 .77 8 .36 5 ,79 8 .39 5 .80 8 .40 5 .32 3 ,44 5 .83 8 .45 5 .85 8 . 4 8 5 .86 8 .49 5 .33 3 .52 5 .39 8 .53 5.91 8 , 5 7 5 .92 8 ,58 5 .94 8 .61 5 ,95 8 .62 5 .97 8 . 6 5 5 ,98 8 .66 6 .00 8 .69 6 . 01 8 .70 6 .03 8 .73 6 ,04 8 ,74 6 .06 8 .77 6 . 07 8 .73 6 ,09 8 .81 6 , 10 8 .32 6 .16 8 .91 6 , 1 7 3 .92 6 .22 9 .00 6 . 2 3 9 .01 6 .29 9 .09 6 . 3 0 9 .10 6 .35 9 .18 6 . 3 6 9 .19 6.41 9 .26 6 .42 9 .27 6 ,47 9 ,35 6 .48 9 .36 6 .52 9 .43 6 .53 9 .44 6 ,53 9 . 5 0 6 . 5 9 9 .51 6 .63 9 .58 6 .64 9 .59 6 ,69 9 .66 6 .70 9 .67 6 .74 9 .73 6 .75 9 .74 6 .79 9 . 8 0 6 .30 9 .81 6 .84 9 .37 6 .35 9 .88 6 .89 9 .94 6 .90 9 .95 6 .93 10 .00 6 .94 10.01 6 .98 10 .07 6 . 9 9 10.08 7 .02 10. 13 7 .03 10.14 7,07 10.19 7 .08 10,20 7. 11 10 .25 7 .12 10.26 7 ,15 10.31 7 .16 10.32
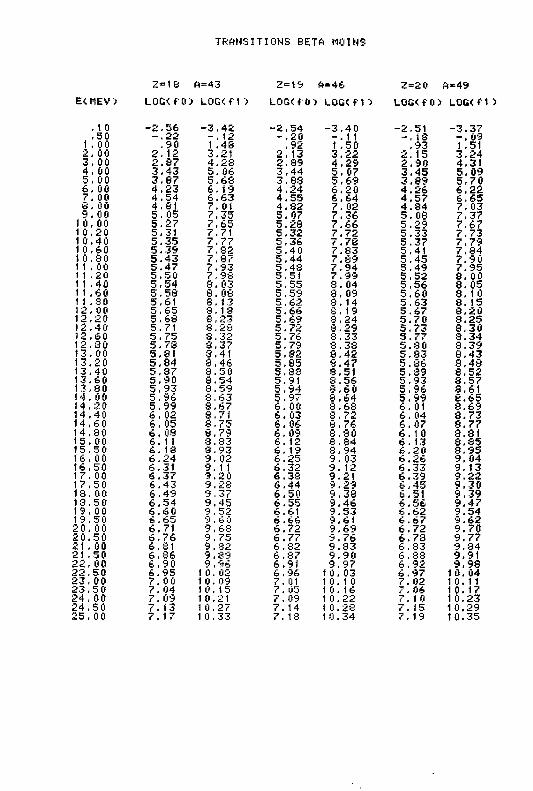
TRANSITIONS BETA MOINS
2=18 A=43 2=19 fi-46 2=20 ft=49
E<MEV> LOG', f CD LOGCfO LOG<fO> L0G<f1) LOG<fO> L0G<f1)
, 10 - 2 , 5 6 - 3 , 4 2 - 2 . 5 4 - 3 . 4 0 - 2 , 5 1 - 3 . 3 7 , 5 0 - . 2 2 - , 12 - . 2 0 - . 1 1 - , 18 - . 0 9
1 ,00 . 9 0 1 .48 , 9 2 1 .50 , 9 3 1.51 2 , 00 2 ,12 3.21 2 .13 3 .22 2 . 15 3 .24 3 ,00 2 . 8 7 4 . 2 8 2 .89 4 . 2 9 2 .90 4 ,31 4 ,00 3 .43 5 .06 3 ,44 5 .07 3 .45 5 ,09 5 , 0 0 3 .87 5 ,68 3 ,88 5 ,69 3 ,89 5 ,70 6 . 00 4 .23 6 .19 4 .24 6 .20 4 .26 6 .22 7 . 00 4 .54 6 .63 4 .55 6 ,64 4 .57 6 .65 8 , 00 4 ,81 7, 01 4 .82 7 ,02 4 .34 7. 03 9 ,00 5 .05 7 ,35 5 .07 7 ,36 5 .08 7,37
10,00 5 ,27 7.65 5 ,28 7 .66 5 .29 7 .67 1 0,20 5 ,31 7.71 5 .32 7 .72 5 .33 7 .73 10.40 5 .35 7 .77 5 .36 7 .78 5 .37 7 .79 10,60 5 .39 7 ,82 5 .40 7 .83 5 .41 7 .84 1 0,80 5 .43 7 .87 5 .44 7 .89 5 .45 7 .90 11 ,00 5 .47 7 .93 5.48 7 .94 5 .49 7 .95 1 1 .20 5 .50 7 .98 5.51 7 .99 5 .52 8 .00 1 1 ,40 5 .54 8 . 03 5 .55 8 .04 5 ,56 8 .05 11 .60 5 .58 8. OS 5.59 8 . 09 5 .60 8 .10 1 1 ,30 5 .61 8 .13 5 .62 8 . 14 5 .63 8. 15 12-00 5 ,65 8, 18 5 .66 8 ,19 5 .67 8 .20 12.20 5 ,68 8 ,23 5 , M 8 ,24 5 .70 8 .25 12.40 5 ,71 8 ,28 5 .72 8 .29 5 ,73 8 .30 12.60 5 ,75 S , 32 5 .76 8 ,33 5 .77 3 .34 12,30 5 ,78 8 ,37 5 .79 8 ,38 5 ,80 8 .39 13,00 5 ,81 8 .41 5 ,82 8 . 4 2 5 .83 3 ,43 13.20 5 .84 8 ,46 5 .85 8 .47 5 .86 8 ,48 13.40 5 ,87 8 ,50 5 . S3 8 .51 5 .39 8 ,52 13.60 5 ,90 8 ,54 5.91 8 .56 5 .93 8 .57 13,80 5 ,93 8 ,59 5 .94 8 ,60 5 ,96 8 .61 14. 00 5 ,96 3 ,63 5 .97 8 .64 5 .99 8 .65 14.20 5 ,99 8 ,67 6 .00 8 .68 6 . 01 8 .69 14.40 6 , 02 8 ,71 6 .03 3 .72 6 . 04 8 .73 14,60 6 ,05 8 ,75 6 ,06 8 ,76 6 ,07 8 .77 14,80 6 . 03 8 ,79 6 .09 3 .80 6 ,10 3.31 15, 00 6 . 1 1 3 .83 6 . 12 8 . 8 4 6 .13 8 .85 15 .50 6 . 18 S . 93 6 ,19 8 .94 6 .20 8 .95 16, 00 6 .24 9. 02 6 .25 9 .03 6 ,26 9 ,04 16 .50 6 .31 9 .11 6 ,32 9 .12 6 ,33 9 .13 17, 00 6 .37 9 .20 6 ,38 9 .21 6 .39 9 ,22 17 ,50 6 .43 9 .28 6,44 9 .29 6 ,45 9 ,30 I S , 00 6 .49 9 .37 6 ,50 9 .38 6,51 9 ,39 18 ,50 6 .54 9 .45 6 .55 9 .46 6 .56 9 .47 19. 00 6 ,60 9 .52 6.61 9 .53 6 ,62 9 .54 19.50 6 .65 9 .6 û 6 ,66 9 .61 6 .67 9 .62 2 0 . 0 0 6 .71 9, 6ft 6 .72 9 ,69 6 .72 9 .70 2 0 . 5 0 6 .76 9 .75 6 .77 9 ,76 6 .78 9 .77 21 .00 6 .81 9 .82 6 .82 9 .83 6 , 8 3 9 .84 21 ,50 6 ,86 9 ,89 6 .87 9 .90 6 ,33 9.91 2 2 , 0 0 6 ,90 9 ,96 6.91 9 ,97 6 ,92 9 ,98 2 2 . 5 0 6 .95 10.02 6 ,96 1 0, 03 6 .97 1 0. 04 2 3 . 0 0 7 .00 10.09 7. 01 10.10 7 .02 10. 11 2 3 , 5 0 7, 04 10.15 7 , 05 10.16 7 .06 10. 17 2 4 , 00 7 , 09 10,21 7, 09 1 0,22 7 .10 10.23 24 ,50 7 .13 1 0.27 7 .14 1 0.28 7 . 15 1 0.29 25 , 00 7 .17 10,33 7. 18 1 0 .34 7 .19 10.35
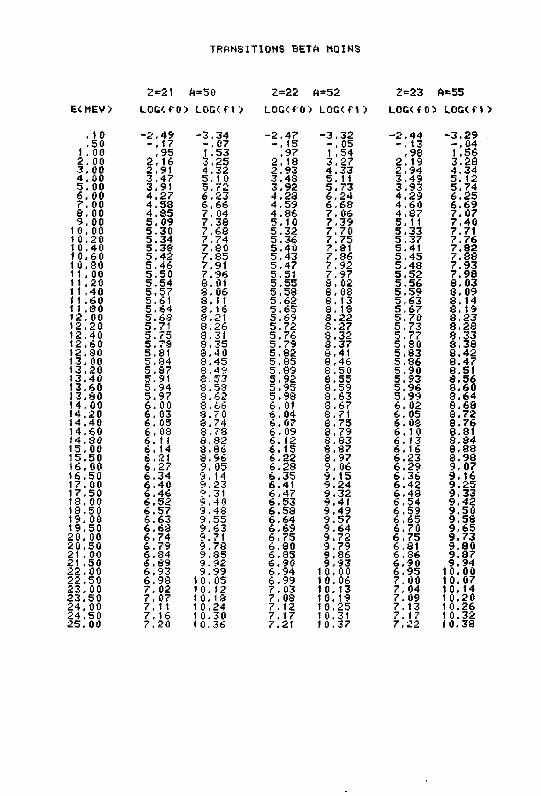
TRANSITIONS BETA MOINS
2=21 A=50 2=22 A=52 2=23 A=55
E<MEV> LOG'.f 0> LOG<f 1 > LOG< f O > LOG< f 1 > LOG< f 0> LÛG< f 1 >
. 10 - 2 . 4 9 - 3 . 3 4 - 2 . 4 7 - 3 . 3 2 - 2 . 4 4 - 3 . 2 9
. 5 0 - . 1 7 - , 0 7 - . 1 5 - . 0 5 - . 1 3 - . 0 4 1 .00 , 9 5 1,53 . 9 7 1 .54 . 9 8 1.56 2 . 0 0 2 .16 3 ,25 2 .18 3 .27 2 .19 3.28 3 . 0 0 2 ,91 4 .32 2 .93 4 . 3 3 2 .94 4 .34 4 . 00 3 .47 5. 1 0 3 .48 5. 11 3 .49 5 .12 5 .00 3.91 5 .72 3 .92 5 .73 3 .93 5 .74 6 . 0 0 4 . 2 7 6 ,23 4 .23 6 .24 4 . 2 9 6 .25 7 ,00 4 .38 6 ,66 4 .59 6 .68 4 .60 6 .69 8 .00 4 .35 7, 04 4 .86 7 . 06 4 .87 7 .07 9 . 0 0 5 .09 7 .38 5 .10 7 .39 5.11 7 .40
10 .00 5 .30 7 ,68 5 .32 7 .70 5 .33 7.71 10 .20 5.34 7.74 5 .36 7.75 5 .37 7 .76 10 .40 5 .38 7 .80 5 .40 7.81 5 .41 7 .32 10 ,60 5 .42 7 .85 5 ,43 7 ,36 5 , 4 5 7 .38 10 .80 5 .46 7.91 5 .47 7 .92 5 .48 7 .93 11 .00 5 .50 7 .96 5.51 7 .97 5 .52 7 .98 11 .20 5 .54 8.01 5 .55 8 .02 5 .56 8 .03 11 ,40 5 .57 8 .06 5 .53 8 ,08 5 ,59 3 .09 11 .60 5.61 8. 1 1 5 .62 8 . 13 5 ,63 8 .14 1 1 .80 5.64 8 . 16 5 .65 8 . 13 5 .67 3. 19 12. 00 5 .68 3.21 5 .69 3 .22 5 .70 8 .23 12 ,20 5 .71 3 ,26 5 .72 8 .27 5 ,73 8 .28 12,40 5 .75 8.31 5 .76 8 .32 5 ,77 8 .33 12 .60 5 .78 8 .35 5 .79 8 .37 5 .80 3 .38 12.80 5,81 8 .40 5 ,82 8.41 5 .83 8 .42 13 ,00 5 ,84 8 .45 5 .85 8 .46 5 .86 8 .47 13 ,20 5 .87 3 ,49 5 .89 8 .50 5 .90 3.51 13 ,40 5 .91 8 ,53 5 .92 8 .55 5 .93 3 .56 13.60 5.94 8 .53 5.95 8 .59 5 .96 3 .60 13,80 5 .97 8 .62 5 ,93 8 .63 5 .99 8.64 14,00 6 .00 3 ,66 6,01 3 .67 6 .02 8 .68 14,20 6 .03 3 .7 0 6 .04 8 .71 6 .05 3 .72 14.40 6. 05 8 .74 6 .07 8 .75 6 .03 8 .76 14,60 6. 08 8 .78 6 .09 3 .79 6 .10 8.31 14 ,80 6. 1 i 8 .82 6 .12 8 .83 6 .13 3 .84 15.00 6 ,14 8 ,86 6 .15 8 ,87 6 .16 8 .38 15 .50 6 .21 8 ,96 6 .22 8 .97 6 .23 3 .98 16 ,00 6 ,27 9. 05 6 .28 9 . 0 6 6 .29 9 ,07 16 .50 6 .34 9 ,14 6.35 9 .15 6 .36 9 .16 17.00 6 .40 9 .23 6.41 9 .24 6 .42 9 .25 17 .50 6 .46 9,31 6 .47 9 .32 6 .43 9 .33 18 .00 6 , 5 2 '3,4 0 6 .53 9 .41 6 .54 9 .42 13.50 6 .57 9 .48 6 .58 9 .49 6 .59 9 .50 19. 00 6 .63 9 .55 6.64 9 .57 6 .65 9 .58 19 .50 6 .63 9 .63 6 .69 9 .64 6 . 7 0 9 .65 2 0 . 0 0 6.74 9.71 6.75 9 .72 6 ,75 9 .73 2 0 . 5 0 6 .79 9 .78 6 .30 9 .79 6 .31 9 .90 21 . 00 6 .84 9 .85 6 .85 9 .86 6 ,36 9 .87 21 ,50 6 .89 9 ,92 6 .90 9 . 9 3 6 . 9 0 9 .94 2 2 . 0 0 6 .93 9 .99 6 .94 10.00 6 ,95 10.00 2 2 . 5 0 6 .98 1 0. 05 6 .99 10.06 7 ,00 10.07 2 3 . 0 0 7 . 0 2 10 .12 7 .03 10 .13 7 .04 10.14 2 3 . 5 0 7 . 07 10.18 7 .08 10.19 7 .09 10.20 2 4 . 0 0 7.11 10,24 7.12 10.25 7 .13 10.26 2 4 . 5 0 7 .16 10.30 7 .17 10.31 7 .17 10.32 2 5 . 0 0 7 .20 1 (1. 36 7.21 1 0.37 7 .22 10.38
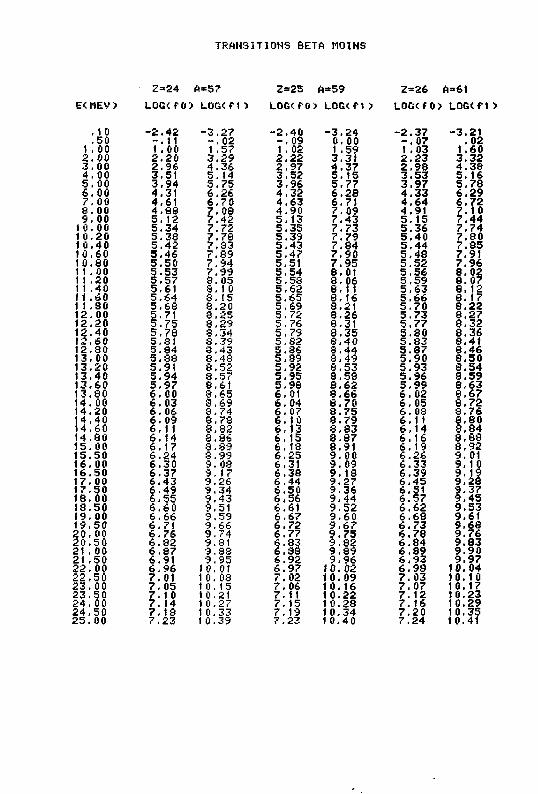
TRANSITIONS BETA MOINS
2=24 A=57 2=25 A=59 2=26 A=61 E<MEV> LOG<f0> LOG<f1> LOG<f0> LOG<fJ> LOG<f0> LOG<f1>
.10 - 2 . 4 2 - 3 . 2 7 - 2 . 4 0 - 3 . 2 4 - 2 . 3 7 - 3 . 2 1
.50 - . 11 - . 0 2 - . 0 9 0,00 - . 0 7 .02 1 .00 1 .00 1 .57 1 .02 1 .59 1 .03 1,60 2 . 0 0 2 . 2 0 3 .29 2 ,22 3 .31 2 . 2 3 3 .32 3 . 0 0 2 . 9 6 4 . 3 6 2 . 9 7 4 . 3 7 2 , 9 8 4 . 3 8 4 ,00 3 .51 5 .14 3 .52 5 .15 3 .53 5 .16 5 .00 3 .94 5 .75 3 ,96 5 .77 3 .97 5 .78 6 ,00 4 ,31 6 .26 4 ,32 6 . 2 8 4 . 3 3 6 .29 7 .00 4 . 6 1 6 .70 4 .63 6 .71 4 . 6 4 6 . 7 2 6 .00 4 .83 7 .08 4 .90 7 .09 4 .91 7 .10 9 ,00 5 .12 7 .42 5 .13 7 .43 5 .15 7 .44
to.oo 5.34 7 .72 5 .35 7 .73 5 .36 7 .74 10.20 5 .33 7 .78 5 .39 7 .79 5 .40 7 .80 10 .40 5 . 4 2 7 .83 5 .43 7 .84 5 . 4 4 7 .85 10 .60 5 .46 7 .89 S,47 7 .90 5 .48 7.91 10 .80 5 .50 7 .94 5 ,51 7 .95 5 .52 7 .96 1 1 .00 5 .53 7 .99 5 .54 8 ,01 5 .56 8 .02 1 1 .20 5 .57 8 .05 5 .58 8 .06 5 .59 8 .07 1 1 .40 5 .61 8 .1 0 5 .62 8 .11 5 .63 8 . 1 2 11 .60 5 .64 8 . i 5 5 .65 8 .16 5 .66 8 . 1 7 1 1 .30 5 .68 8 .20 5 .69 3 .21 5 .70 8 .22 12 .00 5 .71 3 .25 5 .72 3 .26 5 .73 8 .27 12 .20 5 .75 8 .29 5 .76 3 .31 5 . 7 7 8 . 3 2 12 ,40 5 .78 3 .34 5 .79 8 .35 5 .30 8 .36 12 ,60 5 .81 8 .39 5 .82 8 . 4 0 5 .83 8 .41 12 .30 5 .34 S.43 5 .36 3 .44 5 .87 8 .46 13 .00 5 .88 8 .48 5 .89 8 .49 5 ,90 8 .50 13 .20 5 .91 8 .52 5 ,92 8 .53 5 .93 8 .54 13 .40 5 .94 8 .57 5 ,95 8 .58 5 .96 3 ,59 13 .60 5 .97 8 .61 5 ,98 8 . 6 2 5 .99 8 .63 13 ,80 6 .00 8 .65 6 ,01 3 .66 6 .02 8 .67 14 .00 6 . 0 3 3 .69 6 ,04 8 . 7 0 6 .05 8 . 7 2 14 .20 6 .06 3 .74 6 .07 8 .75 6 .08 3 .76 14 .40 6 .09 8 .78 6 .10 3 .79 6 .11 8 .80 14 ,60 6 ,11 8 .32 6 .13 3 . 8 3 6 ,14 8 ,84 14,80 6 .14 8 .86 6 .15 8 .87 6 .16 8 ,88 15. 00 6 .17 3 .89 6 .18 8 .91 6 .19 8 ,92 15 .50 6 .24 3 .99 6 .25 9 .00 6 .26 9 .01 16 ,00 6 . 3 0 9 ,03 6 ,31 9 .09 6 .33 9 .10 16 ,50 6 .37 9 . 17 6 .38 9 .18 6 .39 9 .19 1 7 . 0 0 6 . 4 3 9 . 2 6 6 . 4 4 9 . 2 7 6 . 4 5 9 .28 17,50 6 .49 9 .34 6 .50 9 .36 6 .51 9 .37 18,00 6 .55 9 .43 6 .56 9 .44 6 .57 9 ,45 13.50 6 .60 9.51 6 .61 9 . 5 2 6 .62 9 .53 19.00 6 .66 9 ,59 6 .67 9 . 6 0 6 .68 9 .61 19,50 6 .71 9 .66 6 .72 9 . 6 7 6 . 7 3 9 .68 2 0 , 0 0 6 ,76 9 .74 6 .77 9 .75 6 . 7 8 9 .76 2 0 . 5 0 6 .82 9.81 6 .33 9 . 8 2 6 .84 9 .83 21 . 00 6 ,87 9 ,88 6 .33 9 .89 6 ,89 9 .90 21 ,50 6 , 9 1 9 .95 6 . 9 2 9 . 9 6 6 . 9 3 9 .97 2 2 . 0 0 6 , 9 6 10,01 6 .97 10 .02 6 . 9 8 10.04 2 2 . 5 0 7 ,01 1 0. 08 7 .02 10 .09 7 .03 10.10 2 3 . 0 0 7 .05 10,15 7 .06 10 .16 7 .07 10.17 2 3 . 5 0 7 . 1 0 1 0,21 7.11 10 .22 7 .12 10.23 2 4 . 0 0 7 . 14 1 0.27 7 ,15 10 .28 7 .16 10.29 2 4 . 5 0 7 .18 10.33 7 ,19 10 .34 7 .20 10.35 2 5 . 0 0 7 .23 10.39 7 .23 10.40 7 .24 10,41
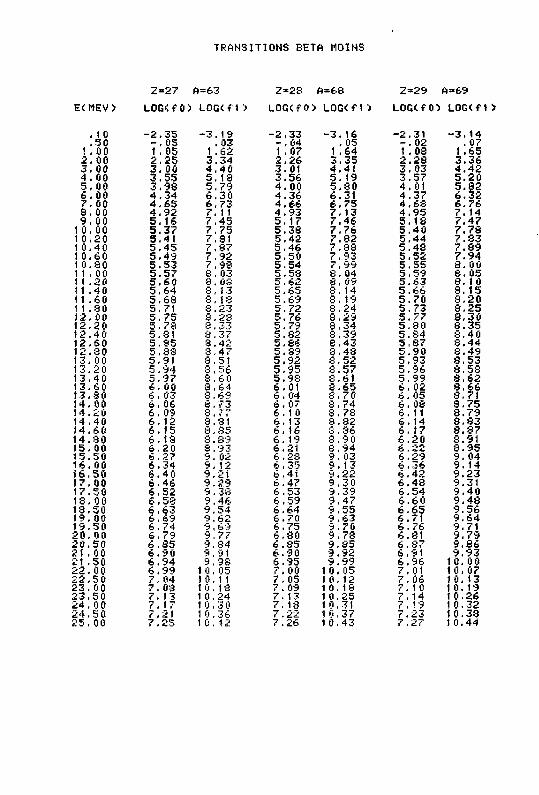
TRANSITIONS BETA MOINS
Z-27 fi=63 2*28 ft=6S Z=29 A=69 E<MEV> LOG<fO'J LOGCfD LOG(fO) LOG<f1) LOG<f0> LOG<f1>
. 1 0 - 2 . 3 5 - 3 . 1 9 - 2 . 3 3 - 3 . 1 6 - 2 , 3 1 - 3 . 1 4
. 5 0 - . 0 5 . 03 - . 0 4 . 0 5 - . 0 2 . 0 7 t .00 1 ,05 1 .62 1 .07 1 .64 1 .08 1.65 2 .00 2 . 2 5 3 .34 2 .26 3 .35 2 .28 3 .36 3 . 0 0 3 , 0 0 4 . 4 0 3 ,01 4 .41 3 .03 4 . 4 2 4 .00 3 .55 5 ,18 3.56 5 .19 3 .57 5 .20 5 ,00 3 ,98 5 ,79 4 .00 5 .30 4 .01 5 .82 6 .00 4 . 3 4 6 ,30 4 .36 6 .31 4 .37 6 .32 7 . 00 4 . 6 5 6 , 7 3 4 .66 6 .75 4 . 6 8 6 . 7 6 8 .00 4 , 9 2 7, 11 4 .93 7 . 13 4 .95 7 .14 9 , 0 0 5 .16 7 ,45 5 .17 7 .46 5 .18 7.47
10 .00 5 .37 7 ,75 5 .38 7 .76 5 .40 7 .78 10,20 5 .41 7.31 5 .42 7 .82 5 .44 7 .33 10.40 5 .45 7 .87 5 .46 7 .88 5 .43 7 .89 10.60 5 ,49 7 ,92 5 .50 7 .93 5 ,52 7 .94 10.80 5 .53 7 ,98 5 .54 7 ,99 5 .55 8. 00 1 1 . 00 5 .57 8 .03 5 .53 8 . 04 5 .59 8. 05 11 .20 5 .60 3. OS 5 .62 8 . 09 5 .63 8. 10 11 .40 5 ,64 8 ,13 5 .65 3 .14 5 ,66 8 .15 11 .60 5 ,68 e. is 5.69 8 .19 5 .70 8 .20 1 1 .90 5 ,71 3 .23 5 .72 8 ,24 5 .73 8 .25 12. 00 5 ,75 8 ,23 5 .76 8 ,29 5 .77 8 .30 12.20 5 .73 8 ,33 5 .79 8 ,34 5 .80 8 .35 12.40 5 .81 8 .37 5 .82 3 .39 5 .84 8 .40 12.60 5 .85 3 .42 5 .86 8 .43 5 ,37 3 .44 12,80 5 .38 3 .47 5 .39 3 .48 5 .90 8 .49 13. 00 5 ,91 8 ,51 5 .92 8 , 5 2 5 ,93 8 .53 13.20 5 .94 8 .56 5 .95 3 .57 5 .96 8 .53 13.40 5 .97 8 ,60 5 .98 3 .61 5 ,99 3 .62 13.60 6 , 00 3 .64 6.01 3 .65 6 , 02 3 ,66 13 .80 6 , 03 3 ,69 6 .04 8 ,70 6 , 05 8 ,71 14.00 6 ,06 8 ,73 6 . 07 8 .74 6 . 03 3 ,75 14.20 6 , 09 8, 77 6 .10 8 .78 6 . 11 8 .79 14.40 6 . 12 8.31 6 .13 8 .32 6 .14 8 .83 14 ,60 6 ,15 8,R5 6 .16 8 .86 6 ,17 8 . 3 7 14.80 6 .18 3 .89 6 .19 3 .90 6 .20 3 .91 15, 00 6 .20 S.93 6.21 8 .94 6 .22 3 .95 15 .50 6 .27 9. 02 6 .28 9. 03 6 ,29 9 .04 16, 00 6 .34 9 , 12 6 .35 9 .13 6 ,36 9 .14 16.50 6 .4 0 9 .21 6.41 9 .22 6 ,42 9 .23 17,00 6 .46 9 .29 6 ,47 9 .30 6 .43 9 .31 17.50 6 . 5 2 9 .38 6 .53 9 .39 6 .54 9 ,40 18 .00 6 ,53 9 .46 6 .59 9 .47 6 .60 9 .48 18.50 6 , 6 3 9 .54 6 .64 9 ,55 6 .65 9 .56 19.00 6 , 69 9 .62 6 ,70 9 ,63 6 .71 9 .64 19 .50 6 .74 9 , 69 6 .75 9 .70 6 .76 9 .71 20 .00 6 ,79 9 ,77 6 ,80 9 .78 6 .31 9 .79 2 0 . 5 0 6 , 8 5 9 .84 6 .85 9 .85 6 . 3 7 9 .86 21 ,00 6 .90 9 ,91 6 .90 9 .92 6.91 9 .93 21 .50 6 .94 9 ,98 6 .95 9 ,99 6 .96 10.00 2 2 , 0 0 6 .99 1 0 , 05 7 ,00 10.05 7.01 10,07 2 2 , 5 0 7 , 04 10.11 7 .05 10 .12 7 .06 10.13 23 , 0 0 7. 03 10.18 7 .09 10 .18 7 . 1 0 10. 19 23 ,50 7 .13 1 0,24 7 .13 1 0.25 7 .14 10.26 24 , 00 7, 17 1 0.30 7. 13 10.31 7 .19 10.32 2 4 . 5 0 7.21 1 0.36 7 .22 1 0 , 37 7 .23 10.33 2 5 , 0 0 7 ,25 1 0. 42 7.26 10 ,43 7 .27 1 0.44
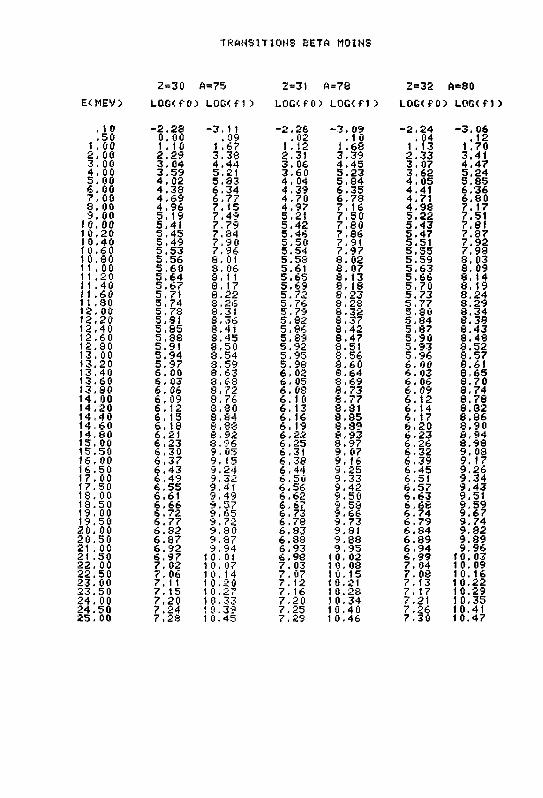
TRANSITIONS BETA MOINS
2=30 A=75 2=3) A=78 2=32 A=80 E<MEV> LOG(fO> LOG<fO LOG< f 0 ) LOG<f1> LOG<fO> LOG<f1>
. 10 - 2 . 2 8 - 3 . 1 1 - 2 . 2 6 - 3 . 0 9 - 2 . 2 4 - 3 . 0 6
. 5 0 0 . 0 0 . 0 9 . 0 2 . 10 . 0 4 . 1 2 1 . 0 0 1 . 1 0 1 . 6 7 1 , 1 2 1 . 6 8 1 . 1 3 1 . 7 0 2 . 0 0 2 . 2 9 3 , 3 8 2 . 3 1 3 . 3 9 2 . 3 3 3 . 4 1 3 . 00 3 . 0 4 4 . 4 4 3 . 0 6 4 . 4 5 3 . 0 7 4 . 4 7 4 , 00 3 . 5 9 5 . 2 1 3 . 6 0 5 . 2 3 3 . 6 2 5 . 2 4 5 , 0 0 4 . 0 2 5 . 8 3 4 , 04 5 . 8 4 4 . 0 5 5 . 8 5 6 , 0 0 4 . 3 8 6 . 3 4 4 . 3 9 6 . 3 5 4 . 4 1 6 . 3 6 7 , 0 0 4 . 6 9 6 . 7 7 4 . 7 0 6 . 7 8 4 . 7 1 6 . 8 0 8 , 00 4 , 9 6 7 . 1 5 4 . 9 7 7 . 16 4 . 9 8 7 . 1 7 9 , 0 0 5 , 1 9 7 , 4 9 5 . 2 1 7 , 5 0 5 . 2 2 7 . 5 1
1 0 , 0 0 5 . 4 1 7 . 7 9 5 . 4 2 7 , 3 0 5 . 4 3 7 . 8 1 1 0 , 2 0 5 . 4 5 7 . 8 4 5 . 4 6 7 , 8 6 5 . 4 7 7 . 8 7 1 0 . 4 0 5 , 4 9 7 . 9 0 5 . 5 0 7 , 9 1 5 . 5 1 7 . 9 2 1 0 , 6 0 5 . 5 3 7 . 9 6 5 . 5 4 7 , 9 7 5 . 5 5 7 . 9 8 1 0 , 8 0 5 . 5 6 6 . 01 5 . 5 3 8 . 02 5 . 5 9 8 . 0 3 1 1 . 0 0 5 , 6 0 S . 06 5 . 6 1 8 . 07 5 . 6 3 8 , 0 9 1 1 . 2 0 5 , 6 4 3 . t 1 5 . 6 5 8 , 13 5 . 6 6 8 , 14 i l .40 5 . 6 7 8 , 17 5 . 6 9 8 , 18 5 . 7 0 8 , 1 9 11 . 6 0 5 , 7 1 3 . 2 2 5 . 7 2 8 . 2 3 5 . 7 3 8 . 2 4 1 1 . 8 0 5 , 7 4 8 . 2 6 5 . 7 6 8 . 2 8 5 . 7 7 8 . 2 9 1 2 . 0 0 5 . 7 8 3 . 3 1 5 . 7 9 8 . 3 2 5 . 3 0 8 . 3 4 1 2 . 2 0 5 , 8 1 3 , 3 6 5 . 8 2 8 . 3 7 5 . 8 4 8 . 3 8 1 2 . 4 0 5 , 8 5 8 . 4 1 5 . 3 6 8 . 4 2 5 . 8 7 8 . 4 3 1 2 . 6 0 5 , 8 8 3 . 4 5 5 . 8 9 8 . 4 7 5 . 9 0 8 . 4 8 1 2 . 3 0 5 . 9 1 8 , 5 0 5 , 9 2 3 . 5 1 5 . 9 3 8 . 5 2 1 3 , 0 0 5 , 9 4 3 , 5 4 5 , 9 5 8 . 5 6 5 , 9 6 8 . 5 7 1 3 . 2 0 5 . 9 7 8 . 5 9 5 . 9 8 3 . 6 0 6 . 0 0 8 . 6 1 1 3 . 4 0 6 . 00 8 . 6 3 6 , 0 2 8 . 6 4 6 . 0 3 8 , 6 5 1 3 . 6 0 6 . 03 8 . 6 3 6 , 0 5 8 , 6 9 6 . 06 8 . 7 0 1 3 , 3 0 6 . 0 6 8 , 7 2 6 , 0 3 8 , 7 3 6 . 0 9 8 , 7 4 1 4 . 0 0 6 , 0 9 8 , 7 6 6 , 1 0 8 , 7 7 6 . 1 2 8 , 7 8 1 4 , 2 0 6 . 1 2 3 . 3 0 6 . 1 3 3 . 8 1 6 . 1 4 8 , 3 2 1 4 , 4 0 6 . 1 5 8 . 8 4 6 . 1 6 8 . 8 5 6 , 1 7 8 . 8 6 1 4 , 6 0 6 . 1 3 8 , 3 3 6 . 19 8 . 8 9 6 . 2 0 8 . 9 0 1 4 , 8 0 6 . 2 1 6 . 9 2 6 . 2 2 8 , 9 3 6 . 2 3 8 . 9 4 I S . 00 6 . 2 3 8 , 9 6 6 . 2 5 8 . 9 7 6 . 2 6 8 . 9 8 1 5 . 5 0 6 . 3 0 9 . 05 6 . 3 1 9 . 0 7 6 . 3 2 9 . 0 8 1 6 , 0 0 6 , 3 7 9 , 15 6 . 3 8 9 . 1 6 6 . 3 9 9 . 1 7 1 6 . 5 0 6 . 4 3 9 . 2 4 6 . 4 4 9 . 2 5 6 . 4 5 9 . 2 6 1 7 . 0 0 6 , 4 9 9 , 32 6 . 5 0 9 . 3 3 6 . 5 1 9 . 3 4 1 7 . 5 0 6 . 5 5 9 . 4 1 6 . 5 6 9 . 4 2 6 . 5 7 9 . 4 3 1 8 . 0 0 6 . 6 1 9 , 4 9 6 . 6 2 9 . 5 0 6 , 6 3 9 . 5 1 1 9 . 5 0 6 . 6 6 9 . 5 7 6 . 6 7 9 . 5 3 6 . 6 8 9 . 5 9 1 9 . 00 6 . 7 2 9 . 6 5 6 . 7 3 9 . 6 6 6 . 7 4 9 . 6 7 1 9 . 5 0 6 . 7 7 9 . 7 2 6 . 7 3 9 . 7 3 6 . 7 9 9 . 7 4 2 0 , 0 0 6 . 8 2 9 , 8 0 6 . « 3 9 . 3 1 6 . 8 4 9 , 3 2 2 0 , 5 0 6 . 3 7 9 . 3 7 6 . 3 3 9 . 8 8 6 , 8 9 9 , 8 9 21 . 0 0 6 . 9 2 9 , 9 4 6 . 9 3 9 . 9 5 6 . 9 4 9 , 9 6 21 . 5 0 6 . 9 7 1 0. 01 6 . 9 8 1 0 . 02 6 . 9 9 1 0 . 0 3 2 2 . 0 0 7 . 0 2 1 0 , 07 7 . 0 3 1 0 . 03 7 . 04 1 0 . 0 9 2 2 . 5 0 7 , 0 6 1 0 . 1 4 7 . 0 7 1 0 . 1 5 7 . 0 8 1 0 . 1 6 2 3 . 0 0 7 . 1 1 1 0 . 20 7 . 12 1 0 . 2 1 7 . 1 3 1 0 . 2 2 2 3 . 5 0 7 . 1 5 1 0 . 2 7 7 . 1 6 1 0 . 2 8 7 . 17 1 0 . 2 9 2 4 . 0 0 7 , 2 0 1 0 , 3 3 7 . 2 0 1 0 . 3 4 7 . 2 1 1 0 , 3 5 2 4 . 5 0 7 . 2 4 1 0 . 3 9 7 . 2 5 1 0 . 4 0 7 . 2 6 1 0 . 4 1 2 5 , 0 0 7 . 2 3 1 0 . 4 5 7 , 2 9 1 0 . 4 6 7 . 3 0 1 0 . 4 7
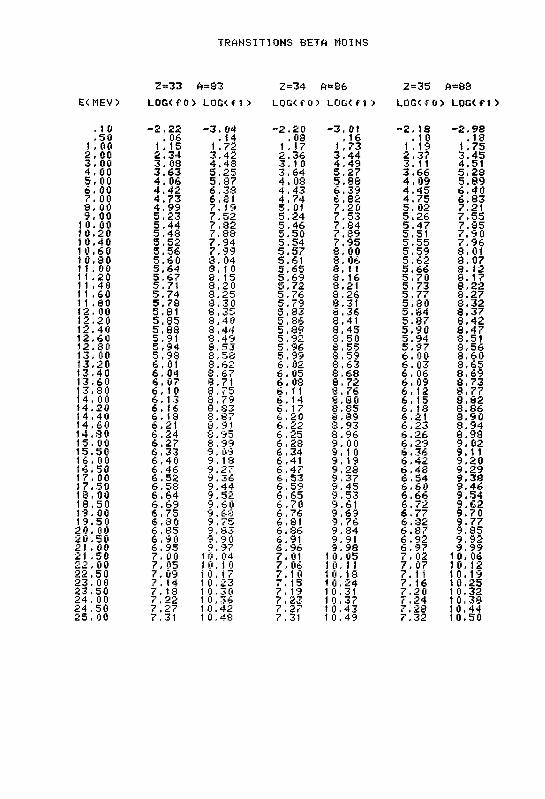
TRANSITIONS BETA MOINS
2=33 A=83 2=34 ft=86 2=35 A=88
E<MEV> LOG<fO> LOG<f1> LOG<fO> LOG<f t ) LOG<fO) LOG<fO
, 10 - 2 , 2 2 - 3 . 0 4 - 2 . 2 0 - 3 , 01 - 2 . 1 8 - 2 . 9 8 . 5 0 . 06 . 14 , 0 3 , 1 6 . 1 0 . 1 8
1 .00 1.15 1 .72 1 ,17 1 .73 1 ,19 1.75 2 .00 2 .34 3 .42 2 ,36 3 .44 2 .37 3 .45 3 .00 3 . 08 4 .48 3,10 4 ,49 3. 1 1 4 .51 4 . 0 0 3 .63 5 ,25 3,64 5 .27 3 .66 5 ,28 5 ,00 4 . 0 6 5 .87 4 ,08 5 .88 4 , 0 9 5 ,89 6 , 0 0 4 . 4 2 6 .38 4 ,43 6 .39 4 . 4 5 6 ,40 7 .00 4 . 7 3 6 ,81 4 ,74 6 .82 4 ,75 6 .83 3 . 0 0 4 , 9 9 7 ,19 5 ,01 7 .20 5 .02 7.21 9 . 0 0 5 ,23 7 ,52 5 .24 7 ,53 5 .26 7 .55
10.00 5 .44 7 ,82 5 ,46 7 .84 5 .47 7 .85 10.20 5 ,48 7, 88 5 .50 7 .89 5.51 7.90 10.40 5 .52 7 .94 5.54 7 .95 5 .55 7 .96 10 .60 5 .56 7 .99 5 .57 8 , 0 0 5 .59 8 ,01 10 .80 5 .60 3 .04 5.61 8 , 06 5 ,62 8 .07 1 1 . 00 5 .64 3, 1 0 5 .65 8. 1 1 5 .66 3. 12 1 1 .20 5 .67 8 .15 5 .69 3 ,16 5 .70 8. 17 1 1 .40 5 .71 8 .20 5 .72 8 .21 5 ,73 8 .22 1 1 .60 5 .74 8 .25 5,76 8 .26 5 ,77 8 .27 1 1 .80 5 .78 8 ,30 5 .79 8 .31 5 .30 3 .32 12 .00 5 .31 3 ,35 5 ,83 8 .36 5 ,84 8 ,37 12.20 5 .85 8 ,4 0 5,36 8 .41 5 .87 8 .42 12 .40 5 ,88 8 ,44 5 ,89 8 .45 5 .90 8 .47 12.60 5 .91 3 ,49 5 .92 3 .50 5 .94 3 .51 12 .80 5 , 9 4 8 ,53 5 .96 8 ,55 5 .97 8 .56 13.00 5 ,98 8 ,58 5 .99 8 ,59 6 .00 8 ,60 13.20 6 ,01 3 .62 6 .02 8 ,63 6 . 0 3 8 ,65 13.40 6 ,04 8 ,67 6 . 05 8 ,68 6 , 06 8 ,69 13.60 6 , 07 8 ,71 6 .03 8 ,72 6 ,09 8 ,73 13,30 6 ,10 3 ,75 6 .11 8 ,76 6 , 1 2 8 ,77 14.00 6 .13 3 ,79 6 . 14 8 .80 6 ,15 8 .82 14 .20 6 .16 3 .83 6 . 17 8 .85 6 , 13 8 ,86 14,40 6 .18 3 ,87 6,20 8 .89 6 ,21 3 .90 14 ,60 6 .21 8 ,91 6 ,22 S, 93 6 , 2 3 8 .94 14 ,30 6 .24 8 .95 6 ,25 8 .96 6 .26 8 .98 15.00 6 ,27 8 ,99 6 ,28 9 ,0 0 6 .29 9 .02 15 .50 6 ,33 9. 09 6 .34 9 ,10 6 .36 9.11 16.00 6 ,40 9 ,18 6.41 9 ,19 6 .42 9 ,20 16.50 6 , 4 6 9 ,27 6 .47 9 ,23 6 ,48 9 .29 17, 00 6 .52 9 ,36 6,53 9 .37 6 ,54 9 .38 17 .50 6 .58 9 .44 6 .59 9 . 45 6 ,60 9 .46 18,00 6 .64 9 ,52 6 .65 9 ,53 6 .66 9 .54 13.50 6 . 6 9 9 ,60 6 ,70 9 .61 6 .72 9 .62 19.00 6 ,75 9 , 68 6 .76 9 .69 6 .77 9 .70 19.50 6 .80 9 ,75 6,81 9 ,76 6 ,82 9 ,77 2 0 . 0 0 6 ,85 9 , 83 6 ,86 9 ,34 6 .87 9 .85 20 .50 6 , 9 0 9 , 9 û 6.91 9 .91 6 .92 9 .92 21 . 00 6 .95 9 .97 6 .96 9 .98 6 .97 9 .99 21 .50 7, 00 1 0, 04 7.01 10.05 7 .02 1 0. 06 2 2 , 0 0 7 .05 10,10 7 .06 10.11 7 .07 10,12 22 .50 7, 09 10,17 7 .10 10.18 7.11 10.19 2 3 . 0 0 7 .14 1 0,23 7. 15 10,24 7 .16 10,25 2 3 . 5 0 7 .18 10,30 7 .19 10.31 7 .20 10.32 2 4 . 0 0 7 ,22 1 0,36 7.23 1 0 ,37 7 .24 10,38 2 4 . 5 0 7 .27 1 0.42 7 ,27 10.43 7 ,23 10.44 25 , 00 7.31 1 0,48 7,31 1 0.49 7.32 10.50
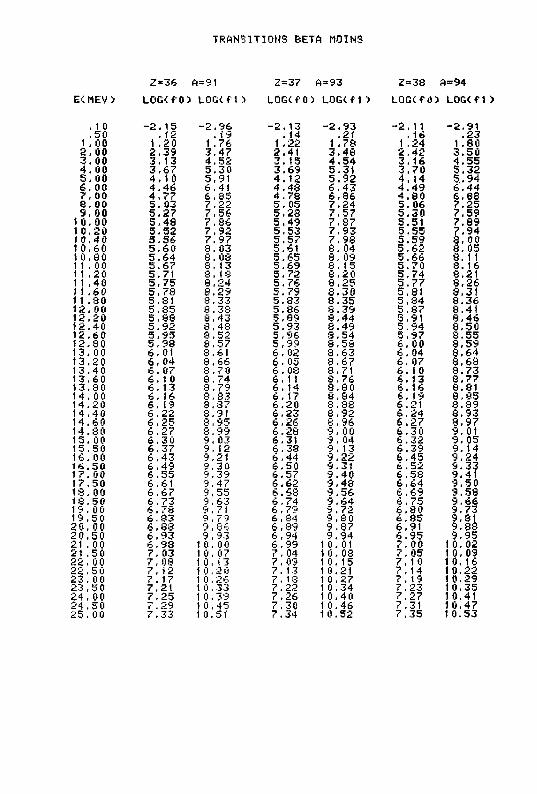
TRANSITIONS BETA MOINS
2-36 A=91 2=37 A=93 2=38 A=94 ECMEV) LOG<f0> L O G < f n LOG(fO) LOG<fO LOG<fO> LOG< f l >
, 10 - 2 . 1 5 - 2 . 9 6 - 2 . 1 3 - 2 . 9 3 - 2 . 1 1 - 2 . 9 1 , 5 0 . 12 . 19 . 14 . 2 1 . 16 . 2 3
1 , 0 0 1 , 2 0 1 , 7 6 1 . 2 2 1 . 7 8 1 , 2 4 1 .80 2 , 0 0 2 . 3 9 3 , 4 7 2 . 4 1 3 . 4 8 2 , 4 2 3 . 5 0 3 . 0 0 3 . 1 3 4 . 5 2 3 . 15 4 . 5 4 3 , 1 6 4 . 5 5 4 . 00 3 , 6 7 5 . 3 0 3 . 6 9 5 . 3 1 3 . 7 0 5 . 3 2 5 , 0 0 4 . 1 0 5 , 9 1 4 . 1 2 5 . 9 2 4 , 1 4 5.. 94 6 . 0 0 4 . 4 6 6 . 4 1 4 . 4 8 6 . 4 3 4 . 4 9 6 . 4 4 7 , 0 0 4 , 7 7 6 . 8 5 4 . 7 8 6 . 3 6 4 . 8 0 6 . 8 8 8 , 0 0 5 , 0 3 7 . 2 2 5 . 0 5 7 , 2 4 5 . 0 6 7 . 2 5 9 , 0 0 5 . 2 7 7 , 5 6 5 . 2 8 7 . 5 7 5 . 3 0 7 . 5 9
1 0 , 0 0 5 . 4 3 7 . 3 6 5 . 4 9 7 . 3 7 5 . 5 1 7 . 8 9 1 0 . 2 0 5 . 5 2 7 . 9 2 5 . 5 3 7 , 9 3 5 . 5 5 7 . 9 4 1 0 , 4 0 5 . 5 6 7 . 9 7 5 . 5 7 7 , 9 3 5 . 5 9 3 . 0 0 1 0 . 6 0 5 , 6 0 8 , 03 5 . 6 1 8 . 0 4 5 . 6 2 8 . 0 5 1 0 , 80 5 . 6 4 8 . 08 5 . 6 5 8 , 0 9 5 . 6 6 3 . 1 1 1 1 . 00 5 . 6 7 8 . 1 3 5 . 6 9 8 . 15 5 . 7 0 3 . 16 11 . 2 0 5 . 7 1 3 , ( 8 5 . 7 2 8 . 2 0 5 . 7 4 8 . 2 1 1 1 , 4 0 5 . 7 5 8 , 2 4 5 . 7 6 8 , 2 5 5 . 7 7 8 . 2 6 11 , 6 0 5 . 7 8 8 . 2 9 5 . 7 9 8 . 3 0 5 . 8 1 3 . 3 1 11 . 3 0 5 , 3 1 8 , 3 3 5 . 8 3 8 . 3 5 5 . 8 4 8 . 3 6 1 2 , 00 5 . 3 5 8 , 3 8 5 . 8 6 8 . 39 5 . 8 7 8 . 4 1 1 2 , 2 0 5 , 8 8 8 . 4 3 5 . 8 9 8 . 4 4 5 . 9 1 8 , 4 6 1 2 . 4 0 5 . 9 2 8 . 4 8 5 . 9 3 8 . 4 9 5 , 9 4 8 , 5 0 1 2 . 6 0 5 , 9 5 8 . 5 2 5 , 9 6 3 , 5 4 5 . 9 7 8 . 5 5 1 2 , 3 0 5 , 9 8 8 . 5 7 5 , 9 9 8 . 5 8 6 . 0 0 8 . 5 9 1 3 , 0 0 6 , 0 1 8 , 6 1 6 , 0 2 8 . 6 3 6 . 0 4 8 . 6 4 1 3 , 2 0 6 . 0 4 3 , 6 6 6 . 0 5 8 . 6 7 6 , 0 7 8 . 6 8 1 3 , 4 0 6 . 07 8 . 7 0 6 . 0 8 8 . 7 1 6 . 1 0 8 . 7 3 1 3 , 6 0 6 . tO 8 , 7 4 6 , 11 8 . 7 6 6 . 13 8 . 7 7 1 3 , 3 0 6 , 1 3 8 , 7 9 6 , 1 4 8 , 8 0 6 , 1 6 8 . 8 1 1 4 . 00 6 , 16 8 , 8 3 6 . 1 7 8 , 8 4 6 , 1 9 8 . 8 5 1 4 . 2 0 6 , 1 9 8 . 3 7 6 . 2 0 3 , 8 8 6 . 2 1 8 . 8 9 1 4 , 4 0 6 , 2 2 8 . 9 1 6 . 2 3 8 . 9 2 6 . 2 4 8 . 9 3 1 4 . 6 0 6 . 2 5 8 , 9 5 6 , 2 6 8 , 96 6 . 2 7 8 . 9 7 1 4 . 3 0 6 , 2 7 S. 9 9 6 . 2 8 9 , 0 0 6 . 3 0 9 . 0 1 1 5 , 0 0 6 . 3 0 9 , 03 6 , 3 1 9 . 04 6 , 3 2 9 . 0 5 1 5 . 5 0 6 . 3 7 9 , 1 2 6 . 3 8 9 . i 3 6 . 3 9 9 . 14 1 6 , 0 0 6 . 4 3 9 , 2 1 6 . 4 4 9 . 2 2 6 . 4 5 9 . 2 4 1 6 . 5 0 6 . 4 9 9 , 3 0 6 . 5 0 9 . 3 1 6 . 5 2 9 . 3 3 1 7 , 0 0 6 . 5 5 9 , 39 6 . 5 7 9 . 4 0 6 . 5 8 9 . 4 1 1 7 , 5 0 6 . 6 1 9 , 4 7 6 . 6 2 9 . 4 8 6 . 6 4 9 . 5 0 1 8 , 00 6 , 6 7 9 , 5 5 6 . 6 8 9 . 5 6 6 . 6 9 9 , 5 8 I S . 5 0 6 . 7 3 9 , 6 J 6 . 7 4 9 , 6 4 6 . 7 5 9 . 6 6 1 9 . 0 0 6 . 7 8 9 . 7 ) 6 , 7 9 9 . 7 2 6 . 8 0 9 . 7 3 1 9 . 5 0 6 , 3 3 9 , 79 6 , 8 4 9 . 8 0 6 , 8 5 9 . 8 1 2 0 , 0 0 6 , 8 3 9 , P. A 6 , 3 9 9 , 8 7 6 , 9 1 9 . 8 8 2 0 , 5 0 6 , 9 3 9 . 93 6 , 9 4 9 , 9 4 6 , 9 5 9 . 9 5 21 . 00 6 , 9 8 1 0 , 0 0 6 . 9 9 1 0 , 0 1 7 , 0 0 1 0 . 0 2 21 . 5 0 7 , 03 1 0 , 0 7 7 . 0 4 1 0 , 0 8 7 , 0 5 1 0 . 0 9 2 2 , 00 7 , 08 1 0 , 13 7 , 09 1 0 . 1 5 7 , 1 0 1 0 . 1 6 2 2 . 5 0 7 . 1 2 1 0 . 2 0 7 . 1 3 1 0 . 2 1 7 , 1 4 t 0 . 2 2 2 3 , 00 7 . 1 7 1 0 . 2 6 7 . 18 1 0 , 2 7 7 , 1 9 1 0 . 2 9 2 3 , 5 0 7 , 2 1 1 0 , 33 7 . 2 2 1 0 , 3 4 7 . 2 3 1 0 . 3 5 2 4 , 00 7 , 2 5 1 0 . 3 9 7 , 2 6 1 0 , 4 0 7 . 2 7 1 0 . 4 1 2 4 , 5 0 7 . 2 9 1 0 , 4 5 7 , 3 0 1 0 . 4 6 7 . 3 1 1 0 . 4 7 2 5 , 00 7 , 3 3 1 0 . 5 1 7 . 3 4 1 0 . 5 2 7 , 3 5 1 0 . 5 3
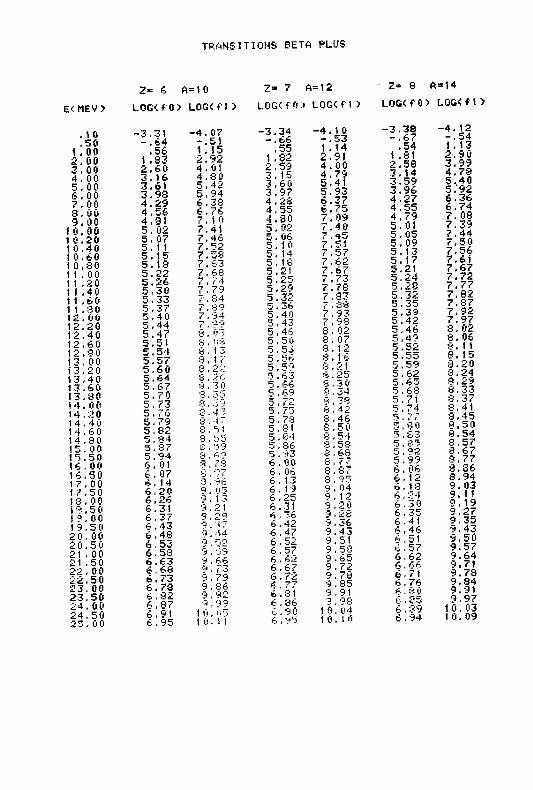
TRANS1TI0MS BETA PLUS
ECMEV>
1 0 , 5 0
1 . 00 2 . 00 3 . 00 4 . 00 5 . 00 6 . 00 7 . 00 3 . 00 9 . 00
1 0 . 00 1 0 . 20 1 0 , 4 0 to . 60 1 0 , 30 1 1 . 00 1 1 . 20 1 1 . 40 1 1 . 60 1 1 . SO t 2 . 00 1 2 , 20 1 2 , , 40 1 2 , , 60 1 2 , , 30 13 . , 0 0 13 , , 2 0 13 , , 4 0 13 , 6 0 13 , , 8 0 14 , , 0 0 14 , 2 0 14 . 4 0 14 . 6 0 14 . 8 0 15 . 00 15 . 5 0 16 , 00 16 . 5 0 17 . 0 0 17 . 5 0 18 . 00 18 . 5 0 1? . 0 0 19 , 5 0 2 0 . 0 0 20 . 5 0 21 . 00 21 . 5 0 22 . 00 2 2 . 5 0 23 . 00 23 . 5 0 24 . 0 0 24 , 5 0 25 . 0 0
2 = 6 A=10 2=> 7 A=12 Z * 8 A=14
LOG<fO> L O G ( f t ) L O G < f 0 > L 0 G < f 1 > L O G < f 0 > L Q G < f 1 >
. 3 1 - 4 . 0 7 - 3 . 3 4 - 4 . 1 0 - 3 . 3 8 - 4 . 1 2
.64 - . 5 1 - . 6 6 - . 5 3 - . 6 7 - . 5 4 « « «5 . 5 5 1 . 1 4 . 5 4 1 . 1 3 56 1 . 1 5
litfj £,?£ I * 2"=; A tin •? *5P 7 9 9
ï-fS 5-Sl I f l 3'" §:?S 4?1 1 l i ! I 3:51 hii ! :« 1:8 |:B i-% : |
i:« ?:« : ?: : :
5 . 0 7 7 . 4 6 S.Ufe 7 , 4 5 5 . « 5 £ . * * g 11 7 . 5 2 5 . 1 0 7 . 5 1 5 . 0 9 7 . 5 U
lé- i ê5 t; u 7 . 5 7 5 . 1 3 7 , 5 6
5 . 1 5 7 . 5 8
3 . 3 4 - 4 . 1 0 - . 6 6 - . 5 3
. 5 5 1 . 1 4 1 . 8 2 2 , 9 1 2 , 5 9 4 . 0 0 3 , 1 5 4 . 7 9 3 , 6 0 5 . 4 1 3 . 9 7 5 . 9 3 4 , 2 3 6 . 3 7 4 , 5 5 6 . 7 5 4 . 8 0 7 . 09 5 . 02 7 . 4 0 5 . 06 7 , 4 5 5 . 1 0 7 , 5 1 5 . 1 4 7 , 5 7 5 . 18 7 . 6 2 5 . 2 1 7 . 6 7 5 . 2 5 7 . 7 3 5 . 2 9 7 . 7 8 5 . 3 2 7 , 8 3 5 . 3 6 7 , 88 5 . 4Û 7 . 93 5 , 4 3 7 . 98 5 . 4 6 8 . 02 5 , 5 0 8 . 07 5 , 5 3 •3 .12 5 . 5 6 8 . 1 6 5 . 5 9 8 . 2 1 5 . 6 3 8 . 2 5 5 . 6 6 8 , J 0 5 . 69 8 , 34 5 . 7 2 8 . 38 5 . 7 5 8 , 42 5 . 7 8 8 . 4 6 5 . 8 1 8 . 5 0 5 . 8 4 8 . 5 4 5 . 8 6 8 , 5 8 5 . 9 3 S . 6 8 6 . 00 8 , 7 ? 6 . 06 3 . 8 7 6 , 1 3 8 . 9 5 6 . 1 9 w. 04 6 , 2 5 9 . 1 2 6 . 3 1 9 . 2 0 6 . 3 6 9 , 2 8 6 . 4 2 9 . 3 6 6 , 4 7 9 . 4 3 6 . 5 2 9 . 5 1 6 . 5 7 9 . 5 8 6 . 6 2 9 . 6 5 6 . 6 7 9 . 7 2 6 . 7 2 9 . 7 8 6 . 7 7 9 . 8 5 6 . 3 1 9 ,9 1 6 , 86 9 , 9ft 6 . 9 0 1 0 . 04 6 , 95 1 0 . 1 0
. 8 1 2 . 9 0
5 . 1 7 7 . 6 i 5 . 1 8 7 . 6 3 5 . I B 4 . ^ = • ' y?
I ' l l ?:!1 I.Û Ï:K |:îi |:|f
- Hi B fcl 111 ?:ff ^ 4 7 « ^ 5 . 4 6 8 . 0 2 5 , 4 b 3 . 0 2 1 ' 2 s " n £ 5 50 8 . 0 7 5 , 4 9 8 . 0 6 l e i 2 <i 5 53 S 12 5 . 5 2 W.11 5 . 5 4 B. 1 J -J, J-î ? • ! t c S^ o i e 5 57 8 , 1 ? 5 . 5 6 a . l b 5 .5 . . . 8 . J o 2 ' ï r i ô V- s S"< 8 , 2 1 5 . 5 y 3 . 2 0
• § y i'%7 * ? - r ft ?5 5 . 6 2 8 . 2 4 "=; fid S --f". 5 . 6 : - a . ^ o J i , ? S X - ^ 1:67 a 30 5-66 8,30 5.*5 g . r f
5 ' 7 6 8 : 4 S i ? ? ^ 5 . 7 4 8 . 4 1 2"-US >. . i ^ B 70 a , 46 5 . 7 c y . 4 5 § ' 8 * s ' s i I'M I 50 5,80 8.50 1:15 «:i4 l -w e.54 5.83 8.54 1:94 S 6? 5 .93 8 .68 5 .9* 8.67
%\l\ I:«? !:$ :li : : t:« %:l% I : l ' -s If :
f:§f %\£ I : : | '1 ;
%-l\ ? 'P 1'4? ":36 l:4ï 1 :1 1:43 1:44 | : 4 7 ? , 4 3 6 .46 | . 4 3 1.63 9.66 6.62 * . b 5 6 ^ * .64 6 . 7 3 9 . 7 9 6 . 7 2 g . 7 B b . r i 9 . 7 8 6 . 7 3 9 . 8 6 6 .7 . - V . 8 5 b . fb | . | 4 ! ; 9 5 tO ï ï 6 ^ 5 1 0 . 1 0 6 . 9 4 l u . 0 9
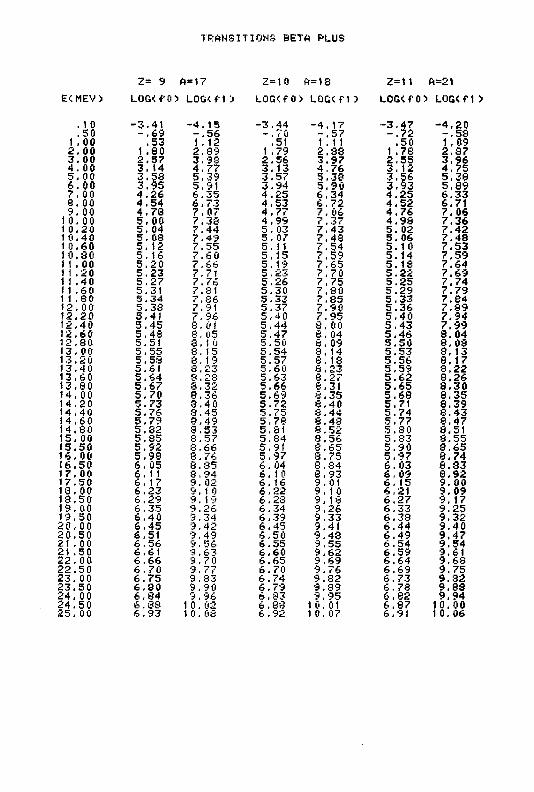
TRANSITIONS BETA PLUS
2= 9 A=17 Z=J0 A=1S Z=11 A=21
E<MEV> LOG<f0> LOG<f1> LÛG<f0 > LÛG<f1> LOGCf0> LOG<f1>
. 1 0 - 3 . 4 1 - 4 . 1 5 - 3 . 4 4 - 4 . 1 7 - 3 . 4 7 - 4 . 2 0
. 5 0 - . 6 9 - . 5 6 - . 7 0 - . 5 7 - , 7 2 - . 5 8 t ,00 . 5 3 1 ,12 .51 1.11 , 5 0 1.09 2 .00 1 .80 2 ,89 1 .79 2 ,88 1 .78 2 ,37 3 . 00 2 ,57 3 .93 2 .56 3 .97 2 ,55 3 ,96 4 . 00 3 .14 4 .77 3. 13 4 , 7 6 3 .12 4 ,75 5 ,00 3 .58 5 ,39 3 .57 5 ,38 3 .56 5 ,38 6 . 0 0 3 ,95 5 ,91 3 .94 5 ,90 3 .93 5 .89 7 .00 4 . 2 6 6 .35 4 .25 6 , 3 4 4 .25 6 .33 8 .00 4 , 5 4 6 .73 4 .53 6 , 7 2 4 .52 6 ,71 9 ,00 4 . 7 3 7 ,07 4 .77 7 .06 4 .76 7 .06
10,00 5 .00 7 .38 4 .99 7 .37 4 , 9 8 7 ,36 10 .20 5 , 04 7.44 5 . 03 7 .43 5 . 02 7 .42 1 0 .40 5 .08 7 .49 5 .07 7 .48 5 .06 7 .48 10.60 5 . 1 2 7.55 5, 11 7.54 5 .10 7 .53 10.80 5 .16 7 .60 5 .15 7 .59 5 .14 7 ,59 M .00 5 . 2 0 7 ,66 5 .19 7 .65 5 .18 7 .64 11 .20 5 .23 7.71 5 .23 7 .70 5 .22 7.69 1 1 .40 5 .27 7,76 5 .26 7 ,75 5 .25 7 ,74 1 1 .60 5 .31 7.81 5 .30 7 .80 5 .29 7 .79 1 1 .30 5 .34 7.86 5 ,33 7 ,85 5 .33 7.84 12.00 5 .38 7.91 5 .37 7 .90 5 .36 7.89 12 .20 5 .41 7 .96 5 ,40 7 .95 5 . 4 0 7,94 12,40 5 .45 8. 01 5 .44 8 , 00 5 ,43 7 .99 12,60 5 ,48 8. 05 5 .47 8 , 04 5 .46 8 .04 12,80 5 .51 8 ,10 5.50 S. 09 5 .50 8 .08 13.00 5 .55 8. 15 5 .54 S, 14 5 .53 8 ,13 13.20 5 ,58 S. 19 5 .57 8 ,18 5 .56 8 ,17 13.40 5 .61 8 .23 5 ,60 8 ,23 5 .59 3 .22 13.60 5 .64 8 .28 5 .63 8 .27 5 . 6 2 8 .26 13,80 5 .67 8 .32 5 ,66 8 ,31 5 .65 8 ,30 14, 00 5 .70 8 ,36 5 .69 8 .35 5 ,68 9 .35 14 ,20 5 .73 3 .4 0 5 ,72 8 .40 5 .71 8 .39 14,40 5 .76 8 .45 5 ,75 8 .44 5 .74 8 .43 14 ,60 5 .79 8 ,49 5 ,78 8 .43 5 .77 8 .47 14.80 5 .82 8 .53 5 ,81 8 .52 5 .80 8 .51 15, 00 5 .85 8 .57 5,84 8 .56 5 .33 8 .55 15 .50 5 .92 8 .66 5 .91 8 .65 5 .90 8 .65 16 .00 5 .98 8 ,76 5 ,97 8 .75 5 .97 8 .74 16.50 6 .05 8 .85 6 . 04 8 .84 6 .03 8 .83 17,00 6 ,11 8 .94 6 . 10 8 .93 6 ,09 8 .92 17.50 6 .17 9 .02 6 . 16 9.01 6 . 15 9 .00 18.00 6 ,23 9 ,10 6 .22 9 .10 6 ,21 9 .09 18.50 6 ,29 9 .19 6 .28 9 .18 6 . 2 7 9 .17 19.00 6 .35 9 .26 6 .34 9 ,26 6 .33 9 ,25 19.50 6 .40 9 .34 6 .39 9 ,33 6 .38 9 ,32 20 ,00 6 ,45 9 .42 6 .45 9 ,41 6 .44 9 .40 2 0 . 5 0 6 .51 9 ,49 6 ,50 9 ,48 6 ,49 9 .47 21 .00 6 ,56 9. 56 6 .55 9 ,55 6 .54 9 .54 21 .50 6 ,61 9 ,63 6 .60 9 ,62 6 .59 9.61 2 2 . 0 0 6 ,66 9 ,70 6 ,65 9 ,69 6 .64 9 ,68 22 .50 6 , 7 0 9 ,77 6 .70 9 .76 6 .69 9 .75 23 . 00 6 .75 9 ,83 6.74 9 .32 6 .73 9 .32 2 3 . 5 0 6 ,80 9 .90 6 .79 9 .39 6 .73 9 .83 2 4 . 0 0 6 .84 9 ,96 6 .83 9, 95 6 .82 9 ,94 2 4 . 5 0 6 .88 1 0. 02 6 .83 10.01 6 .87 10.00 2 5 . 00 6 ,93 10.08 6 .92 10. 07 6.91 10. 06
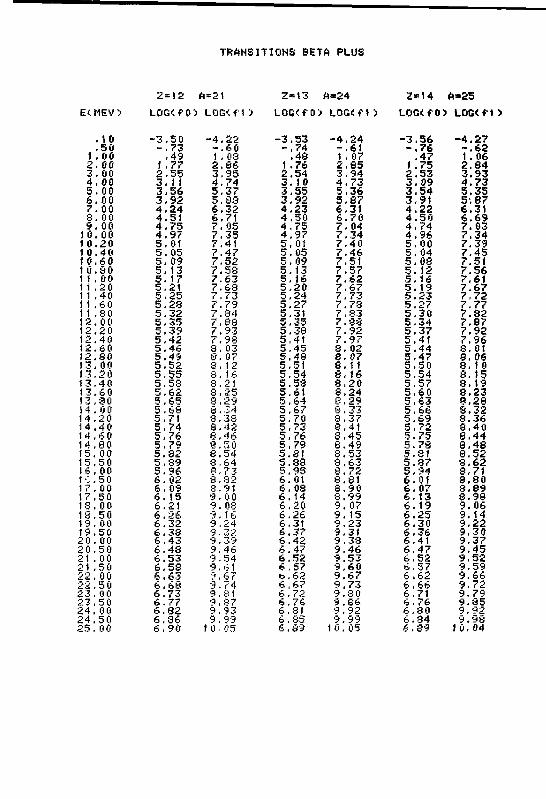
TRANSIT
2=12 A=21 E<NEV> LOG<f O'J LQG<f 1 )
. 10 - 3 . 5 0 - 4 . 2 2
. 5 0 - . 7 3 - . 6 0 1 .00 . 4 9 1 . 03 2 . 0 0 1 .77 2 .86 3 .00 2 . 5 5 3 .95 4 . 0 0 3 . 11 4 ,74 5 .00 3 .56 5, 37 6 , 0 0 3 . 9 2 5 ,38 7 .00 4 , 2 4 6 .32 8 . 0 0 4 .51 6 .71 9 ,00 4 . 7 5 7 .05
10 .00 4 . 9 7 7 .35 10 .20 5 .01 7 .41 10 .40 5 .05 7 .47 10 .60 5 .09 7 ,52 1 0 .80 5 .13 7 .58 11 ,00 5 .17 7 .63 1 1 ,20 5 .21 7 . 68 1 1 ,40 5 , 2 5 7 ,73 11 ,60 5 .28 7 ,79 1 1 .80 5 .32 7 .84 12.00 5 .35 7 .88 12.20 5 ,39 7 .93 12.40 5 .42 7 .98 12.60 5 .46 3, 03 12 .80 5 .49 8 , 07 13, 00 5 .52 8 ,12 13 ,20 5 .55 8 . 16 13,40 5 .58 3 ,21 13,60 5 , 6 2 8 ,25 13,80 5 .65 3 ,29 14.00 5 .68 8 .34 14.20 5 .71 8 ,38 14.40 5 .74 3 .42 14 ,60 5 .76 8 ,46 14,80 5 .79 8 ,50 15. 00 5 .82 8 .54 15.50 5 .89 3 .64 16 .00 5 .96 3 ,73 1-:.50 6 . 02 8 .82 17.00 6 .09 8.91 17.50 6 . 15 9 .00 I S . 00 6 .21 9 . (18 18 ,50 6 .26 9 .16 19, 00 6 .32 9,24 19 .50 6 . 3 8 9 . 32 2 0 . 00 6 .43 9 .39 2 0.50 6 , 4 8 9. 46 21 . 00 6 .53 9 .54 21 .50 6 .53 9 .61 2 2 , 00 6 .63 9 ,67 2 2 . 5 0 6 . 6 8 9.74 2 3 , 0 0 6 .73 9 .81 23 ,50 6 , 77 9 .87 2 4 , 00 6 , 8 2 9 ,93 24 .50 6 ,36 9 . 99 2 5 . 0 0 6 , 9 0 1 0 . 05
OHS BETA PLUS
2=13 ft=24 2=14 A*25 LOC<fO> L O G c f O LOC<fO> LOG<f1>
- 3 . 5 3 - 4 . 2 4 - 3 . 5 6 - 4 . 2 7 - . 7 4 - . 6 1 - . 7 6 - . 6 2
. 4 8 1 .07 . 4 7 1 . 06 1 ,76 2 , 8 5 1.75 2 . 8 4 2 .54 3 ,94 2 .53 3 .93 3 .10 4 . 7 3 3 .09 4 . 7 3 3 ,55 5 ,36 3 ,54 5 .35 3 .92 5 .87 3 ,91 5 .87 4 .23 6 .31 4 .22 6 .31 4 ,50 6 .70 4 .50 6 . 6 9 4 ,75 7 .04 4 , 7 4 7 .03 4 .97 7 .34 4 .96 7 .34 5 ,01 7 .40 5 .00 7 .39 5 .05 7 .46 5 .04 7 .45 5 . >19 7 .51 5 .08 7.51 5 .13 7 .57 5 .12 7 .56 5 .16 7 .62 5 .16 7.61 5 .20 7 .67 5 . i 9 7 .67 5 .24 7 .73 5 .23 7 ,72 5 .27 7 .78 5 .27 7 ,77 5.31 7 .33 5 .30 7 .82 5 ,35 7 .33 5 . 3 4 7 .87 5 ,33 7 .92 5 ,37 7 .92 5 ,41 7 .97 5 .41 7 .96 5 .45 8. 02 5 .44 3. 01 5 ,43 8 . 07 5 .47 3 ,06 5 ,51 8 .11 5 .50 8. 10 5 ,54 8 .16 5 .54 8 .15 5,53 8 .20 5 .57 3 .19 5 .61 8 .24 5 , 6 0 3 .23 5,64 8 ,29 5 ,63 3 .28 5 .67 8. 33 5 .66 8 .32 5 .70 3 .37 5 .69 8 .36 5 ,73 3 .41 5 .72 8 .40 5 ,76 3 ,45 5 .75 8 ,44 5 ,79 8 .49 5 .78 8 ,48 5 .31 8 .53 5 .81 8 .52 5 .33 8 ,63 5 .37 8 ,62 5 .95 8 , 7 2 5 .94 8 .71 6.01 8 ,81 6 .01 8 .80 6 .08 8 .90 6 .07 8 .89 6 , 14 8 .99 6 .13 3 .98 6 ,20 9. 07 6 .19 9 .06 6 .26 9 .15 6 .25 9 .14 6,31 9 .23 6 .30 9 ,22 6 .37 9 ,31 6 .36 9 ,30 6 .42 9 ,33 6 .41 9 .37 6 .47 9 ,46 6 .47 9 .45 6 .52 9 .53 6 ,52 9 ,52 6 .57 9 .60 6 ,57 9 .59 ( j . 62 9 .67 6 .62 9 .66 6 , 67 9 .73 6 , 6 6 9 .72 6,72 9 .30 6 ,71 9.79 6 ,76 9 .86 6 .76 9 .35 6 ,81 9 .92 6 .80 9 ,92 6 ,8s 9 .99 6 .34 9 .98 6 .89 10 .05 6 .39 10.04
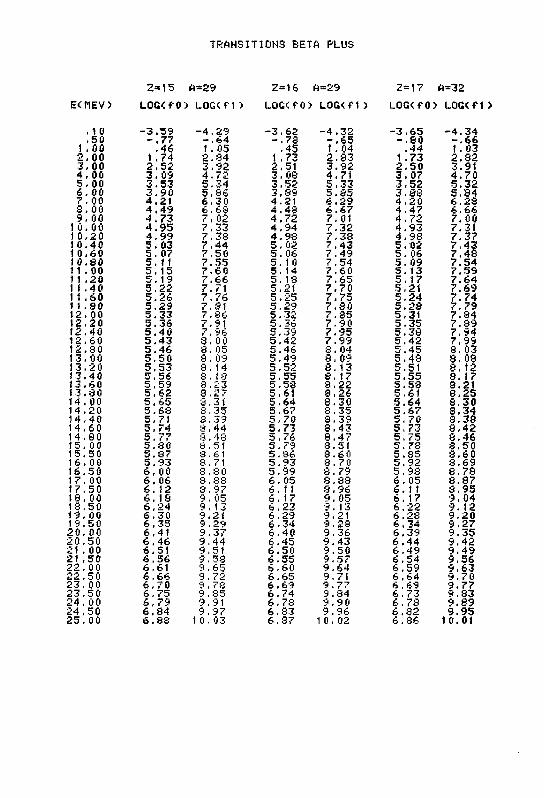
TRANSIT
2="= 15 A=29
E<I1EV> LOG<f0) LOG<f1>
, 10 - 3 . S 9 - 4 . 2 9 . 5 0 - . 7 7 - . 6 4
1 .00 . 4 6 1 .05 2 , 0 0 1 .74 2 .84 3 .00 2 .52 3 ,92 4 , 0 0 3 .09 4 ,72 5 ,00 3 .53 5 ,34 6 , 0 0 3 . 9 0 5 ,86 7 ,00 4 .21 6 .30 3 .00 4 , 4 9 6 . 68 8 . 0 0 4 . 7 3 7, 02
1Û.00 4 . 9 5 7 .33 10,20 4 , 9 9 7 ,38 10 ,40 5 .03 7 ,44 10 ,60 5 .07 7 ,50 10 .80 5 .11 7 .55 11 .00 5 . 15 7 .60 1 1 .20 5 .19 7 .66 1 1 .40 5 , 2 2 7.71 11 .60 5 .26 7 .76 1 1 .80 5 .29 7 .81 12, 00 5 .33 7 .86 12,20 5 ,36 7,91 12 .40 5 . 4 0 7 ,96 12 .60 5 .43 3, 00 12 .80 5 .46 8 . 05 13,00 5 . 5 0 8, 09 13.20 5 ,53 8, 14 13 ,40 5 .56 8 .18 13.60 5 ,59 3 ,23 13.30 5 .62 3 .27 14 .00 5 . 6 5 8 ,31 14.20 5 ,68 8 .35 14 .40 5 .71 3 .39 14 .60 5 .74 8 .44 14.80 5 .77 8 .48 15. 00 5 . 3 0 8 .51 15.50 5 .87 8.61 16. 00 5 .93 8.71 16.50 6 ,00 3 .80 17 .00 6 . 06 8 . ;r<3 17 .50 6 . 12 8 .97 18.00 6 . IS 9. 05 13,50 6 . 2 4 9. 13 19, 00 6 . 3 0 9 .21 19,50 6 ,35 9 ,29 2 0 . 0 0 6 ,41 9 ,37 20 .50 6 .46 9 ,44 21 . 00 6 .51 9 .51 21 .50 6 , 5 6 9 .58 2 2 , 00 6 ,61 9 .65 22 ,50 6 ,66 9 . 72 23 . 0 0 6 .70 9 . 78 2 3 . 5 0 6 .75 9 .85 2 4 , 0 0 6 ,79 9 ,91 2 4 . 5 0 6 .84 9, 97 2 5 , 0 0 6 .88 10, 03
10HS BETA PLUS
2=16 A=29 2=17 A=32
LQG<f0> LOG<f1> LOG<fO> LOG<f1>
- 3 . 6 2 - 4 . 3 2 - 3 . 6 5 - 4 , 3 4 - . 7 8 - . 6 5 - . 8 0 - . 6 6
. 4 5 1.04 . 4 4 1.03 1 ,73 2 .83 1 .73 2 .82 2.51 3 .92 2 .50 3 .91 3 .08 4 .71 3 .07 4 .70 3,52 5 .33 3 .52 5 .32 3 ,89 5 .85 3 .83 5.-84 4 .21 6 .29 4 .20 6 .28 4 .48 6 ,67 4 .47 6 .66 4 . 7 2 7.01 4 . 7 2 7 .00 4 ,94 7 .32 4 ,93 7.31 4 .98 7 .33 4 . 9 8 7 .37 5 .02 7 ,43 5 .02 7 .43 5 . 06 7 ,49 5 . 06 7 ,48 5 .10 7 .54 5 .09 7 .54 5 . 14 7 .60 5 . 13 7.59 5. 13 7 .65 5 .17 7 .64 5 ,21 7 .70 5 ,21 7 .69 5 .25 7 ,75 5 ,24 7.74 5 .29 7 .80 5 .28 7 .79 5 .32 7 .35 5 .31 7.34 5 .36 7 .90 5 .35 7 .89 5 ,39 7 .95 5 .38 7 .94 5 .42 7 .99 5 .42 7.99 5 .46 8 . 04 5 .45 3 ,03 5 .49 8 .09 5 .48 8 ,08 5 .52 8. 13 5 .51 8 ,12 5 .55 8 . 17 5 .55 8, 17 5 .58 3 .22 5 .53 3.21 5 .61 3 .26 5 .61 8 .25 5 .64 8 . 3 0 5 .64 8 ,30 5 .67 8 .35 5 .67 8 .34 5 .70 8 ,39 5 . 7 0 3 .38 5 .73 8 ,43 5 ,73 8 .42 5 ,76 8 ,47 5 ,75 8 .46 5 .79 3 .51 5 .78 3 .50 5 .36 8 .60 5 .85 3 ,60 5 .93 8 .7 0 5 .92 8 ,69 5 .99 8 .79 5 .98 8 .78 6 ,05 8 .38 6 .05 8 .87 6,11 8 .96 6 .11 8 .95 6 . 17 9. 05 6 . 17 9 .04 6 ,23 9 .13 6 .22 9 .12 6 .29 9 .21 6 .28 9 .20 6 .34 9 .28 6 .34 9 ,27 6 .40 9 .36 6 ,39 9 ,35 6 .45 9 .43 6 .44 9 .42 6 .50 9 .50 6 .49 9 .49 6 .55 9 .57 6 .54 9 ,56 6 .60 9 .64 6 ,59 9 .63 6 .65 9 , 7 i 6 .64 9 .70 6 .69 9 .77 6 .69 9 .77 6 .74 9 .84 6 . 73 9 ,83 6 .73 9 ,90 6 ,78 9 ,89 6 .83 9 .96 6 ,82 9 .95 6 .87 1 0. 02 6 .36 10.01

TRANSITIONS BETA PLUS
2 - 1 8 A=34 Z=19 A=3? 2=20 A-38 E<MEV) LOG<fO) L O G t f 1 ) LOG<f0> LOG< f i> LOG(fO) LOGCfl)
. 10 - 3 . 6 8 - 4 . 3 6 - 3 , 7 1 - 4 . 3 8 - 3 . 7 3 - 4 . 4 1 , 5 0 - , 8 1 - . 6 8 - . 8 2 - . 6 9 - . 8 4 - . 7 0
1 ,00 , 4 3 1.02 , 4 2 1 .01 . 4 1 1.00 2 , 0 0 1 .72 2.81 1 ,71 2 .80 1 .70 2 .79 3 . 0 0 2 .50 3 .90 2 .49 3 .89 2 .48 3 .88 4 . 00 3 .06 4 .69 3 ,05 4 . 6 8 3.C5 4 ,67 5 ,00 3 ,51 5 .31 3 .50 5 .31 3 ,49 5 ,30 6 . 0 0 3 .88 5 .83 3 .87 5 .82 3 .86 5 .82 7 .00 4 , 1 9 6 .27 4 .18 6 .26 4 , 1 8 6 .26 8 ,00 4 ,46 6 .66 4 .46 6 .65 4 , 4 5 6 .64 9 , 0 0 4 . 7 1 7. 00 4 , 7 0 6 .99 4 . 6 9 6 ,98
10 .00 4 . 9 3 7 ,30 4 .92 7 .29 4 .91 7 .29 10 .20 4 . 9 7 7 .36 4 .96 7 .35 4 . 9 5 7 .34 10 .40 5 . 01 7 .42 5 .00 7.41 4 . 9 9 7 ,40 10 .60 5 ,05 7 .47 5 .04 7 .46 5 . 0 3 7 .46 10 .80 5 .09 7 .53 5 .08 7 ,52 5 .07 7.51 11 ,00 5 .12 7 ,58 5 .12 7 .57 5 ,11 7 .56 1 i .20 5 .16 7.6-i 5 .15 7 .62 5 . 1 5 7 ,62 1 1 .40 5 .20 7 .68 5 .19 7 .68 5 .18 7 .67 1 1 .60 5 .24 7 ,74 5 ,23 7 .73 5 .22 7 ,72 1 1 ,80 5 .27 7 .79 5 .26 7 .78 5 .26 7 .77 12.00 5.31 7. S3 5 .30 7 .83 5 .29 7 .82 12 .20 5 ,34 7 ,88 5 ,33 7 .87 5 .33 7 ,87 12.40 5 .37 7 .93 5 .37 7 .92 5 .36 7.91 12 ,60 5 .41 7 ,98 5 .40 7 .97 5 .39 7 .96 12,80 5 ,44 8 .02 5 .43 8 .02 5 .43 8.01 13, 00 5 .47 8 . 07 5 .47 8 .06 5 ,46 8 .05 13 .20 5 .51 8. 11 5 .50 8 ,11 5 . 4 9 8 .10 13.40 5 .54 8 ,16 5 .53 8 .15 5 ,52 8. 14 13 .60 5 ,57 8 , 2 0 5 .56 8 .19 5 ,55 8 . 1 9 13,80 5 .60 8,24 5 ,59 8 ,24 5 .58 8 .23 14 ,00 5 ,63 8 ,29 5 .62 8 .28 5.61 8 .27 14 ,20 5 ,66 8 .33 5.65 3 .32 5 .64 8.31 14.40 5 .69 8 .37 5 .68 8 .36 5 .67 8 .35 14 .60 5 .72 8 .41 5 .71 8 , 4 0 5 .70 8 ,39 14 .80 5 .75 8 .45 5 ,74 8 ,44 5 .73 8 .43 15. 00 5 .77 8 . 4 9 5 ,77 8 ,48 5 .76 8 ,47 15 .50 5 .84 8 ,59 5 .84 8 .58 5 .83 8 .57 16 .00 5 .91 8 .68 5 .90 8 ,67 5 ,90 8 .66 16 .50 5 .98 8 .77 5 .97 8 . 7 6 5 .96 8 .76 17. 00 6. 04 8 ,36 6 .03 8 .85 6 .02 3.84 17 .50 6 . 10 8 .95 6 .09 8 .94 6 .03 8 .93 13,00 6 .16 9, 03 6 .15 9, 02 6 ,14 9.01 18.50 6 ,22 9.11 6.21 9 .1 0 6 .20 9 .09 19 .00 6 , 2 7 9 .19 6 .27 9 ,18 6 . 2 6 9 . 1 7 19.50 6 .33 9 ,27 6 .32 9 .26 6 ,31 9 .25 2 0.00 6 ,38 9 .34 6 ,37 9 .33 6 .37 9 .33 2 0 . 5 0 6 ,43 9.41 6 .43 9.41 6 .42 9 .40 21 . 00 6 .49 9 .49 6 .48 9 .43 6 .47 9 .47 21 .50 6 .54 9 .56 6 ,53 9 .55 6 . 5 2 9 .54 2 2 , 0 0 6 .58 9 .62 6 ,58 9 ,62 6 .57 9.61 2 2 , 5 0 6 .63 9 .69 6 .62 9 ,68 6 . 6 2 9 .68 2 3 . 0 0 6 .68 9 . 76 6 .67 9 .75 6 .66 9 .74 2 3 , 5 0 6 .72 9 ,82 6 .72 9.81 6.71 9.31 24 ,00 6 .77 9 .88 6 .76 9 . 8 8 6 .75 9 .37 24 .50 6 .81 9 .95 6,81 9 .94 6 .80 9 .93 2 5 . 0 0 6 .86 10.01 6 .85 10. 00 6 .34 9 .99
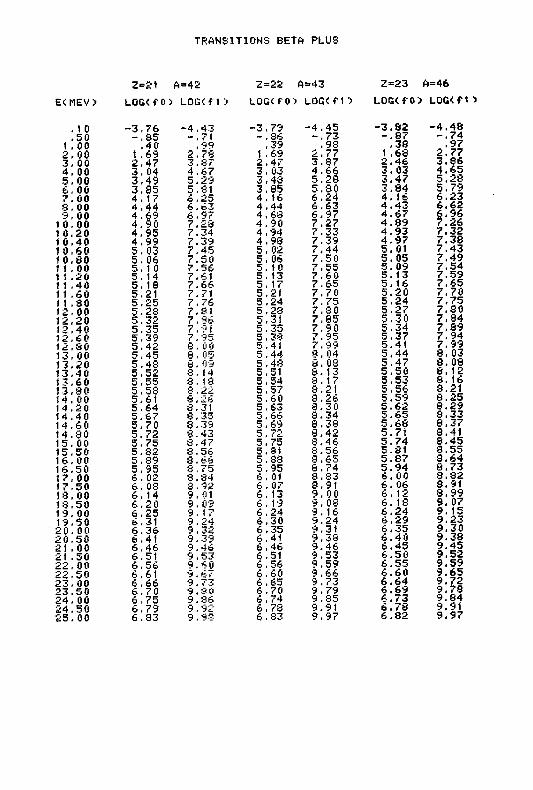
TRANSITIONS BETA PLUS
2=21 A=42 2=22 A=43 2=23 A=46 E<MEV> LOG<fO) LOG<fl; LOG<fO) LOG<fi:> LOG(fO) LOG<ft>
. 1 0 -3,76 -4,43 -3,79 -4.45 -3.82 -4,48
.50 -.85 -.71 -.86 -.73 -.87 -.74 1 . 00 ,40 ,99 .39 ,93 .38 ,97 2.00 1 ,69 2.78 1 .69 2,77 1 .68 2.77 3. 00 2,47 3.87 2.47 3,87 2.46 3.86 4, 00 3. 04 4.67 3.03 4.66 3.03 4.65 5.00 3,49 5.29 3.48 5,28 3.47 5.28 6,00 3,85 5,SI 3.85 5.80 3.84 5.79 7. 00 4, 17 6.25 4. 16 6.24 4. 16 6.23 3, 00 4,44 6.63 4.44 6.63 4.43 6.62 9.00 4,69 6,97 4,68 6.97 4.67 6.96 1 0. 00 4.90 7.28 4.90 7.27 4.89 7.26 10.20 4,95 7.34 4,94 7.33 4.93 7,32 1 0,40 4.99 7.39 4.98 7.39 4.97 7,38 1 0,60 5,03 7,45 5.02 7.44 5.01 7.43 1 0.80 5.06 7.50 5,06 7.50 5.05 7,49 1 1 . 00 5, 10 7.56 5. 10 7.55 5.09 7,54 1 1 .20 5. 14 7,61 5, 13 7,60 5.13 7.59 1 1 ,40 5. 18 7.66 5,17 7.65 5,16 7.65 1 1 ,60 5.21 7.71 5,21 7.70 5.20 7,70 1 1 ,30 5.25 7.76 5.24 7,75 5.24 7,75 12, 00 5.28 7.81 5,28 7,80 5.27 7.80 12,20 5.32 7.86 5.31 7,85 5,30 7.84 12,40 5.35 7.91 5.35 7.90 5.34 7.39 12.60 5.39 7.95 5.38 7,95 5.37 7.94 12,30 5.42 8.0 0 5.41 7.99 5.41 7.99 13,00 5,45 8, 0 5 5.44 8, 04 5,44 3, 03 13.20 5,48 8. 09 5.48 8. 08 5.47 8.08 13.40 5.52 8,14 5,51 8. 13 5.50 8. 12 13.60 5.55 8.18 5,54 8.17 5.53 3. 16 13,80 5,53 3,22 5,57 8.21 5.56 3,21 14.00 5,61 8.26 5,60 3.26 5.59 8,25 14.20 5.64 8.31 5.63 8.30 5.62 8.29 14,40 5.67 8, 35 5,66 8,34 5.65 3.33 14,60 5,70 8.39 5,69 8.33 5.68 8,37 14.80 5.72 8.43 5,72 8.42 5.71 3.41 15.00 5.75 8.47 5.75 8.46 5.74 8.45 15.50 5.82 8.56 5.31 8.56 5.81 8.55 16, 00 5.89 8.66 5,88 3,65 5.87 8.64 16.50 5.95 3,75 5.95 8.74 5.94 8,73 17, 00 6. 02 8.84 6. 01 8.83 6.00 8.82 17,50 6. 08 3.92 6.07 8.91 6.06 8.91 18,00 6. 14 9.01 6,13 9.00 6.12 8,99 18.50 6,20 9. 09 6,19 9, 08 6.18 9, 07 19, 00 6,25 9.17 6,24 9.16 6.24 9, 15 19,50 6,31 9,24 6.30 9.24 6.29 9.23 2 0,00 6,36 9.32 6.35 9.31 6.35 9.30 20,50 6.41 9.39 6.41 9.38 6.40 9.38 21 , 00 6,46 9.46 6.46 9.46 6,45 9.45 21 .50 6,51 9.53 6.51 9.53 6,50 9.52 22,00 6,56 9.60 6.56 9.59 6.55 9.59 22,50 6.61 9.6/ 6,60 9.66 6.60 9.65 23, 00 6.66 9.73 6,65 9.73 6.64 9.72 23,50 6, 70 9. S 0 6,70 9.79 6,69 9.78 24, 00 6,75 9.flft 6,74 9.85 6,73 9.84 24.50 6,79 9,92 6,78 9.91 6 .78 9.91 25.00 6,83 9.98 6.83 9,97 6.82 9.97
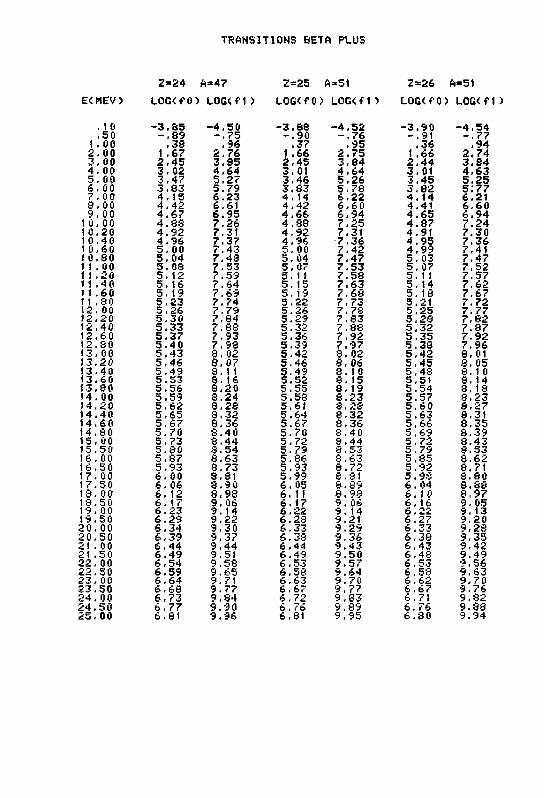
TRANSITIONS BETA PLUS
Z=»24 A=47 2=25 A=51 2=26 A»51 E<MEV> LOG<fO> LOGtf1> LOG<fO> LOG<fO LOG<f0) LOG<f 1 >
, 10 -3.85 -4.50 -3.88 -4,52 -3.90 -4.54 ,50 -.89 -.75 -.90 -.76 -.91 -.77 1 ,00 .38 .96 .37 ,95 .36 .94 2.00 1 .67 2.76 1 .66 2,75 1 .66 2.74
3,00 2.45 3.85 2.45 3.84 2,44 3.84 4,00 3.02 4.64 3.01 4.64 3,01 4.63 5,00 3,47 5.27 3.46 5.26 3,45 5.25 6,00 3.83 5.79 3.83 5.78 3.82 5:77 7.00 4.15 6.23 4. 14 6.22 4.14 6.21 3. 00 4.42 6.61 4.42 6.60 4.41 6.60 9.00 4.67 6.95 4.66 6.94 4.65 6,94 10-00 4.8S 7.26 4.83 7.25 4.87 7.24 10,20 4.92 7.31 4,92 7.31 4.91 7.30 10.40 4.96 7.37 4.96 7.36 4.95 7.36 10,60 5.00 7.43 5.00 7.42 4,99 7.41 10.SO 5.04 7.48 5,04 7.47 5.03 7.47 11.00 5.08 7.53 5.07 7.53 5.07 7,52 11 ,20 5.12 7.59 5.11 7.58 5. 11 7.57 11 ,40 5,16 7.64 5.15 7,63 5.14 7,62 11 .60 5,19 7,69 5.19 7.68 5.13 7,67 1 1 ,30 5.23 7.74 5,22 7.73 5.21 7.72 12, 00 5.26 7.79 5,26 7. 78 5.25 7.77 12,20 5.30 7.84 5,29 7,83 5,28 7,82 12.40 5.33 7.83 5.32 7.88 5.32 7.87 12.60 5,37 7,93 5.36 7.92 5,35 7.92 12.30 5,40 7.98 5,39 7.97 5,33 7.96 13,00 5,43 8,02 5,42 8.02 5,42 8.01 13.20 5.46 8.07 5.46 3.06 5,45 3.05 13.40 5.49 8.11 5.49 8. 10 5,48 8. 10 13.60 5.53 8. 16 5.52 3. 15 5.51 8. 14 13,80 5.56 8.20 5.55 8. 19 5.54 3, 18 14.00 5.59 8.24 5.53 3.23 5.57 8.23 14.20 5.62 8.28 5.61 3,23 5,60 8.27 14.40 5-65 8,32 5.64 3.32 5.63 8.31 14.60 5.67 8.36 5.67 8,36 5,66 8.35 14.80 5.70 8.40 5.70 8,40 5,69 8.39 15.00 5.73 8,44 5.72 8.44 5,72 8.43 15.50 5.80 8.54 5.79 8.53 5,79 8.53 16,00 5.87 8.63 5.86 8.63 5.85 8.62 16.50 5.93 8.73 5.93 8.72 5.92 8.71 17.00 6.00 3.31 5.99 8.81 5.93 8,80 17,50 6.06 8.90 6.05 8.39 6.04 3,88 13.00 6.12 8.98 6,11 8.98 6.10 8,97 18-50 6.17 9. 06 6.17 9.06 6.16 9,05 19. 00 6.23 9. 14 6.22 9. 14 6.22 9.13 19.50 6.29 9.22 6,28 9.21 6.27 9,20 20.00 6.34 9,30 6,33 9.29 6.33 9,28 20.50 6,39 9.37 6.38 9,36 6,38 9,35 21 . 00 6.44 9,44 6.44 9.43 6,43 9.42 21 .50 6.49 9,51 6.49 9.50 6.48 9.49 22,00 6.54 9.58 6.53 9.57 6,53 9.56 22.50 6.59 9.65 6.58 9.64 6,58 9.63 23.00 6-64 9.71 6.63 9.70 6.62 9.70 23,50 6.68 9,77 6,67 9.77 6.67 9.76 24, 00 6.73 9.84 6,72 9.83 6.71 9,32 24.50 6.77 9.90 6. 76 9,89 6.76 9.83 25. 00 6.81 9.96 6.81 9.95 6.30 9.94
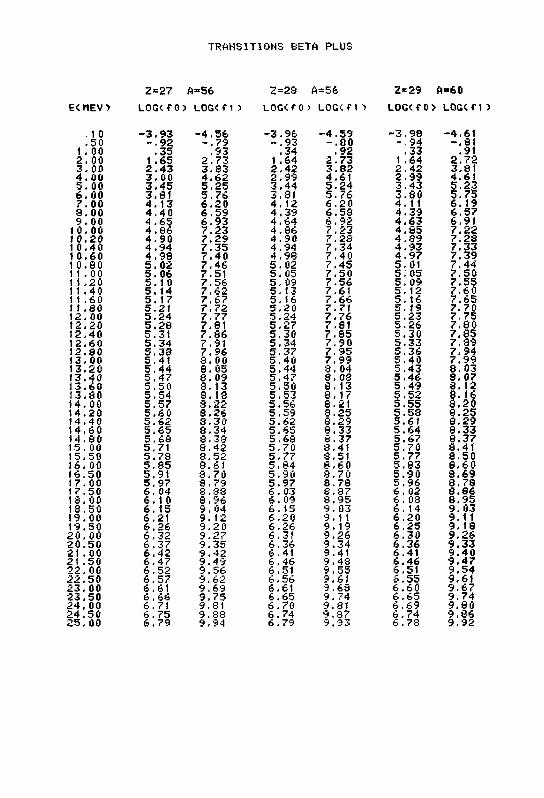
TRANSITIONS BETA PLUS
2 = 2 ? A=56 Z = 2 8 A=56 2 = 2 9 A * 6 0
E<MEV> LOG<fO) L O G < f O UOGtfOJ L O G C f t l L O G ( f O ) LOG<f1>
. 10 - 3 . 9 3 - 4 , 5 6 - 3 . 9 6 - 4 . 5 9 - 3 . 9 8 - 4 . 6 1
. 5 0 - . 9 2 - . 7 9 - . 9 3 - . 8 0 - 9 4 - . 8 1 1 . 0 0 . 3 5 . 9 3 . 3 4 , 9 2 . 3 3 . 9 1 2 . 0 0 1 . 6 5 2 . 7 3 1 . 6 4 2 . 7 3 1 , 6 4 2 . 7 2 3 . 0 0 2 . 4 3 3 . 8 3 2 . 4 2 3 . 8 2 2 . 4 2 3 . 8 1 4 . 00 3 . 0 0 4 . 6 2 2 . 9 9 4 . 6 1 2 . 9 9 4 . 6 1 5 . 0 0 3 . 4 5 5 , 2 5 3 . 4 4 5 . 2 4 3 . 4 3 5 . 2 3 6 . 0 0 3 . 8 1 5 , 7 6 3 . 8 1 5 . 7 6 3 . 8 0 5 . 7 5 7 . 0 0 4 . 13 6 . 2 0 4 . 1 2 6 . 2 0 4 . 1 1 6 . 1 9 9 . 0 0 4 , 4 0 6 . 5 9 4 , 3 9 6 . 5 8 4 . 3 9 6 . 5 7 9 , 0 0 4 . 6 5 6 . 9 3 4 . 6 4 6 . 9 2 4 . 6 3 6 , 9 1
1 0 . 0 0 4 . 8 6 7 . 2 3 4 . 8 6 7 . 2 3 4 . 8 5 7 . 2 2 1 0 . 2 0 4 . 9 0 7 . 2 9 4 . 9 0 7 . 2 8 4 . 8 9 7 . 2 8 1 0 . 4 0 4 . 9 4 7 . 3 5 4 . 9 4 7 . 3 4 4 . 9 3 7 . 3 3 1 0 . 6 0 4 . 9 8 7 . 4 0 4 . 9 8 7 , 4 0 4 . 9 7 7 . 3 9 1 0 . S O 5 . 0 2 7 . 4 6 5 . 0 2 7 . 4 5 5 . 0 1 7 . 4 4 11 . 0 0 5 . 0 6 7 . 5 1 5 . 0 5 7 . 5 0 5 1 0 5 7 . 5 0 11 . 2 0 5 . 1 0 7 . 5 6 5 . 09 7 . 5 6 5 . 09 7 . 5 5 11 . 4 0 5 . 1 4 7 . 6 2 5 . 1 3 7 . 6 1 5 . 1 2 7 . 6 0 1 1 . 6 0 5 . 1 7 7 . 6 7 5 . 16 7 . 6 6 5 . 1 6 7 . 6 5 1 1 .SO 5 . 2 1 7 . 7 2 5 . 2 0 7 . 7 1 5 . 1 9 7 . 7 0 1 2 . 00 5 . 2 4 7 . 7 7 5 . 2 4 7 . 7 6 5 . 2 3 7 . 7 5 1 2 . 2 0 5 . 2 8 7 . 8 1 5 . 2 7 7 , 8 1 5 . 2 6 7 . 8 0 1 2 , 4 0 5 . 3 1 7 , 8 6 5 . 3 0 7 , 8 5 5 . 3 0 7 . 8 5 1 2 . 6 0 5 . 3 4 7 , 9 1 5 . 3 4 7 . 9 0 5 . 3 3 7 . 3 9 1 2 . 8 0 5 . 3 3 7 , 9 6 5 . 3 7 7 . 9 5 5 . 3 6 7 . 9 4 1 3 . 0 0 5 , 4 1 8 . 0 0 5 . 4 0 7 , 9 9 5 , 4 0 7 . 9 9 1 3 . 2 0 5 , 4 4 8 . 0 5 5 . 4 4 8 . 0 4 5 . 4 3 8 . 0 3 1 3 . 4 0 5 . 4 7 8 . 0 9 5 . 4 7 8 . 0 8 5 . 4 6 8 . 0 7 1 3 . 6 0 5 , 5 0 3 . 1 3 5 . 5 0 8 . 1 3 5 . 4 9 8 . 1 2 1 3 . 3 0 5 , 5 4 3 . 1 8 5 . 5 3 8 , 1 7 5 . 5 2 8 . 1 6 1 4 . 0 0 5 . 5 7 8 . 2 2 5 . 5 6 8 . 2 1 5 . 5 5 8 . 2 0 1 4 . 2 0 5 . 6 0 8 . 2 6 5 , 5 9 8 . 2 5 5 . 5 8 8 . 2 5 1 4 . 4 0 5 . 6 2 3 . 3 0 5 , 6 2 8 . 2 9 5 . 6 1 8 . 2 9 1 4 . 6 0 5 . 6 5 8 . 3 4 5 , 6 5 8 . 3 3 5 . 6 4 8 . 3 3 1 4 . 8 0 5 . 6 8 8 . 3 S 5 . 6 8 8 . 3 7 5 . 6 7 8 . 3 7 1 5 , 00 5 . 7 1 8 . 4 2 5 . 7 0 8 . 4 1 5 . 7 0 8 . 4 1 1 5 . 5 0 5 . 7 8 8 . 5 2 5 , 7 7 3 . 5 1 5 . 7 7 8 . 5 0 1 6 . 0 0 5 . 8 5 8 . 6 1 5 , 8 4 8 . 6 0 5 . 8 3 8 . 6 0 1 6 , 5 0 5 . 9 1 8 . 7 0 5 . 9 0 8 . 7 0 5 . 9 0 8 . 6 9 1 7 . 0 0 5 . 9 7 8 , 7 9 5 . 9 7 8 . 7 8 5 . 9 6 8 . 7 8 1 7 . 5 0 6 . 04 8 . 3 8 6 . 03 8 , 8 7 6 . 02 8 . 8 6 1 8 . 0 0 6 . 1 0 8 . 9 6 6 . 0 9 8 . 9 5 6 . 0 8 8 . 9 5 1 3 , 5 0 6 , 15 9 . 04 6 . 1 5 9 , 03 6 . 1 4 9 . 0 3 1 9 . 0 0 6 . 2 1 9 . 1 2 6 . 2 0 9 . 1 1 6 , 2 0 9 . 1 1 1 9 . 5 0 6 . 2 6 9 . 2 0 6 . 2 6 9 . 1 9 6 , 2 5 9 . 1 8 2 0 , 0 0 6 . 3 2 9 . 2 7 6 . 3 1 9 . 2 6 6 . 3 0 9 . 2 6 2 0 . 5 0 6 . 3 7 9 . 3 5 6 . 3 6 9 . 3 4 6 . 3 6 9 . 3 3 21 . 00 6 . 4 2 9 . 4 2 6 . 4 1 9 . 4 1 6 . 4 1 9 . 4 0 21 . 5 0 6 . 4 7 9 . 4 9 6 . 4 6 9 . 4 8 6 . 4 6 9 . 4 7 2 2 , 0 0 6 . 5 2 9 , 5 6 6 . 5 1 9 . 5 5 6 . 5 1 9 . 5 4 2 2 . 5 0 6 , 5 7 9 , 6 2 6 . 5 6 9 . 6 1 6 . 5 5 9 . 6 1 2 3 . 0 0 6 . 6 1 9 . 6 9 6 . 6 1 9 . 6 3 6 . 6 0 9 . 6 7 2 3 , 5 0 6 , 6 6 9 . 7 5 6 . 6 5 9 . 7 4 6 . 6 5 9 . 7 4 2 4 . 0 0 6 . 7 1 9 , 8 1 6 . 7 0 9 . 81 6 , 6 9 9 . 8 0 2 4 . 5 0 6 , 7 5 9 . 8 8 6 . 7 4 9 , 87 6 . 7 4 9 . 8 6 2 5 , 0 0 6 . 7 9 9 . 9 4 6 . 7 9 9 . 9 3 6 . 7 3 9 , 9 2
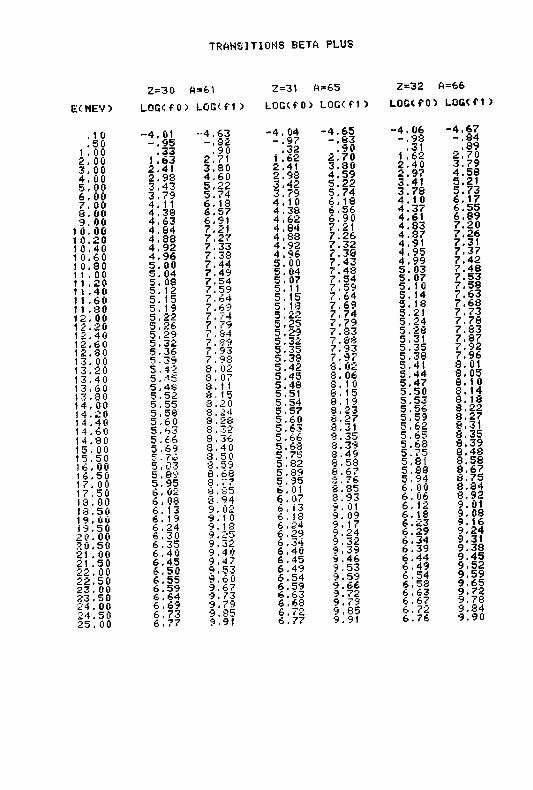
TRANSITIONS BETA PLUS
E< MEV >
10 , 5 0
1 , 00 2 . 00 3 , 00 4 . 00 5 , 00 6 . 00 7 . 00 8 . 00 9 , 00
1 0 , 00 1 0 . 2 0 1 0 , 40 1 0 . 60 1 0 . 8 0 1 1 , 00 1 1 . 20 1 1 . 40 1 1 . 60 11 . 80 1 2 . 00 1 2 , 20 1 2 , 40 1 2 , , 60 1 2 . , 30 1 3 , , 00 1 3 . , 2 0 1 3 , , 40 1 3 , , 6 0 13 , , 3 0 1 4 , , 0 0 14 , 2 0 14 , 4 0 14 , 6 0 14 . 8 0 15 . 0 0 15 . 5 0 16 , 0 0 16 . 5 0 17 . 0 0 17 . 5 0 IS . 0 0 18 . 5 0 19 , 00 19 , 5 0 2 0 . 0 0 20 . 5 0 21 . 0 0 21 . 5 0 2 2 . 0 0 2 2 . 5 0 23 . 00 23 . 5 0 24 . 0 0 24 . 5 0 25 . 0 0
Z=30 A=61 2=31 A=65 LOG<fO) LOG<f1> LOG<f0> LOG<f1>
-4.04 -4.65 -.97 -.83 .32 .90 1.62 2.70 2.41 3.80 2,98 4.59 3.42 5.22 3.79 5.74 4.10 6.18 4,38 6.56 4.62 6.90 4.84 7.21 4.83 7.26 4 .92 7 . 32 4.96 7.33 5.00 7.43 5.04 7.43 5.07 7.54 5.11 7.59 5,15 7.64 5.13 7,69 5.22 7.74 5.25 7,7* 5.29 7.33 5.32 7.88 5.35 7,93 5.33 7.97 5 . 42 8 . 0* 5.45 8,06 5.48 3.10 5,51 8.15 5.54 8.1 y 5.57 8.23 5.60 8.27 5.63 8,31 5.66 8.35 5,68 3.39 5.75 8.4y 5.82 8.58 5.89 8,67 5.95 3,76 6.01 a.35 6.07 8.93 6.13 9.01 6,18 9.09 6.24 9.17 6.29 y.24 6.34 9.32 6.40 9,3y 6.45 9.46 6.49 9,53 6.54 9.59 6.59 9.66 é.63 9.72 6,63 9.7y ,.„„ 6.72 9.85 9,91 6.77 9.91
•4.01 - 4 , 6 3 - . 9 5 - . 3 2
. 3 3 , 9 0 1 .63 2 .71 2 .41 3 .30 2 .93 4 .60 3 .43 5 ,22 3 .79 5 .74 4 .11 6 . 13 4 . 3 8 6 .57 4 . 6 3 6 ,91 4 . 8 4 7.21 4 . 3 8 7 .27 4 ,92 7 .33 4 ,96 7 ,38 5 .00 7 .44 5 .04 7 .49 5 .08 7 .54 5 . 12 7 .59 5 .15 7 .64 5 .19 7 .69 5 ,22 7 .74 5 ,26 7 ,79 5 ,29 7 ,34 5 ,32 7 .39 5 ,36 7 .93 5-39 7 ,98 5 .42 3 ,02 5.-15 8. 07 5 .48 8 .1 1 5 .52 8, (5 5 .55 8.20 5 ,58 8.24 5 .60 8 ,28 5 ,63 3, 32 5 ,66 9. i 6 5 ,69 3 .40 5 .76 3 .5 0 5 .23 8 .59 5 . S*? 8. 68 5 .95 3.77 6 . 02 8 .35 6 .03 8 .94 6 . 13 9. 02 6 .19 9 .10 6 .24 9 .18 6 . 3 0 9 .25 6 .35 9.-S2 6 .40 9.4 0 6 .45 9 .47 6 .50 9 .53 6 .55 9 .60 6 .59 9 .67 6 .64 9 .73 6 ,69 9 ,79 6 .73 9 ,85
2=32 A=66 LOG<fO> LOG< f 1 >
- 4 . 0 6 - 4 . 6 7 - . 9 8 - . 8 4
. 3 1 , 8 9 1 .62 2 .70 2 .40 3 .79 2 , 9 7 4 .58 3 ,41 5 .21 3 .78 5 .73 4 .10 6 .17 4 .37 6 .55 4 .61 6 .89 4 .83 7 .20 4 . 8 7 7 .26 4 .91 7.31 4 . 9 5 7 .37 4 . 9 9 7 .42 5 .03 7 .48 5 .07 7 .53 5 . 1 0 7 .58 5 .14 7 .63 5 .18 7 .68 5 .21 7 .73 5 .24 7 ,78 5 .28 7 .83 5 ,31 7 .87 5 .35 7 .92 5 ,38 7.96 5 .41 3 .01 5 .44 3 .05 5 ,47 8. 10 5 .50 3 .14 5 .53 3. 18 5 .56 8 .22 5 .59 8 .27 5 ,62 8 .31 5 .65 8 .35 5 .68 8 .39 5 .75 8 .48 5 .81 8 .58 5 .88 8 .67 5 .94 8 .75 6 . 00 8 .84 6 . 06 8 .92 6 . 12 9 .01 6 . 18 9 .08 6 .23 9. 16 6 .29 9 .24 6 .34 9.31 6 .39 9 .38 6 .44 9 .45 6 .49 9 ,52 6 .54 9 .59 6 .53 9 .65 6 .63 9 .72 6 .67 9 ,78 6 .72 9 .84 6 .76 9 .90
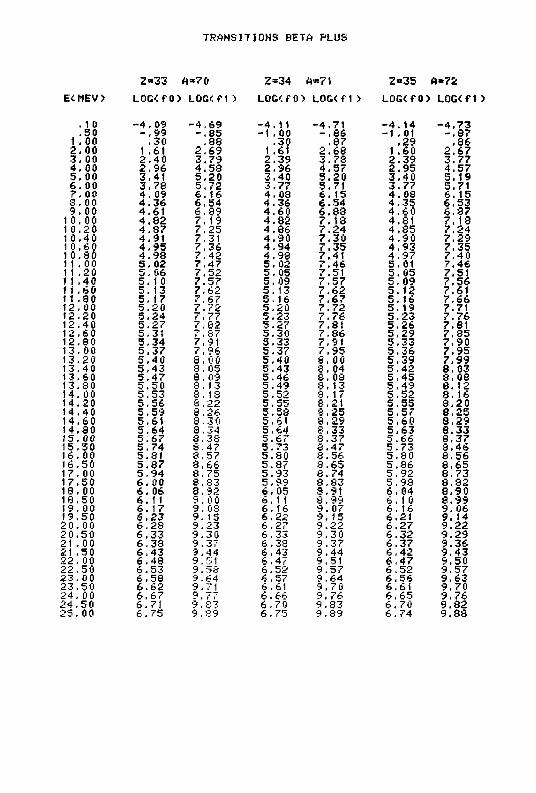
TRANSITIONS BETA PLUS
2*33 A*70 2=34 A<=71 2=35 < W 2 E<MEV> LOGKf 0> LOG< f 1 ; LOG<f0> LOG<f1> LOGff 0) LOG< f 1 )
. 1 0 -4.09 -4,69 -4.11 -4.71 -4.14 -4.73
.50 -.99 -.85 -1 .00 -.86 -1 .01 -.87 1 .00 ,30 .88 .30 .87 .29 .86 2.00 1 .61 2,69 1 .61 2.68 1 .60 2.67 3.00 2.40 3.79 2.39 3.73 2.39 3.77 4.00 2.96 4.58 2.96 4,57 2.95 4.57 5.00 3.41 5,20 3.40 5.20 3.40 5.19 6.00 3.78 5.72 3.77 5.71 3.77 5.71 7.00 4. 09 6,16 4.03 6. 15 4.08 6. 15 3.00 4.36 6,54 4.36 6.54 4.35 6.53 9,00 4.61 6,89 4.60 6.83 4.60 6.87
10.00 4.82 7,19 4.82 7.18 4.81 7.18 10.20 4.87 7.25 4.86 7.24 4.85 7.24 1 0.40 4,91 7.31 4.90 7.30 4.90 7.29 10.60 4,95 7.36 4,94 7.35 4.93 7.35 10.80 4.98 7.42 4.98 7.41 4.97 7.40 1 1 .00 5. 02 7.47 5.02 7.46 5.01 7.46 11 .20 5.06 7.52 5. 05 7.51 5.05 7.51 M .40 5, 10 7.57 5.09 7.57 5,09 7.56 11 .60 5.13 7.62 5.13 7.62 5.12 7.61 11 .80 5.17 7,67 5. 16 7.67 5.16 7.66 12, 00 5.20 7.72 5.20 7.72 5.19 7.71 12.20 5,24 7.77 5.23 7,76 5.23 7.76 12.40 5.27 7.82 5.27 7.81 5.26 7.81 12.60 5,31 7" w7" 5.30 7,86 5.29 7,85 12.80 5.34 7! 91 5.33 7,91 5.33 7.90 13.00 5.37 7,96 5.37 7,95 5.36 7,95 13.20 5.40 3,00 5.40 8.00 5.39 7.99 13.40 5.43 3, 05 5.43 3.04 5,42 8.03 13.60 5.47 8.09 5.46 8. 08 5.45 3.08 13.80 5,50 8,13 5.49 8,13 5.49 8.12 14.00 5,53 8.18 5.52 8,17 5.52 8, 16 14.20 5,56 8.22 5.55 8.21 5.55 3.20 14.40 5,59 3,26 5.53 8.25 5,57 8.25 14.60 5.61 8.30 5.61 3,29 5.60 8.29 14,80 5,64 8,34 5.64 8.33 5.63 8.33 15.00 5.67 3,33 5.67 8.37 5.66 8.37 15.50 5.74 8,47 5.73 8.47 5.73 3.46 16,00 5.81 8,57 5.80 8.56 5.80 8.56 16.50 5.87 8,66 5.87 8.65 5.86 8.65 17,00 5,94 8,75 5.93 8.74 5.92 8.73 17,50 6.00 3.83 5.99 8.83 5.93 8.82 18,00 6.06 8.92 6.05 8.91 6.04 8.90 18.50 6.11 9,0 0 6. 11 8.99 6.10 8.99 19.00 6. 17 9. 08 6. 16 9.07 6. 16 9. 06 19,50 6.23 9, 15 6.22 9.15 6.21 9. 14 20,00 6,28 9.23 6.27 9.22 6.27 9.22 20,50 6.33 9.30 6.33 9.30 6.32 9.29 21 .00 6.38 9.37 6.38 9.37 6.37 9.36 21 .50 6,43 9.44 6,43 9.44 6,42 9.43 22.00 6.43 9.51 6,47 9.51 6,47 9.50 22,50 6.53 9. 58 6.52 9 .57 6.52 9,57 23. 00 6.58 9.64 6,57 9,64 6.56 9,63 23.50 6.62 9.71 6. 61 9,7 0 6.61 9.70 24.00 6.67 9. 77 6,66 9, 76 6.65 9,76 24,50 6.71 9.'8 3 6.70 9,83 6.70 9.82 25,00 6.75 9 .8 9 6.75 9.89 6.74 9.38
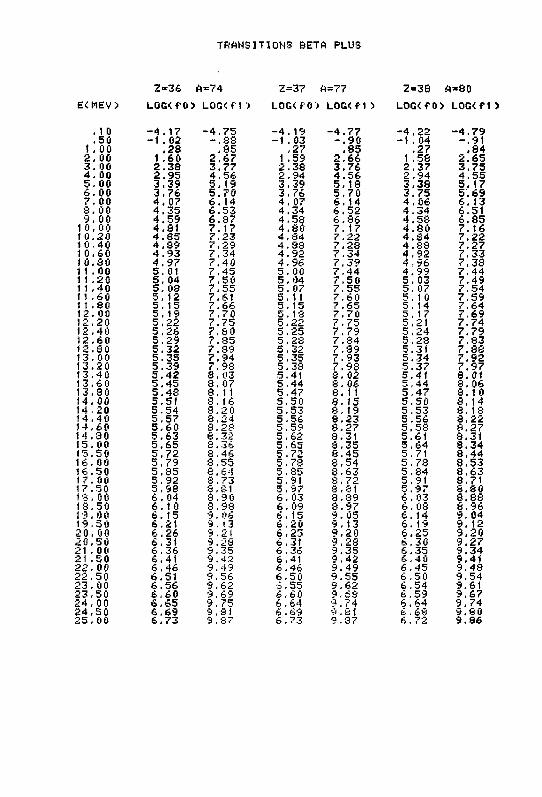
TRANSITIONS BETA PLUS
2«36 A=74 Z=37 A=77 2=38 G*80 E<MEV> LOG<f0> LOC<f1> LOG<fO) LOG<f1) LOG<fO> LOG<f1>
. 10 -4.17 -4.75 -4. 19 -4.77 -4.22 -4.79
.50 -1 .02 -.88 -1 ,03 -.90 -1 ,04 -.91 1 .00 .28 .85 ,27 .85 .27 .84 2,00 1 .60 2.67 1 .59 2.66 1 .58 2.65 3. 00 2.38 3.77 2.38 3.76 2.37 3.75 4. 00 2.95 4.56 2.94 4.56 2,94 4.55 5.00 3.39 5.19 3,39 5.13 3.38 5.17 6. 00 3.76 5.70 3.76 5.70 3.75 5.69 7.00 4.07 6. 14 4,07 6. 14 4.06 6. 13 8. 00 4.35 6.53 4,34 6.52 4.34 6.51 9,00 4.59 6.87 4,58 6.86 4.58 6.85 1 0. 00 4.81 7. 17 4,80 7.17 4.80 7.16 1 0.20 4.85 7.23 4,84 7.22 4.84 7.22 10. 40 4.89 7.29 4.88 7.28 4,88 7.27 10.60 4,93 7.34 4.92 7.34 4.92 7,33 10.SO 4.97 7.40 4.96 7,39 4,96 7.38 11.00 5.01 7,45 5.00 7.44 4.99 7.44 1 1 .20 5. 04 7,50 5.04 7.50 5.03 7.49 1 1 .40 5.08 7.55 5.07 7,55 5.07 7.54 1 1 ,60 5. 12 7,61 5.11 7.60 5, 10 7.59 1 1 .80 5. 15 7.66 5. 15 7.65 5. 14 7.64 12,00 5.19 7,70 5. 18 7,70 5,17 7.69 12,20 5,22 7.75 5,22 7,75 5,21 7,74 12.40 5,26 7,80 5,25 7,79 5 , 24 7.79 12,60 5,29 7, «5 5,28 7.34 5.28 7.83 12.SO 5.32 7.89 5.32 7.39 5.31 7.88 13. 00 5.35 7.94 5,35 7.93 5.34 7.92 13,20 5,39 7,98 5.38 7.98 5.37 7.97 13,40 5.42 3.03 5.41 8. 02 5.41 8.01 13.60 5.45 8,07 5.44 8.06 5,44 8.06 13.80 5,48 8, 11 5,47 8.11 5,47 8,10 14.00 5,51 8,16 5,50 8.15 5,50 8.14 14.20 5.54 3.20 5.53 8, 19 5.53 3.18 14,40 5.57 S.24 5.56 8.23 5.56 3.22 14,60 5,60 8,28 5.59 8.27 5.5?! 3.27 14.80 5.63 8.32 5.62 8.31 5.6i 8.31 15.00 5.65 8.36 5.65 8.35 5.64 8.34 15.50 5.72 3.46 5.72 8.45 5.71 8,44 16,00 5,79 8,55 5.73 8.54 5.78 8,53 16.50 5.85 8.64 5.85 3.63 5.34 8.63 17. 00 5,92 8,73 5.91 8,72 5.91 8.71 17.50 5.98 8,81 5.97 8.81 5.97 8.80 18. 00 6,04 8.9 0 6.03 8.89 6. 03 8.88 IS.50 6,10 8.98 6, 09 8.97 6. 08 8.96 19. 00 6, 15 9. 06 6. 15 9. 05 6.14 9.04 19.50 6.21 9.(3 6 .20 9.13 6. 19 9. 12 2 0,00 6.26 9,21 6.23 9.20 6.25 9,20 20,50 6.31 9,28 6.31 9,28 6.30 9.27 21 . 00 6.36 9.35 6.36 9,35 6,35 9.34 21 .50 6.41 9.42 6.41 9,42 6.40 9.41 22.00 6,46 9.49 6.46 9.49 6.45 9.48 22,50 6.51 9. 56 6.50 9.55 6.50 9.54 23.00 6.56 9.62 6 ,55 9.62 6.54 9.61 23.50 6.60 9,69 6.60 9. 68 6.59 9,67 24.00 6.65 9,75 6 .64 9.74 6,64 9.74 24.50 6.69 9.31 6 .69 9.31 6 .68 9.80 25. 00 6.73 9.87 6.73 9 . 87 6.72 9.86

PUBLICATION Vll.a
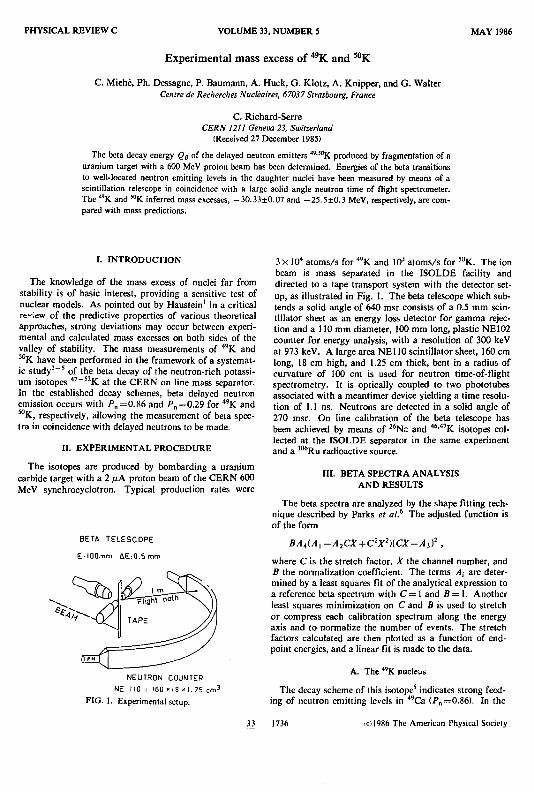
PHYSICAL REVIEW C VOLUME 33, NUMBER 5 MAY 1986
Experimental mass excess of 4 9 K and 5 0 K
C. Miehé, Ph. Dessagne, P. Baumann, A. Huck, G. Klotz, A. Knipper, and G. Walter Centre de Recherches Nucléaires, 67037Strasbourg, France
C. Richard-Serre CERN 1211 Geneva 23, Switzerland
(Received 27 December 1985)
The beta decay energy Q6 of the delayed neutron emitters "'• !0K produced by fragmentation of a uranium target with a 600 MeV proton beam has been determined. Energies of the beta transitions to well-located neutron emitting levels in the daughter nuclei have been measured by means of a scintillation telescope in coincidence with a large solid angle neutron time of flight spectrometer. The "'K and 5 0K inferred mass excesses, -30.33 ±0.07 and -25.5 ±0.3 MeV, respectively, are compared with mass predictions.
I. INTRODUCTION
The knowledge of the mass excess of nuclei far from stability is of basic interest, providing a sensitive test of nuclear models. As pointed out by Haustein' in a critical rc iew of the predictive properties of various theoretical approaches, strong deviations may occur between experimental and calculated mass excesses on both sides of the valley of stability. The mass measurements of 4 , K and 5 0 K have been performed in the framework of a systematic s t u d y 2 - 5 of the beta decay of the neutron-rich potassium isotopes 4 7 _ 5 2 K at the CERN on line mass separator. In the established decay schemes, beta delayed neutron emission occurs with P„=0.%6 and i ' n =0 .29 for 4 9 K and 5 0 K, respectively, allowing the measurement of beta spectra in coincidence with delayed neutrons to be made.
II. EXPERIMENTAL PROCEDURE
The isotopes are produced by bombarding a uranium carbide target with a 2 juA proton beam of the CERN 600 MeV synchrocyclotron. Typical production rates were
SETA TELESCOPE
E-.IOOmm AE:0.5mm
NEUTRON COUNTER NE 110 : 160 »I8 «1.25 cm 3
FIG. 1. Experimental setup.
3 x 10⁴ atoms/s for 4 , K and 103 atoms/s for 5 0 K. The ion beam is mass separated in the ISOLDE facility and directed to a tape transport system with the detector setup, as illustrated in Fig. 1. The beta telescope which subtends a solid angle of 640 msr consists of a 0.5 mm scintillator sheet as an energy loss detector for gamma rejection and a l l O mm diameter, 100 mm long, plastic NE102 counter for energy analysis, with a resolution of 300 keV at 973 keV. A large area NE110 scintillator sheet, 160 cm long, 18 cm high, and 1.25 cm thick, bent in a radius of curvature of 100 cm is used for neutron time-of-flight spectrometry. It is optically coupled to two phototubes associated with a meantimer device yielding a time resolution of 1.1 ns. Neutrons are detected in a solid angle of 270 msr. On line calibration of the beta telescope has been achieved by means of 2 6 N a and 4 6 ' 4 7 K isotopes collected at the ISOLDE separator in the same experiment and a 1 0 6 Ru radioactive source.
III. BETA SPECTRA ANALYSIS AND RESULTS
The beta spectra are analyzed by the shape fitting technique described by Parks et al.6 The adjusted function is of the form
BA4[Al-A2CX + C2X2)(CX-Ai)2,
where C is the stretch factor, X the channel number, and B the normalization coefficient. The terms At are determined by a least squares fit of the analytical expression to a reference beta spectrum with C = 1 and B = \. Another least squares minimization on C and B is used to stretch or compress each calibration spectrum along the energy axis and to normalize the number of events. The stretch factors calculated are then plotted as a function of end-point energies, and a linear fit is made to the data.
A. The *'K nucleus
The decay scheme of this isotope5 indicates strong feeding of neutron emitting levels in 4 , C a (i>„=0.86). In the
1736 vc)1986 The American Physical Society
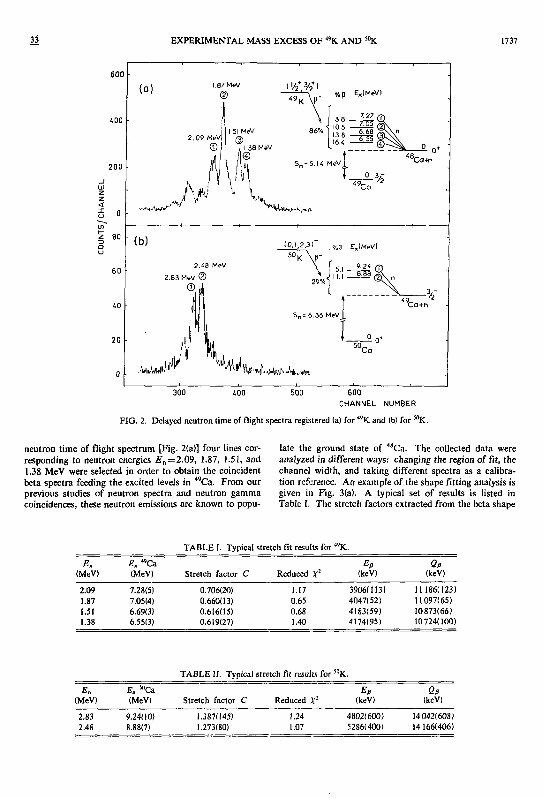
33 EXPERIMENTAL MASS EXCESS OF 4 9 K AND S°K 1737
600 • ( 0 )
200
_JJ02*I
I 51 MeV 2.09 MeV! Q
© I ,138 MeV © S„ = 5.l< MeVX t a 4P
X o
• \ ^A-' lU*,*-**. jTV-fl
60
20
(b) U K \ P "
2.63 MeV ©
I
. %p FjjlMeVl
5 1 0 2 < Q M.I—aS§(|\n
I 5„=6.36 MeV
Ca
400 500 600 CHANNEL NUMBER
FIG. 2. Delayed neutron time of flight spectra registered (a) for 4 9 K and (b) for 3 0K.
neutron time of flight spectrum [Fig. 2(a)] four lines corresponding to neutron energies E n = 2 . 0 9 , 1.87, 1.51, and 1.38 MeV were selected in order to obtain the coincident beta spectra feeding the excited levels in 4 9 Ca. From our previous studies of neutron spectra and neutron gamma coincidences, these neutron emissions are known to popu
late the ground state of 4 8 Ca. The collected data were analyzed in different ways: changing the region of fit, the channel width, and taking different spectra as a calibration reference. An example of the shape fitting analysis is given in Fig. 3(a). A typical set of results is listed in Table I. The stretch factors extracted from the beta shape
TABLE I. Typical stretch fit results for M K.
E„ E, , 9 Ca E„ Qt> (MeV) (MeV) Stretch factor C Reduced X2 (keV) (keV)
2.09 7.28(5) 0.706(20) 1.17 3906(113) 11186(123) 1.87 7.05(4) 0.660(13) 0.65 4047(52) 11097(65) 1.51 6.69(3) 0.616(15) 0.68 4183(59) 10873(66) 1.38 6.55(3) 0.619(27) 1.40 4174(95) 10724(100)
TABLE II. Typical stretch fit results for 5 0K.
E„ (MeV)
Ex
MCa (MeV) Stretch factor C Reduced X2
E„ (keV)
QK (keV)
2.83 2.48
9.24(10) 8.88(7)
1.387(145) 1.273(80)
1.24 1.07
4802(600) 5286(400)
14042(608) 14166(406)
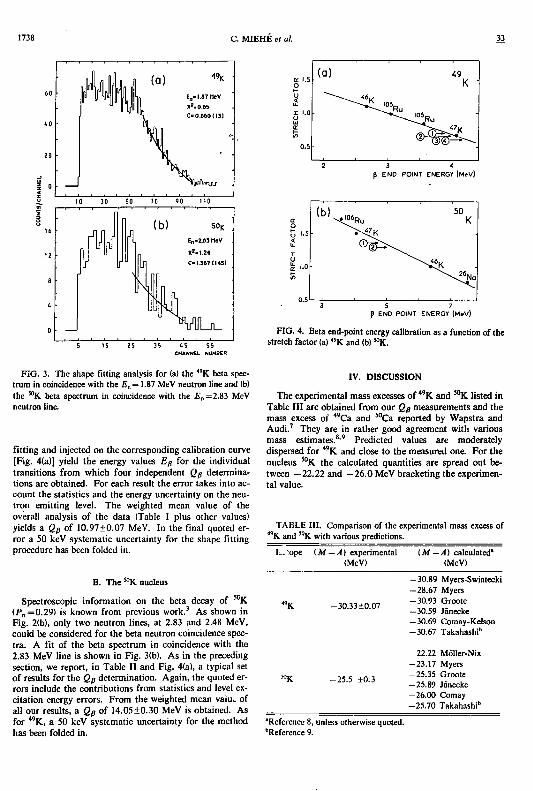
1738 C. MIEHE et al. 33
n 1 111 i ( a ) 4 9 K '
60 nw E„>I.S7neV
X2.0.65 00.660(13)
(0
2a 1 ' ' 0 . J ^V~w •
10 30 SO 10 90 110
V W rl
(b)
(In
5 0 K
5,-USItoV
X2«1.24
C=I.»7(H5)
35 tS 55 CHANNEL NUMBER
B END POINT ENERGY (M*V)
(hi 50 -<*Ru K
1.5 •
1.0
B END POINT ENERGY (MeV)
FIG. 4. Beta end-point energy calibration as a function of the stretch factor (a) < 9 K and (b) W K.
FIG. 3. The shape fitting analysis for (a) the 4 'K beta spectrum in coincidence with the E„ = 1.87 MeV neutron line and (b) the W K beta spectrum in coincidence with the £'n = 2.83 MeV neutron line.
fitting and injected on the corresponding calibration curve [Fig. 4(a)] yield the energy values Eg for the individual transitions from which four independent Qg determinations are obtained. For each result the error takes into account the statistics and the energy uncertainty on the neutron emitting level. The weighted mean value of the overall analysis of the data (Table I plus other values) yields a Qg of 10.97±0.07 MeV. In the final quoted error a 50 keV systematic uncertainty for the shape fitting procedure has been folded in.
B. The M K nucleus
Spectroscopic information on the beta decay of 5 0 K (P„=0.29) is known from previous work.3 As shown in Fig. 2(b), only two neutron lines, at 2.83 and 2.48 MeV, could be considered for the beta neutron coincidence spectra. A fit of the beta spectrum in coincidence with the 2.83 MeV line is shown in Fig. 3(b). As in the preceding section, we report, in Table II and Fig. 4(a), a typical set of results for the Qg determination. Again, the quoted errors include the contributions from statistics and level excitation energy errors. From the weighted mean value of all our results, a Qg of 14.05 ±0.30 MeV is obtained. As for 4 9 K, a 50 keV systematic uncertainty for the method has been folded in.
IV. DISCUSSION
The experimental mass excesses of 4 9 K and 5 0 K listed in Table III are obtained from our Qg measurements and the mass excess of 4 9 Ca and 5 0 Ca reported by Wapstra and Audi. ' They are in rather good agreement with various mass estimates. 8 , 9 Predicted values are moderately dispersed for 4 9 K and close to the measured one. For the nucleus 5 0 K the calculated quantities are spread out between — 22.22 and —26.0 MeV bracketing the experimental value.
TABLE III. Comparison of the experimental mass excess of 4 9 K and S 0K with various predictions.
L-'ope M — A) experimental (MeV)
( Af —A) calculated" (MeV)
-30.33±0.07
-30.89 Myers-Swiatecki -28.67 Myers -30.93 Groole -30.59 Jânecke -30.69 Comay-Kelson -30.67 Takahashi*
-22.22 Môller-Nix -23.17 Myers -25.35 Groote -25.89 Jânecke -26.00 Comay -25.70 Takahashi"
"Reference 8, unless otherwise quoted. "•Reference 9.
33 EXPERIMENTAL MASS EXCESS OF 4 9 K AND "K 1739
Measurement of the beta spectra in coincidence with neutrons in order to determine the Qp value of delayed neutron emitters is shown to be a powerful method to obtain mass excesses of neutron-rich isotopes far from stability. As the neutron emission occurs from a level for which gamma cascade feeding does not exist, a pure beta
'P. E. Haustein, in Proceedings of the 7th International Conference on Atomic Masses and Fundamental Constants AMCO 7, Darmstadt, 1934, edited by O. Klepper (Technische Hochschule Darmstadt Schriftenreihen Wissenschaft und Technik, Darmstadt, 1984), Vol. 26, p. 413.
2A. Huck et al., Phys. Rev. C 31, 2226 (1985). 3A. Huck et al., in Proceedings of the 4th International Confer
ence on Nuclei far from Stability, Helsingor, 1981, CERN Report 81.09, 1981, p. 378; J. Rachidi, thesis, Centre de Recherches Nucléaires Strasbourg, 1983.
spectrum is obtained in coincidence with each neutron line.
The authors would like to thank P. E. Haustein for helpful indications on the shape fitting method used in this work.
4A. Huck et al. (unpublished). 5L. C. Carraz et ai, Phys. Lett. 109B, 419 (1982). 6L. A. Parks, C. N. Davids, and R. C. Pardo, Phys. Rev. C 15,
730(1977). 7A. H. Wapstra and G. Audi, Nucl. Phys. A432, 1 (1985). 8A. H. Wapstra and K. Bos, At. Data Nucl. Data Tables 17,
474(1976). 9 K. Takahashi, H. v. Groote, and E. R. Hilf, Institut fur Kem-
physik Technische Hochschule Darmstadt Report IKDA 76/26, 1976.

PUBLICATION VH.b
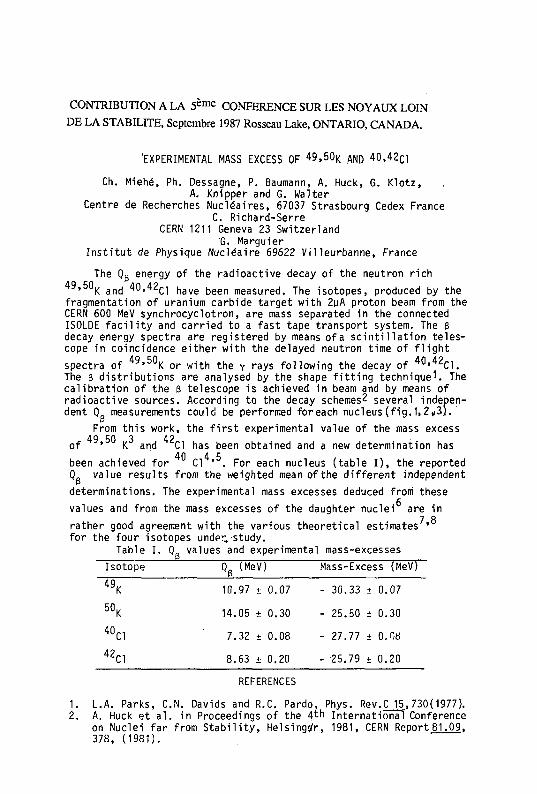
CONTRIBUTION A LA 5 è m e CONFERENCE SUR LES N O Y A U X LOIN
D E LA STABILITE, Septembre 1987 Rosseau Lake, ONTARIO, CANADA.
'EXPERIMENTAL MASS EXCESS OF 49,50 K A N D 40,42C1
Ch. Miehé, Ph. Dessagne, P. Baumann, A. Huck, G. Klotz, A. Knipper and G. Walter
Centre de Recherches Nucléaires, 67037 Strasbourg Cedex France C. Richard-Serre
CERN 1211 Geneva 23 Switzerland G. Marguier
Institut de Physique Nucléaire 69622 Villeurbanne, France
The 0g energy of the radioactive decay of the neutron rich
' K and 40,42çi have been measured. The isotopes, produced by the fragmentation of uranium carbide target with 2pA proton beam from the CERN 600 MeV synchrocyclotron, are mass separated in the connected ISOLDE facility and carried to a fast tape transport system. The B decay energy spectra are registered by means of a scintillation telescope in coincidence either with the delayed neutron time of flight
spectra of q y » b u K or with the y rays following the decay of °' CI. The 6 distributions are analysed by the shape fitting technique^. The calibration of the B telescope is achieved in beam and by means of radioactive sources. According to the decay schemes2 several independent Q measurements could be performed foreach nucleus (fig. 1,2*3).
p From this work, the first experimental value of the mass excess
49 50 3 42 of ' K and CI has been obtained and a new determination has
been achieved for CI ' . For each nucleus (table I), the reported Q value results from the weighted mean of the different independent
determinations. The experimental mass excesses deduced from these
values and from the mass excesses of the daughter nuclei are in 7 8 rather good agreement with the various theoretical estimates '
for the four isotopes under; study. Table I. Q_ values and experimental mass-excesses
g .
Isotope Q. (MeV) Mass-Excess (MeV) p
4 9 K 10.97 ± 0.07 - 30.33 ± 0.07
5 0 K 14.05 ± 0.30 - 25.50 ± 0.30
4 0C1 7.32 ± 0.08 - 27.77 ± 0.08
4 2C1 8.63 ± 0.20 - 25.79 ± 0.20 REFERENCES
1. L.A. Parks, C.N. Davids and R.C. Pardo, Phys. Rev.C 15,730(1977). 2. A. Huck et al. in Proceedings of the 4th International Conference
on Nuclei far from Stability, Helsingtfr, 1981, CERN Report 81.09, 378, (1981).
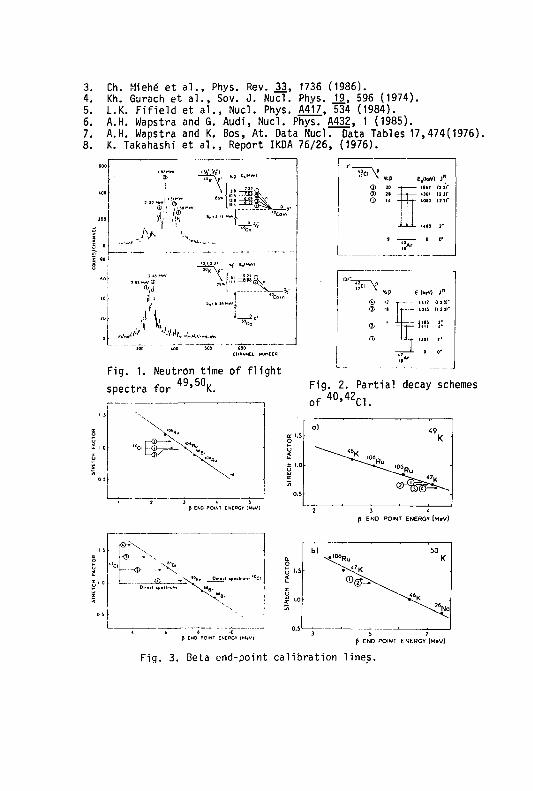
Ch. Miehé et al., Phys. Rev. .33, 1736 (1986). Kh. Gurach et al., Sov. J. Nucl. Phys. _19, 596 (1974). L.K. Fifield et al., Nucl. Phys. A417, 534 (1984). A.H. Wapstra and G. Audi, Nucl. Phys. A432, 1 (1985). A.H. Wapstra and K. Bos, At. Data Nucl. Data Tables 17,474(1976). K. Takahashi et al., Report IKDA 76/26, (1976).
H3SSS, V . . . — 1 '
.A*
%i
r ^
A ""
%P £„««¥) j "
« s u (i j ' r 4.301 (! 31' i o n 1131"
o o*
^ T \ p
Fig. 1. Neutron time of f l i g h t 4. * 49,50. spectra fo r K.
© U - _ _ _ ,(17 ( I I ) ] "
© n - H — *on o 2 v
"T5 *- D °*
Fig. 2. Partial decay schemes
of 4 0 ' 4 2 C 1 .
P END POINT ENERGY IM4V]
a) 49 K "
0 \ 3 < I 1.0 u
-^Ru
*^L 0.5 '
p END POINT ENERGY ( M * V )
"ci - ® - — x
ID-^
^ T ) N . d rum *°CI
D i r . 1 „.,..„«
"~- -
b) 50 K
P END POINT ENERGY |M*V p END POINT ENERGY (M»v)
Fig. 3, Beta end-point calibration lines.

PUBLICATION VIII
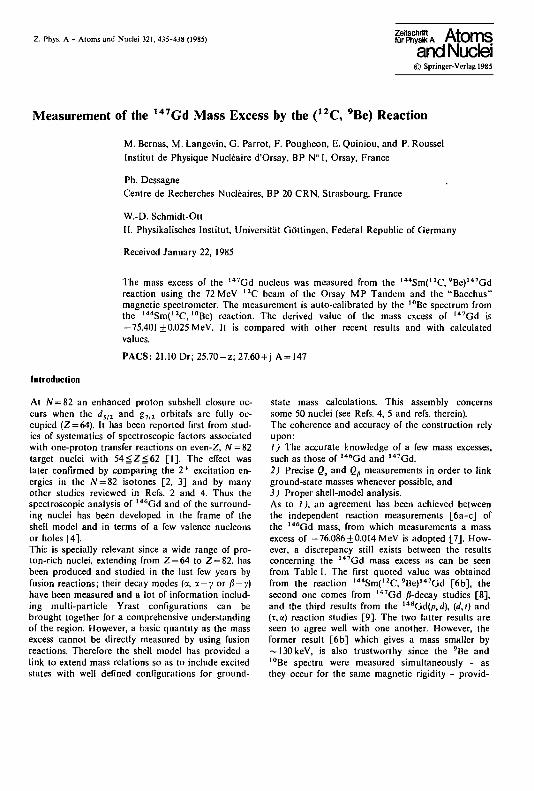
Z. Phys. A - Atoms and Nuclei 321, 435-438 (1985) fûrPliySik A
and Nuclei © Springer-Verlag 1985
Measurement of the , 4 7 G d Mass Excess by the ( , 2 C, 9Be) Reaction
M. Bernas, M. Langevin, G. Parrot, F. Pougheon, E. Quiniou, and P. Roussel Institut de Physique Nucléaire d'Orsay, BP N° I, Orsay, France
Ph. Dessagne Centre de Recherches Nucléaires, BP 20 CRN, Strasbourg, France
W.-D. Schmidt-Ott II. Physikalisches Institut, Universitàt Gôttingen, Federal Republic of Germany
Received January 22, 1985
The mass excess of the ""Gd nucleus was measured from the l 4 4 Sm( 1 2 C, 9Be) 1 4 7Gd reaction using the 72 MeV 1 2 C beam of the Orsay MP Tandem and the "Bacchus" magnetic spectrometer. The measurement is auto-calibrated by the '"Be spectrum from the 1 4 4 Sm(' 2 C, l 0Be) reaction. The derived value of the mass excess of l 4 7 Gd is -75.401 ±0.025 MeV. It is compared with other recent results and with calculated values.
PACS: 21.10 Dr; 25.70-z; 27.60+j A = 147
Introduction
At N = 82 an enhanced proton subshell closure occurs when the d5l2 and g 7 / 2 orbitals are fully occupied (Z = 64). It has been reported first from studies of systematics of spectroscopic factors associated with one-proton transfer reactions on even-Z, AT = 82 target nuclei with 54gZ_62 [I]. The effect was later confirmed by comparing the 2 + excitation energies in the TV = 82 isotones [2, 3] and by many other studies reviewed in Refs. 2 and 4. Thus the spectroscopic analysis of """Gd and of the surrounding nuclei has been developed in the frame of the shell model and in terms of a few valence nucléons or holes [4]. This is specially relevant since a wide range of proton-rich nuclei, extending from Z = 64 to Z = 82. has been produced and studied in the last few years by fusion reactions; their decay modes (a, a —y or /)->•) have been measured and a lot of information including multi-particle Yrast configurations can be brought together for a comprehensive understanding of the region. However, a basic quantity as the mass excess cannot be directly measured by using fusion reactions. Therefore the shell model has provided a link to extend mass relations so as to include excited states with well defined configurations for ground-
state mass calculations. This assembly concerns some 50 nuclei (see Refs. 4, 5 and refs. therein). The coherence and accuracy of the construction rely upon: 1 ) The accurate knowledge of a few mass excesses, such as those of , 4 , , Gd and l 4 7 Gd. 2) Precise (?„ and Qf measurements in order to link ground-state masses whenever possible, and 3) Proper shell-model analysis. As to 1 ) , an agreement has been achieved between the independent reaction measurements [6a-c] of the 1 4 6 Gd mass, from which measurements a mass excess of -76.086±0.0I4MeV is adopted [7]. However, a discrepancy still exists between the results concerning the 1 4 7 Gd mass excess as can be seen from Table 1. The first quoted value was obtained from the reaction 1 4 4 Sm( 1 2 C, 9Be) , , , 7Gd [6b], the second one comes from 1 4 7 Gd /ï-decay studies [8], and the third results from the '""Gdfp.rf), (d,t) and (r, a) reaction studies [9], The two latter results are seen to agree well with one another. However, the former result [6b] which gives a mass smaller by ~130keV, is also trustworthy since the 9Be and l 0Be spectra were measured simultaneously - as they occur for the same magnetic rigidity - provid-
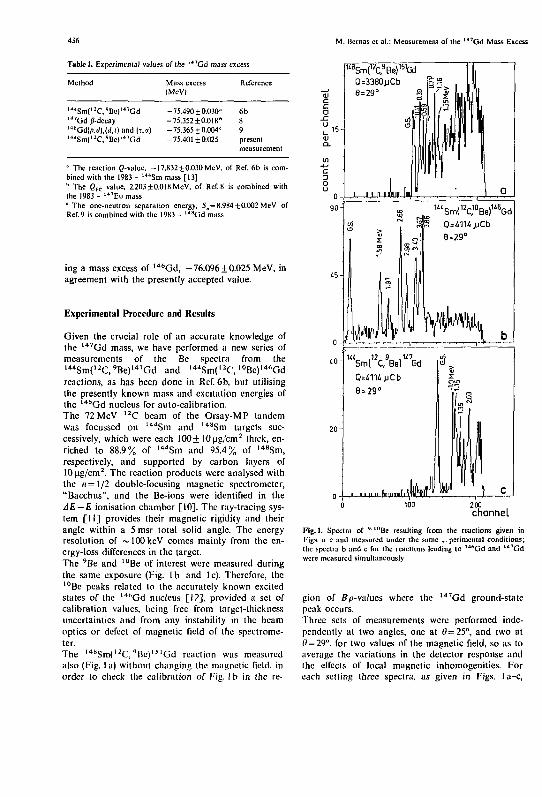
436 M. Bernas et al.: Measurement of the l 4 7 G d Mass Excess
Tablet. Experimental values of the l * 7 Gd mass excess
Method Mass excess (MeV)
l 4 4 Sm(' 2 C.*Bc)' '"Gd -75.490 + 0.030" 6b , 4 , G d /(-decay -75.352±0.01Kb 8 u"Gd[p.d)MD and(r.a) -75.365 ±0.004' 9 ' "Sm( ' 2 C, 'Be)" l 1 Gd -75.401 ±0.025 prcscnl
measurement
" The reaction S-value, - 17.832 ±0.030 MeV, of Ref. 6b is combined with the 1983 - '""Sm mass [13] " The e E C value, 2.203 ±0.018 MeV, of Ref. 8 is combined with the 1983 - ' " E u mass c The one-neutron separation energy, S n = 8.984±O.O02MeV or Ref. 9 is combined with the 1983 - 1 4 "Gd mass
ing a mass excess of 1 4 6 Gd, -76.096 ±0.025 MeV, in agreement with the presently accepted value.
Experimental Procedure and Results
Given the crucial role of an accurate knowledge of the 1 4 7 Gd mass, we have performed a new series of measurements of the Be spectra from the 1 4 4Sm( 1 2C, 9Be)""Gd and l 4 4 Sm( 1 2 C, l 0Be) l 4 r 'Gd reactions, as has been done in Ref. 6b, but utilising the presently known mass and excitation energies of the 1 4 6 Gd nucleus for auto-calibration. The 72 MeV 1 2 C beam of the Orsay-MP tandem was focussed on 1 4 4Sm and 1 4 8 Sm targets successively, which were each 100+ 10ug/cm2 thick, enriched to 88.9% of , 4 4 Sm and 95.4% of l 4 8 Sm, respectively, and supported by carbon layers of 10 ug/cm2. The reaction products were analysed with the n = l/2 double-focusing magnetic spectrometer, "Bacchus", and the Be-ions were identified in the AE—E ionisation chamber [10]. The ray-tracing system [II] provides their magnetic rigidity and their angle within a 5msr total solid angle. The energy resolution of ~100keV comes mainly from the energy-loss differences in the target. The 9Be and 1 0Be of interest were measured during the same exposure (Fig. lb and lc). Therefore, the l 0Bc peaks related to the accurately known excited states of the 1 4 < ,Gd nucleus [12], provided a set of calibration values, being free from target-thickness uncertainties and from any instability in the beam optics or defect of magnetic field of the spectrometer. The 1 4 8 Sm( l 2 C, < , Be) 1 M Gd reaction was measured also (Fig. I a) without changing the magnetic field, in order to check the calibration of Fig. lb in the re-
1 i B Sm( 1 2 C» 1 5 l Gd Q=3380;jCb 8=29°
Fig. 1. Spectra of 9 l 0 B e resulting from the reactions given in Tigs, a-c and measured under the same .. pcrimental conditions; the spectra b and c for the reactions leading to 1 4 A Gd and l 4 7 G d were measured simultaneously
gion of Bp-values where the , 4 1 G d ground-state peak occurs. Three sets of measurements were performed independently at two angles, one at 0 = 25°, and two at 0 = 29°, for two values of the magnetic field, so as to average the variations in the detector response and the effects of local magnetic inhomogenities. For each setting three spectra, as given in Figs. 1 a-c,
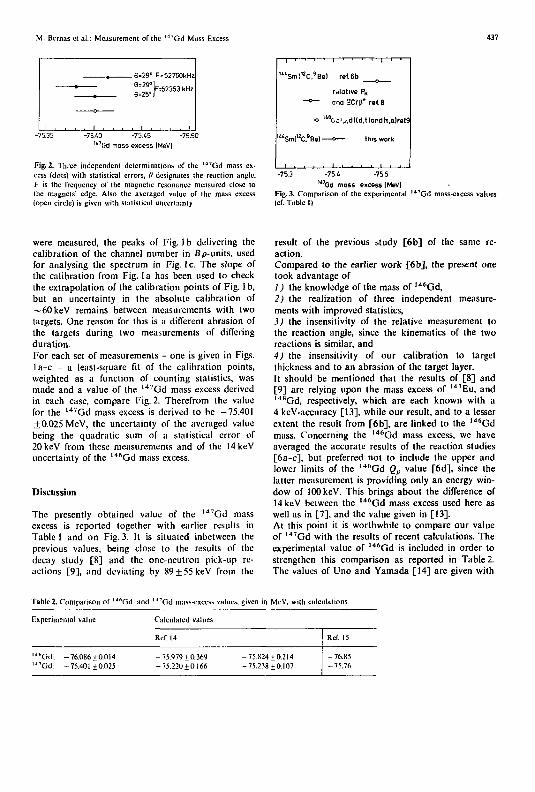
M. Bernas et al.: Measurement of the 1 4 7 G d Mass Excess
S = 2 9 ° 1 F = 5 2 3 5 3 I < H Z 6=25°J
• I
S = 2 9 ° 1 F = 5 2 3 5 3 I < H Z 6=25°J
• I 1 , . . 1 1 !
S = 2 9 ° 1 F = 5 2 3 5 3 I < H Z 6=25°J
• I
-75.35 -75.40 -75.45 -75.50 1 A 7Gd mass excess IMeVI
Fig. 2. Three independent determinations of the 1 4 7 G d muss excess (dots) with statistical errors, 0 designates the reaction angle. F is the frequency of the magnetic resonance measured close to the magnets' edge. Also the averaged value of the mass excess (open circle) is given with statistical uncertainly
1 1 1 1 1
' " S m ^ C . ' B e l
1 i i . i | i .
ref.6b
relative PK
~°— ona <:C/P* r«(.6
o :" >Cc:' i).dl(d,tlandl' i.alref9
1 " S m ( » C . , B a l - - o — this work
I -75.3 -75.4 -755
'"Gd mass excess IMeVI Fig. 3. Comparison of the experimental 1 4 7 G d mass-excess values (cf. Table II
were measured, the peaks of Fig. I b delivering the calibration of the channel number in Bp-units, used for analysing the spectrum in Fig. 1 c. The slope of the calibration from Fig. I a has been used to check the extrapolation of the calibration points of Fig. 1 b, but an uncertainty in the absolute calibration of ~60keV remains between measurements with two targets. One reason for this is a different abrasion of the targets during two measurements of differing duration. For each set of measurements - one is given in Figs, la-c - a least-square fit of the calibration points, weighted as a function of counting statistics, was made and a value of the l 4 7 Gd mass excess derived in each case, compare Fig. 2. Therefrom the value for the I 4 7 Gd mass excess is derived to be -75.401 ±0.025 MeV, the uncertainty of the averaged value being the quadratic sum of a statistical error of 20 keV from these measurements and of the 14 keV uncertainty of the 1 4 6 Gd mass excess.
Discussion
The presently obtained value of the l 4 7 G d mass excess is reported together with earlier results in Table 1 and on Fig. 3. It is situated inbetween the previous values, being close to the results of the decay study [8] and the one-neutron pick-up reactions [9], and deviating by 89 ± 55 keV from the
result of the previous study [6b] of the same reaction. Compared to the earlier work [6b], the present one took advantage of / ) the knowledge of the mass of 1 4 6 Gd, 2) the realization of three independent measurements with improved statistics, 3) the insensitivity of the relative measurement to the reaction angle, since the kinematics of the two reactions is similar, and 4) the insensitivity of our calibration to target thickness and to an abrasion of the target layer. It should be mentioned that the results of [8] and [9] are relying upon the mass excess of 1 4 7 Eu, and , 4 8 Gd, respectively, which are each known with a 4 keV-accuracy [13], while our result, and to a lesser extent the result from [6b], are linked to the 1 4 6 Gd mass. Concerning the l 4 6 G d mass excess, we have averaged the accurate results of the reaction studies [6a-c], but preferred not to include the upper and lower limits of the , 4 , 'Gd Qf value [6d], since the latter measurement is providing only an energy window of 100 keV. This brings about the difference of 14keV between the l 4 6 G d mass excess used here as well as in [7], and the value given in [13]. At this point it is worthwhile to compare our value of 1 4 7 Gd with the results of recent calculations. The experimental value of 1 4 6 Gd is included in order to strengthen this comparison as reported in Table 2. The values of Uno and Yamada [14] are given with
Table 2. Comparison of ' 4 "Gd and 1 4 V i d mass-excess values, given in MeV, with calculations
Experimental value Calculated values
Ref. 14 Ref. 15
l 4 " G d : -76.086 + 0.014 , 4 , G d : -75.401 ±0.025
-75.979 ±0.369 - 75X24 ±0.214 -75.220 ±0.166 -75.238 ±0.107
-76.85 - 75.76
438 M. Bernas et al.: Measurement of the '* 7Gd Mass Excess
the quoted errors, and the agreement is reasonable, especially with the first given constant-shell approximation. Given the simplicity of their calculations, the values of Môller and Nix [15] arc also reproducing the experimental results fairly well. To conclude, even if the energy resolution in the ( , 2 C,'- , 0 Be) reaction is limited to -lOOkeV, the auto-calibration of the Be-spectra provides an experimental method free from systematic errors resulting here in a relatively precise determination of the mass excess of ""Gd. The better knowledge of this mass excess will propagate along the a-precursor line and to the neighbouring nuclei, by using the mass relations derived from the shell-model extension.
The authors like to thank H. Folger and his coworkers of the GSI target laboratory for the preparation of the samarium targets from enriched materials. We are also grateful to Dr. G. Audi for his advise to recalculate the results from previous experiments given in Table 1, using the 1983 mass values.
References
1. Wildenthal, B.H., Newman, E.. Auble, R.L.: Phys. Rev. C3, 1199(1971)
2. Ogawa, M., Broda, R., Zell, K„ Daly, P.J., Kleinheinz. P.: Phys. Rev. Lett. 41, 289 (1978)
3. Daly, P.J., Klcinheinz, P., Broda, R., Stefanini, A.M., Lunardi, S., Backe, H., Richter, U Willwater. R.. Weik, F.: Z. Phys. A - Atoms and Nuclei 288. 103 (1978)
4. Blomqvist, J., Klcinheinz, P., Daly, P.J.: Z. Phys. A - Atoms and Nuclei 312, 27(1983)
5. Wapstra, A.H.: Private communication and Proc. 7th Int. Conf. on Atomic Masses and Fundamental Constants, AMCO 7, 3-7 September 1984, Darmstadt-Seeheim, Klepper, O. (éd.), p. 29. Darmstadt: Techn. Hochschule Darmstadt Lehrdruckcrei
6a. Alford, W.P., Anderson, R.E., Batay-Csorba, P.A., Emigh, R.A., Lind, D.A., Smith, P.A., Zafiratos, CD.: Nucl. Phys. A 321, 45 (1979)
b. Pardo, R.C., Gales, S., Ronningen, R.M., Harwood, L.H.: Phys. Lett. 91 B, 41 (1980)
c. Flynn, E.R., Plichl, J. van der, Wilhelmy, J.B., Mann. L.G.. Struble, G.L., Lanier, R.G.: Phys. Rev. C 28, 97 (1983)
d. Kantus. R., Sehrewe, U.J.. Schmidl-Ott. W.D., Michaelsen. R.: Phys. Rev.C23, 1274(1981)
7. Rubio, B.. Julin, R„ Ercan, A.. Zuber. K„ Kleinheinz, P., Tain, J.L.. Berg, G.P.A.. Hlawatsch, G.. Kalayama. I. MeiBenburger. J.. Paul. D.. Romer. J.G.M., Blomqvist. J.: AMCO 7. (comp. rcf. 51. p. 196
8. Schrcwc. U.J.. Volh. E.. Bosch. U.. Schmidl-Ott, W.-D.. Bchrens. H.: Z. Phys. A - Atoms and Nuclei 317. 305 (1984) Schrcwc, U.J.. Tidemand-Pelcrsson. P.. Bchrens. H.. Dnrnhofer. H. Michaelsen. R. Runic, P... Schmidl-Olt, W.-D.. Vmli. E.: AMCO 7. (comp. ref. 5). p. 203
9. Mann. L.G.. Decman. D.J.. Massey. T.N.. Struble. G.L.. Sisson, D.H.. Henderson. CM.. Rubio. B.. Kleinhcinz. P. Tain, J.L.. Berg. G.P.A.. MeiBenburger. J.. Rômer, J.G.M.. Hlawatsch, G.. Paul. D„ Brinkmôller. B.. Rossen. P. v.. Schee-rer, J.. Thomas. K.E., O'Brien. H.A.: AMCO 7, (camp. ref. 5), p. 217
10. Naulin, F., Roy-Stcphan, M., Kashy, E.: Nucl. Instrum. 180, 647(1981)
11. Roussel, P., Bernas, M., Diaf. F-, Naulin, F., Pougheon, F., Rotbard, G.. Roy-Stcphan. M.: Nucl. Instrum. 153. 111 (1978)
12. Peker, L.K.: Nucl. Data Sheets 41. 237 (1984) !3. Wapstra, AH., Audi, G.: The 1983 Atomic Mass Table. Nucl.
Phys. A 432, I (1985) 14 lino. M., Yamada. M.: INS Report NUMA 40(1982) 15. Mailer, P.. Nix. J.R.: At. Nucl. Dala Tables 26. 165 (1981) M. Be.-nas M. Langcvin <i Parrot F. Pouglteon F.. Quiniou P. Roussel Institut de Physique Nucléaire BP No 1 F-91406 Orsay Cedex France
Ph. Dessagne Centre de Recherches Nucléaires BP20CRN F-67037 Strasbourg France
W.-D. Schmidt-Olt II. Physikatisches Institut Universitât Gôttingen Bunsenstrasse 7-9 D-3400 Gôttingen Federal Republic of Germany

PUBLICATION IX
SPECTROSCOPY OF NEUTRON-RICH
ISOTOPES OF NICKEL AND IRON
M. GIROD S Ph. DESSAGNE 2? M. BERNAS 2
M. LANGEVIN 2\ F. POUGHEON 2 and P. ROUSSEL 2
1 Service de Physique et Techniques Nucléaires, CE . Bruyères-le-Chatel,
BP 12, 91680 BRUYERES-LE-CHATEL, FRANCE
2 Institut de Physique Nucléaire, BP 1, 91406 ORSAY CEDEX, FRANCE
Abstract
Spectroscopy of neutron rich isotopes of 6 7iVt )
68jVi and 62Fe is
studied using the quasi-elastic transfer reactions ( 1 4C, l s O) and ( W C, 1 7 0 ) on mass separated targets of 70Zn and of 6 4iVi. The structure of
these new nuclei is investigated through the Hartree-Fock-Bogoliubov
(HFB) calculations, using the D1SA interaction. Inertial parame
ters are calculated in the cranking approximation. Collective excited
"Permanent address : Centre de Recherches Nucléaires, BP 20, 67037 STRASBOURG
Cedex
'Deceased
states are obtained consistently by solving the Bohr Hamiltonian.
Based on these results, quantum numbers are tentatively assigned
to the observed states and angular distributions, measured and cal
culated from the DWBA , are used to check this assignement. The
spectroscopy of more neutron rich nuclei, yet unknown, is anticipated.
A sharper test of wave functions is provided by the monopole op
erator of the Of —* Oj* transition in 68Ni, which have been deduced
from the halflife measurement performed in delayed coincidence exper
iments. An impressive agreement is obtained between the measured
halSife and its value calculated using complete HFB wave functions.
1
The nuclear structure calculations reported in this work are based on
the mean field theory and use a two body effective interaction. They are
extended here to neutron rich nuclei in the intermediate mass region ; Thus
the effective interaction, calibrated on bulk properties of stable nuclei can
be tested relevantly on those nuclei apart from stability.
The heavy isotopes of Ni have been chosen for this study since they
have a proton closed shell, and interesting properties are expected at the
subshell or shell closures N=40 or 50. The neighbouring 6 J F e nucleus has
been studied too.
The first few states of the new isotopes of e7Ni, 68Ni and 62Fe have
been measured by using quasi elastic transfer reactions ( 1 4 C, leO) and
( 1 4 C, I 7 0 ) . Even if the mass excesses of ™Fe and ssNi [l], the spin and
parity assignement [2] and decay time measurement of the first level in 6SNi [3j have already appeared, these results are recalled here since they
are completed by other excited states studies in 68iVt and in the other
isotopes. Altogether, this set of datas provides the matter to compare with
nuclear structure calculations which are developped in the frame of Hartree-
Fock-Bogoliubov for these nuclei. The enargy surfaces are calculated as
functions of the deformations. The inertial parameters are obtained using
the cranking approximation and the collective excited states are calculated
via the resolution of the Bohr Hamiltonian. The level schemes are deduced
for those isotopes and for a few more neutron rich ones, not yet measured.
Besides their relevancy in nuclear structure understanding, these nuclei are
important to study since they appear at first in the rapid neutron capture
2
process in astrophysic ; a knowledge of their properties(mass excess and 0
decay sheme) is necessary to reproduce natural abundances of heavy nuclei.
In a first part we shall briefly report on properties of i7Ni, eaNi and 6îFe as measured from quasi elastic transfer reactions. The HFB method is
presented with some details and the measured excited states are analysed
at the light of the proposed level schemes. The second part concerns the
study of the decay of the first 0 + state of mNi. The monopole strengh
parameter, as extracted from the experiment, is compared with the value
resulting from a calculation which makes use of the full HFB wave functions
of both levels involved. This type of calculation, performed for the first
time, is accounted in detail.
1 S P E C T R O S C O P Y OF N E U T R O N RICH
NUCLEI 67Ni, **Ni and &2Fe
1.1 Experiment
1.1.1 Experimental set-up
The 72 MeV, 1 4 C beam was delivered by the MP Tandem in Orsay
with an intensity of «20 to 50 nA/p. Mass separated targets of ™Zn and eiNi (see Table 1) were prepared on a 1 2 C backing by the mass-separator
"Paris" of the R. Bernas Laboratory. The isotopic purities were better
than 1 per 1000, but chemical contaminants (mainly oxygen) were still
3
present, although a special attention was paid to extract and carry the
targets in an air free atmosphere. The analysing system consists of a doubly
focusing magnetic spectrometer, Bacchus, equiped with a set of two position
sensitive counters followed by a AEi - AE2 - E ionisation chamber. This
system allows both an accurate momenta and angle ray tracing calculation
(Ap/p « 1CT3 and Ad = 0.2") and a redundant ion identification .The
horizont?' angular opening is 5" for a solid angle of 3 msr [4].
1.1.2 Spectra
The spectra of the 69Ni and 67Ni isotopes were simultaneously recorded
since the l e O and 170 from the ( 1 4 C, 1 6 0 ) and ( 1 4 C, l70) reactions show a
similar magnetic rigidity (Fig. 1). An overall energy resolution of 100 keV
is obtained, which comes mostly from target inhomogeneities. Appropriate
corrections are made, so as to suppress the kinematical Bp dépendance
upon 9 for the studied reaction.
On the spectrum of ^Ni, six levels are seen, four of which had been
reported previously by Kouzes et al from the nZn *He7 Be)67Ni mea
surement [5]. The 67Ni mass excess presently measured is 64.07 ± 0.10
MeV (Table 2) which disagrees by 0.250 MeV with the value of Kouzes.
Furthermore the excited states energies found here are different from the
previous ones. In our case, calibrations in energy are facilited by the large
energy byte [AE ~ 12 MeV) of the spectrometer and the many reactions
channels on targets contaminants of a well known kinematic. Thus even if
•1
less accurate, the present results are reliable.
For 6aNi, the mass excess is remeasured to be -63.53±0.03 MeV in
agreement with the first result obtained with the ( 1 8 0 , mNe) transfer [6]
- see Table 2 - The accuracy is better than for 67Ni because of a larger
cross-section and better compatibility of our different measurements. The
first excited level is clearly seen at 1.77 MeV±0.03 MeV excitation energy
and the other states (Fig. 1) are indeed due to Ni levels since the back-
scattered 1 6 0 line is clearly identified from its difference in kinematical
factor. In these pick-up reactions, the energy mismatch acts to hinder the
excited levels when excitation energy increases.
The e9Ni isotope was observed for the first time and its mass excess
measured from the 70Zn(HC, l50)™Ni reaction is -60.46±0.15 MeV [7|.
Only the mass excess could be measured because the cross-section, already
low for the ground state ( 3 n b/sr), is even lower for populating excited
states.
The e2Fe spectrum exhibits seven new levels (Fig. 2). Since the mass
separated target of 6*Ni utilised was rather thick (see Table 1) and inho-
mogenous, thus the energy accuracy is lower. The mass excess obtained
here, -53.83±0.04 MeV (Table 2), is slightly smaller than both previous
results [6,8]. The first excited state was already reported in ref. [8j. Af
ter that our result was obtained, the 6 2Mre /? - 7 decay to 62Fe has been
studied at G.S.I. [9|. The 62Mn isotope was produced by deep inelastic
transfer from neutron rich projectile of 7 6Ge incident on a heavy target of
tungsten. After the on-line-mass-separator, the 7 lines of S2Mn /?-decay,
5
were identified by their similar half-life r ^ = 0.88 (15)s. Complementary
to ours, this experiment allowed to propose the level scheme of 6 2 F e in the
low excitation range (Fig. 2). One of our present purpose is a theoretical
analysis of the set of results concerning the three isotopes of B7Ni, mNi
and e2Fe gathered above.
1.1.3 Angular distributions
Heavy ion transfer reactions have been quite disappointing for spin at
tribution as compared with light ions reactions. An experimental device
was dovelopped for measuring at very forward angles including 0°. One
reason for this is that the angular range of observation must be shifted to
very small angles in the case of heavy ion reaction [10]. A double series
of beam catchers was set in the vacuum chamber of the spectrometer in
order to trap the beam and measure its intensity without introducing a
prohibitive increase of the background level in the image space. A good
rejection of the primary beam, better than 10 1 3, is achieved. The appro
priate catcher is selected according to the ratio of the magnetic rigidity of
the ion of interest, versus the one of incident particles. Measurements were
performed from 0" to 15° with a 0.2° angular accuracy.
The 0 + —• 0 + nuclear transitions involving even-even nuclei are expected
to be characterized by strong forward enhancement. This is indeed veri
fied in the case of ground state (g.s.)—*g.s. transitions. Since a similar
enhancement (by a factor of 6) was observed in the angular distribution of
6
the first excited state of the 70Zn(uC,16O)esNi° reaction, the spin 0 + could
be assigned to this level. A DWBA calculation was performed in order to
compare the shape of the angular distribution for a final spin value 0 + and
for the more probable case of a 2 + . This calculation assumes a direct, one
dtep, transfer of two protons - (sequential transfer would not change the
shape but the normalization factor) - and optical potentials as given on
Table 3 [11]. It confirms that indeed the spin 0 + can be attributed to the
first excited level of 6BNi ( •• '.;/. 8).
The angular distribution;- for the other levels of mNi were also mea
sured with a lower accuracy because of the smaller values of cross-sections
and of the increased level of background. The reaction occuring on oxy
gen contaminant prevents measurements in some kinematical region. The
DWBA analysis was performed for these results, using the same mechanism
assumptions and the same optical potentials as before.
This simplified description of the reaction was extended to the three
nucléon pick-up for the 70Zn(uC, 170)67Ni reaction. In the case of an odd
value of A for the final nucleus and of a 5/2" spin ejectile, many values
of the spin transfer have to be included and the distribution shape is not
caracteristic of the final spin value.
The quantum numbers of the final states were tentatively assigned from
the individual level schemes obtained from the HFB calculations. The
confrontation of the measured angular distributions with the calculated
DWBA curves, can be used to test these assumptions. This discussion will
come later.
/
1.2 THE HFB CALCULATIONS
1.2.1 Genera! features
The theoretical description of the nuclear structure has been performed- in
the framework of the Hartree- Fock- Bogoliubov theory (HFB).This method
permits to describe bulk nuclear properties in the mean field approximation
starting from a nucléon two-body effective force. The force we use is the
finite range, density dependent, effective interaction DISA, derived from
the Gogny's Dl interaction [12]. This Dl force was optimised to describe
self-consistently the mean field and the pairing field on the same footing.
Many calculations performed with this force succeed to reproduce a variety
of nuclear properties. The DISA effective interaction has been adjusted
starting from the Dl one, in order to improve the surface properties [13],
Moreover this new DISA parametrization leads to smaller pairing corre
lations than the Dl force in such a way that the experimental odd-even
mass differences of the tin isotopes are more accurately reproduced. One
may consider that the quasi-particle vibration coupling has been taken into
account in a phenomenological way. Therefore, we expect that this interac
tion would lead to reasonable predictions for exotic nuclei which properties
have been or will be studied experimentally. The main advantage of micro
scopic methods lies in that the description of nuclear structure properties
is accomplished whitout any a priori hypotheses or adjustable parameters
even for the pairing correlations.
8
1.2.2 T h e col lect ive d y n a m i c s
As a matter of fact, the HFB wave function is a Slater determinant which,
in general, is not appropriate to describe the ground and excited states of
a nucleus . For a complete description of the nucleus, we must generate
a dynamical s tate i> of the system. In the generator coordinate method,
this s tate i/> can be expressed as a superposition of HFB wave functions <j>
describing the nucleus at different deformations labelled by q:
where x(q) is a weight function containing the collective dynamics.
With this definition of tj), the collective wave functions xl) determined
through a variational principle, are governed u y the GrifRn-Hill-Wheeler
equations [14] :
with
a n d r (u')= < ii<fV> H is an Hamiltonian kernel with potential and kinetic terms in the
space of the collective variables q, and I is an overlap between HFB wave
functions.
Because of their complexity, we have not tried to solve these equations
9
directly. Instead, we have made use of an approximate treatment which
consists in developping H(q,q') and I(q,q') on the non-locality. This ex
pression leads to an equation of Bohr type:
M ' 3 Tir, • W - O ?<•»•• l i )
Here, x(q) is a collective wave function from which the weight function
x(q) can be derived (see Appendix). M is the collective mass and V(q) is
the collective potential which is expressed as:
Y d ) -<% i H i<J>,> - ù£Ci)
The first term in Eq.(5) is the HFB energy E(q), while the second one
represents the zero-point-energy correction coming from the fluctuation of
the collective variables in the HFB states [15]. This term and the collective
masses are derived in the framework of the cranking model [16].
The adiabatic approximation is involved in the following assumption ;
the total wave function is a product of an intrinsic state with a collective
wave function. This approximation has been assumed for the derivation
of a Bohr-type Hamiltonian from the Hill-Wheeler equations. The Bohr
Hamiltonian is a pure collective hamiltonian where the microscopic HFB
wave functions does not appear explicitly.
For the description of the low energy rotational and vibrational spectra,
10
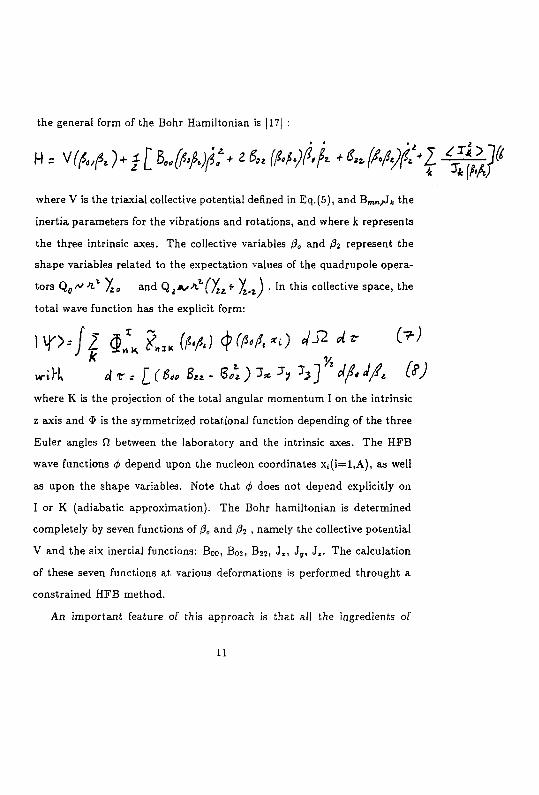
the general form of the Bohr Hamiltonian is [17| :
where V is the triaxial collective potential defined in Eq.(5), and B m n y J t the
inertia parameters for the vibrations and rotations, and where k represents
the three intrinsic axes. The collective variables 0„ and 02 represent the
shape variables related to the expectation values of the quadrupole opera
tors Qg^-n.1 Jzg and QjA/A ( ) ^ * /tmZ) • In this collective space, the
total wave function has the explicit form:
Ï P - / | C £» (w <KM*O «/-&•** ^
w-ihk dr.- 1(6*, B«- e / . ) 1 * J, ?,]* J/Mfi CtJ where K is the projection of the total angular momentum I on the intrinsic
z axis and $ is the symmetrized rotational function depending of the three
Euler angles S7 between the laboratory and the intrinsic axes. The HFB
wave functions 4> depend upon the nucléon coordinates x,(i=l,A), as well
as upon the shape variables. Note that <t> does not depend explicitly on
I or K (adiabatic approximation). The Bohr hamiltonian is determined
completely by seven functions of 0O and 02 , namely the collective potential
V and the six inertial functions: B0o, B02, B 2 2 , J x , Jy, J2- The calculation
of these seven functions at various deformations is performed throught a
constrained HFB method.
An important feature of this approach is that all the ingredients of
11

Eq.(6) can be calculated from the self-consistent HFB approach.
1.2.3 Constrained HFB method and inertial functions
To generate the microscopic HFB wave function, we use the HFB method
with external fields [18]. The HFB equations are obtained by a minimiza
tion of the total energy:
and the constraint conditions:
where H,// is the nuclear effective hamiltonian and A and n are Lagrange
parameters. The first two conditions ensure that average number of protons
and neutrons is conserved while the other ones prescribe triaxial deforma
tions characterized by q0 and q2. The calculation ol the HFB energy E
with respect to the intensity of the external fields Qo and Q2 generate the
so-called potential energy surface (PES), that is E(qo ,q2).
The inertia parameters are calculated in the cranking approximation
12
[14,16]. For the masses we have to calculate the moments:
I " m * ^ - - J
where n) and AJ are the quasi-particle wave functions, and e the
quasi-particule energy. The cranking HFB moments-of-inertia are given by:
-I c v i r* i* ->
We have tested the stability of the value of the inertia parameters as
a function of the size of the oscillator basis. The result is that these pa
rameters smoothly decrease in magnitude with an increasing number N of
major shells and reach constant values when N is enlarged from N = 7 to
N = 11. In this range of N values, the inertia parameters decrease by less
than 15 %, which is rather small.
On the other hand, the pairing correlations play an important role
for evaluating the inertia parameters. A small modification of the pair
ing strenth, for instance when shifting from Dl to DlSA force, induces a
large modification of these parameters and consequently of the spectra.
1.3 R E S U L T S
1.3.1 Potential energy surfaces
We have calculated the potential energy surface for the 6 2 F e and 6aNi
nuclei. The unknown isotopes of nNi and 7sNi have been calculated also
13
in order to anticipate their properties. These collective potentials shown
on Fig.3 are defined in terms of the traditional parameters 0 and 7 which
are related to 0O and 0i via 0O = 0cosi and 02 = 0sin*t. We observe that mFe is a very soft nucleus, i.e. its HFB energy does not change rapidly
with changing the deformation 0 and 7. In contrast, the potential for 7SNi
indicates that this nucleus is spherical and very rigid against 0 deformation.
This is not a surprising result, since this nucleus has a neutron full shell at
N=50. The potentials for bSNi and mNi also display a spherical minimum,
but for eaNi a second minimum exists near the deformation 0 =.3. This
minimum could correspond to a O^ deformed isomeric state. This very
interesting situation will be discussed later in the context of experimântjl
results (i.e. spin and parity as well as halflife) obtained for this state .
Fig. 4 shows the potential energy surface V(0,i = 0" and 60°) for r'2Fe
and Ni isotopes from A=68 untill A=78 as function of the 0 deformation.
Between the quasi magic nucleus 6 8 JVI and the douûly magic nucleus 7aNi,
the intermediate nuclei are moie or less soft around a spherical shape. In
addition, on Fig. 5 we have reported the two-neutron separation energy of
these isotopes presently calculated and for sake of comparison, their value
according to the predictions of Uno and Yamada [19] and Moller and Nix
[20].
14
1.3.2 Theoretical results ; Comparison with the datas
We have performed a numerical resolution of the Bohr Hamiltonian using
the code of Kumar [17,21]. The excited states obtained from this diagonal-
ization can be compared with the experimental results or allow us to make
some predictions for yet unknown nuclei. Due to the symmetries placed on
the Bohr Hamiltonian, only the rotationai-vibrational states with positive
parity could be obtain from its diagonalization.
The diagonalization of the Bohr Hamiltonian gives also the wave func
tions of the collective levels. These wave functions are interpreted as defor
mation probability amplitudes for the states in the collective space 0 — 7.
Calculated level schemes of 62Fe and 6 8/Vi are reported on Fig. 6 and
compared with measured results.
6 2 Fe
A good agreement is obtained provided that the moments of inertia
would be multiplied by 1.6 to reproduce the energy of the first 2+ state.
This spec:.' ai looks like a spherical nuclei spectrum. However, the very
flat potential energy surface of S2Fe (Fig. 3 and 4) indicates that non zero
dynamical deformations can exist in this nuleus. In fact, the deformations
of the first 0+, 2+, 4+ collective wave functions which are found are re
spectively 0/rms = 0.21, 0.25, 0.28, and -y/rms = 18° , 16° , 15°. Then this
15

nucleus seems to be soft with respect to beta and gamma deformations.
6 8 Ni
The energies of the first 0 + and 2 + excited levels are rather well repro
duced by the theory without any scaling factor for the moments of inertia.
An interpretation of the first two 0 + levels can be suggested by the dy
namical description. The structure of the potential energy surface of 6iNi
reported on Fig. 3 and 4, allows to describe the ground state as a spherical
s tate and the second 0 + , as associated to the deformed minimum. However
the only potential energy surface cannot give a definitive conclusion, since
the contribution of the collective inertia parameters and particularly of the
vibrational masses are important. The calculation shows that the mass-
parameter Boo is minimum at /?=0 and maximum near 0 = .3 deformation.
This mass-parameter governs the zero-point energy i.e. the energy of the
first 0 + with respect to the minimum of the potential energy surface. The
zero-point energy that we have found, permits to localize the Of level at
about 500 KeV above the minimum of the deformed well, that is below the
top of barrier in between the two minima (Fig. 4). This result, which indi
cates that the Of level is partially located in this second well, is confirmed
by the structure of the Oj" and Oj wave functions. These wave functions,
as shown in Fig. 7, include the square-root value of the metric given in
Eq.(8). This insures that these wave functions cancel out on the axis 7 =
0" and 60° as they should.
16
The first 0 + wave function is peaked near the spherical point while the
second 0 + wave function displays two peaks: the first one is located near
0 = 0 , and the second one is larger in magnitude with a maximum near
the deformation 0 = .3 . This wave function is in fact spreading over the
first (spherical) and the second (deformed) minima of the potential energy
surface (Fig. 4). Therefore it is plausible to interpret this Ot level as a shape
isomeric state. Other collective levels are reported on Fig. 6 together with
measured ones.
The DWBA analysis was performed for the measured states with the
same mechanism assumptions and optical potentials (Fig. 8 and Table 3).
Quantum numbers of the final states were assumed from the level scheme
resulting of the HFB calculations.
Both shape agreement and normalizing factors bring informations on
the likelihood of the quantum numbers. For the first three states, the
spin attribution is not ambiguous. For the two following states, two spin
values were guessed in each case ; The best shape agreement is obtained
with 0 + and 2 + for the levels at 2.70 and 3.28 MeV, respectively. The
normalization factor N = (dff/dttexp)/(d<r/dÛDWBA) reported on Table 4
does also indicate small spin values, which is to say that angular momentum
matching enhances small spin states.
At higher excitation energies, spin attribution is not at tempted for the
two last states identified at 3.45 and 4.12 MeV since the structures in the
angular distributions vanish.
Even thought the reaction mechanism description given with DWBA is
17
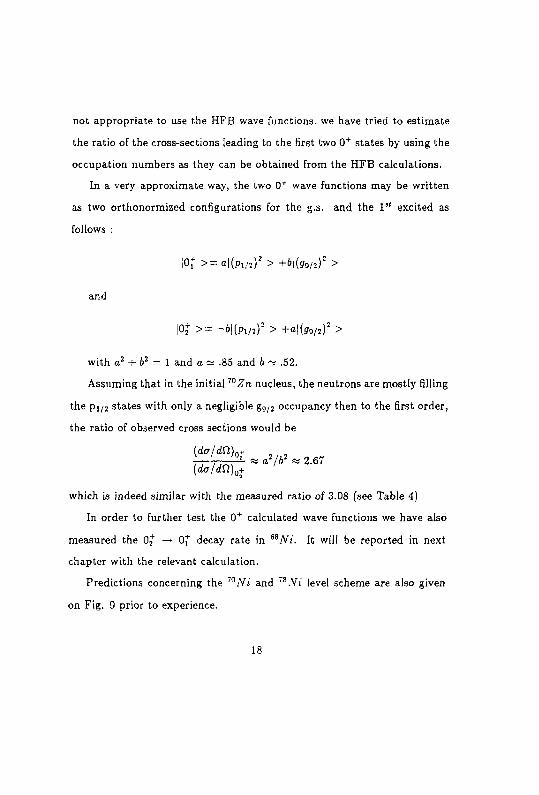
not appropriate to use the HFB wave functions, we have tried to estimate
the ratio of the cross-sections leading to the first two 0 + states by using the
occupation numbers as they can be obtained from the HFB calculations.
In a very approximate way, the two 0 + wave functions may be written
as two orthonormized configurations for the g.s. and the 1" excited as
follows :
|0j- > = a | ( p , / 2 ) 2 > +b\(gg/t): >
and
\°i >= -*I(PI/J) 2 > -H(ff9/2)2 >
with a? + b2 = 1 and a ^ .85 and b ~ .52.
Assuming that in the initial 70Zn nucleus, the neutrons are mostly filling
the p ^ 2 states with only a negligible g9/>2 occupancy then to the first order,
the ratio of observed cross sections would be
)_, ' "' « a 2/* 2 « 2.67 (da/dn)QÎ
which is indeed similar with the measured ratio of 3.08 (see Table 4)
In order to further test the 0 + calculated wave functions we have also
measured the Of —* 0* decay rate in 6aNi. It will be reported in next
chapter with the relevant calculation.
Predictions concerning the ,0Ni and lSNi level scheme are also given
on Fig. 9 prior to experience.
18
"Ni
We have not performed a dynamical calculation for 67Ni. Instead, we
have adopted the blocking procedure which is designed to describe the
first particle-hole excitations in even-odd nuclei [12|. This calculation is
performed as follows: we create a quasi-particle state on the even-even
core and then minimize the total energy functional with this new trial
wave function. This minimization was realized with different blocked quasi-
particle states close to the Fermi surface, assuming the spherical symmetry.
The blocked state which leads to the lowest energy in the minimization
procedure is associated with the ground state of the even-odd nucleus and
the following blocked states describe the first low-lying excited states. The
spin and parity assignment of the levels is given by the spin and parity of
the blocked single-particle states. Such method was already applied for the 73Zn nuclei [22 j . The result of these calculations for 6 7 N i is presented in Fig.
10. The first two levels in s7Ni are found separated by only 260 KeV. Given
that the blocking procedure is an approximation, since the quasi-particle
vibrational coupling which can induce a level shift, is neglected here, one can
only conclude that the 6 7JVi ground state is either 1/2" or 5/2~. In order
to appréciât the level of confidence attached to our calculated scheme, the
blocking calculation was also performed for 65Ni. We obtain the first two
levels very closed in energy as known from experience [23] but reversed.
Calculated spectrum of 69Ni is also reported prior to experiment.
Although the assumption of a direct pick-up of a three-nucleon cluster
is more questionnable, we have used it to calculate angular distributions of
19
the ( U C , l70) transfer reaction. The shape agreement and the value of the
normalizing factor defined as previously allows to argue on possible spin
values of the 67Ni states (Fig. 11 and Table 4).
The g.s. is assumed to be a 1/2" on the basis of its 0—7 decay scheme [9]
consistently with an adequate calculated shape of the angular distribution.
The occurence of 5/2" > at very low excitation energy is possibly hidden since
this level may be too close to the g.s. or its cross section may be smaller
than for a l/2~ state. The first excited state is likely a 9 /2 + although the
cross section is larger than expected. The three other states might be 3/2~,
but their angular distribution shapes are not caracteristic.
2 T H E MONOPOLE DECAY IN **NÏ
A series of light or medium mass nuclei have a 0 + as first excited
state i.e. I 6 0 , t0Ca, nGe, 90Zr, 96Zr and "Mo. The structure of these
Oj states shows enhanced symétries and collective properties. The new
isotope of 6SNi is similar to 30Zr since 40 nucléons are associated with 28
or 50 complementary nucléons respectively, which are both magic numbers.
Beyond N = 40, from classical shell model, the next subshell is the g9/2 for
which the two quasi particle excitation is lowered because of the stronger
coupling of a nucléon pair promoted on this subshell. The Nilson diagram
calculated for 6 8iVi, with the HFB method is reported on Fig. 12. For
20
not deformation, the 40 neutrons fullfill the successive subshells up to the
2pi/2' When a small deformation enters, due to some collective excitation,
the last pair of neutrons may shift to the g 9 / 2 subshell (on the l / 2 + or the
3 / 2 + orbital) in order to minimize the overall energy of the nucleus. The
occupation numbers are also reported which indicate the behaviour of the
nucleus as a function of deformation.
The decay times of the 0^ —» Oj" transition for the few even-even nuclei
mentioned are ranging from 20 to 400 ns. This time range has guided
our experimental choice. Decay times are related to the monopole strengh
parameter p, which involves mostly the initial and final wave functions.
Thus , half lives provide sensitive tests of these wave functions, given our
knowledge of the electro-magnetic transition operator.
2.1 Experiment
The half-life rl/2 of the first 0"1" excited state of 6 8 iVÏ has been derived
from the measurement of time delayed coincidences between the 1 6 0 emerg
ing from the ™ZnuC,K O) G 8 iVi(0j) reaction and the electron associated
with the saNi(0%) decay.
For sake of completeness we shall recall here the details of the experi
mental set up which was found adequate although simple.
The monopole decay occurs either by emission of conversion electrons
of 1.77 MeV energy, with a yield of 1/3 approximately or by pair emission
(e + ,e~) with a yield of 2/3 [24] . In this last case, the electrons show a
21
continuous energy spectrum from 0 to 0.75 MeV.
It would be possible to measure the monoenergetic electron line with a
solid state detector in the reaction chamber but the angular and counting
efficiencies would be too low. Thus we have chosen to rely on time infor
mation, provided by a plastic scintillator, which is able to detect any of the
emitted electrons. A thin circular scintillator sheet (e = 0.5 mm 4> — 100
mm) was set near the target parallel to the reaction plane, covering a solid
angle of 47r/3.
An aluminium foil of 0.05 mm thickness was interposed between the
target and the scintillator in order to absorb scattered ions or evaporation
particles. This foil introduces an energy threshold of 100 keV under which
electrons are not detected. The weak light produced by electrons is con
ducted under vacuum by reflexions on the wall of a very thin aluminized
mylar well, towards a 58 DVP photomultiplier. This special design was
intended to reduce the background from Compton electrons [25].
For this measurement, the 1 4 C beam of 72 MeV was pulsed at a rate
of 2,5 MHz (400 ns) with a 3 ns pulse width. The average current used
was 10 nA. The l60 ions, detected and identified as in chapter 1, were
measured at 9 — 6" lab, over a 5° range. Given the low cross-section (20
nb / s r ) , the experiment was designed so as to optimize the overall efficiency.
In particular, a thicker target of Zn (300 ± 30/ i j /cm 2 ) enriched to 70 %
with 70Zn, was prepared, for which the 1.77 MeV 0t excited state is no
longer resolved from the :sO emerging from back-scattering on the oxygen
target contaminant.
i i
The time distribution of the electrons associated with the decay of
^jVî'fOj) was measured with time to amplitude converter (TAC) triggered
by all particles crossing the first counter in the focal space of the mag
net. The PM amplified signal, suitably delayed, was analysed in the TAC
window, chosen to be 2 [is. Each beam pulse generates a burst of for
tuitous coincidences, since the PM counting rate is instantaneously high.
Therefore, the time spectrum exhibits a série of 5 peaks of chance events,
separated with 400 ns, showing a width of 80 ns. When a AE — E win
dow is set on the ionization chamber signals, so that 1 6 0 are selected, the
intensity of the chance coincidence peaks is divided by a factor of 10 and
their widths is reduced to 30 ns, which is the intrinsic time definition of the
counter triggering the time analysis.
On Fig. 13 the' bidimensional plot of time versus Bp is displayed. It
corresponds to the superposition of four measurements covering 24 hours.
The first strip of chance coincidences, labeled 0, countains both fortuitous
events and real ones (from atomic process for example). The four following
strips correspond to fortuitous events only. Since their intensity does not
decrease with time, there is no saturation effect and the counting efficiency
stays constant as function of time.
Between these strips, time events are seen. In the energy region of
the 1.77 MeV level of 5aNi, a number of events are observed which can
be attr ibuted to its decay. These events are superimposed with a random
background. The very low 1 6 0 counting rate (6/hour) gives a very small
probability of measuring two l 6 0 in the same 2 n-s window. Therefore
23
the real delayed coincidences can be analysed over the whole time window,
except for the 5 lines of fortuitous events.
The total number of significant events, in the energy region of the 1.77
MeV level, is 43. It is compatible with the number of 6iNi nuclei produced
during the exposure (ss 170) and it shows that detection efficiency is only
slightly smaller than the angular efficiency of 1/3.
Given the low statistic, the decay period has been extracted using a
maximum likelyhood method [26] whose entries are the measured times
of the events. This calculation was performed independently for the four
separated measurements and the final value for the period is Ti/2 = 211 ±4$
ns.
2.2 The monopole strength parameter p
The absolute transition probability W = 1/r may be written as the
product of an electronic factor f2, almost independent of the nuclear states
involved in the decay and the square of the nuclear "strength parameter"
p, which is independent of the atomic process :
The factor f2 can be decomposed as a sum of two terms, Qe is the electron
transition probability which takes place between the K(L.M) atomic shell,
towards the continuum state, and fiT is the formation of an electron pair
( e + , e - ) :
24
n = n s + n.
Using the work of Church and Weneser [27] one finds Qt = 1.126fijr.
In the case of the Ni isotopes, tlT and UK have been calculated [24] as a
function of excitation energy of the transition and their values are reported
in Table 5.
The strength parameter p is calculated as \JW'/fj = ±0.076 ± 0.010 .
It is related to the transition probability between the two 0 + states and it
writes
'-•ÇfrUïf-&)'- (bi-dr
where <t>< and 4>j are respectively the initial and final nuclear wave func
tions, rp is the position coordinate of the p'h proton and R is the nuclear
radii with respect to the proton distribution.
In most cases, the value of a is smaller than 0.1 [27] therefore only the
first term of the development is considered in actual calculations.
2.3 Calculation of the monopole nuclear strengh
The nuclear component of the halflife p, the monopole strength parameter
may be written as :
p =< 100|rj!200 > / < f- >
25
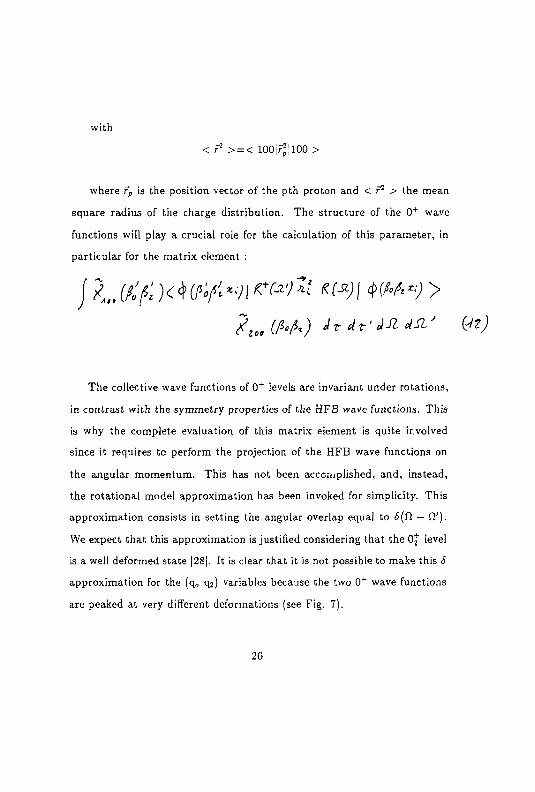
with
< F2 > = < 1001F;! 100 >
where fp is the position vector of the pth proton and < r 2 > the mean
square radius of the charge distribution. The structure of the 0 + wave
functions will play a crucial role for the calculation of this parameter, in
particular for the matrix element :
/ L tip* )< W*^i C M Z I K(Sitt ww >
The collective wave functions of 0 + levels are invariant under rotations,
in contrast with the symmetry properties of the HFB wave functions. This
is why the complete evaluation of this matrix element is quite involved
since it requires to perform the projection of the HFB wave functions on
the angular momentum. This has not been accomplished, and, instead,
the rotational model approximation has been invoked for simplicity. This
approximation consists in setting the angular overlap equal to 6(Q — CI').
We expect that this approximation is justified considering that the Oj level
is a well deformed state [28]. It is clear that it is not possible to make this S
approximation for the (q„ q 2) variables because the two 0 + wave functions
are peaked at very different deformations (see Fig. 7).
26
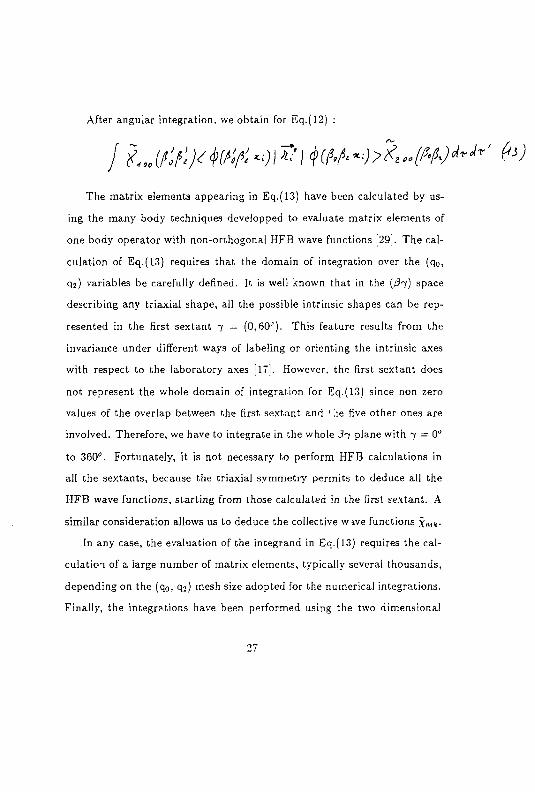
After angular integration, we obtain for Eq.(12) :
The matrix elements appearing in Eq.(13) have been calculated by us
ing the many body techniques developped to evaluate matrix elements of
one body operator with non-orthogonal HFB wave functions [29]. The cal
culation of Eq.(l3) requires that the domain of integration over the (qo,
q 2 ) variables be carefully defined. It is well known that in the (/3~/) space
describing any triaxial shape, all the possible intrinsic shapes can be rep
resented in the first sextant 7 = (0,60"). This feature results from the
invariance under different ways of labeling or orienting the intrinsic axes
with respect to the laboratory axes [17!. However, the first sextant does
not represent the whole domain of integration for Eq.(13) since non zero
values of the overlap between the first sextant and ' ,ie five other ones are
involved. Therefore, we have to integrate in the whole S'y plane with 7 = 0"
to 360". Fortunately, it is not necessary to perform HFB calculations in
all the sextants, because the triaxial symmetry permits to deduce all the
HFB wave functions, starting from those calculated in the first sextant. A
similar consideration allows us to deduce the collective wive functions Xmk-
In any case, the evaluation of the integrand in Eq.(13) requires the cal-
culatioT of a large number of matrix elements, typically several thousands,
depending on the (qo, q^) mesh size adopted for the numerical integrations.
Finally, the integrations have been performed using the two dimensional
27
Simpson's method developped by K.Kumar on a triangular mesh.
We obtain for p a value of 0.1075 with < | r 2 | > = 15.26 fm 2 . The cal
culated halflife of the 0% level of mNi using Eq.(lO) is r =152 ns. Taking
into account that this calculation is fully microscopic and does not coun-
tain any adjustable parameters (once the nuclear interaction is fixed), the
agreement with the experimental value of 211 ns is very impressive.
This result shows that the microscopic methods based on the mean field
approximation are now able to provide predictions in reasonable agreement
with experimental quantities, for instance the halflife of an excited level
which is very sensitive to details of the nuclear dynamics. The present
result involves a large amount of calculations:(i)- the microscopic HFB
method for evaluating the potential energy surface and inertia parame
ters; (ii)- the Bohr-Hamitonian resolution for obtaining the collective wave
functions; (iii)-the very long calculation of the overlap kernels and the off-
diagonal r 3 matrix element, necessary for the determination of the halflife.
Some approximations have been invoked for simplicity : the cranking model
for the collective inertia parameters, the adiabatic approximation for the
collective Hamiltonian, and the rotational model approximation for eval
uating the r" matrix element. At the present time, these approximations
together with the above calculation scheme represent the most complete
and tractable treatment. An ultimate goal would be to solve the whole
Griffin-Hill-Wheeler equations.
The theoretical results presently obtained for exotic nuclei like h2Fe and s s iVt permit to have some confidence in our prediction concerning the more
23
neutron rich isotopes which will be be studied in the future.
C O N C L U S I O N
In this article we have reported and summarized the experimental re
sults obtained recently on the nuclei m Ni, S8Ni and 6 2 F e and used these
results as testing grounds for the mean field theory. Excited states and
associated angular distributions have been measured for the ( U C , 1 6 0 ) and
( U C , 1 7 0 ) transfer reactions on MNi and ~°Zn targets.
The monopole transition between the first excited state 0* in e8Ni and
the ground state has been studied and its halflife measured from time de
layed coincidences.
Our theoretical analysis of the even-even nuclei have been conducted
as follows. In the first stage, the H.F.B. calculation of potential energy
surface was performed, which provides the static properties of the nuclei.
The cranking model has then been used to determine the inertia parameters
which are needed to calculate the nuclear dynamics. Finally, the dynamical
properties of the nuclei - collective wave functions and excitation energies
of the levels - have been deduced from a numerical diagonalization of the
full Bohr Hamiltonian, which is appropriate to describe low lying collective
states. The results agree well with measured scheme of even-even nuclei.
For even odd nuclei the blocking procedure provides a reasonable descrip
tion of the level s1. Tuence of "'Ni.
For the magic dJeus of ''8Ni we have shown that the first 0 + excited
29
state is most likely a shape isomer. Since the theory includes no free pa
rameters, it is remarkable that the measured half-life of this 0 + level is so
well reproduced by our calculations.
The good overall agreement between measurements and calculated re
sults indicates that the method and the D1SA effective interaction are
reliable for mean field theory calculations. On the basis of these excellent
results, one might expect to get reliable informations on the structure of 6 9iVt, nNi and the doubly magic 78Ni nucleus, for whk predictions are
given, prior to experiments. New experimental ways have 10 be invented
to further investigate these species and check those predictions.
Finally, the success of our calculations is due to a large extend to the
full self consistent realistic description of the nuclear dynamics.
We greatfully acknowledge the assistance of J.F. Berger in helping to
derive some of the formulaes, the help of I.M. Turkiewicz, E. Quiniou and
G. Parrot at different stages of the experiment and M.S. Weiss for rereading
the manuscript.
30
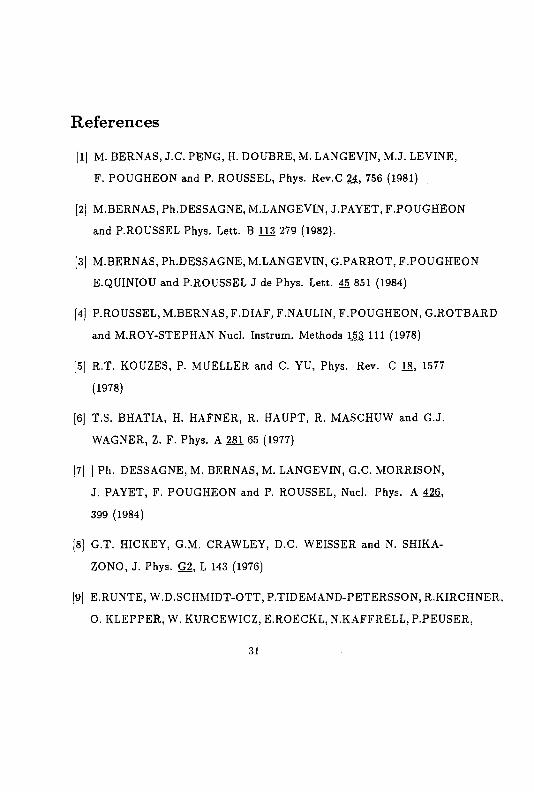
References
[1| M. BERNAS, J.C. PENG, H. DOUBRE, M. LANGEVIN, M.J. LEVINE,
F. POUGHEON and P. ROUSSEL, Phys. Rev.C 24, 756 (1981)
[2] M.BERNAS, Ph.DESSAGNE, M.LANGEVIN, J.PAYET, F.POUGHEON
and P.ROUSSEL Phys. Lett. B 113 279 (1982).
[3| M.BERNAS, Ph.DESSAGNE, M.LANGEVIN, G.PARROT, F.POUGHEON
E.QUINIOU and P.ROUSSEL J de Phys. Lett. 45 851 (1984)
[4] P.ROUSSEL, M.BERNAS, F.DIAF, F.NAULIN, F.POUGHEON, G.ROTBARD
and M.ROY-STEPHAN Nucl. Instrum. Methods 153 111 (1978)
[5| R.T. KOUZES, P. MUELLER and C. YU, Phys. Rev. C 18, 1577
(1978)
[6] T.S. BHATIA, H. HAFNER, R. HAUPT, R. MASCHUW and G.J.
WAGNER, Z. F. Phys. A 281 65 (1977)
[7] ] Ph. DESSAGNE, M. BERNAS, M. LANGEVIN, G.C. MORRISON,
J. PAYET, F. POUGHEON and P. ROUSSEL, Nucl. Phys. A 426,
399 (1984)
[8] G.T. HICKEY, G.M. CRAWLEY, D.C. WEISSER and N. SHIKA-
ZONO, J. Phys. G2, L 143 (1976)
[9] E.RUNTE, W.D.SCHMIDT-OTT, P.TIDEMAND-PETERSSON, R.KIRCHNER,
O. KLEPPER, W. KURCEWICZ, E.ROECKL, N.KAFFRELL, P.PEUSER,
31
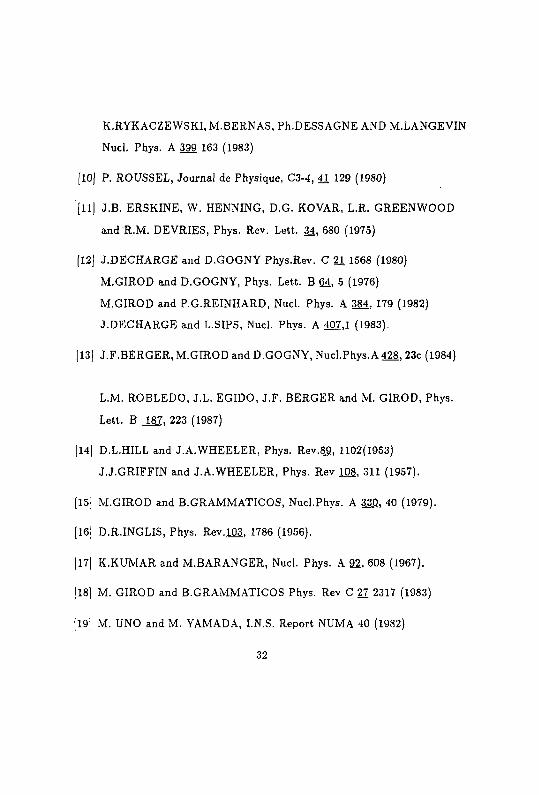
K.RYKACZEWSKI, M.BERNAS, Ph.DESSAGNE AND M.LANGEVIN
Nucl. Phys. A 399 163 (1983)
[10| P. ROUSSEL, Journal de Physique, C3-4, 41 129 (1980)
[11] J.B. ERSKINE, W. HENNING, D.G. KOVAR, L.R. GREENWOOD
and'R.M. DEVRIES, Phys. Rev. Lett. 34, 680 (1975)
[12) J.DECHARGE and D.GOGNY Phys.Rev. C 21 1568 (1980)
M.GIROD and D.GOGNY, Phys. Lett. B 64, 5 (1976)
M.GIROD and P.G.REINHARD, Nucl. Phys. A 384, 179 (1982)
J.DECHARGE and L.SIPS, Nucl. Phys. A 407,1 (1983).
[13] J.F.BERGER, M.GIROD and D.GOGNY, Nucl.Phys.A 428, 23c (1984)
L.M. ROBLEDO, J.L. EGIDO, J.F. BERGER and M. GIROD, Phys.
Lett. B JM, 223 (1987)
[14] D.L.HILL and J.A.WHEELER, Phys. Rev.89, 1102(1953)
J.J.GRIFFIN and J.A.WHEELER, Phys. Rev 108, 311 (1957).
[15] M.GIROD and B.GRAMMATICOS, Nucl.Phys. A 330, 40 (1979).
[16] D.R.INGLIS, Phys. Rev.103, 1786 (1956).
[17] K.KUMAR and M.BARANGER, Nucl. Phys. A 92, 608 (1967).
[18] M. GIROD and B.GRAMMATICOS Phys. Rev C 27 2317 (1983)
[19] M. UNO and M. YAMADA, I.N.S. Report NUMA 40 (1982)
32
(20) P. MOLLER and J.R. NIX, At. Data and Nucl. Data tables 26, 165
(1981)
[21| K.KUMAR , Prog. Part. Nucl. Phys. 9, 233 (1983)
[22] M.BERNAS, Ph.DESSAGNE, M.LANGEVIN, J.PAYET, F.POUGHEON,
P.ROUSSEL, W.D.SCHMIDT-OTT, P.TIDEMAND-PETERSSON and
M.GIROD Nucl. Phys. A 413 363 (1984)
[23] CM. LEDERER and V.S. SHIRLEY, Table of Isopes 7th ed. (1978)
[24] A. PASSO JA, Academic dissertation for Doctorat of Philosophy, Jyvâskylâ,
Finland (1980)
[25] W.K. WELLS, D. CEBRA, D.P. BALAMUTH, Nucl. Instrum. Meth
ods, 223, 103 (1984)
[26] B.T. CLEVELAND, Nucl. Instrum. Methods 214, 451 (1983)
[27] E.L. CHURCH and J. WENESER, Phys. Rev. 103, 1035 (1956)
[28] A. ZARINGHALAM and J.W. NEGELE, Nucl. Phys. A 288, 417
(1977)
[29] K.GOEKE,A.FAESSLER and H.H.WOLTER Nucl. Phys. A 183, 352
(1972)
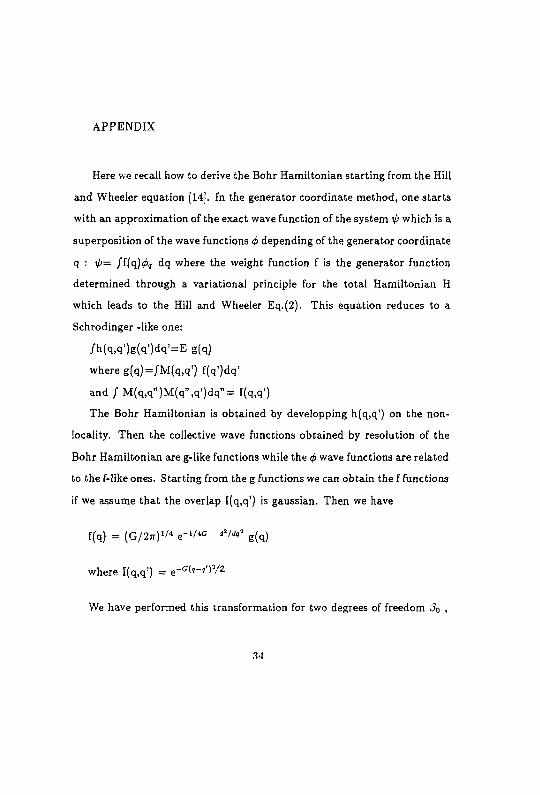
APPENDIX
Here we recall how to derive the Bohr Hamiltonian starting from the Hill
and Wheeler equation [14]. In the generator coordinate method, one starts
with an approximation of the exact wave function of the system 0 which is a
superposition of the wave functions <t> depending of the generator coordinate
q : 1/)= /f(q)<£, dq where the weight function f is the generator function
determined through a variational principle for the total Hamiltonian H
which leads to the Hill and Wheeler Eq.(2). This equation reduces to a
Schrodinger -like one:
/h(q,q')g(q')dq'=E g(q)
where g(q)=/M(q,q') f(q')dq'
and/M(q,q")M(q",q')dq"=I(q,q')
The Bohr Hamiltonian is obtained by developping h(q,q') on the non-
locality. Then the collective wave functions obtained by resolution of the
Bohr Hamiltonian are g-like functions while the <j> wave functions are related
to the f-like ones. Starting from the g functions we can obtain the f functions
if we assume that the overlap I(q,q') is gaussian. Then we have
f(q) = (G/27T)1/4 e-l'iG d''^ g(q)
where I(q,q') = <rGb-«"?'z
We have performed this transformation for two degrees of freedom /3o ,
34
02 to obtain the new collective f-type wave functions XnmStarting from the
g-type ones XniK°f the Bohr Hamiltonian. Due to the gaussian hypothesis,
we must verify that
35
FIGURE CAPTIONS
Fig. 1 - Spectra of l60 and l70 showing the excited states of mNi and 67Ni. The dashed area is due to oxygen target contaminant.
Fig. 2 - Scheme of ™Fe, from the ( H C , 1 6 0) reaction - right - from the e2Mn(/3 - 7)decay_left..
Fig. 3 - Triaxial deformation energy surface calculated for B2Fe, mNi, 70Ni
and 78Ni represented in the fi — -y space.
Fig. 4 - Axial deformation energy curve calculated for 6 2 i r e and for the
série of even Ni isotopes with A = 68 to A = 78.
Fig. 5 - 2 n separation energy of even Ni isotopes : comparison between
the present HFB calculations and the results of Uno and Yamada (19| and
Môller and Nix(20].
Fig. 6 - Collective levels (natural parities) of 6 2 F e and 6BNi compared with
experimental data.
Fig. 7 - Collective wave functions of the two 0 + first levels of e8Ni rep
resented in 0 — i space. Note that the five dimensionnal metric (Eq. 8)
which has been included here, makes the wave functions vanishing on the
36
axis 7 = 0" and 60°.
Fig. 8 - Angular distributions for the set of levels observed in Ni isotopes :
present measurements and DWBA calculations.
Fig. 9 - Predicted collective levels of the unknown isotopes of 70Ni and nNi.
Fig. 10 - Comparison of calculated levels of the odd 6 5Wt and 67Ni isotopes
with data. Calculated level scheme for mNi.
Fig. 11 - Angular distributions of the levels observed in 67Ni : present
measurements and DWBA calculations.
Fig. 12 - Neutron HFB single-particle spectra as function of the 0 param
eter. Occupation numbers are reported for each decimal value of the 0
parameter.
Fig. 13 - Determination of the halflife of the 0j" decay in ssNi.
37
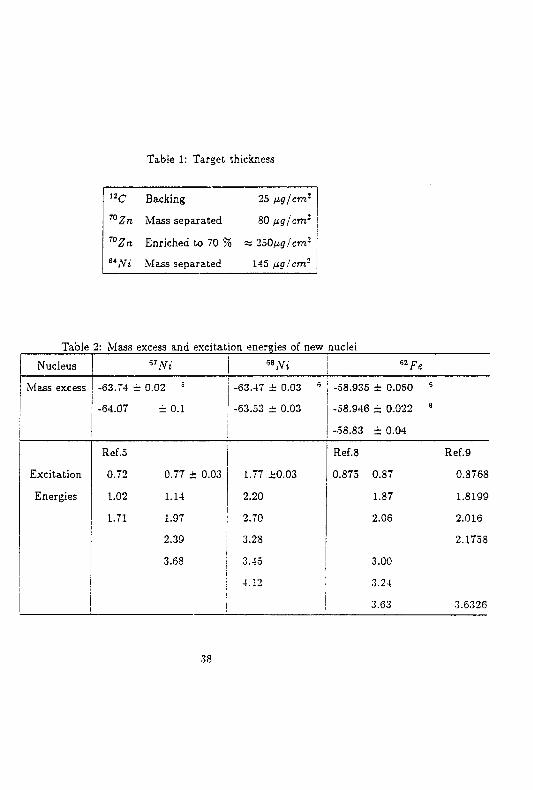
Table 1: Target thickness
25 ng/cm2
80 fig/cm2
=s 250fig/cm2 j
145 fj-g/cm2 \
Table 2: Mass excess and excitation energies of new nuclei Nucleus *7Ni r*Ni *2Fe
Mass excess -63.74 = 0.02 3
-64.07 = 0.1
-63.47 ± 0.03 6
-63.53 ± 0.03
-58.935 ± 0.050 6
-58.946 = 0.022 8
-58.83 ± 0.04
Excitation
Energies
Ref.5
0.72 0.77 ± 0.03
1.02 1.14
1.71 1.97
2.39
3.68
1.77 ±0.03
2.20
2.70
3.28
3.45
4.12
Ref.8 Ref.9
0.873 0.87 0.8768
1.87 1.8199
2.06 2.016
2.1738
3.00
3.24
3.63 3.6326
12 C Backing nZn Mass separated 7°Zn Enriched to 70 % s*Ni Mass separated
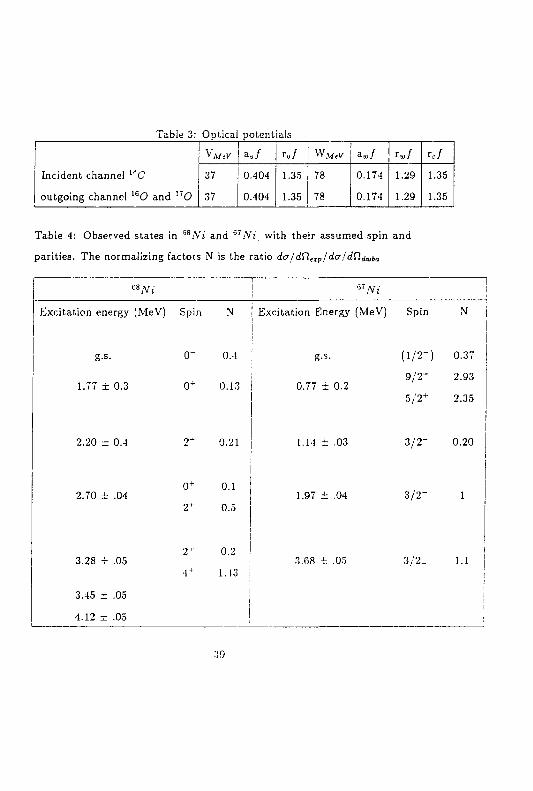
Table 3: Optical potentials
Incident channel l"C
outgoing channel 1 6 0 and I 7 0
V M-V a . / r./ W , W J V a»,/ r«,/ r./ Incident channel l"C
outgoing channel 1 6 0 and I 7 0
37
37
0.404
0.404
1.35
1.35
78
78
0.174
0.174
1.29
1.29
1.35
1.35
Table 4: Observed states in 6 S iVt and 67Ni, with their assumed spin and
parities. The normalizing factors N is the ratio da / dd!ip / da / dQ^wi,a
<*Ni 57Ni
Excitation energy (MeV) Spin N Excitation Energy (MeV) Spin N
g.s. 0~ 0.4 g-s- (1 /2 - ) 0.37
1.77 ± 0.3 0 + 0.13 0.77 ± 0.2 9 /2 ' r
5/2-*-
2.93
2.35
2.20 ± 0.4 Y~ 0.21 1.14 i .03 3 /2" 0.20
2.70 ± .04 0 +
2 +
0.1
0.5 1.97 ± .04 3 /2" 1
3.28 ± .05 2"
4 +
0.2 i
1.43 ! 3.68 ± .05 3/2_ 1.1
3.45 ± .05 ! i
4.12 ± .05 i
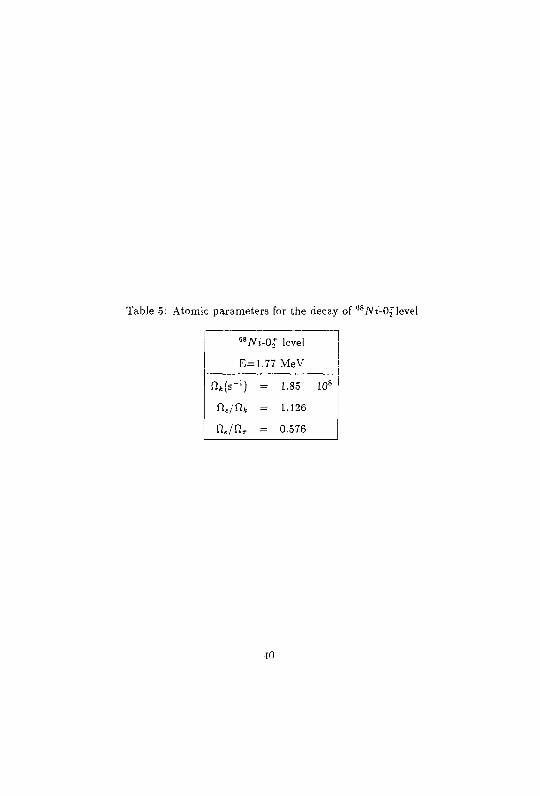
Table 5: Atomic parameters for the decay of b 8yVi-0jlevel
™Ni-OZ level
E= •-l.il MeV
n*(s-L) = 1.85 10 8
n«/n t = 1.126
n«/n, = 0.576
10
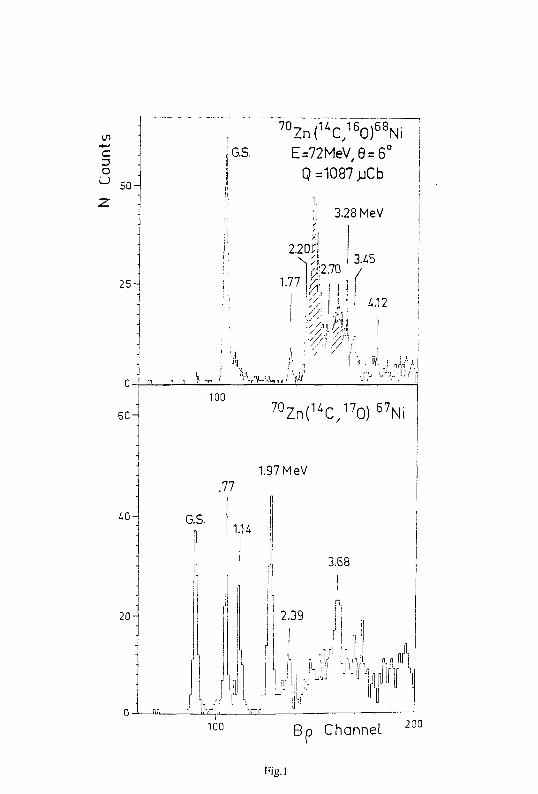
7 0 2 n ( U c ; 6 0 ) 6 8 N , J OS. E=72MeV / 9 = 6° I Q=1087jjCb
3.28 MeV
2.2 m N Cl 3.45
1-77 |^: , / 1%
£.12
V ^ < ^ W l _ i u u v'J i ! ' l \ 100
7 0 Z n ( u C / 7 O ) 6 7 Ni
1.97MeV .77
G.S. f l 1.H
3.68
2.39
i idhA ^ h ^n
100 Bp Channel 200
Rg.l
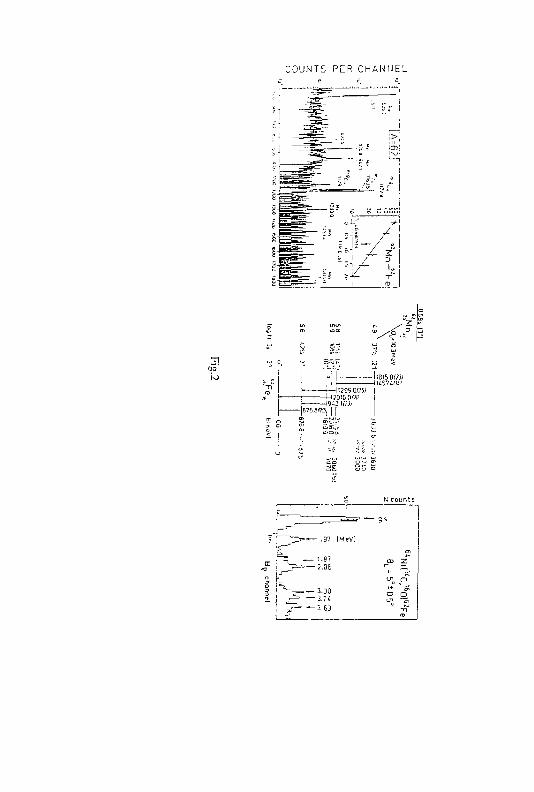
COUNTS PER CHANNEL
3! LU Imioi'ii ' i i iUSVi lK '
- — 11299 OCT ! -1H2015.0/W. |
.», | |
S N counts
! • — — ! — g.s — g.s
l f ~ ^ — -81 |MeV!
^ en
! ~ — • — / 0 6 CD -Z.
! ~ — • — / 0 6 >~ ~ I j ~ ~ ' ~ ~ " £ o 1 =s = 1 ^ - - - = — 3 . 0 0
^0 P
! g f - = - 3 . 6 3 -n 1 -- ro
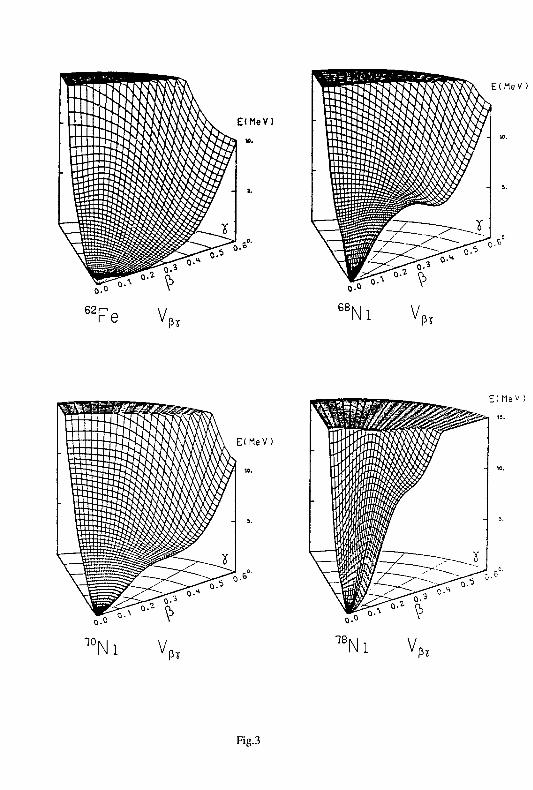
E ( M e V )
62 Fe V
E l M e V )
68
Pï Ni V
PÏ
E ( M e V )
10 Ni V
E ( M e V !
18
Pï Ni V
PÏ
Fig.3
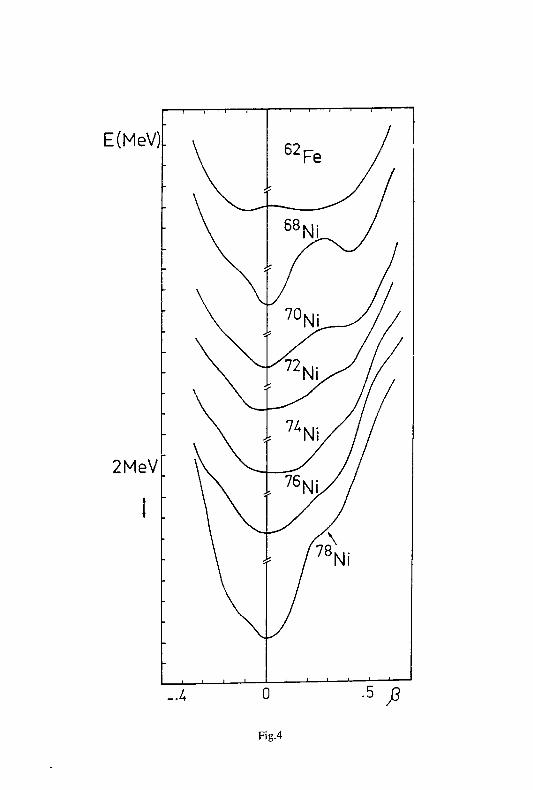
E(MeV)
2MeV|
i
_ l I L_
-i 1 1 1 r-
-A fi Fig.4
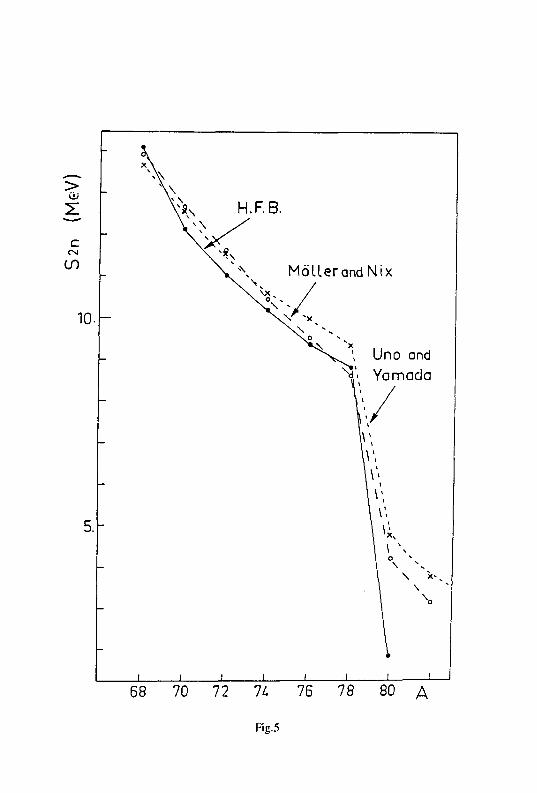
K\\ H.F.B.
Mollerand Nix
\ Uno and "^ Yamacla
68 70 72 IL 76 78 80 A
Fig.5
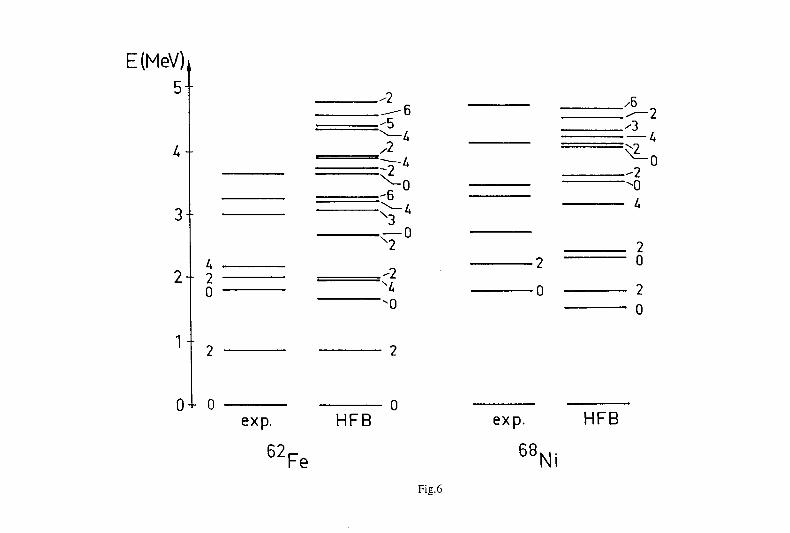
E(MeV) i
5-
4-f
0 4- o
^ f i / O
-5 ^
/2 "vL ' ^ ... ^ - 2 ^ 0 > n
- 2 ^ 0
-6 - 2 ^ 0
^ — A 4 x 3 v°
2
0
2 0
-9 2
0 V, 2
0 2 "U
2
0 2
->
- o
n
exp. 62
HFB
Fe
exp. 68
HFB
Ni Fie.6
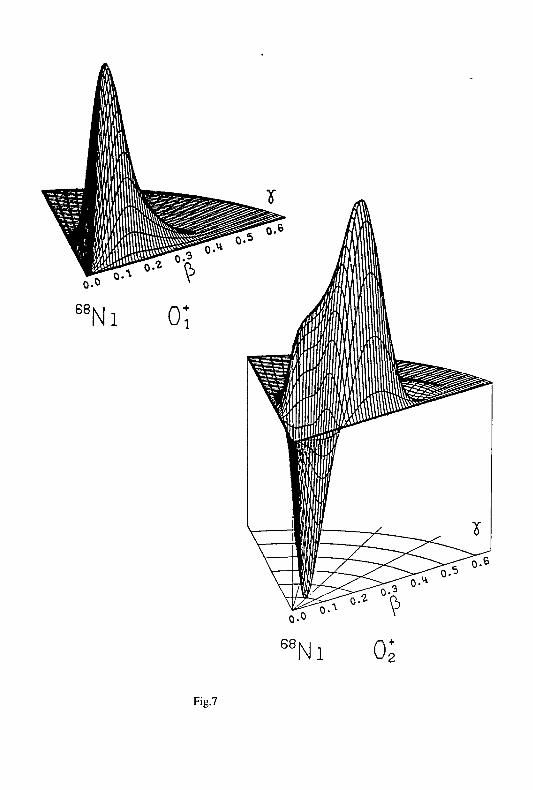
Fig.7
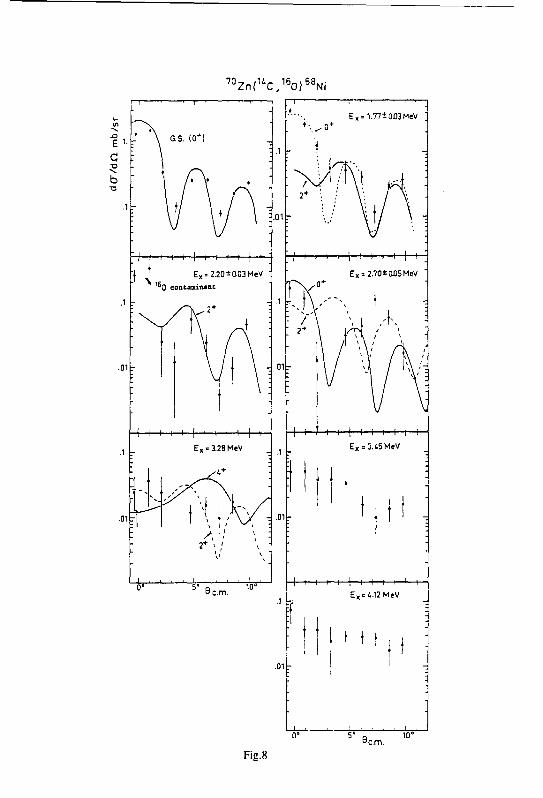
7 0 Z n ( 1 i c / 6 0 ) 6 8 N i
G
-1—!—I—I—|—I—I—I—I—|—!-
' E,= 2.20*0.03 MeV ^ 0 concaminanc
- I—I—i—i——i—i—i—I—h- t -
.01
E,< = 1.77 ±003 MeV
- i— \—*—\—!—I—I—I——H
Ex=2.7O*0D5MeV
- H - t -E x = 3.t5MeV
h i t
-\—i—i—i—i—!—i—i—i—i—|—t-E x = 4.12MeV
t I
Fig.8
0° 5 ° A °c.m.

E(MeVh 5 -
i*-
3 -
2-
1 -
2
0
-2
k 2 0
2 0
U
2
0
0
2
0 + HFB
Ni
HFB
Ni
Fig.9
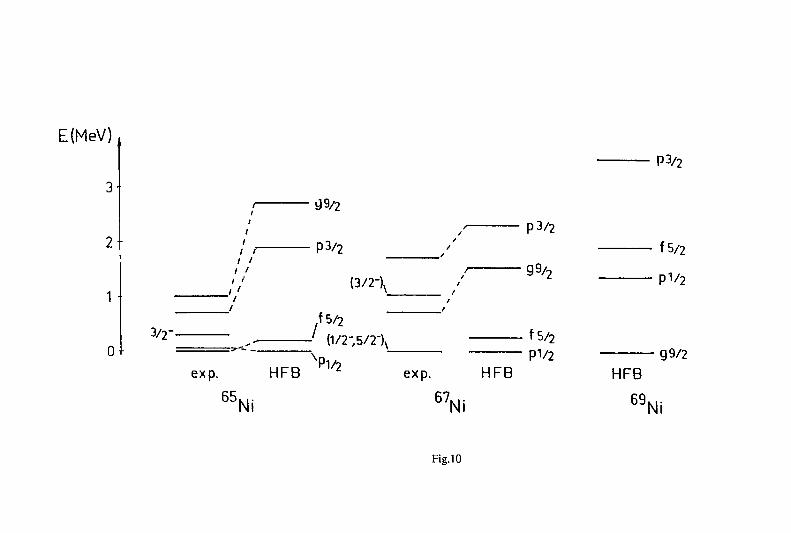
3-
3/2"
/ / / / / '
99/2
P3/2
(3/2"
/
exp. HFB 65 M .
Ni
f 5/2 (1/2-,5/2-)N
exp.
p3/ 2
99/2
f 5/2
p1/2 HFB
6 7 N i
P3/2
f 5/2
pV 2
g 9/2 HFB
69 Ni
Fig. 10
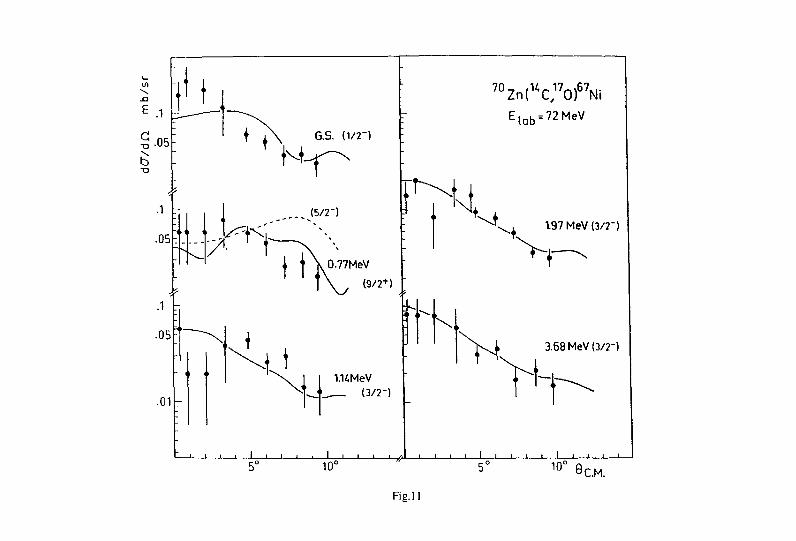
XI
a FÛ
.05-6.S. (1/2-)
b X) rw
0.77MeV
(9/2+)
I.UMeV (3/2")
5° 10° / — —
Fie.ll
70-, ,U„17_,67. . . Zn( C, 0) Ni
E l Q b = 72MeV
M "H 1.97 MeV (3/2")
3.68 MeV (3/2")
_i L 5° 1 0 ° B C K
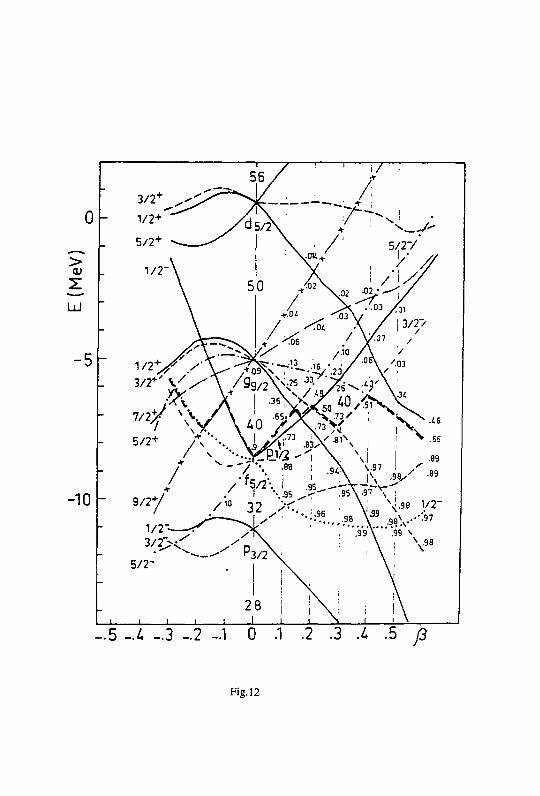
.5 -M -.3 -.2 -.1 0 .1
Fig. 12
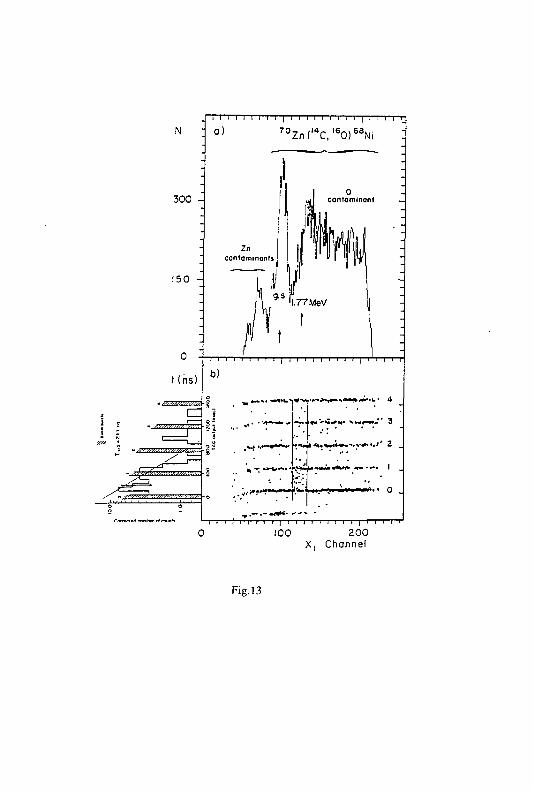
300 -
150
0 •
t (ns)
T i l l I T rT"T"i—i i i i i i i i i I i i i i n
a) 7 0 Z n ( , 4 C , , 6 0 ) 6 8 N i
Zn contaminants
b)
zm fey» «KHKAMfeiH
I I I 1 1 I 1 I I I ' I I I I
' i ' 7 - r r i i i i i 100 200
X. Channel
Fig. 13

PUBLICATION X
J. Physique Lett. 45 (1984) L-851 - L-855 1" SEPTEMBRE 1984, PAGE L-851
Classification Physics Abstracts 21.10
Halflife of the first excited state (0+) of "Ni
M. Bernas, Ph. Dessagne (*), M. Langevin, G. Parrot, F. Pougheon E. Quiniou and P. Roussel
Division de Recherche Expérimentale, IPN d'Orsay, B.P. N° 1. 91406 Orsay Cedex, France
(Reçu le 21 mai 1984, accepté le 3 juillet 1984)
Résumé. — La période du prsmier niveau (0*) du "Ni a été déterminée à partir du spectre en temps obtenu dans la mesure des coïncidences des "O de la réaction , 0 Zn(' 4 C, u O ) 6 , N i * et des électrons, associés à la décroissance de ce niveau. L'attribution du «pin 0* a été ainsi confirmée.
Abstract. — The confirmation of the 0* spin assignment and the halflife value of the first excited state of b d Ni has been derived from the time spectra obtained in the coincidence measurement of the "O from the '"ZnC'C, 1 6 0 ) 6 , N i • reaction with the electrons associated to the decay of this ievel.
The spectroscopy of the 6 8 N i nucleus provides a good illustration of a shell closure effect We have recently reported on the 6 8 N i spectra studied with the , 0 Z n ( 1 4 C , s O)'"Ni reaction [1] ; the first excited state was observed at an excitation energy of 1.77 MeV. From accurate angular distribution measurements performed around 0°, a spin 0 + was assigned to this level.
The y-decay of this level towards the ground state (0* -* 0* transition) is forbidden and it decays either via Ea internal conversion or via electron-positron pair emission. While the detection of the electrons associated to both decays would confirm the 0* spin attribution, the halflife determination will provide an insight into the 6 8 Ni(0£) and s , N i ( 0 , + ) g.s. wave functions involved in the transition.
In this Letter we report on a time measurement of electrons emitted by the 6 8 N i 0£ level, populated with the same ' " Z n ^ C , l 6 0 ) 6 8 N i transfer reaction. From the 0J halflife determination, the nuclear matrix clement of the monopole transition can be deduced rather accurately.
The Orsay MP tandem delivers a 72 MeV beam of ! 4 Q pulsed at a rate of 2.5 MHz (400 ns) for ~ 3 ns pulse width. The average beam current used was 10 nA. The ' s O ejectiles were identified and their energy spectra measured as described in reference [1], in which a cross-section of ~ 20 n barn/sr has been measured for the formation of the " N i 0J level, averaged over 5° at 6 = 6° lab. Given this low yield, the present experiment was designed so as to optimize the detection efficiency while maintaining a reasonable random coincidence rate (Fig. 1). A 300 ± 30 ug/cm 2 thick Zn target, enriched to 70 % with 7 0 Z n was used, for which the 1.77 MeV level is no longer resolved from the g.s. ' e O produced on the O contaminant contribution (Fig. 2).
(•) Permanent address : CRN de Strasbourg.
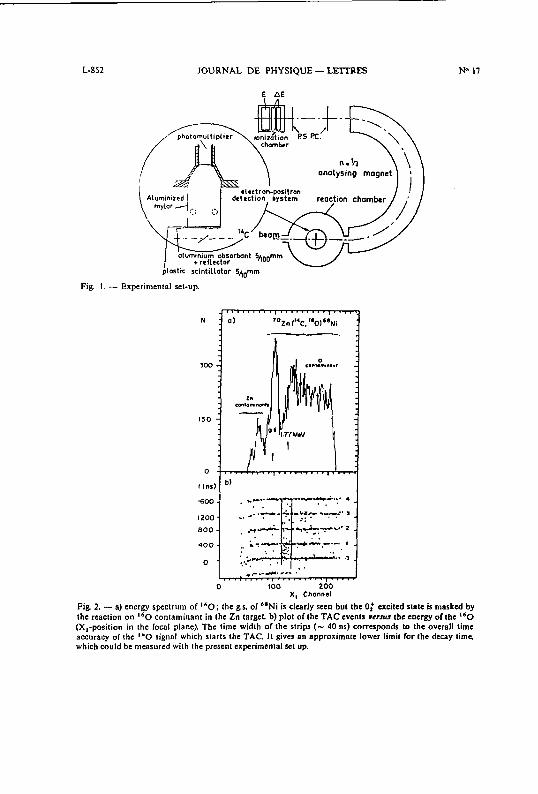
L-852 JOURNAL DE PHYSIQUE — LETTRES N° 17
photomulliplier
id \ss. Atuminired
mylar
aluminium absorbant !unn m m • reflector ^ T O
plastic scintillator 5 ^ m m
Fig. 1. — Experimental set-up.
J ' ' ' l ' • • i N i °> r oZn( , 4C.'*0)«8l
0 100 2 0 0 X, Chonnel
Fig. 2. — aj energy spectrum of * * 0 ; the g.s. of * 8 N i is clearly seen but the 0 / excited state is masked by the reaction on l 6 0 contaminant in the Zn targeL b) plot of the TAC events versus the energy of the I 6 0 (X,-position in the focal plane). The time width of the strips (~ 40 ns) corresponds to the overall time accuracy of (he ' " O signal which starts the TAC. It gives an approximate lower limit for the decay lime, which could be measured with the present experimental set up.
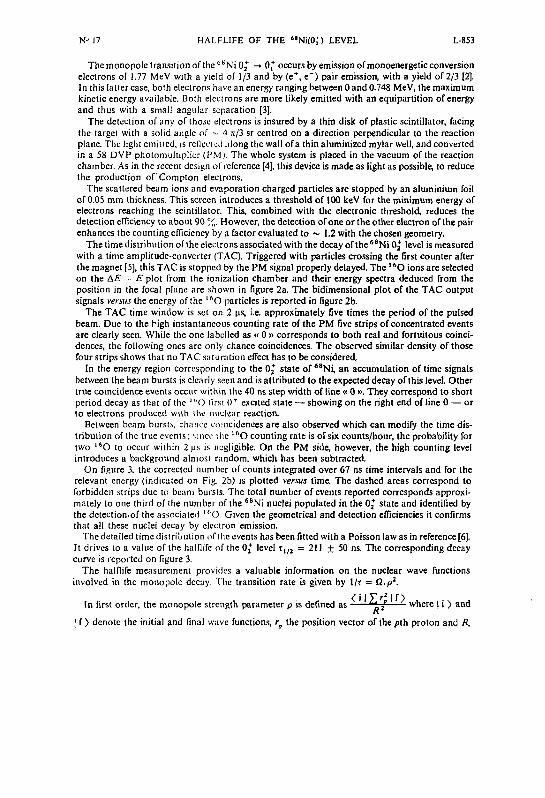
N J 17 HALFLIFE OF THE 68Ni(0j) LEVEL L-853
Themonopole transition of the '"Ni 0^ -• 0,+ occurs by emission of monoenergetic conversion electrons of 1.77 MeV with a yield of 1/3 and by (e*, e") pair emission, with a yield of 2/3 [2]. In this latter case, both electrons have an energy ranging between 0 and 0.748 MeV, the maximum kinetic energy available. Both electrons are more likely emitted with an equipartition of energy and thus with a small angular separation [3].
The detection of any of those electrons is insured by a thin disk of plastic scintillator, facing the target with a solid angle of - 4 ;t/3 sr centred on a direction perpendicular to the reaction plane. The light emiticd, is reflected along the wall of a thin aluminized mylar well, and converted in a 58 DVP photomultiplier (I'M). The whole system is placed in the vacuum of the reaction chamber. As in the recent design of reference [4], this device is made as light as possible, to reduce the production of Compton electrons.
The scattered beam ions and evaporation charged particles are stopped by an aluminium foil of 0.05 mm thickness. This screen introduces a threshold of 100 keV for the minimum energy of electrons reaching the scintillator. This, combined with the electronic threshold, reduces the detection efficiency to about 90 %. However, the detection of one or the other electron of the pair enhances the counting efficiency by a factor evaluated to ~ 1.2 with the chosen geometry.
The time distribution of the electrons associated with the decay of the 6 8 Ni Oj level is measured with a time amplitude-converter (TAC). Triggered with particles crossing the first counter after the magnet [5], this TAC is stopped by the PM signal properly delayed. The 1 6 0 ions are selected on the AE - E plot from the ionization chamber and their energy spectra deduced from the position in the focal plane are shown in figure 2a. The bidimensional plot of the TAC output signals versus the energy of the l 6 0 particles is reported in figure 2b.
The TAC time window is set on 2 us, i.e. approximately five times the period of the pulsed beam. Due to the high instantaneous counting rate of the PM five strips of concentrated events are clearly seen. While the one labelled as « 0 » corresponds to both real and fortuitous coincidences, the following ones are only chance coincidences. The observed similar density of those four strips shows that no TAC saturation effect has to be considered.
In the energy region corresponding to the 0^ state of 6 8 Ni, an accumulation of time signals between the beam bursts is clearly seen and is attributed to the expected decay of this level. Other true coincidence events occur within the 40 ns step width of line « 0 ». They correspond to short period decay as that of the '"() first <)T excited state — showing on the right end of line 0 — or to electrons produced wilh the nuclear reaction.
Between beam bursts, chance coincidences are also observed which can modify the time distribution of the true events; '.nice ihe 1 6 0 counting rate is of six counts/hour, the probability for two 1 6 0 to occur within 2 u.s is negligible. On the PM side, however, the high counting level introduces a background almost random, which has been subtracted.
On figure 3, the corrected number of counts integrated over 67 ns time intervals and for the relevant energy (indicated on Fig. 2b) is plotted versus time. The dashed areas correspond to forbidden strips due to beam bursts. The total number of events reported corresponds approximately to one third of the number of the 6 B Ni nuclei populated in the 0^ state and identified by the detection.of the associated "O. Given the geometrical and detection efficiencies it confirms that all these nuclei decay by electron emission.
The detailed time distribution of the events has been fitted with a Poisson law as in reference [6]. It drives to a value of the halfiifc of the 0^ level t 1 / 2 = 211 + 50 ns. The corresponding decay curve is reported on figure 3.
The halflife measurement provides a valuable information on the nuclear wave functions involved in the monopole decay. The transition rate is given by 1/r = Q.p2.
In first order, the monopole strength parameter p is defined as ~rf where | i > and
| f > denote the initial and final wave functions, r p the position vector of the pth proton and R,
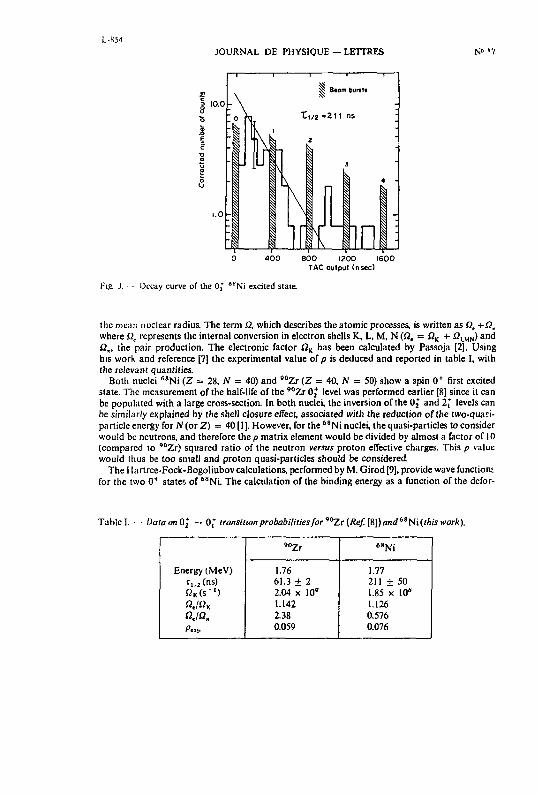
L-S51 JOURNAL DE PHYSIQUE — LETTRES
-1 1 1 1 r
N° '7
2 10.0
800 1200 ISOO TAC output (nsec)
Fig. . Oecay curve of the Oj 6 8Ni excited stale.
the mean nuclear radius. The term Û, which describes the atomic processes, is written as Qc +Qfl
where fic represents the internal conversion in electron shells K, L, M, N (Qt = QK + J \ M N ) and £2„ the pair production. The electronic factor flK has been calculated by Passoja [2]. Using his work and reference [7] the experimental value of p is deduced and reported in table I, with the relevant quantities.
Both nuclei fi8Ni (Z = 28, N = 40) and '°Zr (Z = 40, N = 50) show a spin 0 + first excited state. The measurement of the half-life of the 9 0 Zr 0, level was performed earlier [8] since it can be populated with a large cross-section. In both nuclei, the inversion of the Oj and 2\ levels can be similarly explained by the shell closure effect, associated with the reduction of the two-qua;i-particle energy for N (or Z) = 40 [1]. However, for the 6"Ni nuclei, the quasi-particles to consider would be neutrons, and therefore the p matrix element would be divided by almost a factor of 10 (compared to 9 0Zr) squared ratio of the neutron versus proton effective charges. This p value would thus be too small and proton quasi-particles should be considered.
The Hartree-Fock-Bogoliubov calculations, performed by M. Girod [9], provide wave function-for the two 0 + states of 6 8 Ni. The calculation of the binding energy as a function of the defor-
Tablel. • Data on OJ — 0,* transition probabilities for ,)0Zt(Ref.[K\)and6aN\(ihis work).
Energy (MeV)
-°ZT 6 8 N i
Energy (MeV) 1.76 1.77 t , , 2 (ns) 61.3 ± 2 211 ± 50 n K ( s - ' ) 2.04 x 10 9 1.85 x 10" fi./«K 1.142 1.126
««/fi» 2.38 0.576 P,,,, 0.059 0.076
N" 17 HALFLIFE OF THE "NKOj ) LEVEL L-855
mation ji shows that the 6 8 N i 0 / level corresponds to a deformed isomeric state (fi s 0.35) [10]. The 6 8 N i Nilson orbitals indicate a crossing of the lf 7 ; 2- and 2 p 3 ; 2 - subshells around /? ~ 0.22, subshells which concern the last protons in 6 8 N i . The two 0 + levels in 6 8 N i can be represented, as in reference [II], by a mixture of two orthonormized configurations of the two valence protons : the ground state wave function can be written as a | lf 7 / 2 ) 2 + b | 2 p 3 / 2 > 2. With a small value of b = 0.13. consistent with (he occupation numbers obtained by Curod, and assuming the nucléon radius r n = 1.25 fermi. the p value is calculated to be 0.083 compatible with the value of 0.076 resulting from our measurement.
In spite of the very small formation cross section of t h e 0 2 level of 6 8 N i , the halflife of this state has been measured. The comparison of the associated p value with the 9 0 Z r results and with the H.F.B. calculations of 6 8 N i suggests that the two-proton quasi-particle excitation is a configuration entering this state which explains the monopole transition strength towards the ground state.
Acknowledgments.
We wish to acknowledge useful suggestions and comments from D. Balamuth and R. Lombard.
References
[J] BERNAS. M., DESSAGNE, Ph.. LANGEVIN. M., PAYET. J., POUGHEON. F. and ROUSSEL. P.. Phys. Lett. I13B4 (1982) 279.
[2J PASSOJA. A.. Academic dissertation for doctoral of Philosophy. Jyvaskyla. Finland (1980). [3| OPPENHEIMER. J R . Phys. Rev. 60 (1941) 164. [4] WELLS, W.K., CEDRA. D and HALAMUTH, D.P., to be published in Nucl. Instrum. Methods. [5] ROUSSEL, P.. BERNAS. M.. DIAL F.. NAULIN. F.. POUGHEON. F., ROTBARD, G. and ROY-STÉPHAN, M..
Nucl. Instrum. Methods 153 (1978) 111. [6] CLEVELAND. B.T.. Nucl. lustrum. Methods 214 (1983) 451. [7J CHURCH. E.L. and WENESPR. J.. Phys. Rev. 103 (1956) 1035. (8] BURCH. D.. Russo. P.. SWANSUN, H. and ADELBERGER, E.G., Phys. Lett. 40B (1972) 357. [9] GIROD, M . CEA Bruyères le C'hatel, Private communication.
[10] BERNAS, M., DESSACNE. Ph.. »i; BOER. J.. LANGEVIN. M.. POUGHEON. F., ROUSSEL. P.. ZAIDINS. C, 4th Intern. Conf. on Nucl. Tar from stability, Ed. CERN, Helsingor 1981. p. 397.
[Il] SHELINE. R.K.. Physica 23 (1957) 923. BAYMAN. B.F.. RLINER. AS. and SHELINE. R.K., Phys. Rev. IIS (1959) 1627.

PUBLICATION XI
Nuclear Phvsics A * l l I 1W5) 237-261) < North-Hol land Publishing Company
DECAV STUDIES OF NEUTRON-RICH ISOTOPES OF MANGANESE, IRON, COBALT. NICKEL, COPPER AND ZINC
I:. R l ' N T I . . K.-L. (MPPI-.RT. W.- l) . S C H M I D T - O I T , P. TIDhMAND-IM-. IT-RSSON .ind L. ZIE.Gi L I R
II. I'hvsikali.sihes Imtttut, I'niivrutiil Ciiittingvn, .U00 Cioitmxen, led. Rvp. of (n-rmanv
R. K1RCHNP.R. O. K I . IPPI .R . P.O. [ A R S S O V . I-;. K O K ' K L and I). S C H A R P T
OSt Darmstadt. 61 (HI Darmstadt, h'd. Rep. n( (h-rmam
N. K A I I R I . L 1 . and P PHUSf-R
Institut tiir Kernvlwmw. I'nucruiat Mainz, 6MMI Mam:, H'd. Rfp. i>\>'Cicrmanr
M. l l f .RNAS, P DLSSACiNI ** and M. I A N G r Y I N
Institut de I'hwttfM- Smleatre. lit* no. I. *>t40i Orsav. frante
and
K. R Y K A C Z t - W S K I * * *
hwvtui hizvki DoKwiudc-ahiet. I 'niwcrwtei Warszawskt. fUI-6SI Warsaw. I'uland
Received : : I ehruary IWtf
Abstract: \ 4<> mg cm thick " " W target was irradiated with an I I *> \1eV u "Se heam. On-line mass-separated samples ti l ' projectile-like neutron-rich products from mulu nucléon transfer react ions were investigated h\ fiy spcctm-cop\ in the mass region A *2 74. Decay properties of the nuclei " M n 11).71 s i, ' ' l e O H si, '' i H 11 .""s , i , ' ' ' \ i ( i n . i .mil ' l , " / n is S si were measured Tor the first time. h>r '' \ i a deca*. scheme could he constructed using information from new y-transitioiis I he known decay schemes ol" ' " ' \1n. ' ' l e . ' " ( o and '" '( 'u were extended S'evv half-lite values of neutron-rich isotopes are compared with theoretical predictions.
RADIOAC I I V I I V ' \ l n . " l e . ( o. " " S i . ' " ( u. " " / n | f rom \V|" Se. X) . / I ' I 1.5 MeV nucléon, mass separalion|: measured (•'_. / , . fty . yy-coin, / , .; deduced log ft.
'"'f-e. ' " ' C o . ' " ' " N i . '" ( u. " ' V n tleduccd levels. I TT. Plastic scintillators. t i e deleciors.
I. Introduction
In a series of experiments, earned oui .il the GSI on-l ine muss separator dur ing ihe ktst three \e.irs. decay properties o f new neutron-rieh nuclides have hcen
' I'reM-nt address Kf I \ -M*. I'-'-M Stockholm. Sweden " Present address ( voire de Kct. hen. lies \udeai res. HP no 2U. o7u.;? Strasbourg. I ranee. " * I'.i i T i i IK siipporti-d In Polish M unary of S U C I K C . Nigh I ducalion and technics under the contract
MR I s m u
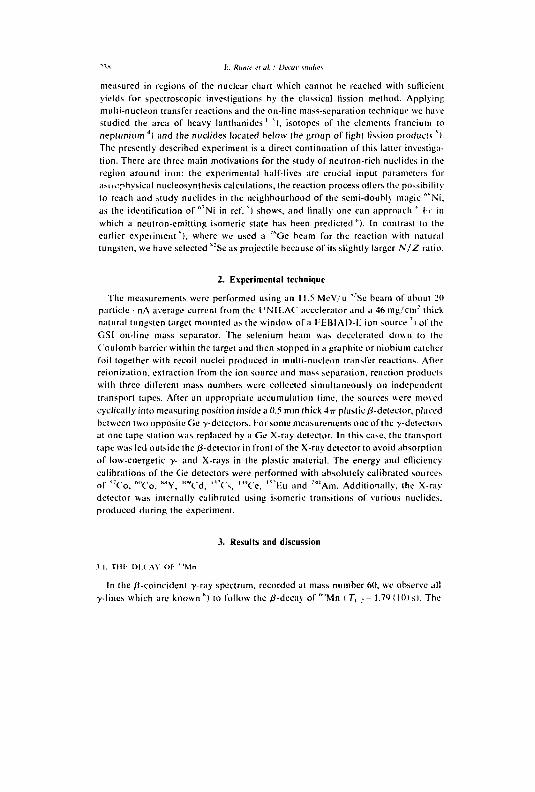
MX /:. Runlv (7 al. ! Dctav \liulu'\
measured in regions of the nuclear chart which cannot be reached with sufficient yields for spectroscopic investigations by the classical fission method. Applying muhi-nucleon transfer reactions and the on-line mass-separation technique we have studied the area of heavy lanthanides ' ' ), isotopes of the elements francium to neptunium 4) and the nuclides located below the group of light fission products ' ) . The presently described experiment is a direct continuation of this latter investigation. There are three main motivations for the study of neutron-rich nuclides in the region around iron: the experimental half-lives are crucial input parameters for asuv:physical nucleosynthesis calculations, the reaction process offers the possibility to reach and study nuclides in the neighbourhood of the semi-douhly magic ""Ni. as the identification of f , 7Ni in réf.") shows, and finally one can approach '' I T in which a neutron-emitting isomeric state has been predicted''). In contrast to the earlier experiment "), where we used a ' ( 'Ge beam for the reaction with natural tungsten, we have selected * :Se as projectile because of its slightly larger N/Z ratio.
2. Experimental technique
The measurements were performed using an 11.5 MeV/u "'Se beam of about 20 particle • nA average current from the I'NILAC accelerator and a 46 mg/crn : thick natural tungsten target mounted as the window of a H-UIAIJ-i: ion source I of the GSI on-line mass separator. The selenium beam was decelerated down to the Coulomb barrier within the target and then stopped in a graphite or niobium catcher foil together with recoil nuclei produced in mulli-nucleon transfer reactions. After rcionization, extraction from the ion source and mass separation, reaction products with three different mass numbers were collected simultaneously on independent transport tapes. After an appropriate accumulation lime, the sources were moved cyclically into measuring position inside a 0.5 mm thick 4;r plastic 0-detector, placed between two opposite Ge y-detectors. For some measurements one of the y-deteclors at one tape station was replaced by a Ge X-ray detector. In this case, the transport tape was led outside the ^-detector in front ofthe X-ray detector to avoid absorption of low-energetic y- and X-rays in the plastic material. The energy and efficiency calibrations of the Ge detectors were performed with absolutely calibrated sources of "Co , ""Co. ""Y, "'"Cd, " V s . ""Ce, '"'Ku and ' "Am. Additionally, the X-ray detector was internally calibrated using isomeric transitions of various nuclides, produced during the experiment.
3. Results and discussion
.1.1. Till-. DI.CAV Oh "Mn
In the /3-coincident y-ray spectrum, recorded at mass number 60, we observe all y-lines which are known ") to follow the /3-decay of "'Mn ( T, : - 1.79 110) s). The
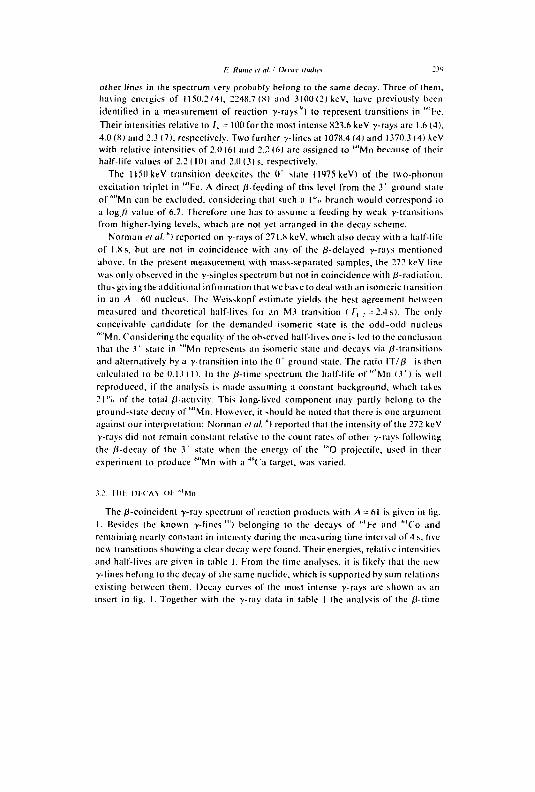
F.. Runle et ni. '' />c«r \littlic\ - »
other tines in the spectrum very probably belong to the same decay. Three of them, having energies of 1150.214). 2248.7(8) and 3100(2) keV, have previously been identified in a measurement of reaction y-rays") to represent transitions in ''"Fe. Their intensities relative to / v - 100 for the most intense 823.6 keV y-rays are 1.6 (4), 4,0 (8) and 2.3 (7), respectively. Two further y-lines at 1078.4 (4) and 1370.3 (4) keV with relative intensities of 2.0(6) and 2.2 (6) are assigned to w M n because of their half-life values of 2.2 ( 10) and 2.0 (3) s. respectively.
The 1151) keV transition deexciles the 0' slate ( l"J75 keV) of the two-phonon excitation triplet in ""Fe. A direct 0-fceding of this level from the 3 ' ground state of ''"Mn can be excluded, considering that such a l"u branch would correspond to a log_/r value of 6.7. Therefore one has to assume a feeding by weak y-transitions from higher-lying levels, which are not yet arranged in the decay scheme.
Norman el al. k ) reported on y-rays of 271.8 keV, which also decay with a half-life of 1.8 s, but are not in coincidence with any of the 0-delaved y-rays mentioned above. In the present measurement with mass-separated samples, the 272 keV line was only observed in the y-singles spectrum but not in coincidence with ^-radiation, thus giving the additional information that we have to deal with an isomeric transition in an A - 6 0 nucleus. The Weisskopf estimate yields the best agreement between measured and theoretical half-lives for an M3 transition ( T, . - 2 . 4 s). The only conceivable candidate for the demanded isomeric state is the odd-odd nucleus ''"Mn. Considering the equality of the observed half-lives one is led to the conclusion that the 3 ' state in ''"Mn represents an isomeric stale and decays via /^-transitions and alternatively by a y-transition into the 0' ground stale. The ratio IT//3 is then calculated to he 0.13 ( 1 ). In the 0-iimc spectrum Ihe half-life of ""Mn ( 3 ' ) is well reproduced, if the analysis is made assuming a constant background, which takes 2l"u of the total ^-activity. This long-lived component may partly belong to the ground-state decay ol"'"Mn. However, it should be noted (hat there is one argument against our interpretation: Norman el nl. ") reported that the intensity of the 272 keV y-rays did not remain constant relative to the count rates of other y-rays following the /d-decay of the 3 ' state when the energy of ihc '"O projectile, used in their experiment to produce ""Mn with a 4 T a target, was varied.
.1.:. Till-. 1)1 CAY Ol " M n
The 0-coincidenl y-ray spectrum of reaction products with /I - 61 is given in lig. 1. Besides the known y-lines '") belonging to the decays of '''Fe and '"'Co and remaining nearly constant in intensity during the measuring lime interval of 4 s, five new transitions showing a clear decay were found. Their energies, relative intensities and half-lives are given in table 1. From the lime analyses, it is likely that the new y-lines belong to the decay of ihe same nuclide, which is supported by sum relations existing between them. Decay curves of the most intense y-rays are shown as an insert in tig. 1. Together with the y-ray data in table 1 the analysis of the /4-time
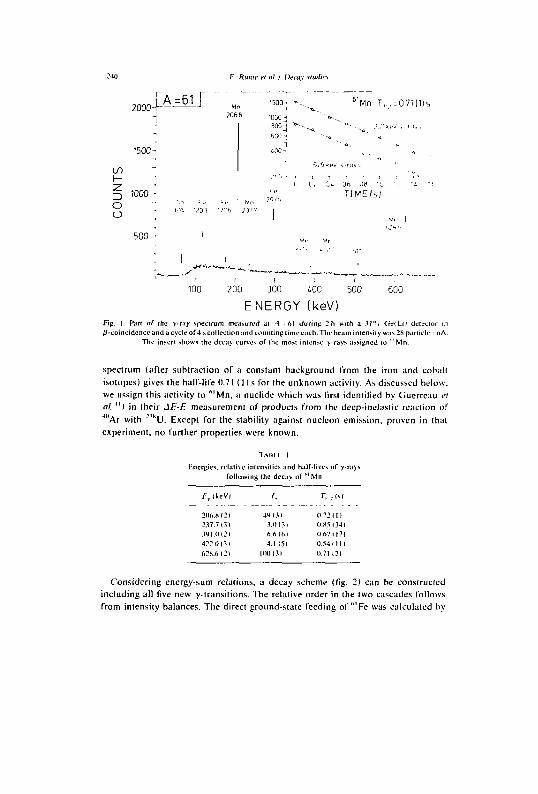
-4() F. Runte et al. I Decay studies
2 0 0 0 _ j l A j L 5 l J M n 1 5 0 0 ^ . ^ 6 'Mn T,,, = 071|l)s
ENERGY (keV) Fig. I. Pari of the y-ray spectrum measured al A-= 61 during 2h with a ?•]"„ Cie(Li) detector in /^-coincidence and a cycle of 4 s collection and counting time each. The beam intensity was 2K particle • nA.
The insert shows the decay curves of the most intense y-rays assigned to ' 'Mn.
spectrum (after subtraction of a constant background from the iron and cobalt isotopes) gives the half-life 0.71 ( 1 ) s for the unknown activity. As discussed below, we assign this activity to h l M n , a nuclide which was first identified by Ciuerreau et al ") in their JZÎ-/T measurement of products from the deep-inelastic reaction of 4"Ar with ~1 KU. Except for the stability against nucléon emission, proven in that experiment, no further properties were known.
TAHI I 1
energies, relative intensities and half-lives of y-ra>s fo l lowing the decay of ' ' 'Mn
/ : , IkcVI /, T, :M
206.X 12) •W 1.31 0.72(11 237.7 (3) 3.0131 0X5(341 391.1112) 6.6 161 0.67 1171 422.0131 4.1 I5i 0.54(111 62S.fi (21 11101.31 0.71121
Considering energy-sum relations, a decay scheme (fig. 2) can be constructed including all live new y-transitions. The relative order in the two cascades follows from intensity balances. The direct ground-state feeding of ' ' 'Fe was calculated by
1500-
LO i— ; § 1000 -o o '__
500 -
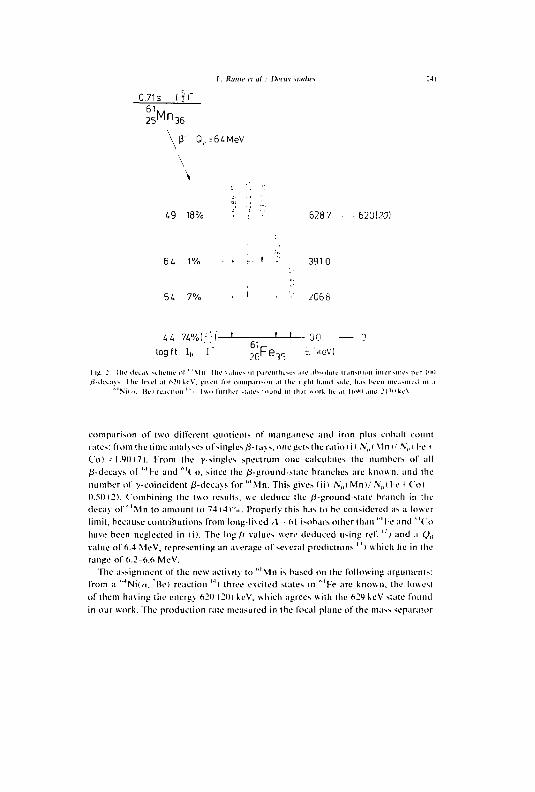
/•. Runic et al. , Dccuv \iudic<
0.71s ( : ) "
2 5 M n 3 6
\ r a, = 64MeV
\ \
49 18% '• • '•' 6287 620(20)
6 4 1 % - • r ' ^ 3910
54 7 % • ' • •' 2068
4 4 7 4 % | - L | " — ' : ' — ' — 0 0 0 6 i
log ft I„ I " 7 cFe-,c t ' k c v ] 26' C 3S
F ig. :. I lie IK'LM> SLIUMIU- o l " ' \ ln Mu- v.iliu-- ni pari-iiMu-so .in- .ilisnluu- IMIISIIIHII inleiiMlu-* per lui fl-ik'i.:i>-. Ilu- k'W-l .11 nJllki'V. [iiwll ]..r oimp.iriM.il al llu- rifîlll ll.unl *uk\ lus hceil llu-.wneil ni .
" S u n . Ilci rc.icliiin " i U n l'imluT -l.ik-~ iniiiid in lli.it uork lu .il lli'lll .nul .MUlkiA
comparison of two dilïerent quotients of manganese and iron plus cobalt count
rules: f rom '.he l ime analyses of si ngles fi- ra \ s, one gels the r ; i l i o ( i l \ , l Mn i/ .V / (i |-e *
C o l -I.SHH7). r r o m the y-singles spectrum one calculates the numbers of all
/3-decays of " 'Ke and ' ' ' ( ' o , since the ^-ground-slate branches are known, and the
number of y-coincident /3-decavs for " ' M n . This gives l i i l / \ ' , ,(Mn>/ .V,ill'C + Co l
11.50 (2). Combin ing the two results, we deduce the / j-ground-stale branch in the
decay of " ' M n to amount to 74 4 i " . i . Properly this has to be considered as a lower
l imi t , because contr ibutions from long- l i \ed A -: 61 isobars other than "'1-e and " 'Co
have been neglected in ( i ) . The log (t values were deduced using ref. '' ) and a Qt
value of 6.4 MeV, represenling an average of several predictions ' ' ) which lie in the
range o f 6.2-6.6 MeV.
The assignment of the new ac l i \ i ty to " ' M i l is based on the fo l lowing arguments:
f rom a " 4 N i ( u , Bel reaction 1 4 l three excited stales in " 'Fe are known, the lowest
o f them having the energy 620 (20) kcV. which agrees wi th the 624 keV slate found
in our work. The product ion rate measured in the focal plane of the mass separator
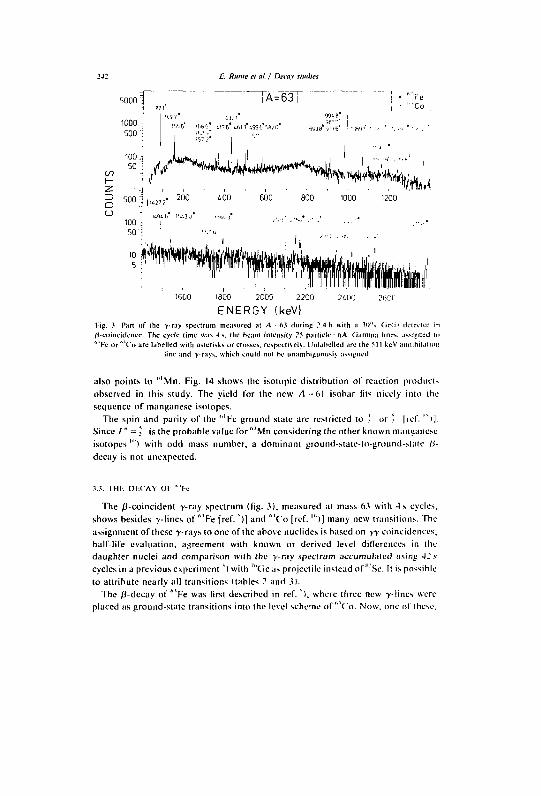
E. Runle el ai / Decay studies
5000:
1000 i 500=î
L A_= 63j 11.9 7
100 50
Hfirifi^ t v ' 6 i 6 l ' J i<39& C&JC.
1S7 / I
| /s~"+*#U»*^iti&^ o o
500 "I | .«•/?• 200 400 600 800 1000
it9U. IU3U
Fig. J. 0-coinc ( ,1Kc or
ENERGY (keV) Part of the y-ray spectrum me;isured at A - 63 during 2.4 h with a 3i>"„
idence. The cycle time was 4 s, the beam intensity 25 particle • nA. Gamma '" 'to are labelled with asterisks or crosses, respectively llnlahelled are the 51
line and y-rays, which could not be unamhijiuou-iiv ussigned.
Ciel il lines, 1 U'V
assent aiimhil,
d to limn
also points to '''Mn, Fig. 14 shows the isotopic distribution of reaction products observed in this study. The yield for the new A -61 isobar fits nicely into the sequence of manganese isotopes.
The spin and parity of the " l Fc ground state are restricted to ' or ] | ref. '") | . Since / " = ] is the probable value for'''Mn considering the other known manganese isotopes '") with odd mass number, a dominant ground-state-lo-ground-state !• decay is not unexpected.
3.3. THI- DE-CAY Oi- " ' le
The /3-coincident y-ray spectrum (fig. 31, measured at mass 63 with 4 s cycles, shows besides -y-lines of M F e fref. ")] and '"'Co [ref. "')] many new transitions. The assignment of these y-rays to one of the above nuclides is based on yy coincidences, half-life evaluation, agreement with known or derived level differences in the daughter nuclei and comparison with the y-ray spectrum accumulated using 42 s cycles in a previous experiment *) with 7 ,'Cieas projectile instead of s S e . It is possible to attribute nearly all transitions (tables 2 and 31.
The /3-decay of M F e was first described in ref. s ) , where three new y-lincs were placed as ground-state transitions into the level scheme of M ( ' o . Now. one of these.
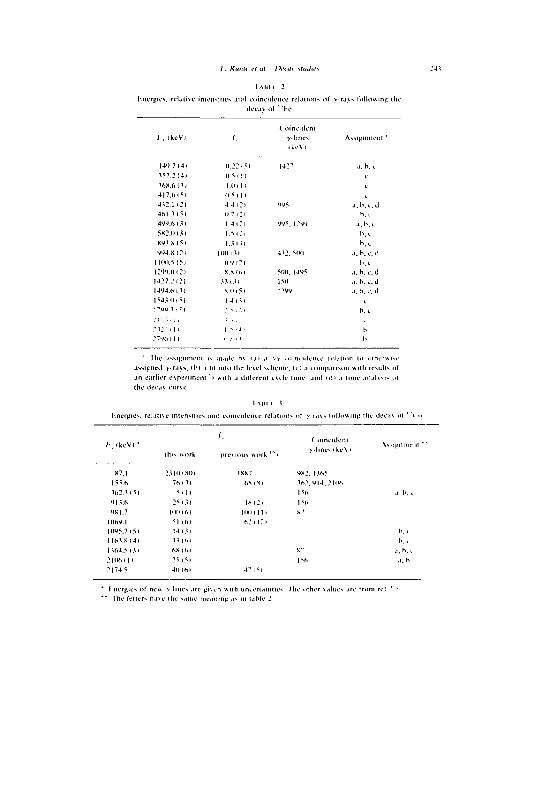
/•. H unie t-t al >vut\ \tudic<
l.nergies. relative intensities and coincidence relations ol y r.i\s following t decav o l " i e
( u i iuu lcm /-, IkcVl /. y - l i n e s
i k c V i
A s s i j i i i t i u ' n l '
1 4 1 . 7 ( 4 1 1 1 . : : 0 1 4 : 7 .1 . h . 1
1 5 7 : 1 4 1 ( i M l i t
16X.6 (.1 1 1 m h t.
4 I 7 . ( , ( M ( K m i
4 i : .1 C l 4 4 i : > 445 . l . b . s . d
461 . .11? ] 11 ^ I : I h . 1
444.f> I .1 1 1 4 1 : 1 4 4 1 . i : 4 4 .1 . b . .
S U M ) 1.Il 1 . 11 :1 l>. s
x i .1 . M 51 1 ..1111 b . s 444.K 1:1 Mi l l 1 11 4 i : . 111(1 J . h . c. d
11(10.1(51 (14 1:1 h . t
1 : 1 1 . 0 1 : 1 S.S l l i l 1II I I . 1441 .1. h . c. cl
14:7. : c i .1.1111 I K I . i . h . i - .d
14141 .111 M i l 11 1744 .1 . h . L-. i l
1 ' 4 . 1 0 ( S | 1 4 ( 1 1 t
M . V 1 I i
" • M i l I l
' I l ie assignment i- m.nie bv l a i .1 yv ini iui. tk. iKc lelal ioi i lit olhcnvi-assigned >-ra>s, t h i a lit into the level scheme, te) a compensent un h results 1 an earlier experiment l with a ilitlerent i u l e lune and i d * .1 time analwis 1 the deeav curve
1 Mti 1 1
l.nergies, relative intensities and comcideiRc relations ut' y i.i\s fol lowing the deca>
ill 's work p r e . i ons w o r k 1
«7.1 M I O I S I I I IKK7 i x : . 1.11.6 76 I 11 6 S | V | !(•:. K.:. . I I I I 1111 i n . 11.1.6 2 5 i . l l l * i : i | i ( .
I K 1.7 I I I I K 6 I min i n H 7
I I I 6 4 . I 11 1 6 1 ( . : 1 1 : 1
1 0 4 1 . 7 ) 5 1 14 111 1 I 6 1 . K I 4 I 11161
1 164.5 1.11 6M 1 6 1 S"
: i l l ( . M l : i 111 1*1.
: i74.5 4 U I I . I 4 " i l l
nnculent y l m e s i k e \ i
" 1 nergics of new y lines ,ire given with uncertainties Hie nther values are trom ret ** Ihe letters have the same meaning .is 111 lahle -
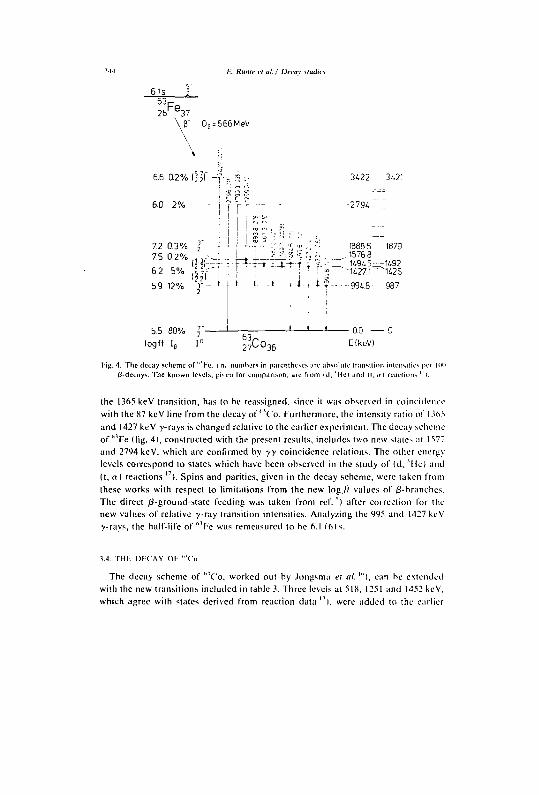
/:'. Ruttte et al. 1 Decav studies
6.1s 6 3 F e 26 c 3 7 \ B ~ Q„ = 666MeV
66 0.2% tip]—j- r i - :
6.0 2% i k V ''
7.2 0.3% j 7.5 0.2% 3 _
6.2 5 % , 5 7 , '
59 12% r —
J
5.5 80% logft I„
-t. * . I . , l î -
•3422 -3421
2794 Zl
1886 5— -1879 . 1575 8 -1494 5-—1492
"1427.1 "" 1425
-994.8 987
6 3 -2 7 u 0 3 6
J 00 0 ElkeV)
Hg. 4. The decay scheme of'"'He. in* numbers in parentheses are absolute iransilion inlensiijes per mil 0-deeays. The known levels, giien for comparison, are from ul, 'Hel ami li.irl reaclions ' l.
the 1365 keV transition, has to be reassigned, since it was observed in coincidence with the 87 keV line from the decay of' ' 'Co. Furthermore, the intensity ratio of 1365 and 1427 keV y-rays is changed relative to the earlier experiment. The decay scheme of '''Fe (fig. 4), constructed with the present results, includes two new stales at 1577 and 2794 keV, which are confirmed by yy coincidence relations. The other energy levels correspond to states which have been observed in the study of (d, 'He) and (t, «) reactions " ) . Spins and parities, given in the decay scheme, were taken from these works with respect to limitations from the new log J) values of 0-hranches. The direct 0-ground-state feeding was taken from réf. *) after correction for the new values of relative y ray Iransilion intensities. Analyzing the 995 and 1427 keV y-rays, the half-life of ( , 'Fe was remeasured to be 6.1 (61s.
3.4. Til l- DIX AY OF-
The decay scheme of ( , lC'o. worked out by .longsma et al. "'1, can be extended with the new transitions included in table 3. Three levels at 518, 1251 and 1452 keV, which agree with states derived from reaction data ' I, were added to the earlier
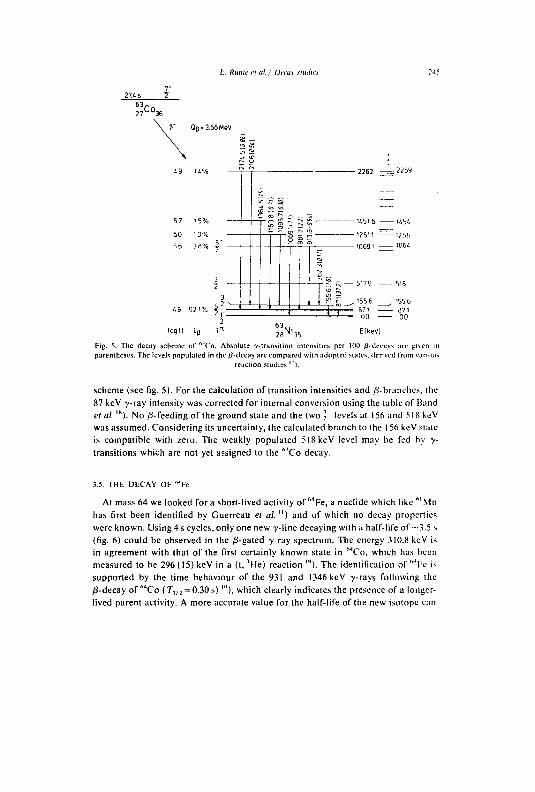
/:. Runw t'l ell. i Dt'tttv slu<lk'\
2 7 C ° 3 6
Q(j = 3.66MeV
57 15%
60 10%
56 3 8%
log» 3
I "
~ * £ S
" r^ C " r^ C
r"1 to )9 Si r r £ *- k_^ I k_^
1 1
2262 = 2 2 5 9
11516 U5i 12511 = :?5fi
10691 . I06 i
155 6 _, 155 6 871 -00 -
— 871 — 00
6 3 n , 2 8 N | 3 5 Elkevl
Fig. 5. The decay scheme of Co. Ahsolule y-transilion intensities per HID 0-decnvs are given in parentheses. The levels populalcd in the 0-decay are compared with adopted stales, derived from various
reaction studies l 7 l .
scheme (see fig. 5). For the calculation of transition intensities and /3-branches, the 87 keV y-ray intensity was corrected for internal conversion using the table of Band el al. '*). No /3-feeding of the ground state and the two ? levels at 156 and 518 keV was assumed. Considering its uncertainty, the calculated branch to the 156 keV state is compatible with zero. The weakly populated 518 keV level may he fed by y-transitions which are not yet assigned to the "'Co decay.
3.5. THE DECAY OF " 4Fc
At mass 64 we looked for a short-lived activity of M F e , a nuclide which like M M n has first been identified by Guerreau el al.") and of which no decay properties were known. Using 4 s cycles, only one new y-line decaying with a half-life of ~3.5 s (fig. 6) could be observed in the /3-gated y-ray spectrum. The energy 310.8 keV is in agreement with that of the first certainly known state in M C o , which has been measured to be 296 (15) keV in a (t, 'He) reaction '"). The identification of "He is supported by the time behaviour of the 931 and 1346 keV y-rays following the /3-decay of M C o ( Tw2 = 0.30 s) '"), which clearly indicates the presence of a longer-lived parent activity. A more accurate value for the half-life of the new isotope can
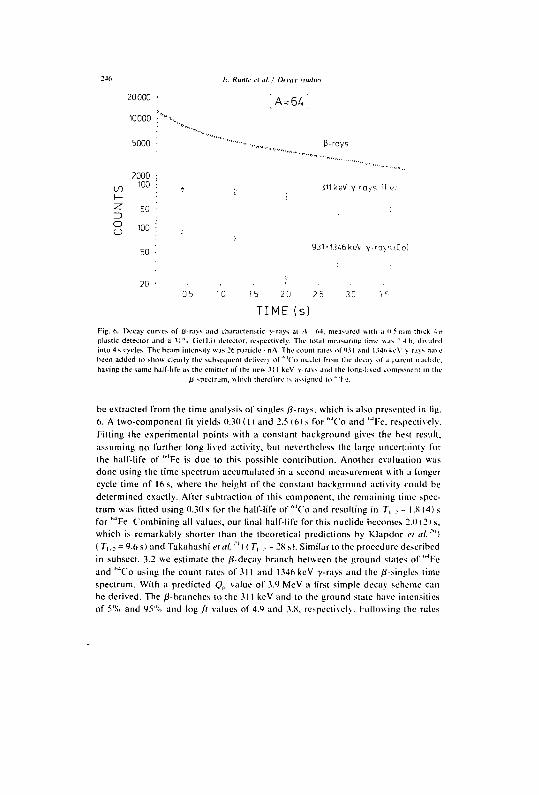
-4<> /:. Runte el ai / Omi t - imdii- i
3-rays
j i l keV Y r ays 'Fei
1'13^6kcV v raysiCo)
20 ' • - • ' 0 5 10 15 2 0 2 5 10 -,c
TIME (s) Fig. 6. IX'Ciiy curves of 0-ravs and characteristic y-rays al A 64. measured with a It 5 mm thick 4TT plastic detector and a 31"n Ciell.i) detector, respectively. The total measuring time «as 2 4 h . divided into 4 s cycles. The beam intensity was 2ft particle • nA. The count rales o f ' M l anil 134ft keV >-ra\s ha\e been added to show clearly the subséquent delivery o f ' " C o nuclei from the deca> of a parent nuclide, having the same half-life as the emitter of the new .111 keV yra>s and the long-lived component in the
^-spectrum, which therefore is assigned to ' ' l e .
be extracted from the time analysis of singles /3-rays, which is also presented in fig. 6. A two-component lit yields 0.30 ( I and 2.5 (61 s for "4C'o and '" lR\ respectively. Fitting the experimental points with a constant background gives the best result, assuming no further long-lived activity, but nevertheless the large uncertainty for the half-life of '' 4Fe is due to this possible contribution. Another evaluation was done using the time spectrum accumulated in a second measurement with a longer cycle time of 16 s, where the height of the constant background activity could he determined exactly. After subtraction of this component, the remaining time spectrum was fitted using 0.30 s for the half-life of '"'Co and resulting in 7", . - I .X (4) s for " 4Fe. Combining all values, our final half-life for this nuclide becomes 2.0 (2) s. which is remarkably shorter than the theoretical predictions by Klapdor ci ai:<>) ( r , ,s = 9.6 s) and Takahashi el til. '"' I ( 7", . - 2X s). Similar to the procedure described in subsect. 3.2 we estimate the 0-decay branch between the ground states of '"'Fe and " C o using the count rates of 311 and 1346 keV y-rays and the 0-singles time spectrum. With a predicted Qlt value of 3.9 MeV a first simple decay scheme can be derived. The 0-branches to the 311 keV and to the ground stale have intensities of 5% and 9V'i, and log/ / values of 4.9 and 3.K, respectively. Following the rules
20000 -
10000 ^ ' x .
5000 :
2000 100
2D o o 100 :
50 :
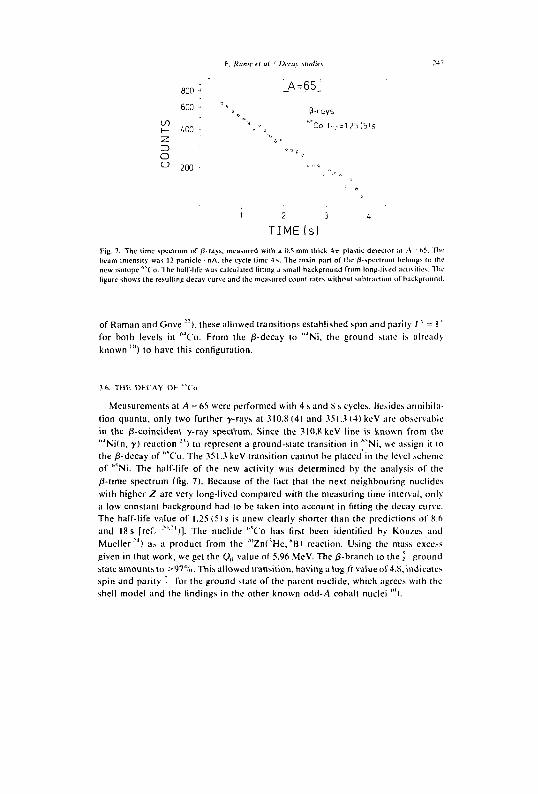
/:. Hume et al. •' Decay studies M 7
P-rays
1 2 3 6
TIME(s)
Fig. 7. The time speelrum of 0-ravs, measured with a 0.5 mm thick 4ÏT plastic deleclor at A -65. The beam intensity was 12 particle • nA. ihe cycle time 4 s. The main part of the /i-speclrum belongs to the new isotope ''*('o. The half-life was calculaled lining a small background from long-lived acluilies. The ligure shows the resulting decay curve and the measured count rates wilhnul subtraction of background.
of Raman and Gove " , these allowed transitions established spin and parity l" - I ' for both levels in " C o . From the /3-decay to ' ' JNi, the ground state is already known '") to have this configuration.
J.d. T i l l : DI-.CAY Ol- "'Co
Measurements at A - 6 5 were performed with 4 s and 8 s cycles. Besides annihilation quanta, only two further y-rays at 310.S (41 and 351..1 (4) keV are observable in the /3-coincidenl y-ray spectrum. Since the 310.8 keV line is known from the " JNi(n, y) reaction "') to represent a ground-slate transition in " N i , we assign it lo the /3-decay of "'Co. The 351.3 keV transition cannot be placed in the level scheme of '''Ni. The half-life of the new activity was determined by the analysis of the /3-time spectrum (fig. 7). Because of the fact that the next neighbouring nuclides with higher Z are very long-lived compared with the measuring time interval, only a low constant background had to be taken into account in fitting the decay curve. The half-life value of 1.25 (5) s is anew clearly shorter than the predictions of 8.(i and 18 s [réf.- '""•"')1. The nuclide "'Co has first been identified by Kouzes and Mueller 2 4 ) a.s a product from the 7"Zn('He,*BI reaction. Using the mass excess given in that work, we get the Ç>„ value of 5.96 MeV. The /3-branch to the ,' ground state amounts to >97%. This allowed transition, having a log./f value of 4.8, indicates spin and parity .• for the ground state of the parent nuclide, which agrees with the shell model and the findings in the other known odd-/^ cobalt nuclei "'l.
800 -'
600 -
400 -
Z> o o 200
A = 6
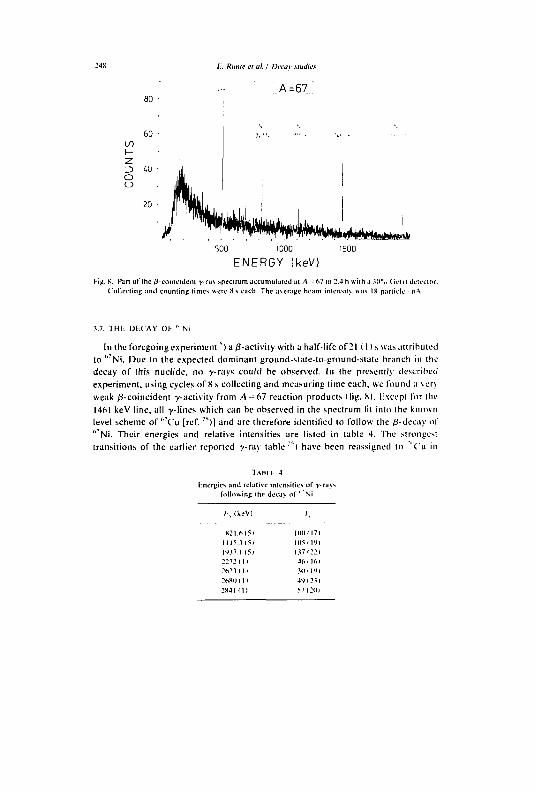
o o
60
40
/:'. Runic et al. / Decay studies
A =67..
<rtW*»LJ *M**te»*t»*wi 500 1000
ENERGY (keV)
Eig. 8. Part of the 0-coineidenl y-rav spectrum accumulated at A -67 in 2.4 h with a .10".. Geli) detect» Collecting and counting times were Ks each. The average heam intensity was IK particle n-Y
3.7. THE DECAY OF " N i
In the foregoing experiment *) a/3-activïty with a half-life of 21 ( 11 s was attributed to , , 7 Ni. Due to the expected dominant ground-state-lo-ground-slate branch in the decay of this nuclide, no y-rays could be observed. In the presently described experiment, using cycles of 8 s collecting and measuring time each, we found a very weak /-coincident y-activity from /I = 67 reaction products dig. SI. lixcept for the 1461 keV line, all y-lines which can be observed in the spectrum lit into the known level scheme of " C u [ref. " l ] and are therefore identified to follow the 0-decay of " N i . Their energies and relative intensities are listed in table 4. The strongest transitions of the earlier reported y-ray table"") have been reassigned to "C'u in
T A M I 4
Energies and relati e intensities o f y-rays fol lowing th i' decay o f Ni
1,(keVI 1,
X21.6 ( 51 111111171
1115.1(51 105(1^1
1 W . I 151 1.17 1221 2272 11) 46 1161
2621 111 1(1 111) 26SII ( 11 4o C D
2.S41 ( 11 57(2(1)
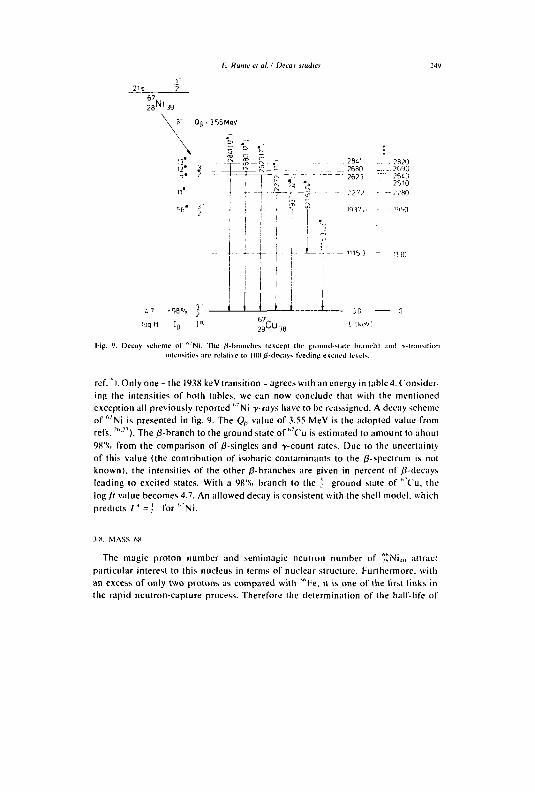
/:". Runte el al. f Decay studies
6 7 M 2 8 N | 3 9
\ 5 - Ç co t J _
MI
- 4 - +-
28i! 2680 2675
- 2820 2690
- 2640 " " 2510
. '2 '2 - 2280
191AI • '9S0
log It 67 2 9 uu i B
Fig. 9. Deeay scheme ol" f l ' N i , The /i-branches (except the ground-slate hranchl and y.transition intensities are relative to Hill ^-decays feeding excited ley els.
ref. * l . Only o n e - the 193X keV transition - agrees with an energy in table 4. Considering the intensities o f both tables, we can now conclude that with the mentioned exception all previously reported ' " N i y-rays have to be reassigned. A decay scheme o f ' ' ' N i is presented in l ig. 9. The Q,, value of 3.55 MeV is the adopted value from refs. * ' ' ' J ' ) . The 0-branch to the ground state o f ' , 7 C'u is estimated to amount to about 98% from the comparison o f ^-singles and -y-count rates. Due to the uncertainty o f this value (the contr ibut ion of isobaric contaminants to the /3-speclrum is not known I, the intensities o f the other ^-branches are given in percent o f /3-decays leading to excited states. With a 98"/n branch to the ' ground state o f " C ' u , the log ft value becomes 4.7. An al lowed decay is consistent with the shell model, which predicts / " = ! f o r ' ' N i .
.VK. MASS 6S
The magic proton number and semimagic neutron number of > N i 4 „ attract particular interest to this nucleus in terms of nuclear structure. Furthermore, with an excess o f only two protons as compared w i th M ' Fe , it is one o f the first l inks in the rapid neutron-capture process. Therefore the determination o f the half- l i fe of
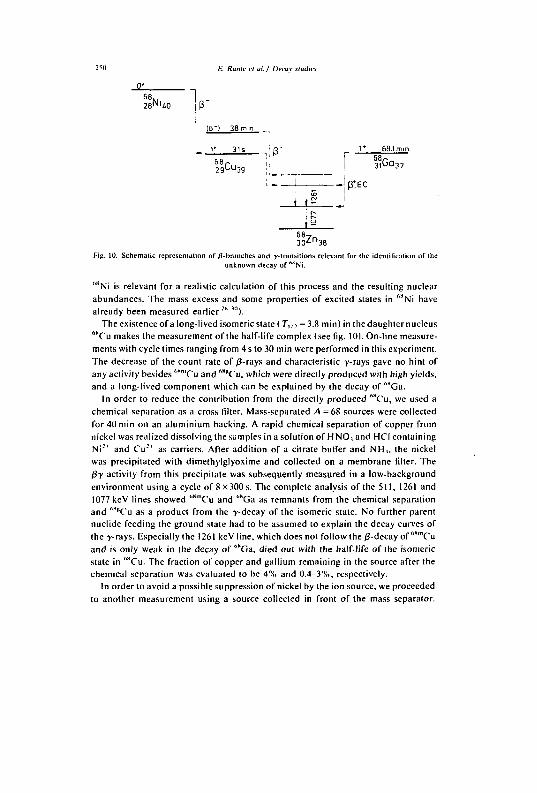
if. Run le el al. / [Decay studies
•Ni iO (3 ~L-
L 1' 31s ' (V 1* 68.1mm
5 4 C u , q ! ! I " G ° 3 7 2 9 u u 3 9
-L - P:EC is
6 » 7 „ 30 z - n 38
Fig. 10. Schematic representation of /J-branches and y-transitions relevant for the idenlilicalion of Ihe unknown decay of ""Ni.
"*Ni is relevant for a realistic calculation of this process and the resulting nuclear abundances. The mass excess and some properties of excited states in f , t lNi have already been measured earlier 2* '").
The existence of a long-lived isomeric state ( Tu: = 3.8 min) in the daughter nucleus ''"Cu makes the measurement of the half-life complex (see fig. 10). On-line measurements with cycle times ranging from 4 s to 30 min were performed in this experiment. The decrease of the count rate of /3-rays and characteristic y-rays gave no hint of any activity besides """Cu and M "Cu, which were directly produced with high yields, and a long-lived component which can be explained by the decay of""Ga.
In order to reduce the contribution from the directly produced ""Cu, we used a chemical separation as a cross filter. Mass-separated A = 68 sources were collected for 40 min on an aluminium backing. A rapid chemical separation of copper from nickel was realized dissol ving the samples in a solution of H NO ! and HCI containing Ni 2 + and Cu~' as carriers. After addition of a citrate buffer and NH,, the nickel was precipitated with dimethylglyoxime and collected on a membrane filter. The fy activity from this precipitate was subsequently measured in a low-background environment using a cycle of 8x300 s. The complete analysis of the 511, 1261 and 1077 keV lines showed ''""C'u and ''"Ga as remnants from the chemical separation and "*eCu as a product from the -y-decay of the isomeric state. No further parent nuclide feeding the ground state had to he assumed to explain the decay curves of the y-rays. Especially the 1261 keVline, which does not follow the /3-decay of """'Cu and is only weak in the decay of '"Ga, died out with the half-life of the isomeric state in ftKCu. The fraction of copper and gallium remaining in the source after the chemical separation was evaluated to be 4% and 0.4-3%, respectively.
In order to avoid a possible suppression of nickel by the ion source, we proceeded to another measurement using a source collected in front of the mass separator.
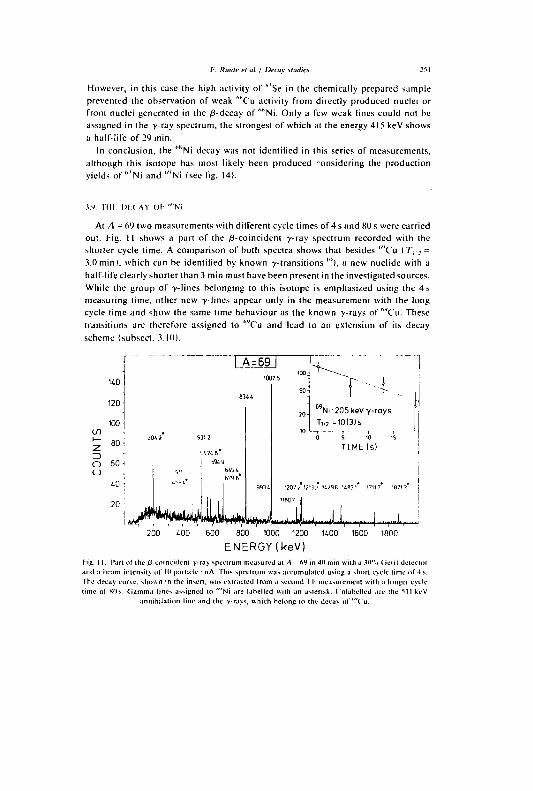
/•'. Rutile et al ! Decay studies 251
However, in this case the high activity of h , Se in the chemically prepared sample prevented the observation of weak t,HCu activity from directly produced nuclei or from nuclei generated in the /3-decay of ''"Ni. Only a few weak lines could not be assigned in the y-ray spectrum, the strongest of which at the energy 415 keV shows a half-life of 29 min.
In conclusion, the '' sNi decay was not identified in this series of measurements, although this isotope has most likely been produced considering (he production yields of'*TNi and "''Ni (see fig. 14).
S.9. I H I . IM-.CAY OF- ""Ni
At A - 6 9 two measurements with ditierent cycle times of 4 s and 80s were carried out. Fig. 11 shows a part of the /3-coincident y-ray spectrum recorded with the shorter cycle time. A comparison of both spectra shows that besides ('"Cu ( T, -. •-3.0 min). which can be identified by known y-transitions M , l , a new nuclide with a half-life clearly shorter than 3 min must have been present in the investigated sources. While the group of y-lines belonging to this isotope is emphasized using the 4 s measuring time, other new y-lines appear only in the measurement with the long cycle time and show the same time behaviour as the known y-rays of''"'C'u. These transitions are therefore assigned to ftVOu and lead to an extension of its decay scheme (subsect. 3.10).
A = 69
140
120
100 i/) :
O 60 i
o , 40 '
20 >m«
•)7t6
67qfl* I 993 4
T 69, Ni 205 keV v-rays T „ 2 =10(3)s
0 5 10 18
T I M E ( s i
W> t V ) U 1^98 ' W
" 6 0 7 I
m,tl(ailâriJièfluMjL i l ; ••' | . - . T . . . l . , .
200 400 600 800 1000 1200 1400 1600 1800
ENERGY (keV) J-ig. 11. l'art of I he 0-coincident y-ray spectrum measured at A 6y in 40 m in with ;i 30"n <ie<i) detector
and a heani intensity of 10 pan ic le • nA. ["his spectrum was accumula ted using a short cycle lime o f - I s .
The decay t u n c , shown in the insert, was extracted from a second I h measurement with a longer cycle
time of XOs. Ciamma lines assigned to '' ' 'Ni are labelled with an asterisk. I 'nlabel led are the 511 keV
annihi lat ion line and the y-rays, which helong to the decay o f ' " 'Vu .
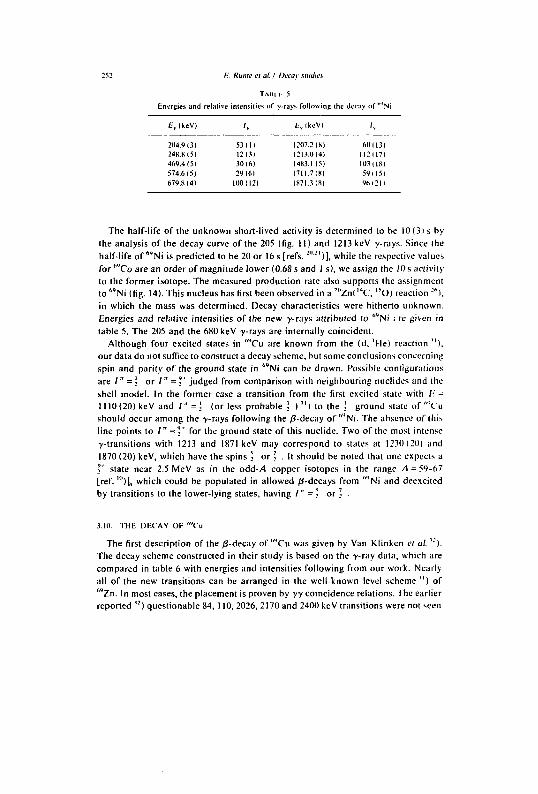
252 H. Runte es al. / Decay studies
TA m. i- 5 Energies and relative intensities of y-rays following the decay of h''Ni
f r ( k e V ) ;y b\ IkeV) ;,
204.91.1) 53 I I I 1207.218) 601131 248.815) 12 131 1213.0(4) I I 2 I I 7 I 469.4 15) 3016) 1483.1 15) 10.1(181 574.6(5) 29161 1711.718) 59(151 679.814) 100 1121 1871.3 181 961211
The half-life of the unknown short-lived activity is determined to be 10 (3) s by the analysis of the decay curve of the 205 (fig. II) and 1213 keV y-rays. Since the half-life of ""Ni is predicted to be 20 or 16s [refs. : " ' ; l ) ] , while the respective values for " t o are an order of magnitude lower (0.68 s and 1 s), we assign the 10 s activity to the former isotope. The measured production rate also supports the assignment to ""Ni (fig. 14). This nucleus has first been observed in a 7 "Zn( ' 4 C, ' s OI reaction ""), in which the mass was determined. Decay characteristics were hitherto unknown. Energies and relative intensities of the new y-rays attributed to ""Ni ; re given in table 5. The 205 and the 680 keV y-rays are internally coincident.
Although four excited states in ''"Cu are known from the (d, 'He) reaction " ) , our data do not suffice to construct a decay scheme, but some conclusions concerning spin and parity of the ground state in ""Ni can be drawn. Possible configurations are I" = [ or / " = " ' judged from comparison with neighbouring nuclides and Ihe shell model. In the former case a transition from the first excited state with /:' -1110 (20) keV and / " = I (or less probable J ) " ) to the j ground slate of "Vu should occur among the y-rays following Ihe /3-decay of ""Ni. The absence of this line points to / " =V for the ground state of this nuclide. Two of the most intense y-transitions with 1213 and 1871 keV may correspond to stales at 1230(20) and 1870 (20) keV, which have the spins ] or ' . It should be noted that one expects a V state near 2.5 MeV as in the odd-A copper isotopes in the range A = 59-67 [ref. '")], which could be populated in allowed /3-decays from ""Ni and deexcitcd by transitions to the lower-lying states, having / " = ? or J .
3.10. THE DECAY OF ""Cu
The first description of the /3-decay of ""Cu was given by Van Klinken el al. * :). The decay scheme constructed in their study is based on the y-ray data, which are compared in table 6 with energies and intensities following from our work. Nearly all of the new transitions can be arranged in the well-known level scheme ") of ""Zn. In most cases, the placement is proven by yy coincidence relations. The earlier reported , 2 ) questionable 84, 110, 2026, 2170 and 2400 keV transitions were not seen
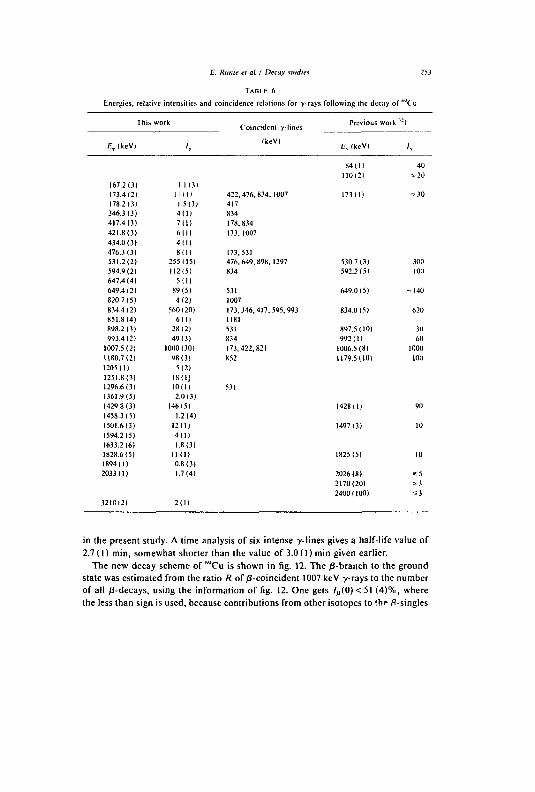
E. Runie et at. / Devay studies '.
TABI f; 6
Energies, relative intensities and coincidence relations for y-rays following the decay of "Vu
Coincident y-lines
167.2(3) 1.1 (3) 173.4(2) 11 III 422,476,834, 1007 178.2 131 1.5(3) 417 346.3(3) 4(11 834 417.4(3) 7(1) 178,834 421.8(3) 6(1) 173, 1007 434.0(3) 4(1) 476.3(3) 811) 173,531 531.2(2) 255(15) 476,649,898, 1297 594.9(2) 112(5) 834 647.4 (4) 5!1) 649.4(2) 89(5) 531 820.7(5) 4(2) 1007 834.4(2) 560(20) 173.346,417,595.993 851.8(4) 6111 1181 898.2 (3) 28121 531 993.4(2) 49(3) 834
1007.5(2) 1000(30) 173,422,821 1180.7(21 98(3) 852 1205(1) 5(2) 1251.8(3) 18(1) 1296.6(3) 1011) 531 1361.9(5) 2.0(31 1429.8(3) 146151 1458.3(5) 1.2141 1501.6(3) 12(1) 1594.2(51 4(1) 1633.2(6) 1.8(3) 1828.6(5) 11(1) 189411) 0.8(3) 2033(1) 1.7(4)
Previous work , ! )
(keVI ffr(keV) /, ' £ y(keV)
84 ( 11 40 110(21 ^20
530.7(3) 300
592.2(51 100
649.015) - 1 4 0
834.0(5) 620
897.5(10) 30
992(11 60 1006.5(8) 1000 1179.5(101 100
1428(1) 90
1497(3) 10
1825(5)
2026(8) s 5 2170(20) a3 2400(100) S3
in the present study. A time analysis of six intense y-lines gives a half-life value of 2.7 ( 1 ) min, somewhat shorter than the value of 3.0 ( 1 ) min given earlier.
The new decay scheme of w Cu is shown in fig. 12. The ^-branch to the ground state was estimated from the ratio R of ^-coincident 1007 keV y-rays to the number of all /3-decays, using the information of fig. 12. One gets / p(0)<51 (4)%, where the less than sign is used, because contributions from other isotopes to the p-singles
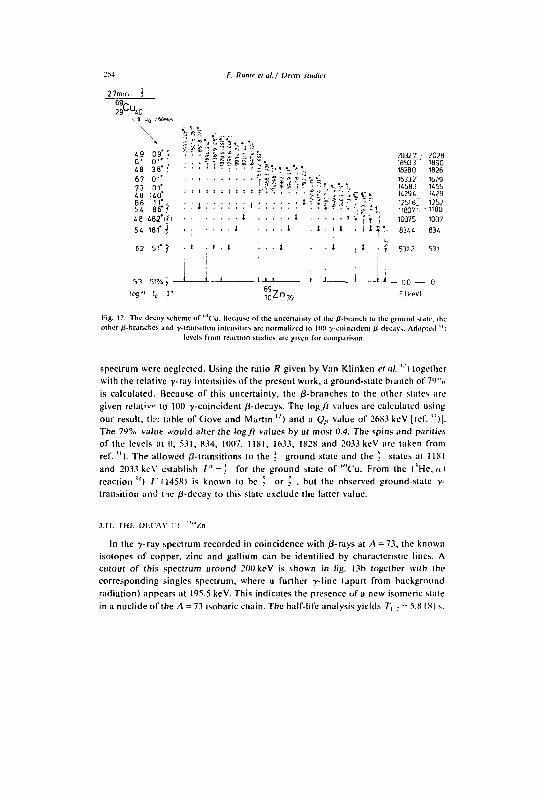
-M E. Runte et at. / Decay studies
27mm ]
20327 2028 16933 1890
• • • . 18280 1826
?r*< 16332 1629 • i f ; " , , v , ' - i 14583 1455 ' •??- y~-. C v t 14294-•' '429
• i " ï ? 3 5 : 12518, 125?
u?:-y 11807- -1180 J . . . . ; i ' Î Î T : 10075 1007
. I . i 1 . i l ? ; . 8344 834
69~ 2 9 U J 4 0
\ 0 Uo : 68Mev
? * S i » " " ~- '-' "' 49 09 < •"•"*•*•£•£• ' . ' s 61 01" ', . . . « S S S S S V . . 48 38" ; • . . I . , : , . - , - f;'., 67 01" . . . . . . . . . . * : • 7 3 <"' < , i . , . i . . > v r - " ' 48 140 ' ' 6.8 11". . • • i i ' • • 5.4 86" 1 • • * ' • ' • 48 48.2'ijl ' • • • 54 18.1" ] . . . . . . I . . . 62 51" ) • I . 1 . 1 1 . . 1 . . 1 . i • t 5312 531
i i • j
51 5 1 % ; — I * 1 i-l-J 1 1 1 i-i— 00 — 0
log" I, r i o Z n 3 9 Flvevi
Fig. 12. The decay scheme ol" "Vu. Hecause of the uncertainly of Ihe 0-branch to the ground stale, the other ^-branches and y-lransition intensities are normalized lo 100 y-coincidenl 0-decays. Adopted " l
levels from reaction studies are given lor comparison.
spectrum were neglected. Using the ratio R given by Van Klinken et al. '""l together with the relative y-ray intensities of the present work, a ground-slate branch of 79",, is calculated. Because of this uncertainly, the /j-branches to the other stales are given relative to 100 y-coincident /3-decays. The log // values are calculated using our result, tl:<: table of Gove and Martin '"') and a <?,, value of 268.1 keV [rcf. " ) | . The 79% value would alter the log ft values by at most 0.4. The spins and parities of the levels at 0, 5.11, 8.14, 1007, 1181, 16.1.1, 1828 and 20.1.1 keV are taken from ref. " ) . The allowed 0-transitions to the ' ground state and the ; states at 11X1 and 20.1.1 keY establish 1" = for the ground state of'"'C'u. From the ('He. u) reaction 1 1 ) /'M45K) is known to be * or l , but the observed ground-state y-transition an-J trie ^J-decay to this state exclude the latter value.
3.11. THI-. DF.C'AY T-! '"'/n
In the y-ray spectrum recorded in coincidence with /3-rays at A - 71, the known isotopes of copper, zinc and gallium can be identified by characteristic lines. A cutout of this spectrum around 200 keV is shown in fig. 1.1b together with Ihe corresponding singles spectrum, where a further y-line (apart from background radiation) appears at 195.5 keV. This indicates the presence of a new isomeric state in a nuclide of the A = 73 isobaric chain. The half-life analysis vields 7", . = 5.8 (S) s.
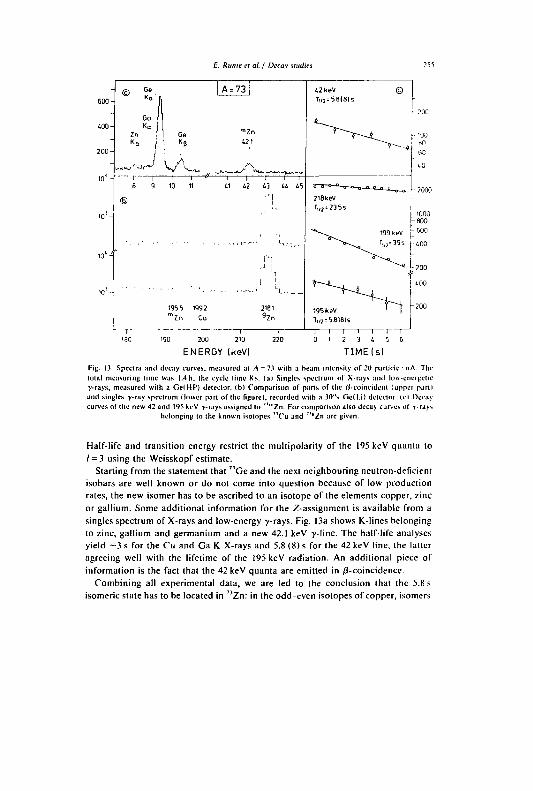
E. Runle el at. I Decay studies
I" '30
195 5 1992 Zn Cu
200 210
ENERGY (keV)
• • - . J — ' » , . . , . '.,
A °^~-
2181 9 Z n
195 keV T,/2 = 5.8I8)S
H ^
I I I I 2 3 t
TIMEIs l
200
too
Fig. I.I. Spectra and decay curves, measured at A - 7.1 wilh a beam intensity of 2U particle • nA. The total measuring time was 1.4 h, Ihe cycle lime X s. la) Singles speclrum of X-rays and low-energetic y-rays, measured with a Ge(HP) detector, (b) Comparison of parts of the 0-coincident (upper parti and singles y-ray spectrum (lower part of the figure), recorded wilh a .10".. Get Li) deleclor. (ci Decay curves of the new 42 and 195 keV y-rays assigned to M m Zn. f-'or comparison also decay curves of y-rays
belonging to the known isotopes "Cu and "KZn are given.
Half-life and transition energy restrict the multipolarity of the 195 keV quanta to 1 = 3 using the Weisskopf estimate.
Starting from the statement that " G e and the next neighbouring neutron-deficient isobars are well known or do not come into question because of low production rates, the new isomer has to be ascribed to an isotope of the elements copper, zinc or gallium. Some additional information for the Z-assignment is available from a singles spectrum of X-rays and low-energy y-rays. Fig. 13a shows K-lines belonging to zinc, gallium and germanium and a new 42.1 keV -y-line. The half-life analyses yield ~3 s for the Cu and Ga K X-rays and 5.8 (8) s for the 42 keV line, the latter agreeing well with the lifetime of the 195 keV radiation. An additional piece of information is the fact that the 42 keV quanta are emitted in /3-coincidence.
Combining all experimental data, we are led to the conclusion that the 5.8 s isomeric state has to be located in 7*Zn: in the odd-even isotopes of copper, isomers
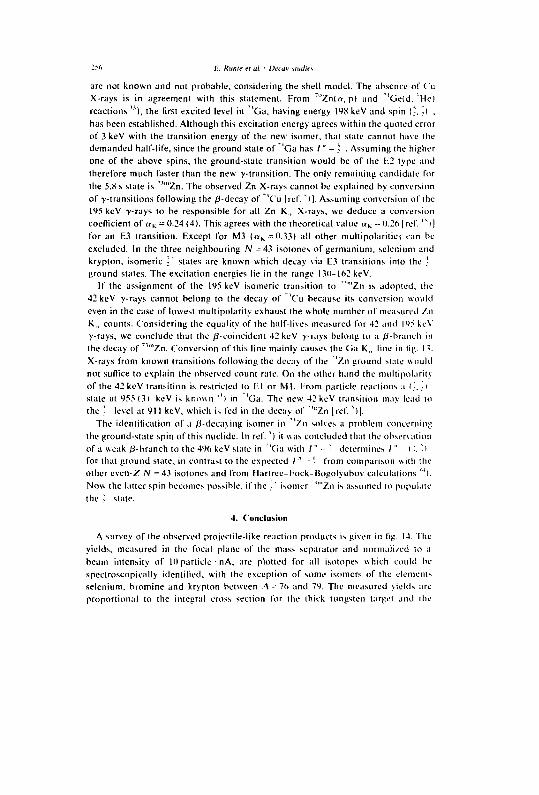
-S(i I:. Rutile et til. i Decay sliittiet
are not known and not probable, considering the shell model. The absence of Cu X-rays is in agreement with this statement. From 7"Znl«, p) and ' 'Geld, 'He) reactions " ) , the first excited level in "Ga , having energy 198 keV and spin C.]) . has been established. Although this excitation energy agrees within the quoted error of 3 keV with the transition energy of the new isomer, that stale cannot have the demanded half-life, since the ground state of 'Ga has / " - ' . Assuming the higher one of the above spins, the ground-state transition would be of the 1-2 type and therefore much faster than the new y-transition. The only remaining candidate for the 5.S s state is "'"Zn. The observed Zn X-rays cannot he explained by conversion of y-transitions following the /3-decay of 'C'u [ref. *)]. Assuming conversion of ihe 195 keV y-rays to be responsible for all Zn K„ X-rays, we deduce a conversion coefficient of « K - 0-24 (4). This agrees with the theoretical value uK - 0.26 [ref. "NJ for an E3 transition. Except for Mi («K-=0.331 all other multipolarities can be excluded. In the three neighbouring N - 4 3 isotones of germanium, selenium and krypton, isomeric _-' states are known which decay via E3 transitions into the ~ ground states. The excitation energies lie in the range l3()-162keV.
If the assignment of the 195 keV isomeric transition to "'"Zn is adopted, the 42 keV y-rays cannot belong to the decay of 'C'u because its conversion would even in the case of lowest multipolarity exhaust the whole number of measured Zn K„ counts. Considering the equality of the half-lives measured for 42 and 195 keV y-rays, we conclude that the /^-coincident 42 keV y-rays belong to a /^-branch in the decay of "'"Zn. Conversion of this line mainly causes the Cia K,. line in tig. 13. X-rays from known transitions following the decay of Ihe 'Zn ground slaie would not suflice to explain the observed count rate. On the other hand the multipolarity of the 42 keV transition is restricted lo E1 or Ml. From particle reactions a I'. . state at 955 (31 keV is known ") in 'Ga. The new 42 keV transition may lead lo the .' level at 911 keV, which is fed in the decay of '"Zn (reI". *)|.
The identification of a /J-deca\ing isomer in 'Zn solves a problem concerning the ground-state spin of this nuclide. In ref. 'l it was concluded that the observation of a weak /^-branch to the 496 keV state in ' da with / " -- ' determines / " ( '.. * I for that ground state, in contrast to the expected / " -- - from comparison with Ihe other even-Z N = 43 isotones and from Hartree-hock-iiogolyubov calculations '"'J. Now the latter spin becomes possible, if the ..' isomer '"'Zn is assumed lo populate the ' state.
4. Conclusion
A survey of the observed projectile-like reaction products is given in fig. 14. The yields, measured in the focal plane of the mass separator and normalized to a beam intensity of HI particle • nA. are plotted for all isotopes which could be spectroscopically identified, with the exception of some isomers of the elements selenium, bromine and krypton between A - 7ft and 79. The measured yields are proportional to the integral cross section for Ihe thick tungsten target and ihe
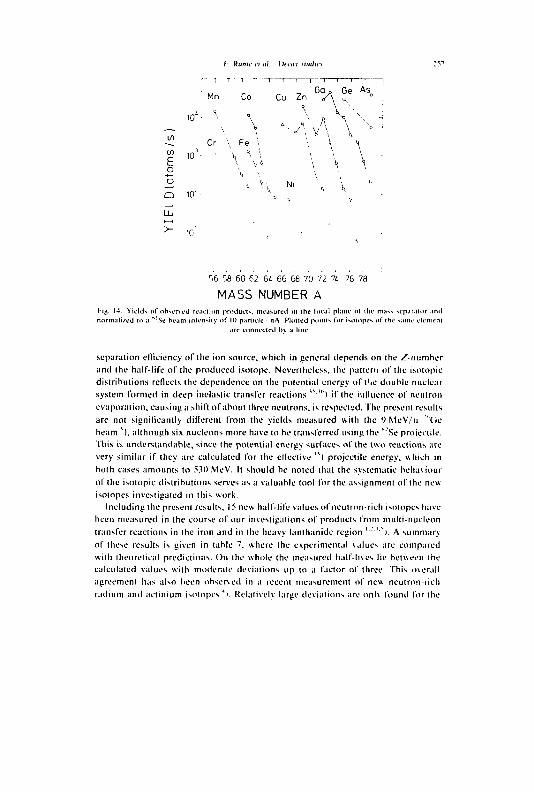
/: Runic et ul. Decay \tudif
' ; T T T — i 1 1 1 1 1 1 T - -
-, G Q f l Ge As Mn Co Cu Zn < / \ ^
„ ' •< \ v
(ato
ms/
s )
1U
1 0 ' .
Cr
-1
> \ Fe \ \ 'A- \ \ \ *
c * ' A \ ' \
• \ A
Ni ' f \ ' a 10' • _ i < UJ
>- io'
56 58 60 62 64 66 68 70 72 7i 76 78 MASS NUMBER A
Hg. 14. Yields of ohscru'd reaclum products, measured in ihr focal plane ol'tin; mass separator ami normalised to a *"Se beam intensity of 10 particle • nA Plotted points l'nr isotopes of the same element
are connected h> a line.
separation efficiency of the ion source, which in general depends on the Z-number and the half-lire of the produced isotope. Nevertheless, the pattern of the isotopic distributions reflects the dependence on the potential energy of t'a* double nuclear system formed in deep inelastic transfer reactions ^'"> if the influence of neutron evaporation, causing a shift of aboul three neutrons, is respected. The present results are not significantly different from the yields measured with the °MeV/u "Cie beam ""I, although six nucléons more have to be transferred using the *'Se projectile. This is understandable, since the potential energy surfaces of the two reactions are very similar if they are calculated for the effective lt~) projectile energy, which in both cases amounts to 530 MeV. It should be noted that the systematic behaviour of the isotopic distributions serves as a valuable tool for the assignment of the new isotopes investigated in this work.
Including the present results, 15 new half-life values of neuIron-rich isotopes have been measured in the course of our investigations of products from multi-nucleon transfer reactions in the iron and in the heavy lanthanide region ' , v ) . A summary of these results is given in table 7. where the experimental \alues are compared with theoretical predictions. On the whole the measured half-lives lie between the calculated values with moderate deviations up to a factor of three. This overall agreement has also heen ohserved in a recent measurement of new neutron-rich radium and actinium isotopes J t . Relatively large deviations are onl\ found for the
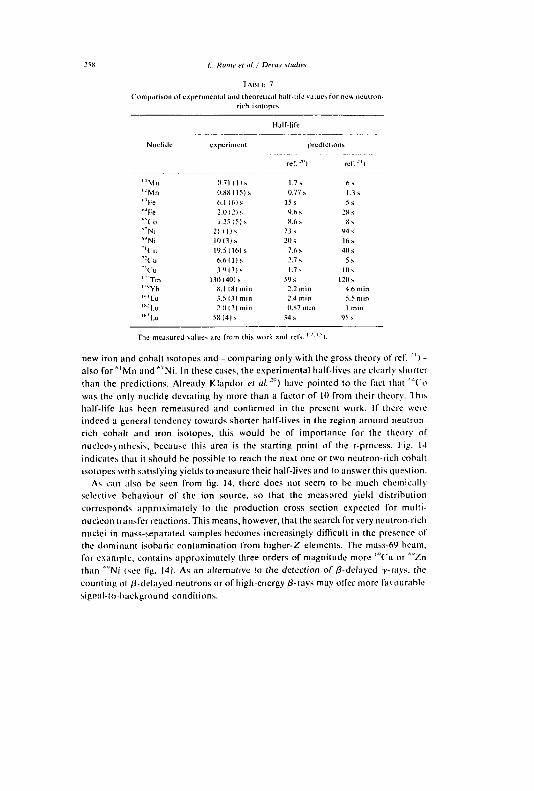
2^S /: Runic el al. / Decay studies
TARI I. 7 Comparison or experimental and theoretical haif-life values for new neutron-
rich i SOtl) p(.'S
Half-life
Nuclide experiment predictions
rel. ''"1 r c r . - ' l
"'Mn (1.71 ( I l s 1.7s 6s " 2Mn 0.88 115)s 0.77 s L.ls ' ' r e 6.1 ( M s 15s 5s M F e 2.0 CI.s 9.6 s 2» s "'Co 1.25(5)s 8.6 s «s "'Ni 21 ( I l s 2.1 s 94 s ""Ni 1»(3) s 20 s 16s ;'C'u 19.5 (16)s 7.6 s 4(1 s '-Vu 6.6 ( 11 s 2.7 s 5s 7 , ( ' u .1.9 1.11 s 1.7 s 10 s r ' T m 1.101401s 59 s 120 s ' " 'Yb «.1 (K lm in 2.2 min 4.6 min " " L u .1.5 1.11 min 2.4 min 5.5 min ' " L u 2.11121min 0.87 min 1 min " ' L u SK14)s 14 s 95 s
The measured values are l'rom this work and rets. ' : ' • * ) .
new iron and cobalt isotopes and - comparing only with the gross theory of ref. ' ' I -also for' ' 'Mn and "'Ni. In these cases, the experimental half-lives are clearly shorter than the predictions. Already Klapdor et al.2") have pointed to the fact that '"'Co was the only nuclide deviating hy more than a factor of 10 from their theory. This half-life has been remeasured and confirmed in the present work. If there were indeed a general tendency towards shorter half-lives in the region around neutron-rich cobalt and iron isotopes, this would be of importance for the theory of nucleosynthesis, because this area is the starting point of the r-process. f-ig. 14 indicates that it should be possible to reach the next one or two neutron-rich cobalt isotopes with satisfying yields to measure their half-lives and to answer this question.
As can also be seen from lig. 14, there does not seem to be much chemically selective behaviour of the ion source, so that the measured yield distribution corresponds approximately to the production cross section expected for multi-nucleon transfer reactions. This means, however, that the search for very neutron-rich nuclei in mass-separated samples becomes increasingly difficult in the presence of the dominant isobaric contamination from higher-Z elements. The mass-69 beam, for example, contains approximately three orders of magnitude more '"('u or ""Zn than ''"Ni (see lig. 141. As an alternative to the detection of/S-delayed -y-rays, the counting of ^-delayed neutrons or of high-energy 0-ruys may offer more favourable signal-to-background conditions.
I:. Rumc el ill. I Dimr imjirr 259
The authors would like to thank C. Bruske, K. Hurkard, W. Hiiller for their assistance in operating the on-line separator and the three tape-transport systems, and the UNILAC crew for developing the *"Se beam.
We regret the sudden decease of our coworker and good friend, Michel Langevin.
References
1) R. Kirchncr, O. Klcppcr, W. Kurccuicz. P.. Rocckl. P.P. Zganjar. I:. Runic. W..D. Schmidl-Otl. I>. Tidemand-Petersson, N. Kalfrcl l , P. Pcuscr and K. Rykac/ewski. Nucl. Pliys. A.378 M982) 549
21 K. Rykaczewski, R. Kir.-hncr, W. Kurcewicv, I) . Schardt. N. Kal l rc l l . P. Pcuscr. h. Runic. W . D Schmidt-Olt, P. Tidemand-Pctcrsson and K.-L Ciippcrl, Z Phys. A.WW [19831 27.1
3) K. Rykacvcwski, P.O. t.arsson. R. Kirchner. C). Klcppcr. p.. Rocckl. I) . Schardl, K.L. Ciippcrl. P. Runtc. W.-D. Schmidt-On. P. Tidcmand-Petersson. N. Katlrcl l , P. Pcuscr. W. Kurcewkv and J. Zylicz. GSI Scicnlilic Rcpnrl I W.I (1984) p. 74
4) K.-L. Ciippeir, P. Runic, W.-D. Schmidt-Olt, P. Tidcmand-Pclersson. R. Kirchncr. (). Klcppcr. W. Kurcewic/.. P.O. Larsson, p.. Rocckl, I) . Schardl. N. Kal l rc l l . P. Pcuscr and K. Rykac/cwski, io he puhlishcd
51 K. Runic, W.-D. Schmidl-Ott. P. Tidctnand-Pclersson, R. Kirchner. ( ) Klcppcr. W. Kurccwic/ . p. Rocckl. N. Kal l rc l l . I". Pcuscr, K. Rykacewski , M. Hcrnas. P. Dcssagne .nul M. I.angevin, Nucl. Phys. A.W9 I l<JK31 163
61 L.K. Pckcr. i i . l . Vnlmyanski. V.P.. Bunako» and S.G. Oglobl in, Phys. t.ell. .36B (1971) 547 71 R. Kirchncr, K.H. Uurkard. W. Hii l lcr and (). Klcppcr. Nucl. Insir. 186 11981 I 295 81 P..B. Norman. C.N. Davids. M.J. Murphy and R.C . Pardn. Ph\s. Rev. CI7 I 19781 2176 9) P..K. Warhunon. J.W. Olncss. A .M. Nathan, J.J. Kololha and J.B. McGrory. Phys. Rev. C I6 1 19771
1027 10) Panic 1,1'isolopcs, 7th cd.cd.C M. I.cdcrcr and V.S. :Shirley I Wiley. New York, 1978), and references
therein I I I I). Guerreau. J. Cialin. I), ( ia l ly , \ . 1'arragn. .1. Girard. R. Lucas and t Ngo. Z. Phys. A295 I 198(1)
1115 12) N.B. Gove and M J . Mart in. Nucl. Data Tables A M < 1 «711 21)6 1.1) 1975 mass predictions, cd. S. Maripuu. At. Nucl. Data Tables 17 (1976) 476 14) .1.1). (ossair t , R.P Trihhle and R.A. Kcnclick, Phys. Rev. CIS (19771 1685 15) L P . Pkstroni and J. I.yttkcns. Nucl. Data Sheets 38 I I9S.H 463, and references therein 16) H.W. Jongsma, R. Kamcnnans and I I . Vertical. /.. Phys. 251 (1972) 425 17) R.I. Auhlc. Nucl. Data Sheets 28(1979] 559, and references, therein IKI I.M. Hand, MIS. Trzhasknvskaya and M.A. I.islcngarten. At. Nucl. Data tables 18 I 19761 433 191 P.R. Hynn and J.I). Garrclt. Phys. 1 elt. 42B (1972) 49 201 H.V. Klapdor. J. Mctzinger and T. Oda, At. Nucl . Data Tables .11 (1984) SI 21) K. Takahashi. M. Yamada and T. Kondoh. At. Nucl. Data Tables 12 (19731 lo i 221 S. Raman and N.IÎ. Gove, Phys. Rev. O (19731 1995 23) R.L. Auhlc. Nucl. Data Sheets 16 11975) 351. and references therein 24] R.T. Kouzes and D. Mueller. Nucl. Phys. A.307 (19781 71 25) J.N. Mo and S. Sen. Nucl. Data Sheets .19 I 1983) 741. and references Ihercin 261 P. Dcssagnc, M. Bernas. M Langcvin. ( i . e . Morrison. J. Pavel. P. Poughcon and P. Roussel. Nucl.
Phys. A426 I 19X41 399 27] R.T. Knuv.es. D. Mueller and ( . Vu. Phys. Rev. ( 1 8 [ 19781 15X7 28) T.S. l lhal ia. I I . I la fne i , R. I laupl . R. Maschuvv and G.I . Wagner. Z Phys. 281 119771 65 291 M. Hcrnas. I.C . Peng. H. Doubrc, M. I.angcun. M. l . I.c\ine. P. Pougheon and P. Roussel, Phys.
Rev. C24 I 19811 756 30] M. Bernas. P. Dessagnc. M. I angevin. Ci. Parmi, I . Pougheon, p.. CJuiniou and P. Roussel. J. de
Phvs. 45 (19841 I.-X5I
260 F. Runte et ai ! Decay studies
311 F. Kearns and N.J. Ward, Nucl. Data Sheets 35 (19821 1(11, and references therein 32) J. van Klinken. A.J. Bureau. G.W. Kakins and R.J. Hanson. Phys. Rev. ISO 119661 886 3.1 LP. Kkslrom and P. Kearns. Nucl. Data Sheets 29 (1980) I, and references therein 34) M. Bernas, P. Dessagne, M. Langevin. J. Payet, K. Pougheon. P. Roussel, W.-D. Schmidt-Oil, P.
Tidemand-Petersson and M. Girod. Nucl. Phys. A413 ( 1984) 363 351 J.V. Kratz, W. Hriichle, G. Kranz, M. Schadel. 1. Warnecke and Ci. Wirth, Nucl. Phys. A332 ( 1979)
477 361 I). Schûll. W.C. Shen. H. Kreieslehen. R. Hock, K. Busch. I). Bangert. W. Pleller and 1-. Piihlhofcr.
Phys. Lett. 102BII98II 116

PUBLICATION XII
Volume 164B, number 1,2,3 PHYSICS LETTERS 5 December 1985
BETA-DFX'AV HALF-LIVES OF NEW NEUTRON-RICH CHROMIUM-TO-NICKEL ISOTOPES AND THEIR CONSEQUENCES FOR THE ASTROPHYSICAL R-PROCESS
U. BOSCH, W.-D. SCHMIDT-OTT. P. TIDEMAND-PHTERSSON. K. RUNTE //. I'hysikahsvhes Institut, Unirerxitaf Gottingcn, I) • 34(M) Goitingeti. f'ed Hep. Germany
W. HILLEBRANDT. M. LECHLK. F.-K. THIHLBMANN Max-Planvk-Institut fur Astrophvsik, /) - N04à Garthing, Fed Hep. Germany
R. KIRCHNER, O. KLEPPER. E. ROECKL. K. RYKACZEWSK1. D. SCHARDT GSI- Darmstadt. D -6W0 Darmstadt. Fed. Rep. Germany
N. KAFFRELL Institut fur Kerntlwnue, Vnirersitat Mainz, P-6500 Main:. Fed. Rep. Germany
M. BERNAS Institut de Physique Nucléaire. F- '->/4ltti Orsay, France
Ph. DESSAGNE
Centre de Recherches Nucléaires. F-fi7tl.U Straihmirfi, Frame
and
W. KURCEWICZ
Uniwcrsytcl Wars:a»ski. l'I..Ot).f>Xt Harsaii: Fiiland
Received 13 September 1985
Beta-decay studies of the new ncutron-rich isotopes ^ ^ C r / ' M n . ""'"Coand ''"Ni. yielding distinctlv shorter half-lives lhan Ihe corresponding theoretical predictions, are presented. The influence of the short half-lives on the r-process calculations of nuclear abundances is discussed. It is concluded that a significantly higher neutron density than the one ohlained from explosive helium burning in supernovae is needed to reproduce the observed abundances around A - XO.
Decay properties of new neutron-rich isotopes have been measured during the last years at the GSI on-line mass separator in the regions of manganese to zinc [ 1,2), of rare-earth elements [3,4] and for radium and actinium [5], For most of the new isotopes the experimental half-lives are comparable with those of the two available predictions (6,7] - though in some cases individual deviations were encountered.
However, a trend towards shorter experimental values was observed [2] for 6 1 Mn, 6 4 F e , 6 5 C o and 6 7 . 6 9 N i . We have, therefore, included even more neutron-rich isotopes in this region into the present investigation.
Half-lives and other nuefcar properties of neutron-rich isotopes are of importance in calculations of the rapid neutron-capture process (r-process) in order to determine the astrophysical scenario, in which the
22 0370-2693/85/$ 03.30 © Elsevier Science Publishers B.V. (North-Holland Physics Publishing Division)
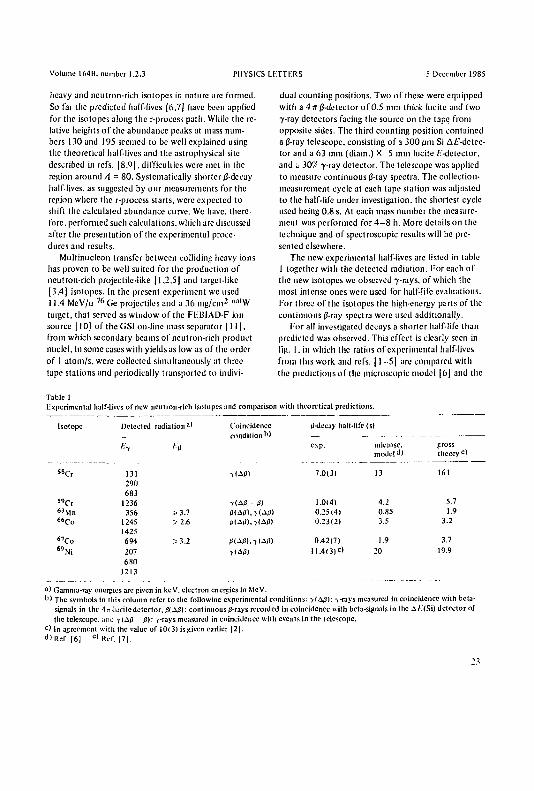
Volume 1640. number 1.2.3 PHYSICS LITTERS 5 December 1985
heavy and neutron-rich isotopes in nature arc formed. So far the predicted half-lives (6.7) have been applied for the isotopes along the r-proccss path. While the relative heights of the abundance peaks at mass numbers 130 and 195 seemed to be well explained using the theoretical half-lives and the astrophysical site described in refs. [8,Q|.difficulties were met in the region around A = 80. Systematically shorter |3-dccay half-lives, as suggested by our measurements for the region where the r-process starts, were expected to shift the calculated abundance curve. We have, therefore, performed such calculations, which arc discussed after the presentation of the experimental procedures and results.
Multinuclcon transfer between colliding heavy ions has proven to be well suited for the production of neutron-rich projectile-like [1,2.5| and target-like (3.4] isotopes. In the present experiment we used 11.4 MeV/u K Ge projectiles and a 36 mg/cm2 n a l W target, that served as window of the FF.lil AD-F ion source [10] of the GS1 on-line mass separator ] 11], from which secondary beams of neutron-rich product nuclei, in some cases with yields as low as of the order of 1 atom/s. were collected simultaneously at three lape stations and periodically transported to indivi
dual counting positions. Two of these were equipped with a 4 77 j3-detcctor of 0.5 mm thick Incite and two •y-ray detectors facing the source on the tape from opposite sides. The third counting position contained a/?-ray telescope, consisting of a 300 fini Si AA'-dctec-tor and a 63 mm (diam.) X 5 mm Incite /Y-deteelor, and a iOfX 7-ray detector. The telescope was applied to measure continuous fl-ray spectra. The collection-measurement cycle at each tape station was adjusted to the half-life under investigation, the shortest cycle used being 0.8 s. At each mass number the measurement was performed for 4 - 8 h. More details on the technique and of spectroscopic results will be presented elsewhere.
The new experimental half-lives are listed in table 1 together with the detected radiation. For each of the new isotopes we observed 7-rays, of which the most intense ones were used for half-life evaluations. For three of the isotopes the high-energy parts of the continuous (i-ray spectra were used additionally.
For all investigated decays a shorter half-life than predicted was observed. This effect is clearly seen in fig. I. in which the ratios of experimental half-lives from this work and refs. 11-5] are compared with the predictions of the microscopic model | 6 | and the
Tabic 1 Experimental half-lives of new neutron-rich isotopes and comparison with theoretical predictions.
Isotope Dctecled radiation a ) Coincidence 0-dccay half-life (s) condition 0 ' .. - - -
i;y >'» exp. micro sc. gross i;y
model d) theory 0)
s s C r 131 290 683
lUftl 7.0(31 13 161
s ' C r 1236 (A0 - « 1.0(4) 4.2 5.7 " M n 356 7. 3.7 0<A(i),T(A|J) 0.25(4) 0.85 1.9 « C o 1245
1425 >2.6 <j(A<n, -,(A<!) 0.23(2) 3.5 3.2
<"Co 694 2.1.2 U(A0),-,(AJJ) 0.42(7) 1.9 3.7 6 9 N i 207
680 1213
•HA/3) 11.4<3)c> 20 19.9
a ) Gamma-ray energies arc given in kcV, electron energies in McV. D>The symbols in this column refer to the following experimental conditions: y(&p): 7-rays measured in coincidence with beta-
signals in the 4;T-lucitcdetector,0(A0): continuous0-rays recorded in coincidence with beta-signals in the A/:'(Si) detector of the telescope, and yi&fi Q): >-rays measured in coincidence with events in the telescope.
c ) In agreement with the value of 10(3) is given earlier | 2 | . d)Ref. | 6 ] . c ) Rcf. | 7 ] .
!?•
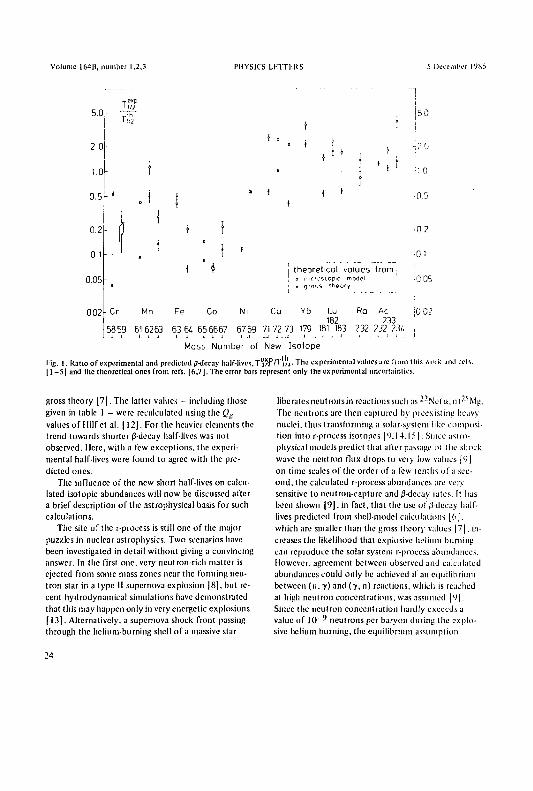
Volume 164B, number 1.2,3 PHYSICS LKTCT.RS 5 December 1985
5.0
20
1.0
0.5
0.2
0 1
0.05
0.02
Ti.-2
<• i f •
theoretical values f rom; o mir'cscopic modei . cross theory
|50
T2 0
!! 0
^0.5
•0 2
•ioi
•0 05
•0 02 Cr Mn Fe Co Ni Cu Yb Lu Ra Ac 182 233
5859 615253 63 6 i 65 6667 6759 7172 73 179 181 183 232 23223/, ,
Mass Number ot New Isotope
Tig. 1. Ratio of experimental and predicted 0-dccay half-uvcs,Tli/iVTiA- The experimental values are from this «iurk anil rets. [1-5] and the theoretical ones from rcfs. [6,7). The error bars represent only the experimental uncertainties.
gross theory |7] . The latter values - including those given in table 1 — were recalculated using the Q„ values of tlilf et al. |12 | . For the heavier elements the trend towards shorter (3-decay half-lives was not observed. Here, with a few exceptions, the experimental half-lives were found to agree with the predicted ones.
The influence of the new short half-lives on calculated isotopic abundances will now be discussed after a brief description of the astrophysical basis for such calculations.
The site of the r-proccss is stil! one of the major puzzles in nuclear astrophysics. Two scenarios have been investigated in detail without giving a convincing answer. In the first one. very neutron-rich matter is ejected from some mass zones near the forming neutron star in a type II supernova explosion |8], but recent hydrodynamica! simulations have demonstrated that this may happen only in very energetic explosions [ 13]. Alternatively, a supernova shock front passing through the helium-burning shell of a massive star
liberates neutrons in reactions such as --Nelu. ni-^Mg. The neutrons are then captured by preexisting heavy nuclei, thus transforming a solar-syslcm like composition into r-process isotopes [9.I4.I5J. Since astro-physical models predict that alter passage of the shock wave the neutron flux drops to very low values | ° | on tittle scales of the order of a lew tenths of a second, the calculated r-proccss abundances are very sensitive to neutron-capture and /3-dccay rates. It has been shown |9 ] , in fact, that the use of/J-decay half-lives predicted from shell-model calculations [6J. which are smaller than the gross theory values [7| . increases the likelihood that explosive helium burning can reproduce the solar system r-process abundances. However, agreement between observed and calculated abundances could only be achieved if an equilibrium between (n. 7) and (7, n) reactions, which is reached al high neutron concentrations, was assumed |9 j . Since the neutron concentration hardly exceeds a value of 10 " neutrons per baryon dining the explosive helium burning, the equilibrium assumption
24
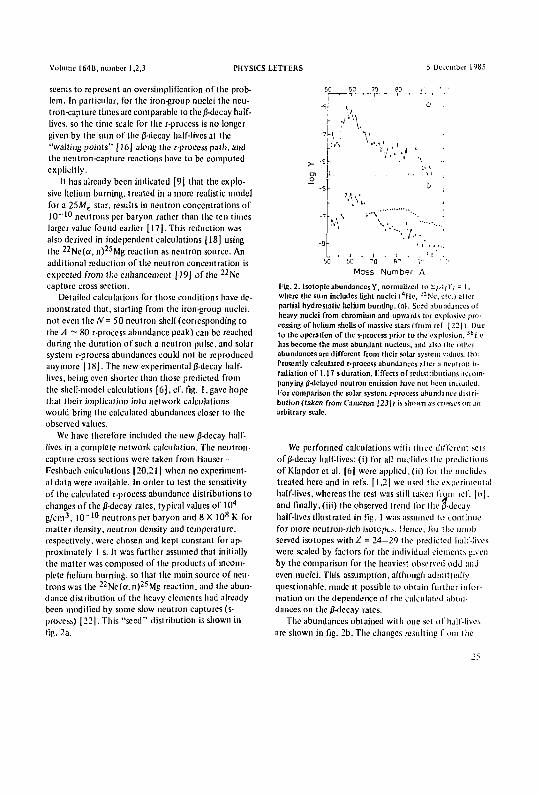
Volume 164B, number i,2,3 PHYSICS LETTERS 5 December 1985
seems to represent an oversimplification of the problem. In particular, for the iron-group nuclei the neutron-capture times are comparable to the 0-decay half-lives, so the time scale for the r-proccss is no longer given by the sum of the (î-ilecay half-lives at the "waiting points" [16] along the r-process path, and the neutron-capture reactions have to be computed explicitly.
It has already been indicated | 9 | that the explosive helium burning, treated in a more realistic model for a 25Ma star, results in neutron concentrations of 1 0 " 1 0 neutrons per baryon rather than the ten times larger value found earlier [17], This reduction was also derived in independent calculations 118] using the 2 2 Ne(a , n) 2 5Mg reaction as neutron source. An additional reduction of the neutron concentration is expected from the enhancement [19] of the 2 2 N e capture cross section.
Detailed calculations for those conditions have demonstrated that, starting from the iron-group nuclei, not even the A' = 50 neutron shell (corresponding to the 4 ~ 80 r-process abundance peak) can be reached during the duration of such a neutron pulse, and solar system r-process abundances could not be reproduced anymore [ I8 | . The new experimental (3-dccay half-lives, being even shorter than those predicted from the shell-model calculations [6| , cf. fig. 1, gave hope that their implication into network calculations would bring the calculated abundances closer to the observed values.
We have therefore included the new 0-dccay half-lives in a complete network calculation. The neutron-capture cross sections were taken from Hauscr-Feshbach calculations [20,211 when no experimental data were available. In order to test the sensitivity of the calculated r-process abundance distributions to changes of the 0-dccay rates, typical values of 10 4
g/cm 3, 1 0 - 1 0 neutrons per baryon and 8 X I0 8 K for matter density, neutron density and temperature, respectively, were chosen and kept constant for approximately I s. It was further assumed that initially the matter was composed of the products of incomplete helium burning, so that the main source of neutrons was the 2 2 Nc(a .n) 2 5 Mg reaction, and the abundance distribution of the heavy elements had already been modified by some slow neutron captures (s-process) |22 | . This "seed" distribution is shown in fig. 2a.
SO 60_ 70 90
50 60 70 B" •
Mass Number A
Fig. 2. Isotopic abundances V, normalized to U/.-t,-)'/ = 1. where the sum includes light nuclei (4lle, J 2Ne, etc.) alter partial hydrostatic helium burning, (a): Seed abundances of heavy nuclei from chromium and upwards for explosive processing of helium shells of massive stars (from R'f. [22 J). Due to the operation of the s-proccss prior to the explosion. S B l e has become the most abundant nucleus, and also the other abundances arc different from their solar system values, (b): Presently calculated r-proccss abundances after a neutron irradiation of 1.17 s duration. ITfects of redistributions accompanying -delayed neutron emission have not been included, for comparison the solar system r-process abundance distribution (taken from Cameron 123|) is shown as crosses on an arbitrary scale.
We performed calculations with three different sets of/?-dccay half-lives: (i) for all nuclides the predictions of Klapdor et al. |6[ were applied.(ii) for the nuclides treated here and in refs. [1,2| we used the experimental half-lives, whereas the rest was still taken from rcf. [oj. and finally.(iii) the observed trend for the (i-decuy half-lives illustrated in fig. 1 was assumed to continue for more neutron-rich isotope;,. Hence, lot the unobserved isotopes with if = 24—29 the predicted half-lives were scaled by factors for the individual elements given by the comparison for the heaviest observed odd and even nuclei. This assumption, although admittedly questionable, made it possible to obtain funhcr information on the dependence of the calculated abundances on the 0-dccay rates.
The abundances obtained with one set of half-lives are shown in fig. 2b. The changes resulting f.om (he
25
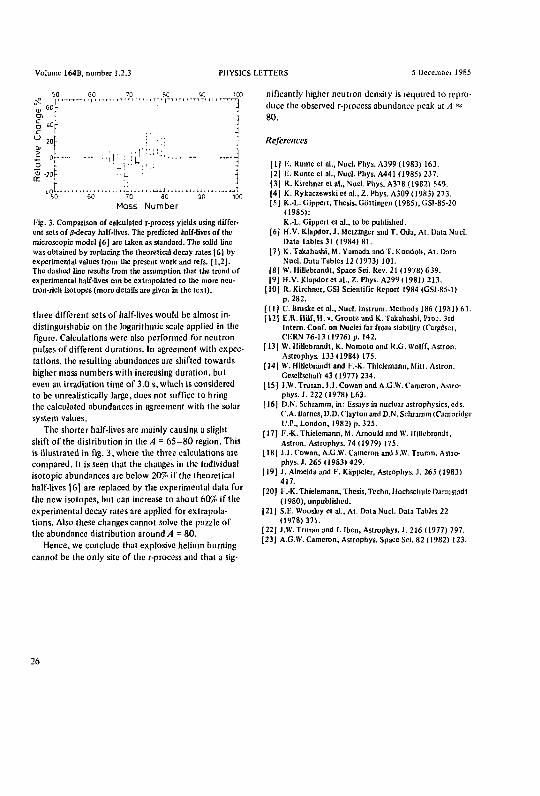
Volume 164B, number 1,2,3 PHYSICS LETTERS 5 December 1985
50 60 70 ^ 80 90 1C
a. sci" ' 1 ' ' ' '"1
ai r -f '"Ê : f '"Ê ° io[ a> I > l- •
^ o---— - ' - i ! : r ; : f iJL !' "" _o l "> -201 "> -201 • ' U j
L -t.0 ' ' ' ' '-•
TO
: L -t.0 ' ' ' ' '-•
TO
" e c ' " ' 7 0 ' " " so 90 10 Mass Number
l-'ig. 3. Comparison of calculated r-proccss yields using different sets of 0-decay half-lives. The predicted half-lives of the microscopic model [6] are taken as standard. The solid line was obtained by replacing the theoretical decay rates [6| by experimental values from the present work and refs. (1,2). The dashed line results from the assumption that the trend of experimental naif-lives can be extrapolated to the more neutron-rich isotopes (more details are given in the text).
three different sets of half-lives would be almost indistinguishable on the logarithmic scale applied in the figure. Calculations were also performed for neutron pulses of different durations. In agreement with expectations, the resulting abundances are shifted towards higher mass numbers with increasing duration, but even an irradiation time of 3.0 s, which is considered to be unrealistically large, does not suffice to bring the calculated abundances in agreement with the solar system values.
The shorter half-lives are mainly causing a slight shift of the distribution in the A = 65-80 region. This is illustrated in fig. 3 , where the three calculations are compared. It is seen that the changes in the individual isotopic abundances are below 20% if the theoretical half-lives [6] are replaced by the experimental data for the new isotopes, but can increase to about 60% if the experimental decay rates are applied for extrapolations. Also these changes cannot solve the puzzle of the abundance distribution around A = 80.
Hence, we conclude that explosive helium burning cannot be the only site of the r-process and that a sig
nificantly higher neutron density is required to reproduce the observed r-process abundance peak at A ^ 80.
References
[1J V.. Runteetal., Nucl. Phys. A399U983) 163. (2) V.. Runte et al., Nucl. Phys. A441 (1985) 237. [3| R. Kirchner et al., Nucl. Phys. A378 (1982) 549. [4| K. Rykaczewski et al., Z. Phys. A309 (1983) 273. [5J K.-L. Gippert, Thesis, Gottingen ( 1985), GS1-85-20
(1985); K.-L. Gippert et al., to be published.
|6 | H.V. Klapdor, J. Mctzinger and T. Oda, At. Data Nucl. Data Tables 31 (1984) 81.
[7] K.Takahashi, M. Vamada and T. Kondoli, At. Data Nucl. Data Tables 12 (1973) 101.
|8) W. HiUebrandt, Space Sci. Rev. 21 (1978) 639. (9| H.V. Klapdor et al., Z. Phys. A299( 1981) 213.
[ 10| R. Kirchner, GS1 Scientific Report 1984 (GSI-85-1) p. 282.
[11) C. Bmske et al., Nucl. lnstrum. Methods [86 (1981) 61. [12 j E.R. Hilf, H. v. Groote and K. Takahashi, Proc. 3rd
Intern. Conf. on Nuclei far from stability (Cargése), CERN76-13(1976)p. 142.
[ 13| W. Hillebrandt, K. Nomoto and R.G. Wolff, Astron. Astrophys. 133(1984) 175.
[14| W. Hillebrandt and l.-K. Thielemann, Milt. Astron. GcscUschaft 43 (1977) 234.
[ 15J J.W. Truran, J.J. Cowan and A.G.W. Cameron, Astrophys. J. 222 (1978) L63.
[ 16] D.N. Schramm, in: Essays in nuclear astrophysics, cds. C.A. Barnes, D.D. Clayton and D.N. Schramm (Cambridge U.P., London, 1982) p. 325.
( 17] F.-K. Thielemann. M. Arnould and W. IliUcbrandl, Aslron. Astrophys. 74 (1979) 175.
[18] J.J. Cowan, A.G.W. Cameron and J.W. Truran, Astrophys. J. 265 (1983) 429.
i 19] J. Almeida and (•'. Kappeler, Astrophys. J. 265 (1983) 417.
[20) !•'.-K.Thielemann, Thesis,Techn.Hochschule Darmstadi (1980), unpublished.
(21 ] S.E. Woosley et al.. At. Data Nucl. Data Tables 22 (1978)371.
[22] J.W. Trunin and I. Iben, Astrophys. J. 216 (1977) 797. [23| A.G.W. Cameron, Astrophys. Space Sci. 82(1982) 123.
26

Imprimé ou Centre de
Recherches Nucléaires
Strasbourg 1 9 8 8