Embed Size (px)
Citation preview
Human Cancer Biology
Changes in Gene Transcription Underlying the AberrantCitrate and Choline Metabolism in Human Prostate CancerSamples
Helena Bertilsson1,4, May-Britt Tessem2, Arnar Flatberg3, Trond Viset5, Ingrid Gribbestad2, Anders Angelsen4,and Jostein Halgunset1,5
AbstractPurpose: Low concentrations of citrate and high concentrations of choline-containing compounds
(ChoCC) are metabolic characteristics observed by magnetic resonance spectroscopy of prostate cancer
tissue. The objective was to investigate the gene expression changes underlying these metabolic aberrations
to find regulatory genes with potential for targeted therapies.
Experimental design: Fresh frozen samples (n ¼ 133) from 41 patients undergoing radical prostatec-
tomy were included. Histopathologic evaluation was carried out for each sample before a metabolic profile
was obtained with high-resolution magic angle spinning (HR-MAS) spectroscopy. Following the HR-MAS,
RNA was extracted from the same sample and quality controlled before carrying out microarray gene
expression profiling. A partial least square statistical model was used to integrate the data sets to identify
genes whose expression show significant covariance with citrate and ChoCC levels.
Results: Samples were classified as benign, n ¼ 35; cancer of low grade (Gleason score 6), n ¼ 24;
intermediate grade (Gleason score 7), n ¼ 41; or high grade (Gleason score �8), n ¼ 33. RNA quality was
high with a mean RNA Integrity Number score of 9.1 (SD 1.2). Gene products predicting significantly a
reduced citrate levelwere acetyl citrate lyase (ACLY, P¼0.003) andm-aconitase (ACON, P<0.001). The twogenes whose expression most closely accompanied the increase in ChoCC were those of phospholipase A2
group VII (PLA2G7, P < 0.001) and choline kinase a (CHKA, P ¼ 0.002).
Conclusions: By integrating histologic, transcriptomic, andmetabolic data, our study has contributed to
an expanded understanding of the mechanisms underlying aberrant citrate and ChoCC levels in prostate
cancer. Clin Cancer Res; 18(12); 3261–9. �2012 AACR.
IntroductionAltered metabolism is a hallmark of cancer cells (1). In
prostate cancer,metabolic changes present as a reduction incitrate and an increase in choline-containing compound(ChoCC) compared with normal prostate cells (2). Thesemetabolites can be analyzed in vivo using magnetic reso-nance spectroscopy (MRS) during an MRI examination (3,4). Thus, reduced citrate and increased ChoCC metabolitelevels can aid discrimination of cancerous from noncan-cerous areas (5), and studies indicate that they also have the
potential to identify tumors with varying levels of aggres-siveness (6).
The application of a highmagnetic field strength (14.1 T)to a tissue sample using high-resolution magic angle spin-ning (HR-MAS) MRS may be used for ex vivo assessment ofthe metabolic status (7). This technique gives a moredetailed metabolic profile compared with in vivo MRS, andthe samples remain intact, allowing for further molecularanalyses. TheChoCCs, observed as a broad signal in vivo, areseparated into choline (Cho), phosphocholine (PC), andglycerophosphocholine (GPC) in the HR-MAS spectra. TheChoCCs constitute important building blocks in cell mem-branes and are elevated, in several malignancies (8, 9),including prostate cancer (10), due to altered phospholipidmetabolism. When using gene therapy to silence theenzyme choline kinase converting Cho to PC, a reductionof cell proliferation and tumor growth was shown in breastcancer cell lines (11). The prostate is highly specialized forthe production and secretion of citrate, which is used as anenergy supply for sperm. Thus, the normal prostate containshigh levels of citrate, with decreasing levels accompanyingthe malignant transformation (12). For the malignant cellsto proliferate, theymust adapt theirmetabolism anduse the
Authors'Affiliations:Departmentsof 1LaboratoryMedicine andChildren'sandWomen's Health, 2Circulation andMedical Imaging, 3Cancer ResearchandMolecularMedicine,NorwegianUniversity of Science andTechnology;and Departments of 4Urology and 5Pathology and Medical Genetics, StOlavs Hospital, Trondheim University Hospital, Trondheim, Norway
Corresponding Author: Helena Bertilsson, Department of LaboratoryMedicine, Children's and Women's Health, Norwegian University of Sci-ence and Technology, and Department of Urology, St Olavs Hospital,Trondheim University Hospital, N-7006 Trondheim, Norway. Phone: 47-72-57-31-03; Fax: 47-73-86-74-28; E-mail: [email protected]
doi: 10.1158/1078-0432.CCR-11-2929
�2012 American Association for Cancer Research.
ClinicalCancer
Research
www.aacrjournals.org 3261
on April 13, 2017. © 2012 American Association for Cancer Research. clincancerres.aacrjournals.org Downloaded from
Published OnlineFirst April 17, 2012; DOI: 10.1158/1078-0432.CCR-11-2929
citrate for de novo lipid synthesis (13). Inactivation ofenzymes, such as ATP citrate lyase (ACLY), has been shownto limit cell proliferation in vitro and to reduce tumorgrowth in vivo in numerous tumors including the prostatecancer cell line PC3 (14).
A better understanding of the underlying mechanismsgoverning the citrate and ChoCC metabolism has thepotential of revealing novel therapeutic targets in prostatecancer. To integrate information from several sources couldbe a key element in achieving this goal (15). Becauseexpression of genes involved in intermediate metabolismis small compared with the expression levels of structural orsecretory genes, such an integrated approachwill contributein finding genes whose altered expression, although per-haps small, will lead to importantmetabolic deviations. Themain objective of this study was to explore the molecularmechanisms underlying the changes in citrate and ChoCCmetabolism in prostate cancer. We combined data fromhistopathologic evaluation, gene expression analysis, andmetabolic profiling from the same sample to identify thosegenes whose expression covariates with the altered levels ofcitrate and ChoCC.
Patients and MethodsPatients and tissue samples
At our institution, a transversal tissue slice (thickness 2mm) is routinely removed for research from all patientsundergoing radical prostatectomy, provided the appropri-ate consent formhas been signed. The slice is removed fromthe middle of the gland with a double bladed knife and
immediately fresh frozen in liquid nitrogen. The 2remaining halves of the prostate gland are stitched to acork board with the cut surface downward, as this mini-mizes the tendency for the capsule to retract during thefixation period in 4% buffered formaldehyde. After fixa-tion the prostate is covered with India ink and cut in4 mm thick transversal slices, which are subsequentlyembedded in paraffin and cut into 4-mm thick sections forhematoxylin and eosin staining and microscopic exami-nation. This study comprises fresh frozen samples from48 patients operated with open radical prostatectomy,fulfilling the following criteria: no previous treatment forprostate cancer, an estimated tumor volume of more than5% of the gland and tumor represented in both hema-toxylin-eosin-saffron (HES) sections adjacent to the fro-zen slice. Several samples from each slice were selectedfrom locations corresponding to cancerous and noncan-cerous areas identified in the adjacent paraffin sections.For finding these areas, a fused image of the digital photoof the fresh slice and the adjacent HES section are overlaidon the frozen slice (16). Cryosections (4 mm) from eachsample were stained with HES and evaluated by a pathol-ogist trained in uropathology. The cellular compositionof the section (percentage of area occupied by benignepithelium, stroma, and cancer) was visually assessed,and Gleason grading was carried out in all cases ofmalignancy. In 2 slices, no cancer was found in any ofthe extracted samples, and in 5 additional slices the RNAextracts showed low concentration or reduced quality(low RIN score), both supposedly due to a high shareof stroma. These 7 slices were therefore excluded. Thus,the statistical analysis is based on the remaining 133samples from 41 patients, all of which gave rise tosuccessful gene expression profiling after HR-MAS MRS.
HR-MAS MR spectroscopyThe frozen slice was laid on an aluminumplate in contact
with liquid nitrogen and 3� 2mm samples (weight 16–20mg) were removed from the slice with a specially designeddrill. Cryosections were cut for histopathologic evaluationfrom each sample before HR-MAS. Thereafter, the samplewas transferred to a disposable insert for the zirconiumHR-MAS rotor (50 mL, 4 mm diameter) together with 3 mLD2O (deuterium oxide) containing TSP (sodium-30-tri-methylsilylpropionate-2,2,3,3-d4). To fit the insert, thesample was cut into smaller pieces using a punch biopsytool. HR-MAS was carried out with a 14.1 T (600 MHz for1H) Bruker Avance DRX spectrometer (Bruker BioSpinGmbH) equipped with a 4-mm 1H/13C HR-MAS probe.Spectra were acquired at 4�C with a spin rate of 5000Hz. A Carr-Purcell-Meiboom-Gill (CPMG) spin echosequence [90� � (t �180� � t)n � acquisition] wasacquired to suppress signals from overlapping lipids andmacromolecules (128 transients, effective echo time ¼ 60milliseconds, acquisition time¼ 3.27 seconds). A spectralregion of 10 KHz was collected into 64,000 data points,and a line broadening of 0.30 Hz was applied to the rawdata before Fourier transformation. After 36 minutes of
Translational RelevanceThe metabolic alterations including low citrate and
high choline levels in prostate cancer are increasinglyapplied in diagnostic tools like magnetic resonancespectroscopy and positron emission tomography toimprove characterization of the disease and to monitorthe response to treatment. The study was designed toinvestigate the genetic alterations behind thesemetabol-ic aberrations by integrating histopathology, metabolicand transcriptomic profiles of the same samplesextracted from radical prostatectomy specimens.Genome-wide transcription analysis (23.444 tran-scripts) and high-resolution magic angle spinning werecarried out on 133 samples. ATP citrate lyase (P¼ 0.003)and aconitase (P < 0.001) covaried most significantlywith the citrate levels, whereas phospholipase A2 groupVII (P < 0.001) and choline kinase alpha (P ¼ 0.002)were the transcriptsmost significantly accompanying therise in choline levels. Because these are the key regulatoryenzymes for important metabolic pathways in prostatecancer progression, our results indicate that these geneproducts deserve attention as possible targets for prostatecancer specific therapy.
Bertilsson et al.
Clin Cancer Res; 18(12) June 15, 2012 Clinical Cancer Research3262
on April 13, 2017. © 2012 American Association for Cancer Research. clincancerres.aacrjournals.org Downloaded from
Published OnlineFirst April 17, 2012; DOI: 10.1158/1078-0432.CCR-11-2929
HR-MAS analysis, the sample was immediately refrozenbefore RNA isolation.
RNA isolationAfter HR-MAS analysis, the sample was homogenized for
10 to 20 seconds in 400 L tissue lysis buffer using a rotor-stator homogenizer (Omni TH, TissueHomogenizer; OmniInternational). The RNA was extracted manually with amirVana miRNA Isolation Kit (Ambion). The RNA concen-tration and purity were determined by a NanoDropSpectrophotometer (NanoDrop Technologies). The RNAintegrity was determined by a 2100 Bioanalyzer (AgilentTechnologies), according to the manufacturers’ instruc-tions, and the results are presented asRNA IntegrityNumber(RIN) scores.
Gene expression profilingAn Illumina TotalPrep RNA Amplification Kit (Ambion
Inc.) was used to amplify RNA for hybridization on Illu-mina BeadChips. To synthesize first-strand cDNA withreverse transcription, total RNA from each samplewas used.Following the second-strand cDNA synthesis and cDNApurification steps, cRNA was synthesized via in vitro tran-scription for 12 hours. The gene expression profiles weremeasuredwith IlluminaHumanHT-12 v4 ExpressionBead-Chip (Illumina), which enables genome-wide expressionanalysis (more than 47,000 transcripts) of 12 samples inparallel on a single microarray. The individual transcriptswith a detection P > 0.01 for all samples were filtered out.The remaining 23,444 transcript values were log2 trans-formed and quantile normalized to adjust for technicalartifacts between samples (17). This normalization willenable differentiation between biological variations in geneexpression levels and variation due to measurement pro-cesses. The microarray data were prepared in a format thatconforms to theMinimum Information About aMicroarrayGene Experiment (MIAME) guidelines and published inArray Express with accession number: E-MTAB-1041.
StatisticsPartial least square (PLS)multivariate regressionwasused
as the statistical model to investigate the relationshipbetween the HR-MAS spectra and Gleason score and forfinding genes whose expression level covariate with theselected metabolites. Each metabolite intensity value wasfound on the HR-MAS spectrum at the specific ppm value
for the included metabolites. For the integration of metab-olite and gene data, the highest intensity spectral value forcitrate, creatine, Cho, PC, and GPC (found at 2.73, 3.04,3.22, 3.23, and 3.24 ppm, respectively) was used as depen-dent values in the PLS model, whereas the gene expressiondata were used as independent values. Thismodel identifies2 orthogonal planes (PC1 and PC2) which maximize thevariance between the samples. Individual genes, whoseexpression levels covariate with the above defined metabo-lites, were identified from the size and variance of theregression coefficients. Testing whether regression coeffi-cients were significantly different from zero gave a P valuefor the association of each gene to each of the metabolites.
ResultsPatient and sample characteristics
Patient characteristics and histopathologic evaluations ofthe prostate gland are presented in Table 1. The percentageof the different tissue types within each sample is presentedin Fig. 1. In 35 of the samples, only benign histology wasfound. Of the remaining 98 samples containing cancer, 24showed low-grade tumor (Gleason score ¼ 6), whereas 41samples showed intermediate grade (Gleason score ¼ 7)and 33 samples contained highly aggressive cancer (Glea-son score� 8). RNA extracts with high purity, indicated by a260 of 280 ratio of 2.0 (SD 0.03) and 260 of 230 ratio of1.94 (SD 0.39), were isolated from all samples. The averageRIN scorewas 9.1 (SD1.2). All gene transcripts (n¼23.444)and selected metabolites (n ¼ 5) serve as variables forfinding genes whose expression level significantly can pre-dict a response in the metabolites. To illustrate the varianceof the samples included in the PLS model integrating genesand metabolites, a score plot depicting each sample (n ¼133) as a pie chart is shown in Fig. 2. The first principalcomponent (PC1) distinguishes malignant from benignsamples, whereas the second principal component (PC2)separates the cancer samples according to their aggres-siveness in terms of Gleason score.
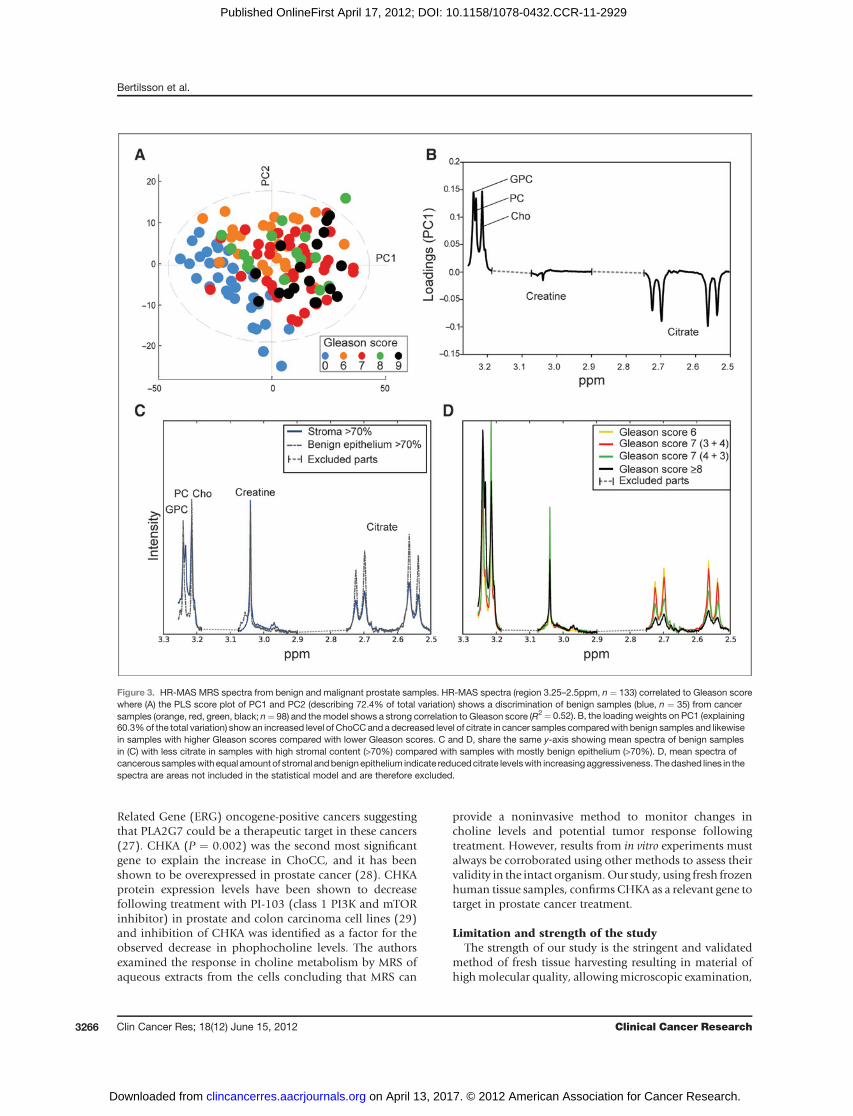
Metabolic profilingResults from HR-MAS MRS analysis are shown in Fig. 3.
The PLS model (Fig. 3A) shows HR-MAS spectra (region3.25–2.5 ppm) with a strong correlation to the Gleasonscore (R2 ¼ 0.52), thereby discriminating benign fromcancerous samples. Cancer samples have a reduced level
Table 1. Patient characteristics and histopathologic evaluation of the prostate gland
Age (mean) Preop PSA (mean) Tumor volume (mean) pT-stage n Gleason score n
62.6 (SD 5.5) 10.4 (SD 6.5) 21.1% (SD 15.3) pT2a 2 3 þ 3 1pT2b 1 3 þ 4 17pT2c 25 4 þ 3 13pT3a 6 4 þ 5 8pT3b 7 5 þ 3 1
5 þ 4 1
Genes Underlying Aberrant Metabolism in Prostate Cancer
www.aacrjournals.org Clin Cancer Res; 18(12) June 15, 2012 3263
on April 13, 2017. © 2012 American Association for Cancer Research. clincancerres.aacrjournals.org Downloaded from
Published OnlineFirst April 17, 2012; DOI: 10.1158/1078-0432.CCR-11-2929
of citrate and an increased ChoCC level compared withnormal samples (Fig. 3B and D). In Fig. 3D, the sampleswith a Gleason score of 7 and an equal amount of benignand stromal tissues are divided between Gleason grades 3þ4 and 4þ 3. The MR spectra show decreasing citrate signalswhen going froma less aggressiveGleason grade (3þ 4) to amore aggressive variant (4 þ 3) within the same Gleasonscore. Prostate stromal cells only produce citrate to a smallextent, and samples with a high proportion of stroma(in Fig. 3C selected as samples with >70% stroma) mimica malignant spectrum in this respect. However, they areseparated from the latter by their lower level of ChoCC. Themean ChoCC level is increased in malignant samples com-paredwith normal and all the individual components of theChoCC contribute to the increased signal.
Gene expression changes underlying aberrant levels ofcitrate and ChoCC
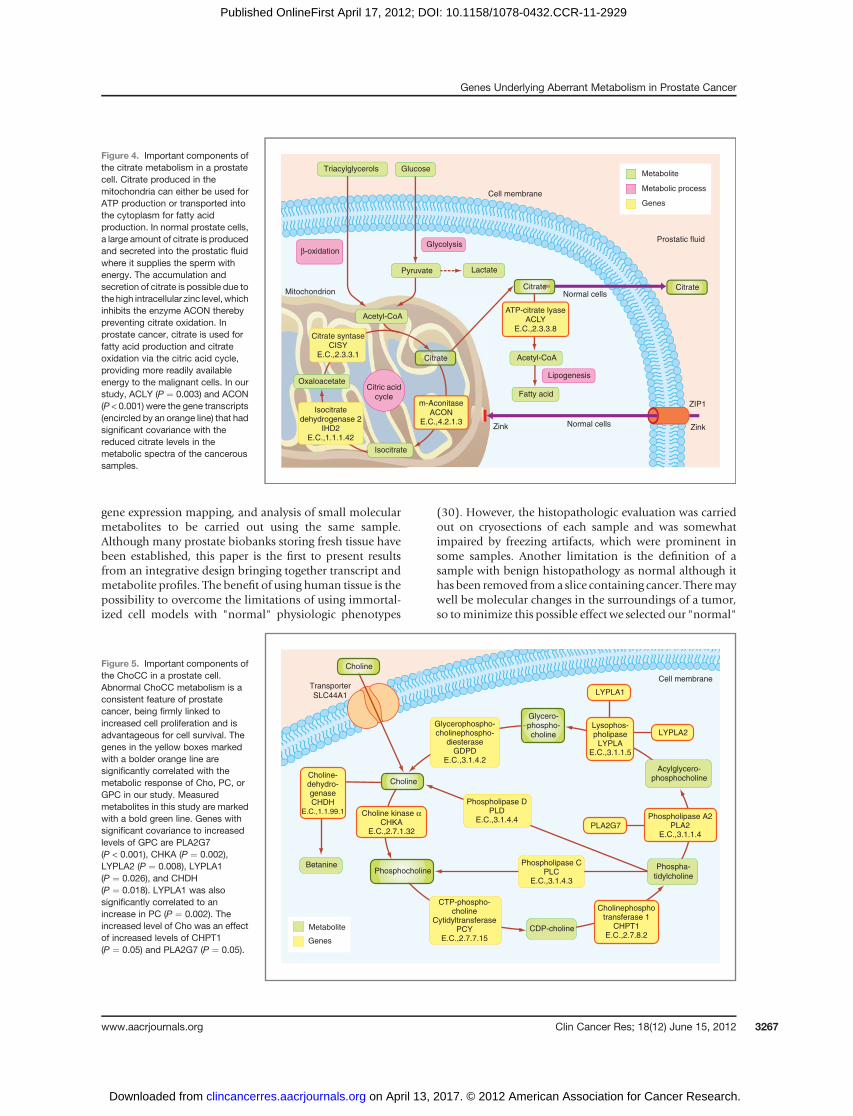
We identified a 3-dimensional predictive subspace, asvisualized in Fig. 2, using gene expression data, metabolicprofiling and sample histopathology. The PLS regressionmodel was used to find gene expression with high covari-ancewith citrate andChoCC levels. To evaluate the possibleinfluence of gene expression changes on the selected meta-bolites in this study, we do not present the results as up ordownregulation of the gene, but as a measurement of howthese variables change together, their covariance. Weexplored all gene expression values involved in the meta-bolic pathways of citrate and ChoCC to find out whichgenes significantly predict a response in the selected meta-bolites. The enzymes with possible regulatory effects oncitrate production (Fig. 4) with significant covariance wereACLY P¼ 0.003 andm-aconitase (ACON) P¼ < 0.001 (Fig.6). ACON also has a significant covariance with GPC (P ¼0.003). The ChoCC and their metabolic pathway are more
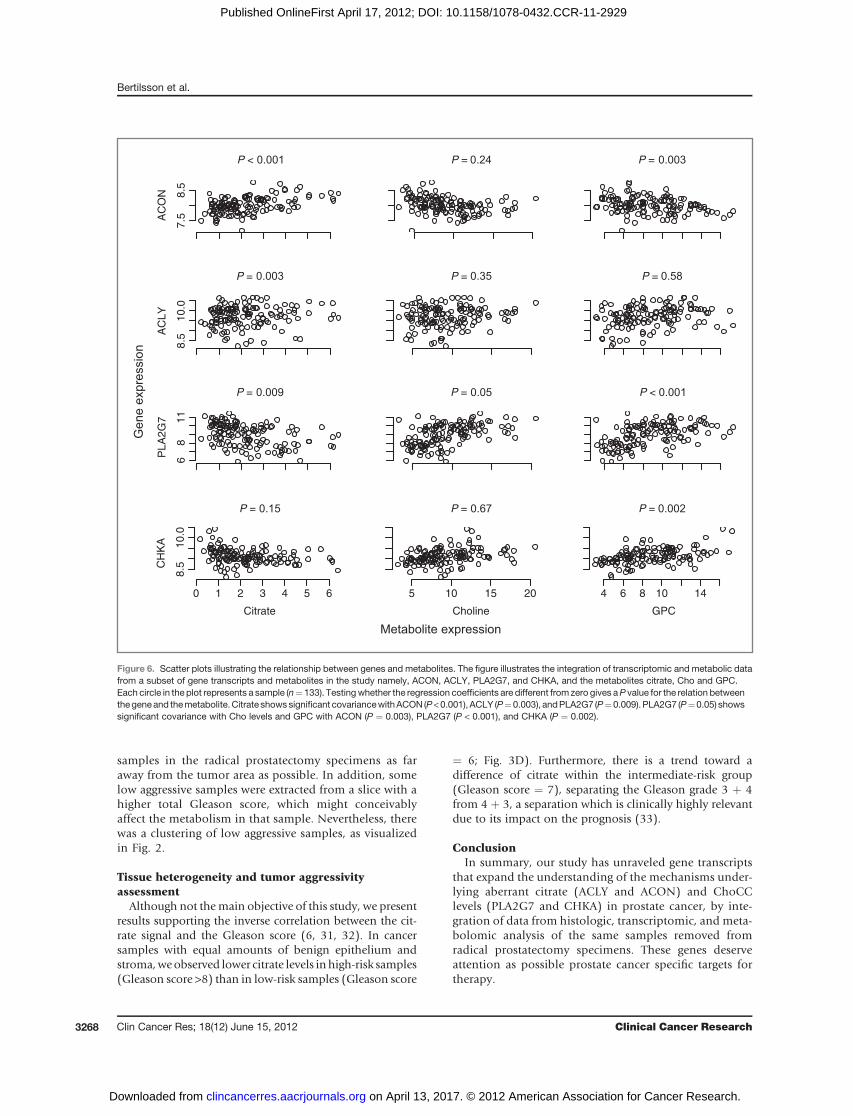
complex and involve several enzymes in the regulation ofthe different metabolites (Fig. 5). The gene transcripts withthe most significant covariance to GPC were PLA2G7 (P <0.001), a member of the arachidonic acid releasing PLA2family, and choline kinasea (CHKA) P¼ 0.002. PLA2G7 (P¼ 0.05) and cholinephosphotransferase 1 (CHPT1, P ¼0.05) showed significant covariance with the increased Cholevels. To illustrate the covariancebetween the genesACON,ACLY, PLA2G7, CHKA and themetabolites citrate, Cho andGPC, the results are presented in Fig. 6with accompanyingPvalues.
DiscussionBenefits of integrating transcriptomic and metabolicdata
This study shows the successful integration of histologic,metabolic, and transcriptomic data from the same humanprostate tissue samples. Even though the RNA extractionwas carried out after HR-MAS MRS, the RNA integrity wasvery high, which is important for generating a robustintegrated model. We identified genes whose expressionshowed a high covariance to the aberrant levels of citrateandChoCCmetabolites andwhich can thereby possibly actas molecular targets for therapy. A small alteration in theexpression of a gene which codes for a rate limiting enzymecan result in significant changes in the activity of thecorresponding metabolic pathway and thereby a change inthe levels of the affectedmetabolite (18). Finding geneswithprofound effects on cellular and metabolic functions ishighly relevant for the development of targeted therapiesand for improving diagnostics (19). Metabolic genes are atgreater risk of being erroneously eliminated in microarrayanalyses because the level of expression is often only slightlychanged compared with the expression level in a normal
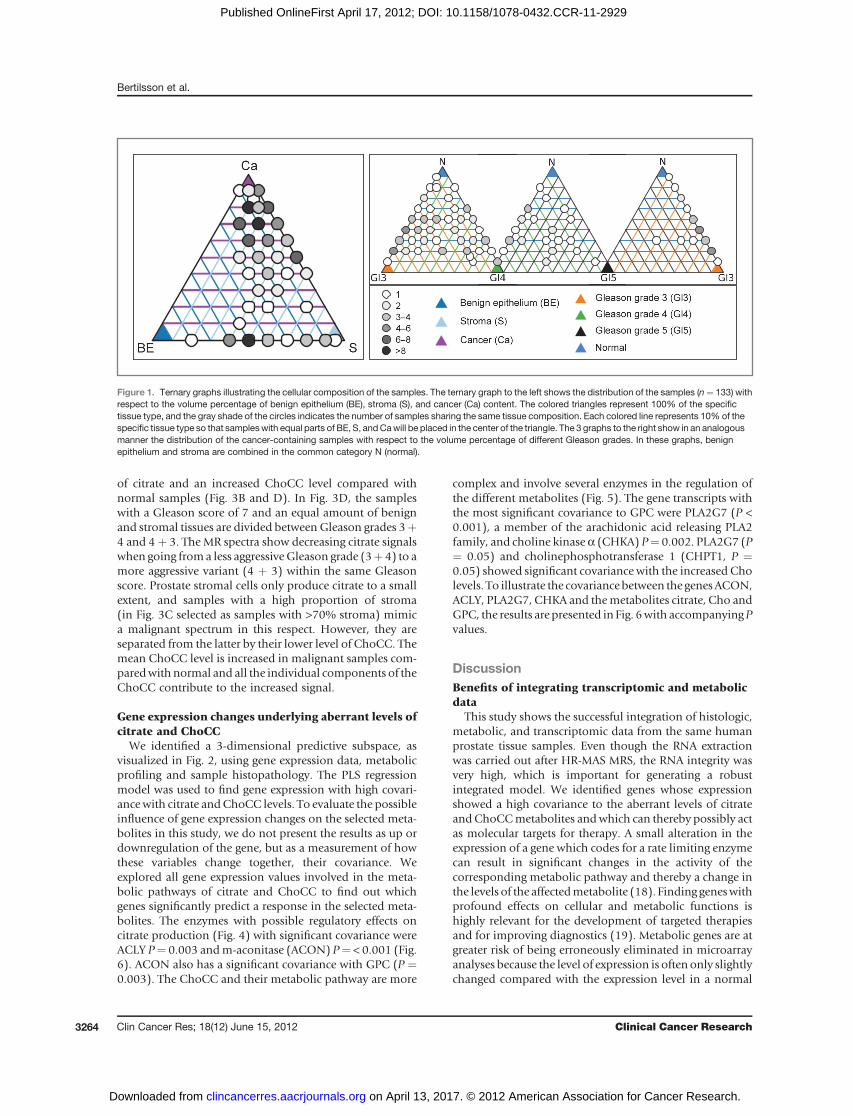
Figure 1. Ternary graphs illustrating the cellular composition of the samples. The ternary graph to the left shows the distribution of the samples (n¼ 133) withrespect to the volume percentage of benign epithelium (BE), stroma (S), and cancer (Ca) content. The colored triangles represent 100% of the specifictissue type, and the gray shade of the circles indicates the number of samples sharing the same tissue composition. Each colored line represents 10% of thespecific tissue type so that sampleswith equal parts of BE, S, andCawill be placed in the center of the triangle. The 3 graphs to the right show in an analogousmanner the distribution of the cancer-containing samples with respect to the volume percentage of different Gleason grades. In these graphs, benignepithelium and stroma are combined in the common category N (normal).
Bertilsson et al.
Clin Cancer Res; 18(12) June 15, 2012 Clinical Cancer Research3264
on April 13, 2017. © 2012 American Association for Cancer Research. clincancerres.aacrjournals.org Downloaded from
Published OnlineFirst April 17, 2012; DOI: 10.1158/1078-0432.CCR-11-2929
state. A small increase (2-fold) in a metabolic regulatorygene can be of greater importance for cancer progressionthan a 50-fold change in expression of a structural protein.
Genes with significant covariance to low citrate andhigh ChoCC levelsThe concern of missing important metabolic genes by
simply studying the level of gene expression has beenaddressed by Costello and colleagues (20) and exemplifiedby the enzyme ACON,which is a key enzyme for convertingcitrate to isocitrate. There is no detectable difference in theexpression of ACON between normal and malignant tissueby immunhistochemistry (21). Whereas in normal cellsACON is effectively inhibited by zinc (Fig. 4), malignantcells have a reduced capability to store zinc, leading to areduced inhibition of ACON and thus citrate is oxidized inthe citric cycle and consequently citrate levels will sink. Theimportance of ACON in prostate cancer metabolism couldhave been missed by a pure genetic/proteomic approach.However, in our study, ACON is a highly significant pre-dictor of the citrate level in cancer samples. The other genetranscript that showed significant covariance with citratelevels was ACLY. ACLY is the key enzyme of de novo lipo-
genesis as it converts citrate to cytosolic acetyl CoA thuslinking tumor-associated glycolysis to enhanced lipogene-sis, as the acetyl-CoA is utilized in fatty acid and cholesterolsynthesis (13). Inhibition of this gene by siRNA has beenshown to suppress the growth and survival of tumor cells(14). ACLY inhibition resulted in the inhibition of tumorcell growth in vitro and in vivo and the effect seems to beenhanced by combining ACLY knockdown and statin treat-ment (22). ACLY overexpression is correlated with poorerprognosis of non–small cell lung carcinomaand is thereforesuggested to be an attractive target for RNA interference in aclinical setting (23). Studies suggesting obesity being a riskfactor for the development of larger tumors and moreaggressive cancers also support the involvement of lipo-genic enzymes in prostate cancer pathophysiology (24, 25).Rapidly proliferating cancer cells require phospholipids forcell membrane synthesis, whichmay explain the increase inChoCC in many cancers. The gene most significantly pre-dicting an increase in ChoCC, especially an increase in GPClevels, was PLA2G7, amember of the PLA2 gene family. Thearachidonic acid pathway is implicated in prostate carcino-genesis (26). Vainio and colleagues showed that PLA2G7washighly overexpressed inprostate cancer, especially inEts
PC
2
PC1
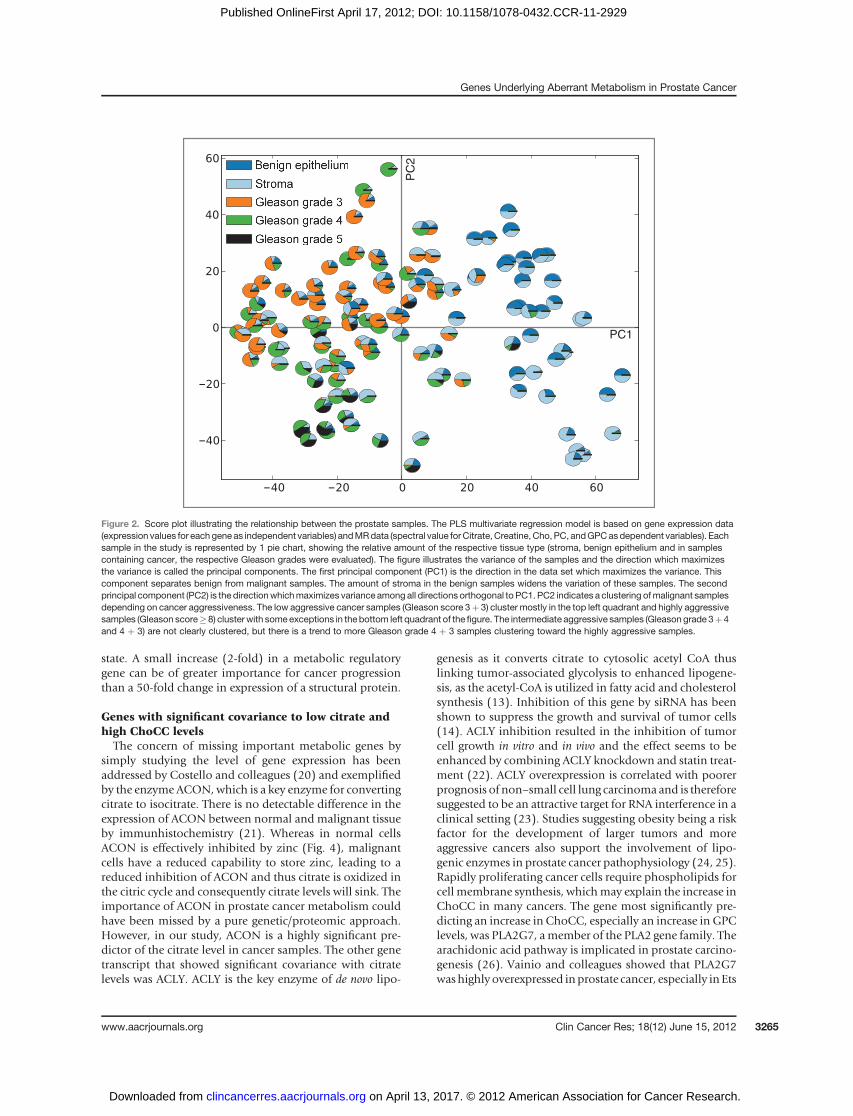
Figure 2. Score plot illustrating the relationship between the prostate samples. The PLS multivariate regression model is based on gene expression data(expression values for each gene as independent variables) andMRdata (spectral value forCitrate, Creatine, Cho, PC, andGPCasdependent variables). Eachsample in the study is represented by 1 pie chart, showing the relative amount of the respective tissue type (stroma, benign epithelium and in samplescontaining cancer, the respective Gleason grades were evaluated). The figure illustrates the variance of the samples and the direction which maximizesthe variance is called the principal components. The first principal component (PC1) is the direction in the data set which maximizes the variance. Thiscomponent separates benign from malignant samples. The amount of stroma in the benign samples widens the variation of these samples. The secondprincipal component (PC2) is the directionwhichmaximizes variance among all directions orthogonal to PC1. PC2 indicates a clustering ofmalignant samplesdepending on cancer aggressiveness. The low aggressive cancer samples (Gleason score 3þ 3) cluster mostly in the top left quadrant and highly aggressivesamples (Gleason score�8) cluster with some exceptions in the bottom left quadrant of the figure. The intermediate aggressive samples (Gleason grade 3þ4and 4 þ 3) are not clearly clustered, but there is a trend to more Gleason grade 4 þ 3 samples clustering toward the highly aggressive samples.
Genes Underlying Aberrant Metabolism in Prostate Cancer
www.aacrjournals.org Clin Cancer Res; 18(12) June 15, 2012 3265
on April 13, 2017. © 2012 American Association for Cancer Research. clincancerres.aacrjournals.org Downloaded from
Published OnlineFirst April 17, 2012; DOI: 10.1158/1078-0432.CCR-11-2929
Related Gene (ERG) oncogene-positive cancers suggestingthat PLA2G7 could be a therapeutic target in these cancers(27). CHKA (P ¼ 0.002) was the second most significantgene to explain the increase in ChoCC, and it has beenshown to be overexpressed in prostate cancer (28). CHKAprotein expression levels have been shown to decreasefollowing treatment with PI-103 (class 1 PI3K and mTORinhibitor) in prostate and colon carcinoma cell lines (29)and inhibition of CHKA was identified as a factor for theobserved decrease in phophocholine levels. The authorsexamined the response in choline metabolism by MRS ofaqueous extracts from the cells concluding that MRS can
provide a noninvasive method to monitor changes incholine levels and potential tumor response followingtreatment. However, results from in vitro experiments mustalways be corroborated using other methods to assess theirvalidity in the intact organism.Our study, using fresh frozenhuman tissue samples, confirms CHKA as a relevant gene totarget in prostate cancer treatment.
Limitation and strength of the studyThe strength of our study is the stringent and validated
method of fresh tissue harvesting resulting in material ofhighmolecular quality, allowingmicroscopic examination,
Figure 3. HR-MAS MRS spectra from benign and malignant prostate samples. HR-MAS spectra (region 3.25–2.5ppm, n ¼ 133) correlated to Gleason scorewhere (A) the PLS score plot of PC1 and PC2 (describing 72.4% of total variation) shows a discrimination of benign samples (blue, n ¼ 35) from cancersamples (orange, red, green, black; n¼ 98) and the model shows a strong correlation to Gleason score (R2¼ 0.52). B, the loading weights on PC1 (explaining60.3%of the total variation) show an increased level of ChoCCand a decreased level of citrate in cancer samples comparedwith benign samples and likewisein samples with higher Gleason scores compared with lower Gleason scores. C and D, share the same y-axis showing mean spectra of benign samplesin (C) with less citrate in samples with high stromal content (>70%) compared with samples with mostly benign epithelium (>70%). D, mean spectra ofcancerous sampleswith equal amount of stromal andbenignepithelium indicate reducedcitrate levelswith increasing aggressiveness. Thedashed lines in thespectra are areas not included in the statistical model and are therefore excluded.
Bertilsson et al.
Clin Cancer Res; 18(12) June 15, 2012 Clinical Cancer Research3266
on April 13, 2017. © 2012 American Association for Cancer Research. clincancerres.aacrjournals.org Downloaded from
Published OnlineFirst April 17, 2012; DOI: 10.1158/1078-0432.CCR-11-2929
gene expression mapping, and analysis of small molecularmetabolites to be carried out using the same sample.Although many prostate biobanks storing fresh tissue havebeen established, this paper is the first to present resultsfrom an integrative design bringing together transcript andmetabolite profiles. The benefit of using human tissue is thepossibility to overcome the limitations of using immortal-ized cell models with "normal" physiologic phenotypes
(30). However, the histopathologic evaluation was carriedout on cryosections of each sample and was somewhatimpaired by freezing artifacts, which were prominent insome samples. Another limitation is the definition of asample with benign histopathology as normal although ithas been removed froma slice containing cancer. Theremaywell be molecular changes in the surroundings of a tumor,so tominimize this possible effect we selected our "normal"
Figure 5. Important components ofthe ChoCC in a prostate cell.Abnormal ChoCC metabolism is aconsistent feature of prostatecancer, being firmly linked toincreased cell proliferation and isadvantageous for cell survival. Thegenes in the yellow boxes markedwith a bolder orange line aresignificantly correlated with themetabolic response of Cho, PC, orGPC in our study. Measuredmetabolites in this study are markedwith a bold green line. Genes withsignificant covariance to increasedlevels of GPC are PLA2G7(P < 0.001), CHKA (P ¼ 0.002),LYPLA2 (P ¼ 0.008), LYPLA1(P ¼ 0.026), and CHDH(P ¼ 0.018). LYPLA1 was alsosignificantly correlated to anincrease in PC (P ¼ 0.002). Theincreased level of Cho was an effectof increased levels of CHPT1(P ¼ 0.05) and PLA2G7 (P ¼ 0.05).
Choline
Acylglycero-phosphocholine
Phospha-
tidylcholine
CDP-choline
Phosphocholine
PLA2G7
Cell membraneTransporter
SLC44A1
CTP-phospho-choline
CytidyltransferasePCY
E.C.,2.7.7.15
Phospholipase A2PLA2
E.C.,3.1.1.4
Glycerophospho-cholinephospho-
diesteraseGDPD
E.C.,3.1.4.2
Choline-dehydro-genaseCHDH
E.C.,1.1.99.1 Choline kinase αCHKA
E.C.,2.7.1.32
LYPLA2
Metabolite
Genes
Phospholipase CPLC
E.C.,3.1.4.3
Phospholipase DPLD
E.C.,3.1.4.4
Glycero-phospho-choline
Betanine
Cholinephosphotransferase 1
CHPT1E.C.,2.7.8.2
LYPLA1
Lysophos-pholipase
LYPLAE.C.,3.1.1.5
Choline
Figure 4. Important components ofthe citrate metabolism in a prostatecell. Citrate produced in themitochondria can either be used forATP production or transported intothe cytoplasm for fatty acidproduction. In normal prostate cells,a large amount of citrate is producedand secreted into the prostatic fluidwhere it supplies the sperm withenergy. The accumulation andsecretion of citrate is possible due tothe high intracellular zinc level, whichinhibits the enzyme ACON therebypreventing citrate oxidation. Inprostate cancer, citrate is used forfatty acid production and citrateoxidation via the citric acid cycle,providing more readily availableenergy to the malignant cells. In ourstudy, ACLY (P ¼ 0.003) and ACON(P < 0.001) were the gene transcripts(encircled by an orange line) that hadsignificant covariance with thereduced citrate levels in themetabolic spectra of the canceroussamples.
Citrate syntaseCISY
E.C.,2.3.3.1
Citric acid
cycle
Isocitrate
Oxaloacetate
Isocitratedehydrogenase 2
IHD2E.C.,1.1.1.42
Normal cellsCitrate
ATP-citrate lyaseACLY
E.C.,2.3.3.8
Lipogenesis
Fatty acid
Acetyl-CoA
Citrate
GlucoseTriacylglycerols
Glycolysis
LactatePyruvate
β-oxidation
Acetyl-CoA
Zink ZinkNormal cells
ZIP1
Metabolite
Metabolic process
GenesCell membrane
Prostatic fluid
m-AconitaseACON
E.C.,4.2.1.3
Citrate
Mitochondrion
Genes Underlying Aberrant Metabolism in Prostate Cancer
www.aacrjournals.org Clin Cancer Res; 18(12) June 15, 2012 3267
on April 13, 2017. © 2012 American Association for Cancer Research. clincancerres.aacrjournals.org Downloaded from
Published OnlineFirst April 17, 2012; DOI: 10.1158/1078-0432.CCR-11-2929
samples in the radical prostatectomy specimens as faraway from the tumor area as possible. In addition, somelow aggressive samples were extracted from a slice with ahigher total Gleason score, which might conceivablyaffect the metabolism in that sample. Nevertheless, therewas a clustering of low aggressive samples, as visualizedin Fig. 2.
Tissue heterogeneity and tumor aggressivityassessment
Although not themain objective of this study, we presentresults supporting the inverse correlation between the cit-rate signal and the Gleason score (6, 31, 32). In cancersamples with equal amounts of benign epithelium andstroma,weobserved lower citrate levels in high-risk samples(Gleason score >8) than in low-risk samples (Gleason score
¼ 6; Fig. 3D). Furthermore, there is a trend toward adifference of citrate within the intermediate-risk group(Gleason score ¼ 7), separating the Gleason grade 3 þ 4from 4 þ 3, a separation which is clinically highly relevantdue to its impact on the prognosis (33).
ConclusionIn summary, our study has unraveled gene transcripts
that expand the understanding of the mechanisms under-lying aberrant citrate (ACLY and ACON) and ChoCClevels (PLA2G7 and CHKA) in prostate cancer, by inte-gration of data from histologic, transcriptomic, and meta-bolomic analysis of the same samples removed fromradical prostatectomy specimens. These genes deserveattention as possible prostate cancer specific targets fortherapy.
7.5
8.5
AC
ON
8.5
10
.0
AC
LY
86
11
PL
A2
G7
6543210
8.5
10
.0
Citrate
CH
KA
105 15 20
Choline
864 10 14
GPC
Figure 6. Scatter plots illustrating the relationship between genes and metabolites. The figure illustrates the integration of transcriptomic and metabolic datafrom a subset of gene transcripts and metabolites in the study namely, ACON, ACLY, PLA2G7, and CHKA, and the metabolites citrate, Cho and GPC.Each circle in the plot represents a sample (n¼ 133). Testingwhether the regression coefficients are different from zero gives aP value for the relation betweenthegeneand themetabolite.Citrate showssignificant covariancewithACON (P<0.001), ACLY (P¼0.003), andPLA2G7 (P¼0.009). PLA2G7 (P¼0.05) showssignificant covariance with Cho levels and GPC with ACON (P ¼ 0.003), PLA2G7 (P < 0.001), and CHKA (P ¼ 0.002).
Bertilsson et al.
Clin Cancer Res; 18(12) June 15, 2012 Clinical Cancer Research3268
on April 13, 2017. © 2012 American Association for Cancer Research. clincancerres.aacrjournals.org Downloaded from
Published OnlineFirst April 17, 2012; DOI: 10.1158/1078-0432.CCR-11-2929
Disclosure of Potential Conflicts of InterestNo potential conflicts of interest were disclosed.
AcknowledgmentsThe authors thank medical laboratory technicians Toril Rolfseng, Unn
Granli, andBorgny Ytterhus for excellent assistancewith the laboratorywork;J�rn-Ove S�ternes for the design and development of equipment used toharvest and handle frozen prostate tissue; and urologists JanGerhardMj�nesand Dag Halvorsen for an essential contribution to the material collection.The microarray service was provided by the Genomics Core Facility, Nor-wegian University of Science and Technology, and NMC - a nationaltechnology platform supported by the functional genomics program (FUGE)of the Research Council of Norway.
Grant SupportThe study was supported by grants from the Cancer Foundation of St.
Olavs Hospital, University Hospital of Trondheim, Unimed Innovation St.OlavsHospital, theNorwegianCancer Society, and the Functional GenomicsProgram (FUGE) in the Research Council of Norway. The Illumina servicewas provided by NMC (Norwegian Microarray Concortium) at the NationalTechnology Platform and supported by FUGE.
The costs of publication of this article were defrayed in part by the paymentof page charges. This article must therefore be hereby marked advertisement inaccordance with 18 U.S.C. Section 1734 solely to indicate this fact.
Received November 18, 2011; revised March 21, 2012; accepted April 6,2012; published OnlineFirst April 17, 2012.
References1. Hanahan D, Weinberg RA. Hallmarks of cancer: the next generation.
Cell 2011;144:646–74.2. Bathen TF, Sitter B, Sjobakk TE, TessemMB, Gribbestad IS. Magnetic
resonance metabolomics of intact tissue: a biotechnological tool incancer diagnostics and treatment evaluation. Cancer Res 2004;70:6692–6.
3. Mazaheri Y, Shukla-Dave A, Muellner A, Hricak H. MRI of the prostate:clinical relevance and emerging applications. J Magn Reson Imaging2011;33:258–74.
4. Sciarra A, Barentsz J, Bjartell A, Eastham J, Hricak H, Panebianco V,et al. Advances inmagnetic resonance imaging: how theyare changingthe management of prostate cancer. Eur Urol 2011;59:962–77.
5. Kurhanewicz J, Swanson MG, Nelson SJ, Vigneron DB. Combinedmagnetic resonance imaging and spectroscopic imaging approach tomolecular imaging of prostate cancer. J Magn Reson Imaging2002;16:451–63.
6. Kobus T, Hambrock T, Hulsbergen-van de Kaa CA, Wright AJ,Barentsz JO, Heerschap A, et al. In vivo assessment of prostate canceraggressiveness usingmagnetic resonance spectroscopic imaging at 3T with an endorectal coil. Eur Urol 2011;60:1074–80.
7. Moestue S, Sitter B, Bathen TF, Tessem MB, Gribbestad IS. HR MASMR spectroscopy in metabolic characterization of cancer. Curr TopMed Chem 2011;11:2–26.
8. Aboagye EO, Bhujwalla ZM. Malignant transformation alters mem-brane choline phospholipid metabolism of humanmammary epithelialcells. Cancer Res 1999;59:80–4.
9. Glunde K, Jiang L, Moestue SA, Gribbestad IS. MRS and MRSIguidance in molecular medicine: targeting and monitoring ofcholine and glucose metabolism in cancer. NMR Biomed 2011;24:673–90.
10. Ackerstaff E, Pflug BR, Nelson JB, Bhujwalla ZM. Detection ofincreased choline compounds with proton nuclear magnetic reso-nance spectroscopy subsequent to malignant transformation ofhuman prostatic epithelial cells. Cancer Res 2001;61:3599–603.
11. KrishnamacharyB,GlundeK,Wildes F,Mori N, Takagi T, RamanV, et al.Noninvasive detection of lentiviral-mediated choline kinase targetingin a human breast cancer xenograft. Cancer Res 2009;69:3464–71.
12. Costello LC, Franklin RB, Narayan P. Citrate in the diagnosis ofprostate cancer. Prostate 1999;38:237–45.
13. Costello LC, Franklin RB. The clinical relevance of the metabolism ofprostate cancer; zinc and tumor suppression: connecting the dots.MolCancer 2006;5:17.
14. Hatzivassiliou G, Zhao F, Bauer DE, Andreadis C, ShawAN, Dhanak D,et al. ATP citrate lyase inhibition can suppress tumor cell growth.Cancer Cell 2005;8:311–21.
15. Zadra G, Priolo C, Patnaik A, Loda M. New strategies in prostatecancer: targeting lipogenic pathways and the energy sensor AMPK.Clin Cancer Res 2010;16:3322–8.
16. Bertilsson H, Angelsen A, Viset T, Skogseth H, TessemMB, HalgunsetJ. A new method to provide a fresh frozen prostate slice suitable forgene expression study and MR spectroscopy. Prostate 2011;71:461–9.
17. Hansen KD, Irizarry RA, Wu Z. Removing technical variability in RNA-seq data using conditional quantile normalization. Biostatistics2012;13:204–16.
18. Costello LC, Franklin RB. Tumor cell metabolism: the marriage ofmolecular genetics and proteomics with cellular intermediary metab-olism; proceed with caution! Mol Cancer 2006;5:59.
19. Flavin R, Zadra G, Loda M. Metabolic alterations and targeted ther-apies in prostate cancer. J Pathol 2011;223:283–94.
20. Costello LC, Franklin RB. Integration of molecular genetics and pro-teomics with cell metabolism: how to proceed; how not to proceed!Gene 2011;15:88–93.
21. Singh KK, Desouki MM, Franklin RB, Costello LC. Mitochondrialaconitase and citrate metabolism in malignant and nonmalignanthuman prostate tissues. Mol Cancer 2006;5:14.
22. Hanai JI, Doro N, Sasaki AT, Kobayashi S, Cantley LC, Seth P, et al.Inhibition of lung cancer growth: ATP citrate lyase knockdown andstatin treatment leads to dual blockade of mitogen-actiated proteinkinase (MAPK) and phosphatidylinositol-3- kinase (PI3K)/AKT path-ways. J Cell Physiol 2012;227:1709–20.
23. Migita T, Narita T, Nomura K, Miyagi E, Inazuka F, Matsuura M, et al.ATP citrate lyase: activation and therapeutic implications in non-smallcell lung cancer. Cancer Res 2008;68:8547–54.
24. Freedland SJ, Banez LL, Sun LL, Fitzsimons NJ, Moul JW. Obesemenhave higher-grade and larger tumors: an analysis of the duke prostatecenter database. Prostate Cancer Prostatic Dis 2009;12:259–63.
25. Capitanio U, Suardi N, Briganti A, Gallina A, Abdollah F, Lughezzani G,et al. Influence of obesity on tumour volume in patients with prostatecancer. BJU Int 2012;109:678–84.
26. PatelMI, KurekC, DongQ. The arachidonic acid pathway and its role inprostate cancer development and progression. J Urol 2008;179:1668–75.
27. Vainio P, Gupta S, Ketola K, Mirtti T, Mpindi JP, Kohonen P, et al.Arachidonic acid pathway members PLA2G7, HPGD, EPHX2, andCYP4F8 identified as putative novel therapeutic targets in prostatecancer. Am J Pathol 2011;178:525–36.
28. Lenkinski RE, Bloch BN, Liu F, Frangioni JV, Perner S, Rubin MA, et al.An illustration of the potential for mapping MRI/MRS parameters withgenetic over-expression profiles in human prostate cancer. MAGMA2008;21:411–21.
29. Al-Saffar NM, Jackson LE, Raynaud FI, Clarke PA, Ramirez de MolinaA, Lacal JC, et al. The phosphoinositide 3-kinase inhibitor PI-103downregulates choline kinase alpha leading to phosphocholine andtotal cholinedecreasedetected bymagnetic resonance spectroscopy.Cancer Res 2010;70:5507–17.
30. Teahan O, Bevan CL, Waxman J, Keun HC. Metabolic signatures ofmalignant progression in prostate epithelial cells. Int J Biochem CellBiol 2011;43:1002–9.
31. Zakian KL, Sircar K, Hricak H, Chen HN, Shukla-Dave A, Eberhardt S,et al. Correlation of proton MR spectroscopic imaging with gleasonscore based on step-section pathologic analysis after radical prosta-tectomy. Radiology 2005;234:804–14.
32. vanAstenJJ,CuijpersV,Hulsbergen-vandeKaaC,Soede-HuijbregtsC,Witjes JA,VerhofstadA,et al. High resolutionmagic angle spinningNMRspectroscopyformetabolicassessmentofcancerpresenceandGleasonscore in human prostate needle biopsies. MAGMA 2008;21:435–42.
33. Chan TY, Partin AW, Walsh PC, Epstein JI. Prognostic significance ofGleason score 3þ4 versus Gleason score 4þ3 tumor at radical pros-tatectomy. Urology 2000;56:823–7.
Genes Underlying Aberrant Metabolism in Prostate Cancer
www.aacrjournals.org Clin Cancer Res; 18(12) June 15, 2012 3269
on April 13, 2017. © 2012 American Association for Cancer Research. clincancerres.aacrjournals.org Downloaded from
Published OnlineFirst April 17, 2012; DOI: 10.1158/1078-0432.CCR-11-2929
2012;18:3261-3269. Published OnlineFirst April 17, 2012.Clin Cancer Res Helena Bertilsson, May-Britt Tessem, Arnar Flatberg, et al. Choline Metabolism in Human Prostate Cancer SamplesChanges in Gene Transcription Underlying the Aberrant Citrate and
Updated version
10.1158/1078-0432.CCR-11-2929doi:
Access the most recent version of this article at:
Cited articles
http://clincancerres.aacrjournals.org/content/18/12/3261.full.html#ref-list-1
This article cites 33 articles, 7 of which you can access for free at:
Citing articles
/content/18/12/3261.full.html#related-urls
This article has been cited by 6 HighWire-hosted articles. Access the articles at:
E-mail alerts related to this article or journal.Sign up to receive free email-alerts
Subscriptions
Reprints and
To order reprints of this article or to subscribe to the journal, contact the AACR Publications Department at
Permissions
To request permission to re-use all or part of this article, contact the AACR Publications Department at
on April 13, 2017. © 2012 American Association for Cancer Research. clincancerres.aacrjournals.org Downloaded from
Published OnlineFirst April 17, 2012; DOI: 10.1158/1078-0432.CCR-11-2929


![IPv6-Gene[1].. Chap7](https://img.pdfslide.fr/doc/110x75/563dbb0d550346aa9aa9dcfc/ipv6-gene1-chap7.jpg)