Embed Size (px)
Citation preview
THÈSE NO 3245 (2005)
ÉCOLE POLYTECHNIQUE FÉDÉRALE DE LAUSANNE
PRÉSENTÉE À LA FACULTÉ SCIENCES DE BASE
Institut des sciences et ingénierie chimiques
SECTION DE CHIMIE ET GÉNIE CHIMIQUE
POUR L'OBTENTION DU GRADE DE DOCTEUR ÈS SCIENCES
PAR
M.Sc. in chemical technology and engineering, Ukrainian State Chemical Technology University, Ukraineet de nationalité ukrainienne
acceptée sur proposition du jury:
Lausanne, EPFL2005
CHEMICAL AND ELECTROCHEMICAL PROMOTION OFSUPPORTED RHODIUM CATALYST
Olena BARANOVA
Prof. C. Comninellis, directeur de thèseDr Y. Beaufils, rapporteur
Dr G. Foti, rapporteurProf. H. van den Bergh, rapporteur
Prof. C.G. Vayenas, rapporteur

Acknowledgements, Remerciements, Благодарность
First of all I wish to express my sincerest gratitude to Professor Christos Comninellis who
gave me the opportunity to work in his group, who taught me the joy of research and the hard
work. Thank you very much for your help and useful advises.
Sincerest thanks are expressed to Professor Costas Vayenas for inviting me to his laboratory
in Patras and introducing me to the mysteries of electrochemical promotion.
Many thanks are also expressed to the team from Patras: Stella Balomenou, Alexandros
Katsaounis, Alan Thursfield, Ioannis Constantinou, Dimitra Archonta for their help and friend-
ship. I will never forget my time in Patras!
I am grateful to the members of the jury: Dr Y. Beaufils, G. Fóti, Prof. H. van den Bergh,
Prof. Vayenas and to the president of the jury: Prof. C. Fridli.
Un grand merci à György Fóti pour votre constante disponibilité et les précieux conseils.
Vous m’avez beaucoup aidée pendant toutes ces années.
Un grand merci aussi à mes collègues de bureau: Béatrice Marselli, Ilaria Duo et Justina
Eaves pour l’excellente atmosphère de travail et leur amitié.
Et au bureau des garçons: d’abord à Arnaud Jaccoud et Alain Fankhauser pour leur excel-
lents travaux de diplômes, ainsi qu’à Ivan Bolzonella et Guillaume Siné. Merci aussi aux autre
membre du groupe de génie électrochimique: Bahaa El Roustom, Agnieszka Cieciwa, Gabriele
Prosperi, Erika Herrera Calderon.
Un merci aux amis de la K-fét: Pascale Tribolet, Chrystèle Horny, Petra Prechtl, Frédéric
Lavanchy, Sophie Fortini, Eric Joanet, Kim Nikolajsen pour ces bonnes années que nous avons
passées ensemble.
J’aimrais remercie aussi les personne suivante:
- Brian Senior (SEM), Nicolas Xanthopolous (XPS), Rosendo Sanjines (AFM)
-H. Jotterand et le Prof. Lévy pour la déposition du rhodium par sputtering
- P.-A. Perroud pour le support informatique
- G. Bovard, J.-C. Rapit et les autres membres de l’atelier mécanique.
Un grand merci à P. Anken et I. Margot.
Merci à Klaus Müller pour la correction de ma thèse et les commentaires utiles.
Спасибо русским коллегам: Игорю Юранову, Дмитрию Булышеву, а так же Наташе
Семагиной и Павлу Коровченко.
J’aimerais beaucoup remercier Marie et Georges Barraud. Merci pour votre soutien, votre
disponibilité et aussi pour votre amitié.
Огромное спасибо моим родителям: мои дорогие спасибо за вашу любовь и
поддержку. Без вашей помощи эта диссертация была бы невозможна.
Анюта, спасибо за твою веру в мня – you are the best!
Un tendre merci à Kyryl et Cédric.
Abstract
The chemical and electrochemical promotion of highly dispersed nanofilm Rh catalysts
(dispersion: about 10 %, film thickness: 40 nm) has been investigated for the first time. To this end
Rh metal was sputter-deposited, either on a purely ionic conductor (8 % Y2O3-stabilized ZrO2) or
on a mixed ionic-electronic conductor (TiO2), the latter being a highly dispersed layer of TiO2 (4
µm) deposited on YSZ. These catalysts are designated as Rh/YSZ and Rh/TiO2/YSZ, respectively.
It was established analytically that both in the Rh/YSZ and in the Rh/TiO2/YSZ system, the
catalyst films have a nanoparticle-size grain structure. The Rh supported on titania is rather
porous, exhibiting a higher dispersion and surface area than Rh on YSZ. Both after reduction (H2,
T=400 °C) and after oxidation (O2, T=400 °C), Rh supported on TiO2 was found to be in a more
highly reduced state than Rh on YSZ. After reducing treatment, the Rh/TiO2/YSZ samples contain
a larger amount of weakly bonded oxygen, which can be attributed to oxygen “backspillover”
from the TiO2.
A major feature of this research was the electrochemical characterization of the oxygen/Rh/
solid electrolyte three-phase boundary by steady-state polarization measurements and by imped-
ance spectroscopy. These are powerful techniques for extracting experimental trends and details
that are useful for an understanding of the electrochemical promotion principles. It was shown that
the exchange current densities at the Rh/solid electrolyte interface are lower on account of the
TiO2 layer. The exchange current densities are more than twice lower at Rh/TiO2(4 µm)/YSZ than
at Rh/YSZ, demonstrating that the former interface is much more polarizable.
The mechanism of oxygen exchange occurring close to equilibrium (O2/O2- couple) was
investigated for the first time at Rh catalyst electrodes interfaced with solid electrolyte. The proc-
esses of cathodic oxygen reduction and anodic oxygen evolution are not symmetric, but they are
similar in the two systems, Rh/YSZ and Rh/TiO2(4 µm)/YSZ. The cathodic process consists of
three steps: dissociative adsorption of oxygen at the gas-exposed Rh surface, atomic oxygen diffu-
sion to the electrochemical reaction sites (ERS), and a two-electron transfer to this oxygen on the
ERS. The cathodic process is limited by interfacial diffusion of oxygen atoms from the gas-
exposed metal surface to the ERS. The anodic process includes two steps: two-electron transfer
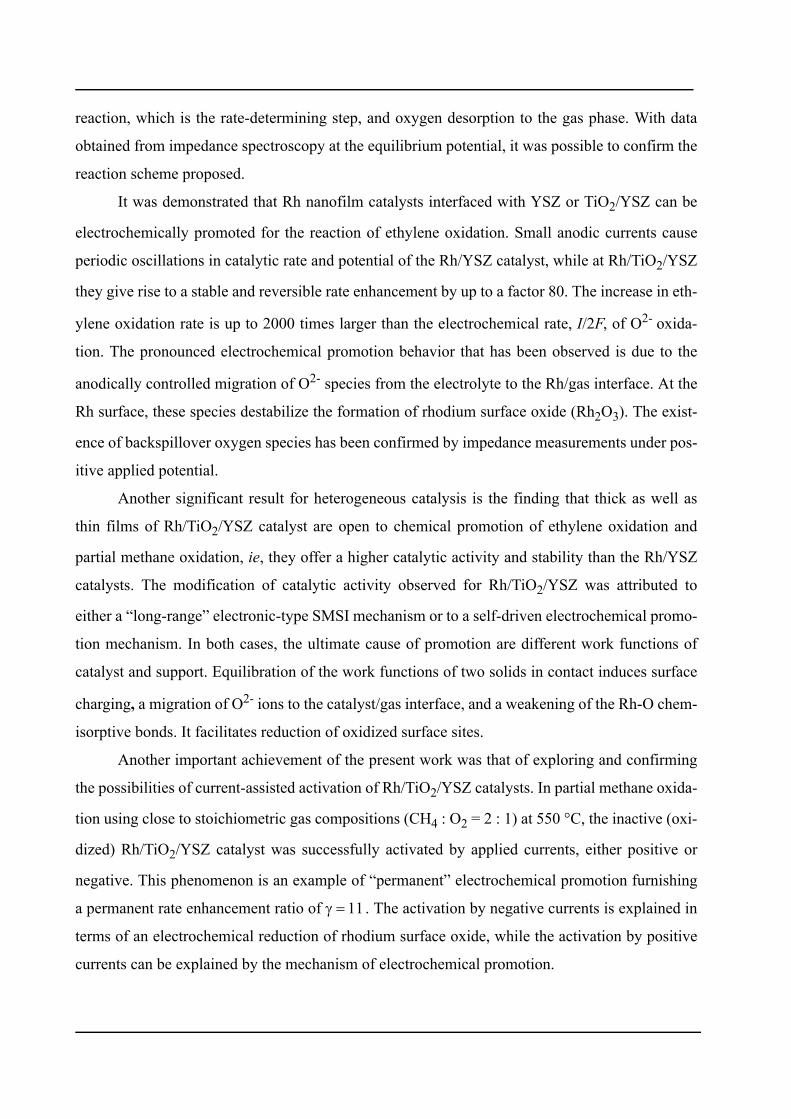
reaction, which is the rate-determining step, and oxygen desorption to the gas phase. With data
obtained from impedance spectroscopy at the equilibrium potential, it was possible to confirm the
reaction scheme proposed.
It was demonstrated that Rh nanofilm catalysts interfaced with YSZ or TiO2/YSZ can be
electrochemically promoted for the reaction of ethylene oxidation. Small anodic currents cause
periodic oscillations in catalytic rate and potential of the Rh/YSZ catalyst, while at Rh/TiO2/YSZ
they give rise to a stable and reversible rate enhancement by up to a factor 80. The increase in eth-
ylene oxidation rate is up to 2000 times larger than the electrochemical rate, I/2F, of O2- oxida-
tion. The pronounced electrochemical promotion behavior that has been observed is due to the
anodically controlled migration of O2- species from the electrolyte to the Rh/gas interface. At the
Rh surface, these species destabilize the formation of rhodium surface oxide (Rh2O3). The exist-
ence of backspillover oxygen species has been confirmed by impedance measurements under pos-
itive applied potential.
Another significant result for heterogeneous catalysis is the finding that thick as well as
thin films of Rh/TiO2/YSZ catalyst are open to chemical promotion of ethylene oxidation and
partial methane oxidation, ie, they offer a higher catalytic activity and stability than the Rh/YSZ
catalysts. The modification of catalytic activity observed for Rh/TiO2/YSZ was attributed to
either a “long-range” electronic-type SMSI mechanism or to a self-driven electrochemical promo-
tion mechanism. In both cases, the ultimate cause of promotion are different work functions of
catalyst and support. Equilibration of the work functions of two solids in contact induces surface
charging, a migration of O2- ions to the catalyst/gas interface, and a weakening of the Rh-O chem-
isorptive bonds. It facilitates reduction of oxidized surface sites.
Another important achievement of the present work was that of exploring and confirming
the possibilities of current-assisted activation of Rh/TiO2/YSZ catalysts. In partial methane oxida-
tion using close to stoichiometric gas compositions (CH4 : O2 = 2 : 1) at 550 °C, the inactive (oxi-
dized) Rh/TiO2/YSZ catalyst was successfully activated by applied currents, either positive or
negative. This phenomenon is an example of “permanent” electrochemical promotion furnishing
a permanent rate enhancement ratio of γ = 11. The activation by negative currents is explained in
terms of an electrochemical reduction of rhodium surface oxide, while the activation by positive
currents can be explained by the mechanism of electrochemical promotion.
Version Abrégée
Pour la première fois, la promotion chimique et électrochimique des catalyseurs sous forme
de nanocouche de Rh hautement dispersée (40 nm d’épaisseur, dispersion ~10%) a été étudiée.
Dans le cadre de ce travail, des catalyseurs en Rh ont été déposés par sputtering soit sur un con-
ducteur purement ionique (8%Y2O3-stabilizé-ZrO2) soit sur un conducteur mixte ionique-élec-
tronique. Ce dernier est une couche de TiO2 (4 µm) hautement dispersée sur du YSZ. Ces deux
catalyseurs seront notés Rh/YSZ et Rh/TiO2/YSZ, respectivement.
Nous avons montré que ces deux catalyseurs ont une structure en nanograins. De plus, il est
apparu que l’intercouche de TiO2 augmente la surface catalytique ainsi que la dispersion. En
traitant les catalyseurs dans une atmosphère réductrice (H2, T=400°C) puis oxydante (O2,
T=400°C), le Rh a été trouvé dans le Rh/TiO2/YSZ à un état plus réduit, comparé au Rh dans Rh/
YSZ. Plus particulièrement, la réduction en Rh de Rh/ TiO2/YSZ contient plus d’oxygène faible-
ment lié qui peut être attribué à l’oxygène “backspillover” du support TiO2.
La caractérisation électrochimique de l’interface triple O2, Rh/électrolyte solide par des
méthodes de polarisation stationnaire et de spectroscopie d’impédance, se révèle être l’un des axes
majeurs de ce travail. C’est sans doute l’un des moyens d’investigation qui nous a permis de
dégager le plus d’informations utiles à la compréhension du phénomène de promotion électro-
chimique. Il a été montré que l’intercouche de TiO2 diminue la densité de courant d’échange à
l’interface Rh/ électrolyte solide. Le courant d’échange trouvé est environ deux fois plus petit pour
le catalyseur Rh/TiO2/YSZ que celui du catalyseur Rh/YSZ. Cela indique donc que la première
interface est plus polarisable.
Le mécanisme du processus d’échange d’oxygène proche de l’équilibre (couple O2/O2-) a
été étudié sur une électrode en Rh en contact avec un électrolyte solide. Les processus de réduction
cathodique et d’évolution anodique de l’oxygène ne sont pas symétriques. Par contre, ils sont
identiques pour les deux systèmes. Plus précisément, il a été établi que le processus cathodique
consiste en trois étapes: (i) adsorption dissociative de l’oxygène à la surface du Rh exposée au gaz,
(ii) diffusion de l’oxygène sous forme atomique vers les sites électrochimique réactifs (SER) (iii)
sur les SER, il apparaît finalement un transfert de deux électrons. L’étape (ii) est considérée
comme étant limitante. Le processus anodique est constitué de deux étapes: réaction de transfert
électronique (étape limitante) puis désorption de l’oxygène formé vers la phase gazeuse. Nous
avons pu confirmer ce mécanisme par la spectroscopie d’impédance sous un potentiel d’équilibre.
Nous avons montré que les catalyseurs sous forme de nanocouche de Rh peutent être
promu par l’application d’un potentiel positif pour la réaction d’oxydation de l’éthylène. Les
faibles courants anodiques provoquent des oscillations périodiques de la vitesse de réaction et du
potentiel du catalyseur Rh/YSZ, alors que le Rh/TiO2/YSZ présente une augmentation de la
vitesse de réaction stable et réversible d’un facteur ρ supérieur à 80. La vitesse de réaction d’oxy-
dation est 2000 fois plus rapide que la vitesse électrochimique, I/2F, de l’oxydation de O2-. La
promotion électrochimique observée est due à la migration des espèces O2- (backspillover) de
l’électrolyte solide vers l’interface Rh/gaz sous polarisation anodique. Les espèces d’oxygène
backspillover déstabilisent la formation d’oxyde Rh2O3 à la surface. L’existence de ces espèces,
sous application d’un potentiel positif, a bien été confirmée grâce à la spectroscopie d’impédance.
L’autre fait expérimental important pour la catalyse mis en évidence est que le système Rh/
TiO2/YSZ présente une promotion chimique des réactions d’oxydation de l’éthylène et d’oxyda-
tion partielle du méthane, indépendemment des méthodes de préparation du catalyseur en Rh.
Cela signifie une plus grande activité catalytique ainsi qu’une meilleure stabilité par rapport à Rh/
YSZ. La modification observée de l’activité catalytique de Rh/TiO2/YSZ est due soit à une forte
interaction métal-support (de nature électronique, se manifestant à longue distance) soit au
mécanisme de promotion électrochimique automotrice (self-driven electrochemical promotion).
Dans ces deux cas, la promotion est due principalement à la différence de travail d’extraction
entre le catalyseur et le support. L’équilibre du travail d’extraction des deux solides affaiblit la
force avec laquelle l’oxygène s’adsorbe à la surface du catalyseur et facilite ainsi la réduction de
l’oxyde à la surface.
L’autre resultat important de ce travail est l’exploration de la possibilité d’activation du cat-
alyseur Rh/TiO2/YSZ par un courant. Lors de la réaction d’oxydation partielle de méthane proche
de la composition gazeuse stœchiométrique (CH4:O2=2:1), l’activation du Rh/TiO2/YSZ oxydé a
été effectué. Cette activation a été réalisée par l’application d’un courant aussi bien positif que
négatif. Le phénomène observé est un exemple de promotion électrochimique “permanent”, que
nous avons caractérisée par le facteur d’augmentation “permanent”, γ. Des valeurs de γ

supérieures à 11 ont été determinées. L’activation par un courant négatif s’explique par une réduc-
tion électrochimique d’oxyde de Rh à la surface, alors que sous l’application d’un courant positif,
l’oxyde de Rh réduit par le mécanisme de la promotion électrochimique.

Table of Contents
CHAPTER 1 Introduction . . . . . . . . . . . . . . . . . . . . . . . . . . . . . . . . . . . . . . . . . . . . . . . 1
1.1 Motivation and Objectives . . . . . . . . . . . . . . . . . . . . . . . . . . . . . . . . . . . . . . . 2
1.2 References . . . . . . . . . . . . . . . . . . . . . . . . . . . . . . . . . . . . . . . . . . . . . . . . . . . 3
CHAPTER 2 Review of relevant basic work (bibliography) . . . . . . . . . . . . . . . . . . . 5
2.1 Electrochemical promotion . . . . . . . . . . . . . . . . . . . . . . . . . . . . . . . . . . . . . . 5
2.1.1 Definitions and basic quantities involved . . . . . . . . . . . . . . . . . . . . . . . 5
2.1.2 The mechanism of electrochemical promotion . . . . . . . . . . . . . . . . . . . 9
2.1.3 Rationalization of the potential-work function equivalence . . . . . . . . 16
2.1.4 Work function measurements . . . . . . . . . . . . . . . . . . . . . . . . . . . . . . . . 19
2.1.5 Permanent electrochemical promotion . . . . . . . . . . . . . . . . . . . . . . . . . 21
2.1.6 Electrochemical promotion on rhodium catalysts . . . . . . . . . . . . . . . . 24
2.1.7 Electrochemical activation of a catalyst . . . . . . . . . . . . . . . . . . . . . . . . 28
2.2 Metal-support interaction . . . . . . . . . . . . . . . . . . . . . . . . . . . . . . . . . . . . . . . 31
2.2.1 Metal-semiconductor boundary layer theory . . . . . . . . . . . . . . . . . . . . 32
2.2.2 Strong metal-support interactions . . . . . . . . . . . . . . . . . . . . . . . . . . . . 33
2.2.3 Electrochemical promotion and metal-support interactions . . . . . . . . . 33
2.2.4 Solid electrolytes . . . . . . . . . . . . . . . . . . . . . . . . . . . . . . . . . . . . . . . . . 37
2.2.4.1 Properties of yttria-stabilized-zirconia . . . . . . . . . . . . . . . . . . . . . . . 38
2.2.4.2 Properties of titanium dioxide . . . . . . . . . . . . . . . . . . . . . . . . . . . . . 40
2.3 Electrode reactions at gas/metal/YSZ interfaces . . . . . . . . . . . . . . . . . . . . . 43
2.3.1 Oxygen electrode O2, M/YSZ . . . . . . . . . . . . . . . . . . . . . . . . . . . . . . . 45
2.4 Aim of the work . . . . . . . . . . . . . . . . . . . . . . . . . . . . . . . . . . . . . . . . . . . . . . 50
2.5 References 51
CHAPTER 3 Experimental . . . . . . . . . . . . . . . . . . . . . . . . . . . . . . . . . . . . . . . . . . . . . 59
3.1 Electrochemical cells . . . . . . . . . . . . . . . . . . . . . . . . . . . . . . . . . . . . . . . . . . 59
3.1.1 Single-pellet cells . . . . . . . . . . . . . . . . . . . . . . . . . . . . . . . . . . . . . . . . . 59
3.1.2 Ring-shaped cells . . . . . . . . . . . . . . . . . . . . . . . . . . . . . . . . . . . . . . . . . 62
3.2 Electrode preparation . . . . . . . . . . . . . . . . . . . . . . . . . . . . . . . . . . . . . . . . . . 62
3.2.1 YSZ pretreatment . . . . . . . . . . . . . . . . . . . . . . . . . . . . . . . . . . . . . . . . . 62
3.2.2 Preparation of Rh catalyst electrodes by sputtering . . . . . . . . . . . . . . . 64
3.2.3 Preparation of Rh catalyst electrodes using commercial paste . . . . . . .65
3.2.4 Preparation of the TiO2 layer . . . . . . . . . . . . . . . . . . . . . . . . . . . . . . . .66
3.3 Catalyst characterization . . . . . . . . . . . . . . . . . . . . . . . . . . . . . . . . . . . . . . . .66
3.7.1 Kinetic measurements . . . . . . . . . . . . . . . . . . . . . . . . . . . . . . . . . . . . . . 68
3.8 References . . . . . . . . . . . . . . . . . . . . . . . . . . . . . . . . . . . . . . . . . . . . . . . . . . .70
CHAPTER 4 Characterization of Rh catalyst electrodes . . . . . . . . . . . . . . . . . . . . .71
4.1 Introduction . . . . . . . . . . . . . . . . . . . . . . . . . . . . . . . . . . . . . . . . . . . . . . . . . .71
4.2 Scanning electron microscopy (SEM) . . . . . . . . . . . . . . . . . . . . . . . . . . . . .73
4.2.1 SEM of Rh/YSZ catalysts . . . . . . . . . . . . . . . . . . . . . . . . . . . . . . . . . . .74
4.2.2 SEM of Rh/TiO2/YSZ catalysts . . . . . . . . . . . . . . . . . . . . . . . . . . . . . .75
4.3 Atomic Force Microscopy . . . . . . . . . . . . . . . . . . . . . . . . . . . . . . . . . . . . . .76
4.4 X-ray photoelectron spectroscopy (XPS) . . . . . . . . . . . . . . . . . . . . . . . . . . .79
4.4.1 XPS spectra of Rh 3d5/2 and 3d3/2 . . . . . . . . . . . . . . . . . . . . . . . . . . . .80
4.4.2 XPS spectra of O 1s . . . . . . . . . . . . . . . . . . . . . . . . . . . . . . . . . . . . . . .83
4.5 Conclusions . . . . . . . . . . . . . . . . . . . . . . . . . . . . . . . . . . . . . . . . . . . . . . . . . .85
4.6 References . . . . . . . . . . . . . . . . . . . . . . . . . . . . . . . . . . . . . . . . . . . . . . . . . . .86
CHAPTER 5 Electrochemical characterization of the Rh catalysts:
Polarization measurements . . . . . . . . . . . . . . . . . . . . . . . . . . . . . . . . . . . . . . . . . . . . . .87
5.1 Introduction . . . . . . . . . . . . . . . . . . . . . . . . . . . . . . . . . . . . . . . . . . . . . . . . . .88
5.2 Results . . . . . . . . . . . . . . . . . . . . . . . . . . . . . . . . . . . . . . . . . . . . . . . . . . . . . .89
5.2.1 Basic relations relevant to the work . . . . . . . . . . . . . . . . . . . . . . . . . . .89
5.2.2 Low-field polarization of the O2(g), Rh/YSZ interface . . . . . . . . . . . .91
5.2.3 Low field polarization of the O2(g), Rh/TiO2/YSZ interface . . . . . . . .95
5.2.3.1 Effect of TiO2 thickness . . . . . . . . . . . . . . . . . . . . . . . . . . . . . . . . . .96
5.2.3.2 Effect of oxygen partial pressure . . . . . . . . . . . . . . . . . . . . . . . . . .100
5.2.4 High-field polarization of the O2(g), Rh/YSZ and O2(g), Rh/TiO2/YSZ
interfaces . . . . . . . . . . . . . . . . . . . . . . . . . . . . . . . . . . . . . . . . . . . . . . . . . . . .102
5.3 Discussion . . . . . . . . . . . . . . . . . . . . . . . . . . . . . . . . . . . . . . . . . . . . . . . . . .104
5.4 Conclusions . . . . . . . . . . . . . . . . . . . . . . . . . . . . . . . . . . . . . . . . . . . . . . . . .107
5.5 References . . . . . . . . . . . . . . . . . . . . . . . . . . . . . . . . . . . . . . . . . . . . . . . . . .108
CHAPTER 6 Electrochemical characterization of Rh catalysts:
Impedance measurements . . . . . . . . . . . . . . . . . . . . . . . . . . . . . . . . . . . . . . . . . . . . . .111
6.1 Introduction . . . . . . . . . . . . . . . . . . . . . . . . . . . . . . . . . . . . . . . . . . . . . . . . 112
6.1.1 AC Impedance spectroscopy in solid-state cells . . . . . . . . . . . . . . . . 114
6.1.2 Ac impedance spectroscopy in electrochemical promotion
of catalysis . . . . . . . . . . . . . . . . . . . . . . . . . . . . . . . . . . . . . . . . . . . . . . . . . . 116
6.2 Theory . . . . . . . . . . . . . . . . . . . . . . . . . . . . . . . . . . . . . . . . . . . . . . . . . . . . 120
6.2.1 Theoretical impedance model for the O2, Rh/electrolyte system
at equilibrium . . . . . . . . . . . . . . . . . . . . . . . . . . . . . . . . . . . . . . . . . . . . . . . 120
6.3 Results and discussion . . . . . . . . . . . . . . . . . . . . . . . . . . . . . . . . . . . . . . . . 127
6.3.1 Impedance measurements at equilibrium potential . . . . . . . . . . . . . . 127
6.3.2 Impedance measurements under polarization . . . . . . . . . . . . . . . . . . 136
6.4 Conclusions . . . . . . . . . . . . . . . . . . . . . . . . . . . . . . . . . . . . . . . . . . . . . . . . 143
6.5 References . . . . . . . . . . . . . . . . . . . . . . . . . . . . . . . . . . . . . . . . . . . . . . . . . 144
CHAPTER 7 Promotion of Rh catalysts: Open-circuit ethylene oxidation . . . . . . 147
7.1 Introduction . . . . . . . . . . . . . . . . . . . . . . . . . . . . . . . . . . . . . . . . . . . . . . . . 148
7.2 Theory . . . . . . . . . . . . . . . . . . . . . . . . . . . . . . . . . . . . . . . . . . . . . . . . . . . . 149
7.2.1 Generic model for a macroscopic deactivation
of surface processes . . . . . . . . . . . . . . . . . . . . . . . . . . . . . . . . . . . . . . . . . . . 149
7.3 Experimental . . . . . . . . . . . . . . . . . . . . . . . . . . . . . . . . . . . . . . . . . . . . . . . 152
7.4 Results . . . . . . . . . . . . . . . . . . . . . . . . . . . . . . . . . . . . . . . . . . . . . . . . . . . . 154
7.5 Discussion . . . . . . . . . . . . . . . . . . . . . . . . . . . . . . . . . . . . . . . . . . . . . . . . . 159
7.6 Conclusions . . . . . . . . . . . . . . . . . . . . . . . . . . . . . . . . . . . . . . . . . . . . . . . . 162
7.7 References . . . . . . . . . . . . . . . . . . . . . . . . . . . . . . . . . . . . . . . . . . . . . . . . . 162
CHAPTER 8 Electrochemical promotion of Rh catalysts:
Closed-circuit ethylene oxidation . . . . . . . . . . . . . . . . . . . . . . . . . . . . . . . . . . . . . . . . 165
8.1 Introduction . . . . . . . . . . . . . . . . . . . . . . . . . . . . . . . . . . . . . . . . . . . . . . . . 166
8.2 Experimental . . . . . . . . . . . . . . . . . . . . . . . . . . . . . . . . . . . . . . . . . . . . . . . 167
8.3 Results . . . . . . . . . . . . . . . . . . . . . . . . . . . . . . . . . . . . . . . . . . . . . . . . . . . . 167
8.3.1 Electrochemical promotion of Rh/YSZ catalysts.
Oscillatory behavior . . . . . . . . . . . . . . . . . . . . . . . . . . . . . . . . . . . . . . . . . . 167
8.3.2 Electrochemical promotion of Rh/TiO2/YSZ catalysts . . . . . . . . . . . 176
8.4 Discussion . . . . . . . . . . . . . . . . . . . . . . . . . . . . . . . . . . . . . . . . . . . . . . . . . 182
8.5 Conclusions . . . . . . . . . . . . . . . . . . . . . . . . . . . . . . . . . . . . . . . . . . . . . . . . 187
8.6 References . . . . . . . . . . . . . . . . . . . . . . . . . . . . . . . . . . . . . . . . . . . . . . . . . .188
CHAPTER 9 Promotion of Rh catalysts: Partial methane oxidation
at open and closed circuit . . . . . . . . . . . . . . . . . . . . . . . . . . . . . . . . . . . . . . . . . . . . . .191
9.1 Introduction . . . . . . . . . . . . . . . . . . . . . . . . . . . . . . . . . . . . . . . . . . . . . . . . .192
9.2 Experimental . . . . . . . . . . . . . . . . . . . . . . . . . . . . . . . . . . . . . . . . . . . . . . . .193
9.3 Results . . . . . . . . . . . . . . . . . . . . . . . . . . . . . . . . . . . . . . . . . . . . . . . . . . . . .194
9.3.1 Promotion of Rh catalysts by a TiO2 interlayer . . . . . . . . . . . . . . . . . .194
9.3.2 Current-assisted activation of Rh/TiO2/YSZ catalysts . . . . . . . . . . . .199
9.4 Discussion . . . . . . . . . . . . . . . . . . . . . . . . . . . . . . . . . . . . . . . . . . . . . . . . . .204
9.5 Conclusions . . . . . . . . . . . . . . . . . . . . . . . . . . . . . . . . . . . . . . . . . . . . . . . . .208
9.6 References . . . . . . . . . . . . . . . . . . . . . . . . . . . . . . . . . . . . . . . . . . . . . . . . . .209
CHAPTER 10 General discussion . . . . . . . . . . . . . . . . . . . . . . . . . . . . . . . . . . . . . . .211
1
CHAPTER 1 Introduction
The electrochemical promotion of catalysis (EPOC) or nonfaradaic electro-
chemical modification of catalytic activity (NEMCA) that was discovered-
toward the end of the 1980s by Vayenas and co-workers is an
interdisciplinary phenomenon observed at the interface of catalysis and
electrochemistry. Today, several research groups all over the world are stud-
ying this effect, and it has been demonstrated that it is not limited to any par-
ticular electrolyte, conductive catalyst, or type of reaction.
Apart from good prospects for a commercial utilization of electrochemical
promotion, investigations into the mechanism and origin of EPOC have
already made an enormous contribution to the understanding of related phe-
nomena in heterogeneous catalysis, such as promotion and metal-support
interactions (MSI). It has been established more recently [1], that promo-
tion, electrochemical promotion, and metal-support interactions are all
linked via the phenomena of spillover and backspillover, the catalytic reac-
tion occurring in the presence of a double layer which for electrochemical
promotion can be controlled in situ.
Chapter 1 Introduction
2
1.1 Motivation and Objectives
The mechanistic equivalence between electrochemical promotion and metal-support inter-
actions was first demonstrated by Nicole et al. [2] in studies of ethylene oxidation on an IrO2 film
catalyst supported on YSZ and on IrO2-TiO2 mixtures. It was demonstrated that the IrO2 elec-
trode can be promoted electrochemically, but for the two oxides present in intimate contact, this is
not possible, as they are already promoted via O2- spillover [2]. The mechanistic equivalence of
EPOC with YSZ and of MSI with ZrO2, TiO2 and CeO2-based supports was established by this
important experiment as well as by several others [1].
Despite the many studies of the two phenomena: EPOC and MSI, several key questions
still remain: (i) Is a catalyst promoted by metal-support interactions in its “best” electrochemi-
cally promoted state? (ii) Do metal-support interactions occur only at highly dispersed catalysts?
(iii) Is it possible to induce electrochemical promotion at such a catalyst? Further investigations of
the interfaces between catalyst and support (solid electrolyte), of the interfaces between catalyst
and gas phase, and of the three-phase boundary (catalyst/solid electrolyte/gas interface) are
required to answer these questions.
The present work constitutes part of the complex investigations that have been conducted
in our laboratory over the last decade [3-7]. Its objective are the first studies ever of an electro-
chemical modification of catalytic activity and of metal-support interactions at nanofilm rhodium
catalysts (thickness 40 nm) characterized by high dispersion (about 10 %). These catalysts were
supported, either on a purely ionic conductor (8 % Y2O3-stabilized ZrO2) or on a mixed ionic-
electronic conductor (TiO2) present as a highly dispersed (80 %) layer of TiO2 (4 µm) deposited
on YSZ (TiO2/YSZ). The electrochemical promotion of highly dispersed catalysts, that is, cata-
lysts with low metal loading, is an important achievement, both from theoretical and from practi-
cal points of view. On one hand, at catalysts having such a design (which is similar to that of the
catalytic systems exhibiting the effects of metal-support interactions), the phenomena of EPOC
and MSI can be studied in parallel. On the other hand, efficient electrochemical promotion of
highly dispersed catalysts virtually eliminates the major economic obstacle to the commercial uti-
lization of EPOC that existed in the poorly dispersed metal catalysts (typically 10-3-10-5)
employed in the form of thick porous films (0.2 - 10 µm) in all prior electrochemical promotion
studies [1].
Toward these objectives, the following investigations have been performed:
References
3
1. Investigations of Rh/solid electrolyte systems by surface science (SEM, AFM, XPS)
(Chapter 4) and electrochemical techniques (steady-state polarization and impedance spectros-
copy) (Chapters 5, 6). Particular attention was paid to the kinetics of electron transfer and to the
mechanism of oxygen reduction and evolution (the O2/O2- couple) at the O2, Rh/solid electrolyte
interface (Chapters 4, 5).
2. Studies of the effect of different supports (solid electrolytes) on the catalytic perform-
ance of the Rh catalyst in model reactions under open-circuit conditions, development of a macro-
scopic model for catalyst deactivation (Chapters 7 and 9).
3. Investigations of electrochemical promotion of Rh catalysts interfaced with YSZ and
TiO2/YSZ supports in the oxidation of ethylene and methane as model reactions (Chapters 8 and
9).
4. Establishment of the relationship between EPOC and MSI on the basis of partial meth-
ane oxidation over Rh/TiO2/YSZ catalysts as a model reaction (Chapter 9).
1.2 References
1. C. G. Vayenas, S. Bebelis, C. Pliangos, S. Brosda, and D. Tsiplakides, Electro-
chemical activation of catalysis. Promotion, Electrochemical promotion, and
metal-support interaction. Kluwer Academic/Plenum Publishers, New York
(2001).
2. J. Nicole, D. Tsiplakides, C. Pliangos, X. E. Verykios, C. Comninellis, and C. G.
Vayenas, J. Catal., 204 (2001) 23.
3. E. Varkaraki, Electrochemical promotion of an IrO2 catalyst for the gas phase oxi-
dation of ethylene. Thesis No 1455, EPFL, Lausanne, (1996).
4. J. Nicole, Etude de la Promotion Electrochimique de l'Oxydation Catalytique de
l'Ethylène sur des Oxydes Métalliques. Thesis No 1933, EPFL, Lausanne, (1999).
5. S. Wodiunig, Electrochemical promotion of RuO2 catalysts for the gas phase com-
bustion of ethylene. Thesis No 3138, EPFL, Lausanne, (2000).
6. I. Bolzonella, Electrochemical promotion of rhodium catalyst. Application to nitro-
gen monoxide reduction. Thesis No 2743, EPFL, Lausanne, (2003).
7. J. Eaves, Promotion électrochimique des catalyseurs à base de rhodium et d'irid-
ium. Thesis No 2883, EPFL, Lausanne, (2004).

5
CHAPTER 2 Review of relevant basic work (bib-
liography)
In this chapter, the current state of the art in the electrochemical promotion
of catalysis (EPOC) and related fields is presented. Particular attention is
paid to the origin of EPOC and to the mechanism of the phenomenon (Sec-
tion 2.1.2). In subsequent sections, metal-support interactions (MSI) are dis-
cussed. Plausible mechanisms of this phenomenon and its connection with
EPOC are demonstrated. The main properties of the ZrO2(8 % Y2O3) and
TiO2 solid electrolytes used as substrates (supports) are described.
2.1 Electrochemical promotion
2.1.1 Definitions and basic quantities involved
The electrochemical promotion of catalysis (EPOC), also known as nonfaradaic electro-
chemical modification of catalytic activity (NEMCA), is a rather general phenomenon observed in
heterogeneous catalysis that was discovered relatively recently and made a strong impact on mod-
ern electrochemistry and surface science [1-9].
Chapter 2 Review of relevant basic work (bibliography)
6
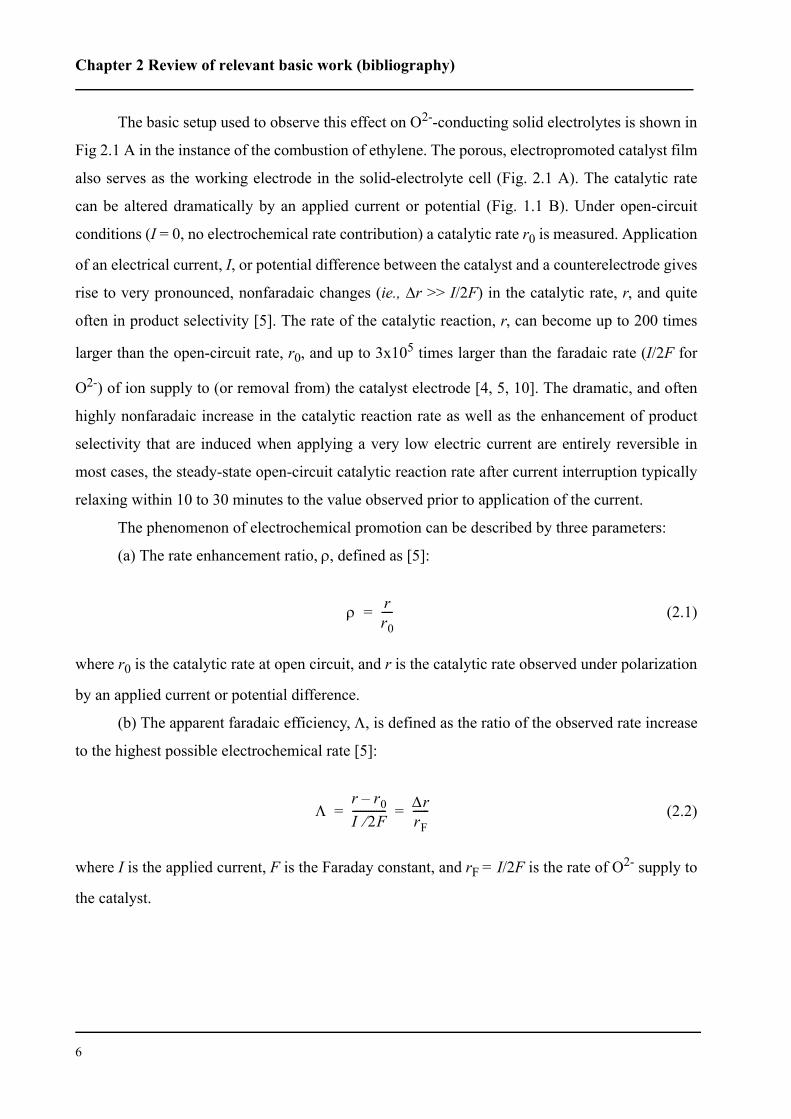
The basic setup used to observe this effect on O2--conducting solid electrolytes is shown in
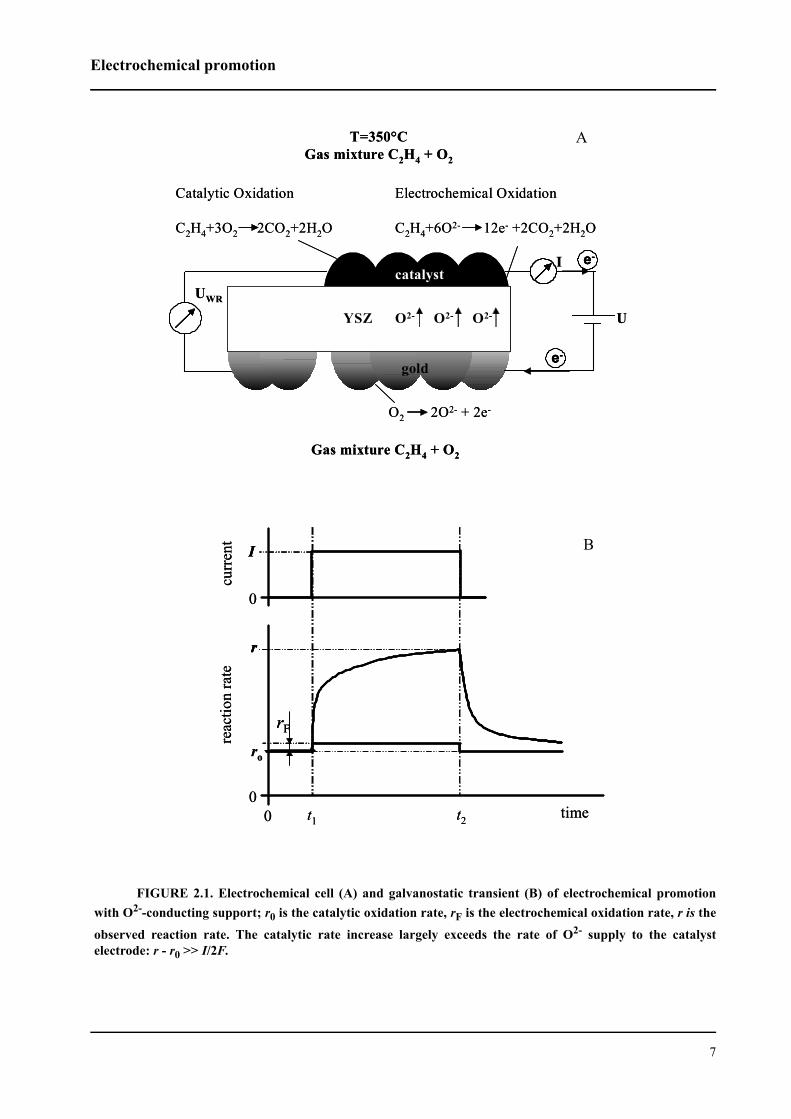
Fig 2.1 A in the instance of the combustion of ethylene. The porous, electropromoted catalyst film
also serves as the working electrode in the solid-electrolyte cell (Fig. 2.1 A). The catalytic rate
can be altered dramatically by an applied current or potential (Fig. 1.1 B). Under open-circuit
conditions (I = 0, no electrochemical rate contribution) a catalytic rate r0 is measured. Application
of an electrical current, I, or potential difference between the catalyst and a counterelectrode gives
rise to very pronounced, nonfaradaic changes (ie., ∆r >> I/2F) in the catalytic rate, r, and quite
often in product selectivity [5]. The rate of the catalytic reaction, r, can become up to 200 times
larger than the open-circuit rate, r0, and up to 3x10⁵ times larger than the faradaic rate (I/2F for
O2-) of ion supply to (or removal from) the catalyst electrode [4, 5, 10]. The dramatic, and often
highly nonfaradaic increase in the catalytic reaction rate as well as the enhancement of product
selectivity that are induced when applying a very low electric current are entirely reversible in
most cases, the steady-state open-circuit catalytic reaction rate after current interruption typically
relaxing within 10 to 30 minutes to the value observed prior to application of the current.
The phenomenon of electrochemical promotion can be described by three parameters:
(a) The rate enhancement ratio, ρ, defined as [5]:
(2.1)
where r0 is the catalytic rate at open circuit, and r is the catalytic rate observed under polarization
by an applied current or potential difference.
(b) The apparent faradaic efficiency, Λ, is defined as the ratio of the observed rate increase
to the highest possible electrochemical rate [5]:
(2.2)
where I is the applied current, F is the Faraday constant, and rF = I/2F is the rate of O2- supply to
the catalyst.
ρ rr0----=
Λr r0–I 2F⁄------------- ∆r
rF------= =
Electrochemical promotion
7
FIGURE 2.1. Electrochemical cell (A) and galvanostatic transient (B) of electrochemical promotionwith O2--conducting support; r0 is the catalytic oxidation rate, rF is the electrochemical oxidation rate, r is the
observed reaction rate. The catalytic rate increase largely exceeds the rate of O2- supply to the catalystelectrode: r - r0 >> I/2F.
0
0time0 t1 t2
curr
ent
reac
tion
rate
ro
I
rF
r
0
0time0 t1 t2
curr
ent
reac
tion
rate
ro
II
rFrF
rrr
catalyst
gold
YSZ U
I
e-
e-
O2-O2- O2-
O2 2O2- + 2e-
Electrochemical Oxidation
C2H4+6O2- 12e- +2CO2+2H2O
Catalytic Oxidation
C2H4+3O2 2CO2+2H2O
Gas mixture C2H4 + O2
T=350°CGas mixture C2H4 + O2
UWR
catalyst
gold
YSZ U
I
e-e-
e-e-
O2-O2- O2-
O2 2O2- + 2e-
Electrochemical Oxidation
C2H4+6O2- 12e- +2CO2+2H2O
Catalytic Oxidation
C2H4+3O2 2CO2+2H2O
Gas mixture C2H4 + O2
T=350°CGas mixture C2H4 + O2
UWR
A
B
Chapter 2 Review of relevant basic work (bibliography)
8
(c) The promotion index, PIj, defined as:
(2.3)
where θj is the coverage of the catalyst surface by the promoting ion j (eg., O2-).
The effect has been studied for more than seventy catalytic reactions [5, 10] at porous
metal films deposited on a variety of solid electrolytes, including O2- conductors such as yttria-
stabilized zirconia (YSZ) [2], Na+ conductors such as β”-Al2O3 [11], F- conductors such as CaF2
[12], H+-conducting solid electrolytes such as CaZr0.9In0.1O3-α, CsHSO4, and Nafion [13-15], as
well as on mixed ionic-electronic conductors [16, 17]. Work in this area has been reviewed
repeatedly [5, 18-20].
In the current theory of electrochemical promotion, the effect is attributed to specific pro-
moting species [5, 18]. These are generated electrochemically at the three-phase boundaries (tpb)
between solid electrolyte, catalyst, and gas phase, and then spread out over the gas-exposed cata-
lyst surface.
The overall parameters of the complex phenomenon of electrochemical promotion are
readily investigated by phenomenological techniques such as catalytic rate measurements [3-5],
solid-state cyclic voltammetry [5, 21, 22], catalyst work function measurements [3, 23, 24], and
AC impedance spectroscopy [25, 26], while more sophisticated techniques such as XPS [5, 27-
30], UPS, TPD [21, 31-37], PEEM [38], or STM [23] are needed to identify and monitor particu-
lar promoting species.
Apart from its obvious scientific interest, the phenomenon of electrochemical promotion
may be of great importance in present [39-41] and future industrial applications. The first step in
the development of reactors for reactions to be promoted electrochemically is that of realizing
bipolar cell configurations [19, 42], the second step was recently realized in terms of a monolithic
electropromoted reactor through a collaboration between EPFL, the University of Patras, and
Bosch, Stuttgart [43].
In the following, a mechanistic interpretation of electrochemical promotion will be out-
lined while demonstrating more particularly the connection between the catalyst’s surface work
function and the catalyst’s potential under electrochemical promotion conditions.
PIj ∆r r0⁄( ) ∆θj⁄=
Electrochemical promotion
9
2.1.2 The mechanism of electrochemical promotion
The electrochemical promotion of catalysis, similarly to the usual (chemical) promotion
and to metal-support interactions in heterogeneous catalysis, is related to spillover-backspillover
phenomena. The latter can be described as the mobility of adsorbed species from one phase on
which they easily adsorb (donor) to another phase where they do not directly adsorb (acceptor).
By this mechanism a seemingly inert material can acquire catalytic activity. Spillover may lead to
an improvement of catalytic activity or selectivity and also to an increase in lifetime of the cata-
lyst.
In the presence of spillover in heterogeneous catalysis, the usual kinetic models can no
longer be applied in a direct way. The generation of new surface sites or changes in surface con-
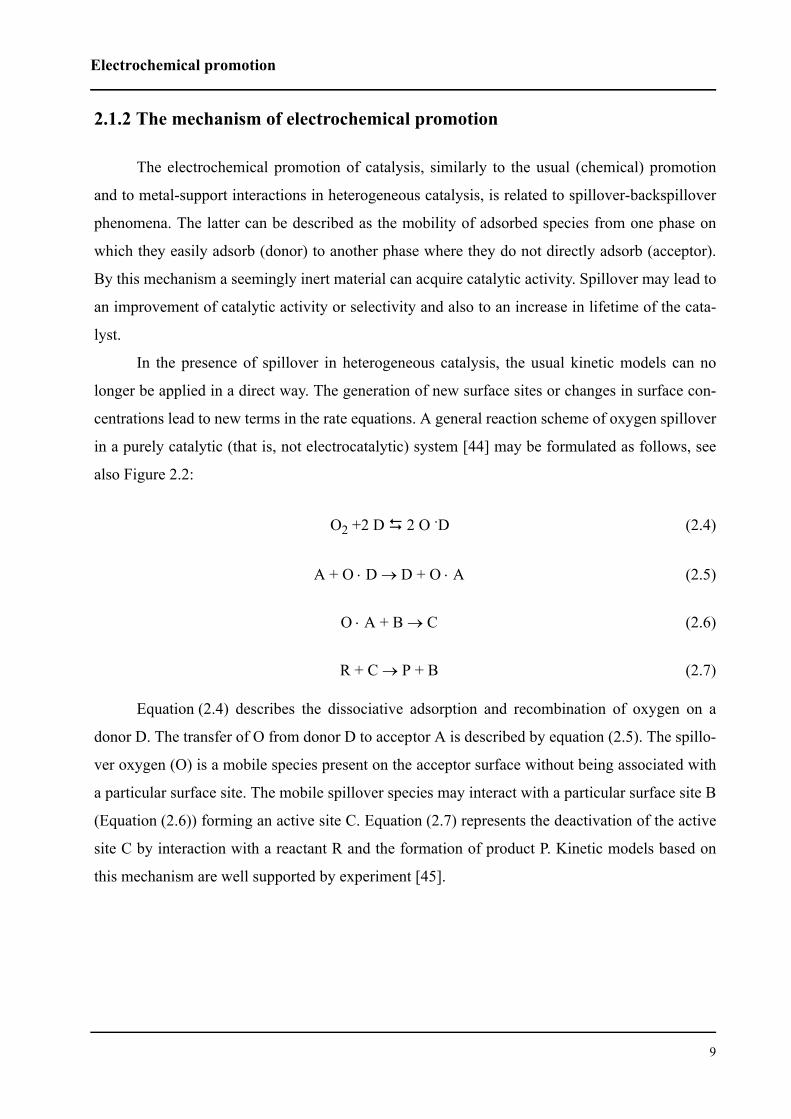
centrations lead to new terms in the rate equations. A general reaction scheme of oxygen spillover
in a purely catalytic (that is, not electrocatalytic) system [44] may be formulated as follows, see
also Figure 2.2:
O2 +2 D 2 O .D (2.4)
(2.5)
(2.6)
(2.7)
Equation (2.4) describes the dissociative adsorption and recombination of oxygen on a
donor D. The transfer of O from donor D to acceptor A is described by equation (2.5). The spillo-
ver oxygen (O) is a mobile species present on the acceptor surface without being associated with
a particular surface site. The mobile spillover species may interact with a particular surface site B
(Equation (2.6)) forming an active site C. Equation (2.7) represents the deactivation of the active
site C by interaction with a reactant R and the formation of product P. Kinetic models based on
this mechanism are well supported by experiment [45].
A O D D O A⋅+→⋅+
O A B C→+⋅
R C P B+→+
Chapter 2 Review of relevant basic work (bibliography)
10
FIGURE 2.2. Schematic representation of the mechanism of oxygen spillover in a purely catalyticsystem. Symbols as in Equations (2.4) to (2.7).
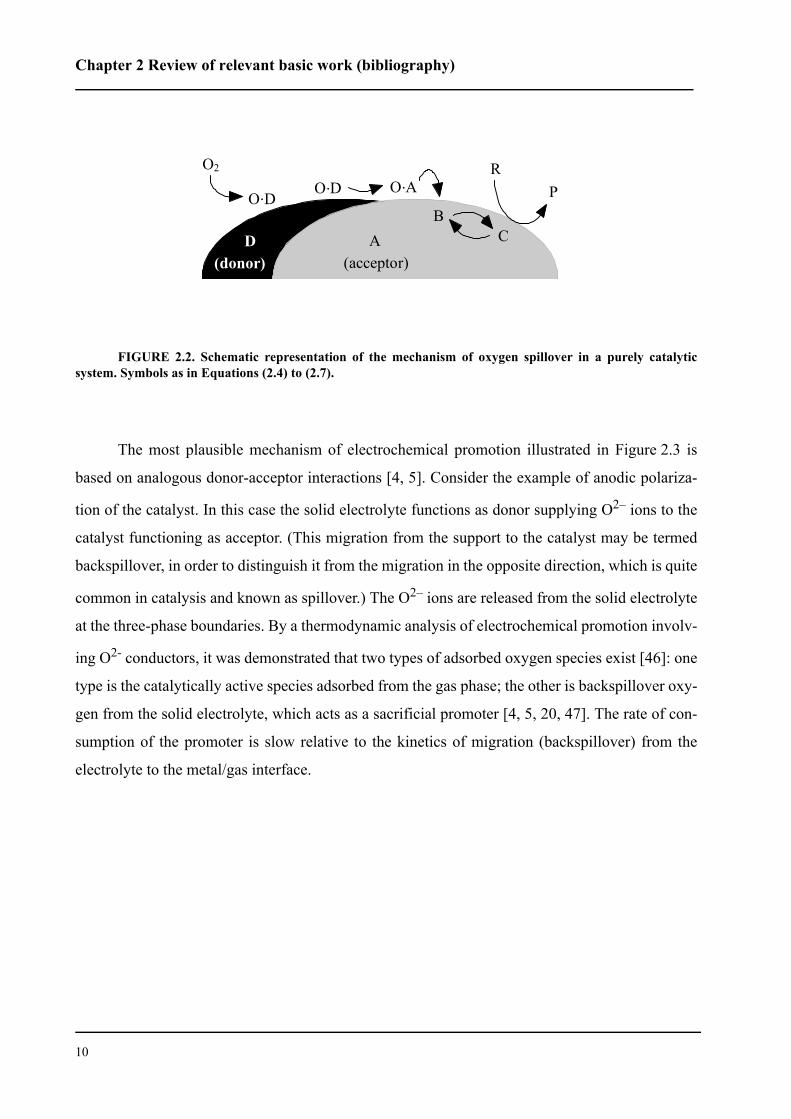
The most plausible mechanism of electrochemical promotion illustrated in Figure 2.3 is
based on analogous donor-acceptor interactions [4, 5]. Consider the example of anodic polariza-
tion of the catalyst. In this case the solid electrolyte functions as donor supplying O2– ions to the
catalyst functioning as acceptor. (This migration from the support to the catalyst may be termed
backspillover, in order to distinguish it from the migration in the opposite direction, which is quite
common in catalysis and known as spillover.) The O2– ions are released from the solid electrolyte
at the three-phase boundaries. By a thermodynamic analysis of electrochemical promotion involv-
ing O2- conductors, it was demonstrated that two types of adsorbed oxygen species exist [46]: one
type is the catalytically active species adsorbed from the gas phase; the other is backspillover oxy-
gen from the solid electrolyte, which acts as a sacrificial promoter [4, 5, 20, 47]. The rate of con-
sumption of the promoter is slow relative to the kinetics of migration (backspillover) from the
electrolyte to the metal/gas interface.
(donor)
O . D
O2 O .D O.A P
R
D (acceptor)
A B
C
Electrochemical promotion
11
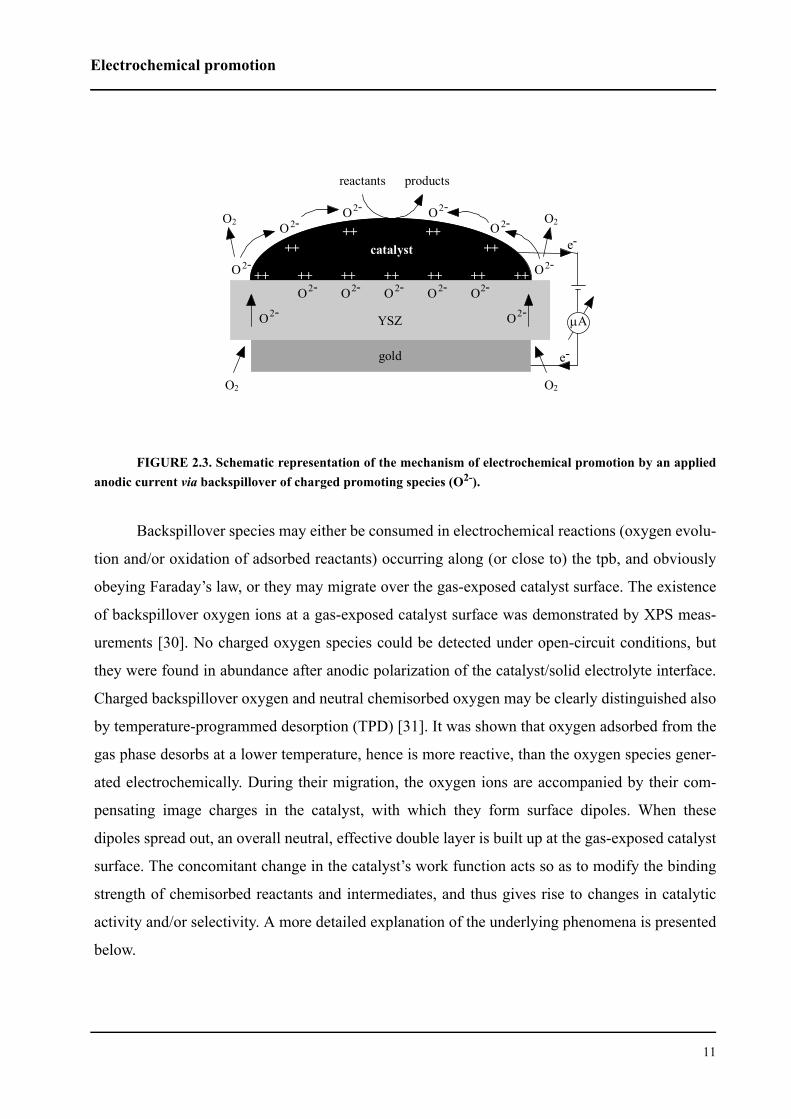
FIGURE 2.3. Schematic representation of the mechanism of electrochemical promotion by an appliedanodic current via backspillover of charged promoting species (O2-).
Backspillover species may either be consumed in electrochemical reactions (oxygen evolu-
tion and/or oxidation of adsorbed reactants) occurring along (or close to) the tpb, and obviously
obeying Faraday’s law, or they may migrate over the gas-exposed catalyst surface. The existence
of backspillover oxygen ions at a gas-exposed catalyst surface was demonstrated by XPS meas-
urements [30]. No charged oxygen species could be detected under open-circuit conditions, but
they were found in abundance after anodic polarization of the catalyst/solid electrolyte interface.
Charged backspillover oxygen and neutral chemisorbed oxygen may be clearly distinguished also
by temperature-programmed desorption (TPD) [31]. It was shown that oxygen adsorbed from the
gas phase desorbs at a lower temperature, hence is more reactive, than the oxygen species gener-
ated electrochemically. During their migration, the oxygen ions are accompanied by their com-
pensating image charges in the catalyst, with which they form surface dipoles. When these
dipoles spread out, an overall neutral, effective double layer is built up at the gas-exposed catalyst
surface. The concomitant change in the catalyst’s work function acts so as to modify the binding
strength of chemisorbed reactants and intermediates, and thus gives rise to changes in catalytic
activity and/or selectivity. A more detailed explanation of the underlying phenomena is presented
below.
e -
e -
µA YSZ
catalyst
O + +
2 - O++
2- O++
2- O++
2- O++
2-
products reactants
+ + O2 - ++ O2-
++O2-
++O2-
+ + O 2 -
++O2-O2
O2
gold
O2
O2
O 2 - O2-
Chapter 2 Review of relevant basic work (bibliography)
12
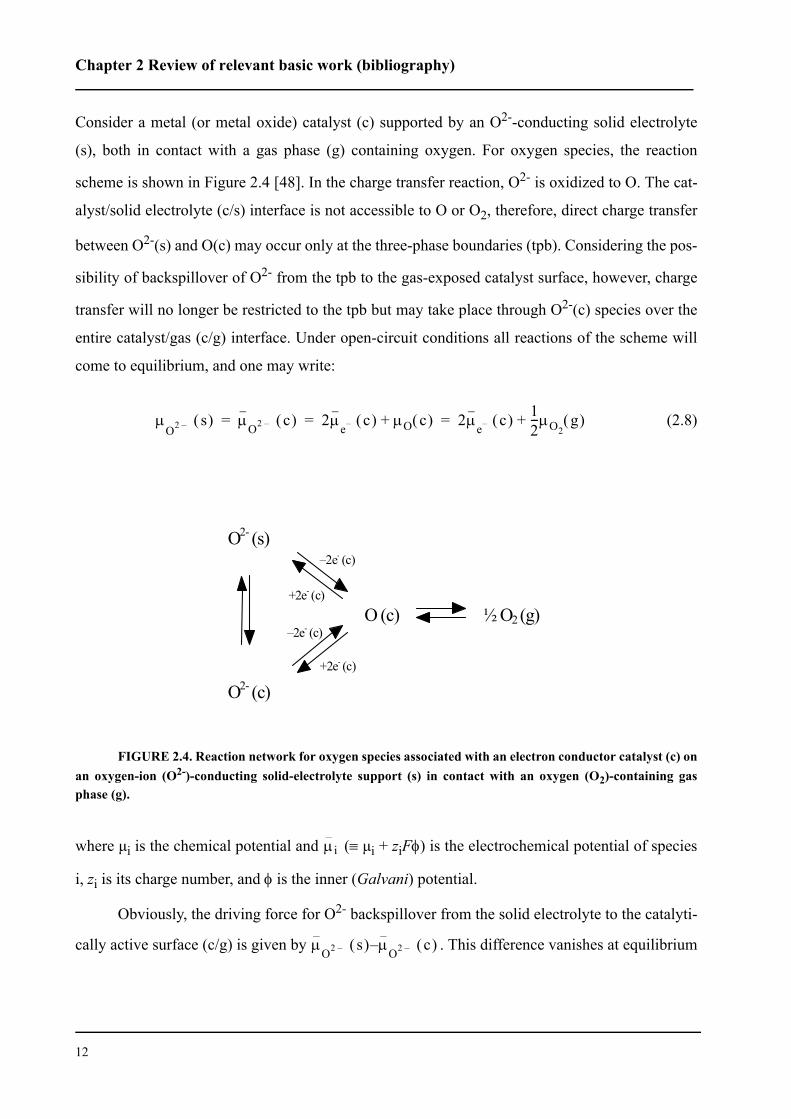
Consider a metal (or metal oxide) catalyst (c) supported by an O2--conducting solid electrolyte
(s), both in contact with a gas phase (g) containing oxygen. For oxygen species, the reaction
scheme is shown in Figure 2.4 [48]. In the charge transfer reaction, O2- is oxidized to O. The cat-
alyst/solid electrolyte (c/s) interface is not accessible to O or O2, therefore, direct charge transfer
between O2-(s) and O(c) may occur only at the three-phase boundaries (tpb). Considering the pos-
sibility of backspillover of O2- from the tpb to the gas-exposed catalyst surface, however, charge
transfer will no longer be restricted to the tpb but may take place through O2-(c) species over the
entire catalyst/gas (c/g) interface. Under open-circuit conditions all reactions of the scheme will
come to equilibrium, and one may write:
(2.8)
FIGURE 2.4. Reaction network for oxygen species associated with an electron conductor catalyst (c) onan oxygen-ion (O2-)-conducting solid-electrolyte support (s) in contact with an oxygen (O2)-containing gasphase (g).
where µi is the chemical potential and (≡ µi + ziFφ) is the electrochemical potential of species
i, zi is its charge number, and φ is the inner (Galvani) potential.
Obviously, the driving force for O2- backspillover from the solid electrolyte to the catalyti-
cally active surface (c/g) is given by . This difference vanishes at equilibrium
µO2 – s( ) µ
O2 – c( ) 2µe– c( ) µO c( )+ 2µ
e– c( ) 12---µO2
g( )+= = =
O2- (s)
O2- (c)
O (c) ½ O2 (g)
–2e- (c)
+2e- (c)
–2e- (c)
+2e- (c)
µi
µO2 – s( ) µ
O2 – c( )–
Electrochemical promotion
13
(see the left-hand side of Equation ()) when an effective double layer has been established at the c/
g interface, by analogy to the case of an emersed electrode in aqueous electrochemistry [49].
In a typical electrochemical promotion experiment, a potential step is applied to the elec-
trochemical cell. In the ideal case of a perfect reference electrode having invariant potential, the
induced change in the ohmic-drop-free potential difference between the catalyst (working elec-
trode) and the reference electrode, UWR, is equal to the change in the inner (Galvani) potential of
the catalyst, φ:
(2.9)
This difference is measurable. By changing the potential of the catalyst one modifies its
Fermi level, EF, or - in other terms - the electrochemical potential of the electrons in the catalyst
( ). This latter quantity is defined as the difference between the zero-energy state of the
electrons (taken in the ground state at infinite distance from the solid) and the energy of a conduc-
tion electron in the bulk of the catalyst. It is common practice to count this energy difference in
two conceptually different ways. One of them is common in electrochemistry, the other is com-
mon in surface science.
In electrochemistry, one considers the electrochemical potential of electrons as the sum of
their chemical potential in the solid, µe, and the contribution due to the electrostatic (inner) poten-
tial:
(2.10)
Under polarization, the chemical potential of electrons in the bulk solid remains invariant,
and one may write:
(2.11)
Hence, in the electrochemical approach formulated in terms of the bulk properties , µe,
and φ, the change in electrochemical potential of the electrons can be related, directly to the
applied potential difference.
Yet, since heterogeneous catalysis is a surface phenomenon, it is preferable to express the
change in electrochemical potential, , in terms of the surface science approach:
∆UWR ∆φ=
µe EF=
µe µe eφ–( )+=
∆µe e∆φ– e∆UWR–( )= =
µe
∆µe
Chapter 2 Review of relevant basic work (bibliography)
14
(2.12)
where Φ is the work function of the solid surface, and Ψ is the outer (Volta) potential. This
approach has the distinct advantage that both Φ and Ψ are surface properties, and both are meas-
urable quantities.
The work function, Φ, is defined as the minimum energy required to extract an electron
from the bulk of the solid (ie., from the Fermi level) and to eject it with zero kinetic energy to a
point just outside the solid surface where the image force interactions are negligible (typically 0.1
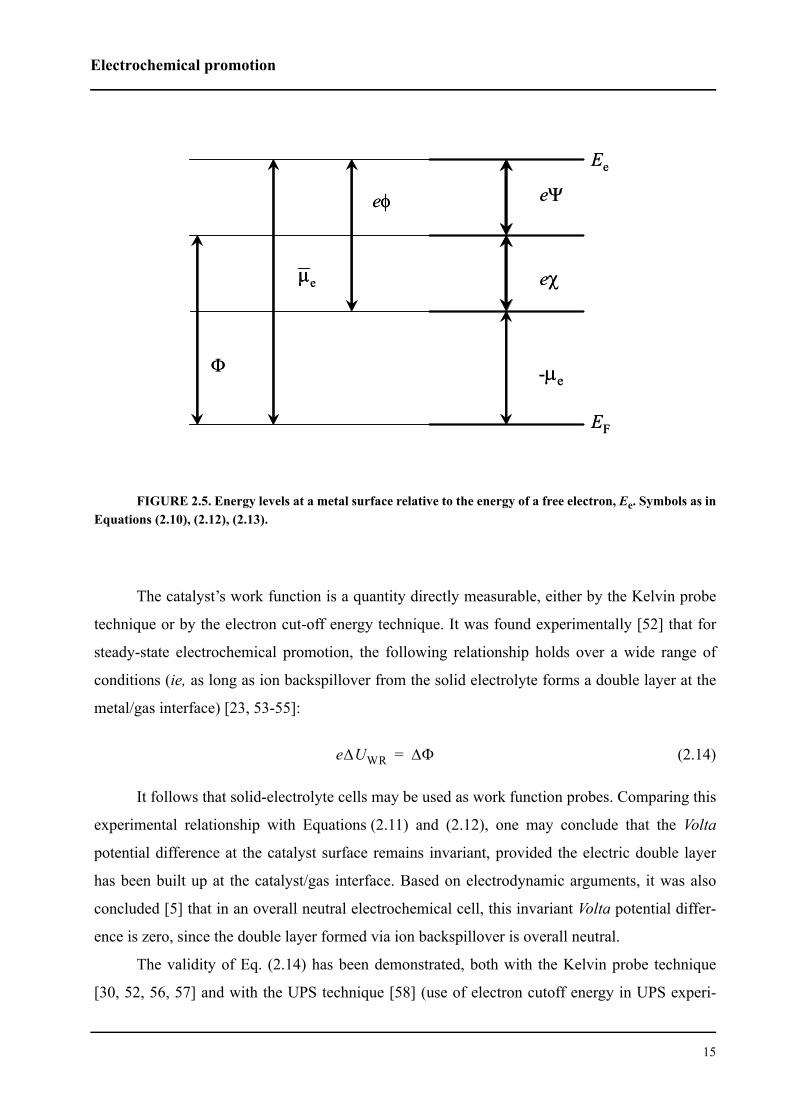
to 1 µm). This is schematically represented in Fig. 2.5.
The Volta potential at this point defines the energy, eΨ, required to bring the electron from
there to its zero energy level (to infinite distance from the solid). When the surface is electrically
neutral (zero Volta potential), the work function alone measures the electrochemical potential of
the electrons in the bulk solid. Two quantities contribute to the work function:
(2.13)
the chemical potential, µe, of the electron in the solid, and the surface potential, χ, which accounts
for the potential barrier that the electron must overcome in order to cross the surface of the solid.
Since the chemical potential, µe, is an invariant bulk property, any change in the work function
due to application of a potential difference will be equal to the change in surface potential. Popu-
lation of the surface with dipoles via O2- backspillover, ie, the formation of an electric double
layer, will increase the surface potential, and the concomitant increase in work function will affect
the binding strength of chemisorbed reactants. It follows that the adsorption energy of electron
acceptors (eg, atomic O) will be weakened while that of electron donors (eg, C2H4) will be
strengthened. This results in a variation of the adsorption equilibrium constants, hence also in
coverage of the adsorbed species [5, 50, 51]. A corresponding change in catalytic reaction rate
must then be expected.
µe Φ– eΨ–( )+=
Φ µe– eχ+=
Electrochemical promotion
15
FIGURE 2.5. Energy levels at a metal surface relative to the energy of a free electron, Ee. Symbols as inEquations (2.10), (2.12), (2.13).
The catalyst’s work function is a quantity directly measurable, either by the Kelvin probe
technique or by the electron cut-off energy technique. It was found experimentally [52] that for
steady-state electrochemical promotion, the following relationship holds over a wide range of
conditions (ie, as long as ion backspillover from the solid electrolyte forms a double layer at the
metal/gas interface) [23, 53-55]:
(2.14)
It follows that solid-electrolyte cells may be used as work function probes. Comparing this
experimental relationship with Equations (2.11) and (2.12), one may conclude that the Volta
potential difference at the catalyst surface remains invariant, provided the electric double layer
has been built up at the catalyst/gas interface. Based on electrodynamic arguments, it was also
concluded [5] that in an overall neutral electrochemical cell, this invariant Volta potential differ-
ence is zero, since the double layer formed via ion backspillover is overall neutral.
The validity of Eq. (2.14) has been demonstrated, both with the Kelvin probe technique
[30, 52, 56, 57] and with the UPS technique [58] (use of electron cutoff energy in UPS experi-
Ee
EF
eΨ
eχ
-µe
eφ
eµ
Φ
Ee
EF
eΨ
eχ
-µe
eφ
eµ
Φ
e∆UWR ∆Φ=
Chapter 2 Review of relevant basic work (bibliography)
16
ments), for work function measurements at gas-exposed electrode surfaces (Pt [30, 52], Ag [58],
IrO2 [56, 57]) and for catalysts in contact with YSZ [30, 52, 56-58] and β”-Al2O3 (a Na+ conduc-
tor) [30, 52] at temperatures of 200 to 550 °C.
Although changes in catalyst work function with catalyst potential were widely studied and
understood, Eq. (2.14) has been the subject of vivid controversy and discussions in recent years
[54, 59, 60].
New important points concerning the validity of Eq. (2.14) were brought up recently by
Leiva and Sánchez [61]. These authors elucidated the physical conditions that lead to the validity
of Eq. (2.14), by putting forward a physical model based on electrostatic considerations. The
authors performed the integration of the Poisson equations across the catalyst/solid electrolyte
and catalyst/gas interphases, and emphasised the role of charge distribution at the interfaces.
2.1.3 Rationalization of the potential-work function equivalence
Like every experimental “law”, Eq. (2.14) has its limitations. These limitations are consid-
ered below.
The key experimental observation is [5]:
(2.15)
where ΦW denotes work function of the working electrode (catalyst).
Using an arrangement with two-Kelvin probes [32] for monitoring in situ the work func-
tions of both the working and the reference electrode, ΦW and ΦR, the following simple relation-
ships were found:
(2.16)
(2.17)
and attributed to ion backspillover onto the electrode surface and to the formation of an
effective electrochemical double layer on the electrode surface. This double layer neutralizes any
net electrostatic charge residing on the gas-exposed electrode surface in the simple cell Po2/Pt/
YSZ/Pt/P’o2. The partial pressures of O2 on the two sides of the cell are Po2 and P’o2. Oxygen
e∆UWR ∆ΦW=
eUWR ΦW ΦR–=
ΨW ΨR 0= =
Electrochemical promotion
17
may chemisorb on the metal surfaces, so that the work functions ΦW and ΦR of the two gas-
exposed electrode surfaces are ΦW(Po2) and ΦR(P’o2). In such a cell the following situations are
possible:
1. The temperature is low, so that ionic mobility on the electrode surface is negligible, ie,
there is no spillover. One always has, by definition:
(2.18)
Also, due to establishment of the equilibrium:
(2.19)
at the metal-gas-solid electrolyte three-phase-boundaries, one has:
(2.20)
and from Eq. (2.18):
(2.21)
Then, comparing Eqs. (2.18) and (2.21) one has:
(2.22)
Since Po2 and P’o2 are fixed, UWR is fixed, and since there is no spillover, ΦW(Po2) and
ΦR(P’o2) are also fixed. Thus, in situation 1 (no ion spillover) eΨW - eΨR is fixed to a nonzero
value.
In fact, as an application of Eq. (2.22), consider the case of Po2 = P’o2 and, thus, of UWR =
0. Then one has:
(2.23)
The nonzero value of eΨW - eΨR in Eq. (2.22) implies that net surface charges exist on the
gas-exposed electrode surface. These charges (q+, q-) have to be opposite and equal, as the cell
eUWR µW µR–( )– ΦW ΦR– eΨW eΨR–+= =
O2 g( ) 4e– 2O2 –↔+
µO24µW+ 2µ
O2 – µ′O24µR+= =
eUWR1
4F------- µO2
µO2 ––( ) R T
4F-------
PO2
P′O2
----------
ln= =
eΨW eΨR+ eUWR Φ+ R p′O2( ) ΦW pO2
( )–=
eΨW eΨR+ ΦR P′O2( ) ΦW PO2
( ) 0≠–=
Chapter 2 Review of relevant basic work (bibliography)
18
overall is electrochemically neutral and all other charges are located at the metal-solid electrolyte
interfaces to maintain their electroneutrality. The charges q+ = q- are quite small relative to the
charges, Q, stored at the metal-electrolyte interface, yet due to their presence the system has
excess electrostatic energy:
(2.24)
2. The temperature is increased to the point where the ionic mobility on the electrode sur-
face is high, so ion spillover occurs.
Oxygen ions are now attracted to the electrode having positive charge, or to the electrode
that has been made positive by anodic polarization. Backspillover will continue until the charge is
neutralized. Similarly, oxygen anions will be repelled from the electrode that is negatively
charged or cathodically polarized. The charges q+ and q- thus disappear, ΨW and ΨR vanish.
In this situation Eq. (2.22) becomes
(2.25)
where eUWR is still fixed by Eq. (2.21) but ΦW and ΦR are variables. They can change due to the
spillover of ions. They will change in such a way as to minimize the excess electrostatic energy of
the system:
(2.26)
This is possible when ΨW = ΨR, which implies that q+ = q- = 0 for an overall neutral sys-
tem, ie, ΨW = ΨR = 0. But note that even for an overall charged system, ie, a system where a net
charge q has been introduced, the excess electrostatic energy is given by:
(2.27)
and minimized by
(2.28)
It thus follows from Eqs. (2.25) and (2.28) that:
EC ΨW ΨR–( )q +=
eΨW eΨR+ eUWR Φ+ R ΦW–=
EC ΨW ΨR–( )q + 0= =
EC ΨW ΨR–( )q=
ΨW ΨR=
Electrochemical promotion
19
(2.29)
(overall neutral cell) (2.30)
(overall charged cell) (2.31)
The reasons for deviations from potential-work function equivalence showing up as a
nonzero Volta potential difference can be summarized as [55]: (i) slow or negligible ion backspill-
over; (ii) excessively high or excessively low applied voltage; (iii) high and low temperature.
In summary, electrochemical promotion may be regarded as catalysis occurring in an elec-
tric double layer controlled by application of a current or a potential difference [5]. The condition
required to achieve electrochemical promotion is formation of a double layer at the catalyst/gas
interface by the mechanism of ion backspillover from the solid electrolyte support. This may
occur over a wide range of conditions. The most important experimental parameters that are favo-
rable for electrochemical promotion are the following: an extensive tpb (porous catalyst), moder-
ate diffusion lengths (thin catalyst films), an adequate temperature range, eg, 250 to 500 °C for
YSZ (a temperature not too low, so as to have sufficient ionic mobility, and not too high, so as to
avoid a high reactivity of backspillover ions).
2.1.4 Work function measurements
The technique most commonly used for work function measurements in a reacting atmos-
phere is known as the Kelvin or vibrating-capacitor method [62-64]. Its principle is as follows. By
placing a conductor, the Kelvin probe, into the immediate proximity of the catalyst surface and
connecting the probe to the catalyst via an external circuit, a capacitor is formed. The contact
potential difference between the two conductors arising from their work function difference
results in a charge separation between the opposing surfaces. Vibration of the Kelvin probe then
generates an alternative current via periodic variation of the capacitance. The external potential
difference that must be applied to make the current vanish is the measure of the work function dif-
ference between the two conductors. By using a Kelvin probe made of an inert material, which has
an invariant work function, any variation of the response due to varying experimental conditions
may be attributed to the changes in work function of the catalyst alone. For an illustration of the
usefulness of work function studies in electrochemical promotion, a dynamic approach was
eUWR ΦW ΦR–=
ΨW ΨR 0= =
ΨW ΨR=
Chapter 2 Review of relevant basic work (bibliography)
20
selected where the time dependence of work function changes due to polarization steps is investi-
gated. The model reaction is ethylene combustion over RuO2 catalyst [65]. Such experiments
should provide insight into the migration of promoting species towards the gas-exposed catalyst
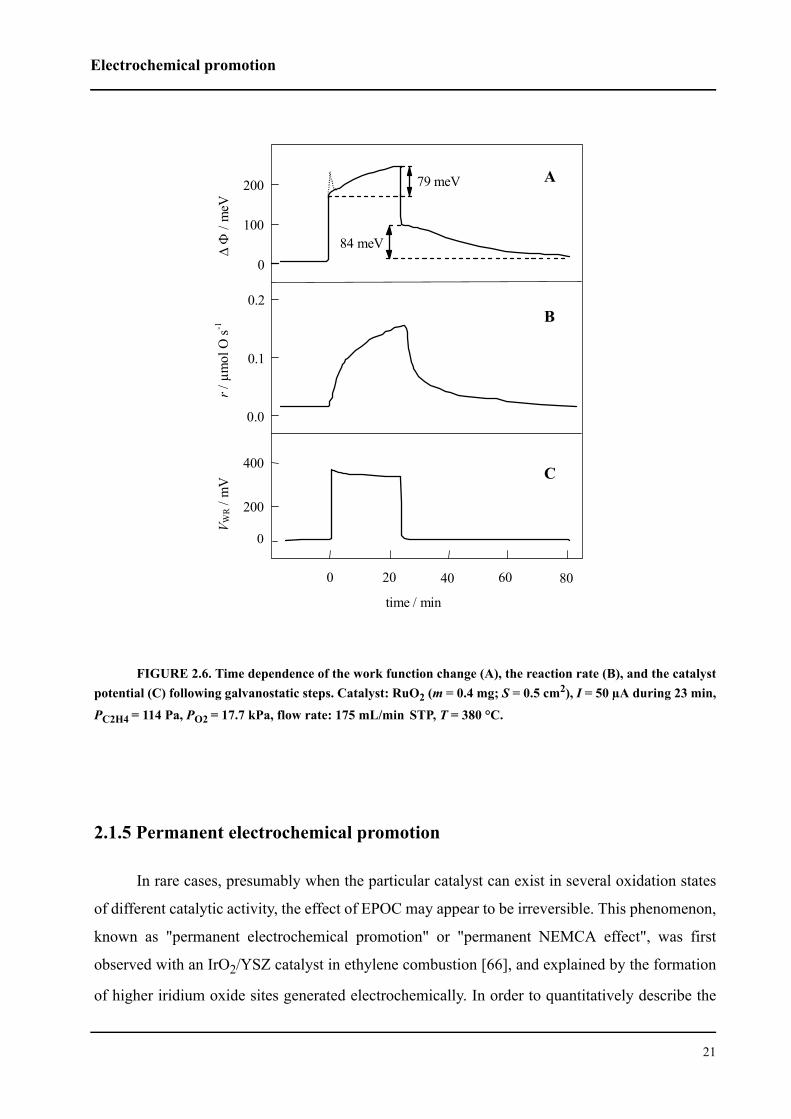
surface. Figure 2.6 shows the time dependence of the work function change (∆Φ) and of the cor-
responding reaction rate (r) and catalyst potential (UWR) following galvanostatic steps of 50 µA.
The work function transients observed during anodic polarization of the catalyst were com-
posed of two main steps: a sharp increase just after application of the current, and a subsequent
slow increase leading to a new steady-state value under polarization. Between these two steps, a
sharp peak is observed in certain cases, as exemplified in Figure 2.6 A. The initial jump in work
function is associated with the surface region easily accessible to promoting species. This region
is supposed to be close to the three-phase boundary (tpb) where the promoting species are gener-
ated. The adsorption of charged oxygen on sites next to the tpb leads to the observed increase in
work function. The final step, where the work function exhibits a slow increase, is due to migra-
tion of the promoting species from the tpb towards the entire gas-exposed catalyst surface. The
work function continues to change until steady-state coverage by the promoting species is reached
and, in parallel, the catalytic reaction rate reaches its new promoted steady-state value. The sharp
peak preceding the final step might only appear when the relative positions of the catalyst and the
Kelvin probe are properly adjusted. In principle, the probe must be placed into a region next to the
catalyst where the tpb is accessible for the work function measurements. If the Kelvin probe is too
far away from the tpb, no sharp peak but only a smooth transition between initial jump and final
slow increase might be observed. Further investigations are required for a verification and satis-
factory interpretation of the sharp peak appearing in some work function transients.
Electrochemical promotion
21
FIGURE 2.6. Time dependence of the work function change (A), the reaction rate (B), and the catalystpotential (C) following galvanostatic steps. Catalyst: RuO2 (m = 0.4 mg; S = 0.5 cm2), I = 50 µA during 23 min,
PC2H4 = 114 Pa, PO2 = 17.7 kPa, flow rate: 175 mL/min STP, T = 380 °C.
2.1.5 Permanent electrochemical promotion
In rare cases, presumably when the particular catalyst can exist in several oxidation states
of different catalytic activity, the effect of EPOC may appear to be irreversible. This phenomenon,
known as "permanent electrochemical promotion" or "permanent NEMCA effect", was first
observed with an IrO2/YSZ catalyst in ethylene combustion [66], and explained by the formation
of higher iridium oxide sites generated electrochemically. In order to quantitatively describe the
time / min
200
100
0
0.1
0.0
∆ Φ
/ m
eV
r / µ
mol
O s-1
V W
R / m
V
400
200
0
0.2
84 meV
79 meV A
B
C
0 20 40 60 80
Chapter 2 Review of relevant basic work (bibliography)
22
irreversible nature of electrochemical promotion, a "permanent" rate enhancement ratio, γ,
defined as the ratio of two open-circuit catalytic reaction rates, one after current interruption, r',
and the other prior to application of the current, r0, has been proposed:
(2.32)
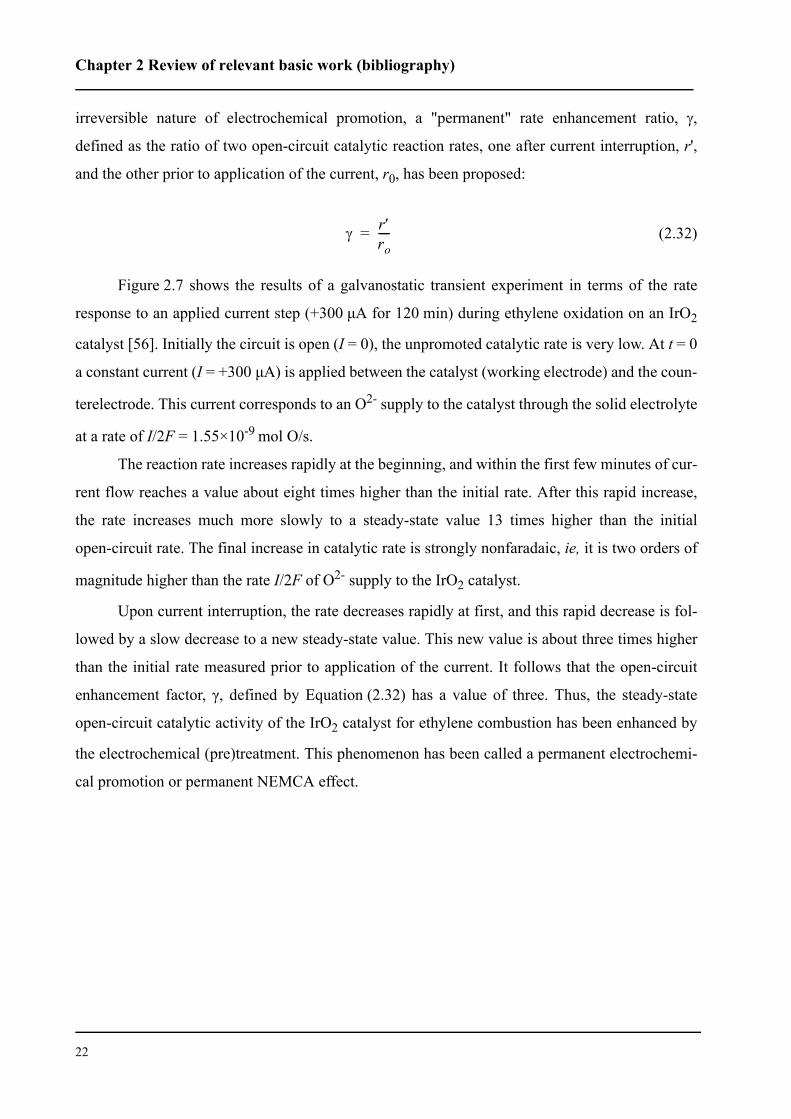
Figure 2.7 shows the results of a galvanostatic transient experiment in terms of the rate
response to an applied current step (+300 µA for 120 min) during ethylene oxidation on an IrO2
catalyst [56]. Initially the circuit is open (I = 0), the unpromoted catalytic rate is very low. At t = 0
a constant current (I = +300 µA) is applied between the catalyst (working electrode) and the coun-
terelectrode. This current corresponds to an O2- supply to the catalyst through the solid electrolyte
at a rate of I/2F = 1.55×10⁻⁹ mol O/s.
The reaction rate increases rapidly at the beginning, and within the first few minutes of cur-
rent flow reaches a value about eight times higher than the initial rate. After this rapid increase,
the rate increases much more slowly to a steady-state value 13 times higher than the initial
open-circuit rate. The final increase in catalytic rate is strongly nonfaradaic, ie, it is two orders of
magnitude higher than the rate I/2F of O2- supply to the IrO2 catalyst.
Upon current interruption, the rate decreases rapidly at first, and this rapid decrease is fol-
lowed by a slow decrease to a new steady-state value. This new value is about three times higher
than the initial rate measured prior to application of the current. It follows that the open-circuit
enhancement factor, γ, defined by Equation (2.32) has a value of three. Thus, the steady-state
open-circuit catalytic activity of the IrO2 catalyst for ethylene combustion has been enhanced by
the electrochemical (pre)treatment. This phenomenon has been called a permanent electrochemi-
cal promotion or permanent NEMCA effect.
γ r′ro----=
Electrochemical promotion
23
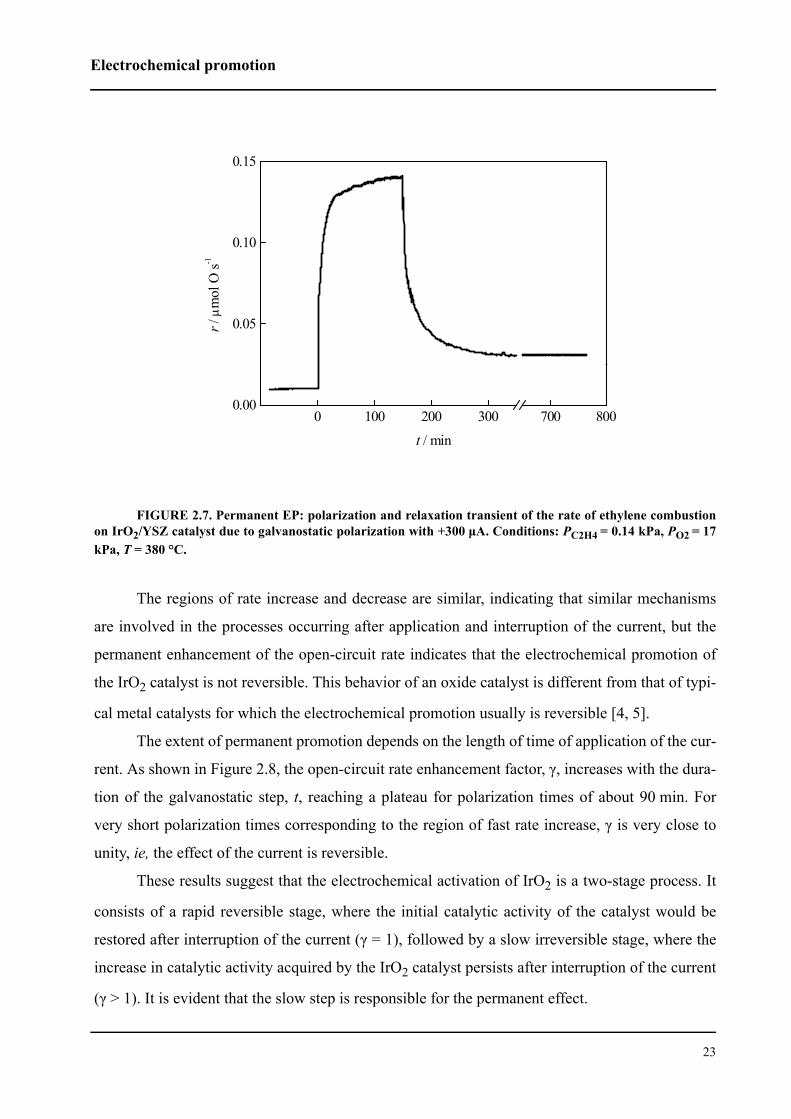
FIGURE 2.7. Permanent EP: polarization and relaxation transient of the rate of ethylene combustionon IrO2/YSZ catalyst due to galvanostatic polarization with +300 µA. Conditions: PC2H4 = 0.14 kPa, PO2 = 17kPa, T = 380 °C.
The regions of rate increase and decrease are similar, indicating that similar mechanisms
are involved in the processes occurring after application and interruption of the current, but the
permanent enhancement of the open-circuit rate indicates that the electrochemical promotion of
the IrO2 catalyst is not reversible. This behavior of an oxide catalyst is different from that of typi-
cal metal catalysts for which the electrochemical promotion usually is reversible [4, 5].
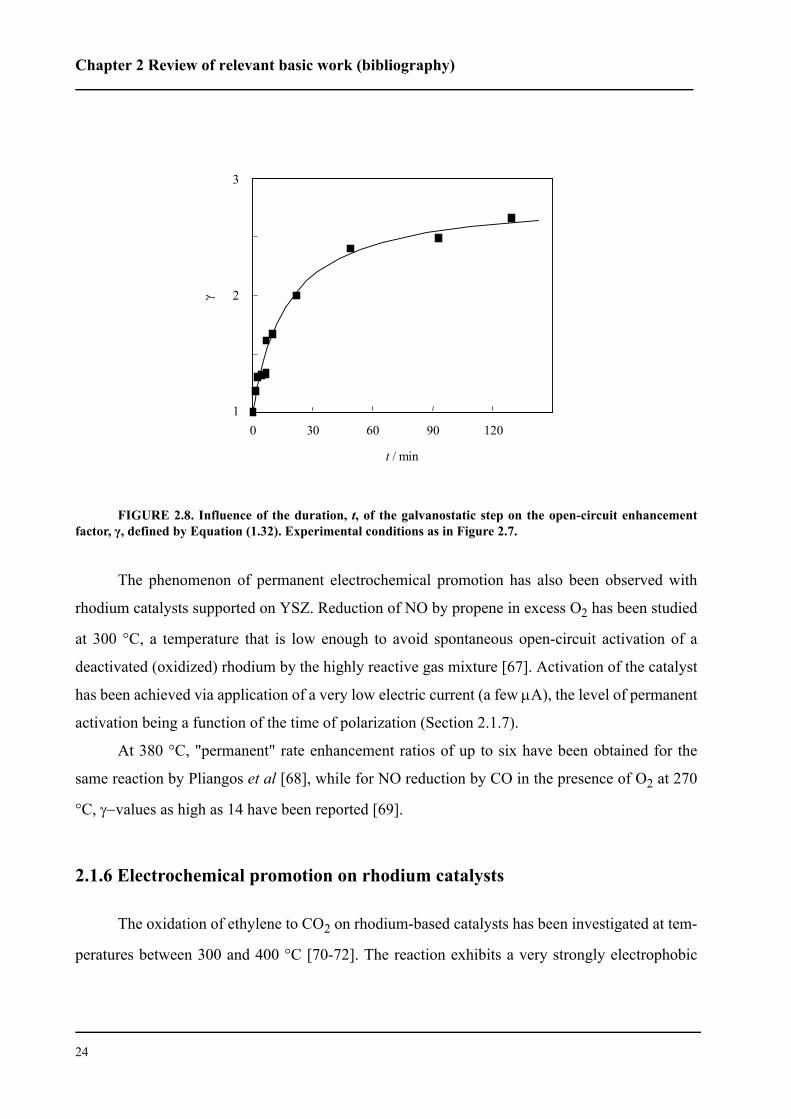
The extent of permanent promotion depends on the length of time of application of the cur-
rent. As shown in Figure 2.8, the open-circuit rate enhancement factor, γ, increases with the dura-
tion of the galvanostatic step, t, reaching a plateau for polarization times of about 90 min. For
very short polarization times corresponding to the region of fast rate increase, γ is very close to
unity, ie, the effect of the current is reversible.
These results suggest that the electrochemical activation of IrO2 is a two-stage process. It
consists of a rapid reversible stage, where the initial catalytic activity of the catalyst would be
restored after interruption of the current (γ = 1), followed by a slow irreversible stage, where the
increase in catalytic activity acquired by the IrO2 catalyst persists after interruption of the current
(γ > 1). It is evident that the slow step is responsible for the permanent effect.
0 100 200 300 700 8000.00
0.05
0.10
0.15
r / µ
mol
O s-1
t / min
Chapter 2 Review of relevant basic work (bibliography)
24
FIGURE 2.8. Influence of the duration, t, of the galvanostatic step on the open-circuit enhancementfactor, γ, defined by Equation (1.32). Experimental conditions as in Figure 2.7.
The phenomenon of permanent electrochemical promotion has also been observed with
rhodium catalysts supported on YSZ. Reduction of NO by propene in excess O2 has been studied
at 300 °C, a temperature that is low enough to avoid spontaneous open-circuit activation of a
deactivated (oxidized) rhodium by the highly reactive gas mixture [67]. Activation of the catalyst
has been achieved via application of a very low electric current (a few µA), the level of permanent
activation being a function of the time of polarization (Section 2.1.7).
At 380 °C, "permanent" rate enhancement ratios of up to six have been obtained for the
same reaction by Pliangos et al [68], while for NO reduction by CO in the presence of O2 at 270
°C, γ−values as high as 14 have been reported [69].
2.1.6 Electrochemical promotion on rhodium catalysts
The oxidation of ethylene to CO2 on rhodium-based catalysts has been investigated at tem-
peratures between 300 and 400 °C [70-72]. The reaction exhibits a very strongly electrophobic
1
2
3
γ
0 30 60 90 120
t / min
Electrochemical promotion
25
behavior, and the values obtained for ρ (Eq. (2.1)) and Λ (Eq. (2.2)) are among the highest found
thus far in EP experiments (100 and 10000, respectively).
In these recent publications, the extremely effective electrochemical promotion of rhodium
catalysts has been explained in terms of a dependence of the reaction rate on the oxidation state of
the rhodium-based catalyst. Measurements of the catalyst’s potential actually revealed the
changes in oxidation state of the rhodium-based catalyst that were caused by variations in compo-
sition of the reactive gas mixture. In fact, when increasing the oxygen partial pressure Pliangos et
al [70] observed, first an increase in reaction rate and then, at a certain critical gas composition,
an abrupt drop in reaction rate that was accompanied by a significant change (increase) in catalyst
potential (by up to 150 mV). This increase was evidence for catalyst oxidation.
Moreover, the drop in reaction rate was displaced to higher oxygen concentrations when
positive potentials were applied to the catalyst, implying that the stability of the surface oxides
decreases with an increase in catalyst potential. It has been suggested that oxygen back-spillover
is responsible for this effect. The presence of these species at the catalyst surface causes a weak-
ening of the chemisorptive bond strength of electron acceptor adsorbates (oxygen) and, hence, an
easier formation of metallic rhodium. Electrochemical promotion was most effective on a fairly
highly oxidized rhodium catalyst surface having sufficient opportunity for reduction of this sur-
face.
Recently, the reactions of propylene oxidation and NO reduction by propylene on rhodium-
based catalysts were studied in detail [73]. The primary goal was that of modelling the reaction of
propylene combustion on rhodium oxide and on metallic rhodium while revealing the different
catalytic properties in the two oxidation states. This modelling was able to explain why the rho-
dium metal is a far better catalyst for propylene combustion. In fact, the catalytic reaction rate on
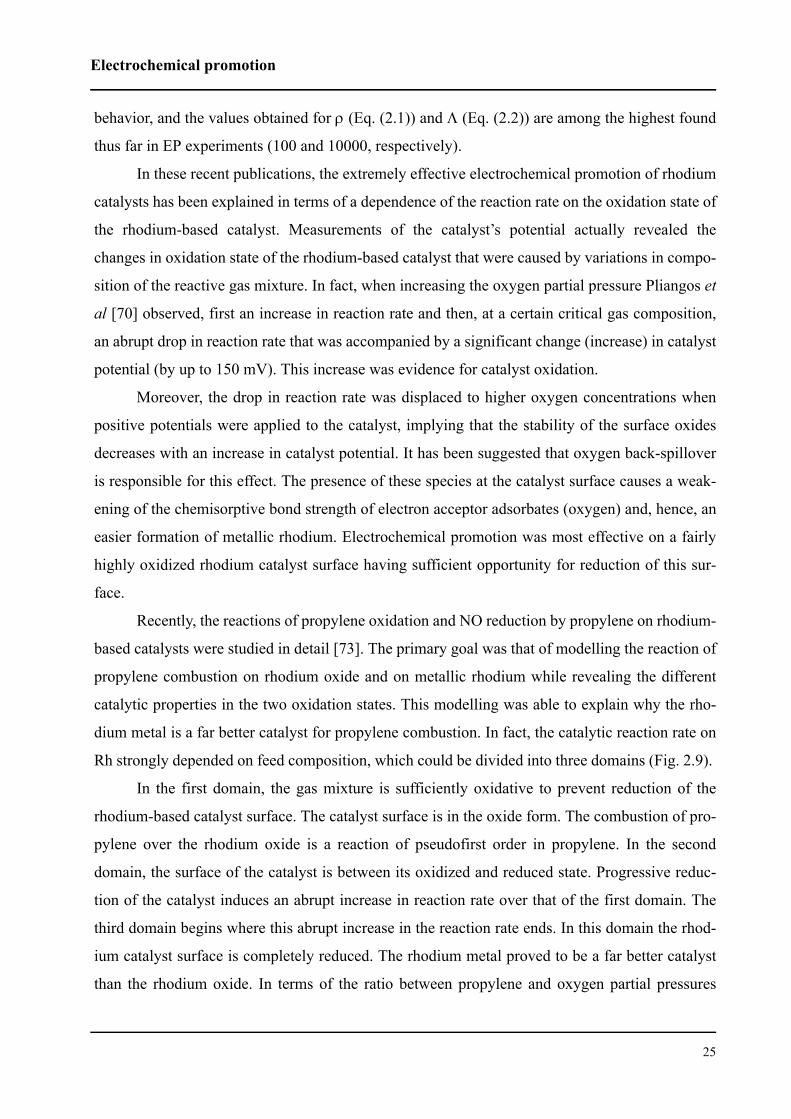
Rh strongly depended on feed composition, which could be divided into three domains (Fig. 2.9).
In the first domain, the gas mixture is sufficiently oxidative to prevent reduction of the
rhodium-based catalyst surface. The catalyst surface is in the oxide form. The combustion of pro-
pylene over the rhodium oxide is a reaction of pseudofirst order in propylene. In the second
domain, the surface of the catalyst is between its oxidized and reduced state. Progressive reduc-
tion of the catalyst induces an abrupt increase in reaction rate over that of the first domain. The
third domain begins where this abrupt increase in the reaction rate ends. In this domain the rhod-
ium catalyst surface is completely reduced. The rhodium metal proved to be a far better catalyst
than the rhodium oxide. In terms of the ratio between propylene and oxygen partial pressures
Chapter 2 Review of relevant basic work (bibliography)
26
(C3H6/O2), the three composition domains into which the catalyst's behavior was divided become
identical for all oxygen or propylene partial pressures.
FIGURE 2.9. Complete combustion of propylene with oxygen over Rh catalyst. Reaction rate as afunction of propylene pressure for the rhodium-based catalyst. Reaction conditions: 375 °C, 1000 Pa oxygen,and 200 mL/min. The ratios C3H6/O2 are provided as a second x-axis. The plot is divided arbitrarily into three
regions called: domain 1, domain 2, domain 3. Rhodium loading: 2.5 g/m2. Geometric surface area: 0.5 cm2.
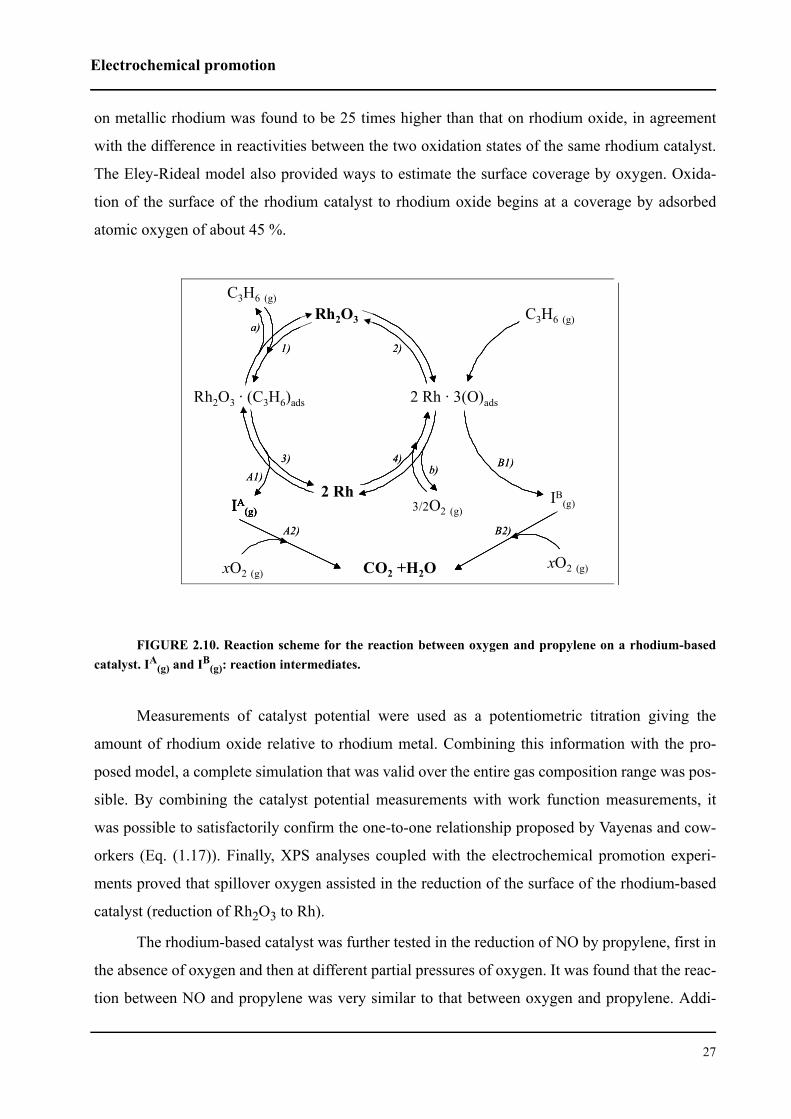
On the basis of these observations, a reaction model was proposed (Fig. 2.10). The core of
the model are the reversible changes between rhodium oxidation states. Two different reaction
pathways leading to the formation of CO2 and H2O are possible, and depend on the rhodium oxi-
dation state. On rhodium oxide, only propylene is adsorbed. The adsorbed propylene reacts with
the rhodium oxide forming CO2 and H2O as the final reaction products. On metallic rhodium, to
the contrary, only oxygen is adsorbed. Propylene from the gas phase reacts with the adsorbed oxy-
gen, again to CO2 and H2O. According to this reaction pathway, the reaction rate of propylene
oxidation on metallic rhodium follows the Eley-Rideal mechanism. By open-circuit steady-state
measurements on the Rh catalyst, it was possible to verify both models. The kinetic rate constant
0
200
400
600
800
1000
0 200 400 600 800 1000PC3H6 [Pa]
r o [n
mol
O s-1
]
0 0.3 0.6 0.9 1.2C3 H6 /O2
domain 1 domain 3domain 2
Electrochemical promotion
27
on metallic rhodium was found to be 25 times higher than that on rhodium oxide, in agreement
with the difference in reactivities between the two oxidation states of the same rhodium catalyst.
The Eley-Rideal model also provided ways to estimate the surface coverage by oxygen. Oxida-
tion of the surface of the rhodium catalyst to rhodium oxide begins at a coverage by adsorbed
atomic oxygen of about 45 %.
FIGURE 2.10. Reaction scheme for the reaction between oxygen and propylene on a rhodium-basedcatalyst. IA
(g) and IB(g): reaction intermediates.
Measurements of catalyst potential were used as a potentiometric titration giving the
amount of rhodium oxide relative to rhodium metal. Combining this information with the pro-
posed model, a complete simulation that was valid over the entire gas composition range was pos-
sible. By combining the catalyst potential measurements with work function measurements, it
was possible to satisfactorily confirm the one-to-one relationship proposed by Vayenas and cow-
orkers (Eq. (1.17)). Finally, XPS analyses coupled with the electrochemical promotion experi-
ments proved that spillover oxygen assisted in the reduction of the surface of the rhodium-based
catalyst (reduction of Rh2O3 to Rh).
The rhodium-based catalyst was further tested in the reduction of NO by propylene, first in
the absence of oxygen and then at different partial pressures of oxygen. It was found that the reac-
tion between NO and propylene was very similar to that between oxygen and propylene. Addi-
2 Rh
C3H6 (g)
Rh2O3
Rh2O3 · (C3H6)ads 2 Rh · 3(O)ads
IB(g)
C3H6 (g)
3/2O2 (g)IA(g)
CO2 +H2OxO2 (g)xO2 (g)
1) 2)
3) 4)
a)
b)A1)B1)
B2)A2)
2 Rh
C3H6 (g)
Rh2O3
Rh2O3 · (C3H6)ads 2 Rh · 3(O)ads
IB(g)
C3H6 (g)
3/2O2 (g)IA(g)
CO2 +H2OxO2 (g)xO2 (g)
2 Rh
C3H6 (g)
Rh2O3
Rh2O3 · (C3H6)ads 2 Rh · 3(O)ads
IB(g)
C3H6 (g)
3/2O2 (g)IA(g)
CO2 +H2OxO2 (g)xO2 (g)
Rh2O3
Rh2O3 · (C3H6)ads 2 Rh · 3(O)ads
IB(g)
C3H6 (g)
3/2O2 (g)IA(g)
CO2 +H2OxO2 (g)xO2 (g)
1) 2)
3) 4)
a)
b)A1)B1)
B2)A2)
Chapter 2 Review of relevant basic work (bibliography)
28
tionally, it was found that NO oxidizes the catalyst surface in the same manner as oxygen does. As
a consequence, in the presence of oxygen a strong competition between oxygen and NO for pro-
pylene combustion was observed. The selectivity of NO reduction to N2 (SN2) was found to be
rather independent of the gas composition (SN2 ˜ 65 %). Electrochemical promotion induces a dis-
tinct nonfaradaic enhancement of the reaction rate, but it hardly affects the N2 selectivity. The
selectivity of NO reduction by propylene, to the contrary, is strongly affected (decreased) by
increasing oxygen content at a fixed partial pressure of propylene.
On the basis of these results, the model proposed for the combustion of propylene with
oxygen (Fig. 2.10) was adapted to propylene combustion with NO. This reaction mechanism took
into account the oxidation state of the rhodium-based catalyst. Here again, on rhodium oxide the
adsorbed propylene reacts directly with the oxidized catalyst following the Mars-van Krevelen
model (redox catalysis). The role of NO, like that of O2, is that of furnishing the adsorbed oxygen
for catalyst oxidation. The kinetics is found to be zero order in the O2 and NO partial pressure. On
the reduced surface, the Eley-Rideal mechanism was supposed to be valid. The reaction occurs
between the atomic oxygen adsorbed on the rhodium catalyst surface and propylene from the gas
phase. Now the role of NO, similarly to that of O2, is that of furnishing the adsorbed atomic oxy-
gen at the catalyst surface. From experimental data, it was found that in this respect, 2.3PNO is
equivalent to Po2.
At the rhodium oxide surface, EPOC induces an increase in reaction rate. The role of oxy-
gen backspillover is that of favoring the adsorption of propylene at the oxidized surface. At the
metallic rhodium surface, EP induces an increase in the kinetic constant of the reaction, which is
more than doubled. To the contrary, EPOC does not increase the kinetic constant of oxygen
adsorption. The role of the oxygen backspillover is that of lowering the strength of oxygen
adsorption, thus increasing the rate of the reaction. Relative to the reduced rhodium surface, on
rhodium oxide the reaction rate is lower but more sensitive to EP, which can give rise to a 300-%
increase in the rate constant.
2.1.7 Electrochemical activation of a catalyst
The concept of a nonfaradaic electrochemical modification of catalysts may also be applied
to an in-situ control of catalytic activity. This phenomenon was studied using YSZ-interfaced Rh
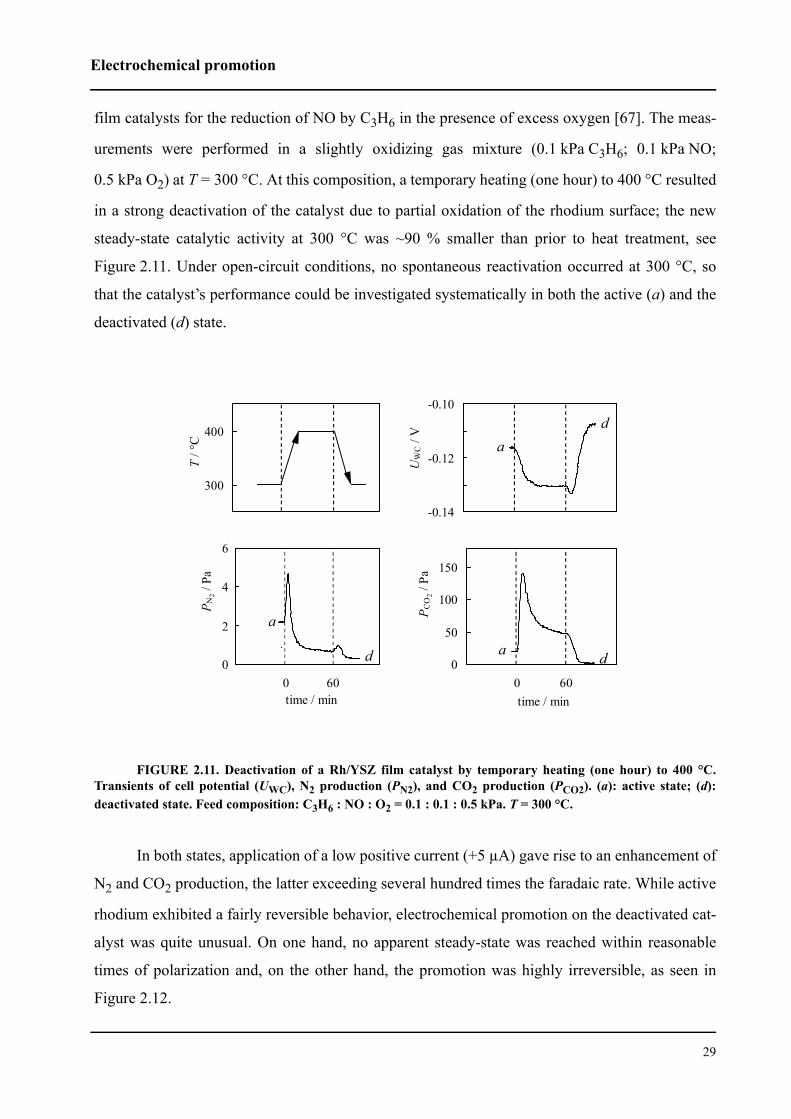
Electrochemical promotion
29
film catalysts for the reduction of NO by C3H6 in the presence of excess oxygen [67]. The meas-
urements were performed in a slightly oxidizing gas mixture (0.1 kPa C3H6; 0.1 kPa NO;
0.5 kPa O2) at T = 300 °C. At this composition, a temporary heating (one hour) to 400 °C resulted
in a strong deactivation of the catalyst due to partial oxidation of the rhodium surface; the new
steady-state catalytic activity at 300 °C was ~90 % smaller than prior to heat treatment, see
Figure 2.11. Under open-circuit conditions, no spontaneous reactivation occurred at 300 °C, so
that the catalyst’s performance could be investigated systematically in both the active (a) and the
deactivated (d) state.
FIGURE 2.11. Deactivation of a Rh/YSZ film catalyst by temporary heating (one hour) to 400 °C.Transients of cell potential (UWC), N2 production (PN2), and CO2 production (PCO2). (a): active state; (d):deactivated state. Feed composition: C3H6 : NO : O2 = 0.1 : 0.1 : 0.5 kPa. T = 300 °C.
In both states, application of a low positive current (+5 µA) gave rise to an enhancement of
N2 and CO2 production, the latter exceeding several hundred times the faradaic rate. While active
rhodium exhibited a fairly reversible behavior, electrochemical promotion on the deactivated cat-
alyst was quite unusual. On one hand, no apparent steady-state was reached within reasonable
times of polarization and, on the other hand, the promotion was highly irreversible, as seen in
Figure 2.12.
-0.14
-0.12
-0.10
-60 0 60 120
UW
C /
V
ad
250
300
350
400
450
-60 0 60 120
T / °
C
0
2
4
6
-60 0 60 120time / min
P N2 /
Pa
a
d 0
50
100
150
-60 0 60 120 time / min
P CO
2 / P
a
a d
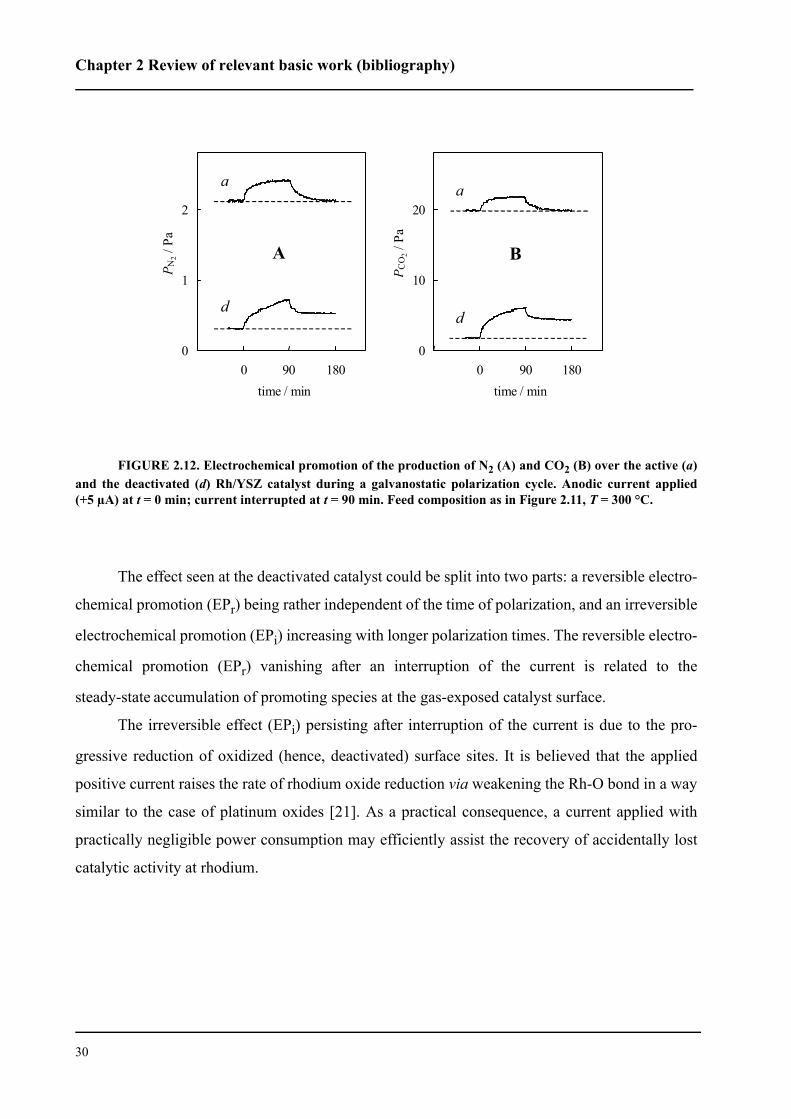
Chapter 2 Review of relevant basic work (bibliography)
30
FIGURE 2.12. Electrochemical promotion of the production of N2 (A) and CO2 (B) over the active (a)and the deactivated (d) Rh/YSZ catalyst during a galvanostatic polarization cycle. Anodic current applied(+5 µA) at t = 0 min; current interrupted at t = 90 min. Feed composition as in Figure 2.11, T = 300 °C.
The effect seen at the deactivated catalyst could be split into two parts: a reversible electro-
chemical promotion (EPr) being rather independent of the time of polarization, and an irreversible
electrochemical promotion (EPi) increasing with longer polarization times. The reversible electro-
chemical promotion (EPr) vanishing after an interruption of the current is related to the
steady-state accumulation of promoting species at the gas-exposed catalyst surface.
The irreversible effect (EPi) persisting after interruption of the current is due to the pro-
gressive reduction of oxidized (hence, deactivated) surface sites. It is believed that the applied
positive current raises the rate of rhodium oxide reduction via weakening the Rh-O bond in a way
similar to the case of platinum oxides [21]. As a practical consequence, a current applied with
practically negligible power consumption may efficiently assist the recovery of accidentally lost
catalytic activity at rhodium.
0
1
2
0 90 180time / min
P N2 /
Pa
a
d
A
0
10
20
0 90 180 time / min
P CO
2 / P
a
a
d
B
Metal-support interaction
31
2.2 Metal-support interaction
Metal-support interactions are a phenomenon responsible for changes which occur in the
catalytic activity or selectivity of catalytically active phases when varying the catalyst support
[74-76]. In commercial catalysts, the catalytically active phase usually is dispersed on a highly
porous, high-surface-area (>100 m2/g) support. Such a support, frequently termed carrier, has
pores as small as 0.1 nm and can serve as a substrate for the active phases in a highly dispersed
form. In the early days of catalysis, this porous, high-surface-area support usually was regarded as
inert. It soon became obvious, though, that the catalytic activity in a reaction on a given active
phase often was strongly influenced by crystallite size and by the material of the support. Geome-
try (“structure effects”) did not yield a satisfactory explanation.
Thus, metal-support interactions have been a focal point of extensive research during
recent decades. Typical examples are:
1. the phenomenon of strong metal-support interactions (SMSI) discovered by Tauster et al
[77];
2. the effect of dopant-induced-metal support interactions (DIMSI) studied by Verykios
and coworkers [78];
3. the discovery of highly active Au/SnO2 oxidation catalysts by Haruta and coworkers
[79, 80].
An explanation frequently offered for the nature of MSI are electronic-type interactions
between support and catalyst particles. A concept of electronic interactions associated with the
bulk electronic properties of the two phases in contact (metal crystallites and support materials)
was first proposed by Schwab ([81] and references therein) and Solymosi ([82] and references
therein). This concept is based on metal-semiconductor boundary-layer theory, according to
which thermodynamic equilibrium develops at a metal-semiconductor contact (in the present
case, the interface between the metal crystillites and the support). The equilibrium condition
requires that the Fermi energy levels of the electrons in the two solids be the same. In order for
this to be achieved, charge must be transported from one material to the other. For instance, in
cases where the electron work function of the metal is higher than that of the semiconductor,
charge will flow from the semiconductor to the metal until the Fermi levels at the interface are
equilibrated. The charge transfer process causes significant alterations in the catalytic properties
Chapter 2 Review of relevant basic work (bibliography)
32
and selectivity of the dispersed metal particles. The driving force for charge transfer is the differ-
ence in electrochemical potentials.
2.2.1 Metal-semiconductor boundary layer theory
The condition of thermodynamic equilibrium at a metal-semiconductor contact implies that
the electrochemical potential should be uniform throughout the system. If, prior to contact, the
metal and the semiconductor have different electrochemical potentials, then upon contact, charge
will flow to the material with the smaller potential until the potentials are equalized. When the
two materials carry no net charge, then and , where M and S denote the
metal and the semiconductor, respectively. For ΦM > ΦS the electron flux will be toward the
metal. At equilibrium, the common electrochemical potential will be (similarly to Eq. (2.12):
(2.33)
and
(2.34)
that is, a contact potential difference equal to the work function difference has developed. Quanti-
ties ΨM and ΨS are the outer potential of the metal and the semiconductor, respectively. For
instance, in a situation where ΦM > ΦS, charge is transferred from the semiconductor to the metal.
Electrons transferred to the metal are associated with the interface atoms, while the more
extended region in the semiconductor that is depleted of electrons is characterized by a bending of
the valence and conduction bands [83, 84]. The Schottky barrier, ΦSB, at the interface is given by
(2.35)
It could be shown that for strongly ionic semiconductors, the barrier height will be equal or
proportional to the work function difference [83, 84], just as indicated by Eq. (2.35). It was also
shown that the ideal Schottky theory can be used to describe a metal-TiO2 contact [85]. Experi-
mentally, the barrier height in contacts of TiO2 with metals such as Pd, Pt, or Au in air was found
to be equal to the work function difference [86].
µeM ΦM= µe
SΦS=
µeeq
ΦM– eΨM– ΦS– eΨS–= =
∆Φ e ∆Ψ( )=
ΦSB ΦM ΦS–( ) e⁄=
Metal-support interaction
33
2.2.2 Strong metal-support interactions
In more recent years, the concept of strong metal-support interactions (SMSI) was intro-
duced by Tauster et al [77, 87]. It was observed that Group VIII-metal particles supported on tita-
nia and other reducible oxides lose their ability to chemisorb H2 and CO when they are subjected
to reduction at temperatures higher than 773 K. A number of models have been proposed to
explain the mechanism of this phenomenon, which include formation of intermetallic bonds with
localized charge transfer from the reduced titania support to the metal crystallites [88, 89].
Another model is diffusion of a suboxide species to the surface of the metal crystallites, rendering
them partially inaccessible to chemisorption and catalytic action [76, 90]. A model involving geo-
metric decoration has been shown by many investigators to be most often responsible for the
SMSI state. Direct experimental evidence for the occurrence of metal decoration by TiOx species
has been provided by HREM and XPS [91-93]. In some cases, electronic effects may also be
playing an important role in the phenomenon [93, 94]. Certain similarities with the M/TiO2 cata-
lytic system, but also significant differences are observed for the M/CeO2 system [95].
Recently an alternative interpretation of metal-support interactions was proposed [5, 85,
96] (Section 2.2.3).
2.2.3 Electrochemical promotion and metal-support interactions
Recent experiments in our laboratory have provided evidence that electrochemical promo-
tion and metal-support interactions are phenomena which are functionally identical, and differ
only operationally [96].
For studies of the relation between EPOC and MSI, it was proposed to prepare mixed IrO2-
TiO2 catalysts consisting of micro and nanoparticles of IrO2 (as an active phase) and TiO2 (as an
inert support) in intimate contact. A series of catalyst films of varying composition was prepared
in which the IrO2 loading was kept constant (130 µg/cm2) [96].
A decrease in the effect of electrochemical promotion with increasing TiO2 content is
clearly manifest in Fig. 2.13, which shows plots of the open-circuit (I = 0) and electrochemically
promoted (I = 200 µA) steady-state catalytic rates against film composition. It is worth noting
that:
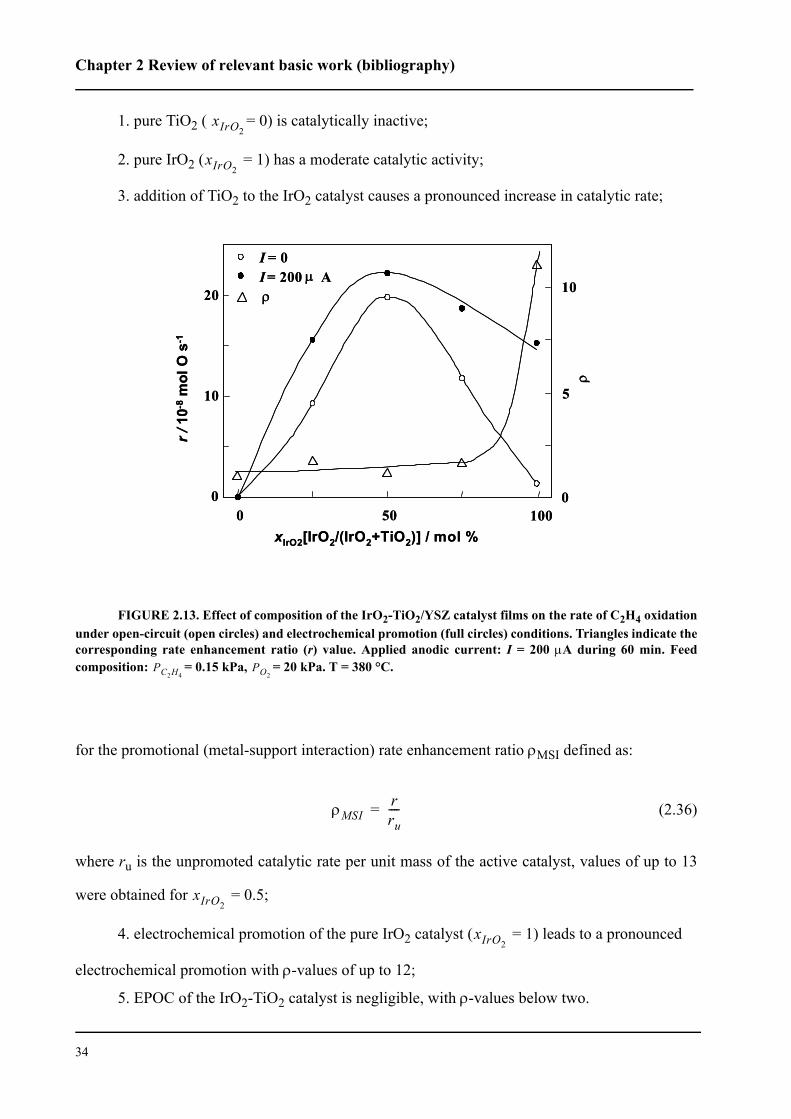
Chapter 2 Review of relevant basic work (bibliography)
34
1. pure TiO2 ( = 0) is catalytically inactive;
2. pure IrO2 ( = 1) has a moderate catalytic activity;
3. addition of TiO2 to the IrO2 catalyst causes a pronounced increase in catalytic rate;
FIGURE 2.13. Effect of composition of the IrO2-TiO2/YSZ catalyst films on the rate of C2H4 oxidationunder open-circuit (open circles) and electrochemical promotion (full circles) conditions. Triangles indicate thecorresponding rate enhancement ratio (r) value. Applied anodic current: I = 200 µA during 60 min. Feedcomposition: = 0.15 kPa, = 20 kPa. T = 380 °C.
for the promotional (metal-support interaction) rate enhancement ratio ρMSI defined as:
(2.36)
where ru is the unpromoted catalytic rate per unit mass of the active catalyst, values of up to 13
were obtained for = 0.5;
4. electrochemical promotion of the pure IrO2 catalyst ( = 1) leads to a pronounced
electrochemical promotion with ρ-values of up to 12;
5. EPOC of the IrO2-TiO2 catalyst is negligible, with ρ-values below two.
xIrO2
xIrO2
0 50 1000
10
20
I = 0I = 200 µ A
0
5
10
ρ
ρ
xIrO2[IrO2/(IrO2+TiO2)] / mol %
r / 1
0-8m
ol O
s-1
0 50 1000
10
20
I = 0I = 200 µ A
0
5
10
ρ
ρ
xIrO2[IrO2/(IrO2+TiO2)] / mol %
r / 1
0-8m
ol O
s-1
PC2H4PO2
ρMSIrru----=
xIrO2
xIrO2
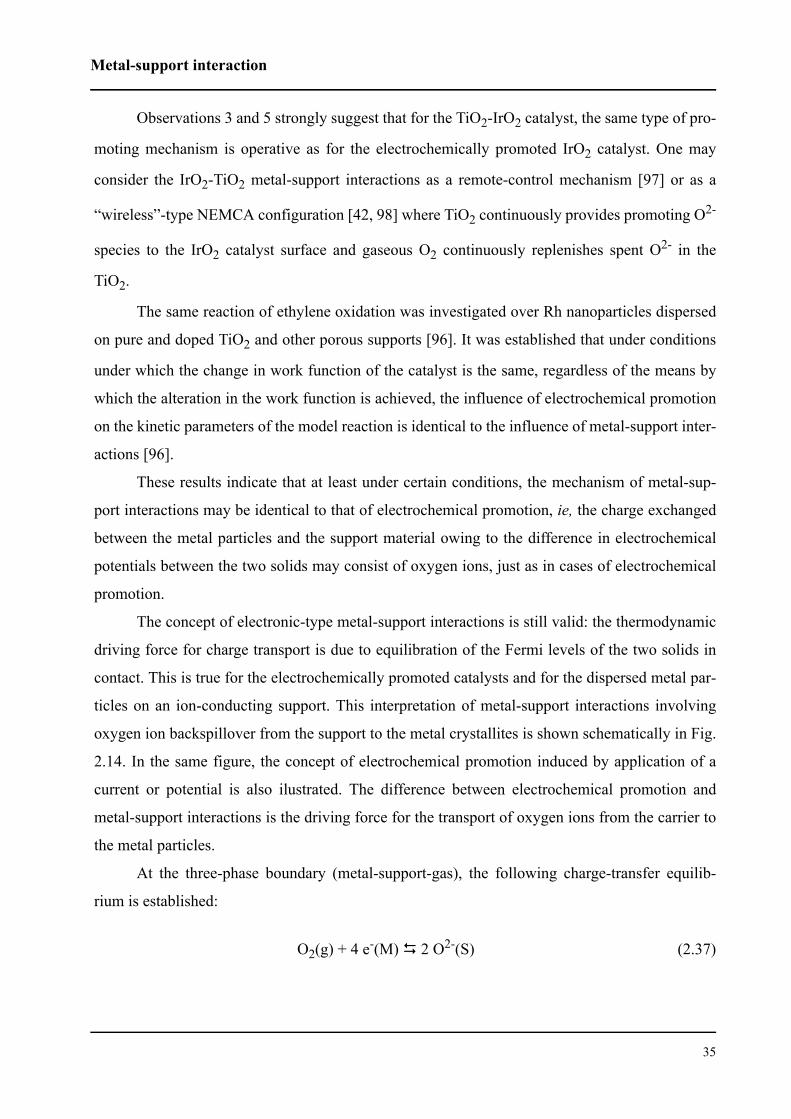
Metal-support interaction
35
Observations 3 and 5 strongly suggest that for the TiO2-IrO2 catalyst, the same type of pro-
moting mechanism is operative as for the electrochemically promoted IrO2 catalyst. One may
consider the IrO2-TiO2 metal-support interactions as a remote-control mechanism [97] or as a
“wireless”-type NEMCA configuration [42, 98] where TiO2 continuously provides promoting O2-
species to the IrO2 catalyst surface and gaseous O2 continuously replenishes spent O2- in the
TiO2.
The same reaction of ethylene oxidation was investigated over Rh nanoparticles dispersed
on pure and doped TiO2 and other porous supports [96]. It was established that under conditions
under which the change in work function of the catalyst is the same, regardless of the means by
which the alteration in the work function is achieved, the influence of electrochemical promotion
on the kinetic parameters of the model reaction is identical to the influence of metal-support inter-
actions [96].
These results indicate that at least under certain conditions, the mechanism of metal-sup-
port interactions may be identical to that of electrochemical promotion, ie, the charge exchanged
between the metal particles and the support material owing to the difference in electrochemical
potentials between the two solids may consist of oxygen ions, just as in cases of electrochemical
promotion.
The concept of electronic-type metal-support interactions is still valid: the thermodynamic
driving force for charge transport is due to equilibration of the Fermi levels of the two solids in
contact. This is true for the electrochemically promoted catalysts and for the dispersed metal par-
ticles on an ion-conducting support. This interpretation of metal-support interactions involving
oxygen ion backspillover from the support to the metal crystallites is shown schematically in Fig.
2.14. In the same figure, the concept of electrochemical promotion induced by application of a
current or potential is also ilustrated. The difference between electrochemical promotion and
metal-support interactions is the driving force for the transport of oxygen ions from the carrier to
the metal particles.
At the three-phase boundary (metal-support-gas), the following charge-transfer equilib-
rium is established:
O2(g) + 4 e-(M) 2 O2-(S) (2.37)
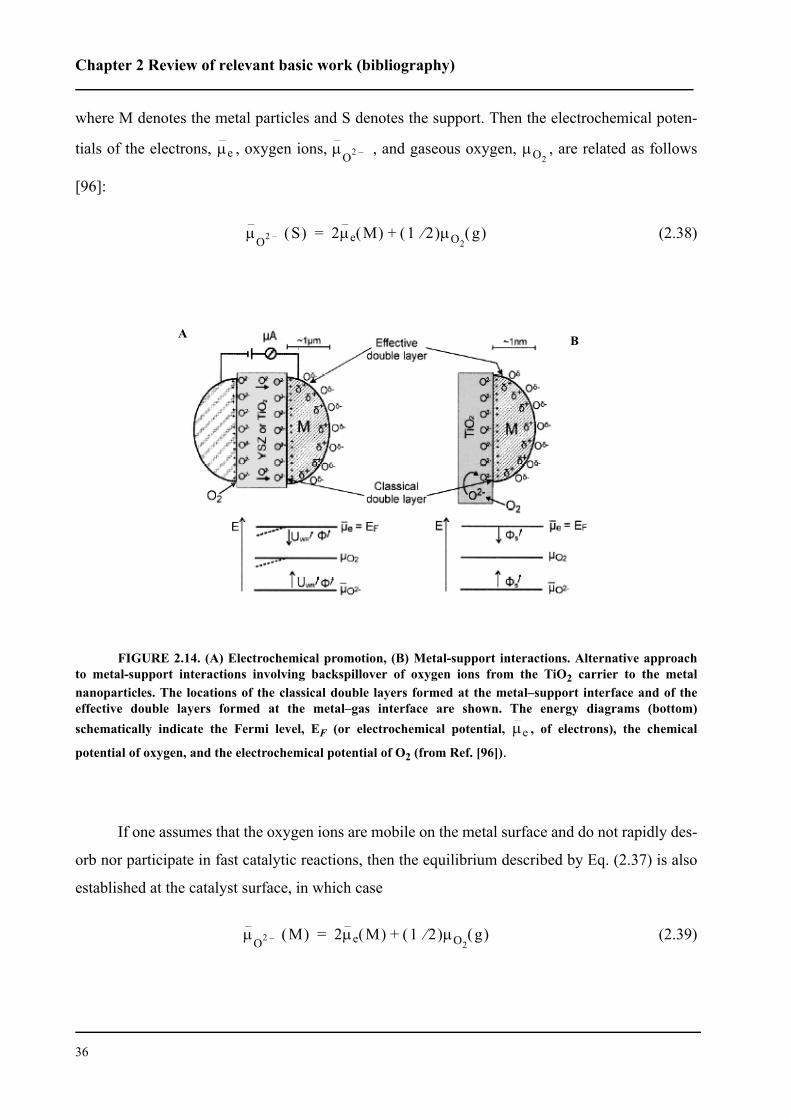
Chapter 2 Review of relevant basic work (bibliography)
36
where M denotes the metal particles and S denotes the support. Then the electrochemical poten-
tials of the electrons, , oxygen ions, , and gaseous oxygen, , are related as follows
[96]:
(2.38)
FIGURE 2.14. (A) Electrochemical promotion, (B) Metal-support interactions. Alternative approachto metal-support interactions involving backspillover of oxygen ions from the TiO2 carrier to the metalnanoparticles. The locations of the classical double layers formed at the metal–support interface and of theeffective double layers formed at the metal–gas interface are shown. The energy diagrams (bottom)schematically indicate the Fermi level, EF (or electrochemical potential, , of electrons), the chemical
potential of oxygen, and the electrochemical potential of O2 (from Ref. [96]).
If one assumes that the oxygen ions are mobile on the metal surface and do not rapidly des-
orb nor participate in fast catalytic reactions, then the equilibrium described by Eq. (2.37) is also
established at the catalyst surface, in which case
(2.39)
µe µO2 – µO2
µO2 – S( ) 2µe M( ) 1 2⁄( )µO2
g( )+=
A B
µe
µO2 – M( ) 2µe M( ) 1 2⁄( )µO2
g( )+=
Metal-support interaction
37
Thus, in the metal-support system the thermodynamic driving force for O2- backspillover
from the support to the metal surface is the difference in electrochemical potentials of the oxygen
ions, [5, 54]. Alternatively, the Fermi levels of the two solids in contact are
equalized by transport of charged carriers, such as oxygen ions. This could occur simultaneously
with the transport of electrons or positive holes, depending on the relative values of electronic and
ionic conductivities of the semiconducting support.
2.2.4 Solid electrolytes
Solid electrolyte should have high ionic conductivity and low electronic conductivity.
Known electrolyte materials mainly differ in the nature of their conductivity, either having pure
ionic or mixed ionic-electronic conductivity. The preparation, properties, and some applications
of solid electrolytes have been discussed in a number of books [99-101] and reviews [102, 103].
The major commercial application of solid electrolytes is in gas sensors [104, 105] and solid-
oxide fuel cells [106, 107]. Solid electrolytes play an increasingly important role in heterogeneous
catalysis, both as nanodispersed catalyst carriers and as supports of thick or thin, electrochemi-
cally promoted films [4, 5, 18-20, 85]. The lowest acceptable ionic conductivity of a solid electro-
lyte in practical fuel cell applications is 0.1 to 1 ohm-1cm-1. This places severe restrictions on the
choice of materials and operating temperatures. For catalytic (promotional) and sensor applica-
tions, however, much lower conductivities (10-4 ohm-1cm-1) usually are sufficient. This implies
that a great variety of solid electrolytes can be used over a very wide temperature range. In pub-
lished electrochemical promotion studies, the following solid electrolytes were used:
(i) Yttria-stabilized-zirconia (YSZ), an O2- conductor at temperatures higher than 280 °C.
(ii) β”-Al2O2 and Na3Zr2Si2PO12 (NASICON), which are Na+ conductors at temperatures
between 180 °C and 400 °C.
(iii) CsHSO4, Ca Zr0.9In0.1O3-α, and Nafion, which are proton conductors at temperatures
between 150 and 25 °C, respectively.
(iv) CaF2, a F- conductor at temperatures between 550 and 700 °C.
(v) Mixed ionic-electronic conductors such as TiO2 and CeO2.
µO2 – S( ) µ
O2 –– M( )
Chapter 2 Review of relevant basic work (bibliography)
38
Other solid electrolytes were also reported [5].
In this section, a short description is provided of some important properties of YSZ and
TiO2 oxide materials that are of interest within the scope of the present thesis.
2.2.4.1 Properties of yttria-stabilized-zirconia
The majority defects in pure ZrO2 are oxygen vacancies Vö and electrons e-, both at very
low concentrations. Lower-valent oxides such as Y2O3 or CaO when added to ZrO2 raise its oxy-
gen vacancy concentration, and thus lead to a much higher ionic conductivity.
For ZrO2 doped with Y2O3, the oxide conductivity is plotted schematically as a function of
the oxygen partial pressure in Fig. 2.15.
The “partial pressure window”, that is, the range of partial pressures over which a com-
pound is an ionic conductor, is relatively wide for the stabilized zirconias, covering about 20 to 30
orders of magnitude around the minimum of electronic conductivity.
The cubic fluorite structure is one of the most important crystal structures in the field of
ionically conducting oxides. It is the structure of the high-temperature form of ZrO2 and of the so-
called stabilized zirconias. At room temperature, ZrO2 has a deformed structure derived from the
fluorite (CaF2) structure. Pure ZrO2 when cooled down from high temperatures undergoes several
phase transitions accompanied by relatively large volume changes.
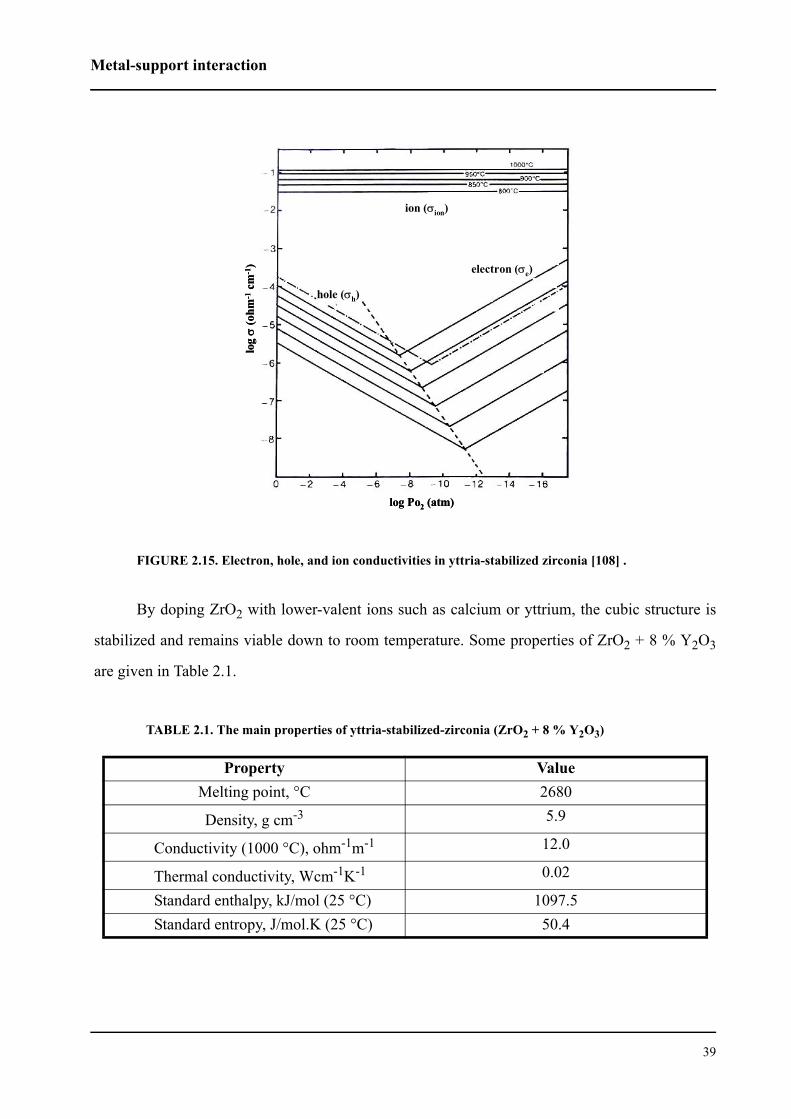
Metal-support interaction
39
FIGURE 2.15. Electron, hole, and ion conductivities in yttria-stabilized zirconia [108] .
By doping ZrO2 with lower-valent ions such as calcium or yttrium, the cubic structure is
stabilized and remains viable down to room temperature. Some properties of ZrO2 + 8 % Y2O3
are given in Table 2.1.
TABLE 2.1. The main properties of yttria-stabilized-zirconia (ZrO2 + 8 % Y2O3)
Property ValueMelting point, °C 2680
Density, g cm-3 5.9
Conductivity (1000 °C), ohm-1m-1 12.0
Thermal conductivity, Wcm-1K-1 0.02
Standard enthalpy, kJ/mol (25 °C) 1097.5Standard entropy, J/mol.K (25 °C) 50.4
log
σ(o
hm-1
cm-1
)
hole (σh)
log Po2 (atm)
ion (σion)
electron (σe)
log
σ(o
hm-1
cm-1
)
hole (σh)
log Po2 (atm)
ion (σion)
electron (σe)
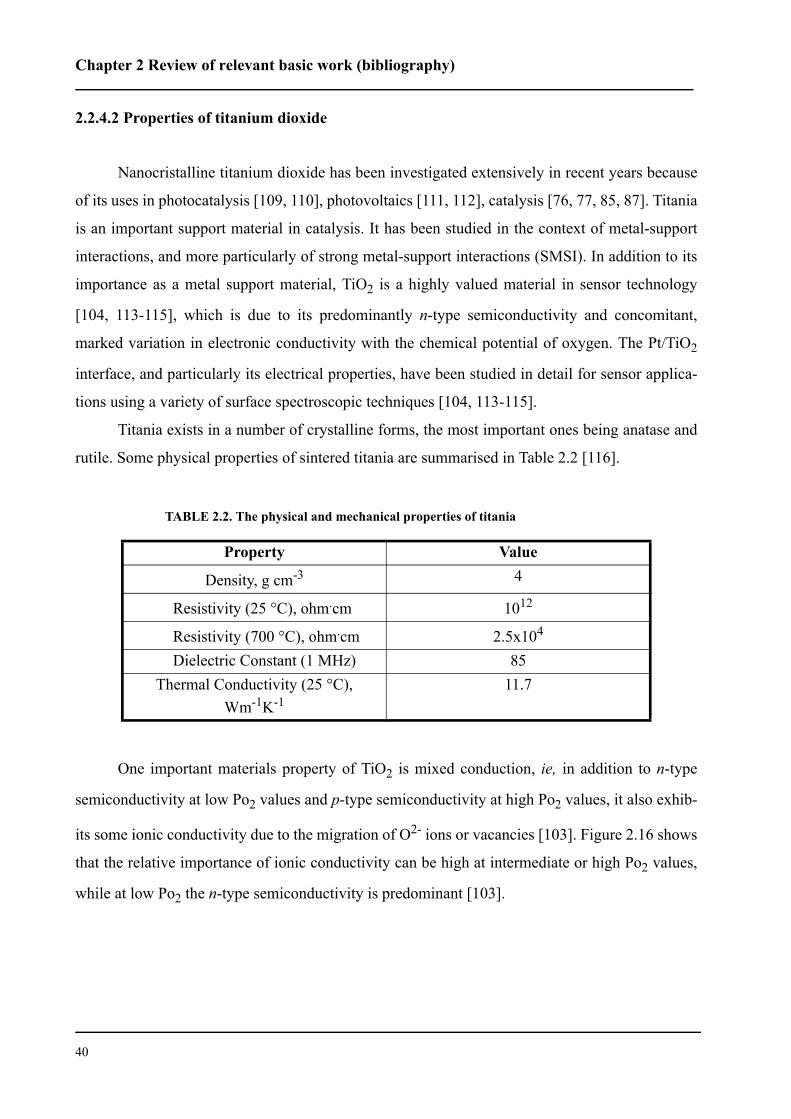
Chapter 2 Review of relevant basic work (bibliography)
40
2.2.4.2 Properties of titanium dioxide
Nanocristalline titanium dioxide has been investigated extensively in recent years because
of its uses in photocatalysis [109, 110], photovoltaics [111, 112], catalysis [76, 77, 85, 87]. Titania
is an important support material in catalysis. It has been studied in the context of metal-support
interactions, and more particularly of strong metal-support interactions (SMSI). In addition to its
importance as a metal support material, TiO2 is a highly valued material in sensor technology
[104, 113-115], which is due to its predominantly n-type semiconductivity and concomitant,
marked variation in electronic conductivity with the chemical potential of oxygen. The Pt/TiO2
interface, and particularly its electrical properties, have been studied in detail for sensor applica-
tions using a variety of surface spectroscopic techniques [104, 113-115].
Titania exists in a number of crystalline forms, the most important ones being anatase and
rutile. Some physical properties of sintered titania are summarised in Table 2.2 [116].
One important materials property of TiO2 is mixed conduction, ie, in addition to n-type
semiconductivity at low Po2 values and p-type semiconductivity at high Po2 values, it also exhib-
its some ionic conductivity due to the migration of O2- ions or vacancies [103]. Figure 2.16 shows
that the relative importance of ionic conductivity can be high at intermediate or high Po2 values,
while at low Po2 the n-type semiconductivity is predominant [103].
TABLE 2.2. The physical and mechanical properties of titania
Property Value
Density, g cm-3 4
Resistivity (25 °C), ohm.cm 1012
Resistivity (700 °C), ohm.cm 2.5x10⁴ Dielectric Constant (1 MHz) 85
Thermal Conductivity (25 °C),Wm-1K-1
11.7
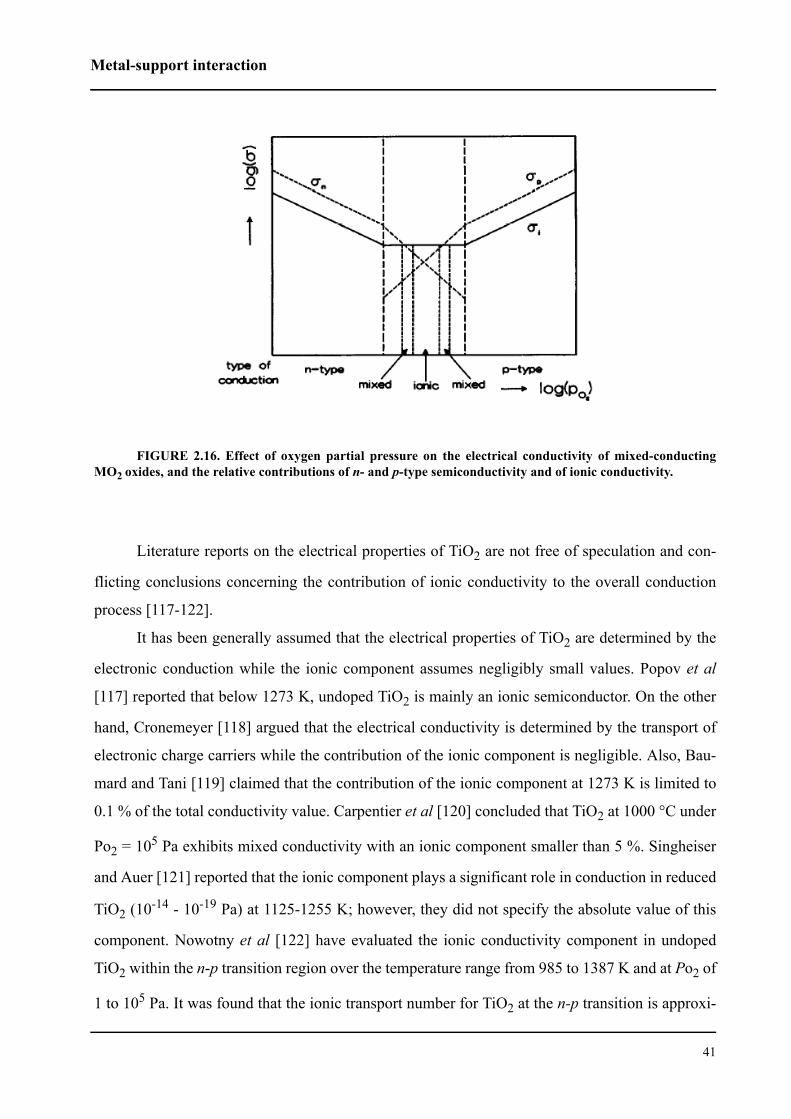
Metal-support interaction
41
FIGURE 2.16. Effect of oxygen partial pressure on the electrical conductivity of mixed-conductingMO2 oxides, and the relative contributions of n- and p-type semiconductivity and of ionic conductivity.
Literature reports on the electrical properties of TiO2 are not free of speculation and con-
flicting conclusions concerning the contribution of ionic conductivity to the overall conduction
process [117-122].
It has been generally assumed that the electrical properties of TiO2 are determined by the
electronic conduction while the ionic component assumes negligibly small values. Popov et al
[117] reported that below 1273 K, undoped TiO2 is mainly an ionic semiconductor. On the other
hand, Cronemeyer [118] argued that the electrical conductivity is determined by the transport of
electronic charge carriers while the contribution of the ionic component is negligible. Also, Bau-
mard and Tani [119] claimed that the contribution of the ionic component at 1273 K is limited to
0.1 % of the total conductivity value. Carpentier et al [120] concluded that TiO2 at 1000 °C under
Po2 = 105 Pa exhibits mixed conductivity with an ionic component smaller than 5 %. Singheiser
and Auer [121] reported that the ionic component plays a significant role in conduction in reduced
TiO2 (10-14 - 10-19 Pa) at 1125-1255 K; however, they did not specify the absolute value of this
component. Nowotny et al [122] have evaluated the ionic conductivity component in undoped
TiO2 within the n-p transition region over the temperature range from 985 to 1387 K and at Po2 of
1 to 105 Pa. It was found that the ionic transport number for TiO2 at the n-p transition is approxi-
Chapter 2 Review of relevant basic work (bibliography)
42
mately 0.5. Another indirect confirmation concerning an ionic component of TiO2 conductivity
was reported by Pliangos et al [16] who studied the Pt/TiO2 system in electrochemical promotion
experiments at 773 K. These authors have shown by work function and XPS measurements in
UHV that under oxidizing conditions, TiO2 partly behaves as a solid electrolyte due to O2- con-
duction, and can be electropromoted. Under reducing conditions in UHV, the n-type conductivity
of TiO2 is predominant, and hence the Pt-TiO2 contact is totally ohmic. Under these conditions
electrochemistry is inoperative.
It is well known that TiO2 conductivity depends on the oxidation state of Ti, and the series
TiO2-Ti2O3-TiO-Ti is an interesting oxide system in which the progressive transition from insula-
tor to metal is accomplished by reduction [116]. In fact, TiO2 is readily reduced by hydrogen at
relatively moderate temperatures (T > 400 °C). TiOx is a degenerate semiconductor with a very
high carrier concentration, and the high electrical resistivity of TiO2 (1010 ohm.cm) dramatically
decreases upon partial reduction, see Fig. 2.17 [116, 123, 124].
FIGURE 2.17. Conductivity of TiOx as a function of x [116].
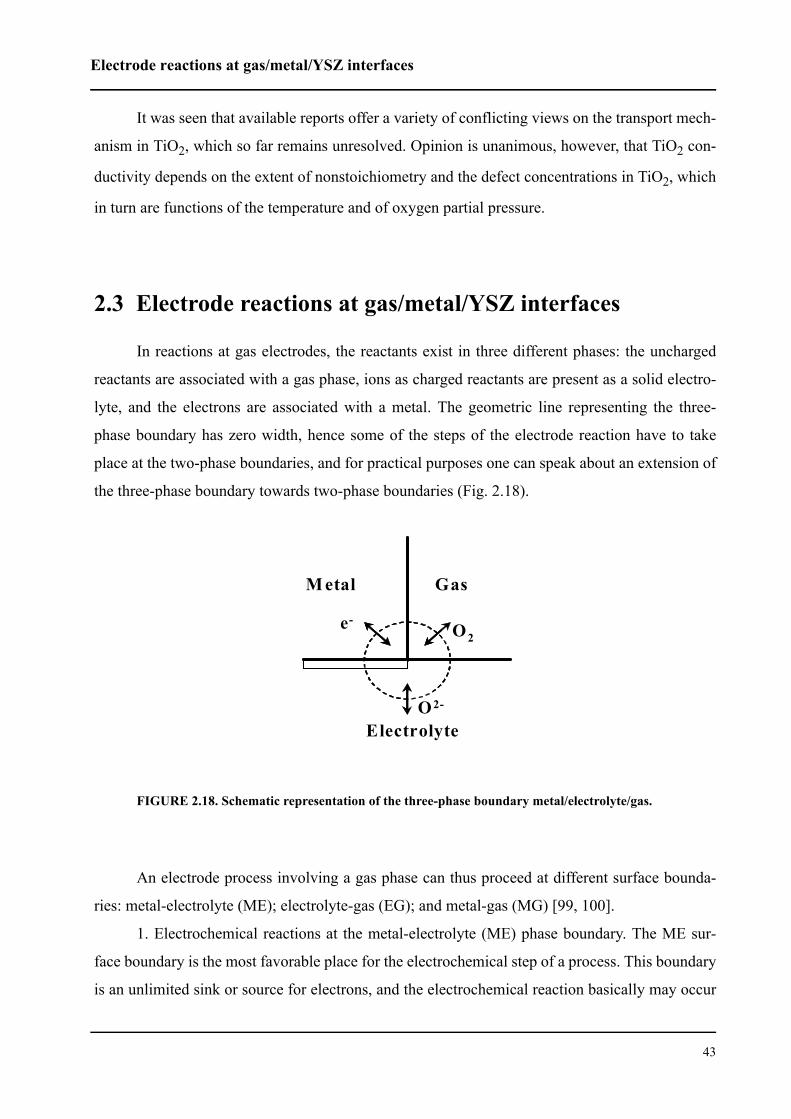
Electrode reactions at gas/metal/YSZ interfaces
43
It was seen that available reports offer a variety of conflicting views on the transport mech-
anism in TiO2, which so far remains unresolved. Opinion is unanimous, however, that TiO2 con-
ductivity depends on the extent of nonstoichiometry and the defect concentrations in TiO2, which
in turn are functions of the temperature and of oxygen partial pressure.
2.3 Electrode reactions at gas/metal/YSZ interfaces
In reactions at gas electrodes, the reactants exist in three different phases: the uncharged
reactants are associated with a gas phase, ions as charged reactants are present as a solid electro-
lyte, and the electrons are associated with a metal. The geometric line representing the three-
phase boundary has zero width, hence some of the steps of the electrode reaction have to take
place at the two-phase boundaries, and for practical purposes one can speak about an extension of
the three-phase boundary towards two-phase boundaries (Fig. 2.18).
FIGURE 2.18. Schematic representation of the three-phase boundary metal/electrolyte/gas.
An electrode process involving a gas phase can thus proceed at different surface bounda-
ries: metal-electrolyte (ME); electrolyte-gas (EG); and metal-gas (MG) [99, 100].
1. Electrochemical reactions at the metal-electrolyte (ME) phase boundary. The ME sur-
face boundary is the most favorable place for the electrochemical step of a process. This boundary
is an unlimited sink or source for electrons, and the electrochemical reaction basically may occur
O2-
e-
Gas
O2
M etal
ElectrolyteO2-
e-
Gas
O2
M etal
Electrolyte
Chapter 2 Review of relevant basic work (bibliography)
44
over the entire surface of the electrolyte, which serves to decrease the electrode’s polarization and
contact resistance.
The higher the diffusion rate of electrochemically active species and the smaller the rate of
discharge process, the longer will be the distance over which the reaction is spread out along the
ME boundary from the three-phase boundary (MEG). Electrochemically active species are sup-
plied to the boundary of electrolyte and metal or withdrawn in the three-phase boundary through
the EG and MG surfaces. At these boundaries, active species are exchanged with a gas phase
through adsorption and desorption processes. This process scheme can be realized on an anode as
well as on a cathode.
It must be asked whether gas atoms can diffuse into the interface region between electrode
and electrolyte and, if so, whether the diffusivity is the same as that measured for a gas over the
free and clean surface of a metal crystal. It appears reasonable to expect that, as long as there is no
strong chemical bonding between the metal electrode and the electrolyte, gas atoms should have
no difficulty in diffusing along the interface, and do so with a diffusivity that is similar (at least in
order of magnitude) to that at the free surface [125].
2. Electrochemical reactions at the electrolyte-gas (EG) surface boundary. For an electro-
chemical reaction to occur at the EG interface, diffusion of electrons along the boundary is
required. The electrochemically active species can be supplied, either directly from the gas phase
or from an adsorbed layer at the MG boundary. Typically, solid electrolytes have very low elec-
tronic conductivity, and thus a very low electronic surface conductivity. Therefore, this process is
hampered by a lack of electrons at the EG interface.
3. Electrochemical reactions at the metal-gas (MG) surface boundary. For an electrode
reaction to occur at the MG interface, ions must be supplied to it by diffusion. This implies an
extension of the reaction zone toward the gas-exposed electrode surface. Mechanisms of this type
have often been described in the literature on electrochemical promotion [5]. This extension of
the reaction zone means that an effective double layer is developed along the gas-exposed elec-
trode surface. Once this effective double layer is formed, the reaction can take place at the metal-
gas interface.
Electrode reactions at gas/metal/YSZ interfaces
45
2.3.1 Oxygen electrode O2, M/YSZ
Solid-electrolyte electrochemical cells are widely used as high-temperature oxygen sen-
sors, as solid-oxide fuel cells and, as shown before, in electrochemical promotion experiments.
Interest in these devices has motivated a large number of investigations into the kinetics and
mechanism of the most common electrochemical reaction, viz, oxygen oxidation/reduction at O2,
M/solid electrolyte interfaces. The overall reaction in an O2, M/YSZ cell can be written as:
1/2 O2(g) + 2 e- O2- (2.40)
or, using Kröger-Vink notation, as:
1/2 O2(g) + 2 e- + Vö Oox (2.41)
where Vö and Oox are a doubly charged oxygen vacancy and an oxygen atom, respectively, both
located at a normal oxygen site in the electrolyte.
A variety of kinetic studies have been performed over the last three decades, and many
kinetic models have been proposed in the literature to explain the mechanism of this electrode
reaction at O2, M/solid electrolyte interfaces between Pt, Au, Ag, and Pd as the metal and YSZ
and doped ceria as the electrolyte [99, 100, 125-135]. The geometric complexity of the various
metal electrodes complicates the kinetics of the oxygen reactions, and to date no consensus has
emerged as to the details of the reaction mechanism.
One of the systems most thoroughly studied in solid-state electrochemistry is the O2/Pt/
solid-electrolyte electrochemical cell. It is generally accepted that oxygen reduction at Pt occurs
in several steps of which any one may be rate determining:
(i) Gas-phase diffusion from the bulk gas into a Pt pore (Eq. (2.42)) as well as gas-phase
diffusion within the open Pt pore system (Eq. (2.43)):
O2(g) O2(Pt-pores) (2.42)
O2(Pt-pores,1) O2(Pt-pores,2) (2.43)
Gas-phase diffusion has been suggested to be rate-limiting in references [136, 137].
(ii) Oxygen may then dissociatively adsorb on the electrode:
Chapter 2 Review of relevant basic work (bibliography)
46
O2(Pt-pores) 2 O(MG) (2.44)
Dissociative adsorption is known to be the common mode of adsorption for oxygen on most tran-
sition metals at high temperatures [138], and was suggested to contribute to the rate-determining
step in reference [139].
(iii) The adsorbed oxygen atoms may diffuse to a three-phase boundary O(MEG) :
O(MG) O(MEG) (2.45)
O(MEG) O(ERS) (2.46)
and, further, along the electrode/electrolyte interface (“laterally”) to an electrochemical reaction
site (OERS). Surface diffusion of atomic oxygen has been suggested as being rate-determining in
[131, 137, 140], lateral diffusion has been suggested as being rate-determining in [99, 125, 129].
At the electrochemical reaction site (ERS), adsorbed oxygen atoms pick up charge and
enter the electrolyte:
O(ERS) +2 e- O2- (2.47)
Equation (2.47) represents an overall charge transfer reaction that may itself consist of sev-
eral elementary reactions. It represents a cathodic current in the forward direction, and an anodic
current in the reverse direction.
Disagreement exists as to the location of the ERS; they might be located in the three-phase
boundary (MEG) or in the more extensive two-phase boundary (ME). Two distinct models have
in fact been proposed for the electrode reaction, one which places the ERS at the three-phase
boundary MEG, and one that places the ERS into the two-dimensional interface between the elec-
trode and the electrolyte. They are shown schematically in Fig. 2.19 as models I and II, respec-
tively [132].
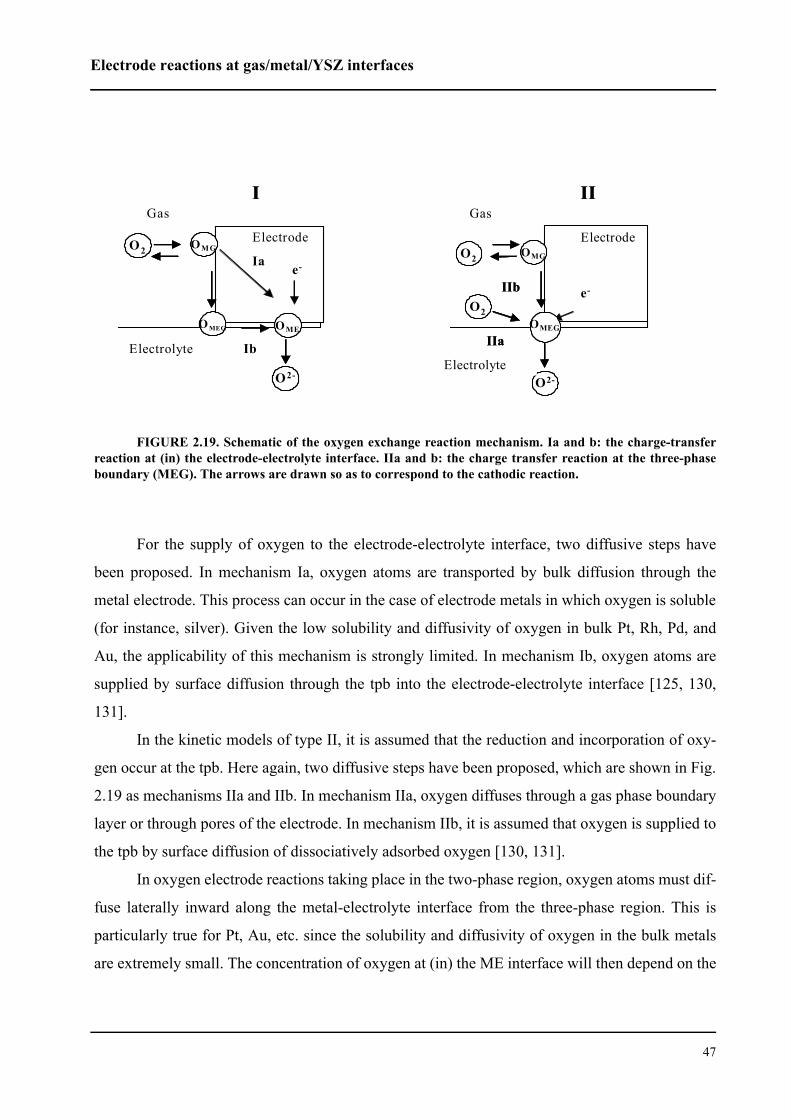
Electrode reactions at gas/metal/YSZ interfaces
47
For the supply of oxygen to the electrode-electrolyte interface, two diffusive steps have
been proposed. In mechanism Ia, oxygen atoms are transported by bulk diffusion through the
metal electrode. This process can occur in the case of electrode metals in which oxygen is soluble
(for instance, silver). Given the low solubility and diffusivity of oxygen in bulk Pt, Rh, Pd, and
Au, the applicability of this mechanism is strongly limited. In mechanism Ib, oxygen atoms are
supplied by surface diffusion through the tpb into the electrode-electrolyte interface [125, 130,
131].
In the kinetic models of type II, it is assumed that the reduction and incorporation of oxy-
gen occur at the tpb. Here again, two diffusive steps have been proposed, which are shown in Fig.
2.19 as mechanisms IIa and IIb. In mechanism IIa, oxygen diffuses through a gas phase boundary
layer or through pores of the electrode. In mechanism IIb, it is assumed that oxygen is supplied to
the tpb by surface diffusion of dissociatively adsorbed oxygen [130, 131].
In oxygen electrode reactions taking place in the two-phase region, oxygen atoms must dif-
fuse laterally inward along the metal-electrolyte interface from the three-phase region. This is
particularly true for Pt, Au, etc. since the solubility and diffusivity of oxygen in the bulk metals
are extremely small. The concentration of oxygen at (in) the ME interface will then depend on the
FIGURE 2.19. Schematic of the oxygen exchange reaction mechanism. Ia and b: the charge-transferreaction at (in) the electrode-electrolyte interface. IIa and b: the charge transfer reaction at the three-phaseboundary (MEG). The arrows are drawn so as to correspond to the cathodic reaction.
Electrode
Gas
Electrolyte
e-Ia
Ib
I
OME
OMGO2
O2-
O MEG
Electrode
Gas
Electrolyte
e-Ia
Ib
I
OMEOME
OMGOMGO2O2
O2-O2-
O MEGO MEG
e-
IIa
II
IIb
ElectrodeOMGO2
OMEG
O2-Electrolyte
O2
Gas
e-
IIa
II
IIb
ElectrodeOMGOMGO2O2
OMEGOMEG
O2-O2-Electrolyte
O2O2
Gas
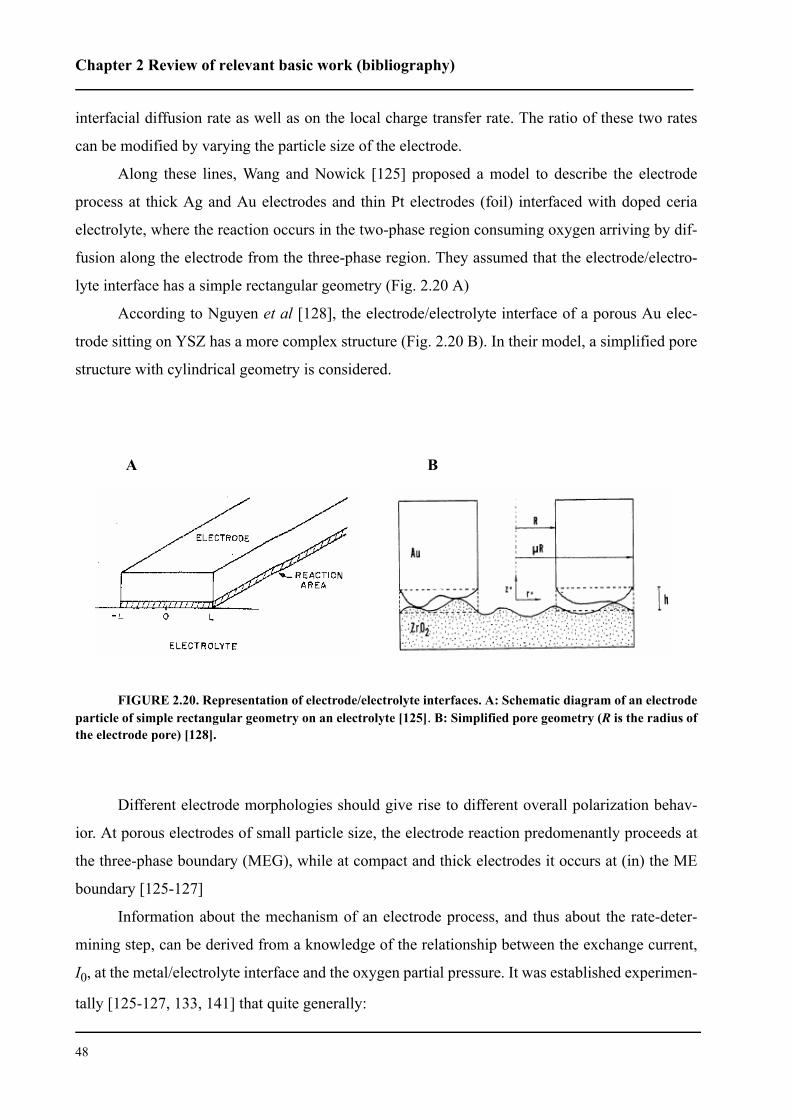
Chapter 2 Review of relevant basic work (bibliography)
48
interfacial diffusion rate as well as on the local charge transfer rate. The ratio of these two rates
can be modified by varying the particle size of the electrode.
Along these lines, Wang and Nowick [125] proposed a model to describe the electrode
process at thick Ag and Au electrodes and thin Pt electrodes (foil) interfaced with doped ceria
electrolyte, where the reaction occurs in the two-phase region consuming oxygen arriving by dif-
fusion along the electrode from the three-phase region. They assumed that the electrode/electro-
lyte interface has a simple rectangular geometry (Fig. 2.20 A)
According to Nguyen et al [128], the electrode/electrolyte interface of a porous Au elec-
trode sitting on YSZ has a more complex structure (Fig. 2.20 B). In their model, a simplified pore
structure with cylindrical geometry is considered.
Different electrode morphologies should give rise to different overall polarization behav-
ior. At porous electrodes of small particle size, the electrode reaction predomenantly proceeds at
the three-phase boundary (MEG), while at compact and thick electrodes it occurs at (in) the ME
boundary [125-127]
Information about the mechanism of an electrode process, and thus about the rate-deter-
mining step, can be derived from a knowledge of the relationship between the exchange current,
I0, at the metal/electrolyte interface and the oxygen partial pressure. It was established experimen-
tally [125-127, 133, 141] that quite generally:
A B
FIGURE 2.20. Representation of electrode/electrolyte interfaces. A: Schematic diagram of an electrodeparticle of simple rectangular geometry on an electrolyte [125]. B: Simplified pore geometry (R is the radius ofthe electrode pore) [128].
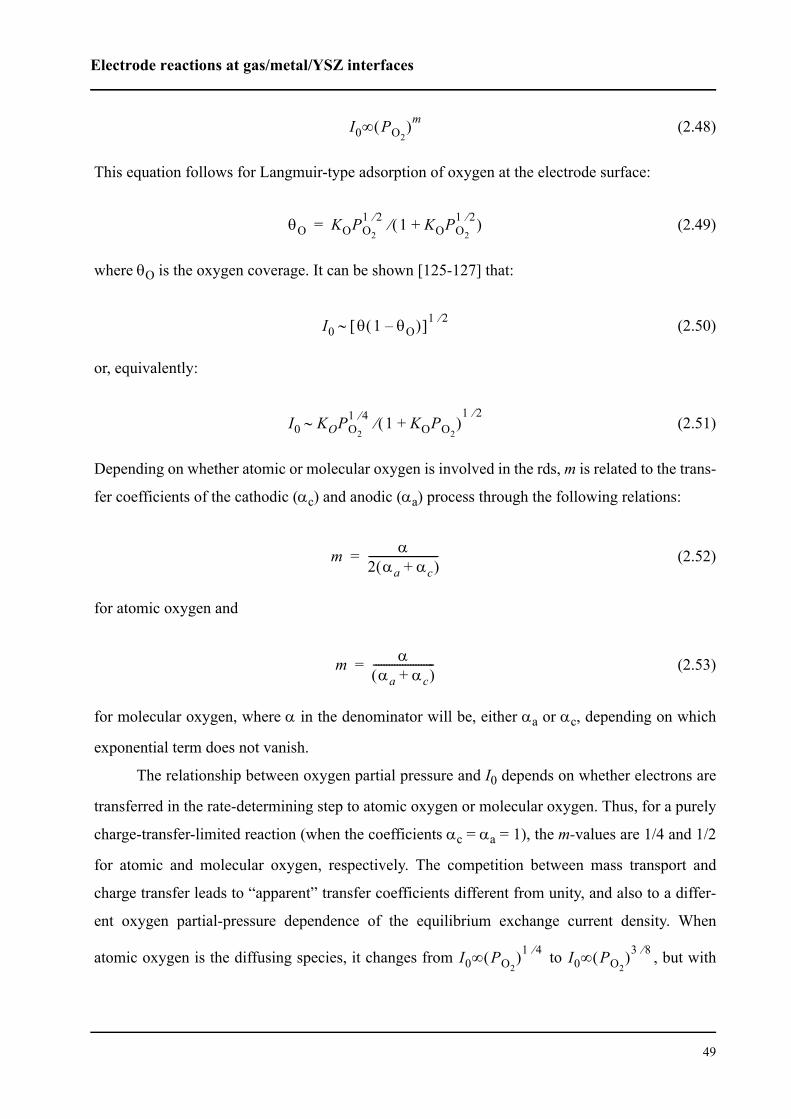
Electrode reactions at gas/metal/YSZ interfaces
49
(2.48)
This equation follows for Langmuir-type adsorption of oxygen at the electrode surface:
(2.49)
where θO is the oxygen coverage. It can be shown [125-127] that:
(2.50)
or, equivalently:
(2.51)
Depending on whether atomic or molecular oxygen is involved in the rds, m is related to the trans-
fer coefficients of the cathodic (αc) and anodic (αa) process through the following relations:
(2.52)
for atomic oxygen and
(2.53)
for molecular oxygen, where α in the denominator will be, either αa or αc, depending on which
exponential term does not vanish.
The relationship between oxygen partial pressure and I0 depends on whether electrons are
transferred in the rate-determining step to atomic oxygen or molecular oxygen. Thus, for a purely
charge-transfer-limited reaction (when the coefficients αc = αa = 1), the m-values are 1/4 and 1/2
for atomic and molecular oxygen, respectively. The competition between mass transport and
charge transfer leads to “apparent” transfer coefficients different from unity, and also to a differ-
ent oxygen partial-pressure dependence of the equilibrium exchange current density. When
atomic oxygen is the diffusing species, it changes from to , but with
I0∞ PO2( )m
θO KOPO2
1 2⁄ 1 KOPO2
1 2⁄+( )⁄=
I0 θ 1 θO–( )[ ]1 2⁄∼
I0 KOPO2
1 4⁄ 1 KOPO2+( )⁄
1 2⁄∼
m α2 αa αc+( )--------------------------=
m ααa αc+( )
-----------------------=
I0∞ PO2( )1 4⁄ I0∞ PO2
( )3 8⁄
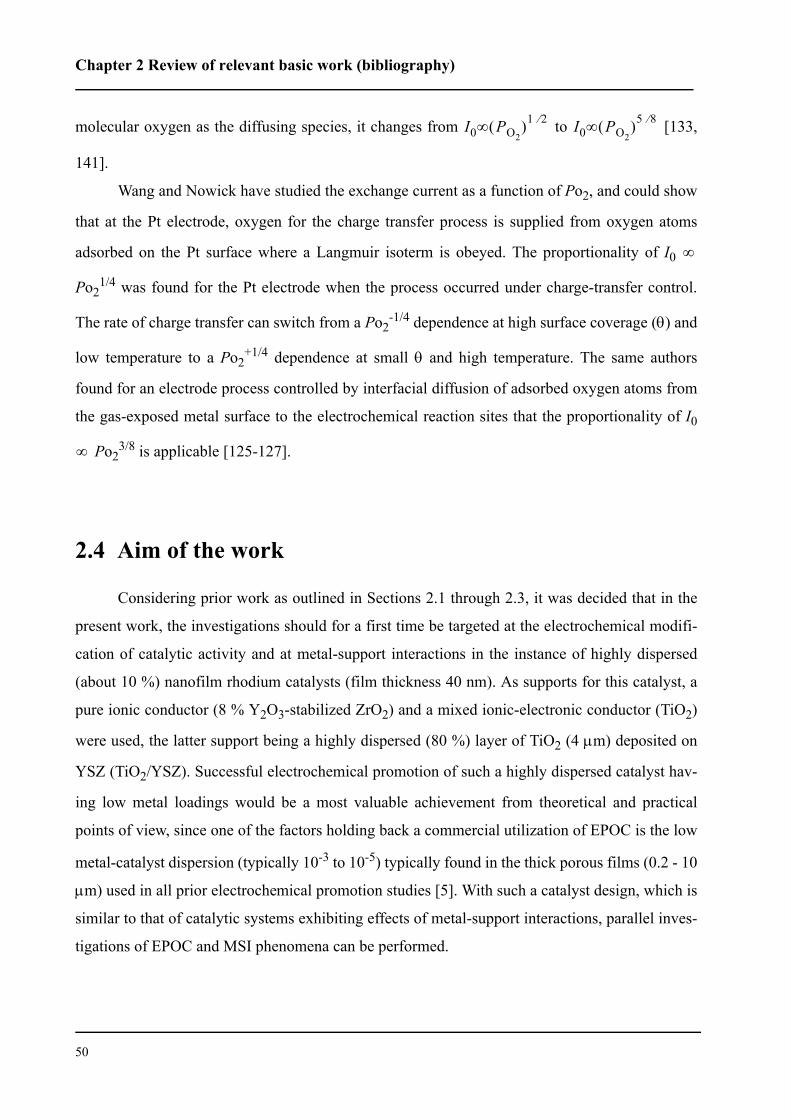
Chapter 2 Review of relevant basic work (bibliography)
50
molecular oxygen as the diffusing species, it changes from to [133,
141].
Wang and Nowick have studied the exchange current as a function of Po2, and could show
that at the Pt electrode, oxygen for the charge transfer process is supplied from oxygen atoms
adsorbed on the Pt surface where a Langmuir isoterm is obeyed. The proportionality of I0
Po21/4 was found for the Pt electrode when the process occurred under charge-transfer control.
The rate of charge transfer can switch from a Po2-1/4 dependence at high surface coverage (θ) and
low temperature to a Po2+1/4 dependence at small θ and high temperature. The same authors
found for an electrode process controlled by interfacial diffusion of adsorbed oxygen atoms from
the gas-exposed metal surface to the electrochemical reaction sites that the proportionality of I0
Po23/8 is applicable [125-127].
2.4 Aim of the work
Considering prior work as outlined in Sections 2.1 through 2.3, it was decided that in the
present work, the investigations should for a first time be targeted at the electrochemical modifi-
cation of catalytic activity and at metal-support interactions in the instance of highly dispersed
(about 10 %) nanofilm rhodium catalysts (film thickness 40 nm). As supports for this catalyst, a
pure ionic conductor (8 % Y2O3-stabilized ZrO2) and a mixed ionic-electronic conductor (TiO2)
were used, the latter support being a highly dispersed (80 %) layer of TiO2 (4 µm) deposited on
YSZ (TiO2/YSZ). Successful electrochemical promotion of such a highly dispersed catalyst hav-
ing low metal loadings would be a most valuable achievement from theoretical and practical
points of view, since one of the factors holding back a commercial utilization of EPOC is the low
metal-catalyst dispersion (typically 10-3 to 10-5) typically found in the thick porous films (0.2 - 10
µm) used in all prior electrochemical promotion studies [5]. With such a catalyst design, which is
similar to that of catalytic systems exhibiting effects of metal-support interactions, parallel inves-
tigations of EPOC and MSI phenomena can be performed.
I0∞ PO2( )1 2⁄ I0∞ PO2
( )5 8⁄
∞
∞
References
51
2.5 References
1. M. Stoukides and C. G. Vayenas, J. Catal., 70 (1981) 137.
2. C. G. Vayenas, S. Bebelis, and S. G. Neophytides, J. Phys. Chem., 92 (1988) 5083.
3. C. G. Vayenas, S. Bebelis, S. G. Neophytides, and I. V. Yentekakis, Nature, 343
(1990) 625.
4. C. G. Vayenas, M. M. Jaksic, S. I. Bebelis, and S. G. Neophytides, in Modern
aspects of Electrochemistry J. O. M. Bockris, B. E. Conway, and R. E. White, eds.,
Plenum Press, New York, (1996), p. 57.
5. C. G. Vayenas, S. Bebelis, C. Pliangos, S. Brosda, and D. Tsiplakides, Electro-
chemical activation of catalysis. Promotion, Electrochemical promotion, and
metal-support interaction. Kluwer Academic/Plenum Publishers, New York
(2001).
6. J. O. M. Bockris, A. K. N. Reddy, and M. Gamboa-Aldecco, Kluwer Academic/
Plenum, New York (2000).
7. K. Juttner, U. Galla, and H. Schmieder, Elecrochim. Acta, 45 (2000) 2575.
8. G. Ertl, H. Knötzinger, and J. Weitkamp, Hand Book of Catalysis VCH, Weinheim
(1997).
9. J. Pritchard, Nature, 343 (1990) 592.
10. C. G. Vayenas, S. Brosda, and C. Pliangos, J. Catal., 216 (2003) 487.
11. C. G. Vayenas, S. Bebelis, and S. Despotopoulou, J. Catal., 128 (1991) 415.
12. I. V. Yentekakis and C. G. Vayenas, J. Catal., 149 (1994) 238.
13. M. Makri, A. Buekenhoudt, J. Luyten, and C. G. Vayenas, Ionics, 2 (1996) 282.
14. T. I. Politova, V. A. Sobyanin, and V. D. Belyaev, React. Kinet. Catal. Lett, 41
(1990) 321.
15. D. Tsiplakides, S. G. Neophytides, O. Enea, M. M. Jaksic, and C. G. Vayenas, J.
Electrochem. Soc, 144 (1997) 2072.
16. C. Pliangos, I. V. Yentekakis, S. Ladas, and C. G. Vayenas, J. Catal., 1996 (1996)
189.
17. P. D. Petrolekas, S. Balamenou, and C. G. Vayenas, J. Electrochem. Soc, 145
(1998) 1202.
18. C. G. Vayenas, S. Bebelis, C. Pliangos, and S. G. Neophytides, The electrochemical
activation of catalysis Kluwer Acadenic/Plenum Publishers, New York (1996).
Chapter 2 Review of relevant basic work (bibliography)
52
19. G. Fóti, I. Bolzonella, and C. Comninellis, in Modern Aspects of electrochemistry,
Vol. 36 C. G. Vayenas, B. E. Conway, R. E. White, and M. E. Gamboa-Adelco,
eds., Kluwer Academic / Plenum Publisher, New York, Boston, Dordrecht, Lon-
don, Moscow, (2003), p. 310.
20. R. M. Lambert, F. Williams, A. Palermo, and M. S. Tikhov, Topics in Catalysis, 13
(2000) 91.
21. S. G. Neophytides and C. G. Vayenas, J. Phys. Chem., 99 (1995) 1763.
22. J. Nicole and C. Comninellis, Solid State Ionics, 136-137 (2000) 687.
23. D. Tsiplakides and C. G. Vayenas, J. Electrochem. Soc, 148 (2001) E189.
24. S. Wodiunig, Electrochemical promotion of RuO2 catalysts for the gas phase com-
bustion of ethylene. Thesis No 3138, EPFL, Lausanne, (2000).
25. D. Kek, N. Bonanos, M. Mogensen, and S. Pejovnik, Solid State Ionics, 131 (2000)
249.
26. A. D. Frantzis, S. Bebelis, and C. G. Vayenas, Solid State Ionics, 136-137 (2000)
863.
27. I. R. Harkness and R. M. Lambert, J. Catal., 152 (1995) 211.
28. T. Arakawa, A. Saito, and J. Shiokawa, Appl. Surf. Sci, 16 (1983) 365.
29. T. Arakawa, A. Saito, and J. Shiokawa, Chem. Phys. Lett, 94 (1983) 250.
30. S. Ladas, S. Bebelis, and C. G. Vayenas, Surf. Sci., 251-252 (1991) 1062.
31. S. G. Neophytides, D. Tsiplakides, and C. G. Vayenas, J. Catal., 1998 (1998) 414.
32. D. Tsiplakides and C. G. Vayenas, J. Catal., 185 (1999) 237.
33. D. Tsiplakides, S. G. Neophytides, and C. G. Vayenas, Solid State Ionics, 136-137
(2000) 839.
34. S. Wodiunig and C. Comninellis, J. Eur. Ceram. Soc., 19 (1999) 931.
35. A. Katsaounis, Z. Nikopoulou, X. E. Verykios, and C. G. Vayenas, J. Catal., 222
(2004) 192.
36. A. Katsaounis, Z. Nikopoulou, X. E. Verykios, and C. G. Vayenas, J. Catal., 226
(2004) 197.
37. F. Tietz, C. Papadelis, D. Tsiplakides, A. Katsaounis, and C. G. Vayenas, Ionics, 7
(2001) 101.
38. J. Poppe, S. Völkening, A. Schaak, J. Janek, and R. Imbihl, Phys. Chem. Chem.
Phys., 1 (1999) 5241.
References
53
39. H. Chritensen, J. Dinesen, H. H. Engell, and K. K. Hansen, SAE, SP-1414 (1999)
225.
40. J. Dinesen, S. S. Nissen, and H. Chritensen, SAE, SP-1313 (1998) 197.
41. H. Chritensen, J. Dinesen, H. H. Engell, L. C. Larsen, K. K. Hansen, and E. M.
Skou, SAE, SP-1497 (2000) 141.
42. S. Wodiunig, F. Bokeloh, J. Nicole, and C. Comninellis, Elecrochem. Solid-State
Lett., 2 (1999) 281.
43. S. Balamenou, D. Tsiplakides, A. Katsaounis, S. Thiemann-Handler, B. Cramer, G.
Fóti, C. Comninellis, and C. G. Vayenas, Applied Catalysis B: Environmental, 52
(2004) 181.
44. T. Rebitzki, B. Delmon, and J. H. Block, AIShE J, 41 (1995) 1543.
45. F. M. Faus, B. Zhou, H. Matralis, and B. Delmon, J. Catal., 132 (1991) 200.
46. C. G. Vayenas, Solid State Ionics, 168 (2004) 321.
47. G. Fóti, S. Wodiunig, and C. Comninellis, Current topics in Electrochemistry, 7
(2000) 1.
48. I. S. Metcalfe, J. Catal., 199 (2001) 247.
49. S. Trasatti, Electrochim. Acta, 36 (1991) 1659.
50. C. G. Vayenas, S. Brosda, and C. Pliangos, J. Catal., 203 (2001) 329.
51. S. Brosda and C. G. Vayenas, J. Catal., 208 (2002) 38.
52. C. G. Vayenas, S. Bebelis, and S. Ladas, Nature, 323 (1990) 625.
53. C. G. Vayenas and D. Tsiplakides, Surf. Sci., 467 (2000) 23.
54. C. G. Vayenas, J. Electroanal. Chem., 486 (2000) 85.
55. I. Riess and C. G. Vayenas, Solid State Ionics, 159 (2003) 313.
56. J. Nicole, D. Tsiplakides, S. Wodiunig, and C. Comninellis, J. Electrochem. Soc,
144 (1997) L312.
57. J. Nicole, Etude de la Promotion Electrochimique de l'Oxydation Catalytique de
l'Ethylène sur des Oxydes Métalliques. Thesis No 1933, EPFL, Lausanne, (1999).
58. W. Zipprich, H.-D. Wiemhöfer, U. Vohrer, and W. Göpel, Ber. Bunsenges. Phys.
Chem., 99 (1998) 1406.
59. F. J. Williams and C. M. Aldao, Surf. Sci., 425 (1999) L387.
60. R. Parsons, J. Electroanal. Chem., 486 (2000) 91.
61. P. M. Leiva and C. G. Sánchez, J. Solid State Electrochem, 7 (2003) 588.
Chapter 2 Review of relevant basic work (bibliography)
54
62. J. C. Rivière, Solid State Surface Science Marcel Dekker, New York (1969).
63. K. Besocke and S. Berger, Rev. Sci. Instrum., 47 (1976) 840.
64. N. A. Surplice and R. J. D'Arcy, J. Phys. E., 3 (1970) 477.
65. S. Wodiunig, C. Comninellis, and C. Mousty, in Energy and Electrochemical
Processing for a Cleaner Environment., The Electrochemical Society Proceedings
Series: PV 97 28 E. J. Rudd and C. W. Walton, eds., Pennington, (1997), p. 147.
66. J. Nicole and C. Comninellis, J. Appl. Electrochem., 28 (1998) 223.
67. G. Fóti, O. Lavanchy, and C. Comninellis, J. Appl. Electrochem., 30 (2000) 1223.
68. C. Pliangos, C. Raptis, T. Badas, and C. G. Vayenas, Solid State Ionics, 136-137
(2000) 767.
69. C. Pliangos, C. Raptis, T. Badas, and C. G. Vayenas, Ionics, 6 (2000) 119.
70. C. Pliangos, I. V. Yentekakis, X. E. Verykios, and C. G. Vayenas, J. Catal., 154
(1995) 124.
71. C. Pliangos, I. V. Yentekakis, V. G. Papadakis, C. G. Vayenas, and X. E. Verykios,
Applied Catalysis B: Environmental, 14 (1997) 161.
72. T. Ioannides and X. E. Verykios, J. Catal., 161 (1996) 560
73. I. Bolzonella, Electrochemical promotion of rhodium catalyst. Application to nitro-
gen monoxide reduction. Thesis No 2743, EPFL, Lausanne, (2003).
74. L. L. Hegedus, R. Aris, A. T. Bell, M. Boudart, N. Y. Chen, B. C. Gates, W. O.
Haag, G. A. Somorjari, and J. Wei, Catalyst design: Progress and Perspectives.
John & sons, New York (1987).
75. A. Wieckowski, E. R. Savinova, and C. G. Vayenas, Catalysis and Electrocatalysis
at Nanoparticles Marcel Dekker, Inc., New York (2003).
76. G. L. Haller and D. E. Resasco, Advances in Catalysis, 36 (1989) 173.
77. S. J. Tauster, S. C. Fung, and R. L. Garten, JACS, 100 (1978) 170.
78. E. C. Akubuiro and X. E. Verykios, J. Catal., 113 (1988) 106.
79. M. Haruta, A. Ueda, S. Tsubota, and R. M. T. Sanchez, Catal. Today, 29 (1996)
443.
80. Y. Iizuka, H. Fujiki, N. Yamauchi, T. Chijiiwa, S. Arai, S. Tsubota, and M. Haruta,
Catal. Today, 36 (1997) 115.
81. G. M. Schwab, in Advances in Catalysis, Vol. 27 D. D. Eley, H. Pines, and P. B.
Weisz, eds., Academic Press, New York, (1978).
References
55
82. F. Solymosi, I. Tombacz, and M. Kocsis, J. Catal., 75 (1982) 78.
83. H. K. Henisch, in Electrode processes in solid state ionics M. Kleitz and J. Dupay,
eds., Reidel, Dordrecht, Holland, (1976).
84. M. S. Tyagi, in Metal-semiconductor schottky barrier junctions and their applica-
tions B. L. Sharma, ed.), Plenum, New York, (1984).
85. X. E. Verykios, in Catalysis and Electrocatalysis at nanoparticle surface A.
Wieckowski, E. R. Savinova, and C. G. Vayenas, eds., Marcel Dekker, Inc., New
York - Basel, (2003), p. 745
86. N. Yamamoto, S. Tonomura, and H. Tsubomura, J. Electrochem. Soc, 129 (1982)
444.
87. S. J. Tauster, S. C. Fung, R. T. K. Baker, and J. A. Horsley, Science, 211 (1981)
1121.
88. P. Meriaudeau, O. H. Ellestad, M. Dufax, and C.Naccache, J. Catal., 75 (1982)
243.
89. P. Meriaudeau, O. H. Ellestad, M. Dufaux, and C. Naccache, J. Catal., 75 (1982)
243.
90. R. Burch, in Hydrogen Effects in Catalysis Z. Paal and P. G. Menon, eds., Marcel
Dekker, New York, (1988), p. 347.
91. A. D. Logan, A. K. Datye, and J. E. Houston, Surface Sci., 245 (1991) 280.
92. A. K. Datye, D. Kalakkad, M. H. Yao, and D. J. Smith, J. Catal., 155 (1995) 148.
93. V. Andera, Applied Surf. Sci., 51 (1991) 1.
94. J. P. Belzunegui, J. M. Rojo, and J. Sanz, J. Phys. Chem., 95 (1991) 3464.
95. P. Meriaudeau, J. F. Dutel, M. Dufax, and C. Naccache, Stud. Surf. Sci. Catal, 11
(1982) 95.
96. J. Nicole, D. Tsiplakides, C. Pliangos, X. E. Verykios, C. Comninellis, and C. G.
Vayenas, J. Catal., 204 (2001) 23.
97. B. Delmon and G. F. Froment, Catal. Rev.-Sci. Eng., 38 (1996) 69.
98. M. Marwood and C. G. Vayenas, J. Catal., 168 (1997) 538.
99. V. N. Chebotin and M. V. Perfilev, Electrochemistry of solid electrolytes Khimiia
Publ. House, Moscou (1978).
Chapter 2 Review of relevant basic work (bibliography)
56
100. C. Deportes, M. Duclot, P. Fabry, J. Fouletier, A. Hammou, M. Kleitz, E. Siebert,
and J.-L. Souquet, Electrochimie des solides Press Universitair de Grenoble, Gre-
noble (1994).
101. H. Rickert, in Electrochemistry of Solids, Springer-Verlag, Berlin, (1982).
102. E. C. Subbarao and H. S. Maiti, Solid State Ionics, 11 (1984) 317.
103. P. J. Gellings and H. J. M. Bouwmeester, Catalysis Today, 12 (1992) 1.
104. W. Göpel, Sensor and Actuators B, 18-19 (1994) 1.
105. A. Mandelis and C. Christofides, Solid State Gas Sensor Devices John Wiley &
Sons, New York (1993).
106. P. J. Gellings and H. J. M. Bouwmeester, The CRC handbook of solid state electro-
chemistry CRC Press, Boca Raton (1997).
107. W. Vielstich, H. A. Gasteiger, and A. Lamm, Handbook of Fuel Cells - Fundamen-
tals, Thechnology and Applications John Wiley & Sons, Ltd (2003).
108. J. H. Park and R. N. Blumenthal, J. Electrochem. Soc, 136 (1989) 2867.
109. M. F. Fox and M. T. Dulay, Chem. Rev., 93 (1993) 341.
110. A. L. Linsebigler, G. Lu, and J. T. Yates, Chem. Rev., 95 (1995) 735.
111. C. J. Barbé, F. Arendsen, P. Comte, M. Jirousek, F. Lenzmann, V. Shklover, and M.
Grätzel, J. Am. Ceram. Soc., 80 (1997) 3157
112. M. Grätzel, Nature, 414 (2001) 338.
113. K. D. Schierbaum, U. K. Kirner, J. F. Geiger, and W. Göpel, Sensor and Actuators
B, 4 (1991) 87.
114. W. Göpel, U. K. Kirner, H. D. Wiemhöfer, and G. Rocker, Solid State Ionics, 28-30
(1988) 1423.
115. U. K. Kirner, K. D. Schierbaum, W. Göpel, B. Leibold, N. Nicoloso, W. Weppner,
D. Fischer, and W. F. Chu, Sensor and Actuators B1,(1990) 103.
116. Gmelin's Handbook Part 24 Weinheim (1951).
117. V. P. Popov and V. E. Svaiko-Svaikovski, Fiz. Tverd. Tiela (Russ. Solid State
Phys.), 21 (1979) 383.
118. D. C. Cronemeyer, Phys. Rev., 87 (1952) 876.
119. J. F. Baumard and E. Tani, Phys. Stat. Sol., 39 (1977) 373.
120. J. L. Carpentier, A. Lebrun, F. Perdu, and P. Tellier, C. R. Acad. Sci., 304 serie II
(1987) 1489.
References
57
121. L. Singheiser and W. Auer, Ber. Bunsen. Gessellschaft Phys. Chem., 81 (1977)
1167.
122. J. Novotny, M. Radecka, M. Rekas, S. Sugihara, E. R. Vance, and W. Weppner,
Ceramics International, 24 (1997) 571
123. J. F. Marucco, J. Gautron, and P. Lemasson, J. Phys. Chem. Solids, 42 (1981) 363
124. F. Millot, M.-G. Blanchin, R. Tétot, J. F. Marucco, B. Poumellec, C. Picard, and B.
Touzelin, Prog. Solid St. Chem., 17 (1987) 263.
125. D. Y. Wang and A. S. Nowick, J. Electrochem. Soc, 128 (1981) 55.
126. D. Y. Wang and A. S. Nowick, J. Electrochem. Soc., 126 (1979) 1155.
127. D. Y. Wang and A. S. Nowick, J. Electrochem. Soc., 126 (1979) 1166
128. B. C. Nguyen, L. M. Rinco-Rubio, and D. M. Mason, J. Electrochem. Soc, 133
(1986) 1860.
129. M. V. Perfilev, Solid State Ionics, 9 & 10 (1983) 765.
130. J. Mizusaki, K. Amano, S. Yamauchi, and K. Fueki, Solid State Ionics, 22 (1987)
313.
131. J. Mizusaki, K. Amano, S. Yamauchi, and K. Fueki, Solid State Ionics, 22 (1987)
323.
132. N. L. Robertson and J. N. Michaels, J. Electrochem. Soc, 137 (1990) 129.
133. B. A. v. Hassel, B. A. Boukamp, and A. J. Burggraaf, Solid State Ionics, 48 (1991)
155.
134. O. J. Velle, T. Norby, and P. Kofstad, Solid State Ionics, 47 (1991) 161
135. C. Athanasiou, G. Karagiannakis, S. Zisekas, and M. Stoukides, Solid State Ionics,
136-137 (2000) 873.
136. T. H. Etsell and S. N. Flengas, J. Electrochem. Soc, 11 (1971) 1890.
137. T. M. Gur, I. D. Raistrick, and R. A. Huggins, J. Electrochem. Soc, 127 (1980)
2620.
138. J. R. Anderson, Structure of metallic catalysts Academic Press, New York (1975).
139. J. E. Bauerle, J. Phys. Chem. Solids, 30 (1969) 2657.
140. S. Pizzini, in Fast ion transport in solids W. v. Gool, ed.), North-Holland, Amster-
dam, (1973), p. 461.
141. B. A. v. Hassel, B. A. Boukamp, and A. J. Burggraaf, Solid State Ionics, 48 (1991)
139.

59
CHAPTER 3 Experimental
In this chapter the experimental setup and protocols used for preparing the-
catalyst electrodes and the electrochemical cells used in this work are pre-
sented. The most important experimental techniques are listed but details
concerning each technique will be provided at the beginning of each chapter
reporting experimental results.
3.1 Electrochemical cells
3.1.1 Single-pellet cells
Two single-pellet cell configurations have been used in the present work. One of the config-
urations is the cell presented in Figure 3.1, where the rhodium catalyst used as the working elec-
trode was deposited on one side of a pellet of yttria-stabilized zirconia (YSZ 8 mol%, Technox 802
from Dynamic Ceramic), while the Au counterelectrode and reference electrodes were deposited
on the other side (Fig. 3.1) [1].
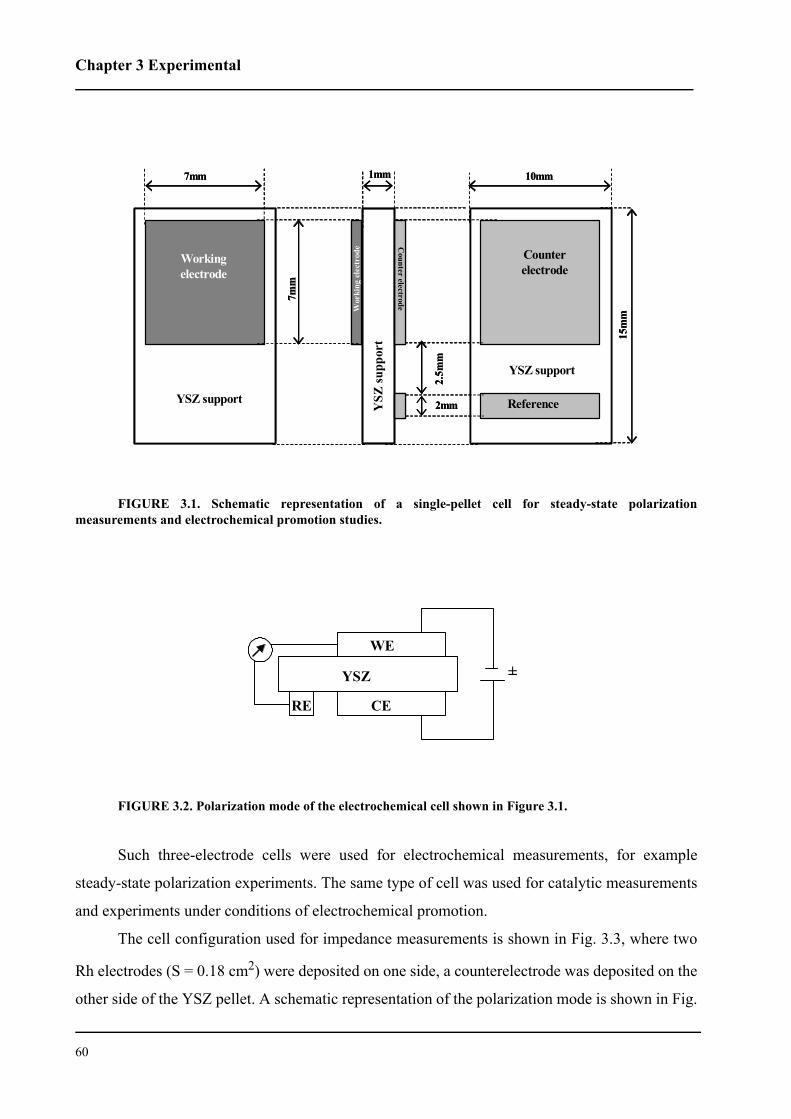
Chapter 3 Experimental
60
FIGURE 3.1. Schematic representation of a single-pellet cell for steady-state polarizationmeasurements and electrochemical promotion studies.
FIGURE 3.2. Polarization mode of the electrochemical cell shown in Figure 3.1.
Such three-electrode cells were used for electrochemical measurements, for example
steady-state polarization experiments. The same type of cell was used for catalytic measurements
and experiments under conditions of electrochemical promotion.
The cell configuration used for impedance measurements is shown in Fig. 3.3, where two
Rh electrodes (S = 0.18 cm2) were deposited on one side, a counterelectrode was deposited on the
other side of the YSZ pellet. A schematic representation of the polarization mode is shown in Fig.
YSZ
sup
port
7mm
Working electrode
7mm
YSZ support
Wor
king
ele
ctro
de
Counter electrode
1mm
Counter electrode
Reference
e
10mm
15m
m
YSZ support
2mm
2.5m
m
YSZ
sup
port
7mm
Working electrode
7mm
YSZ support
Wor
king
ele
ctro
de
Counter electrode
1mm
Counter electrode
Reference
e
10mm
15m
m
YSZ support
2mm
2.5m
m
±
CE
YSZ
WE
RE
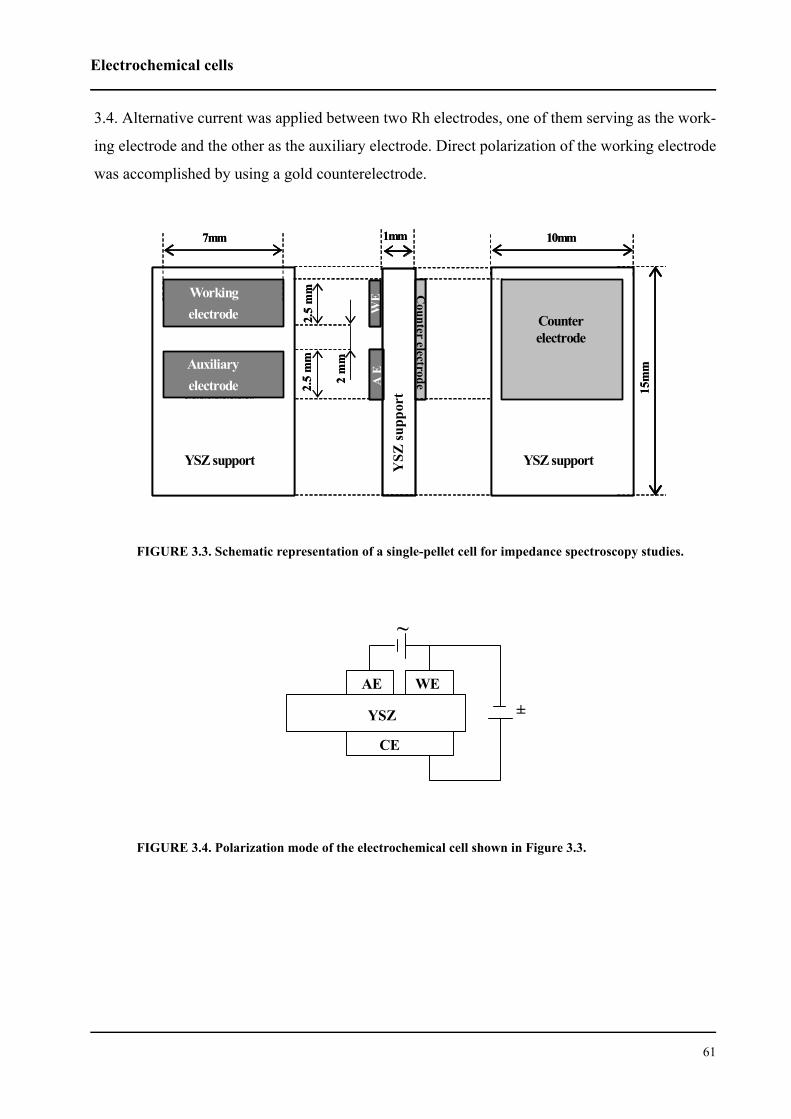
Electrochemical cells
61
3.4. Alternative current was applied between two Rh electrodes, one of them serving as the work-
ing electrode and the other as the auxiliary electrode. Direct polarization of the working electrode
was accomplished by using a gold counterelectrode.
FIGURE 3.3. Schematic representation of a single-pellet cell for impedance spectroscopy studies.
FIGURE 3.4. Polarization mode of the electrochemical cell shown in Figure 3.3.
YSZ
supp
ort
2.5
mmWorking
electrode
e
7mm
YSZ support
AE
Counter electrode
1mm
Counterelectrode
10mm
15m
m
YSZ support
Auxiliaryelectrode
e
2.5
mm
WE
2 m
m
YSZ
supp
ort
2.5
mmWorking
electrode
e
7mm
YSZ support
AE
Counter electrode
1mm
Counterelectrode
10mm
15m
m
YSZ support
Auxiliaryelectrode
e
2.5
mm
WE
2 m
m
±
~
CE
YSZ
AE WE
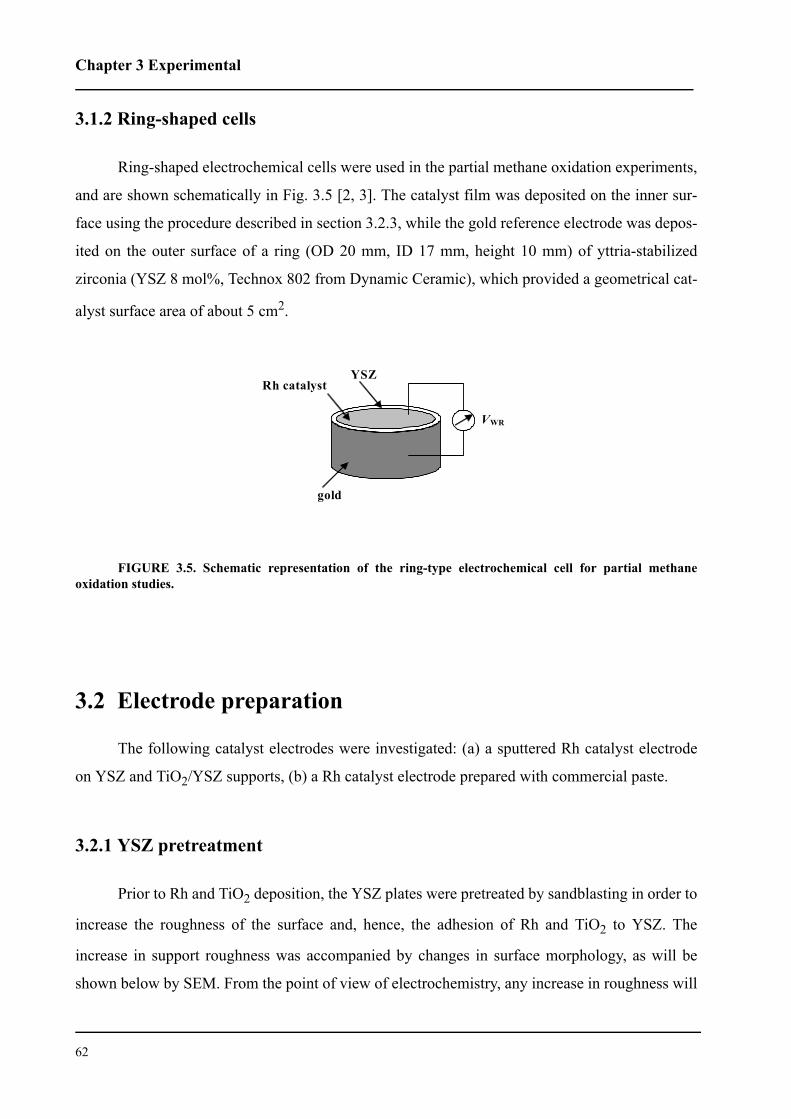
Chapter 3 Experimental
62
3.1.2 Ring-shaped cells
Ring-shaped electrochemical cells were used in the partial methane oxidation experiments,
and are shown schematically in Fig. 3.5 [2, 3]. The catalyst film was deposited on the inner sur-
face using the procedure described in section 3.2.3, while the gold reference electrode was depos-
ited on the outer surface of a ring (OD 20 mm, ID 17 mm, height 10 mm) of yttria-stabilized
zirconia (YSZ 8 mol%, Technox 802 from Dynamic Ceramic), which provided a geometrical cat-
alyst surface area of about 5 cm2.
FIGURE 3.5. Schematic representation of the ring-type electrochemical cell for partial methaneoxidation studies.
3.2 Electrode preparation
The following catalyst electrodes were investigated: (a) a sputtered Rh catalyst electrode
on YSZ and TiO2/YSZ supports, (b) a Rh catalyst electrode prepared with commercial paste.
3.2.1 YSZ pretreatment
Prior to Rh and TiO2 deposition, the YSZ plates were pretreated by sandblasting in order to
increase the roughness of the surface and, hence, the adhesion of Rh and TiO2 to YSZ. The
increase in support roughness was accompanied by changes in surface morphology, as will be
shown below by SEM. From the point of view of electrochemistry, any increase in roughness will
Rh catalyst
YSZ
gold
VWR
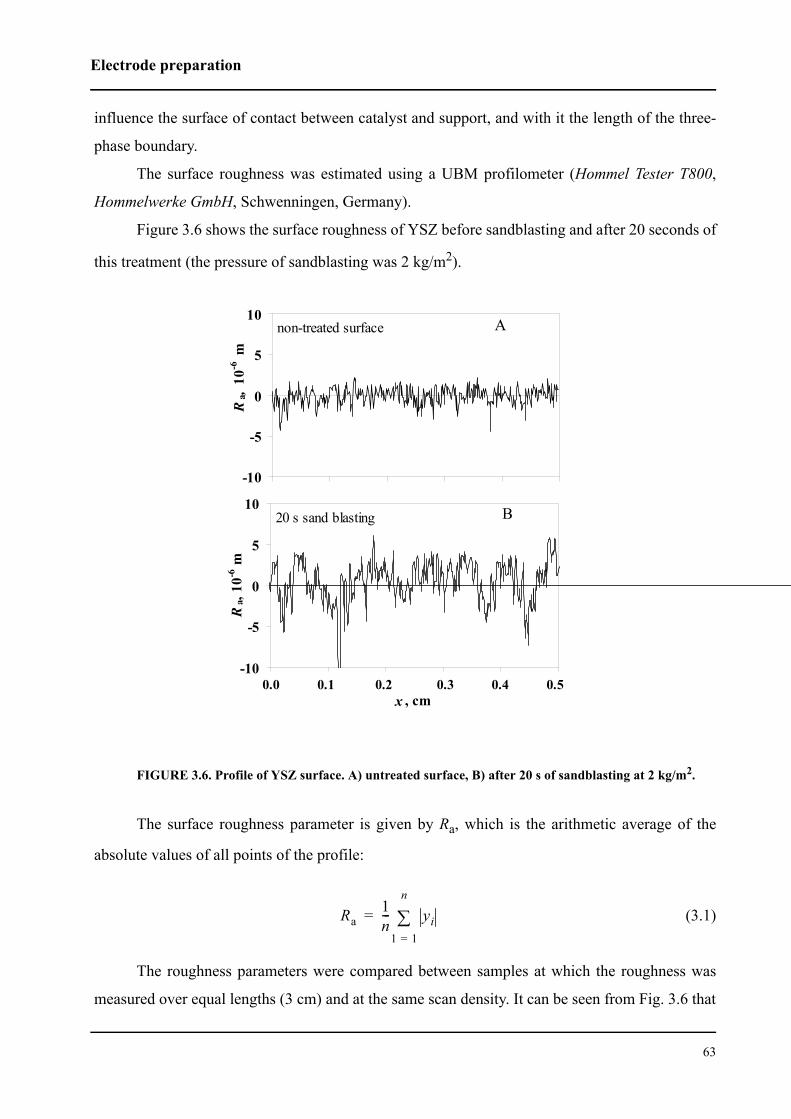
Electrode preparation
63
influence the surface of contact between catalyst and support, and with it the length of the three-
phase boundary.
The surface roughness was estimated using a UBM profilometer (Hommel Tester T800,
Hommelwerke GmbH, Schwenningen, Germany).
Figure 3.6 shows the surface roughness of YSZ before sandblasting and after 20 seconds of
this treatment (the pressure of sandblasting was 2 kg/m2).
FIGURE 3.6. Profile of YSZ surface. A) untreated surface, B) after 20 s of sandblasting at 2 kg/m2.
The surface roughness parameter is given by Ra, which is the arithmetic average of the
absolute values of all points of the profile:
(3.1)
The roughness parameters were compared between samples at which the roughness was
measured over equal lengths (3 cm) and at the same scan density. It can be seen from Fig. 3.6 that
-10
-5
0
5
10
Ra,
10-6
m
non-treated surface
-10
-5
0
5
10
x , cm
Ra,
10-6
m
0.0 0.1 0.2 0.3 0.4 0.5
20 s sand blasting
A
B
Ra1n--- yi
1 1=
n
∑=
Chapter 3 Experimental
64
20 s of sandblasting lead to a twofold increase in surface roughness. The roughness parameters,
Ra, are 0.82 µm and 2.1 µm for the untreated and the sandblasted surface, respectively.
After the sandblasting procedure, the support was carefully cleaned in order to avoid the
presence of impurities on the support surface that would interfere with film growth. The cleaning
procedure was the following:
1. The support was cleaned for 10 min in acetone in an ultrasonic bath (1200, Branson);
2. After sonication, the support was rinsed for 10 min with demineralized water.
3. Then the support was immersed into 2-propanol and cleaned for 30 min in the ultrasonic
bath.
3.2.2 Preparation of Rh catalyst electrodes by sputtering
The technique of sputtering is often used to deposit thin films. Deposition by sputtering
offers many unique characteristics as compared to other thin-film deposition methods. These
characteristics include a very simple control of thickness of the deposited film and a good adhe-
sion to the support due to the high energy of sputtered atoms. When a solid is heated to a suffi-
ciently high temperature, it is possible for individual atoms to acquire enough energy to escape
from the surface. This effect is known as evaporation. Sputtering is similar to evaporation, though
energy is transferred to the solid, not by heating but by bombardment of the solid via collisions.
As it is more convenient to accelerate ions, sputtering normally is obtained by ion bombardment
[4]. The pressure inside the deposition chamber has to be as low as possible in order to avoid the
back-diffusion of sputtered atoms and collisions between the ions and the gas during the accelera-
tion phase. The growth process will influence the morphological characteristics of the thin film.
These depend, not only on the parameters of the sputtering process but also on the surface rough-
ness of the support and on the nature of the material deposited.
The sputtering was performed in Prof. F. Lévy’s laboratory (Laboratoire de physique des
couches minces, EPFL) by H. Jotterand; their contribution is gratefully acknowledged.
After cleaning, the support was introduced into the sputtering chamber that was filled with
pure argon. Then rhodium (Rh 99.8, Lesker) was deposited onto the substrate (YSZ support) at 50
°C. The sputtering conditions were the following: direct-current (dc) mode with a discharge of
305 V, argon pressure 0.5 Pa. Under these conditions the deposition rate was 0.25 nm/s. The film
Electrode preparation
65
thickness was measured by calibration with smooth silicon samples processed simultaneously.
The thickness of the sputter-deposited rhodium film was 40 nm.
The Rh/TiO2/YSZ samples were prepared by the same method of deposition but on YSZ
supports previously covered with a thin film of TiO2 (see below, section 3.2.4)
The geometric surface area of the rhodium catalyst was 0.5 cm2.
The surface area and dispersion of the metal in the Rh film catalysts was estimated with the
transient galvanostatic catalytic rate response technique [5]. This is based on measuring the time,
τ, required for the rate increase to reach 63 % of its final steady-state value in galvanostatic elec-
tropromotion experiments. It is well established that τ, which expresses the time required to form
a monolayer of O2- on the catalytically active gas-exposed catalyst electrode surface, is given by:
(3.2)
where NG is the surface area (in mol) of the gas-exposed catalyst electrode, and I is the applied
current. From this expression, and taking into account that (see Chapter 8) τ is approximately 1
min for I = 50 µA, one can estimate that NG = 1.6 x 10⁻⁸ mol.
The catalyst dispersion is defined as:
DC = (number of catalyst surface atoms/total number of catalyst atoms) x 100 (3.3)
Assuming 10 % porosity for the Rh film, one finds that the 40-nm film having a geometric surface
area of 0.5 cm2 contains 2 x 10⁻⁷ mol Rh. These numbers yield an estimate for the metal’s disper-
sion of 8 % ( %).
The counterelectrode and the reference electrode consisted of porous gold deposited onto
the YSZ by thermal decomposition of a gold paste (Gwent C70219R4); the calcining temperature
was 550 °C. It should be noted that the Au reference electrode is a pseudoreference electrode,
since it is exposed to a gas of varying composition. It has been shown [5] that Au/YSZ is a satis-
factory pseudoreference electrode in oxygen atmosphere.
3.2.3 Preparation of Rh catalyst electrodes using commercial paste
Two types of catalyst electrode were prepared: Rh/YSZ and Rh/TiO2/YSZ.
τ2FNG
I--------------≈
3±
Chapter 3 Experimental
66
Rh/YSZ: prepared by depositing 30 µL/cm2 of Rh paste (Engelhard Rh8826; 10 % Rh)
diluted three times (by mass) with THF on the YSZ support. Three consecutive layers were
deposited. Each layer was fired at 400 °C/10 min; the final heat treatment occurred at 550 °C/1
hour (estimated loading: 0.54 mg Rh /cm2).
Rh/TiO2/YSZ: This differed from the Rh/YSZ catalyst, only in that the YSZ support was
covered with a thin film of TiO2 (see section 3.2.4)
A gold film serving as the counterelectrode was deposited onto the outer surface of the
YSZ ring (Fig. 3.5) using gold paste (Gwent C70219R4); the deposition temperature was 550 °C.
3.2.4 Preparation of the TiO2 layer
A micropipette was used to deposit 2.5 µL of a slurry of 20 % TiO2 (1 g TiO2 Degussa P25
in 20 mL EtOH : H2O = 1 : 1) on YSZ of 0.6 cm2 surface area, which was then evaporated for 10
min at 60 °C and heat-treated for 30 min at 450 °C in air. The loading of the TiO2 layer was 1 mg/
cm2. The apparent density of the TiO2 was 2 g/cm3, the estimated layer thickness was about 4 µm.
For preparation of TiO2 with a thickness 20 µm and 40 µm the ammount of a slurry was deposited
5 and 10 times higher than for 4 µm, subsecuently. Following by the same procedure of evapora-
tion and heat treatment.
For preparation of the ring-type cells (Fig. 3.5), the same slurry of 20 % TiO2 was applied
onto the inner surface of the YSZ ring. Several layers were applied until reaching the desired
loading (1.7 mg TiO2/cm2).
The thicknesses were estimated with a KLA-Tencor Profile, Model P15 profilometer.
3.3 Catalyst characterization
3.4. Scanning electron microscopy (SEM)
The measurements were carried out with a scanning electron microscope (JSM-6300F,
JEOL).
Catalyst characterization
67
The thin (40 nm) Rh films sputtered on YSZ and TiO2/YSZ were analyzed twice, first as
prepared and again after 200 hours spent working under reaction conditions.
3.5. Atomic force microscopy
Atomic force microscopic (AFM) studies were carried out in air under ambient conditions
(25 °C) using an Atomic Force Microscope (Topometrix Model Explorer). Topographic (3D,
height) images were recorded in the tapping mode using an etched silicon probe. The scan area
was 20 µm × 20 µm, the image contained 300×300 data points.
For the acquisition of topographical information, a probe tip traverses the surface and
senses the force of interaction between itself and the investigated surface. The measurements
were performed with the naked YSZ support, with a YSZ surface covered by a thin layer of TiO2
(4 µm), and with the Rh/YSZ and Rh/TiO2/YSZ samples having a Rh film thickness of 40 nm.
3.6. X-ray photoelectron spectroscopy (XPS)
The measurements were carried out with an XPS system (PHI 5500 ESCA, Perkin Elmer)
using the Kα radiation of Mg. The energy was varied between 0 eV and 1100 eV.
The 40-nm Rh films sputtered on YSZ and TiO2/YSZ were investigated twice, first after
reduction (H2/400 °C/1 h) and again after oxidation (O2/400 °C/1 h).
Deconvolution of the XPS spectra and element quantification were performed using the
CasaXPS program (Version 2.1.34).
3.7. Electrochemical measurements
The following electrochemical methods have been used in the present work: steady-state
polarization measurements and impedance spectroscopy.
Steady-state polarization measurements have been performed with a computer-controlled
Autolab PGstat30 in a single-pellet cell (Fig. 3.1, polarization mode as shown in Fig. 3.2) using
40-nm Rh working electrodes deposited on YSZ and on TiO2/YSZ. The temperature was varied
from 450 °C to 600 °C; the oxygen partial pressure from 0.5 kPa to 20 kPa. The gas flow rate was
kept constant at 200 mL/min.
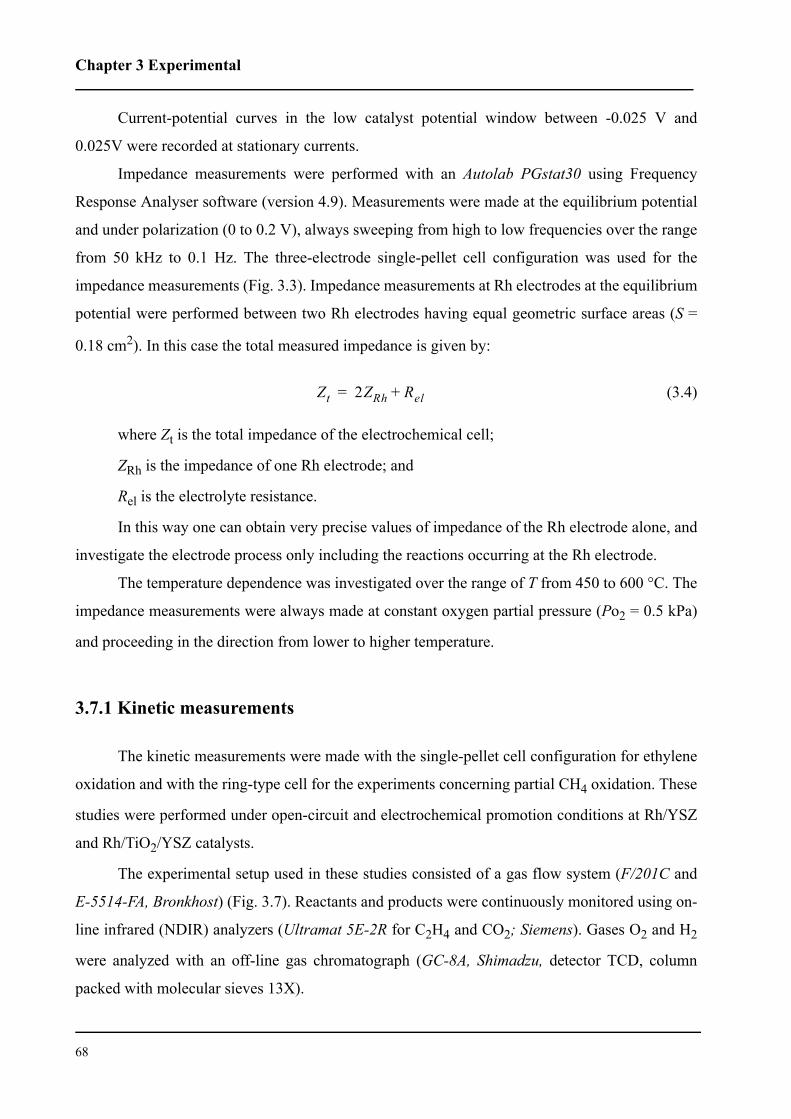
Chapter 3 Experimental
68
Current-potential curves in the low catalyst potential window between -0.025 V and
0.025V were recorded at stationary currents.
Impedance measurements were performed with an Autolab PGstat30 using Frequency
Response Analyser software (version 4.9). Measurements were made at the equilibrium potential
and under polarization (0 to 0.2 V), always sweeping from high to low frequencies over the range
from 50 kHz to 0.1 Hz. The three-electrode single-pellet cell configuration was used for the
impedance measurements (Fig. 3.3). Impedance measurements at Rh electrodes at the equilibrium
potential were performed between two Rh electrodes having equal geometric surface areas (S =
0.18 cm2). In this case the total measured impedance is given by:
(3.4)
where Zt is the total impedance of the electrochemical cell;
ZRh is the impedance of one Rh electrode; and
Rel is the electrolyte resistance.
In this way one can obtain very precise values of impedance of the Rh electrode alone, and
investigate the electrode process only including the reactions occurring at the Rh electrode.
The temperature dependence was investigated over the range of T from 450 to 600 °C. The
impedance measurements were always made at constant oxygen partial pressure (Po2 = 0.5 kPa)
and proceeding in the direction from lower to higher temperature.
3.7.1 Kinetic measurements
The kinetic measurements were made with the single-pellet cell configuration for ethylene
oxidation and with the ring-type cell for the experiments concerning partial CH4 oxidation. These
studies were performed under open-circuit and electrochemical promotion conditions at Rh/YSZ
and Rh/TiO2/YSZ catalysts.
The experimental setup used in these studies consisted of a gas flow system (F/201C and
E-5514-FA, Bronkhost) (Fig. 3.7). Reactants and products were continuously monitored using on-
line infrared (NDIR) analyzers (Ultramat 5E-2R for C2H4 and CO2; Siemens). Gases O2 and H2
were analyzed with an off-line gas chromatograph (GC-8A, Shimadzu, detector TCD, column
packed with molecular sieves 13X).
Zt 2ZRh Rel+=
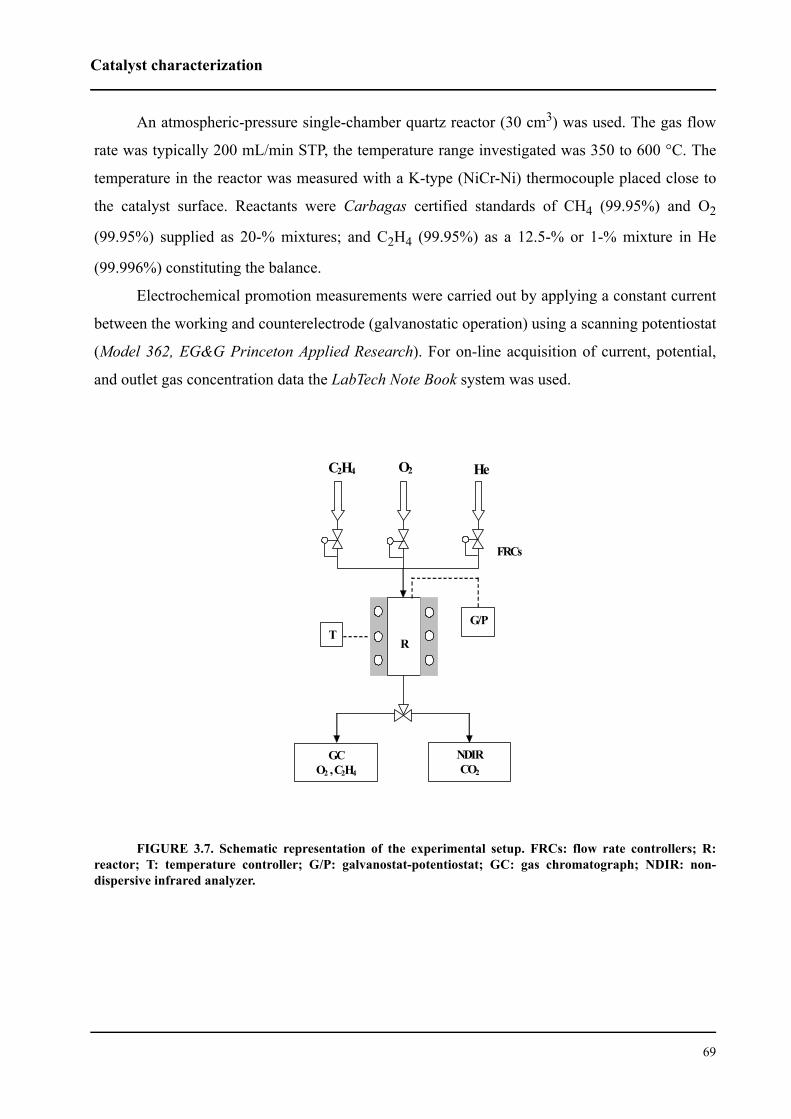
Catalyst characterization
69
An atmospheric-pressure single-chamber quartz reactor (30 cm3) was used. The gas flow
rate was typically 200 mL/min STP, the temperature range investigated was 350 to 600 °C. The
temperature in the reactor was measured with a K-type (NiCr-Ni) thermocouple placed close to
the catalyst surface. Reactants were Carbagas certified standards of CH4 (99.95%) and O2
(99.95%) supplied as 20-% mixtures; and C2H4 (99.95%) as a 12.5-% or 1-% mixture in He
(99.996%) constituting the balance.
Electrochemical promotion measurements were carried out by applying a constant current
between the working and counterelectrode (galvanostatic operation) using a scanning potentiostat
(Model 362, EG&G Princeton Applied Research). For on-line acquisition of current, potential,
and outlet gas concentration data the LabTech Note Book system was used.
FIGURE 3.7. Schematic representation of the experimental setup. FRCs: flow rate controllers; R:reactor; T: temperature controller; G/P: galvanostat-potentiostat; GC: gas chromatograph; NDIR: non-dispersive infrared analyzer.
C2H4 O2 He
R T
G/P
NDIRCO2
FRCs
GCO2 , C2H4
Chapter 3 Experimental
70
3.8 References
1. E. A. Baranova, A. Thursfield, S. Brosda, G. Fóti, C. Comninellis, and C. G. Vaye-
nas, J. Catal., 152 (2005) E40.
2. G. Fóti, I. Bolzonella, J. Eaves, and C. Comninellis, CHIMIA, 56 (2002) 137.
3. G. Fóti, S. Wodiunig, and C. Comninellis, Current topics in Electrochemistry, 7
(2000) 1.
4. R. V. Stuart, Vacuum Technology, thin films, and Sputtering: An introduction Aca-
demic press (1983).
5. C. G. Vayenas, S. Bebelis, C. Pliangos, S. Brosda, and D. Tsiplakides, Electro-
chemical activation of catalysis. Promotion, Electrochemical promotion, and
metal-support interaction. Kluwer Academic/Plenum Publishers, New York
(2001).
71
CHAPTER 4 Characterization of Rh catalyst
electrodes
In this chapter the characterization of sputtered Rh catalyst electrodes on
YSZ (Rh/YSZ) and on thin layers of TiO2 deposited on YSZ supports (Rh/
TiO2/YSZ) is presented. Several types of analysis were performed with the
aim of investigating the morphological properties (SEM, AFM) and chemi-
cal surface composition (XPS) of the Rh catalysts. Both Rh/YSZ and Rh/
TiO2/YSZ have a nanoparticle structure that remains stable over a period of
200 hours when the catalyst electrodes are exposed to working conditions.
The Rh film interfaced with TiO2 has a higher surface area and catalyst dis-
persion than Rh/YSZ. It was found that TiO2 is able to keep Rh in a more
highly reduced state, probably due to strong electronic metal-support inter-
actions between Rh and TiO2.
4.1 Introduction
In the present PhD work, Rh catalysts supported on YSZ and TiO2/YSZ were investigated.
Due to a strong public interest in environmental problems and to more stringent automobile
exhaust standards, Rh catalysts have attracted much attention during recent years. At present, Rh
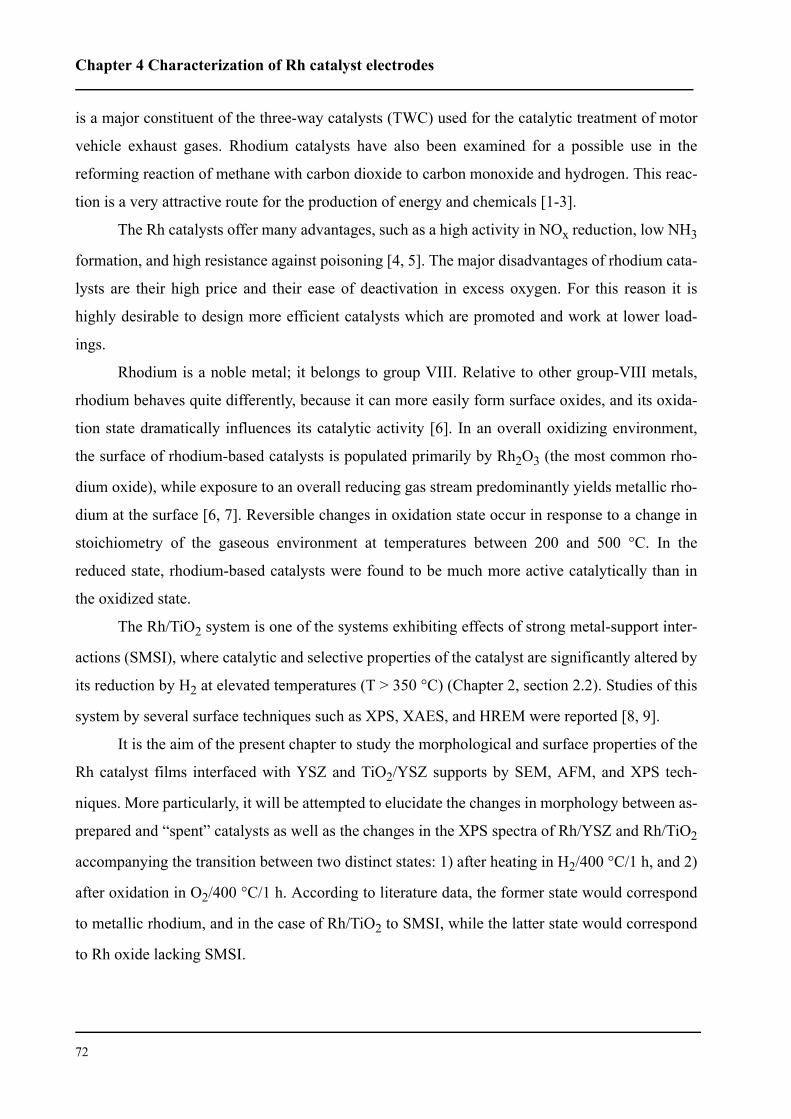
Chapter 4 Characterization of Rh catalyst electrodes
72
is a major constituent of the three-way catalysts (TWC) used for the catalytic treatment of motor
vehicle exhaust gases. Rhodium catalysts have also been examined for a possible use in the
reforming reaction of methane with carbon dioxide to carbon monoxide and hydrogen. This reac-
tion is a very attractive route for the production of energy and chemicals [1-3].
The Rh catalysts offer many advantages, such as a high activity in NOx reduction, low NH3
formation, and high resistance against poisoning [4, 5]. The major disadvantages of rhodium cata-
lysts are their high price and their ease of deactivation in excess oxygen. For this reason it is
highly desirable to design more efficient catalysts which are promoted and work at lower load-
ings.
Rhodium is a noble metal; it belongs to group VIII. Relative to other group-VIII metals,
rhodium behaves quite differently, because it can more easily form surface oxides, and its oxida-
tion state dramatically influences its catalytic activity [6]. In an overall oxidizing environment,
the surface of rhodium-based catalysts is populated primarily by Rh2O3 (the most common rho-
dium oxide), while exposure to an overall reducing gas stream predominantly yields metallic rho-
dium at the surface [6, 7]. Reversible changes in oxidation state occur in response to a change in
stoichiometry of the gaseous environment at temperatures between 200 and 500 °C. In the
reduced state, rhodium-based catalysts were found to be much more active catalytically than in
the oxidized state.
The Rh/TiO2 system is one of the systems exhibiting effects of strong metal-support inter-
actions (SMSI), where catalytic and selective properties of the catalyst are significantly altered by
its reduction by H2 at elevated temperatures (T > 350 °C) (Chapter 2, section 2.2). Studies of this
system by several surface techniques such as XPS, XAES, and HREM were reported [8, 9].
It is the aim of the present chapter to study the morphological and surface properties of the
Rh catalyst films interfaced with YSZ and TiO2/YSZ supports by SEM, AFM, and XPS tech-
niques. More particularly, it will be attempted to elucidate the changes in morphology between as-
prepared and “spent” catalysts as well as the changes in the XPS spectra of Rh/YSZ and Rh/TiO2
accompanying the transition between two distinct states: 1) after heating in H2/400 °C/1 h, and 2)
after oxidation in O2/400 °C/1 h. According to literature data, the former state would correspond
to metallic rhodium, and in the case of Rh/TiO2 to SMSI, while the latter state would correspond
to Rh oxide lacking SMSI.
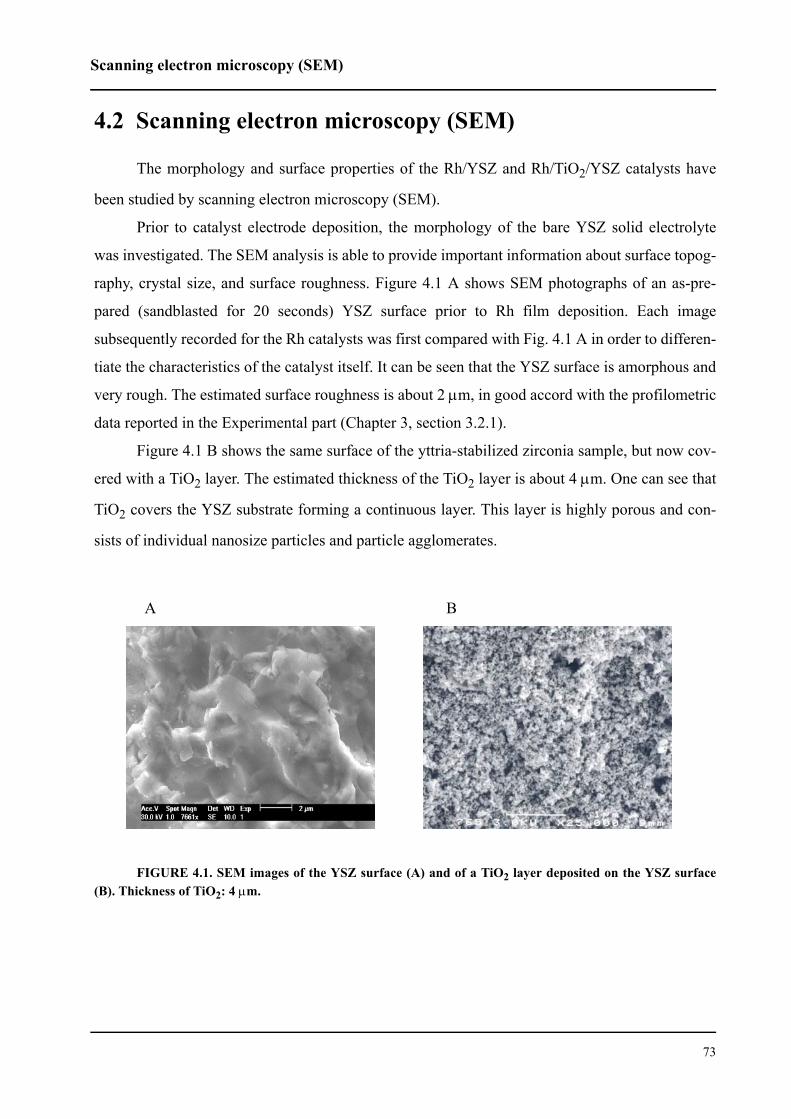
Scanning electron microscopy (SEM)
73
4.2 Scanning electron microscopy (SEM)
The morphology and surface properties of the Rh/YSZ and Rh/TiO2/YSZ catalysts have
been studied by scanning electron microscopy (SEM).
Prior to catalyst electrode deposition, the morphology of the bare YSZ solid electrolyte
was investigated. The SEM analysis is able to provide important information about surface topog-
raphy, crystal size, and surface roughness. Figure 4.1 A shows SEM photographs of an as-pre-
pared (sandblasted for 20 seconds) YSZ surface prior to Rh film deposition. Each image
subsequently recorded for the Rh catalysts was first compared with Fig. 4.1 A in order to differen-
tiate the characteristics of the catalyst itself. It can be seen that the YSZ surface is amorphous and
very rough. The estimated surface roughness is about 2 µm, in good accord with the profilometric
data reported in the Experimental part (Chapter 3, section 3.2.1).
Figure 4.1 B shows the same surface of the yttria-stabilized zirconia sample, but now cov-
ered with a TiO2 layer. The estimated thickness of the TiO2 layer is about 4 µm. One can see that
TiO2 covers the YSZ substrate forming a continuous layer. This layer is highly porous and con-
sists of individual nanosize particles and particle agglomerates.
A B
FIGURE 4.1. SEM images of the YSZ surface (A) and of a TiO2 layer deposited on the YSZ surface(B). Thickness of TiO2: 4 µm.
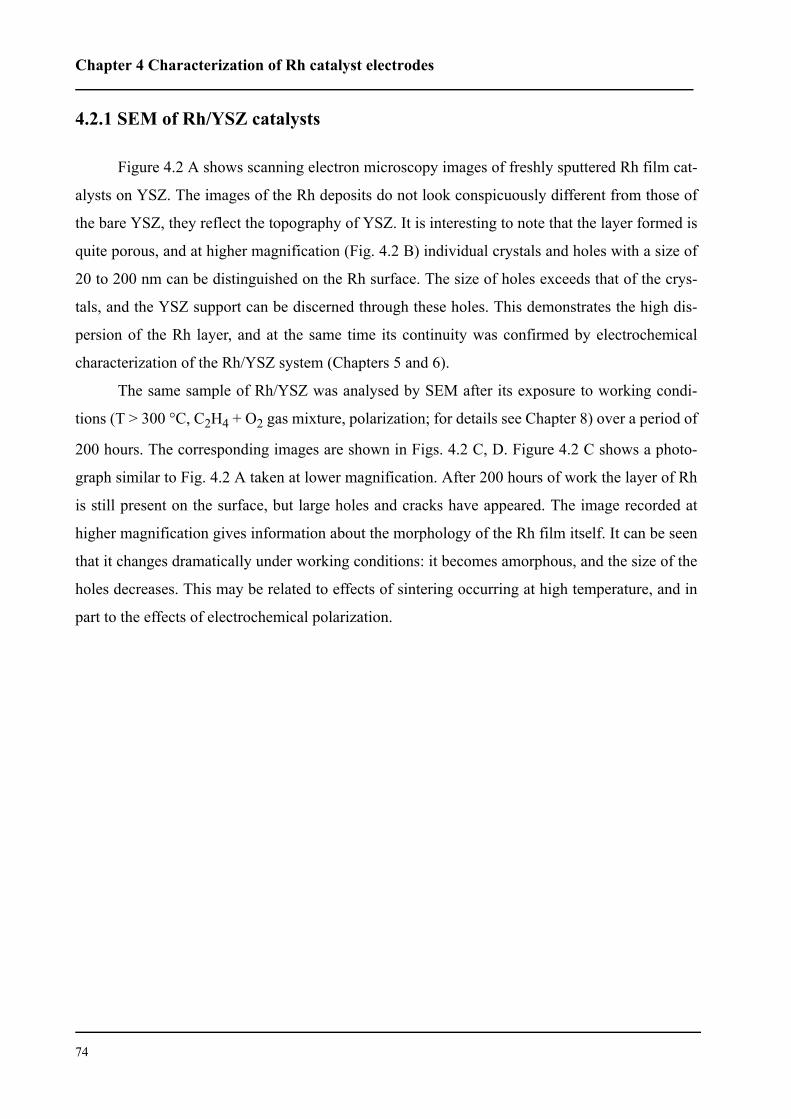
Chapter 4 Characterization of Rh catalyst electrodes
74
4.2.1 SEM of Rh/YSZ catalysts
Figure 4.2 A shows scanning electron microscopy images of freshly sputtered Rh film cat-
alysts on YSZ. The images of the Rh deposits do not look conspicuously different from those of
the bare YSZ, they reflect the topography of YSZ. It is interesting to note that the layer formed is
quite porous, and at higher magnification (Fig. 4.2 B) individual crystals and holes with a size of
20 to 200 nm can be distinguished on the Rh surface. The size of holes exceeds that of the crys-
tals, and the YSZ support can be discerned through these holes. This demonstrates the high dis-
persion of the Rh layer, and at the same time its continuity was confirmed by electrochemical
characterization of the Rh/YSZ system (Chapters 5 and 6).
The same sample of Rh/YSZ was analysed by SEM after its exposure to working condi-
tions (T > 300 °C, C2H4 + O2 gas mixture, polarization; for details see Chapter 8) over a period of
200 hours. The corresponding images are shown in Figs. 4.2 C, D. Figure 4.2 C shows a photo-
graph similar to Fig. 4.2 A taken at lower magnification. After 200 hours of work the layer of Rh
is still present on the surface, but large holes and cracks have appeared. The image recorded at
higher magnification gives information about the morphology of the Rh film itself. It can be seen
that it changes dramatically under working conditions: it becomes amorphous, and the size of the
holes decreases. This may be related to effects of sintering occurring at high temperature, and in
part to the effects of electrochemical polarization.
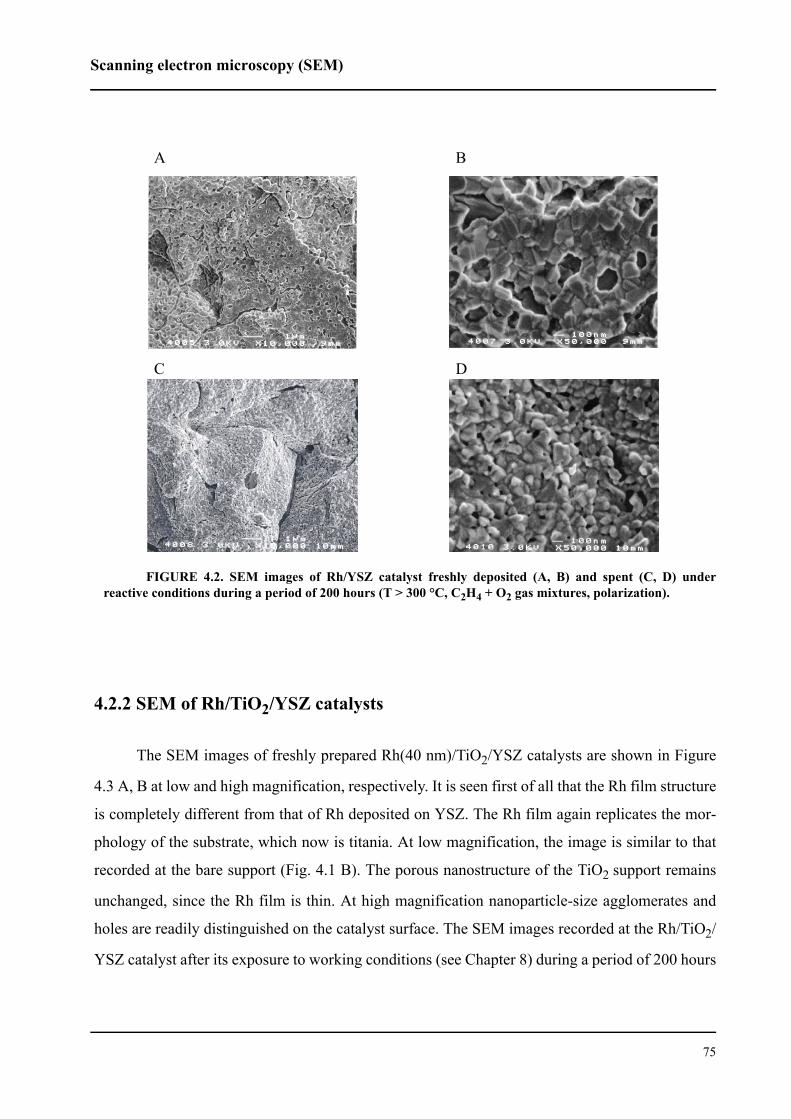
Scanning electron microscopy (SEM)
75
4.2.2 SEM of Rh/TiO2/YSZ catalysts
The SEM images of freshly prepared Rh(40 nm)/TiO2/YSZ catalysts are shown in Figure
4.3 A, B at low and high magnification, respectively. It is seen first of all that the Rh film structure
is completely different from that of Rh deposited on YSZ. The Rh film again replicates the mor-
phology of the substrate, which now is titania. At low magnification, the image is similar to that
recorded at the bare support (Fig. 4.1 B). The porous nanostructure of the TiO2 support remains
unchanged, since the Rh film is thin. At high magnification nanoparticle-size agglomerates and
holes are readily distinguished on the catalyst surface. The SEM images recorded at the Rh/TiO2/
YSZ catalyst after its exposure to working conditions (see Chapter 8) during a period of 200 hours
A B
C D
FIGURE 4.2. SEM images of Rh/YSZ catalyst freshly deposited (A, B) and spent (C, D) underreactive conditions during a period of 200 hours (T > 300 °C, C2H4 + O2 gas mixtures, polarization).
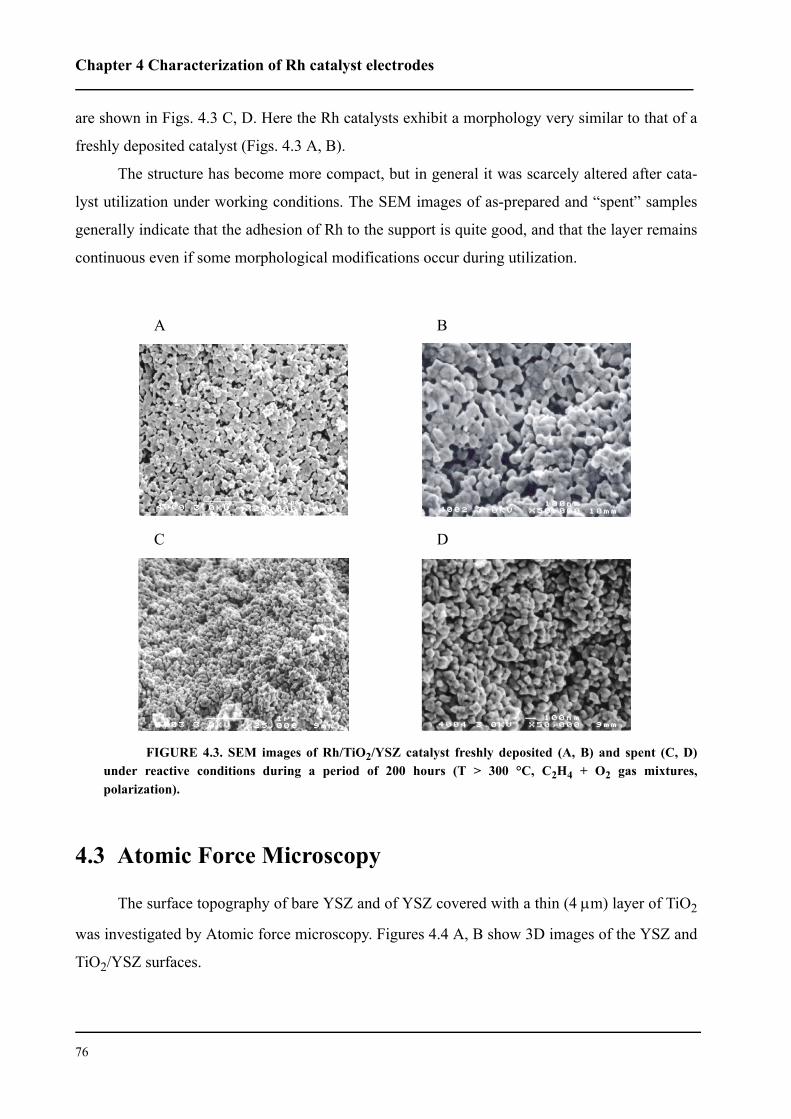
Chapter 4 Characterization of Rh catalyst electrodes
76
are shown in Figs. 4.3 C, D. Here the Rh catalysts exhibit a morphology very similar to that of a
freshly deposited catalyst (Figs. 4.3 A, B).
The structure has become more compact, but in general it was scarcely altered after cata-
lyst utilization under working conditions. The SEM images of as-prepared and “spent” samples
generally indicate that the adhesion of Rh to the support is quite good, and that the layer remains
continuous even if some morphological modifications occur during utilization.
4.3 Atomic Force Microscopy
The surface topography of bare YSZ and of YSZ covered with a thin (4 µm) layer of TiO2
was investigated by Atomic force microscopy. Figures 4.4 A, B show 3D images of the YSZ and
TiO2/YSZ surfaces.
A B
C D
FIGURE 4.3. SEM images of Rh/TiO2/YSZ catalyst freshly deposited (A, B) and spent (C, D)under reactive conditions during a period of 200 hours (T > 300 °C, C2H4 + O2 gas mixtures,polarization).
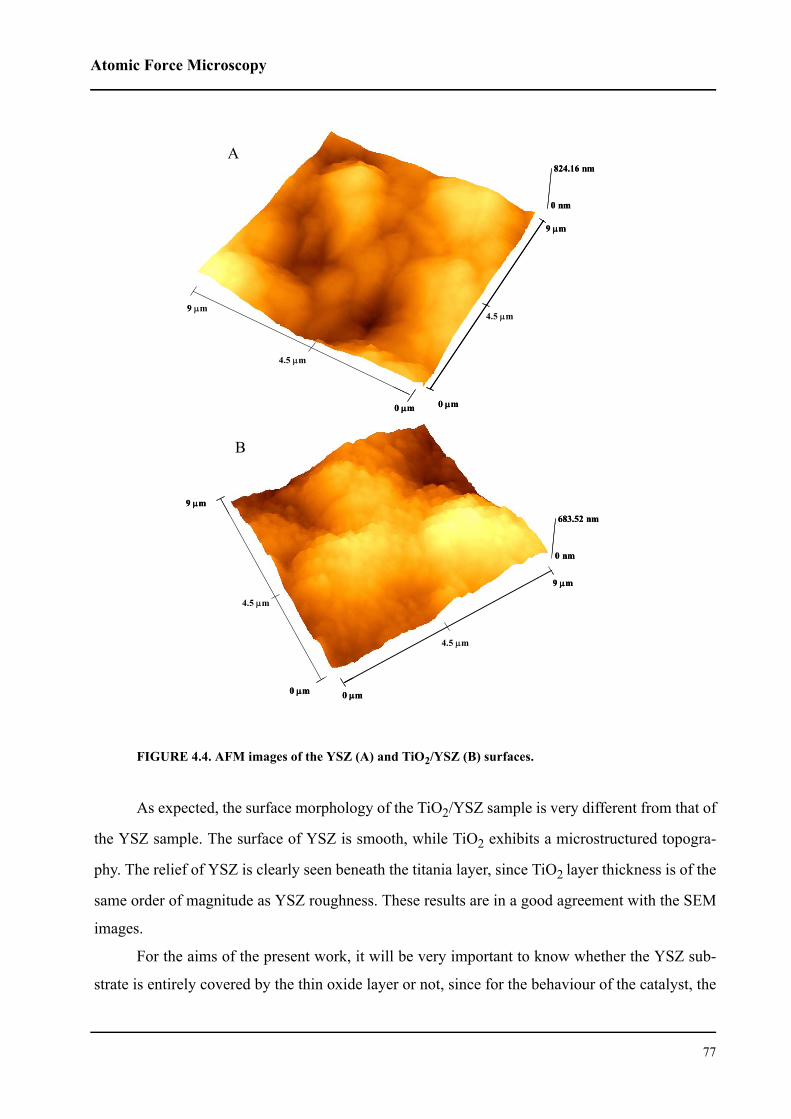
Atomic Force Microscopy
77
FIGURE 4.4. AFM images of the YSZ (A) and TiO2/YSZ (B) surfaces.
As expected, the surface morphology of the TiO2/YSZ sample is very different from that of
the YSZ sample. The surface of YSZ is smooth, while TiO2 exhibits a microstructured topogra-
phy. The relief of YSZ is clearly seen beneath the titania layer, since TiO2 layer thickness is of the
same order of magnitude as YSZ roughness. These results are in a good agreement with the SEM
images.
For the aims of the present work, it will be very important to know whether the YSZ sub-
strate is entirely covered by the thin oxide layer or not, since for the behaviour of the catalyst, the
0 µm0 µm
9 µm
4.5 µm
4.5 µm
9 µm
683.52 nm
0 nm
0 µm0 µm
9 µm
4.5 µm
4.5 µm
9 µm
683.52 nm
0 nm
0 µm0 µm
9 µm
4.5 µm
4.5 µm
824.16 nm
0 nm
9 µm
0 µm0 µm
9 µm
4.5 µm
4.5 µm
824.16 nm
0 nm
9 µm
A
B
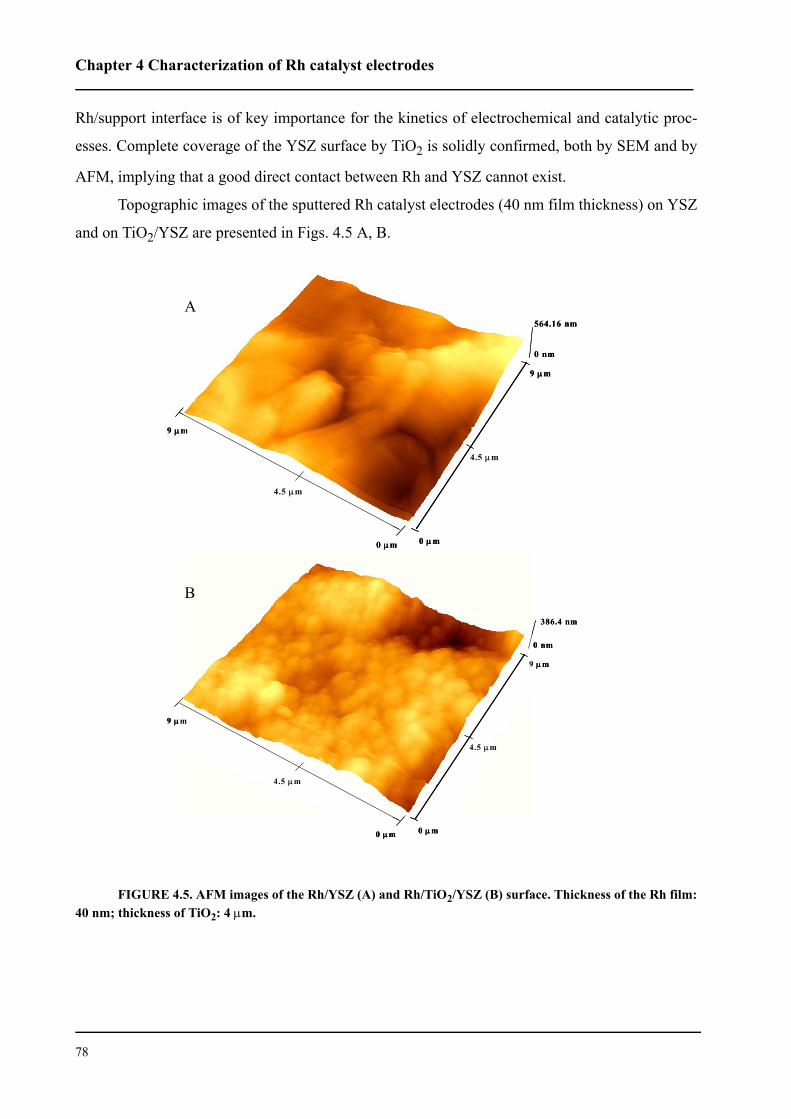
Chapter 4 Characterization of Rh catalyst electrodes
78
Rh/support interface is of key importance for the kinetics of electrochemical and catalytic proc-
esses. Complete coverage of the YSZ surface by TiO2 is solidly confirmed, both by SEM and by
AFM, implying that a good direct contact between Rh and YSZ cannot exist.
Topographic images of the sputtered Rh catalyst electrodes (40 nm film thickness) on YSZ
and on TiO2/YSZ are presented in Figs. 4.5 A, B.
FIGURE 4.5. AFM images of the Rh/YSZ (A) and Rh/TiO2/YSZ (B) surface. Thickness of the Rh film:40 nm; thickness of TiO2: 4 µm.
0 µm0 µm
9 µm
4.5 µm
4.5 µm
564.16 nm
0 nm
9 µm
0 µm0 µm
9 µm
4.5 µm
4.5 µm
564.16 nm
0 nm
9 µm
0 µm0 µm
9 µm
4.5 µm
4.5 µm
386.4 nm
0 nm
9 µm
0 µm0 µm
9 µm
4.5 µm
4.5 µm
386.4 nm
0 nm
9 µm
A
B
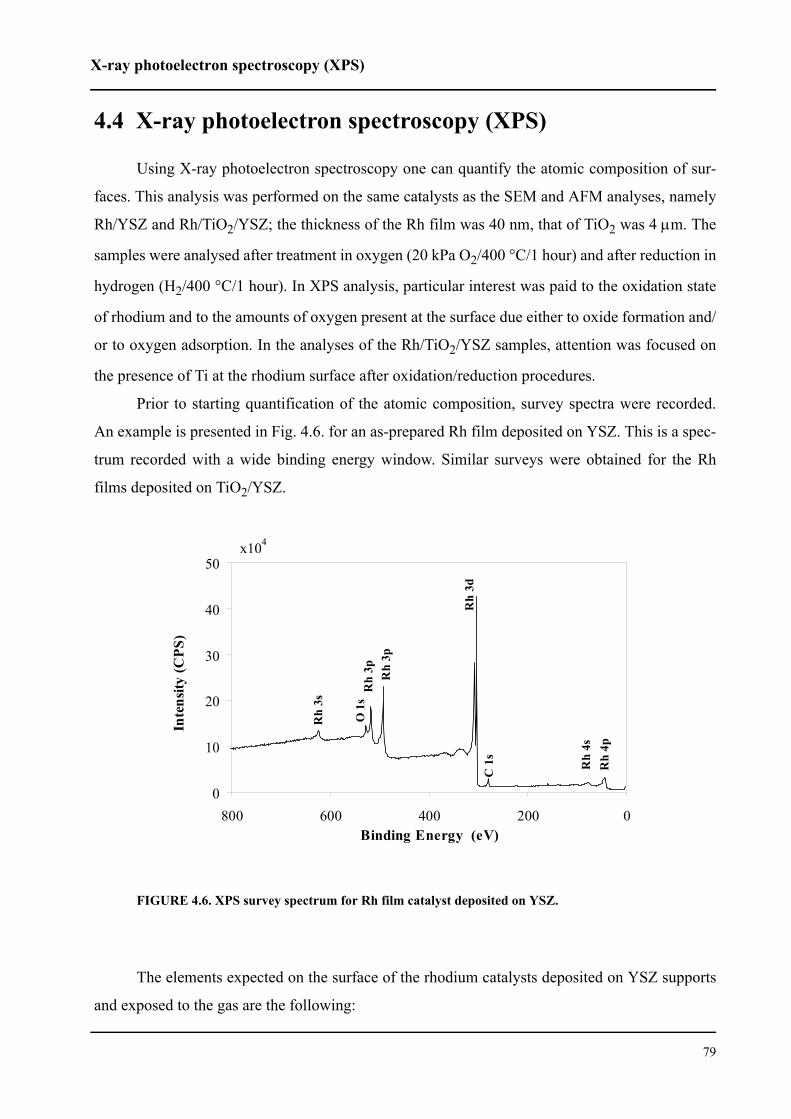
X-ray photoelectron spectroscopy (XPS)
79
4.4 X-ray photoelectron spectroscopy (XPS)
Using X-ray photoelectron spectroscopy one can quantify the atomic composition of sur-
faces. This analysis was performed on the same catalysts as the SEM and AFM analyses, namely
Rh/YSZ and Rh/TiO2/YSZ; the thickness of the Rh film was 40 nm, that of TiO2 was 4 µm. The
samples were analysed after treatment in oxygen (20 kPa O2/400 °C/1 hour) and after reduction in
hydrogen (H2/400 °C/1 hour). In XPS analysis, particular interest was paid to the oxidation state
of rhodium and to the amounts of oxygen present at the surface due either to oxide formation and/
or to oxygen adsorption. In the analyses of the Rh/TiO2/YSZ samples, attention was focused on
the presence of Ti at the rhodium surface after oxidation/reduction procedures.
Prior to starting quantification of the atomic composition, survey spectra were recorded.
An example is presented in Fig. 4.6. for an as-prepared Rh film deposited on YSZ. This is a spec-
trum recorded with a wide binding energy window. Similar surveys were obtained for the Rh
films deposited on TiO2/YSZ.
FIGURE 4.6. XPS survey spectrum for Rh film catalyst deposited on YSZ.
The elements expected on the surface of the rhodium catalysts deposited on YSZ supports
and exposed to the gas are the following:
0
10
20
30
40
50
0200400600800Binding Energy (eV)
Inte
nsity
(CPS
)
x104
Rh
3s
O 1
sR
h 3p Rh
3p
Rh
3dC
1s
Rh
4sR
h 4p
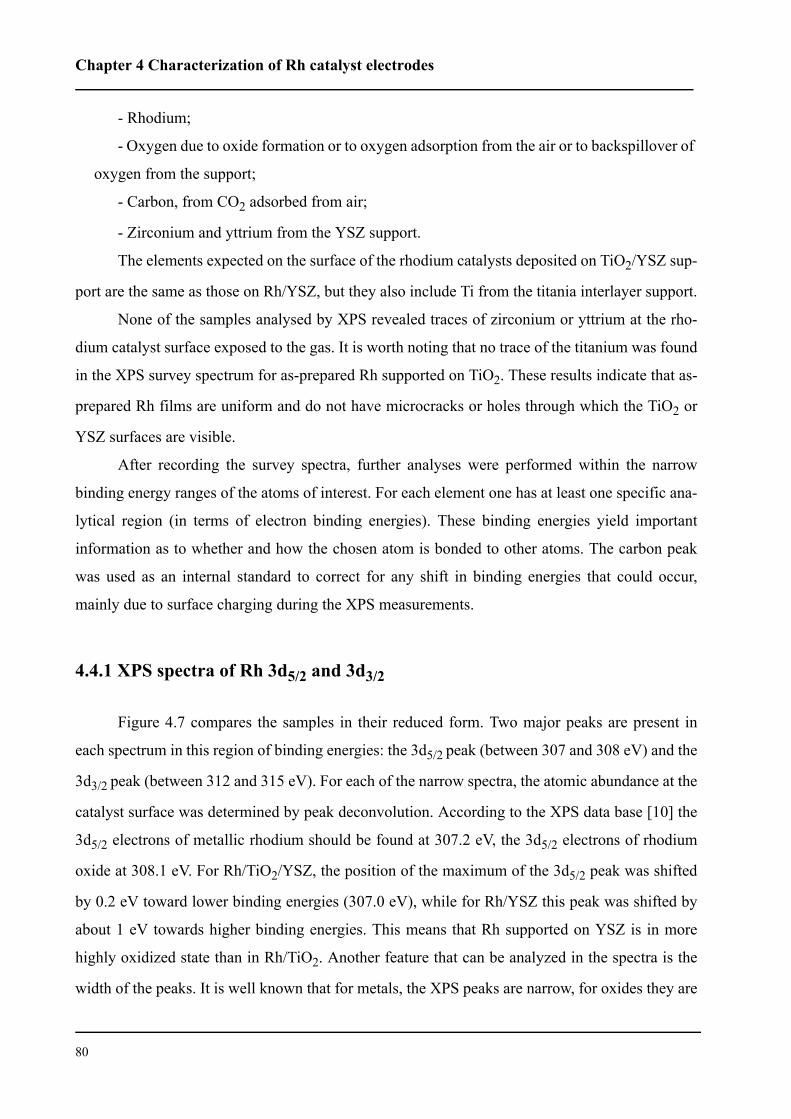
Chapter 4 Characterization of Rh catalyst electrodes
80
- Rhodium;
- Oxygen due to oxide formation or to oxygen adsorption from the air or to backspillover of
oxygen from the support;
- Carbon, from CO2 adsorbed from air;
- Zirconium and yttrium from the YSZ support.
The elements expected on the surface of the rhodium catalysts deposited on TiO2/YSZ sup-
port are the same as those on Rh/YSZ, but they also include Ti from the titania interlayer support.
None of the samples analysed by XPS revealed traces of zirconium or yttrium at the rho-
dium catalyst surface exposed to the gas. It is worth noting that no trace of the titanium was found
in the XPS survey spectrum for as-prepared Rh supported on TiO2. These results indicate that as-
prepared Rh films are uniform and do not have microcracks or holes through which the TiO2 or
YSZ surfaces are visible.
After recording the survey spectra, further analyses were performed within the narrow
binding energy ranges of the atoms of interest. For each element one has at least one specific ana-
lytical region (in terms of electron binding energies). These binding energies yield important
information as to whether and how the chosen atom is bonded to other atoms. The carbon peak
was used as an internal standard to correct for any shift in binding energies that could occur,
mainly due to surface charging during the XPS measurements.
4.4.1 XPS spectra of Rh 3d5/2 and 3d3/2
Figure 4.7 compares the samples in their reduced form. Two major peaks are present in
each spectrum in this region of binding energies: the 3d5/2 peak (between 307 and 308 eV) and the
3d3/2 peak (between 312 and 315 eV). For each of the narrow spectra, the atomic abundance at the
catalyst surface was determined by peak deconvolution. According to the XPS data base [10] the
3d5/2 electrons of metallic rhodium should be found at 307.2 eV, the 3d5/2 electrons of rhodium
oxide at 308.1 eV. For Rh/TiO2/YSZ, the position of the maximum of the 3d5/2 peak was shifted
by 0.2 eV toward lower binding energies (307.0 eV), while for Rh/YSZ this peak was shifted by
about 1 eV towards higher binding energies. This means that Rh supported on YSZ is in more
highly oxidized state than in Rh/TiO2. Another feature that can be analyzed in the spectra is the
width of the peaks. It is well known that for metals, the XPS peaks are narrow, for oxides they are
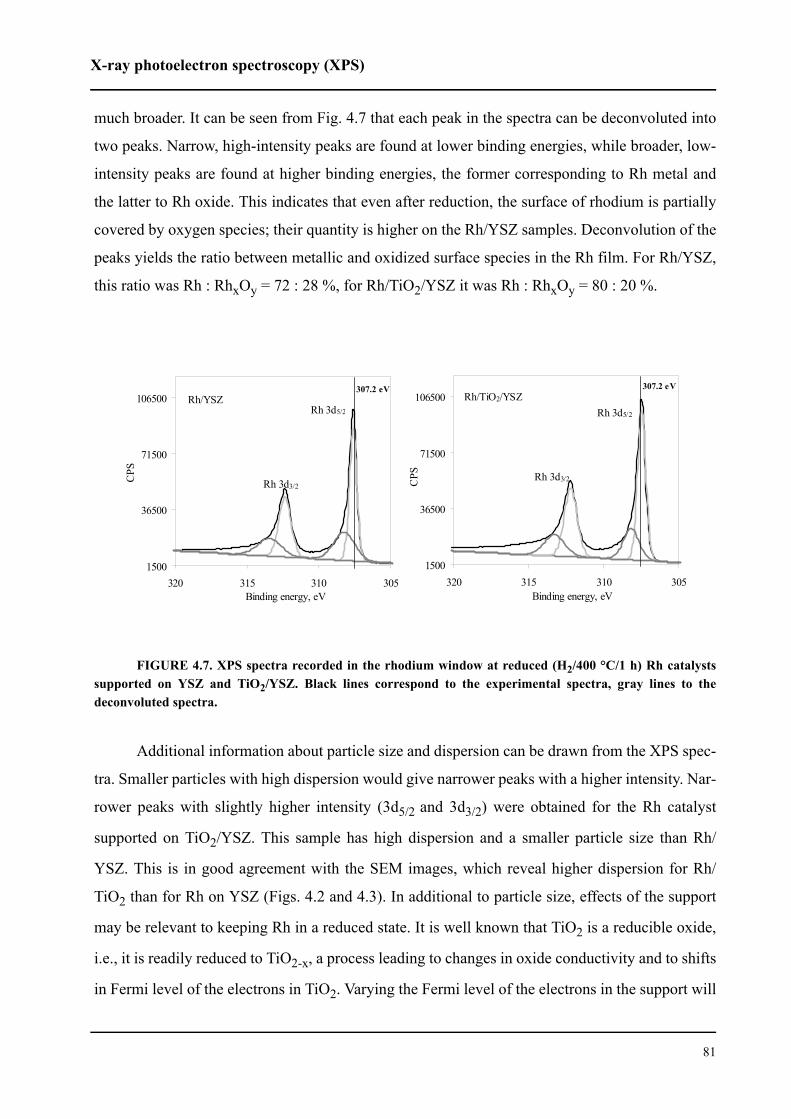
X-ray photoelectron spectroscopy (XPS)
81
much broader. It can be seen from Fig. 4.7 that each peak in the spectra can be deconvoluted into
two peaks. Narrow, high-intensity peaks are found at lower binding energies, while broader, low-
intensity peaks are found at higher binding energies, the former corresponding to Rh metal and
the latter to Rh oxide. This indicates that even after reduction, the surface of rhodium is partially
covered by oxygen species; their quantity is higher on the Rh/YSZ samples. Deconvolution of the
peaks yields the ratio between metallic and oxidized surface species in the Rh film. For Rh/YSZ,
this ratio was Rh : RhxOy = 72 : 28 %, for Rh/TiO2/YSZ it was Rh : RhxOy = 80 : 20 %.
FIGURE 4.7. XPS spectra recorded in the rhodium window at reduced (H2/400 °C/1 h) Rh catalystssupported on YSZ and TiO2/YSZ. Black lines correspond to the experimental spectra, gray lines to thedeconvoluted spectra.
Additional information about particle size and dispersion can be drawn from the XPS spec-
tra. Smaller particles with high dispersion would give narrower peaks with a higher intensity. Nar-
rower peaks with slightly higher intensity (3d5/2 and 3d3/2) were obtained for the Rh catalyst
supported on TiO2/YSZ. This sample has high dispersion and a smaller particle size than Rh/
YSZ. This is in good agreement with the SEM images, which reveal higher dispersion for Rh/
TiO2 than for Rh on YSZ (Figs. 4.2 and 4.3). In additional to particle size, effects of the support
may be relevant to keeping Rh in a reduced state. It is well known that TiO2 is a reducible oxide,
i.e., it is readily reduced to TiO2-x, a process leading to changes in oxide conductivity and to shifts
in Fermi level of the electrons in TiO2. Varying the Fermi level of the electrons in the support will
1500
36500
71500
106500
305310315320Binding energy, eV
CPS
Rh/TiO2/YSZRh 3d5/2
Rh 3d3/2
307.2 eV
1500
36500
71500
106500
305310315320Binding energy, eV
CPS
Rh/YSZRh 3d5/2
Rh 3d3/2
307.2 eV
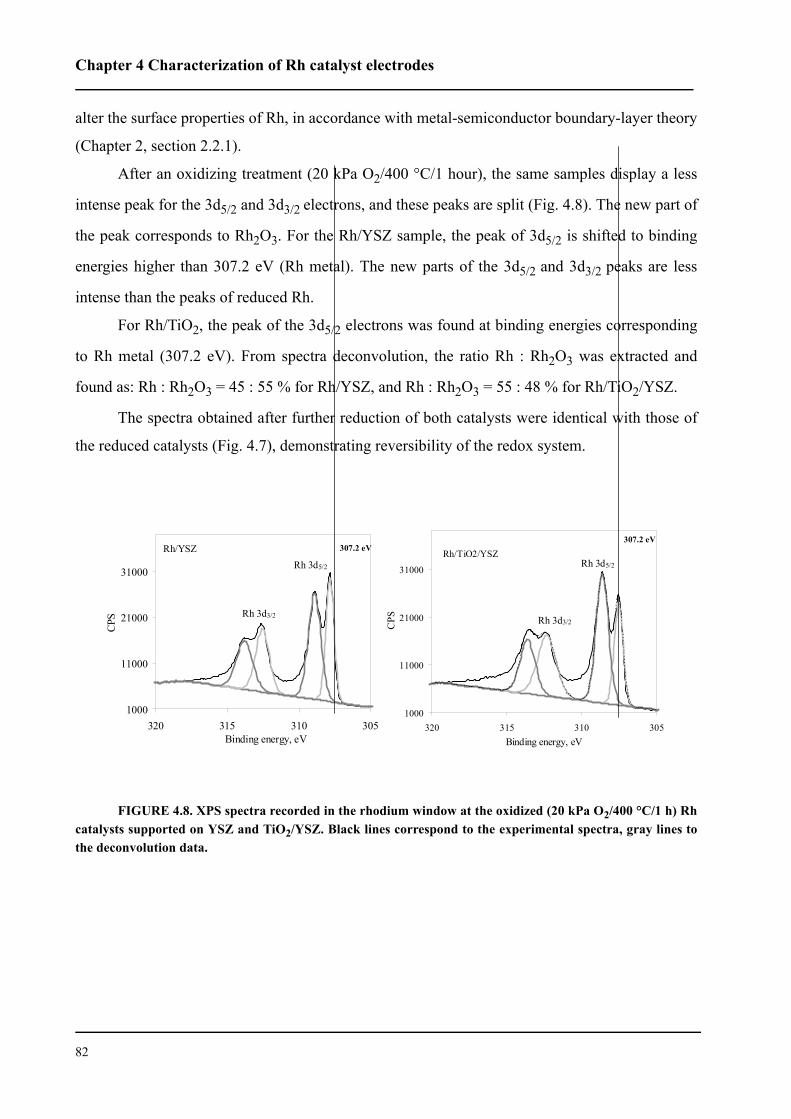
Chapter 4 Characterization of Rh catalyst electrodes
82
alter the surface properties of Rh, in accordance with metal-semiconductor boundary-layer theory
(Chapter 2, section 2.2.1).
After an oxidizing treatment (20 kPa O2/400 °C/1 hour), the same samples display a less
intense peak for the 3d5/2 and 3d3/2 electrons, and these peaks are split (Fig. 4.8). The new part of
the peak corresponds to Rh2O3. For the Rh/YSZ sample, the peak of 3d5/2 is shifted to binding
energies higher than 307.2 eV (Rh metal). The new parts of the 3d5/2 and 3d3/2 peaks are less
intense than the peaks of reduced Rh.
For Rh/TiO2, the peak of the 3d5/2 electrons was found at binding energies corresponding
to Rh metal (307.2 eV). From spectra deconvolution, the ratio Rh : Rh2O3 was extracted and
found as: Rh : Rh2O3 = 45 : 55 % for Rh/YSZ, and Rh : Rh2O3 = 55 : 48 % for Rh/TiO2/YSZ.
The spectra obtained after further reduction of both catalysts were identical with those of
the reduced catalysts (Fig. 4.7), demonstrating reversibility of the redox system.
FIGURE 4.8. XPS spectra recorded in the rhodium window at the oxidized (20 kPa O2/400 °C/1 h) Rhcatalysts supported on YSZ and TiO2/YSZ. Black lines correspond to the experimental spectra, gray lines tothe deconvolution data.
1000
11000
21000
31000
305310315320Binding energy, eV
CPS
Rh/TiO2/YSZRh 3d5/2
307.2 eV
Rh 3d3/2
1000
11000
21000
31000
305310315320Binding energy, eV
CPS
Rh/YSZRh 3d5/2
Rh 3d3/2
307.2 eV
X-ray photoelectron spectroscopy (XPS)
83
4.4.2 XPS spectra of O 1s
Figure 4.9 shows the O1s spectra of Rh/YSZ and Rh/TiO2/YSZ samples in their reduced
state (H2/400 °C/1 hour). The binding energy of 530.4 eV corresponds to strongly bonded oxygen
(in the form of Rh2O3). Neither of the two samples yields evidence for strongly bonded oxygen.
This means that oxygen present on the Rh surface after reduction (Fig. 4.7) is weakly bonded oxy-
gen originating, either from air (during transfer of the samples from the reactor to the XPS vac-
uum chamber) or from the YSZ or TiO2 support. Strongly bonded oxygen in the form of Rh2O3
oxide is not present on the Rh surface after reduction. Moreover, two kinds of weakly bonded
oxygen species are detected on the Rh surface, one at a binding energy of 531 eV and the other at
532.8 eV. The first one may be oxygen from the solid electrolyte, the second one probably is air
oxygen bonded to carbon.
FIGURE 4.9. XPS spectra recorded in the oxygen window at reduced (H2/400 °C/1 h) Rh catalystssupported on YSZ and TiO2/YSZ. Black lines correspond to the experimental spectra, gray lines to thedeconvoluted spectra.
The amount of oxygen present on the Rh surface changes strongly upon oxidation (1 h/O2/
400 °C) (Fig. 4.10) and is indicative of Rh2O3 formation. Weakly bonded oxygen remains on the
surface but produces a less intense peak than found for the reduced Rh surface.
The XPS analyses were used to quantify the atomic surface compositions of the rhodium-
based catalysts supported on YSZ and TiO2/YSZ. The atomic abundance of the two catalysts was
13000
14000
15000
16000
17000
528530532534536538Binding energy, eV
CPS
Rh/YSZ
O 1s
530.4 eV Rh/TiO2/YSZ
14000
15000
16000
17000
528530532534536538Binding energy, eV
CPS
O 1s530.4 eV
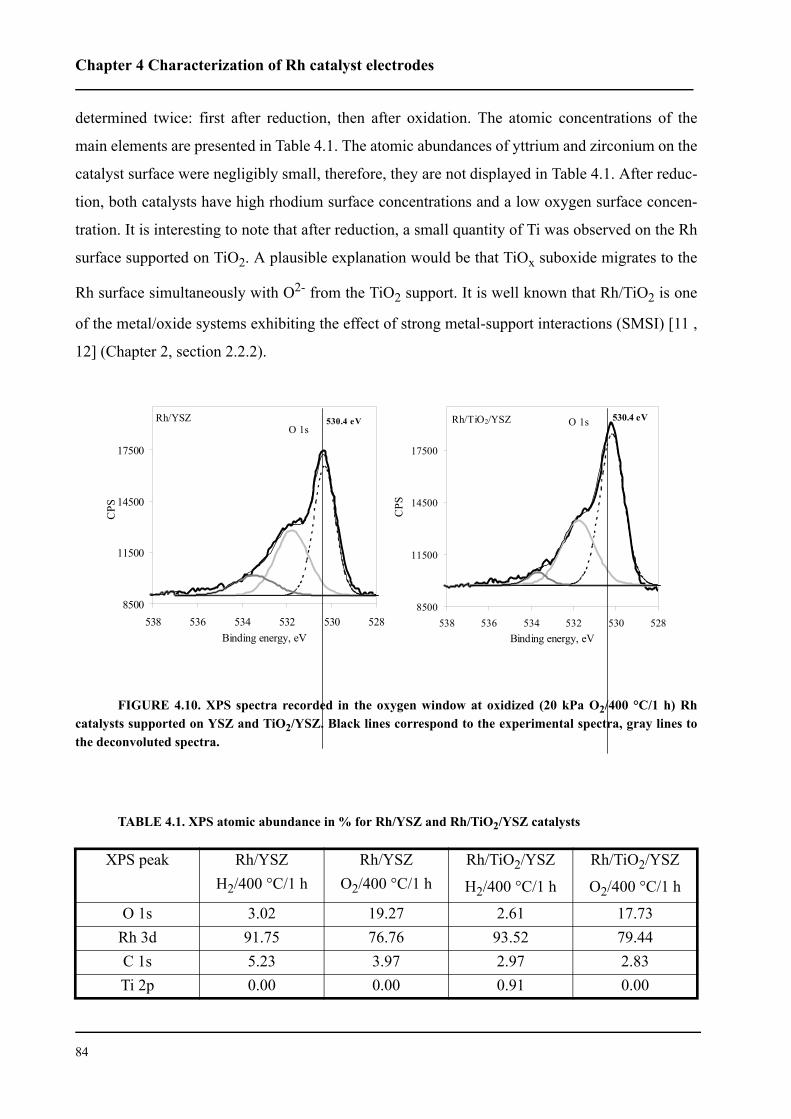
Chapter 4 Characterization of Rh catalyst electrodes
84
determined twice: first after reduction, then after oxidation. The atomic concentrations of the
main elements are presented in Table 4.1. The atomic abundances of yttrium and zirconium on the
catalyst surface were negligibly small, therefore, they are not displayed in Table 4.1. After reduc-
tion, both catalysts have high rhodium surface concentrations and a low oxygen surface concen-
tration. It is interesting to note that after reduction, a small quantity of Ti was observed on the Rh
surface supported on TiO2. A plausible explanation would be that TiOx suboxide migrates to the
Rh surface simultaneously with O2- from the TiO2 support. It is well known that Rh/TiO2 is one
of the metal/oxide systems exhibiting the effect of strong metal-support interactions (SMSI) [11 ,
12] (Chapter 2, section 2.2.2).
FIGURE 4.10. XPS spectra recorded in the oxygen window at oxidized (20 kPa O2/400 °C/1 h) Rhcatalysts supported on YSZ and TiO2/YSZ. Black lines correspond to the experimental spectra, gray lines tothe deconvoluted spectra.
TABLE 4.1. XPS atomic abundance in % for Rh/YSZ and Rh/TiO2/YSZ catalysts
XPS peak Rh/YSZ H2/400 °C/1 h
Rh/YSZO2/400 °C/1 h
Rh/TiO2/YSZ
H2/400 °C/1 h
Rh/TiO2/YSZ
O2/400 °C/1 h
O 1s 3.02 19.27 2.61 17.73Rh 3d 91.75 76.76 93.52 79.44C 1s 5.23 3.97 2.97 2.83Ti 2p 0.00 0.00 0.91 0.00
O 1s
8500
11500
14500
17500
528530532534536538Binding energy, eV
CPS
Rh/YSZ 530.4 eV O 1s
8500
11500
14500
17500
528530532534536538Binding energy, eV
CPS
Rh/TiO2/YSZ 530.4 eV
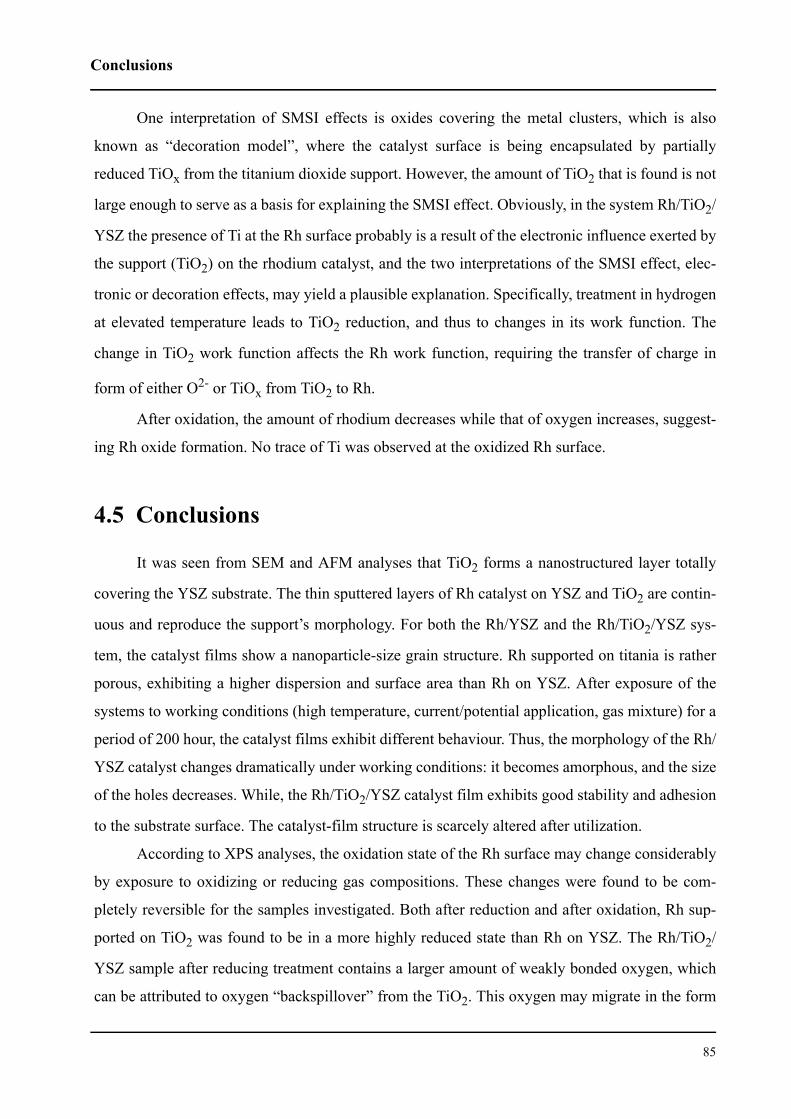
Conclusions
85
One interpretation of SMSI effects is oxides covering the metal clusters, which is also
known as “decoration model”, where the catalyst surface is being encapsulated by partially
reduced TiOx from the titanium dioxide support. However, the amount of TiO2 that is found is not
large enough to serve as a basis for explaining the SMSI effect. Obviously, in the system Rh/TiO2/
YSZ the presence of Ti at the Rh surface probably is a result of the electronic influence exerted by
the support (TiO2) on the rhodium catalyst, and the two interpretations of the SMSI effect, elec-
tronic or decoration effects, may yield a plausible explanation. Specifically, treatment in hydrogen
at elevated temperature leads to TiO2 reduction, and thus to changes in its work function. The
change in TiO2 work function affects the Rh work function, requiring the transfer of charge in
form of either O2- or TiOx from TiO2 to Rh.
After oxidation, the amount of rhodium decreases while that of oxygen increases, suggest-
ing Rh oxide formation. No trace of Ti was observed at the oxidized Rh surface.
4.5 Conclusions
It was seen from SEM and AFM analyses that TiO2 forms a nanostructured layer totally
covering the YSZ substrate. The thin sputtered layers of Rh catalyst on YSZ and TiO2 are contin-
uous and reproduce the support’s morphology. For both the Rh/YSZ and the Rh/TiO2/YSZ sys-
tem, the catalyst films show a nanoparticle-size grain structure. Rh supported on titania is rather
porous, exhibiting a higher dispersion and surface area than Rh on YSZ. After exposure of the
systems to working conditions (high temperature, current/potential application, gas mixture) for a
period of 200 hour, the catalyst films exhibit different behaviour. Thus, the morphology of the Rh/
YSZ catalyst changes dramatically under working conditions: it becomes amorphous, and the size
of the holes decreases. While, the Rh/TiO2/YSZ catalyst film exhibits good stability and adhesion
to the substrate surface. The catalyst-film structure is scarcely altered after utilization.
According to XPS analyses, the oxidation state of the Rh surface may change considerably
by exposure to oxidizing or reducing gas compositions. These changes were found to be com-
pletely reversible for the samples investigated. Both after reduction and after oxidation, Rh sup-
ported on TiO2 was found to be in a more highly reduced state than Rh on YSZ. The Rh/TiO2/
YSZ sample after reducing treatment contains a larger amount of weakly bonded oxygen, which
can be attributed to oxygen “backspillover” from the TiO2. This oxygen may migrate in the form
Chapter 4 Characterization of Rh catalyst electrodes
86
of TiOx, since after reduction some quantity of Ti was found on the Rh surface but disappeared
after oxidation of the catalyst. The driving force for this migration is the difference in the work
functions of Rh and TiO2, especially after reducing treatment leading to electronic-type SMSI.
4.6 References
1. V. A. Tsipouriari, A. M. Efstathiou, and X. E. Verykios, J. Catal., 161 (1996) 31.
2. A. M. Efstathiou, A. Kladi, V. A. Tsipouriari, and X. E. Verykios, J. Catal., 158
(1996) 64.
3. Z. L. Zhang, V. A. Tsipouriari, A. M. Efstathiou, and X. E. Verykios, J. Catal., 158
(1996) 51.
4. R. J. H. Voorhoeve, in Advanced materials in catalysis J. J. Burton and R. L. Gar-
ten, eds., Academic Press, New York, (1977).
5. V. P. Zhdanov and B. Kasemo, Surface Science Reports, 29 (1997) 31.
6. S. H. Oh and J. E. Carpenter, J. Catal., 80 (1983) 472.
7. G. L. Kellog, Surface Sci., 171 (1986) 359.
8. V. Andera, Applied Surf. Sci., 51 (1991) 1.
9. S. Bernal, J. J. Calvino, M. A. Cauqui, J. M. Gatica, C. L. Cartes, J. A. P. Omil, and
J. M. Pintado, Catal. Today, 77 (2003) 385.
10. C. Wagner, W. Riggs, L. Davis, and J. Moulder, Handbook of x-ray photoelectron
spectroscopy Perkin Elmer Corporation, Physical Electronics Division, Eden Prai-
rie, Minnesota (1979).
11. S. J. Tauster, S. C. Fung, and R. L. Garten, JACS, 100 (1978) 170.
12. S. J. Tauster, S. C. Fung, R. T. K. Baker, and J. A. Horsley, Science, 211 (1981)
1121.
87
CHAPTER 5 Electrochemical characterization of
the Rh catalysts: Polarization measurements
In the present chapter, the first studies ever conducted are reported, of the
kinetics of the oxygen couple O2/O2- at Rh thin-film electrodes interfaced
with the pure ionic conductor, YSZ (ZrO2 + Y2O3 solid oxide electrolyte),
and with the mixed electronic-ionic conductor, TiO2 supported on YSZ.
These studies were performed over a range of oxygen partial pressures from
0.5 to 20 kPa at temperatures of 450 to 600 °C. The exchange current densi-
ties determined at different temperatures and oxygen partial pressures (Po2)
provide important information about the kinetics and mechanism of the O2/
O2- electrode reaction at the interface. At Rh/YSZ, the exchange current
densities are less than half those at Rh/TiO2(4 µm)/YSZ, and decrease fur-
ther with increasing titania thickness. At the Rh electrode supported on
YSZ, an activation energy of 126 kJ/mol was estimated for the oxygen evo-
lution and oxygen reduction reaction close to equilibrium. At Rh/TiO2/YSZ,
the activation energy decreases with increasing TiO2 layer thickness, and
has values of 132.5, 101.4, and 83.4 kJ/mol for layer thicknesses of 4, 20,
and 40 µm. On the basis of the polarization measurements, a mechanism of
the oxygen evolution and oxygen reduction was proposed.
Chapter 5 Electrochemical characterization of the Rh catalysts: Polarization measurements
88
5.1 Introduction
Electrochemical cells with solid oxide electrolytes have attracted much attention for use in
high temperature fuel cells [1] and sensor technology [2, 3]. The O2- conductors such as Y2O3-
stabilized ZrO2 (YSZ) play an increasingly important role in heterogeneous catalysis, both as
nanodispersed catalyst carriers and as supports of thick or thin, electrochemically promoted films
[4-8]. Interest in these devices has been the motivation for a large number of investigations on the
kinetics and mechanism of the reduction and oxidation of oxygen (the O2/O2- couple), which is a
very fundamental electrochemical reaction:
1/2 O2(g) + 2 e- O2- (5.1)
or, using Kröger-Vink notation:
1/2 O2(g) + 2 e- + Vö Oox (5.2)
where Vö and Oox are a doubly charged oxygen vacancy and an oxygen atom, respectively, occur-
ring at normal oxygen sites in the electrolyte.
Oxygen exchange is a three-phase reaction between oxygen in the gas phase, electrons in
the electrode, and oxygen vacancies in the electrolyte. In solid electrolyte cells, the electrodes
typically are thin and porous, conductive metal films adhering to the smooth electrolyte surface.
These metal electrodes have complex geometric and physical properties complicating the kinetics
of the oxygen reaction. To date no consensus has in fact been reached as to details of the reaction
mechanism and location of the electrochemical reaction sites in the system O2/metal/electrolyte
(see Chapter 2, section 2.3).
No investigations at Rh electrodes were found in the literature. The present chapter reports
the first studies ever conducted of the kinetics of the oxygen couple O2/O2 at Rh thin-film elec-
trodes interfaced with the pure ionic conductor, YSZ (ZrO2 + Y2O3 solid oxide electrolyte), and
with the mixed electronic-ionic conductor, TiO2 supported on YSZ. These studies were per-
formed over a range of oxygen partial pressures from 0.5 to 20 kPa at temperatures of 450 to 600
°C. The exchange current densities, i0, and the influence of different parameters on i0 were inves-
tigated for both systems (Rh/YSZ and Rh/TiO2/YSZ). On the basis of these data, an attempt was
Results
89
made to identify the mechanism of the process of Eq. (5.1) at rhodium film electrodes interfaced
with YSZ and TiO2/YSZ.
5.2 Results
5.2.1 Basic relations relevant to the work
The simplest possible electrode process is one where species A and B engage in a one-elec-
tron transfer or exchange at the interface without being involved in any other chemical step:
A + e- B (5.3)
The Butler-Volmer equation can be written for a one-step, one-electron process as [9]:
(5.4)
where α and 1−α are the transfer coefficients; F is the Faraday constant; f = F/RT; k0 is the stand-
ard rate constant; CA and CB are the concentrations of the reactants and products, respectively; η
is the overpotential; and S is the electrode’s surface area.
The oxygen exchange reaction (formulated above as an overall reaction Eq. (5.1)) is a mul-
tistep reaction. In chemical kinetic studies, one often can simplify the prediction and analysis of
behavior by recognizing that a single step of a process is much more sluggish than all the others,
and hence controls the rate of the overall reaction. If the process is an electrode process, this rate-
determining step (rds) can be a heterogeneous electron transfer reaction. In developing a kinetic
equation for a process consisting of several steps, one may consider that an overall process in
which A and B are coupled by an overall multielectron process [9]:
A + ne- B (5.5)
proceeds by a mechanism having the following general character:
A + n’e- A’ (net result of steps preceding the rds)
A’ + e- B’ (rds) (5.6)
i FSk0 CA 0 t,( )e αfη– CB 0 t,( )e 1 α–( )fη–[ ]=
Chapter 5 Electrochemical characterization of the Rh catalysts: Polarization measurements
90
R’ + n”e- B (net result of steps following the rds)
where n, the total number of electrons, may be written as n’ + n” + 1 = n. This equation remains
valid when either or both of n’ or n” are zero.
The current- potential characteristic for a multistep reaction can then be written as
(5.7)
where k0rds and α apply to the rds. This relation is obtained from Eq. (5.4) written for the rds, and
multiplied by n, because each net conversion of A to B results in the flow, not just of one electron
but of n electrons across the interface.
The Butler-Volmer equation is of special interest in two limiting cases. At overpotentials
much lower than RT/F (low-field approximation) both exponential terms in the Butler-Volmer
equation can be linearized, and Eq. (5.7) becomes:
(5.8)
The second limiting case is that found at very high overpotentials (η >> RT/F), where the
high-field approximation of the Butler-Volmer equation is obtained:
(5.9)
where α is the transfer coefficient of either the cathodic or the anodic process, depending on
which exponential term does not vanish. According to Eq. (5.9) (the Tafel equation), the apparent
values of the exchange current density and the corresponding charge transfer coefficient can be
obtained from the slope and intercept of the linear relationship between ln i and η.
Polarization measurements have been performed at Rh/YSZ and Rh/TiO2/YSZ electrodes
in the low-polarization region, where the low-field approximation of the Butler-Volmer equation
is valid. At high overpotentials, precise measurements are difficult due to a significant contribu-
tion of ohmic resistance of the solid electrolyte to the current-potential characteristics. Therefore,
most of the polarization measurements in Rh/YSZ and Rh/TiO2/YSZ electrochemical cells were
made in the region of low overpotentials, where the influence of the ohmic resistance is negligi-
ble. These measurements were carried out at different T and Po2, and used to estimate the
i nFSkrds0 CA 0 t,( )e αfη– CR 0 t,( )e 1 α–( )fη–[ ]=
i i0nFηRT
----------- =
iln i0 α nFRT-------
η+ln=
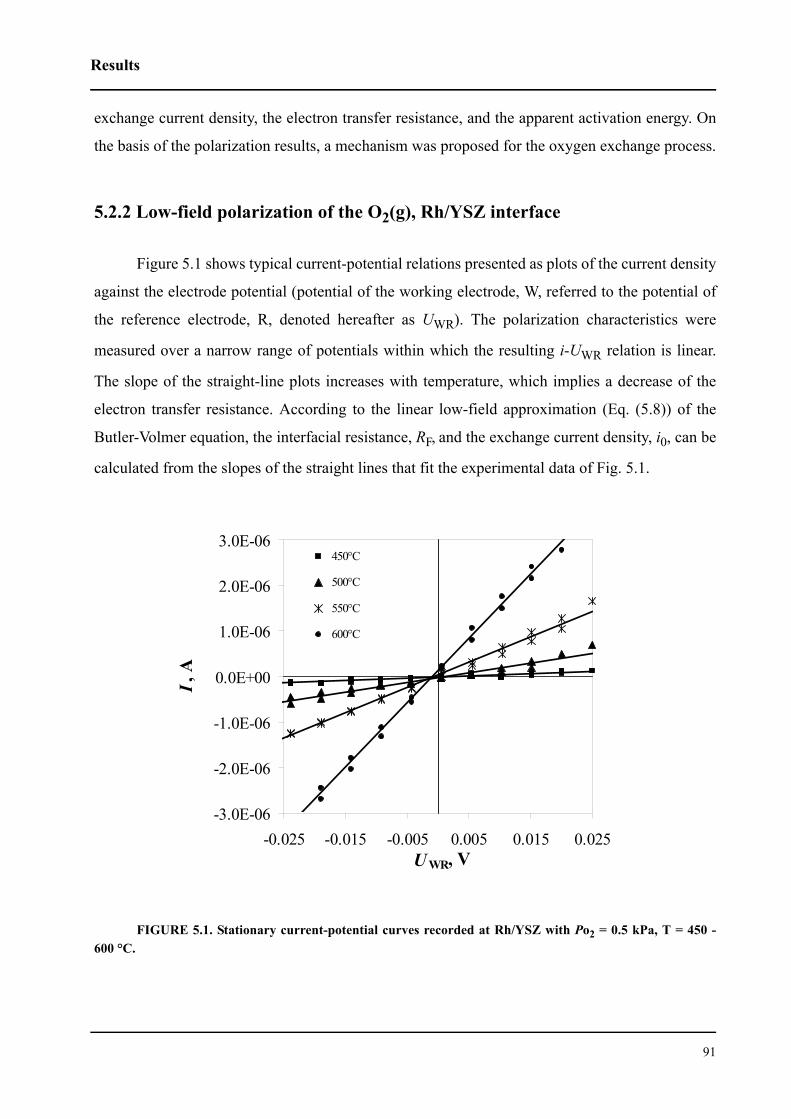
Results
91
exchange current density, the electron transfer resistance, and the apparent activation energy. On
the basis of the polarization results, a mechanism was proposed for the oxygen exchange process.
5.2.2 Low-field polarization of the O2(g), Rh/YSZ interface
Figure 5.1 shows typical current-potential relations presented as plots of the current density
against the electrode potential (potential of the working electrode, W, referred to the potential of
the reference electrode, R, denoted hereafter as UWR). The polarization characteristics were
measured over a narrow range of potentials within which the resulting i-UWR relation is linear.
The slope of the straight-line plots increases with temperature, which implies a decrease of the
electron transfer resistance. According to the linear low-field approximation (Eq. (5.8)) of the
Butler-Volmer equation, the interfacial resistance, RF, and the exchange current density, i0, can be
calculated from the slopes of the straight lines that fit the experimental data of Fig. 5.1.
FIGURE 5.1. Stationary current-potential curves recorded at Rh/YSZ with Po2 = 0.5 kPa, T = 450 -600 °C.
-3.0E-06
-2.0E-06
-1.0E-06
0.0E+00
1.0E-06
2.0E-06
3.0E-06
-0.025 -0.015 -0.005 0.005 0.015 0.025UWR, V
I, A
450°C
500°C
550°C
600°C
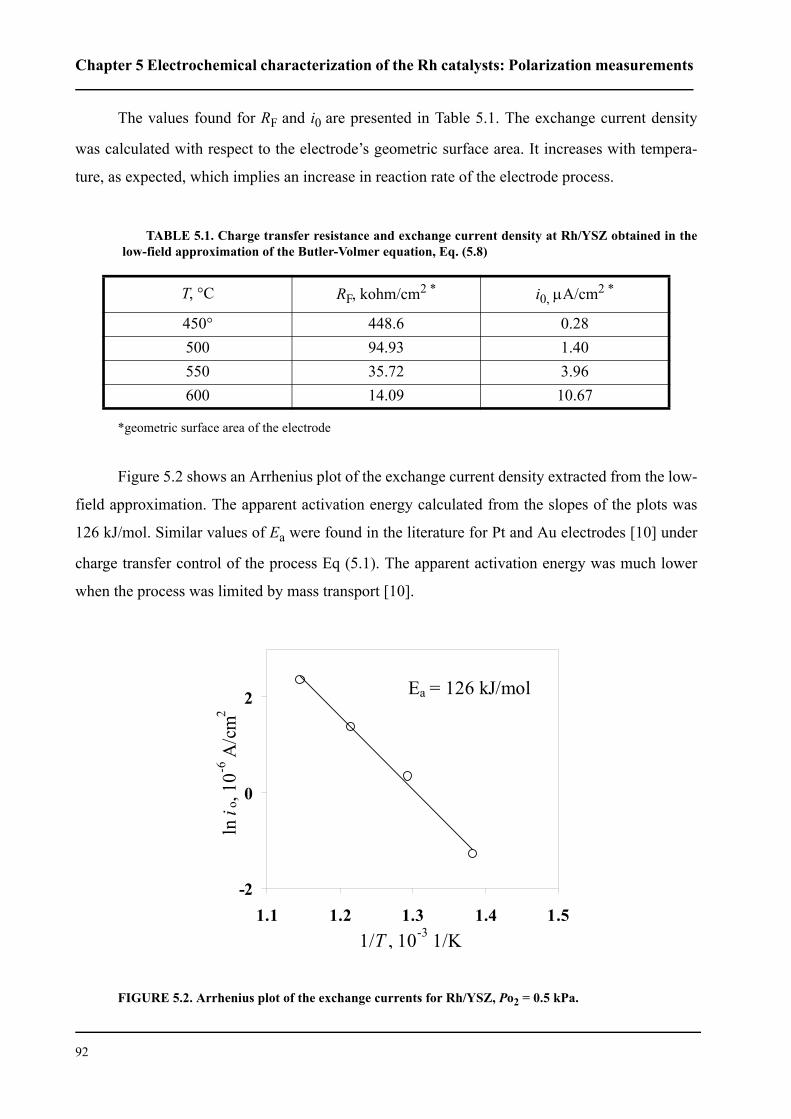
Chapter 5 Electrochemical characterization of the Rh catalysts: Polarization measurements
92
The values found for RF and i0 are presented in Table 5.1. The exchange current density
was calculated with respect to the electrode’s geometric surface area. It increases with tempera-
ture, as expected, which implies an increase in reaction rate of the electrode process.
*geometric surface area of the electrode
Figure 5.2 shows an Arrhenius plot of the exchange current density extracted from the low-
field approximation. The apparent activation energy calculated from the slopes of the plots was
126 kJ/mol. Similar values of Ea were found in the literature for Pt and Au electrodes [10] under
charge transfer control of the process Eq (5.1). The apparent activation energy was much lower
when the process was limited by mass transport [10].
FIGURE 5.2. Arrhenius plot of the exchange currents for Rh/YSZ, Po2 = 0.5 kPa.
TABLE 5.1. Charge transfer resistance and exchange current density at Rh/YSZ obtained in thelow-field approximation of the Butler-Volmer equation, Eq. (5.8)
T, °C RF, kohm/cm2 * i0, µA/cm2 *
450° 448.6 0.28500 94.93 1.40550 35.72 3.96600 14.09 10.67
-2
0
2
1.1 1.2 1.3 1.4 1.51/T , 10-3 1/K
ln i o
, 10-6
A/c
m2
Ea = 126 kJ/mol
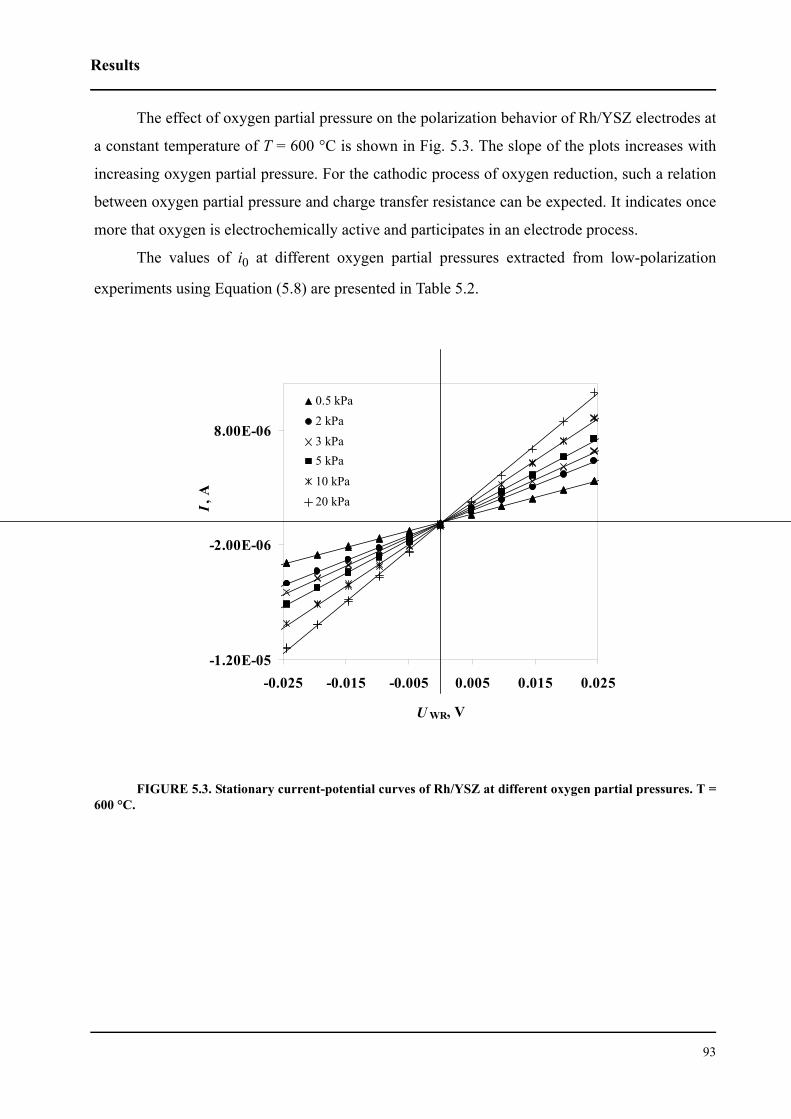
Results
93
The effect of oxygen partial pressure on the polarization behavior of Rh/YSZ electrodes at
a constant temperature of T = 600 °C is shown in Fig. 5.3. The slope of the plots increases with
increasing oxygen partial pressure. For the cathodic process of oxygen reduction, such a relation
between oxygen partial pressure and charge transfer resistance can be expected. It indicates once
more that oxygen is electrochemically active and participates in an electrode process.
The values of i0 at different oxygen partial pressures extracted from low-polarization
experiments using Equation (5.8) are presented in Table 5.2.
FIGURE 5.3. Stationary current-potential curves of Rh/YSZ at different oxygen partial pressures. T =600 °C.
-1.20E-05
-2.00E-06
8.00E-06
-0.025 -0.015 -0.005 0.005 0.015 0.025
UWR, V
I, A
0.5 kPa2 kPa3 kPa5 kPa
10 kPa20 kPa
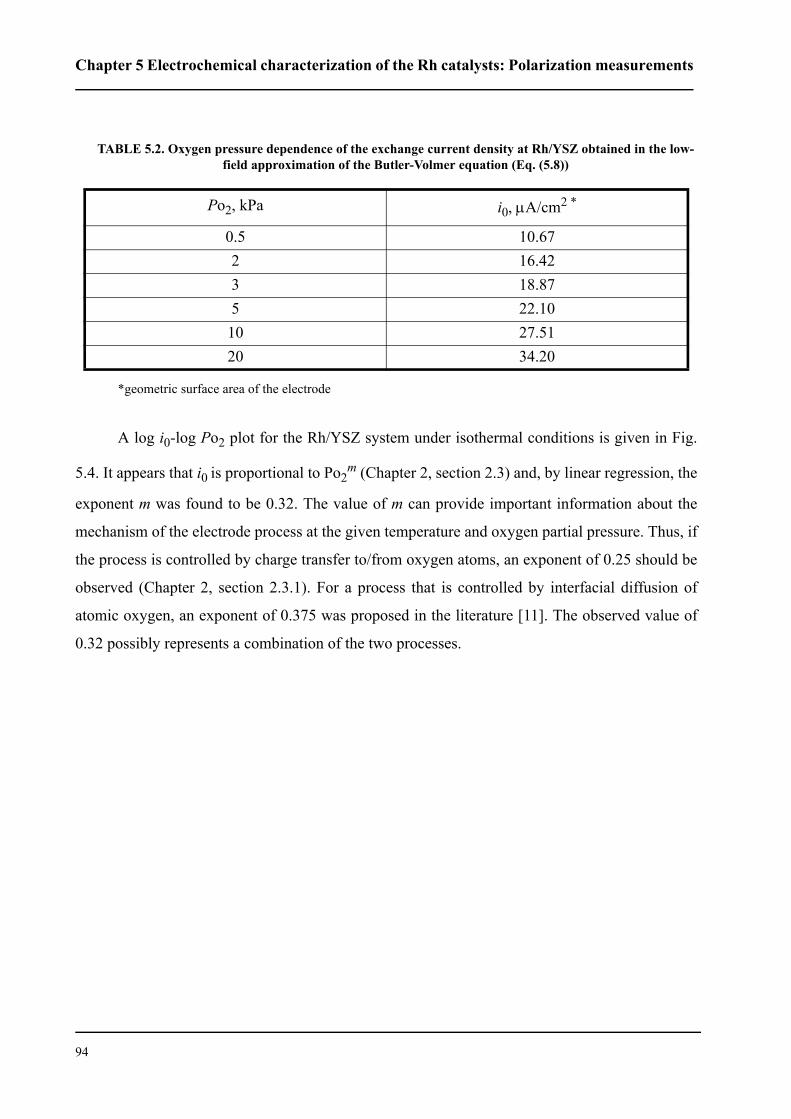
Chapter 5 Electrochemical characterization of the Rh catalysts: Polarization measurements
94
*geometric surface area of the electrode
A log i0-log Po2 plot for the Rh/YSZ system under isothermal conditions is given in Fig.
5.4. It appears that i0 is proportional to Po2m (Chapter 2, section 2.3) and, by linear regression, the
exponent m was found to be 0.32. The value of m can provide important information about the
mechanism of the electrode process at the given temperature and oxygen partial pressure. Thus, if
the process is controlled by charge transfer to/from oxygen atoms, an exponent of 0.25 should be
observed (Chapter 2, section 2.3.1). For a process that is controlled by interfacial diffusion of
atomic oxygen, an exponent of 0.375 was proposed in the literature [11]. The observed value of
0.32 possibly represents a combination of the two processes.
TABLE 5.2. Oxygen pressure dependence of the exchange current density at Rh/YSZ obtained in the low-field approximation of the Butler-Volmer equation (Eq. (5.8))
Po2, kPa i0, µA/cm2 *
0.5 10.672 16.423 18.875 22.1010 27.5120 34.20
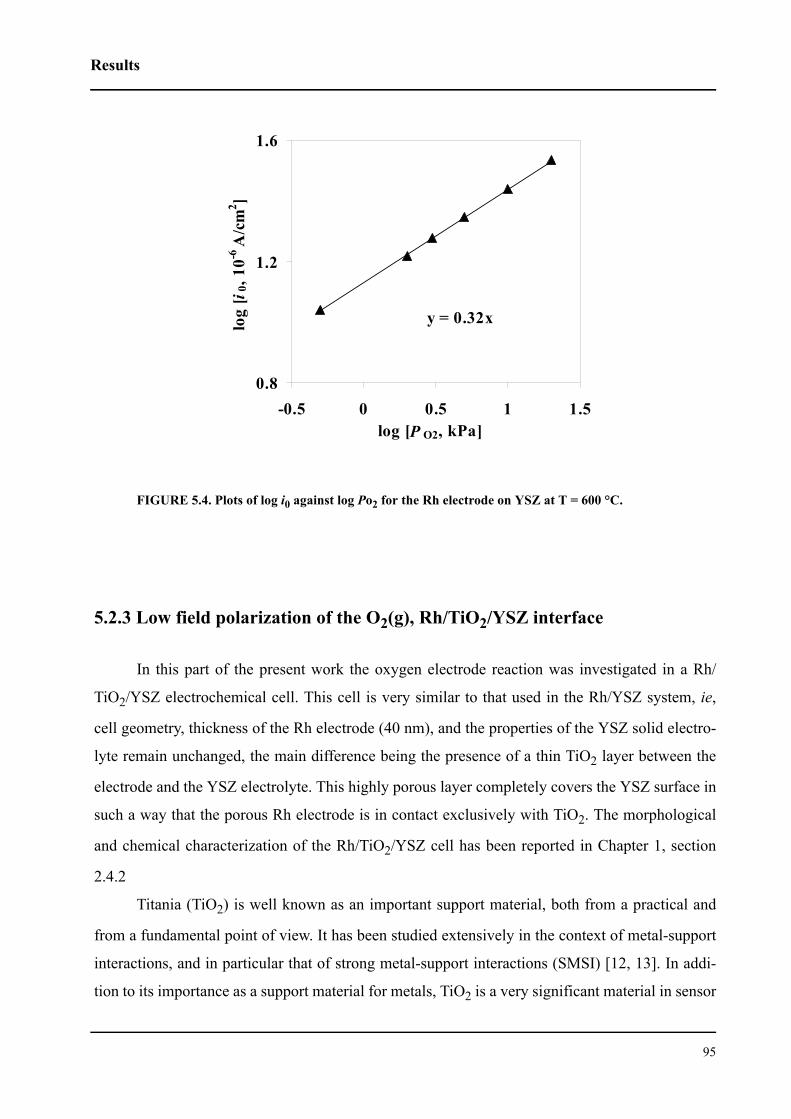
Results
95
FIGURE 5.4. Plots of log i0 against log Po2 for the Rh electrode on YSZ at T = 600 °C.
5.2.3 Low field polarization of the O2(g), Rh/TiO2/YSZ interface
In this part of the present work the oxygen electrode reaction was investigated in a Rh/
TiO2/YSZ electrochemical cell. This cell is very similar to that used in the Rh/YSZ system, ie,
cell geometry, thickness of the Rh electrode (40 nm), and the properties of the YSZ solid electro-
lyte remain unchanged, the main difference being the presence of a thin TiO2 layer between the
electrode and the YSZ electrolyte. This highly porous layer completely covers the YSZ surface in
such a way that the porous Rh electrode is in contact exclusively with TiO2. The morphological
and chemical characterization of the Rh/TiO2/YSZ cell has been reported in Chapter 1, section
2.4.2
Titania (TiO2) is well known as an important support material, both from a practical and
from a fundamental point of view. It has been studied extensively in the context of metal-support
interactions, and in particular that of strong metal-support interactions (SMSI) [12, 13]. In addi-
tion to its importance as a support material for metals, TiO2 is a very significant material in sensor
y = 0.32x
0.8
1.2
1.6
-0.5 0 0.5 1 1.5log [P O2, kPa]
log
[i0,
10-6
A/c
m2 ]
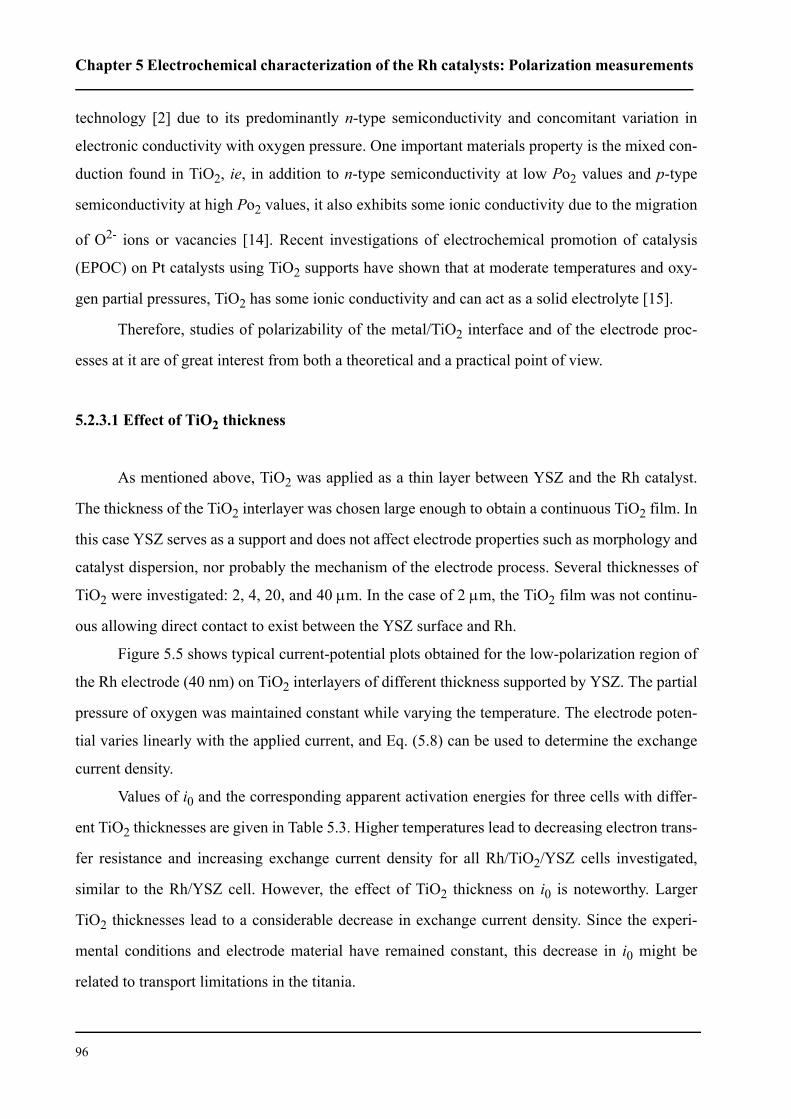
Chapter 5 Electrochemical characterization of the Rh catalysts: Polarization measurements
96
technology [2] due to its predominantly n-type semiconductivity and concomitant variation in
electronic conductivity with oxygen pressure. One important materials property is the mixed con-
duction found in TiO2, ie, in addition to n-type semiconductivity at low Po2 values and p-type
semiconductivity at high Po2 values, it also exhibits some ionic conductivity due to the migration
of O2- ions or vacancies [14]. Recent investigations of electrochemical promotion of catalysis
(EPOC) on Pt catalysts using TiO2 supports have shown that at moderate temperatures and oxy-
gen partial pressures, TiO2 has some ionic conductivity and can act as a solid electrolyte [15].
Therefore, studies of polarizability of the metal/TiO2 interface and of the electrode proc-
esses at it are of great interest from both a theoretical and a practical point of view.
5.2.3.1 Effect of TiO2 thickness
As mentioned above, TiO2 was applied as a thin layer between YSZ and the Rh catalyst.
The thickness of the TiO2 interlayer was chosen large enough to obtain a continuous TiO2 film. In
this case YSZ serves as a support and does not affect electrode properties such as morphology and
catalyst dispersion, nor probably the mechanism of the electrode process. Several thicknesses of
TiO2 were investigated: 2, 4, 20, and 40 µm. In the case of 2 µm, the TiO2 film was not continu-
ous allowing direct contact to exist between the YSZ surface and Rh.
Figure 5.5 shows typical current-potential plots obtained for the low-polarization region of
the Rh electrode (40 nm) on TiO2 interlayers of different thickness supported by YSZ. The partial
pressure of oxygen was maintained constant while varying the temperature. The electrode poten-
tial varies linearly with the applied current, and Eq. (5.8) can be used to determine the exchange
current density.
Values of i0 and the corresponding apparent activation energies for three cells with differ-
ent TiO2 thicknesses are given in Table 5.3. Higher temperatures lead to decreasing electron trans-
fer resistance and increasing exchange current density for all Rh/TiO2/YSZ cells investigated,
similar to the Rh/YSZ cell. However, the effect of TiO2 thickness on i0 is noteworthy. Larger
TiO2 thicknesses lead to a considerable decrease in exchange current density. Since the experi-
mental conditions and electrode material have remained constant, this decrease in i0 might be
related to transport limitations in the titania.
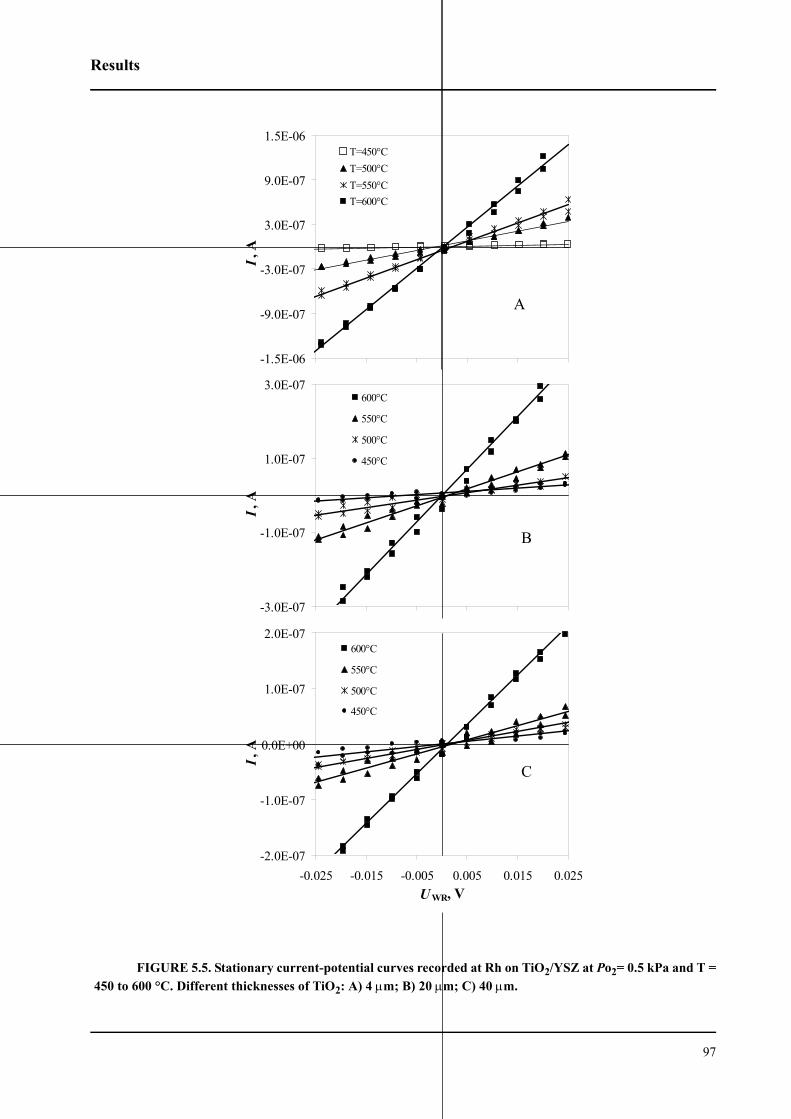
Results
97
FIGURE 5.5. Stationary current-potential curves recorded at Rh on TiO2/YSZ at Po2= 0.5 kPa and T =450 to 600 °C. Different thicknesses of TiO2: A) 4 µm; B) 20 µm; C) 40 µm.
-1.5E-06
-9.0E-07
-3.0E-07
3.0E-07
9.0E-07
1.5E-06
-0.025 -0.015 -0.005 0.005 0.015 0.025UWR, V
I, A
T=450°CT=500°CT=550°CT=600°C
-3.0E-07
-1.0E-07
1.0E-07
3.0E-07
-0.025 -0.015 -0.005 0.005 0.015 0.025UWR, V
I, A
600°C
550°C
500°C
450°C
-2.0E-07
-1.0E-07
0.0E+00
1.0E-07
2.0E-07
-0.025 -0.015 -0.005 0.005 0.015 0.025UWR, V
I, A
600°C
550°C
500°C
450°C
A
B
C
Chapter 5 Electrochemical characterization of the Rh catalysts: Polarization measurements
98
*geometric surface area of the electrode
The Rh/TiO2/YSZ system is much more complex than the Rh/YSZ system and, depending
on TiO2 conductivity, the electron transfer process can take place at different interfaces. Three
main possibilities may exist depending on the type of TiO2 conductivity:
1. The electronic conductivity of TiO2 layer predominates (TiOx, where x < 2, and
, Chapter 2, Fig. 2.17). Titania serves as an electrode similar to rhodium, and charge
transfer occurs at the O2, TiO2/YSZ interface. Titania supplies electrons, YSZ supplies oxygen
ions. In this case, one would expect no influence of TiO2 thickness on the exchange current den-
sity. Decreasing i0 with increasing TiO2 thickness clearly indicates that under working conditions
the conductivity of TiO2 is not purely electronic.
2. The ionic conductivity of TiO2 predominates (TiOx, where x = 2; 1.5; 1.65, Chapter 2,
Fig. 2.17). Titania serves as an electrolyte similar to YSZ, and charge transfer occurs at the O2,
Rh/TiO2 interface. In this case, no influence of TiO2 thickness on the exchange current density
should be expected. Under working conditions, the likelihood of having pure ionic conduction in
TiO2 is rather low.
3. TiO2 is a mixed electronic-ionic conductor (O2- conductivity in addition to electronic
conductivity). In this case titania will also be able to play the role of a solid electrolyte by supply-
ing oxygen ions, and the oxygen exchange process may take place at the O2, Rh/TiO2 interface,
similar to the Rh/YSZ interface.
TABLE 5.3. Exchange current densities determined for a Rh film electrode (40 nm) on TiO2 (differentthicknesses)/YSZ solid electrolyte in the low-field approximation of the Butler-Volmer equation (Eq. (5.8))
T, °C4 µm TiO2
i0, µA/cm2 *20 µm TiO2
i0, µA/cm2 *40 µm TiO2
i0, µA/cm2 *
450° 0.083 0.056 0.054500 0.87 0.135 0.098550 1.79 0.327 0.181600 4.18 1.07 0.653
Ea, kJ/mol 132.5 101.4 83.4
x 1.5≠
x 1.65≠
Results
99
Under the working conditions adopted in the present work, the ionic conductivity of TiO2
is rather low [14], and this may be one of the reasons why the exchange current density decreases
with increasing TiO2 thickness. Hence, in the anodic process O2- ions supplied from YSZ will be
able to cross the TiO2 layer and reach the reaction zone situated at the O2, Rh/TiO2 interface.
Evidence in favor of the third case is the finding that the general polarization behavior of
the Rh electrode is similar for Rh/YSZ and Rh/TiO2/YSZ electrochemical cells, the only differ-
ence being in the rate of the electrode process (quantified by the i0 value), which may be due to
the low ionic conductivity of TiO2. Besides, it has been shown by Pliangos et al [15] while study-
ing electrochemical promotion of ethylene oxidation over Pt catalysts supported on TiO2 that tita-
nia can act as a supplier of oxygen ions (backspillover) to the Pt catalyst. The conclusion of ionic
character of the conductivity of titania is also supported by the efficient electrochemical promo-
tion of ethylene oxidation in the Rh/TiO2/YSZ system (see below in Chapter 8).
At first sight, the difference between the values of i0 at the Rh/YSZ (Table 5.1) and Rh/
TiO2 (Table 5.3) interfaces is insignificant but it worth remembering that the exchange current
densities refer, not to real but to geometric surface areas of the electrode. According to scanning
electron microscopic analysis (Figs. 4.2 - 4.3, Chapter 4), the surface areas of Rh catalysts sup-
ported on TiO2 are higher than those of Rh on YSZ, which implies that the real exchange current
densities are much lower.
Figure 5.6 shows plots of the exchange current densities against the reciprocal temperature
for three catalysts with 40-nm Rh catalysts. These Arrhenius plots have different slopes, and the
highest apparent activation energy, Ea, obtained for Rh/TiO2(4 µm) is close to Ea at Rh/YSZ. The
lowest apparent activation energy obtained for Rh/TiO2(40 µm) suggests a change in reaction
mechanism, and specifically a change in the rate-determining step. Obviously, the reaction
becomes mass-transfer controlled.
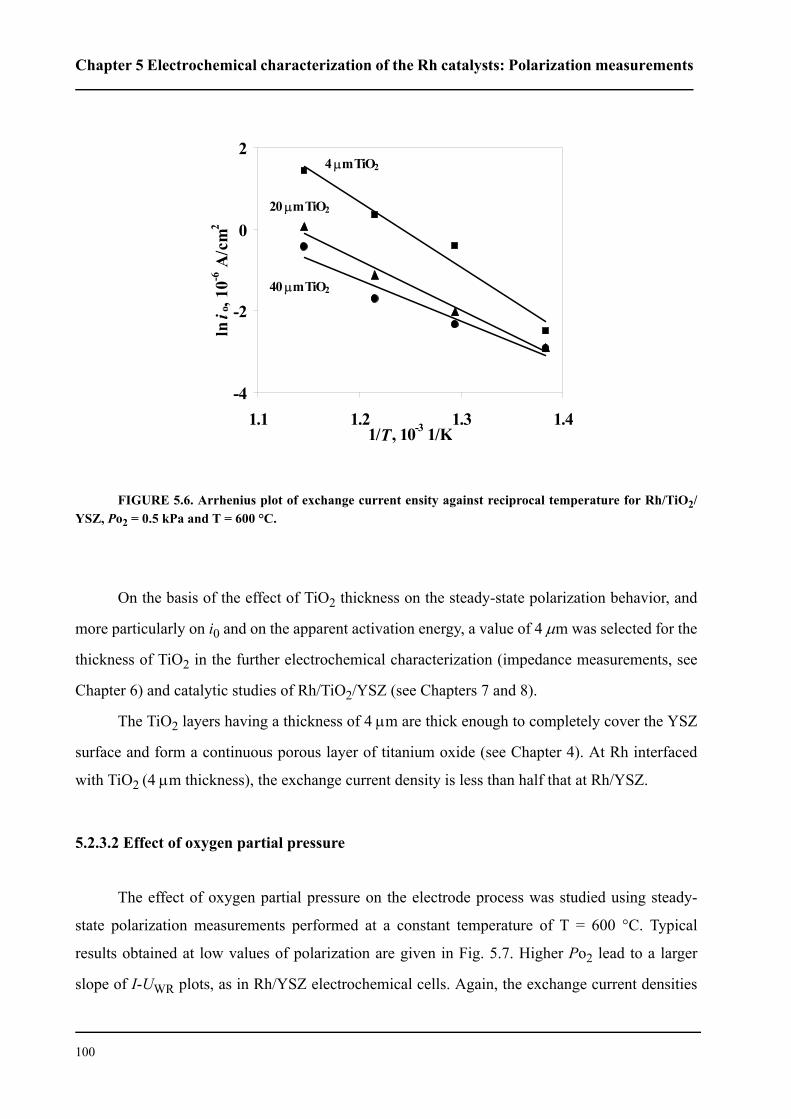
Chapter 5 Electrochemical characterization of the Rh catalysts: Polarization measurements
100
FIGURE 5.6. Arrhenius plot of exchange current ensity against reciprocal temperature for Rh/TiO2/YSZ, Po2 = 0.5 kPa and T = 600 °C.
On the basis of the effect of TiO2 thickness on the steady-state polarization behavior, and
more particularly on i0 and on the apparent activation energy, a value of 4 µm was selected for the
thickness of TiO2 in the further electrochemical characterization (impedance measurements, see
Chapter 6) and catalytic studies of Rh/TiO2/YSZ (see Chapters 7 and 8).
The TiO2 layers having a thickness of 4 µm are thick enough to completely cover the YSZ
surface and form a continuous porous layer of titanium oxide (see Chapter 4). At Rh interfaced
with TiO2 (4 µm thickness), the exchange current density is less than half that at Rh/YSZ.
5.2.3.2 Effect of oxygen partial pressure
The effect of oxygen partial pressure on the electrode process was studied using steady-
state polarization measurements performed at a constant temperature of T = 600 °C. Typical
results obtained at low values of polarization are given in Fig. 5.7. Higher Po2 lead to a larger
slope of I-UWR plots, as in Rh/YSZ electrochemical cells. Again, the exchange current densities
-4
-2
0
2
1.1 1.2 1.3 1.41/T, 10-3 1/K
ln i o
, 10-6
A/c
m2
20 µm TiO2
40 µm TiO2
4 µm TiO2
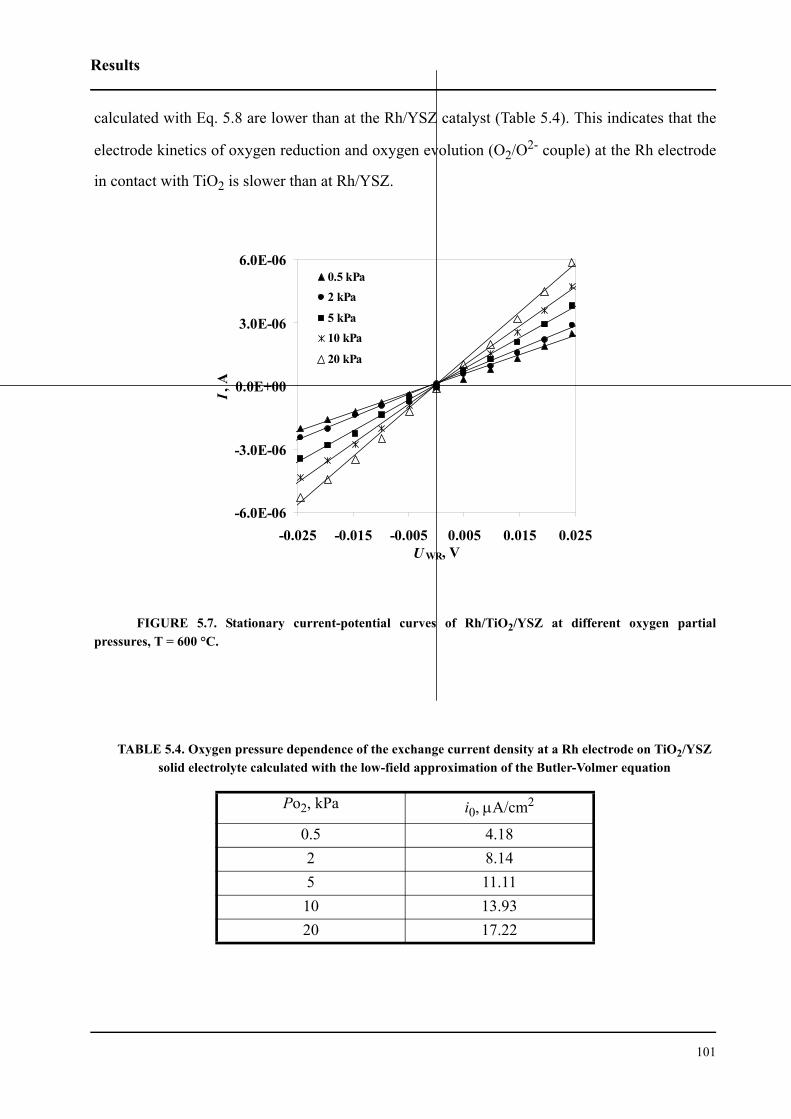
Results
101
calculated with Eq. 5.8 are lower than at the Rh/YSZ catalyst (Table 5.4). This indicates that the
electrode kinetics of oxygen reduction and oxygen evolution (O2/O2- couple) at the Rh electrode
in contact with TiO2 is slower than at Rh/YSZ.
FIGURE 5.7. Stationary current-potential curves of Rh/TiO2/YSZ at different oxygen partialpressures, T = 600 °C.
TABLE 5.4. Oxygen pressure dependence of the exchange current density at a Rh electrode on TiO2/YSZ solid electrolyte calculated with the low-field approximation of the Butler-Volmer equation
Po2, kPa i0, µA/cm2
0.5 4.182 8.145 11.1110 13.9320 17.22
-6.0E-06
-3.0E-06
0.0E+00
3.0E-06
6.0E-06
-0.025 -0.015 -0.005 0.005 0.015 0.025UWR, V
I, A
0.5 kPa2 kPa
5 kPa10 kPa
20 kPa
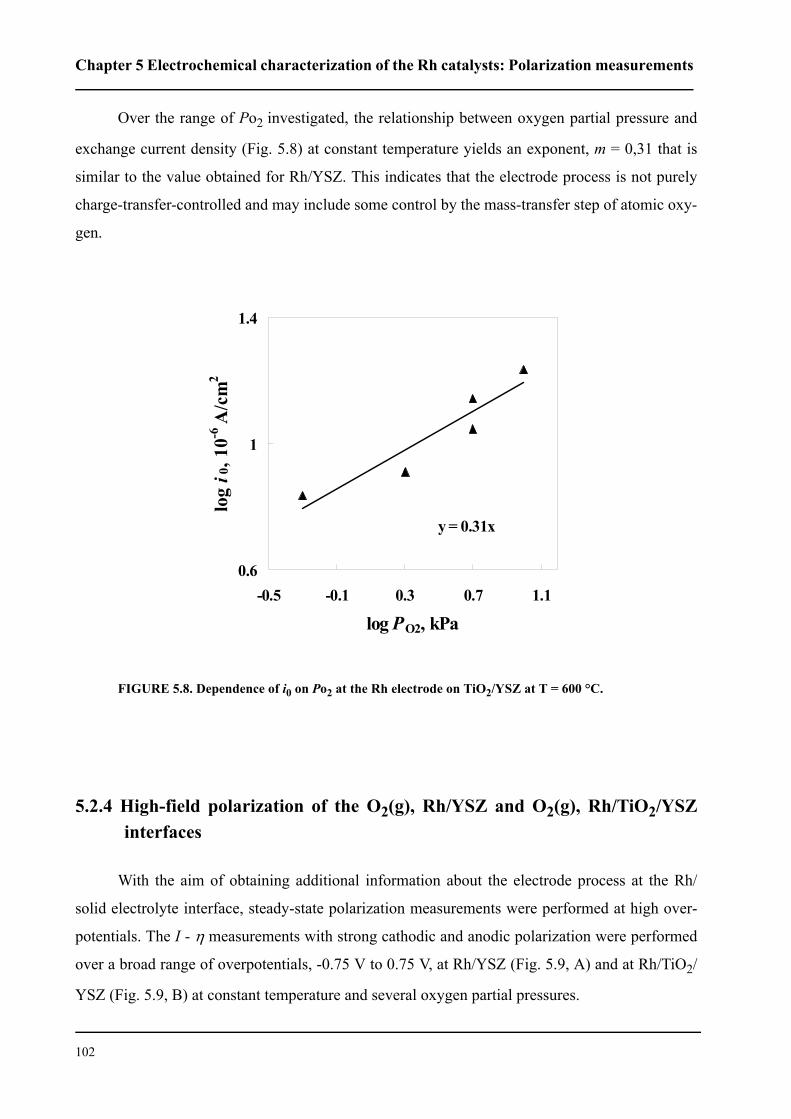
Chapter 5 Electrochemical characterization of the Rh catalysts: Polarization measurements
102
Over the range of Po2 investigated, the relationship between oxygen partial pressure and
exchange current density (Fig. 5.8) at constant temperature yields an exponent, m = 0,31 that is
similar to the value obtained for Rh/YSZ. This indicates that the electrode process is not purely
charge-transfer-controlled and may include some control by the mass-transfer step of atomic oxy-
gen.
FIGURE 5.8. Dependence of i0 on Po2 at the Rh electrode on TiO2/YSZ at T = 600 °C.
5.2.4 High-field polarization of the O2(g), Rh/YSZ and O2(g), Rh/TiO2/YSZinterfaces
With the aim of obtaining additional information about the electrode process at the Rh/
solid electrolyte interface, steady-state polarization measurements were performed at high over-
potentials. The I - η measurements with strong cathodic and anodic polarization were performed
over a broad range of overpotentials, -0.75 V to 0.75 V, at Rh/YSZ (Fig. 5.9, A) and at Rh/TiO2/
YSZ (Fig. 5.9, B) at constant temperature and several oxygen partial pressures.
y = 0.31x
0.6
1
1.4
-0.5 -0.1 0.3 0.7 1.1
log PO2, kPa
log i 0
, 10-6
A/c
m2
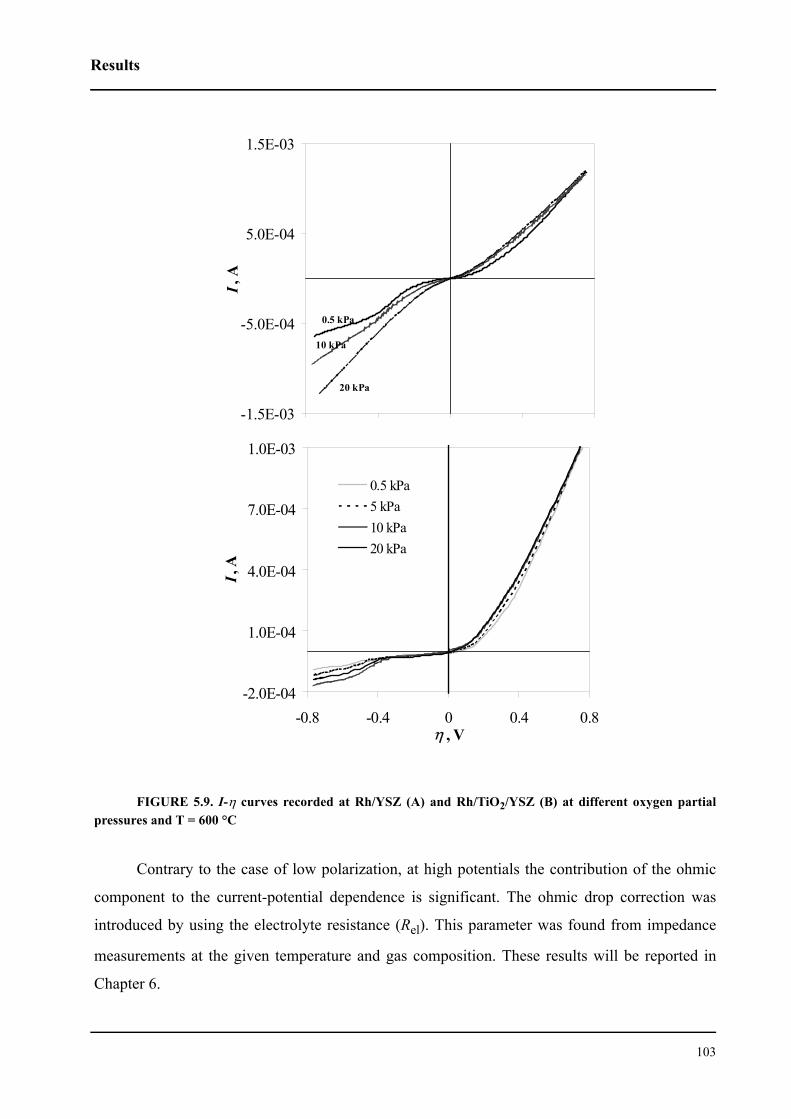
Results
103
FIGURE 5.9. I-η curves recorded at Rh/YSZ (A) and Rh/TiO2/YSZ (B) at different oxygen partialpressures and T = 600 °C
Contrary to the case of low polarization, at high potentials the contribution of the ohmic
component to the current-potential dependence is significant. The ohmic drop correction was
introduced by using the electrolyte resistance (Rel). This parameter was found from impedance
measurements at the given temperature and gas composition. These results will be reported in
Chapter 6.
B
-1.5E-03
-5.0E-04
5.0E-04
1.5E-03
I, A
0.5 kPa
10 kPa
20 kPa
-2.0E-04
1.0E-04
4.0E-04
7.0E-04
1.0E-03
-0.8 -0.4 0 0.4 0.8η , V
I, A
0.5 kPa5 kPa 10 kPa 20 kPa
Chapter 5 Electrochemical characterization of the Rh catalysts: Polarization measurements
104
Much higher current flow in the Rh/YSZ than in the Rh/TiO2/YSZ cell, which is similar to
the results obtained at low polarisation. The anodic and cathodic processes are no longer symmet-
rical under strong polarization. At a given absolute value of the applied potential difference, at
both electrodes much higher anodic than cathodic currents are recorded, which shows the asym-
metry of the electrode processes. This asymmetry is higher for the Rh/TiO2/YSZ electrode, and is
certainly related to the TiO2 interlayer. For example, cathodic oxygen reduction requires an over-
potential of almost -0.4 V, while oxygen evolution needs only 0.1 V.
Another interesting feature observed for both electrodes is that the anodic process is
slightly Po2-dependent, and this only at low overpotentials where the anodic current increases
with increasing Po2. The cathodic process at Rh/YSZ and Rh/TiO2/YSZ strongly depends on the
oxygen partial pressure, especially at high overpotentials. At Po2 = 0.5 kPa the cathodic currents
at both electrodes exhibit a limiting value, Ilim. This limiting current disappears with increasing
Po2 at Rh/YSZ, while at Rh/TiO2/YSZ, values of Ilim that increase with increasing Po2 are seen
over the full range of oxygen partial pressures.
5.3 Discussion
The general polarization behavior of the Rh/YSZ and Rh/TiO2/YSZ catalysts is the same.
The observed effects of applied potential, temperature, and oxygen partial pressure are similar for
the Rh/YSZ and Rh/TiO2/YSZ systems. The main difference resides in the rate of the electrode
process in the two cells, as given by the exchange current densities. The exchange current densi-
ties at the Rh/TiO2 interface are less than half (for the case of 4 µm thick titania layers; the differ-
ence is even more pronounced at large TiO2 thicknesses) those at Rh/YSZ, indicating a significant
polarizability of the Rh/TiO2 interface. It is likely that despite its low ionic conductivity [14, 15],
TiO2 acts as a solid electrolyte [16].
The exponents found for the relationship between i0 and Po2m clearly indicate that atomic
rather than molecular oxygen is involved in the electrode process. Thus, m was found to have val-
ues between 1/4 (rds is charge transfer) and 3/8 (rds is interfacial diffusion of atomic oxygen to
the electrochemical reaction sites) [11], the actual rds depending on the operating conditions such
as applied potential and oxygen partial pressure. Values of m between 1/2 and 5/8 would be
Discussion
105
expected for the relationship between the exchange current density and oxygen partial pressure
[17, 18] if molecular oxygen was involved in the charge transfer process and in diffusion. The
exponents, m, obtained for Rh/YSZ and Rh/TiO2/YSZ also show that oxygen may dissociatively
adsorb on the electrode surface. The overall electrode process contains a charge transfer step and
a diffusion step competing as the slow steps.
The polarization behavior observed at Rh electrodes interfaced with YSZ and TiO2/YSZ
indicates that the mechanisms that are possible for the anodic and cathodic processes are different.
This becomes particularly obvious at high overpotentials (Fig. 5.9) where asymmetry appears.
This implies that the rate-determining step is not the same for the anodic and cathodic process.
The anodic process of oxygen evolution is independent of oxygen partial pressure, as should be
expected. The cathodic process depends on Po2 and, as indicated by Ilim, includes a slow diffusion
stage. Several authors have reported a similar polarization dependence and similar limiting
cathodic currents [19, 20].
According to the experimental results obtained at low and high polarization and after an
analysis of literature data, the equilibrium processes of cathodic oxygen reduction and anodic
oxygen evolution (O2/O2-) at Rh electrodes, both interfaced with YSZ and with TiO2, may be
described by the same reaction scheme. The reaction mechanisms at cathode and anode include
different rate determining steps.
The mechanism of the cathodic process can be written as follows:
O2 2 O(MG) fast step (5.10)
slow step (5.11)
fast step (5.12)
In the cathodic processs the first step is a fast step of dissociative oxygen adsorption on the
gas-exposed Rh surface (Eq. (5.10)). The next step (Eq. (5.11)) is atomic oxygen diffusion to the
electrochemical reaction sites (ERS). The third step (Eq. (5.12)) is a two-electron transfer process.
It is worth noting that the mechanism (5.10) - (5.12) was many times described in the liter-
ature for O2 reduction at Pt electrodes (see Chapter 1, section 3) [10, 11, 19, 21-26].
The mechanism of the anodic process can be represented as follows:
)()( ERSdiffusion
MG OO →
O ERS( ) 2e– O2 –→+
Chapter 5 Electrochemical characterization of the Rh catalysts: Polarization measurements
106
slow step (5.13)
2 O(ERS) O2(G) fast step (5.14)
The first step is the electrochemical step of oxygen formation at the electrochemical reac-
tion sites (Eq. (1.13)), the second step is its desorption in molecular form to the gas phase (Eq.
(5.14)).
It is worth emphasizing that in mechanisms (5.10) - (5.12) and (5.13), (5.14) the nature of
the rate-determining step of the cathodic and anodic process will considerably depend on several
factors, and first of all on the electrode potential and also on oxygen partial pressure. The above
mechanisms are able to describe the cathodic and anodic processes under certain conditions,
namely in the region of low electrode polarization (close to equilibrium) and in an excess of gase-
ous oxygen.
The location of the electrochemical reaction sites for the cathodic and anodic processes is
not trivial. In the literature no consensus exists as to the location of the ERS; to a large extent, it
depends on the geometry of the electrode, the shape of the gas/metal/electrolyte contact and also
on the electrode and electrolyte materials. In both processes, the electrochemical step may occur
at the three-phase boundary or at the two-phase metal/electrolyte boundary. If there is no strong
chemical bonding between rhodium and the electrolyte or/and formation of a new phase is inhib-
ited, oxygen will diffuse along the interface. In the cathodic reaction, if the surface diffusion rate
of atomic oxygen is slower than the rate of charge transfer, current will flow predominantly close
to the three-phase boundary (MEG). In this case the central area of the electrode initially becomes
blocking. The relationship between the rates of mass transfer and charge transfer will be deter-
mining for the spread of the three-phase boundary across the two-phase boundary (ME). The
anodic process can take place at the ME boundary. This interface is fully accessible to O2- from
the solid electrolyte and to electrons from the metal. Because it requires oxygen exchange with a
gas phase, the electrochemical reaction will occur predominantly at the MEG boundary or in its
close vicinity. Therefore, the location of the electrochemical reaction sites merits further investi-
gations.
In order to confirm and validate the oxygen exchange mechanism proposed, impedance
spectroscopic analysis will be performed and reported in Chapter 6.
O2– 2e– O ERS( )→–
Conclusions
107
5.4 Conclusions
In the present chapter, the electrochemical characterization of Rh electrodes in the systems
with yttria-stabilized zirconia solid electrolyte and with titanium dioxide was performed using the
steady-state polarization technique. The following conclusions may be drawn from the results
presented above:
1. Both the Rh/YSZ and the Rh/TiO2/YSZ interfaces are polarizable, and reproducible
polarization results were obtained in the present chapter. The general features of the kinetic pro-
cess of oxygen reduction/oxidation at the Rh catalyst electrode are similar for Rh/YSZ and Rh/
TiO2/YSZ electrochemical cells. The electrode kinetics depends on applied potential, working
temperature, and oxygen partial pressure.
2. The exchange current densities provide important information about the rate of the O2/
O2- electrode reaction at the interface. The exchange current densities at Rh/TiO2 (4 µm) are less
than half those at Rh/YSZ, and decrease further with increasing titania thickness.
3. The thickness of TiO2 strongly influences the exchange current density of the reaction.
Increasing TiO2 thickness leads to decreasing i0. The observed dependence of i0 on TiO2 thick-
ness shows that under working conditions, the conductivity of titania is not purely electronic. It
was suggested that at the given oxygen atmospheres and temperatures, the conductivity of TiO2 is
mixed ionic-electronic with a strong ionic constituent. For further investigations, a layer thickness
of TiO2 of 4 µm was chosen at which the ohmic contribution is the lowest.
4. At high values of polarization of Rh/YSZ and Rh/TiO2/YSZ, the cathodic and anodic
curves are not symmetrical. It was found that the anodic process of oxygen evolution is independ-
ent of oxygen partial pressure, while the cathodic process depends on Po2 and shows Ilim at low
oxygen partial pressures.
5. A mechanism was proposed for the oxygen exchange process (O2/O2-). The processes of
cathodic oxygen reduction and anodic oxygen evolution are not symmetrical. The cathodic pro-
cess consists of three steps: dissociative adsorption of oxygen at the gas-exposed Rh surface,
atomic oxygen diffusion to the electrochemical reaction sites, and two-electron transfer reaction
at the electrochemical reaction sites. The cathodic process is limited by interfacial diffusion of
oxygen atoms from the gas-exposed metal surface to the ERS. The anodic process includes two
steps: a two-electron transfer reaction, which is the rds, and oxygen desorption to the gas phase.
Chapter 5 Electrochemical characterization of the Rh catalysts: Polarization measurements
108
5.5 References
1. A. Wieckowski, E. R. Savinova, and C. G. Vayenas, Catalysis and Electrocatalysis
at Nanoparticles Marcel Dekker, Inc., New York (2003).
2. W. Göpel, Sensor and Actuators B, 18-19 (1994) 1.
3. A. Mandelis and C. Christofides, Solid State Gas Sensor Devices John Wiley &
Sons, New York (1993).
4. C. G. Vayenas, S. Brosda, and C. Pliangos, J. Catal., 216 (2003) 487.
5. C. G. Vayenas, S. Brosda, and C. Pliangos, J. Catal., 203 (2001) 329.
6. C. G. Vayenas, S. Bebelis, C. Pliangos, S. Brosda, and D. Tsiplakides, Electro-
chemical activation of catalysis. Promotion, Electrochemical promotion, and
metal-support interaction. Kluwer Academic/Plenum Publishers, New York
(2001).
7. C. G. Vayenas, M. M. Jaksic, S. I. Bebelis, and S. G. Neophytides, in Modern
aspects of Electrochemistry J. O. M. Bockris, B. E. Conway, and R. E. White, eds.,
Plenum Press, New York, (1996), p. 57.
8. G. Fóti, I. Bolzonella, and C. Comninellis, in Modern Aspects of electrochemistry,
Vol. 36 C. G. Vayenas, B. E. Conway, R. E. White, and M. E. Gamboa-Adelco,
eds., Kluwer Academic / Plenum Publisher, New York, Boston, Dordrecht, Lon-
don, Moscow, (2003), p. 310.
9. J. O. M. Bockris and A. K. N. Reddy, Modern electrochemistry Plenum Press, New
York (1977).
10. O. J. Velle, T. Norby, and P. Kofstad, Solid State Ionics, 47 (1991) 161
11. D. Y. Wang and A. S. Nowick, J. Electrochem. Soc, 128 (1981) 55.
12. S. J. Tauster, S. C. Fung, and R. L. Garten, JACS, 100 (1978) 170.
13. S. J. Tauster, S. C. Fung, R. T. K. Baker, and J. A. Horsley, Science, 211 (1981)
1121.
14. P. J. Gellings and H. J. M. Bouwmeester, Catalysis Today, 12 (1992) 1.
15. C. Pliangos, I. V. Yentekakis, S. Ladas, and C. G. Vayenas, J. Catal., 1996 (1996)
189.
16. J. Nicole, D. Tsiplakides, C. Pliangos, X. E. Verykios, C. Comninellis, and C. G.
Vayenas, J. Catal., 204 (2001) 23.
References
109
17. B. A. v. Hassel, B. A. Boukamp, and A. J. Burggraaf, Solid State Ionics, 48 (1991)
139.
18. B. A. v. Hassel, B. A. Boukamp, and A. J. Burggraaf, Solid State Ionics, 48 (1991)
155.
19. N. L. Robertson and J. N. Michaels, J. Electrochem. Soc, 137 (1990) 129.
20. M. V. Perfilev, Solid State Ionics, 9 & 10 (1983) 765.
21. D. Y. Wang and A. S. Nowick, J. Electrochem. Soc., 126 (1979) 1155.
22. D. Y. Wang and A. S. Nowick, J. Electrochem. Soc., 126 (1979) 1166
23. J. Mizusaki, K. Amano, S. Yamauchi, and K. Fueki, Solid State Ionics, 22 (1987)
313.
24. J. Mizusaki, K. Amano, S. Yamauchi, and K. Fueki, Solid State Ionics, 22 (1987)
323.
25. A. Mitterdorfer and L. J. Gauckler, Solid State Ionics, 117 (1999) 187.
26. A. Mitterdorfer and L. J. Gauckler, Solid State Ionics, 117 (1999) 203.

111
CHAPTER 6 Electrochemical characterization of
Rh catalysts: Impedance measurements
On the basis of the oxygen exchange mechanism, an impedance model was
set up for the Rh/oxygen electrode in contact with a solid electrolyte. Elec-
trochemical impedance spectra were recorded at T = 450 - 600 °C and Po2 =
0.5 kPa at open circuit and under polarization in order to confirm the imped-
ance model for the processes occurring at Rh electrodes interfaced with
YSZ and TiO2/YSZ. Good agreement was found to exist between the model
(theory) and experiments (the impedance spectra). This agreement consti-
tutes support for validity of the reaction mechanism proposed in the preced-
ing chapter. The validity of the mechanism was confirmed in an indirect
way by the values obtained for the exchange current density, i0, since the
values obtained from the impedance measurements are very close to those
obtained from low-field polarization experiments.
Impedance data recorded under polarization provide information as to the
origin of electrochemical promotion. Under positive polarization the
adsorption capacitance of the Rh/YSZ electrode increases dramatically,
which is understood as reflecting the creation of an effective double layer
across the entire gas-exposed electrode surface. The second semicircle
Chapter 6 Electrochemical characterization of Rh catalysts: Impedance measurements
112
appearing in the impedance spectra of the Rh/TiO2/YSZ electrode indi-
cates that the system has additional complexity.
6.1 Introduction
The technique where the cell’s or electrode’s impedance is studied as a function of fre-
quency of the ac signal source is called electrochemical impedance spectroscopy (EIS) [1]. The
equivalent resistance and capacitance values can be interpreted theoretically in terms of interfa-
cial phenomena. The mean (dc) potential of the working electrode is the equilibrium potential
determined by the ratio of oxidized and reduced forms of the redox couple. This technique is very
precise, and is frequently used in electrochemistry to evaluate heterogeneous charge-transfer
parameters and study double-layer structure.
The impedance, Z, is a kind of generalized resistance that links voltage E and current I in
phasor notation:
(6.1)
where is the phasor of the electrode potential, and is the phasor of applied current.
This equation is a generalized Ohm’s law. It is convenient to represent phasors in complex
notation. Components along the ordinate are regarded as imaginary, and are multiplied by
, while components along the abscissa are regarded as real. In this case, Ohm’s law can
be represented as
(6.2)
where ZRe and ZIm are the real and imaginary parts of impedance. For example: ZRe = R and ZIm
= 1/ωC.
Interesting information can be derived from the variation of impedance with frequency,
which can be displayed in different ways. In one of the common representations, the Nyquist
plots, values of ZIm are displayed as functions of ZRe for different values of ω. The plot that is
obtained for a parallel R-C circuit is shown in Fig. 6.1. The first intersection of the semicircle with
the abscissa gives the electrolyte resistance (Rel), the second intersection gives the sum of electro-
E· I·Z=
E· I·
j 1–=
Z ω( ) ZRe jZIm–=
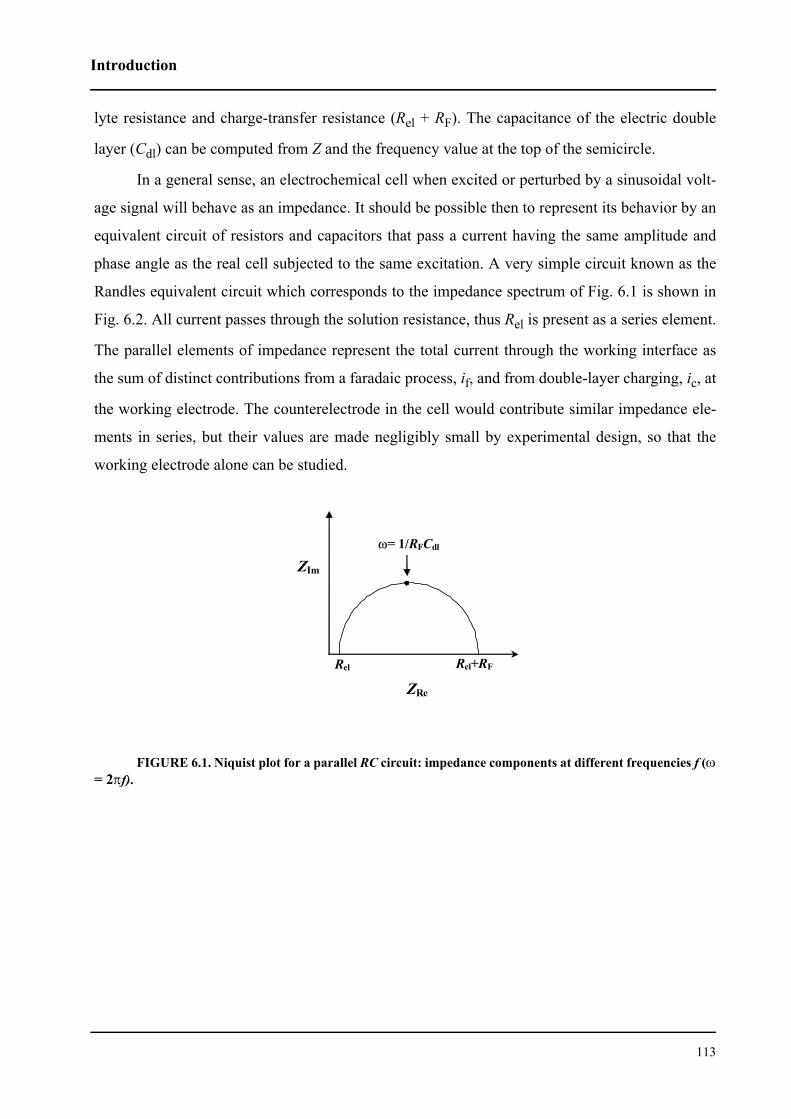
Introduction
113
lyte resistance and charge-transfer resistance (Rel + RF). The capacitance of the electric double
layer (Cdl) can be computed from Z and the frequency value at the top of the semicircle.
In a general sense, an electrochemical cell when excited or perturbed by a sinusoidal volt-
age signal will behave as an impedance. It should be possible then to represent its behavior by an
equivalent circuit of resistors and capacitors that pass a current having the same amplitude and
phase angle as the real cell subjected to the same excitation. A very simple circuit known as the
Randles equivalent circuit which corresponds to the impedance spectrum of Fig. 6.1 is shown in
Fig. 6.2. All current passes through the solution resistance, thus Rel is present as a series element.
The parallel elements of impedance represent the total current through the working interface as
the sum of distinct contributions from a faradaic process, if, and from double-layer charging, ic, at
the working electrode. The counterelectrode in the cell would contribute similar impedance ele-
ments in series, but their values are made negligibly small by experimental design, so that the
working electrode alone can be studied.
FIGURE 6.1. Niquist plot for a parallel RC circuit: impedance components at different frequencies f (ω= 2πf).
ZIm
ZRe
Rel Rel+RF
ω= 1/RFCdl
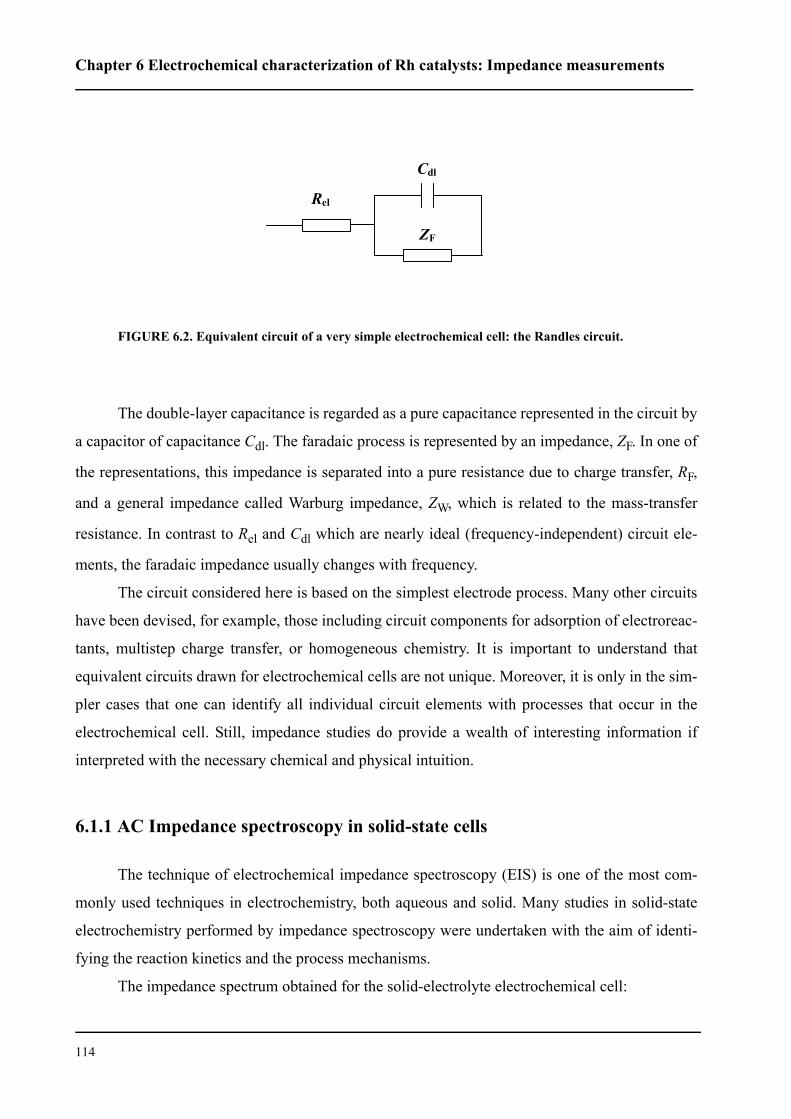
Chapter 6 Electrochemical characterization of Rh catalysts: Impedance measurements
114
FIGURE 6.2. Equivalent circuit of a very simple electrochemical cell: the Randles circuit.
The double-layer capacitance is regarded as a pure capacitance represented in the circuit by
a capacitor of capacitance Cdl. The faradaic process is represented by an impedance, ZF. In one of
the representations, this impedance is separated into a pure resistance due to charge transfer, RF,
and a general impedance called Warburg impedance, ZW, which is related to the mass-transfer
resistance. In contrast to Rel and Cdl which are nearly ideal (frequency-independent) circuit ele-
ments, the faradaic impedance usually changes with frequency.
The circuit considered here is based on the simplest electrode process. Many other circuits
have been devised, for example, those including circuit components for adsorption of electroreac-
tants, multistep charge transfer, or homogeneous chemistry. It is important to understand that
equivalent circuits drawn for electrochemical cells are not unique. Moreover, it is only in the sim-
pler cases that one can identify all individual circuit elements with processes that occur in the
electrochemical cell. Still, impedance studies do provide a wealth of interesting information if
interpreted with the necessary chemical and physical intuition.
6.1.1 AC Impedance spectroscopy in solid-state cells
The technique of electrochemical impedance spectroscopy (EIS) is one of the most com-
monly used techniques in electrochemistry, both aqueous and solid. Many studies in solid-state
electrochemistry performed by impedance spectroscopy were undertaken with the aim of identi-
fying the reaction kinetics and the process mechanisms.
The impedance spectrum obtained for the solid-electrolyte electrochemical cell:
Cdl
Rel
ZF
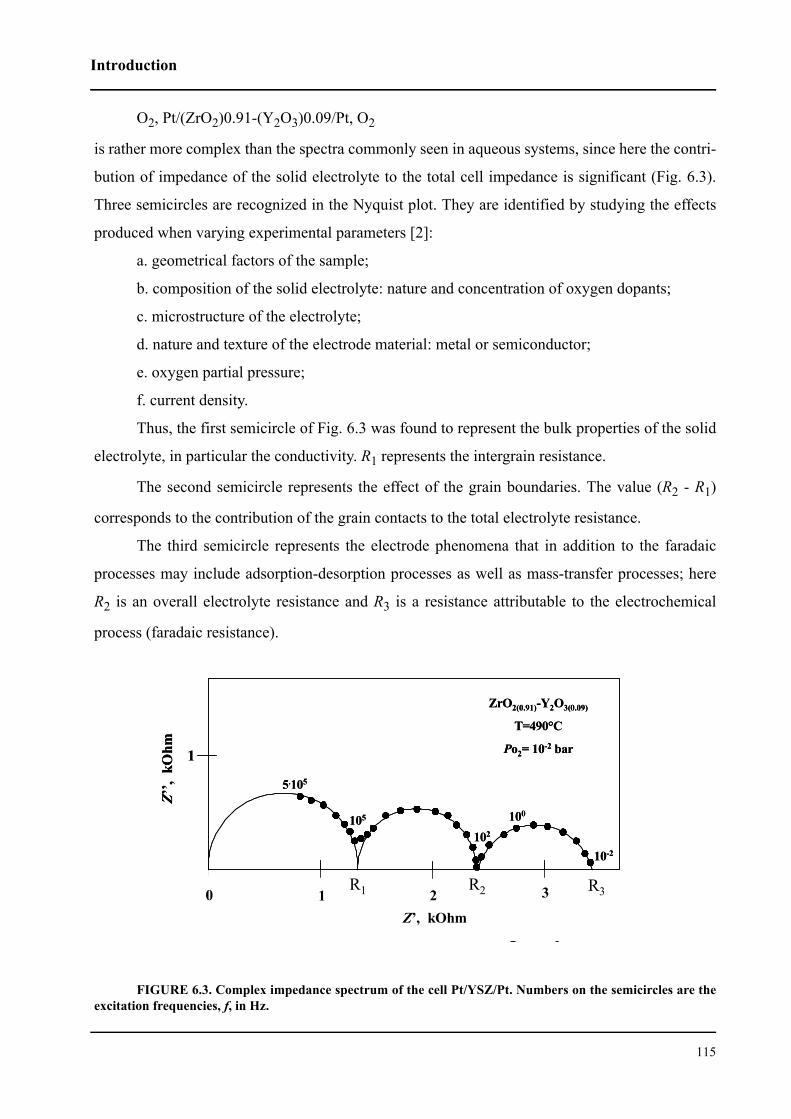
Introduction
115
O2, Pt/(ZrO2)0.91-(Y2O3)0.09/Pt, O2
is rather more complex than the spectra commonly seen in aqueous systems, since here the contri-
bution of impedance of the solid electrolyte to the total cell impedance is significant (Fig. 6.3).
Three semicircles are recognized in the Nyquist plot. They are identified by studying the effects
produced when varying experimental parameters [2]:
a. geometrical factors of the sample;
b. composition of the solid electrolyte: nature and concentration of oxygen dopants;
c. microstructure of the electrolyte;
d. nature and texture of the electrode material: metal or semiconductor;
e. oxygen partial pressure;
f. current density.
Thus, the first semicircle of Fig. 6.3 was found to represent the bulk properties of the solid
electrolyte, in particular the conductivity. R1 represents the intergrain resistance.
The second semicircle represents the effect of the grain boundaries. The value (R2 - R1)
corresponds to the contribution of the grain contacts to the total electrolyte resistance.
The third semicircle represents the electrode phenomena that in addition to the faradaic
processes may include adsorption-desorption processes as well as mass-transfer processes; here
R2 is an overall electrolyte resistance and R3 is a resistance attributable to the electrochemical
process (faradaic resistance).
FIGURE 6.3. Complex impedance spectrum of the cell Pt/YSZ/Pt. Numbers on the semicircles are theexcitation frequencies, f, in Hz.
0
1
1 2 3
Z’, kOhm
Z’’,
kO
hm
105
5.105
102
10-2
100
ZrO2(0.91)-Y2O3(0.09)
T=490°C
Po2= 10-2 bar
R1 R2 R30
1
1 2 3
Z’, kOhm
Z’’,
kO
hm
105
5.105
102
10-2
100
ZrO2(0.91)-Y2O3(0.09)
T=490°C
Po2= 10-2 bar
R1 R2 R3
Chapter 6 Electrochemical characterization of Rh catalysts: Impedance measurements
116
The presence and shape of the three semicircles strongly depend on working temperature
and cell configuration. The first two semicircular arcs correspond to parallel R-C circuit elements,
while the third one is more complex. When the electrode process contains slow diffusion steps, a
diffusion impedance will have to be added to the charge-transfer impedance. An adsorption proc-
ess would contribute to the double-layer capacitance with an additional adsorption capacitance.
Different equivalent circuits can be found in the literature depending on the rate-determining step
(rds).
6.1.2 Ac impedance spectroscopy in electrochemical promotion of catalysis
Recently, impedance spectroscopy was used to investigate the origin of electrochemical
promotion at a Pd catalyst electrode deposited on YSZ and exposed to CH4/O2 and C2H4/O2 gas
mixtures [3]. Other systems studied were Au, Pt, Rh electrodes interfaced with YSZ in different
gas mixtures (pure O2 and H2 and C2H4-O2 mixtures).
Figure 6.4 shows complex impedance spectra (Nyquist plots) recorded for the CH4, O2, Pd/
YSZ system. The impedance in the frequency range above 104 Hz was found to represent the
impedance of the bulk electrolyte and grain boundaries. Three distinct features of the impedance
spectra were discussed by the authors. (i) In the range of high frequencies (higher than 300 Hz),
part of a small depressed semicircle is observed at absolute values of overpotential lower than 0.6
V. (ii) At frequencies lower than 300 Hz, the main feature under open-circuit conditions is an
inclined straight line, which can be considered as part of a depressed semicircle. In fact, when
raising the applied dc potential difference to high positive or negative values a depressed semicir-
cle (semicircle 2) clearly develops. This semicircle becomes smaller with increasing and decreas-
ing polarization (overpotential), indicating that it reflects processes at the Pd/YSZ interface. (iii)
At high positive overpotentials (higher than 0.6 V) a third depressed semicircle (semicircle 3)
appears in the lowest frequencies range.
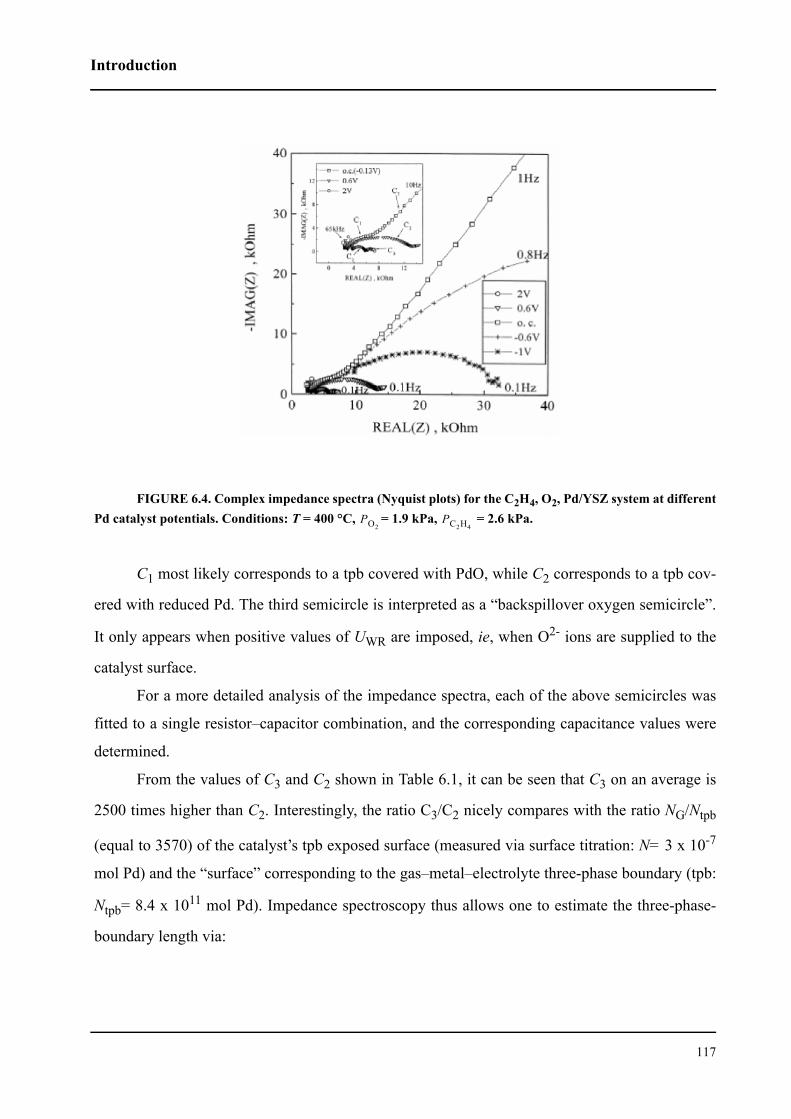
Introduction
117
FIGURE 6.4. Complex impedance spectra (Nyquist plots) for the C2H4, O2, Pd/YSZ system at differentPd catalyst potentials. Conditions: T = 400 °C, = 1.9 kPa, = 2.6 kPa.
C1 most likely corresponds to a tpb covered with PdO, while C2 corresponds to a tpb cov-
ered with reduced Pd. The third semicircle is interpreted as a “backspillover oxygen semicircle”.
It only appears when positive values of UWR are imposed, ie, when O2- ions are supplied to the
catalyst surface.
For a more detailed analysis of the impedance spectra, each of the above semicircles was
fitted to a single resistor–capacitor combination, and the corresponding capacitance values were
determined.
From the values of C3 and C2 shown in Table 6.1, it can be seen that C3 on an average is
2500 times higher than C2. Interestingly, the ratio C3/C2 nicely compares with the ratio NG/Ntpb
(equal to 3570) of the catalyst’s tpb exposed surface (measured via surface titration: N= 3 x 10⁻⁷
mol Pd) and the “surface” corresponding to the gas–metal–electrolyte three-phase boundary (tpb:
Ntpb= 8.4 x 10¹¹ mol Pd). Impedance spectroscopy thus allows one to estimate the three-phase-
boundary length via:
PO2PC2H4
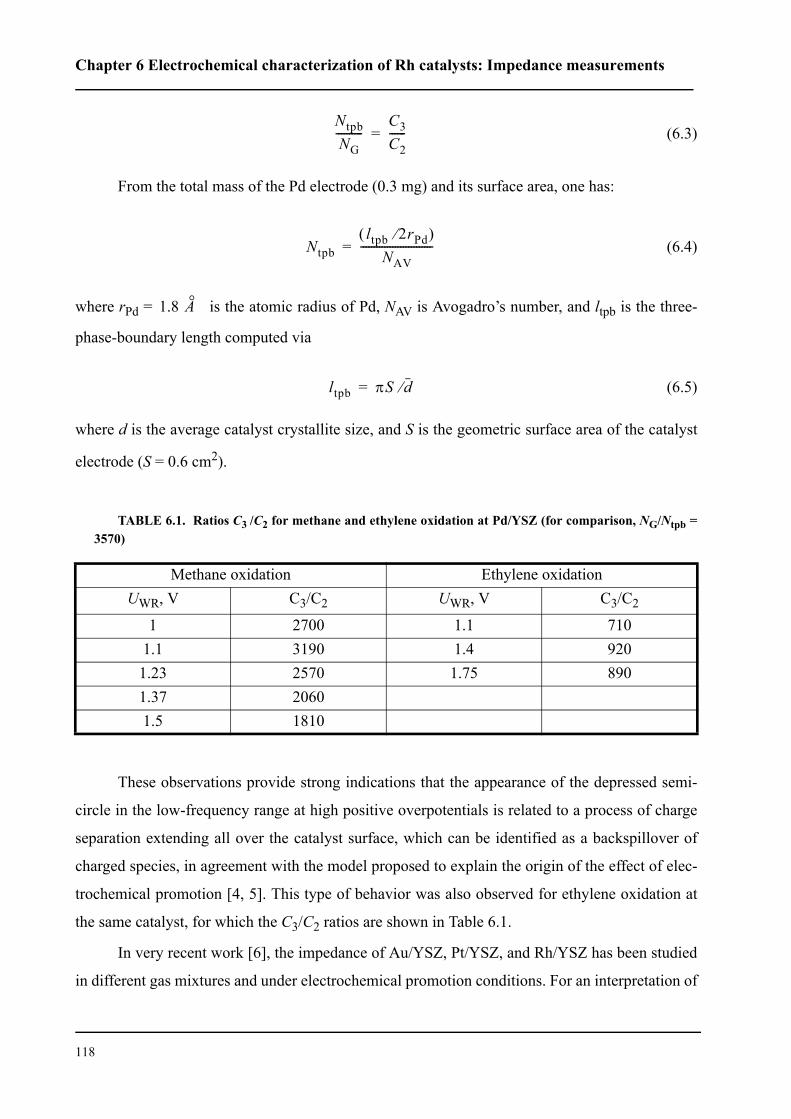
Chapter 6 Electrochemical characterization of Rh catalysts: Impedance measurements
118
(6.3)
From the total mass of the Pd electrode (0.3 mg) and its surface area, one has:
(6.4)
where rPd = 1.8 is the atomic radius of Pd, NAV is Avogadro’s number, and ltpb is the three-
phase-boundary length computed via
(6.5)
where d is the average catalyst crystallite size, and S is the geometric surface area of the catalyst
electrode (S = 0.6 cm2).
These observations provide strong indications that the appearance of the depressed semi-
circle in the low-frequency range at high positive overpotentials is related to a process of charge
separation extending all over the catalyst surface, which can be identified as a backspillover of
charged species, in agreement with the model proposed to explain the origin of the effect of elec-
trochemical promotion [4, 5]. This type of behavior was also observed for ethylene oxidation at
the same catalyst, for which the C3/C2 ratios are shown in Table 6.1.
In very recent work [6], the impedance of Au/YSZ, Pt/YSZ, and Rh/YSZ has been studied
in different gas mixtures and under electrochemical promotion conditions. For an interpretation of
TABLE 6.1. Ratios C3 /C2 for methane and ethylene oxidation at Pd/YSZ (for comparison, NG/Ntpb =3570)
Methane oxidation Ethylene oxidationUWR, V C3/C2 UWR, V C3/C2
1 2700 1.1 7101.1 3190 1.4 9201.23 2570 1.75 8901.37 20601.5 1810
NtpbNG
----------C3C2------=
Ntpbltpb 2rPd⁄( )
NAV---------------------------=
A°
ltpb πS d⁄=
Introduction
119
the experimental results, the authors used several electrical equivalent circuits, such as
R(RQ)(RQ), R(RC), and RG, where R is a resistance either of the solid electrolyte or electrode
process, Q is a constant phase element, and G is a Gerischer impedance [7]. Under special condi-
tions for a CEC (chemical-electrochemical-chemical)-type reaction [8], the complex expression
reduces to a rather simple impedance relation:
(6.6)
Here k represents the effective transfer rate of the chemical reaction. The form of this impedance
dispersion is somewhat similar in shape to a finite-length Warburg impedance.
Although EIS provides important information about the properties of the system, it is usu-
ally more difficult than in the steady-state polarization measurements to obtain expressions
describing the frequency-dependent behavior in terms of a physicochemical description. There-
fore, in impedance spectroscopy an identification of the process kinetics may be procured, either
by starting from experimental data, reducing them to an electrical equivalent circuit, and then
deriving a reaction mechanism, or by proceeding in the reverse order, viz, by first assuming a
reaction mechanism, then designing the corresponding theoretical equivalent circuit, and finally
proceed to an experimental confirmation by means of impedance measurements.
The present chapter has two main goals: (i) experimentally substantiating the kinetic
scheme proposed in the previous chapter for the oxygen exchange reaction on Rh electrodes in
contact with YSZ and TiO2/YSZ (section 3.1: Impedance measurements at equilibrium potential),
(ii) confirming the often suggested mechanism of electrochemical promotion via impedance
measurements in the O2, Rh/YSZ and O2, Rh/TiO2/YSZ systems (section 6.3.2: Impedance meas-
urements under polarisation). The approach to this task was divided into the following stages:
1. design of a theoretical impedance model for the O2-/O2 process and of a theoretical
equivalent circuit for this process;
2. definition of an equivalent circuit that would correspond to the experimental data over a
broad range of frequencies, and calculation of its parameters;
3. comparison of the expression for the impedance in terms of the equivalent circuit from
(2) with that derived for the theoretical model from (1).
Z ω( )Z
k jω+-------------------=
Chapter 6 Electrochemical characterization of Rh catalysts: Impedance measurements
120
6.2 Theory
6.2.1 Theoretical impedance model for the O2, Rh/electrolyte systemat equilibrium
Consider the Rh electrode interfaced with YSZ or TiO2/YSZ under open-circuit conditions
in an O2 atmosphere. In such a system at equilibrium, two processes are taking place: cathodic
reduction of oxygen (Eqs. (5.10) to (5.12), Chapter 5) and anodic oxidation of oxygen ions (Eqs.
(5.13) and (5.14), Chapter 5). It will be assumed that the electrochemical reaction sites (ERS) for
cathodic and anodic processes are different. Impedance models can then be developed independ-
ently for each process, and similar to the impedance model proposed for the lithium electrode by
Kuznetsov and co-workers [9].
Consider first the cathodic process of O2 reduction:
O2 2 O(MG) (6.7)
(6.8)
(6.9)
where MG stands for metal/gas; Vd is the rate of atomic oxygen interfacial diffusion from MG to
ERS boundaries; and iC is the rate of electrochemical reduction of oxygen. Oxygen dissociatively
adsorbs at the MG interface with a rate of adsorption B.
Assuming that the steps of oxygen adsorption and electron transfer are fast steps, then
interfacial diffusion of atomic oxygen will be the rate-limiting step.
The charge density on the Rh electrode depends on electrode potential (U) and on the quan-
tity of adsorbed on the metal surface (Γ) [10]:
(6.10)
Then the derivative of the complete differential of electrode charge density with respect to
time is equal to the charging current passing through the electrode [11]:
)()( ERSV
MG OO d→
−− →+ 2)( 2 OeO Ci
ERS
O MG( )
),( Γ= Uqq
Theory
121
(6.11)
Taking advantage of the method of complex amplitudes [11-13], one then can write for the
phasor (complex current amplitude) of the charging current (δicc):
(6.12)
where δU is the phasor of electrode potential; δΓ is the phasor of adsorption; the coefficients a1 =
and b1 = .
The relation between adsorbed , in the gas phase, and electrode potential is
given by the adsorption isotherm:
(6.13)
where C is the concentration of oxygen in the gas phase.
The balance of adsorbed oxygen atoms is determined by the magnitude of the diffusion
flux:
(6.14)
Applying the method of complex amplitudes to (6.14) one can make the transition to phase
variables:
(6.15)
For the phasor of adsorption, the equation can be written as:
(6.16)
The phasor of the diffusion flux is related to the phasor of the bulk concentration by the equation:
(6.17)
iccdqdt------ ∂q
∂U-------dU
dt------- ∂q
∂Γ------dΓ
dt------+= =
δiccdδqdt
--------- jω ∂q∂U-------δU jω ∂q
∂Γ------δΓ+ jωa1δU jωb1δΓ+= = =
∂q∂U------- ∂q
∂Γ------
O MG( ) O2
),( UCΓ=Γ
dVdtd
−=Γ
dδΓdt
---------- iωδΓ δVd–= =
CkUaCC
UU
δδδδδ 22 +=∂
Γ∂+
∂Γ∂
=Γ
δVd 1 j+( )ω1 2⁄ D 2⁄ δC=
Chapter 6 Electrochemical characterization of Rh catalysts: Impedance measurements
122
where D is the coefficient of atomic oxygen diffusion.
The faradaic current (ifc) is determined by oxygen diffusion, and for the phasor of current
in the case of semi-infinite diffusion one obtains:
(6.18)
For the balance of adsorbed species at the Rh surface, one has:
(6.19)
The total cathodic current consists of a charging current and a faradaic current:
(6.20)
The phasor of the total cathodic current flowing at the two-phase boundary is given by the sum of
phasors of the charging current and the current of the faradaic process:
(6.21)
For the anodic process of oxygen formation occurring at the equilibrium potential at Rh
electrodes in contact with YSZ or TiO2/YSZ, one can write (see Chapter 6):
(6.22)
2 O(ERS) O2(G) (6.23)
where iA is the rate of electrochemical oxidation of oxygen ions.
In the anodic process, the rate-determining step is an electron-transfer step (Eq. (6.22)).
Therefore, the relations for the magnitude of the phasors are:
(6.24)
(6.25)
δifc FδVd F 1 j+( )ω1 2⁄ D 2⁄ δC 1 j+( )ω1 2⁄ k3δC= = =
fciFjDt
dF δδωδ−=Γ=
Γ
iC icc ifc+=
δiC δicc δifc+=
)(2 2 ERS
i OeO A→− −−
UUqjica δωδ
∂∂
=
UUi
i fafa δδ
∂
∂=
Theory
123
(6.26)
For the phasor of total current of the equilibrium process, one can write:
(6.27)
The complex conductivity of the oxygen electrode in the system with solid electrolyte is
described by the following relation:
(6.28)
Insofar as the phasors of the anodic and cathodic current are mutually independent, the
complex conductivity of an electrode can be represented as a sum of cathodic and anodic conduc-
tivities, which are determined separately from each other:
(6.29)
It is easy to find the expression for the admittance of the anodic process:
(6.30)
where Cda is the double-layer capacitance of the anode.
An electric equivalent circuit for the admittance of the anodic process Eq. (6.30) can be
formulated as the parallel combination of a double-layer capacitance and a resistance of the elec-
trochemical reaction.
For the purposes of obtaining the solution for the cathodic process, it will be preferable to
write the sets of Eqs. (6.12), (6.16), (6.18), (6.19) and (6.21) in a matrix form [11-13] (see
Annex):
(6.31)
where M is a matrix vector composed of the coefficients at δU, the transposed matrix M being:
(6.32)
facaA iii δδδ +=
ACOOiii δδδ +=−
22 /
U
iY OO
δ
δ2
2 /−
=
ACACOO YY
Ui
Ui
U
iY +=+==
−
δδ
δδ
δ
δ2
2 /
1−+=∂
∂+
∂∂
= adafa
A RCjUi
UqjY ωω
δU M⋅ L N⋅=
MT0 jωa1 0 a2 0=
Chapter 6 Electrochemical characterization of Rh catalysts: Impedance measurements
124
N is a matrix column composed of the left-hand sides of Equations (6.12), (6.16), (6.18), (6.19)
and (6.21), the transposed matrix N being:
(6.33)
and L is a square matrix of fifth order:
(6.34)
Now the admittance of the cathodic process can be represented as follows:
(6.35)
where ∆L is the determinant of matrix L; ∆’L is the determinant of a matrix obtained by substitut-
ing the first column in matrix L by the matrix vector M.
The equetion 6.31 can be represented as:
(6.36)
NTδiC δicc δifcδΓ δC=
1– 1 1 0 0
0 1– 0 jωb1 0
0 0 1– 0 1 j+( )ω1 2⁄ k3
0 0 0 1– k2
0 0 1– jωF 0
LL
Ui
Y CC ∆
∆==
'δδ
δU
0jωa1
0a2
0
1– 1 1 0 00 1– 0 jωb1 0
0 0 1– 0 1 j+( )ω1 2⁄ k3
0 0 0 1– k2
0 0 1– jωF 0
δiC
δicc
δifc
δΓδC
=
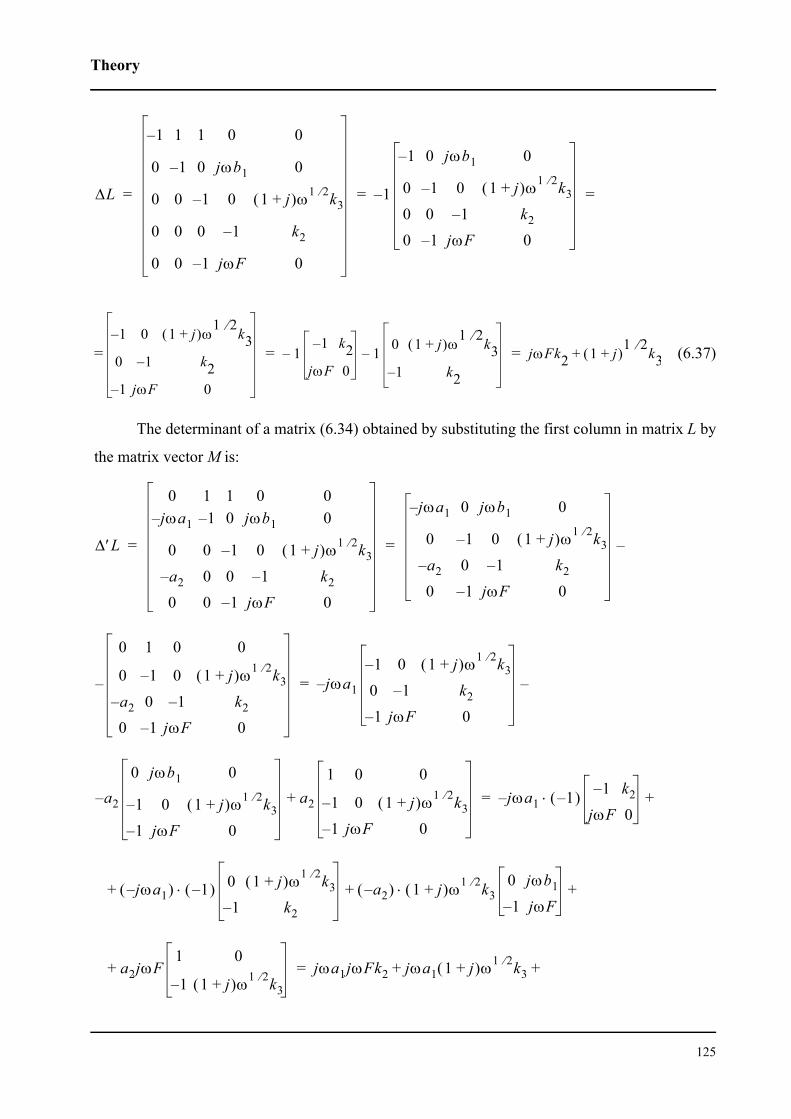
Theory
125
= (6.37)
The determinant of a matrix (6.34) obtained by substituting the first column in matrix L by
the matrix vector M is:
∆L
1– 1 1 0 0
0 1– 0 jωb1 0
0 0 1– 0 1 j+( )ω1 2⁄ k3
0 0 0 1– k2
0 0 1– jωF 0
1
1– 0 jωb1 0
0 1– 0 1 j+( )ω1 2⁄ k3
0 0 1– k2
0 1– jωF 0
–= = =
1– 0 1 j+( )ω1 2⁄ k3
0 1– k21– jωF 0
11– k2
jωF 0– 1 0 1 j+( )ω
1 2⁄ k31– k2
– jωFk2 1 j+( )1 2⁄ k3+= =
∆′L
0 1 1 0 0j– ωa1 1– 0 jωb1 0
0 0 1– 0 1 j+( )ω1 2⁄ k3
a– 2 0 0 1– k2
0 0 1– jωF 0
j– ωa1 0 jωb1 0
0 1– 0 1 j+( )ω1 2⁄ k3
a– 2 0 1– k2
0 1– jωF 0
–= =
0 1 0 0
0 1– 0 1 j+( )ω1 2⁄ k3
a– 2 0 1– k2
0 1– jωF 0
– j– ωa1
1– 0 1 j+( )ω1 2⁄ k3
0 1– k2
1– jωF 0
–=
a– 2
0 jωb1 0
1– 0 1 j+( )ω1 2⁄ k3
1– jωF 0
a2
1 0 0
1– 0 1 j+( )ω1 2⁄ k3
1– jωF 0
+ j– ωa1 1–( ) 1– k2
jωF 0+⋅=
j– ωa1( ) 1–( ) 0 1 j+( )ω1 2⁄ k3
1– k2
a2–( ) 1 j+( )ω1 2⁄ k30 jωb1
1– jωF+⋅+⋅+
a+ 2jωF1 0
1– 1 j+( )ω1 2⁄ k3
jωa1jωFk2 jωa1 1 j+( )ω1 2⁄ k3+ +=
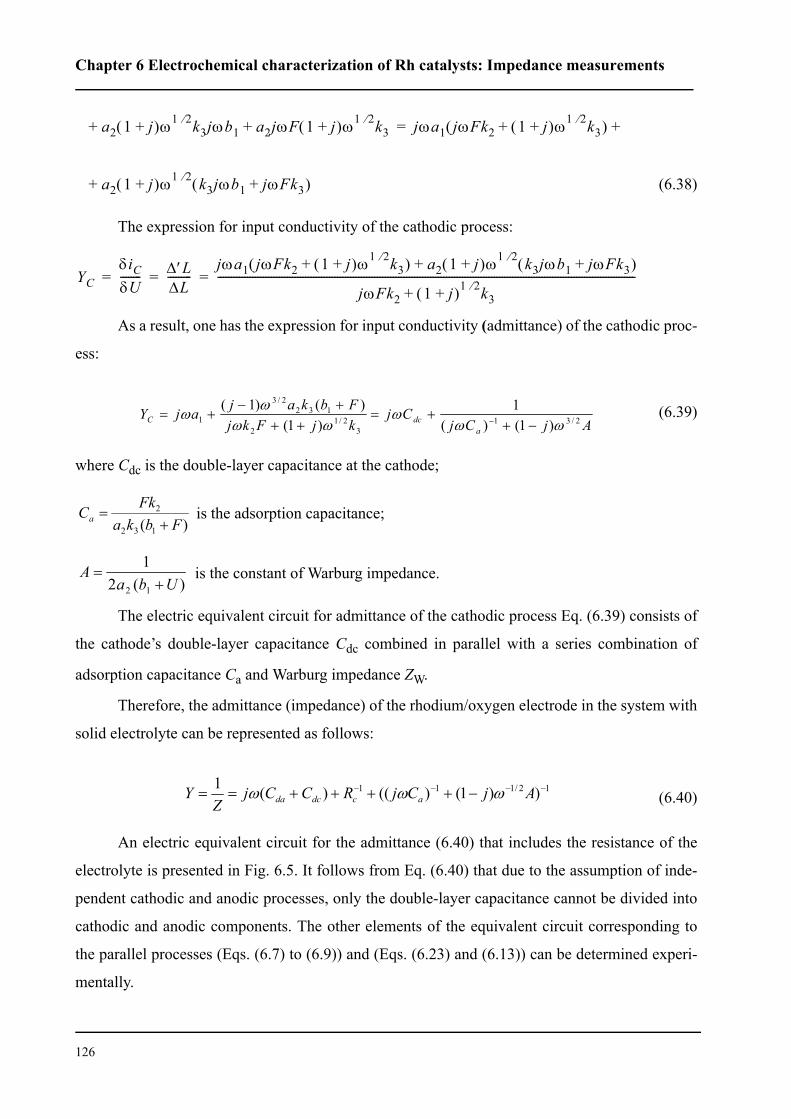
Chapter 6 Electrochemical characterization of Rh catalysts: Impedance measurements
126
(6.38)
The expression for input conductivity of the cathodic process:
As a result, one has the expression for input conductivity (admittance) of the cathodic proc-
ess:
(6.39)
where Cdc is the double-layer capacitance at the cathode;
is the adsorption capacitance;
is the constant of Warburg impedance.
The electric equivalent circuit for admittance of the cathodic process Eq. (6.39) consists of
the cathode’s double-layer capacitance Cdc combined in parallel with a series combination of
adsorption capacitance Ca and Warburg impedance ZW.
Therefore, the admittance (impedance) of the rhodium/oxygen electrode in the system with
solid electrolyte can be represented as follows:
(6.40)
An electric equivalent circuit for the admittance (6.40) that includes the resistance of the
electrolyte is presented in Fig. 6.5. It follows from Eq. (6.40) that due to the assumption of inde-
pendent cathodic and anodic processes, only the double-layer capacitance cannot be divided into
cathodic and anodic components. The other elements of the equivalent circuit corresponding to
the parallel processes (Eqs. (6.7) to (6.9)) and (Eqs. (6.23) and (6.13)) can be determined experi-
mentally.
a2+ 1 j+( )ω1 2⁄ k3jωb1 a2jωF 1 j+( )ω1 2⁄ k3+ jωa1 jωFk2 1 j+( )ω1 2⁄ k3+( ) +=
a+ 2 1 j+( )ω1 2⁄ k3jωb1 jωFk3+( )
YCδiCδU-------- ∆′L
∆L---------
jωa1 jωFk2 1 j+( )ω1 2⁄ k3+( ) a2 1 j+( )ω1 2⁄ k3jωb1 jωFk3+( )+
jωFk2 1 j+( )1 2⁄ k3+-------------------------------------------------------------------------------------------------------------------------------------------------------------= = =
AjCjCj
kjFkjFbkajajY
adcC 2/31
32/1
2
1322/3
1 )1()(1
)1()()1(
ωωω
ωωωω
−++=
+++−
+= −
)( 132
2
FbkaFk
Ca +=
)(21
12 UbaA
+=
12/111 ))1()(()(1 −−−− −++++== AjCjRCCjZ
Y acdcda ωωω
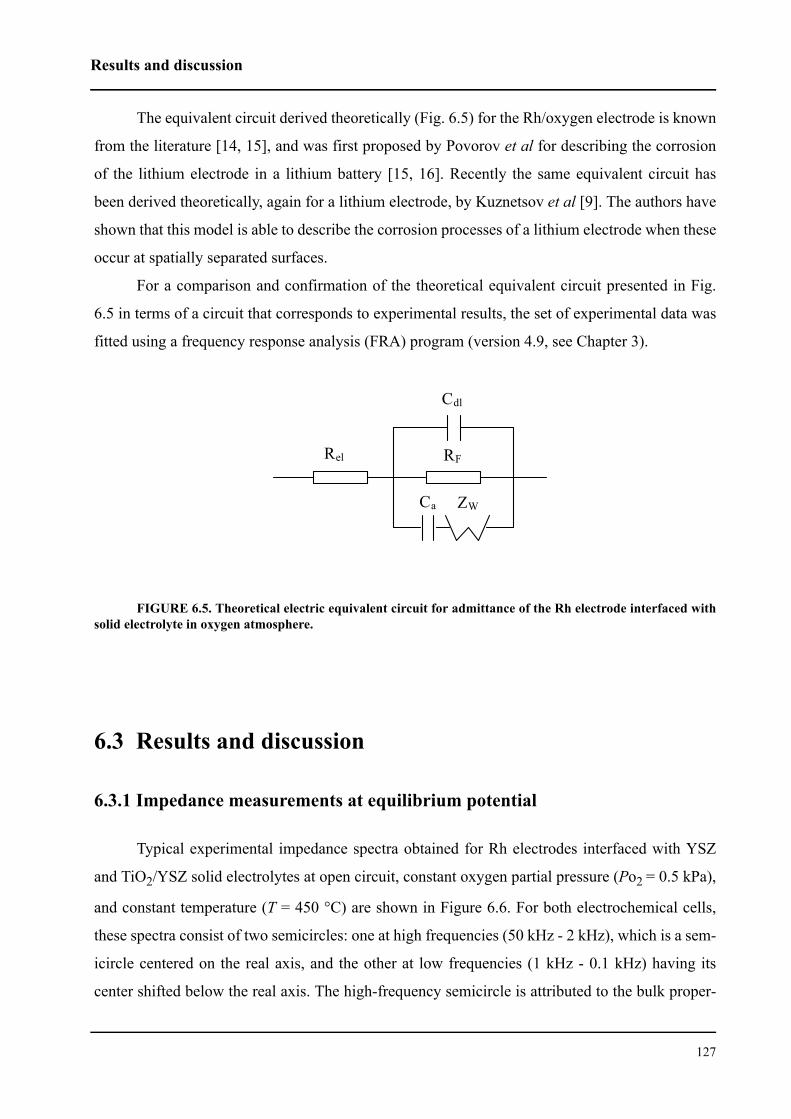
Results and discussion
127
The equivalent circuit derived theoretically (Fig. 6.5) for the Rh/oxygen electrode is known
from the literature [14, 15], and was first proposed by Povorov et al for describing the corrosion
of the lithium electrode in a lithium battery [15, 16]. Recently the same equivalent circuit has
been derived theoretically, again for a lithium electrode, by Kuznetsov et al [9]. The authors have
shown that this model is able to describe the corrosion processes of a lithium electrode when these
occur at spatially separated surfaces.
For a comparison and confirmation of the theoretical equivalent circuit presented in Fig.
6.5 in terms of a circuit that corresponds to experimental results, the set of experimental data was
fitted using a frequency response analysis (FRA) program (version 4.9, see Chapter 3).
FIGURE 6.5. Theoretical electric equivalent circuit for admittance of the Rh electrode interfaced withsolid electrolyte in oxygen atmosphere.
6.3 Results and discussion
6.3.1 Impedance measurements at equilibrium potential
Typical experimental impedance spectra obtained for Rh electrodes interfaced with YSZ
and TiO2/YSZ solid electrolytes at open circuit, constant oxygen partial pressure (Po2 = 0.5 kPa),
and constant temperature (T = 450 °C) are shown in Figure 6.6. For both electrochemical cells,
these spectra consist of two semicircles: one at high frequencies (50 kHz - 2 kHz), which is a sem-
icircle centered on the real axis, and the other at low frequencies (1 kHz - 0.1 kHz) having its
center shifted below the real axis. The high-frequency semicircle is attributed to the bulk proper-
Cdl
Rel
Ca ZW
RF
Chapter 6 Electrochemical characterization of Rh catalysts: Impedance measurements
128
ties of the solid electrolyte [2, 17]. It changes when varying the working temperature, since the
conductivity of the solid electrolyte changes with temperature but remains constant when apply-
ing a polarizing potential. The first semicircular arc corresponds to parallel R-C circuit elements,
R being related to the electrolyte’s resistance and C representing the geometric capacitance of the
samples [2]. The second semicircle is related to the electrode process.
It is interesting to analyse the first semicircular arc, since it provides information about the
properties of the solid electrolyte. There is a considerable difference in sizes of the first semicircle
between the Rh/YSZ and Rh/TiO2/YSZ system, and consequently in parameters R. This differ-
ence arises from the diverse nature of the YSZ and TiO2 supports, and can be rationalized in terms
of differences in grain size and grain boundary resistance between the two solids.
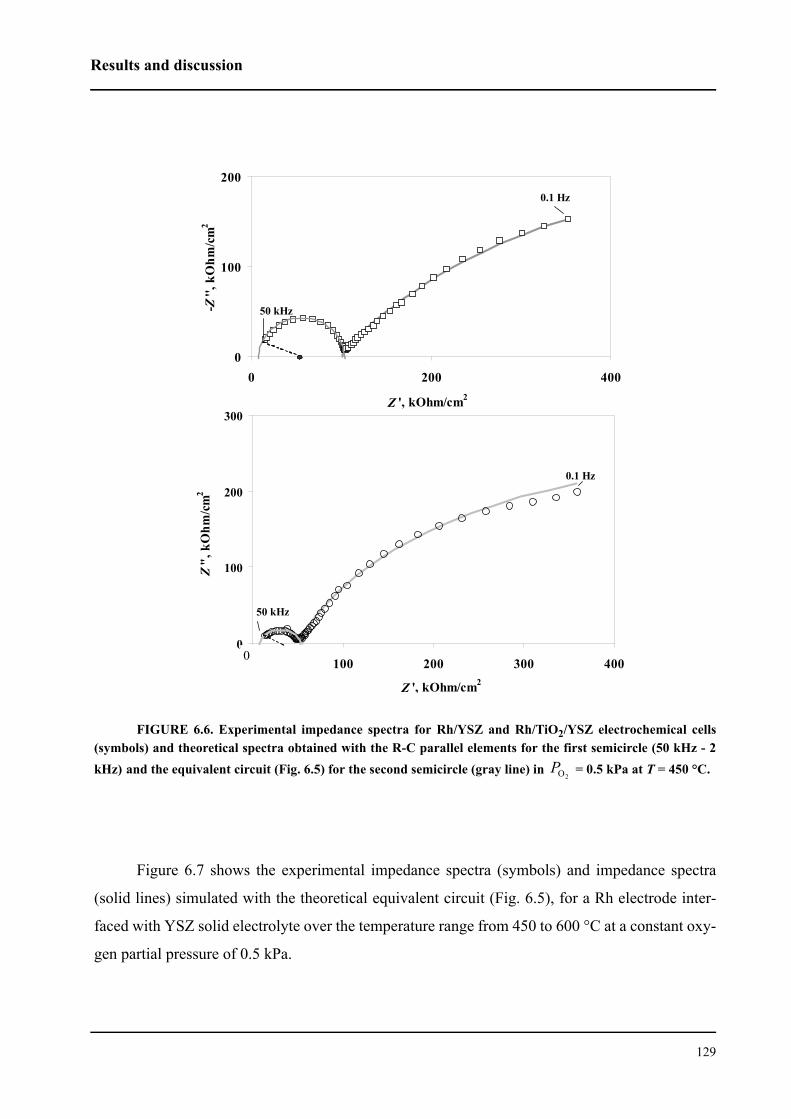
Results and discussion
129
Figure 6.7 shows the experimental impedance spectra (symbols) and impedance spectra
(solid lines) simulated with the theoretical equivalent circuit (Fig. 6.5), for a Rh electrode inter-
faced with YSZ solid electrolyte over the temperature range from 450 to 600 °C at a constant oxy-
gen partial pressure of 0.5 kPa.
FIGURE 6.6. Experimental impedance spectra for Rh/YSZ and Rh/TiO2/YSZ electrochemical cells(symbols) and theoretical spectra obtained with the R-C parallel elements for the first semicircle (50 kHz - 2kHz) and the equivalent circuit (Fig. 6.5) for the second semicircle (gray line) in = 0.5 kPa at T = 450 °C.
0
100
200
0 200 400
Z ', kOhm/cm2
-Z'',
kO
hm/c
m2
50 kHz
0.1 Hz
0
100
200
300
0 100 200 300 400
Z ', kOhm/cm2
Z",
kO
hm/c
m2
0
50 kHz
0.1 Hz
2OP
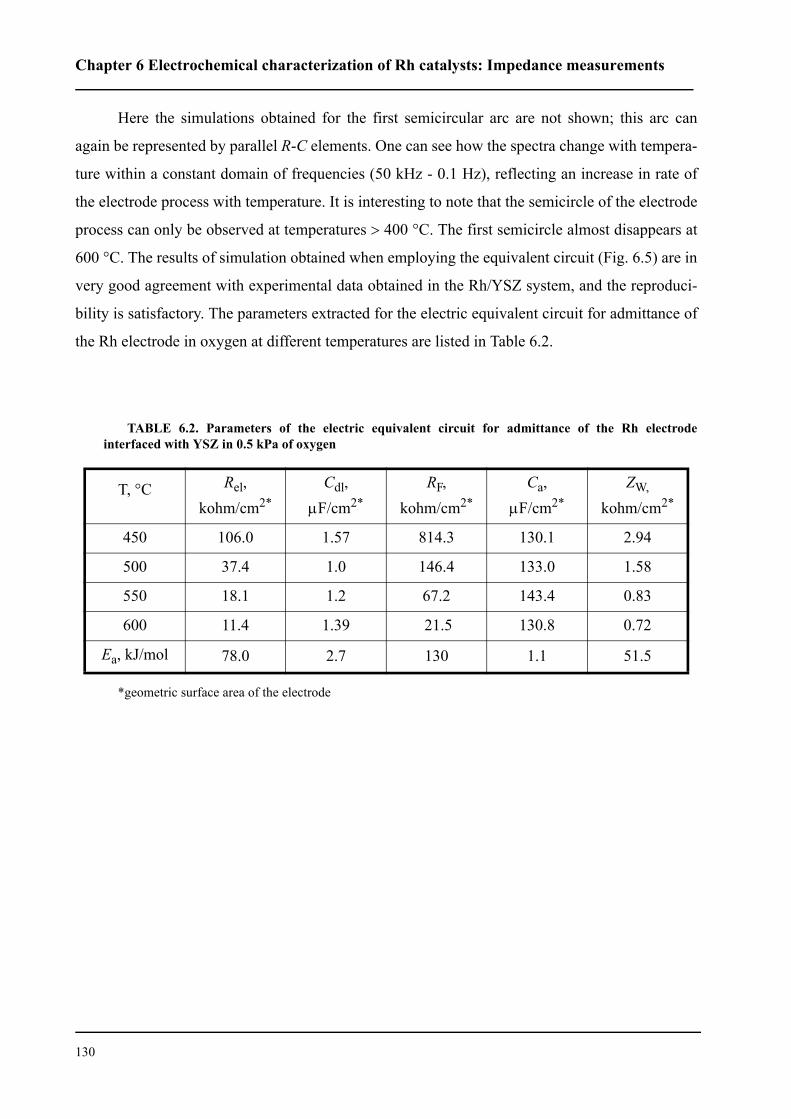
Chapter 6 Electrochemical characterization of Rh catalysts: Impedance measurements
130
Here the simulations obtained for the first semicircular arc are not shown; this arc can
again be represented by parallel R-C elements. One can see how the spectra change with tempera-
ture within a constant domain of frequencies (50 kHz - 0.1 Hz), reflecting an increase in rate of
the electrode process with temperature. It is interesting to note that the semicircle of the electrode
process can only be observed at temperatures > 400 °C. The first semicircle almost disappears at
600 °C. The results of simulation obtained when employing the equivalent circuit (Fig. 6.5) are in
very good agreement with experimental data obtained in the Rh/YSZ system, and the reproduci-
bility is satisfactory. The parameters extracted for the electric equivalent circuit for admittance of
the Rh electrode in oxygen at different temperatures are listed in Table 6.2.
*geometric surface area of the electrode
TABLE 6.2. Parameters of the electric equivalent circuit for admittance of the Rh electrodeinterfaced with YSZ in 0.5 kPa of oxygen
T, °C Rel,kohm/cm2*
Cdl,µF/cm2*
RF,kohm/cm2*
Ca,µF/cm2*
ZW,
kohm/cm2*
450 106.0 1.57 814.3 130.1 2.94
500 37.4 1.0 146.4 133.0 1.58
550 18.1 1.2 67.2 143.4 0.83
600 11.4 1.39 21.5 130.8 0.72
Ea, kJ/mol 78.0 2.7 130 1.1 51.5
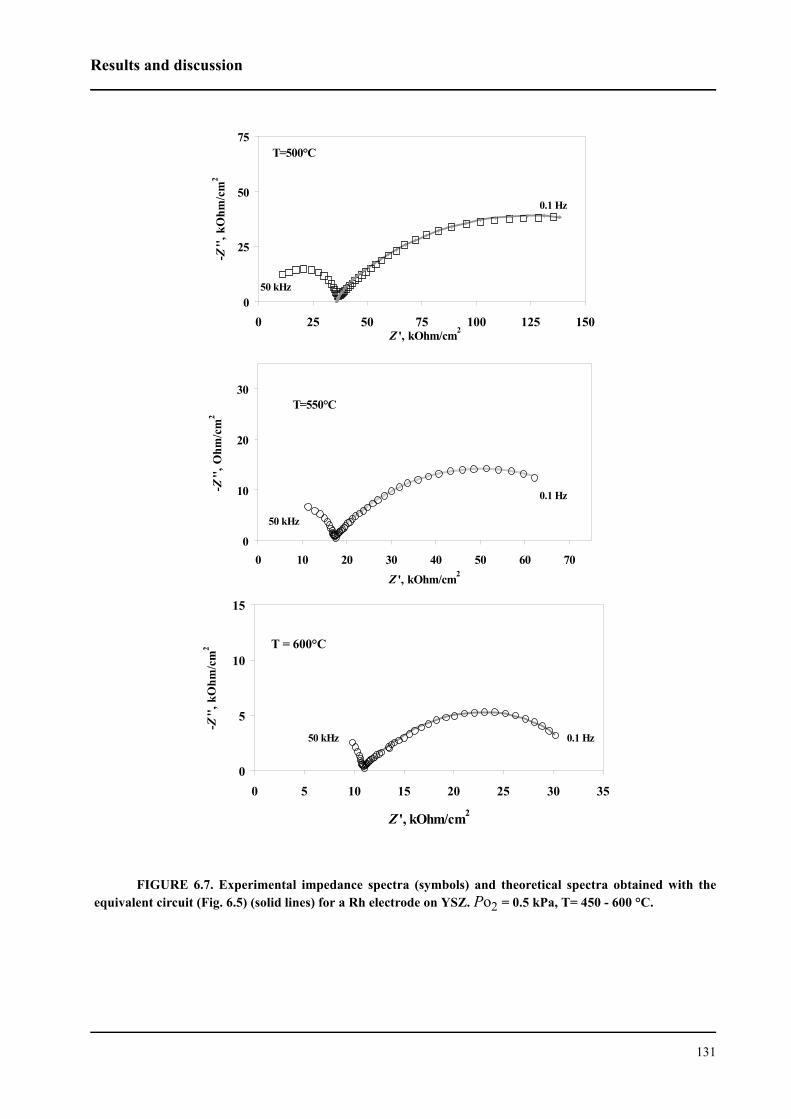
Results and discussion
131
FIGURE 6.7. Experimental impedance spectra (symbols) and theoretical spectra obtained with theequivalent circuit (Fig. 6.5) (solid lines) for a Rh electrode on YSZ. Po2 = 0.5 kPa, T= 450 - 600 °C.
0
25
50
75
0 25 50 75 100 125 150Z ', kOhm/cm2
-Z'',
kO
hm/c
m2
50 kHz
T=500°C
0.1 Hz
0
10
20
30
0 10 20 30 40 50 60 70Z ', kOhm/cm2
-Z'',
Ohm
/cm
2
T=550°C
50 kHz
0.1 Hz
0
5
10
15
0 5 10 15 20 25 30 35
Z ', kOhm/cm2
-Z'',
kO
hm/c
m2
50 kHz 0.1 Hz
T = 600°C
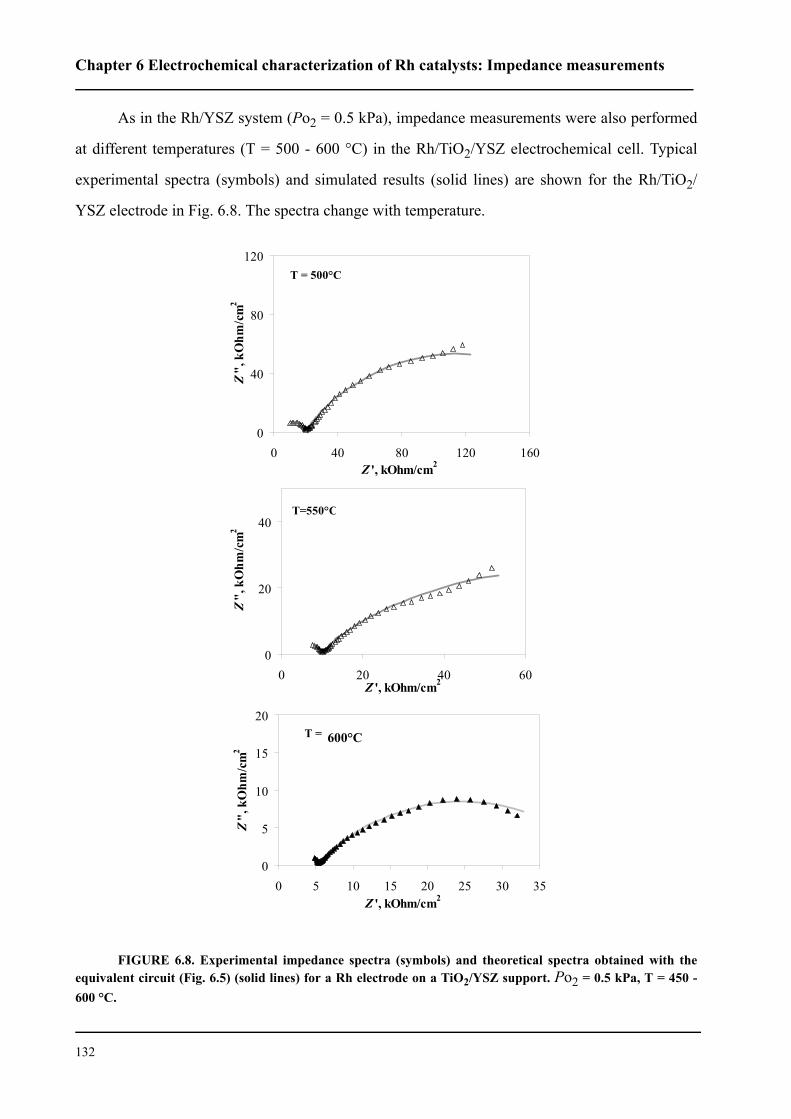
Chapter 6 Electrochemical characterization of Rh catalysts: Impedance measurements
132
As in the Rh/YSZ system (Po2 = 0.5 kPa), impedance measurements were also performed
at different temperatures (T = 500 - 600 °C) in the Rh/TiO2/YSZ electrochemical cell. Typical
experimental spectra (symbols) and simulated results (solid lines) are shown for the Rh/TiO2/
YSZ electrode in Fig. 6.8. The spectra change with temperature.
FIGURE 6.8. Experimental impedance spectra (symbols) and theoretical spectra obtained with theequivalent circuit (Fig. 6.5) (solid lines) for a Rh electrode on a TiO2/YSZ support. Po2 = 0.5 kPa, T = 450 -600 °C.
0
20
40
0 20 40 60Z ', kOhm/cm2
Z",
kO
hm/c
m2
T=550°C
0
40
80
120
0 40 80 120 160Z ', kOhm/cm2
Z",
kO
hm/c
m2
T = 500°C
0
5
10
15
20
0 5 10 15 20 25 30 35Z ', kOhm/cm2
Z",
kO
hm/c
m2
T = 600°C
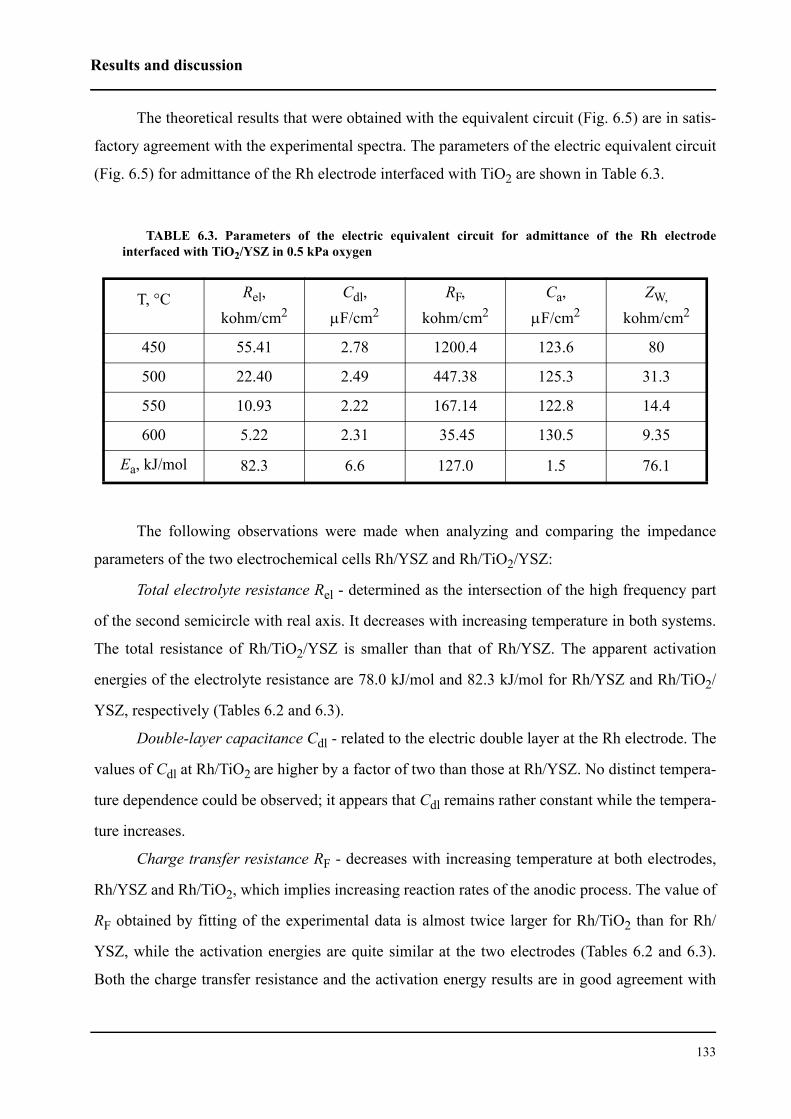
Results and discussion
133
The theoretical results that were obtained with the equivalent circuit (Fig. 6.5) are in satis-
factory agreement with the experimental spectra. The parameters of the electric equivalent circuit
(Fig. 6.5) for admittance of the Rh electrode interfaced with TiO2 are shown in Table 6.3.
The following observations were made when analyzing and comparing the impedance
parameters of the two electrochemical cells Rh/YSZ and Rh/TiO2/YSZ:
Total electrolyte resistance Rel - determined as the intersection of the high frequency part
of the second semicircle with real axis. It decreases with increasing temperature in both systems.
The total resistance of Rh/TiO2/YSZ is smaller than that of Rh/YSZ. The apparent activation
energies of the electrolyte resistance are 78.0 kJ/mol and 82.3 kJ/mol for Rh/YSZ and Rh/TiO2/
YSZ, respectively (Tables 6.2 and 6.3).
Double-layer capacitance Cdl - related to the electric double layer at the Rh electrode. The
values of Cdl at Rh/TiO2 are higher by a factor of two than those at Rh/YSZ. No distinct tempera-
ture dependence could be observed; it appears that Cdl remains rather constant while the tempera-
ture increases.
Charge transfer resistance RF - decreases with increasing temperature at both electrodes,
Rh/YSZ and Rh/TiO2, which implies increasing reaction rates of the anodic process. The value of
RF obtained by fitting of the experimental data is almost twice larger for Rh/TiO2 than for Rh/
YSZ, while the activation energies are quite similar at the two electrodes (Tables 6.2 and 6.3).
Both the charge transfer resistance and the activation energy results are in good agreement with
TABLE 6.3. Parameters of the electric equivalent circuit for admittance of the Rh electrodeinterfaced with TiO2/YSZ in 0.5 kPa oxygen
T, °C Rel,kohm/cm2
Cdl,µF/cm2
RF,kohm/cm2
Ca,µF/cm2
ZW,
kohm/cm2
450 55.41 2.78 1200.4 123.6 80
500 22.40 2.49 447.38 125.3 31.3
550 10.93 2.22 167.14 122.8 14.4
600 5.22 2.31 35.45 130.5 9.35
Ea, kJ/mol 82.3 6.6 127.0 1.5 76.1
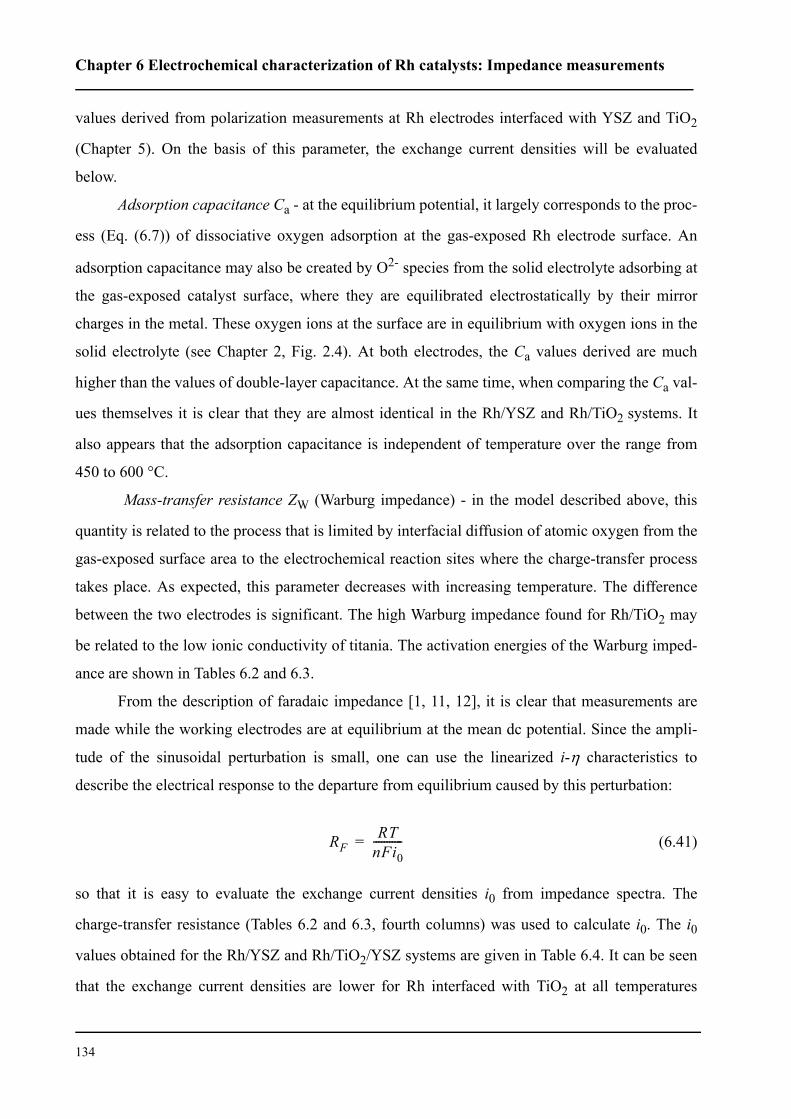
Chapter 6 Electrochemical characterization of Rh catalysts: Impedance measurements
134
values derived from polarization measurements at Rh electrodes interfaced with YSZ and TiO2
(Chapter 5). On the basis of this parameter, the exchange current densities will be evaluated
below.
Adsorption capacitance Ca - at the equilibrium potential, it largely corresponds to the proc-
ess (Eq. (6.7)) of dissociative oxygen adsorption at the gas-exposed Rh electrode surface. An
adsorption capacitance may also be created by O2- species from the solid electrolyte adsorbing at
the gas-exposed catalyst surface, where they are equilibrated electrostatically by their mirror
charges in the metal. These oxygen ions at the surface are in equilibrium with oxygen ions in the
solid electrolyte (see Chapter 2, Fig. 2.4). At both electrodes, the Ca values derived are much
higher than the values of double-layer capacitance. At the same time, when comparing the Ca val-
ues themselves it is clear that they are almost identical in the Rh/YSZ and Rh/TiO2 systems. It
also appears that the adsorption capacitance is independent of temperature over the range from
450 to 600 °C.
Mass-transfer resistance ZW (Warburg impedance) - in the model described above, this
quantity is related to the process that is limited by interfacial diffusion of atomic oxygen from the
gas-exposed surface area to the electrochemical reaction sites where the charge-transfer process
takes place. As expected, this parameter decreases with increasing temperature. The difference
between the two electrodes is significant. The high Warburg impedance found for Rh/TiO2 may
be related to the low ionic conductivity of titania. The activation energies of the Warburg imped-
ance are shown in Tables 6.2 and 6.3.
From the description of faradaic impedance [1, 11, 12], it is clear that measurements are
made while the working electrodes are at equilibrium at the mean dc potential. Since the ampli-
tude of the sinusoidal perturbation is small, one can use the linearized i-η characteristics to
describe the electrical response to the departure from equilibrium caused by this perturbation:
(6.41)
so that it is easy to evaluate the exchange current densities i0 from impedance spectra. The
charge-transfer resistance (Tables 6.2 and 6.3, fourth columns) was used to calculate i0. The i0
values obtained for the Rh/YSZ and Rh/TiO2/YSZ systems are given in Table 6.4. It can be seen
that the exchange current densities are lower for Rh interfaced with TiO2 at all temperatures
RFRT
nFi0-----------=
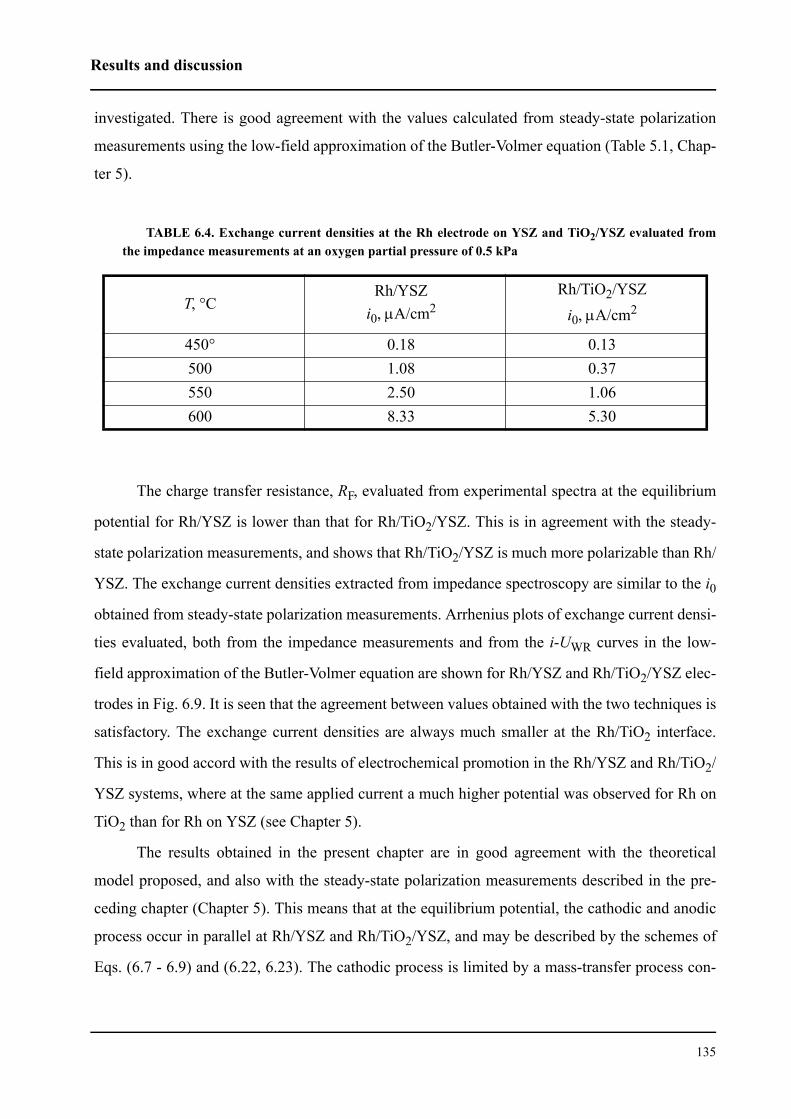
Results and discussion
135
investigated. There is good agreement with the values calculated from steady-state polarization
measurements using the low-field approximation of the Butler-Volmer equation (Table 5.1, Chap-
ter 5).
The charge transfer resistance, RF, evaluated from experimental spectra at the equilibrium
potential for Rh/YSZ is lower than that for Rh/TiO2/YSZ. This is in agreement with the steady-
state polarization measurements, and shows that Rh/TiO2/YSZ is much more polarizable than Rh/
YSZ. The exchange current densities extracted from impedance spectroscopy are similar to the i0
obtained from steady-state polarization measurements. Arrhenius plots of exchange current densi-
ties evaluated, both from the impedance measurements and from the i-UWR curves in the low-
field approximation of the Butler-Volmer equation are shown for Rh/YSZ and Rh/TiO2/YSZ elec-
trodes in Fig. 6.9. It is seen that the agreement between values obtained with the two techniques is
satisfactory. The exchange current densities are always much smaller at the Rh/TiO2 interface.
This is in good accord with the results of electrochemical promotion in the Rh/YSZ and Rh/TiO2/
YSZ systems, where at the same applied current a much higher potential was observed for Rh on
TiO2 than for Rh on YSZ (see Chapter 5).
The results obtained in the present chapter are in good agreement with the theoretical
model proposed, and also with the steady-state polarization measurements described in the pre-
ceding chapter (Chapter 5). This means that at the equilibrium potential, the cathodic and anodic
process occur in parallel at Rh/YSZ and Rh/TiO2/YSZ, and may be described by the schemes of
Eqs. (6.7 - 6.9) and (6.22, 6.23). The cathodic process is limited by a mass-transfer process con-
TABLE 6.4. Exchange current densities at the Rh electrode on YSZ and TiO2/YSZ evaluated fromthe impedance measurements at an oxygen partial pressure of 0.5 kPa
T, °CRh/YSZ
i0, µA/cm2Rh/TiO2/YSZ
i0, µA/cm2
450° 0.18 0.13500 1.08 0.37550 2.50 1.06600 8.33 5.30
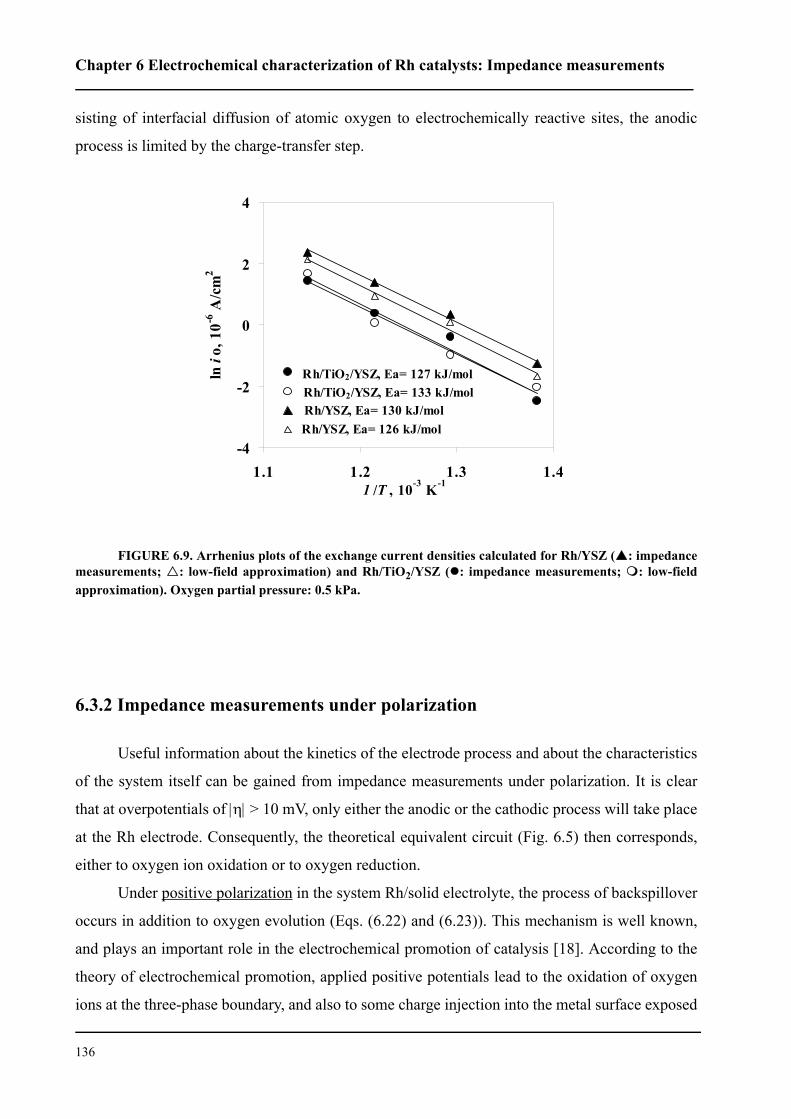
Chapter 6 Electrochemical characterization of Rh catalysts: Impedance measurements
136
sisting of interfacial diffusion of atomic oxygen to electrochemically reactive sites, the anodic
process is limited by the charge-transfer step.
FIGURE 6.9. Arrhenius plots of the exchange current densities calculated for Rh/YSZ ( : impedancemeasurements; : low-field approximation) and Rh/TiO2/YSZ ( : impedance measurements; : low-fieldapproximation). Oxygen partial pressure: 0.5 kPa.
6.3.2 Impedance measurements under polarization
Useful information about the kinetics of the electrode process and about the characteristics
of the system itself can be gained from impedance measurements under polarization. It is clear
that at overpotentials of |η| > 10 mV, only either the anodic or the cathodic process will take place
at the Rh electrode. Consequently, the theoretical equivalent circuit (Fig. 6.5) then corresponds,
either to oxygen ion oxidation or to oxygen reduction.
Under positive polarization in the system Rh/solid electrolyte, the process of backspillover
occurs in addition to oxygen evolution (Eqs. (6.22) and (6.23)). This mechanism is well known,
and plays an important role in the electrochemical promotion of catalysis [18]. According to the
theory of electrochemical promotion, applied positive potentials lead to the oxidation of oxygen
ions at the three-phase boundary, and also to some charge injection into the metal surface exposed
-4
-2
0
2
4
1.1 1.2 1.3 1.41 /T , 10-3 K-1
ln i
o, 1
0-6 A
/cm
2
Rh/TiO2/YSZ, Ea= 127 kJ/molRh/TiO2/YSZ, Ea= 133 kJ/molRh/YSZ, Ea= 130 kJ/molRh/YSZ, Ea= 126 kJ/mol
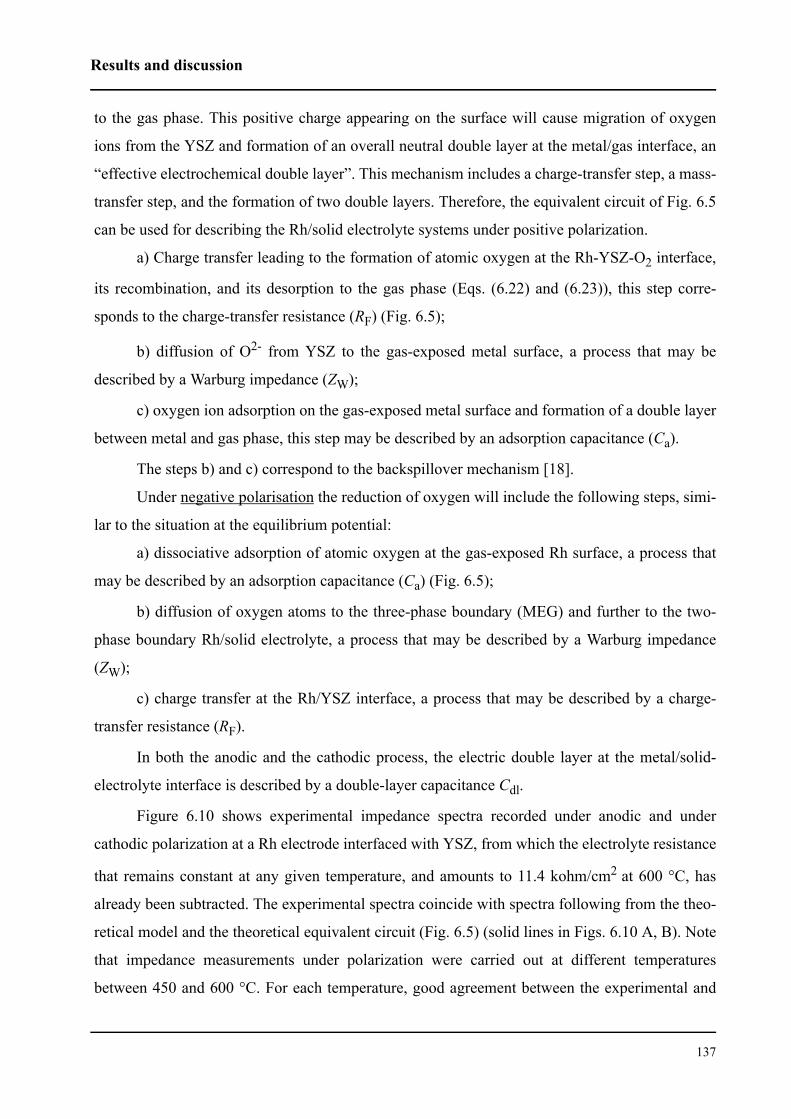
Results and discussion
137
to the gas phase. This positive charge appearing on the surface will cause migration of oxygen
ions from the YSZ and formation of an overall neutral double layer at the metal/gas interface, an
“effective electrochemical double layer”. This mechanism includes a charge-transfer step, a mass-
transfer step, and the formation of two double layers. Therefore, the equivalent circuit of Fig. 6.5
can be used for describing the Rh/solid electrolyte systems under positive polarization.
a) Charge transfer leading to the formation of atomic oxygen at the Rh-YSZ-O2 interface,
its recombination, and its desorption to the gas phase (Eqs. (6.22) and (6.23)), this step corre-
sponds to the charge-transfer resistance (RF) (Fig. 6.5);
b) diffusion of O2- from YSZ to the gas-exposed metal surface, a process that may be
described by a Warburg impedance (ZW);
c) oxygen ion adsorption on the gas-exposed metal surface and formation of a double layer
between metal and gas phase, this step may be described by an adsorption capacitance (Ca).
The steps b) and c) correspond to the backspillover mechanism [18].
Under negative polarisation the reduction of oxygen will include the following steps, simi-
lar to the situation at the equilibrium potential:
a) dissociative adsorption of atomic oxygen at the gas-exposed Rh surface, a process that
may be described by an adsorption capacitance (Ca) (Fig. 6.5);
b) diffusion of oxygen atoms to the three-phase boundary (MEG) and further to the two-
phase boundary Rh/solid electrolyte, a process that may be described by a Warburg impedance
(ZW);
c) charge transfer at the Rh/YSZ interface, a process that may be described by a charge-
transfer resistance (RF).
In both the anodic and the cathodic process, the electric double layer at the metal/solid-
electrolyte interface is described by a double-layer capacitance Cdl.
Figure 6.10 shows experimental impedance spectra recorded under anodic and under
cathodic polarization at a Rh electrode interfaced with YSZ, from which the electrolyte resistance
that remains constant at any given temperature, and amounts to 11.4 kohm/cm2 at 600 °C, has
already been subtracted. The experimental spectra coincide with spectra following from the theo-
retical model and the theoretical equivalent circuit (Fig. 6.5) (solid lines in Figs. 6.10 A, B). Note
that impedance measurements under polarization were carried out at different temperatures
between 450 and 600 °C. For each temperature, good agreement between the experimental and
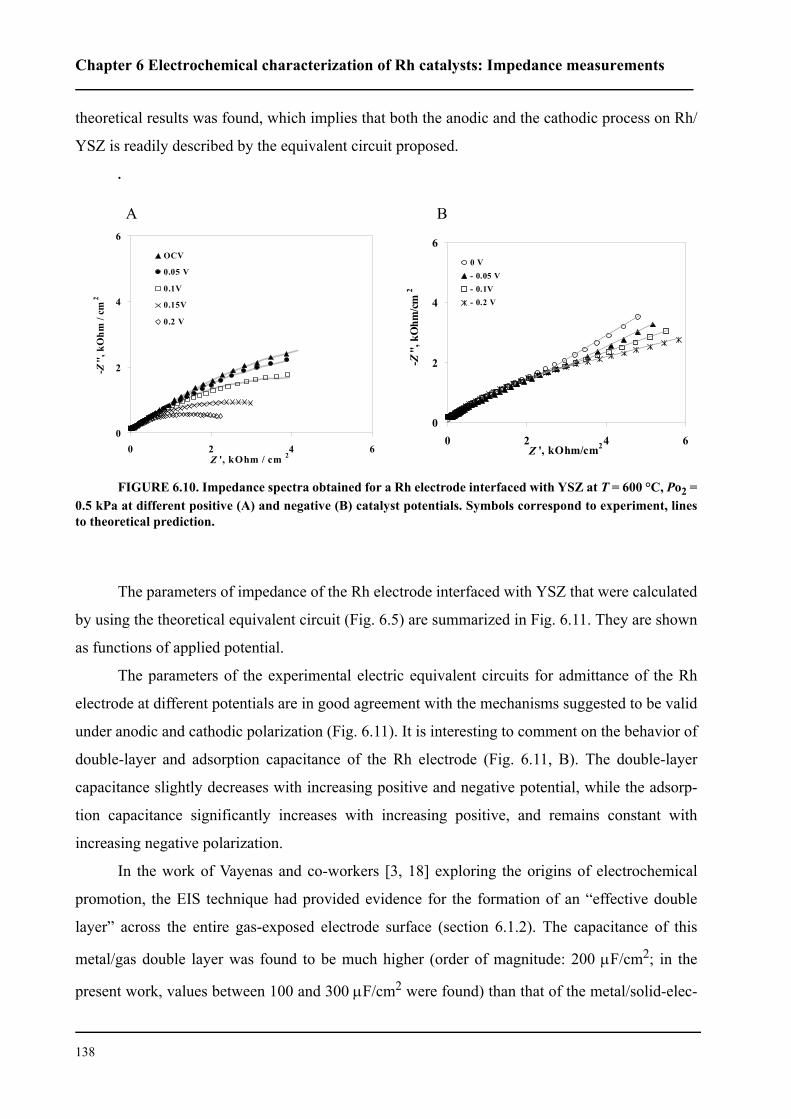
Chapter 6 Electrochemical characterization of Rh catalysts: Impedance measurements
138
theoretical results was found, which implies that both the anodic and the cathodic process on Rh/
YSZ is readily described by the equivalent circuit proposed.
.
The parameters of impedance of the Rh electrode interfaced with YSZ that were calculated
by using the theoretical equivalent circuit (Fig. 6.5) are summarized in Fig. 6.11. They are shown
as functions of applied potential.
The parameters of the experimental electric equivalent circuits for admittance of the Rh
electrode at different potentials are in good agreement with the mechanisms suggested to be valid
under anodic and cathodic polarization (Fig. 6.11). It is interesting to comment on the behavior of
double-layer and adsorption capacitance of the Rh electrode (Fig. 6.11, B). The double-layer
capacitance slightly decreases with increasing positive and negative potential, while the adsorp-
tion capacitance significantly increases with increasing positive, and remains constant with
increasing negative polarization.
In the work of Vayenas and co-workers [3, 18] exploring the origins of electrochemical
promotion, the EIS technique had provided evidence for the formation of an “effective double
layer” across the entire gas-exposed electrode surface (section 6.1.2). The capacitance of this
metal/gas double layer was found to be much higher (order of magnitude: 200 µF/cm2; in the
present work, values between 100 and 300 µF/cm2 were found) than that of the metal/solid-elec-
A B
FIGURE 6.10. Impedance spectra obtained for a Rh electrode interfaced with YSZ at T = 600 °C, Po2 =0.5 kPa at different positive (A) and negative (B) catalyst potentials. Symbols correspond to experiment, linesto theoretical prediction.
0
2
4
6
0 2 4 6Z ', kOhm / cm 2
-Z'',
kO
hm /
cm 2
OCV
0.05 V
0.1V
0.15V
0.2 V
0
2
4
6
0 2 4 6Z ', kOhm/cm2
-Z'',
kO
hm/cm
2
0 V- 0.05 V- 0.1V- 0.2 V
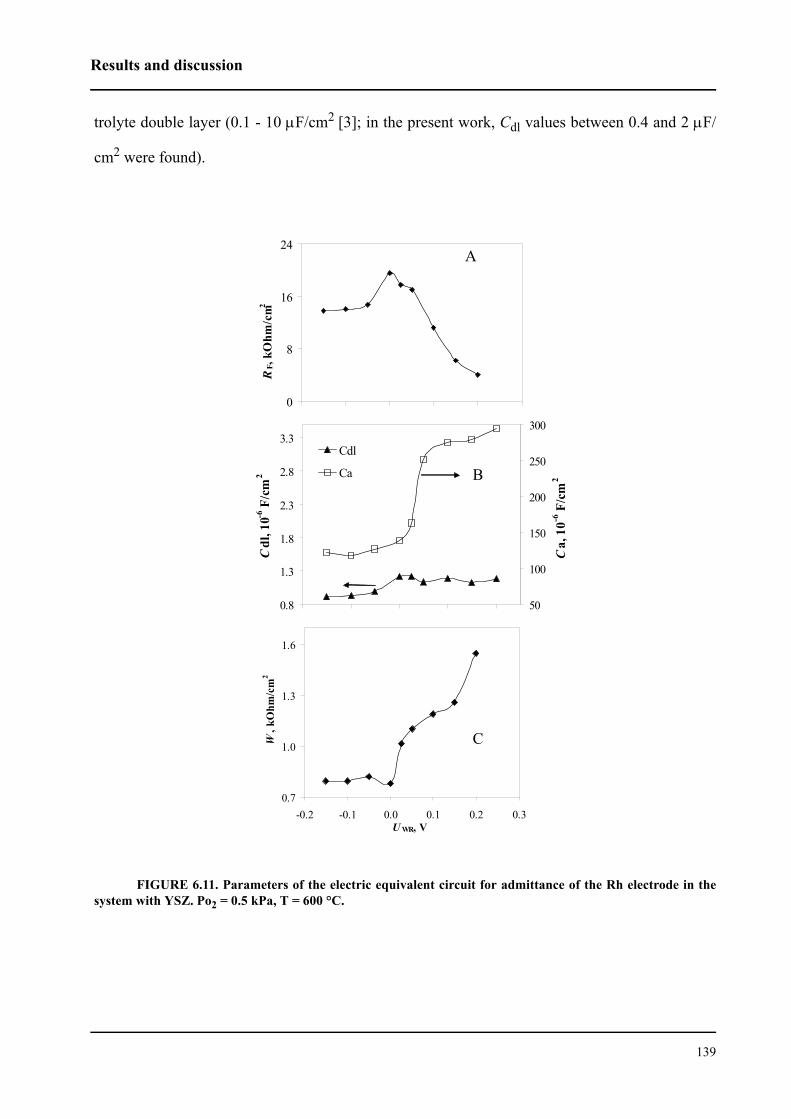
Results and discussion
139
trolyte double layer (0.1 - 10 µF/cm2 [3]; in the present work, Cdl values between 0.4 and 2 µF/
cm2 were found).
FIGURE 6.11. Parameters of the electric equivalent circuit for admittance of the Rh electrode in thesystem with YSZ. Po2 = 0.5 kPa, T = 600 °C.
0
8
16
24
-0.2 -0.1 0 0.1 0.2 0.3U , V
RF,
kOhm
/cm2
0.8
1.3
1.8
2.3
2.8
3.3
-0.2 -0.1 0 0.1 0.2U , V
Cdl
, 10-6
F/c
m2
50
100
150
200
250
300
Ca,
10-6
F/c
m2
Cdl
Ca
0.7
1.0
1.3
1.6
-0.2 -0.1 0.0 0.1 0.2 0.3U WR, V
W, k
Ohm
/cm
2A
B
C
Chapter 6 Electrochemical characterization of Rh catalysts: Impedance measurements
140
The values of both capacitances are known to be related to the gas-exposed electrode sur-
face area, NG, and to the “surface area” of the three-phase boundary, Ntpb, by Eq. (6.3). For the
case of Rh/YSZ, it can be written as:
(6.42)
This relation [18] allows one to calculate the tpb length on the basis of impedance measure-
ments. Typical values of Ntpb are of the order of 10-9-10-10 mol metal/cm2 electrolyte, ie, typically
by a factor of 102 to 103 smaller than NG. The parameter Ntpb expresses the number of moles of
electrode metal in contact, both with the solid electrolyte and with the gas phase. More commonly
the length of the tpb is normalized with respect to surface area, S, of the electrolyte. This normal-
ized tpb length, denoted Ntpb,n, is Ntpb/S, its values are given in Table 6.5 for Rh/YSZ catalyst as a
function of applied potential. These values correspond to a “length”, ltpb, of several km per cm2 of
solid electrolyte.
TABLE 6.5. Normalized tpb lengths, Ntpb,n, in the Rh/YSZ system as a function of the appliedpotential; T = 600 °C, Po2 = 0.5 kPa
UWR, V Ntpb,n, 10-10 mol Rh/cm2
-0.15 6.118-0.10 5.99-0.05 6.570.00 6.70.025 5.70.05 3.420.10 3.30.15 3.080.20 3.06
NtpbNG
----------CdlCa--------=
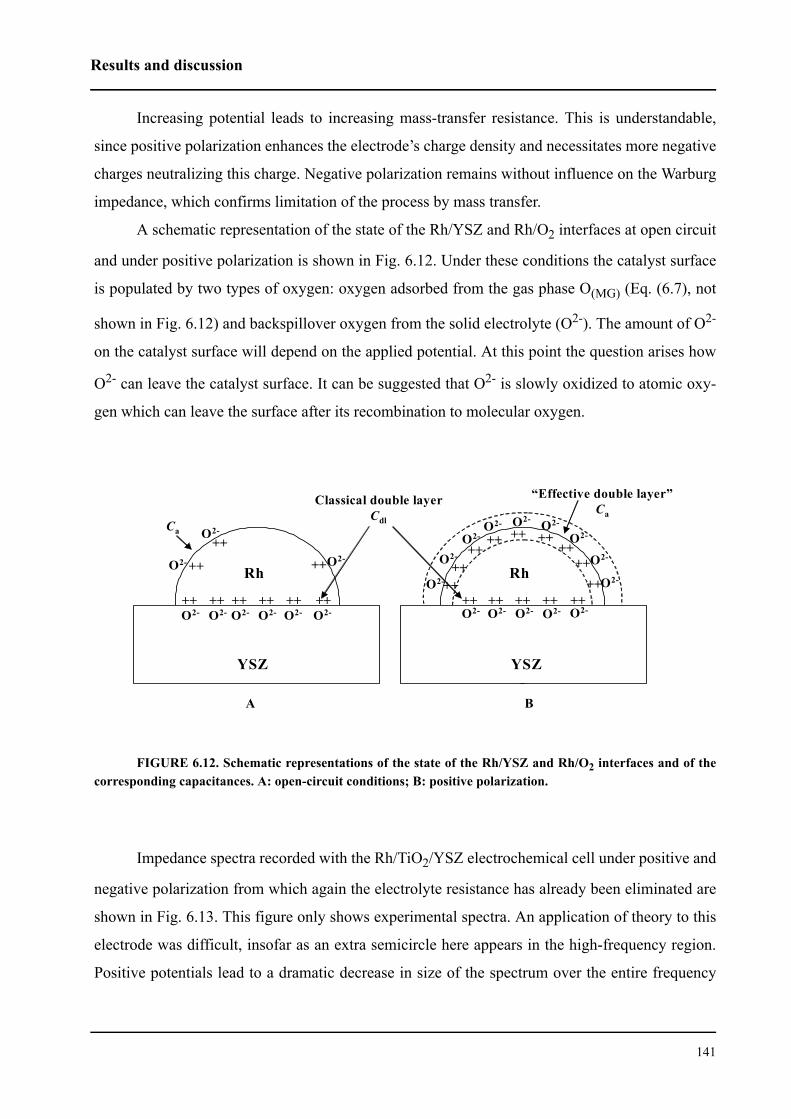
Results and discussion
141
Increasing potential leads to increasing mass-transfer resistance. This is understandable,
since positive polarization enhances the electrode’s charge density and necessitates more negative
charges neutralizing this charge. Negative polarization remains without influence on the Warburg
impedance, which confirms limitation of the process by mass transfer.
A schematic representation of the state of the Rh/YSZ and Rh/O2 interfaces at open circuit
and under positive polarization is shown in Fig. 6.12. Under these conditions the catalyst surface
is populated by two types of oxygen: oxygen adsorbed from the gas phase O(MG) (Eq. (6.7), not
shown in Fig. 6.12) and backspillover oxygen from the solid electrolyte (O2-). The amount of O2-
on the catalyst surface will depend on the applied potential. At this point the question arises how
O2- can leave the catalyst surface. It can be suggested that O2- is slowly oxidized to atomic oxy-
gen which can leave the surface after its recombination to molecular oxygen.
FIGURE 6.12. Schematic representations of the state of the Rh/YSZ and Rh/O2 interfaces and of thecorresponding capacitances. A: open-circuit conditions; B: positive polarization.
Impedance spectra recorded with the Rh/TiO2/YSZ electrochemical cell under positive and
negative polarization from which again the electrolyte resistance has already been eliminated are
shown in Fig. 6.13. This figure only shows experimental spectra. An application of theory to this
electrode was difficult, insofar as an extra semicircle here appears in the high-frequency region.
Positive potentials lead to a dramatic decrease in size of the spectrum over the entire frequency
A B
“Effective double layer”Ca
O2- O2- O2- O2- O2- O2-
O2-O2-
O2-
++ ++ ++ ++ ++ ++
++
++
++ O2-
O2-O2-
O2-
O2-O2-
O2-
O2-
++ ++ ++ ++ ++
++++
O2-
++++
++ ++ ++++
++
O2- O2- O2- O2- O2-
YSZ
Rh
YSZ
Rh
Classical double layerCdlCa
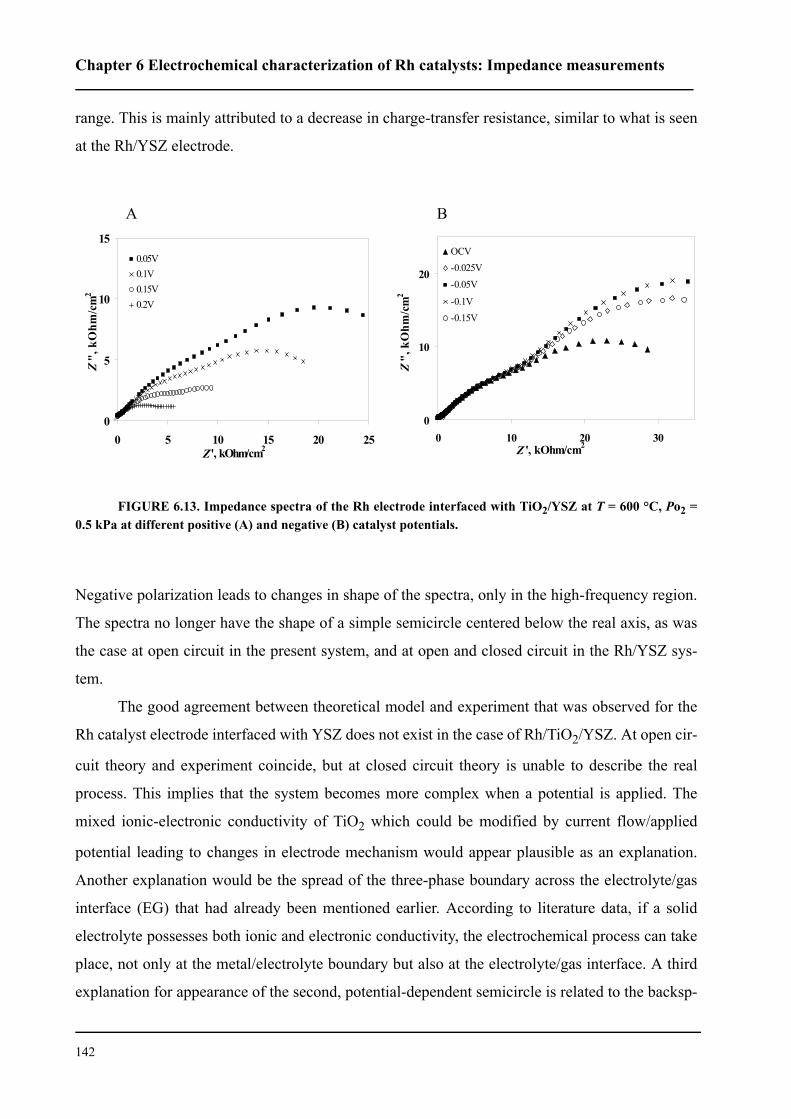
Chapter 6 Electrochemical characterization of Rh catalysts: Impedance measurements
142
range. This is mainly attributed to a decrease in charge-transfer resistance, similar to what is seen
at the Rh/YSZ electrode.
Negative polarization leads to changes in shape of the spectra, only in the high-frequency region.
The spectra no longer have the shape of a simple semicircle centered below the real axis, as was
the case at open circuit in the present system, and at open and closed circuit in the Rh/YSZ sys-
tem.
The good agreement between theoretical model and experiment that was observed for the
Rh catalyst electrode interfaced with YSZ does not exist in the case of Rh/TiO2/YSZ. At open cir-
cuit theory and experiment coincide, but at closed circuit theory is unable to describe the real
process. This implies that the system becomes more complex when a potential is applied. The
mixed ionic-electronic conductivity of TiO2 which could be modified by current flow/applied
potential leading to changes in electrode mechanism would appear plausible as an explanation.
Another explanation would be the spread of the three-phase boundary across the electrolyte/gas
interface (EG) that had already been mentioned earlier. According to literature data, if a solid
electrolyte possesses both ionic and electronic conductivity, the electrochemical process can take
place, not only at the metal/electrolyte boundary but also at the electrolyte/gas interface. A third
explanation for appearance of the second, potential-dependent semicircle is related to the backsp-
A B
FIGURE 6.13. Impedance spectra of the Rh electrode interfaced with TiO2/YSZ at T = 600 °C, Po2 =0.5 kPa at different positive (A) and negative (B) catalyst potentials.
0
5
10
15
0 5 10 15 20 25Z', kOhm/cm2
Z",
kO
hm/c
m2
0.05V0.1V0.15V0.2V
0
10
20
0 10 20 30Z ', kOhm/cm2
Z",
kO
hm/c
m2
OCV-0.025V-0.05V
-0.1V-0.15V
Conclusions
143
illover of ionic oxygen species. Such a behavior had already been observed in the Pd/YSZ system
(see section 6.1.2) at high positive UWR [3]. The concentration of backspillover oxygen at the Rh
surface interfaced with TiO2/YSZ is much higher than its concentration at Rh/YSZ. This explana-
tion is consistent, too, with the observation that electrochemical promotion of ethylene oxidation
is more efficient in the Rh/TiO2/YSZ system than in the Rh/YSZ system (see later in Chapter 8).
The effect of polarization on the Rh/TiO2/YSZ system will merit further detailed examination.
6.4 Conclusions
In the present chapter an impedance model of the Rh/oxygen electrode in contact with solid
electrolytes has been designed. The model is based on steady-state polarization data that had been
discussed in the preceding chapter (Chapter 5).
1. The impedance model set up for the oxygen exchange processes at Rh electrodes inter-
faced with YSZ and TiO2/YSZ was confronted with experimental results. For this purpose, elec-
trochemical impedance spectra were recorded at T = 450 - 600 °C in Po2 = 0.5 kPa at open circuit
and under polarization. Experimental results for the equilibrium process O2-/O2 at Rh/YSZ and
Rh/TiO2/YSZ are in good accord with theoretical impedance representations of the reaction
mechanism.
2. At the equilibrium potential, two processes take place: oxygen evolution and oxygen
reduction. In the cathodic process, dissociative adsorption at the gas-exposed metal surface, inter-
facial diffusion of atomic oxygen, and a two-electron transfer step are considered. The rate-limit-
ing step is interfacial diffusion of atomic oxygen from the metal/gas (MG) interface to the
electrochemically reactive sites. In the anodic process, the first stage is a two-electron transfer
step, which is followed by oxygen recombination and desorption to the gas phase. The rate-deter-
mining step is charge transfer itself.
3. From both the impedance and the steady-state polarization results, it is clear that the
exchange current densities are much lower at Rh/TiO2/YSZ than at Rh/YSZ, which implies
higher polarizability of the former system. In general, the behavior of the two systems is quite
similar, and at the equilibrium potential and/or in the low-polarization region, they can be
described by the same reaction mechanism.
Chapter 6 Electrochemical characterization of Rh catalysts: Impedance measurements
144
4. The equivalent circuit proposed is also applicable to the processes of oxygen evolution
and oxygen reduction in the Rh/YSZ system under polarization. Under anodic polarization the
reaction mechanism may in addition to the charge-transfer step include migration of oxygen ions
and formation of an “effective double layer” at the gas-exposed metal surface. This is manifest
from high values of capacitance (>100 µF/cm2), which increase with increasing positive UWR.
Under polarization, the impedance of the Rh/TiO2/YSZ electrode becomes more complex than
that of Rh/YSZ, and requires further investigations. The conclusions drawn from the impedance
analysis under positive polarization are well supported by those obtained by Vayenas and co-
workers [3].
6.5 References
1. A. J. Bard and L. R. Faulkner, Electrochemical methodes. Fundamentals and
applications John Wiley & Sons, Inc. (2001).
2. C. Deportes, M. Duclot, P. Fabry, J. Fouletier, A. Hammou, M. Kleitz, E. Siebert,
and J.-L. Souquet, Electrochimie des solides Press Universitair de Grenoble, Gre-
noble (1994).
3. A. D. Frantzis, S. Bebelis, and C. G. Vayenas, Solid State Ionics, 136-137 (2000)
863.
4. C. G. Vayenas, S. Bebelis, and S. Ladas, Nature, 323 (1990) 625.
5. J. Pritchard, Nature, 343 (1990) 592.
6. T. Badas, Thesis, University of Patras, Patras, (2003).
7. H. Gerischer, Z. Phys. Chem., 198 (1951) 216.
8. M. S.-R. a. J. H. Sluyters, in Electrochemical Chemistry, Vol. 4 A. J. Bard, ed.),
Marcel Dekker, New York, (1970), p. 68.
9. A. A. Kuznetsov and V. V. Netesa, Ukr. Chim. Journal, 65 (1999) 126
10. A. A. Kuznetsov, Elektrokhimiya, 29 (1993) 23
11. B. M. Grafov and E. A. Ukshe, Electrochemical AC circuits Nauka, Moscow
(1973).
12. B. M. Grafov and E. A. Ukshe, The kinetics of complex electrochemical reactions
Nauka, Moscow (1981).
13. A. A. Kuznetsov, Zashch. Met, 25 (1989) 585.
References
145
14. L. S. Kanevskiy, M. B. Avdolyan, and T. L. Kulova, Elektrokhimiya, 31 (1995)
383.
15. Y. M. Povorov and I. V. Vorob'eva, Elektrokhimiya, 18 (1982) 1693.
16. Y. M. Povorov, L. A. Beketaeva, and I. V. Vorob'eva, Elektrokhimiya, 19 (1983)
586.
17. V. N. Chebotin and M. V. Perfilev, Electrochemistry of solid electrolytes Khimiia
Publ. House, Moscou (1978).
18. C. G. Vayenas, S. Bebelis, C. Pliangos, S. Brosda, and D. Tsiplakides, Electro-
chemical activation of catalysis. Promotion, Electrochemical promotion, and
metal-support interaction. Kluwer Academic/Plenum Publishers, New York
(2001).

147
CHAPTER 7 Promotion of Rh catalysts: Open-
circuit ethylene oxidation
Ethylene oxidation on Rh catalysts exhibits a sudden transition from a
region of high to a region of low reaction rates as the oxygen partial
pressure increases above a certain critical value. This sudden transition is
accompanied by the formation of a rhodium surface oxide that is responsi-
ble for deactivation of the catalyst. A model explaining this macroscopic
deactivation of Rh catalysts was proposed and illustrated with results
obtained at Rh(40 nm)/YSZ and Rh(40 nm)/TiO2/YSZ catalysts. The Rh/
YSZ catalysts have a finite catalytic activity towards ethylene oxidation,
only in reducing feed compositions, while on Rh/TiO2/YSZ catalysts high
reaction rates of C2H4 oxidation can be maintained over a wide range of
oxygen partial pressures. Deactivated Rh/TiO2/YSZ catalysts are readily
reactivated by changing the gas composition from oxidizing to reducing,
while deactivated Rh/YSZ catalysts remain inactive under the same condi-
tions. The greater ease of modification of the catalytic activity observed for
Rh on an interlayer of TiO2 correlates with a greater ease of reduction of
this Rh surface oxide to metallic rhodium. The phenomenon may be inter-
Chapter 7 Promotion of Rh catalysts: Open-circuit ethylene oxidation
148
preted, either by strong electronic-type metal-support interactions or by
a self-driven wireless electrochemical promotion mechanism.
7.1 Introduction
The oxidation of ethylene to CO2 on rhodium-based catalysts has been extensively investi-
gated in the instance of Rh dispersed on different supports as well as of polycrystalline Rh films
interfaced with ZrO2 (8 mol% Y2O3) solid electrolyte [1-4]. It was demonstrated that the catalytic
performance of the rhodium catalysts depends on their oxidation state [3-6], rhodium metal being
much more active than rhodium oxide. Detailed investigations of the catalytic activity of Rh in its
different oxidation states were performed in the group of electrochemical engineering at EPFL, by
I. Bolzonella, in the instance of propylene combustion under open-circuit and electrochemical
promotion conditions [7]. It was demonstrated that this reaction strongly depends on the oxidation
state of Rh, and it was possible to distinguish three domains of catalyst operation in terms of the
reaction rates, r, as functions of oxygen partial pressures, P. The domain of low reaction rates cor-
responds to catalyst surfaces in the oxide form. The second domain where the catalyst surface is
between its oxidized and reduced state was called a transition domain. The third domain begins
where the abrupt increase in reaction rate occurs. In this domain the rhodium catalyst surface is
completely reduced. On the basis of these observations, a reaction model was proposed [7], and
this model is described in detail in Chapter 2, section 2.3 of the present thesis. This model nicely
explains the mechanism of propylene or ethylene oxidation on Rh catalysts, and it also explains
the reasons for the dramatic decrease or increase in reaction rate. However, it does not define a
mechanism for surface deactivation nor any parameters that would be responsible for it. Moreo-
ver, the model is unable to explain the hysteresis of reaction rates very often observed at the Rh
catalysts.
In this chapter, first a simple phenomenological model describing and qualitatively dis-
cussing the sudden transition of the Rh catalyst from high to low activity will be presented [8]. By
“phenomenological”, it is intended to say that the model does not account for details of the micro-
scopic processes occurring in the system, it merely describes the process globally and in a generic
manner. Despite this restriction, the model is able to establish a link between the sudden transition
from high to low reaction rates and the growth of a new surface structure. As an interesting conse-
quence, the predicted hysteresis in the r-P characteristics is discussed.
Theory
149
The model will then be illustrated and tested using experimental results for ethylene oxida-
tion on Rh/YSZ and Rh/TiO2/YSZ catalysts. It will be shown that the catalytic activity and stabil-
ity of Rh can be dramatically enhanced by interfacing it with a layer of TiO2 deposited on the
YSZ solid electrolyte used as support.
7.2 Theory
7.2.1 Generic model for a macroscopic deactivation of surface processes
During the oxidation of propylene [7] or ethylene [3, 4], rhodium catalysts exhibit the fol-
lowing behavior: the reaction rate r smoothly increases as a function of the external control
parameter P until this reaches a critical value Pcrit, at which point the reaction rate suddenly drops
and goes toward zero with increasing P (Fig. 7.1). This drop marks the transition between ranges
of high and low reaction rates. Thus, such systems exhibit what may be considered a generalized
phase transition. In the oxidation of C2H4 on rhodium catalysts, the reaction rate r is the rate of
production of CO2, the external control parameter is the partial pressure of O2 in the feed gas
stream.
In parallel with the sudden drop in reaction rate r, the growth of a surface structure Σ(p) not
present prior to this transition is observed. The growth of this surface structure is responsible for
the abrupt decrease in reaction rate r with increasing oxygen partial pressure P. The mechanism of
formation of this structure is a microscopic one, whereas the deactivation effect is macroscopic.
Apart from the example of ethylene oxidation, a broad sample of systems are known which
exhibit surface processes resulting in a sudden transition from high to low reaction rates as a func-
tion of external parameters. Typical examples are certain electrolytic processes, several systems
in heterogeneous catalysis (oxidation of CO and C2H4 on Pt) [9], cases of electrochemical promo-
tion of catalysis [10], and metal passivation [11].
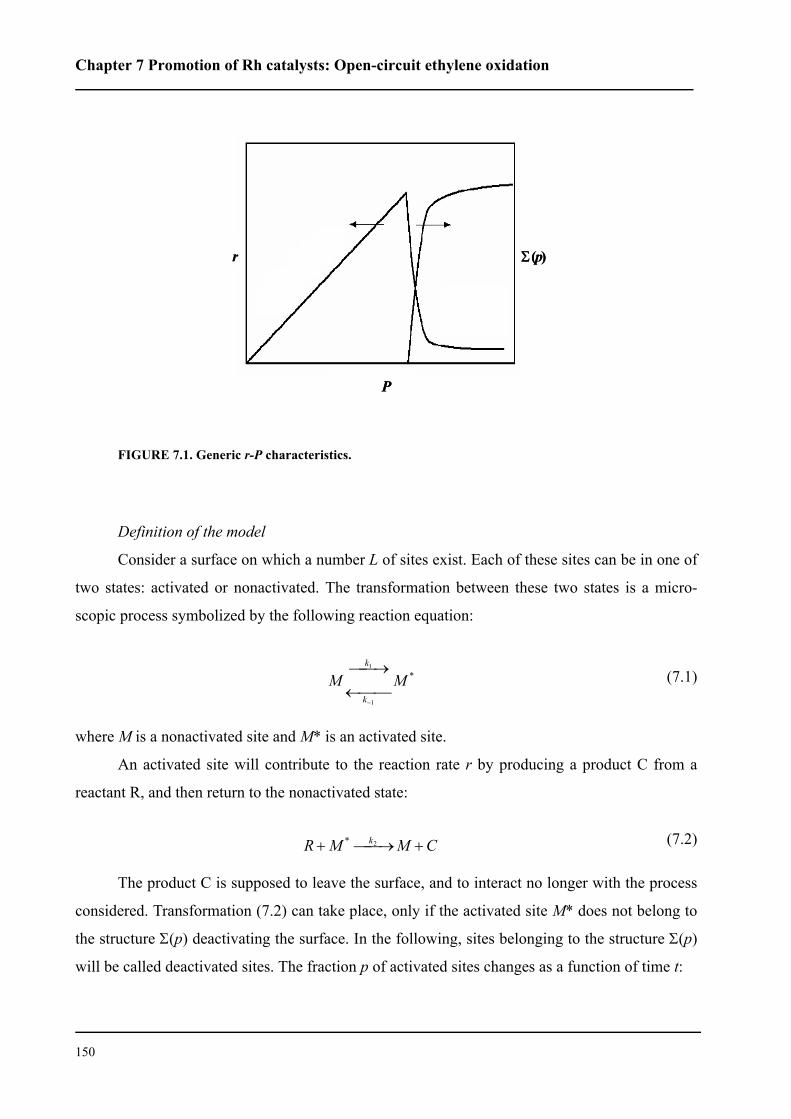
Chapter 7 Promotion of Rh catalysts: Open-circuit ethylene oxidation
150
FIGURE 7.1. Generic r-P characteristics.
Definition of the model
Consider a surface on which a number L of sites exist. Each of these sites can be in one of
two states: activated or nonactivated. The transformation between these two states is a micro-
scopic process symbolized by the following reaction equation:
(7.1)
where M is a nonactivated site and M* is an activated site.
An activated site will contribute to the reaction rate r by producing a product C from a
reactant R, and then return to the nonactivated state:
(7.2)
The product C is supposed to leave the surface, and to interact no longer with the process
considered. Transformation (7.2) can take place, only if the activated site M* does not belong to
the structure Σ(p) deactivating the surface. In the following, sites belonging to the structure Σ(p)
will be called deactivated sites. The fraction p of activated sites changes as a function of time t:
P
r Σ(p)
P
r Σ(p)
*
1
1
MMk
k
←→
−
CMMR k +→+ 2*
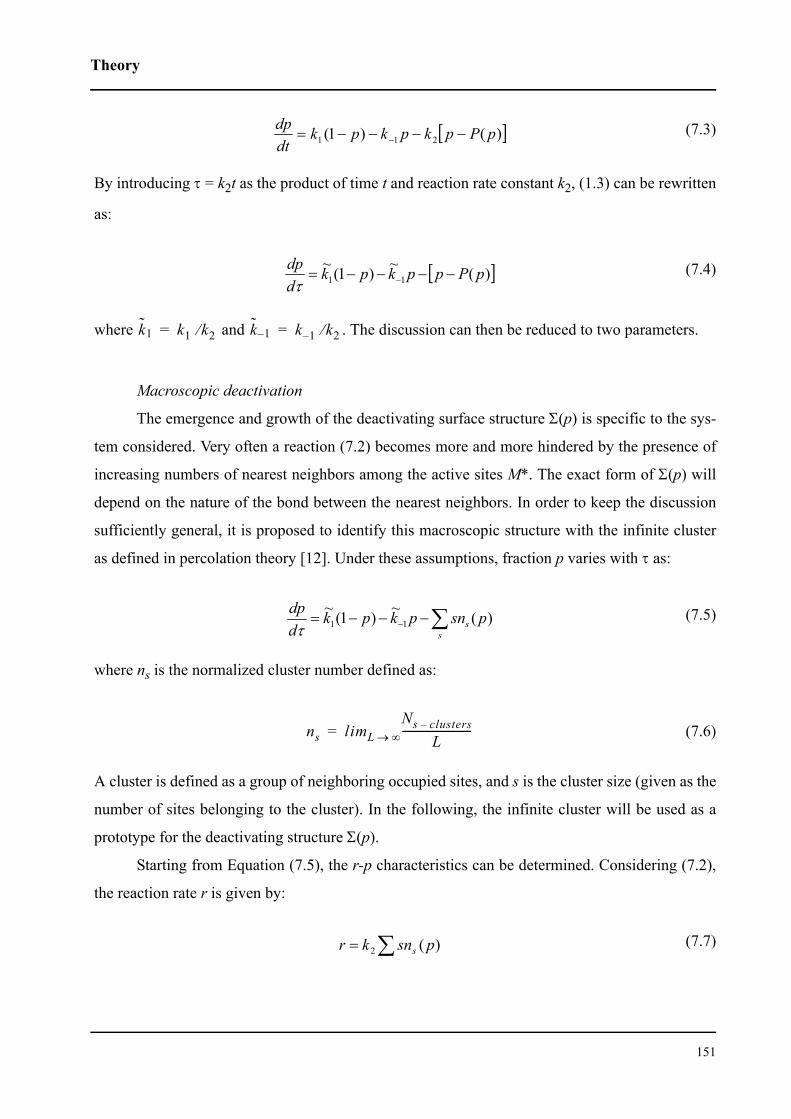
Theory
151
(7.3)
By introducing τ = k2t as the product of time t and reaction rate constant k2, (1.3) can be rewritten
as:
(7.4)
where and . The discussion can then be reduced to two parameters.
Macroscopic deactivation
The emergence and growth of the deactivating surface structure Σ(p) is specific to the sys-
tem considered. Very often a reaction (7.2) becomes more and more hindered by the presence of
increasing numbers of nearest neighbors among the active sites M*. The exact form of Σ(p) will
depend on the nature of the bond between the nearest neighbors. In order to keep the discussion
sufficiently general, it is proposed to identify this macroscopic structure with the infinite cluster
as defined in percolation theory [12]. Under these assumptions, fraction p varies with τ as:
(7.5)
where ns is the normalized cluster number defined as:
(7.6)
A cluster is defined as a group of neighboring occupied sites, and s is the cluster size (given as the
number of sites belonging to the cluster). In the following, the infinite cluster will be used as a
prototype for the deactivating structure Σ(p).
Starting from Equation (7.5), the r-p characteristics can be determined. Considering (7.2),
the reaction rate r is given by:
(7.7)
[ ])()1( 211 pPpkpkpkdtdp
−−−−= −
[ ])(~)1(~11 pPppkpk
ddp
−−−−= −τ
k̃1 k1 k2⁄= k̃ 1– k 1– k2⁄=
∑−−−= −s
s psnpkpkddp )(~)1(~
11τ
ns limL ∞→Ns clusters–
L--------------------------=
∑= )(2 psnkr s
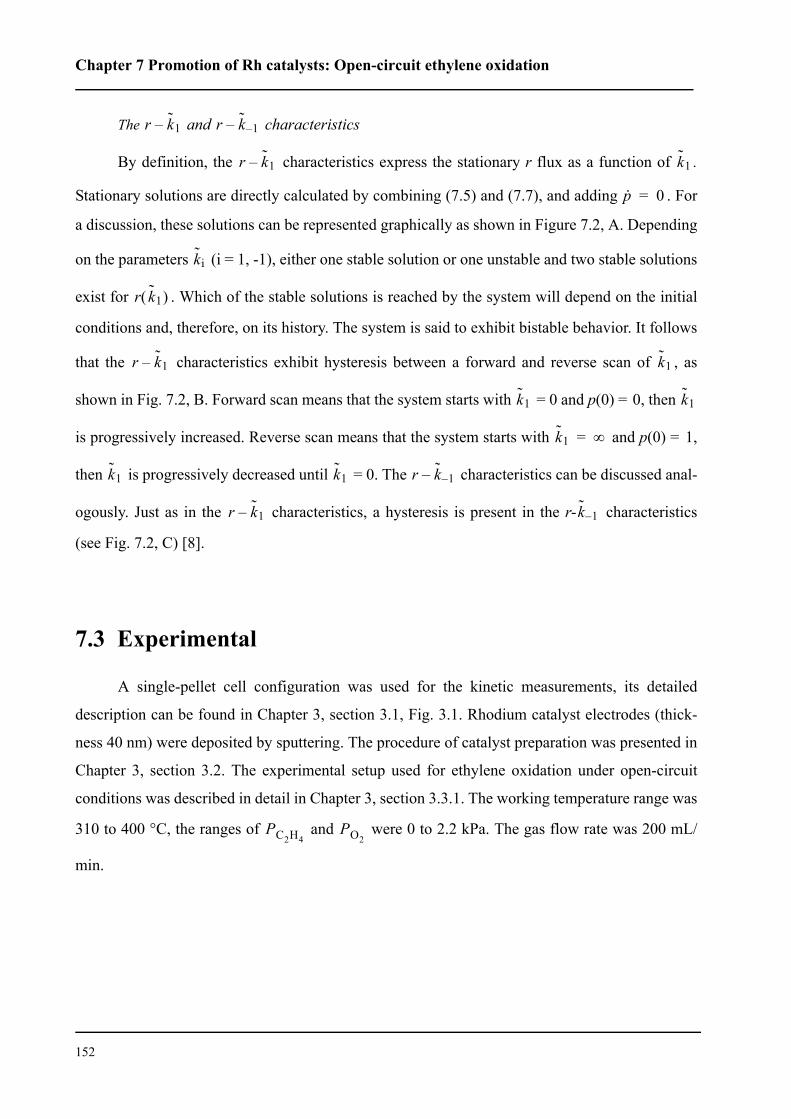
Chapter 7 Promotion of Rh catalysts: Open-circuit ethylene oxidation
152
The and characteristics
By definition, the characteristics express the stationary r flux as a function of .
Stationary solutions are directly calculated by combining (7.5) and (7.7), and adding . For
a discussion, these solutions can be represented graphically as shown in Figure 7.2, A. Depending
on the parameters (i = 1, -1), either one stable solution or one unstable and two stable solutions
exist for . Which of the stable solutions is reached by the system will depend on the initial
conditions and, therefore, on its history. The system is said to exhibit bistable behavior. It follows
that the characteristics exhibit hysteresis between a forward and reverse scan of , as
shown in Fig. 7.2, B. Forward scan means that the system starts with = 0 and p(0) = 0, then
is progressively increased. Reverse scan means that the system starts with and p(0) = 1,
then is progressively decreased until = 0. The characteristics can be discussed anal-
ogously. Just as in the characteristics, a hysteresis is present in the r- characteristics
(see Fig. 7.2, C) [8].
7.3 Experimental
A single-pellet cell configuration was used for the kinetic measurements, its detailed
description can be found in Chapter 3, section 3.1, Fig. 3.1. Rhodium catalyst electrodes (thick-
ness 40 nm) were deposited by sputtering. The procedure of catalyst preparation was presented in
Chapter 3, section 3.2. The experimental setup used for ethylene oxidation under open-circuit
conditions was described in detail in Chapter 3, section 3.3.1. The working temperature range was
310 to 400 °C, the ranges of and were 0 to 2.2 kPa. The gas flow rate was 200 mL/
min.
r k̃1– r k̃ 1––
r k̃1– k̃1
p· 0=
k̃i
r k̃1( )
r k̃1– k̃1
k̃1 k̃1
k̃1 ∞=
k̃1 k̃1 r k̃ 1––
r k̃1– k̃ 1–
PC2H4PO2
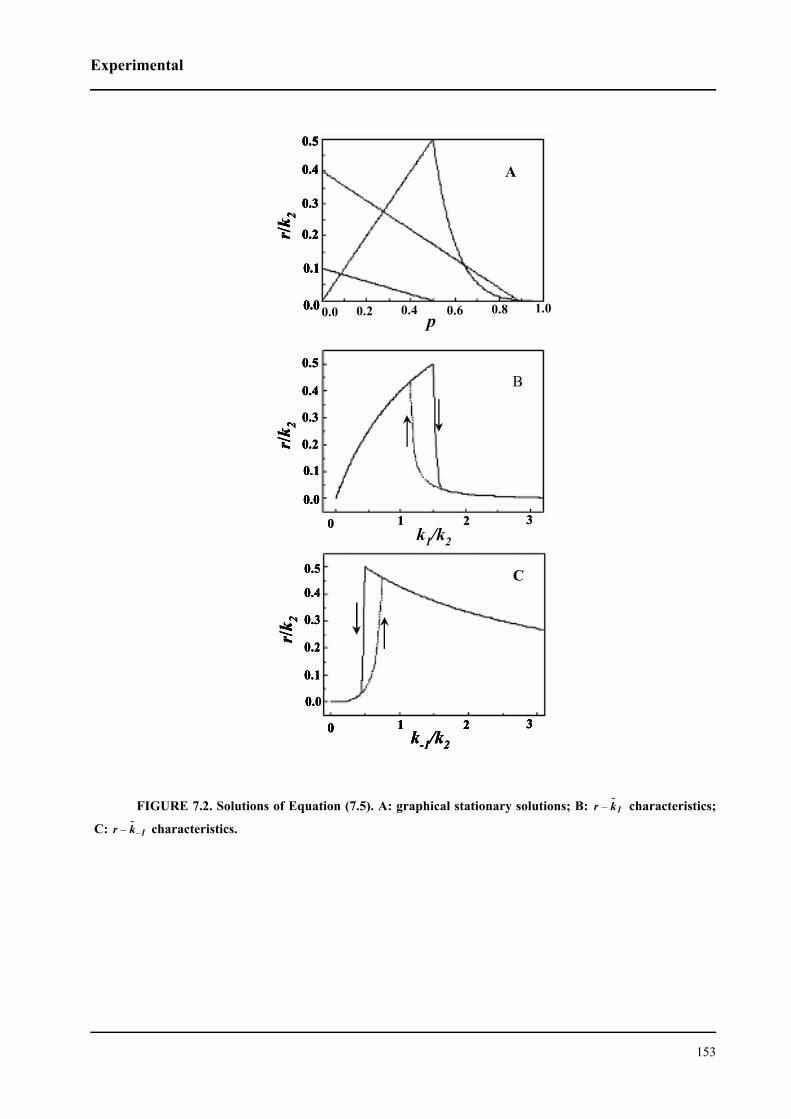
Experimental
153
FIGURE 7.2. Solutions of Equation (7.5). A: graphical stationary solutions; B: characteristics;
C: characteristics.
p
r/k 2
r/k 2
r/k 2
k1/k2
k-1/k2
A
B
C
0.00.0
0.1
0.2
0.4
0.5
0.3
0.0
0.1
0.2
0.4
0.5
0.3
0.0
0.1
0.2
0.4
0.5
0.3
0.4 0.8 1.00.60.2
0 1 2 3
0 1 2 3
p
r/k 2
r/k 2
r/k 2
k1/k2
k-1/k2
A
B
C
0.00.0
0.1
0.2
0.4
0.5
0.3
0.0
0.1
0.2
0.4
0.5
0.3
0.0
0.1
0.2
0.4
0.5
0.3
0.4 0.8 1.00.60.2
0 1 2 3
0 1 2 3
p
r/k 2
r/k 2
r/k 2
k1/k2
k-1/k2
A
B
C
0.00.0
0.1
0.2
0.4
0.5
0.3
0.0
0.1
0.2
0.4
0.5
0.3
0.0
0.1
0.2
0.4
0.5
0.3
0.0
0.1
0.2
0.4
0.5
0.3
0.4 0.8 1.00.60.2
0 1 2 30 1 2 3
0 1 2 30 1 2 3
r k̃1–
r k̃ 1––
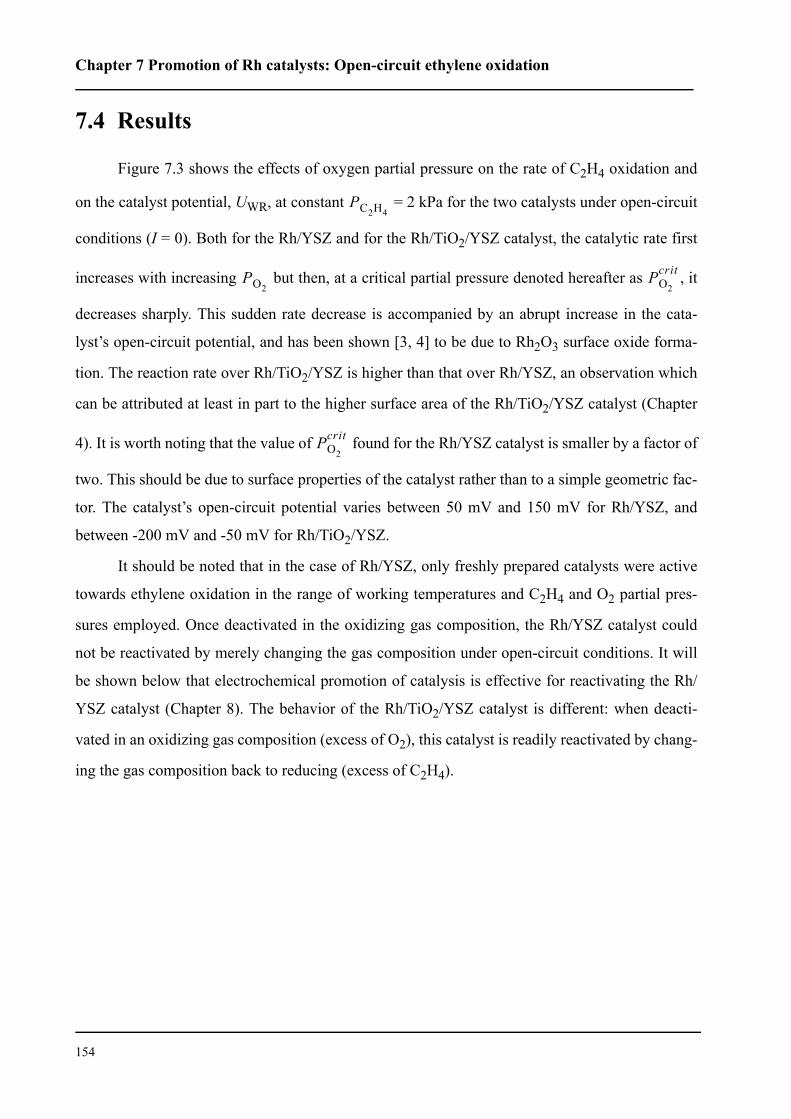
Chapter 7 Promotion of Rh catalysts: Open-circuit ethylene oxidation
154
7.4 Results
Figure 7.3 shows the effects of oxygen partial pressure on the rate of C2H4 oxidation and
on the catalyst potential, UWR, at constant = 2 kPa for the two catalysts under open-circuit
conditions (I = 0). Both for the Rh/YSZ and for the Rh/TiO2/YSZ catalyst, the catalytic rate first
increases with increasing but then, at a critical partial pressure denoted hereafter as , it
decreases sharply. This sudden rate decrease is accompanied by an abrupt increase in the cata-
lyst’s open-circuit potential, and has been shown [3, 4] to be due to Rh2O3 surface oxide forma-
tion. The reaction rate over Rh/TiO2/YSZ is higher than that over Rh/YSZ, an observation which
can be attributed at least in part to the higher surface area of the Rh/TiO2/YSZ catalyst (Chapter
4). It is worth noting that the value of found for the Rh/YSZ catalyst is smaller by a factor of
two. This should be due to surface properties of the catalyst rather than to a simple geometric fac-
tor. The catalyst’s open-circuit potential varies between 50 mV and 150 mV for Rh/YSZ, and
between -200 mV and -50 mV for Rh/TiO2/YSZ.
It should be noted that in the case of Rh/YSZ, only freshly prepared catalysts were active
towards ethylene oxidation in the range of working temperatures and C2H4 and O2 partial pres-
sures employed. Once deactivated in the oxidizing gas composition, the Rh/YSZ catalyst could
not be reactivated by merely changing the gas composition under open-circuit conditions. It will
be shown below that electrochemical promotion of catalysis is effective for reactivating the Rh/
YSZ catalyst (Chapter 8). The behavior of the Rh/TiO2/YSZ catalyst is different: when deacti-
vated in an oxidizing gas composition (excess of O2), this catalyst is readily reactivated by chang-
ing the gas composition back to reducing (excess of C2H4).
PC2H4
PO2PO2
crit
PO2
crit
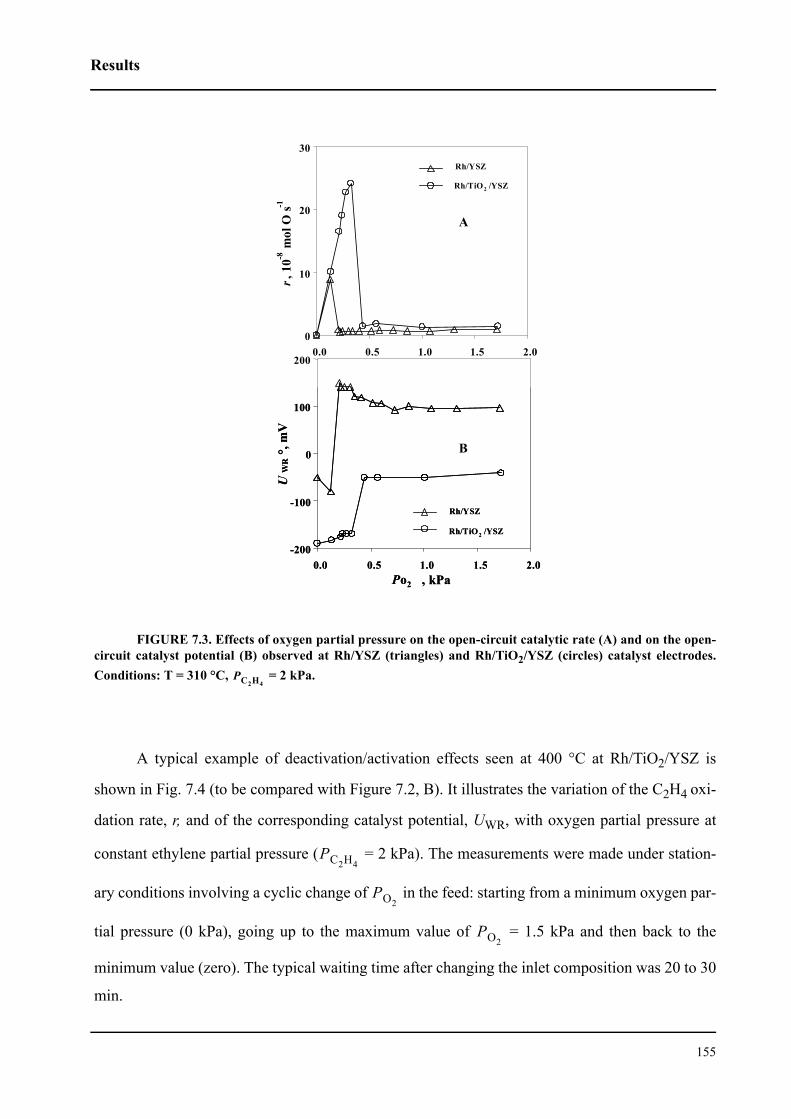
Results
155
FIGURE 7.3. Effects of oxygen partial pressure on the open-circuit catalytic rate (A) and on the open-circuit catalyst potential (B) observed at Rh/YSZ (triangles) and Rh/TiO2/YSZ (circles) catalyst electrodes.Conditions: T = 310 °C, = 2 kPa.
A typical example of deactivation/activation effects seen at 400 °C at Rh/TiO2/YSZ is
shown in Fig. 7.4 (to be compared with Figure 7.2, B). It illustrates the variation of the C2H4 oxi-
dation rate, r, and of the corresponding catalyst potential, UWR, with oxygen partial pressure at
constant ethylene partial pressure ( = 2 kPa). The measurements were made under station-
ary conditions involving a cyclic change of in the feed: starting from a minimum oxygen par-
tial pressure (0 kPa), going up to the maximum value of = 1.5 kPa and then back to the
minimum value (zero). The typical waiting time after changing the inlet composition was 20 to 30
min.
0
10
20
30
0.0 0.5 1.0 1.5 2.0
r , 1
0-8m
ol O
s-1
Rh/YSZ
Rh/TiO 2 /YSZ
-200
-100
0
100
200
0.0 0.5 1.0 1.5 2.0Po2 , kPa
UW
R °
, mV
Rh/TiO 2 /YSZ
Rh/YSZ
0
10
20
30
0.0 0.5 1.0 1.5 2.0
r , 1
0-8m
ol O
s-1
Rh/YSZ
Rh/TiO 2 /YSZ
-200
-100
0
100
200
0.0 0.5 1.0 1.5 2.0Po2 , kPa
UW
R °
, mV
Rh/TiO 2 /YSZ
Rh/YSZ
A
B
PC2H4
PC2H4
PO2
PO2
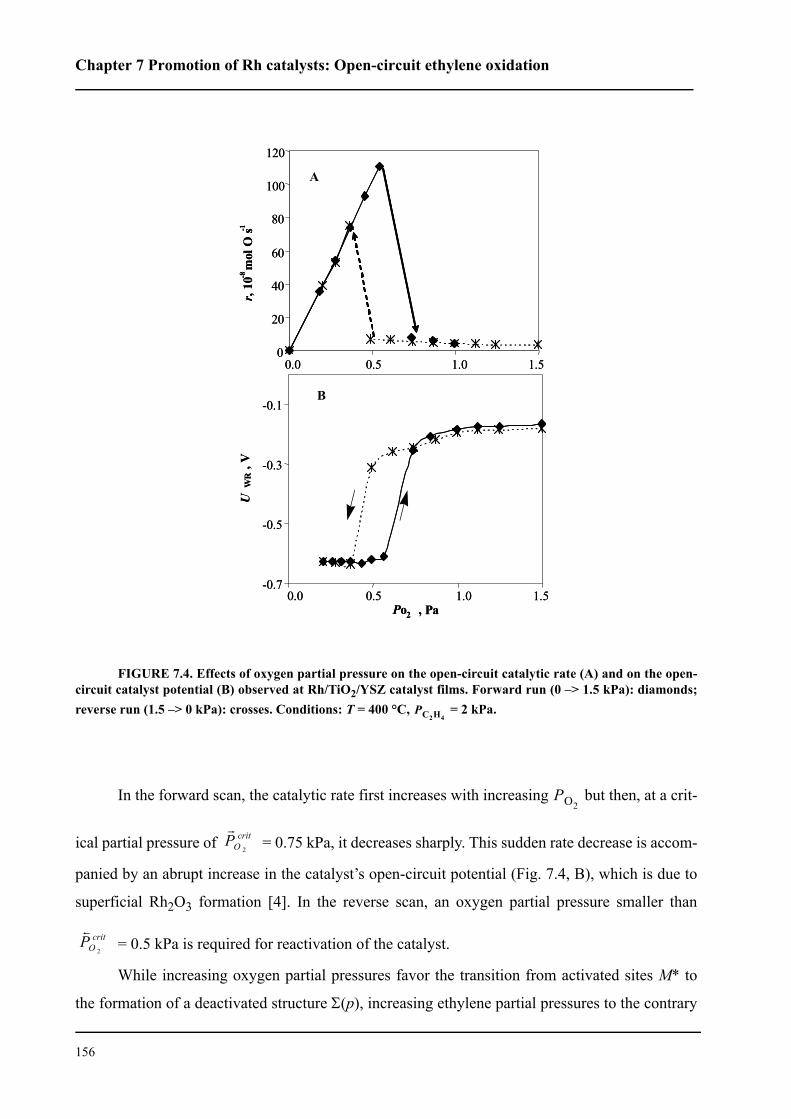
Chapter 7 Promotion of Rh catalysts: Open-circuit ethylene oxidation
156
FIGURE 7.4. Effects of oxygen partial pressure on the open-circuit catalytic rate (A) and on the open-circuit catalyst potential (B) observed at Rh/TiO2/YSZ catalyst films. Forward run (0 –> 1.5 kPa): diamonds;reverse run (1.5 –> 0 kPa): crosses. Conditions: T = 400 °C, = 2 kPa.
In the forward scan, the catalytic rate first increases with increasing but then, at a crit-
ical partial pressure of = 0.75 kPa, it decreases sharply. This sudden rate decrease is accom-
panied by an abrupt increase in the catalyst’s open-circuit potential (Fig. 7.4, B), which is due to
superficial Rh2O3 formation [4]. In the reverse scan, an oxygen partial pressure smaller than
= 0.5 kPa is required for reactivation of the catalyst.
While increasing oxygen partial pressures favor the transition from activated sites M* to
the formation of a deactivated structure Σ(p), increasing ethylene partial pressures to the contrary
0
20
40
60
80
100
120
r, 10
-8 m
ol O
s-1
0.50.0 1.0 1.5
-0.7
-0.5
-0.3
-0.1
Po2 , Pa
UW
R, V
0.50.0 1.51.0
0
20
40
60
80
100
120
r, 10
-8 m
ol O
s-1
0.50.0 1.0 1.5
-0.7
-0.5
-0.3
-0.1
Po2 , Pa
UW
R, V
0.50.0 1.51.0
A
B
PC2H4
PO2
critOP
2
r
critOP
2
s
Results
157
disfavor this transition. The reaction rates and the catalyst’s potential are shown as functions of
the ethylene partial pressure at constant = 0.2 kPa and 310 °C for the Rh/YSZ and Rh/TiO2/
YSZ catalysts in Fig. 7.5. The open-circuit rate remains very low on Rh/YSZ over the entire range
of investigated. The corresponding catalyst potentials also remain positive, and practically
constant. Both observations show that the Rh surface continues to be in the superficial Rh2O3
state [3, 4]. This is consistent with the observation that higher partial pressures of ethylene are
required for reducing this rhodium surface oxide.
FIGURE 7.5. Effects of ethylene partial pressure on the open-circuit catalytic rate (A) and on the open-circuit catalyst potential (B) observed at Rh/YSZ (triangles) and Rh/TiO2/YSZ (circles) catalyst electrodes.Conditions: T = 310 °C, = 0.2 kPa.
PO2
PO2
0
10
20
0.0 0.5 1.0 1.5 2.0 2.5
r , 1
0-8m
ol O
s-1
Rh/YSZ
Rh/TiO2/YSZ
-250
-150
-50
50
150
0.0 0.5 1.0 1.5 2.0 2.5PC2H4
, kPa
UW
R°,
mV
Rh/YSZ
Rh/TiO2/YSZ
A
B
PO2
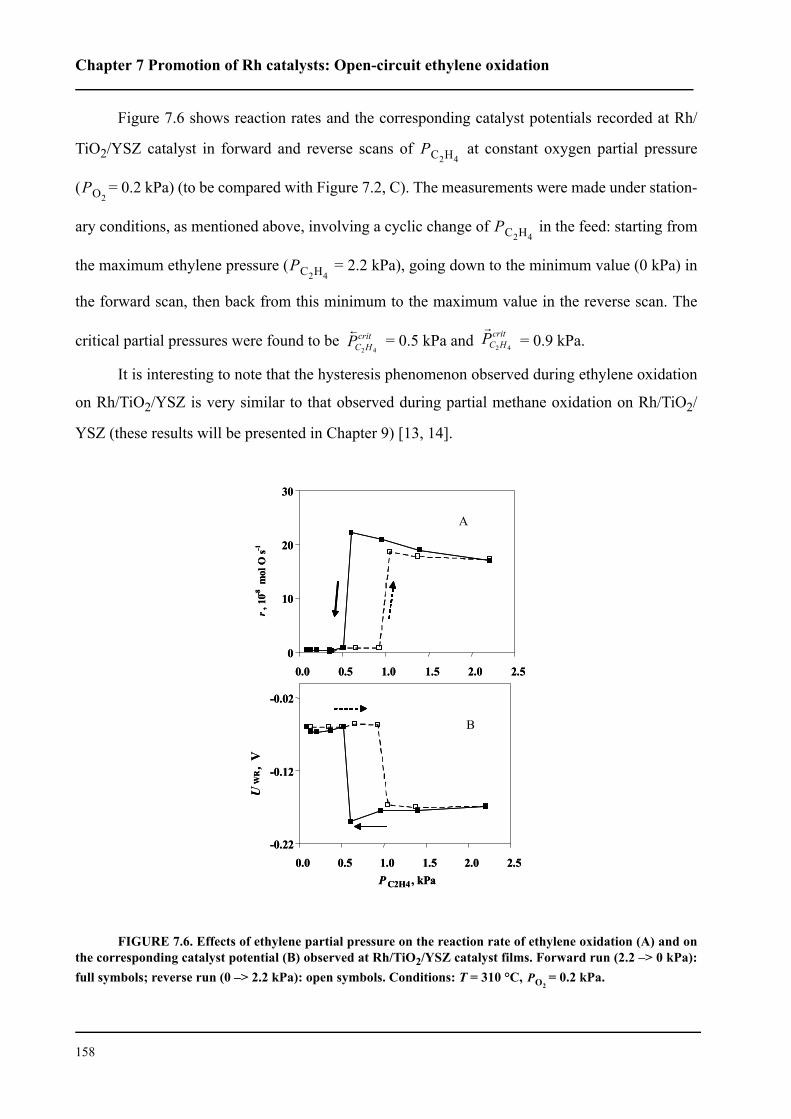
Chapter 7 Promotion of Rh catalysts: Open-circuit ethylene oxidation
158
Figure 7.6 shows reaction rates and the corresponding catalyst potentials recorded at Rh/
TiO2/YSZ catalyst in forward and reverse scans of at constant oxygen partial pressure
( = 0.2 kPa) (to be compared with Figure 7.2, C). The measurements were made under station-
ary conditions, as mentioned above, involving a cyclic change of in the feed: starting from
the maximum ethylene pressure ( = 2.2 kPa), going down to the minimum value (0 kPa) in
the forward scan, then back from this minimum to the maximum value in the reverse scan. The
critical partial pressures were found to be = 0.5 kPa and = 0.9 kPa.
It is interesting to note that the hysteresis phenomenon observed during ethylene oxidation
on Rh/TiO2/YSZ is very similar to that observed during partial methane oxidation on Rh/TiO2/
YSZ (these results will be presented in Chapter 9) [13, 14].
FIGURE 7.6. Effects of ethylene partial pressure on the reaction rate of ethylene oxidation (A) and onthe corresponding catalyst potential (B) observed at Rh/TiO2/YSZ catalyst films. Forward run (2.2 –> 0 kPa):full symbols; reverse run (0 –> 2.2 kPa): open symbols. Conditions: T = 310 °C, = 0.2 kPa.
PC2H4
PO2
PC2H4
PC2H4
critHCP
42
s critHCP
42
r
0
10
20
30
0.0 0.5 1.0 1.5 2.0 2.5
r , 1
0-8 m
ol O
s-1
-0.22
-0.12
-0.02
0.0 0.5 1.0 1.5 2.0 2.5P C2H4, kPa
UW
R,
V
0
10
20
30
0.0 0.5 1.0 1.5 2.0 2.5
r , 1
0-8 m
ol O
s-1
-0.22
-0.12
-0.02
0.0 0.5 1.0 1.5 2.0 2.5P C2H4, kPa
UW
R,
V
A
B
PO2
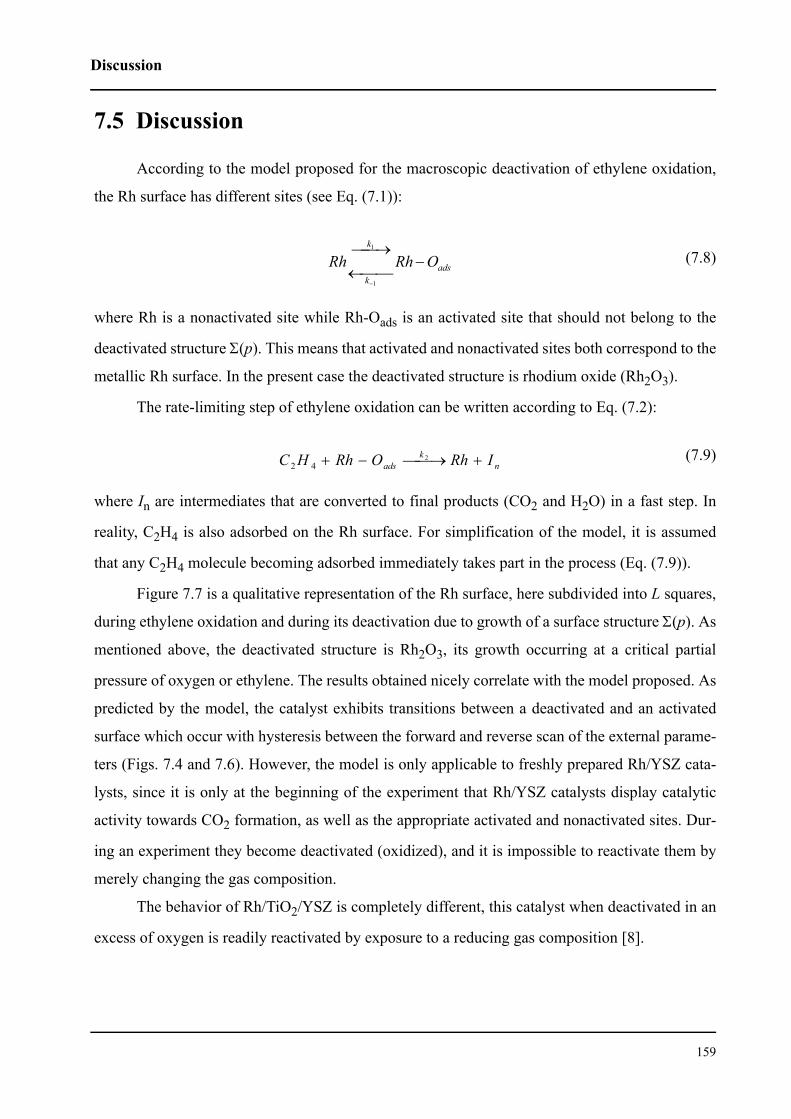
Discussion
159
7.5 Discussion
According to the model proposed for the macroscopic deactivation of ethylene oxidation,
the Rh surface has different sites (see Eq. (7.1)):
(7.8)
where Rh is a nonactivated site while Rh-Oads is an activated site that should not belong to the
deactivated structure Σ(p). This means that activated and nonactivated sites both correspond to the
metallic Rh surface. In the present case the deactivated structure is rhodium oxide (Rh2O3).
The rate-limiting step of ethylene oxidation can be written according to Eq. (7.2):
(7.9)
where In are intermediates that are converted to final products (CO2 and H2O) in a fast step. In
reality, C2H4 is also adsorbed on the Rh surface. For simplification of the model, it is assumed
that any C2H4 molecule becoming adsorbed immediately takes part in the process (Eq. (7.9)).
Figure 7.7 is a qualitative representation of the Rh surface, here subdivided into L squares,
during ethylene oxidation and during its deactivation due to growth of a surface structure Σ(p). As
mentioned above, the deactivated structure is Rh2O3, its growth occurring at a critical partial
pressure of oxygen or ethylene. The results obtained nicely correlate with the model proposed. As
predicted by the model, the catalyst exhibits transitions between a deactivated and an activated
surface which occur with hysteresis between the forward and reverse scan of the external parame-
ters (Figs. 7.4 and 7.6). However, the model is only applicable to freshly prepared Rh/YSZ cata-
lysts, since it is only at the beginning of the experiment that Rh/YSZ catalysts display catalytic
activity towards CO2 formation, as well as the appropriate activated and nonactivated sites. Dur-
ing an experiment they become deactivated (oxidized), and it is impossible to reactivate them by
merely changing the gas composition.
The behavior of Rh/TiO2/YSZ is completely different, this catalyst when deactivated in an
excess of oxygen is readily reactivated by exposure to a reducing gas composition [8].
adsk
k
ORhRh −←→
−1
1
nk
ads IRhORhHC +→−+ 242
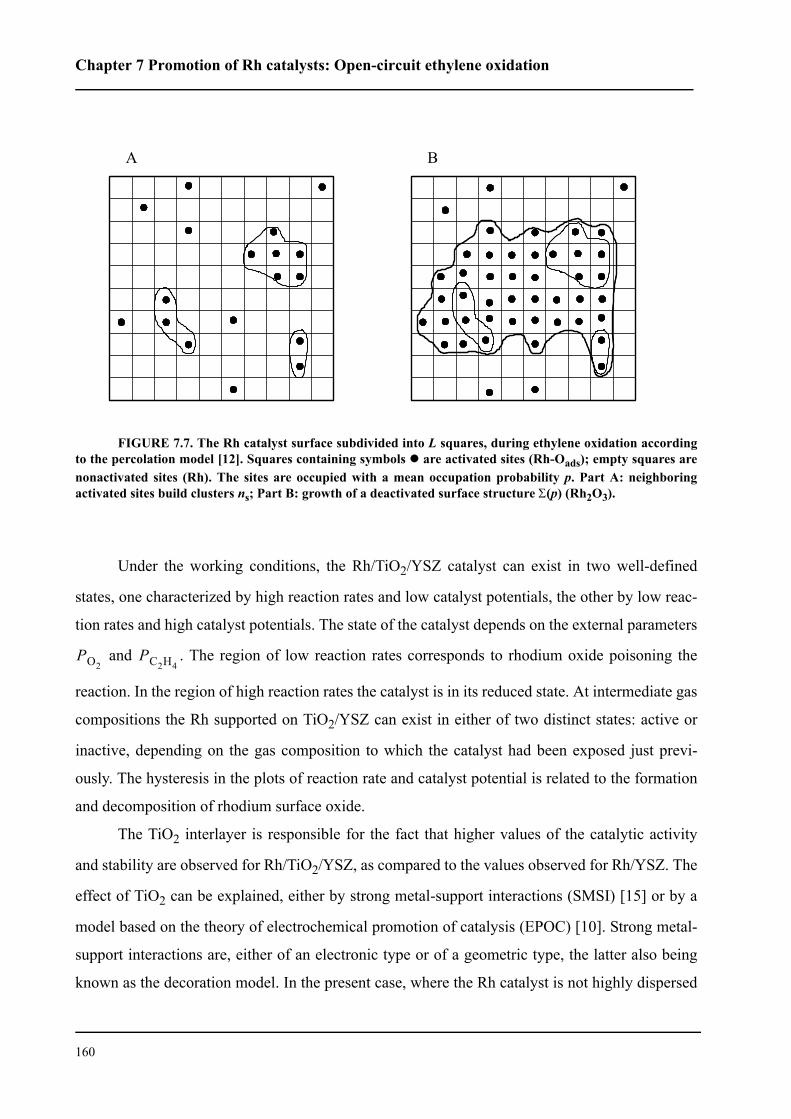
Chapter 7 Promotion of Rh catalysts: Open-circuit ethylene oxidation
160
Under the working conditions, the Rh/TiO2/YSZ catalyst can exist in two well-defined
states, one characterized by high reaction rates and low catalyst potentials, the other by low reac-
tion rates and high catalyst potentials. The state of the catalyst depends on the external parameters
and . The region of low reaction rates corresponds to rhodium oxide poisoning the
reaction. In the region of high reaction rates the catalyst is in its reduced state. At intermediate gas
compositions the Rh supported on TiO2/YSZ can exist in either of two distinct states: active or
inactive, depending on the gas composition to which the catalyst had been exposed just previ-
ously. The hysteresis in the plots of reaction rate and catalyst potential is related to the formation
and decomposition of rhodium surface oxide.
The TiO2 interlayer is responsible for the fact that higher values of the catalytic activity
and stability are observed for Rh/TiO2/YSZ, as compared to the values observed for Rh/YSZ. The
effect of TiO2 can be explained, either by strong metal-support interactions (SMSI) [15] or by a
model based on the theory of electrochemical promotion of catalysis (EPOC) [10]. Strong metal-
support interactions are, either of an electronic type or of a geometric type, the latter also being
known as the decoration model. In the present case, where the Rh catalyst is not highly dispersed
A B
FIGURE 7.7. The Rh catalyst surface subdivided into L squares, during ethylene oxidation accordingto the percolation model [12]. Squares containing symbols are activated sites (Rh-Oads); empty squares arenonactivated sites (Rh). The sites are occupied with a mean occupation probability p. Part A: neighboringactivated sites build clusters ns; Part B: growth of a deactivated surface structure Σ(p) (Rh2O3).
PO2PC2H4
Discussion
161
but, rather, exists as a film deposited on titania, an electronic effect could be effective only in the
presence of long-range interactions. Possible modifications in electronic structure of a metal by
long-range effects are changes in d-band population, changes in the density of states at the Fermi
level, and a shift of the Fermi level due to the different work functions of metal and support. In the
case of Rh, the first two effects are less important because of the high density of unoccupied d
states above the Fermi level, whereas depending on the nature of the support, Fermi level shifts
may be very important. In fact, the metal-semiconductor boundary-layer theory states that, at
thermodynamic equilibrium, the Fermi energy levels of electrons in the two solids in contact are
equal. Upon contact of two solids having different Fermi levels (work functions), charge must be
transported from one material to the other until the Fermi levels at the interface are equilibrated.
Obviously, the solid having the lower work function gets positively charged, the other gets nega-
tively charged. The work function of stoichiometric, unreduced TiO2 is 5.5 eV, that of Rh is 5.1
eV, hence upon contact, negative charge is transported from the Rh catalyst to the TiO2 support.
The resulting increase in the catalyst’s work function leads to a lowering of the catalyst-oxygen
bond strength and, consequently, to a decrease in the stability of rhodium oxide. Modifications of
the catalytic activity of Rh on TiO2 supports had already been reported for highly dispersed Rh
catalysts [16, 17]. In the present work, similar results have now been obtained for a Rh film cata-
lyst deposited on TiO2. This demonstrates that electronic-type SMSI may be long-range interac-
tions affecting the entire metal catalyst.
An alternative explanation for the effect of the TiO2 support on the stability of rhodium
oxide against reduction to metallic Rh is based on the theory of electrochemical promotion of
catalysis (EPOC). In the model of electrochemical promotion, this phenomenon is regarded as
catalysis in the presence of an electrically controlled double layer formed by an ion backspillover
mechanism at the gas-exposed catalyst surface. As in the case of electronic-type SMSI discussed
above, the thermodynamic driving force for electron transport is the difference in Fermi levels of
the two solids in contact. Since TiO2 is a semiconductor exhibiting mixed (electron and O2- ion)
conduction, the positive charge built up on Rh by the electronic effect will induce migration of
O2- ions to the catalyst/support interface, the driving force being the difference in electrochemical
potentials of oxide ions in the two oppositely charged solids. The O2- ions accompanied by their
mirror charges in the metal may then spread out across the entire gas-exposed catalyst surface by
the backspillover mechanism, thus forming an overall neutral electric double layer. This popula-
Chapter 7 Promotion of Rh catalysts: Open-circuit ethylene oxidation
162
tion of the surface with dipoles increases the surface potential, the concomitant increase in work
function affecting the binding strength of chemisorbed species. More precisely, the adsorption
energy of electron donors will increase while that of electron acceptors (eg, atomic O) and also
the stability of the Rh oxide against reduction are lowered.
The close analogy between electrochemical promotion of catalysis (EPOC) and strong
metal-support interactions (SMSI) is obvious, and these two phenomena may in fact be consid-
ered as functionally identical, and only operationally different [1].
7.6 Conclusions
A phenomenological model was presented that is able to explain the macroscopic deactiva-
tion of Rh catalysts during ethylene oxidation. In this model, processes controlled by an external
parameter P, either or , are considered. Macroscopic deactivation occurring at a certain
critical value of P is explained in terms of growth of a structure inhibiting the surface reaction. In
C2H4 oxidation at Rh, this structure corresponds to a Rh surface oxide (Rh2O3); the growth of this
structure is nicely confirmed by the observed values of catalyst potential.
Catalysts Rh/TiO2/YSZ are much more stable against oxidation, and catalytically more
active than Rh/YSZ. This promotion of the C2H4 oxidation process on Rh/TiO2/YSZ, which is
much more pronounced than on Rh/YSZ, may be interpreted, either by strong electronic-type
metal-support interactions or by a self-driven wireless electrochemical promotion mechanism. In
both cases, the ultimate cause of promotion resides in different work functions of catalyst and
support. Equilibration of the Fermi levels causes weakening of the Rh-O chemisorptive bond, and
makes reduction of the oxidized surface sites easier.
7.7 References
1. J. Nicole, D. Tsiplakides, C. Pliangos, X. E. Verykios, C. Comninellis, and C. G.
Vayenas, J. Catal., 204 (2001) 23.
2. X. E. Verykios, in Catalysis and Electrocatalysis at nanoparticle surface A.
Wieckowski, E. R. Savinova, and C. G. Vayenas, eds., Marcel Dekker, Inc., New
York - Basel, (2003), p. 745
PO2PC2H4
References
163
3. C. Pliangos, I. V. Yentekakis, V. G. Papadakis, C. G. Vayenas, and X. E. Verykios,
Applied Catalysis B: Environmental, 14 (1997) 161.
4. C. Pliangos, I. V. Yentekakis, X. E. Verykios, and C. G. Vayenas, J. Catal., 154
(1995) 124.
5. S. H. Oh and J. E. Carpenter, J. Catal., 80 (1983) 472.
6. G. L. Kellog, Surface Sci., 171 (1986) 359.
7. I. Bolzonella, Electrochemical promotion of rhodium catalyst. Application to nitro-
gen monoxide reduction. Thesis No 2743, EPFL, Lausanne, (2003).
8. R. Wüthrich, E. A. Baranova, H. Bleuler, and C. Comninellis, Electrochem. Com-
mun., 6 (2004) 1199.
9. M. M. Slin'ko and N. I. Jaeger, in Studies in Surface Science and Catalysis, Vol. 86
B. Delmon and J. T. Yates, eds., Elsevier, Amsterdam, (1994).
10. C. G. Vayenas, S. Bebelis, C. Pliangos, S. Brosda, and D. Tsiplakides, Electro-
chemical activation of catalysis. Promotion, Electrochemical promotion, and
metal-support interaction. Kluwer Academic/Plenum Publishers, New York
(2001).
11. G. L. Griffin, J. Electrochem. Soc., 131 (1984) 18.
12. D. Stauffer and A. Aharony, Inroduction to Percolation Theory Taylor & Francis,
London (1998).
13. E. A. Baranova, G. Fóti, and C. Comninellis, Electrochem. Commun., 6 (2004)
170.
14. E. A. Baranova, G. Fóti, and C. Comninellis, Electrochem. Commun., 6 (2004)
389.
15. S. J. Tauster, S. C. Fung, and R. L. Garten, JACS, 100 (1978) 170.
16. F. Solymosi, I. Tombacz, and M. Kocsis, J. Catal., 75 (1982) 78.
17. P. Meriaudeau, O. H. Ellestad, M. Dufaux, and C. Naccache, J. Catal., 75 (1982)
243.

165
CHAPTER 8 Electrochemical promotion of Rh
catalysts: Closed-circuit ethylene oxidation
Electrochemical promotion of catalysis (EPOC) was investigated in the
instance of a model reaction, the oxidation of ethylene on sputtered Rh film
catalysts (40 nm thick) deposited on YSZ and on YSZ covered with a thin
layer of TiO2. It was found that the two catalysts differ in their behavior
under polarization (closed circuit).
Small anodic currents applied to the Rh/YSZ catalyst cause periodic oscilla-
tions of the catalytic rate and potential having a frequency that can be con-
trolled electrochemically. The oscillations of reaction rate are synchronous
with those of catalyst potential, but always in the opposite direction. These
oscillations can be interpreted in terms of the formation and decomposition
of rhodium surface oxide: minimum rates correspond to an oxidized Rh sur-
face (Rh oxide), maximum rates to reduced Rh catalyst (Rh metal). This
phenomenon is fully reversible but can only be observed under closed-cir-
cuit conditions.
Currents applied to Rh/TiO2/YSZ lead to a pronounced nonoscillatory elec-
trochemical promotion of the catalyst. Its catalytic activity for C2H4 oxida-
tion can be reversibly enhanced by up to a factor of 80 via an anodic current
or potential applied to the catalyst, the increase in oxidation rates being up
Chapter 8 Electrochemical promotion of Rh catalysts: Closed-circuit ethylene oxidation
166
to 2000 times larger than the rate of supply of O2- to the Rh catalyst
electrode.
The electrochemical promotion behavior observed at the two catalytic
systems has its origin in an anodically controlled migration (backspillo-
ver) of O2- species from YSZ to the Rh/gas interface and in the con-
comitant destabilization of surface Rh2O3 formation via repulsive
lateral interactions.
8.1 Introduction
One factor that limits the commercial utilization of electrochemical promotion is the low
degree of metal dispersion (typically 10-3 to 10-5) found in the thick, porous films (typically 0.2 to
10 µm, most often produced by decomposition of a paste) used in practically all prior electro-
chemical promotion studies [1]. Metal dispersion expresses the percentage of metal catalyst or
electrode exposed to the gaseous reactants. For most commercial supported catalysts, degrees of
metal dispersion of 10 to 100 % are required [2]. The low degrees of dispersion typically used in
prior EPOC studies may be acceptable for certain active catalyst phase materials but can be pro-
hibitive for many noble-metal applications [1].
This problem can in many cases be overcome by dispersing the active phase on an elec-
tronically conductive material [1]. In a related approach, an industrial promoted catalyst is inter-
faced with a solid electrolyte. In this case the bulk of the commercial catalyst must be conductive.
The feasibility of this concept was already demonstrated in the synthesis of NH3 on Fe-based,
promoted commercial catalysts (BASF S6-10 RED) [3]. This commercial catalyst is electroni-
cally conducting, since it is not supported on an insulating support (such as SiO2, Al2O3), and it
was found that this catalyst film when deposited on the H+-conducting oxide electrolyte
(Ca0.9ZrIn0.1O3-α) was sufficiently conductive to also act as an electrode of the solid electrolyte
cell. Another case was SO2 oxidation on V2O5-K2S2O7-based catalysts (Haldor-Topsoe VK-58)
[4]. A third approach to the problem is the induction of electrochemical promotion without an
intermediate conductive phase. In this case the active catalyst phase is highly dispersed on a solid
electrolyte. This approach was not yet fully demonstrated.
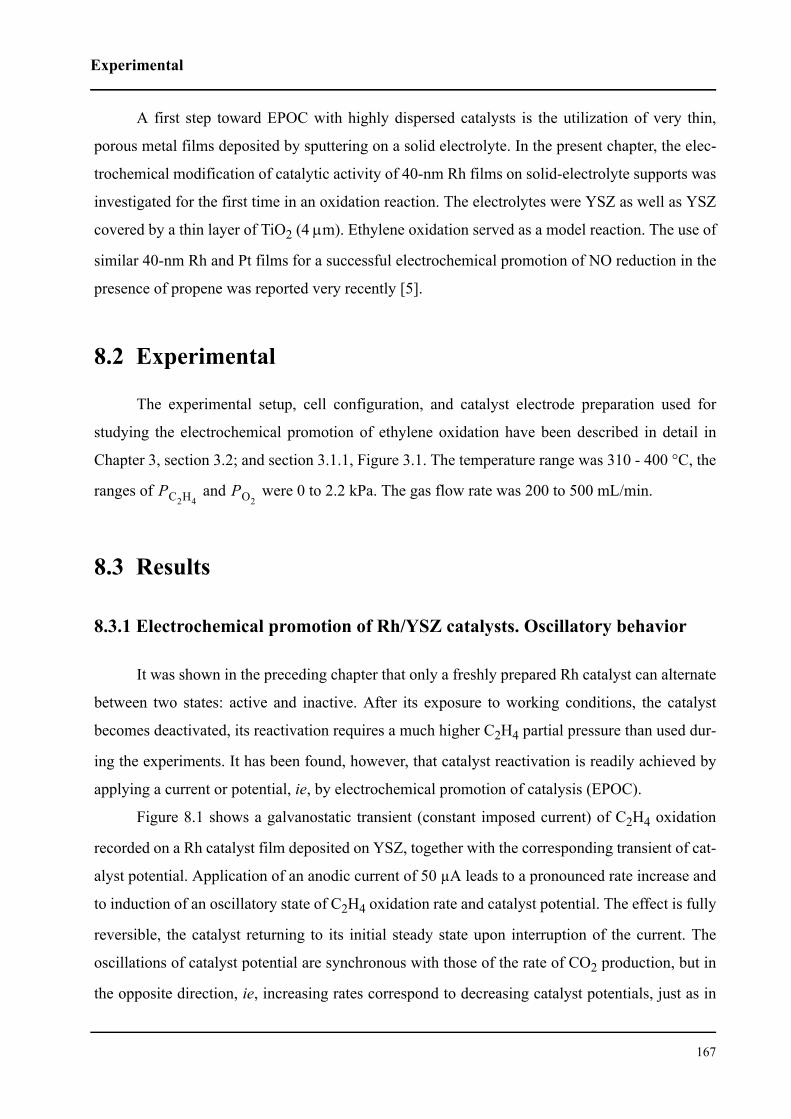
Experimental
167
A first step toward EPOC with highly dispersed catalysts is the utilization of very thin,
porous metal films deposited by sputtering on a solid electrolyte. In the present chapter, the elec-
trochemical modification of catalytic activity of 40-nm Rh films on solid-electrolyte supports was
investigated for the first time in an oxidation reaction. The electrolytes were YSZ as well as YSZ
covered by a thin layer of TiO2 (4 µm). Ethylene oxidation served as a model reaction. The use of
similar 40-nm Rh and Pt films for a successful electrochemical promotion of NO reduction in the
presence of propene was reported very recently [5].
8.2 Experimental
The experimental setup, cell configuration, and catalyst electrode preparation used for
studying the electrochemical promotion of ethylene oxidation have been described in detail in
Chapter 3, section 3.2; and section 3.1.1, Figure 3.1. The temperature range was 310 - 400 °C, the
ranges of and were 0 to 2.2 kPa. The gas flow rate was 200 to 500 mL/min.
8.3 Results
8.3.1 Electrochemical promotion of Rh/YSZ catalysts. Oscillatory behavior
It was shown in the preceding chapter that only a freshly prepared Rh catalyst can alternate
between two states: active and inactive. After its exposure to working conditions, the catalyst
becomes deactivated, its reactivation requires a much higher C2H4 partial pressure than used dur-
ing the experiments. It has been found, however, that catalyst reactivation is readily achieved by
applying a current or potential, ie, by electrochemical promotion of catalysis (EPOC).
Figure 8.1 shows a galvanostatic transient (constant imposed current) of C2H4 oxidation
recorded on a Rh catalyst film deposited on YSZ, together with the corresponding transient of cat-
alyst potential. Application of an anodic current of 50 µA leads to a pronounced rate increase and
to induction of an oscillatory state of C2H4 oxidation rate and catalyst potential. The effect is fully
reversible, the catalyst returning to its initial steady state upon interruption of the current. The
oscillations of catalyst potential are synchronous with those of the rate of CO2 production, but in
the opposite direction, ie, increasing rates correspond to decreasing catalyst potentials, just as in
PC2H4PO2
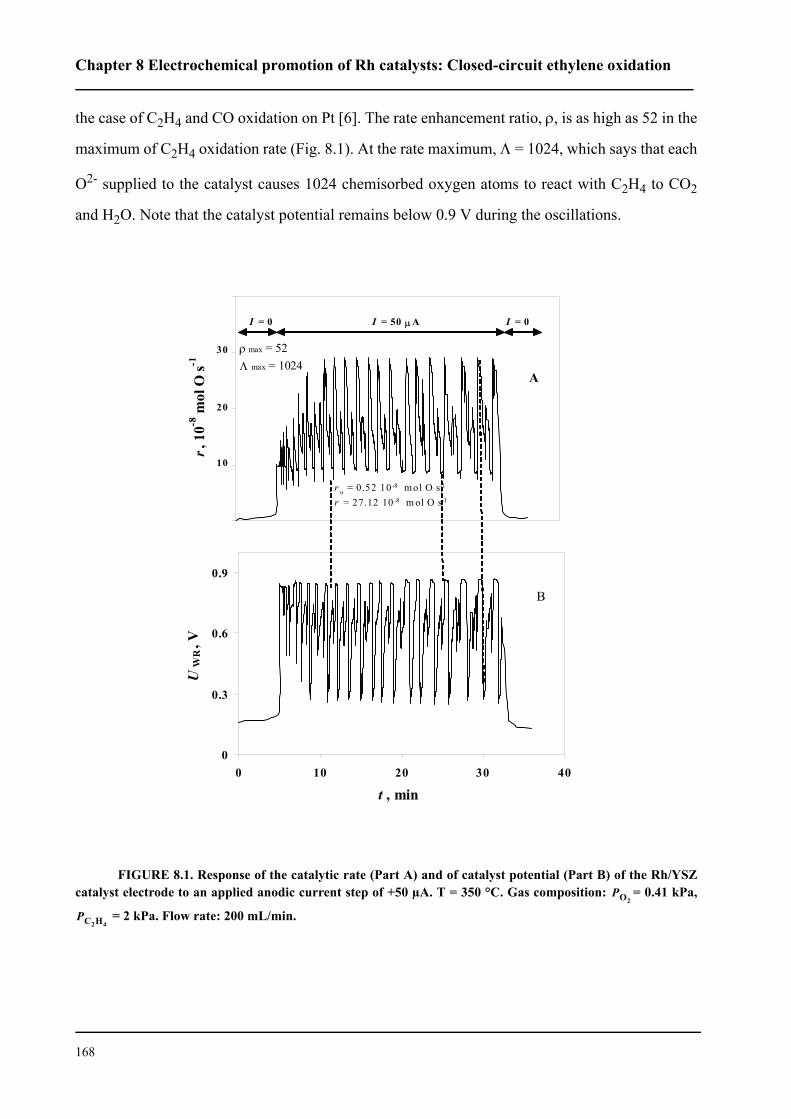
Chapter 8 Electrochemical promotion of Rh catalysts: Closed-circuit ethylene oxidation
168
the case of C2H4 and CO oxidation on Pt [6]. The rate enhancement ratio, ρ, is as high as 52 in the
maximum of C2H4 oxidation rate (Fig. 8.1). At the rate maximum, Λ = 1024, which says that each
O2- supplied to the catalyst causes 1024 chemisorbed oxygen atoms to react with C2H4 to CO2
and H2O. Note that the catalyst potential remains below 0.9 V during the oscillations.
FIGURE 8.1. Response of the catalytic rate (Part A) and of catalyst potential (Part B) of the Rh/YSZcatalyst electrode to an applied anodic current step of +50 µA. T = 350 °C. Gas composition: = 0.41 kPa,
= 2 kPa. Flow rate: 200 mL/min.
0
0.3
0.6
0.9
0 10 20 30 40
t , min
UW
R, V
r, 1
0-8 m
ol O
s-1
30
20
10
I = 0 I = 0I = 50 µ A
ρ max = 52Λ max = 1024
r o = 0 .52 10-8 mol O s-1
r = 27.12 10-8 m ol O s-1
A
B
PO2
PC2H4
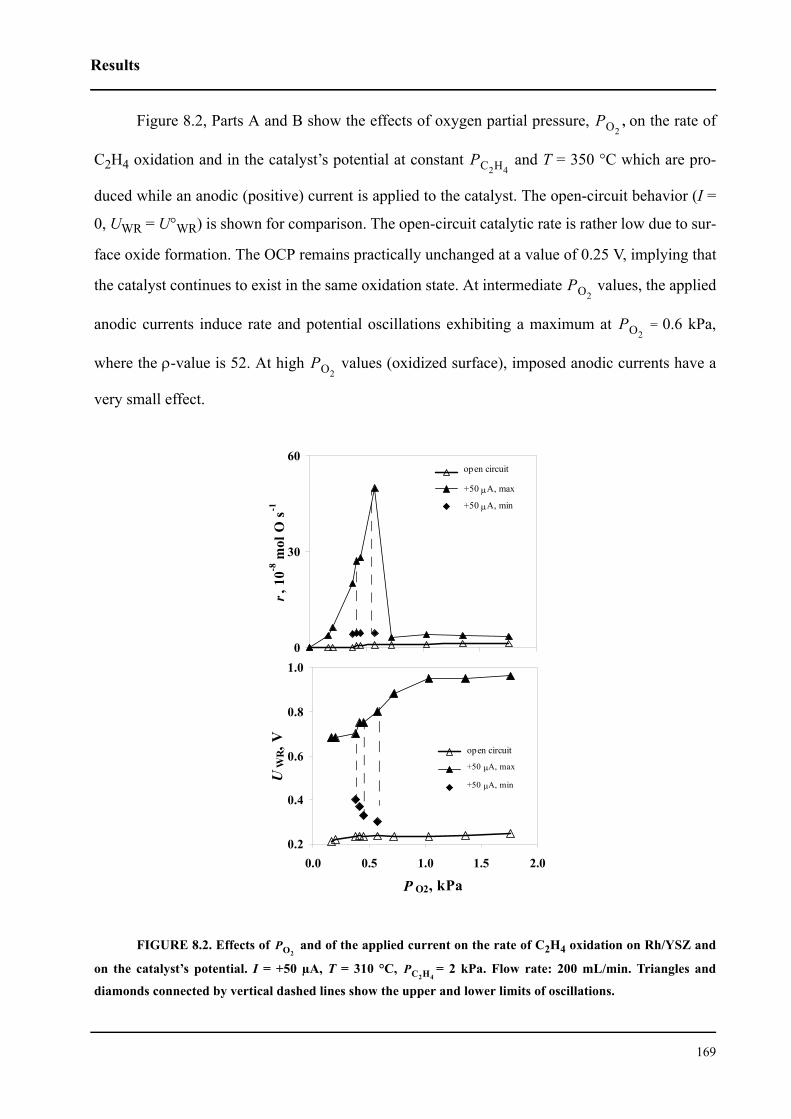
Results
169
Figure 8.2, Parts A and B show the effects of oxygen partial pressure, , on the rate of
C2H4 oxidation and in the catalyst’s potential at constant and T = 350 °C which are pro-
duced while an anodic (positive) current is applied to the catalyst. The open-circuit behavior (I =
0, UWR = U°WR) is shown for comparison. The open-circuit catalytic rate is rather low due to sur-
face oxide formation. The OCP remains practically unchanged at a value of 0.25 V, implying that
the catalyst continues to exist in the same oxidation state. At intermediate values, the applied
anodic currents induce rate and potential oscillations exhibiting a maximum at = 0.6 kPa,
where the ρ-value is 52. At high values (oxidized surface), imposed anodic currents have a
very small effect.
FIGURE 8.2. Effects of and of the applied current on the rate of C2H4 oxidation on Rh/YSZ and
on the catalyst’s potential. I = +50 µA, T = 310 °C, = 2 kPa. Flow rate: 200 mL/min. Triangles and
diamonds connected by vertical dashed lines show the upper and lower limits of oscillations.
PO2
PC2H4
PO2
PO2
PO2
0
30
60
r, 1
0-8 m
ol O
s-1
+50 µA, max
+50 µA, min
open circuit
0.2
0.4
0.6
0.8
1.0
0.0 0.5 1.0 1.5 2.0
P O2, kPa
UW
R, V open circuit
+50 µA, max
+50 µA, min
PO2
PC2H4
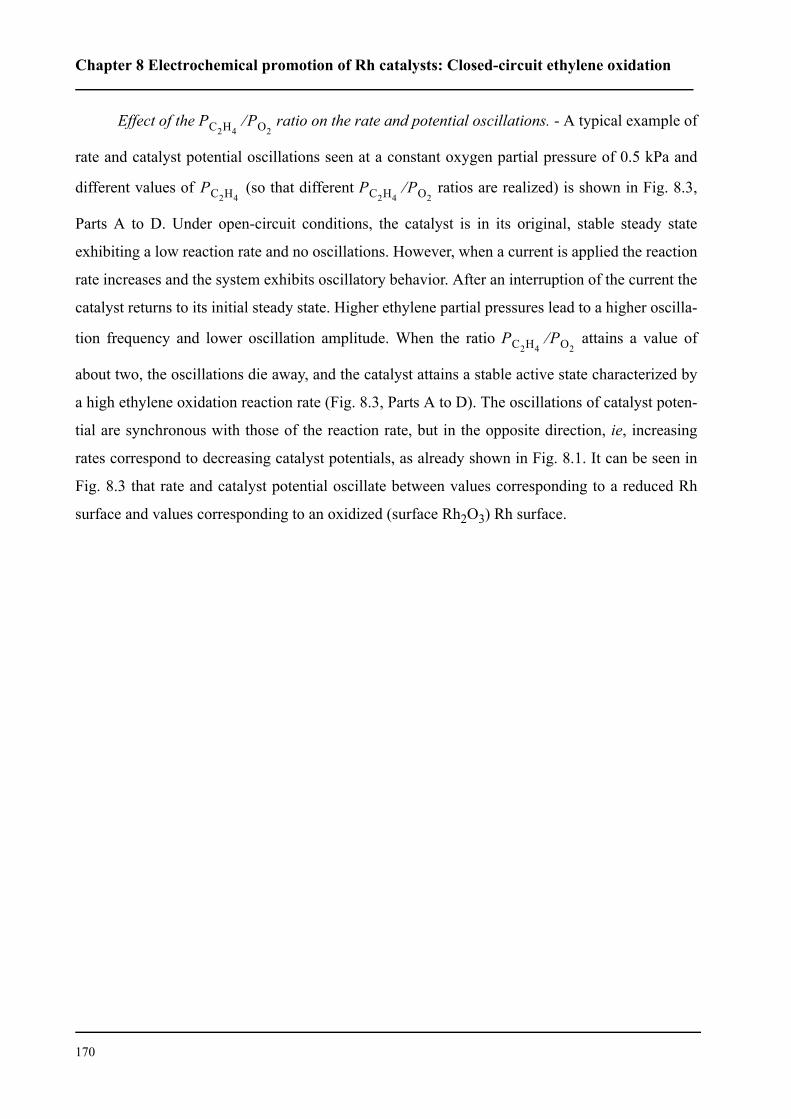
Chapter 8 Electrochemical promotion of Rh catalysts: Closed-circuit ethylene oxidation
170
Effect of the ratio on the rate and potential oscillations. - A typical example of
rate and catalyst potential oscillations seen at a constant oxygen partial pressure of 0.5 kPa and
different values of (so that different ratios are realized) is shown in Fig. 8.3,
Parts A to D. Under open-circuit conditions, the catalyst is in its original, stable steady state
exhibiting a low reaction rate and no oscillations. However, when a current is applied the reaction
rate increases and the system exhibits oscillatory behavior. After an interruption of the current the
catalyst returns to its initial steady state. Higher ethylene partial pressures lead to a higher oscilla-
tion frequency and lower oscillation amplitude. When the ratio attains a value of
about two, the oscillations die away, and the catalyst attains a stable active state characterized by
a high ethylene oxidation reaction rate (Fig. 8.3, Parts A to D). The oscillations of catalyst poten-
tial are synchronous with those of the reaction rate, but in the opposite direction, ie, increasing
rates correspond to decreasing catalyst potentials, as already shown in Fig. 8.1. It can be seen in
Fig. 8.3 that rate and catalyst potential oscillate between values corresponding to a reduced Rh
surface and values corresponding to an oxidized (surface Rh2O3) Rh surface.
PC2H4PO2
⁄
PC2H4PC2H4
PO2⁄
PC2H4PO2
⁄
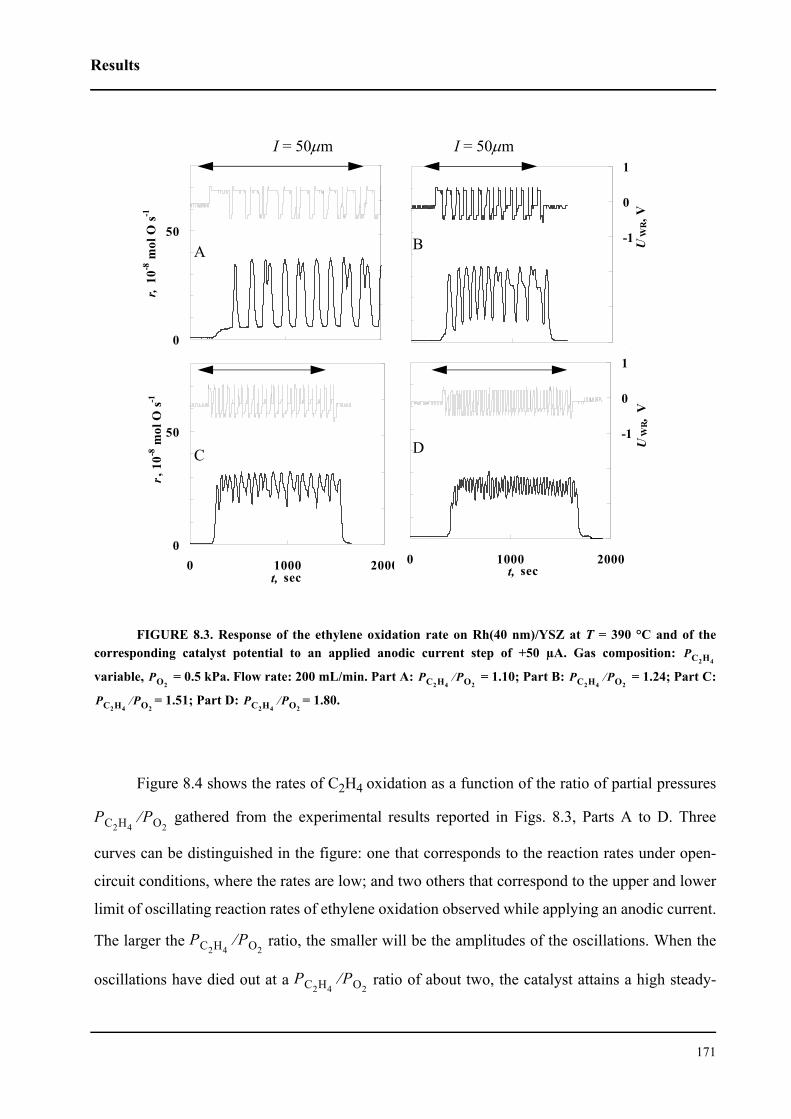
Results
171
FIGURE 8.3. Response of the ethylene oxidation rate on Rh(40 nm)/YSZ at T = 390 °C and of thecorresponding catalyst potential to an applied anodic current step of +50 µA. Gas composition:
variable, = 0.5 kPa. Flow rate: 200 mL/min. Part A: = 1.10; Part B: = 1.24; Part C:
= 1.51; Part D: = 1.80.
Figure 8.4 shows the rates of C2H4 oxidation as a function of the ratio of partial pressures
gathered from the experimental results reported in Figs. 8.3, Parts A to D. Three
curves can be distinguished in the figure: one that corresponds to the reaction rates under open-
circuit conditions, where the rates are low; and two others that correspond to the upper and lower
limit of oscillating reaction rates of ethylene oxidation observed while applying an anodic current.
The larger the ratio, the smaller will be the amplitudes of the oscillations. When the
oscillations have died out at a ratio of about two, the catalyst attains a high steady-
0
50
r, 1
0-8 m
ol O
s-1
-4
-3
-2
-1
0
1
UW
R, V
0
50
0 1000 2000t, sec
r, 1
0-8 m
ol O
s-1
0 1000 2000t, sec
-4
-3
-2
-1
0
1
UW
R,
V
I = 50µm I = 50µm
A B
C D
PC2H4
PO2PC2H4
PO2⁄ PC2H4
PO2⁄
PC2H4PO2
⁄ PC2H4PO2
⁄
PC2H4PO2
⁄
PC2H4PO2
⁄
PC2H4PO2
⁄
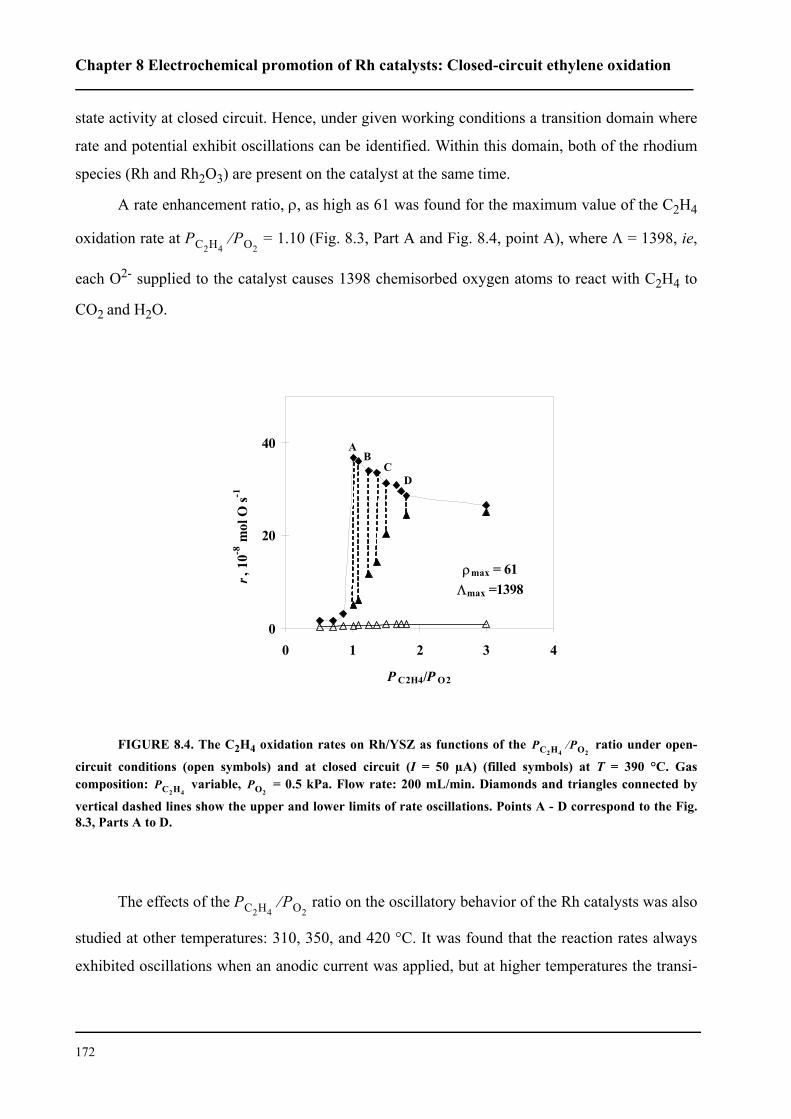
Chapter 8 Electrochemical promotion of Rh catalysts: Closed-circuit ethylene oxidation
172
state activity at closed circuit. Hence, under given working conditions a transition domain where
rate and potential exhibit oscillations can be identified. Within this domain, both of the rhodium
species (Rh and Rh2O3) are present on the catalyst at the same time.
A rate enhancement ratio, ρ, as high as 61 was found for the maximum value of the C2H4
oxidation rate at = 1.10 (Fig. 8.3, Part A and Fig. 8.4, point A), where Λ = 1398, ie,
each O2- supplied to the catalyst causes 1398 chemisorbed oxygen atoms to react with C2H4 to
CO2 and H2O.
FIGURE 8.4. The C2H4 oxidation rates on Rh/YSZ as functions of the ratio under open-
circuit conditions (open symbols) and at closed circuit (I = 50 µA) (filled symbols) at T = 390 °C. Gascomposition: variable, = 0.5 kPa. Flow rate: 200 mL/min. Diamonds and triangles connected by
vertical dashed lines show the upper and lower limits of rate oscillations. Points A - D correspond to the Fig.8.3, Parts A to D.
The effects of the ratio on the oscillatory behavior of the Rh catalysts was also
studied at other temperatures: 310, 350, and 420 °C. It was found that the reaction rates always
exhibited oscillations when an anodic current was applied, but at higher temperatures the transi-
PC2H4PO2
⁄
0
20
40
0 1 2 3 4
P C2H4/P O2
r, 1
0-8 m
ol O
s-1
ρmax = 61Λmax =1398
AB
CD
PC2H4PO2
⁄
PC2H4PO2
PC2H4PO2
⁄
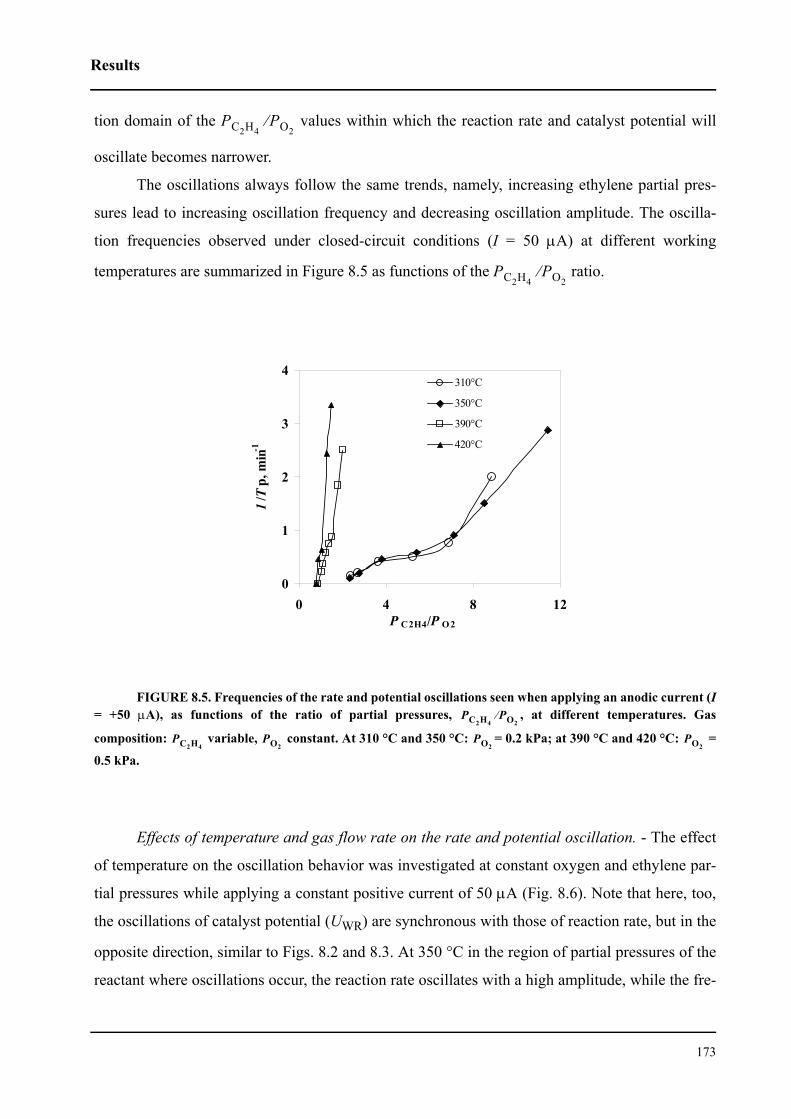
Results
173
tion domain of the values within which the reaction rate and catalyst potential will
oscillate becomes narrower.
The oscillations always follow the same trends, namely, increasing ethylene partial pres-
sures lead to increasing oscillation frequency and decreasing oscillation amplitude. The oscilla-
tion frequencies observed under closed-circuit conditions (I = 50 µA) at different working
temperatures are summarized in Figure 8.5 as functions of the ratio.
FIGURE 8.5. Frequencies of the rate and potential oscillations seen when applying an anodic current (I= +50 µA), as functions of the ratio of partial pressures, , at different temperatures. Gas
composition: variable, constant. At 310 °C and 350 °C: = 0.2 kPa; at 390 °C and 420 °C: =
0.5 kPa.
Effects of temperature and gas flow rate on the rate and potential oscillation. - The effect
of temperature on the oscillation behavior was investigated at constant oxygen and ethylene par-
tial pressures while applying a constant positive current of 50 µA (Fig. 8.6). Note that here, too,
the oscillations of catalyst potential (UWR) are synchronous with those of reaction rate, but in the
opposite direction, similar to Figs. 8.2 and 8.3. At 350 °C in the region of partial pressures of the
reactant where oscillations occur, the reaction rate oscillates with a high amplitude, while the fre-
PC2H4PO2
⁄
PC2H4PO2
⁄
0
1
2
3
4
0 4 8 12P C2H4/P O 2
1/T
p, m
in-1
310°C
350°C
390°C
420°C
PC2H4PO2
⁄
PC2H4PO2
PO2PO2
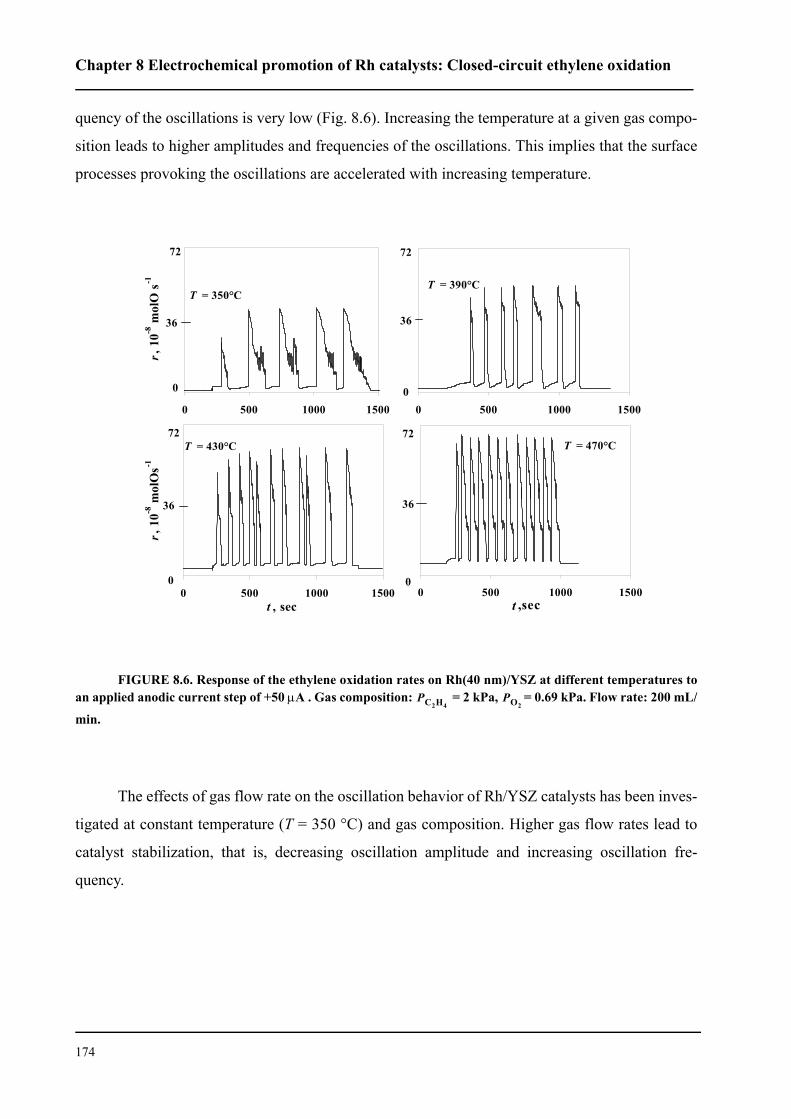
Chapter 8 Electrochemical promotion of Rh catalysts: Closed-circuit ethylene oxidation
174
quency of the oscillations is very low (Fig. 8.6). Increasing the temperature at a given gas compo-
sition leads to higher amplitudes and frequencies of the oscillations. This implies that the surface
processes provoking the oscillations are accelerated with increasing temperature.
FIGURE 8.6. Response of the ethylene oxidation rates on Rh(40 nm)/YSZ at different temperatures toan applied anodic current step of +50 µA . Gas composition: = 2 kPa, = 0.69 kPa. Flow rate: 200 mL/
min.
The effects of gas flow rate on the oscillation behavior of Rh/YSZ catalysts has been inves-
tigated at constant temperature (T = 350 °C) and gas composition. Higher gas flow rates lead to
catalyst stabilization, that is, decreasing oscillation amplitude and increasing oscillation fre-
quency.
0 500 1000 1500
r, 1
0-8 m
olO
s-1
T = 350°C
72
36
0
0 500 1000 1500
T = 390°C
36
72
0
0 500 1000 1500t , sec
r, 1
0-8 m
olO
s-1
T = 430°C72
36
00 500 1000 1500
t ,sec
T = 470°C72
36
0
PC2H4PO2
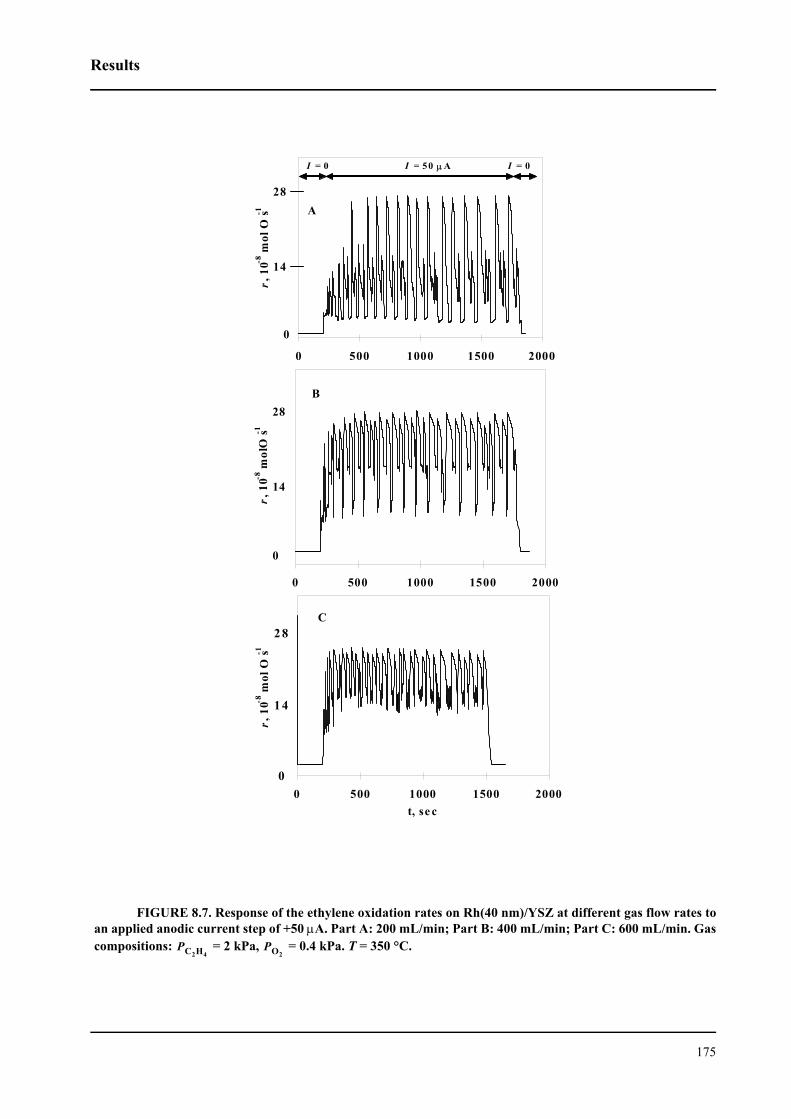
Results
175
FIGURE 8.7. Response of the ethylene oxidation rates on Rh(40 nm)/YSZ at different gas flow rates toan applied anodic current step of +50 µA. Part A: 200 mL/min; Part B: 400 mL/min; Part C: 600 mL/min. Gascompositions: = 2 kPa, = 0.4 kPa. T = 350 °C.
0 500 1000 1500 2000
r, 1
0-8 m
olO
s-1
28
0
14
B
0 500 1000 1500 2000t, se c
r, 1
0-8 m
ol O
s-1
2 8
1 4
0
C
0 500 1000 1500 2000
r, 1
0-8 m
ol O
s-1
28
14
0
I = 0 I = 0I = 50 µ A
A
PC2H4PO2
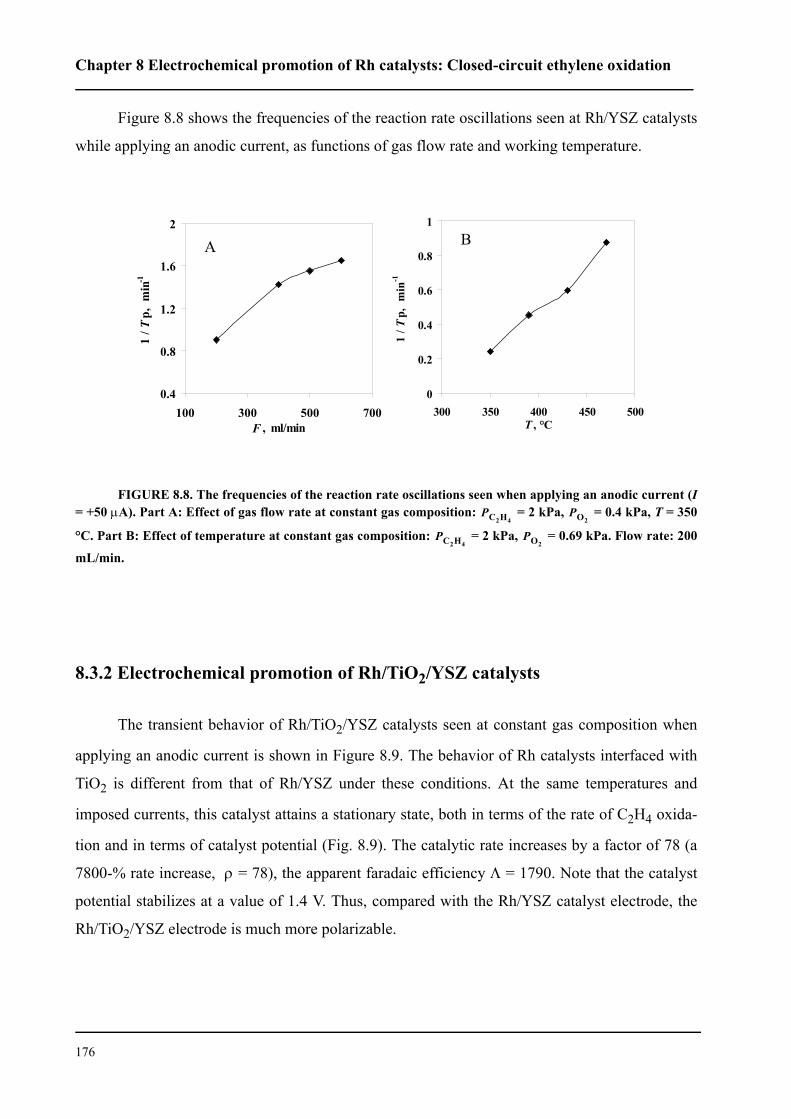
Chapter 8 Electrochemical promotion of Rh catalysts: Closed-circuit ethylene oxidation
176
Figure 8.8 shows the frequencies of the reaction rate oscillations seen at Rh/YSZ catalysts
while applying an anodic current, as functions of gas flow rate and working temperature.
FIGURE 8.8. The frequencies of the reaction rate oscillations seen when applying an anodic current (I= +50 µA). Part A: Effect of gas flow rate at constant gas composition: = 2 kPa, = 0.4 kPa, T = 350
°C. Part B: Effect of temperature at constant gas composition: = 2 kPa, = 0.69 kPa. Flow rate: 200
mL/min.
8.3.2 Electrochemical promotion of Rh/TiO2/YSZ catalysts
The transient behavior of Rh/TiO2/YSZ catalysts seen at constant gas composition when
applying an anodic current is shown in Figure 8.9. The behavior of Rh catalysts interfaced with
TiO2 is different from that of Rh/YSZ under these conditions. At the same temperatures and
imposed currents, this catalyst attains a stationary state, both in terms of the rate of C2H4 oxida-
tion and in terms of catalyst potential (Fig. 8.9). The catalytic rate increases by a factor of 78 (a
7800-% rate increase, ρ = 78), the apparent faradaic efficiency Λ = 1790. Note that the catalyst
potential stabilizes at a value of 1.4 V. Thus, compared with the Rh/YSZ catalyst electrode, the
Rh/TiO2/YSZ electrode is much more polarizable.
0
0.2
0.4
0.6
0.8
1
300 350 400 450 500T , °C
1 / T
p, m
in-1
0.4
0.8
1.2
1.6
2
100 300 500 700F , ml/min
1 / T
p, m
in-1
A B
PC2H4PO2
PC2H4PO2
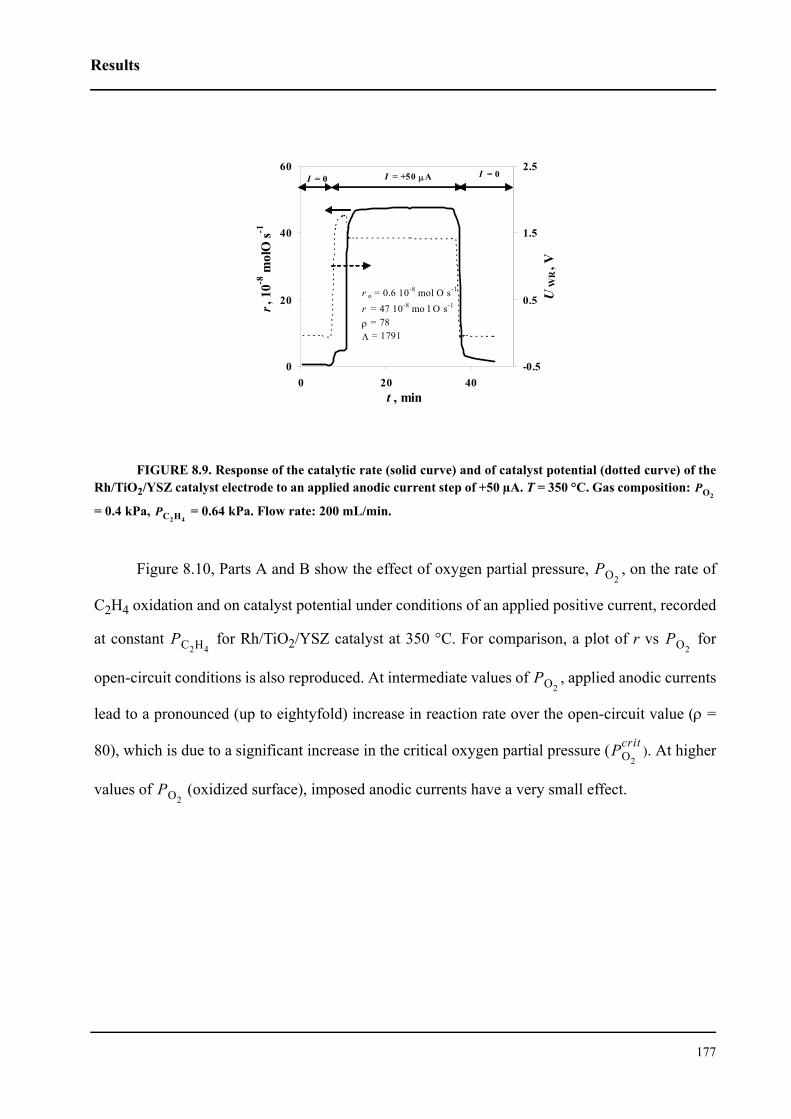
Results
177
FIGURE 8.9. Response of the catalytic rate (solid curve) and of catalyst potential (dotted curve) of theRh/TiO2/YSZ catalyst electrode to an applied anodic current step of +50 µA. T = 350 °C. Gas composition:
= 0.4 kPa, = 0.64 kPa. Flow rate: 200 mL/min.
Figure 8.10, Parts A and B show the effect of oxygen partial pressure, , on the rate of
C2H4 oxidation and on catalyst potential under conditions of an applied positive current, recorded
at constant for Rh/TiO2/YSZ catalyst at 350 °C. For comparison, a plot of r vs for
open-circuit conditions is also reproduced. At intermediate values of , applied anodic currents
lead to a pronounced (up to eightyfold) increase in reaction rate over the open-circuit value (ρ =
80), which is due to a significant increase in the critical oxygen partial pressure ( ). At higher
values of (oxidized surface), imposed anodic currents have a very small effect.
0
20
40
60
0 20 40t , min
r, 1
0-8 m
olO
s-1
-0.5
0.5
1.5
2.5
UW
R, V
r o = 0.6 10-8 mol O s-1
r = 47 10-8 mo l O s-1
ρ = 78Λ = 1791
I = 0 I = +50 µA I = 0
PO2
PC2H4
PO2
PC2H4PO2
PO2
PO2
crit
PO2
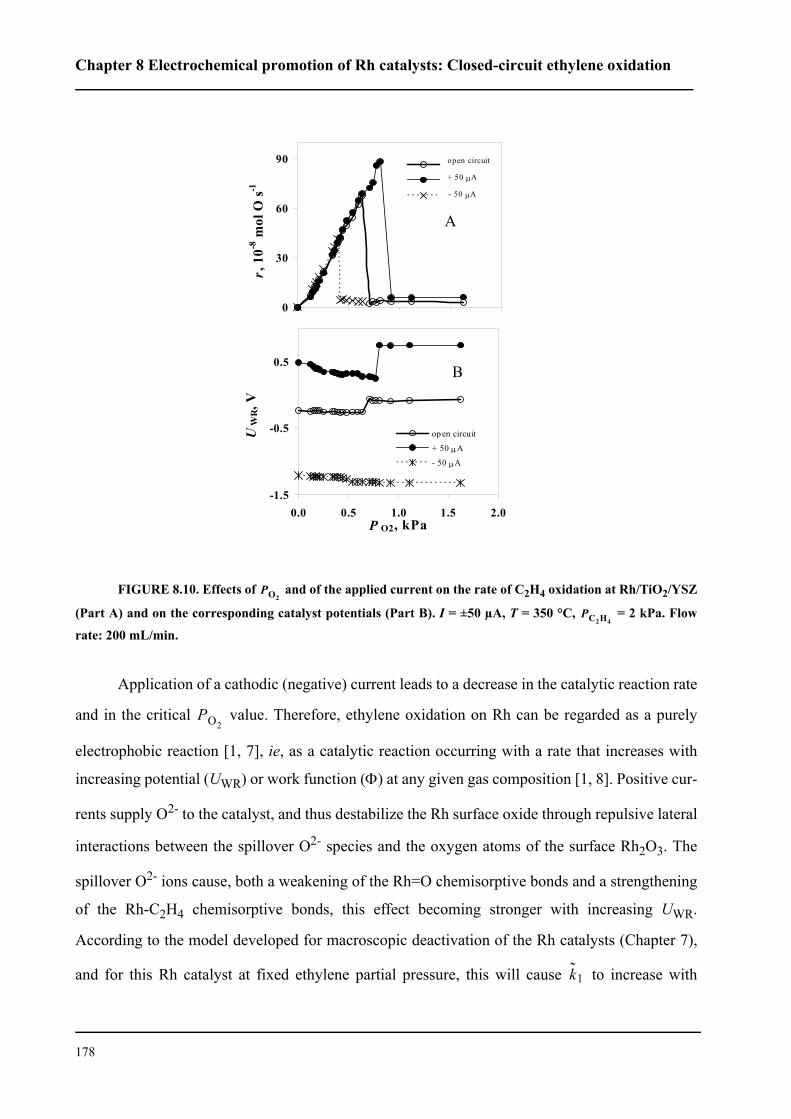
Chapter 8 Electrochemical promotion of Rh catalysts: Closed-circuit ethylene oxidation
178
FIGURE 8.10. Effects of and of the applied current on the rate of C2H4 oxidation at Rh/TiO2/YSZ
(Part A) and on the corresponding catalyst potentials (Part B). I = ±50 µA, T = 350 °C, = 2 kPa. Flow
rate: 200 mL/min.
Application of a cathodic (negative) current leads to a decrease in the catalytic reaction rate
and in the critical value. Therefore, ethylene oxidation on Rh can be regarded as a purely
electrophobic reaction [1, 7], ie, as a catalytic reaction occurring with a rate that increases with
increasing potential (UWR) or work function (Φ) at any given gas composition [1, 8]. Positive cur-
rents supply O2- to the catalyst, and thus destabilize the Rh surface oxide through repulsive lateral
interactions between the spillover O2- species and the oxygen atoms of the surface Rh2O3. The
spillover O2- ions cause, both a weakening of the Rh=O chemisorptive bonds and a strengthening
of the Rh-C2H4 chemisorptive bonds, this effect becoming stronger with increasing UWR.
According to the model developed for macroscopic deactivation of the Rh catalysts (Chapter 7),
and for this Rh catalyst at fixed ethylene partial pressure, this will cause to increase with
0
30
60
90
r, 1
0-8 m
ol O
s-1
open circuit
+ 50 µA
- 50 µA
-1.5
-0.5
0.5
0.0 0.5 1.0 1.5 2.0P O2, kPa
UW
R, V
op en circuit
+ 50 µA
- 50 µA
A
B
PO2
PC2H4
PO2
k̃1
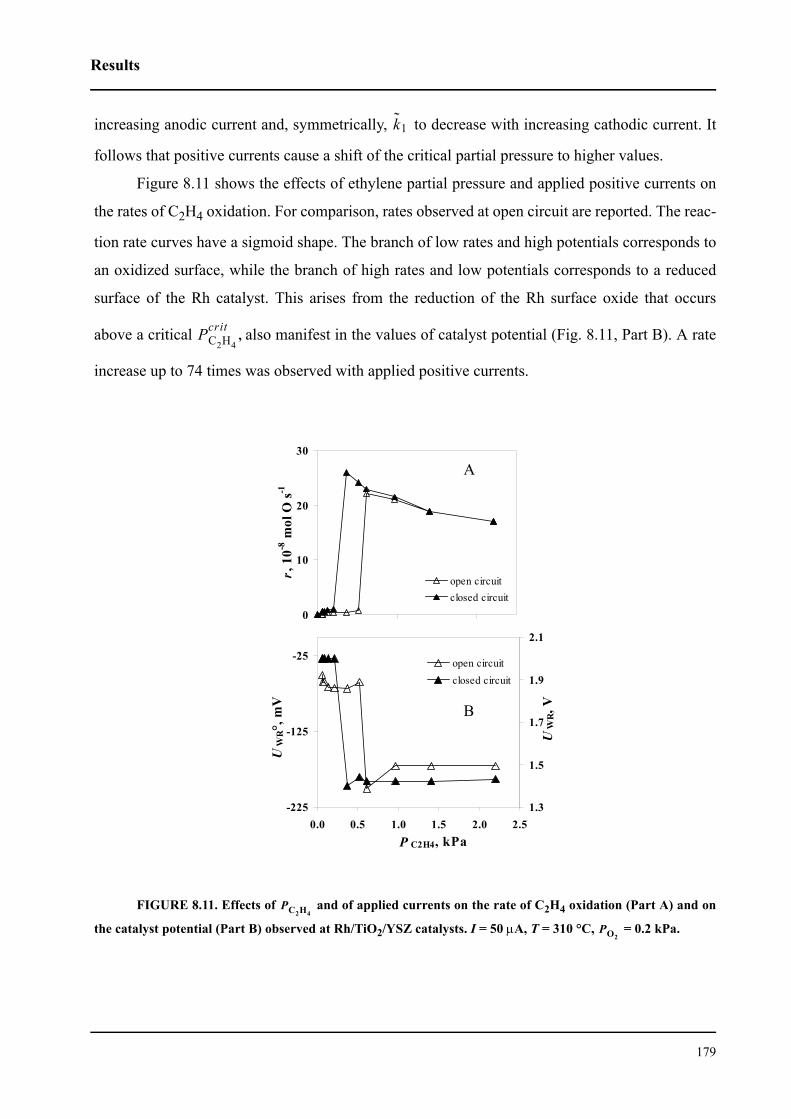
Results
179
increasing anodic current and, symmetrically, to decrease with increasing cathodic current. It
follows that positive currents cause a shift of the critical partial pressure to higher values.
Figure 8.11 shows the effects of ethylene partial pressure and applied positive currents on
the rates of C2H4 oxidation. For comparison, rates observed at open circuit are reported. The reac-
tion rate curves have a sigmoid shape. The branch of low rates and high potentials corresponds to
an oxidized surface, while the branch of high rates and low potentials corresponds to a reduced
surface of the Rh catalyst. This arises from the reduction of the Rh surface oxide that occurs
above a critical , also manifest in the values of catalyst potential (Fig. 8.11, Part B). A rate
increase up to 74 times was observed with applied positive currents.
FIGURE 8.11. Effects of and of applied currents on the rate of C2H4 oxidation (Part A) and on
the catalyst potential (Part B) observed at Rh/TiO2/YSZ catalysts. I = 50 µA, T = 310 °C, = 0.2 kPa.
k̃1
PC2H4
crit
0
10
20
30
0.0 1.0 2.0
r, 1
0-8 m
ol O
s-1
open circuit closed circuit
-225
-125
-25
0.0 0.5 1.0 1.5 2.0 2.5P C2H4, kPa
UW
R°,
mV
1.3
1.5
1.7
1.9
2.1
UW
R, V
open circuitclosed circuit
A
B
PC2H4
PO2
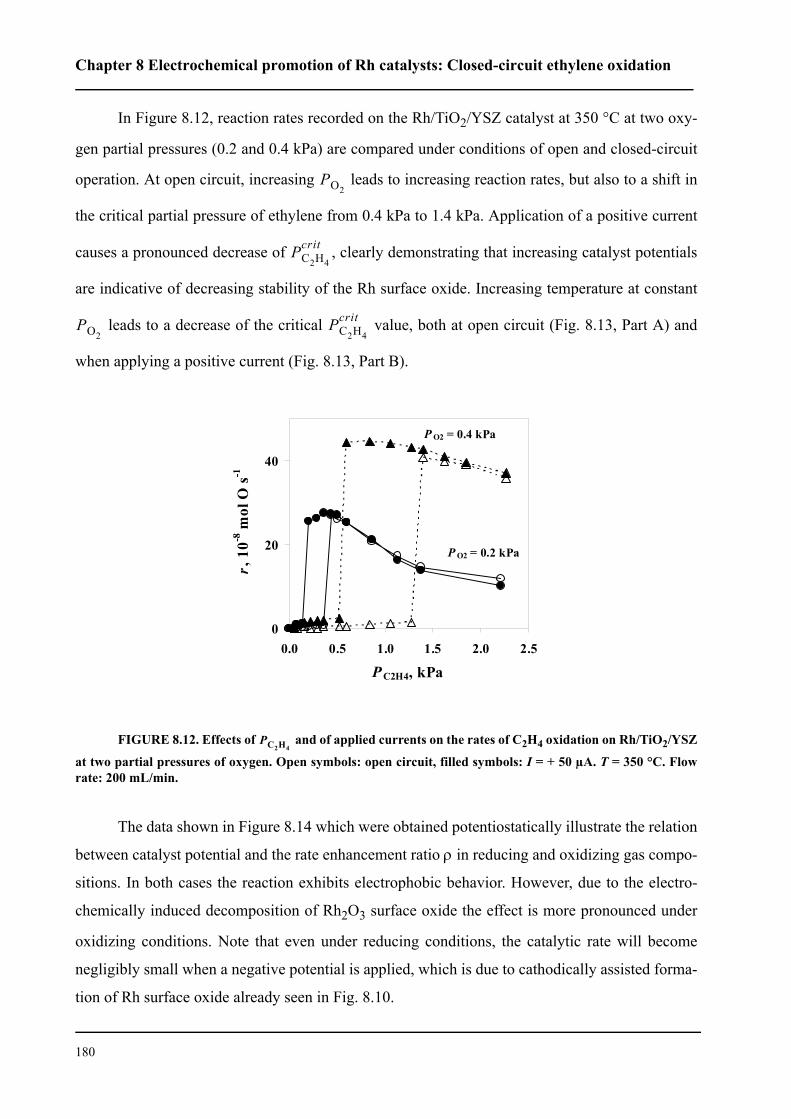
Chapter 8 Electrochemical promotion of Rh catalysts: Closed-circuit ethylene oxidation
180
In Figure 8.12, reaction rates recorded on the Rh/TiO2/YSZ catalyst at 350 °C at two oxy-
gen partial pressures (0.2 and 0.4 kPa) are compared under conditions of open and closed-circuit
operation. At open circuit, increasing leads to increasing reaction rates, but also to a shift in
the critical partial pressure of ethylene from 0.4 kPa to 1.4 kPa. Application of a positive current
causes a pronounced decrease of , clearly demonstrating that increasing catalyst potentials
are indicative of decreasing stability of the Rh surface oxide. Increasing temperature at constant
leads to a decrease of the critical value, both at open circuit (Fig. 8.13, Part A) and
when applying a positive current (Fig. 8.13, Part B).
FIGURE 8.12. Effects of and of applied currents on the rates of C2H4 oxidation on Rh/TiO2/YSZ
at two partial pressures of oxygen. Open symbols: open circuit, filled symbols: I = + 50 µA. T = 350 °C. Flowrate: 200 mL/min.
The data shown in Figure 8.14 which were obtained potentiostatically illustrate the relation
between catalyst potential and the rate enhancement ratio ρ in reducing and oxidizing gas compo-
sitions. In both cases the reaction exhibits electrophobic behavior. However, due to the electro-
chemically induced decomposition of Rh2O3 surface oxide the effect is more pronounced under
oxidizing conditions. Note that even under reducing conditions, the catalytic rate will become
negligibly small when a negative potential is applied, which is due to cathodically assisted forma-
tion of Rh surface oxide already seen in Fig. 8.10.
PO2
PC2H4
crit
PO2PC2H4
crit
0
20
40
0.0 0.5 1.0 1.5 2.0 2.5
P C2H4, kPa
r, 1
0-8 m
ol O
s-1
P O2 = 0.2 kPa
P O2 = 0.4 kPa
PC2H4
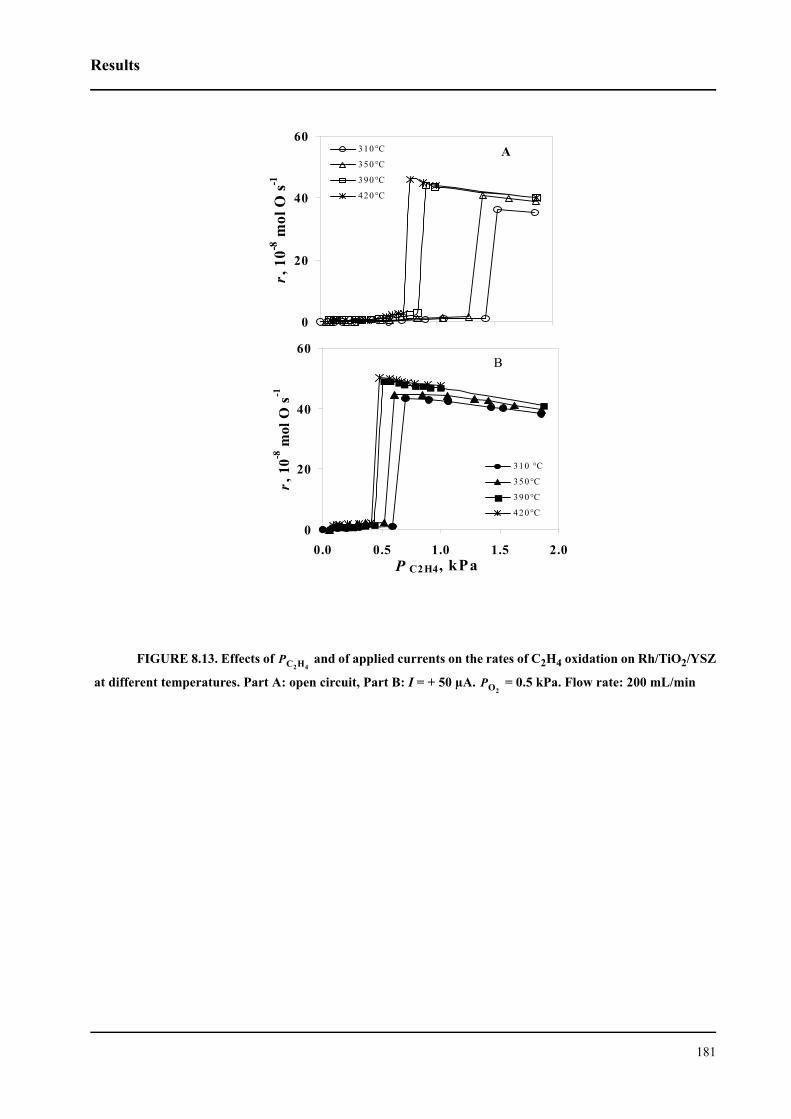
Results
181
FIGURE 8.13. Effects of and of applied currents on the rates of C2H4 oxidation on Rh/TiO2/YSZ
at different temperatures. Part A: open circuit, Part B: I = + 50 µA. = 0.5 kPa. Flow rate: 200 mL/min
0
20
40
60
r, 1
0-8 m
ol O
s-1
310°C
350°C
390°C
420°C
0
20
40
60
0.0 0.5 1.0 1.5 2.0P C2H4, kPa
r, 1
0-8 m
ol O
s-1
310 °C
350°C
390°C
420°C
B
A
PC2H4
PO2
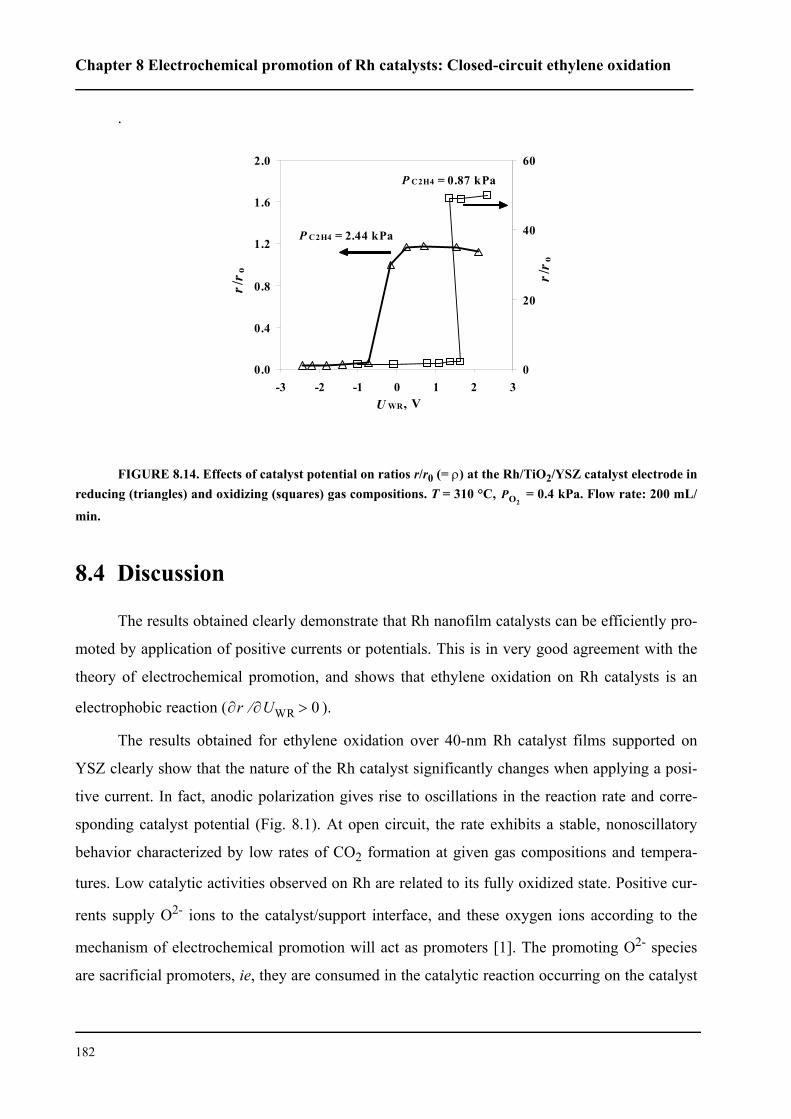
Chapter 8 Electrochemical promotion of Rh catalysts: Closed-circuit ethylene oxidation
182
.
FIGURE 8.14. Effects of catalyst potential on ratios r/r0 (= ρ) at the Rh/TiO2/YSZ catalyst electrode inreducing (triangles) and oxidizing (squares) gas compositions. T = 310 °C, = 0.4 kPa. Flow rate: 200 mL/
min.
8.4 Discussion
The results obtained clearly demonstrate that Rh nanofilm catalysts can be efficiently pro-
moted by application of positive currents or potentials. This is in very good agreement with the
theory of electrochemical promotion, and shows that ethylene oxidation on Rh catalysts is an
electrophobic reaction ( ).
The results obtained for ethylene oxidation over 40-nm Rh catalyst films supported on
YSZ clearly show that the nature of the Rh catalyst significantly changes when applying a posi-
tive current. In fact, anodic polarization gives rise to oscillations in the reaction rate and corre-
sponding catalyst potential (Fig. 8.1). At open circuit, the rate exhibits a stable, nonoscillatory
behavior characterized by low rates of CO2 formation at given gas compositions and tempera-
tures. Low catalytic activities observed on Rh are related to its fully oxidized state. Positive cur-
rents supply O2- ions to the catalyst/support interface, and these oxygen ions according to the
mechanism of electrochemical promotion will act as promoters [1]. The promoting O2- species
are sacrificial promoters, ie, they are consumed in the catalytic reaction occurring on the catalyst
0.0
0.4
0.8
1.2
1.6
2.0
-3 -2 -1 0 1 2 3U WR, V
r/r o
0
20
40
60
r/r o
P C2H4 = 2.44 kPa
P C2H4 = 0.87 kPa
PO2
∂r ∂UWR⁄ 0>
Discussion
183
surface, and spent O2- are continuously replenished via reduction of gaseous O2 at the countere-
lectrode [1].
In several heterogeneous catalytic systems operating close to the limits of surface oxide
stability, oscillatory behavior has been found repeatedly [9 and reference therein, 10, 11]. In most
cases these oscillations of reaction rate are observed in a transition region between the two steady
states characterized by high and low reaction rates [9]. The catalyst’s bistability can arise, either
from multiple steady states on the catalyst surface or from multiplicity in the reactor dynamics. In
[9], it was shown that additives or impurities that may constitute catalyst promoters as well as cat-
alyst poisons can play a significant role in the induction of oscillatory behavior of a catalyst. In
fact, additives present in the gas phase or on the catalyst surface will merely behave as additional
adsorbates on the catalyst surface. They will block sites, can affect the activity of the catalyst and
induce oscillations [12-15]. The impurities can be responsible for the appearance of oscillations if
in the region of bistability, they are acting so as to drive the system from one state to the other.
The induction of oscillatory states in the rate of C2H4 oxidation on Rh (40 nm)/YSZ via
anodic polarization is an effect similar to that observed during CO oxidation on electropromoted
polycrystalline Pt films (5 µm) deposited on YSZ [11]. In this work [11] the oscillations were
induced by electrochemically controlled backspillover of oxygen ions from the solid electrolyte to
the catalyst surface. The authors observed that reaction rate oscillations can be induced by posi-
tive, and stopped by negative currents [1]. The effect of the positive current was interpreted in
terms of changes in the surface coverage by chemisorbed oxygen, CO, and PtO2. In the case of
positive currents, O2- ions are continuously supplied to the Pt surface, which implies that the
backspillover species, which in some way are "impurities", should be present on the catalyst sur-
face in order to switch on the rate oscillations [9].
The mechanism by which the self-sustained oscillations are generated at Rh/YSZ can be
explained as follows. According to the present results, the Rh surface oxide is stable at given tem-
peratures and gas compositions. When by anodic polarization and the concomitant O2- supply to
the catalyst, a weakening of oxygen bonds to the rhodium surface is caused, the oxygen that had
previously been associated with Rh2O3 becomes available for the reaction with C2H4, and this
causes an abrupt decrease in the ratio over the catalyst. When this ratio falls below
some critical ratio , formation of surface Rh2O3 will resume. However, this
PC2H4PO2
⁄
PC2H4PO2
⁄( )crit
Chapter 8 Electrochemical promotion of Rh catalysts: Closed-circuit ethylene oxidation
184
causes an increase in the ratio due to extra consumption of gaseous O2, so the oxide
becomes unstable again, and the cycle is repeated.
The results obtained for C2H4 oxidation over Rh nanofilm catalysts can be summarized as
follows: (i) Rate oscillations can be triggered by applied positive currents, only in the domain
where the catalyst exhibits bistability. At low ratios the applied currents do not lead to
rate oscillations. Under more strongly reducing conditions (high ), applied currents lead to
a dramatic increase in reaction rate. In this domain, the oscillations have a very small amplitude
and almost die away. (ii) The frequency of the oscillations increases with increasing
ratios, temperatures, and gas flow rates. (iii) The catalyst potential and the rate of CO2 production
exhibit synchronous oscillations while a decrease in catalyst potential always corresponds to an
increase in reaction rate.
Nonoscillatory electrochemical promotion of Rh/TiO2/YSZ is tied to the presence of the
TiO2 interlayer. Several of its advantages for EPOC were already cited above: it raises the cata-
lyst’s surface area and degree of dispersion (see the SEM analysis, section 4.1, Chapter 4), and it
depresses the exchange current density at the metal/gas interface (see Chapters 5 and 6). This is
also manifest in all figures of the present chapter in the overpotentials created at the Rh/TiO2/YSZ
interface, which at a given current are always larger than those created at the Rh/YSZ interface.
The third advantage of TiO2 is an enhanced stability of the reduced and highly active Rh phase,
which as shown in Chapter 7 is due to effects of SMSI established between Rh and TiO2. Over
and above the metal-support-promoted state of Rh/TiO2/YSZ, the catalytic activity is boosted fur-
ther by applied positive currents.
This is supported by Figure 8.15, where the temperature dependence of the critical
ratios for surface Rh2O3 formation observed in prior work with thick Rh films
(10 µm) [16, 17] (the triangles in Fig. 8.15 for thick films on YSZ, electropromoted or at open-cir-
cuit) are compared with those observed in the present work (thin films without and with TiO2
interlayers, circles and squares in Figure 8.15). It can be seen that TiO2 sublayers generally lead to
higher ratios, ie, destabilize the formation of Rh2O3. As already discussed in
detail, anodic polarization (electropromoted films) leads to even higher ratios,
PC2H4PO2
⁄
PC2H4PO2
⁄
PC2H4
PC2H4PO2
⁄
PO2PC2H4
⁄( )crit
PO2PC2H4
⁄( )crit
PO2PC2H4
⁄( )crit
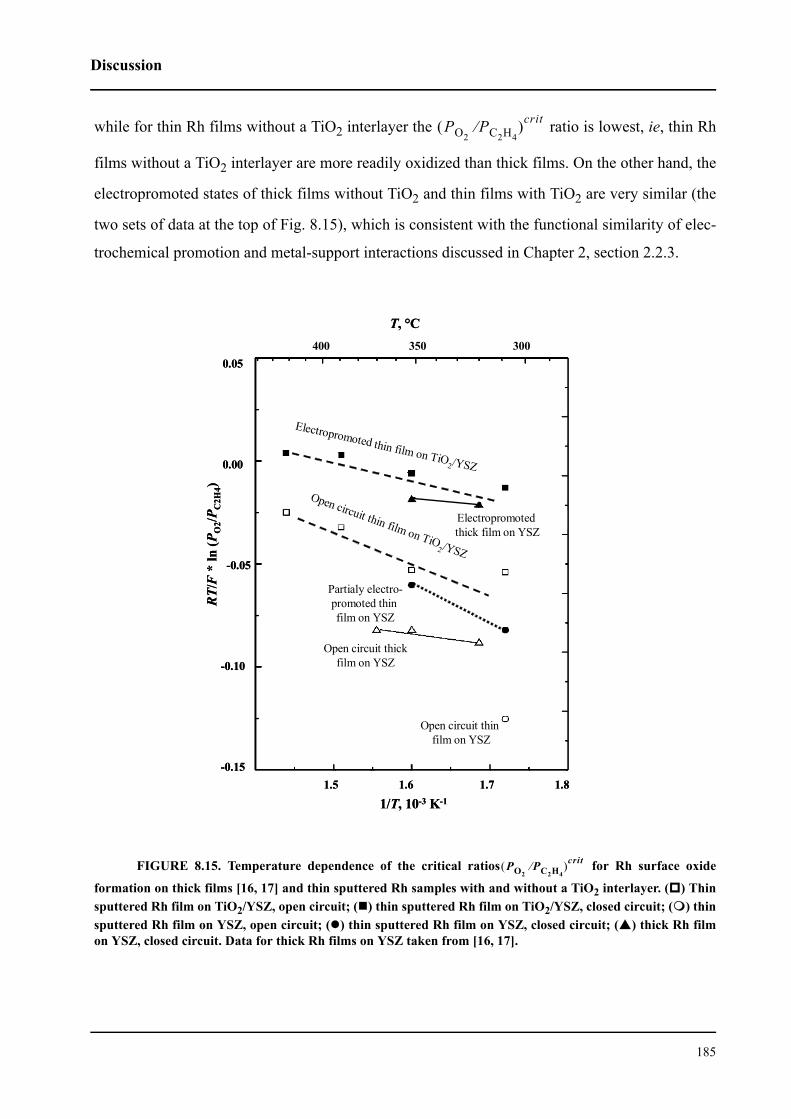
Discussion
185
while for thin Rh films without a TiO2 interlayer the ratio is lowest, ie, thin Rh
films without a TiO2 interlayer are more readily oxidized than thick films. On the other hand, the
electropromoted states of thick films without TiO2 and thin films with TiO2 are very similar (the
two sets of data at the top of Fig. 8.15), which is consistent with the functional similarity of elec-
trochemical promotion and metal-support interactions discussed in Chapter 2, section 2.2.3.
FIGURE 8.15. Temperature dependence of the critical ratios for Rh surface oxide
formation on thick films [16, 17] and thin sputtered Rh samples with and without a TiO2 interlayer. ( ) Thinsputtered Rh film on TiO2/YSZ, open circuit; ( ) thin sputtered Rh film on TiO2/YSZ, closed circuit; ( ) thinsputtered Rh film on YSZ, open circuit; ( ) thin sputtered Rh film on YSZ, closed circuit; ( ) thick Rh filmon YSZ, closed circuit. Data for thick Rh films on YSZ taken from [16, 17].
PO2PC2H4
⁄( )crit
Electropromoted thin film on TiO2/YSZ
Open circuit thin film on TiO2/YSZ
Electropromotedthick film on YSZ
Partialy electro-promoted thin film on YSZ
Open circuit thick film on YSZ
Open circuit thin film on YSZ
RT/
F*
ln(P
O2/P
C2H
4)
1/T, 10-3 K-1
T, °C
0.05
0.00
-0.05
-0.10
-0.151.5 1.6 1.7 1.8
400 350 300
PO2PC2H4
⁄( )crit
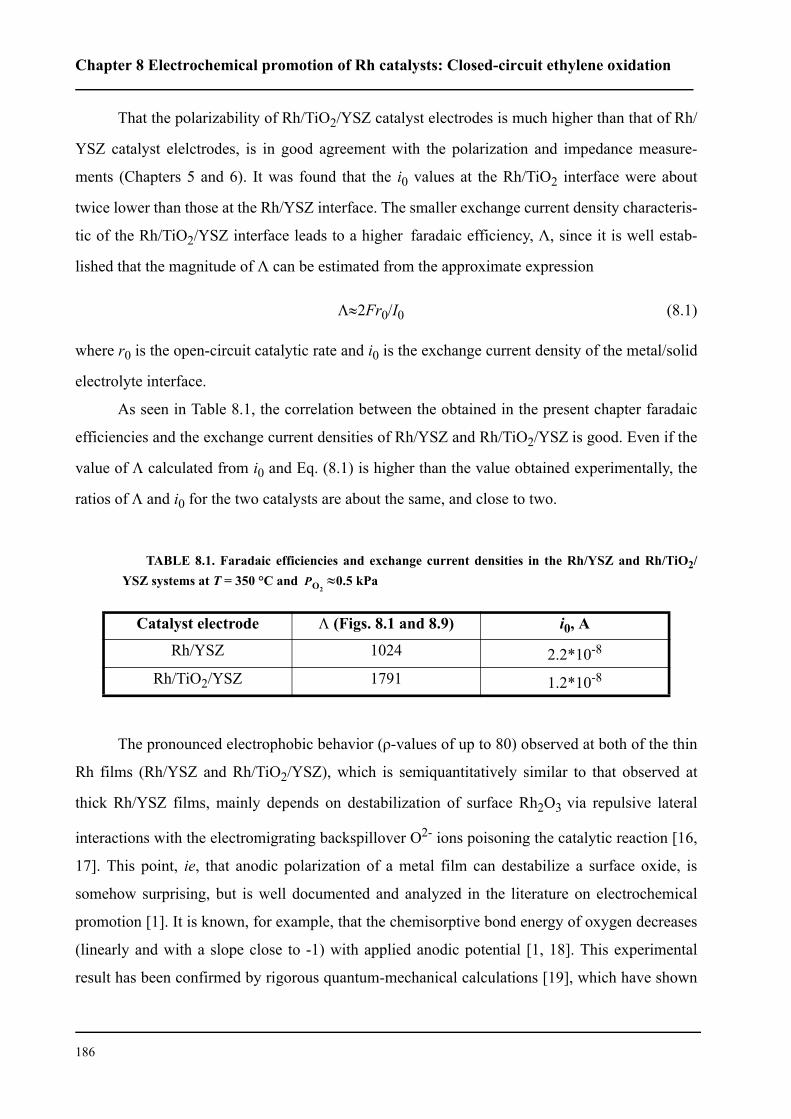
Chapter 8 Electrochemical promotion of Rh catalysts: Closed-circuit ethylene oxidation
186
That the polarizability of Rh/TiO2/YSZ catalyst electrodes is much higher than that of Rh/
YSZ catalyst elelctrodes, is in good agreement with the polarization and impedance measure-
ments (Chapters 5 and 6). It was found that the i0 values at the Rh/TiO2 interface were about
twice lower than those at the Rh/YSZ interface. The smaller exchange current density characteris-
tic of the Rh/TiO2/YSZ interface leads to a higher faradaic efficiency, Λ, since it is well estab-
lished that the magnitude of Λ can be estimated from the approximate expression
Λ≈2Fr0/Ι0 (8.1)
where r0 is the open-circuit catalytic rate and i0 is the exchange current density of the metal/solid
electrolyte interface.
As seen in Table 8.1, the correlation between the obtained in the present chapter faradaic
efficiencies and the exchange current densities of Rh/YSZ and Rh/TiO2/YSZ is good. Even if the
value of Λ calculated from i0 and Eq. (8.1) is higher than the value obtained experimentally, the
ratios of Λ and i0 for the two catalysts are about the same, and close to two.
The pronounced electrophobic behavior (ρ-values of up to 80) observed at both of the thin
Rh films (Rh/YSZ and Rh/TiO2/YSZ), which is semiquantitatively similar to that observed at
thick Rh/YSZ films, mainly depends on destabilization of surface Rh2O3 via repulsive lateral
interactions with the electromigrating backspillover O2- ions poisoning the catalytic reaction [16,
17]. This point, ie, that anodic polarization of a metal film can destabilize a surface oxide, is
somehow surprising, but is well documented and analyzed in the literature on electrochemical
promotion [1]. It is known, for example, that the chemisorptive bond energy of oxygen decreases
(linearly and with a slope close to -1) with applied anodic potential [1, 18]. This experimental
result has been confirmed by rigorous quantum-mechanical calculations [19], which have shown
TABLE 8.1. Faradaic efficiencies and exchange current densities in the Rh/YSZ and Rh/TiO2/YSZ systems at T = 350 °C and ≈0.5 kPa
Catalyst electrode Λ (Figs. 8.1 and 8.9) i0, A
Rh/YSZ 1024 2.2*10-8
Rh/TiO2/YSZ 1791 1.2*10-8
PO2
Conclusions
187
that Stark-type electrostatic interactions in the double layer present at the metal-gas interface are
the main cause of electrochemical (and also of chemical) promotion.
It should be pointed out, though, that the difference between Rh/YSZ films (where rate
oscillations occur) and Rh/TiO2/YSZ films (where rate oscillations do not occur over the parame-
ter range investigated) can be traced to the fact that in the latter case, due to the much lower
exchange current density at the Rh/TiO2/YSZ films and identical applied current densities, the
resulting potential is much higher than in the case of Rh/YSZ. This higher potential then destabi-
lizes the Rh surface oxide much more efficiently, and thus the surface remains reduced over a
wider range of gas compositions.
The results obtained in the present chapter demonstrate that it will be technically feasible to
induce electrochemical promotion at very thin (40 nm) catalyst films. The degree of Rh metal dis-
persion in these films is of the order of 10 %, as shown both in the present study and in similar
studies of NO reduction by propene in the presence of O2 on films similarly deposited [5]. This is
a very significant improvement with respect to metal dispersion relative to practically all prior
electrochemical promotion studies [1], an improvement which practically closes the gap of noble-
metal dispersion, and thus of noble-metal cost, between electrochemically promoted films and
commercial, nanodispersed noble-metal catalysts (where metal dispersion typically amounts to 10
- 100 % [20, 21]). Thus, the main obstacle to a commercial utilization of electrochemical promo-
tion has in principle been removed by these results.
8.5 Conclusions
The feasibility of electrochemical promotion of thin Rh films (40 nm) prepared by sputter-
ing has been demonstrated for the first time. The pronounced electrophobic electrochemical pro-
motion of C2H4 oxidation observed on the thin Rh films is similar to that observed with thick Rh
films. The electrochemical promotion of thin films having degrees of metal dispersion of the
order of 10 % is of considerable technological importance.
Small anodic currents applied to the Rh/YSZ catalyst cause periodic catalytic rate and
potential oscillations with a frequency that can be controlled electrochemically. The oscillations
can be interpreted in terms of the formation and decomposition of rhodium surface oxide: mini-
mum rates correspond to an oxidized Rh surface (Rh oxide), maximum rates to reduced Rh cata-
Chapter 8 Electrochemical promotion of Rh catalysts: Closed-circuit ethylene oxidation
188
lyst (Rh metal). The phenomenon observed is fully reversible, and only occurs under closed-
circuit conditions.
Catalysts Rh/TiO2/YSZ exhibit pronounced nonoscillatory electrochemical promotion,
their catalytic activity for C2H4 oxidation can be reversibly enhanced by up to a factor of 80 by
applying a positive anodic current or potential. The increase in oxidation rate is up to 2000 times
larger than the rate of supply of O2- to the Rh catalyst electrode.
The electrochemical promotion behavior observed in the two catalytic systems is due to
anodically controlled migration (backspillover) of O2- species from YSZ to the Rh/gas interface
and to the concomitant destabilization of surface Rh2O3 formation via repulsive lateral interac-
tions.
8.6 References
1. C. G. Vayenas, S. Bebelis, C. Pliangos, S. Brosda, and D. Tsiplakides, Electro-
chemical activation of catalysis. Promotion, Electrochemical promotion, and
metal-support interaction. Kluwer Academic/Plenum Publishers, New York
(2001).
2. A. Wieckowski, E. R. Savinova, and C. G. Vayenas, Catalysis and Electrocatalysis
at Nanoparticles Marcel Dekker, Inc., New York (2003).
3. C. G. Yiokari, G. E. Pitselis, D. G. Polydoros, A. Katsaounis, and C. G. Vayenas, J.
Phys. Chem., 104 (2000) 10600.
4. I. M. Petrushina, V. A. Bandur, F. Cappeln, and N. J. Bjerrum, J. Electrochem. Soc,
147(8) (2000) 3010.
5. S. Balamenou, D. Tsiplakides, A. Katsaounis, S. Thiemann-Handler, B. Cramer, G.
Fóti, C. Comninellis, and C. G. Vayenas, Applied Catalysis B: Environmental, 52
(2004) 181.
6. C. G. Vayenas, C. Georgakis, J. N. Michaels, and J. Tormo, J. Catal., 67 (1981) 348
7. C. G. Vayenas, S. Bebelis, and S. Ladas, Nature, 323 (1990) 625.
8. C. G. Vayenas, S. Bebelis, S. G. Neophytides, and I. V. Yentekakis, Nature, 343
(1990) 625.
9. M. M. Slin'ko and N. I. Jaeger, in Studies in Surface Science and Catalysis, Vol. 86
B. Delmon and J. T. Yates, eds., Elsevier, Amsterdam, (1994).
References
189
10. C. G. Vayenas, B. Lee, and J. N. Michaels, J. Catal., 66 (1980) 37
11. I. V. Yentekakis and C. G. Vayenas, J. Catal., 111 (1988) 170
12. A. K. Galwey, P. Gray, J. F. Griffiths, and S. M. Hasko, Nature, 313 (1985) 668.
13. T. Lamb, R. P. Scott, P. Watts, B. Holland, S. Gentry, and A. Jones, J.Chem.Soc.
Chem.Commun., 23 (1977) 882.
14. R. C. Yeates, J. E. Turner, A. J. Gellman, and G. A. Somoriai, Surface Sci., 149
(1985) 175.
15. K. E. Keck and B. Kasemo, Surface Sci., 167 (1986) 313.
16. C. Pliangos, I. V. Yentekakis, V. G. Papadakis, C. G. Vayenas, and X. E. Verykios,
Applied Catalysis B: Environmental, 14 (1997) 161.
17. C. Pliangos, I. V. Yentekakis, X. E. Verykios, and C. G. Vayenas, J. Catal., 154
(1995) 124.
18. C. G. Vayenas, S. Brosda, and C. Pliangos, J. Catal., 203 (2001) 329.
19. C. Sanchez and E. Leiva, in Handbook of Fuel Cells: Fundamentals, Thechnology
and applications, Vol. 2 W. Vielstich, H. A. Gasteiger, and A. Lamm, eds., John
Wiley & Sons, Ltd, England, (2003).
20. L. L. Hegedus, R. Aris, A. T. Bell, M. Boudart, N. Y. Chen, B. C. Gates, W. O.
Haag, G. A. Somorjari, and J. Wei, Catalyst design: Progress and Perspectives.
John & sons, New York (1987).
21. G. Ertl, H. Knötzinger, and J. Weitkamp, Hand Book of Catalysis VCH, Weinheim
(1997).

191
CHAPTER 9 Promotion of Rh catalysts: Partial
methane oxidation at open and closed circuit
The catalytic activity of Rh for the partial oxidation of methane to syngas
can be markedly influenced by interfacing polycrystalline Rh films with a
dispersed TiO2 interlayer deposited on the YSZ supports. High CO selectiv-
ities (close to 97 %) can be attained at 550 °C over a wide range of CH4/O2
ratios. The modification of catalytic activity and selectivity towards CO and
H2 production observed at Rh interfaced with an interlayer of TiO2 is
related to the lower stability of Rh surface oxide against reduction to metal-
lic Rh. This phenomenon may be interpreted, either by strong electronic-
type metal-support interactions or by a self-driven wireless electrochemical
promotion mechanism. The Rh/TiO2/YSZ catalyst exhibits the particular
characteristic of having two distinct stable states, an inactive (oxidized) and
an active (metallic) state, in the partial oxidation of methane to syngas. At a
gas composition close to stoichiometric (CH4 : O2 = 2 : 1) and 550 °C, the
inactive Rh/TiO2/YSZ catalyst was successfully activated by applying cur-
rents, either positive or negative. The phenomenon observed is an example
of “permanent electrochemical promotion” providing a permanent rate
enhancement ratio of 11 and a CO selectivity of 45 %. The activation by
Chapter 9 Promotion of Rh catalysts: Partial methane oxidation at open and closed circuit
192
negative currents is explained by electrochemical reduction of rhodium
surface oxide, while in the instance of applied positive currents the
rhodium surface oxide breaks down due to a weakening of the Rh-O
bond strength which occurs due to the accumulation of backspillover
oxygen at the gas-exposed catalyst surface.
9.1 Introduction
Over the last decade, many efforts have been made to improve the catalytic partial oxida-
tion of CH4 with oxygen, and achieve syngas formation according to Eq. (9.1) [1, 2]:
(9.1)
This process has some advantages over conventional steam reforming, namely: it is more
energy-efficient and can produce the H2/CO mole ratio of two (instead of three in steam reform-
ing) that is desired for methanol or Fischer-Tropsch synthesis. However, this reaction has not yet
been developed on an industrial scale due to problems related to catalyst deactivation, mainly by
carbon deposition and/or oxidation of the catalyst to the corresponding oxide.
Prettre et al [3] were among the first to report the formation of syngas by partial oxidation
of CH4 with supported Ni catalysts over the temperature range from 973 to 1173 K. The reaction
was reported to occur in two steps. In the first step, methane is converted to CO2 and water until
all oxygen has been converted according to Eq. (9.2):
(9.2)
In the second step, syngas is produced via secondary reactions such as the carbon dioxide
reaction Eq. (9.3) and the steam-reforming reaction Eq. (9.4):
(9.3)
(9.4)
It is generally agreed that the type of catalyst used may strongly influence the reaction
pathway. It has in fact been reported that on Rh catalysts the partial oxidation of methane to CO
CH412---O2 CO 2H2+→+
CH4 2O2 CO2 2H2O+→+
CH4 CO2 2CO 2H2+→+
CH4 H2O CO 3H2+→+
Experimental
193
and H2 occurs in a single step (Eq. (9.1)) without the formation of intermediate CO2 [4], just as
had been the case on Ni catalysts [3].
More recent studies have demonstrated that Rh is one of the most promising catalysts for
the partial oxidation of methane, because it offers the highest selectivity toward H2 production
[4]. However, problems related to Rh catalyst deactivation, mainly due to carbon deposition and/
or Rh oxidation to Rh2O3, have not yet been completely resolved.
It is the aim of the work reported in this chapter to investigate a modification of catalytic
activity and improved stability against deactivation of Rh catalysts for the partial oxidation of
methane that is achieved by interfacing the Rh catalyst with TiO2 particles supported on YSZ
solid electrolyte (Rh/TiO2/YSZ). In the first part of this chapter the promoting effects of TiO2 will
be studied under open-circuit conditions, where the YSZ support is not considered to play any
role in the observed phenomena but is used to enable potential measurements. The results will be
discussed in terms of strong metal-support interactions (SMSI) [5] and of electrochemical promo-
tion of catalysis (NEMCA) [6].
In the second part of this chapter, investigations of the same systems under closed-circuit
conditions are described. It was the aim of this part to explore the possibilities of a current-
assisted activation of Rh/TiO2/YSZ catalysts for a selective oxidation of methane with oxygen to
CO and H2.
9.2 Experimental
The ring-type electrochemical cell used in the present work has been described in detail
earlier (Chapter 3, section 3.2). The catalyst film was deposited on the inner surface, the gold
counterelectrode on the outer surface of an YSZ ring. The catalyst was prepared by paste deposi-
tion (see Chapter 3, section 3.2.3). The experimental setup was described in Chapter 3, section
3.3.5. Currents or potentials were applied in a direct polarization mode where the catalyst served
as the working electrode, and the gold film served as the counterelectrode.
The selectivity, S(CO), of methane oxidation to CO was calculated with the following
equation:
(9.5)S CO( )rCO
rCO rCO2+
--------------------------=
Chapter 9 Promotion of Rh catalysts: Partial methane oxidation at open and closed circuit
194
where rCO and rCO2 are the rates of CO and CO2 product formation.
9.3 Results
9.3.1 Promotion of Rh catalysts by a TiO2 interlayer [7]
The catalytic activity of Rh/YSZ and Rh/TiO2/YSZ catalysts was investigated by a cyclic
variation of the mole ratios of CH4 and O2 in the feed, which started from the maximum ratio of
39 : 1, went down to a minimum value of 1 : 2 in the forward run, and then returned from this
minimum to the maximum value of 39 : 1 in the reverse run [7]. All measurements were made
under stationary conditions; the typical waiting time after any change in inlet composition was 20
to 30 min. A typical example of the results obtained at 550 °C is reported in Figure 9.1. This fig-
ure shows that a freshly prepared Rh/YSZ catalyst is active toward partial CH4 oxidation at a
methane/oxygen mole ratio of 39 : 1 (Fig. 9.1, left-hand parts). However, in the forward run (from
the ratio of 39 : 1 to a ratio of 1 : 2) the catalytic activity of Rh/YSZ towards CO production
decreases rapidly, and falls to almost zero at a CH4/O2 mole ratio of about three. In the reverse
run, when the CH4/O2 ratio increases from 1 : 2 to 39 : 1, the specific reaction rate of CO forma-
tion remains almost zero while the rate of CO2 formation slightly increases with increasing CH4/
O2 mole ratios.
A completely different behavior was observed during partial methane oxidation with the
Rh catalysts interfaced with TiO2 (Fig. 9.1, right-hand parts). In this case both the forward and
reverse runs are characterized by high catalytic activity towards CO and H2 formation. In the for-
ward run on Rh/TiO2/YSZ, the specific rate of CO2 production increases with decreasing CH4/O2
mole ratios, and reaches a maximum value when CH4 : O2 = 1 : 1, while at this gas composition
the production of CO has almost completely ceased. Also, the reverse run on Rh/TiO2/YSZ is
characterized by a smaller rate of CO2 formation and a higher catalytic activity towards CO for-
mation than observed in the forward run.
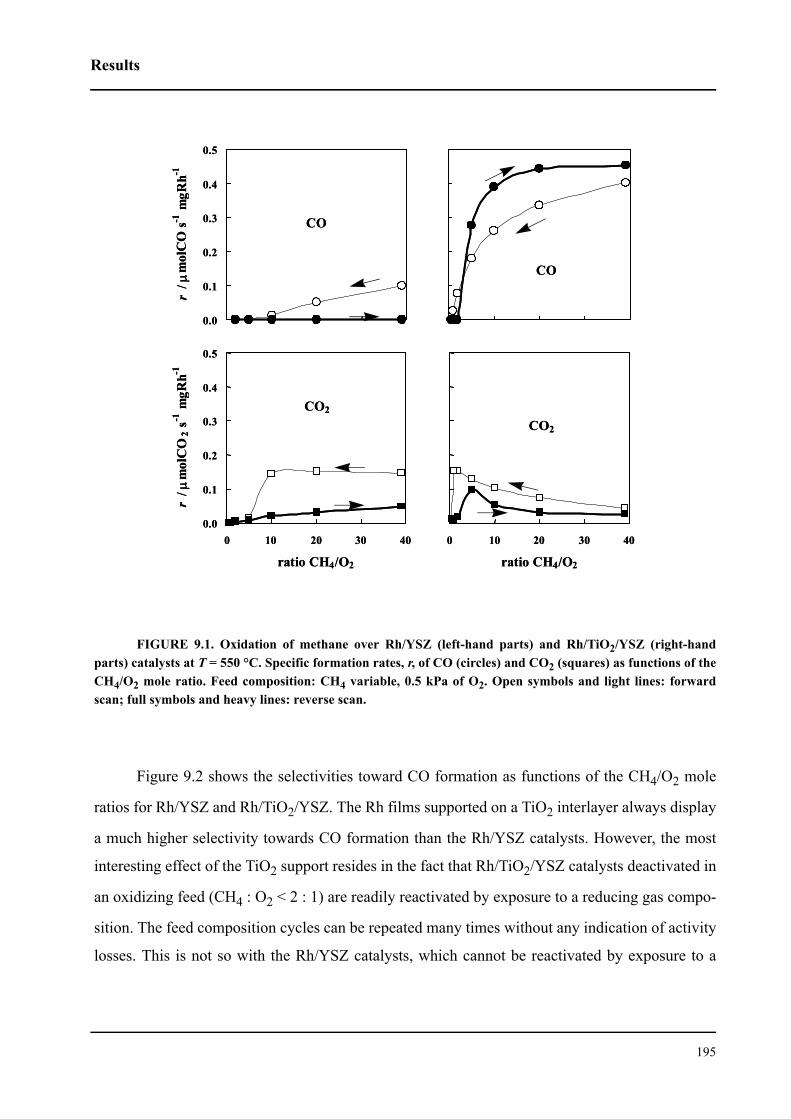
Results
195
FIGURE 9.1. Oxidation of methane over Rh/YSZ (left-hand parts) and Rh/TiO2/YSZ (right-handparts) catalysts at T = 550 °C. Specific formation rates, r, of CO (circles) and CO2 (squares) as functions of theCH4/O2 mole ratio. Feed composition: CH4 variable, 0.5 kPa of O2. Open symbols and light lines: forwardscan; full symbols and heavy lines: reverse scan.
Figure 9.2 shows the selectivities toward CO formation as functions of the CH4/O2 mole
ratios for Rh/YSZ and Rh/TiO2/YSZ. The Rh films supported on a TiO2 interlayer always display
a much higher selectivity towards CO formation than the Rh/YSZ catalysts. However, the most
interesting effect of the TiO2 support resides in the fact that Rh/TiO2/YSZ catalysts deactivated in
an oxidizing feed (CH4 : O2 < 2 : 1) are readily reactivated by exposure to a reducing gas compo-
sition. The feed composition cycles can be repeated many times without any indication of activity
losses. This is not so with the Rh/YSZ catalysts, which cannot be reactivated by exposure to a
CO
0 10 20 30 40
ratio CH4/O2
CO2
0.0
0.1
0.2
0.3
0.4
0.5
r/ µ
mol
CO
s-1m
gRh-1
CO
0.0
0.1
0.2
0.3
0.4
0.5
0 10 20 30 40
ratio CH4/O2
r/ µ
mol
CO
2s-1
mgR
h-1
CO2
CO
0 10 20 30 40
ratio CH4/O2
CO2
0.0
0.1
0.2
0.3
0.4
0.5
r/ µ
mol
CO
s-1m
gRh-1
CO
0.0
0.1
0.2
0.3
0.4
0.5
0 10 20 30 40
ratio CH4/O2
r/ µ
mol
CO
2s-1
mgR
h-1
CO2
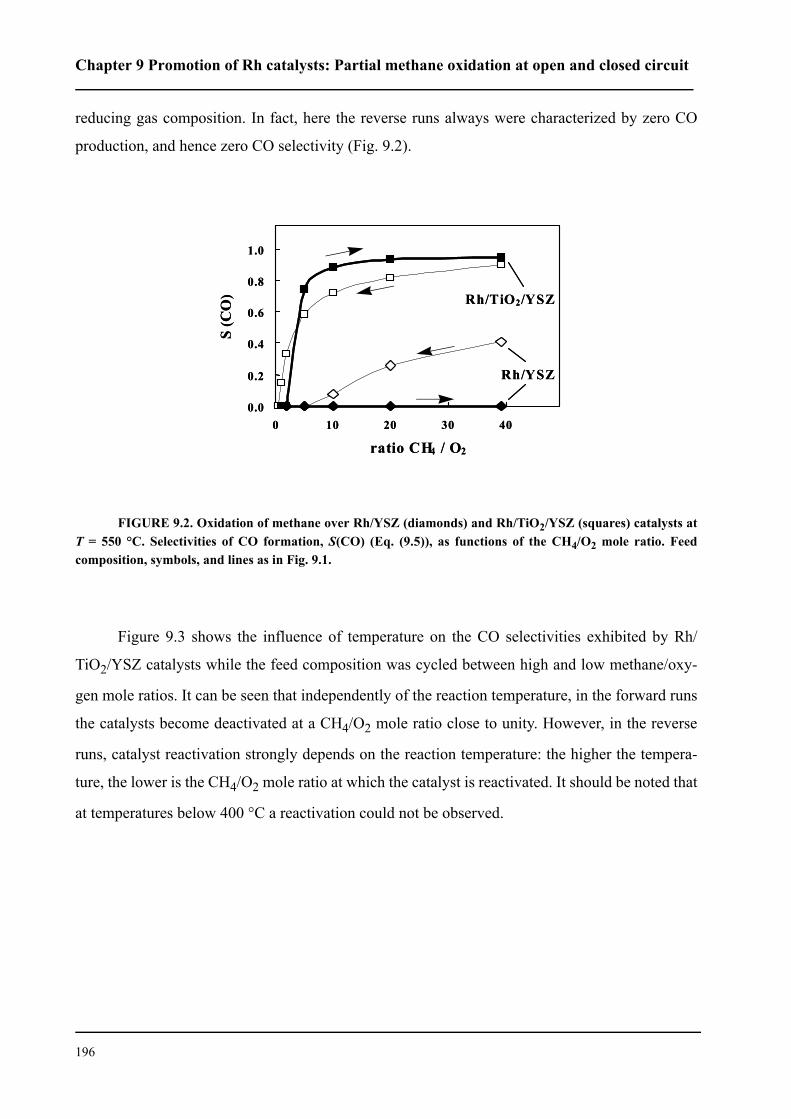
Chapter 9 Promotion of Rh catalysts: Partial methane oxidation at open and closed circuit
196
reducing gas composition. In fact, here the reverse runs always were characterized by zero CO
production, and hence zero CO selectivity (Fig. 9.2).
FIGURE 9.2. Oxidation of methane over Rh/YSZ (diamonds) and Rh/TiO2/YSZ (squares) catalysts atT = 550 °C. Selectivities of CO formation, S(CO) (Eq. (9.5)), as functions of the CH4/O2 mole ratio. Feedcomposition, symbols, and lines as in Fig. 9.1.
Figure 9.3 shows the influence of temperature on the CO selectivities exhibited by Rh/
TiO2/YSZ catalysts while the feed composition was cycled between high and low methane/oxy-
gen mole ratios. It can be seen that independently of the reaction temperature, in the forward runs
the catalysts become deactivated at a CH4/O2 mole ratio close to unity. However, in the reverse
runs, catalyst reactivation strongly depends on the reaction temperature: the higher the tempera-
ture, the lower is the CH4/O2 mole ratio at which the catalyst is reactivated. It should be noted that
at temperatures below 400 °C a reactivation could not be observed.
0.0
0.2
0.4
0.6
0.8
1.0
0 10 20 30 40
ratio CH4 / O2
S (C
O) Rh/TiO2/YSZ
Rh/YSZ
0.0
0.2
0.4
0.6
0.8
1.0
0 10 20 30 40
ratio CH4 / O2
S (C
O) Rh/TiO2/YSZ
Rh/YSZ
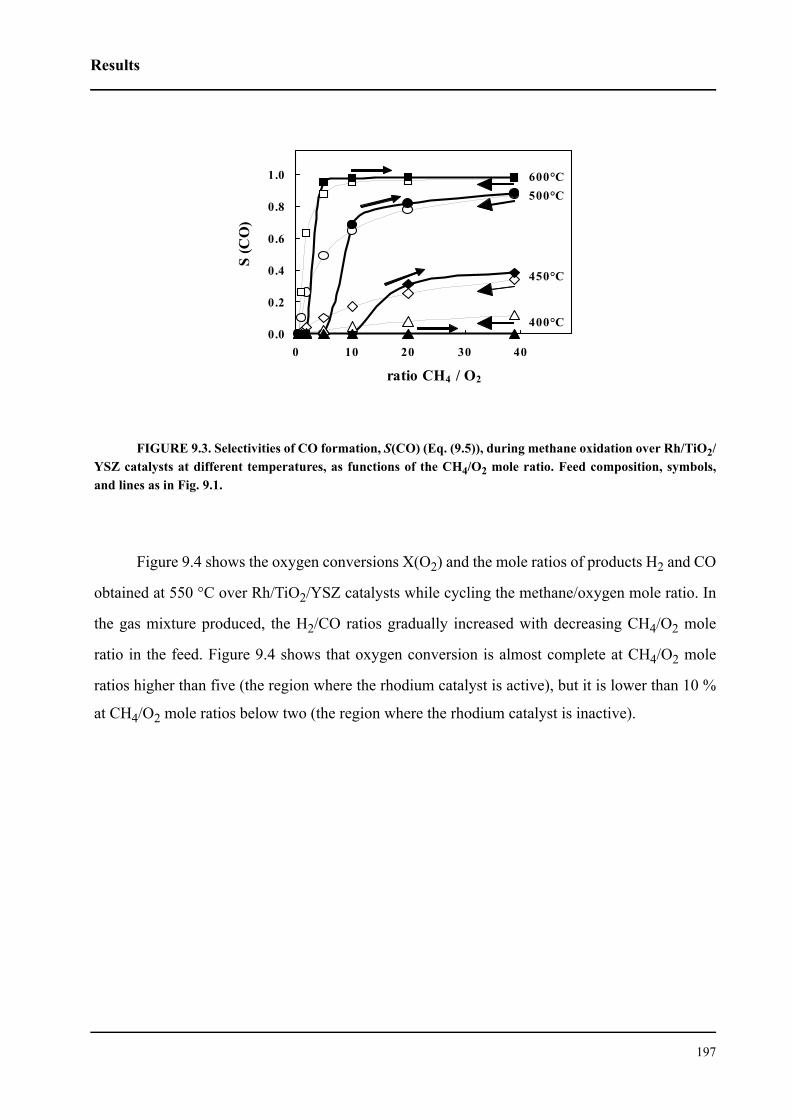
Results
197
FIGURE 9.3. Selectivities of CO formation, S(CO) (Eq. (9.5)), during methane oxidation over Rh/TiO2/YSZ catalysts at different temperatures, as functions of the CH4/O2 mole ratio. Feed composition, symbols,and lines as in Fig. 9.1.
Figure 9.4 shows the oxygen conversions X(O2) and the mole ratios of products H2 and CO
obtained at 550 °C over Rh/TiO2/YSZ catalysts while cycling the methane/oxygen mole ratio. In
the gas mixture produced, the H2/CO ratios gradually increased with decreasing CH4/O2 mole
ratio in the feed. Figure 9.4 shows that oxygen conversion is almost complete at CH4/O2 mole
ratios higher than five (the region where the rhodium catalyst is active), but it is lower than 10 %
at CH4/O2 mole ratios below two (the region where the rhodium catalyst is inactive).
0.0
0.2
0.4
0.6
0.8
1.0
0 10 20 30 40
ratio CH4 / O2
S (C
O)
600°C
450°C
500°C
400°C
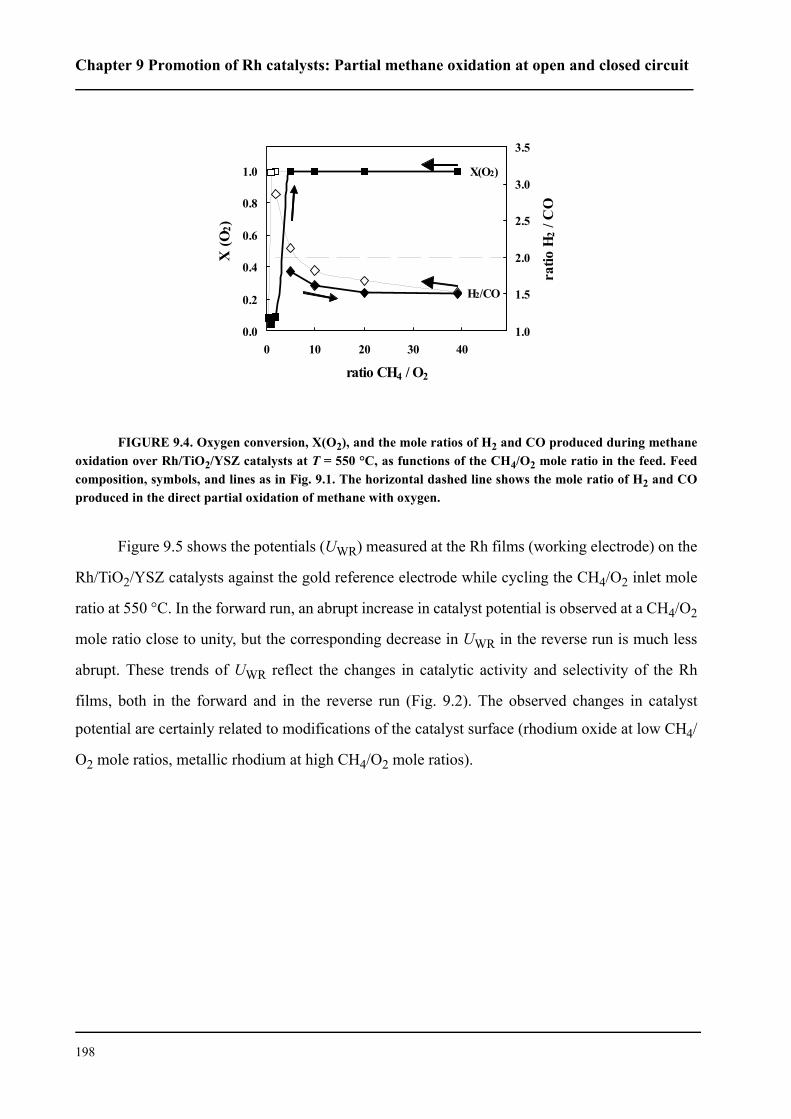
Chapter 9 Promotion of Rh catalysts: Partial methane oxidation at open and closed circuit
198
FIGURE 9.4. Oxygen conversion, X(O2), and the mole ratios of H2 and CO produced during methaneoxidation over Rh/TiO2/YSZ catalysts at T = 550 °C, as functions of the CH4/O2 mole ratio in the feed. Feedcomposition, symbols, and lines as in Fig. 9.1. The horizontal dashed line shows the mole ratio of H2 and COproduced in the direct partial oxidation of methane with oxygen.
Figure 9.5 shows the potentials (UWR) measured at the Rh films (working electrode) on the
Rh/TiO2/YSZ catalysts against the gold reference electrode while cycling the CH4/O2 inlet mole
ratio at 550 °C. In the forward run, an abrupt increase in catalyst potential is observed at a CH4/O2
mole ratio close to unity, but the corresponding decrease in UWR in the reverse run is much less
abrupt. These trends of UWR reflect the changes in catalytic activity and selectivity of the Rh
films, both in the forward and in the reverse run (Fig. 9.2). The observed changes in catalyst
potential are certainly related to modifications of the catalyst surface (rhodium oxide at low CH4/
O2 mole ratios, metallic rhodium at high CH4/O2 mole ratios).
0.0
0.2
0.4
0.6
0.8
1.0
0 10 20 30 40
ratio CH4 / O2
X (O
2)
1.0
1.5
2.0
2.5
3.0
3.5
ratio
H2 /
CO
X(O2)
H2/CO
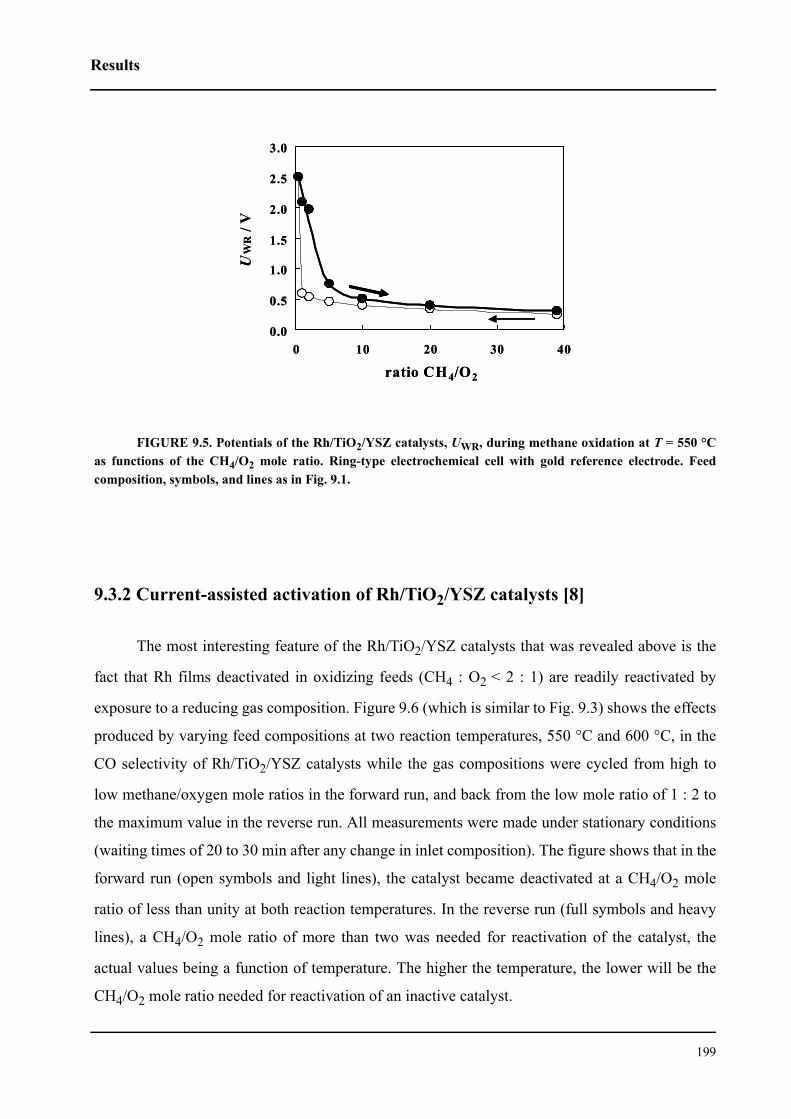
Results
199
FIGURE 9.5. Potentials of the Rh/TiO2/YSZ catalysts, UWR, during methane oxidation at T = 550 °Cas functions of the CH4/O2 mole ratio. Ring-type electrochemical cell with gold reference electrode. Feedcomposition, symbols, and lines as in Fig. 9.1.
9.3.2 Current-assisted activation of Rh/TiO2/YSZ catalysts [8]
The most interesting feature of the Rh/TiO2/YSZ catalysts that was revealed above is the
fact that Rh films deactivated in oxidizing feeds (CH4 : O2 < 2 : 1) are readily reactivated by
exposure to a reducing gas composition. Figure 9.6 (which is similar to Fig. 9.3) shows the effects
produced by varying feed compositions at two reaction temperatures, 550 °C and 600 °C, in the
CO selectivity of Rh/TiO2/YSZ catalysts while the gas compositions were cycled from high to
low methane/oxygen mole ratios in the forward run, and back from the low mole ratio of 1 : 2 to
the maximum value in the reverse run. All measurements were made under stationary conditions
(waiting times of 20 to 30 min after any change in inlet composition). The figure shows that in the
forward run (open symbols and light lines), the catalyst became deactivated at a CH4/O2 mole
ratio of less than unity at both reaction temperatures. In the reverse run (full symbols and heavy
lines), a CH4/O2 mole ratio of more than two was needed for reactivation of the catalyst, the
actual values being a function of temperature. The higher the temperature, the lower will be the
CH4/O2 mole ratio needed for reactivation of an inactive catalyst.
0.0
0.5
1.0
1.5
2.0
2.5
3.0
0 10 20 30 40
ratio CH4/O2
UW
R/ V
0.0
0.5
1.0
1.5
2.0
2.5
3.0
0 10 20 30 40
ratio CH4/O2
UW
R/ V
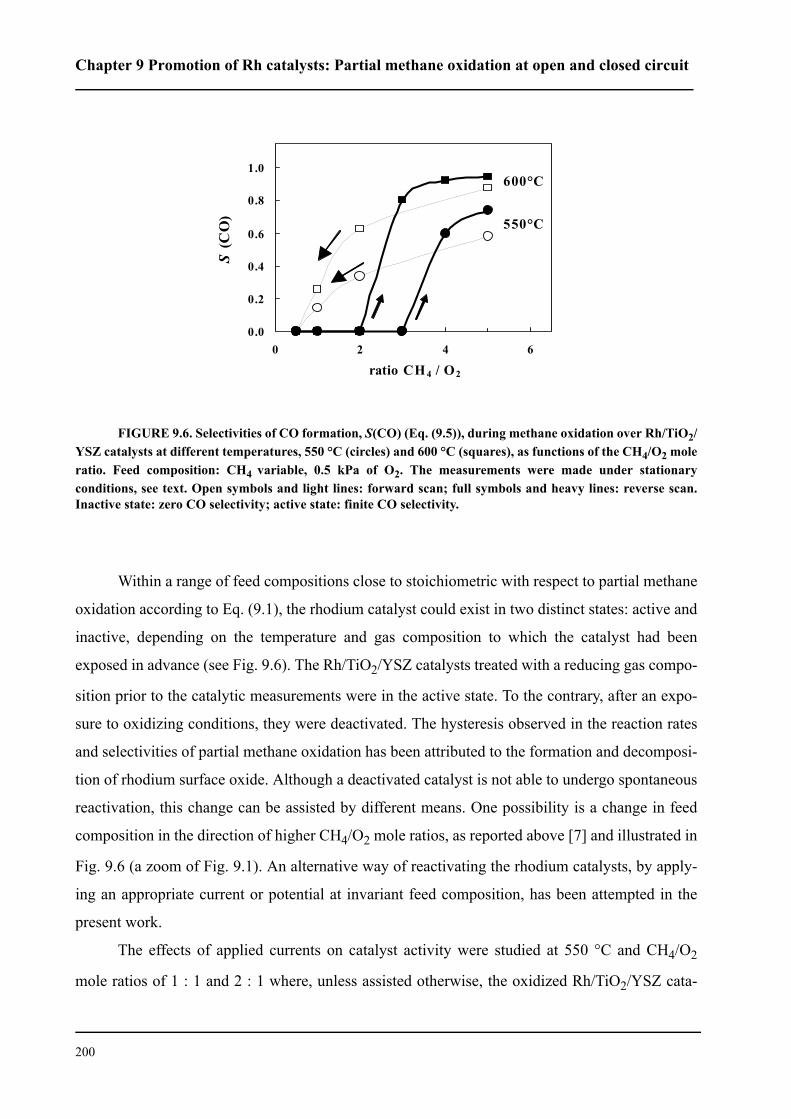
Chapter 9 Promotion of Rh catalysts: Partial methane oxidation at open and closed circuit
200
FIGURE 9.6. Selectivities of CO formation, S(CO) (Eq. (9.5)), during methane oxidation over Rh/TiO2/YSZ catalysts at different temperatures, 550 °C (circles) and 600 °C (squares), as functions of the CH4/O2 moleratio. Feed composition: CH4 variable, 0.5 kPa of O2. The measurements were made under stationaryconditions, see text. Open symbols and light lines: forward scan; full symbols and heavy lines: reverse scan.Inactive state: zero CO selectivity; active state: finite CO selectivity.
Within a range of feed compositions close to stoichiometric with respect to partial methane
oxidation according to Eq. (9.1), the rhodium catalyst could exist in two distinct states: active and
inactive, depending on the temperature and gas composition to which the catalyst had been
exposed in advance (see Fig. 9.6). The Rh/TiO2/YSZ catalysts treated with a reducing gas compo-
sition prior to the catalytic measurements were in the active state. To the contrary, after an expo-
sure to oxidizing conditions, they were deactivated. The hysteresis observed in the reaction rates
and selectivities of partial methane oxidation has been attributed to the formation and decomposi-
tion of rhodium surface oxide. Although a deactivated catalyst is not able to undergo spontaneous
reactivation, this change can be assisted by different means. One possibility is a change in feed
composition in the direction of higher CH4/O2 mole ratios, as reported above [7] and illustrated in
Fig. 9.6 (a zoom of Fig. 9.1). An alternative way of reactivating the rhodium catalysts, by apply-
ing an appropriate current or potential at invariant feed composition, has been attempted in the
present work.
The effects of applied currents on catalyst activity were studied at 550 °C and CH4/O2
mole ratios of 1 : 1 and 2 : 1 where, unless assisted otherwise, the oxidized Rh/TiO2/YSZ cata-
0.0
0.2
0.4
0.6
0.8
1.0
0 2 4 6
ratio CH4 / O2
S (C
O)
600°C
550°C
Results
201
lysts will remain inactive, which implies zero CO production and very low CO2 production. Fig-
ure 9.7 illustrates the reactivation of a Rh/TiO2/YSZ catalyst achieved when applying a negative
current while using stoichiometric gas feeds of CH4 : O2 = 2 : 1 (1 and 0.5 kPa, respectively). It
shows in Part A the applied current density, i; in Part B the cell potential, UWC; in Part C the spe-
cific reaction rates of CO2 formation, rCO2; and in Part D the specific reaction rates of CO pro-
duction, rCO, all as functions of time. At the outset the oxidized catalyst was inactive, and
exhibited a very low rate of CO2 formation and zero CO production under open-circuit conditions
(i = 0). Upon applying a negative (cathodic) current, the rate of CO2 formation gradually
increased during the first few minutes until a critical state was reached where the CO2 production
suddenly increased, the catalyst’s potential dropped, and a significant rate of CO production
appeared which was attended by complete O2 conversion (active catalyst state). No activation
was observed within several hours when the applied negative current density was lower than 0.7
mA/cm2 (curves (a) in Fig. 9.7). With an applied current density of 0.7 mA/cm2, reactivation
occurred after 33 minutes (curves (b) in Fig. 9.7), while at current densities in the range of 0.75 to
0.85 mA/cm2 it occurred within a reasonably short time of 3 to 6 minutes (curves (c) in Fig. 9.7).
Thus, the higher the current density, the shorter will be the time required for reactivation of the
catalyst.
The same experiments were repeated with applied positive (anodic) currents, and gave
similar results that are shown in Fig. 9.8 summarizing the observations in terms of i-U curves.
At an oxidizing feed ratio of CH4 : O2 = 1 : 1, an analogous behavior was recorded when
negative or positive currents were applied but, in this case, currents an order of magnitude higher
were required for reactivation than at a 2 : 1 feed ratio.
The observed differences in the specific rates of CO2 and CO formation between open and
closed-circuit operation cannot be attributed to the phenomenon of reversible electrochemical
promotion, since no relaxation of the CO2 and CO production could be observed after an interup-
tion of the current in the active state (curves (b) and (c) in Fig. 9.7).
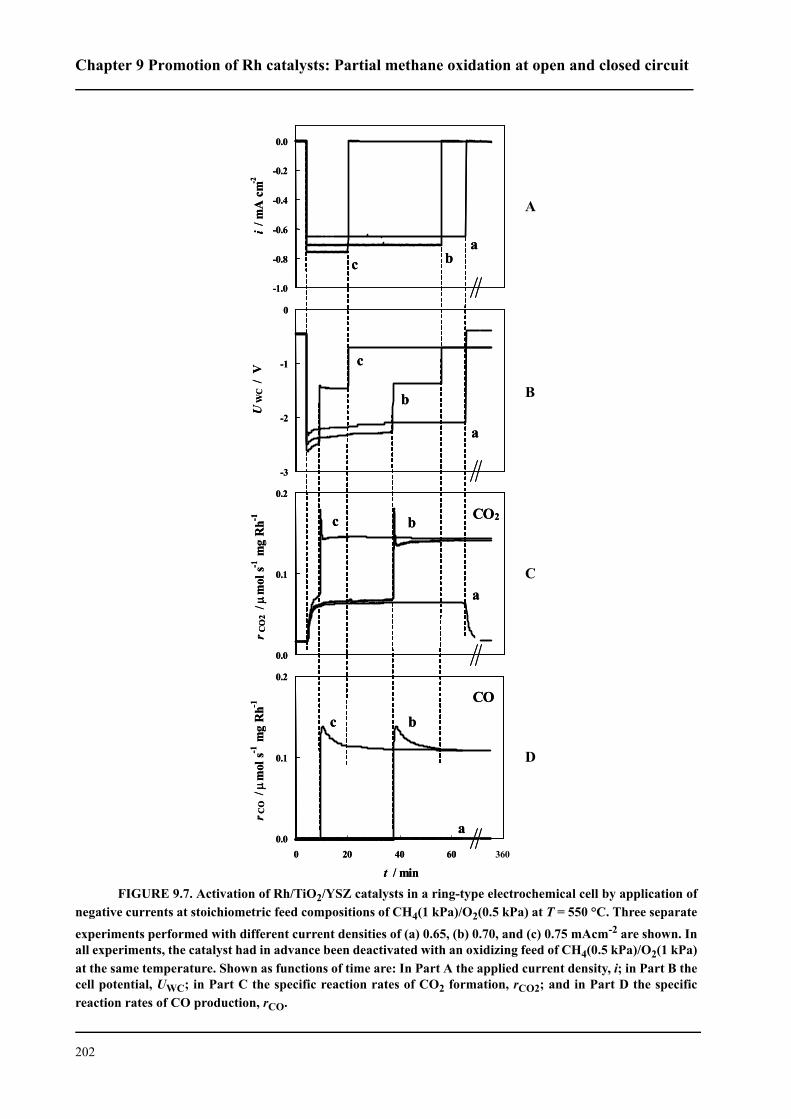
Chapter 9 Promotion of Rh catalysts: Partial methane oxidation at open and closed circuit
202
FIGURE 9.7. Activation of Rh/TiO2/YSZ catalysts in a ring-type electrochemical cell by application ofnegative currents at stoichiometric feed compositions of CH4(1 kPa)/O2(0.5 kPa) at T = 550 °C. Three separate
experiments performed with different current densities of (a) 0.65, (b) 0.70, and (c) 0.75 mAcm-2 are shown. Inall experiments, the catalyst had in advance been deactivated with an oxidizing feed of CH4(0.5 kPa)/O2(1 kPa)at the same temperature. Shown as functions of time are: In Part A the applied current density, i; in Part B thecell potential, UWC; in Part C the specific reaction rates of CO2 formation, rCO2; and in Part D the specificreaction rates of CO production, rCO.
0.0
0.1
0.2
r CO
2/ µ
mol
s-1m
g R
h-1 CO2
a
bc
-1.0
-0.8
-0.6
-0.4
-0.2
0.0
i/ m
Acm
-2a
bc
-3
-2
-1
0
UW
C/
V
a
b
c
0.0
0.1
0.2
0 20 40 60 80
t / min
r CO
/ µm
ol s-1
mg
Rh-1
a
bc
360
CO
A
B
C
D
0.0
0.1
0.2
r CO
2/ µ
mol
s-1m
g R
h-1 CO2
a
bc
-1.0
-0.8
-0.6
-0.4
-0.2
0.0
i/ m
Acm
-2a
bc
-3
-2
-1
0
UW
C/
V
a
b
c
0.0
0.1
0.2
0 20 40 60 80
t / min
r CO
/ µm
ol s-1
mg
Rh-1
a
bc
360
CO
A
B
C
D
Results
203
Similarly to the case where activation/deactivation was induced by changing feed composi-
tion (Fig. 9.6), the catalyst exhibited two distinct (and stable) open-circuit behaviors: prior to
application of the current, it was inactive (stable inactive state), but once reactivated due to an
applied current, the catalyst indefinitely maintained the high activity acquired, even after an inter-
ruption of the current.
The phenomena are reminiscent of the effects of permanent electrochemical promotion
reported for IrO2 and Rh catalysts [9-12]. After successful reactivation (curves (b) and (c) in Fig.
9.7), an interruption of the current only affects the cell potential, which is shifted to an open-cir-
cuit value (reduced catalyst) that is more negative than its value at the inactive (oxidized) catalyst,
either prior to reactivation or after an unsuccessful attempt of reactivation with a current that was
too low (curve (a) in Fig. 9.7, Part B). This pattern of behavior is equally valid for negative and
positive activation currents, and leads to identical shifts of the open-circuit potential regardless of
the sign of the applied current.
Figure 9.8 summarizes in terms of i-U curves the results obtained for the reactivation of
oxidized Rh/TiO2/YSZ catalysts by application of a negative or positive current at a CH4/O2 mole
ratio of 2 : 1 (stoichiometric feed). Two steady-state i-U curves are shown, one for rhodium oxide
(inactive state) and one for Rh metal (active state), the former of course ending at the minimum
current densities required to achieve reactivation. In fact, the system jumped from one curve to
the other when the critical reactivation current was attained under given conditions, the jumps
indicating decomposition of the rhodium surface oxide to Rh metal. Figure 9.8 nicely illustrates
that positive and negative currents were equally efficient for reactivation, except that the negative
current required to reactivate an inactive Rh/TiO2/YSZ catalyst was smaller than the correspond-
ing positive current. Since the changes in catalytic activity of the Rh/TiO2/YSZ catalysts have
been attributed to oxidation and reduction of the rhodium films, it is concluded that the reduction
of rhodium surface oxide is stimulated, both by positive and by negative currents.
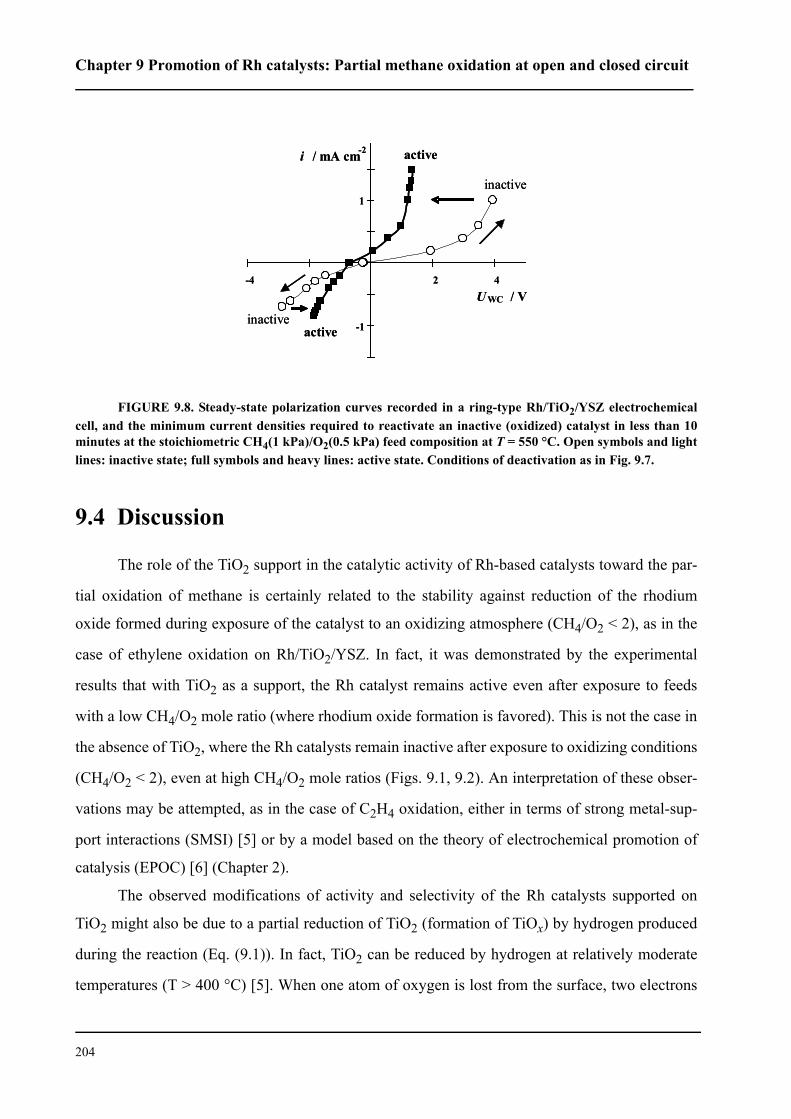
Chapter 9 Promotion of Rh catalysts: Partial methane oxidation at open and closed circuit
204
FIGURE 9.8. Steady-state polarization curves recorded in a ring-type Rh/TiO2/YSZ electrochemicalcell, and the minimum current densities required to reactivate an inactive (oxidized) catalyst in less than 10minutes at the stoichiometric CH4(1 kPa)/O2(0.5 kPa) feed composition at T = 550 °C. Open symbols and lightlines: inactive state; full symbols and heavy lines: active state. Conditions of deactivation as in Fig. 9.7.
9.4 Discussion
The role of the TiO2 support in the catalytic activity of Rh-based catalysts toward the par-
tial oxidation of methane is certainly related to the stability against reduction of the rhodium
oxide formed during exposure of the catalyst to an oxidizing atmosphere (CH4/O2 < 2), as in the
case of ethylene oxidation on Rh/TiO2/YSZ. In fact, it was demonstrated by the experimental
results that with TiO2 as a support, the Rh catalyst remains active even after exposure to feeds
with a low CH4/O2 mole ratio (where rhodium oxide formation is favored). This is not the case in
the absence of TiO2, where the Rh catalysts remain inactive after exposure to oxidizing conditions
(CH4/O2 < 2), even at high CH4/O2 mole ratios (Figs. 9.1, 9.2). An interpretation of these obser-
vations may be attempted, as in the case of C2H4 oxidation, either in terms of strong metal-sup-
port interactions (SMSI) [5] or by a model based on the theory of electrochemical promotion of
catalysis (EPOC) [6] (Chapter 2).
The observed modifications of activity and selectivity of the Rh catalysts supported on
TiO2 might also be due to a partial reduction of TiO2 (formation of TiOx) by hydrogen produced
during the reaction (Eq. (9.1)). In fact, TiO2 can be reduced by hydrogen at relatively moderate
temperatures (T > 400 °C) [5]. When one atom of oxygen is lost from the surface, two electrons
UWC / V
i / mA cm -2 active
inactive
activeinactive
1
-1
-4 2 4
UWC / V
i / mA cm -2 active
inactive
activeinactive
1
-1
-4 2 4
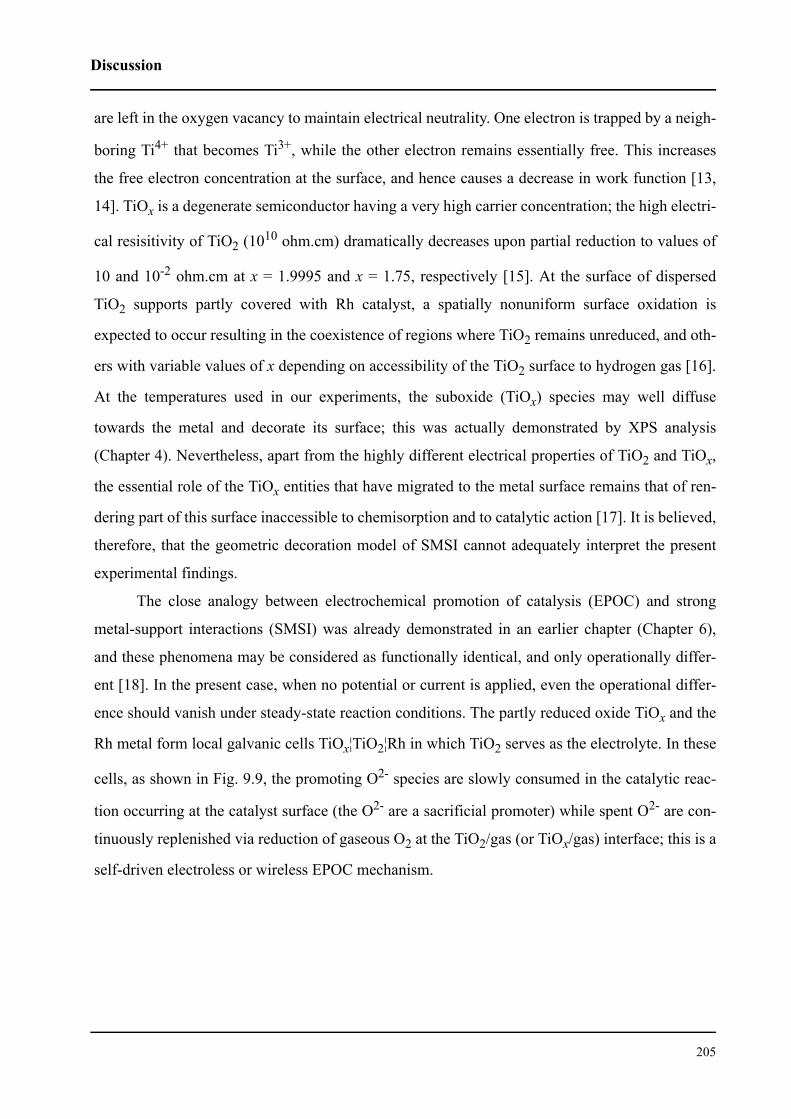
Discussion
205
are left in the oxygen vacancy to maintain electrical neutrality. One electron is trapped by a neigh-
boring Ti4+ that becomes Ti3+, while the other electron remains essentially free. This increases
the free electron concentration at the surface, and hence causes a decrease in work function [13,
14]. TiOx is a degenerate semiconductor having a very high carrier concentration; the high electri-
cal resisitivity of TiO2 (1010 ohm.cm) dramatically decreases upon partial reduction to values of
10 and 10-2 ohm.cm at x = 1.9995 and x = 1.75, respectively [15]. At the surface of dispersed
TiO2 supports partly covered with Rh catalyst, a spatially nonuniform surface oxidation is
expected to occur resulting in the coexistence of regions where TiO2 remains unreduced, and oth-
ers with variable values of x depending on accessibility of the TiO2 surface to hydrogen gas [16].
At the temperatures used in our experiments, the suboxide (TiOx) species may well diffuse
towards the metal and decorate its surface; this was actually demonstrated by XPS analysis
(Chapter 4). Nevertheless, apart from the highly different electrical properties of TiO2 and TiOx,
the essential role of the TiOx entities that have migrated to the metal surface remains that of ren-
dering part of this surface inaccessible to chemisorption and to catalytic action [17]. It is believed,
therefore, that the geometric decoration model of SMSI cannot adequately interpret the present
experimental findings.
The close analogy between electrochemical promotion of catalysis (EPOC) and strong
metal-support interactions (SMSI) was already demonstrated in an earlier chapter (Chapter 6),
and these phenomena may be considered as functionally identical, and only operationally differ-
ent [18]. In the present case, when no potential or current is applied, even the operational differ-
ence should vanish under steady-state reaction conditions. The partly reduced oxide TiOx and the
Rh metal form local galvanic cells TiOx¦TiO2¦Rh in which TiO2 serves as the electrolyte. In these
cells, as shown in Fig. 9.9, the promoting O2- species are slowly consumed in the catalytic reac-
tion occurring at the catalyst surface (the O2- are a sacrificial promoter) while spent O2- are con-
tinuously replenished via reduction of gaseous O2 at the TiO2/gas (or TiOx/gas) interface; this is a
self-driven electroless or wireless EPOC mechanism.
Chapter 9 Promotion of Rh catalysts: Partial methane oxidation at open and closed circuit
206
FIGURE 9.9. Self-driven electrochemical promotion of partial CH4 oxidation on Rh interfaced withTiO2, with internal short-circuiting.
A plausible and easy explanation of the reactivation of Rh catalysts supported on TiO2
which is observed when applying a relatively high current could be by the effect of local heating.
In fact, the actual temperature of the catalyst was not known, only that of the reacting gas mixture
close to the catalyst was measured. The local temperature of the catalyst might be significantly
different from the temperature measured in the gas phase, all the more because the low flow rates
created a CSTR-like environment around the catalyst that was unfavorable for efficient heat trans-
fer from the catalyst toward the gas. A very conservative estimate of the temperature difference
between catalyst and gas, the former being heated by the applied current, was attempted using a
heat transfer coefficient of 5 Wm-2K-1, which is typical for natural convection in gases. This
would give a high estimate of catalyst temperature, because the actual heat transfer, although
poor, was certainly better than that by natural convection.
Considering the heating power in the inactive (more highly resistive) catalyst at the
moment of reactivation (see Fig. 9.8), and assuming bulk heating, hence a uniform temperature
within the coating, temperature differences between catalyst and gas as low as 2 and 6 degrees
were calculated for negative and positive applied currents at a stoichiometric feed composition
and T = 550 °C. Such a weak local heating cannot be responsible for the observed reactivation,
since at the given gas composition at open circuit, the catalyst remained inactive even at 600 °C
(see Fig. 9.6). It can now be concluded that local heating by the applied current cannot be the sole
cause of reactivation. This conclusion is further reinforced by the asymmetry of the phenomenon,
the positive currents required to achieve reactivation being higher than the negative currents
required under the same conditions. Although the semiconductor character of the interlayer may
O2
TiOx
TiO2
e-O2-
Rh
CH4 + 1/2O2
CO + 2H2
e-
O2
TiOx
TiO2
e-O2-
Rh
CH4 + 1/2O2
CO + 2H2
CH4 + 1/2O2
CO + 2H2
e-
Discussion
207
also contribute to the asymmetry, the asymmetric current requirements suggest above all that dif-
ferent mechanisms of catalyst regeneration prevail when applying positive and negative currents.
The rectivation of inactive (oxidized) rhodium catalysts by negative currents can be
explained most simply by electrochemical reduction of the rhodium oxide:
(9.6)
In fact, even the minimum amount of charge passed through the catalyst during activation
(about 4 mA over a time of three minutes in stoichiometric feed) would be enough to reduce
roughly 10 % of the total amount of rhodium deposited, if present as an oxide, while the fraction
of rhodium atoms exposed to the gas (and hence catalytically active) is actually as low as 1 % or
less in Rh paste catalysts.
The reactivation by positive currents in turn can be explained by the theory of electrochem-
ical promotion of catalysis. Positive currents supply O2- ions to the catalyst/support interface.
These ions are released at the three-phase boundary (tpb), then spread out across the entire gas-
exposed catalyst surface by a mechanism of backspillover. During their migration these ions are
accompanied by their mirror charges in the catalyst, thus forming an overall neutral double layer
of dipoles at the catalytically active surface. The population of the surface with dipoles raises the
surface potential, the concomitant increase in work function lowers the bond strength of chemi-
sorbed oxygen as well as the stability of the rhodium surface oxide against chemical reduction.
The current-assisted activation of the Rh/TiO2/YSZ catalysts produced dramatic enhance-
ments of both the catalytic activity and the selectivity toward partial CH4 oxidation; the high cat-
alytic reaction rates thus acquired remained unchanged after an interruption of the current. This
effect of activation may be quantified by the "permanent" rate enhancement ratio, γ, defined as the
ratio of the open-circuit reaction rates prior to (r0) and after (r’) application of the current (Chap-
ter 2, section 1.2):
(9.7)
The reaction rates are suitably expressed in terms of reacted oxygen (mol O s-1) calculated
from the specific rates of CO and CO2 formation according to the stoichiometry of reactions (9.1)
Rh3 + 3e– Rh0→+
γ r'r0----=
Chapter 9 Promotion of Rh catalysts: Partial methane oxidation at open and closed circuit
208
and (9.2), respectively. At the stoichiometric gas composition (CH4 : O2 = 2 : 1) a "permanent"
rate enhancement ratio, γ, as high as 11 was obtained. However, the most interesting feature of
current-assisted activation is the increase in selectivity of the Rh catalysts. Prior to application of
the current the selectivity for partial methane oxidation was zero (no CO formation at all) while
during current flow as well as after interruption of the current, the selectivity of the Rh catalysts
was as high as 45 % at the stoichiometric gas composition at 550 °C.
9.5 Conclusions
In this chapter, the partial oxidation of methane over Rh catalysts supported on YSZ con-
taining a thin interlayer of TiO2 was investigated. Under working conditions the rhodium catalyst
exists in two well distinguished surface states: active and inactive. According to measured cata-
lyst potentials, these two states correspond to rhodium metal (active state) and rhodium oxide
(inactive state).
The remarkable increase in catalytic activity and selectivity towards CO and H2 production
that occurs when Rh is in contact with TiO2 is related to the drop in stability of the Rh surface
oxide against reduction to metallic Rh. This phenomenon may be interpreted, either by strong
electronic-type metal-support interactions or by a self-driven wireless electrochemical promotion
mechanism. In both cases, the ultimate cause of promotion are different work functions of catalyst
and support. Equilibration of the Fermi levels causes weakening of the Rh-O chemisorptive
bonds, and facilitates reduction of oxidized surface sites.
At gas compositions close to stoichiometric (CH4 : O2 = 2 : 1) at temperatures in the range
of 500 to 600 °C, Rh catalysts have two stable states: inactive (Rh oxide) and active (Rh metal),
depending on the gas composition to which the catalyst had been exposed in adance. It was found
that positive and negative currents both can produce reactivation manifesting itself in a large
increase of both the catalytic reaction rate and the selectivity for partial methane oxidation. This
phenomenon is a typical example of permanent electrochemical promotion, since after interrup-
tion of the current the reactivated catalyst remained active indefinitely. At the stoichiometric feed
composition at 550 °C a γ-value ("permanent" rate enhancement ratio) of 11 and a CO selectivity
of 45 % were obtained.
The results suggest that the mechanisms of reactivation by positive and negative currents
are different. It is believed that negative currents sustain the electrochemical reduction of rhodium
References
209
oxide, while positive currents cause breakup of rhodium surface oxide due to weakening of the
rhodium-oxygen bond strength by accumulated backspillover oxygen at the gas-exposed catalyst
surface, just as seen in the reversible electrochemical promotion of catalysis with anodic currents.
9.6 References
1. M. A. Pena, J. P. Gomez, and J. L. G. Fierro, Appl. Catal. A, 144 (1996) 7.
2. S. C. Tsang, J. B. Claridge, and M. L. H. Green, Catal. Today, 23 (1995) 3.
3. M. Prettre, C. Eichner, and M. Perrin, J. Chem. Soc. Faraday Trans., 43 (1946)
335.
4. D. A. Hickman, E. A. Haupfear, and L. D. Schmidt, Catal. Lett., 17 (1993) 223.
5. S. J. Tauster, S. C. Fung, and R. L. Garten, JACS, 100 (1978) 170.
6. C. G. Vayenas, S. Bebelis, C. Pliangos, S. Brosda, and D. Tsiplakides, Electro-
chemical activation of catalysis. Promotion, Electrochemical promotion, and
metal-support interaction. Kluwer Academic/Plenum Publishers, New York
(2001).
7. E. A. Baranova, G. Fóti, and C. Comninellis, Electrochem. Commun., 6 (2004)
170.
8. E. A. Baranova, G. Fóti, and C. Comninellis, Electrochem. Commun., 6 (2004)
389.
9. J. Nicole and C. Comninellis, J. Appl. Electrochem., 28 (1998) 223.
10. C. Pliangos, C. Raptis, T. Badas, and C. G. Vayenas, Solid State Ionics, 136-137
(2000) 767.
11. E. Varkaraki, J. Nicole, E. Plattner, and C. Comninellis, J. Appl. Electrochem., 25
(1995) 978.
12. G. Fóti, O. Lavanchy, and C. Comninellis, J. Appl. Electrochem., 30 (2000) 1223.
13. Y. W. Chung, W. J. Lo, and G. A. Somorjai, Surface Sci., 64 (1977) 588.
14. T. Ioannides and X. E. Verykios, J. Catal., 161 (1996) 560.
15. Gmelin's Handbook Part 24 Weinheim (1951).
16. F. Pesty, H. P. Steinruck, and T. E. Madey, Surface Sci., 339 (1995) 83

Chapter 9 Promotion of Rh catalysts: Partial methane oxidation at open and closed circuit
210
17. G. L. Haller and D. E. Resasco, Advances in Catalysis, 36 (1989) 173.
18. J. Nicole, D. Tsiplakides, C. Pliangos, X. E. Verykios, C. Comninellis, and C. G.
Vayenas, J. Catal., 204 (2001) 23.
211
CHAPTER 10 General discussion
The main results obtained in the present work are discussed and the princi-
pal conclusions drawn. This work continues the complex investigations
started several years ago in the “NEMCA group” of Prof. Comninellis,
EPFL. It is focused on the electrochemical promotion of catalysis (EPOC)
and on its connection with the phenomenon of metal-support interactions
(MSI). Both EPOC and MSI are interfacial phenomena, therefore, one of the
major challenges in the field of electrochemical promotion is that of eluci-
dating the mechanism by which the promoting effect propagates from one
interface (catalyst/electrolyte) to the other (catalyst/gas). Due to the interdis-
ciplinary nature of electrochemical promotion, which involves concepts
from at least five different fields (catalysis, surface science, electrochemis-
try, solid state ionics, chemical reaction engineering), the present study uses
different techniques and approaches in order to reach the goals contem-
plated. For the experimental work, two Rh catalysts were chosen where Rh
was deposited by sputtering in a thickness of 40 nm, either directly on YSZ
or on YSZ covered with a TiO2 layer (4 µm).
Chapter 10 General discussion
212
In the first chapter of results (Chapter 4: Characterization of Rh catalyst electrodes), data
characterizing the Rh catalyst electrodes sputtered on YSZ (Rh/YSZ) and on a layer of TiO2
deposited on YSZ support (Rh/TiO2/YSZ) were presented. Several types of analysis were
employed in order to elucidate the morphological properties (SEM, AFM) of the Rh catalysts and
their chemical surface composition (XPS). It follows from SEM and AFM analyses that TiO2
forms a nanostructured layer completely covering the YSZ substrate. The thin layer of Rh catalyst
sputtered on YSZ or TiO2 forms continuous layers and replicates the support morphology. In both
systems, Rh/YSZ and Rh/TiO2/YSZ, the catalyst films have a nanoparticle-size grain structure.
After exposure of the catalysts to working conditions (high temperature, applied currents/poten-
tials, mixtures of C2H4 and O2) during 200 hours, it was confirmed that the catalyst films have
good stability and adhesion to the substrate surface.
The oxidation state of the Rh surface undergoes considerable changes during exposure,
both to oxidizing or to reducing gas compositions. After reduction as well as after oxidation, Rh
supported on TiO2 was found to be in a more highly reduced state than Rh on YSZ. After reduing
treatment, the Rh/TiO2/YSZ sample contains a larger amount of weakly bonded oxygen, which
can be attributed to oxygen “backspillover” from the TiO2. This oxygen may migrate in some
form of TiOx, since after reduction some quantity of Ti was found on the Rh surface but disap-
peared after oxidation of the catalyst. The driving force for this migration is the difference in work
functions of Rh catalyst and TiO2 support. The migration occurring more particularly after a
reducing treatment leading to electronic-type SMSI.
These characteristics of the two catalysts were often recalled in later chapters in order to
explain the electrochemical and catalytic behavior of the Rh/YSZ and the Rh/TiO2/YSZ catalysts.
In Chapter 5 (Electrochemical characterization of the Rh catalysts: Polarization measure-
ments), studies of oxygen kinetics (O2/O2- couple) performed for the first time on Rh thin-film
electrodes interfaced with a pure ionic conductor (ZrO2 + Y2O3 solid electrolyte) and with a
mixed electronic-ionic conductor (TiO2) supported on YSZ are reported. The temperature range
examined was between 450 and 600 °C, the oxygen partial pressures ranged from 0.5 to 20 kPa.
Exchange current measurements at different T and Po2 provided important information as to the
kinetics and mechanism of the O2/O2- electrode reaction at the interface. The exchange current
213
densities found at Rh/TiO2(4 µm)/YSZ are less than half those found at Rh/YSZ, and decrease
further with increasing titania thickness.
From the experimental results obtained at low and high polarization, and after an analysis
of literature data, a mechanism was proposed for the O2/O2- exchange process. In the cathodic
process, the first step is fast dissociative adsorption of oxygen at the gas-exposed Rh surface. The
second step is atomic oxygen diffusion from the gas-exposed catalyst surface to the electrochemi-
cal reaction sites (ERS), where a fast two-electron transfer reaction then takes place:
O2 2 O(MG) fast step (10.1)
slow step (10.2)
fast step (10.3)
The cathodic process is limited by interfacial diffusion of oxygen atoms from the gas-
exposed metal surface to ERS. These can be located, either at the Rh/solid electrolyte two-phase
boundary or at the Rh/solid electrolyte/gas three-phase boundary. It is obvious that so long as the
rate of surface diffusion is lower than the rate of charge transfer, current will flow predominantly
near the three-phase boundary region.
The anodic process includes two steps: two-electron transfer at ERS and oxygen desorp-
tion. The most probable location of the electrochemically reactive sites is the three-phase bound-
ary, where the atomic oxygen produced recombines to molecules and untergoes exchange with the
gas phase.
slow step (10.4)
2 O(ERS) O2(G) fast step (10.5)
The mechanism (Equations (10.1) to (10.5)) proposed could be confirmed in the next chap-
ter (Chapter 6: Electrochemical characterization of Rh catalysts: Impedance measurements) by
impedance spectroscopy. First, a theoretical impedance model of the O2/O2- process at the equi-
librium potential was developed. Then the impedance model was confronted with the experimen-
tal data. For this purpose, electrochemical impedance spectra were recorded at T = 450 - 600 °C
)()( ERSdiffusion
MG OO →
O ERS( ) 2e– O2 –→+
O2– 2e– O ERS( )→–
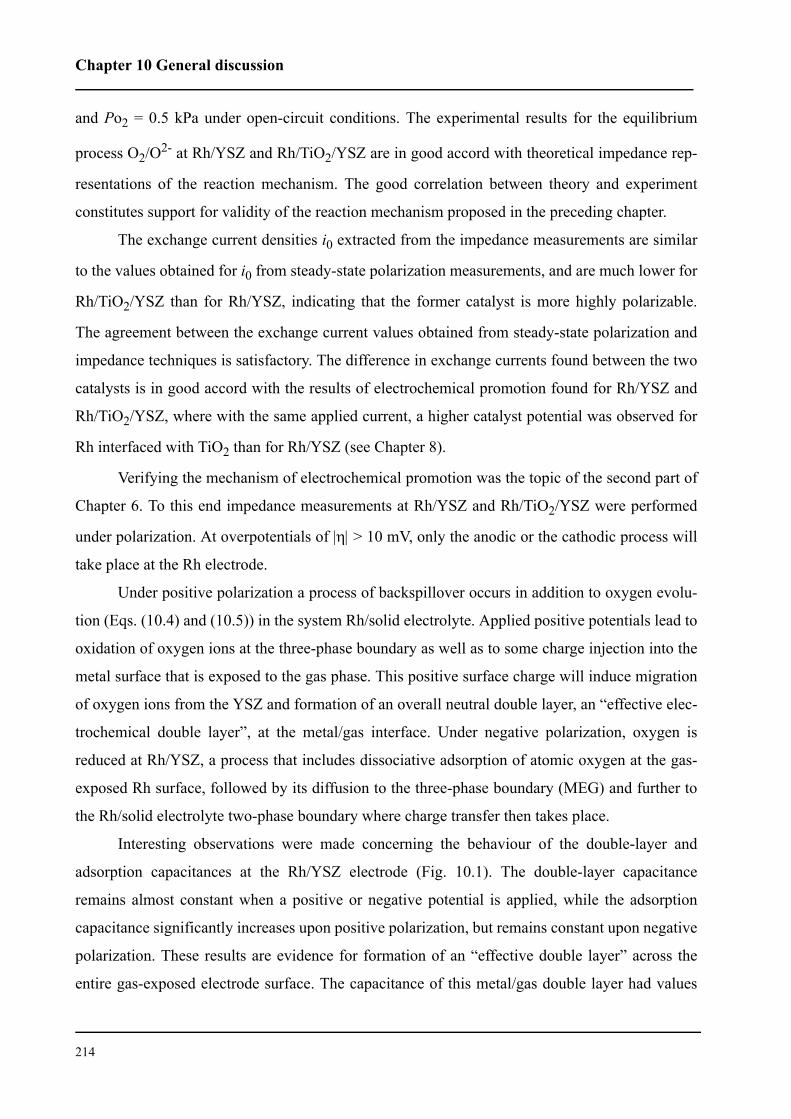
Chapter 10 General discussion
214
and Po2 = 0.5 kPa under open-circuit conditions. The experimental results for the equilibrium
process O2/O2- at Rh/YSZ and Rh/TiO2/YSZ are in good accord with theoretical impedance rep-
resentations of the reaction mechanism. The good correlation between theory and experiment
constitutes support for validity of the reaction mechanism proposed in the preceding chapter.
The exchange current densities i0 extracted from the impedance measurements are similar
to the values obtained for i0 from steady-state polarization measurements, and are much lower for
Rh/TiO2/YSZ than for Rh/YSZ, indicating that the former catalyst is more highly polarizable.
The agreement between the exchange current values obtained from steady-state polarization and
impedance techniques is satisfactory. The difference in exchange currents found between the two
catalysts is in good accord with the results of electrochemical promotion found for Rh/YSZ and
Rh/TiO2/YSZ, where with the same applied current, a higher catalyst potential was observed for
Rh interfaced with TiO2 than for Rh/YSZ (see Chapter 8).
Verifying the mechanism of electrochemical promotion was the topic of the second part of
Chapter 6. To this end impedance measurements at Rh/YSZ and Rh/TiO2/YSZ were performed
under polarization. At overpotentials of |η| > 10 mV, only the anodic or the cathodic process will
take place at the Rh electrode.
Under positive polarization a process of backspillover occurs in addition to oxygen evolu-
tion (Eqs. (10.4) and (10.5)) in the system Rh/solid electrolyte. Applied positive potentials lead to
oxidation of oxygen ions at the three-phase boundary as well as to some charge injection into the
metal surface that is exposed to the gas phase. This positive surface charge will induce migration
of oxygen ions from the YSZ and formation of an overall neutral double layer, an “effective elec-
trochemical double layer”, at the metal/gas interface. Under negative polarization, oxygen is
reduced at Rh/YSZ, a process that includes dissociative adsorption of atomic oxygen at the gas-
exposed Rh surface, followed by its diffusion to the three-phase boundary (MEG) and further to
the Rh/solid electrolyte two-phase boundary where charge transfer then takes place.
Interesting observations were made concerning the behaviour of the double-layer and
adsorption capacitances at the Rh/YSZ electrode (Fig. 10.1). The double-layer capacitance
remains almost constant when a positive or negative potential is applied, while the adsorption
capacitance significantly increases upon positive polarization, but remains constant upon negative
polarization. These results are evidence for formation of an “effective double layer” across the
entire gas-exposed electrode surface. The capacitance of this metal/gas double layer had values
215
much higher (100 - 300 µF/cm2 in order of magnitude) than that of the metal/solid electrolyte
double layer (0.4 - 2 µF/cm2).
The values of the two capacitances are related to NG, the gas-exposed surface area of the
electrode, and to Ntpb, the “surface area” of the three-phase boundary, by Eq. (6.39) of Chapter 6.
From impedance data it is then possible to calculate the length of the tpb. The values obtained for
Ntpb are of the order of 10-10 mol Rh/cm2 electrolyte for Rh/YSZ, roughly a factor of 102 smaller
than NG for which a value of NG = 1.6 10-8 mol was found in Chapter 3, section 2.2, and corre-
spond to a “length”, ltpb, of several km per cm2 of the solid electrolyte.
FIGURE 10.1. Values of double-layer and adsorption capacitances at Rh/YSZ calculated with theequivalent circuit of Fig. 6.5, Chapter 6. Po2 = 0.5 kPa, T = 600 °C.
From impedance measurements at Rh/TiO2/YSZ, it was seen that strong polarization led to
changes in the reaction mechanism. Rhodium electrodes interfaced with TiO2 yield more complex
spectra when polarized; the associated electrode processes merit further detailed examination.
Effects of metal-support interactions have been investigated, both at thin (40 nm) and at
thick (several µm) Rh catalyst films supported on YSZ and TiO2/YSZ, using two model reac-
0.8
1.8
2.8
-0.2 -0.1 0 0.1 0.2
U, V
Cdl
, 10-6
F/c
m2
50
150
250
Ca,
10-6
F/c
m2
Cdl
Ca
Chapter 10 General discussion
216
tions: ethylene oxidation (Chapter 7: Promotion of Rh catalysts: Open-circuit ethylene oxi-
dation) and partial methane oxidation (Chapter 9: Promotion of Rh catalysts: Partial
methane oxidation at open and closed circuit). In these reactions, a sudden transition from a
region of high to a region of low reaction rates is observed to occur at these Rh catalysts with
increasing oxygen partial pressure. This sudden transition is accompanied by the formation of
rhodium surface oxide responsible for deactivation of the catalyst. A phenomenological model
was proposed (Chapter 7: Promotion of Rh catalysts: Open-circuit ethylene oxidation)
with the aim of explaining this deactivation of Rh catalysts during ethylene and methane oxida-
tion. This model is quite similar to the model proposed by Bolzonella et al (see Chapter 2, section
1.3), but in addition takes into account the external parameters that are responsible for surface
deactivation, and is able to explain the hysteresis of reaction rates often observed at Rh catalysts.
Two kinds of sites, activated (Rh-Oad) or nonactivated (Rh), are assumed to exist on Rh
metal. Their mutual transformation is a microscopic process described by the following reaction:
(10.6)
where M is a nonactivated site and M* is an activated site.
The activated site may contribute to the reaction rate r by generating a product C while
using up a reactant R, and then returns to its nonactivated state:
(10.7)
Product C is supposed to leave the surface, and thus no longer to interact with the process
considered. The reactive transformation (10.7) can only occur when the activated site M* (Rh-
Oad) does not belong to the structure Σ(p) deactivating the surface (Rh2O3). The sites belonging to
the structure Σ(p) are called deactivated sites. The fraction p of activated sites is a function of time
written as:
(10.8)
This model is able to reproduce the hysteresis effects seen between forward and reverse
scans of an external parameter such as the partial pressures of reactants.
*
1
1
MMk
k
←→
−
CMMR k +→+ 2*
[ ])()1( 211 pPpkpkpkdtdp
−−−−= −
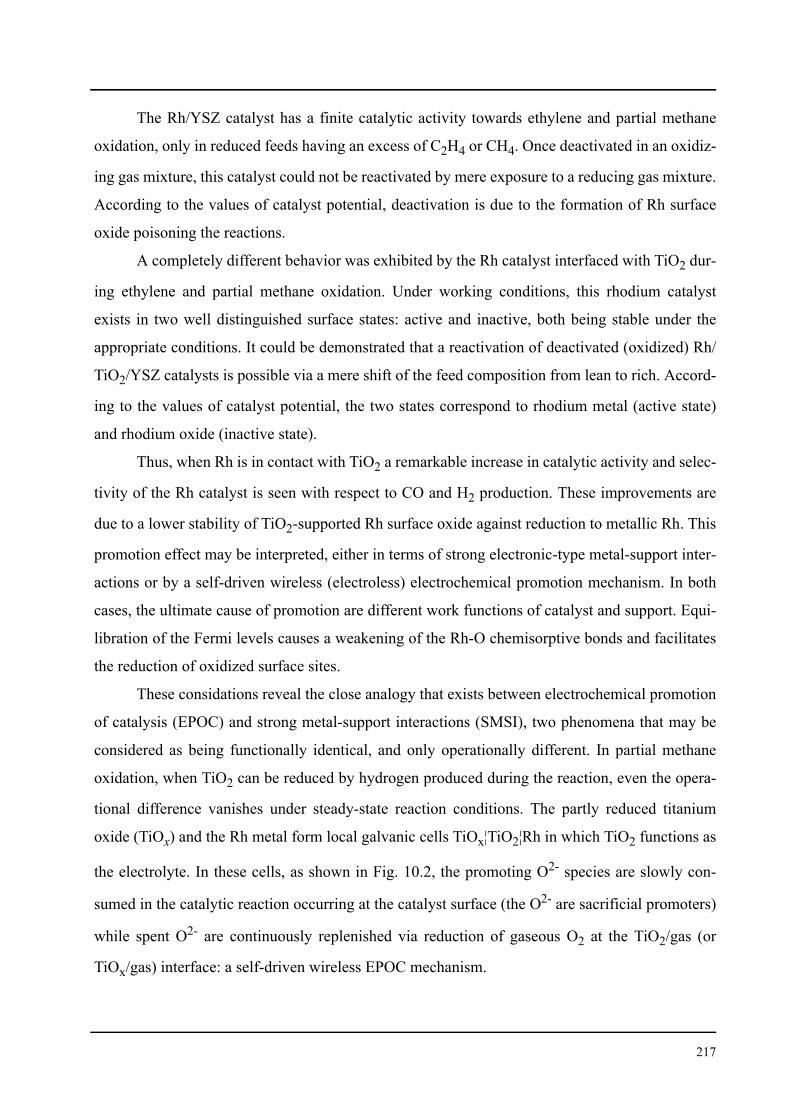
217
The Rh/YSZ catalyst has a finite catalytic activity towards ethylene and partial methane
oxidation, only in reduced feeds having an excess of C2H4 or CH4. Once deactivated in an oxidiz-
ing gas mixture, this catalyst could not be reactivated by mere exposure to a reducing gas mixture.
According to the values of catalyst potential, deactivation is due to the formation of Rh surface
oxide poisoning the reactions.
A completely different behavior was exhibited by the Rh catalyst interfaced with TiO2 dur-
ing ethylene and partial methane oxidation. Under working conditions, this rhodium catalyst
exists in two well distinguished surface states: active and inactive, both being stable under the
appropriate conditions. It could be demonstrated that a reactivation of deactivated (oxidized) Rh/
TiO2/YSZ catalysts is possible via a mere shift of the feed composition from lean to rich. Accord-
ing to the values of catalyst potential, the two states correspond to rhodium metal (active state)
and rhodium oxide (inactive state).
Thus, when Rh is in contact with TiO2 a remarkable increase in catalytic activity and selec-
tivity of the Rh catalyst is seen with respect to CO and H2 production. These improvements are
due to a lower stability of TiO2-supported Rh surface oxide against reduction to metallic Rh. This
promotion effect may be interpreted, either in terms of strong electronic-type metal-support inter-
actions or by a self-driven wireless (electroless) electrochemical promotion mechanism. In both
cases, the ultimate cause of promotion are different work functions of catalyst and support. Equi-
libration of the Fermi levels causes a weakening of the Rh-O chemisorptive bonds and facilitates
the reduction of oxidized surface sites.
These considations reveal the close analogy that exists between electrochemical promotion
of catalysis (EPOC) and strong metal-support interactions (SMSI), two phenomena that may be
considered as being functionally identical, and only operationally different. In partial methane
oxidation, when TiO2 can be reduced by hydrogen produced during the reaction, even the opera-
tional difference vanishes under steady-state reaction conditions. The partly reduced titanium
oxide (TiOx) and the Rh metal form local galvanic cells TiOx¦TiO2¦Rh in which TiO2 functions as
the electrolyte. In these cells, as shown in Fig. 10.2, the promoting O2- species are slowly con-
sumed in the catalytic reaction occurring at the catalyst surface (the O2- are sacrificial promoters)
while spent O2- are continuously replenished via reduction of gaseous O2 at the TiO2/gas (or
TiOx/gas) interface: a self-driven wireless EPOC mechanism.
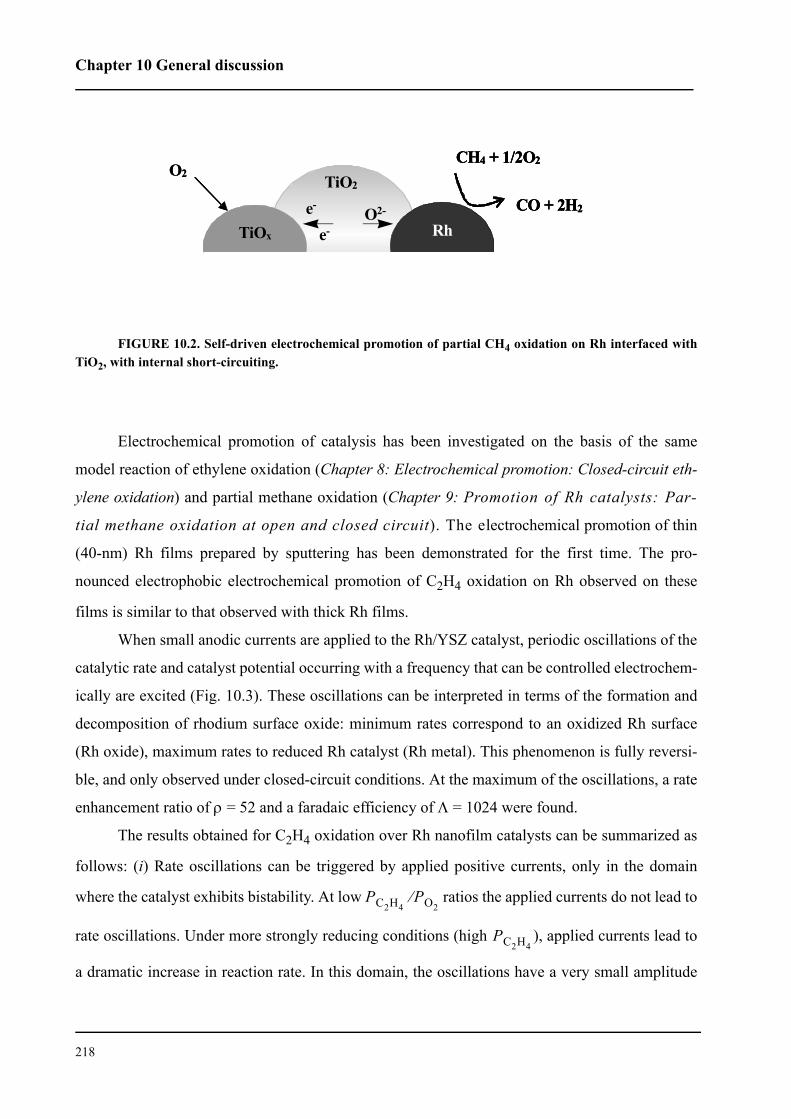
Chapter 10 General discussion
218
FIGURE 10.2. Self-driven electrochemical promotion of partial CH4 oxidation on Rh interfaced withTiO2, with internal short-circuiting.
Electrochemical promotion of catalysis has been investigated on the basis of the same
model reaction of ethylene oxidation (Chapter 8: Electrochemical promotion: Closed-circuit eth-
ylene oxidation) and partial methane oxidation (Chapter 9: Promotion of Rh catalysts: Par-
tial methane oxidation at open and closed circuit). The electrochemical promotion of thin
(40-nm) Rh films prepared by sputtering has been demonstrated for the first time. The pro-
nounced electrophobic electrochemical promotion of C2H4 oxidation on Rh observed on these
films is similar to that observed with thick Rh films.
When small anodic currents are applied to the Rh/YSZ catalyst, periodic oscillations of the
catalytic rate and catalyst potential occurring with a frequency that can be controlled electrochem-
ically are excited (Fig. 10.3). These oscillations can be interpreted in terms of the formation and
decomposition of rhodium surface oxide: minimum rates correspond to an oxidized Rh surface
(Rh oxide), maximum rates to reduced Rh catalyst (Rh metal). This phenomenon is fully reversi-
ble, and only observed under closed-circuit conditions. At the maximum of the oscillations, a rate
enhancement ratio of ρ = 52 and a faradaic efficiency of Λ = 1024 were found.
The results obtained for C2H4 oxidation over Rh nanofilm catalysts can be summarized as
follows: (i) Rate oscillations can be triggered by applied positive currents, only in the domain
where the catalyst exhibits bistability. At low ratios the applied currents do not lead to
rate oscillations. Under more strongly reducing conditions (high ), applied currents lead to
a dramatic increase in reaction rate. In this domain, the oscillations have a very small amplitude
O2
TiOx
TiO2
e-O2-
Rh
CH4 + 1/2O2
CO + 2H2
e-
O2
TiOx
TiO2
e-O2-
Rh
CH4 + 1/2O2
CO + 2H2
CH4 + 1/2O2
CO + 2H2
e-
PC2H4PO2
⁄
PC2H4
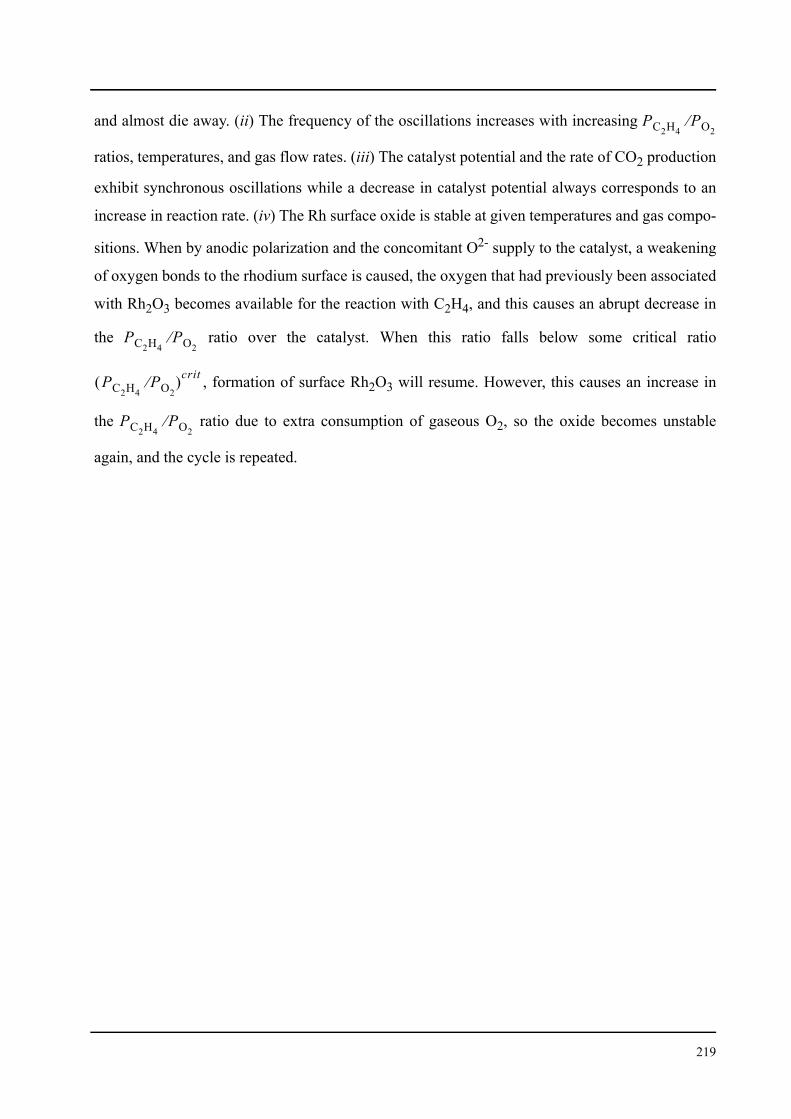
219
and almost die away. (ii) The frequency of the oscillations increases with increasing
ratios, temperatures, and gas flow rates. (iii) The catalyst potential and the rate of CO2 production
exhibit synchronous oscillations while a decrease in catalyst potential always corresponds to an
increase in reaction rate. (iv) The Rh surface oxide is stable at given temperatures and gas compo-
sitions. When by anodic polarization and the concomitant O2- supply to the catalyst, a weakening
of oxygen bonds to the rhodium surface is caused, the oxygen that had previously been associated
with Rh2O3 becomes available for the reaction with C2H4, and this causes an abrupt decrease in
the ratio over the catalyst. When this ratio falls below some critical ratio
, formation of surface Rh2O3 will resume. However, this causes an increase in
the ratio due to extra consumption of gaseous O2, so the oxide becomes unstable
again, and the cycle is repeated.
PC2H4PO2
⁄
PC2H4PO2
⁄
PC2H4PO2
⁄( )crit
PC2H4PO2
⁄
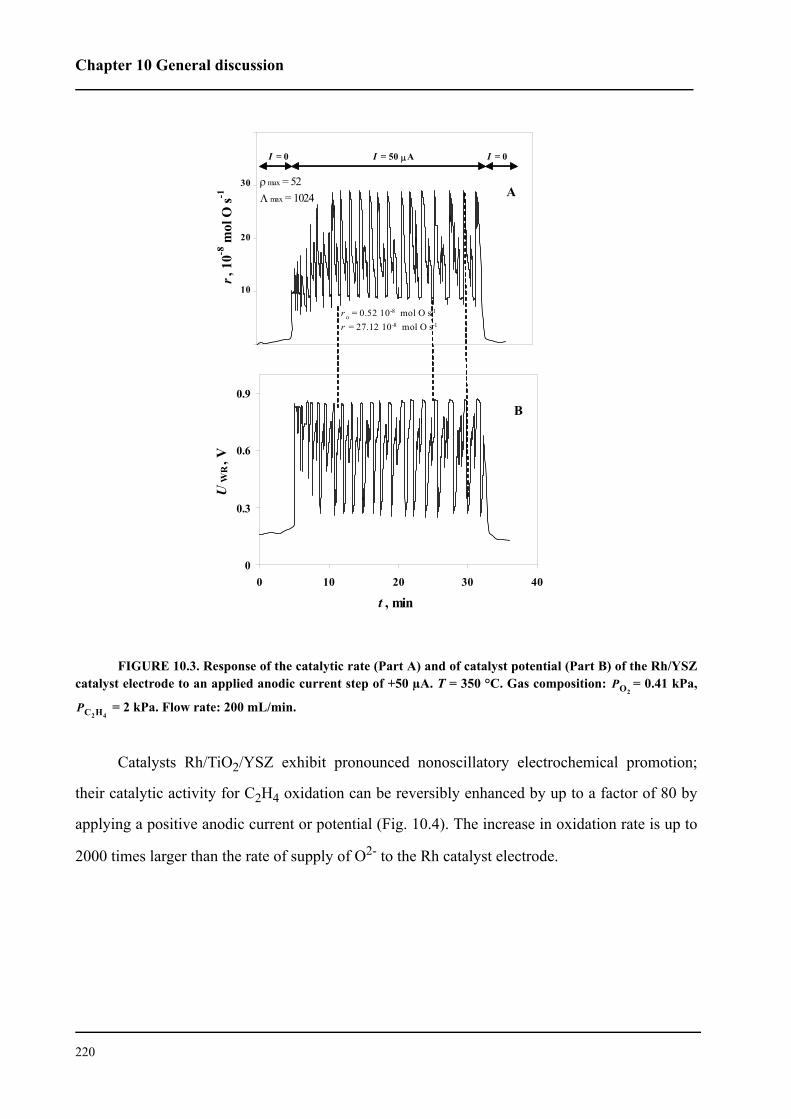
Chapter 10 General discussion
220
FIGURE 10.3. Response of the catalytic rate (Part A) and of catalyst potential (Part B) of the Rh/YSZcatalyst electrode to an applied anodic current step of +50 µA. T = 350 °C. Gas composition: = 0.41 kPa,
= 2 kPa. Flow rate: 200 mL/min.
Catalysts Rh/TiO2/YSZ exhibit pronounced nonoscillatory electrochemical promotion;
their catalytic activity for C2H4 oxidation can be reversibly enhanced by up to a factor of 80 by
applying a positive anodic current or potential (Fig. 10.4). The increase in oxidation rate is up to
2000 times larger than the rate of supply of O2- to the Rh catalyst electrode.
0
0.3
0.6
0.9
0 10 20 30 40
t , min
UW
R, V
r, 1
0-8 m
ol O
s-1
30
20
10
I = 0 I = 0I = 50 µA
ρ max = 52Λ max = 1024
r o = 0.52 10-8 mol O s-1
r = 27.12 10-8 mol O s-1
A
B
PO2
PC2H4
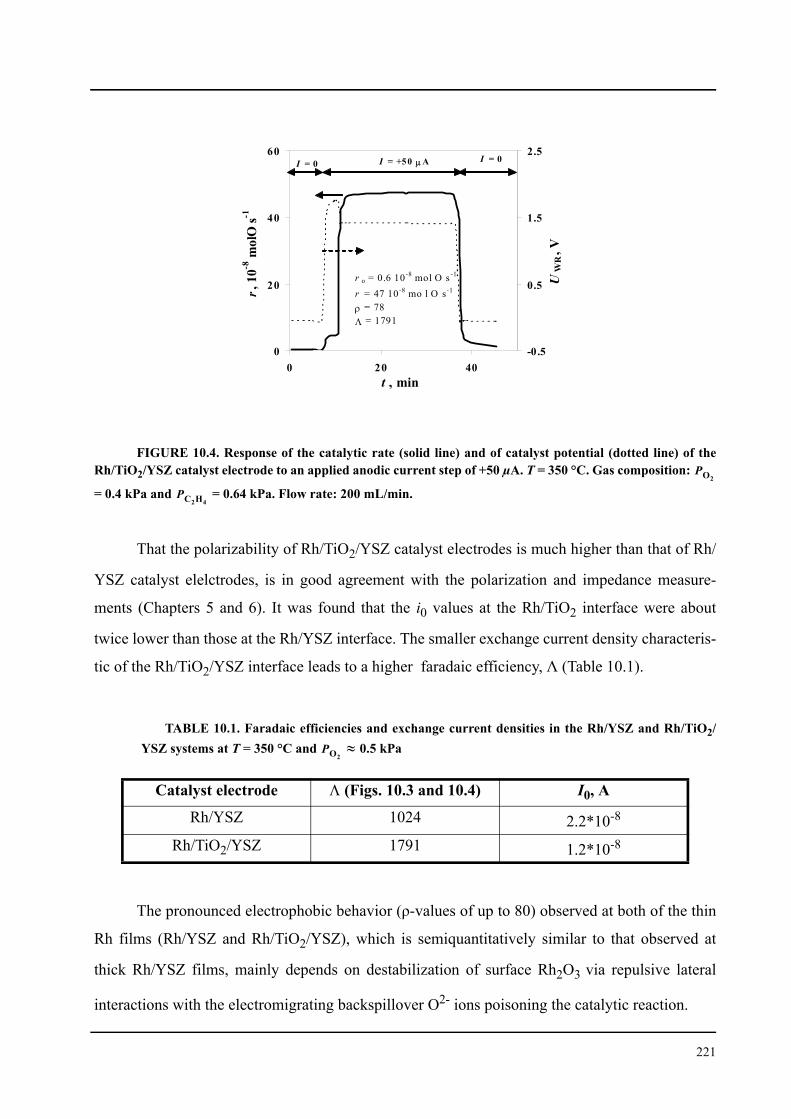
221
FIGURE 10.4. Response of the catalytic rate (solid line) and of catalyst potential (dotted line) of theRh/TiO2/YSZ catalyst electrode to an applied anodic current step of +50 µA. T = 350 °C. Gas composition:
= 0.4 kPa and = 0.64 kPa. Flow rate: 200 mL/min.
That the polarizability of Rh/TiO2/YSZ catalyst electrodes is much higher than that of Rh/
YSZ catalyst elelctrodes, is in good agreement with the polarization and impedance measure-
ments (Chapters 5 and 6). It was found that the i0 values at the Rh/TiO2 interface were about
twice lower than those at the Rh/YSZ interface. The smaller exchange current density characteris-
tic of the Rh/TiO2/YSZ interface leads to a higher faradaic efficiency, Λ (Table 10.1).
The pronounced electrophobic behavior (ρ-values of up to 80) observed at both of the thin
Rh films (Rh/YSZ and Rh/TiO2/YSZ), which is semiquantitatively similar to that observed at
thick Rh/YSZ films, mainly depends on destabilization of surface Rh2O3 via repulsive lateral
interactions with the electromigrating backspillover O2- ions poisoning the catalytic reaction.
TABLE 10.1. Faradaic efficiencies and exchange current densities in the Rh/YSZ and Rh/TiO2/YSZ systems at T = 350 °C and ≈ 0.5 kPa
Catalyst electrode Λ (Figs. 10.3 and 10.4) I0, A
Rh/YSZ 1024 2.2*10-8
Rh/TiO2/YSZ 1791 1.2*10-8
0
20
40
60
0 20 40t , min
r, 1
0-8 m
olO
s-1
-0 .5
0.5
1.5
2.5
UW
R, V
r o = 0.6 10-8 mol O s-1
r = 47 10-8 mo l O s-1
ρ = 78Λ = 1791
I = 0 I = +5 0 µ A I = 0
PO2
PC2H4
PO2
Chapter 10 General discussion
222
At thick Rh catalyst films interfaced with TiO2/YSZ, an interesting behavior was observed
during partial methane oxidation (Chapter 9: Promotion of Rh catalysts: Partial methane
oxidation at open and closed circuit). In addition to the strong metal-support interactions,
this catalyst exhibits a pronounced “permanent” electrochemical promotion (Chapter 2, section
1.2), ie, under certain working conditions the catalyst can be activated, both by applying a posi-
tive or a negative current. At gas compositions close to stoichiometric (CH4 : O2 = 2 : 1) and tem-
peratures between 500 and 600 °C, these Rh catalysts can exist in either of two stable states:
inactive (Rh oxide) and active (Rh metal), depending on the gas composition to which the catalyst
had been exposed in advance. It was found that positive as well as negative currents may lead to
activation manifesting itself in a large increase of the catalytic reaction rate and in the selectivity
for partial methane oxidation. This phenomenon is a typical example of permanent electrochemi-
cal promotion, inasmuch as after an interruption of the current the reactivated catalyst will remain
active indefinitely. With a stoichiometric feed composition at 550 °C a "permanent" rate enhance-
ment ratio of γ = 11 and a CO selectivity of 45 % were obtained.
The results suggest that the mechanisms of reactivation by positive and negative currents
are different. It is believed that negative currents sustain the electrochemical reduction of rhodium
oxide, while positive currents cause breakup of the rhodium surface oxide due to weakening of
the rhodium-oxygen bond strength by accumulated backspillover oxygen at the gas-exposed cata-
lyst surface, just as seen in the reversible electrochemical promotion of catalysis with anodic cur-
rents.
List of symbols
1. List of acronyms
DIMSI dopant-induced metal-support interaction
EIS electrochemical impedance spectroscopy
EP electrochemical promotion
EPr reversible electrochemical promotion
EPi irreversible electrochemical promotion
EPOC electrochemical promotion of catalysis
ME metal/electrolyte interface
MEG metal/electrolyte/gas interface
MG metal/gas interface
MSI metal-support interaction
NEMCA non-faradaic electrochemical modification of catalytic activity
rds rate determining step
SEM scanning electron microscopy
tpb three-phase boundary
TPD temperature programmed desorption
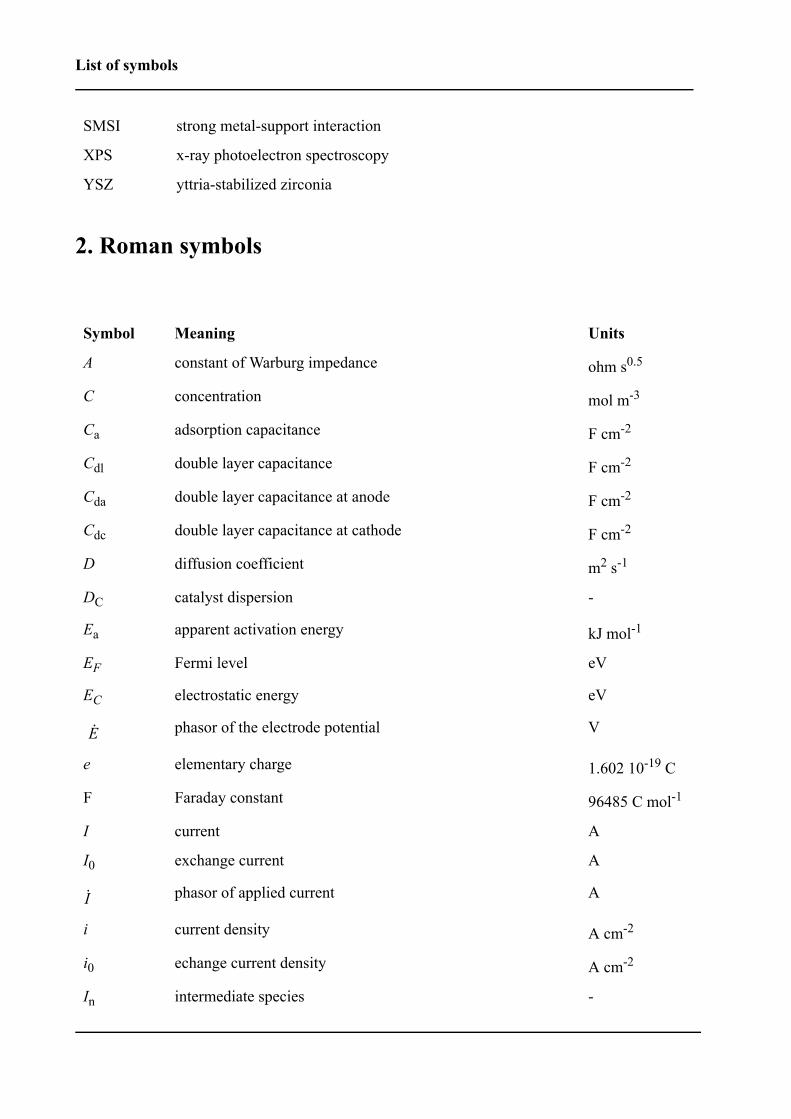
List of symbols
2. Roman symbols
SMSI strong metal-support interaction
XPS x-ray photoelectron spectroscopy
YSZ yttria-stabilized zirconia
Symbol Meaning Units
A constant of Warburg impedance ohm s0.5
C concentration mol m-3
Ca adsorption capacitance F cm-2
Cdl double layer capacitance F cm-2
Cda double layer capacitance at anode F cm-2
Cdc double layer capacitance at cathode F cm-2
D diffusion coefficient m2 s-1
DC catalyst dispersion -
Ea apparent activation energy kJ mol-1
EF Fermi level eV
EC electrostatic energy eV
phasor of the electrode potential V
e elementary charge 1.602 10-19 C
F Faraday constant 96485 C mol-1
I current A
I0 exchange current A
phasor of applied current A
i current density A cm-2
i0 echange current density A cm-2
In intermediate species -
E·
I·
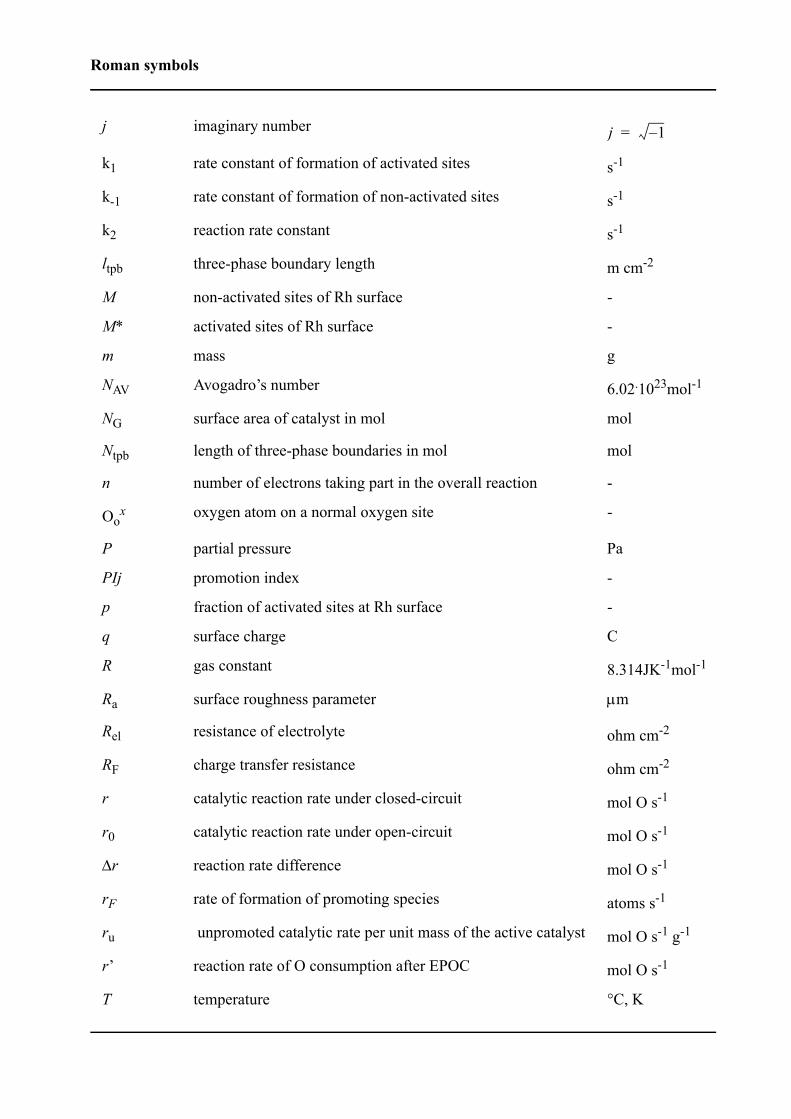
Roman symbols
j imaginary number
k1 rate constant of formation of activated sites s-1
k-1 rate constant of formation of non-activated sites s-1
k2 reaction rate constant s-1
ltpb three-phase boundary length m cm-2
M non-activated sites of Rh surface -
M* activated sites of Rh surface -
m mass g
NAV Avogadro’s number 6.02.1023mol-1
NG surface area of catalyst in mol mol
Ntpb length of three-phase boundaries in mol mol
n number of electrons taking part in the overall reaction -
Oox oxygen atom on a normal oxygen site -
P partial pressure Pa
PIj promotion index -
p fraction of activated sites at Rh surface -
q surface charge C
R gas constant 8.314JK-1mol-1
Ra surface roughness parameter µm
Rel resistance of electrolyte ohm cm-2
RF charge transfer resistance ohm cm-2
r catalytic reaction rate under closed-circuit mol O s-1
r0 catalytic reaction rate under open-circuit mol O s-1
∆r reaction rate difference mol O s-1
rF rate of formation of promoting species atoms s-1
ru unpromoted catalytic rate per unit mass of the active catalyst mol O s-1 g-1
r’ reaction rate of O consumption after EPOC mol O s-1
T temperature °C, K
j 1–=
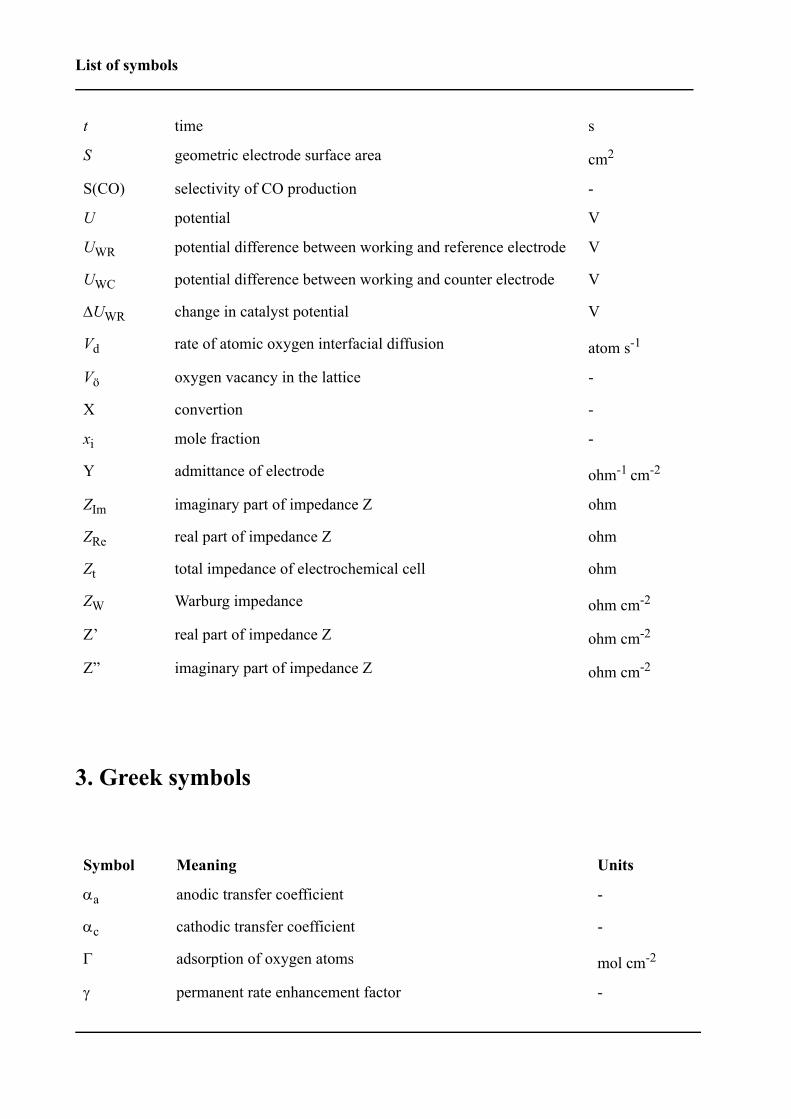
List of symbols
3. Greek symbols
t time s
S geometric electrode surface area cm2
S(CO) selectivity of CO production -
U potential V
UWR potential difference between working and reference electrode V
UWC potential difference between working and counter electrode V
∆UWR change in catalyst potential V
Vd rate of atomic oxygen interfacial diffusion atom s-1
Vö oxygen vacancy in the lattice -
X convertion -
xi mole fraction -
Y admittance of electrode ohm-1 cm-2
ZIm imaginary part of impedance Z ohm
ZRe real part of impedance Z ohm
Zt total impedance of electrochemical cell ohm
ZW Warburg impedance ohm cm-2
Z’ real part of impedance Z ohm cm-2
Z” imaginary part of impedance Z ohm cm-2
Symbol Meaning Units
αa anodic transfer coefficient -
αc cathodic transfer coefficient -
Γ adsorption of oxygen atoms mol cm-2
γ permanent rate enhancement factor -
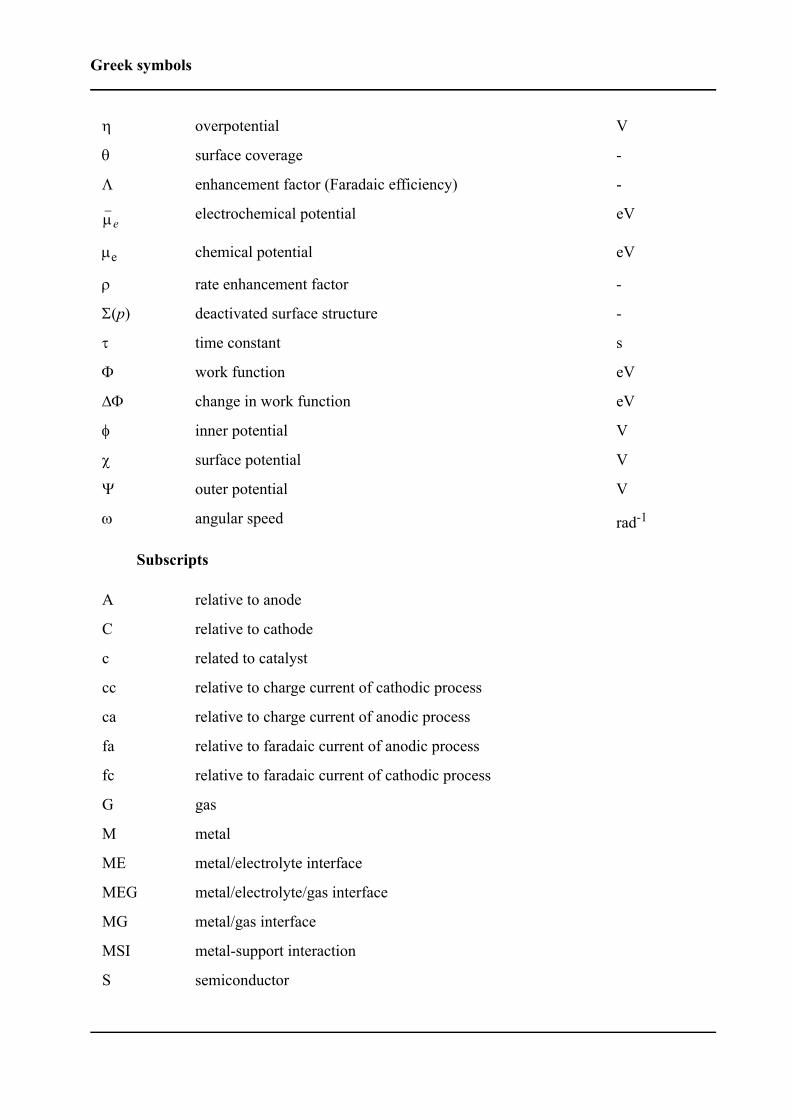
Greek symbols
Subscripts
η overpotential V
θ surface coverage -
Λ enhancement factor (Faradaic efficiency) -
electrochemical potential eV
µe chemical potential eV
ρ rate enhancement factor -
Σ(p) deactivated surface structure -
τ time constant s
Φ work function eV
∆Φ change in work function eV
φ inner potential V
χ surface potential V
Ψ outer potential V
ω angular speed rad-1
A relative to anode
C relative to cathode
c related to catalyst
cc relative to charge current of cathodic process
ca relative to charge current of anodic process
fa relative to faradaic current of anodic process
fc relative to faradaic current of cathodic process
G gas
M metal
ME metal/electrolyte interface
MEG metal/electrolyte/gas interface
MG metal/gas interface
MSI metal-support interaction
S semiconductor
µe

List of symbols
Superscripts
SB Schottky barrier
0 index for standard conditions
crit critical partial pressure of gas
m exponent in relation of exchange current and oxygen partial
pressure (Eq. 2.48)
Curriculum Vitae
Education
Professional experience
Internship
Language
Olena Baranova
av. Maria Belgia 11006 Lausanne
Ukrainian
29 July 1976
2002 - 2005
1999 - 2002
1993 - 1999
Institute of Chemical Sciences and Engineering, EPFL, Lausanne,
Switzerland, Docteur ès sciences
Department of Physical Chemistry, Ukrainian State Chemical
Technology University, Ukraine, Candidate of Chemical Science,
specialty: Electrochemistry
Ukrainian State Chemical Technology University, Ukraine, M.Sc.
in Chemical Technology and Engineering
from 2002 -
1999 - 2002
Institute of Chemical Sciences and Engineering, EPFL, Assistant
Participation in two EU projects: 1. Natural Gas Fuelled Solid Oxide Fuel
Cells (SOFCs) for cogeneration of electricity and chemicals.
2. SMART NOx abatement systems for next-generation environmental tech-nologies
Department of Physical Chemistry, Ukrainian State University ofChemical Engineering, Ukraine, Research assistant
May-June 2003
March-July 2001
July-Nov. 1999
Department of Chemical Engineering, University of Patras, Greece
Group of electrochemical engineering, EPFL, Switzerland
UkrESTO, Ltd, Dnepropetrovsk, Ukraine
Russian - Mother tongueUkrainian - Mother tongueFrench - Excellent
English - FluentGerman - Beginner
Publications1. E.A. Baranova, A. Thursfield, S. Brosda, G. Fóti, Ch. Comninellis, C.G. Vayenas. Elec-
trochemically induced oscillations of C2H4 oxidation over thin sputtered Rh catalyst films. J.
Cat. (2005) submitted.
2. E.A. Baranova, A. Thursfield, S. Brosda, G. Fóti, Ch. Comninellis, C.G. Vayenas. Elec-
trochemical promotion of ethylene oxidation over Rh catalyst thin films sputtered on YSZ and
TiO2/YSZ supports. J. Electrochem. Soc. 152 (2) E40-E49 (2005).
3. R.Wüthrich , E.A. Baranova , H. Bleuler, Ch. Comninellis. A phenomenological model
for macroscopic deactivation of surface processes. Electrochem Commun. 6. 1199-1205 (2004).
4. E.A. Baranova, G. Fóti, Ch. Comninellis. Promotion of Rh catalyst interfaced with TiO2.
Electrochem Commun. 6. 170-175 (2004).
5. E.A. Baranova, G. Fóti, Ch. Comninellis. Current-assisted activation of Rh/TiO2/YSZ
catalyst. Electrochem Commun. 6. 389-394 (2004).
Oral Presentations1. E.A. Baranova, G. Fóti, Ch. Comninellis. Reactor Development for Practical Utilization
of Electrochemical Promotion of Catalysis. International Conference on Solid State Ionics. 17-22
July, 2005, Baden-Baden, Germany.
2. E.A. Baranova, G. Fóti, Ch. Comninellis. Electrochemical promotion and metal-support
interaction. The 1st Workshop in Electrochemical Promotion. 7 octobre 2003, Lausanne, Switzer-
land.
3. E.A. Baranova, G. Fóti, Ch. Comninellis. EPOC with Rh/YSZ and Rh/TiO2/YSZ cata-
lysts. The 2nd Workshop in Electrochemical Promotion. 24 June 2004, Lyon, France.
4. E.A. Baranova, G. Fóti, Ch. Comninellis. Promotion of Rh nanofilm catalyst interfaced
with TiO2 particles. 55th Annual Meeting of ISE, 19-24 September 2004 Thesssaloniki, Greece
Posters1. E.A. Baranova, G. Fóti, Ch. Comninellis. Electrochemical Promotion of Rh Catalysts.
International Conference on Solid State Ionics. 17-22 July 2005, Baden-Baden, Germany.

2. E.A. Baranova Electrochemical promotion of sputter-coated Rh catalysts on TiO2/YSZ
and YSZ supports. LGRC Summer Poster Session. 17 June 2003, Lausanne, Switzerland
3. E.A. Baranova Electrochemical promotion and metal-support interaction: Ethylene oxi-
dation over Rh catalyst supported on YSZ and TiO2/YSZ. Séminaire hors-ville en chimie inorga-
nique et génie chimique. Octobre 2003, Champéry, Switzerland.


![Changes of Plasma FABP4, CRP, Leptin, and Chemerin Levels ...downloads.hindawi.com/journals/omcl/2018/2151429.pdf · expression [4]. FABP4, expressed by adipocytes and macro-phages,](https://img.pdfslide.fr/doc/110x75/5eb6a41459a2f8152e7ee083/changes-of-plasma-fabp4-crp-leptin-and-chemerin-levels-expression-4-fabp4.jpg)