Embed Size (px)
Citation preview
CO2 Adsorption on Ti3O6−: A Novel Carbonate Binding Motif
Sreekanta Debnath,†,‡ Xiaowei Song,‡ Matias R. Fagiani,†,‡ Marissa L. Weichman,§,∥ Min Gao,⊥,#
Satoshi Maeda,#,○ Tetsuya Taketsugu,#,○,□ Wieland Schollkopf,‡ Andrey Lyalin,*,□
Daniel M. Neumark,*,§,△ and Knut R. Asmis*,†
†Wilhelm-Ostwald-Institut fur Physikalische und Theoretische Chemie, Universitat Leipzig, Linnestrasse 2, D-04103 Leipzig,Germany‡Fritz-Haber-Institut der Max-Planck-Gesellschaft, Faradayweg 4-6, D-14195 Berlin, Germany§Department of Chemistry, University of California, Berkeley, California 94720, United States⊥Institute for Catalysis, Hokkaido University, Sapporo 001-0021, Japan#Department of Chemistry, Faculty of Science, Hokkaido University, Sapporo 060-0810, Japan○Institute for Chemical Reaction Design and Discovery (WPI-ICReDD), Hokkaido University, Sapporo 001-0021, Japan□Global Research Center for Environment and Energy based on Nanomaterials Science (GREEN), National Institute for MaterialScience (NIMS), Tsukuba 305-0044, Japan△Chemical Sciences Division, Lawrence Berkeley National Laboratory, Berkeley, California 94720, United States
*S Supporting Information
ABSTRACT: CO2 adsorption on Ti3O6−, which serves as a
model for an oxygen vacancy on a titania surface, is studiedusing infrared photodissociation (IRPD) spectroscopy incombination with density functional theory (DFT) and coupledcluster computations, as well as a recently developed multi-component artificial force induced reaction method. The IRPDspectra of D2-tagged [(Ti3O6)(CO2)n]
−, with n = 1, 2, arereported in the spectral window of 450−2400 cm−1 andassigned based on a comparison to harmonic IR spectra fromthe DFT calculations. We find that CO2 binding leaves theunpaired electron largely unperturbed. The first two CO2molecules adsorb chemically to Ti3O6
− by incorporating aformally doubly negatively charged, either doubly or triply coordinated O atom to form a bidentate or tridentate bridgingcarbonate dianion (CO3
2−), respectively. The latter binding motif exhibits a characteristic IR signature in the form of an intensedoublet of peaks near 1400 cm−1 stemming from two antisymmetric carbonate stretching modes.
1. INTRODUCTION
Steadily growing global energy consumption has led to a sharprise in atmospheric CO2 levels, one of the factors contributingto anthropogenic climate change. Hence, there is an increasingdemand for efficient methods to reduce atmospheric CO2 andconvert it into value-added chemicals using heterogeneouscatalysts.1,2 TiO2-based materials have been identified aspromising, cost-efficient candidates for CO2 sequestrationand conversion, considering their relative abundance in earth’scrust in combination with their photocatalytic activity.3−5 Toenhance the photocatalytic efficiency, it is necessary to developan understanding of the fundamental processes occurring atthe TiO2 interface. Adsorption studies of CO2 on titania, forexample, have focused on a molecular level characterization ofchemi- versus physisorption, that is, formation of bicarbonateor carbonate versus CO2 binding exclusively to a metal centerthrough one of its oxygen atoms, and are typically discussed inthe context of Lewis acids and bases, finding that stronger CO2
binding is promoted by higher oxygen basicity as well as highermetal acidity.6−9 Here, we employ a complementary approachto shed new light on TiO2−CO2 interactions. We use infraredphotodissociation (IRPD) spectroscopy, combined withdensity functional theory (DFT) calculations, to study CO2adsorption by the radical anion Ti3O6
− in the gas phase. Thiscluster represents a model for oxygen vacancies on titaniasurfaces.10 The goal of the present study is identifying thevibrational signatures of characteristic binding motifs in thevicinity of such defect sites.The Cs structure of Ti3O6
− (see Figure 1), characterizedpreviously by IRPD spectroscopy,10 exhibits two 4-foldcoordinated Ti4+ centers and one triply coordinated Ti3+
Special Issue: Hans-Joachim Freund and Joachim Sauer Festschrift
Received: November 3, 2018Revised: December 7, 2018Published: December 12, 2018
Article
pubs.acs.org/JPCCCite This: J. Phys. Chem. C 2019, 123, 8439−8446
© 2018 American Chemical Society 8439 DOI: 10.1021/acs.jpcc.8b10724J. Phys. Chem. C 2019, 123, 8439−8446
Dow
nloa
ded
via
UN
IV O
F C
AL
IFO
RN
IA B
ER
KE
LE
Y o
n A
pril
26, 2
019
at 2
1:30
:15
(UT
C).
Se
e ht
tps:
//pub
s.ac
s.or
g/sh
arin
ggui
delin
es f
or o
ptio
ns o
n ho
w to
legi
timat
ely
shar
e pu
blis
hed
artic
les.
center. The latter carries the spin density and represents thereactive center for hydrogen dissociation11 as well as wateradsorption.12 CO2 adsorption could be favorable at this site asit represents an electron donor site for the π acceptor CO2.However, there are many possible binding motifs known fromCO2 adsorption studies on titania surfaces7,8,13,14 and onneutral and small anionic titanium oxide clusters in the gasphase.15,16 These include chemisorbed monodentate, bridgingbidentate, chelating bidentate and tridentate carbonates,oxalates, as well as configurations with linear and bentphysisorbed CO2. A priori, it is unclear which binding motifsare preferred in the [Ti3O6(CO2)n]
− system. Our results showthat two types of tridentate carbonates, each with its owncharacteristic IR signature, are formed, an asymmetric and asymmetric one, of which the latter has not been reportedpreviously.
2. EXPERIMENTAL AND COMPUTATIONALMETHODSExperimental Methods. The IRPD experiments were
carried out with an ion trap tandem mass spectrometerdescribed previously.17,18 In brief, [Ti3O6(CO2)n]
− (n = 1, 2)clusters are produced in a dual gas channel pulsed laser-vaporization source operated at 50 Hz.11,19 The beam of ions
passes through a 4 mm diameter skimmer and is collimated ina radio frequency (RF) decapole ion-guide filled with Hebuffer-gas. Ions of interest are mass-selected according to theirmass/charge ratio using a quadrupole mass-filter (see FigureS1 for a characteristic mass spectrum of the [Ti3O6(CO2)n]
−
clusters studied here). The mass-selected beam is focused intoa cryogenically cooled RF ring-electrode ion trap. The trap iscontinuously filled with buffer gas (10% D2 in He) at a traptemperature of 13−15 K, which allows for the accumulationand thermalization of the trapped ions. Inside the trap, ionsundergo three-body collisions with the buffer gas, whichpromote the formation of weakly bound ion-D2 complexes.20
Ions are extracted from the ion trap at 5 Hz and are focusedinto the center of the extraction region of a time-of-flight(TOF) mass spectrometer, where they are irradiated by anintense and wavelength-tunable IR laser pulse from the IR freeelectron laser FHI FEL.21 When resonant with a rovibrationaltransition, the initially internally cold parent ions can absorbone (or more) photon(s), leading to loss of messengermolecules via intramolecular vibrational predissociation. Atsufficiently high pulse energies, loss of the more stronglybound CO2 molecules is also observed.The TOF intensities of all ions are monitored simulta-
neously as the FEL wavelength is scanned from 450 to 2400cm−1 in 3 cm−1 steps; for each wavelength step, ∼100 TOFtraces are acquired and averaged. Over this wavelength range,the FHI FEL has a spectral bandwidth ranging from 2 cm−1
fwhm at 450 to 7 cm−1 fwhm at 1200 cm−1, and a typicalenergy output of 10−30 mJ/pulse. Attenuated laser pulsesusing 12−33% of the full FEL power are employed in aparticular spectral window to ensure operation within a linearabsorption regime and to avoid saturation. Typically, at leastthree scans are summed, the photodissociation cross sectionσIRPD is determined as described previously,22,23 and the dataobtained in separately scanned ranges are stitched together toobtain the final IRPD spectrum.
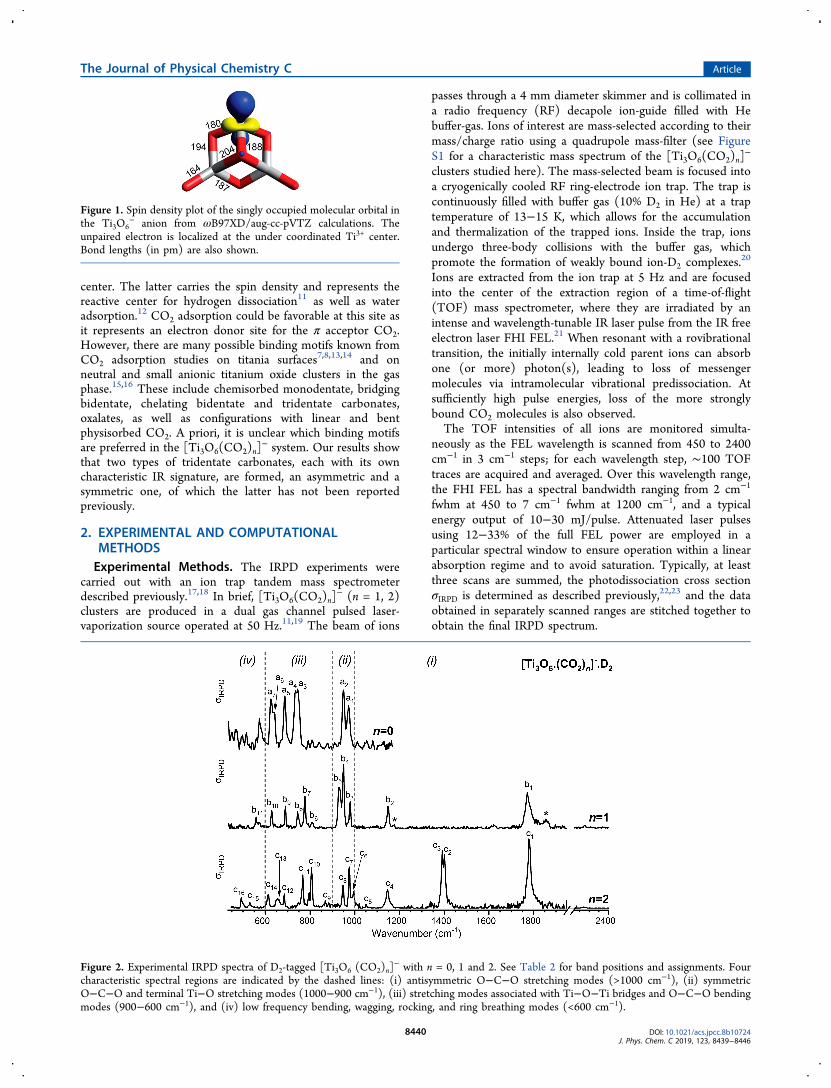
Figure 1. Spin density plot of the singly occupied molecular orbital inthe Ti3O6
− anion from ωB97XD/aug-cc-pVTZ calculations. Theunpaired electron is localized at the under coordinated Ti3+ center.Bond lengths (in pm) are also shown.
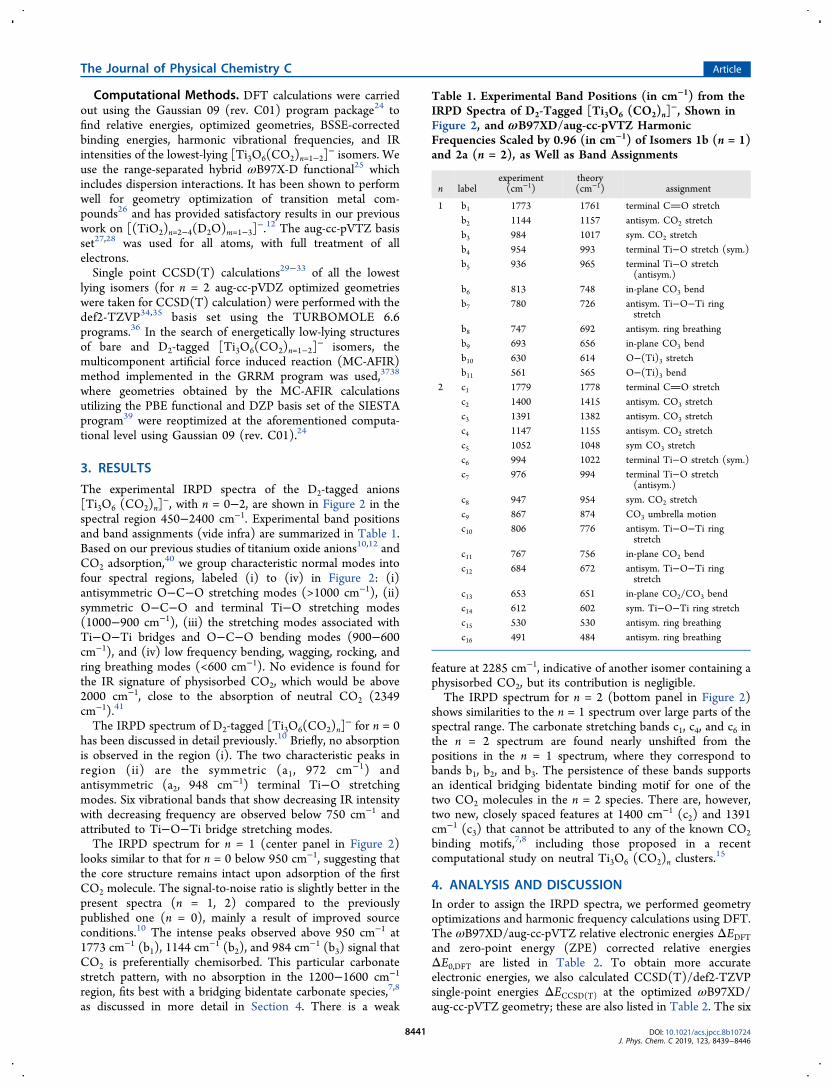
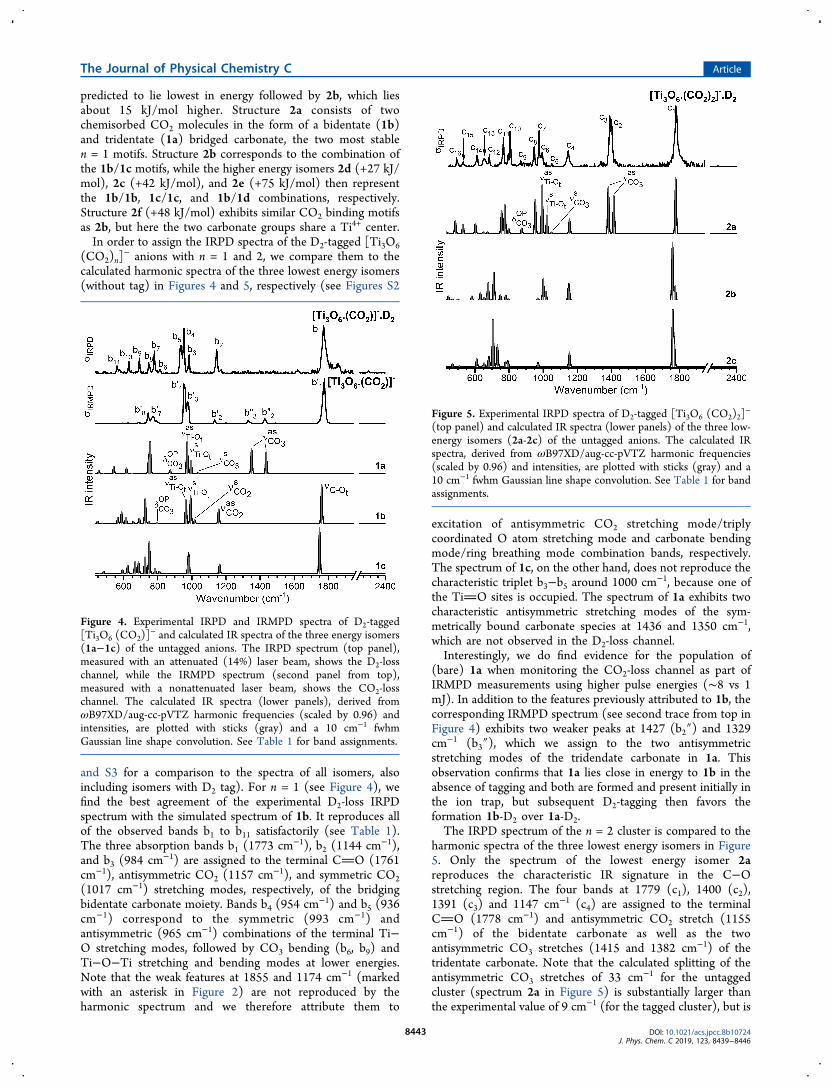
Figure 2. Experimental IRPD spectra of D2-tagged [Ti3O6 (CO2)n]− with n = 0, 1 and 2. See Table 2 for band positions and assignments. Four
characteristic spectral regions are indicated by the dashed lines: (i) antisymmetric O−C−O stretching modes (>1000 cm−1), (ii) symmetricO−C−O and terminal Ti−O stretching modes (1000−900 cm−1), (iii) stretching modes associated with Ti−O−Ti bridges and O−C−O bendingmodes (900−600 cm−1), and (iv) low frequency bending, wagging, rocking, and ring breathing modes (<600 cm−1).
The Journal of Physical Chemistry C Article
DOI: 10.1021/acs.jpcc.8b10724J. Phys. Chem. C 2019, 123, 8439−8446
8440
Computational Methods. DFT calculations were carriedout using the Gaussian 09 (rev. C01) program package24 tofind relative energies, optimized geometries, BSSE-correctedbinding energies, harmonic vibrational frequencies, and IRintensities of the lowest-lying [Ti3O6(CO2)n=1−2]
− isomers. Weuse the range-separated hybrid ωB97X-D functional25 whichincludes dispersion interactions. It has been shown to performwell for geometry optimization of transition metal com-pounds26 and has provided satisfactory results in our previouswork on [(TiO2)n=2−4(D2O)m=1−3]
−.12 The aug-cc-pVTZ basisset27,28 was used for all atoms, with full treatment of allelectrons.Single point CCSD(T) calculations29−33 of all the lowest
lying isomers (for n = 2 aug-cc-pVDZ optimized geometrieswere taken for CCSD(T) calculation) were performed with thedef2-TZVP34,35 basis set using the TURBOMOLE 6.6programs.36 In the search of energetically low-lying structuresof bare and D2-tagged [Ti3O6(CO2)n=1−2]
− isomers, themulticomponent artificial force induced reaction (MC-AFIR)method implemented in the GRRM program was used,3738
where geometries obtained by the MC-AFIR calculationsutilizing the PBE functional and DZP basis set of the SIESTAprogram39 were reoptimized at the aforementioned computa-tional level using Gaussian 09 (rev. C01).24
3. RESULTS
The experimental IRPD spectra of the D2-tagged anions[Ti3O6 (CO2)n]
−, with n = 0−2, are shown in Figure 2 in thespectral region 450−2400 cm−1. Experimental band positionsand band assignments (vide infra) are summarized in Table 1.Based on our previous studies of titanium oxide anions10,12 andCO2 adsorption,
40 we group characteristic normal modes intofour spectral regions, labeled (i) to (iv) in Figure 2: (i)antisymmetric O−C−O stretching modes (>1000 cm−1), (ii)symmetric O−C−O and terminal Ti−O stretching modes(1000−900 cm−1), (iii) the stretching modes associated withTi−O−Ti bridges and O−C−O bending modes (900−600cm−1), and (iv) low frequency bending, wagging, rocking, andring breathing modes (<600 cm−1). No evidence is found forthe IR signature of physisorbed CO2, which would be above2000 cm−1, close to the absorption of neutral CO2 (2349cm−1).41
The IRPD spectrum of D2-tagged [Ti3O6(CO2)n]− for n = 0
has been discussed in detail previously.10 Briefly, no absorptionis observed in the region (i). The two characteristic peaks inregion (ii) are the symmetric (a1, 972 cm−1) andantisymmetric (a2, 948 cm−1) terminal Ti−O stretchingmodes. Six vibrational bands that show decreasing IR intensitywith decreasing frequency are observed below 750 cm−1 andattributed to Ti−O−Ti bridge stretching modes.The IRPD spectrum for n = 1 (center panel in Figure 2)
looks similar to that for n = 0 below 950 cm−1, suggesting thatthe core structure remains intact upon adsorption of the firstCO2 molecule. The signal-to-noise ratio is slightly better in thepresent spectra (n = 1, 2) compared to the previouslypublished one (n = 0), mainly a result of improved sourceconditions.10 The intense peaks observed above 950 cm−1 at1773 cm−1 (b1), 1144 cm
−1 (b2), and 984 cm−1 (b3) signal that
CO2 is preferentially chemisorbed. This particular carbonatestretch pattern, with no absorption in the 1200−1600 cm−1
region, fits best with a bridging bidentate carbonate species,7,8
as discussed in more detail in Section 4. There is a weak
feature at 2285 cm−1, indicative of another isomer containing aphysisorbed CO2, but its contribution is negligible.The IRPD spectrum for n = 2 (bottom panel in Figure 2)
shows similarities to the n = 1 spectrum over large parts of thespectral range. The carbonate stretching bands c1, c4, and c6 inthe n = 2 spectrum are found nearly unshifted from thepositions in the n = 1 spectrum, where they correspond tobands b1, b2, and b3. The persistence of these bands supportsan identical bridging bidentate binding motif for one of thetwo CO2 molecules in the n = 2 species. There are, however,two new, closely spaced features at 1400 cm−1 (c2) and 1391cm−1 (c3) that cannot be attributed to any of the known CO2binding motifs,7,8 including those proposed in a recentcomputational study on neutral Ti3O6 (CO2)n clusters.
15
4. ANALYSIS AND DISCUSSIONIn order to assign the IRPD spectra, we performed geometryoptimizations and harmonic frequency calculations using DFT.The ωB97XD/aug-cc-pVTZ relative electronic energies ΔEDFTand zero-point energy (ZPE) corrected relative energiesΔE0,DFT are listed in Table 2. To obtain more accurateelectronic energies, we also calculated CCSD(T)/def2-TZVPsingle-point energies ΔECCSD(T) at the optimized ωB97XD/aug-cc-pVTZ geometry; these are also listed in Table 2. The six
Table 1. Experimental Band Positions (in cm−1) from theIRPD Spectra of D2-Tagged [Ti3O6 (CO2)n]
−, Shown inFigure 2, and ωB97XD/aug-cc-pVTZ HarmonicFrequencies Scaled by 0.96 (in cm−1) of Isomers 1b (n = 1)and 2a (n = 2), as Well as Band Assignments
n labelexperiment(cm−1)
theory(cm−1) assignment
1 b1 1773 1761 terminal CO stretchb2 1144 1157 antisym. CO2 stretchb3 984 1017 sym. CO2 stretchb4 954 993 terminal Ti−O stretch (sym.)b5 936 965 terminal Ti−O stretch
(antisym.)b6 813 748 in-plane CO3 bendb7 780 726 antisym. Ti−O−Ti ring
stretchb8 747 692 antisym. ring breathingb9 693 656 in-plane CO3 bendb10 630 614 O−(Ti)3 stretchb11 561 565 O−(Ti)3 bend
2 c1 1779 1778 terminal CO stretchc2 1400 1415 antisym. CO3 stretchc3 1391 1382 antisym. CO3 stretchc4 1147 1155 antisym. CO2 stretchc5 1052 1048 sym CO3 stretchc6 994 1022 terminal Ti−O stretch (sym.)c7 976 994 terminal Ti−O stretch
(antisym.)c8 947 954 sym. CO2 stretchc9 867 874 CO3 umbrella motionc10 806 776 antisym. Ti−O−Ti ring
stretchc11 767 756 in-plane CO2 bendc12 684 672 antisym. Ti−O−Ti ring
stretchc13 653 651 in-plane CO2/CO3 bendc14 612 602 sym. Ti−O−Ti ring stretchc15 530 530 antisym. ring breathingc16 491 484 antisym. ring breathing
The Journal of Physical Chemistry C Article
DOI: 10.1021/acs.jpcc.8b10724J. Phys. Chem. C 2019, 123, 8439−8446
8441
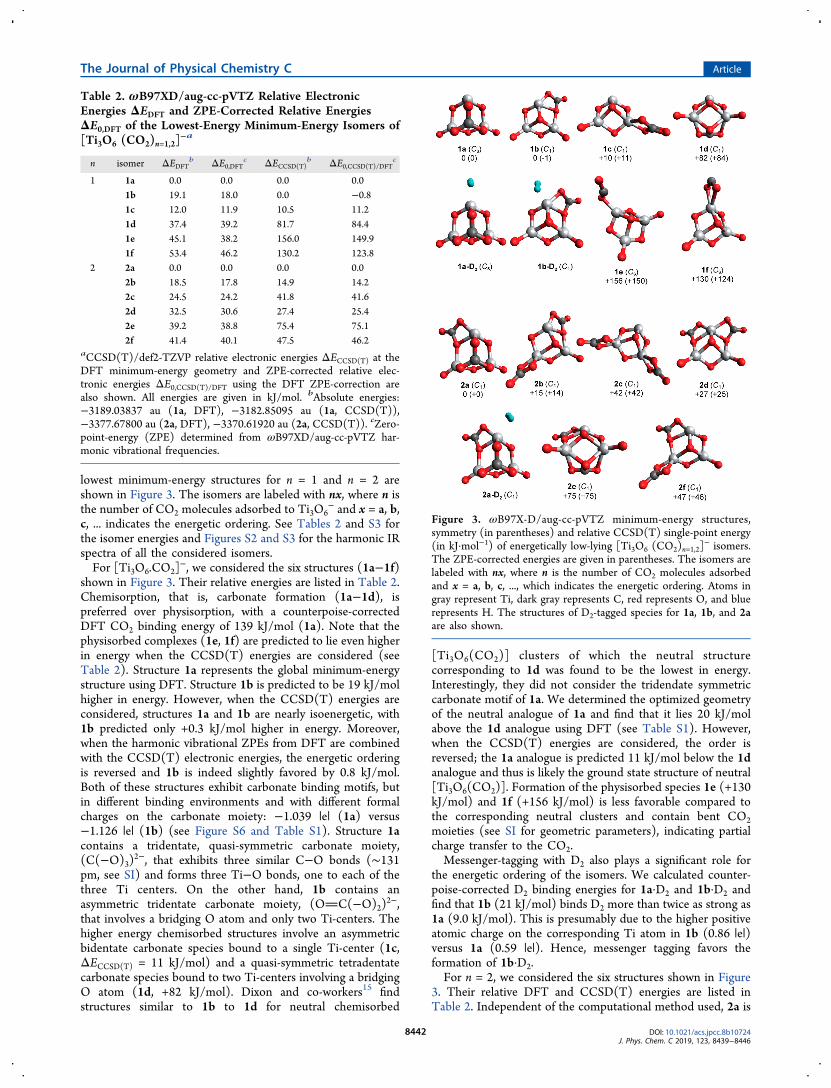
lowest minimum-energy structures for n = 1 and n = 2 areshown in Figure 3. The isomers are labeled with nx, where n isthe number of CO2 molecules adsorbed to Ti3O6
− and x = a, b,c, ... indicates the energetic ordering. See Tables 2 and S3 forthe isomer energies and Figures S2 and S3 for the harmonic IRspectra of all the considered isomers.For [Ti3O6.CO2]
−, we considered the six structures (1a−1f)shown in Figure 3. Their relative energies are listed in Table 2.Chemisorption, that is, carbonate formation (1a−1d), ispreferred over physisorption, with a counterpoise-correctedDFT CO2 binding energy of 139 kJ/mol (1a). Note that thephysisorbed complexes (1e, 1f) are predicted to lie even higherin energy when the CCSD(T) energies are considered (seeTable 2). Structure 1a represents the global minimum-energystructure using DFT. Structure 1b is predicted to be 19 kJ/molhigher in energy. However, when the CCSD(T) energies areconsidered, structures 1a and 1b are nearly isoenergetic, with1b predicted only +0.3 kJ/mol higher in energy. Moreover,when the harmonic vibrational ZPEs from DFT are combinedwith the CCSD(T) electronic energies, the energetic orderingis reversed and 1b is indeed slightly favored by 0.8 kJ/mol.Both of these structures exhibit carbonate binding motifs, butin different binding environments and with different formalcharges on the carbonate moiety: −1.039 |e| (1a) versus−1.126 |e| (1b) (see Figure S6 and Table S1). Structure 1acontains a tridentate, quasi-symmetric carbonate moiety,(C(−O)3)2−, that exhibits three similar C−O bonds (∼131pm, see SI) and forms three Ti−O bonds, one to each of thethree Ti centers. On the other hand, 1b contains anasymmetric tridentate carbonate moiety, (OC(−O)2)2−,that involves a bridging O atom and only two Ti-centers. Thehigher energy chemisorbed structures involve an asymmetricbidentate carbonate species bound to a single Ti-center (1c,ΔECCSD(T) = 11 kJ/mol) and a quasi-symmetric tetradentatecarbonate species bound to two Ti-centers involving a bridgingO atom (1d, +82 kJ/mol). Dixon and co-workers15 findstructures similar to 1b to 1d for neutral chemisorbed
[Ti3O6(CO2)] clusters of which the neutral structurecorresponding to 1d was found to be the lowest in energy.Interestingly, they did not consider the tridendate symmetriccarbonate motif of 1a. We determined the optimized geometryof the neutral analogue of 1a and find that it lies 20 kJ/molabove the 1d analogue using DFT (see Table S1). However,when the CCSD(T) energies are considered, the order isreversed; the 1a analogue is predicted 11 kJ/mol below the 1danalogue and thus is likely the ground state structure of neutral[Ti3O6(CO2)]. Formation of the physisorbed species 1e (+130kJ/mol) and 1f (+156 kJ/mol) is less favorable compared tothe corresponding neutral clusters and contain bent CO2moieties (see SI for geometric parameters), indicating partialcharge transfer to the CO2.Messenger-tagging with D2 also plays a significant role for
the energetic ordering of the isomers. We calculated counter-poise-corrected D2 binding energies for 1a·D2 and 1b·D2 andfind that 1b (21 kJ/mol) binds D2 more than twice as strong as1a (9.0 kJ/mol). This is presumably due to the higher positiveatomic charge on the corresponding Ti atom in 1b (0.86 |e|)versus 1a (0.59 |e|). Hence, messenger tagging favors theformation of 1b·D2.For n = 2, we considered the six structures shown in Figure
3. Their relative DFT and CCSD(T) energies are listed inTable 2. Independent of the computational method used, 2a is
Table 2. ωB97XD/aug-cc-pVTZ Relative ElectronicEnergies ΔEDFT and ZPE-Corrected Relative EnergiesΔE0,DFT of the Lowest-Energy Minimum-Energy Isomers of[Ti3O6 (CO2)n=1,2]
−a
n isomer ΔEDFTb ΔE0,DFT
c ΔECCSD(T)b ΔE0,CCSD(T)/DFTc
1 1a 0.0 0.0 0.0 0.01b 19.1 18.0 0.0 −0.81c 12.0 11.9 10.5 11.21d 37.4 39.2 81.7 84.41e 45.1 38.2 156.0 149.91f 53.4 46.2 130.2 123.8
2 2a 0.0 0.0 0.0 0.02b 18.5 17.8 14.9 14.22c 24.5 24.2 41.8 41.62d 32.5 30.6 27.4 25.42e 39.2 38.8 75.4 75.12f 41.4 40.1 47.5 46.2
aCCSD(T)/def2-TZVP relative electronic energies ΔECCSD(T) at theDFT minimum-energy geometry and ZPE-corrected relative elec-tronic energies ΔE0,CCSD(T)/DFT using the DFT ZPE-correction arealso shown. All energies are given in kJ/mol. bAbsolute energies:−3189.03837 au (1a, DFT), −3182.85095 au (1a, CCSD(T)),−3377.67800 au (2a, DFT), −3370.61920 au (2a, CCSD(T)). cZero-point-energy (ZPE) determined from ωB97XD/aug-cc-pVTZ har-monic vibrational frequencies.
Figure 3. ωB97X-D/aug-cc-pVTZ minimum-energy structures,symmetry (in parentheses) and relative CCSD(T) single-point energy(in kJ·mol−1) of energetically low-lying [Ti3O6 (CO2)n=1,2]
− isomers.The ZPE-corrected energies are given in parentheses. The isomers arelabeled with nx, where n is the number of CO2 molecules adsorbedand x = a, b, c, ..., which indicates the energetic ordering. Atoms ingray represent Ti, dark gray represents C, red represents O, and bluerepresents H. The structures of D2-tagged species for 1a, 1b, and 2aare also shown.
The Journal of Physical Chemistry C Article
DOI: 10.1021/acs.jpcc.8b10724J. Phys. Chem. C 2019, 123, 8439−8446
8442
predicted to lie lowest in energy followed by 2b, which liesabout 15 kJ/mol higher. Structure 2a consists of twochemisorbed CO2 molecules in the form of a bidentate (1b)and tridentate (1a) bridged carbonate, the two most stablen = 1 motifs. Structure 2b corresponds to the combination ofthe 1b/1c motifs, while the higher energy isomers 2d (+27 kJ/mol), 2c (+42 kJ/mol), and 2e (+75 kJ/mol) then representthe 1b/1b, 1c/1c, and 1b/1d combinations, respectively.Structure 2f (+48 kJ/mol) exhibits similar CO2 binding motifsas 2b, but here the two carbonate groups share a Ti4+ center.In order to assign the IRPD spectra of the D2-tagged [Ti3O6
(CO2)n]− anions with n = 1 and 2, we compare them to the
calculated harmonic spectra of the three lowest energy isomers(without tag) in Figures 4 and 5, respectively (see Figures S2
and S3 for a comparison to the spectra of all isomers, alsoincluding isomers with D2 tag). For n = 1 (see Figure 4), wefind the best agreement of the experimental D2-loss IRPDspectrum with the simulated spectrum of 1b. It reproduces allof the observed bands b1 to b11 satisfactorily (see Table 1).The three absorption bands b1 (1773 cm−1), b2 (1144 cm−1),and b3 (984 cm−1) are assigned to the terminal CO (1761cm−1), antisymmetric CO2 (1157 cm−1), and symmetric CO2(1017 cm−1) stretching modes, respectively, of the bridgingbidentate carbonate moiety. Bands b4 (954 cm−1) and b5 (936cm−1) correspond to the symmetric (993 cm−1) andantisymmetric (965 cm−1) combinations of the terminal Ti−O stretching modes, followed by CO3 bending (b6, b9) andTi−O−Ti stretching and bending modes at lower energies.Note that the weak features at 1855 and 1174 cm−1 (markedwith an asterisk in Figure 2) are not reproduced by theharmonic spectrum and we therefore attribute them to
excitation of antisymmetric CO2 stretching mode/triplycoordinated O atom stretching mode and carbonate bendingmode/ring breathing mode combination bands, respectively.The spectrum of 1c, on the other hand, does not reproduce thecharacteristic triplet b3−b5 around 1000 cm−1, because one ofthe TiO sites is occupied. The spectrum of 1a exhibits twocharacteristic antisymmetric stretching modes of the sym-metrically bound carbonate species at 1436 and 1350 cm−1,which are not observed in the D2-loss channel.Interestingly, we do find evidence for the population of
(bare) 1a when monitoring the CO2-loss channel as part ofIRMPD measurements using higher pulse energies (∼8 vs 1mJ). In addition to the features previously attributed to 1b, thecorresponding IRMPD spectrum (see second trace from top inFigure 4) exhibits two weaker peaks at 1427 (b2″) and 1329cm−1 (b3″), which we assign to the two antisymmetricstretching modes of the tridendate carbonate in 1a. Thisobservation confirms that 1a lies close in energy to 1b in theabsence of tagging and both are formed and present initially inthe ion trap, but subsequent D2-tagging then favors theformation 1b-D2 over 1a-D2.The IRPD spectrum of the n = 2 cluster is compared to the
harmonic spectra of the three lowest energy isomers in Figure5. Only the spectrum of the lowest energy isomer 2areproduces the characteristic IR signature in the C−Ostretching region. The four bands at 1779 (c1), 1400 (c2),1391 (c3) and 1147 cm−1 (c4) are assigned to the terminalCO (1778 cm−1) and antisymmetric CO2 stretch (1155cm−1) of the bidentate carbonate as well as the twoantisymmetric CO3 stretches (1415 and 1382 cm−1) of thetridentate carbonate. Note that the calculated splitting of theantisymmetric CO3 stretches of 33 cm−1 for the untaggedcluster (spectrum 2a in Figure 5) is substantially larger thanthe experimental value of 9 cm−1 (for the tagged cluster), but is
Figure 4. Experimental IRPD and IRMPD spectra of D2-tagged[Ti3O6 (CO2)]
− and calculated IR spectra of the three energy isomers(1a−1c) of the untagged anions. The IRPD spectrum (top panel),measured with an attenuated (14%) laser beam, shows the D2-losschannel, while the IRMPD spectrum (second panel from top),measured with a nonattenuated laser beam, shows the CO2-losschannel. The calculated IR spectra (lower panels), derived fromωB97XD/aug-cc-pVTZ harmonic frequencies (scaled by 0.96) andintensities, are plotted with sticks (gray) and a 10 cm−1 fwhmGaussian line shape convolution. See Table 1 for band assignments.
Figure 5. Experimental IRPD spectra of D2-tagged [Ti3O6 (CO2)2]−
(top panel) and calculated IR spectra (lower panels) of the three low-energy isomers (2a-2c) of the untagged anions. The calculated IRspectra, derived from ωB97XD/aug-cc-pVTZ harmonic frequencies(scaled by 0.96) and intensities, are plotted with sticks (gray) and a10 cm−1 fwhm Gaussian line shape convolution. See Table 1 for bandassignments.
The Journal of Physical Chemistry C Article
DOI: 10.1021/acs.jpcc.8b10724J. Phys. Chem. C 2019, 123, 8439−8446
8443
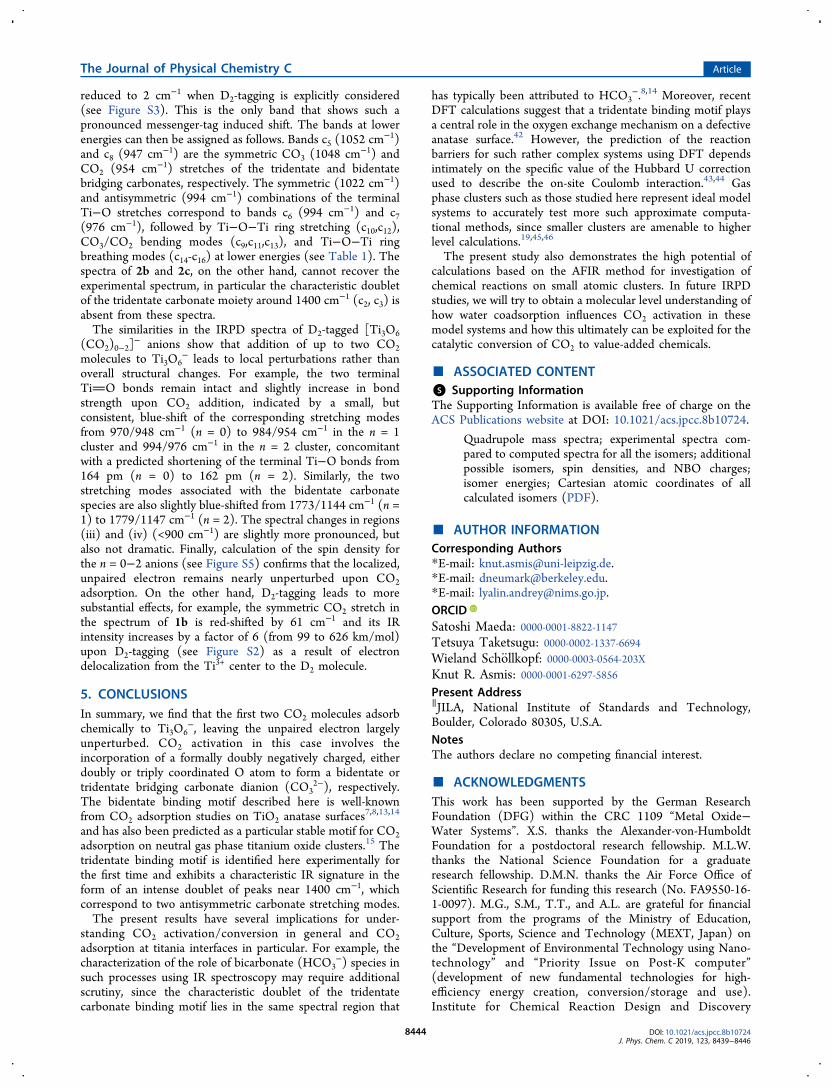
reduced to 2 cm−1 when D2-tagging is explicitly considered(see Figure S3). This is the only band that shows such apronounced messenger-tag induced shift. The bands at lowerenergies can then be assigned as follows. Bands c5 (1052 cm
−1)and c8 (947 cm−1) are the symmetric CO3 (1048 cm−1) andCO2 (954 cm−1) stretches of the tridentate and bidentatebridging carbonates, respectively. The symmetric (1022 cm−1)and antisymmetric (994 cm−1) combinations of the terminalTi−O stretches correspond to bands c6 (994 cm−1) and c7(976 cm−1), followed by Ti−O−Ti ring stretching (c10,c12),CO3/CO2 bending modes (c9,c11,c13), and Ti−O−Ti ringbreathing modes (c14-c16) at lower energies (see Table 1). Thespectra of 2b and 2c, on the other hand, cannot recover theexperimental spectrum, in particular the characteristic doubletof the tridentate carbonate moiety around 1400 cm−1 (c2, c3) isabsent from these spectra.The similarities in the IRPD spectra of D2-tagged [Ti3O6
(CO2)0−2]− anions show that addition of up to two CO2
molecules to Ti3O6− leads to local perturbations rather than
overall structural changes. For example, the two terminalTiO bonds remain intact and slightly increase in bondstrength upon CO2 addition, indicated by a small, butconsistent, blue-shift of the corresponding stretching modesfrom 970/948 cm−1 (n = 0) to 984/954 cm−1 in the n = 1cluster and 994/976 cm−1 in the n = 2 cluster, concomitantwith a predicted shortening of the terminal Ti−O bonds from164 pm (n = 0) to 162 pm (n = 2). Similarly, the twostretching modes associated with the bidentate carbonatespecies are also slightly blue-shifted from 1773/1144 cm−1 (n =1) to 1779/1147 cm−1 (n = 2). The spectral changes in regions(iii) and (iv) (<900 cm−1) are slightly more pronounced, butalso not dramatic. Finally, calculation of the spin density forthe n = 0−2 anions (see Figure S5) confirms that the localized,unpaired electron remains nearly unperturbed upon CO2adsorption. On the other hand, D2-tagging leads to moresubstantial effects, for example, the symmetric CO2 stretch inthe spectrum of 1b is red-shifted by 61 cm−1 and its IRintensity increases by a factor of 6 (from 99 to 626 km/mol)upon D2-tagging (see Figure S2) as a result of electrondelocalization from the Ti3+ center to the D2 molecule.
5. CONCLUSIONSIn summary, we find that the first two CO2 molecules adsorbchemically to Ti3O6
−, leaving the unpaired electron largelyunperturbed. CO2 activation in this case involves theincorporation of a formally doubly negatively charged, eitherdoubly or triply coordinated O atom to form a bidentate ortridentate bridging carbonate dianion (CO3
2−), respectively.The bidentate binding motif described here is well-knownfrom CO2 adsorption studies on TiO2 anatase surfaces7,8,13,14
and has also been predicted as a particular stable motif for CO2adsorption on neutral gas phase titanium oxide clusters.15 Thetridentate binding motif is identified here experimentally forthe first time and exhibits a characteristic IR signature in theform of an intense doublet of peaks near 1400 cm−1, whichcorrespond to two antisymmetric carbonate stretching modes.The present results have several implications for under-
standing CO2 activation/conversion in general and CO2adsorption at titania interfaces in particular. For example, thecharacterization of the role of bicarbonate (HCO3
−) species insuch processes using IR spectroscopy may require additionalscrutiny, since the characteristic doublet of the tridentatecarbonate binding motif lies in the same spectral region that
has typically been attributed to HCO3−.8,14 Moreover, recent
DFT calculations suggest that a tridentate binding motif playsa central role in the oxygen exchange mechanism on a defectiveanatase surface.42 However, the prediction of the reactionbarriers for such rather complex systems using DFT dependsintimately on the specific value of the Hubbard U correctionused to describe the on-site Coulomb interaction.43,44 Gasphase clusters such as those studied here represent ideal modelsystems to accurately test more such approximate computa-tional methods, since smaller clusters are amenable to higherlevel calculations.19,45,46
The present study also demonstrates the high potential ofcalculations based on the AFIR method for investigation ofchemical reactions on small atomic clusters. In future IRPDstudies, we will try to obtain a molecular level understanding ofhow water coadsorption influences CO2 activation in thesemodel systems and how this ultimately can be exploited for thecatalytic conversion of CO2 to value-added chemicals.
■ ASSOCIATED CONTENT*S Supporting InformationThe Supporting Information is available free of charge on theACS Publications website at DOI: 10.1021/acs.jpcc.8b10724.
Quadrupole mass spectra; experimental spectra com-pared to computed spectra for all the isomers; additionalpossible isomers, spin densities, and NBO charges;isomer energies; Cartesian atomic coordinates of allcalculated isomers (PDF).
■ AUTHOR INFORMATIONCorresponding Authors*E-mail: [email protected].*E-mail: [email protected].*E-mail: [email protected] Maeda: 0000-0001-8822-1147Tetsuya Taketsugu: 0000-0002-1337-6694Wieland Schollkopf: 0000-0003-0564-203XKnut R. Asmis: 0000-0001-6297-5856Present Address∥JILA, National Institute of Standards and Technology,Boulder, Colorado 80305, U.S.A.NotesThe authors declare no competing financial interest.
■ ACKNOWLEDGMENTSThis work has been supported by the German ResearchFoundation (DFG) within the CRC 1109 “Metal Oxide−Water Systems”. X.S. thanks the Alexander-von-HumboldtFoundation for a postdoctoral research fellowship. M.L.W.thanks the National Science Foundation for a graduateresearch fellowship. D.M.N. thanks the Air Force Office ofScientific Research for funding this research (No. FA9550-16-1-0097). M.G., S.M., T.T., and A.L. are grateful for financialsupport from the programs of the Ministry of Education,Culture, Sports, Science and Technology (MEXT, Japan) onthe “Development of Environmental Technology using Nano-technology” and “Priority Issue on Post-K computer”(development of new fundamental technologies for high-efficiency energy creation, conversion/storage and use).Institute for Chemical Reaction Design and Discovery
The Journal of Physical Chemistry C Article
DOI: 10.1021/acs.jpcc.8b10724J. Phys. Chem. C 2019, 123, 8439−8446
8444
(ICRD) was established by World Premier InternationalResearch Initiative (WPI), MEXT, Japan. A.L. and T.T.gratefully acknowledge the financial support of JSPSKAKENHI Grant Nos. 15K05387 and 16KT0047, respec-tively.
■ REFERENCES(1) Habisreutinger, S. N.; Schmidt-Mende, L.; Stolarczyk, J. K.Photocatalytic reduction of CO2 on TiO2 and other semiconductors.Angew. Chem., Int. Ed. 2013, 52, 7372−7408.(2) Civis, S.; Ferus, M.; Knízek, A.; Kubelík, P.; Kavan, L.; Zukalova,M. Photocatalytic transformation of CO2 to CH4 and CO on acidicsurface of TiO2 anatase. Opt. Mater. 2016, 56, 80−83.(3) Linsebigler, A. L.; Lu, G.; Yates, J. T. Photocatalysis on TiO2surfaces: Principles, mechanisms, and selected results. Chem. Rev.1995, 95, 735−758.(4) Thompson, T. L.; Yates, J. T. Surface science studies of thephotoactivation of TiO2: New photochemical processes. Chem. Rev.2006, 106, 4428−4453.(5) Guo, Q.; Zhou, C.; Ma, Z.; Ren, Z.; Fan, H.; Yang, X.Elementary photocatalytic chemistry on TiO2 surfaces. Chem. Soc. Rev.2016, 45, 3701−3730.(6) Martra, G. Lewis acid and base sites at the surface ofmicrocrystalline TiO2 anatase: relationships between surfacemorphology and chemical behaviour. Appl. Catal., A 2000, 200,275−285.(7) Liao, L. F.; Lien, C. F.; Shieh, D. L.; Chen, M. T.; Lin, J. L. FTIRstudy of adsorption and photoassisted oxygen isotopic exchange ofcarbon monoxide, carbon dioxide, carbonate, and formate on TiO2. J.Phys. Chem. B 2002, 106, 11240−11245.(8) Mino, L.; Spoto, G.; Ferrari, A. M. CO2 capture by TiO2 anatasesurfaces: A combined DFT and FTIR study. J. Phys. Chem. C 2014,118, 25016−25026.(9) He, H.; Zapol, P.; Curtiss, L. A. A theoretical study of CO2anions on anatase (101) surface. J. Phys. Chem. C 2010, 114, 21474−21481.(10) Weichman, M. L.; Song, X. W.; Fagiani, M. R.; Debnath, S.;Gewinner, S.; Schollkopf, W.; Neumark, D. M.; Asmis, K. R. Gasphase vibrational spectroscopy of cold (TiO2)n
− (n = 3−8) clusters. J.Chem. Phys. 2016, 144, 124308.(11) Song, X. W.; Fagiani, M. R.; Debnath, S.; Gao, M.; Maeda, S.;Taketsugu, T.; Gewinner, S.; Schollkopf, W.; Asmis, K. R.; Lyalin, A.Excess charge driven dissociative hydrogen adsorption on Ti2O4
−.Phys. Chem. Chem. Phys. 2017, 19, 23154−23161.(12) Weichman, M. L.; Debnath, S.; Kelly, J. T.; Gewinner, S.;Schollkopf, W.; Neumark, D. M.; Asmis, K. R. Dissociative wateradsorption on gas-phase titanium dioxide cluster anions probed withinfrared photodissociation spectroscopy. Top. Catal. 2018, 61, 92−105.(13) Freund, H. J.; Roberts, M. W. Surface chemistry of carbondioxide. Surf. Sci. Rep. 1996, 25, 225−273.(14) Su, W. G.; Zhang, J.; Feng, Z. C.; Chen, T.; Ying, P. L.; Li, C.Surface phases of TiO2 nanoparticles studied by UV Ramanspectroscopy and FT-IR spectroscopy. J. Phys. Chem. C 2008, 112,7710−7716.(15) Flores, L. A.; Murphy, J. G.; Copeland, W. B.; Dixon, D. A.Reaction of CO2 with groups 4 and 6 transition metal oxide clusters. J.Phys. Chem. A 2017, 121, 8719−8727.(16) Dodson, L. G.; Thompson, M. C.; Weber, J. M. Interactions ofmolecular titanium oxides TiOx (x = 1−3) with carbon dioxide incluster anions. J. Phys. Chem. A 2018, 122, 6909−6917.(17) Goebbert, D. J.; Meijer, G.; Asmis, K. R. 10K ring electrodetrap - tandem mass spectrometer for infrared spectroscopy of massselected ions. AIP Conf. Proc. 2008, 1104, 22−29.(18) Goebbert, D. J.; Garand, E.; Wende, T.; Bergmann, R.; Meijer,G.; Asmis, K. R.; Neumark, D. M. Infrared spectroscopy of themicrohydrated nitrate ions NO3
−(H2O)1−6. J. Phys. Chem. A 2009,113, 7584−7592.
(19) Fagiani, M. R.; Song, X.; Debnath, S.; Gewinner, S.; Schollkopf,W.; Asmis, K. R.; Bischoff, F. A.; Muller, F.; Sauer, J. Dissociativewater adsorption by Al3O4
+ in the gas phase. J. Phys. Chem. Lett. 2017,8, 1272−1277.(20) Brummer, M.; Kaposta, C.; Santambrogio, G.; Asmis, K. R.Formation and photodepletion of cluster ion-messenger atomcomplexes in a cold ion trap: Infrared spectroscopy of VO+, VO2
+,and VO3
+. J. Chem. Phys. 2003, 119, 12700−12703.(21) Schollkopf, W.; Gewinner, S.; Junkes, H.; Paarmann, A.; vonHelden, G.; Bluem, H.; Todd, A. M. M. The new IR and THz FELfacility at the Fritz Haber Institute in Berlin. Proc SPIE, 2015, 9512,95121L.(22) Heine, N.; Asmis, K. R. Cryogenic ion trap vibrationalspectroscopy of hydrogen-bonded clusters relevant to atmosphericchemistry. Int. Rev. Phys. Chem. 2015, 34, 1−34.(23) Heine, N.; Asmis, K. R. Cryogenic ion trap vibrationalspectroscopy of hydrogen-bonded clusters relevant to atmosphericchemistry (vol 34, pg 1, 2015). Int. Rev. Phys. Chem. 2016, 35, 507−507.(24) Frisch, M. J.; Trucks, G. W.; Schlegel, H. B.; Scuseria, G. E.;Robb, M. A.; Cheeseman, J. R.; Scalmani, G.; Barone, V.; Mennucci,B.; Petersson, G. A.; et al. Gaussian 09, version D01; Gaussian, Inc.:Wallingford, CT, U.S.A., 2009.(25) Chai, J.-D.; Head-Gordon, M. Long-range corrected hybriddensity functionals with damped atom-atom dispersion corrections.Phys. Chem. Chem. Phys. 2008, 10, 6615−6620.(26) Minenkov, Y.; Singstad, A.; Occhipinti, G.; Jensen, V. R. Theaccuracy of DFT-optimized geometries of functional transition metalcompounds: a validation study of catalysts for olefin metathesis andother reactions in the homogeneous phase. Dalton Trans. 2012, 41,5526−5541.(27) Kendall, R. A.; D, T. H., Jr.; Harrison, R. J. Electron affinities ofthe first-row atoms revisited. Systematic basis sets and wave functions.J. Chem. Phys. 1992, 96, 6796−6806.(28) Davidson, E. R. Comment on “Comment on Dunning’scorrelation-consistent basis sets. Chem. Phys. Lett. 1996, 260, 514−518.(29) Noga, J.; Bartlett, R. J. The full CCSDT model for molecularelectronic structure. J. Chem. Phys. 1987, 86, 7041−7050.(30) Urban, M.; Noga, J.; Cole, S. J.; Bartlett, R. J. Towards a fullCCSDT model for electron correlation. J. Chem. Phys. 1985, 83,4041−4046.(31) Stanton, J. F. Why CCSD(T) works: a different perspective.Chem. Phys. Lett. 1997, 281, 130−134.(32) Raghavachari, K.; Trucks, G. W.; Pople, J. A.; Head-Gordon, M.A fifth-order perturbation comparison of electron correlation theories.Chem. Phys. Lett. 1989, 157, 479−483.(33) Bartlett, R. J.; Musiał, M. Coupled-cluster theory in quantumchemistry. Rev. Mod. Phys. 2007, 79, 291−352.(34) Weigend, F.; Ahlrichs, R. Balanced basis sets of split valence,triple zeta valence and quadruple zeta valence quality for H to Rn:Design and assessment of accuracy. Phys. Chem. Chem. Phys. 2005, 7,3297−3305.(35) Hellweg, A.; Hattig, C.; Hofener, S.; Klopper, W. Optimizedaccurate auxiliary basis sets for RI-MP2 and RI-CC2 calculations forthe atoms Rb to Rn. Theor. Chem. Acc. 2007, 117, 587−597.(36) Ahlrichs, R.; Bar, M.; Haser, M.; Horn, H.; Kolmel, C.Electronic structure calculations on workstation computers: Theprogram system turbomole. Chem. Phys. Lett. 1989, 162, 165−169.(37) Maeda, S.; Ohno, K.; Morokuma, K. Systematic exploration ofthe mechanism of chemical reactions: the global reaction routemapping (GRRM) strategy using the ADDF and AFIR methods. Phys.Chem. Chem. Phys. 2013, 15, 3683−3701.(38) Maeda, S.; Harabuchi, Y.; Sumiya, Y.; Takagi, M.; Suzuki, K.;Hatanaka, M.; Osada, Y.; Taketsugu, T.; Morokuma, K.; Ohno, K.GRRM, a developmental version at Hokkaido University; https://afir.sci.hokudai.ac.jp (accessed 29 August, 2018).
The Journal of Physical Chemistry C Article
DOI: 10.1021/acs.jpcc.8b10724J. Phys. Chem. C 2019, 123, 8439−8446
8445
(39) Jose, M. S.; Emilio, A.; Julian, D. G.; Alberto, G.; Javier, J.;Pablo, O.; Daniel, S.-P. The SIESTA method for ab initio order- Nmaterials simulation. J. Phys.: Condens. Matter 2002, 14, 2745.(40) Miller, G. B. S.; Esser, T. K.; Knorke, H.; Gewinner, S.;Schoellkopf, W.; Heine, N.; Asmis, K. R.; Uggerud, E. Spectroscopicidentification of a bidentate binding motif in the anionic magnesium-CO2 complex ([ClMgCO2]
−). Angew. Chem., Int. Ed. 2014, 53,14407−14410.(41) Shimanouchi, T. Tables of molecular vibrational frequenciesconsolidated; National Bureau of Standards, 1972; Vol. 1, pp 1−160.(42) Sorescu, D. C.; Civis, S.; Jordan, K. D. Mechanism of oxygenexchange between CO2 and TiO2(101) anatase. J. Phys. Chem. C2014, 118, 1628−1639.(43) Anisimov, V. I.; Zaanen, J.; Andersen, O. K. Band theory andMott insulatoras - Hubbard-U instead of Stoner-I. Phys. Rev. B:Condens. Matter Mater. Phys. 1991, 44, 943−954.(44) Dudarev, S. L.; Botton, G. A.; Savrasov, S. Y.; Humphreys, C. J.;Sutton, A. P. Electron-energy-loss spectra and the structural stabilityof nickel oxide: An LSDA+U study. Phys. Rev. B: Condens. MatterMater. Phys. 1998, 57, 1505−1509.(45) Burow, A. M.; Wende, T.; Sierka, M.; Wlodarczyk, R.; Sauer, J.;Claes, P.; Jiang, L.; Meijer, G.; Lievens, P.; Asmis, K. R. Structures andvibrational spectroscopy of partially reduced gas-phase cerium oxideclusters. Phys. Chem. Chem. Phys. 2011, 13, 19393−19400.(46) Jiang, L.; Wende, T.; Claes, P.; Bhattacharyya, S.; Sierka, M.;Meijer, G.; Lievens, P.; Sauer, J.; Asmis, K. R. Electron distribution inpartially reduced mixed metal oxide systems: Infrared spectroscopy ofCemVnOo
+ gas phase clusters. J. Phys. Chem. A 2011, 115, 11187−11192.
The Journal of Physical Chemistry C Article
DOI: 10.1021/acs.jpcc.8b10724J. Phys. Chem. C 2019, 123, 8439−8446
8446


![Infinite dimensional Riemannian symmetric spaces with ... › article › AIF_2015__65_1_211_0.pdf · INFINITE DIMENSIONAL RIEMANNIAN SYMMETRIC SPACES 213 appears in [9]. Moreover,](https://img.pdfslide.fr/doc/110x75/5f03a1987e708231d40a00f6/infinite-dimensional-riemannian-symmetric-spaces-with-a-article-a-aif20156512110pdf.jpg)