Embed Size (px)
Citation preview
Deutsche BankJune 2007
http://www.loreal-finance.com
-------------------------Avertissement / Disclaimer -------------------------
«Ce document ne constitue pas une offre de vente ou la sollicitation d’une offre d’achat de titres L’Oréal. Si vous souhaitez obtenir des informations plus complètes concernant L’Oréal, nous vous invitons à vous reporter aux documents publics déposés en France auprès de l’Autorité des Marchés Financiers (également disponibles en version anglaise sur notre site Internet www.loreal-finance.com).Ce document peut contenir certaines déclarations de nature prévisionnelle. Bien que la Société estime que ces déclarations reposent sur des hypothèses raisonnables à la date de publication du présent communiqué, elles sont par nature soumises à des risques et incertitudes pouvant donner lieu à un écart entre les chiffres réels et ceux indiqués ou induits dans ces déclarations.»
"This document does not constitute an offer to sell, or a solicitation of an offer to buy, L’Oréal shares. If you wish to obtainmore comprehensive information about L’Oréal, please refer to the public documents registered in France with the Autorité des Marchés Financiers (which are also available in English on our Internet site: www.loreal-finance.com).This document maycontain some forward-looking statements. Although the Company considers that these statements are based on reasonable hypotheses at the date of publication of this release, they are by their nature subject to risks and uncertainties which could cause actual results to differ materially from those indicated or projected in these statements."
3June 2007
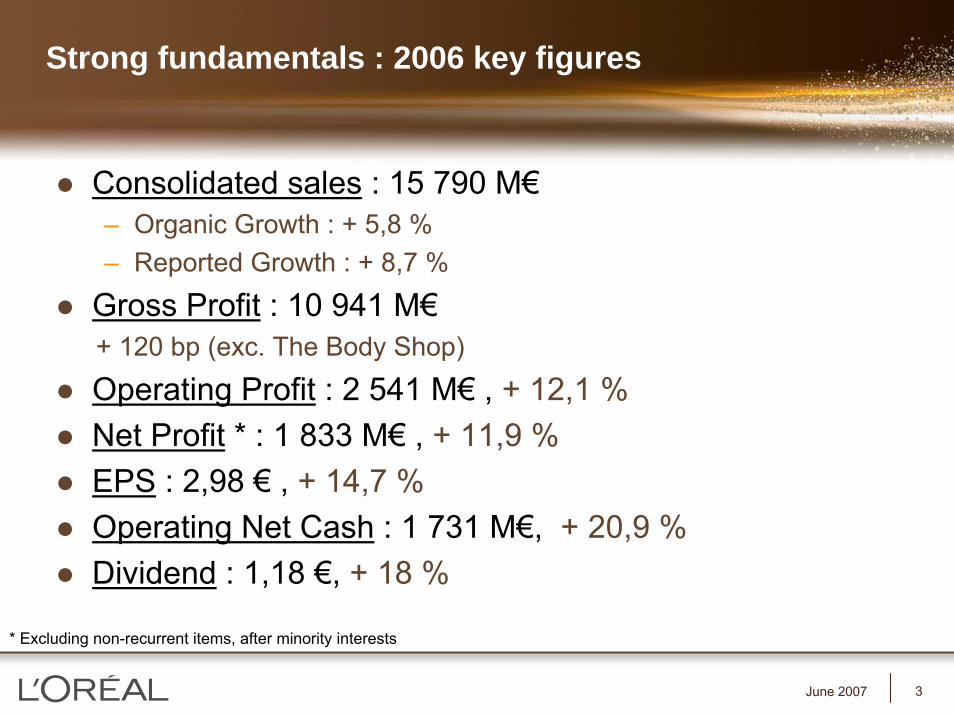
Strong fundamentals : 2006 key figures
Consolidated sales : 15 790 M€– Organic Growth : + 5,8 %– Reported Growth : + 8,7 %
Gross Profit : 10 941 M€+ 120 bp (exc. The Body Shop)
Operating Profit : 2 541 M€ , + 12,1 %Net Profit * : 1 833 M€ , + 11,9 %EPS : 2,98 € , + 14,7 %Operating Net Cash : 1 731 M€, + 20,9 %Dividend : 1,18 €, + 18 %
* Excluding non-recurrent items, after minority interests
4June 2007
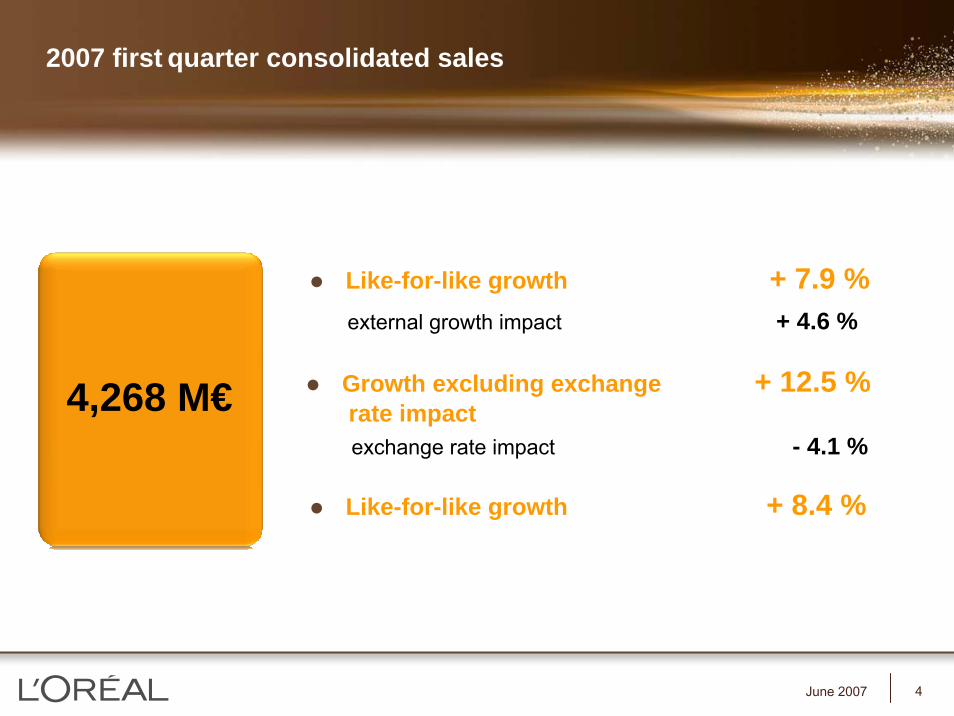
2007 first quarter consolidated sales
Like-for-like growth + 8.4 %
Like-for-like growth + 7.9 %external growth impact + 4.6 %
4,268 M€ Growth excluding exchange + 12.5 %rate impactexchange rate impact - 4.1 %
5June 2007
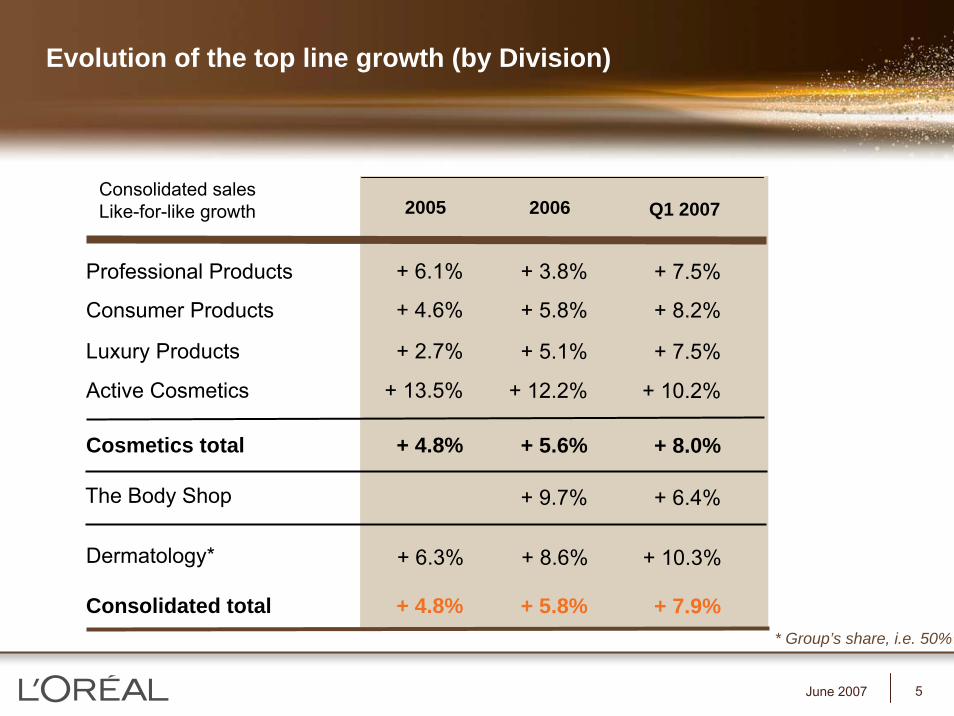
Evolution of the top line growth (by Division)
* Group’s share, i.e. 50%
2005
Professional Products + 6.1%
Consumer Products + 4.6%
Luxury Products + 2.7%
Cosmetics total + 4.8%
Active Cosmetics + 13.5%
Dermatology* + 6.3%
Consolidated total + 4.8%
The Body Shop
2006
+ 3.8%
+ 5.8%
+ 5.1%
+ 5.6%
+ 12.2%
+ 8.6%
+ 5.8%
+ 9.7%
Q1 2007
+ 7.5%
+ 8.2%
+ 7.5%
+ 8.0%
+ 10.2%
+ 10.3%
+ 7.9%
+ 6.4%
Consolidated salesLike-for-like growth
6June 2007
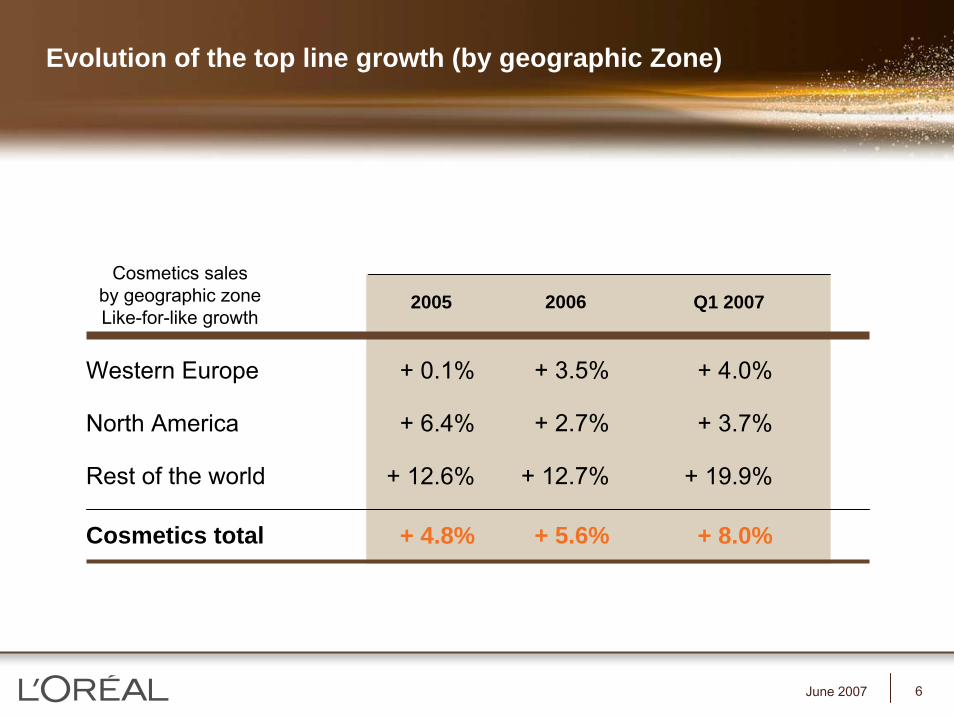
Evolution of the top line growth (by geographic Zone)
Western Europe
North America
Rest of the world
Cosmetics total
2006
+ 3.5%
+ 2.7%
+ 12.7%
+ 5.6%
2005
+ 0.1%
+ 6.4%
+ 12.6%
+ 4.8%
Q1 2007
+ 4.0%
+ 3.7%
+ 19.9%
+ 8.0%
Cosmetics salesby geographic zoneLike-for-like growth
7June 2007
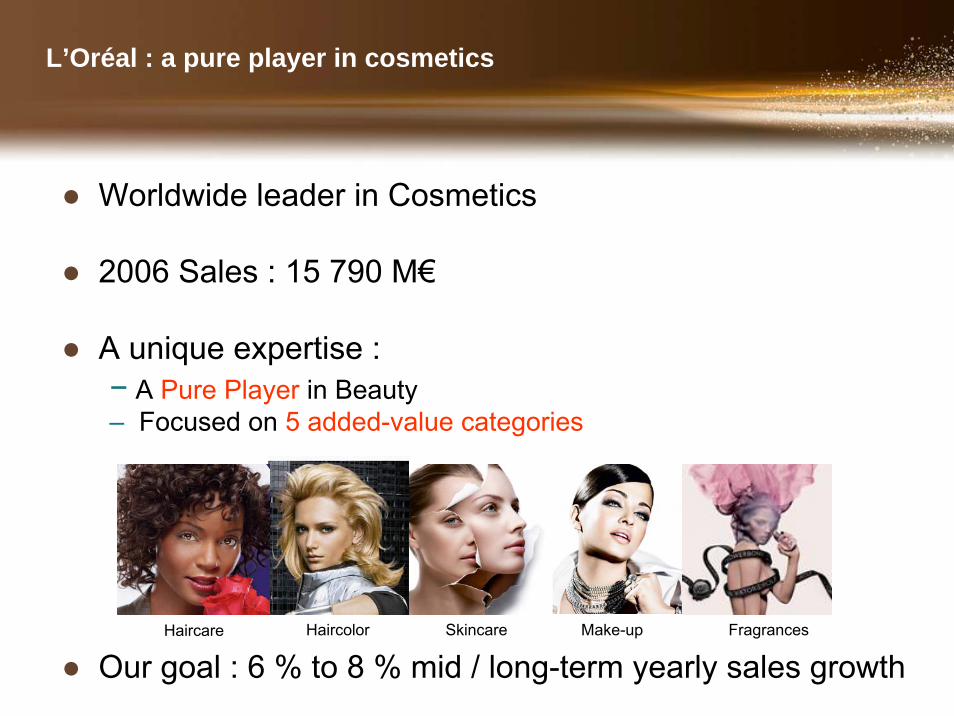
L’Oréal : a pure player in cosmetics
● Worldwide leader in Cosmetics
● 2006 Sales : 15 790 M€
● A unique expertise :− A Pure Player in Beauty– Focused on 5 added-value categories
● Our goal : 6 % to 8 % mid / long-term yearly sales growthHaircare Haircolor Skincare Make-up Fragrances
8June 2007
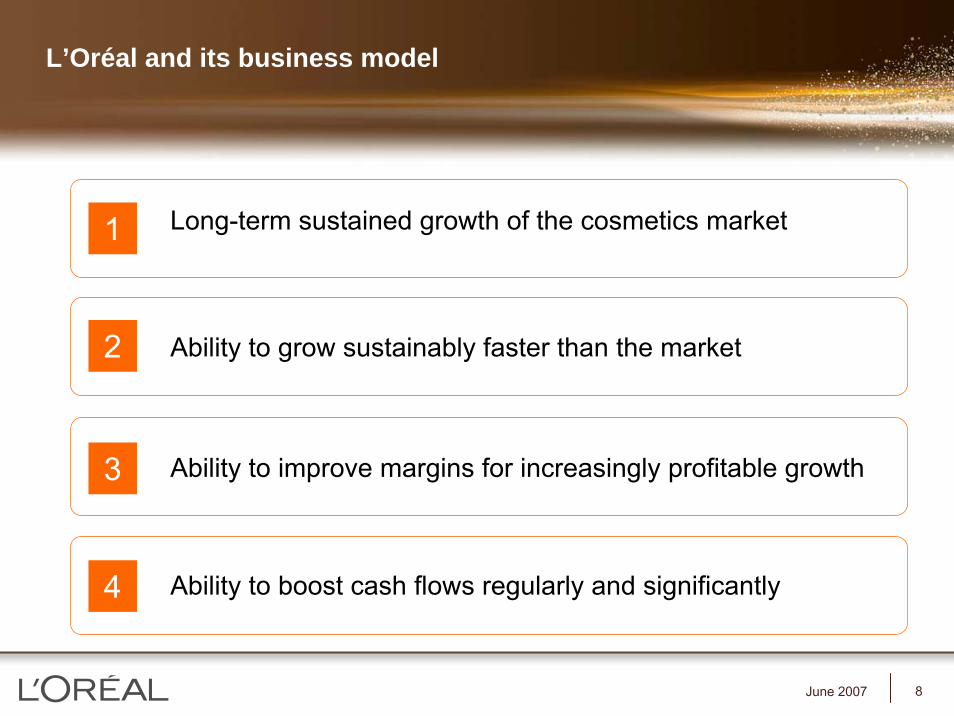
Long-term sustained growth of the cosmetics market
Ability to grow sustainably faster than the market
Ability to improve margins for increasingly profitable growth
1
2
3
Ability to boost cash flows regularly and significantly4
L’Oréal and its business model
9June 2007
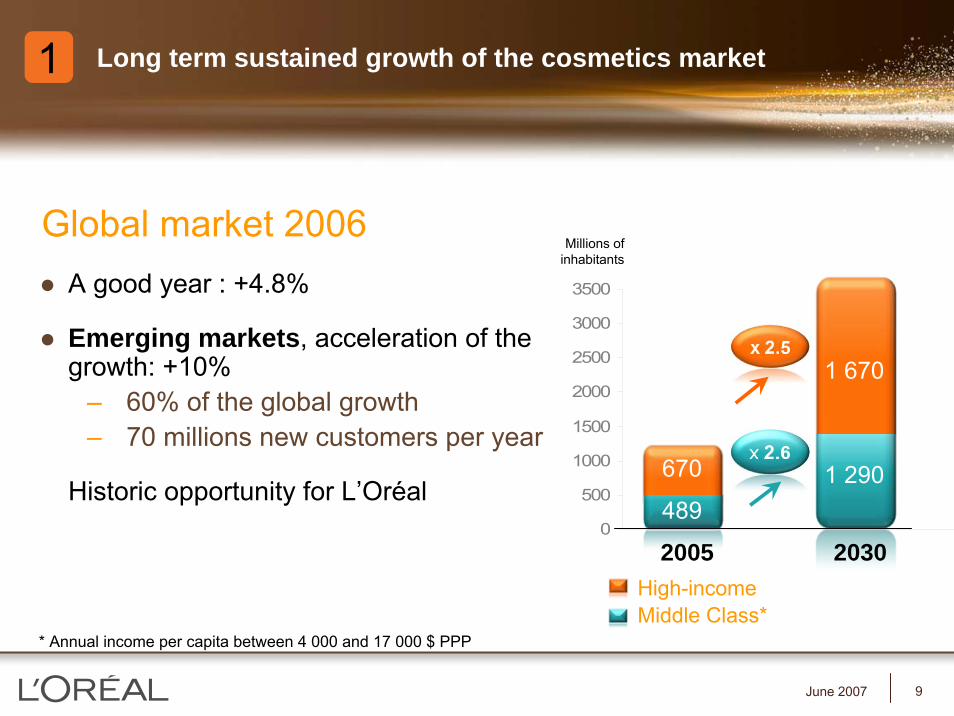
Long term sustained growth of the cosmetics market
A good year : +4.8%
Emerging markets, acceleration of the growth: +10%
– 60% of the global growth– 70 millions new customers per year
Historic opportunity for L’Oréal
Global market 2006
0
500
1000
1500
2000
2500
3000
3500
Middle Class*High-income
Millions ofinhabitants
1 670
1 290489
670
2005 2030
* Annual income per capita between 4 000 and 17 000 $ PPP
1
10June 2007
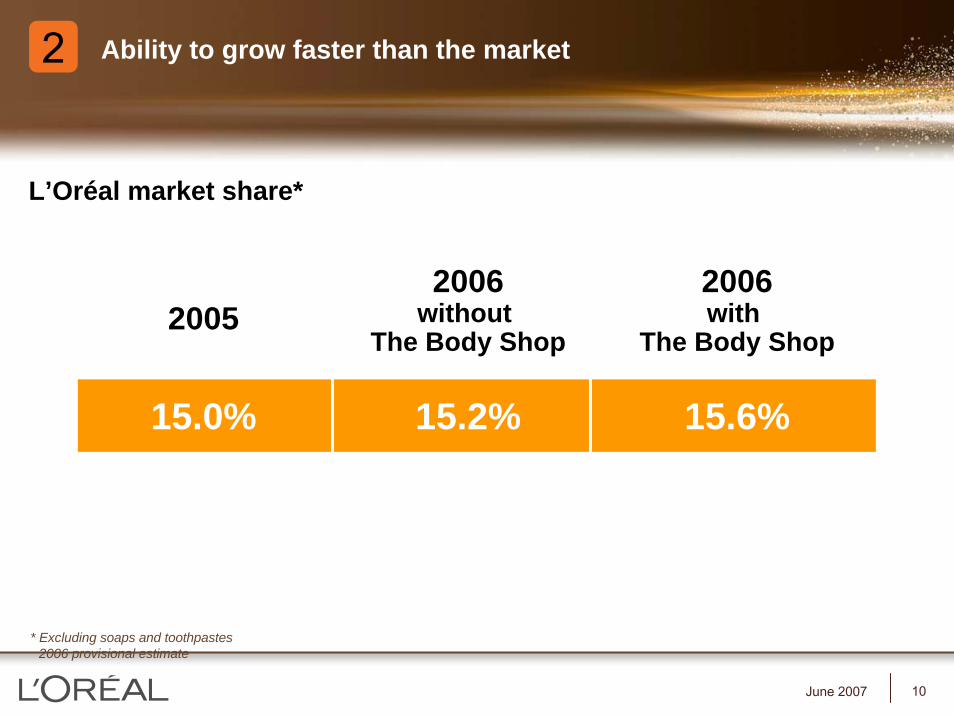
20052006with
The Body Shop
15.0% 15.6%
2006without
The Body Shop
15.2%
L’Oréal market share*
* Excluding soaps and toothpastes2006 provisional estimate
Ability to grow faster than the market2
11June 2007
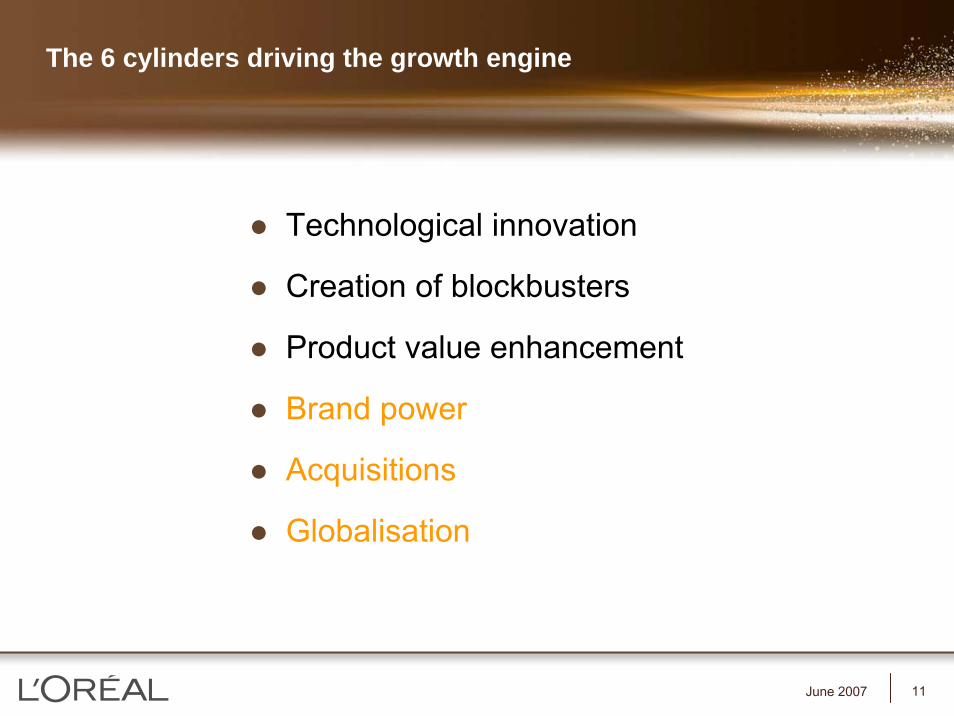
Technological innovation
Creation of blockbusters
Product value enhancement
Brand power
Acquisitions
Globalisation
The 6 cylinders driving the growth engine
12June 2007
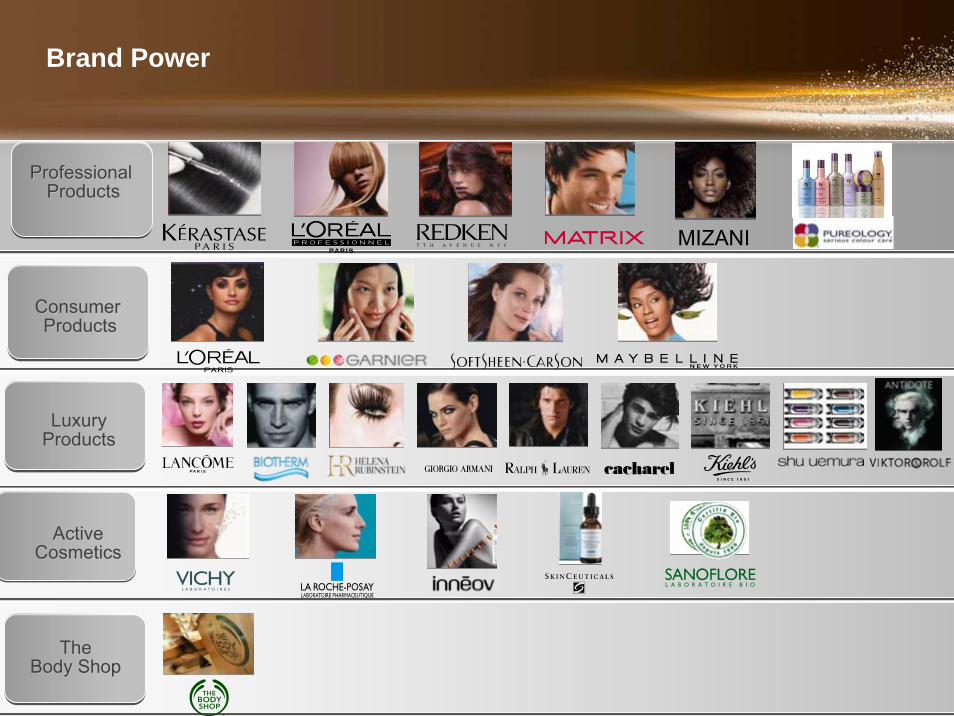
LuxuryLuxuryProductsProducts
ActiveActiveCosmeticsCosmetics
The The Body ShopBody Shop
Consumer Consumer ProductsProducts
MIZANI
Professional Professional ProductsProducts
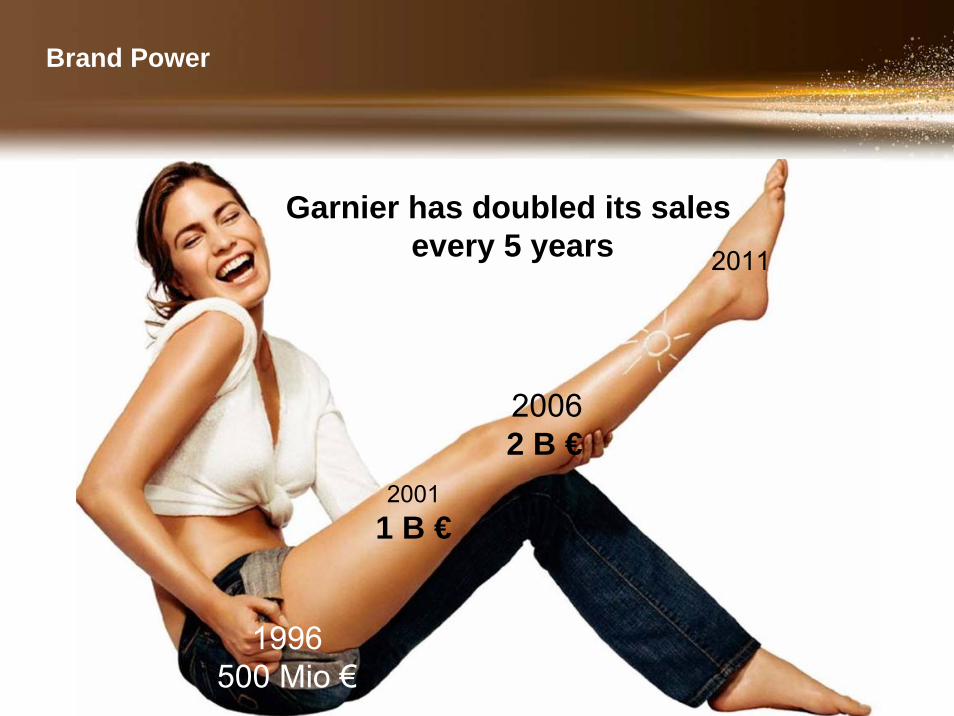
Brand Power
13June 2007
1996500 Mio €
20011 B €
20062 B €
2011
Garnier has doubled its sales every 5 years
Brand Power
14June 2007
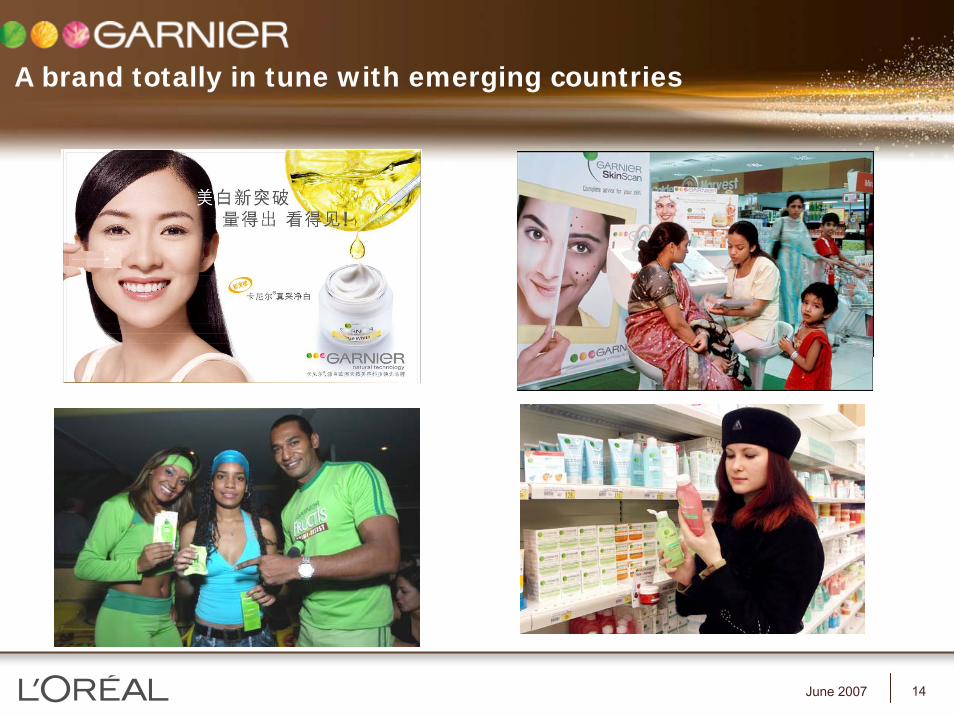
A brand totally in tune with emerging countries
15June 2007
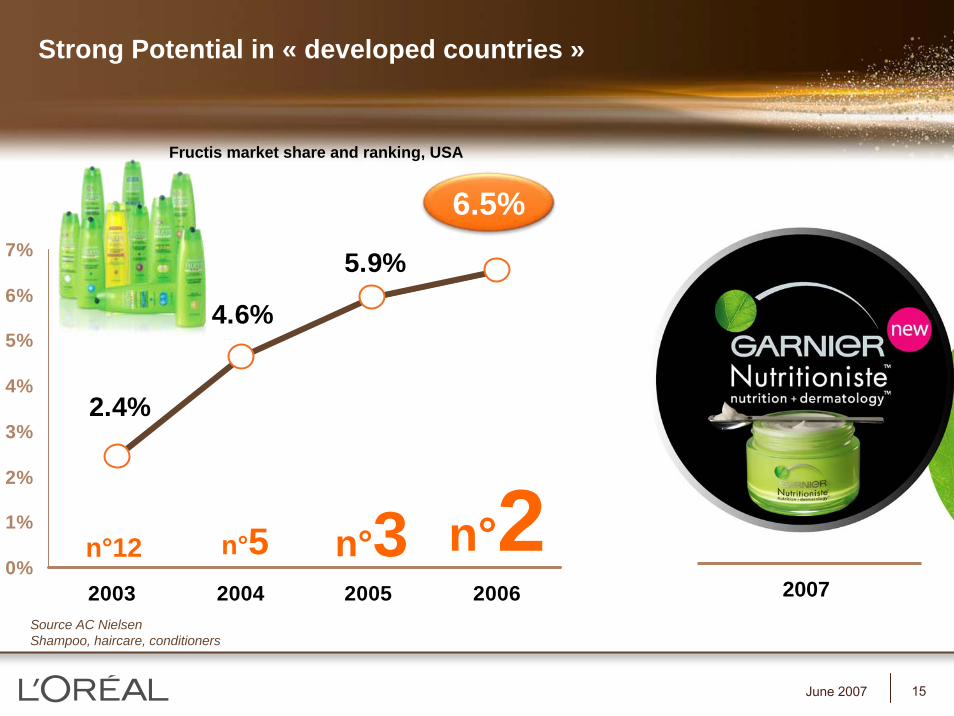
2.4%
4.6%
5.9%
0%
1%
2%
3%
4%
5%
6%
7%
2003 2004 2005 2006
n°12 n°5 n°3 n°2
6.5%
Strong Potential in « developed countries »
Source AC NielsenShampoo, haircare, conditioners
Fructis market share and ranking, USA
2007
16June 2007
Technological innovation
Creation of blockbusters
Product value enhancement
Brand power
Acquisitions
Globalisation
The 6 cylinders driving the growth engine
17June 2007
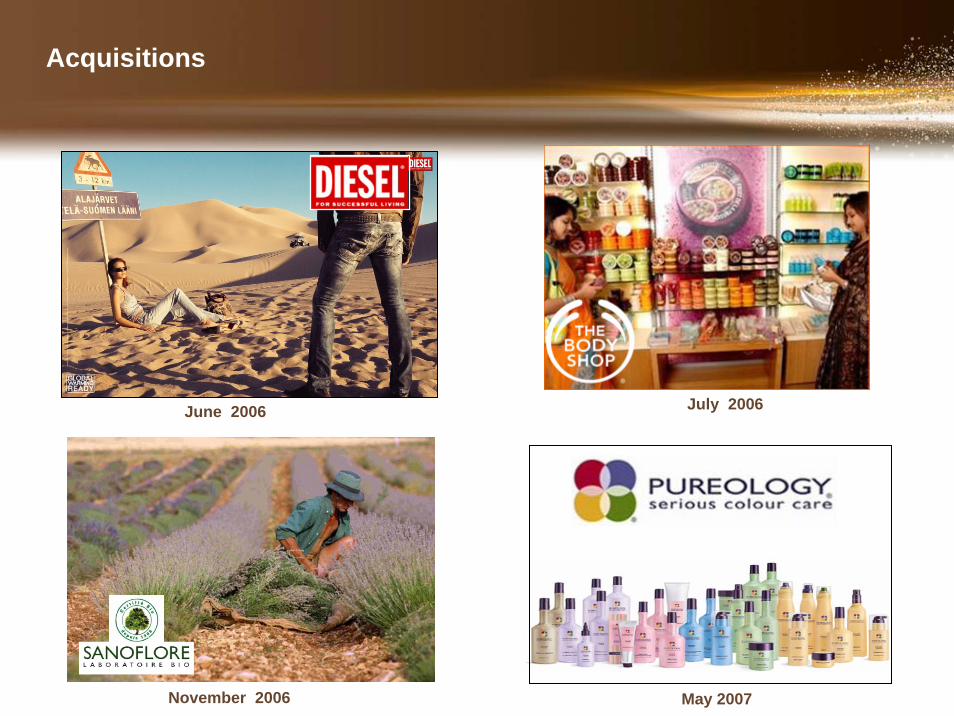
July 2006June 2006
May 2007
Acquisitions
November 2006
18June 2007
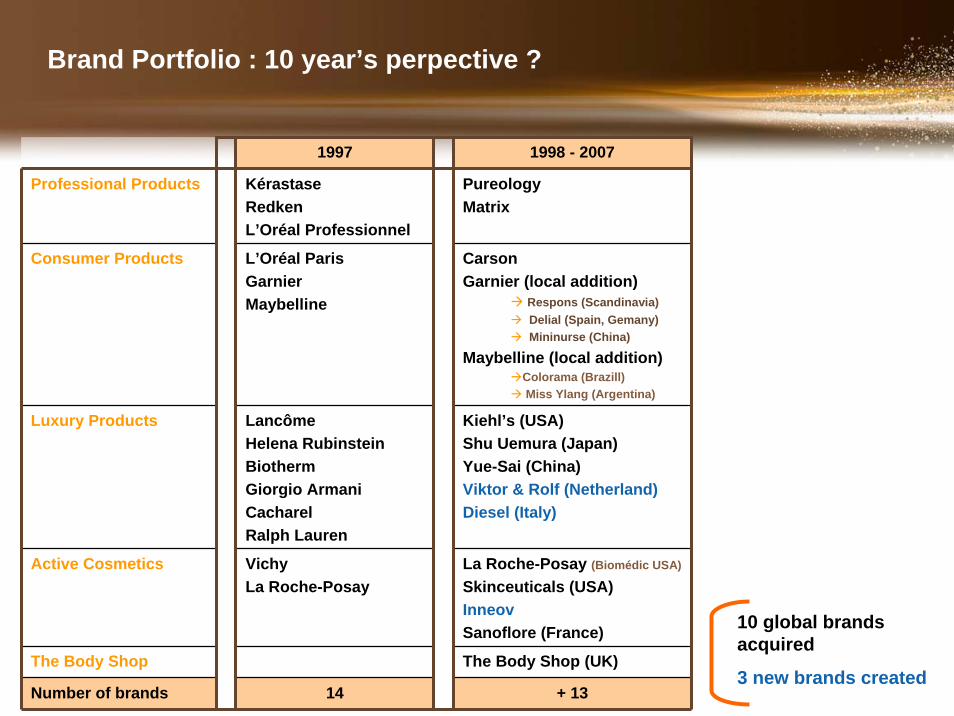
Brand Portfolio : 10 year’s perpective ?
1997 1998 - 2007
Professional Products KérastaseRedkenL’Oréal Professionnel
PureologyMatrix
Consumer Products L’Oréal ParisGarnierMaybelline
CarsonGarnier (local addition)
Respons (Scandinavia)Delial (Spain, Gemany)Mininurse (China)
Maybelline (local addition)Colorama (Brazill)Miss Ylang (Argentina)
Luxury Products LancômeHelena RubinsteinBiothermGiorgio ArmaniCacharelRalph Lauren
Kiehl’s (USA)Shu Uemura (Japan)Yue-Sai (China)Viktor & Rolf (Netherland)Diesel (Italy)
Active Cosmetics Vichy La Roche-Posay
La Roche-Posay (Biomédic USA)
Skinceuticals (USA)InneovSanoflore (France)
The Body Shop The Body Shop (UK)
Number of brands 14 + 13
10 global brands acquired
3 new brands created
19June 2007
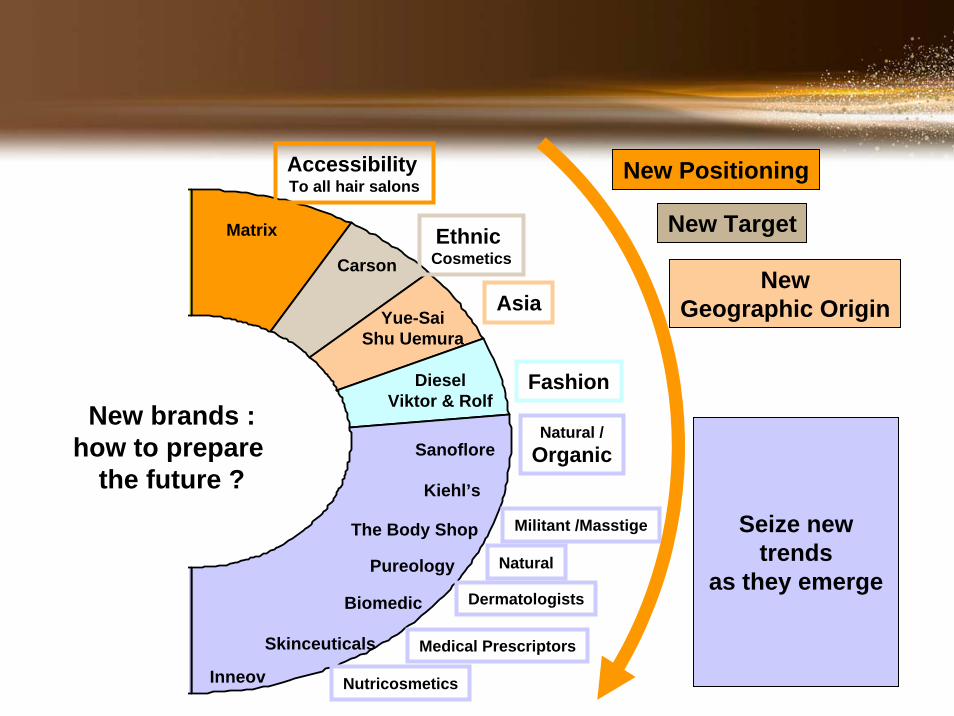
Ethnic Cosmetics
Matrix
Carson
Yue-SaiShu Uemura
Sanoflore
Kiehl’s
The Body Shop
Pureology
Biomedic
Skinceuticals
New brands :how to prepare
the future ?
AccessibilityTo all hair salons
Asia
Natural /Organic
Seize new trends
as they emerge
Militant /Masstige
Natural
Dermatologists
NewGeographic Origin
New Positioning
New Target
Medical Prescriptors
FashionDieselViktor & Rolf
Inneov Nutricosmetics
20June 2007
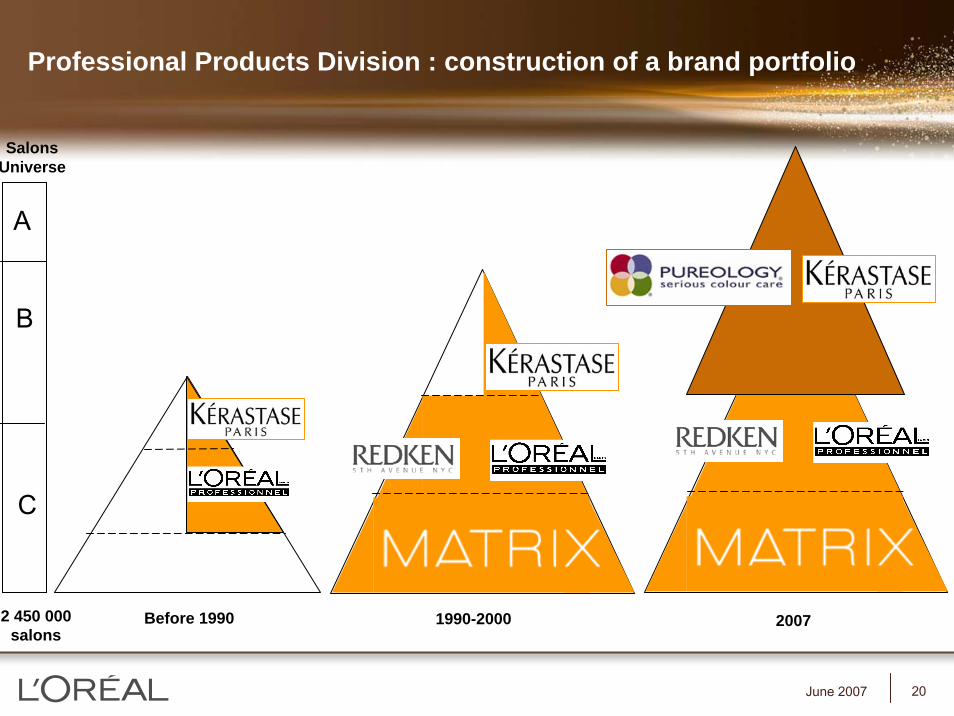
Professional Products Division : construction of a brand portfolio
Before 1990 1990-2000 2007
A
B
C
2 450 000salons
SalonsUniverse
21June 2007
Technological innovation
Creation of blockbusters
Product value enhancement
Brand power
Acquisitions
Globalisation
The 6 cylinders driving the growth engine
22June 2007
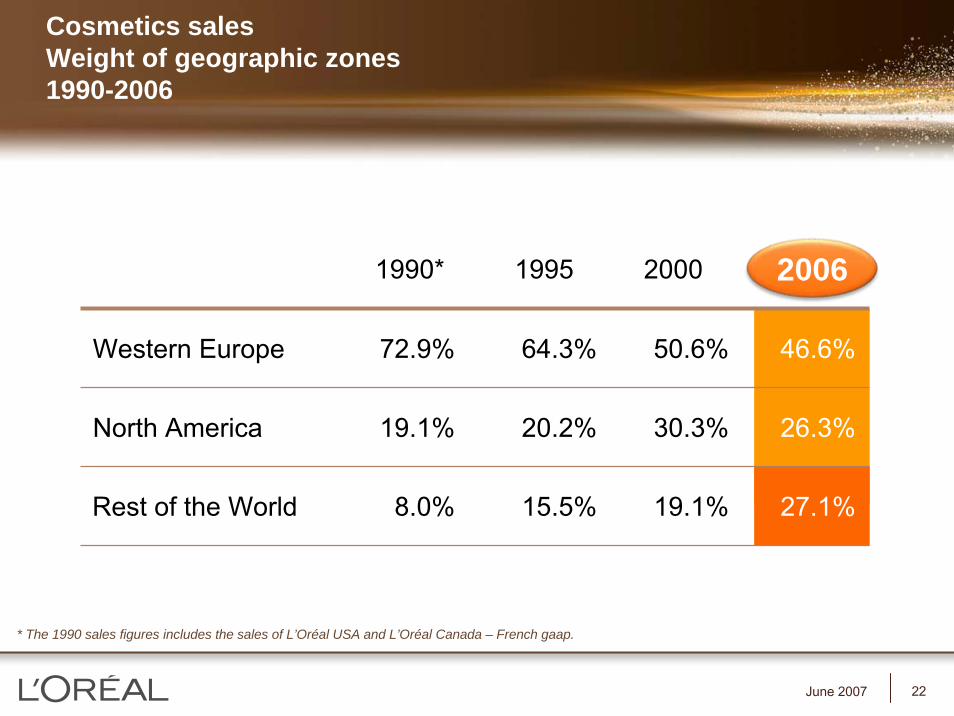
Cosmetics sales Weight of geographic zones1990-2006
Western Europe 72.9% 46.6%64.3% 50.6%
North America 19.1% 26.3%20.2% 30.3%
Rest of the World 8.0% 27.1%15.5% 19.1%
* The 1990 sales figures includes the sales of L’Oréal USA and L’Oréal Canada – French gaap.
1990* 1995 2000 2006
23June 2007
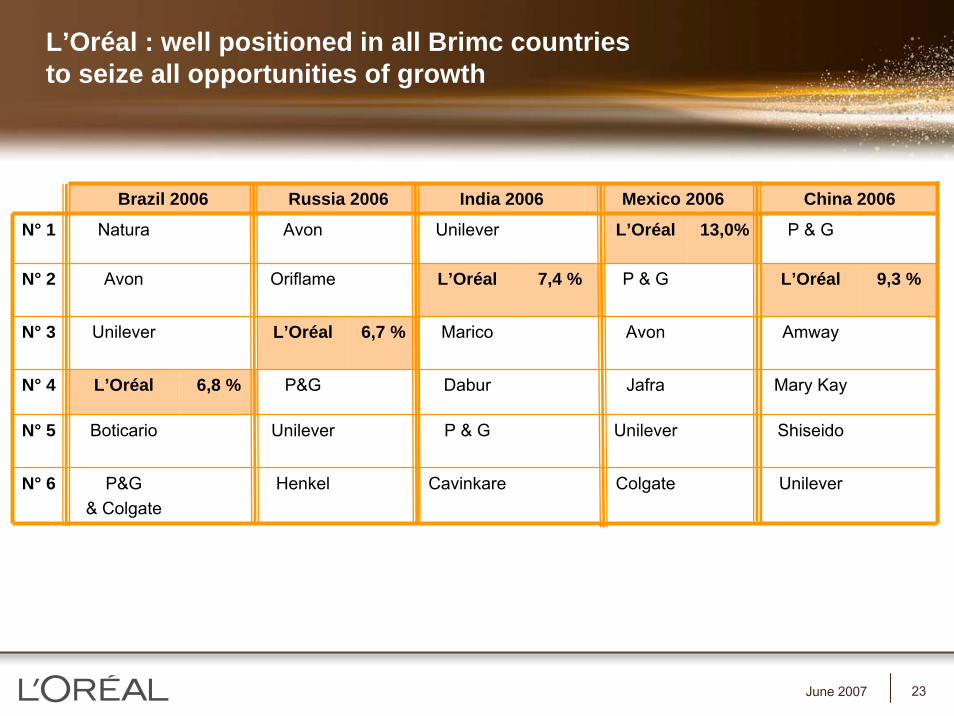
L’Oréal : well positioned in all Brimc countriesto seize all opportunities of growth
Brazil 2006 Russia 2006 India 2006 Mexico 2006
Natura L’Oréal 13,0%
P & G
Avon
Jafra
Unilever
Colgate
Avon
Unilever
L’Oréal
Boticario
P&G& Colgate
Unilever
6,8 %
L’Oréal
Marico
Dabur
P & G
Cavinkare
Avon
7,4 %
6,7 %
Oriflame
L’Oréal
P&G
Unilever
Henkel
China 2006
N° 1 P & G
L’Oréal
Amway
Mary Kay
N° 5 Shiseido
N° 6 Unilever
N° 2 9,3 %
N° 3
N° 4
24June 2007
Gradual improvement of margin and cash flows
● A strategic vision : enhance the value of products throughinnovation
● Economies of scale through growing brand globalization.
● « Permanent Restructuration » concept.
● Settlement of subsidiaries mostly complete.
3
4
25June 2007
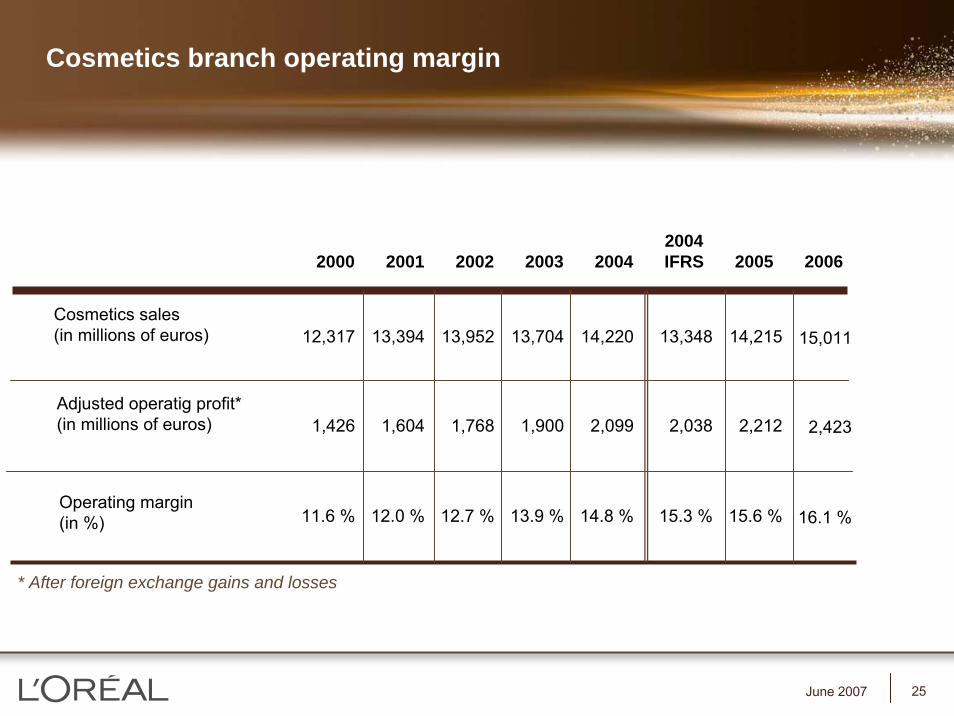
Cosmetics branch operating margin
Cosmetics sales(in millions of euros)
Adjusted operatig profit*(in millions of euros)
Operating margin(in %)
12,317
1,426
11.6 %
13,394
1,604
12.0 %
13,952
1,768
12.7 %
13,704
1,900
13.9 %
14,220
2,099
14.8 %
13,348
2,038
15.3 %
14,215
2,212
15.6 %
2000 2001 2002 2003 2004
* After foreign exchange gains and losses
2004IFRS 2005
15,011
2,423
16.1 %
2006
26June 2007
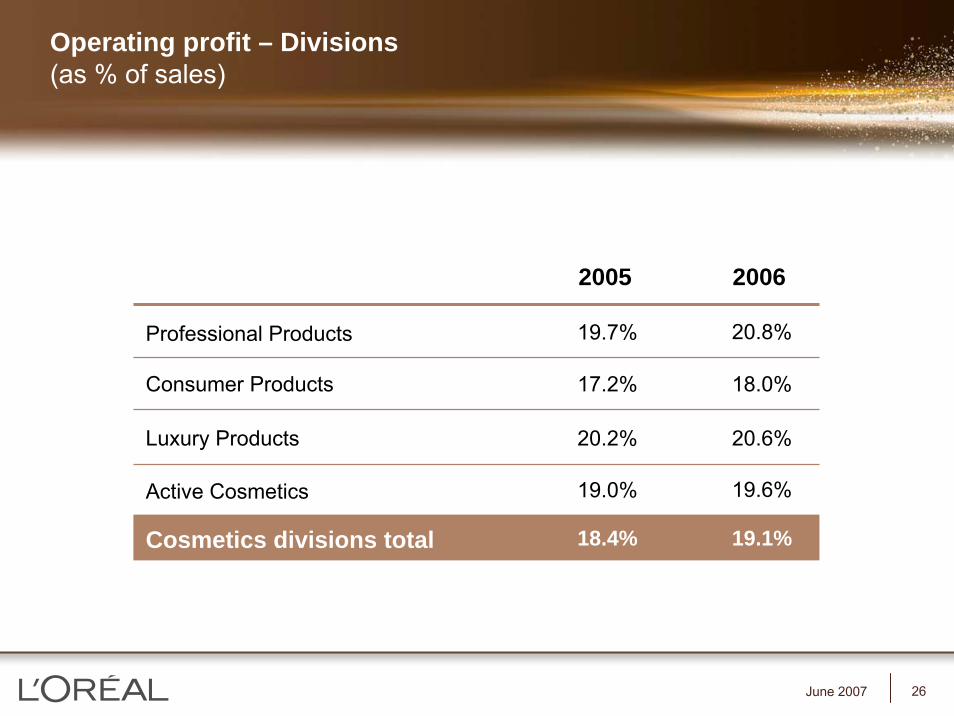
Operating profit – Divisions(as % of sales)
Consumer Products
Luxury Products
Active Cosmetics 19.6%19.0%
18.0%
20.6%
Professional Products 20.8%19.7%
17.2%
20.2%
20062005
Cosmetics divisions total 19.1%18.4%
27June 2007
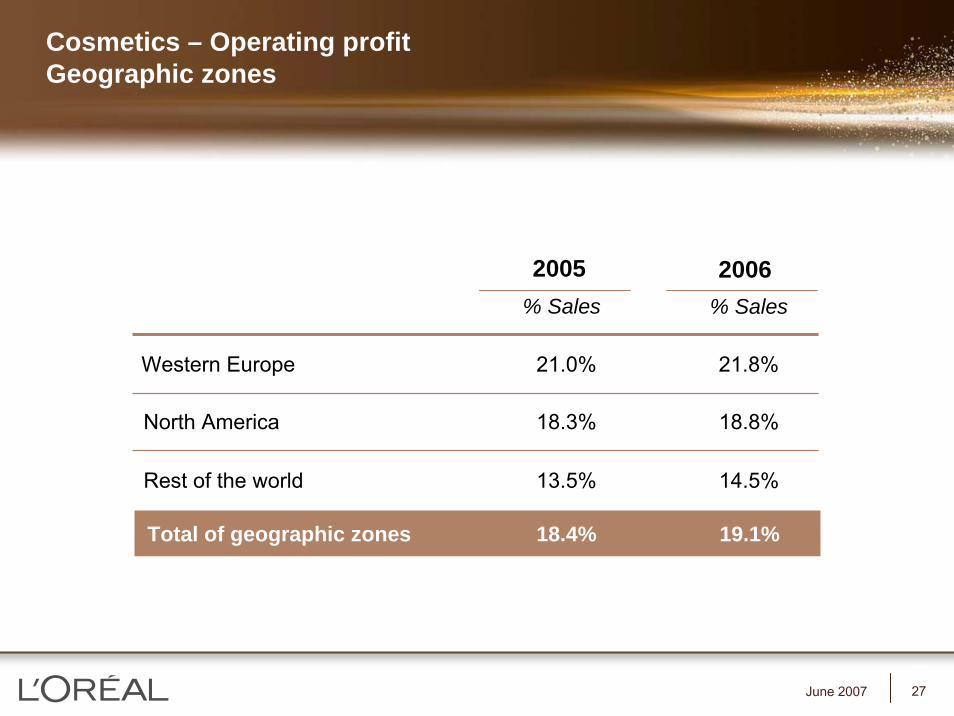
2005% Sales
Cosmetics – Operating profitGeographic zones
13.5% 14.5%Rest of the world
18.3% 18.8%North America
21.0% 21.8%Western Europe
2006
18.4% 19.1%Total of geographic zones
18,4 %
% Sales
28June 2007
Conclusion
A unique and strong business model
A powerful brand portfolio
Strengthened by acquisitions
Well positioned in all emerging countries
Strong potential for sustainable growth of the top line and of the bottom line.