Embed Size (px)
Citation preview
29
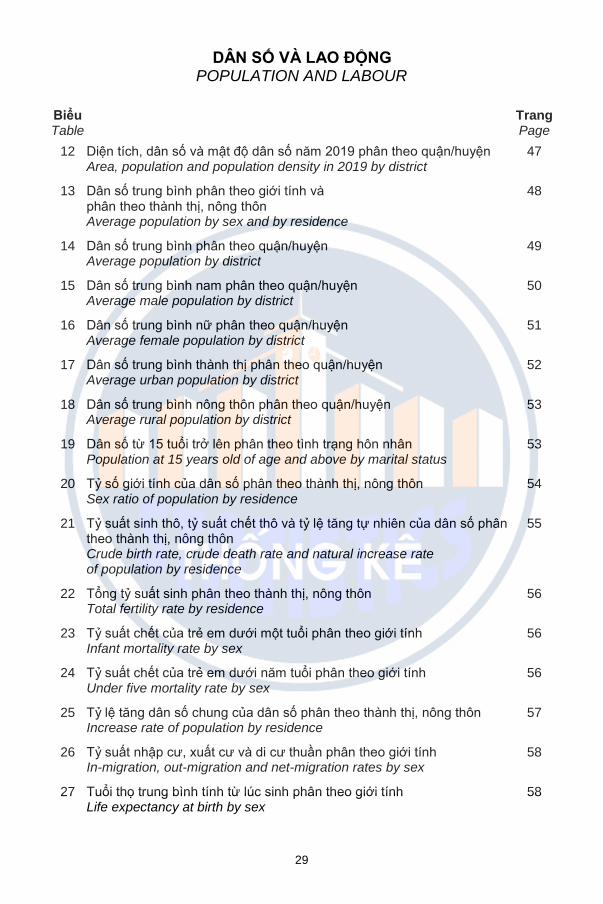
DÂN SÔ VÀ LAO ĐỘNG POPULATION AND LABOUR
Biểu Table
Trang Page
12 Diên tich, dân sô va mật đô dân sô năm 2019 phân theo quận/huyên Area, population and population density in 2019 by district
47
13 Dân sô trung binh phân theo giới tinh va phân theo thanh thị, nông thôn Average population by sex and by residence
48
14 Dân sô trung binh phân theo quận/huyên Average population by district
49
15 Dân sô trung binh nam phân theo quận/huyên Average male population by district
50
16 Dân sô trung binh nư phân theo quận/huyên Average female population by district
51
17 Dân sô trung binh thanh thị phân theo quận/huyên Average urban population by district
52
18 Dân sô trung binh nông thôn phân theo quận/huyên Average rural population by district
53
19 Dân sô từ 15 tuôi trở lên phân theo tinh trang hôn nhân Population at 15 years old of age and above by marital status
53
20 Tỷ sô giới tinh cua dân sô phân theo thanh thị, nông thôn Sex ratio of population by residence
54
21 Tỷ suất sinh thô, tỷ suất chêt thô va tỷ lê tăng tư nhiên cua dân sô phân theo thanh thị, nông thôn Crude birth rate, crude death rate and natural increase rate of population by residence
55
22 Tông tỷ suất sinh phân theo thanh thị, nông thôn Total fertility rate by residence
56
23 Tỷ suất chêt cua trẻ em dưới môt tuôi phân theo giới tinh Infant mortality rate by sex
56
24 Tỷ suất chêt cua trẻ em dưới năm tuôi phân theo giới tinh Under five mortality rate by sex
56
25 Tỷ lê tăng dân sô chung cua dân sô phân theo thanh thị, nông thôn Increase rate of population by residence
57
26 Tỷ suất nhập cư, xuất cư va di cư thuân phân theo giới tinh In-migration, out-migration and net-migration rates by sex
58
27 Tuôi thọ trung binh tinh từ lúc sinh phân theo giới tinh Life expectancy at birth by sex
58
30
Biểu Table
Trang Page
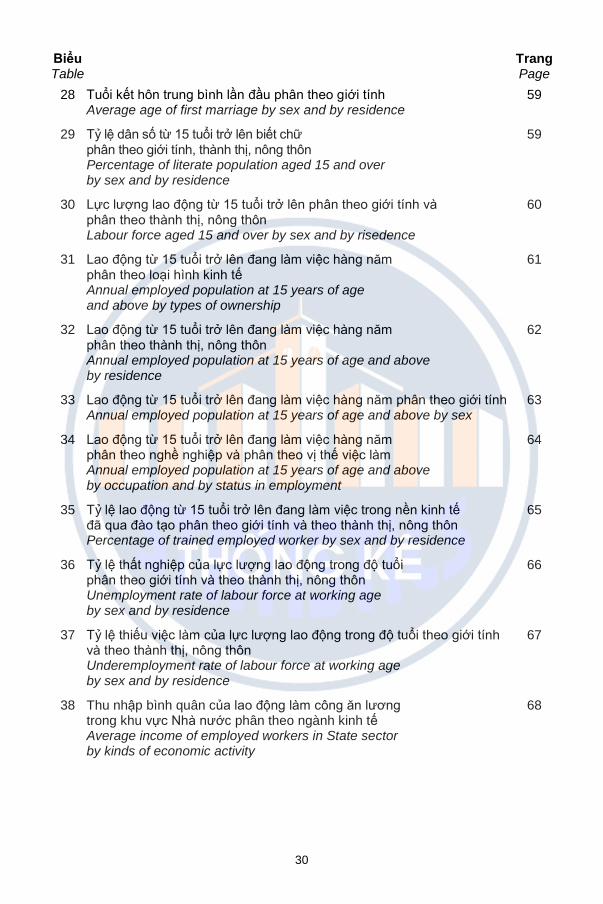
28 Tuôi kêt hôn trung binh lân đâu phân theo giới tinh Average age of first marriage by sex and by residence
59
29 Tỷ lê dân sô từ 15 tuôi trở lên biêt chư phân theo giới tinh, thanh thị, nông thôn Percentage of literate population aged 15 and over by sex and by residence
59
30 Lưc lương lao đông từ 15 tuôi trở lên phân theo giới tinh va phân theo thanh thị, nông thôn Labour force aged 15 and over by sex and by risedence
60
31 Lao đông từ 15 tuôi trở lên đang lam viêc hang năm phân theo loai hinh kinh tê Annual employed population at 15 years of age and above by types of ownership
61
32 Lao đông từ 15 tuôi trở lên đang lam viêc hang năm phân theo thanh thị, nông thôn Annual employed population at 15 years of age and above by residence
62
33 Lao đông từ 15 tuôi trở lên đang lam viêc hang năm phân theo giới tinh Annual employed population at 15 years of age and above by sex
63
34 Lao đông từ 15 tuôi trở lên đang lam viêc hang năm phân theo nghề nghiêp va phân theo vị thê viêc lam Annual employed population at 15 years of age and above by occupation and by status in employment
64
35 Tỷ lê lao đông từ 15 tuôi trở lên đang lam viêc trong nền kinh tê đa qua đao tao phân theo giới tinh va theo thanh thị, nông thôn Percentage of trained employed worker by sex and by residence
65
36 Tỷ lê thất nghiêp cua lưc lương lao đông trong đô tuôi phân theo giới tinh va theo thanh thị, nông thôn Unemployment rate of labour force at working age by sex and by residence
66
37 Tỷ lê thiêu viêc lam cua lưc lương lao đông trong đô tuôi theo giới tinh va theo thanh thị, nông thôn Underemployment rate of labour force at working age by sex and by residence
67
38 Thu nhập bình quân cua lao đông lam công ăn lương trong khu vưc Nha nước phân theo ngành kinh tê Average income of employed workers in State sector by kinds of economic activity
68
31
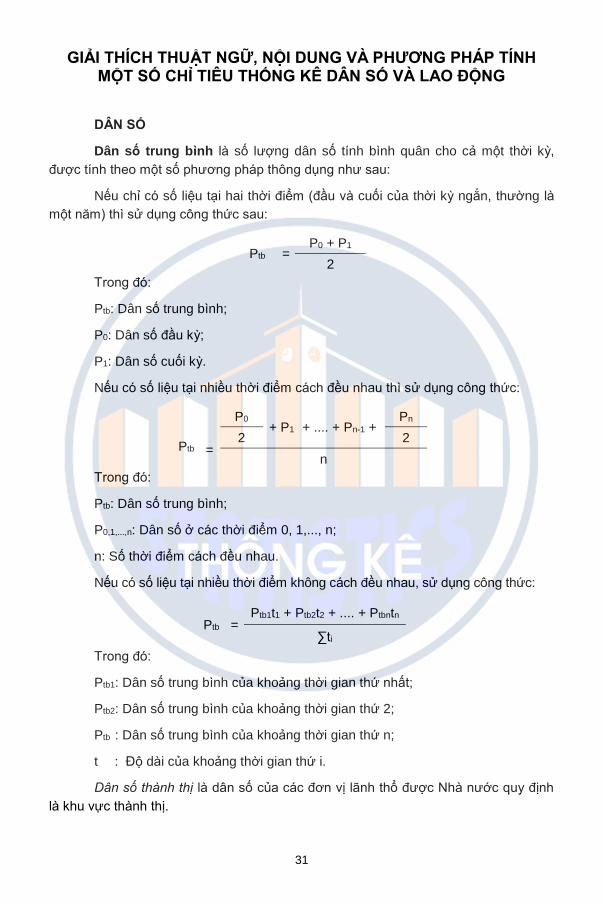
GIẢI THICH THUẬT NGỮ, NỘI DUNG VÀ PHƯƠNG PHAP TINH MỘT SÔ CHỈ TIÊU THÔNG KÊ DÂN SÔ VÀ LAO ĐỘNG
DÂN SÔ
Dân số trung bình la sô lương dân sô tinh binh quân cho ca môt thời kỳ,
đươc tinh theo môt sô phương phap thông dung như sau:
Nêu chỉ co sô liêu tai hai thời điểm (đâu va cuôi cua thời kỳ ngắn, thường la
môt năm) thi sư dung công thưc sau:
Ptb = P0 + P1
2
Trong đo:
Ptb: Dân sô trung binh;
P0: Dân sô đâu kỳ;
P1: Dân sô cuôi kỳ.
Nêu co sô liêu tai nhiều thời điểm cach đều nhau thi sư dung công thưc:
Ptb
=
P0 + P1 + .... + Pn-1 +
Pn
2 2
n
Trong đo:
Ptb: Dân sô trung binh;
P0,1,...,n: Dân sô ở cac thời điểm 0, 1,..., n;
n: Sô thời điểm cach đều nhau.
Nêu co sô liêu tai nhiều thời điểm không cach đều nhau, sư dung công thưc:
Ptb = Ptb1t1 + Ptb2t2 + .... + Ptbntn
∑ti
Trong đo:
Ptb1: Dân sô trung binh cua khoang thời gian thư nhất;
Ptb2: Dân sô trung binh cua khoang thời gian thư 2;
Ptb : Dân sô trung binh cua khoang thời gian thư n;
t : Đô dai cua khoang thời gian thư i.
Dân số thành thị la dân sô cua cac đơn vị lanh thô đươc Nha nước quy định
la khu vưc thanh thị.
32
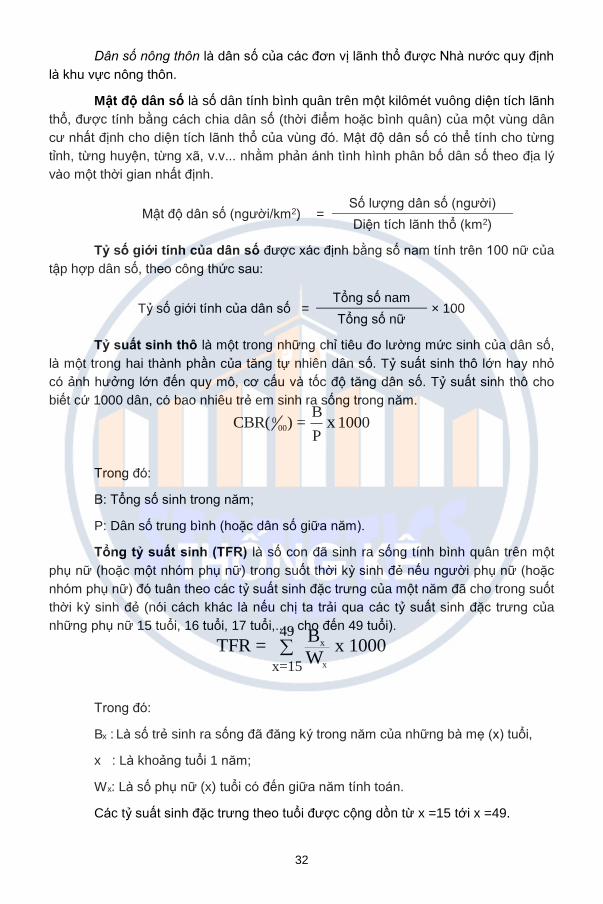
Dân số nông thôn la dân sô cua cac đơn vị lanh thô đươc Nha nước quy định
la khu vưc nông thôn.
Mật độ dân số la sô dân tinh binh quân trên môt kilômét vuông diên tich lanh
thô, đươc tinh băng cach chia dân sô (thời điểm hoặc binh quân) cua môt vùng dân
cư nhất định cho diên tich lanh thô cua vùng đo. Mật đô dân sô co thể tinh cho từng
tỉnh, từng huyên, từng xa, v.v... nhăm phan anh tinh hinh phân bô dân sô theo địa ly
vao môt thời gian nhất định.
Mật đô dân sô (người/km2) = Sô lương dân sô (người)
Diên tich lanh thô (km2)
Ty số giới tính của dân số đươc xac định băng sô nam tinh trên 100 nư cua
tập hơp dân sô, theo công thưc sau:
Tỷ sô giới tinh cua dân sô = Tông sô nam
× 100 Tông sô nư
Ty suất sinh thô la môt trong nhưng chỉ tiêu đo lường mưc sinh cua dân sô,
la môt trong hai thanh phân cua tăng tư nhiên dân sô. Tỷ suất sinh thô lớn hay nhỏ
co anh hưởng lớn đên quy mô, cơ cấu va tôc đô tăng dân sô. Tỷ suất sinh thô cho
biêt cư 1000 dân, co bao nhiêu trẻ em sinh ra sông trong năm.
000
BCBR( ) = 1000
P x
Trong đo:
B: Tông sô sinh trong năm;
P: Dân sô trung binh (hoặc dân sô giưa năm).
Tổng ty suất sinh (TFR) la sô con đa sinh ra sông tính binh quân trên môt
phu nư (hoặc môt nhom phu nư) trong suôt thời kỳ sinh đẻ nêu người phu nư (hoặc
nhom phu nư) đo tuân theo cac tỷ suất sinh đặc trưng cua môt năm đa cho trong suôt
thời kỳ sinh đẻ (noi cach khac la nêu chị ta trai qua cac tỷ suất sinh đặc trưng cua
nhưng phu nư 15 tuôi, 16 tuôi, 17 tuôi,... , cho đên 49 tuôi).
x
x
49
x=15
B
TFR = x 1000W
Trong đo:
Bx : La sô trẻ sinh ra sông đa đăng ky trong năm cua nhưng ba me (x) tuôi,
x : La khoang tuôi 1 năm;
Wx: La sô phu nư (x) tuôi co đên giưa năm tinh toan.
Cac tỷ suất sinh đặc trưng theo tuôi đươc công dôn từ x =15 tới x =49.
33
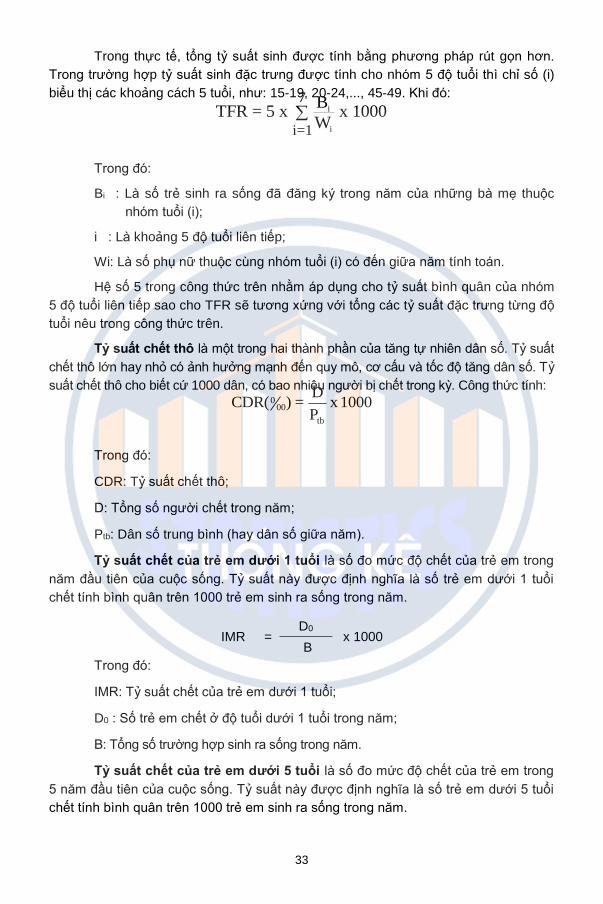
Trong thưc tê, tông tỷ suất sinh đươc tinh băng phương phap rút gọn hơn.
Trong trường hơp tỷ suất sinh đặc trưng đươc tinh cho nhom 5 đô tuôi thi chỉ sô (i)
biểu thị cac khoang cách 5 tuôi, như: 15-19, 20-24,..., 45-49. Khi đo: i
i
7
i=1
BTFR = 5 x x 1000
W
Trong đo:
Bi : La sô trẻ sinh ra sông đa đăng ky trong năm cua nhưng ba me thuôc
nhom tuôi (i);
i : La khoang 5 đô tuôi liên tiêp;
Wi: La sô phu nư thuôc cùng nhom tuôi (i) co đên giưa năm tinh toan.
Hê sô 5 trong công thưc trên nhăm ap dung cho tỷ suất binh quân cua nhom
5 đô tuôi liên tiêp sao cho TFR se tương xưng với tông cac tỷ suất đặc trưng từng đô
tuôi nêu trong công thưc trên.
Ty suất chết thô la môt trong hai thanh phân cua tăng tư nhiên dân sô. Tỷ suất
chêt thô lớn hay nhỏ co anh hưởng manh đên quy mô, cơ cấu va tôc đô tăng dân sô. Tỷ
suất chêt thô cho biêt cư 1000 dân, co bao nhiêu người bị chêt trong kỳ. Công thưc tính: 0
00
tb
DCDR( ) = x 1000
P
Trong đo:
CDR: Tỷ suất chêt thô;
D: Tông sô người chêt trong năm;
Ptb: Dân sô trung binh (hay dân sô giưa năm).
Ty suất chết của trẻ em dưới 1 tuổi la sô đo mưc đô chêt cua trẻ em trong
năm đâu tiên cua cuôc sông. Tỷ suất nay đươc định nghĩa la sô trẻ em dưới 1 tuôi
chêt tinh binh quân trên 1000 trẻ em sinh ra sông trong năm.
IMR = D0
x 1000 B
Trong đo:
IMR: Tỷ suất chêt cua trẻ em dưới 1 tuôi;
D0 : Sô trẻ em chêt ở đô tuôi dưới 1 tuôi trong năm;
B: Tông sô trường hơp sinh ra sông trong năm.
Ty suất chết của trẻ em dưới 5 tuổi la sô đo mưc đô chêt cua trẻ em trong
5 năm đâu tiên cua cuôc sông. Tỷ suất nay đươc định nghĩa la sô trẻ em dưới 5 tuôi
chêt tinh binh quân trên 1000 trẻ em sinh ra sông trong năm.
34
5q0 = 5D0
x 1000 B
Trong đo:
5q0: Tỷ suất chêt cua trẻ em dưới 5 tuôi (con gọi la U5MR);
5D0 : Sô trẻ em chêt ở đô tuôi dưới 5 tuôi trong năm;
B: Tông sô trường hơp sinh ra sông trong năm.
Ty lệ tăng dân số tự nhiên la mưc chênh lêch giưa sô sinh va sô chêt so với
dân sô trung binh trong kỳ nghiên cưu, hoặc băng hiêu sô giưa tỷ suất sinh thô với tỷ
suất chêt thô cua dân sô trong kỳ.
NIR = B - D
× 1000 = CBR – CDR Ptb
Trong đo:
NIR: Tỷ lê tăng dân sô tư nhiên;
B: Sô sinh trong năm;
D: Sô chêt trong năm;
Ptb: Dân sô trung binh (hoặc dân sô co đên ngay 1 tháng 7) cua năm;
CBR: Tỷ suất sinh thô;
CDR: Tỷ suất chêt thô.
Ty lệ tăng dân số chung (gọi tắt la "tỷ lê tăng dân sô") la tỷ lê ma theo đo
dân sô đươc tăng lên (hay giam đi) trong môt thời kỳ (thường tinh cho môt năm lịch)
do tăng tư nhiên va di cư thuân, đươc biểu thị băng tỷ lê phân trăm so với dân sô
trung binh (hay dân sô co đên giưa năm).
GR = CBR - CDR + IMR - OMR Trong đo:
GR: Tỷ lê tăng dân sô chung;
CBR: Tỷ suất sinh thô;
CDR: Tỷ suất chêt thô;
IMR: Tỷ suất nhập cư;
OMR: Tỷ suất xuất cư.
Hay: GR = NIR + NMR
Trong đo:
NIR : Tỷ lê tăng dân sô tư nhiên;
NMR: Tỷ suất di cư thuân.
35
Ty suất nhập cư la sô người từ đơn vị lanh thô khac (nơi xuất cư) nhập cư
đên môt đơn vị lanh thô trong kỳ nghiên cưu (thường la môt năm lịch) tinh binh quân
trên 1000 dân cua đơn vị lanh thô đo (nơi nhập cư).
IMR (%o) = I
x 1000 Ptb
Trong đo:
IMR: Tỷ suất nhập cư;
I: Sô người nhập cư trong năm;
Ptb: Dân sô trung binh (hay dân sô co đên giưa năm).
Ty suất xuất cư la sô người xuất cư cua môt đơn vị lanh thô trong kỳ nghiên
cưu (thường la môt năm lịch) tinh binh quân trên 1000 dân cua đơn vị lanh thô đo.
OMR (%o) = O
x 1000 Ptb
Trong đo:
OMR: Tỷ suất xuất cư;
O: Sô người xuất cư trong năm;
Ptb: Dân sô trung binh (hay dân sô co đên giưa năm).
Ty suất di cư thuần la hiêu sô giưa sô người nhập cư va sô người xuất cư
cua môt đơn vị lanh thô trong kỳ nghiên cưu (thường la môt năm lịch) tinh binh quân
trên 1000 dân cua đơn vị lanh thô đo.
NMR (%o) = I - O
x 1000 Ptb
Trong đo:
NMR: Tỷ suất di cư thuân;
I: Sô người nhập cư trong năm;
O: Sô người xuất cư trong năm;
Ptb: Dân sô trung binh (hay dân sô giưa năm).
Hoặc: NMR = IMR - OMR
Trong đo:
NMR: Tỷ suất di cư thuân;
IMR: Tỷ suất nhập cư;
OMR: Tỷ suất xuất cư.
36
Tuổi thọ trung bình tính từ luc sinh la chỉ tiêu thông kê chu yêu cua Bang
sông, biểu thị triển vọng môt người mới sinh co thể sông đươc bao nhiêu năm nêu
như mô hinh chêt hiên tai đươc tiêp tuc duy tri.
e0 = T0
l0
Trong đo:
e0: Tuôi thọ trung binh tinh từ lúc sinh;
T0: Tông sô năm cua nhưng người mới sinh trong Bang sông se
tiêp tuc sông đươc;
Io: Sô người sông đên đô tuôi 0 cua Bang sông
(tập hơp sinh ra sông ban đâu đươc quan sat).
Tuôi thọ trung binh tinh từ lúc sinh la môt trong nhưng chỉ tiêu tông hơp đươc
tinh từ Bang sông.
Bang sông (hay con gọi la Bang chêt) la môt bang thông kê bao gôm nhưng
chỉ tiêu biểu thị mưc đô chêt cua dân sô ở cac đô tuôi khac nhau va kha năng sông
cua dân sô khi chuyển từ đô tuôi nay sang đô tuôi khac. Bang sông cho biêt từ môt
tập hơp sinh ban đâu (cùng môt đoan hê), se co bao nhiêu người sông đươc đên 1
tuôi, 2 tuôi, ...,100 tuôi,…; trong sô đo co bao nhiêu người ở mỗi đô tuôi nhất định bị
chêt và không sông đươc đên đô tuôi sau; nhưng người đa đat đươc môt đô tuôi
nhất định se co xac suất sông va xac suất chêt như thê nao; tuôi thọ trung binh trong
tương lai la bao nhiêu.
Ty lệ dân số từ 15 tuổi trở lên biết chữ là tỷ lê giưa sô người từ 15 tuôi trở
lên tai thời điểm (t) biêt chư (co thể đọc, viêt va hiểu đươc môt câu đơn gian băng
chư quôc ngư, chư dân tôc hoặc chư nước ngoai) so với tông dân sô từ 15 tuôi trở
lên tai thời điểm đo.
Tỷ lê dân sô từ 15 tuôi trở lên biêt chư (%)
= Sô người từ 15 tuôi trở lên biêt chư
× 100 Tông sô dân sô từ 15 tuôi trở lên
Tuổi kết hôn trung bình lần đầu cho biêt sô năm đôc thân trung binh cua môt
đoan hê gia định đa sông đôc thân trước khi kêt hôn lân đâu, với gia định răng tỷ trọng
đôc thân theo đô tuôi cua đoan hê nay giông như kêt qua thu đươc tai thời điểm điều tra.
LAO ĐỘNG VÀ VIỆC LÀM
Lực lượng lao động bao gôm nhưng người từ đu 15 tuôi trở lên co viêc lam
(đang lam viêc) hoặc thất nghiêp trong thời kỳ tham chiêu (7 ngay trước thời điểm
quan sát).
Số lao động đang làm việc trong nền kinh tế bao gôm nhưng người từ 15 tuôi
trở lên co viêc lam trong thời kỳ tham chiêu (7 ngay trước thời điểm quan sat).

37
Sô lao đông đang lam viêc trong nền kinh tê là nhưng người từ 15 tuôi trở lên
trong thời kỳ tham chiêu (7 ngay trước thời điểm quan sat) co lam bất cư viêc gi (không
bị phap luật cấm) từ 1 giờ trở lên để tao ra cac san phâm hang hoa hoặc cung cấp cac
dịch vu nhăm muc đich tao thu nhập cho ban thân va gia đinh.
Người đang lam viêc bao gôm ca nhưng người không lam viêc trong tuân
nghiên cưu nhưng đang co môt công viêc va vẫn gắn bo chặt che với công viêc đo
(vẫn đươc tra lương/công trong thời gian không lam viêc hoặc chắc chắn se quay trở
lai lam sau thời gian không qua 1 tháng).
Ngoai ra, nhưng trường hơp cu thể sau đây đều đươc coi la người đang lam
viêc (co viêc lam):
(1) Nhưng người đang tham gia cac hoat đông tập huấn, đao tao hoặc cac
hoat đông nâng cao kỹ năng do yêu câu cua công viêc trong cơ sở tuyển dung;
(2) Nhưng người học viêc, tập sư (kể ca bac sĩ thưc tập) lam viêc va co
nhận đươc tiền lương, tiền công;
(3) Nhưng người lam viêc trong cac hô/cơ sở kinh tê cua chinh họ để san
xuất ra cac san phâm hang hoa va cung cấp dịch vu;
(4) Nhưng người lam viêc vi muc đich tiền công, tiền lương hoặc lơi nhuận
nhưng cac khoan tiền lương, tiền công va lơi nhuận đo co thể không tra trưc tiêp cho
họ ma đươc tich lũy vao thu nhập chung cua gia đinh họ. Nhưng người nay bao gôm:
(i) Người lam viêc trong cac đơn vị kinh doanh đươc tô chưc bởi 1 thanh
viên gia đinh đang sông cùng hô hoặc khac hô;
(ii) Người thưc hiên cac phân viêc, nhiêm vu cua 1 công viêc lam công ăn
lương đươc tô chưc bởi 1 thanh viên gia đinh đang sông cùng hô hoặc khac hô.
Ty lệ lao động đang làm việc trong nền kinh tế đã qua đào tạo la tỷ lê sô
lao đông đang lam viêc đa qua đao tao chiêm trong tông sô lao đông đang lam viêc
trong kỳ.
Tỷ lê lao đông đang lam trong nền kinh tê
đa qua đao tao (%) =
Sô người đang lam viêc đa qua đao tao × 100%
Tông sô lao đông đang lam viêc
Sô lao đông đang lam viêc trong nền kinh tê đa qua đao tao bao gôm nhưng
người thỏa man ca hai điều kiên sau đây:
- Đang lam viêc trong nền kinh tê;
- Đa đươc đao tao ở môt trường hay môt sơ sở đao tao chuyên môn, kỹ
thuật, nghiêp vu thuôc Hê thông giao duc quôc dân từ 3 thang trở lên, đa tôt
nghiêp, đươc cấp băng/chưng chỉ chưng nhận đa đat môt trinh đô chuyên môn, kỹ
thuật, nghiêp vu nhất định, bao gôm: sơ cấp nghề, trung cấp nghề, cao đẳng nghề,
trung cấp chuyên nghiêp, cao đẳng chuyên nghiêp, đai học va trên đai học (thac sỹ,
tiên sỹ, tiên sỹ khoa học).
38
EXPLANATION OF TERMINOLOGY, CONTENT AND CALCULATION METHODOLOGY OF SOME STATISTICAL
INDICATORS ON POPULATION AND LABOUR
POPULATION
Average population is the number of people on average for an entire period,
calculated by several the following methods:
If data is available at two time points (the beginning and the end of the short
period, usually a year), then use the following formula:
Ptb
= P0 + P1
2
Where:
Ptb: Average population;
P0: Population at the beginning of the period;
P1: Population at the end of the period.
If data is available at evenly distributed time points, then use the formula:
Ptb
=
P0 + P1 + .... + Pn-1 +
Pn
2 2
n
Where:
Ptb: Average population;
P0,1,...,n: Population at time points of 0, 1,..., n;
n: Number of evenly distributed time points.
If data is available at different times, using the formula:
Ptb
= Ptb1t1 + Ptb2t2+ .... + Ptbntn
∑ti
Where:
Ptb1: Average population of the first duration;
Ptb2: Average population of the second duration;
Ptbn: Average population of the nth duration;
ti: Length of the ith duration.
Urban population is the population of the territorial units which is designated
as urban areas by the State.
39
Rural population is the population of the territorial units which is designated as
rural areas by the State.
Population density is the average number of people per square kilometer of
the territorial area, calculated by dividing the population (time point or average) of a
certain residential area to the area of that territory. Population density can be calculated
for each province, district, commune, etc. to reflect the population distribution by
geography at a given time.
Population density (persons/km2)
= Population (persons)
Territorial area (km2)
Sex ratio of the population is determined by the number of males per 100
females of the population set, by the following formula:
Sex ratio of the population (%) = Total of males
× 100 Total of females
Crude birth rate is one of the indicators measuring the fertility of the
population, is one of the two components of natural population increase. High or low
value of crude birth rate can significantly affect the size, structure and population growth
rate. Crude birth rate indicates that for every 1000 people, how many live births are in
the year.
CBR (‰) = 1000
P
B
Where:
B: Total live births in the year;
P: Average population (or mid-year population).
Total fertility rate (TFR) is the average number of live births that would be
born per woman (or a group of women) during the childbirth period if the woman (or a
group of women) follow age-specific fertility rates observed in a given year during the
reproductive period (in other words, if she experienced age-specific fertility rates of
women aged 15, 16, 17, ..., up to 49).
1000W
BTFR
49
15x x
x
Where:
Bx : Number of live births registered in the year of women aged (x);
x : One-year age interval;
Wx: Number of women aged (x) in the middle of the calculation year.
Age-specific fertility rates are accumulated from x =15 to x =49.
40
In fact, the total fertility rate is calculated by the abridged method. In case that
the age-specific fertility rates are calculated for 5-year age groups, index of (i)
represents the 5-years interval of age, such as 15-19, 20-24, ..., 45-49. Then:
1000W
B5TFR
7
1i i
i
Where:
Bi : Number of live births registered in the year of women in the age group (i);
i : Consecutive5-year age intervals;
Wi: Number of women in the same age group (i) in the middle of the calculation year.
The coefficient of 5 in the above formula is applied for the average rate of
consecutive 5-year age groups so that the TFR will be commensurate with the age-
specific fertility rates described in this formula.
Crude deathrate is one of the two components of natural population
increase. High or low value of crude death rate can significantly affect the size,
structure and population growth rate. Crude death rate indicates that for every 1000
people, how many deaths are in the year.
CDR (‰) =
1000P
D
tb
Where:
CDR: Crude death rate;
D: Total of deaths in the year;
Ptb: Average population (or mid-year population).
Infant mortality rate is the measure of the mortality level of children in the
first year of life. This rate is defined as the number of children under one year of
ageper1000 live births in the year on average.
IMR = D0
× 1000 B
Where:
IMR: Infant mortality rate;
D0: Number of deaths of children under one year of age in the year;
B: Total of live births in the year.
Under-five mortality rate is the measure of mortality level of children in the
first five years of life. This rate is defined as the number of deaths of children under
age 5 per 1,000 live births in the year on average.
41
5q0 = 5D0
× 1000 B
Where:
5q0: Under five mortality rate (also known as U5MR);
5D0 : Number of deaths under age 5 in the year;
B: Total of live births in the year.
Natural growth rate of population is the difference between number of live
births and number of deaths compared to the average population during the reference
period, or the difference between the crude birth rate and the crude death rate of
population in the period.
NIR = B - D
× 1000 = CBR - CDR Ptb
Where:
NIR: Natural growth rate of population;
B: Number of live births in the year;
D: Number of deaths in the year;
Ptb: Average population (or population as of July) of the year.
CBR: Crude birth rate
CDR: Crude death rate
Total growth rate of population (referred to as "population growth rate") is
the rate that the population is increased (or decreased) in one period (usually for one
calendar year) due to natural increase and net migration, are expressed as a
percentage compared to the average population (or mid-year population).
GR = CBR - CDR + IMR - OMR
Where:
GR: Total growth rate of population;
CBR: Crude birth rate;
CDR: Crude death rate;
IMR: In-migration rate;
OMR: Out-migration rate.
Or: GR = NIR + NMR
Where:
NIR: Natural growth rate of population;
NMR: Net-migration rate.
42
In-migration rate is the number of people from different territorial units (out-
migration place) in-migrates to a territorial unit in the reference period (usually a
calendar year) on average per 1000 population of that territorial unit (in-migration
place).
IMR (‰) = I
× 1000 Ptb
Where:
IMR: In-migration rate;
I: Number of in-migrants in the year;
Ptb: Average population (or mid-year population).
Out-migration rate is the number out-migrants of a territorial unit in the
reference period (usually a calendar year) on average per 1000 population of that
territorial unit.
OMR (‰) = O
× 1000 Ptb
Where:
OMR: Out-migration rate;
O: Number of out-migrants in the year;
Ptb: Average population (or mid-year population).
Net-migration rate is the difference between number of immigrants and
number of out-migrants of a territorial unit in the reference period (usually a calendar
year) on average per 1000 population of that territorial unit.
NMR (‰) = I - O
× 1000 Ptb
Where:
NMR: Net-migration rate;
I: Number of immigrants in the year;
O: Number of out-migrants in the year;
Ptb: Average population (or mid-year population).
Or: NMR = IMR - OMR
Where:
NMR: Net-migration rate;
IMR: In-migration rate;
OMR: Out-migration rate.
43
Life expectancy at birth is the key statistical indicator of the Life table that
represents the prospect of a newborn could live for how many years if the current
mortality model is maintained.
e0 = T0
l0
Where:
e0: Life expectancy at birth;
T0: Total number of years of the newborns in the Life table who will continue
to live;
l0: Number of persons who live to the age of 0 of the Life table
(the set of original newborns is observed).
Life expectancy at birth is one of the integrated indicators calculated from the
Life table.
The Life table (also called the Mortality table) is a statistical table that includes
the indicators showing the mortality of the population at different ages and the viability
of population moving from one age to the next. The Life table shows that from an initial
set of the births (on the same cohort), there will be how many persons who will live to 1
year, 2 years, ..., 100 years, ...; among them, there are how many persons at each of
the certain ages who will be dead before the following age; those persons who have
reached a certain age will have what probability of survival and death; how long is the
life expectancy in the future.
Rate of literate population aged 15 years and overis the rate between the
number of persons aged 15 years and over at time (t) who are literate (able to read,
write and understand a simple sentence in the national language, ethnic or foreign
language) and the total population aged 15 years and over at that time.
Rate of literate population aged 15 years and over (%)
= Literate population aged 15 years and over
× 100 Total population aged 15 years and over
Singulate mean age at marriage (SMAM) is the average number of single
life years of a presumptive cohort that has been lived single life before getting married
for the first time, with the assumption that this cohort’s proportion of single by age is
the same as the one collected at the intercensal time point.
LABOUR FORCE AND EMPLOYMENT
Labour force includes the employed persons aged 15 years and over
(currently working) and the unemployed persons during the reference period (7 days
prior to the time point of observation).
Employed population in the economy includes persons aged 15 years and over
who are employed in the reference period (7 days prior the time point of observation).

44
Employed population in the economy are persons aged 15 years and above in
the reference period who are engaged in any activity (not prohibited by the law) at
least one hour to produce goods/products or provide services for the purpose of
generating income for themselves and their families.
Employed population also include those persons who are not working in the
reference week but have a job and strongly attach to this job (such as continuously
receive salary/wage during the absence from work or surely back to work for less
than 1 month).
Besides, the following specific cases are also considered “employed” or
“engaged in an activity”:
(1) Those persons who are participating in training or skill enhancement
activities due to job requirements in the recruiting establishment;
(2) Those persons who are considered apprentices, trainees (including
interns), are working and receiving wage/salary;
(3) Those persons who are working in their own economic establishments/
households to produce goods/products or provide services;
(4) Those persons who are working for the purpose of wage/salary/profit even
that the money is not paid directly to them but accrued to their own families’ general
income, including:
(i) Those persons who are working in any kind of business units run by one
member of their own families, living in the same or another household;
(ii) Those persons who are in charge of any task/duty of a paid job held by
one member of their own families, living in the same or another household.
Rate of trained persons employed in the economy is the rate of trained
persons employed to total number of persons employed in the period.
Rate of trained persons employed in the economy
= Number of trained persons employed
× 100 Total number of persons employed
Number of trained persons employed in the economy includes those who
satisfy both of the following conditions:
- Be employed in the economy;
- Have been trained in a school or an establishment whose responsibility is
training in professional, technical knowledge under the National Education System
for 3 months and more, have been graduated or granted the degree/certificate
including: short-term training, vocational secondary school, vocational college,
professional secondary school, college, university and post-graduate (master, doctor,
and science doctorate).
45
MỘT SÔ NÉT VỀ DÂN SÔ, LAO ĐỘNG VÀ VIỆC LÀM NĂM 2019
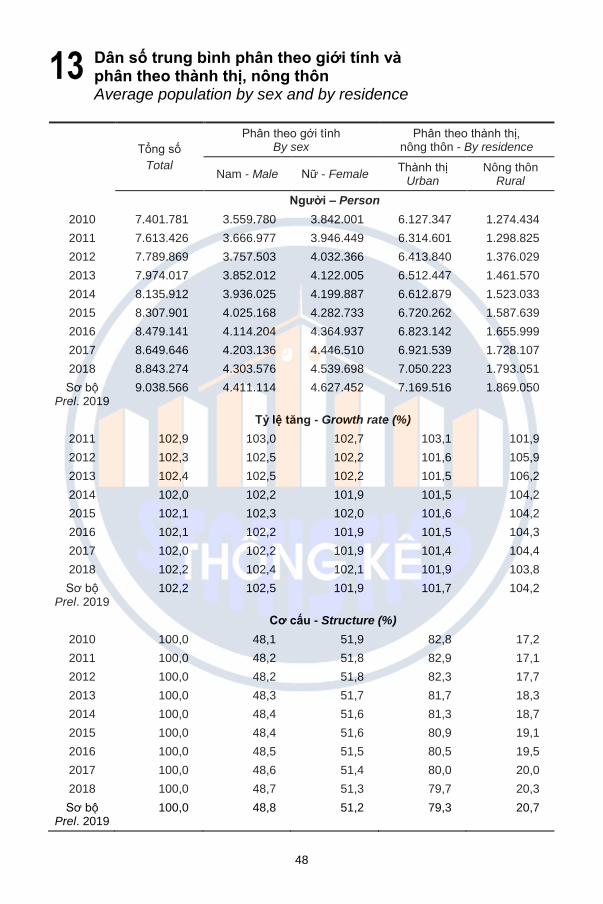
Năm 2019, dân sô trung binh Thanh phô Hô Chi Minh đat 9,04 triêu người,
tăng 2,2% so với năm 2018. Trong đo, dân sô tai khu vưc thanh thị chiêm 79,3% với
7,17 triêu người, tăng 1,7% so với năm 2018; dân sô tai khu vưc nông thôn chiêm
20,7% với 1,87 triêu người, tăng 4,2%; dân sô la nam giới chiêm 48,8% với 4,41 triêu
người, tăng 2,5% va dân sô la nư giới chiêm 51,2% với 4,63 triêu người, tăng 1,9%.
Tỷ sô giới tinh dân sô cua toan Thanh phô la 95,3 nam/100 nư (năm 2018: 94,8
nam/100 nư), khu vưc thanh thị la 93,8 nam/100 nư va khu vưc nông thôn 99,7
nam/100 nư.Tỷ suất sinh thô đat 14,1‰ (năm 2018: 12,3‰); tỷ suất chêt thô đat
4,7‰ (năm 2018: 4,6‰) va tỷ lê tăng tư nhiên đat 9,4‰ (năm 2018: 7,7‰).Tuôi thọ
trung binh cua dân sô đat 76,6 tuôi (năm 2018: 76,6 tuôi).
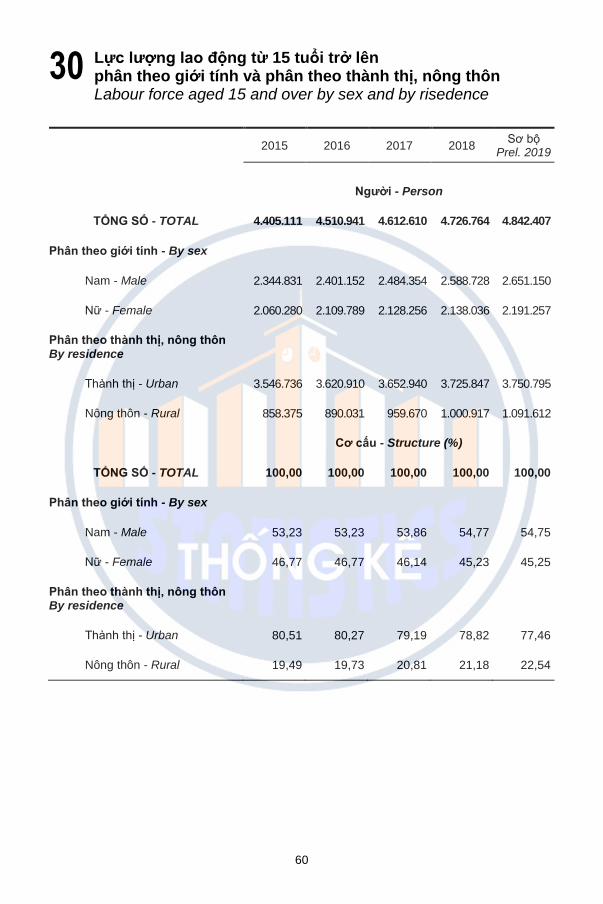
Năm 2019, lưc lương lao đông từ 15 tuôi trở lên cua Thanh phô đat 4,84 triêu
người, tăng 2,4% so với năm 2018. Trong đo, lưc lương lao đông tai khu vưc thanh
thị chiêm 77,46%, khu vưc nông thôn chiêm 22,54%, lưc lương lao đông la nam giới
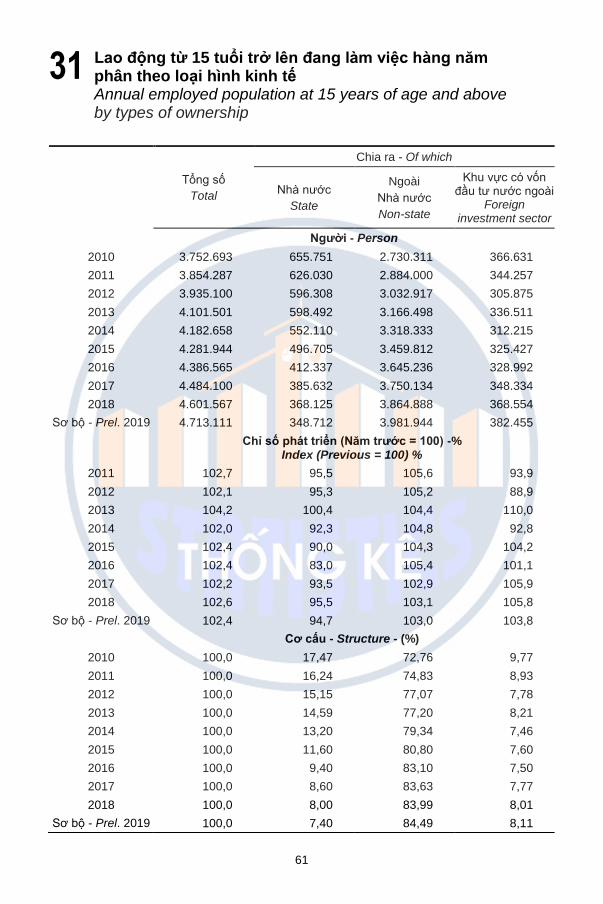
chiêm 54,75% va nư giới chiêm 45,25%. Lao đông từ 15 tuôi trở lên đang lam viêc
trong nền kinh tê cua Thanh phô đat 4,71 triêu lao đông, chiêm 97,33% tông lưc
lương lao đông từ 15 tuôi trở lên va tăng 2,4% sô lao đông so với năm 2018. Trong
đo, lao đông trong khu vưc nha nước chiêm 7,40%; lao đông trong khu vưc tư nhân
chiêm 84,49% va trong khu vưc co vôn đâu tư nước ngoai chiêm 8,11%.
Năm 2019, tỷ lê lao đông đa qua đao tao đat 37,30%, tăng 0,56 điểm phân
trăm so với năm 2018. Trong đo, tai khu vưc thanh thị co tỷ lê lao đông đa qua đao
tao đat 41,01%, tăng 1,25 điểm phân trăm so năm 2018; tai khu vưc nông thôn, tỷ lê
lao đông đa qua đao tao đat 24,54%, tăng 0,38 điểm phân trăm; lao đông la nam giới
co tỷ lê đa qua đao tao chiêm 39,21%, giam 0,29 điểm phân trăm; lao đông la nư giới
chiêm 34,99%, tăng 1,6 điểm phân trăm so với năm 2018.
46
POPULATION, LABOR AND EMPLOYMENT IN 2019
Average population in Ho Chi Minh city in 2019 reached over 9.04 million
people, an increase of 2.2% over 2018; among them, the urban population
accounted for 79.3% with 7.17 million people an increase of 1.7% over 2018; the
rural population accounted for 20.7% with 1.87 million people; rising by 4.2%; male
population accounted for 48.8% with 4.41 million people; rising by 2.5%; female
population accounted for 51.2% with 4.63 million people, rising by 1.9%. The sex
ratio was 95.3 males per 100 females, in which the gender ratio in urban area was
93.8 males/100 females; the gender ratio in rural area was 99.7 males/100 females;
the crude birth rate in 2019 was 14.1‰; the crude death rate was 4.7‰; the natural
increase rate was 9.4‰.The city average life expectancy at birth was 76.6 years,
equivalent to 2018
Labor force at 15 years of age and above in 2019 was 4.84 million people,
rising by 2.4% compared to 2018; of which the labor force in urban areas accounted
for 77.46%; the labor force in rural areas accounted for 22.54%; male employees
accounted for 54.75%; female employees accounted for 45.25%. Labor force working
in state sector, private sector and FDI accounted for 7.40 %; 84.49% and 8.11%
respectively.
In 2019, the percentage of trained employed workers aged 15 years and
above gained 37.30%; 0.56 percentage points higher than the previous year; in which
the percentage of trained employed workers in urban areas was 41.01%; 1.25
percentage points higher than the previous year and in rural areas was 24.54%; rising
0.38 percentage points; the percentage of male trained employed workers aged 15
years and above was 39.21%; declining 0.29 percentage points and this rate in
female workers was 32.98%, rising by 1.6 percentage points against 2018.
47
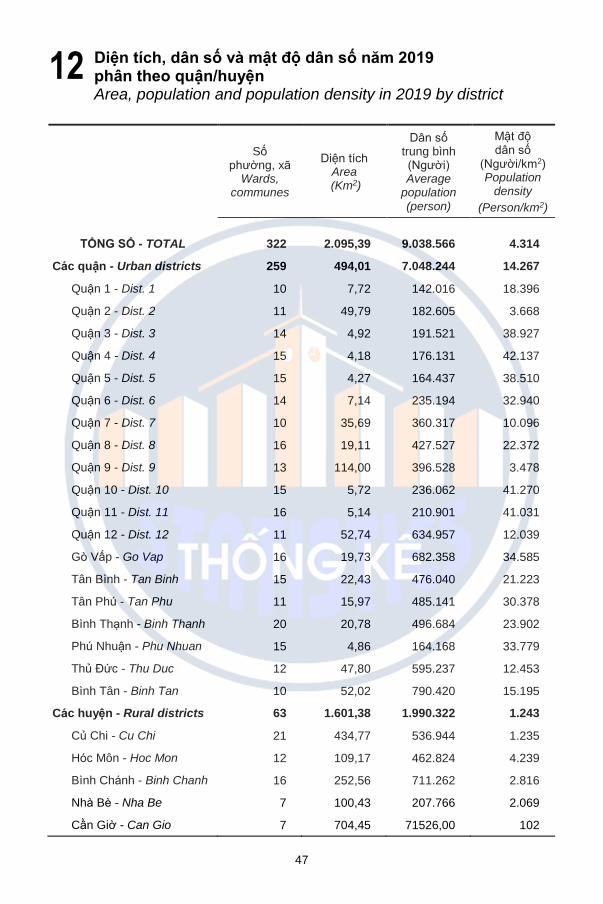
Diện tích, dân số và mật độ dân số năm 2019 phân theo quận/huyện Area, population and population density in 2019 by district
Sô phường, xa
Wards, communes
Diên tich Area
(Km2)
Dân sô trung bình (Người) Average
population (person)
Mật đô dân sô
(Người/km2) Population
density
(Person/km2)
TỔNG SÔ - TOTAL 322 2.095,39 9.038.566 4.314
Các quận - Urban districts 259 494,01 7.048.244 14.267
Quận 1 - Dist. 1 10 7,72 142.016 18.396
Quận 2 - Dist. 2 11 49,79 182.605 3.668
Quận 3 - Dist. 3 14 4,92 191.521 38.927
Quận 4 - Dist. 4 15 4,18 176.131 42.137
Quận 5 - Dist. 5 15 4,27 164.437 38.510
Quận 6 - Dist. 6 14 7,14 235.194 32.940
Quận 7 - Dist. 7 10 35,69 360.317 10.096
Quận 8 - Dist. 8 16 19,11 427.527 22.372
Quận 9 - Dist. 9 13 114,00 396.528 3.478
Quận 10 - Dist. 10 15 5,72 236.062 41.270
Quận 11 - Dist. 11 16 5,14 210.901 41.031
Quận 12 - Dist. 12 11 52,74 634.957 12.039
Go Vấp - Go Vap 16 19,73 682.358 34.585
Tân Binh - Tan Binh 15 22,43 476.040 21.223
Tân Phú - Tan Phu 11 15,97 485.141 30.378
Binh Thanh - Binh Thanh 20 20,78 496.684 23.902
Phú Nhuận - Phu Nhuan 15 4,86 164.168 33.779
Thu Đưc - Thu Duc 12 47,80 595.237 12.453
Binh Tân - Binh Tan 10 52,02 790.420 15.195
Các huyện - Rural districts 63 1.601,38 1.990.322 1.243
Cu Chi - Cu Chi 21 434,77 536.944 1.235
Hoc Môn - Hoc Mon 12 109,17 462.824 4.239
Binh Chanh - Binh Chanh 16 252,56 711.262 2.816
Nha Be - Nha Be 7 100,43 207.766 2.069
Cân Giờ - Can Gio 7 704,45 71526,00 102
12
48
Dân số trung bình phân theo giới tính và phân theo thành thị, nông thôn Average population by sex and by residence
Tông sô
Total
Phân theo gới tinh By sex
Phân theo thanh thị, nông thôn - By residence
Nam - Male Nư - Female Thanh thị
Urban Nông thôn
Rural
Người – Person
2010 7.401.781 3.559.780 3.842.001 6.127.347 1.274.434
2011 7.613.426 3.666.977 3.946.449 6.314.601 1.298.825
2012 7.789.869 3.757.503 4.032.366 6.413.840 1.376.029
2013 7.974.017 3.852.012 4.122.005 6.512.447 1.461.570
2014 8.135.912 3.936.025 4.199.887 6.612.879 1.523.033
2015 8.307.901 4.025.168 4.282.733 6.720.262 1.587.639
2016 8.479.141 4.114.204 4.364.937 6.823.142 1.655.999
2017 8.649.646 4.203.136 4.446.510 6.921.539 1.728.107
2018 8.843.274 4.303.576 4.539.698 7.050.223 1.793.051
Sơ bô Prel. 2019
9.038.566 4.411.114 4.627.452 7.169.516 1.869.050
Ty lệ tăng - Growth rate (%)
2011 102,9 103,0 102,7 103,1 101,9
2012 102,3 102,5 102,2 101,6 105,9
2013 102,4 102,5 102,2 101,5 106,2
2014 102,0 102,2 101,9 101,5 104,2
2015 102,1 102,3 102,0 101,6 104,2
2016 102,1 102,2 101,9 101,5 104,3
2017 102,0 102,2 101,9 101,4 104,4
2018 102,2 102,4 102,1 101,9 103,8
Sơ bô Prel. 2019
102,2 102,5 101,9 101,7 104,2
Cơ cấu - Structure (%)
2010 100,0 48,1 51,9 82,8 17,2
2011 100,0 48,2 51,8 82,9 17,1
2012 100,0 48,2 51,8 82,3 17,7
2013 100,0 48,3 51,7 81,7 18,3
2014 100,0 48,4 51,6 81,3 18,7
2015 100,0 48,4 51,6 80,9 19,1
2016 100,0 48,5 51,5 80,5 19,5
2017 100,0 48,6 51,4 80,0 20,0
2018 100,0 48,7 51,3 79,7 20,3
Sơ bô Prel. 2019
100,0 48,8 51,2 79,3 20,7
13
49
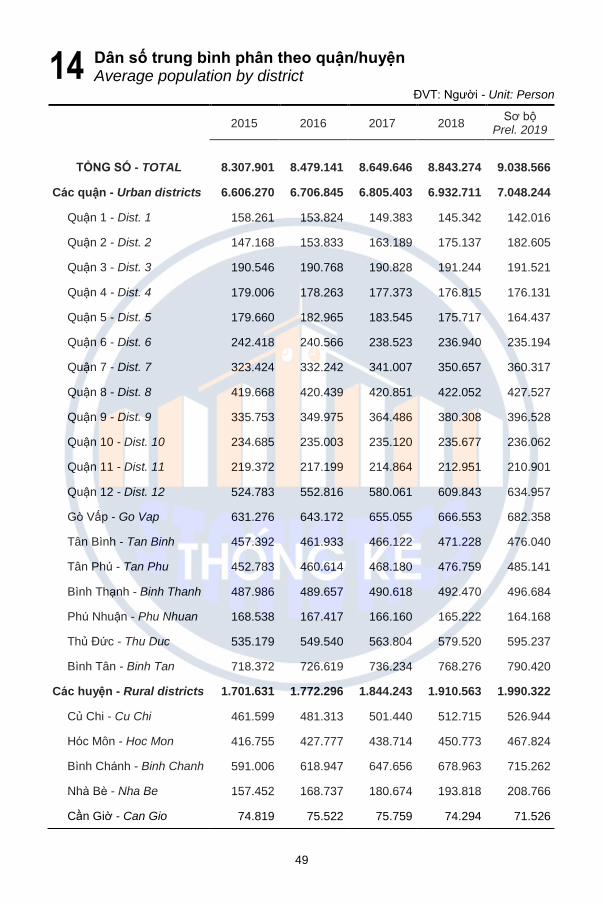
Dân số trung bình phân theo quận/huyện Average population by district
ĐVT: Người - Unit: Person
2015 2016 2017 2018 Sơ bô
Prel. 2019
TỔNG SÔ - TOTAL 8.307.901 8.479.141 8.649.646 8.843.274 9.038.566
Các quận - Urban districts 6.606.270 6.706.845 6.805.403 6.932.711 7.048.244
Quận 1 - Dist. 1 158.261 153.824 149.383 145.342 142.016
Quận 2 - Dist. 2 147.168 153.833 163.189 175.137 182.605
Quận 3 - Dist. 3 190.546 190.768 190.828 191.244 191.521
Quận 4 - Dist. 4 179.006 178.263 177.373 176.815 176.131
Quận 5 - Dist. 5 179.660 182.965 183.545 175.717 164.437
Quận 6 - Dist. 6 242.418 240.566 238.523 236.940 235.194
Quận 7 - Dist. 7 323.424 332.242 341.007 350.657 360.317
Quận 8 - Dist. 8 419.668 420.439 420.851 422.052 427.527
Quận 9 - Dist. 9 335.753 349.975 364.486 380.308 396.528
Quận 10 - Dist. 10 234.685 235.003 235.120 235.677 236.062
Quận 11 - Dist. 11 219.372 217.199 214.864 212.951 210.901
Quận 12 - Dist. 12 524.783 552.816 580.061 609.843 634.957
Go Vấp - Go Vap 631.276 643.172 655.055 666.553 682.358
Tân Binh - Tan Binh 457.392 461.933 466.122 471.228 476.040
Tân Phú - Tan Phu 452.783 460.614 468.180 476.759 485.141
Binh Thanh - Binh Thanh 487.986 489.657 490.618 492.470 496.684
Phú Nhuận - Phu Nhuan 168.538 167.417 166.160 165.222 164.168
Thu Đưc - Thu Duc 535.179 549.540 563.804 579.520 595.237
Binh Tân - Binh Tan 718.372 726.619 736.234 768.276 790.420
Các huyện - Rural districts 1.701.631 1.772.296 1.844.243 1.910.563 1.990.322
Cu Chi - Cu Chi 461.599 481.313 501.440 512.715 526.944
Hoc Môn - Hoc Mon 416.755 427.777 438.714 450.773 467.824
Binh Chanh - Binh Chanh 591.006 618.947 647.656 678.963 715.262
Nha Be - Nha Be 157.452 168.737 180.674 193.818 208.766
Cân Giờ - Can Gio 74.819 75.522 75.759 74.294 71.526
14
50
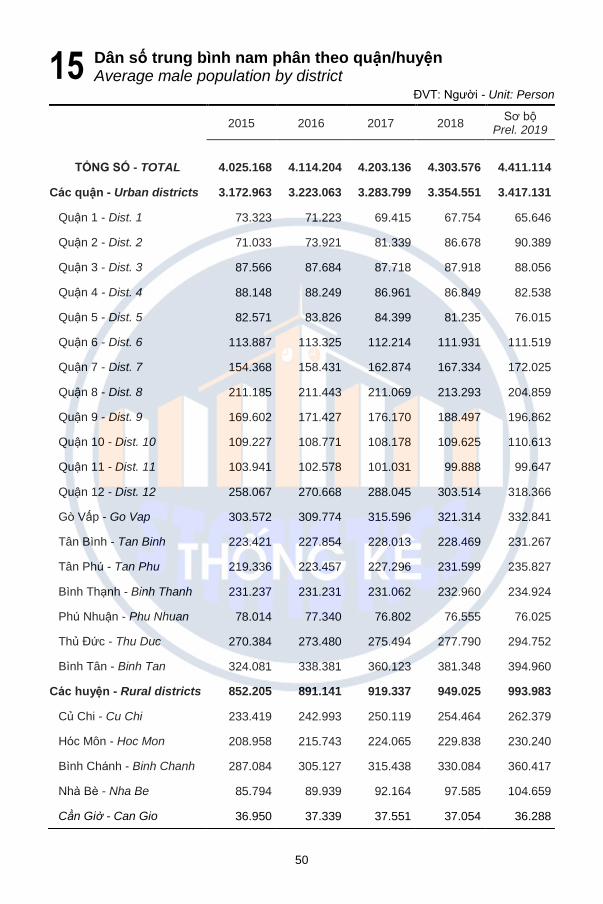
Dân số trung bình nam phân theo quận/huyện Average male population by district
ĐVT: Người - Unit: Person
2015 2016 2017 2018
Sơ bô Prel. 2019
TỔNG SÔ - TOTAL 4.025.168 4.114.204 4.203.136 4.303.576 4.411.114
Các quận - Urban districts 3.172.963 3.223.063 3.283.799 3.354.551 3.417.131
Quận 1 - Dist. 1 73.323 71.223 69.415 67.754 65.646
Quận 2 - Dist. 2 71.033 73.921 81.339 86.678 90.389
Quận 3 - Dist. 3 87.566 87.684 87.718 87.918 88.056
Quận 4 - Dist. 4 88.148 88.249 86.961 86.849 82.538
Quận 5 - Dist. 5 82.571 83.826 84.399 81.235 76.015
Quận 6 - Dist. 6 113.887 113.325 112.214 111.931 111.519
Quận 7 - Dist. 7 154.368 158.431 162.874 167.334 172.025
Quận 8 - Dist. 8 211.185 211.443 211.069 213.293 204.859
Quận 9 - Dist. 9 169.602 171.427 176.170 188.497 196.862
Quận 10 - Dist. 10 109.227 108.771 108.178 109.625 110.613
Quận 11 - Dist. 11 103.941 102.578 101.031 99.888 99.647
Quận 12 - Dist. 12 258.067 270.668 288.045 303.514 318.366
Go Vấp - Go Vap 303.572 309.774 315.596 321.314 332.841
Tân Binh - Tan Binh 223.421 227.854 228.013 228.469 231.267
Tân Phú - Tan Phu 219.336 223.457 227.296 231.599 235.827
Binh Thanh - Binh Thanh 231.237 231.231 231.062 232.960 234.924
Phú Nhuận - Phu Nhuan 78.014 77.340 76.802 76.555 76.025
Thu Đưc - Thu Duc 270.384 273.480 275.494 277.790 294.752
Binh Tân - Binh Tan 324.081 338.381 360.123 381.348 394.960
Các huyện - Rural districts 852.205 891.141 919.337 949.025 993.983
Cu Chi - Cu Chi 233.419 242.993 250.119 254.464 262.379
Hoc Môn - Hoc Mon 208.958 215.743 224.065 229.838 230.240
Binh Chanh - Binh Chanh 287.084 305.127 315.438 330.084 360.417
Nha Be - Nha Be 85.794 89.939 92.164 97.585 104.659
Cần Giờ - Can Gio 36.950 37.339 37.551 37.054 36.288
15
51
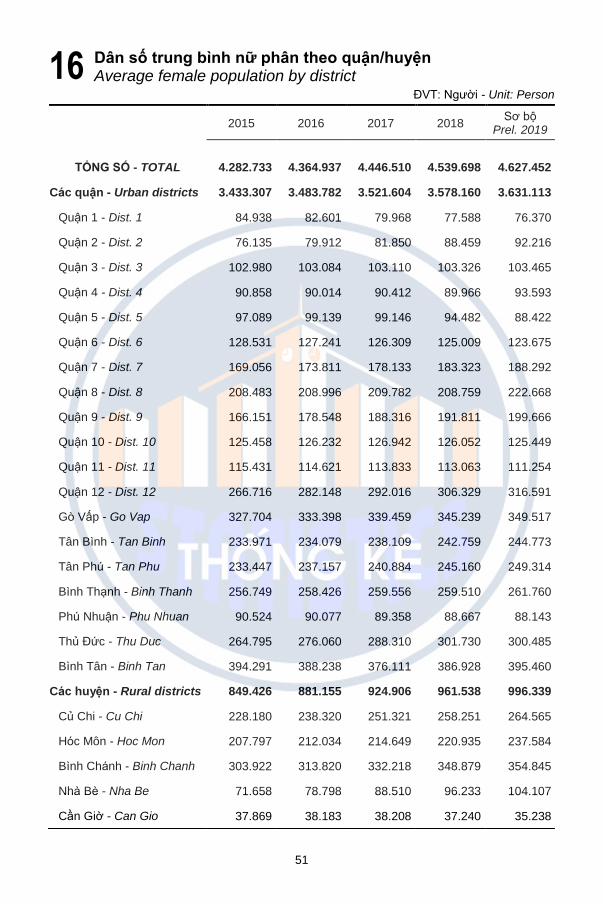
Dân số trung bình nữ phân theo quận/huyện Average female population by district
ĐVT: Người - Unit: Person
2015 2016 2017 2018
Sơ bô Prel. 2019
TỔNG SÔ - TOTAL 4.282.733 4.364.937 4.446.510 4.539.698 4.627.452
Các quận - Urban districts 3.433.307 3.483.782 3.521.604 3.578.160 3.631.113
Quận 1 - Dist. 1 84.938 82.601 79.968 77.588 76.370
Quận 2 - Dist. 2 76.135 79.912 81.850 88.459 92.216
Quận 3 - Dist. 3 102.980 103.084 103.110 103.326 103.465
Quận 4 - Dist. 4 90.858 90.014 90.412 89.966 93.593
Quận 5 - Dist. 5 97.089 99.139 99.146 94.482 88.422
Quận 6 - Dist. 6 128.531 127.241 126.309 125.009 123.675
Quận 7 - Dist. 7 169.056 173.811 178.133 183.323 188.292
Quận 8 - Dist. 8 208.483 208.996 209.782 208.759 222.668
Quận 9 - Dist. 9 166.151 178.548 188.316 191.811 199.666
Quận 10 - Dist. 10 125.458 126.232 126.942 126.052 125.449
Quận 11 - Dist. 11 115.431 114.621 113.833 113.063 111.254
Quận 12 - Dist. 12 266.716 282.148 292.016 306.329 316.591
Go Vấp - Go Vap 327.704 333.398 339.459 345.239 349.517
Tân Binh - Tan Binh 233.971 234.079 238.109 242.759 244.773
Tân Phú - Tan Phu 233.447 237.157 240.884 245.160 249.314
Binh Thanh - Binh Thanh 256.749 258.426 259.556 259.510 261.760
Phú Nhuận - Phu Nhuan 90.524 90.077 89.358 88.667 88.143
Thu Đưc - Thu Duc 264.795 276.060 288.310 301.730 300.485
Binh Tân - Binh Tan 394.291 388.238 376.111 386.928 395.460
Các huyện - Rural districts 849.426 881.155 924.906 961.538 996.339
Cu Chi - Cu Chi 228.180 238.320 251.321 258.251 264.565
Hoc Môn - Hoc Mon 207.797 212.034 214.649 220.935 237.584
Binh Chanh - Binh Chanh 303.922 313.820 332.218 348.879 354.845
Nha Be - Nha Be 71.658 78.798 88.510 96.233 104.107
Cân Giờ - Can Gio 37.869 38.183 38.208 37.240 35.238
16
52
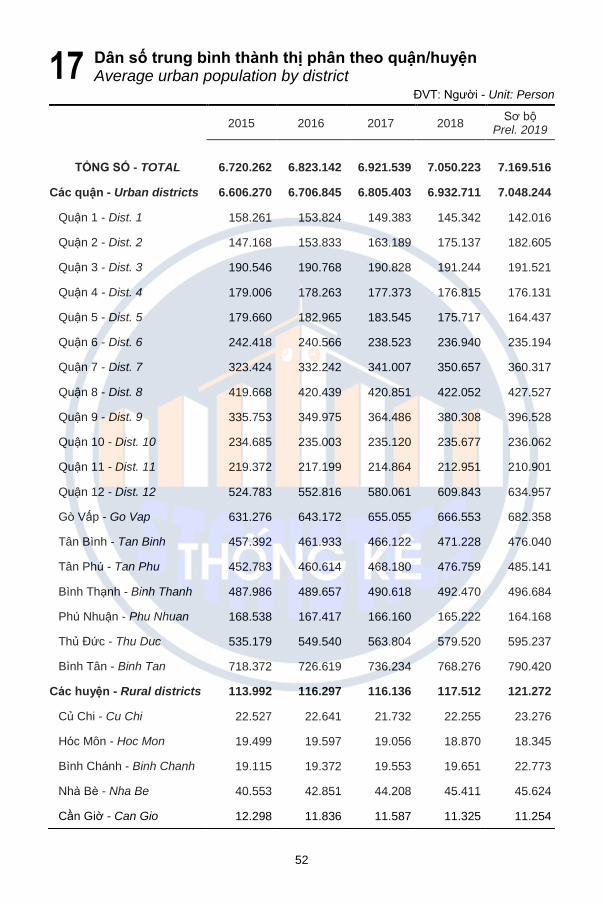
Dân số trung bình thành thị phân theo quận/huyện Average urban population by district
ĐVT: Người - Unit: Person
2015 2016 2017 2018
Sơ bô Prel. 2019
TỔNG SÔ - TOTAL 6.720.262 6.823.142 6.921.539 7.050.223 7.169.516
Các quận - Urban districts 6.606.270 6.706.845 6.805.403 6.932.711 7.048.244
Quận 1 - Dist. 1 158.261 153.824 149.383 145.342 142.016
Quận 2 - Dist. 2 147.168 153.833 163.189 175.137 182.605
Quận 3 - Dist. 3 190.546 190.768 190.828 191.244 191.521
Quận 4 - Dist. 4 179.006 178.263 177.373 176.815 176.131
Quận 5 - Dist. 5 179.660 182.965 183.545 175.717 164.437
Quận 6 - Dist. 6 242.418 240.566 238.523 236.940 235.194
Quận 7 - Dist. 7 323.424 332.242 341.007 350.657 360.317
Quận 8 - Dist. 8 419.668 420.439 420.851 422.052 427.527
Quận 9 - Dist. 9 335.753 349.975 364.486 380.308 396.528
Quận 10 - Dist. 10 234.685 235.003 235.120 235.677 236.062
Quận 11 - Dist. 11 219.372 217.199 214.864 212.951 210.901
Quận 12 - Dist. 12 524.783 552.816 580.061 609.843 634.957
Go Vấp - Go Vap 631.276 643.172 655.055 666.553 682.358
Tân Binh - Tan Binh 457.392 461.933 466.122 471.228 476.040
Tân Phú - Tan Phu 452.783 460.614 468.180 476.759 485.141
Binh Thanh - Binh Thanh 487.986 489.657 490.618 492.470 496.684
Phú Nhuận - Phu Nhuan 168.538 167.417 166.160 165.222 164.168
Thu Đưc - Thu Duc 535.179 549.540 563.804 579.520 595.237
Binh Tân - Binh Tan 718.372 726.619 736.234 768.276 790.420
Các huyện - Rural districts 113.992 116.297 116.136 117.512 121.272
Cu Chi - Cu Chi 22.527 22.641 21.732 22.255 23.276
Hoc Môn - Hoc Mon 19.499 19.597 19.056 18.870 18.345
Binh Chanh - Binh Chanh 19.115 19.372 19.553 19.651 22.773
Nha Be - Nha Be 40.553 42.851 44.208 45.411 45.624
Cân Giờ - Can Gio 12.298 11.836 11.587 11.325 11.254
17
53
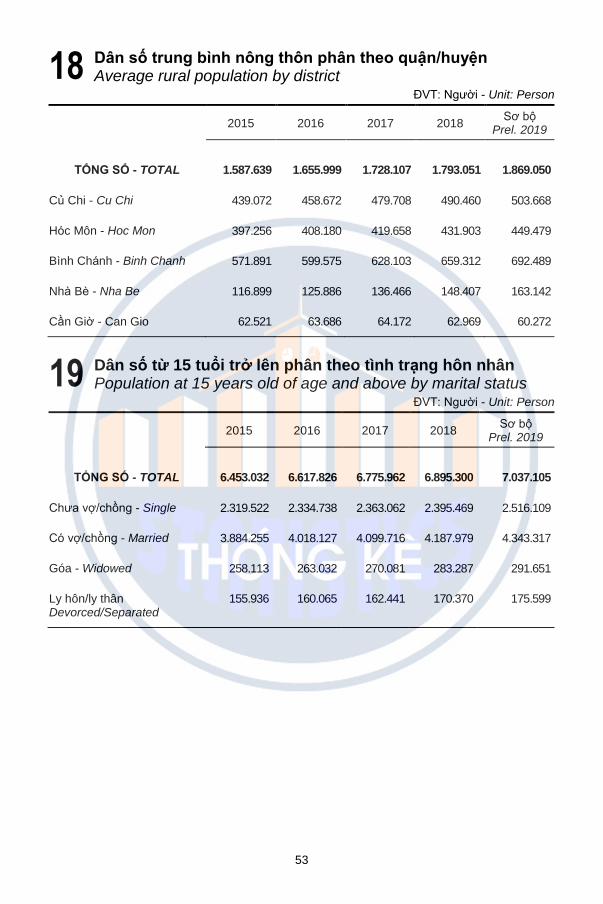
Dân số trung bình nông thôn phân theo quận/huyện Average rural population by district
ĐVT: Người - Unit: Person
2015 2016 2017 2018
Sơ bô Prel. 2019
TỔNG SÔ - TOTAL 1.587.639 1.655.999 1.728.107 1.793.051 1.869.050
Cu Chi - Cu Chi 439.072 458.672 479.708 490.460 503.668
Hoc Môn - Hoc Mon 397.256 408.180 419.658 431.903 449.479
Binh Chanh - Binh Chanh 571.891 599.575 628.103 659.312 692.489
Nha Be - Nha Be 116.899 125.886 136.466 148.407 163.142
Cân Giờ - Can Gio 62.521 63.686 64.172 62.969 60.272
Dân số từ 15 tuổi trở lên phân theo tình trạng hôn nhân Population at 15 years old of age and above by marital status
ĐVT: Người - Unit: Person
2015 2016 2017 2018
Sơ bô Prel. 2019
TỔNG SÔ - TOTAL 6.453.032 6.617.826 6.775.962 6.895.300 7.037.105
Chưa vơ/chông - Single 2.319.522 2.334.738 2.363.062 2.395.469 2.516.109
Co vơ/chông - Married 3.884.255 4.018.127 4.099.716 4.187.979 4.343.317
Góa - Widowed 258.113 263.032 270.081 283.287 291.651
Ly hôn/ly thân Devorced/Separated
155.936 160.065 162.441 170.370 175.599
18
19
54
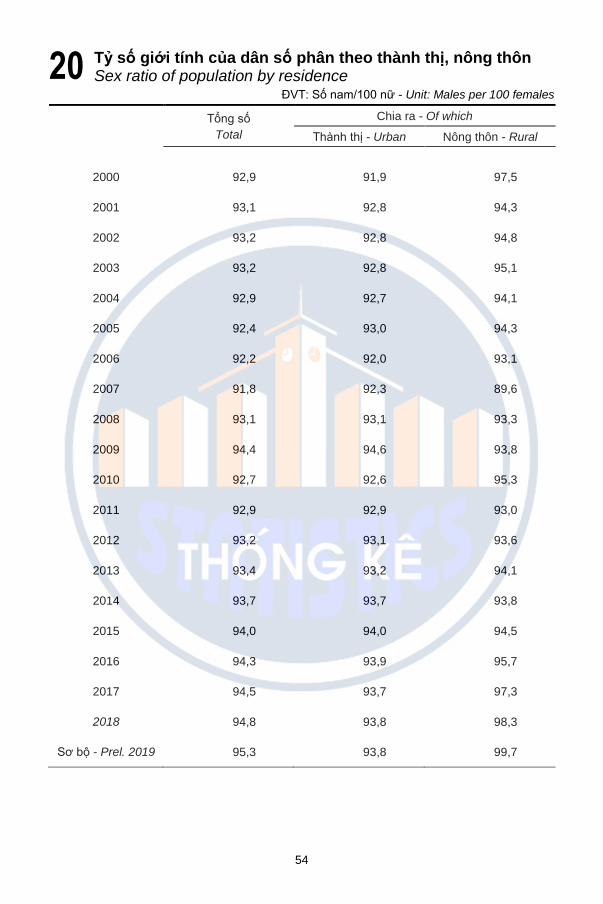
Ty số giới tính của dân số phân theo thành thị, nông thôn Sex ratio of population by residence
ĐVT: Sô nam/100 nư - Unit: Males per 100 females
Tông sô
Total
Chia ra - Of which
Thanh thị - Urban Nông thôn - Rural
2000 92,9 91,9 97,5
2001 93,1 92,8 94,3
2002 93,2 92,8 94,8
2003 93,2 92,8 95,1
2004 92,9 92,7 94,1
2005 92,4 93,0 94,3
2006 92,2 92,0 93,1
2007 91,8 92,3 89,6
2008 93,1 93,1 93,3
2009 94,4 94,6 93,8
2010 92,7 92,6 95,3
2011 92,9 92,9 93,0
2012 93,2 93,1 93,6
2013 93,4 93,2 94,1
2014 93,7 93,7 93,8
2015 94,0 94,0 94,5
2016 94,3 93,9 95,7
2017 94,5 93,7 97,3
2018 94,8 93,8 98,3
Sơ bô - Prel. 2019 95,3 93,8 99,7
20
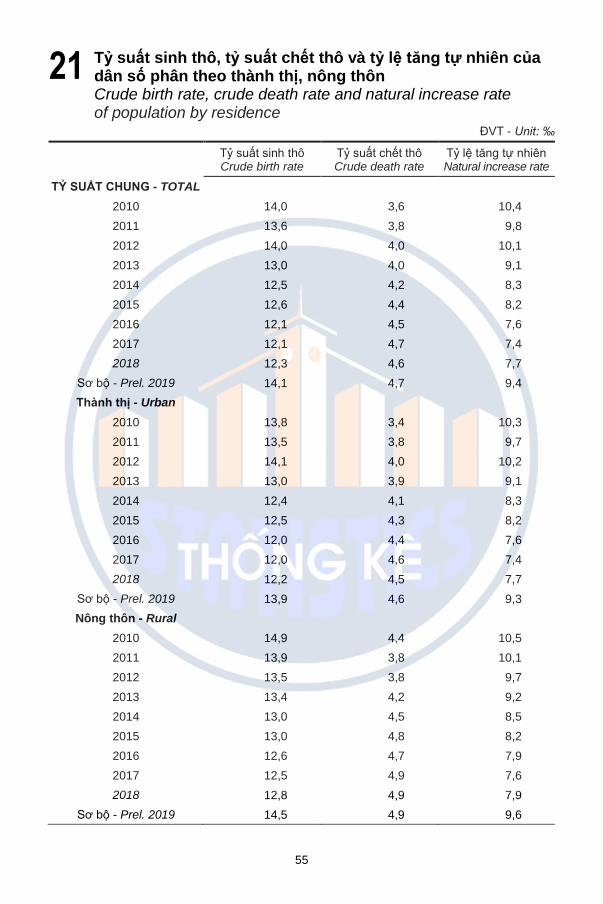
55
Ty suất sinh thô, ty suất chết thô và ty lệ tăng tự nhiên của dân số phân theo thành thị, nông thôn Crude birth rate, crude death rate and natural increase rate of population by residence
ĐVT - Unit: ‰
Tỷ suất sinh thô Crude birth rate
Tỷ suất chêt thô Crude death rate
Tỷ lê tăng tư nhiên Natural increase rate
TỶ SUẤT CHUNG - TOTAL
2010 14,0 3,6 10,4
2011 13,6 3,8 9,8
2012 14,0 4,0 10,1
2013 13,0 4,0 9,1
2014 12,5 4,2 8,3
2015 12,6 4,4 8,2
2016 12,1 4,5 7,6
2017 12,1 4,7 7,4
2018 12,3 4,6 7,7
Sơ bô - Prel. 2019 14,1 4,7 9,4
Thành thị - Urban
2010 13,8 3,4 10,3
2011 13,5 3,8 9,7
2012 14,1 4,0 10,2
2013 13,0 3,9 9,1
2014 12,4 4,1 8,3
2015 12,5 4,3 8,2
2016 12,0 4,4 7,6
2017 12,0 4,6 7,4
2018 12,2 4,5 7,7
Sơ bô - Prel. 2019 13,9 4,6 9,3
Nông thôn - Rural
2010 14,9 4,4 10,5
2011 13,9 3,8 10,1
2012 13,5 3,8 9,7
2013 13,4 4,2 9,2
2014 13,0 4,5 8,5
2015 13,0 4,8 8,2
2016 12,6 4,7 7,9
2017 12,5 4,9 7,6
2018 12,8 4,9 7,9
Sơ bô - Prel. 2019 14,5 4,9 9,6
21
56
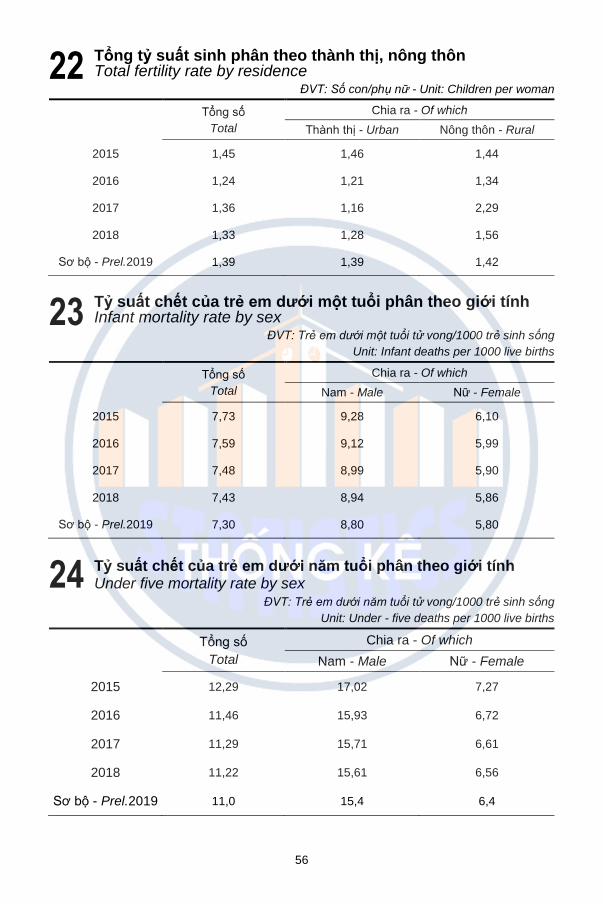
Tổng ty suất sinh phân theo thành thị, nông thôn Total fertility rate by residence
ĐVT: Số con/phụ nữ - Unit: Children per woman
Tông sô
Total
Chia ra - Of which
Thanh thị - Urban Nông thôn - Rural
2015 1,45 1,46 1,44
2016 1,24 1,21 1,34
2017 1,36 1,16 2,29
2018 1,33 1,28 1,56
Sơ bô - Prel.2019 1,39 1,39 1,42
Ty suất chết của trẻ em dưới một tuổi phân theo giới tính Infant mortality rate by sex
ĐVT: Trẻ em dưới một tuổi tử vong/1000 trẻ sinh sống
Unit: Infant deaths per 1000 live births
Tông sô
Total
Chia ra - Of which
Nam - Male Nư - Female
2015 7,73 9,28 6,10
2016 7,59 9,12 5,99
2017 7,48 8,99 5,90
2018 7,43 8,94 5,86
Sơ bô - Prel.2019 7,30 8,80 5,80
Ty suất chết của trẻ em dưới năm tuổi phân theo giới tính Under five mortality rate by sex
ĐVT: Trẻ em dưới năm tuổi tử vong/1000 trẻ sinh sống
Unit: Under - five deaths per 1000 live births
Tông sô
Total
Chia ra - Of which
Nam - Male Nư - Female
2015 12,29 17,02 7,27
2016 11,46 15,93 6,72
2017 11,29 15,71 6,61
2018 11,22 15,61 6,56
Sơ bô - Prel.2019 11,0 15,4 6,4
22
24
23
57
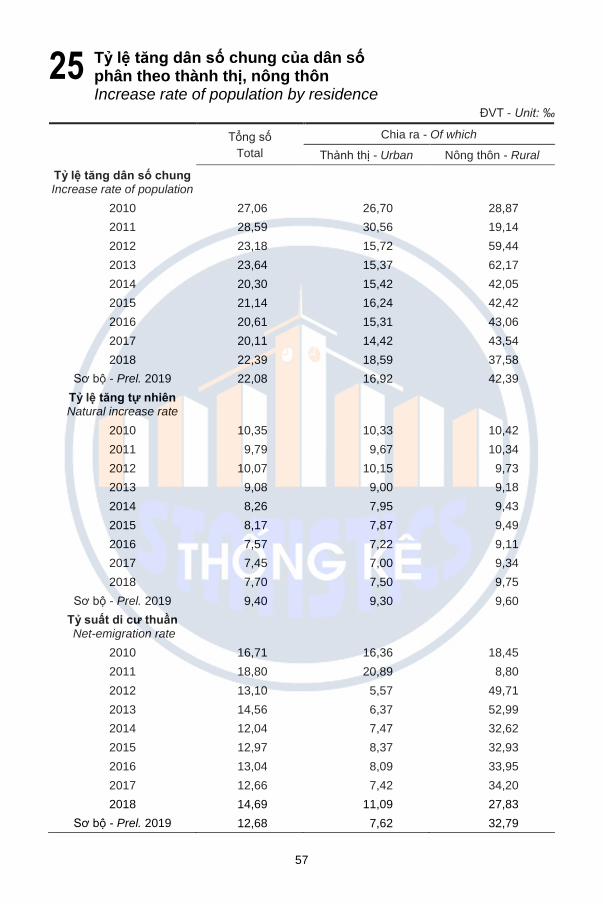
Ty lệ tăng dân số chung của dân số phân theo thành thị, nông thôn Increase rate of population by residence
ĐVT - Unit: ‰
Tông sô
Total
Chia ra - Of which
Thanh thị - Urban Nông thôn - Rural
Ty lệ tăng dân số chung Increase rate of population
2010 27,06 26,70 28,87
2011 28,59 30,56 19,14
2012 23,18 15,72 59,44
2013 23,64 15,37 62,17
2014 20,30 15,42 42,05
2015 21,14 16,24 42,42
2016 20,61 15,31 43,06
2017 20,11 14,42 43,54
2018 22,39 18,59 37,58
Sơ bô - Prel. 2019 22,08 16,92 42,39
Ty lệ tăng tự nhiên Natural increase rate
2010 10,35 10,33 10,42
2011 9,79 9,67 10,34
2012 10,07 10,15 9,73
2013 9,08 9,00 9,18
2014 8,26 7,95 9,43
2015 8,17 7,87 9,49
2016 7,57 7,22 9,11
2017 7,45 7,00 9,34
2018 7,70 7,50 9,75
Sơ bô - Prel. 2019 9,40 9,30 9,60
Ty suất di cư thuần Net-emigration rate
2010 16,71 16,36 18,45
2011 18,80 20,89 8,80
2012 13,10 5,57 49,71
2013 14,56 6,37 52,99
2014 12,04 7,47 32,62
2015 12,97 8,37 32,93
2016 13,04 8,09 33,95
2017 12,66 7,42 34,20
2018 14,69 11,09 27,83
Sơ bô - Prel. 2019 12,68 7,62 32,79
25
58
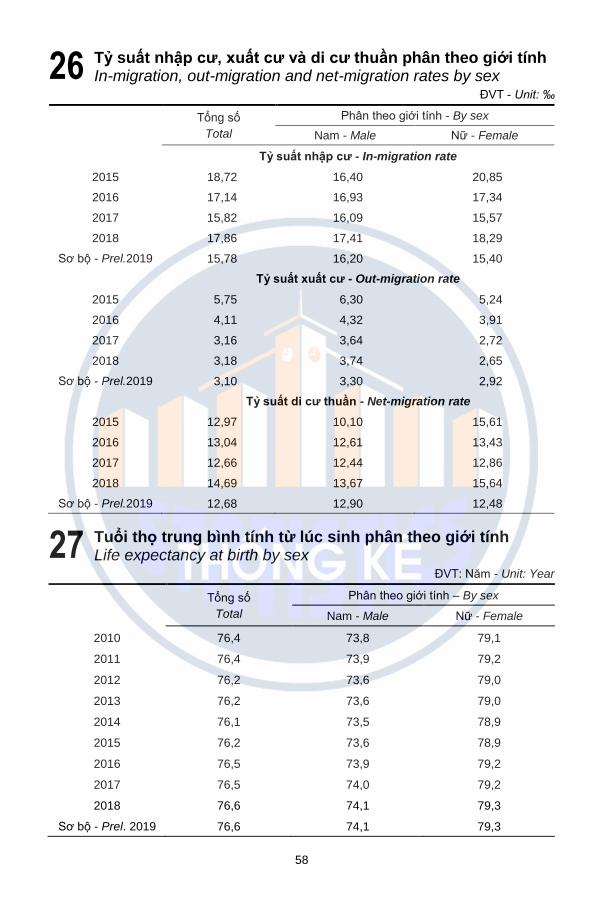
Ty suất nhập cư, xuất cư và di cư thuần phân theo giới tính In-migration, out-migration and net-migration rates by sex
ĐVT - Unit: ‰
Tông sô
Total
Phân theo giới tinh - By sex
Nam - Male Nư - Female
Ty suất nhập cư - In-migration rate
2015 18,72 16,40 20,85
2016 17,14 16,93 17,34
2017 15,82 16,09 15,57
2018 17,86 17,41 18,29
Sơ bô - Prel.2019 15,78 16,20 15,40
Ty suất xuất cư - Out-migration rate
2015 5,75 6,30 5,24
2016 4,11 4,32 3,91
2017 3,16 3,64 2,72
2018 3,18 3,74 2,65
Sơ bô - Prel.2019 3,10 3,30 2,92
Ty suất di cư thuần - Net-migration rate
2015 12,97 10,10 15,61
2016 13,04 12,61 13,43
2017 12,66 12,44 12,86
2018 14,69 13,67 15,64
Sơ bô - Prel.2019 12,68 12,90 12,48
Tuổi thọ trung bình tính từ lúc sinh phân theo giới tính Life expectancy at birth by sex
ĐVT: Năm - Unit: Year
Tông sô
Total
Phân theo giới tinh – By sex
Nam - Male Nư - Female
2010 76,4 73,8 79,1
2011 76,4 73,9 79,2
2012 76,2 73,6 79,0
2013 76,2 73,6 79,0
2014 76,1 73,5 78,9
2015 76,2 73,6 78,9
2016 76,5 73,9 79,2
2017 76,5 74,0 79,2
2018 76,6 74,1 79,3
Sơ bô - Prel. 2019 76,6 74,1 79,3
27
26
59
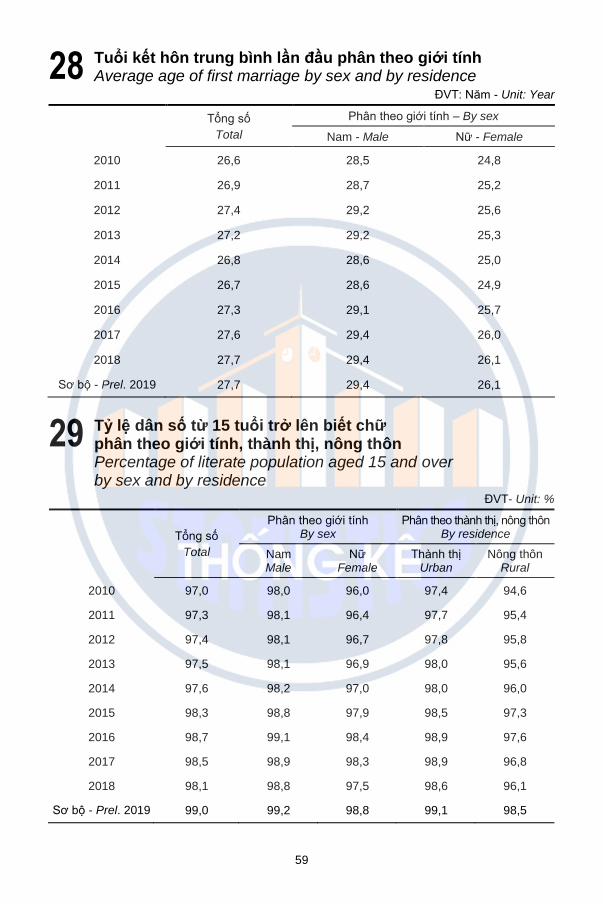
Tuổi kết hôn trung bình lần đầu phân theo giới tính Average age of first marriage by sex and by residence
ĐVT: Năm - Unit: Year
Tông sô
Total
Phân theo giới tinh – By sex
Nam - Male Nư - Female
2010 26,6 28,5 24,8
2011 26,9 28,7 25,2
2012 27,4 29,2 25,6
2013 27,2 29,2 25,3
2014 26,8 28,6 25,0
2015 26,7 28,6 24,9
2016 27,3 29,1 25,7
2017 27,6 29,4 26,0
2018 27,7 29,4 26,1
Sơ bô - Prel. 2019 27,7 29,4 26,1
Ty lệ dân số từ 15 tuổi trở lên biết chữ phân theo giới tính, thành thị, nông thôn Percentage of literate population aged 15 and over by sex and by residence
ĐVT- Unit: %
Tông sô
Total
Phân theo giới tinh By sex
Phân theo thanh thị, nông thôn By residence
Nam Male
Nư Female
Thanh thị Urban
Nông thôn Rural
2010 97,0 98,0 96,0 97,4 94,6
2011 97,3 98,1 96,4 97,7 95,4
2012 97,4 98,1 96,7 97,8 95,8
2013 97,5 98,1 96,9 98,0 95,6
2014 97,6 98,2 97,0 98,0 96,0
2015 98,3 98,8 97,9 98,5 97,3
2016 98,7 99,1 98,4 98,9 97,6
2017 98,5 98,9 98,3 98,9 96,8
2018 98,1 98,8 97,5 98,6 96,1
Sơ bô - Prel. 2019 99,0 99,2 98,8 99,1 98,5
28
29
60
Lực lượng lao động từ 15 tuổi trở lên phân theo giới tính và phân theo thành thị, nông thôn Labour force aged 15 and over by sex and by risedence
2015 2016 2017 2018
Sơ bô Prel. 2019
Người - Person
TỔNG SÔ - TOTAL 4.405.111 4.510.941 4.612.610 4.726.764 4.842.407
Phân theo giới tính - By sex
Nam - Male 2.344.831 2.401.152 2.484.354 2.588.728 2.651.150
Nư - Female 2.060.280 2.109.789 2.128.256 2.138.036 2.191.257
Phân theo thành thị, nông thôn
By residence
Thanh thị - Urban 3.546.736 3.620.910 3.652.940 3.725.847 3.750.795
Nông thôn - Rural 858.375 890.031 959.670 1.000.917 1.091.612
Cơ cấu - Structure (%)
TỔNG SÔ - TOTAL 100,00 100,00 100,00 100,00 100,00
Phân theo giới tính - By sex
Nam - Male 53,23 53,23 53,86 54,77 54,75
Nư - Female 46,77 46,77 46,14 45,23 45,25
Phân theo thành thị, nông thôn By residence
Thanh thị - Urban 80,51 80,27 79,19 78,82 77,46
Nông thôn - Rural 19,49 19,73 20,81 21,18 22,54
30
61
Lao động từ 15 tuổi trở lên đang làm việc hàng năm phân theo loại hình kinh tế Annual employed population at 15 years of age and above by types of ownership
Tông sô
Total
Chia ra - Of which
Nha nước
State
Ngoài
Nha nước
Non-state
Khu vưc co vôn đâu tư nước ngoai
Foreign investment sector
Người - Person
2010 3.752.693 655.751 2.730.311 366.631
2011 3.854.287 626.030 2.884.000 344.257
2012 3.935.100 596.308 3.032.917 305.875
2013 4.101.501 598.492 3.166.498 336.511
2014 4.182.658 552.110 3.318.333 312.215
2015 4.281.944 496.705 3.459.812 325.427
2016 4.386.565 412.337 3.645.236 328.992
2017 4.484.100 385.632 3.750.134 348.334
2018 4.601.567 368.125 3.864.888 368.554
Sơ bô - Prel. 2019 4.713.111 348.712 3.981.944 382.455
Chỉ số phát triển (Năm trước = 100) -%
Index (Previous = 100) %
2011 102,7 95,5 105,6 93,9
2012 102,1 95,3 105,2 88,9
2013 104,2 100,4 104,4 110,0
2014 102,0 92,3 104,8 92,8
2015 102,4 90,0 104,3 104,2
2016 102,4 83,0 105,4 101,1
2017 102,2 93,5 102,9 105,9
2018 102,6 95,5 103,1 105,8
Sơ bô - Prel. 2019 102,4 94,7 103,0 103,8
Cơ cấu - Structure - (%)
2010 100,0 17,47 72,76 9,77
2011 100,0 16,24 74,83 8,93
2012 100,0 15,15 77,07 7,78
2013 100,0 14,59 77,20 8,21
2014 100,0 13,20 79,34 7,46
2015 100,0 11,60 80,80 7,60
2016 100,0 9,40 83,10 7,50
2017 100,0 8,60 83,63 7,77
2018 100,0 8,00 83,99 8,01
Sơ bô - Prel. 2019 100,0 7,40 84,49 8,11
31
62
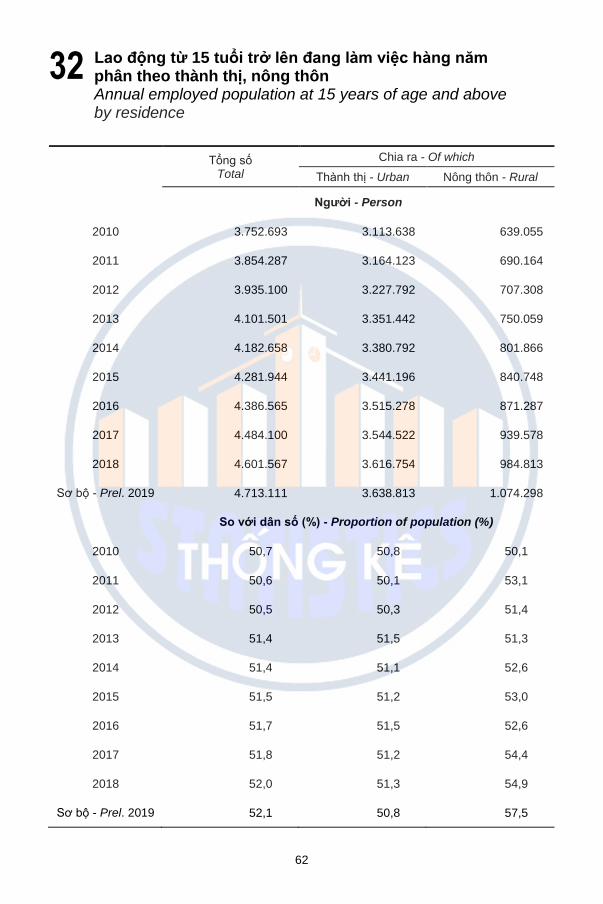
Lao động từ 15 tuổi trở lên đang làm việc hàng năm phân theo thành thị, nông thôn Annual employed population at 15 years of age and above by residence
Tông sô
Total
Chia ra - Of which
Thanh thị - Urban Nông thôn - Rural
Người - Person
2010 3.752.693 3.113.638 639.055
2011 3.854.287 3.164.123 690.164
2012 3.935.100 3.227.792 707.308
2013 4.101.501 3.351.442 750.059
2014 4.182.658 3.380.792 801.866
2015 4.281.944 3.441.196 840.748
2016 4.386.565 3.515.278 871.287
2017 4.484.100 3.544.522 939.578
2018 4.601.567 3.616.754 984.813
Sơ bô - Prel. 2019 4.713.111 3.638.813 1.074.298
So với dân số (%) - Proportion of population (%)
2010 50,7 50,8 50,1
2011 50,6 50,1 53,1
2012 50,5 50,3 51,4
2013 51,4 51,5 51,3
2014 51,4 51,1 52,6
2015 51,5 51,2 53,0
2016 51,7 51,5 52,6
2017 51,8 51,2 54,4
2018 52,0 51,3 54,9
Sơ bô - Prel. 2019 52,1 50,8 57,5
32
63
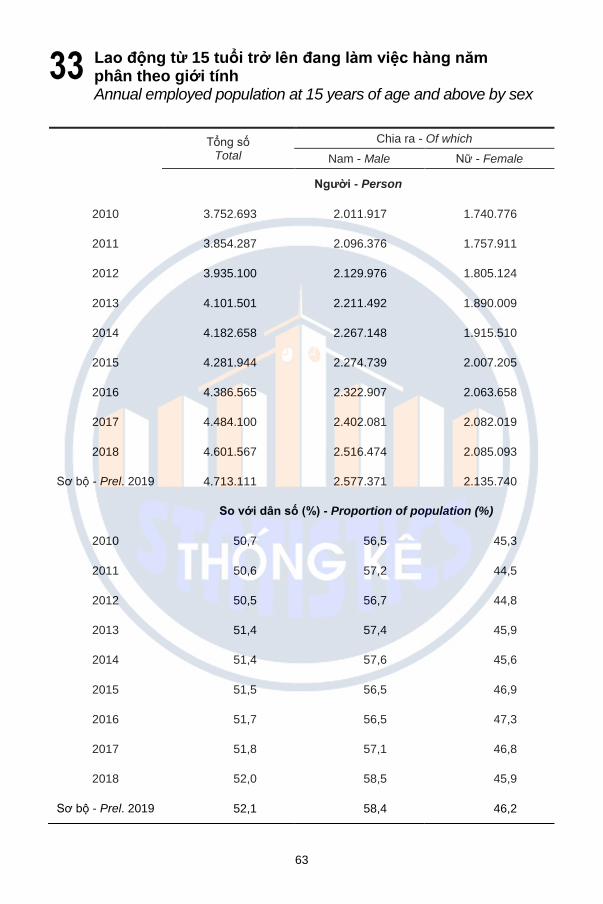
Lao động từ 15 tuổi trở lên đang làm việc hàng năm phân theo giới tính Annual employed population at 15 years of age and above by sex
Tông sô
Total
Chia ra - Of which
Nam - Male Nư - Female
Người - Person
2010 3.752.693 2.011.917 1.740.776
2011 3.854.287 2.096.376 1.757.911
2012 3.935.100 2.129.976 1.805.124
2013 4.101.501 2.211.492 1.890.009
2014 4.182.658 2.267.148 1.915.510
2015 4.281.944 2.274.739 2.007.205
2016 4.386.565 2.322.907 2.063.658
2017 4.484.100 2.402.081 2.082.019
2018 4.601.567 2.516.474 2.085.093
Sơ bô - Prel. 2019 4.713.111 2.577.371 2.135.740
So với dân số (%) - Proportion of population (%)
2010 50,7 56,5 45,3
2011 50,6 57,2 44,5
2012 50,5 56,7 44,8
2013 51,4 57,4 45,9
2014 51,4 57,6 45,6
2015 51,5 56,5 46,9
2016 51,7 56,5 47,3
2017 51,8 57,1 46,8
2018 52,0 58,5 45,9
Sơ bô - Prel. 2019 52,1 58,4 46,2
33
64
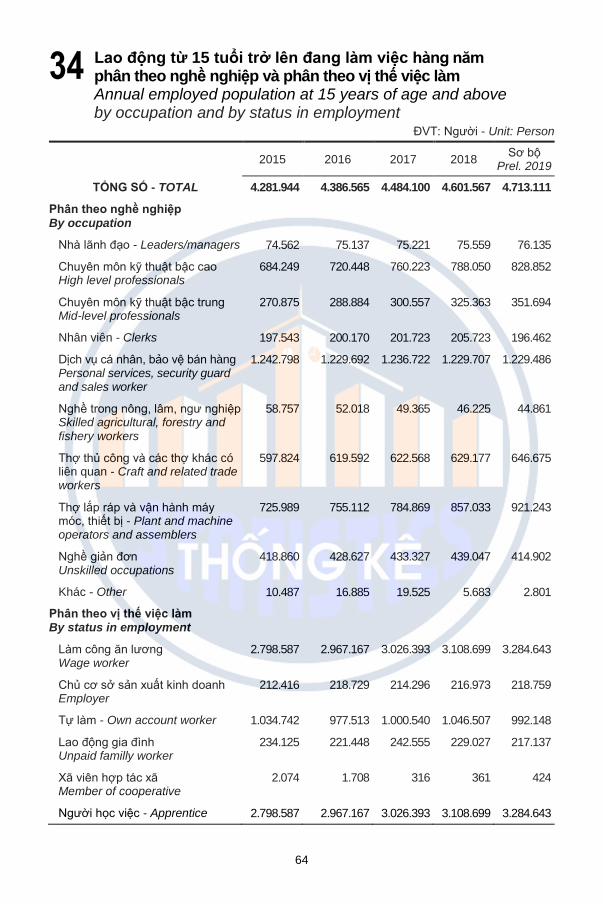
Lao động từ 15 tuổi trở lên đang làm việc hàng năm phân theo nghề nghiệp và phân theo vị thế việc làm Annual employed population at 15 years of age and above by occupation and by status in employment
ĐVT: Người - Unit: Person
2015 2016 2017 2018 Sơ bô
Prel. 2019
TỔNG SÔ - TOTAL 4.281.944 4.386.565 4.484.100 4.601.567 4.713.111
Phân theo nghề nghiệp
By occupation
Nha lanh đao - Leaders/managers 74.562 75.137 75.221 75.559 76.135
Chuyên môn kỹ thuật bậc cao High level professionals
684.249 720.448 760.223 788.050 828.852
Chuyên môn kỹ thuật bậc trung Mid-level professionals
270.875 288.884 300.557 325.363 351.694
Nhân viên - Clerks 197.543 200.170 201.723 205.723 196.462
Dịch vu ca nhân, bao vê ban hàng Personal services, security guard and sales worker
1.242.798 1.229.692 1.236.722 1.229.707 1.229.486
Nghề trong nông, lâm, ngư nghiêp Skilled agricultural, forestry and fishery workers
58.757 52.018 49.365 46.225 44.861
Thơ thu công va cac thơ khac có liên quan - Craft and related trade workers
597.824 619.592 622.568 629.177 646.675
Thơ lắp rap va vận hanh may moc, thiêt bị - Plant and machine operators and assemblers
725.989 755.112 784.869 857.033 921.243
Nghề gian đơn Unskilled occupations
418.860 428.627 433.327 439.047 414.902
Khác - Other 10.487 16.885 19.525 5.683 2.801
Phân theo vị thế việc làm By status in employment
Lam công ăn lương Wage worker
2.798.587 2.967.167 3.026.393 3.108.699 3.284.643
Chu cơ sở san xuất kinh doanh Employer
212.416 218.729 214.296 216.973 218.759
Tư lam - Own account worker 1.034.742 977.513 1.000.540 1.046.507 992.148
Lao đông gia đinh Unpaid familly worker
234.125 221.448 242.555 229.027 217.137
Xa viên hơp tac xa Member of cooperative
2.074 1.708 316 361 424
Người học viêc - Apprentice 2.798.587 2.967.167 3.026.393 3.108.699 3.284.643
34
65
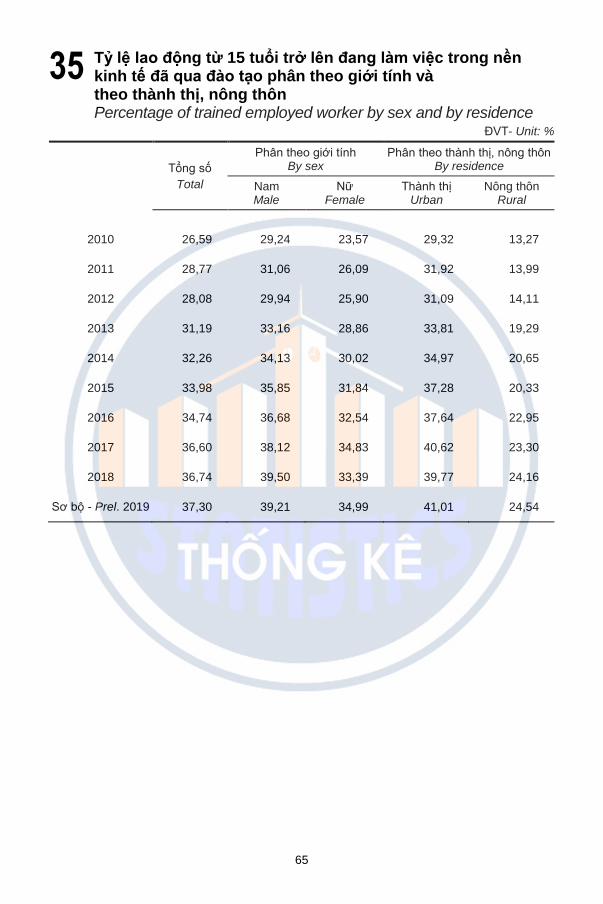
Ty lệ lao động từ 15 tuổi trở lên đang làm việc trong nền kinh tế đã qua đào tạo phân theo giới tính và theo thành thị, nông thôn Percentage of trained employed worker by sex and by residence
ĐVT- Unit: %
Tông sô
Total
Phân theo giới tinh By sex
Phân theo thanh thị, nông thôn By residence
Nam Male
Nư Female
Thanh thị Urban
Nông thôn Rural
2010 26,59 29,24 23,57 29,32 13,27
2011 28,77 31,06 26,09 31,92 13,99
2012 28,08 29,94 25,90 31,09 14,11
2013 31,19 33,16 28,86 33,81 19,29
2014 32,26 34,13 30,02 34,97 20,65
2015 33,98 35,85 31,84 37,28 20,33
2016 34,74 36,68 32,54 37,64 22,95
2017 36,60 38,12 34,83 40,62 23,30
2018 36,74 39,50 33,39 39,77 24,16
Sơ bô - Prel. 2019 37,30 39,21 34,99 41,01 24,54
35
66
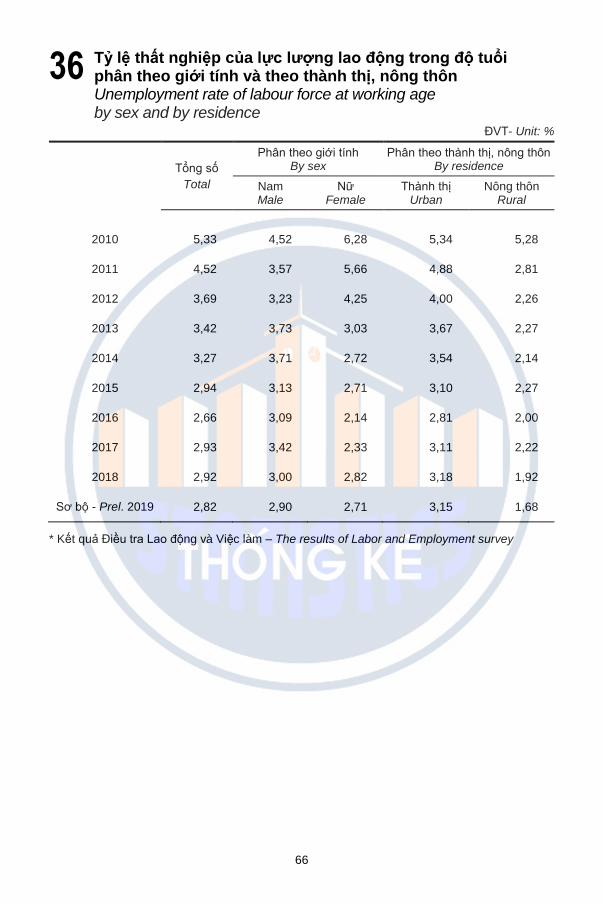
Ty lệ thất nghiệp của lực lượng lao động trong độ tuổi phân theo giới tính và theo thành thị, nông thôn Unemployment rate of labour force at working age by sex and by residence
ĐVT- Unit: %
Tông sô
Total
Phân theo giới tinh By sex
Phân theo thanh thị, nông thôn By residence
Nam Male
Nư Female
Thanh thị Urban
Nông thôn Rural
2010 5,33 4,52 6,28 5,34 5,28
2011 4,52 3,57 5,66 4,88 2,81
2012 3,69 3,23 4,25 4,00 2,26
2013 3,42 3,73 3,03 3,67 2,27
2014 3,27 3,71 2,72 3,54 2,14
2015 2,94 3,13 2,71 3,10 2,27
2016 2,66 3,09 2,14 2,81 2,00
2017 2,93 3,42 2,33 3,11 2,22
2018 2,92 3,00 2,82 3,18 1,92
Sơ bô - Prel. 2019 2,82 2,90 2,71 3,15 1,68
* Kêt qua Điều tra Lao đông và Viêc làm – The results of Labor and Employment survey
36
67
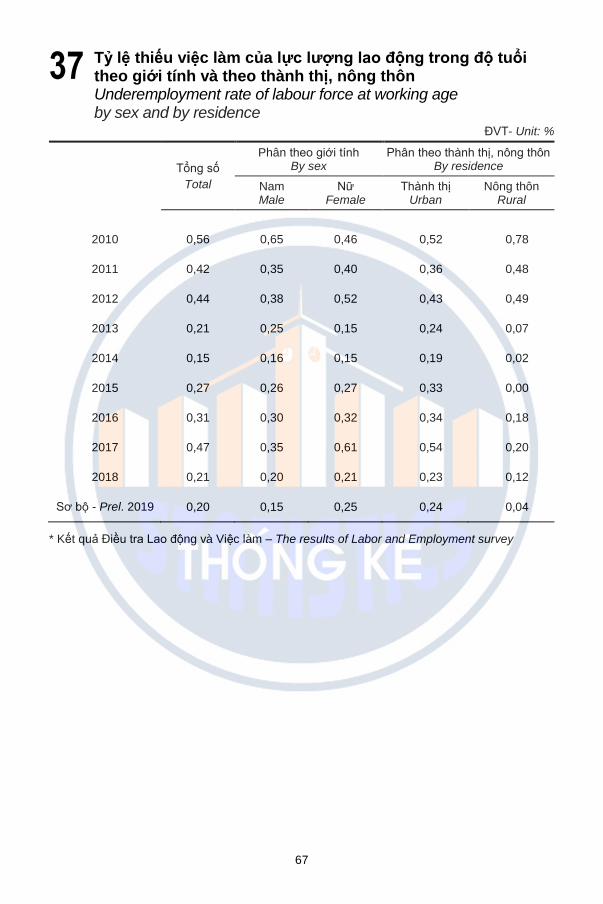
Ty lệ thiếu việc làm của lực lượng lao động trong độ tuổi theo giới tính và theo thành thị, nông thôn Underemployment rate of labour force at working age by sex and by residence
ĐVT- Unit: %
Tông sô
Total
Phân theo giới tinh By sex
Phân theo thanh thị, nông thôn By residence
Nam Male
Nư Female
Thanh thị Urban
Nông thôn Rural
2010 0,56 0,65 0,46 0,52 0,78
2011 0,42 0,35 0,40 0,36 0,48
2012 0,44 0,38 0,52 0,43 0,49
2013 0,21 0,25 0,15 0,24 0,07
2014 0,15 0,16 0,15 0,19 0,02
2015 0,27 0,26 0,27 0,33 0,00
2016 0,31 0,30 0,32 0,34 0,18
2017 0,47 0,35 0,61 0,54 0,20
2018 0,21 0,20 0,21 0,23 0,12
Sơ bô - Prel. 2019 0,20 0,15 0,25 0,24 0,04
* Kêt qua Điều tra Lao đông và Viêc làm – The results of Labor and Employment survey
37
68
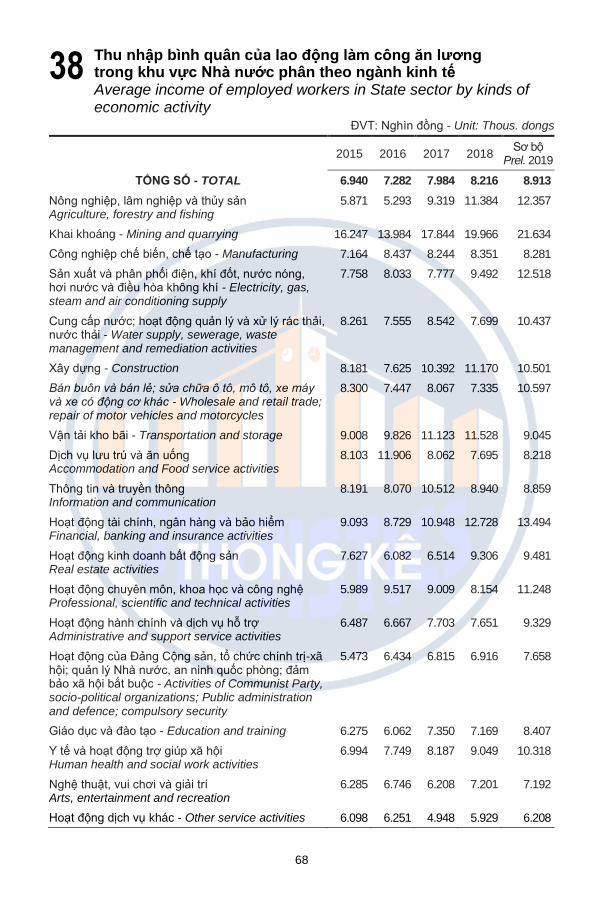
Thu nhập bình quân của lao động làm công ăn lương trong khu vực Nhà nước phân theo ngành kinh tế Average income of employed workers in State sector by kinds of economic activity
ĐVT: Nghin đông - Unit: Thous. dongs
2015 2016 2017 2018 Sơ bô
Prel. 2019
TỔNG SÔ - TOTAL 6.940 7.282 7.984 8.216 8.913
Nông nghiêp, lâm nghiêp va thuy san Agriculture, forestry and fishing
5.871 5.293 9.319 11.384 12.357
Khai khoáng - Mining and quarrying 16.247 13.984 17.844 19.966 21.634
Công nghiêp chê biên, chê tao - Manufacturing 7.164 8.437 8.244 8.351 8.281
San xuất va phân phôi điên, khi đôt, nước nong, hơi nước va điều hoa không khi - Electricity, gas, steam and air conditioning supply
7.758 8.033 7.777 9.492 12.518
Cung cấp nước; hoat đông quan ly va xư ly rac thai, nước thai - Water supply, sewerage, waste management and remediation activities
8.261 7.555 8.542 7.699 10.437
Xây dưng - Construction 8.181 7.625 10.392 11.170 10.501
Bán buôn và bán lẻ; sửa chữa ô tô, mô tô, xe máy và xe có động cơ khác - Wholesale and retail trade; repair of motor vehicles and motorcycles
8.300 7.447 8.067 7.335 10.597
Vận tai kho bai - Transportation and storage 9.008 9.826 11.123 11.528 9.045
Dịch vu lưu trú va ăn uông Accommodation and Food service activities
8.103 11.906 8.062 7.695 8.218
Thông tin va truyền thông Information and communication
8.191 8.070 10.512 8.940 8.859
Hoat đông tai chinh, ngân hang va bao hiểm Financial, banking and insurance activities
9.093 8.729 10.948 12.728 13.494
Hoat đông kinh doanh bất đông san Real estate activities
7.627 6.082 6.514 9.306 9.481
Hoat đông chuyên môn, khoa học va công nghê Professional, scientific and technical activities
5.989 9.517 9.009 8.154 11.248
Hoat đông hanh chinh va dịch vu hỗ trơ Administrative and support service activities
6.487 6.667 7.703 7.651 9.329
Hoat đông cua Đang Công san, tô chưc chinh trị-xã hôi; quan ly Nha nước, an ninh quôc phong; đam bao xa hôi bắt buôc - Activities of Communist Party, socio-political organizations; Public administration and defence; compulsory security
5.473 6.434 6.815 6.916 7.658
Giao duc va đao tao - Education and training 6.275 6.062 7.350 7.169 8.407
Y tê va hoat đông trơ giúp xa hôi Human health and social work activities
6.994 7.749 8.187 9.049 10.318
Nghê thuật, vui chơi va giai tri Arts, entertainment and recreation
6.285 6.746 6.208 7.201 7.192
Hoat đông dịch vu khác - Other service activities 6.098 6.251 4.948 5.929 6.208
38