Embed Size (px)
Citation preview
En vue de l'obtention du
DOCTORAT DE L'UNIVERSITÉ DE TOULOUSEDélivré par :
Institut National Polytechnique de Toulouse (INP Toulouse)Discipline ou spécialité :
Génie des Procédés et de l'Environnement
Présentée et soutenue par :Mme RACHELLE EL KHOURY
le vendredi 16 juin 2017
Titre :
Unité de recherche :
Ecole doctorale :
La lutte biologique contre l'ochratoxine A: utilisation des extraits de plantesmédicinales ainsi que des souches d'actinobactéries et mise en évidence
de leur mode d'action
Mécanique, Energétique, Génie civil, Procédés (MEGeP)
Laboratoire de Génie Chimique (L.G.C.)Directeur(s) de Thèse :
MME FLORENCE MATHIEUM. ANDRE EL KHOURY
Rapporteurs :M. HASSAN RAMMAL, UNIVERSITE LIBANAISE BEYROUTH
Mme SABINE GALINDO-SCHORR, UNIVERSITE MONTPELLIER 2
Membre(s) du jury :M. ROGER LTEIF, UNIVERSITE ST JOSEPH DE BEYROUTH, Président
M. ALI ATAOUI, UNIVERSITE LIBANAISE BEYROUTH, MembreM. ANDRE EL KHOURY, UNIVERSITE ST JOSEPH DE BEYROUTH, Membre
M. EMMANUEL COTON, UNIVERSITE DE BRETAGNE OCCIDENTALE, MembreMme FLORENCE MATHIEU, INP TOULOUSE, Membre
M. RICHARD MAROUN, UNIVERSITE ST JOSEPH DE BEYROUTH, Membre

2
Where life begins and love never ends…
To you, Mom, Dad, Anthony and Tarek
3
Remerciements
Une thèse de doctorat est loin d'être un travail solitaire. De nombreuses
personnes se sont retrouvées ainsi de manière fortuite ou non, pour le
pire ou le meilleur, entre moi et mon doctorat. Ce sont certaines de ces
personnes que j’aimerais mettre en avant dans ces remerciements.
En premier lieu, j’ai beaucoup de reconnaissance et d’admiration à
témoigner à ma directrice de thèse, Pr. Florence Mathieu qui est un
modèle professionnel pour sa gestion calme de son temps pourtant si
chargé de responsabilités importantes. Florence merci pour la
confiance que vous m’avez accordée en acceptant d’encadrer ce travail
doctoral, pour votre disponibilité et pour la liberté que vous m’avez
laissée tout au long de cette étude.
Un grand merci à mon directeur de thèse, Dr. André El Khoury pour
la confiance, la liberté et l’indépendance que vous m’avez accordées,
qui, à mon avis, m’ont laissé spontanément faire ressortir le meilleur de
moi-même dans mon travail et comme personne. Merci pour m’avoir
appris à être une scientifique autonome tout au long de ce travail de
recherche. Nonobstant, votre relecture finale méticuleuse du
manuscrit. Merci pour votre soutien moral, académique et
scientifique…
Je tiens à remercier Pr. Ali Atoui, mon codirecteur de thèse, qui a suivi
ce travail dans tous ses détails avec une rigueur scientifique
exceptionnelle, ce qui m’a donné le courage pour poursuivre la
réalisation de ce projet de recherche. Je vous remercie pour toutes les
heures que vous avez consacrées à m’apprendre les différentes manips
de biologie moléculaire, y compris techniques et précision. Merci pour
vos suggestions toujours avisées.
Je commence à peine à mesurer la chance que j’ai eu d’effectuer ma
thèse durant le mandat de monsieur le doyen et le codirecteur de ma
thèse, Pr. Richard Maroun. Outre la profondeur rare de sa pensée
scientifique, j’ai découvert quelqu’un d’intègre et de sincère, qualités
éminemment rares et précieuses.
4
Je tiens à remercier les membres du jury et les rapporteurs Pr. Sabine
Galindo-Schorr et Pr. Hassan Rammal et aux examinateurs Pr.
Emmanuel Coton et Pr. Roger Lteif qui m’ont fait l’honneur d’examiner
ce travail.
Cette opportunité qui m’a été accordée à travers le programme de
cotutelle, m’a permis de lier de nouvelles relations, tant professionnelles
qu’amicales. Elle m’a accordé la chance de collaborer avec deux équipes;
une équipe Libanaise assez solide, et une équipe Française de calibre. Je
remercie donc toutes les personnes formidables que j’ai rencontrées par
le biais de l’ENSAT. Ce travail n’aurait pu être mené à bien sans
l’accueil chaleureux que m’ont témoigné Elodie, Carole, Kathy,
Philippe… je vous remercie pour le climat sympathique dans lequel vous
m’avez permis de travailler. Je remercie aussi tous les membres du
Laboratoire de la Faculté des Sciences, en particulier Dr. Charbel Afif,
le « Super Hero » de l’HPLC, ainsi que mes chers stagiaires Mme. Hiba
Kawtharani et M. Anthony El Khoury pour la sympathie et l'aide qu'ils
m'ont témoignées durant la dernière année de dur labeur.
Finalement je ne peux pas oublier les amis et les camarades qui ont fait
de ce parcours une merveilleuse expérience…
..Lara El Féghali, ma chère Larlour. En 2007, on était que deux
étrangères à la FS en face de l’amphi 202. Et là, en 2017, tu es devenue
la seule chose qui manquait dans ma vie…Une sœur... Merci pour ta
gentillesse, tes mots d’encouragements et ton sourire angélique.
..Racha Majed et Christelle Abi Nader, sans vous la salle des doctorants
aurait était grise et triste. C’est grâce à votre esprit positif et votre
humeur que j’ai pu franchir les obstacles et les difficultés que j’ai
rencontrées durant ces trois ans.
..Samer Yammine, tes mots d’encouragements, tes conseils et ton
support ont fait de moi la femme indépendante et ambitieuse dont je
suis aujourd’hui. Merci pour les bons moments et les merveilleux
voyages et aventures, je ne les oublierais jamais.
5
..Jacques Al Kai, ami, frère et my biggest fan. Merci pour ta gentillesse,
tendresse et affection. Sans toi mes séjours en France auraient été
« sans couleurs ».
..Rita Chamaa et Tala Assi, my partners in Drama… vous avez fait de
Toulouse ma deuxième maison, ville et famille… Votre humour, et
soutien moral (dont j’avais besoin presque tous les jours!) m’ont
encouragé à continuer jusqu’à la fin… Merci pour les weekends, les
« girls’ night in », les « girls’ night out » et les robes de mariées ?!
..Rhoda El Khoury et joanna Tannous, mes collègues et amies. Merci
pour votre présence ainsi que votre soutien moral et scientifique. Je
n’oublierai jamais les sessions de beauté dans notre salle doc.
..Nay el Khoury, Marina Daccache, Rim Dbeissy et Nadine Bejjani,
grâce à votre esprit révolutionnaire, on a transformé la salle doc en
salle 602. Ces souvenirs resteront à jamais dans ma tête.

6
List de publications
El Khoury, R., A. Atoui., C. Verheecke, R. Maroun., A. El Khoury and F. Mathieu
(2016). “Essential Oils Modulate Gene Expression and Ochratoxin A Production in
Aspergillus carbonarius.” Toxins (Basel) 8(8).
El Khoury Rachelle, Atoui Ali, Mathieu Florence, Kawtharani Hiba, Khoury Anthony,
Maroun Richard and El Khoury Andre. “Antifungal and Antiochratoxigenic Activities
of Essential Oils and Total Phenolic Extracts: A comparative study.” Antioxidants.
Articles soumis :
Soumis dans la revue « Toxins » :
El Khoury Rachelle, Mathieu Florence, Atoui Ali, Kawtharany Hiba, Khoury Anthony,
AfifCharbel, Maroun Richard and El Khoury Andre. “Ability of Soil Isolated
Actinobacteria Strains to Prevent, Bind and Biodegrade Ochratoxin A, a Common
food Contaminant.”
Conférences Internationales
5th International Symposium on Mycotoxins and Toxigenic Moulds: Challenges and
Perspectives. Modulation of ochratoxin A genes’ expression in Aspergillus
carbonarius by the use of some essential oils, De Saeger, S.; Audenaert, K.; Croubels,
S. Report from 5th International Symposium on Mycotoxins and Toxigenic Moulds:
challenges and Perspectives (MYTOX) Held in Ghent, Belgium, May 2016. Toxins
2016, 8(5), 146; doi: 10.3390/toxins8050146.
The International Science Conference LAAS22 - Conférence Scientifique
Internationale LAAS22: Composés phénoliques et huiles essentielles : inhibiteurs de
l’ochratoxine A produite par Aspergillus carbonarius, Liban, Beirut, Avril 2016.
18th ISANH Middle East World Congress, Antoixydants on the 3rd and 4th of May 2017.
Beirut, Lebanon
7
LISTE DES TABLEAUX
Tableau 1 : Les principales mycotoxines ainsi que leurs effets possibles sur la santé de
l’homme et leur occurrence dans les aliments et les denrées alimentaires (CAST 2003;
AFSSA 2009). .................................................................................................................... 27
Tableau 2 : Les niveaux de mycotoxines autorisés par l'Union Européenne (UE) dans
les aliments et les denrées alimentaires qu'elles contaminent (recommandations N°
1425/2003 et N° 1881/2006) .............................................................................................. 29
Tableau 3 : Différentes espèces des champignons producteurs d'OTA ...................... 34
Tableau 4 : Conditions optimales pour la croissance d’A. carbonarius et la production
de l’OTA sur milieu de raisin semi-synthétique (Passamani et al. 2014) ...................... 37
Tableau 5 : Caractéristiques des PKS dans le règne fongique, et chez A. carbonarius 44
Tableau 6 : Caractéristiques des NRPS dans le règne fongique, et chez A.
carbonarius ......................................................................................................................... 45
Tableau 7 : Caractéristiques de l’halogénase/chloroperoxydase chez A. carbonarius . 46
Tableau 8: Gènes de biosynthèse de l’OTA identifiés chez les producteurs majeurs de
l’OTA (N.I. : non identifié) .............................................................................................. 47
Tableau 9 : Effet de plusieurs sources de carbone sur la croissance d'A. carbonarius et
la production de l'OTA .................................................................................................... 53
Tableau 10 : Effet des huiles essentielles sur la croissance des champignons
ochratoxinogènes. CMF : Concentration Minimale Fongicide ..................................... 66
Tableau 11 : Concentrations minimales fongicides (CMF) de différents composés
phénoliques sur des cultures d’A.carbonarius ................................................................ 69
LISTE DES FIGURES
Figure 1 : Les différentes voies métaboliques des mycotoxines. .................................. 23
Figure 2 : Répartition géographique des mycotoxines dans le monde, en se basant sur
les pourcentages des échantillons contaminés. Schéma réalisé par Kovalsky (2014). 31
Figure 3 : Structure chimique de l'OTA. Schéma adapté et modifié de El Khoury and
Atoui (2010)....................................................................................................................... 32
8
Figure 4 : (I) Culture sur milieu CYA de (A) A. carbonarius, (B) A. niger. (II) Conidies
de (A) A. carbonarius et (B) A. niger ................................................................................. 36
Figure 5 : Schéma représentant la structure microscopique d'A. carbonarius .............. 36
Figure 6 : Schéma de la première voie hypothétique de la biosynthèse de l'OTA. .... 42
Figure 7 : Schéma montrant la voie de biosynthèse de l'OTA proposée en 2016 chez A.
carbonarius. Schéma adapté et modifié de Ferrara et al. (2016). .................................... 43
Figure 8 : Structure chimique des métabolites de l'OTA .............................................. 44
Figure 9 : Représentation schématique des différents clusters hypothétiques de la voie
de biosynthèse de l’OTA chez A. carbonarius (Ferrara et al., 2016), A. steynii (Gil-Serna
et al., 2015), A. niger et P. nordicum (Karolewiez and Geisen, 2005). ............................ 47
Figure 10 : Interaction entre les complexes de la famille « velvet » et la protéine LaeA
chez A. nidulans. (KapA : protéine de transport) ........................................................... 51
Figure 11 : Pratiques et conditions influençant les teneurs de l’OTA dans les fruits et
les grains. .......................................................................................................................... 60
TABLE DES MATIERES
Introduction bibliographique………………………………………………………….….18
A. Mycotoxines, définition et généralité ................................................................... 22
A.I. Champignons producteurs ............................................................................... 24
A.II. Occurrence et toxicité des mycotoxines .......................................................... 26
A.III. Règlementation ................................................................................................ 28
B. Ochratoxine A ........................................................................................................... 31
B.I. Historique ............................................................................................................ 31
B.II. Structure chimique et propriétés physico-chimiques de l’OTA .................... 32
B.III. Occurrence dans les aliments, exposition de l’homme et principaux
producteurs................................................................................................................ 33
B.IV. Aspergillus carbonarius : le contaminant majeur des raisins .......................... 35
B.V. Toxicité de l’OTA .............................................................................................. 38
B.VI. Voie de biosynthèse ......................................................................................... 41
B. VII. Moyens de lutte contre l’OTA ...................................................................... 57
9
Chapitre 1 ...................................................................................................................... 76
Etude comparative des effets antifongiques et antiochratoxinogènes des composés
phénoliques et huiles essentielles ................................................................................ 76
I. Introduction ........................................................................................................ 77
II. Article soumis dans la revue Journal of Applied Microbiology .......................... 78
III. Conclusion....................................................................................................... 90
Chapitre 2 ...................................................................................................................... 92
Huiles essentielles : agents antiochratoxinogènes, antifongiques et réprimeurs des
gènes de biosynthèse chez Aspergillus carbonarius ..................................................... 92
I. Introduction ........................................................................................................ 93
II. Article publié : Essential Oils Modulate Gene Expression and Ochratoxin A
Production in Aspergillus carbonarius, Toxins (8), 8-242. ..................................... 94
III. Conclusion..................................................................................................... 112
Chapitre 3 .................................................................................................................... 114
Détoxification de l’OTA par des actinobactéries isolées du sol : adhésion,
biodégradation et répression des gènes de biosynthèse de l’OTA chez
Aspergillus carbonarius .................................................................................................................... 114
I. Introduction ...................................................................................................... 115
II. Article soumis dans la revue Toxins ............................................................... 116
III. Conclusion..................................................................................................... 126
Discussion générale et perspectives…………………………………………………….162
10
Liste des abréviations
OTA Ochratoxine A
NEB Néphrite Endémique du Balkans
IARC International Agency of Research on Cancer
A. Aspergillus
NRPS Non Ribosomal Peptide Synthase
PKS Polykétide Synthase
P. Penicillium
AFSSA Agence Française de Sécurité Sanitaire des Aliments
AF Aflatoxine
CYA Czapec-Yeast Agar
LD Dose Léthale
HOG High osmolarity Glycerol
HPLC High Performance Liquid Chromatography
H.E Huiles Essentielles
CMF Concentration Minimale Fongicide
S. Saccharomyces
PBS Phosphate Buffer Solution
PDA Potato Dextrose Agar
ISP2 International Streptomyces Project-2
WHO World Health Organisation
SOD Superoxyde Dismutase
RPM Round Per Minute
RT Reverse Transcriptase
ROS Espèce Réactive de l’oxygène
qPCR Quantitative Poly-Chain Reaction
PAT Patuline
LAB Bactéries lactiques
11
FUM Fumonisine
FDA Food and Drug Administration
FAO Food and Agriculture Organisation
EU European Union
DMATS Dimethylallyl Tryptophane Synthase
Aw Activité de l’eau
12
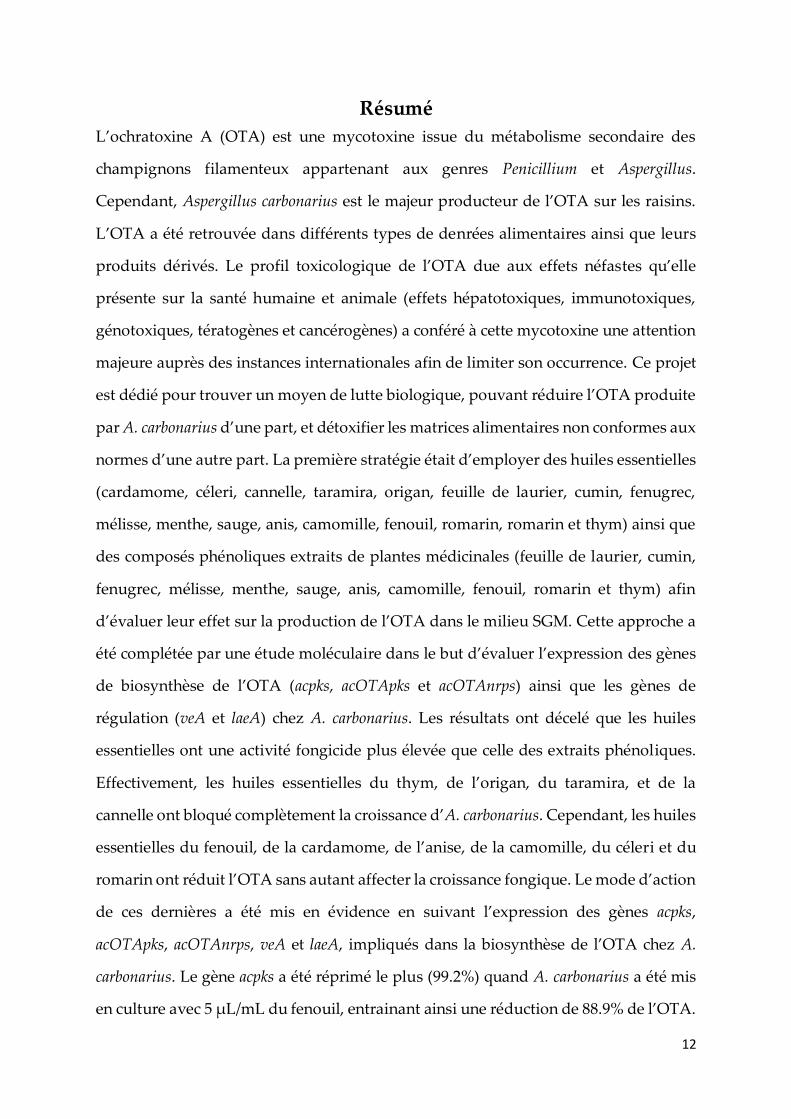
Résumé
L’ochratoxine A (OTA) est une mycotoxine issue du métabolisme secondaire des
champignons filamenteux appartenant aux genres Penicillium et Aspergillus.
Cependant, Aspergillus carbonarius est le majeur producteur de l’OTA sur les raisins.
L’OTA a été retrouvée dans différents types de denrées alimentaires ainsi que leurs
produits dérivés. Le profil toxicologique de l’OTA due aux effets néfastes qu’elle
présente sur la santé humaine et animale (effets hépatotoxiques, immunotoxiques,
génotoxiques, tératogènes et cancérogènes) a conféré à cette mycotoxine une attention
majeure auprès des instances internationales afin de limiter son occurrence. Ce projet
est dédié pour trouver un moyen de lutte biologique, pouvant réduire l’OTA produite
par A. carbonarius d’une part, et détoxifier les matrices alimentaires non conformes aux
normes d’une autre part. La première stratégie était d’employer des huiles essentielles
(cardamome, céleri, cannelle, taramira, origan, feuille de laurier, cumin, fenugrec,
mélisse, menthe, sauge, anis, camomille, fenouil, romarin, romarin et thym) ainsi que
des composés phénoliques extraits de plantes médicinales (feuille de laurier, cumin,
fenugrec, mélisse, menthe, sauge, anis, camomille, fenouil, romarin et thym) afin
d’évaluer leur effet sur la production de l’OTA dans le milieu SGM. Cette approche a
été complétée par une étude moléculaire dans le but d’évaluer l’expression des gènes
de biosynthèse de l’OTA (acpks, acOTApks et acOTAnrps) ainsi que les gènes de
régulation (veA et laeA) chez A. carbonarius. Les résultats ont décelé que les huiles
essentielles ont une activité fongicide plus élevée que celle des extraits phénoliques.
Effectivement, les huiles essentielles du thym, de l’origan, du taramira, et de la
cannelle ont bloqué complètement la croissance d’A. carbonarius. Cependant, les huiles
essentielles du fenouil, de la cardamome, de l’anise, de la camomille, du céleri et du
romarin ont réduit l’OTA sans autant affecter la croissance fongique. Le mode d’action
de ces dernières a été mis en évidence en suivant l’expression des gènes acpks,
acOTApks, acOTAnrps, veA et laeA, impliqués dans la biosynthèse de l’OTA chez A.
carbonarius. Le gène acpks a été réprimé le plus (99.2%) quand A. carbonarius a été mis
en culture avec 5 µL/mL du fenouil, entrainant ainsi une réduction de 88.9% de l’OTA.
13
La deuxième stratégie était de développer un moyen de lutte biologique pouvant
détoxifier les matrices alimentaires contaminées. Cette méthodologie a été développée
suite à l’utilisation de sept souches d’actinobactéries (AT10, AT8, SN7, MS1, ML5, G10
et PT1), en évaluant leur capacité à métaboliser l’OTA, adhérer cette toxine à leur paroi
membranaire ainsi que leur effet sur l’expression des gènes impliqués dans la
biosynthèse de l’OTA chez A. carbonarius (acpks, acOTApks, acOTAnrps, veA et laeA).
Les résultats ont montré que toutes les souches possèdent la capacité d’adhérer l’OTA
à leur surface, notamment la souche SN7 qui a réduit 33% de l’OTA après 60 minutes
d’incubation dans une solution PBS (Phosphate Buffer Solution) non nutritive. Les
souches AT10 et SN7 ont métabolisé 51.94 et 52.68% de l’OTA ajoutée au milieu ISP2
(International Streptomyces Project-2) après 5 jours de culture à 28 °C. Cependant, les
souches MS1, ML5 et G10 étaient les seules à avoir un effet sur l’expression des gènes
de biosynthèse de l’OTA chez A. carbonarius. Effectivement les gènes acpks, acOTApks
et acOTAnrps ont été réprimés respectivement de 37.1, 23.9 et 21% par MS1, de 39, 23
et 11.1% par ML5 et de 39, 18.3 et 11.1% par la souche G10. Ce projet a mis en valeur
la capacité des extraits naturels (composés phénoliques et huiles essentielles) et des
actinobactéries à prévenir d’une part la production de l’OTA et d’autre part réduire
ses taux, sans pourtant affecter l’équilibre naturel ni engendrer l’apparition des débris
toxiques dans les aliments traités.
Abstract
Ochratoxin A (OTA) is a mycotoxin derived from the secondary metabolism of
filamentous fungi belonging to the Penicillium and Aspergillus genera. However,
Aspergillus carbonarius is the major producer of OTA on grapes. OTA has been detected
in different types of foodstuffs as well as several products derived from these
commodities. The toxicological profile of OTA and its adverse effects on human and
animal health (hepatotoxic, immunotoxic, genotoxic, teratogenic and carcinogenic
effects) has given this mycotoxin a major attention of international committees in
order to limit its occurrence. The aim of this project was to develop biological

14
techniques that can reduce OTA produced by A. carbonarius and detoxify non-
compliant food matrices. The first strategy was achieved by using essential oils
(cardamom, celery, cinnamon, taramira, oregano, bay leaf, cumin, fenugreek, melissa,
mint, sage, anise, chamomile, fennel, rosemary and thyme) and phenolic compounds
extracted from medicinal plants (bay leaf, cumin, fenugreek, melissa, mint, sage, anise,
chamomile, fennel, rosemary, and thyme) to evaluate their effect on OTA production
in SGM medium. This approach was complemented by a molecular study to evaluate
the expression of the OTA biosynthesis genes (acpks, acOTApks and acOTAnrps) as well
as the regulatory genes (veA and laeA) in A. carbonarius. The results revealed that
essential oils had more significant fungicidal activity than phenolic extracts. Indeed,
the essential oils of thyme, oregano, taramira, and cinnamon completely blocked the
growth of A. carbonarius. However, essential oils of fennel, cardamom, anise,
chamomile, celery and rosemary reduced OTA without affecting fungal growth. The
mode of action of these essential oils has been demonstrated by evaluating the
expression of acpks, acOTApks, acOTAnrps, veA and laeA genes in A. carbonarius. The
expression of acpks was repressed the most (up to 99.2%) when A. carbonarius was
cultured with 5 µL / mL of fennel essential oil, resulting in a 88.9% of reduction in the
OTA produced by this fungus. The second strategy was developed in order to detoxify
contaminated food matrices. This methodology was achieved by using seven strains
of actinobacteria (AT10, AT8, SN7, MS1, ML5, G10 and PT1), and evaluating their
ability to metabolize OTA, adhere this toxin to their membrane walls and their effect
on the expression of the genes involved in the biosynthesis of OTA in A. carbonarius
(acpks, acOTApks, acOTAnrps, veA and laeA). The results showed that all strains were
able to bind OTA to their surfaces, especially the SN7 strain which reduced 33% of
OTA after incubation for 60 minutes in PBS (Phosphate Buffer Solution). The strains
AT10 and SN7 metabolized 51.94 and 52.68% of the OTA added to the ISP2 medium
(International Streptomyces Project-2) after 5 days of culture at 28° C. However, MS1,
ML5 and G10 were the only strains to have an effect on the expression of the OTA
biosynthesis genes in A. carbonarius. Indeed, acpks, acOTApks and acOTAnrps genes
15
were repressed respectively by 37.1, 23.9 and 21% by MS1, 39, 23 and 11.1% by ML5
and 39, 18.3 and 11.1% by the strain G10. This project highlighted the power of natural
extracts (phenolic compounds and essential oils) as well as strains of actinobacteria to
prevent OTA production on one hand and to detoxify contaminated commodities on
the other hand without altering the natural microbial balance.

16
Introduction
bibliographique

17
Contexte de l’étude
18
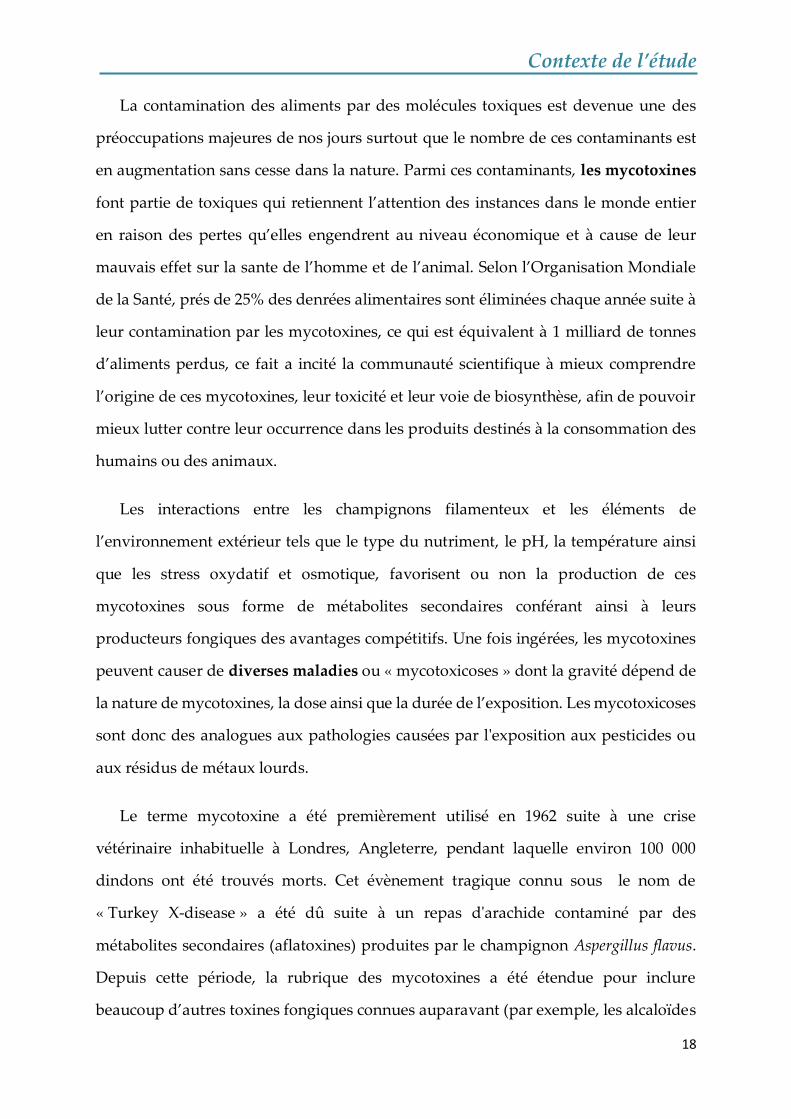
La contamination des aliments par des molécules toxiques est devenue une des
préoccupations majeures de nos jours surtout que le nombre de ces contaminants est
en augmentation sans cesse dans la nature. Parmi ces contaminants, les mycotoxines
font partie de toxiques qui retiennent l’attention des instances dans le monde entier
en raison des pertes qu’elles engendrent au niveau économique et à cause de leur
mauvais effet sur la sante de l’homme et de l’animal. Selon l’Organisation Mondiale
de la Santé, prés de 25% des denrées alimentaires sont éliminées chaque année suite à
leur contamination par les mycotoxines, ce qui est équivalent à 1 milliard de tonnes
d’aliments perdus, ce fait a incité la communauté scientifique à mieux comprendre
l’origine de ces mycotoxines, leur toxicité et leur voie de biosynthèse, afin de pouvoir
mieux lutter contre leur occurrence dans les produits destinés à la consommation des
humains ou des animaux.
Les interactions entre les champignons filamenteux et les éléments de
l’environnement extérieur tels que le type du nutriment, le pH, la température ainsi
que les stress oxydatif et osmotique, favorisent ou non la production de ces
mycotoxines sous forme de métabolites secondaires conférant ainsi à leurs
producteurs fongiques des avantages compétitifs. Une fois ingérées, les mycotoxines
peuvent causer de diverses maladies ou « mycotoxicoses » dont la gravité dépend de
la nature de mycotoxines, la dose ainsi que la durée de l’exposition. Les mycotoxicoses
sont donc des analogues aux pathologies causées par l'exposition aux pesticides ou
aux résidus de métaux lourds.
Le terme mycotoxine a été premièrement utilisé en 1962 suite à une crise
vétérinaire inhabituelle à Londres, Angleterre, pendant laquelle environ 100 000
dindons ont été trouvés morts. Cet évènement tragique connu sous le nom de
« Turkey X-disease » a été dû suite à un repas d'arachide contaminé par des
métabolites secondaires (aflatoxines) produites par le champignon Aspergillus flavus.
Depuis cette période, la rubrique des mycotoxines a été étendue pour inclure
beaucoup d’autres toxines fongiques connues auparavant (par exemple, les alcaloïdes
Contexte de l’étude
19
de l'ergot et la patuline) ainsi que de nouveaux métabolites secondaires révélés dans
des études ciblées à la découverte de nouvelles mycotoxines, telle que l'ochratoxine A.
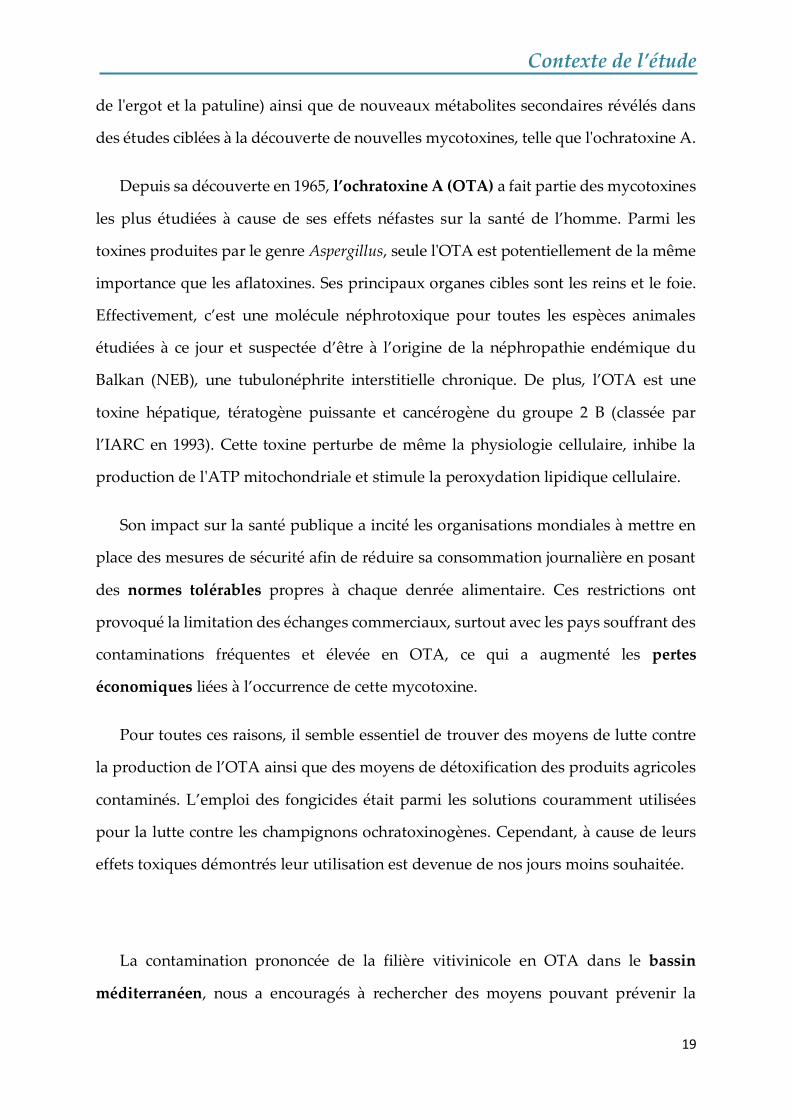
Depuis sa découverte en 1965, l’ochratoxine A (OTA) a fait partie des mycotoxines
les plus étudiées à cause de ses effets néfastes sur la santé de l’homme. Parmi les
toxines produites par le genre Aspergillus, seule l'OTA est potentiellement de la même
importance que les aflatoxines. Ses principaux organes cibles sont les reins et le foie.
Effectivement, c’est une molécule néphrotoxique pour toutes les espèces animales
étudiées à ce jour et suspectée d’être à l’origine de la néphropathie endémique du
Balkan (NEB), une tubulonéphrite interstitielle chronique. De plus, l’OTA est une
toxine hépatique, tératogène puissante et cancérogène du groupe 2 B (classée par
l’IARC en 1993). Cette toxine perturbe de même la physiologie cellulaire, inhibe la
production de l'ATP mitochondriale et stimule la peroxydation lipidique cellulaire.
Son impact sur la santé publique a incité les organisations mondiales à mettre en
place des mesures de sécurité afin de réduire sa consommation journalière en posant
des normes tolérables propres à chaque denrée alimentaire. Ces restrictions ont
provoqué la limitation des échanges commerciaux, surtout avec les pays souffrant des
contaminations fréquentes et élevée en OTA, ce qui a augmenté les pertes
économiques liées à l’occurrence de cette mycotoxine.
Pour toutes ces raisons, il semble essentiel de trouver des moyens de lutte contre
la production de l’OTA ainsi que des moyens de détoxification des produits agricoles
contaminés. L’emploi des fongicides était parmi les solutions couramment utilisées
pour la lutte contre les champignons ochratoxinogènes. Cependant, à cause de leurs
effets toxiques démontrés leur utilisation est devenue de nos jours moins souhaitée.
La contamination prononcée de la filière vitivinicole en OTA dans le bassin
méditerranéen, nous a encouragés à rechercher des moyens pouvant prévenir la
Contexte de l’étude
20
production de cette mycotoxine sur les raisins, en limitant la croissance du majeur
champignon producteur « A. carbonarius », et/ou en réduisant la production de l’OTA
par ce champignon.
A l’heure actuelle, de nouvelles stratégies sont recherchées à cet égard, dont la lutte
biologique contre la croissance fongique et la réduction de la production de l’OTA.
L’intérêt croissant d’utilisation des extraits naturels de plantes tels que les composés
phénoliques et les huiles essentielles ont attiré l’attention, vu leur efficacité prouvée
contre d’autres mycotoxines (telles que les aflatoxines) ainsi leur pouvoir antifongique
contre les champignons filamenteux responsables de la production de ces
mycotoxines.
Effectivement, dans la première partie de notre étude, nous nous sommes attachés
à étudier les effets des huiles essentielles et de composés phénoliques extraits de
mêmes plantes médicinales sur (1) la croissance d’A. carbonarius, (2) sa masse sèche et
(3) sa capacité à produire l’OTA quand ce champignon est soumis à de différentes
conditions de culture.
Afin de mieux comprendre l’effet de ces substances, il est indispensable de
comprendre leur mécanisme d’action au niveau moléculaire, même si les gènes de
biosynthèse et de régulation de l’OTA chez A. carbonarius sont jusqu’à présent
partiellement identifiés.
Ainsi, La deuxième partie consiste à élucider un mécanisme d’action moléculaire
propre à chaque huile essentielle testée dans cette étude. Notre intérêt s’est surtout
porté sur les huiles qui ont été capables d’inhiber la production d’OTA sans avoir pour
autant altérés le développement fongique. De ce fait, nous nous sommes focalisés sur
l’étude de la variation dans l’expression des gènes de biosynthèse de l’OTA chez A.
carbonarius mise en culture supplémentées des différentes huiles essentielles afin de
pouvoir corréler ces variations aux niveaux de production de l’OTA.
Contexte de l’étude
21
Ces deux approches avaient pour but de prévenir la production de l’OTA.
Cependant, la troisième partie de ce projet, a été dédiée pour la détoxification des
denrées alimentaires, en employant des souches d’actinomycètes isolées du sol. Dans
cette partie, nous avons étudié l’effet de ces bactéries sur (1) la dégradation
enzymatique de l’OTA, (2) l’adhésion de cette toxine sur la paroi des actinomycètes
et (3) la modulation de l’expression des gènes de biosynthèse de l’OTA chez A.
carbonarius mis en culture avec ces bactéries.
Introduction bibliographique
22
A. Mycotoxines, définition et généralité
Les mycotoxines sont des contaminants naturels, définies comme étant des
métabolites secondaires toxiques, produits par plusieurs espèces de champignons
filamenteux, surtout par ceux appartenant aux genres Aspergillus, Penicillium,
Alternaria et Claviceps (Marin et al., 2013). Ces métabolites sont universellement
présents dans les aliments et les denrées alimentaires et retiennent aujourd'hui
l´attention des milliers de chercheurs dans le monde entier, afin de mener des études
sur leur origine, toxicité, voie de biosynthèse, et surtout sur les stratégies de contrôle
de leur biosynthèse.
Le terme « mycotoxine » a pour origine la combinaison des termes « mycos » qui
signifie champignon en grecque et « toxicum » qui signifie poison en latin (Jouany et
al., 2009, Rai et al., 2012). Longtemps confinées aux pathologies provoquées par l’ergot
du seigle, les mycotoxines ont été découvertes dans les années 1960 après l’infection
de 100 000 dindes en Angleterre et leur mort due à une nécrose hépatique sévère
(Bennett and Klich, 2003). Cette tragédie a été attribuée à la présence de concentrations
trop élevées d’aflatoxines dans les arachides fournies à ces volailles (Medeiros et al.,
2012). La santé des êtres vivants et des animaux est gravement affectée non seulement
par la présence des concentrations élevées de mycotoxines dans les aliments, mais
aussi par la durée d’exposition, le type de mycotoxine et son mécanisme d’action, tout
en prenant en compte le métabolisme de l’espèce concernée et de son mécanisme de
défense (Hussein and Brasel, 2001). Du point de vue chimique, les mycotoxines sont
des molécules de faible masse moléculaire (<1000 Daltons) (Bennett and Klich, 2003).
La synthèse d’un type de mycotoxines peut être élaborée par diverses espèces
fongiques, mais pas forcément par toutes les souches appartenant à la même espèce.
On réserve le terme « mycotoxines » aux métabolites secondaires fongiques qui
présentent une toxicité pour les humains et d’autres vertébrés (Bennett and Klich,
2003). Jusqu’à maintenant, 300 mycotoxines ont été identifiées mais seulement une
Introduction bibliographique
23
vingtaine d’entre elles ont montré un profil toxicologique préoccupant pour l’homme
et l’animal. Parmi cette vingtaine, six familles de mycotoxines sont fréquemment
rencontrées chez les filières agro-alimentaires : l’aflatoxine, la patuline, l’ochratoxine,
la fumonisine, les tricothécènes et la zéaralénone (Hendrickse et al., 1982). Ces
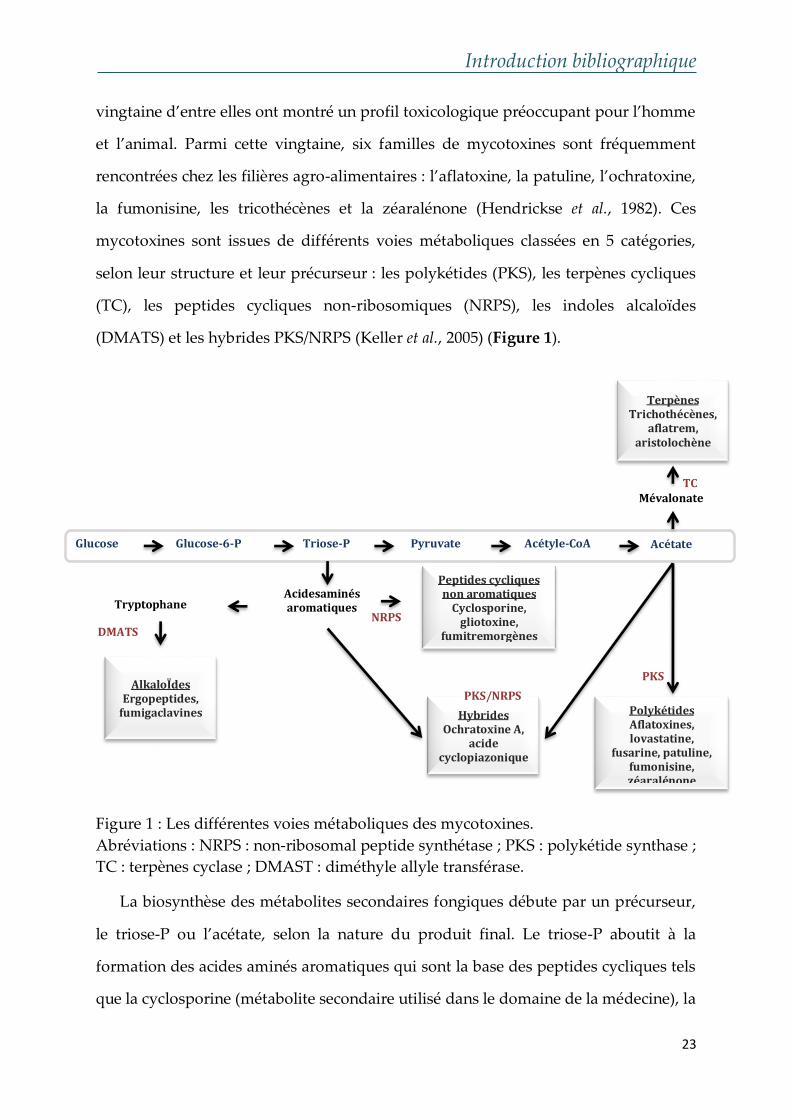
mycotoxines sont issues de différents voies métaboliques classées en 5 catégories,
selon leur structure et leur précurseur : les polykétides (PKS), les terpènes cycliques
(TC), les peptides cycliques non-ribosomiques (NRPS), les indoles alcaloïdes
(DMATS) et les hybrides PKS/NRPS (Keller et al., 2005) (Figure 1).
Figure 1 : Les différentes voies métaboliques des mycotoxines.
Abréviations : NRPS : non-ribosomal peptide synthétase ; PKS : polykétide synthase ;
TC : terpènes cyclase ; DMAST : diméthyle allyle transférase.
La biosynthèse des métabolites secondaires fongiques débute par un précurseur,
le triose-P ou l’acétate, selon la nature du produit final. Le triose-P aboutit à la
formation des acides aminés aromatiques qui sont la base des peptides cycliques tels
que la cyclosporine (métabolite secondaire utilisé dans le domaine de la médecine), la
Glucose Glucose-6-P Triose-P Pyruvate Acétyle-CoA Acétate
Mévalonate
Acidesaminés
aromatiques
Peptides cycliques
non aromatiques
Cyclosporine, gliotoxine,
fumitremorgènes
Terpènes
Trichothécènes, aflatrem,
aristolochène
Hybrides
Ochratoxine A, acide
cyclopiazonique
Polykétides
Aflatoxines, lovastatine,
fusarine, patuline, fumonisine, zéaralénone
Tryptophane
AlkaloÏdes
Ergopeptides, fumigaclavines
DMATS
NRPS
PKS/NRPS
TC
PKS
Introduction bibliographique
24
gliotoxine et la fumitremorgène (deux mycotoxines produites par A. fumigatus)
(Gardiner and Howlett, 2005, Boudra, 2002). Les acides aminés aromatiques sont de
même des précurseurs du tryptophane, qui en présence de l’enzyme diméthyl allyle
transférase sera transformé en des alcaloïdes (ergopeptides et fumigaclavines)
généralement produits par des champignons du genre Claviceps.
L’acétate, le deuxième précurseur de la production des métabolites secondaires
fongiques, conduit à la formation du mévalonate d’une part et des polykétides d’une
autre part. En présence de l’enzyme terpène cyclase, la mévalonate donne des terpènes
(trichothécènes, aflatrem et aristolochène). Les polykétides, formés par l’intermédiaire
des PKS, sont la base de plusieurs mycotoxines, telles que l’aflatoxine, la fusarine, la
zéaralénone, la patuline et la fumonisine (Yu et al., 2004, Gaffoor and Trail, 2006, Puel et
al., 2010). Ces dernières sont produites par des champignons appartenant aux genres
Aspergillus, Fusarium, Penicillium.
Quant à la formation de l’OTA et de l’acide cyclopiazonique, ces toxines requièrent
l’implication des polykétides et des acides aminés aromatiques. Ainsi, ce type de
mycotoxine est nommé « hybride » et nécessite le travail des deux types d’enzymes
PKS et NRPS, afin de former la molécule finale (Gallo et al., 2014).
A.I. Champignons producteurs
Tout au long de la chaine alimentaire, depuis le champ jusqu’à l’assiette du
consommateur, et si les conditions environnementales sont favorables, les moisissures
sont capables de synthétiser des mycotoxines. Ces moisissures, encore appelées
champignons filamenteux toxinogènes, sont des organismes pluricellulaires
appartenant au règne des « Mycètes ». Encore appelé règne « Fongique », ce dernier
regroupe une vaste variété des champignons macroscopiques, de même que des
champignons microscopiques, encore nommés moisissures, faisant l’intérêt de notre
problématique. Ces dernières, notamment les moisissures toxiques, sont des
organismes ubiquitaires proliférant dans l’environnement sur des substances
Introduction bibliographique
25
organiques et produisant des mycotoxines si les conditions d’humidité et la
température sont favorables (Aydogdu and Gucer, 2009). Ces mycotoxines sont
produites par plusieurs genres de champignons, citant Cladosporium, Fusarium,
Alternaria spp., Aspergillus spp. et Penicillium spp. (Legan, 2000).
Le genre Penicillium compte au moins 18 espèces mycotoxinogènes à savoir P.
crustosum, P. chrysogenum, P. hirsutum, P. expansum, P. roqueforti, P. viridicatum, P.
commune, P. aurantiogriseum, P. citrinum, P. verrucosum, P. cyclopium, P. canescens, P.
madriti, P. palitans, P. thomii, P. baarnense, P. fenneliae et P. frequentans. Ces espèces sont
productrices de l’OTA, la citrinine, la patuline, l’acide cyclopiazonique, l’acide
penicillique, la roquefortine, la frequentine, la palitentine, l’acide mycophénolique, la
gliotoxine, la citreoviridine et la rubratoxine B (Frisvad and Filtenborg, 1983, Firsvad
and Thrane, 1996, Müller and Amend, 1997, Frisvad and Samson, 2004, Ismaiel and
Papenbrock, 2014). Par ailleurs, ces espèces fongiques ainsi que les mycotoxines
qu’elles produisent, envahissent les graines après leur récolte, causant des pertes
économiques importantes dans différentes régions du monde.
Les espèces fongiques appartenant au genre Aspergillus sont aussi retrouvées dans
les denrées alimentaires (Onions et al., 1981, Richard, 2007). En effet, A. carbonarius, A.
ochraceus, A. alliaceus, A. westerdijkiae et A. steynii sont les producteurs majeurs de
l’OTA qui fait partie des mycotoxines les plus menaçantes (Van der Merwe, 1965,
Frisvad, 2004, Horie, 1995, Keller et al., 2005, Bennett and Klich, 2003). Les deux
espèces productrices d’aflatoxines les plus étudiées sont A. flavus et A. parasitucus, vu
leurs dégâts sur la santé de l’homme, l’économie et leurs effets phytotoxiques affectant
la qualité des plantes (Llewellyn et al., 1984, McLean et al., 1992). En ce qui concerne
A. niger, espèce productrice d’OTA et fumonisine B2 (Nielsen et al., 2009), elle aussi est
considérée parmi les espèces d’Aspergillus les plus répandues, contaminant une
grande variété de substrats et causant des dommages après la récolte (Ashiq, 2015, Pitt
et al., 2000).
Introduction bibliographique
26
Alternaria, Helminthosporium, Pyrenophora, Phoma et Zygosporium sont des
moisissures saprobiques, elles sont pathogènes pour les plantes (phytopathogènes) et
sont souvent associées aux maladies des feuilles, du bois et de certaines herbes. Les
espèces appartenant à ces genres de champignons filamenteux, produisent des
mycotoxines dangereuses comme les cytochalasines et l’acide tenuazonique (Ismaiel
and Papenbrock, 2014).
Les membres du genre Fusarium produisent une gamme de composés
phytotoxiques comme l’acide fusarique, les fumonisines (FUM B1 et B2), l’eniantin, la
zéaralénone et les tricothécènes (Barbosa et al., 2013, Richard, 2007). Ces métabolites
possèdent des activités biologiques variées et causent des dégâts morphologiques,
physiologiques et métaboliques comprenant les nécroses, la chlorose, la réduction de
la germination des graines et la diminution de la croissance des plantes (Nelson et al.,
1994, McLean, 1996).
A.II. Occurrence et toxicité des mycotoxines
Une fois trouvées dans les denrées alimentaires, les mycotoxines peuvent affecter
la santé de l’homme ainsi que celle de l’animal. En effet, l’exposition aux mycotoxines
se manifeste suite à la consommation des denrées alimentaires contaminées par des
moisissures et/ou par des mycotoxines dépassant les doses autorisées (voie directe)
ou suite à la consommation des produits dérivés des animaux contaminés, notamment
la viande, le lait et les œufs, contenant des mycotoxines ingérées par ces animaux (voie
indirecte).
Les syndromes causés suite à une inhalation ou une ingestion de mycotoxines par
l’homme ou les animaux, sont appelés des « mycotoxicoses » (AFSSA, 2009). Une des
mycotoxicoses les plus importantes est connue sous le nom de « l’ergotisme », définie
comme étant le résultat d’empoisonnement, suite à l’ingestion à long terme des
alcaloïdes issus de l’ergot du seigle (Claviceps purpura), un champignon qui infecte le
seigle et d’autres céréales. L’ergotisme connu depuis les années 1750 sous le nom de
Introduction bibliographique
27
« Feu de Saint Antoine », devint épidémique en Europe centrale durant le moyen âge.
Un autre exemple des mycotoxicoses est l’aleucie toxique alimentaire (ATA), une
maladie historique causant la mort des milliers de Russes en 1940, des fièvres graves,
des saignements de la peau, du nez et des gencives, ainsi que des nécroses et des
répressions du système immunitaire avec une mortalité arrivant jusqu’à 80% (Nelson
et al., 1994). Plus tard, dans les années 1960, l’aflatoxine a été découverte suite à la
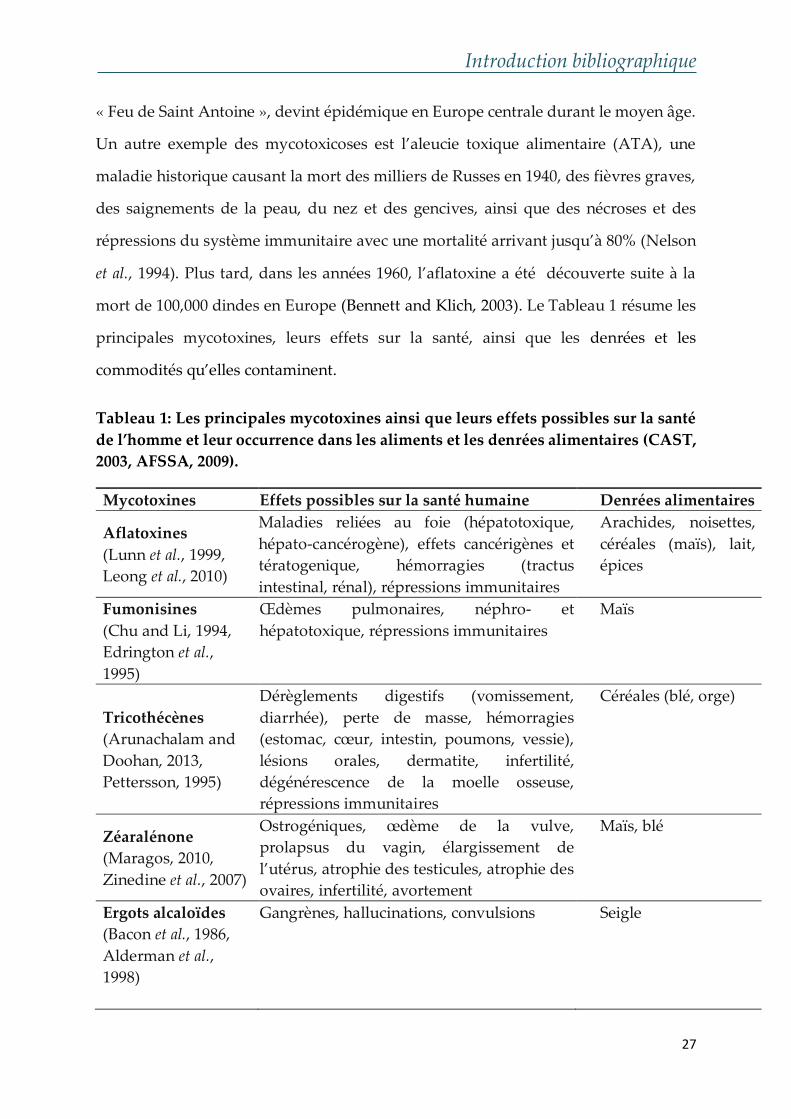
mort de 100,000 dindes en Europe (Bennett and Klich, 2003). Le Tableau 1 résume les
principales mycotoxines, leurs effets sur la santé, ainsi que les denrées et les
commodités qu’elles contaminent.
Tableau 1: Les principales mycotoxines ainsi que leurs effets possibles sur la santé
de l’homme et leur occurrence dans les aliments et les denrées alimentaires (CAST,
2003, AFSSA, 2009).
Mycotoxines Effets possibles sur la santé humaine Denrées alimentaires
Aflatoxines
(Lunn et al., 1999,
Leong et al., 2010)
Maladies reliées au foie (hépatotoxique,
hépato-cancérogène), effets cancérigènes et
tératogenique, hémorragies (tractus
intestinal, rénal), répressions immunitaires
Arachides, noisettes,
céréales (maïs), lait,
épices
Fumonisines
(Chu and Li, 1994,
Edrington et al.,
1995)
Œdèmes pulmonaires, néphro- et
hépatotoxique, répressions immunitaires
Maïs
Tricothécènes
(Arunachalam and
Doohan, 2013,
Pettersson, 1995)
Dérèglements digestifs (vomissement,
diarrhée), perte de masse, hémorragies
(estomac, cœur, intestin, poumons, vessie),
lésions orales, dermatite, infertilité,
dégénérescence de la moelle osseuse,
répressions immunitaires
Céréales (blé, orge)
Zéaralénone
(Maragos, 2010,
Zinedine et al., 2007)
Ostrogéniques, œdème de la vulve,
prolapsus du vagin, élargissement de
l’utérus, atrophie des testicules, atrophie des
ovaires, infertilité, avortement
Maïs, blé
Ergots alcaloïdes
(Bacon et al., 1986,
Alderman et al.,
1998)
Gangrènes, hallucinations, convulsions Seigle
Introduction bibliographique
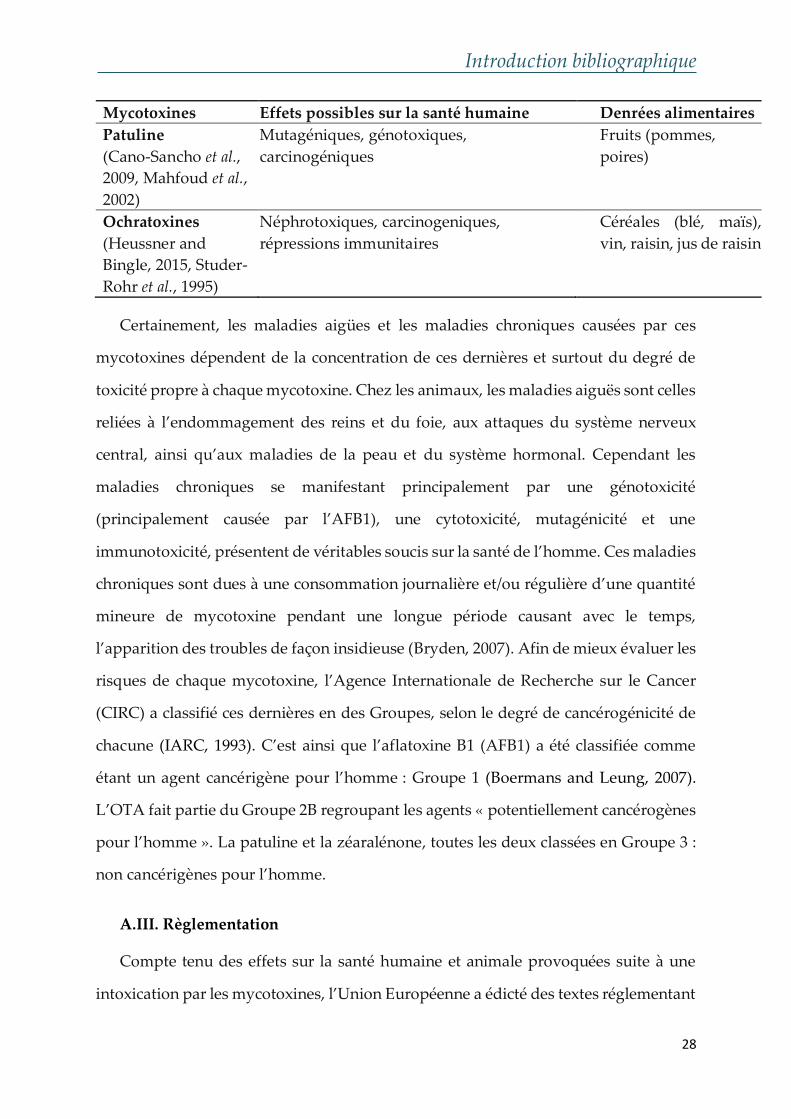
28
Mycotoxines Effets possibles sur la santé humaine Denrées alimentaires
Patuline
(Cano-Sancho et al.,
2009, Mahfoud et al.,
2002)
Mutagéniques, génotoxiques,
carcinogéniques
Fruits (pommes,
poires)
Ochratoxines
(Heussner and
Bingle, 2015, Studer-
Rohr et al., 1995)
Néphrotoxiques, carcinogeniques,
répressions immunitaires
Céréales (blé, maïs),
vin, raisin, jus de raisin
Certainement, les maladies aigües et les maladies chroniques causées par ces
mycotoxines dépendent de la concentration de ces dernières et surtout du degré de
toxicité propre à chaque mycotoxine. Chez les animaux, les maladies aiguës sont celles
reliées à l’endommagement des reins et du foie, aux attaques du système nerveux
central, ainsi qu’aux maladies de la peau et du système hormonal. Cependant les
maladies chroniques se manifestant principalement par une génotoxicité
(principalement causée par l’AFB1), une cytotoxicité, mutagénicité et une
immunotoxicité, présentent de véritables soucis sur la santé de l’homme. Ces maladies
chroniques sont dues à une consommation journalière et/ou régulière d’une quantité
mineure de mycotoxine pendant une longue période causant avec le temps,
l’apparition des troubles de façon insidieuse (Bryden, 2007). Afin de mieux évaluer les
risques de chaque mycotoxine, l’Agence Internationale de Recherche sur le Cancer
(CIRC) a classifié ces dernières en des Groupes, selon le degré de cancérogénicité de
chacune (IARC, 1993). C’est ainsi que l’aflatoxine B1 (AFB1) a été classifiée comme
étant un agent cancérigène pour l’homme : Groupe 1 (Boermans and Leung, 2007).
L’OTA fait partie du Groupe 2B regroupant les agents « potentiellement cancérogènes
pour l’homme ». La patuline et la zéaralénone, toutes les deux classées en Groupe 3 :
non cancérigènes pour l’homme.
A.III. Règlementation
Compte tenu des effets sur la santé humaine et animale provoquées suite à une
intoxication par les mycotoxines, l’Union Européenne a édicté des textes réglementant
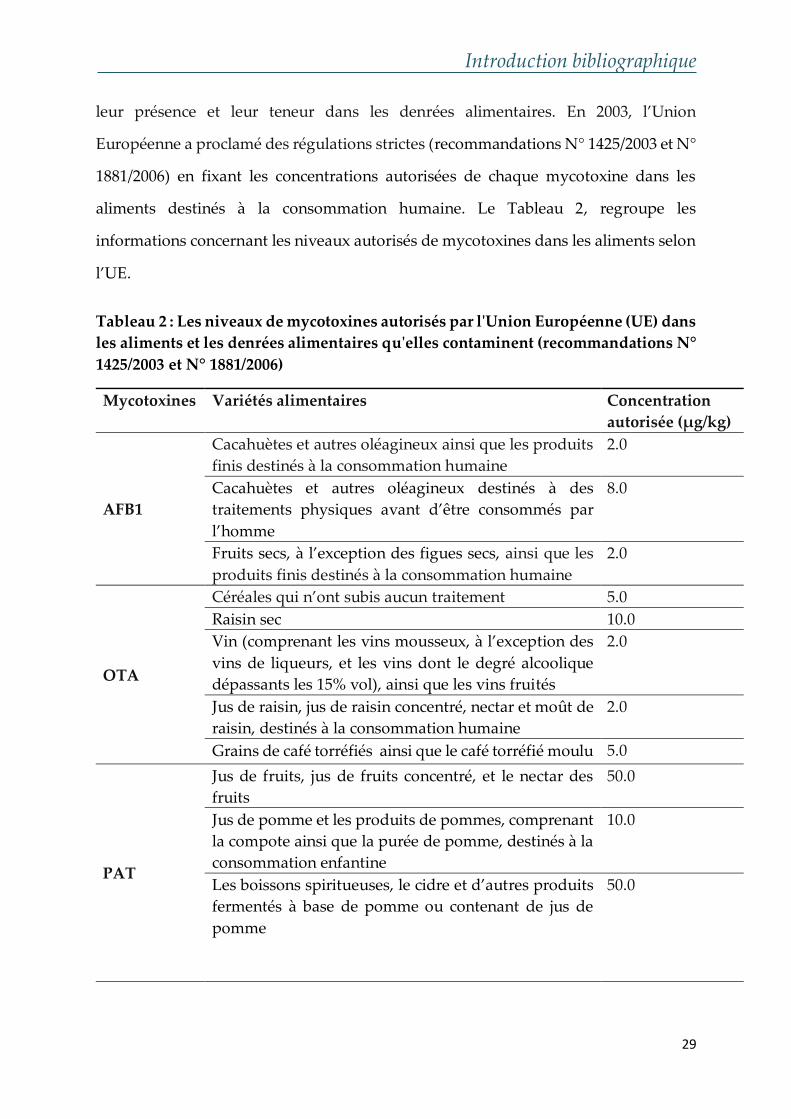
Introduction bibliographique
29
leur présence et leur teneur dans les denrées alimentaires. En 2003, l’Union
Européenne a proclamé des régulations strictes (recommandations N° 1425/2003 et N°
1881/2006) en fixant les concentrations autorisées de chaque mycotoxine dans les
aliments destinés à la consommation humaine. Le Tableau 2, regroupe les
informations concernant les niveaux autorisés de mycotoxines dans les aliments selon
l’UE.
Tableau 2 : Les niveaux de mycotoxines autorisés par l'Union Européenne (UE) dans
les aliments et les denrées alimentaires qu'elles contaminent (recommandations N°
1425/2003 et N° 1881/2006)
Mycotoxines Variétés alimentaires Concentration
autorisée (μg/kg)
AFB1
Cacahuètes et autres oléagineux ainsi que les produits
finis destinés à la consommation humaine
2.0
Cacahuètes et autres oléagineux destinés à des
traitements physiques avant d’être consommés par
l’homme
8.0
Fruits secs, à l’exception des figues secs, ainsi que les
produits finis destinés à la consommation humaine
2.0
OTA
Céréales qui n’ont subis aucun traitement 5.0
Raisin sec 10.0
Vin (comprenant les vins mousseux, à l’exception des
vins de liqueurs, et les vins dont le degré alcoolique
dépassants les 15% vol), ainsi que les vins fruités
2.0
Jus de raisin, jus de raisin concentré, nectar et moût de
raisin, destinés à la consommation humaine
2.0
Grains de café torréfiés ainsi que le café torréfié moulu 5.0
PAT
Jus de fruits, jus de fruits concentré, et le nectar des
fruits
50.0
Jus de pomme et les produits de pommes, comprenant
la compote ainsi que la purée de pomme, destinés à la
consommation enfantine
10.0
Les boissons spiritueuses, le cidre et d’autres produits
fermentés à base de pomme ou contenant de jus de
pomme
50.0
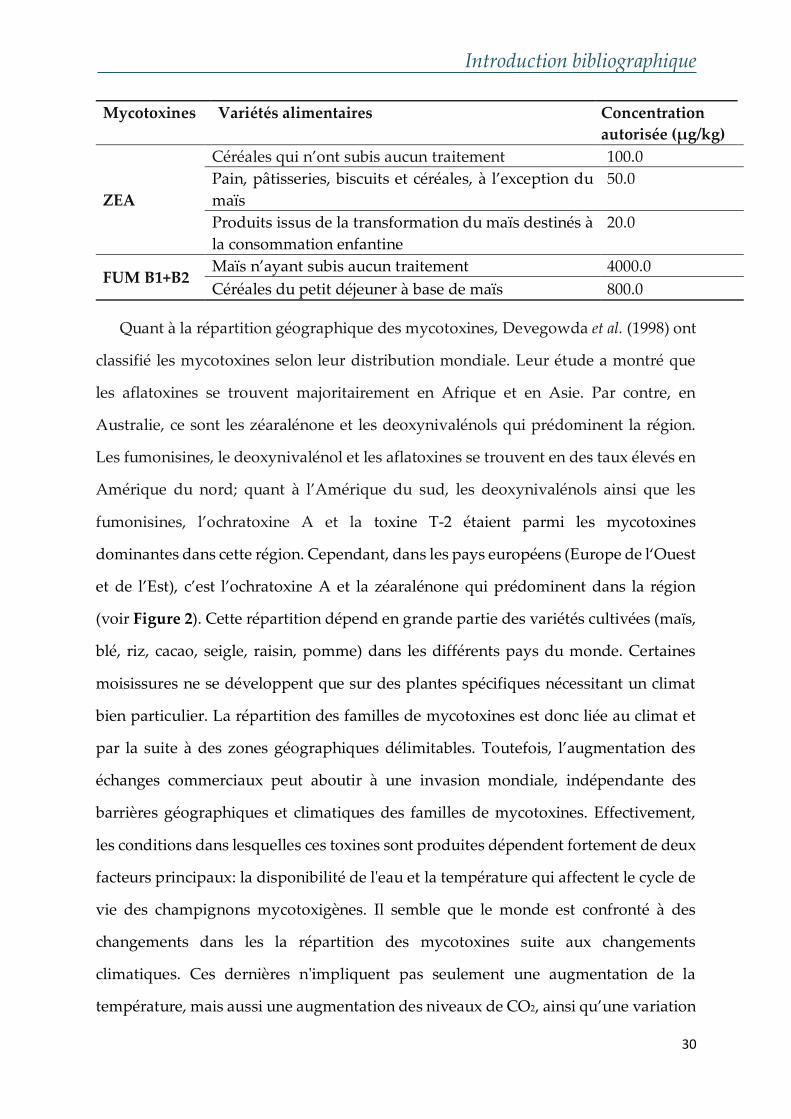
Introduction bibliographique
30
Mycotoxines Variétés alimentaires Concentration
autorisée (μg/kg)
ZEA
Céréales qui n’ont subis aucun traitement 100.0
Pain, pâtisseries, biscuits et céréales, à l’exception du
maïs
50.0
Produits issus de la transformation du maïs destinés à
la consommation enfantine
20.0
FUM B1+B2 Maïs n’ayant subis aucun traitement 4000.0
Céréales du petit déjeuner à base de maïs 800.0
Quant à la répartition géographique des mycotoxines, Devegowda et al. (1998) ont
classifié les mycotoxines selon leur distribution mondiale. Leur étude a montré que
les aflatoxines se trouvent majoritairement en Afrique et en Asie. Par contre, en
Australie, ce sont les zéaralénone et les deoxynivalénols qui prédominent la région.
Les fumonisines, le deoxynivalénol et les aflatoxines se trouvent en des taux élevés en
Amérique du nord; quant à l’Amérique du sud, les deoxynivalénols ainsi que les
fumonisines, l’ochratoxine A et la toxine T-2 étaient parmi les mycotoxines
dominantes dans cette région. Cependant, dans les pays européens (Europe de l‘Ouest
et de l’Est), c’est l’ochratoxine A et la zéaralénone qui prédominent dans la région
(voir Figure 2). Cette répartition dépend en grande partie des variétés cultivées (maïs,
blé, riz, cacao, seigle, raisin, pomme) dans les différents pays du monde. Certaines
moisissures ne se développent que sur des plantes spécifiques nécessitant un climat
bien particulier. La répartition des familles de mycotoxines est donc liée au climat et
par la suite à des zones géographiques délimitables. Toutefois, l’augmentation des
échanges commerciaux peut aboutir à une invasion mondiale, indépendante des
barrières géographiques et climatiques des familles de mycotoxines. Effectivement,
les conditions dans lesquelles ces toxines sont produites dépendent fortement de deux
facteurs principaux: la disponibilité de l'eau et la température qui affectent le cycle de
vie des champignons mycotoxigènes. Il semble que le monde est confronté à des
changements dans les la répartition des mycotoxines suite aux changements
climatiques. Ces dernières n'impliquent pas seulement une augmentation de la
température, mais aussi une augmentation des niveaux de CO2, ainsi qu’une variation
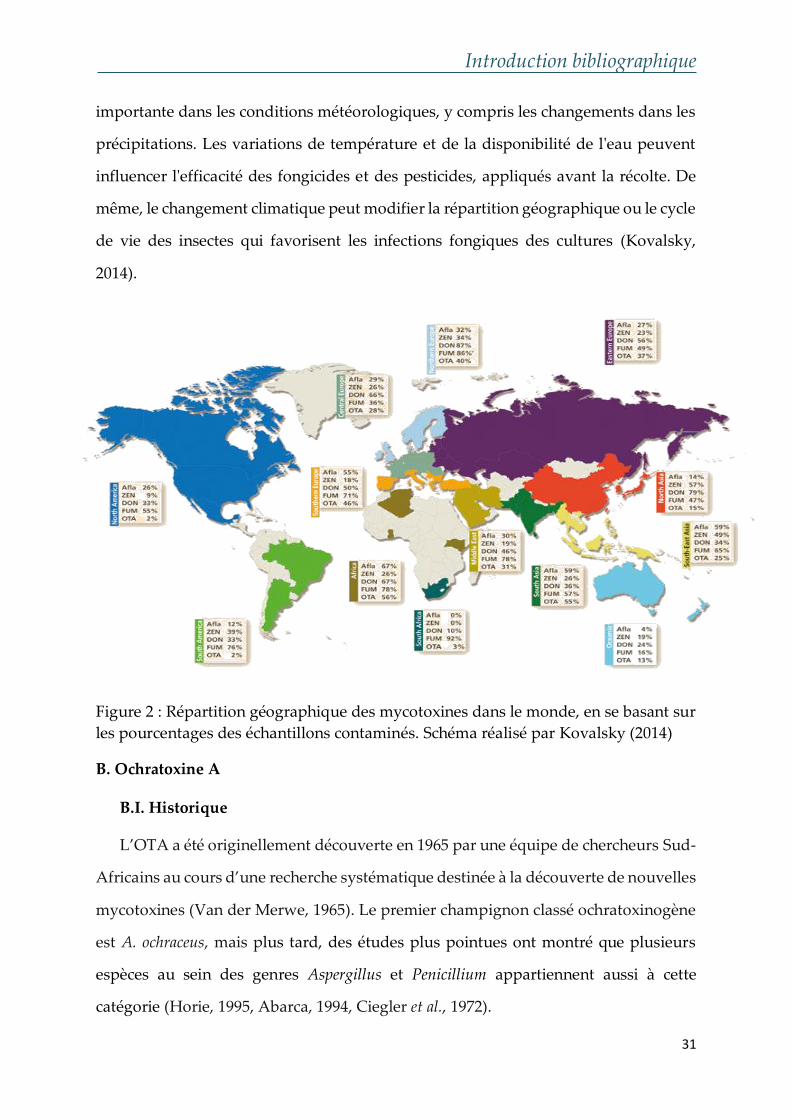
Introduction bibliographique
31
importante dans les conditions météorologiques, y compris les changements dans les
précipitations. Les variations de température et de la disponibilité de l'eau peuvent
influencer l'efficacité des fongicides et des pesticides, appliqués avant la récolte. De
même, le changement climatique peut modifier la répartition géographique ou le cycle
de vie des insectes qui favorisent les infections fongiques des cultures (Kovalsky,
2014).
Figure 2 : Répartition géographique des mycotoxines dans le monde, en se basant sur
les pourcentages des échantillons contaminés. Schéma réalisé par Kovalsky (2014)
B. Ochratoxine A
B.I. Historique
L’OTA a été originellement découverte en 1965 par une équipe de chercheurs Sud-
Africains au cours d’une recherche systématique destinée à la découverte de nouvelles
mycotoxines (Van der Merwe, 1965). Le premier champignon classé ochratoxinogène
est A. ochraceus, mais plus tard, des études plus pointues ont montré que plusieurs
espèces au sein des genres Aspergillus et Penicillium appartiennent aussi à cette
catégorie (Horie, 1995, Abarca, 1994, Ciegler et al., 1972).
Introduction bibliographique
32
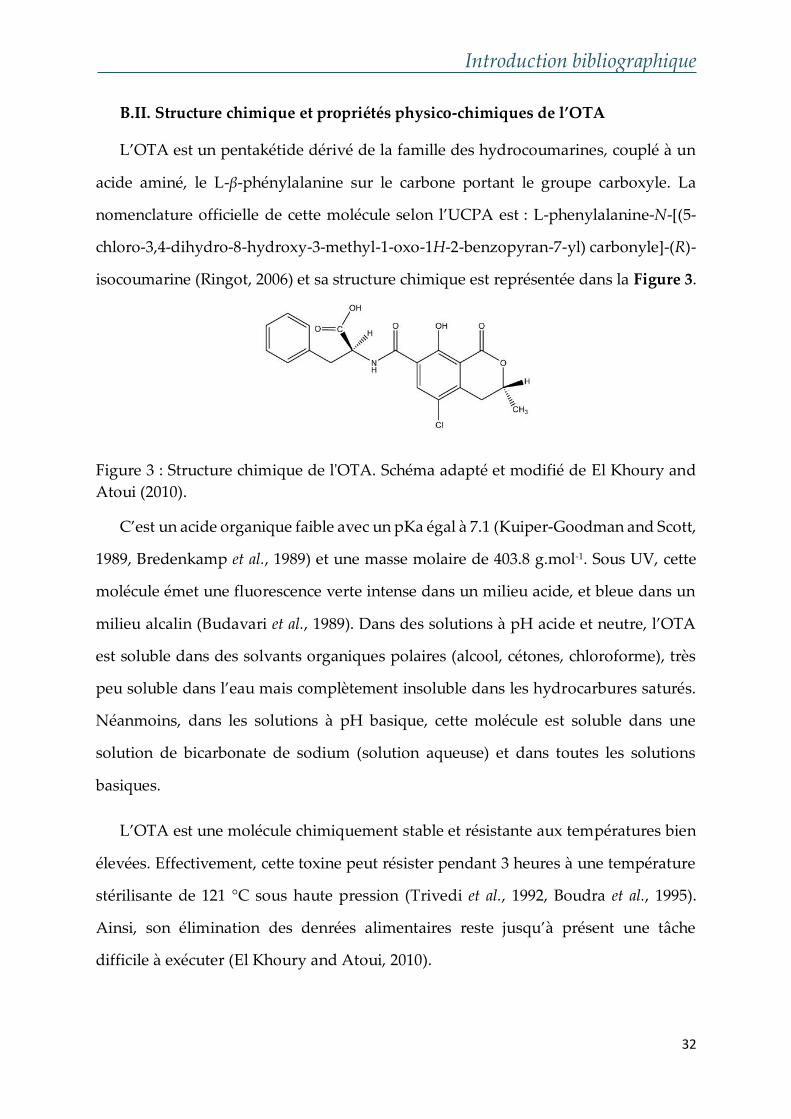
B.II. Structure chimique et propriétés physico-chimiques de l’OTA
L’OTA est un pentakétide dérivé de la famille des hydrocoumarines, couplé à un
acide aminé, le L-β-phénylalanine sur le carbone portant le groupe carboxyle. La
nomenclature officielle de cette molécule selon l’UCPA est : L-phenylalanine-N-[(5-
chloro-3,4-dihydro-8-hydroxy-3-methyl-1-oxo-1H-2-benzopyran-7-yl) carbonyle]-(R)-
isocoumarine (Ringot, 2006) et sa structure chimique est représentée dans la Figure 3.
Figure 3 : Structure chimique de l'OTA. Schéma adapté et modifié de El Khoury and
Atoui (2010).
C’est un acide organique faible avec un pKa égal à 7.1 (Kuiper-Goodman and Scott,
1989, Bredenkamp et al., 1989) et une masse molaire de 403.8 g.mol-1. Sous UV, cette
molécule émet une fluorescence verte intense dans un milieu acide, et bleue dans un
milieu alcalin (Budavari et al., 1989). Dans des solutions à pH acide et neutre, l’OTA
est soluble dans des solvants organiques polaires (alcool, cétones, chloroforme), très
peu soluble dans l’eau mais complètement insoluble dans les hydrocarbures saturés.
Néanmoins, dans les solutions à pH basique, cette molécule est soluble dans une
solution de bicarbonate de sodium (solution aqueuse) et dans toutes les solutions
basiques.
L’OTA est une molécule chimiquement stable et résistante aux températures bien
élevées. Effectivement, cette toxine peut résister pendant 3 heures à une température
stérilisante de 121 °C sous haute pression (Trivedi et al., 1992, Boudra et al., 1995).
Ainsi, son élimination des denrées alimentaires reste jusqu’à présent une tâche
difficile à exécuter (El Khoury and Atoui, 2010).
Introduction bibliographique
33
B.III. Occurrence dans les aliments, exposition de l’homme et principaux
producteurs
L’OTA est une mycotoxine trouvée essentiellement dans les produits dérivés des
plantes, comme à titre d’exemple les céréales (Park et al., 2005), les haricots, les
arachides, les épices (Overy et al., 2003), les fruits secs (Drusch and Ragab, 2003), le
café (Napolitano et al., 2007), le lait et la bière (Skaug, 1999, Tangni et al., 2002), et elle
est surtout détectée dans les produits dérivés du raisin tels que le jus de raisin, le vin,
et les raisins secs (Pietri et al., 2001, Zimmerli and Dick, 1996, Rosa et al., 2004). Le jus
de raisin ainsi que les raisins secs ou déshydratés, utilisés dans les barres de céréales,
biscuits et pain, suscitent de considérables inquiétudes aux niveaux national et
international vue leur consommation élevée par les enfants, et donc représentent une
source importante de consommation journalière d’OTA (Jordan, 2009). Afin de mieux
contrôler son occurrence en Europe, la « Commission Européenne » a décidé en 1994
de créer un groupe de coopération scientifique, connu sous le nom de « SCOOP Task
3.2.2 » dans le but de rassembler toutes les informations sur l’apport de l’OTA
absorbée via le régime alimentaire adopté dans les pays de l’Union Européenne
(Majerus and Kapp, 2002). Vue la nécessité de fixer des teneurs maximales tolérables
de certains contaminants d’origine naturelle (surtout l’OTA et les aflatoxines) dans les
denrées alimentaires, cette commission a décidé (Décision 1999/143/EC) d’établir le
rapport « Assurance sur l’apport d’ochratoxine A par le régime alimentaire dans
l’Union Européenne » (Commission, 2004). Ce rapport a révélé la présence de l’OTA
dans une grande variété des denrées alimentaires telle que les céréales, le café, la bière,
le vin et la viande. Les concentrations trouvées sont variables allant de quelques ng/kg
à plusieurs µg/kg (un échantillon de café vert contient 250 µg/kg d’OTA). Parmi 5180
échantillons de céréales, 55% sont contaminés avec des taux d’OTA arrivant à 33
µg/kg. Le cacao s’est avéré la denrée la plus fréquemment contaminée (81% des
échantillons) mais avec des teneurs en OTA les plus faibles (moyenne de 0.277 µg/kg).
Toutefois, la contamination des viandes par l’OTA accentue la possibilité d’une
Introduction bibliographique
34
contamination indirecte de l’homme, suite au stockage de l’OTA dans les muscles des
animaux (volailles, porc) (Jorgensen, 1998). A cause de sa thermostabilité, l’OTA se
maintient stable face aux procédés de transformation des aliments (cuisson,
fermentation, torréfaction...), ce qui lui permet de se retrouver dans les produits
dérivés de matières premières contaminées (Verger et al., 1999).
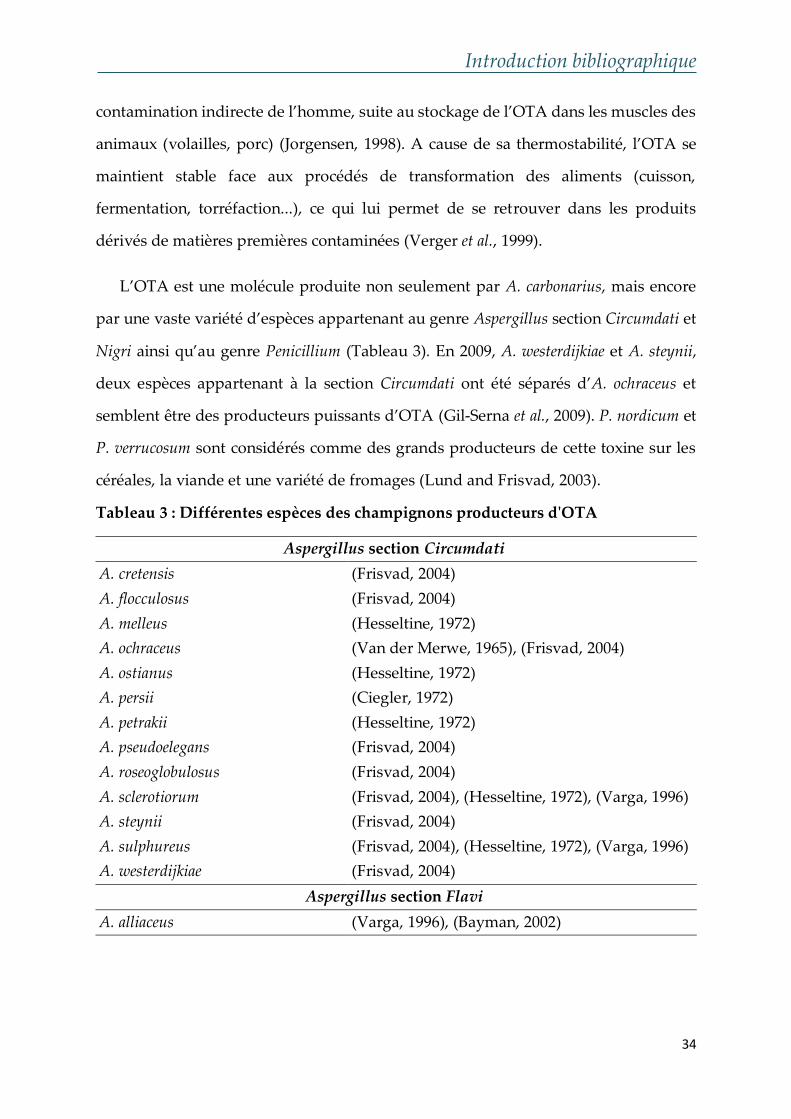
L’OTA est une molécule produite non seulement par A. carbonarius, mais encore
par une vaste variété d’espèces appartenant au genre Aspergillus section Circumdati et
Nigri ainsi qu’au genre Penicillium (Tableau 3). En 2009, A. westerdijkiae et A. steynii,
deux espèces appartenant à la section Circumdati ont été séparés d’A. ochraceus et
semblent être des producteurs puissants d’OTA (Gil-Serna et al., 2009). P. nordicum et
P. verrucosum sont considérés comme des grands producteurs de cette toxine sur les
céréales, la viande et une variété de fromages (Lund and Frisvad, 2003).
Tableau 3 : Différentes espèces des champignons producteurs d'OTA
Aspergillus section Circumdati
A. cretensis (Frisvad, 2004)
A. flocculosus (Frisvad, 2004)
A. melleus (Hesseltine, 1972)
A. ochraceus (Van der Merwe, 1965), (Frisvad, 2004)
A. ostianus (Hesseltine, 1972)
A. persii (Ciegler, 1972)
A. petrakii (Hesseltine, 1972)
A. pseudoelegans (Frisvad, 2004)
A. roseoglobulosus (Frisvad, 2004)
A. sclerotiorum (Frisvad, 2004), (Hesseltine, 1972), (Varga, 1996)
A. steynii (Frisvad, 2004)
A. sulphureus (Frisvad, 2004), (Hesseltine, 1972), (Varga, 1996)
A. westerdijkiae (Frisvad, 2004)
Aspergillus section Flavi
A. alliaceus (Varga, 1996), (Bayman, 2002)
Introduction bibliographique
35
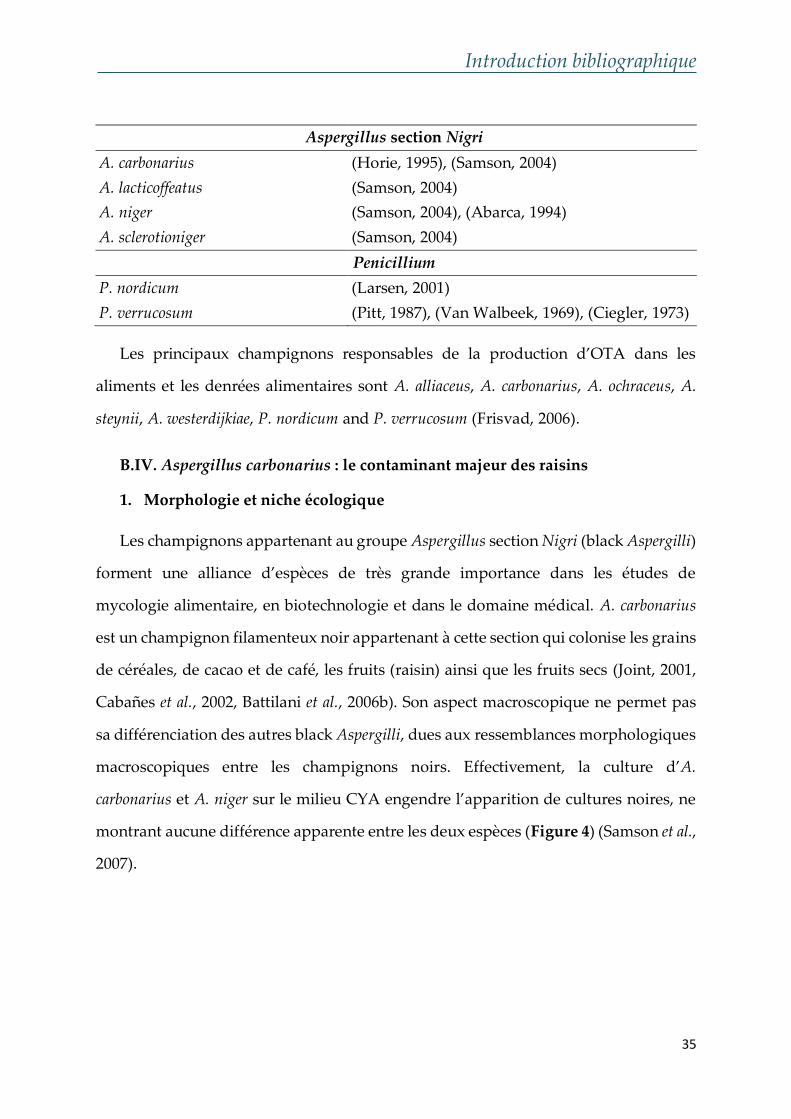
Aspergillus section Nigri
A. carbonarius (Horie, 1995), (Samson, 2004)
A. lacticoffeatus (Samson, 2004)
A. niger (Samson, 2004), (Abarca, 1994)
A. sclerotioniger (Samson, 2004)
Penicillium
P. nordicum (Larsen, 2001)
P. verrucosum (Pitt, 1987), (Van Walbeek, 1969), (Ciegler, 1973)
Les principaux champignons responsables de la production d’OTA dans les
aliments et les denrées alimentaires sont A. alliaceus, A. carbonarius, A. ochraceus, A.
steynii, A. westerdijkiae, P. nordicum and P. verrucosum (Frisvad, 2006).
B.IV. Aspergillus carbonarius : le contaminant majeur des raisins
1. Morphologie et niche écologique
Les champignons appartenant au groupe Aspergillus section Nigri (black Aspergilli)
forment une alliance d’espèces de très grande importance dans les études de
mycologie alimentaire, en biotechnologie et dans le domaine médical. A. carbonarius
est un champignon filamenteux noir appartenant à cette section qui colonise les grains
de céréales, de cacao et de café, les fruits (raisin) ainsi que les fruits secs (Joint, 2001,
Cabañes et al., 2002, Battilani et al., 2006b). Son aspect macroscopique ne permet pas
sa différenciation des autres black Aspergilli, dues aux ressemblances morphologiques
macroscopiques entre les champignons noirs. Effectivement, la culture d’A.
carbonarius et A. niger sur le milieu CYA engendre l’apparition de cultures noires, ne
montrant aucune différence apparente entre les deux espèces (Figure 4) (Samson et al.,
2007).

Introduction bibliographique
36
Figure 4 : (I) Culture sur milieu CYA de (A) A. carbonarius, (B) A. niger. (II) Conidies
de (A) A. carbonarius et (B) A. niger
Néanmoins, au niveau microscopique, A. carbonarius a une structure assez
particulière (Figure 5) : c’est un champignon bisérié ayant des conidiophiores lisses
de 2 à 3 µm de longueur, des vésicules sphériques de diamètre 60 à 90 µm, les métules
sont de 12 à 18 µm et de très larges conidies de 6 à 8 µm de diamètre, noire et très
rugueuses, voire pointues.
Figure 5 : Schéma représentant la structure microscopique d'A. carbonarius
(I) A B
(II) A B
Introduction bibliographique
37
En plus de ces caractéristiques morphologiques, A. carbonarius était le seul à
pousser dans une gamme de température allant de 9 °C jusqu’à 36 °C (Samson et al.,
2007).
2. Facteurs affectant la croissance d’A. carbonarius et la synthèse de l’OTA
Le niveau de colonisation des champignons filamenteux est déterminé par les
facteurs environnementaux régnants et la composition de la matrice alimentaire
(Magan et al., 2004). Ces moisissures peuvent produire des mycotoxines, si les
conditions environnementales le permettent. Cependant la production de ces
dernières est déclenchée durant la transition morphologique des champignons et
dépend de plusieurs facteurs tels que la température, le pH du milieu ainsi que
l’humidité et la teneur en eau (aw) des substrats. Cependant, les conditions optimales
de production de l’OTA sont généralement très différentes de celle de la croissance
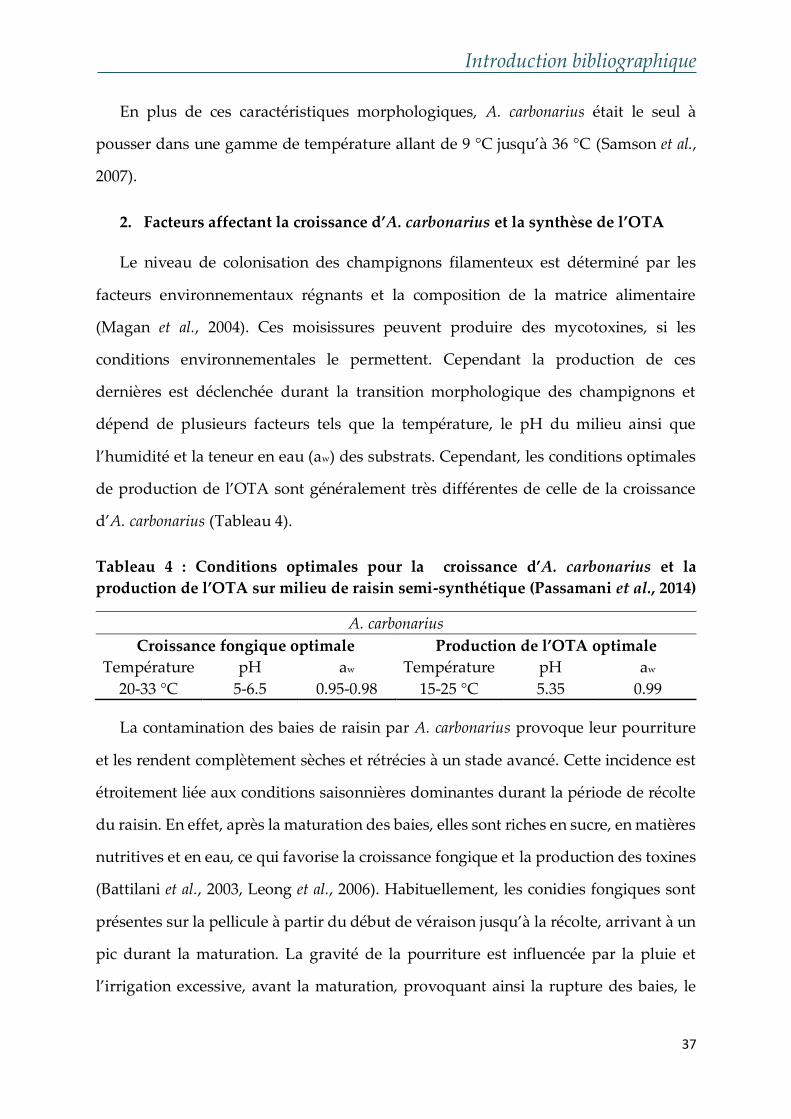
d’A. carbonarius (Tableau 4).
Tableau 4 : Conditions optimales pour la croissance d’A. carbonarius et la
production de l’OTA sur milieu de raisin semi-synthétique (Passamani et al., 2014)
A. carbonarius
Croissance fongique optimale Production de l’OTA optimale
Température pH aw Température pH aw
20-33 °C 5-6.5 0.95-0.98 15-25 °C 5.35 0.99
La contamination des baies de raisin par A. carbonarius provoque leur pourriture
et les rendent complètement sèches et rétrécies à un stade avancé. Cette incidence est
étroitement liée aux conditions saisonnières dominantes durant la période de récolte
du raisin. En effet, après la maturation des baies, elles sont riches en sucre, en matières
nutritives et en eau, ce qui favorise la croissance fongique et la production des toxines
(Battilani et al., 2003, Leong et al., 2006). Habituellement, les conidies fongiques sont
présentes sur la pellicule à partir du début de véraison jusqu’à la récolte, arrivant à un
pic durant la maturation. La gravité de la pourriture est influencée par la pluie et
l’irrigation excessive, avant la maturation, provoquant ainsi la rupture des baies, le
Introduction bibliographique
38
fait qui augmente le risque de contamination par des champignons filamenteux
(Leong et al., 2006, Cozzi et al., 2007).
Le projet « Wine-Ochra Risk » réalisé dans six pays Méditerranéens entre les
années 2001 et 2005, montre que l’incidence de contamination du raisin par des
champignons Aspergillus appartenant à la section Nigri est significativement corrélée
avec la latitude et la longitude (Battilani et al., 2006a). Suivant l’approche géostatique
décrite par Battilani et al. (2006a), l’occurrence d’A. carbonarius est plus importante en
s’approchant vers le sud de l’Europe. La combinaison des paramètres « température »
et « pluviosité » durant la période « fin Aout-début Septembre » dans plusieurs pays
Méditerranéens, a permis la mise en œuvre des cartes « Thermo-humidité » pouvant
prédire l’occurrence de l’OTA dans les vignobles. Les conditions météorologiques
ainsi que la proximité de la mer jouent également un rôle majeur dans la
détermination de l’occurrence de l’OTA dans les raisins (Cozzi et al., 2007).
B.V. Toxicité de l’OTA
Le profil toxicologique de l’OTA a été largement évalué dans de nombreuses
études au cours des années (Haighton et al., 2012, O'Brien and Dietrich, 2005, El
Khoury and Atoui, 2010, Mally, 2012, Vettorazzi et al., 2014). L’OTA est la mycotoxine
la plus dangereuse appartenant à la famille des ochratoxines. D’ailleurs, cette toxine a
gagné sa place parmi les métabolites secondaires toxiques, en lien avec ses propriétés
carcénogéniques, néphrotoxiques, tératogeniques, immunotoxiques et neurotoxiques
(Pfohl‐Leszkowicz and Manderville, 2007).
Durant la dernière décennie, les études menées sur le pouvoir carcinogénique de
l’OTA ont attribué cet effet au mécanisme génotoxique indirect de cette molécule
(mécanisme épigénique), relié au stress oxydatif, à la prolifération cellulaire
compensatoire et à l’interruption des signaux de division cellulaire (Mally and Dekant,
2009, Vettorazzi et al., 2013, Rumora and Žanić Grubišić, 2009). Néanmoins,
l’hypothèse de l’implication génotoxique directe de l’OTA induisant la formation des
Introduction bibliographique
39
adduits à l’ADN reste toujours en cours de discussion (Pfohl-Leszkowicz and
Manderville, 2011). En effet, l’ingestion de cette molécule via le régime alimentaire
aboutit à l’apparition de tumeurs hépatocellulaires et rénales, des hépatomes et des
nodules hépatiques chez les souris mâles et des carcinomes hépatocellulaires chez les
souris femelles (Huff et al., 1992, Pfohl‐Leszkowicz et al., 1998). Cependant, les études
sur l’association de cancers chez les humains suite à l’ingestion de l’OTA demeurent
peu concluantes, bien que des morts dues aux tumeurs du tractus urinaire ont été
signalés dans les pays des Balkans (Néphropathie Endémique des Balkans ou BEN),
notamment en Bulgarie et Yougoslavie (Feier and Tofana, 2009).
Quant aux effets néphrotoxiques de l’OTA, cette dernière a été associée à
l’ochratoxicose des poulets et des porcs (néphropathie porcine liée aux mycotoxines,
MPN) classée parmi les maladies causant des pertes économiques mondiales (Huff et
al., 1974, Elaroussi et al., 2006, Stoev et al., 2010a, Stoev et al., 2010b), et caractérisée par
un endommagement sévère des reins lié à la consommation des aliments contaminés
en OTA (Stoev and Denev, 2013, Goliński et al., 1984). Cette molécule a montré une
grande affinité envers les protéines, plus particulièrement le sérum d’albumine (la
Bovine Sérum Albumine ou BSA), favorisant ainsi sa bioaccumulation dans les
organes des animaux, et par la suite sa transmission vers les animaux prédateurs. Par
conséquent, les muscles, les produits des abats, le lait et parfois les œufs, peuvent être
contaminés indirectement par l’OTA. Quant à l’intoxication des humains par cette
toxine, il s’est avéré que cette dernière est responsable de la maladie rénale progressive
(Néphropathie Endémique ou EN) se manifestant par une fibrose cellulaire
interstitielle, une atrophie tubulaire et une caryomégalie des cellules tubulaires
rénales (Stoev, 1998, Maaroufi et al., 1993).
L’OTA a aussi des effets tératogenique, immunotoxique et neurotoxique.
Effectivement, cette substance est capable de traverser la membrane du placenta chez
les rats, les souris et les poules, induisant des malformations et des dysmorphogenèses
fœtales chez ces animaux (Maruya et al., 1982, Hayes et al., 1974, Gilani et al., 1978). En
Introduction bibliographique
40
plus, sous certaines conditions, l’OTA peut agir comme un agent immunodépresseur,
inhibant par la suite la prolifération des lymphocytes B et T ainsi que la production de
l’Interleukine 2 (IL2) (Lea et al., 1989). De même, Petzinger and Weidenbach (2002) a
constaté que l’OTA est à l’origine de plusieurs maladies immunitaires, notamment la
régression du thymus, la suppression de la réponse immunitaire et des troubles dans
la circulation lymphatique (lymphopénie). Par rapport au système nerveux, l’OTA est
considérée comme une substance hautement toxique pour les cellules nerveuses
(Brown et al., 1976) causant des lésions et des endommagements au niveau cérébral
(Soleas et al., 2001).
Les doses létales (LD) et le mécanisme d’action de l’OTA ont été largement étudiés
et interprétés au cours des années, surtout sur les porcs et les rats. Les LD50 de l’OTA
(doses létales capables de tuer 50% de la population étudiée) chez les porcs sont de
l’ordre de 1.0–6.0 mg/kg, et de 20–30 mg/kg pour les rats (O'Brien and Dietrich, 2005).
Ces auteurs ont ainsi démontré que ces taux d’OTA causent des hémorragies dans
tous les organes vitaux, des néphroses et nécroses dans le foie et les tissues
lymphoïdes. En plus, cette toxine peut s’accumuler dans le corps, puisqu’elle est
facilement absorbée par l’estomac et l’intestin grêle, mais difficilement éliminée par
les voies biliaires. Une fois ingérée, l’OTA a une durée de demi-vie variable selon le
genre des animaux. La durée de demi-vie de cette toxine chez les êtres humains peut
arriver à 35 jours (la durée de demi-vie la plus élevée), et à 40 heures chez les rats (la
durée la plus petite) (O'Brien and Dietrich, 2005). La demi-vie élevée de l’OTA chez
certains organismes est due à l’affinité de cette molécule avec les protéines sériques.
Kumagai (1985) a constaté que les rats dépourvus d’albumine sont capables d’éliminer
plus rapidement l’OTA par les voies urinaires que les rats témoins.
Quant aux métabolites issus de la transformation de l’OTA, leur toxicité est très
peu étudiée. En effet, l’OTα est 1000 fois moins toxique que l’OTA (Bruinink et al.,
1998) et sa demi-vie est de 9.6 heures chez les rats (Li et al., 1997). De même,
l’administration de l’OTB n’a pas d’effet néfaste chez les rats (Mally et al., 2005),
Introduction bibliographique
41
pourtant des nécroses et des dégénérations tubulaires rénales sont observées après
l’ingestion de la même dose d’OTA par ces rats. Cette différence de toxicité est
attribuée à la faible affinité de l’OTB envers les protéines sériques, ce qui diminue sa
bioaccumulation dans les organes et favorise ainsi son excrétion.
B.VI. Voie de biosynthèse
Bien que l’OTA soit parmi les mycotoxines les plus menaçantes à la sécurité des
aliments, sa voie de biosynthèse reste jusqu’à présent, pas complètement élucidée
comparée aux autres mycotoxines (Huffman et al., 2010). Néanmoins, plusieurs
hypothèses ont été mises au cours des années sur la chronologie de la production de
l’OTA :
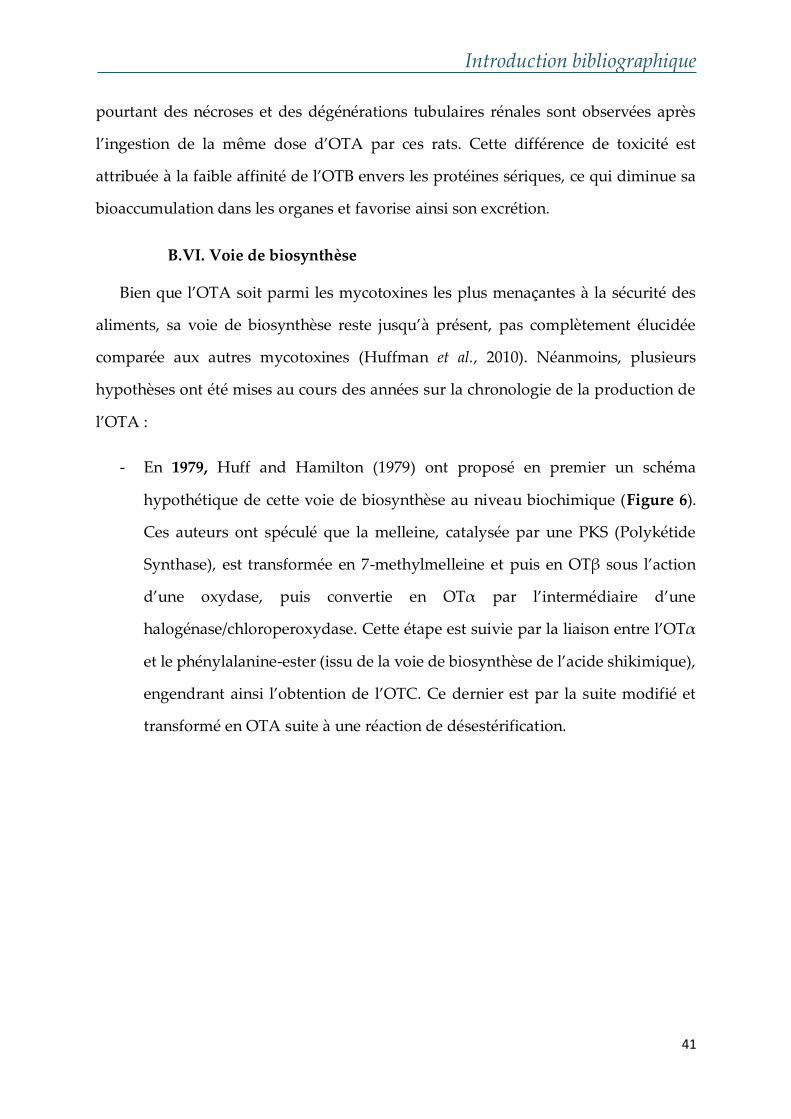
- En 1979, Huff and Hamilton (1979) ont proposé en premier un schéma
hypothétique de cette voie de biosynthèse au niveau biochimique (Figure 6).
Ces auteurs ont spéculé que la melleine, catalysée par une PKS (Polykétide
Synthase), est transformée en 7-methylmelleine et puis en OTβ sous l’action
d’une oxydase, puis convertie en OTα par l’intermédiaire d’une
halogénase/chloroperoxydase. Cette étape est suivie par la liaison entre l’OTα
et le phénylalanine-ester (issu de la voie de biosynthèse de l’acide shikimique),
engendrant ainsi l’obtention de l’OTC. Ce dernier est par la suite modifié et
transformé en OTA suite à une réaction de désestérification.
Introduction bibliographique
42
Figure 6 : Schéma de la première voie hypothétique de la biosynthèse de l'OTA.
Schéma adapté et modifié de (Huff and Hamilton, 1979).
- Entre les années 2001 et 2012, des études moléculaires ont montré que chez A.
ochraceus (Harris and Mantle 2001) et A. westerdijkiae NRRL 3174 producteur
d’OTA (anciennement identifié comme A. ochraceus) (Bacha et al., 2009, Bacha
et al., 2012, Harris and Mantle, 2001), la melleine ne joue aucun rôle dans la
biosynthèse de cette toxine. Outre melleine, l’intermédiaire OTC, qui est
supposé avoir un rôle dans la dernière étape de biosynthèse de l’OTA, n’a pas
été détecté dans les cultures d’A. carbonarius liquide, et c’est ainsi que
l’hypothèse de son implication dans la biosynthèse de l’OTA a été éloigné par
Gallo et al. (2012).
- Ultérieurement, Gallo et al. (2012) a proposé un nouveau modèle présentant la
voie de biosynthèse de l’OTA chez A. carbonarius, dans lequel l’OTβ est
transformée en OTB par une NRPS (Peptide Synthase Non Ribosomique) (suite
à une liaison amidique entre l’OTβ et le L-phénylalanine), et puis en OTA par
l’intermédiaire d’une halogénase/chloroperoxydase. D’ailleurs, dans ce modèle
1 acétyl-CoA 4 malonyl-CoA
Melleine
PKS
Oxydase
7-carboxymelleine
(Otβ)
Chloroperoxydase
OTα OTC
Phénylalanineéthyl-ester Phénylalanine
Estérification Issu de la voie
de biosynthèse
de l’acide
shikimique
OTA
7-methylmelleine
Introduction bibliographique
43
de biosynthèse, l’OTα n’est plus considérée comme un intermédiaire de
synthèse chez A. carbonarius ITEM 5010, mais plutôt comme un produit de
dégradation de l’OTA.
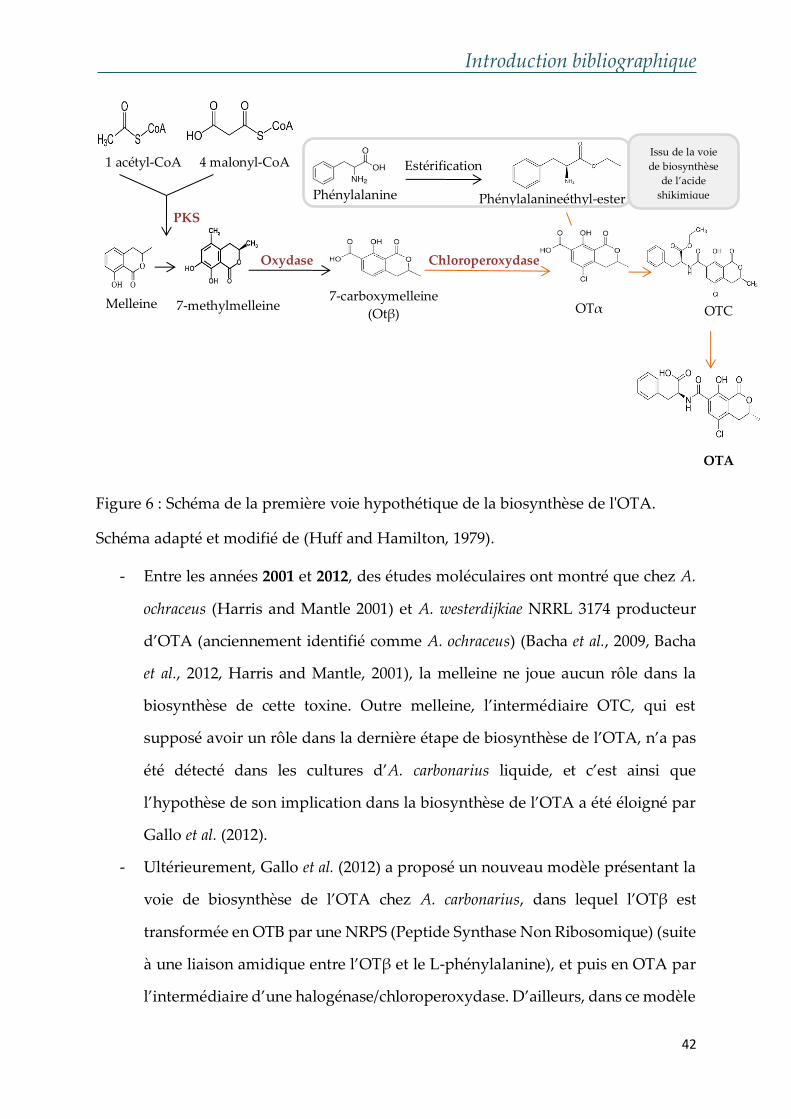
- En 2016, la voie de biosynthèse de l’OTA a été confirmée suite à l’identification
et au séquençage du gène codant une halogénase/choloperoxydase chez A.
carbonarius. La mutation de ce gène a engendré la production excessive de
l’OTB, sans aucune détection de l’OTA. Les métabolites qui précèdent la
formation de l’OTB ont été de même détectés, ce qui place la chloration en
dernière étape dans la voie de biosynthèse de l’OTA (Ferrara et al., 2016).
Figure 7 : Schéma montrant la voie de biosynthèse de l'OTA proposée en 2016 chez A.
carbonarius. Schéma adapté et modifié de Ferrara et al. (2016).
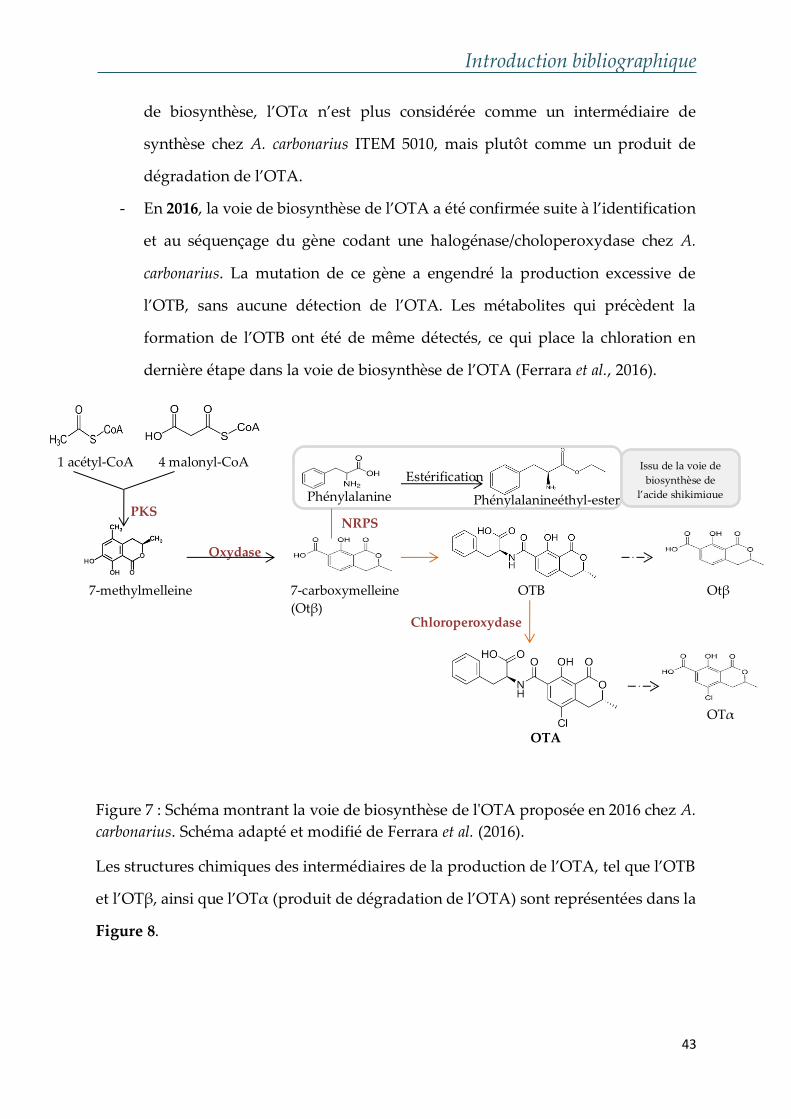
Les structures chimiques des intermédiaires de la production de l’OTA, tel que l’OTB
et l’OTβ, ainsi que l’OTα (produit de dégradation de l’OTA) sont représentées dans la
Figure 8.
1 acétyl-CoA 4 malonyl-CoA
PKS
Oxydase
7-carboxymelleine
(Otβ) 7-methylmelleine
Phénylalanineéthyl-ester Phénylalanine
Estérification Issu de la voie de
biosynthèse de
l’acide shikimique
OTB
NRPS
Chloroperoxydase
OTA
OTα
Otβ
Introduction bibliographique
44
Figure 8 : Structure chimique des métabolites de l'OTA
1. Gènes de la biosynthèse de l’OTA chez A. carbonarius
Les PKS les NRPS ont été identifiées comme étant des enzymes à plusieurs
modules, impliquées dans la biosynthèse des polykétides et des peptides
respectivement, essentielles à la production des métabolites secondaires chez les
champignons filamenteux (Gallo et al., 2013). La chloroperoxydase responsable de
l’ajout d’un atome de chlore présent dans l’OTA a été de même identifié chez plusieurs
souches ochratoxinogènes (Figure 9). Les gènes de biosynthèse de l’OTA chez A.
carbonarius, ainsi que les propriétés des enzymes codées sont représentés dans les
Tableaux 5, 6 et 7.
a. Polykétides Synthases de l’OTA
La famille des polykétides regroupe les métabolites dérivant de la condensation
répétitive des unités d’acétates (-CH2-CO-) par l’intermédiaire des enzymes connues
sous le nom des « polykétides synthases » ou « PKS ».
Tableau 5: Caractéristiques des PKS dans le règne fongique, et chez A. carbonarius
Gène identifié chez
A. carbonarius
acOTApks (PI no. 173482) constitué de 8 063 bp, a été
séquencé en 2014 par (Gallo, Knox et al. 2014).
OT
B
Introduction bibliographique
45
PKS chez
A. carbonarius
Domaines : KS (β-kétosynthase), AT (acyltransférase), DH
(déshydratase), C-Met (C-methyltransférase) responsable
de l’ajout du group méthyle à la molécule de l’OTA.
Le C-terminal contient les domaines ER (enoylréductase),
KR (kétoréductase) et ACP (porteur des précurseurs acyl-
CoA)
Type : PKS hautement réduite ou « HR-PKS »
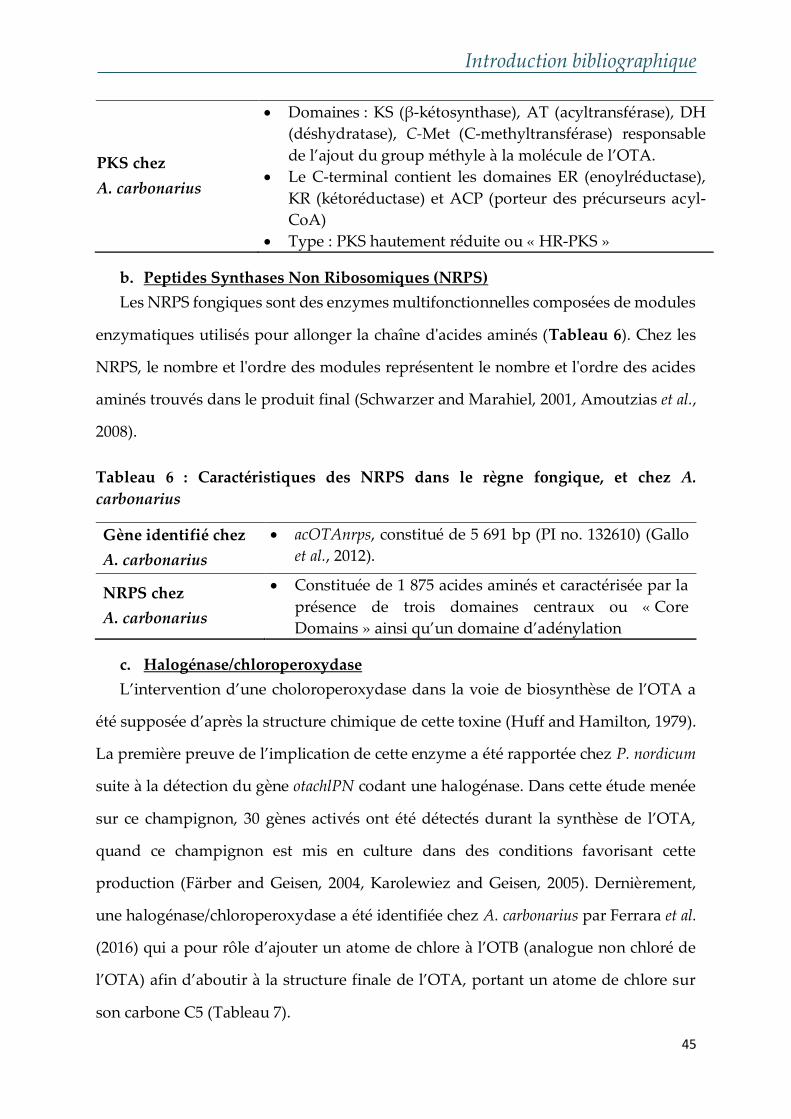
b. Peptides Synthases Non Ribosomiques (NRPS)
Les NRPS fongiques sont des enzymes multifonctionnelles composées de modules
enzymatiques utilisés pour allonger la chaîne d'acides aminés (Tableau 6). Chez les
NRPS, le nombre et l'ordre des modules représentent le nombre et l'ordre des acides
aminés trouvés dans le produit final (Schwarzer and Marahiel, 2001, Amoutzias et al.,
2008).
Tableau 6 : Caractéristiques des NRPS dans le règne fongique, et chez A.
carbonarius
Gène identifié chez
A. carbonarius
acOTAnrps, constitué de 5 691 bp (PI no. 132610) (Gallo
et al., 2012).
NRPS chez
A. carbonarius
Constituée de 1 875 acides aminés et caractérisée par la
présence de trois domaines centraux ou « Core
Domains » ainsi qu’un domaine d’adénylation
c. Halogénase/chloroperoxydase
L’intervention d’une choloroperoxydase dans la voie de biosynthèse de l’OTA a
été supposée d’après la structure chimique de cette toxine (Huff and Hamilton, 1979).
La première preuve de l’implication de cette enzyme a été rapportée chez P. nordicum
suite à la détection du gène otachlPN codant une halogénase. Dans cette étude menée
sur ce champignon, 30 gènes activés ont été détectés durant la synthèse de l’OTA,
quand ce champignon est mis en culture dans des conditions favorisant cette
production (Färber and Geisen, 2004, Karolewiez and Geisen, 2005). Dernièrement,
une halogénase/chloroperoxydase a été identifiée chez A. carbonarius par Ferrara et al.
(2016) qui a pour rôle d’ajouter un atome de chlore à l’OTB (analogue non chloré de
l’OTA) afin d’aboutir à la structure finale de l’OTA, portant un atome de chlore sur
son carbone C5 (Tableau 7).
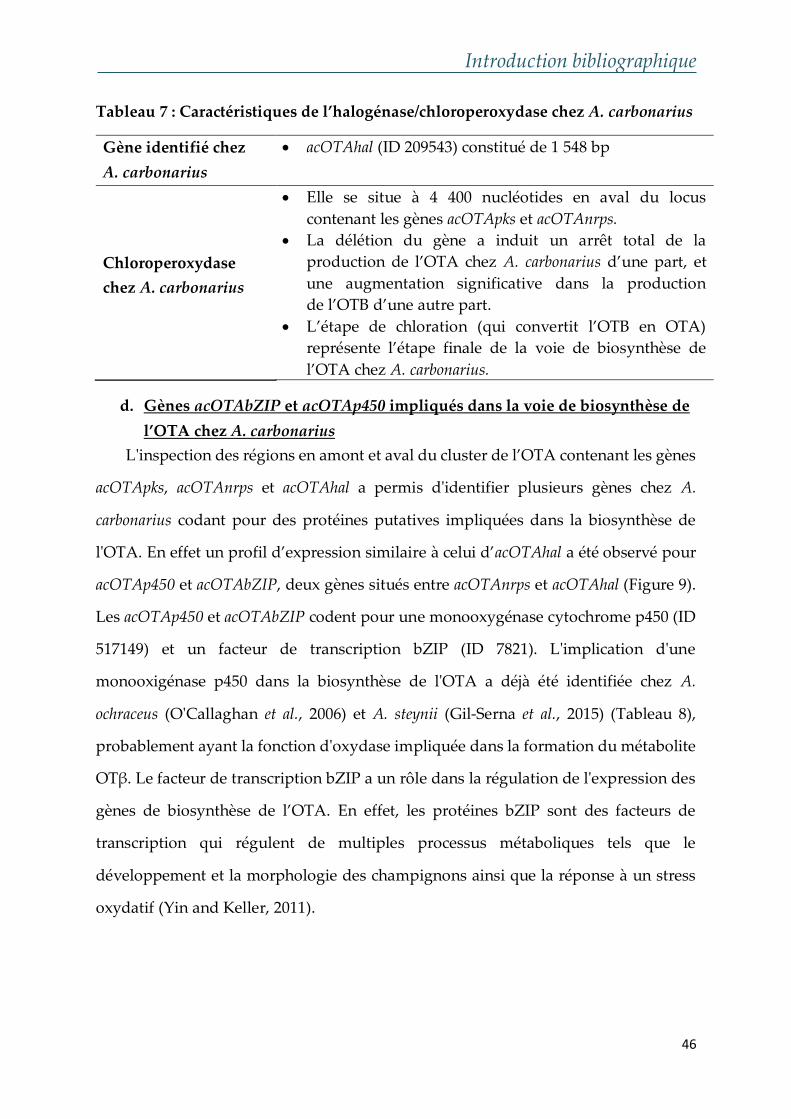
Introduction bibliographique
46
Tableau 7 : Caractéristiques de l’halogénase/chloroperoxydase chez A. carbonarius
Gène identifié chez
A. carbonarius
acOTAhal (ID 209543) constitué de 1 548 bp
Chloroperoxydase
chez A. carbonarius
Elle se situe à 4 400 nucléotides en aval du locus
contenant les gènes acOTApks et acOTAnrps.
La délétion du gène a induit un arrêt total de la
production de l’OTA chez A. carbonarius d’une part, et
une augmentation significative dans la production
de l’OTB d’une autre part.
L’étape de chloration (qui convertit l’OTB en OTA)
représente l’étape finale de la voie de biosynthèse de
l’OTA chez A. carbonarius.
d. Gènes acOTAbZIP et acOTAp450 impliqués dans la voie de biosynthèse de
l’OTA chez A. carbonarius
L'inspection des régions en amont et aval du cluster de l’OTA contenant les gènes
acOTApks, acOTAnrps et acOTAhal a permis d'identifier plusieurs gènes chez A.
carbonarius codant pour des protéines putatives impliquées dans la biosynthèse de
l'OTA. En effet un profil d’expression similaire à celui d’acOTAhal a été observé pour
acOTAp450 et acOTAbZIP, deux gènes situés entre acOTAnrps et acOTAhal (Figure 9).
Les acOTAp450 et acOTAbZIP codent pour une monooxygénase cytochrome p450 (ID
517149) et un facteur de transcription bZIP (ID 7821). L'implication d'une
monooxigénase p450 dans la biosynthèse de l'OTA a déjà été identifiée chez A.
ochraceus (O'Callaghan et al., 2006) et A. steynii (Gil-Serna et al., 2015) (Tableau 8),
probablement ayant la fonction d'oxydase impliquée dans la formation du métabolite
OTβ. Le facteur de transcription bZIP a un rôle dans la régulation de l'expression des
gènes de biosynthèse de l’OTA. En effet, les protéines bZIP sont des facteurs de
transcription qui régulent de multiples processus métaboliques tels que le
développement et la morphologie des champignons ainsi que la réponse à un stress
oxydatif (Yin and Keller, 2011).
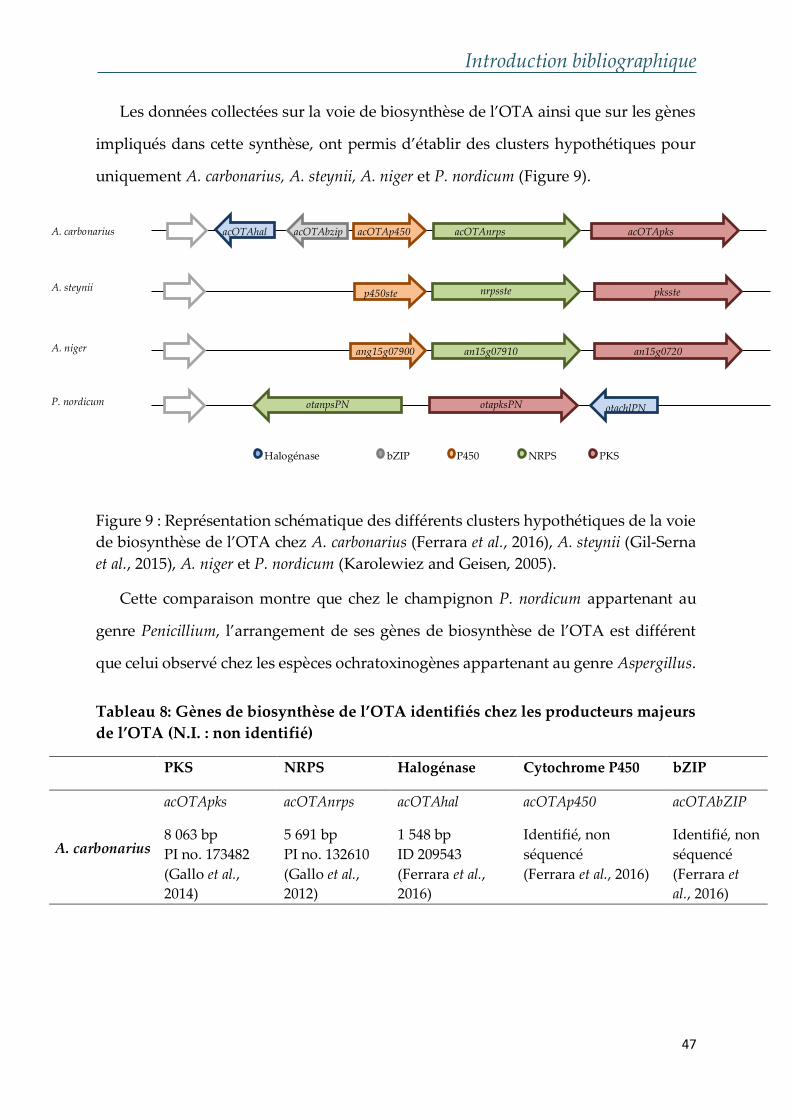
Introduction bibliographique
47
Les données collectées sur la voie de biosynthèse de l’OTA ainsi que sur les gènes
impliqués dans cette synthèse, ont permis d’établir des clusters hypothétiques pour
uniquement A. carbonarius, A. steynii, A. niger et P. nordicum (Figure 9).
Figure 9 : Représentation schématique des différents clusters hypothétiques de la voie
de biosynthèse de l’OTA chez A. carbonarius (Ferrara et al., 2016), A. steynii (Gil-Serna
et al., 2015), A. niger et P. nordicum (Karolewiez and Geisen, 2005).
Cette comparaison montre que chez le champignon P. nordicum appartenant au
genre Penicillium, l’arrangement de ses gènes de biosynthèse de l’OTA est différent
que celui observé chez les espèces ochratoxinogènes appartenant au genre Aspergillus.
Tableau 8: Gènes de biosynthèse de l’OTA identifiés chez les producteurs majeurs
de l’OTA (N.I. : non identifié)
PKS NRPS Halogénase Cytochrome P450 bZIP
A. carbonarius
acOTApks
8 063 bp
PI no. 173482
(Gallo et al.,
2014)
acOTAnrps
5 691 bp
PI no. 132610
(Gallo et al.,
2012)
acOTAhal
1 548 bp
ID 209543
(Ferrara et al.,
2016)
acOTAp450
Identifié, non
séquencé
(Ferrara et al., 2016)
acOTAbZIP
Identifié, non
séquencé
(Ferrara et
al., 2016)
Halogénase bZIP P450 NRPS PKS
A. steynii
A. niger
P. nordicum
A. carbonarius acOTAhal acOTAbzip acOTAp450 acOTAnrps acOTApks
p450ste nrpsste pksste
ang15g07900 an15g07910 an15g0720
otanpsPN otapksPN otachlPN
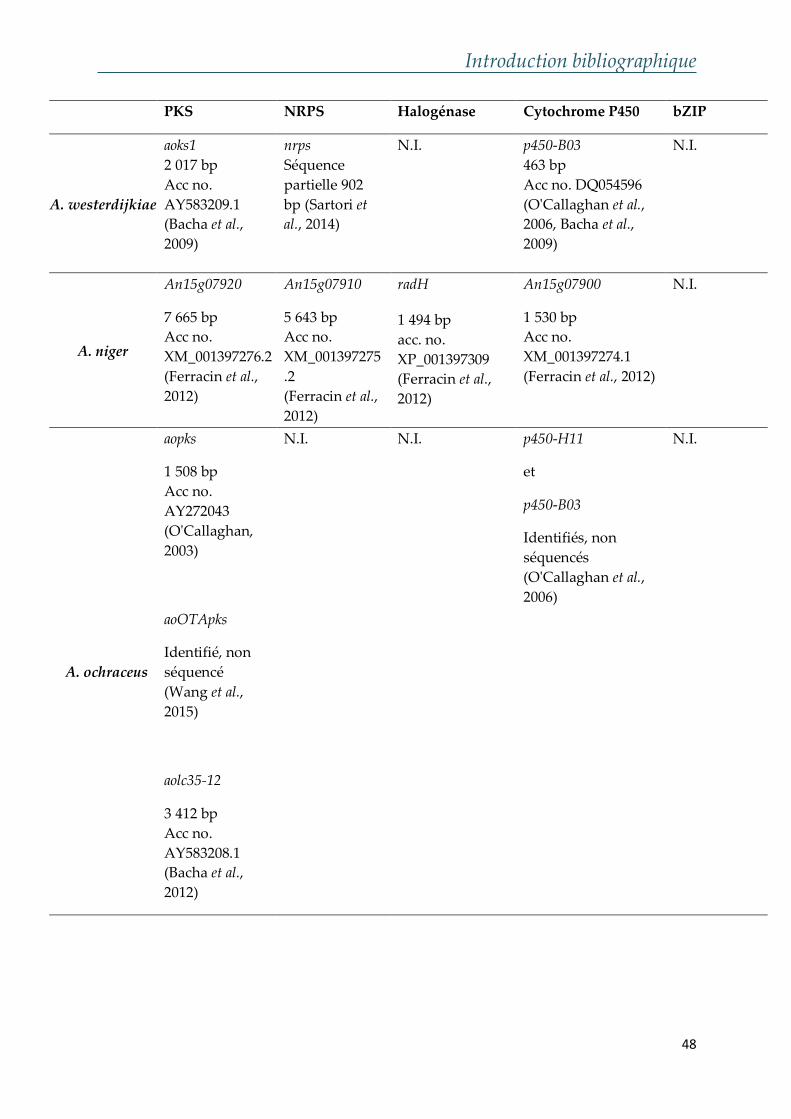
Introduction bibliographique
48
PKS NRPS Halogénase Cytochrome P450 bZIP
A. westerdijkiae
aoks1
2 017 bp
Acc no.
AY583209.1
(Bacha et al.,
2009)
nrps
Séquence
partielle 902
bp (Sartori et
al., 2014)
N.I. p450-B03
463 bp
Acc no. DQ054596
(O'Callaghan et al.,
2006, Bacha et al.,
2009)
N.I.
A. niger
An15g07920
7 665 bp
Acc no.
XM_001397276.2
(Ferracin et al.,
2012)
An15g07910
5 643 bp
Acc no.
XM_001397275
.2
(Ferracin et al.,
2012)
radH
1 494 bp
acc. no.
XP_001397309
(Ferracin et al.,
2012)
An15g07900
1 530 bp
Acc no.
XM_001397274.1
(Ferracin et al., 2012)
N.I.
A. ochraceus
aopks
1 508 bp
Acc no.
AY272043
(O'Callaghan,
2003)
aoOTApks
Identifié, non
séquencé
(Wang et al.,
2015)
aolc35-12
3 412 bp
Acc no.
AY583208.1
(Bacha et al.,
2012)
N.I. N.I. p450-H11
et
p450-B03
Identifiés, non
séquencés
(O'Callaghan et al.,
2006)
N.I.
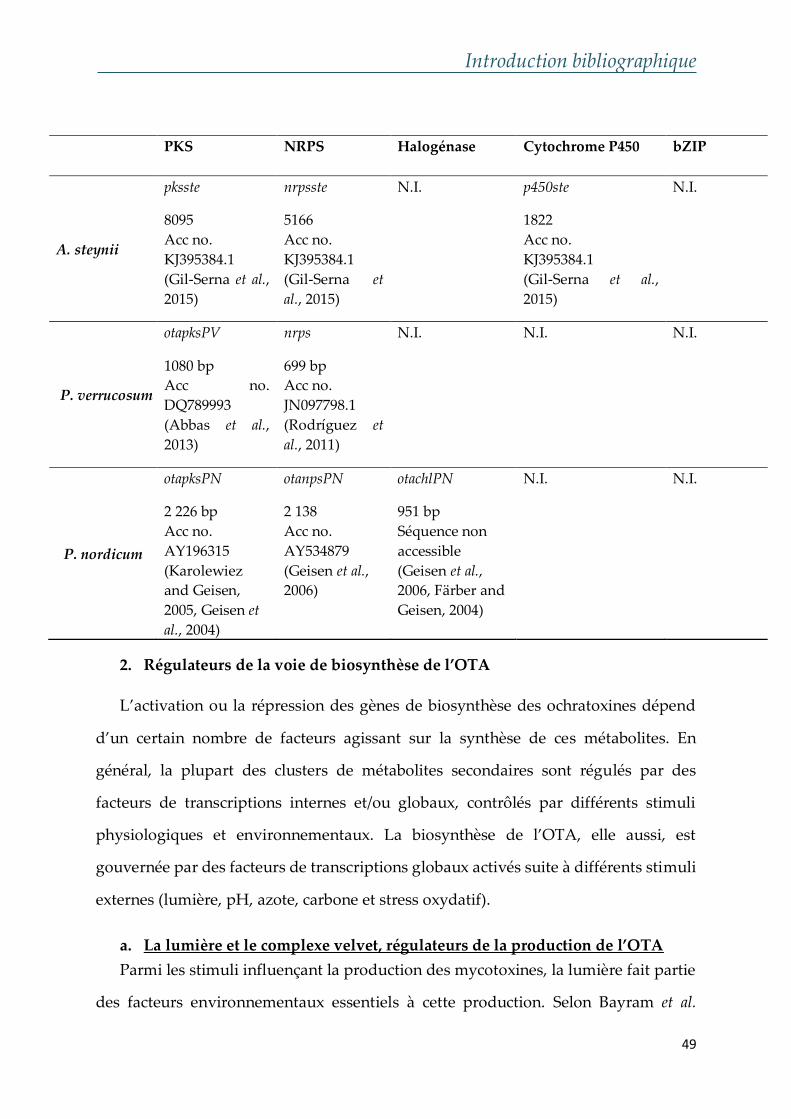
Introduction bibliographique
49
PKS NRPS Halogénase Cytochrome P450 bZIP
A. steynii
pksste
8095
Acc no.
KJ395384.1
(Gil-Serna et al.,
2015)
nrpsste
5166
Acc no.
KJ395384.1
(Gil-Serna et
al., 2015)
N.I. p450ste
1822
Acc no.
KJ395384.1
(Gil-Serna et al.,
2015)
N.I.
P. verrucosum
otapksPV
1080 bp
Acc no.
DQ789993
(Abbas et al.,
2013)
nrps
699 bp
Acc no.
JN097798.1
(Rodríguez et
al., 2011)
N.I. N.I. N.I.
P. nordicum
otapksPN
2 226 bp
Acc no.
AY196315
(Karolewiez
and Geisen,
2005, Geisen et
al., 2004)
otanpsPN
2 138
Acc no.
AY534879
(Geisen et al.,
2006)
otachlPN
951 bp
Séquence non
accessible
(Geisen et al.,
2006, Färber and
Geisen, 2004)
N.I. N.I.
2. Régulateurs de la voie de biosynthèse de l’OTA
L’activation ou la répression des gènes de biosynthèse des ochratoxines dépend
d’un certain nombre de facteurs agissant sur la synthèse de ces métabolites. En
général, la plupart des clusters de métabolites secondaires sont régulés par des
facteurs de transcriptions internes et/ou globaux, contrôlés par différents stimuli
physiologiques et environnementaux. La biosynthèse de l’OTA, elle aussi, est
gouvernée par des facteurs de transcriptions globaux activés suite à différents stimuli
externes (lumière, pH, azote, carbone et stress oxydatif).
a. La lumière et le complexe velvet, régulateurs de la production de l’OTA
Parmi les stimuli influençant la production des mycotoxines, la lumière fait partie
des facteurs environnementaux essentiels à cette production. Selon Bayram et al.
Introduction bibliographique
50
(2008), la présence ou l’absence de la lumière induit une différentiation
morphologique des champignons, et c’est seulement en l’absence de la lumière que
les moisissures produisent des métabolites secondaires. La formation des conidies, la
croissance mycéliale et la production de l’OTA peuvent être influencées par la lumière
blanche et l’U.V chez A. ochraceus et A. niger. En fait, la lumière rouge (λ = 627 nm) et
la lumière bleue (455<λ<470 nm) induisent une inhibition de la croissance fongique et
de la production de l’OTA (Fanelli et al., 2012, Schmidt-Heydt et al., 2011b, Aziz and
Moussa, 1997). Afin de mieux comprendre ce phénomène, un complexe velvet
« VelB/VeA/LaeA » a été largement décrit, contenant des domaines conservés tout au
long du règne fongique (Bayram and Braus, 2012). Ce complexe est localisé
principalement dans le noyau en absence de lumière (Bayram et al., 2008). En présence
de lumière, le VeA est localisé dans le cytoplasme et le VelB favorise la formation de
spores asexuées. En obscurité, le complexe VelB / VeA est transporté vers le noyau et
provoque une augmentation de l'activité du LaeA, un régulateur épigénétique
principal pour le métabolisme secondaire dans le genre Aspergillus (Figure 10) (Bok
and Keller, 2004).
Quant aux gènes de régulation, veA et laeA chez A. carbonarius ont été identifiés en
2013 par Crespo-Sempere et al. (2013). Ces gènes codent respectivement pour deux
protéines appelées VeA (PI no. 202676) et LaeA (PI no. 5941). En effet, suite à
l’inactivation de ces gènes chez A. carbonarius, la croissance végétative est touchée
d’une manière non significative, cependant, une réduction significative dans la
production des conidies est remarquée (Crespo-Sempere et al., 2013). En d’autres
termes, la production des conidies a augmenté en présence de lumière chez A.
carbonarius, tandis que la production de l’OTA est significativement amplifiée en
obscurité. Malgré les taux de production variés, suite à la présence ou l’absence de
lumière, les niveaux de transcription du veA et du laeA demeurent les mêmes,
indépendamment du stimulus lumineux, ce qui signifie que la production de l’OTA
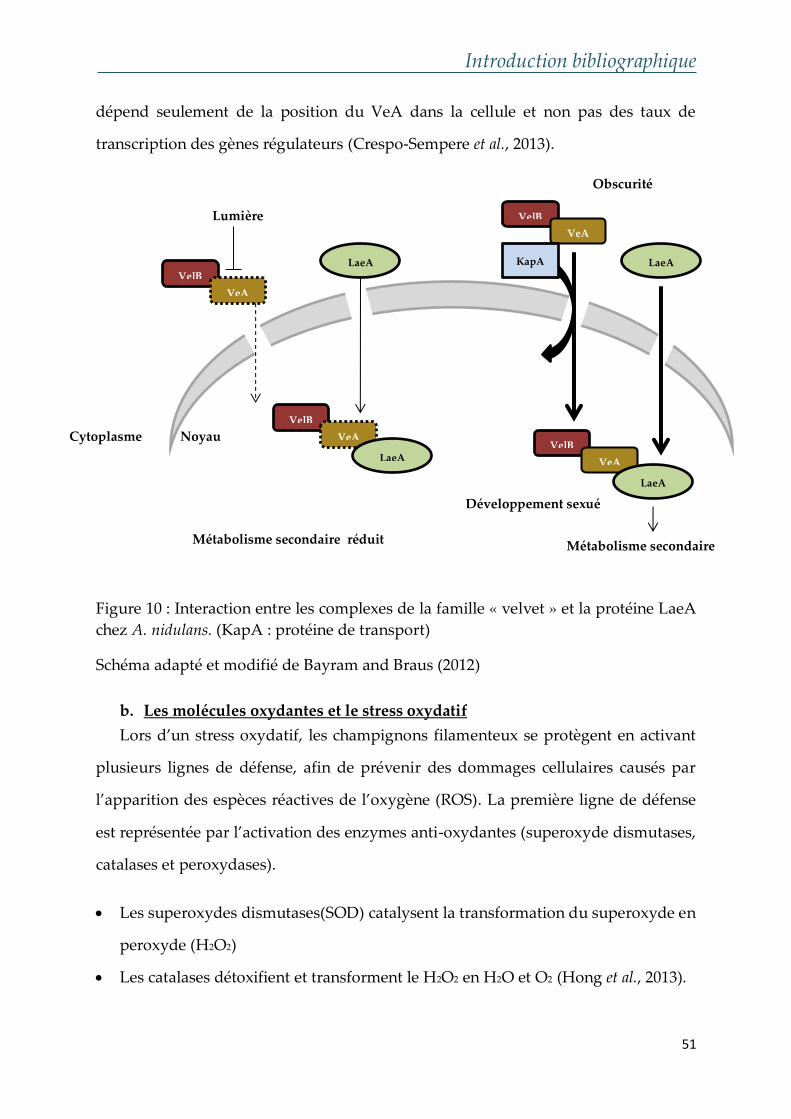
Introduction bibliographique
51
dépend seulement de la position du VeA dans la cellule et non pas des taux de
transcription des gènes régulateurs (Crespo-Sempere et al., 2013).
Figure 10 : Interaction entre les complexes de la famille « velvet » et la protéine LaeA
chez A. nidulans. (KapA : protéine de transport)
Schéma adapté et modifié de Bayram and Braus (2012)
b. Les molécules oxydantes et le stress oxydatif
Lors d’un stress oxydatif, les champignons filamenteux se protègent en activant
plusieurs lignes de défense, afin de prévenir des dommages cellulaires causés par
l’apparition des espèces réactives de l’oxygène (ROS). La première ligne de défense
est représentée par l’activation des enzymes anti-oxydantes (superoxyde dismutases,
catalases et peroxydases).
Les superoxydes dismutases(SOD) catalysent la transformation du superoxyde en
peroxyde (H2O2)
Les catalases détoxifient et transforment le H2O2 en H2O et O2 (Hong et al., 2013).
VelB
VeA
Lumière
VelB
VeA
LaeA
LaeA
VelB
VeA
LaeA
VelB
VeA
KapA LaeA
Développement sexué
Métabolisme secondaire Métabolisme secondaire réduit
Noyau Cytoplasme
Obscurité
Introduction bibliographique
52
Les peroxiredoxines (PRX), agissent comme des peroxydases cellulaires ayant un
rôle protecteur des protéines contre les ROS (Rhee et al., 2012).
Une modulation dans l’expression des sod et prx chez A. carbonarius est observée
suite à un ajout des antioxydants (BHT et catéchine). En effet, une concentration de 2.5
mmol/L de BHT induit une réduction dans l’expression de ces gènes suivie d’une
diminution des taux d’OTA. Cependant, l’emploi des concentrations supérieures à 2.5
mmol/L de BHT provoque une augmentation des ROS dans le milieu de culture, ce
qui induit une production élevée de l’OTA (Crespo-Sempere et al., 2016).
D’autres mécanismes sont de même impliqués dans la régulation de la synthèse
des mycotoxines tels que les récepteurs liés au stress oxydatif. Ces récepteurs peuvent
transmettre le "message oxydatif" vers le noyau et favoriser un changement de
transcription visant à restaurer l'équilibre redox correct dans la cellule. Par exemple la
production des ochratoxines et des aflatoxines est régulée par le facteur de
transcription du stress oxydatif « Yap-1 » (Reverberi et al., 2012, Reverberi et al., 2007).
Chez A. parasiticus, la délétion du gène ApyapA (un homologue du Yap-1 présent chez
les levures) désactive la capacité du champignon à rétablir l'équilibre redox correct
dans la cellule. Par la suite, le métabolisme secondaire et la synthèse des aflatoxines
sont déclenchés. De même, l'hypothèse de l’implication du stress oxydatif dans la
régulation de la synthèse de l'OTA chez A. ochraceus a été confirmée suite à par la
rupture du gène AyloxA, codant une lipoxygenase chez ce champignon (Reverberi et
al., 2012). L’inactivation de ce gène induit un changement dans les phénotypes des
colonies et la formation des conidies, une diminution de l’activité de la lipoxygenase,
et une inhibition significative de la production d’OTA chez A. ochraceus. Le stress
oxydatif affecte non seulement la production de cette toxine, mais aussi peut induire
la production de la citrinine à la place de l’OTA, révélant ainsi le phénomène de
« cross-regulation » de la voie de biosynthèse OTA/citrinin chez P. verrucosum
(Schmidt-Heydt et al., 2015).
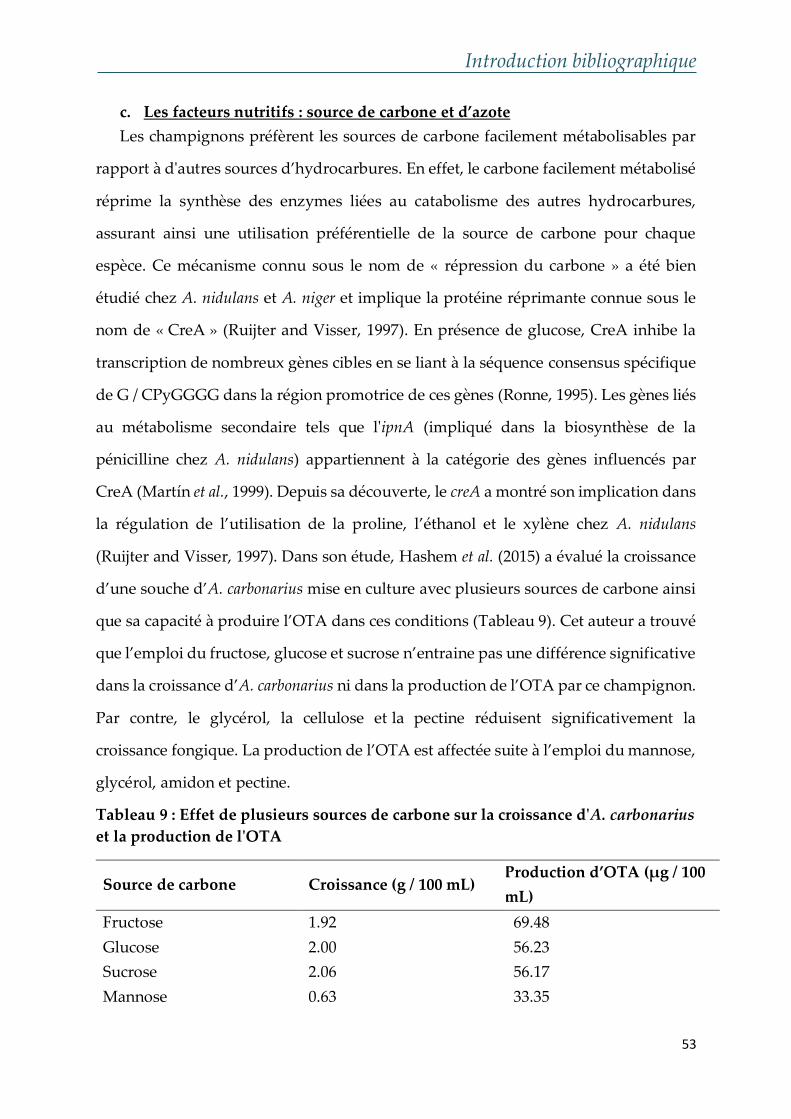
Introduction bibliographique
53
c. Les facteurs nutritifs : source de carbone et d’azote
Les champignons préfèrent les sources de carbone facilement métabolisables par
rapport à d'autres sources d’hydrocarbures. En effet, le carbone facilement métabolisé
réprime la synthèse des enzymes liées au catabolisme des autres hydrocarbures,
assurant ainsi une utilisation préférentielle de la source de carbone pour chaque
espèce. Ce mécanisme connu sous le nom de « répression du carbone » a été bien
étudié chez A. nidulans et A. niger et implique la protéine réprimante connue sous le
nom de « CreA » (Ruijter and Visser, 1997). En présence de glucose, CreA inhibe la
transcription de nombreux gènes cibles en se liant à la séquence consensus spécifique
de G / CPyGGGG dans la région promotrice de ces gènes (Ronne, 1995). Les gènes liés
au métabolisme secondaire tels que l'ipnA (impliqué dans la biosynthèse de la
pénicilline chez A. nidulans) appartiennent à la catégorie des gènes influencés par
CreA (Martín et al., 1999). Depuis sa découverte, le creA a montré son implication dans
la régulation de l’utilisation de la proline, l’éthanol et le xylène chez A. nidulans
(Ruijter and Visser, 1997). Dans son étude, Hashem et al. (2015) a évalué la croissance
d’une souche d’A. carbonarius mise en culture avec plusieurs sources de carbone ainsi
que sa capacité à produire l’OTA dans ces conditions (Tableau 9). Cet auteur a trouvé
que l’emploi du fructose, glucose et sucrose n’entraine pas une différence significative
dans la croissance d’A. carbonarius ni dans la production de l’OTA par ce champignon.
Par contre, le glycérol, la cellulose et la pectine réduisent significativement la
croissance fongique. La production de l’OTA est affectée suite à l’emploi du mannose,
glycérol, amidon et pectine.
Tableau 9 : Effet de plusieurs sources de carbone sur la croissance d'A. carbonarius
et la production de l'OTA
Source de carbone Croissance (g / 100 mL) Production d’OTA (μg / 100
mL)
Fructose 1.92 69.48
Glucose 2.00 56.23
Sucrose 2.06 56.17
Mannose 0.63 33.35
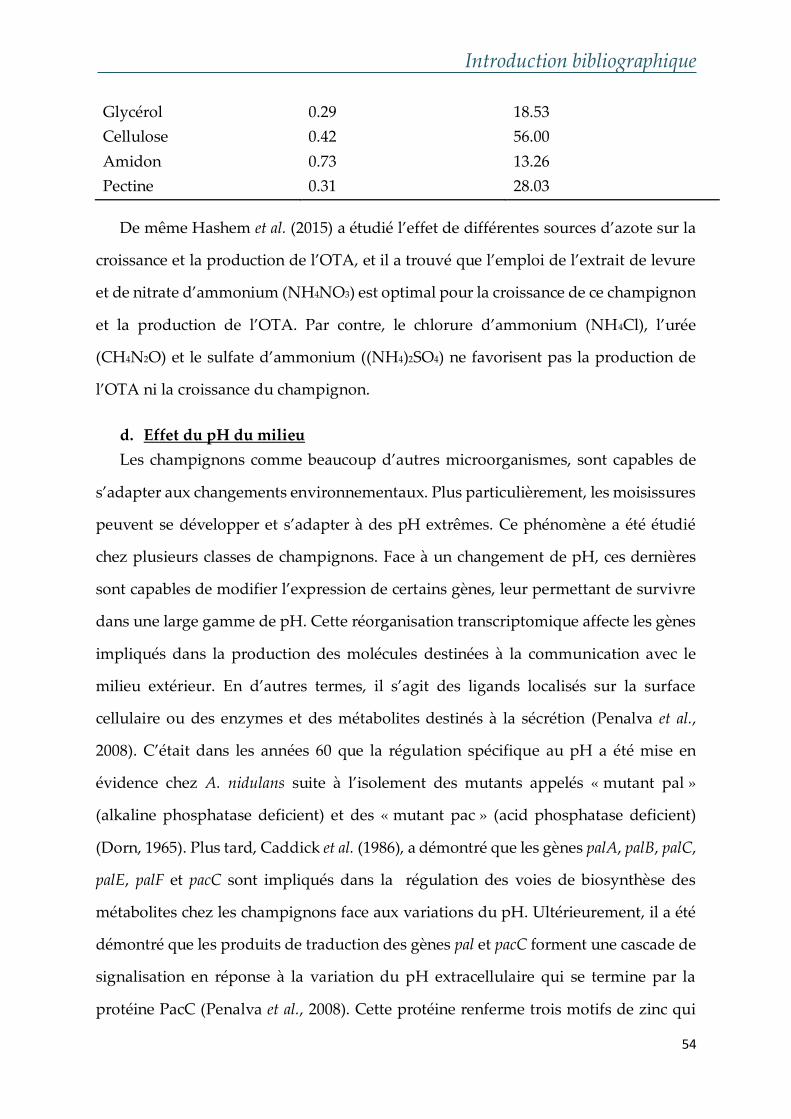
Introduction bibliographique
54
Glycérol 0.29 18.53
Cellulose 0.42 56.00
Amidon 0.73 13.26
Pectine 0.31 28.03
De même Hashem et al. (2015) a étudié l’effet de différentes sources d’azote sur la
croissance et la production de l’OTA, et il a trouvé que l’emploi de l’extrait de levure
et de nitrate d’ammonium (NH4NO3) est optimal pour la croissance de ce champignon
et la production de l’OTA. Par contre, le chlorure d’ammonium (NH4Cl), l’urée
(CH4N2O) et le sulfate d’ammonium ((NH4)2SO4) ne favorisent pas la production de
l’OTA ni la croissance du champignon.
d. Effet du pH du milieu
Les champignons comme beaucoup d’autres microorganismes, sont capables de
s’adapter aux changements environnementaux. Plus particulièrement, les moisissures
peuvent se développer et s’adapter à des pH extrêmes. Ce phénomène a été étudié
chez plusieurs classes de champignons. Face à un changement de pH, ces dernières
sont capables de modifier l’expression de certains gènes, leur permettant de survivre
dans une large gamme de pH. Cette réorganisation transcriptomique affecte les gènes
impliqués dans la production des molécules destinées à la communication avec le
milieu extérieur. En d’autres termes, il s’agit des ligands localisés sur la surface
cellulaire ou des enzymes et des métabolites destinés à la sécrétion (Penalva et al.,
2008). C’était dans les années 60 que la régulation spécifique au pH a été mise en
évidence chez A. nidulans suite à l’isolement des mutants appelés « mutant pal »
(alkaline phosphatase deficient) et des « mutant pac » (acid phosphatase deficient)
(Dorn, 1965). Plus tard, Caddick et al. (1986), a démontré que les gènes palA, palB, palC,
palE, palF et pacC sont impliqués dans la régulation des voies de biosynthèse des
métabolites chez les champignons face aux variations du pH. Ultérieurement, il a été
démontré que les produits de traduction des gènes pal et pacC forment une cascade de
signalisation en réponse à la variation du pH extracellulaire qui se termine par la
protéine PacC (Penalva et al., 2008). Cette protéine renferme trois motifs de zinc qui
Introduction bibliographique
55
s’attachent à la séquence consensus « 5’-GCCARG » de la région promotrice de gènes
chez A. nidulans (Tilburn et al., 1995, Espeso et al., 1997).
Plus particulièrement, chez A. nidulans et A. parasiticus, la production de la
stérigmatocystine et de l’aflatoxine respectivement a été régulée par le « PacC » pour
différentes valeurs de pH (Keller et al., 1997). Ainsi, le pH acide (4-6) induit une
expression précoce des gènes stcU chez A. nidulans et ver-1 chez A. parasiticus
comparée à celle en pH basique ou neutre, ce qui induit une production importante
de stérigmatocystine et d’aflatoxine respectivement. Cependant, chez A. ochraceus et
A. carbonarius, la variation du pH du milieu semble avoir un effet non significatif sur
la production de l’OTA, comparé à celui de l’activité de l’eau et la température
(Kapetanakou et al., 2009). Ce fait peut être dû à l’absence du site de liaison PacC dans
la région promotrice du gène pks chez A. carbonarius. En effet, dans son étude sur la
régulation de la production de l’OTA par des stimulus externes, Thomas B.T. (2015) a
trouvé que ce site n’était présent que chez 4 isolats parmi 18 souches d’Aspergillus
appartenant à la section Nigri et productrices d’OTA. Cette observation pourrait être
la raison pour laquelle le pH n’est pas considéré comme un facteur important dans la
régulation de la production de l’OTA chez les champignons appartenant à la section
Nigri, plus particulièrement A. carbonarius.
e. Stress osmotique
A. carbonarius produit généralement des quantités élevées d'OTA, comparées à
celles produites par P. nordicum. En revanche, P. verrucosum ne produit généralement
que des quantités modérées d'OTA par rapport à P. nordicum. En fait, la production
d'OTA par le genre Penicillium dépend fortement des conditions environnementales
telles que les stress osmotique et oxydatif. Effectivement, P. verrucosum est capable de
produire la citrinine (métabolite secondaire) au lieu de l’OTA suite à un stress oxydatif
(Schmidt-Heydt et al., 2011a), alors que dans un stress osmotique (taux élevé de NaCl)
la production de citrinine est déplacée vers l'OTA (Schmidt-Heydt et al., 2012). La
biosynthèse et l'excrétion de l'OTA (qui porte un chlore dans sa molécule), peuvent
Introduction bibliographique
56
être considérées comme une sorte d'adaptation aux environnements riches en NaCl.
La production excessive de l’OTA dans un milieu riche en NaCl par le genre
Penicillium est considéré comme un moyen de transport du chlore hors de la cellule,
afin d’assurer une certaine homéostasie, favorisant ainsi la survie de ces champignons
dans de telles conditions (Schmidt-Heydt et al., 2012).
Contrairement aux deux Penicillium, A. carbonarius n'a jamais été trouvé dans des
environnements riches en NaCl. Ceci indique que ce dernier n'est pas adapté à ce type
d’habitat. Les changements dans l'osmolarité du milieu (causés par le NaCl ou les
sucres), sont habituellement transmis au niveau transcriptionnel par l’intermédiaire
de cascades de signaux. Les champignons ont diverses cascades de signaux, qui sont
activées par différents signaux externes (Rispail et al., 2009). La cascade de signaux
activée par l’osmolarité élevée, est connue sous le nom « HOG » (High Osmolarity
Glycérol) (Rispail et al., 2009). Cette dernière est composée d'un récepteur sensible aux
changements d’osmolarité externes, situé au niveau de la membrane et qui transmet
le signal vers un ensemble de trois protéines kinases consécutives (MAP kinases), dont
la dernière est la protéine kinase HOG (Rispail et al., 2009). La forme phosphorylée de
cette kinase est la forme active et peut activer les facteurs de transcription en aval par
phosphorylation. Ce mécanisme d’adaptation favorise la production continue d'OTA
qui assure la viabilité de l'organisme producteur dans des environnements riches en
NaCl. Le mécanisme devrait théoriquement être présent chez tous les organismes
producteurs de cette toxine. Cependant, ce n’est pas le cas pour A. carbonarius, qui a
perdu drastiquement sa capacité de biosynthèse de l’OTA ainsi que son pouvoir de
croissance quand il est mis en culture dans un milieu supplémenté de 40 g/L de NaCl
(Stoll et al., 2013). Cela peut être dû au fait que la phosphorylation et l'activation de la
biosynthèse de l'OTA ne sont pas apparemment couplées chez ce champignon. Ainsi,
suite à un stress osmotique causé par le NaCl, A. carbonarius semble avoir des
difficultés à s’adapter et produire l’OTA dans ces conditions de vie (Stoll et al., 2013).
Introduction bibliographique
57
B. VII. Moyens de lutte contre l’OTA
Prévenir la production de l’OTA est devenue une des préoccupations majeures
afin de protéger les consommateurs de ses risques délétères sur leur santé. Les dégâts
économiques de l’OTA ainsi que ses effets néfastes sur la santé publique ont incité les
scientifiques à trouver des moyens de préventions contre l’apparition de cette toxine
aux champs, ainsi que des moyens de détoxification de l’OTA des denrées
alimentaires (Rustom, 1997). En effet l’efficacité de ces deux techniques dépend
amplement de la méthode utilisée, le moment d’emploi (avant ou après la récolte) et
surtout du type de champignons responsables de sa production (Kabak et al., 2006).
Les processus de décontamination ainsi que la prévention de l’occurrence de l’OTA
doivent répondre aux critères suivants (Kabak et al., 2006) :
(1) Destruction, inactivation ou élimination de l’OTA
(2) Aucun résidu toxique, carcinogène ou mutagène ne doit apparaître dans les
denrées alimentaires traitées
(3) Préserver les propriétés physico-chimiques et sensorielles du produit
(4) Techniquement et économiquement faisable
Ces stratégies peuvent viser soit à limiter le développement fongique (approche
préventive), soit agir sur la toxine même afin de l’éliminer ou réduire sa disponibilité
(approche curative). Dans le premier cas, l’intervention se fait en général au champ ou
dans les silos de stockage afin de mieux contrôler l’infection fongique. Quant à la
décontamination des substrats de la toxine, l’intervention se fait après la récolte afin
de réduire sa disponibilité en limitant son adsorption par les organismes
consommateurs.
1. Les bonnes pratiques agricoles
a. Avant et durant la récolte
Afin de limiter l’apparition d’A. carbonarius et d’autres champignons
ochratoxinogènes, il faut tout d’abord adopter des bonnes pratiques agricoles dans le
Introduction bibliographique
58
but de défavoriser la dispersion des spores fongiques qui peuvent être présentes dans
le sol. Ces pratiques se basent sur la préparation et la fertilisation du sol avant la
semée, le désherbage et la rotation des cultures (FAO-WHO, 2013, Magan et al., 2004).
A l’heure actuelle, des nouvelles stratégies prometteuses impliquant des méthodes de
biotechnologie modernes sont à l’étude (Amézqueta et al., 2009). Ces nouvelles
approches pourront être efficaces contre cette problématique, qui consiste en
l’utilisation des agents bio-compétitifs non toxinogènes comme des souches d’A. niger
non productrices d’OTA sur les cultures aux champs (Valero et al., 2007). Cependant,
cette stratégie reste problématique vue la possibilité de recombinaison de ces souches
avec d’autres souches toxinogènes (Norred, 1999).
Pour prévenir la contamination des grains de café, de céréales et de baies de raisin
durant la récolte, il faut tout d’abord s’assurer de la propreté et de la bonne
performance de l’équipement agricole et effectuer la récolte quand la teneur en eau
des plantes atteint son optimal pour générer le minimum de dommages mécaniques
au produit (Joint FAO/WHO Codex Alimentarius, 2003). De même, il faut (1) se
débarrasser des grains souillés tombés par terre, afin de prévenir le transport des
spores de ces derniers vers les nouveaux fruits récoltés ; (2) La période de récolte joue
également un rôle essentiel dans la prévention du développement fongique. Il est
recommandé de récolter juste après que la maturité physiologique soit atteinte afin de
limiter la contamination par l’OTA et (3) éviter tout contact entre le sol et les fruits
semés (FAO, 2009, Bucheli and Taniwaki, 2002).
b. Les conditions de stockage après la récolte
Même si les pratiques agricoles appliquées aux champs et au moment de la récolte
sont indispensables à la limitation de la contamination des produits agricoles par des
champignons ochratoxinogènes, les conditions de stockage demeurent primordiales
afin de limiter et prévenir la production des toxines puisque cette période peut offrir
des conditions optimales pour cette production (Température, humidité et absence de
lumière) (Norred, 1999). Il a même été suggéré que les grains de café sont rarement
Introduction bibliographique
59
contaminés en OTA durant la période de récolte, et que c’est pendant le stockage et
le séchage que la production de l’OTA est déclenchée, surtout si ce processus est
réalisé dans des conditions tropicales humides (Bucheli and Taniwaki, 2002). De ce
fait, pour limiter ce risque de contamination, il est recommandé de (1) sécher les grains
uniquement en couche minces (3 à 5 cm de profondeur) ; (2) faire tourner la semence
régulièrement pendant la journée afin d’aérer les grains ; (3) éviter leur
réhumidification qui favorise la croissance rapide des champignons et la possibilité
de production d’OTA, surtout pour les graines de cacao et de café du à leur
hygroscopicité (FAO, 2009, Magan and Aldred, 2005) ; (4) garder les produits en
stockage qui ont subi un séchage complet et ayant un aw = 0.70 ; (5) maintenir une
température de 20 °C pour le stockage des produits emballés et de 2 à 3 °C pour ceux
qui ne le sont pas (Figure 11) (Joint FAO/WHO Codex Alimentarius, 2003, Bucheli and
Taniwaki, 2002) . En plus, le stockage des grains doit avoir lieu dans un endroit propre,
sec et à l’abri des infestations d’insectes. Des inspections régulières doivent être aussi
effectuées sur les grains en stockages afin de détecter le plus tôt possible le
développement fongique et limiter son extension.
La démarche HACCP (Hazard Analysis of Critical Control Points) est un système
d’identification, d’évaluation et de contrôle des dangers significatifs pour la sécurité
des aliments. Il s’agit d’une approche structurée et systématique pour le contrôle
sanitaire des denrées alimentaires. En effet, deux projets ont eu pour but de mettre en
œuvre les systèmes HACCP afin de contrôler l’OTA dans les céréales (OTAP PREV)
et le café (Norred, 1999, Olsen et al., 2003). Les points critiques de contrôle contre la
contamination en OTA se situent plutôt dans la période de récolte, le séchage et le
stockage des produits agricoles.
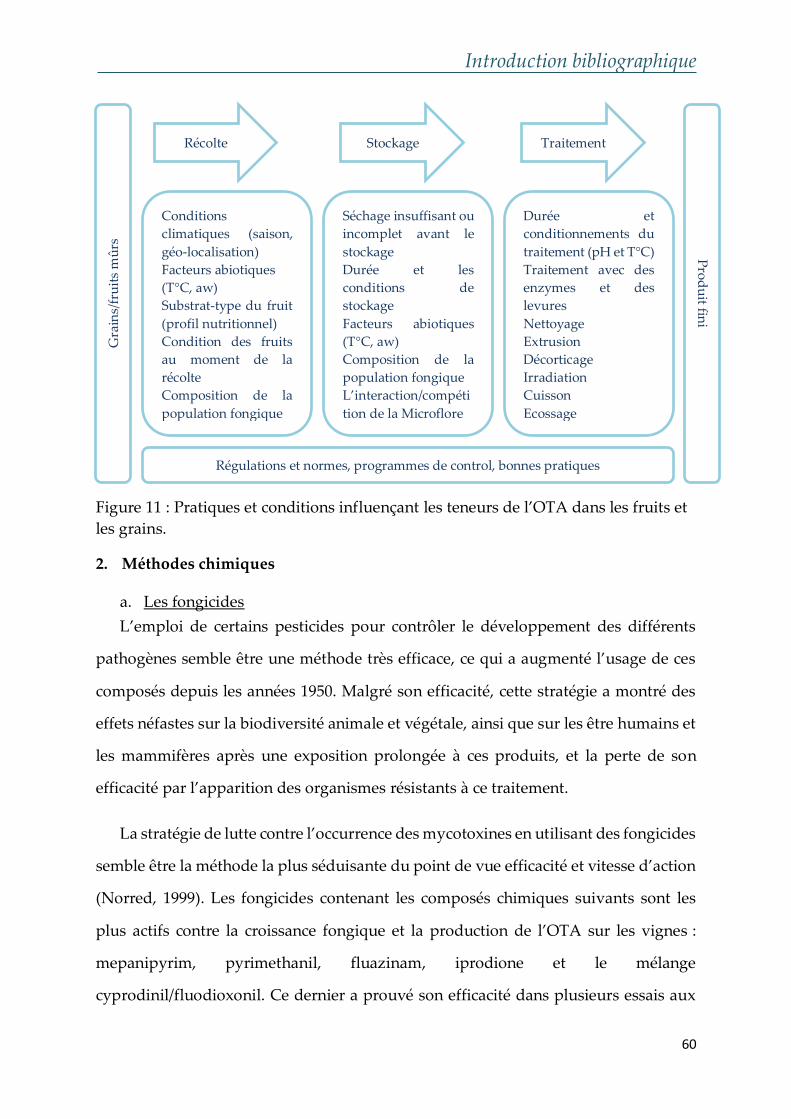
Introduction bibliographique
60
Figure 11 : Pratiques et conditions influençant les teneurs de l’OTA dans les fruits et
les grains.
2. Méthodes chimiques
a. Les fongicides
L’emploi de certains pesticides pour contrôler le développement des différents
pathogènes semble être une méthode très efficace, ce qui a augmenté l’usage de ces
composés depuis les années 1950. Malgré son efficacité, cette stratégie a montré des
effets néfastes sur la biodiversité animale et végétale, ainsi que sur les être humains et
les mammifères après une exposition prolongée à ces produits, et la perte de son
efficacité par l’apparition des organismes résistants à ce traitement.
La stratégie de lutte contre l’occurrence des mycotoxines en utilisant des fongicides
semble être la méthode la plus séduisante du point de vue efficacité et vitesse d’action
(Norred, 1999). Les fongicides contenant les composés chimiques suivants sont les
plus actifs contre la croissance fongique et la production de l’OTA sur les vignes :
mepanipyrim, pyrimethanil, fluazinam, iprodione et le mélange
cyprodinil/fluodioxonil. Ce dernier a prouvé son efficacité dans plusieurs essais aux
Gra
ins/
fru
its
mû
rs
Récolte Stockage Traitement
Conditions
climatiques (saison,
géo-localisation)
Facteurs abiotiques
(T°C, aw)
Substrat-type du fruit
(profil nutritionnel)
Condition des fruits
au moment de la
récolte
Composition de la
population fongique
• L’interaction/
Séchage insuffisant ou
incomplet avant le
stockage
Durée et les
conditions de
stockage
Facteurs abiotiques
(T°C, aw)
Composition de la
population fongique
L’interaction/compéti
tion de la Microflore
Durée et
conditionnements du
traitement (pH et T°C)
Traitement avec des
enzymes et des
levures
Nettoyage
Extrusion
Décorticage
Irradiation
Cuisson
Ecossage
Pro
du
it fini
Régulations et normes, programmes de control, bonnes pratiques
Introduction bibliographique
61
champs, réalisés dans plusieurs pays Méditerranéens, dont la France, l’Espagne, la
Grène et l’Italie (Tjamos et al., 2004, Belli et al., 2007). Dans les régions présentant des
risques élevés, un traitement antérieur à la véraison est essentiel afin de lutter au
maximum contre la contamination des produits cultivés, préférablement 21 jours
avant la récolte. Cependant, l’application de certains fongicides peut induire une
augmentation des taux d’OTA même s’ils sont capables de réduire la croissance
fongique. A titre d’exemple, les fongicides comme le Carbendazim et le Clorus, qui
ont inhibé la croissance d’A. carbonarius d’une part, ont induit une augmentation de la
production de l’OTA d’une autre part (Medina et al., 2007).
Néanmoins, l’usage des fongicides qui dépasse les normes recommandées
provoque des dégâts environnementaux et sanitaires vis-à-vis de la sécurité
alimentaire et la santé des organismes consommateurs. Blair (1989) a déclaré qu’une
substance chimique modérément inoffensive à de faibles doses, pourra devenir
toxique à de plus fortes doses. Ainsi, la toxicité aiguë des fongicides envers les êtres
humains est faible, causant des dermatites allergiques et des irritations de la peau et
des muqueuses (Schneider and Dickert, 1994). Quant à la toxicité chronique de ces
produits, leurs conséquences sur la santé pourront être graves (effets carcinogènes et
mutagènes) suite à une exposition prolongée. De plus, de fortes doses de ces
fongicides utilisés en agriculture peuvent induire une toxicité cutanée, des dermatites,
des démangeaisons, des allergies et des brûlures (Schneider and Dickert, 1994,
Gocmen et al., 1985, Larsen et al., 1990). Par conséquent, l’Union Européen a mis des
restrictions, limitant ainsi l’utilisation des fongicides vu leurs effets néfastes sur la
santé publique et l’environnement (De Costa and Bezerra, 2009).
b. Procédés chimiques de dégradation de l’OTA
La stratégie de détoxification des denrées alimentaires de l’OTA par des moyens
chimiques se base sur l’utilisation des composés chimiques capables de transformer
cette toxine en d’autres métabolites. Les méthodes les plus connues sont
Introduction bibliographique
62
l’ammonisation, l’hydrolyse alcaline, l’ozonation, de même que l’utilisation des
bisulfites, des acides et des agents oxydants.
Effectivement, l’ammonisation a été adoptée par plusieurs pays grâce à sa capacité
à décomposer complètement l’OTA présent dans le maïs, le blé et l’orge (Joint, 2001,
Bhatnagar et al., 2003). Même si cette technique n’a pas abouti à la formation et
l’accumulation des produits secondaires toxiques, son utilisation altère la nature
organoleptique des denrées alimentaires traitées (brunissement des céréales, perte de
lysine et d’autres acides aminés) (Joint, 2001, Varga et al., 1996, Huff and Hamilton,
1979). Par conséquent, de nos jours, son utilisation n’est plus recommandée vue ses
effets secondaires sur la qualité des aliments traités (Joint, 2001).
En plus, l’hydrolyse alcaline par le peroxyde d’hydrogène (H2O2) et l’hydroxyde
de sodium (NaOH) peuvent également décomposer l’OTA. Cependant leur
application in vivo demeure impossible vue leurs effets indésirables sur la qualité
sensorielle et nutritionnelle des substrats (Joint, 2001).
Une durée de 15 sec de traitement par ozonation (10% O3), diminue les niveaux
d’OTA présents dans les noisettes et les végétaux jusqu’à des seuils non détectables
par HPLC (Assante et al., 1977).
Les acides formique, propionique et sorbique ainsi que l’hypochlorite de sodium
dégradent l’OTA après 3 à 24h d’incubation (Joint, 2001, Krohn et al., 1997). Même si
ces composés chimiques diminuent les teneurs en OTA dans les matrices alimentaires,
leur utilisation sur les produits destinés à la consommation humaine est interdite par
l’Union Européen (Commision, 2006).
3. Méthodes Physiques
Les méthodes physiques de détoxification consistent au nettoyage, au tri
mécanique ainsi qu’à l’irradiation afin d’éliminer les fractions contaminées de
l’aliment.
Introduction bibliographique
63
Tout d’abord, le nettoyage commence par un écossage, un épluchage et une
élimination des particules de poussière des grains récoltés. Ensuite, le produit nettoyé
passe au tri mécanique qui sépare les grains contaminés des grains sains.
Concernant le traitement thermique, l’OTA est une molécule thermiquement
stable qui peut survivre aux transformations des aliments, notamment le rôtissage,
brassage et la cuisson jusqu’à une certaine limite (Krogh et al., 1974, Scott, 1996). Ainsi,
une température de 100 °C ne réduit que 50% l’OTA contaminant le blé même après
10 heures de cuisson (Boudra et al., 1995).
La congélation (-20 °C) et décongélation (26 °C), les traitements par les rayons UV
ainsi que l’irradiation-γ peuvent détruire les conidies des champignons filamenteux,
mais seule l’irradiation-γ est capable de détruire l’OTA (une dose de 10.0 KGy élimine
88% de l’OTA présente dans le raisin) (Aziz et al., 2004, Deberghes et al., 1995,
Deberghes et al., 1993, Refai et al., 1996, Kanapitsas et al., 2016). Cependant,
l’irradiation par des rayons γ n’est autorisée que si les doses ne dépassent pas les 10
KGy (Akueche et al., 2012).
4. Adsorption par des agents physico-chimiques
Une autre approche qui vise à décontaminer les produits agricoles des
mycotoxines, se base sur l'utilisation des matériaux adsorbants, qui, une fois présents
dans le milieu, se lient aux mycotoxines et les immobilisent afin de les éliminer en fin
de compte par une simple filtration. Ces adsorbants peuvent être classés en différents
groupes en fonction de leur origine : les minéraux (aluminosilicates), les charbons
actifs, les adsorbants biologiques (les parois cellulaires de levures et de bactéries ou
les fibres végétales) et les adsorbants synthétiques, y compris les argiles naturelles
modifiées et les résines synthétiques (polyvinylpyrrolidone, cholestyramine). Ces
matériaux ont été testé afin d’évaluer leur pouvoir à réduire les teneurs en OTA
contaminant le vin et le moût du raisin (Visconti et al., 2008, Castellari et al., 2001).
Parmi ces adsorbants, le charbon actif et le caséinate de potassium sont les plus
Introduction bibliographique
64
efficace : 90% d’OTA est éliminé du vin rouge en présence du charbon actif et 82% par
150 g/L de caséinate de potassium(Trioné and Dumeau, 2000). Cependant, l’emploi
du charbon n’est pas conseillé puisqu’il élimine également les anthocyanes et les
autres polyphénols du vin. De même, l'efficacité du traitement avec des fragments de
bois de chêne dépend de la quantité de copeaux de bois et de la poudre utilisée (Savino
et al., 2007). Selon les résultats d'Olivares-Marín et al. (2009), le charbon actif produit à
partir de pierres de cerisier pourrait être utilisé pour enlever jusqu'à 50% de l'OTA
présente dans le vin, sans causer des changements dans l'indice polyphénolique total
et l'intensité de la couleur. D'autres adsorbants, y compris la bentonite, les esters
d'acétate de cellulose, la polyvinylpyrrolidone, la cholestyramine et le polygel sont
inefficaces pour l'élimination de l'OTA (Visconti et al., 2008, Gambuti et al., 2005, Var
et al., 2008).
En conclusion, de nombreux matériaux adsorbants sont testés dans le but de
réduire des taux de l'OTA. Cependant, leur activité n'est pas aussi élevée que prévu,
à l'exception du charbon actif (Scott, 1996, Espejo and Armada, 2009). En 2005, Tangni
et al. (2005) a développé une nouvelle fibre végétale insoluble, capable d'adsorber
l'OTA présente dans les produits alimentaires liquides. Il existe d'autres matériaux
adsorbants prometteurs dans la détoxification de l’OTA, tels que les zéolithes
modifiées (Amézqueta et al., 2009, Daković et al., 2005, Daković et al., 2003) et les
bentonites organophiles (Thimm et al., 2001).
5. Les stratégies de bio-contrôle
Les approches physiques et chimiques engendrent des ambigüités chez les
toxicologues, à cause de leurs effets négatifs sur la qualité des produits finis. De ce fait,
une stratégie alternative est proposée pour lutter contre l’occurrence de l’OTA dans
les denrées alimentaires, basée sur l’utilisation des méthodes biologiques n’affectant
pas la santé humaine ni l’environnement (Bleve et al., 2006). Cette stratégie consiste en
l’utilisation des composés naturels issus des plantes (composés phénoliques, huiles
essentielles), ainsi que des microorganismes (bactéries lactiques, levures,
Introduction bibliographique
65
actinomycètes) capables de décomposer, transformer et/ou adsorber l’OTA et aussi
agir sur la voie de biosynthèse pour réduire partiellement ou complètement la
production de cette toxine.
a. Les extraits naturels de plantes : huiles essentielles et composés phénoliques
Les plantes vertes produisent naturellement divers métabolites secondaires tels
que les composés phénoliques, les terpenoïdes et les alkaloïdes, afin de se protéger
contre les agressions externes (mécanique, biologique ou climatique). Ces composés
ont montré au cours des années leur utilité contre les contaminations fongiques et/ou
mycotoxiques.
a.1. Huiles essentielles
Découvertes et utilisées depuis des siècles, les huiles essentielles (H.E) sont des
métabolites secondaires produits par des plantes, ayant une vaste application dans la
médecine traditionnelle, la préservation et l’aromatisation des aliments, ainsi que dans
la parfumerie (Kalemba and Kunicka, 2003). Depuis le Moyen Age, les H.E sont
amplement utilisées dans les applications bactéricides, virucides, fongicides,
antiparasitaires et insecticides (Bakkali et al., 2008). Leur propriété antifongique s’est
largement développée au cours des années. En effet, des études approfondies sont
réalisées sur leur pouvoir inhibiteur de la croissance fongique et de l’OTA produite
par des champignons filamenteux. Cependant, l’évaluation de l’effet antifongique des
huiles essentielles contre les champignons ochratoxinogènes, a été menée
essentiellement sur A. ochraceus, alors que leur impact sur A. carbonarius reste très peu
élucidé (Tableau 10).
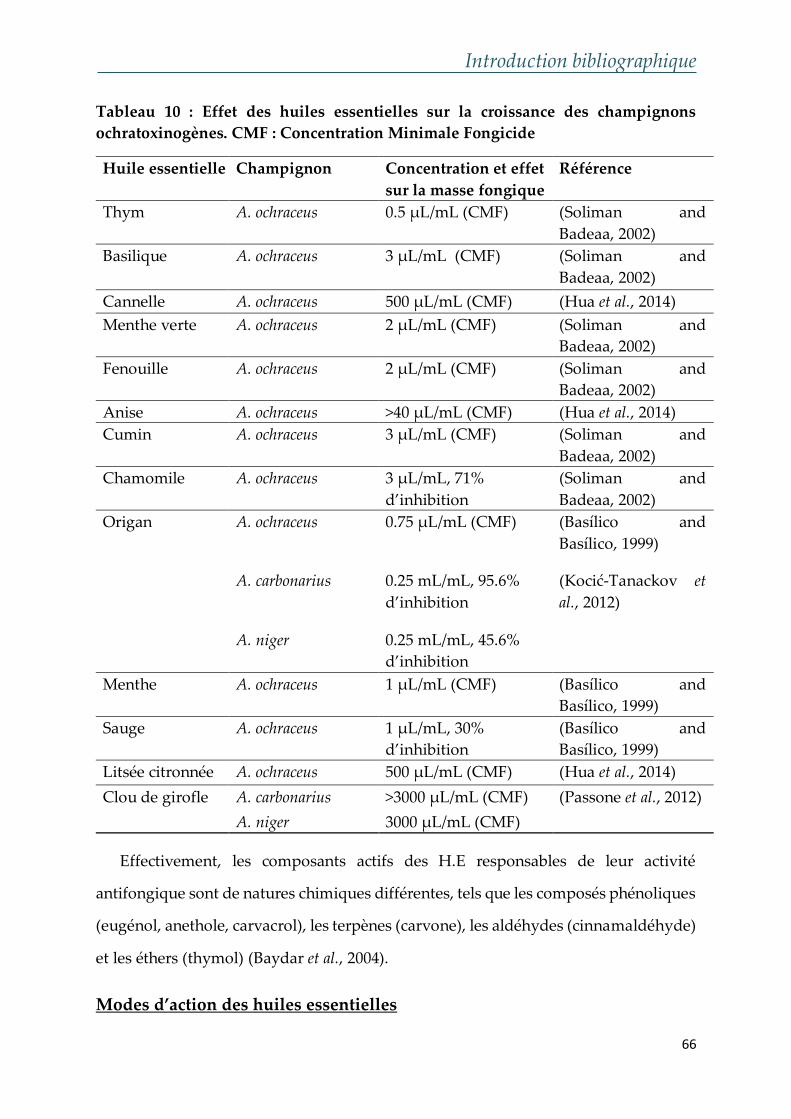
Introduction bibliographique
66
Tableau 10 : Effet des huiles essentielles sur la croissance des champignons
ochratoxinogènes. CMF : Concentration Minimale Fongicide
Huile essentielle Champignon Concentration et effet
sur la masse fongique
Référence
Thym A. ochraceus
0.5 µL/mL (CMF) (Soliman and
Badeaa, 2002)
Basilique A. ochraceus
3 µL/mL (CMF) (Soliman and
Badeaa, 2002)
Cannelle A. ochraceus 500 µL/mL (CMF) (Hua et al., 2014)
Menthe verte A. ochraceus 2 µL/mL (CMF) (Soliman and
Badeaa, 2002)
Fenouille A. ochraceus 2 µL/mL (CMF) (Soliman and
Badeaa, 2002)
Anise A. ochraceus >40 µL/mL (CMF) (Hua et al., 2014)
Cumin A. ochraceus 3 µL/mL (CMF) (Soliman and
Badeaa, 2002)
Chamomile A. ochraceus 3 µL/mL, 71%
d’inhibition
(Soliman and
Badeaa, 2002)
Origan A. ochraceus 0.75 µL/mL (CMF) (Basílico and
Basílico, 1999)
A. carbonarius 0.25 mL/mL, 95.6%
d’inhibition
(Kocić-Tanackov et
al., 2012)
A. niger 0.25 mL/mL, 45.6%
d’inhibition
Menthe A. ochraceus 1 µL/mL (CMF) (Basílico and
Basílico, 1999)
Sauge A. ochraceus 1 µL/mL, 30%
d’inhibition
(Basílico and
Basílico, 1999)
Litsée citronnée A. ochraceus 500 µL/mL (CMF) (Hua et al., 2014)
Clou de girofle A. carbonarius >3000 µL/mL (CMF) (Passone et al., 2012)
A. niger 3000 µL/mL (CMF)
Effectivement, les composants actifs des H.E responsables de leur activité
antifongique sont de natures chimiques différentes, tels que les composés phénoliques
(eugénol, anethole, carvacrol), les terpènes (carvone), les aldéhydes (cinnamaldéhyde)
et les éthers (thymol) (Baydar et al., 2004).
Modes d’action des huiles essentielles
Introduction bibliographique
67
Malgré leurs caractères fongicides et inhibiteurs de l’OTA et de bien d’autres
mycotoxines, le mode d’action des H.E. est pauvrement décrit. Pourtant, plusieurs
cibles cellulaires potentielles ont été élucidées. Grâce à leur richesse en molécules
bioactives, les H.E. sont capables d’agir simultanément sur plusieurs cibles cellulaires.
Leurs actions peuvent être situées au niveau de la membrane plasmique des
champignons, au niveau des enzymes intracellulaires impliquées dans la respiration
cellulaire et la synthèse des protéines structurales, ou bien au niveau de la répression
de l’expression des gènes responsables de la biosynthèse de l’OTA (Conner et al., 1984,
Kim et al., 2008, Denyer and Hugo, 1991). Tout d’abord, grâce à leur nature lipophile,
les H.E. peuvent traverser les membranes plasmiques et celles des organites
cellulaires, surtout la mitochondrie. Cette incorporation cause un déséquilibre dans la
composition lipidique membranaire et une diminution des taux d’ergostérol (lipide
membranaire essentiel au développement fongique et l’intégrité de la membrane
cellulaire fongique) (Prakash et al., 2015, Barrett-Bee and Dixon, 1994). Les H.E.
peuvent aussi agir sur les polysaccharides membranaires, tels que le galactose et le
galactosamine (Tatsadjieu et al., 2009). Ces déséquilibres membranaires induisent des
fuites des organites et des ions nécessaires à la survie des champignons. En effet,
Tolouee et al. (2010) a trouvé que la mort des cellules fongiques d’A. niger traité à l’H.E.
de la camomille est due à l’augmentation de la perméabilité de la membrane
plasmique de ce champignon, entrainant ainsi un déséquilibre osmotique et la fuite
des constituants cytoplasmiques.
En second lieu, l’action antifongique des H.E. peut se produire au niveau des
enzymes responsables de la production de l’OTA tels que le catabolisme du glucose
et la peroxydation lipidique. En effet, la synthèse de l’OTA requiert la présence des
acétyl-CoA provenant du métabolisme du glucose en pyruvate dans le cytoplasme qui
sera transformé ultérieurement en acétyl-CoA au niveau de la membrane
mitochondriale (Strijbis and Distel, 2010). L’emploi des H.E. à des cultures fongiques
réduit l’activité de MnSOD (ou Sod2), une superoxyde dismutase mitochondriale,
Introduction bibliographique
68
connue pour son rôle primordiale dans la détoxification des radicaux libres produits
au cours de la respiration cellulaire (Kim et al., 2006). Cette inhibition entraîne une
accumulation des radicaux libres, ce qui réduit la chaîne respiratoire mitochondriale,
induisant ainsi au blocage de la synthèse d’acétyl-CoA, précurseur de l’OTA (Prakash
et al., 2012).
Dernièrement, les H.E. ont montré un pouvoir régulateur de l’expression des
gènes de biosynthèse de l’OTA. Récemment, grâce à l’avancement des techniques
d’analyse moléculaire, des études sont menées sur la capacité des H.E à inhiber la
production de l’OTA en réprimant l’expression des gènes de la voie de biosynthèse de
cette toxine. Effectivement, l’ajout de doses croissantes de l’H.E des graines de
carambole (AEE) induit une diminution de la production de l’OTA, non
proportionnelle à l’inhibition de croissance d’A. ochraceus (Murthy et al., 2009). Ainsi,
une dose de 50-150 mL/g d’AEE, réduit la production de l’OTA sans nécessairement
affecter la croissance fongique. Similairement, un ajout de 75-150 mg/mL de l’H.E du
citron peut bloquer complètement la production de l’OTA chez A. ochraceus,
impliquant que cette réduction n’est pas reliée à l’inhibition de la croissance du
champignon, mais à la répression de l’expression des gènes de biosynthèse et/ou de
régulation de l’OTA (Hua et al., 2014). Afin de vérifier leur hypothèse, cet auteur a
suivi l’expression du gène « pks » chez A. carbonarius et il a trouvé que son expression
est complètement inhibée suite à l’ajout de 75-150 mg/mL de cette H.E. Une étude
similaire a montré que l’expression du gène « acOTApks » chez A. carbonarius est
significativement réduite par 0.065 mg/mL des acides hydrocinnamiques, notamment
l’acide férulique et l’acide paracoumarique (composant actifs de l’H.E de la cannelle)
(Ferrara et al., 2015).
a.2. Les composés phénoliques de plantes médicinales
Les plantes et les herbes médicinales, utilisées comme des remèdes contre des
troubles bénins, ont été le sujet de plusieurs études, afin de mieux comprendre l’action
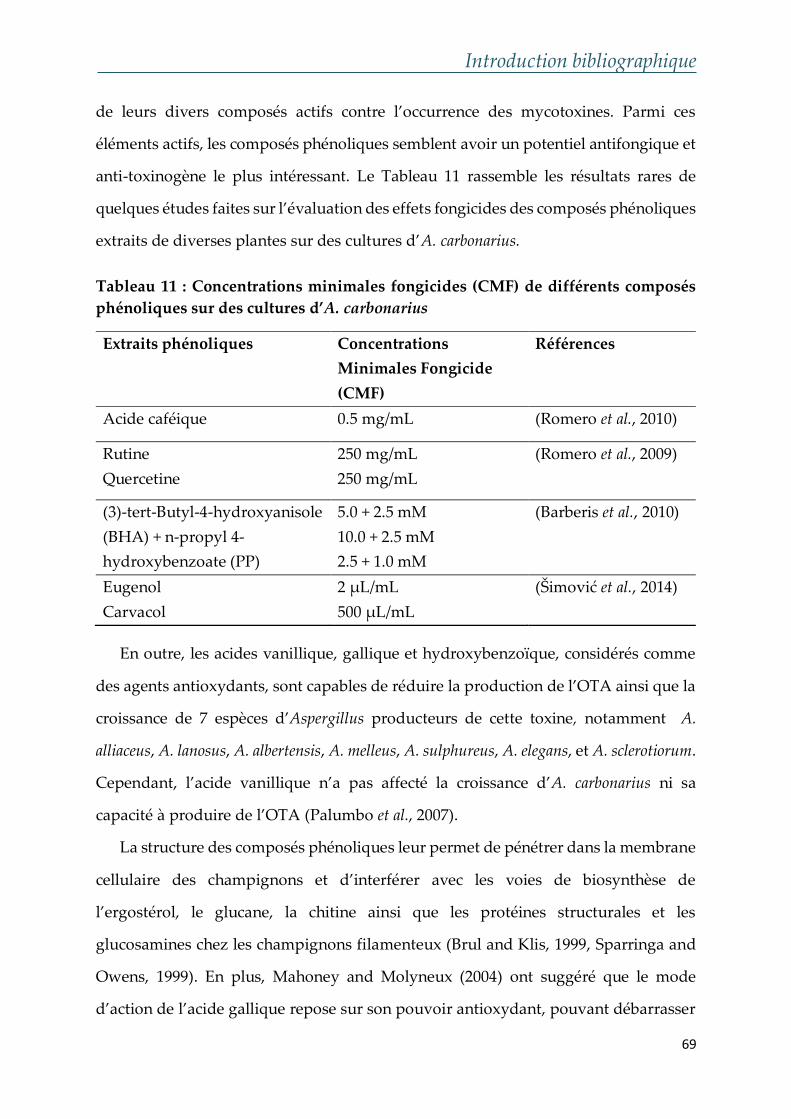
Introduction bibliographique
69
de leurs divers composés actifs contre l’occurrence des mycotoxines. Parmi ces
éléments actifs, les composés phénoliques semblent avoir un potentiel antifongique et
anti-toxinogène le plus intéressant. Le Tableau 11 rassemble les résultats rares de
quelques études faites sur l’évaluation des effets fongicides des composés phénoliques
extraits de diverses plantes sur des cultures d’A. carbonarius.
Tableau 11 : Concentrations minimales fongicides (CMF) de différents composés
phénoliques sur des cultures d’A. carbonarius
Extraits phénoliques Concentrations
Minimales Fongicide
(CMF)
Références
Acide caféique 0.5 mg/mL (Romero et al., 2010)
Rutine
Quercetine
250 mg/mL
250 mg/mL
(Romero et al., 2009)
(3)-tert-Butyl-4-hydroxyanisole
(BHA) + n-propyl 4-
hydroxybenzoate (PP)
5.0 + 2.5 mM
10.0 + 2.5 mM
2.5 + 1.0 mM
(Barberis et al., 2010)
Eugenol
Carvacol
2 µL/mL
500 µL/mL
(Šimović et al., 2014)
En outre, les acides vanillique, gallique et hydroxybenzoïque, considérés comme
des agents antioxydants, sont capables de réduire la production de l’OTA ainsi que la
croissance de 7 espèces d’Aspergillus producteurs de cette toxine, notamment A.
alliaceus, A. lanosus, A. albertensis, A. melleus, A. sulphureus, A. elegans, et A. sclerotiorum.
Cependant, l’acide vanillique n’a pas affecté la croissance d’A. carbonarius ni sa
capacité à produire de l’OTA (Palumbo et al., 2007).
La structure des composés phénoliques leur permet de pénétrer dans la membrane
cellulaire des champignons et d’interférer avec les voies de biosynthèse de
l’ergostérol, le glucane, la chitine ainsi que les protéines structurales et les
glucosamines chez les champignons filamenteux (Brul and Klis, 1999, Sparringa and
Owens, 1999). En plus, Mahoney and Molyneux (2004) ont suggéré que le mode
d’action de l’acide gallique repose sur son pouvoir antioxydant, pouvant débarrasser
Introduction bibliographique
70
la cellule des radicaux libres, qui peuvent engendrer un stress oxydatif déclenchant la
production des mycotoxines chez les champignons filamenteux. En outre, les
composés phénoliques peuvent affecter les champignons ayant acquis une résistance
aux traitements antifongiques. Effectivement, les flavonoïdes, la catéchine, les
chalconoïdes, les xanthones, les stilbènes, les anthocyanines et les tannins, peuvent
franchir la membrane cellulaire et inhiber l’activité des transporteurs ABC (ATP-
binding cassettes, qui confèrent aux champignons leur pouvoir résistant aux
antifongiques) (You et al., 1995, Meschini et al., 2003). D’autres études montrent que
les polyphénols peuvent s’attacher aux protéines cellulaires et changer par la suite
leurs structures tertiaires, réduisant ainsi l’activité des transporteurs ABC (Ma and
Wink, 2008, Wink and Schimmer, 2010, Wink, 2012).
b. Bio-contrôle par des souches bactériennes
Certains microorganismes ont prouvé leur capacité à prévenir, éliminer et
dégrader l’OTA, et ils sont considérés comme étant le moyen de lutte le plus efficace
contre l’occurrence de cette toxine dans les denrées alimentaires (Kabak et al., 2006,
Amézqueta et al., 2009, Kabak and Dobson, 2009, Sweeney and Dobson, 1998, Halász
et al., 2009, Schatzmayr et al., 2003, Petchkongkaew et al., 2008). Lors de l’élaboration
du vin, la teneur en OTA augmente jusqu’à l’étape de la fermentation malolactique
qui précède l’embouteillage. Normalement, durant cette phase, le taux d’OTA
diminue, probablement du à son adsorption sur la surface des levures Sacharomyces
ou sa dégradation par les bactéries lactiques encore présentes dans le vin (Bejaoui et
al., 2004, Cecchini et al., 2006).
b.1. Adsorption de l’OTA sur la surface bactérienne
L’ajout de Lactobacillus plantarum, de S. cerevisiae et de S. bayanus dans le milieu de
culture, provoque une baisse significative des taux de l’OTA sans engendrer des
métabolites de dégradation, indiquant ainsi la possibilité de l’adsorption de l’OTA sur
la membrane cellulaire de ces levures et bactéries lactiques (Silva et al., 2003, Bejaoui
et al., 2004). La détoxification par les levures durant la fermentation alcoolique a été
Introduction bibliographique
71
étudiée et analysée dans de nombreuses études (Petruzzi et al., 2014a, Petruzzi et al.,
2015, Caridi et al., 2006, Cecchini et al., 2006, Meca et al., 2010, Bevilacqua et al., 2014).
Le contact prolongé entre les levures et le vin durant la vinification, suivi par une
diminution de l’OTA, suggère l’implication de ces microorganismes dans le processus
de détoxification. Il s’est avéré que c’est la nature chimique de ces deux éléments qui
rend possible cette détoxification. En effet, la paroi cellulaire de S. cerevisiae est
composée d’une couche interne de 1,3-β-glycan et 1,6- β-glycan stabilisée par des
liaisons d’hydrogène. L’exposition des ces chaînes de polysaccharides ainsi que les
mannoprotéines (formant 30 à 40% de la masse de la paroi) à la surface des levures,
attribue à ces microorganismes la capacité d’adsorber l’OTA à leur surface (Petruzzi
et al., 2014b). De ce fait, les technologies de vinification récentes focalisent sur
l’utilisation des fractions de levures mortes afin d’accélérer le processus de
détoxification du vin, sans toucher à ses caractéristiques physico-chimiques et
sensorielles (Van der Merwe et al., 1965). Suite à ce sujet, Petruzzi et al. (2014b) ont
testé deux souches de S. cerevisiae mortes (inactivation thermique), ainsi que des parois
cellulaires commerciales, afin de comparer leur pouvoir à adsorber l’OTA. Cet auteur
a constaté que les parois cellulaires peuvent adsorber jusqu’à 50% de l’OTA, tandis
que les levures mortes n’ont adsorbé que 43% de cette toxine. En plus, Bizaj et al. (2009)
a trouvé qu’il n’ya pas une différence significative entre les levures mortes et vivantes
de S. cerevisiae dans la détoxification du vin, prouvant ainsi que ce processus repose
uniquement sur l’adsorption l’OTA et non pas sur sa dégradation par cette levure.
b.2. Dégradation de l’OTA par des bactéries
Des études menées sur Acinetobacter calcoaceticus ont révélé que cette dernière peut
dégrader l’OTA et la transformer en OTα sous l’effet d’une estérase extracellulaire
produite par cette bactérie (Hwanga and Draughon, 1994). En réalité, la majorité des
microorganismes qui dégradent l’OTA sont capables de cliver la phénylalanine de
cette toxine, provoquant l’accumulation de l’OTα dans le milieu réactionnel. Les
similarités des profils de dégradation de l’OTA par des souches de Bacillus et des
Introduction bibliographique
72
souches non ochratoxicogéniques d’A. niger et la détection du produit de dégradation
OTα, suggèrent l’implication d’une carboxypeptidase A responsable de cette
transformation (Petchkongkaew et al., 2008). Cette enzyme a été détectée chez
plusieurs bactéries anaérobies et aérobies (Sphingomonas sp., Stenotrophomonas
nitritreducens, Stenotrophomonas, Ralstonia eutropha, et Eubacterium sp.), et levures
(Trichosporon sp., Cryptococcus sp., Rhodotorula sp., Trichosporon sp., et Trichosporon sp.)
(Schatzmayr et al., 2006, Schatzmayr et al., 2002, Schatzmayr et al., 2012). Ainsi,
Streptococcus salivarius, Bifidobacterium bifidum, Lactobacillus delbrueckii, et certaines
bactéries lactiques dégradent jusqu’à 100% d’OTA présente dans le lait (Škrinjar et al.,
1996). Durant la fermentation alcoolique, Saccharomyces cerevisiae et Kloeckera apiculata
transforment l’OTA en des métabolites moins toxiques. L’hypothèse de l’adsorption
de l’OTA à la paroi de ces levures a été rejetée puisque aucun résidu de cette toxine
n’a été trouvé sur leur paroi (Angioni et al., 2007). Cependant, l’absence de l’OTα et de
la phénylalanine du milieu réactionnel, suggère l’existence d’une autre voie de
dégradation, non présente chez la plupart des microorganismes.

73

74
Travail expérimental

75
76
Chapitre 1
Etude comparative des effets
antifongiques et
antiochratoxinogènes des composés
phénoliques et huiles essentielles
77
I. Introduction
Etant la toxine la plus nuisible et la plus répandue dans la famille des ochratoxines,
la prévention de la production de l’OTA devint une obligation majeure afin de délivrer
aux consommateurs des aliments conformes aux normes exigées. Les stratégies de
préventions chimiques et physiques de l’OTA, détaillées dans la partie précédente de
ce manuscrit ont pu réduire cette toxine mais en engendrant l’apparition des résidus
toxiques dans les aliments traités.
Ce chapitre est dédié à développer des moyens naturelles afin de prévenir la
production de l’OTA par A. carbonarius. D’après l’étude bibliographique approfondie,
nous avons trouvé que les huiles essentielles ainsi que les composés phénoliques sont
parmi les substances naturelles les plus étudiés dans la lutte contre les champignons
filamenteux producteurs de mycotoxines. Ces extraits (huiles essentielles et composés
phénoliques) ont montré une capacité intéressante contre la croissance des
champignons appartenant au genre Aspergillus, notamment A. flavus, A. parasiticus, A.
ochraceus, A. niger et A. carbonarius. Ce dernier, étant le majeur producteur de l’OTA sur
les raisins dans les pays du bassin méditerranéen, nous étions intéressés d’évaluer
l’effet de plusieurs composés phénoliques extraits des plantes médicinales ainsi que
celui des huiles essentielles sur la morphologie et la croissance d’A. carbonarius S402
(souche isolée du raisin Libanais) ainsi que sa capacité à produire l’OTA sous ces
différentes conditions.
Afin de valider cette hypothèse, nous avons procéder à mettre en culture la souche
A. carbonarius S402 en présence d’un équivalent de 250 µg/mL d’acide gallique de
chacun des composés phénoliques extraits des plantes médicinales, ainsi de 1 et 5
µL/mL des huiles essentielles correspondantes.
Les résultats ont montré que les huiles essentielles sont plus efficaces contre la
production de l’OTA que les composés phénoliques extraits des mêmes plantes. Ainsi,
cette technique nous a permis de classer ces deux types de composés naturels en deux
grandes catégories : les antifongiques et les antiochratoxinogènes.
78
II. Article accepté dans la revue Antioxidants
Article
Antifungal and Antiochratoxigenic Activities of
Essential Oils and Total Phenolic Extracts: A
Comparative Study
Rachelle EL Khoury 1,2, Ali Atoui 3, Florence Mathieu 1,*, Hiba Kawtharani 2, Anthony EL Khoury 2,
Richard G. Maroun 2 and Andre EL Khoury 2
1 Laboratoire de Génie Chimique, Université de Toulouse, Centre National de Recherche Scientifique(CNRS), Institut National Polytechnique de Toulouse (INPT), Université Paul Sabatier (UPS), Toulouse 31326, France;
[email protected] (R.E.K.); [email protected] (H.K.);
[email protected] (Ant.E.K.); [email protected] (R.G.M.); [email protected] (And.E.K.)
2 Laboratoire de Mycologie et Sécurité Alimentaire (LMSA), Centre d’analyse et de Recherche (CAR), Campus des Sciences et Technologie, Université Saint-Joseph, Dekwaneh-Beyrouth 1104-2020, Lebanon
3 Laboratory of Microbiology, Department of Natural Sciences and Earth, Faculty of Sciences I, Lebanese
University, Hadath Campus, P.O. Box 5 Beirut, Lebanon; [email protected] * Correspondence: [email protected]; Tel.: +33-534-323-935
Received: 17 May 2017; Accepted: 10 June 2017; Published: date
Abstract: This study is intended to prevent ochratoxin A (OTA) production by Aspergillus carbonarius
S402 using essential oils (EOs) and total phenolic compounds extracted from plants and herbs. The EOs
used in this study are the following: bay leaves, cumin, fenugreek, melissa, mint, and sage. As for the
phenolic compounds, they were extracted from bay leaves, cumin, fenugreek, melissa, mint, sage, anise,
chamomile, fennel, rosemary, and thyme. The experiments were conducted on Synthetic Grape Medium
(SGM) medium at 28 °C for 4 days. OTA was extracted from the medium with methanol and quantified
using HPLC (High Performance Liquid Chromatography). Results showed that EOs had a greater
impact than the total phenolic extracts on the OTA production. Reduction levels ranged between 25%
(sage) and 80% (melissa) for the EOs at 5 µL mL−1, and 13% (thyme) and 69% (mint) for the phenolic
extracts. Although they did not affect the growth of A. carbonarius, total phenolic extracts and EOs were
capable of partially reducing OTA production. Reduction levels depended on the nature of the plants
and the concentration of the EOs. Reducing OTA with natural extracts could be a solution to prevent
OTA production without altering the fungal growth, thus preserving the natural microbial balance. Keywords: ochratoxin A; essential oils; total phenolic extracts; biocontrol; Aspergillus carbonarius
1. Introduction
Ochratoxin A (OTA) is a mycotoxin produced by several species belonging to the Aspergillus and
Penicillium genera. Its presence in common foodstuff and beverages has aroused significant public concern.
More particularly, this toxin can be found in numerous food crops, such as cereals and cereal by-products [1],
grapes and grape by−products [2], spices [3], and coffee [4]. Moreover, due to the physical stability of OTA,
and considering the fact that mycotoxins can be transferred through the food chain, OTA can also be found in
tissues and products of animal origins, such as pork and poultry, and dairy products among others [5,6]. The
greatest concern about this food contaminant lies within its nephrotoxic, carcinogenic, teratogenic, and
79
immunotoxic effects on human health following its ingestion [7–9]. Moreover, the International Agency for
Research on Cancer has enlisted the OTA in the group 2B as a possible human carcinogen [10]. The European
Union (EU), as well as many other countries, has set maximum permitted levels of this toxin on a variety
of food and feed to limit the risk of human exposure [11]. OTA production and fungal growth are associated with environmental and nutritional factors such as
pH, temperature, water activity, and nitrogen and carbon sources [12]. Nevertheless, little is known about the
oxidative stress and antioxidants’ effects on the OTA production as well as the fungal growth of A. carbonarius.
The correlation between the oxidative stress as well as the reactive oxygen species and mycotoxin production
was firstly evaluated in 2000 by Jayashree Subramanyam [13] who found that the increasing oxidative stress
induced the aflatoxins production, leading to enhanced lipid peroxydation and the generation of reactive
oxygen species. While the oxidative stress induces mycotoxin production, the presence of antioxidant
molecules in the culture media reduces the production of such mycotoxins (aflatoxins, fumonisins) [14–16].
These antioxidants can be found in plants extracts such as the essential oils (EOs) and phenolic compounds
that have proven their efficiency against mycotoxin production. As for the OTA, numerous studies were
conducted on the capacity of EOs to reduce fungal growth as well as the production of this particular toxin. In
our previous work, we studied the effect of several EOs, such as fennel, rosemary, celery, chamomile, oregano,
cinnamon, and thyme on the growth of A. carbonarius and OTA production. In fact, the EOs of thyme,
cinnamon, and oregano were found to be effective against A. carbonarius [17]. On the other hand, the EOs of
the fennel, chamomile, and celery were only effective against OTA production by A. carbonarius, suggesting a
different mode of action of the studied EOs. Nevertheless, the effect of naturally extracted total phenolic compounds on the growth of A.
carbonarius and its OTA production has not been yet evaluated. Therefore, the aim of this study was to
focus on reducing the production of OTA and establishing a comparative study between total phenolic
extracts extracted from the anise, bay leaves, chamomile, cumin, fennel, fenugreek, melissa, mint,
rosemary, sage, and thyme as well as their corresponding EOs. The activity of five of these EOs (anise,
chamomile, fennel, rosemary, and thyme) was tested in our previous work. 2. Materials and Methods 2.1. Plant Material
In this study, the phenolic compounds were extracted from 11 plants that we purchased from a
Lebanese market. The plants were the following: anise, bay leaves, chamomile, cumin, fennel, fenugreek,
melissa (lemon balm), mint, rosemary, sage, and thyme. The EOs were also purchased from a Lebanese market: mint, cumin, melissa, bay leaves, fenugreek,
and sage. 2.2. Extraction of Phenolic Compounds from Medicinal Plants
The extraction of the phenolic compounds commenced by grinding all the 11 dried plants with a
mixer until they were transformed into a fine powder. Then, 10 g of each plant powder were mixed with
100 mL acetone (85:15 v/v) and incubated for 24 h at 37 °C in a shaker/incubator (Model SI−45, serial
number AS-SI45-1038E). After the maceration, the mix was then filtered through 150 mm filters (grade
290, particles retention size 80 g/m2, Sartorius filter discs, AG-37070, Goettingen, Germany). In order to
have a filtrate free from microorganisms and fungal spores, we proceeded to perform a second filtration
with 0.22 µm filters (Ministart Syringe Filter, Sartorius Stedium Biotech GmbH-37070, Goettingen,
Germany). Finally, the mixture was incubated at 45 °C for 24 h to evaporate the acetone and obtain a
sterile powder that was later blended with 4 mL of sterilized water. Vortexing the mixture was a
necessary step to ensure its homogeneity. As for the EOs, they were bought from a Lebanese market with
no further modifications.
Antioxidants 2017, 6, 44; doi: 10.3390/antiox6020044 www.mdpi.com/journal/antioxidants
Antioxidants 2017, 6, 44 2 of 11
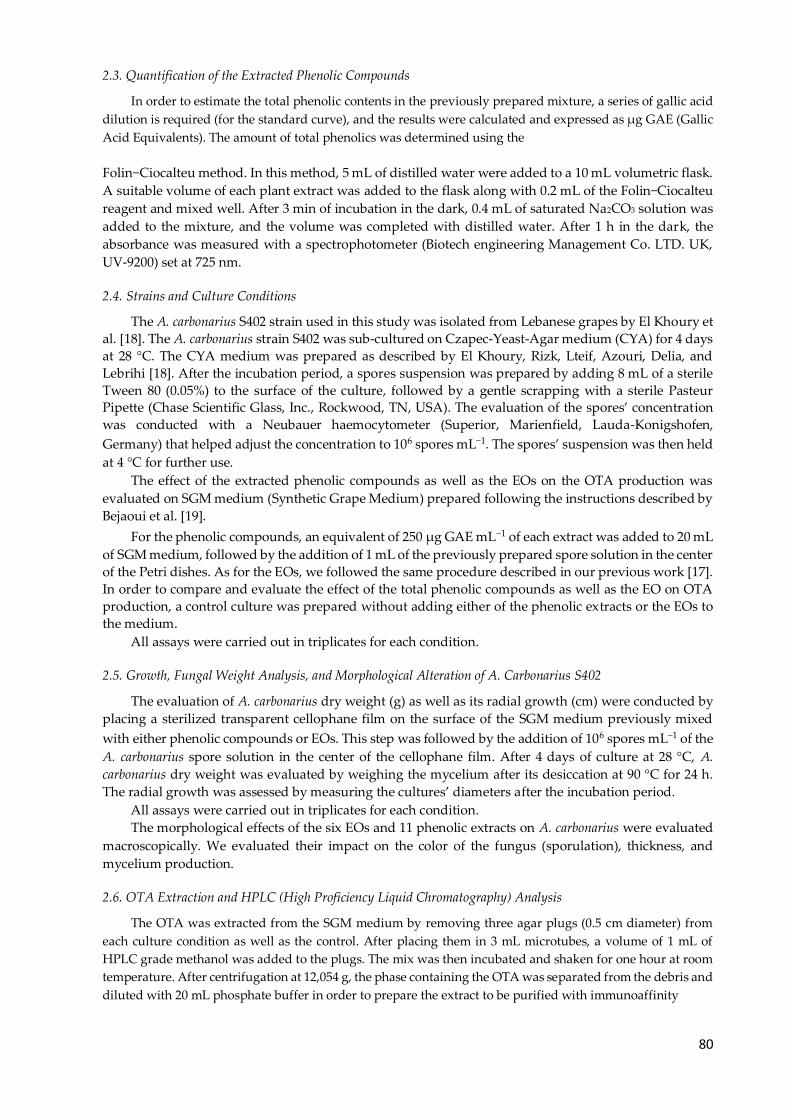
80
2.3. Quantification of the Extracted Phenolic Compounds
In order to estimate the total phenolic contents in the previously prepared mixture, a series of gallic acid
dilution is required (for the standard curve), and the results were calculated and expressed as µg GAE (Gallic
Acid Equivalents). The amount of total phenolics was determined using the
Folin−Ciocalteu method. In this method, 5 mL of distilled water were added to a 10 mL volumetric flask.
A suitable volume of each plant extract was added to the flask along with 0.2 mL of the Folin−Ciocalteu
reagent and mixed well. After 3 min of incubation in the dark, 0.4 mL of saturated Na2CO3 solution was
added to the mixture, and the volume was completed with distilled water. After 1 h in the dark, the
absorbance was measured with a spectrophotometer (Biotech engineering Management Co. LTD. UK,
UV-9200) set at 725 nm. 2.4. Strains and Culture Conditions
The A. carbonarius S402 strain used in this study was isolated from Lebanese grapes by El Khoury et
al. [18]. The A. carbonarius strain S402 was sub-cultured on Czapec-Yeast-Agar medium (CYA) for 4 days
at 28 °C. The CYA medium was prepared as described by El Khoury, Rizk, Lteif, Azouri, Delia, and
Lebrihi [18]. After the incubation period, a spores suspension was prepared by adding 8 mL of a sterile
Tween 80 (0.05%) to the surface of the culture, followed by a gentle scrapping with a sterile Pasteur Pipette (Chase Scientific Glass, Inc., Rockwood, TN, USA). The evaluation of the spores’ concentration
was conducted with a Neubauer haemocytometer (Superior, Marienfield, Lauda-Konigshofen,
Germany) that helped adjust the concentration to 106 spores mL−1. The spores’ suspension was then held
at 4 °C for further use. The effect of the extracted phenolic compounds as well as the EOs on the OTA production was
evaluated on SGM medium (Synthetic Grape Medium) prepared following the instructions described by
Bejaoui et al. [19]. For the phenolic compounds, an equivalent of 250 µg GAE mL−1 of each extract was added to 20 mL
of SGM medium, followed by the addition of 1 mL of the previously prepared spore solution in the center
of the Petri dishes. As for the EOs, we followed the same procedure described in our previous work [17].
In order to compare and evaluate the effect of the total phenolic compounds as well as the EO on OTA
production, a control culture was prepared without adding either of the phenolic extracts or the EOs to
the medium. All assays were carried out in triplicates for each condition.
2.5. Growth, Fungal Weight Analysis, and Morphological Alteration of A. Carbonarius S402
The evaluation of A. carbonarius dry weight (g) as well as its radial growth (cm) were conducted by
placing a sterilized transparent cellophane film on the surface of the SGM medium previously mixed
with either phenolic compounds or EOs. This step was followed by the addition of 106 spores mL−1 of the
A. carbonarius spore solution in the center of the cellophane film. After 4 days of culture at 28 °C, A.
carbonarius dry weight was evaluated by weighing the mycelium after its desiccation at 90 °C for 24 h.
The radial growth was assessed by measuring the cultures’ diameters after the incubation period. All assays were carried out in triplicates for each condition. The morphological effects of the six EOs and 11 phenolic extracts on A. carbonarius were evaluated
macroscopically. We evaluated their impact on the color of the fungus (sporulation), thickness, and
mycelium production. 2.6. OTA Extraction and HPLC (High Proficiency Liquid Chromatography) Analysis
The OTA was extracted from the SGM medium by removing three agar plugs (0.5 cm diameter) from
each culture condition as well as the control. After placing them in 3 mL microtubes, a volume of 1 mL of
HPLC grade methanol was added to the plugs. The mix was then incubated and shaken for one hour at room
temperature. After centrifugation at 12,054 g, the phase containing the OTA was separated from the debris and
diluted with 20 mL phosphate buffer in order to prepare the extract to be purified with immunoaffinity
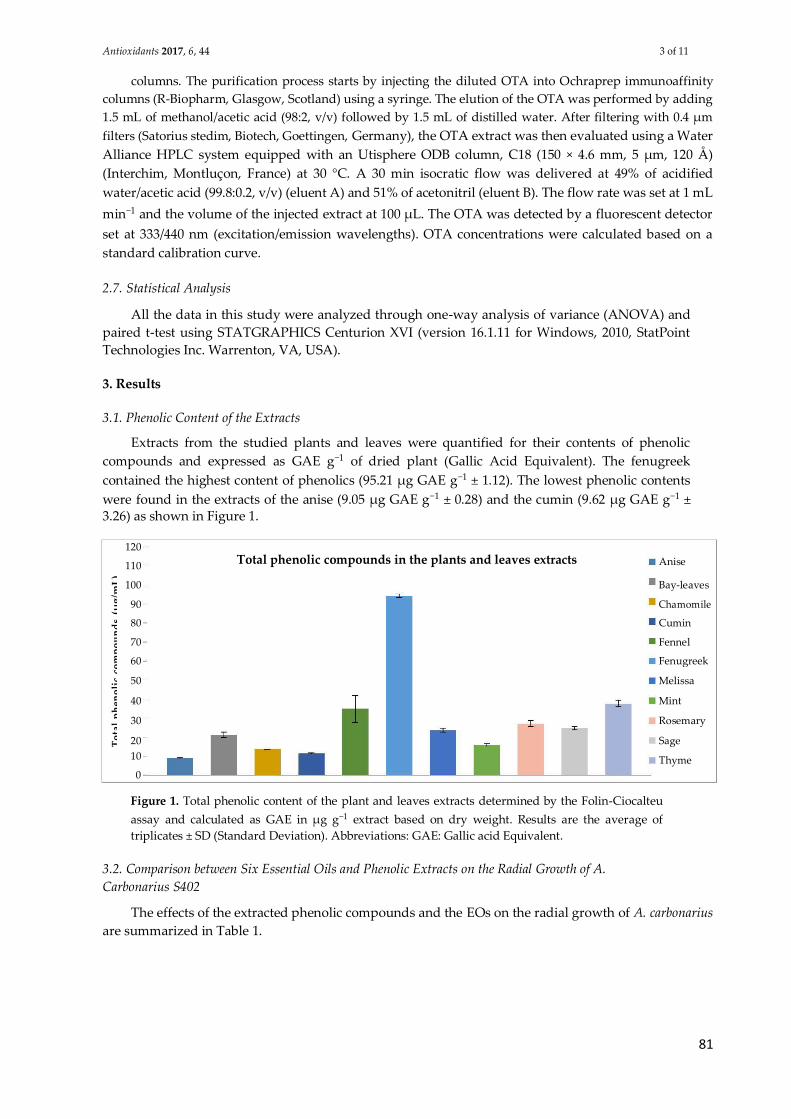
81
columns. The purification process starts by injecting the diluted OTA into Ochraprep immunoaffinity
columns (R-Biopharm, Glasgow, Scotland) using a syringe. The elution of the OTA was performed by adding
1.5 mL of methanol/acetic acid (98:2, v/v) followed by 1.5 mL of distilled water. After filtering with 0.4 µm
filters (Satorius stedim, Biotech, Goettingen, Germany), the OTA extract was then evaluated using a Water
Alliance HPLC system equipped with an Utisphere ODB column, C18 (150 × 4.6 mm, 5 µm, 120 Å)
(Interchim, Montluçon, France) at 30 °C. A 30 min isocratic flow was delivered at 49% of acidified
water/acetic acid (99.8:0.2, v/v) (eluent A) and 51% of acetonitril (eluent B). The flow rate was set at 1 mL
min−1 and the volume of the injected extract at 100 µL. The OTA was detected by a fluorescent detector
set at 333/440 nm (excitation/emission wavelengths). OTA concentrations were calculated based on a
standard calibration curve.
2.7. Statistical Analysis
All the data in this study were analyzed through one-way analysis of variance (ANOVA) and
paired t-test using STATGRAPHICS Centurion XVI (version 16.1.11 for Windows, 2010, StatPoint
Technologies Inc. Warrenton, VA, USA). 3. Results 3.1. Phenolic Content of the Extracts
Extracts from the studied plants and leaves were quantified for their contents of phenolic
compounds and expressed as GAE g−1 of dried plant (Gallic Acid Equivalent). The fenugreek
contained the highest content of phenolics (95.21 µg GAE g−1 ± 1.12). The lowest phenolic contents
were found in the extracts of the anise (9.05 µg GAE g−1 ± 0.28) and the cumin (9.62 µg GAE g−1 ± 3.26) as shown in Figure 1. 120
Total phenolic compounds in the plants and leaves extracts
110 Anise
μg
/mL
)
100 Bay-leaves
90 Chamomile (
Cumin
com
po
un
ds 80
70 Fennel
60 Fenugreek
50
Melissa
ph
eno
lic
40 Mint
30 Rosemary
To
tal
20 Sage
10 Thyme
0
Figure 1. Total phenolic content of the plant and leaves extracts determined by the Folin-Ciocalteu
assay and calculated as GAE in µg g−1 extract based on dry weight. Results are the average of
triplicates ± SD (Standard Deviation). Abbreviations: GAE: Gallic acid Equivalent. 3.2. Comparison between Six Essential Oils and Phenolic Extracts on the Radial Growth of A.
Carbonarius S402
The effects of the extracted phenolic compounds and the EOs on the radial growth of A. carbonarius
are summarized in Table 1.
Antioxidants 2017, 6, 44 3 of 11
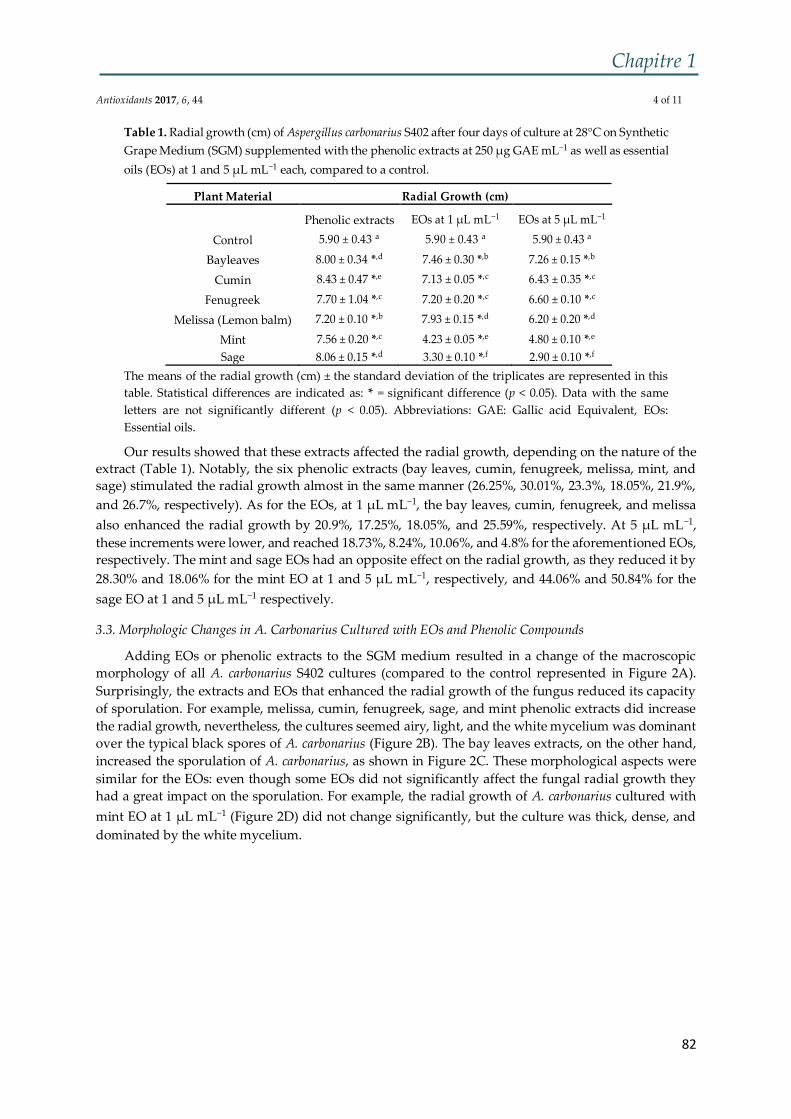
Chapitre 1
82
Table 1. Radial growth (cm) of Aspergillus carbonarius S402 after four days of culture at 28°C on Synthetic
Grape Medium (SGM) supplemented with the phenolic extracts at 250 µg GAE mL−1 as well as essential
oils (EOs) at 1 and 5 µL mL−1 each, compared to a control.
Plant Material Radial Growth (cm)
Phenolic extracts EOs at 1 µL mL−1 EOs at 5 µL mL−1
Control 5.90 ± 0.43 a 5.90 ± 0.43 a 5.90 ± 0.43 a
Bayleaves 8.00 ± 0.34 *,d 7.46 ± 0.30 *,b 7.26 ± 0.15 *,b
Cumin 8.43 ± 0.47 *,e 7.13 ± 0.05 *,c 6.43 ± 0.35 *,c
Fenugreek 7.70 ± 1.04 *,c 7.20 ± 0.20 *,c 6.60 ± 0.10 *,c
Melissa (Lemon balm) 7.20 ± 0.10 *,b 7.93 ± 0.15 *,d 6.20 ± 0.20 *,d
Mint 7.56 ± 0.20 *,c 4.23 ± 0.05 *,e 4.80 ± 0.10 *,e Sage 8.06 ± 0.15 *,d 3.30 ± 0.10 *,f 2.90 ± 0.10 *,f
The means of the radial growth (cm) ± the standard deviation of the triplicates are represented in this
table. Statistical differences are indicated as: * = significant difference (p < 0.05). Data with the same
letters are not significantly different (p < 0.05). Abbreviations: GAE: Gallic acid Equivalent, EOs:
Essential oils.
Our results showed that these extracts affected the radial growth, depending on the nature of the extract (Table 1). Notably, the six phenolic extracts (bay leaves, cumin, fenugreek, melissa, mint, and sage) stimulated the radial growth almost in the same manner (26.25%, 30.01%, 23.3%, 18.05%, 21.9%,
and 26.7%, respectively). As for the EOs, at 1 µL mL−1, the bay leaves, cumin, fenugreek, and melissa
also enhanced the radial growth by 20.9%, 17.25%, 18.05%, and 25.59%, respectively. At 5 µL mL−1,
these increments were lower, and reached 18.73%, 8.24%, 10.06%, and 4.8% for the aforementioned EOs, respectively. The mint and sage EOs had an opposite effect on the radial growth, as they reduced it by
28.30% and 18.06% for the mint EO at 1 and 5 µL mL−1, respectively, and 44.06% and 50.84% for the
sage EO at 1 and 5 µL mL−1 respectively. 3.3. Morphologic Changes in A. Carbonarius Cultured with EOs and Phenolic Compounds
Adding EOs or phenolic extracts to the SGM medium resulted in a change of the macroscopic
morphology of all A. carbonarius S402 cultures (compared to the control represented in Figure 2A).
Surprisingly, the extracts and EOs that enhanced the radial growth of the fungus reduced its capacity
of sporulation. For example, melissa, cumin, fenugreek, sage, and mint phenolic extracts did increase
the radial growth, nevertheless, the cultures seemed airy, light, and the white mycelium was dominant
over the typical black spores of A. carbonarius (Figure 2B). The bay leaves extracts, on the other hand,
increased the sporulation of A. carbonarius, as shown in Figure 2C. These morphological aspects were
similar for the EOs: even though some EOs did not significantly affect the fungal radial growth they
had a great impact on the sporulation. For example, the radial growth of A. carbonarius cultured with
mint EO at 1 µL mL−1 (Figure 2D) did not change significantly, but the culture was thick, dense, and
dominated by the white mycelium.
Antioxidants 2017, 6, 44 4 of 11
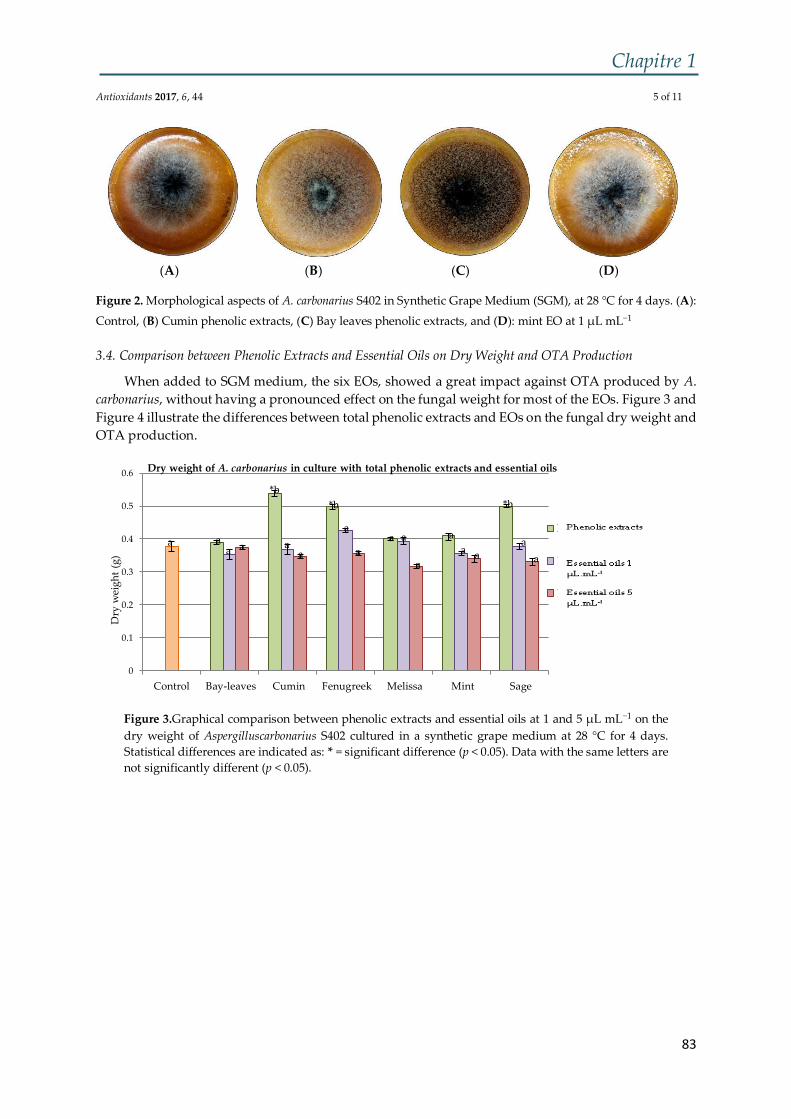
Chapitre 1
83
(A) (B) (C) (D)
Figure 2. Morphological aspects of A. carbonarius S402 in Synthetic Grape Medium (SGM), at 28 °C for 4 days. (A):
Control, (B) Cumin phenolic extracts, (C) Bay leaves phenolic extracts, and (D): mint EO at 1 µL mL−1 3.4. Comparison between Phenolic Extracts and Essential Oils on Dry Weight and OTA Production
When added to SGM medium, the six EOs, showed a great impact against OTA produced by A.
carbonarius, without having a pronounced effect on the fungal weight for most of the EOs. Figure 3 and
Figure 4 illustrate the differences between total phenolic extracts and EOs on the fungal dry weight and
OTA production.
Figure 3.Graphical comparison between phenolic extracts and essential oils at 1 and 5 µL mL−1 on the
dry weight of Aspergilluscarbonarius S402 cultured in a synthetic grape medium at 28 °C for 4 days.
Statistical differences are indicated as: * = significant difference (p < 0.05). Data with the same letters are
not significantly different (p < 0.05).
Antioxidants 2017, 6, 44 5 of 11
0
0.1
0.2
0.3
0.4
0.5
0.6
Control Bay-leaves Cumin Fenugreek Melissa Mint Sage
Dry
wei
gh
t (g
)
Dry weight of A. carbonarius in culture with total phenolic extracts and essential oils
Phenolic extracts
Essential oils 1 µL.mL-1
Essential oils 5 µL.mL-1
a aa a a
a a
aaa
a
a
aa
a
a
*b
*b *b

Chapitre 1
84
Figure 4. Graphical comparison between the effects of phenolic extracts and essential oils at 1 and 5 µL
mL−1 on the ochratoxin A (OTA) produced by A. carbonariuss S402 cultured in a synthetic grape medium
at 28 °C for 4 days. Statistical differences are indicated as: * = significant difference (p < 0.05). Data with
the same letters are not significantly different (p < 0.05).
Results showed that neither the EOs nor phenolic extracts were able to completely block the
growth of A. carbonarius S402. In fact, none of the six EOs (bay leaves, cumin, fenugreek mint, melissa,
and sage) significantly affected the dry weight of the studied fungus. On the other hand, the cumin,
fenugreek, and sage phenolic extracts increased the fungal weight instead of reducing it, by 30.3% for
the cumin and 22% equally for the fenugreek and sage. These weight increments were in correlation
with the sporulation of A. carbonarius that was also increased by these extracts, whereas the phenolic
extracts of the bay leaves, melissa, and mint did not significantly reduce the fungal weight of A.
carbonarius. Concerning the OTA production, both phenolic extracts and EOs acted differently when added to A.
carbonarius cultures. For example, some EOs at 1 and 5 µL mL−1 severely affected the OTA, while the phenolic
extracts had a mild impact on the production of that toxin. More particularly, cumin EO at 1 µL mL−1 as well
as its phenolic extract reduced equally the OTA by 37.3%, while at 5 µL mL−1 the OTA levels reached a
reduction of 69.5%. The melissa phenolic extracts reduced the OTA by 32.3%, by 78% with the EO at 1 µL
mL−1, and 80% with the corresponding EO at 5 µL mL−1. The fenugreek and bay leaves showed irregularity in this topic. In fact, adding 1 µL mL−1 of
fenugreek EO to the SGM medium enhanced OTA production by 45.1% while at 5 µL mL−1 this toxin production was reduced by 60%, while the total phenolic extracts of these seeds reduced it by 32%. As
for the bay leaves, their EO at 1 and 5 µL mL−1 equally decreased the OTA by 72%, unlike their phenolic extracts, which increased the level of this mycotoxin by 24.5%.
Surprisingly, an even reduction of OTA reaching 25% was observed when the sage phenolic
extract and EO (at both concentrations) were added to the culture medium. The mint phenolic extracts
and EOs acted almost in the same manner, reducing OTA levels by 69% (phenolic extracts), 60% and
70% for the EO at 1 and 5 µL mL−1, respectively. As for the results of the five remaining phenolic extracts (anise, chamomile, fennel, rosemary, and
thyme), their effects on radial growth, dry weight, and OTA production are represented in Table 2.
Antioxidants 2017, 6, 44 6 of 11
0
20
40
60
80
100
120
Control Bay-leaves Cumin Fenugreek Melissa Mint Sage
OT
A p
rod
uct
ion
(n
g.m
L−
1.
g−
1)
OTA production by A. carbonarius in culture with total phenolic extracts and EOs
Phenolic extracts
Essential oils 1 µL.mL-
1
Essential oils 5 µL.mL-
1
a
*b
*c *c*c *c
*c
*d *d*d
*d
*e
*f
*g*g *
g
*h *h
*f
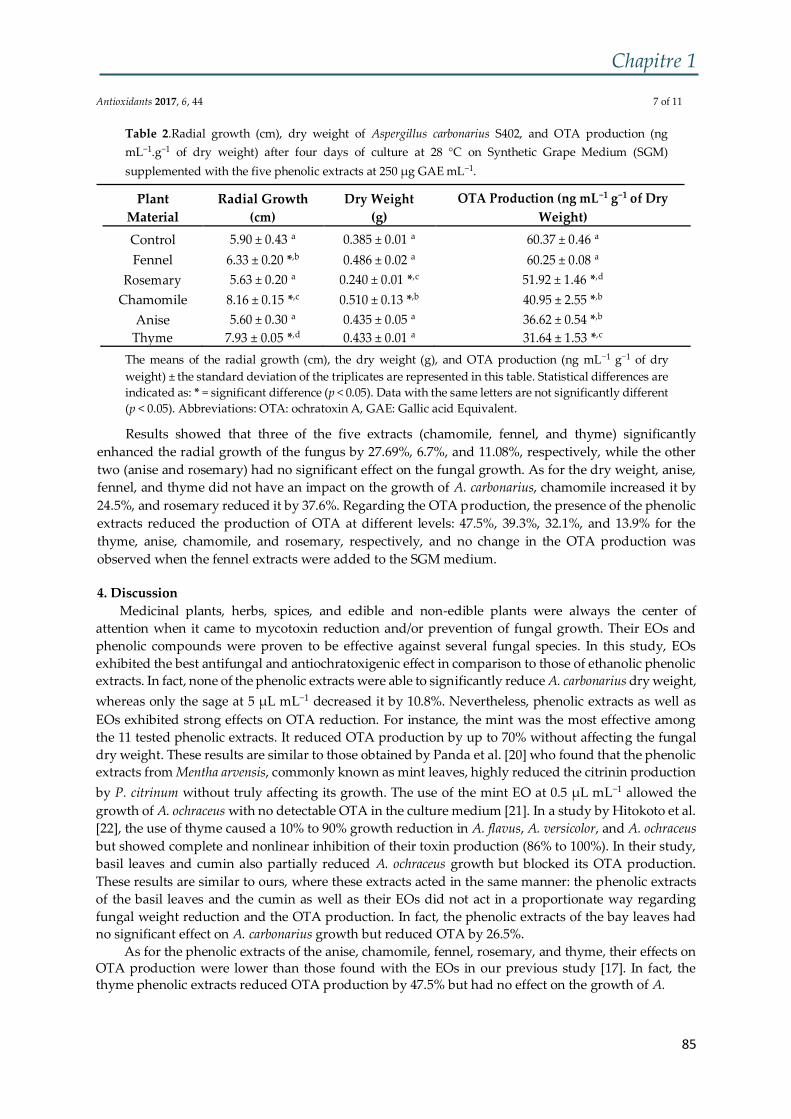
Chapitre 1
85
Table 2.Radial growth (cm), dry weight of Aspergillus carbonarius S402, and OTA production (ng
mL−1.g−1 of dry weight) after four days of culture at 28 °C on Synthetic Grape Medium (SGM)
supplemented with the five phenolic extracts at 250 µg GAE mL−1.
Plant Radial Growth Dry Weight OTA Production (ng mL−1 g−1 of Dry
Material (cm) (g) Weight)
Control 5.90 ± 0.43 a 0.385 ± 0.01 a 60.37 ± 0.46 a
Fennel 6.33 ± 0.20 *,b 0.486 ± 0.02 a 60.25 ± 0.08 a
Rosemary 5.63 ± 0.20 a 0.240 ± 0.01 *,c 51.92 ± 1.46 *,d
Chamomile 8.16 ± 0.15 *,c 0.510 ± 0.13 *,b 40.95 ± 2.55 *,b
Anise 5.60 ± 0.30 a 0.435 ± 0.05 a 36.62 ± 0.54 *,b Thyme 7.93 ± 0.05 *,d 0.433 ± 0.01 a 31.64 ± 1.53 *,c
The means of the radial growth (cm), the dry weight (g), and OTA production (ng mL−1 g−1 of dry
weight) ± the standard deviation of the triplicates are represented in this table. Statistical differences are
indicated as: * = significant difference (p < 0.05). Data with the same letters are not significantly different
(p < 0.05). Abbreviations: OTA: ochratoxin A, GAE: Gallic acid Equivalent.
Results showed that three of the five extracts (chamomile, fennel, and thyme) significantly
enhanced the radial growth of the fungus by 27.69%, 6.7%, and 11.08%, respectively, while the other
two (anise and rosemary) had no significant effect on the fungal growth. As for the dry weight, anise,
fennel, and thyme did not have an impact on the growth of A. carbonarius, chamomile increased it by
24.5%, and rosemary reduced it by 37.6%. Regarding the OTA production, the presence of the phenolic
extracts reduced the production of OTA at different levels: 47.5%, 39.3%, 32.1%, and 13.9% for the
thyme, anise, chamomile, and rosemary, respectively, and no change in the OTA production was
observed when the fennel extracts were added to the SGM medium. 4. Discussion
Medicinal plants, herbs, spices, and edible and non-edible plants were always the center of
attention when it came to mycotoxin reduction and/or prevention of fungal growth. Their EOs and
phenolic compounds were proven to be effective against several fungal species. In this study, EOs
exhibited the best antifungal and antiochratoxigenic effect in comparison to those of ethanolic phenolic
extracts. In fact, none of the phenolic extracts were able to significantly reduce A. carbonarius dry weight,
whereas only the sage at 5 µL mL−1 decreased it by 10.8%. Nevertheless, phenolic extracts as well as
EOs exhibited strong effects on OTA reduction. For instance, the mint was the most effective among
the 11 tested phenolic extracts. It reduced OTA production by up to 70% without affecting the fungal
dry weight. These results are similar to those obtained by Panda et al. [20] who found that the phenolic
extracts from Mentha arvensis, commonly known as mint leaves, highly reduced the citrinin production
by P. citrinum without truly affecting its growth. The use of the mint EO at 0.5 µL mL−1 allowed the
growth of A. ochraceus with no detectable OTA in the culture medium [21]. In a study by Hitokoto et al.
[22], the use of thyme caused a 10% to 90% growth reduction in A. flavus, A. versicolor, and A. ochraceus
but showed complete and nonlinear inhibition of their toxin production (86% to 100%). In their study,
basil leaves and cumin also partially reduced A. ochraceus growth but blocked its OTA production.
These results are similar to ours, where these extracts acted in the same manner: the phenolic extracts
of the basil leaves and the cumin as well as their EOs did not act in a proportionate way regarding
fungal weight reduction and the OTA production. In fact, the phenolic extracts of the bay leaves had
no significant effect on A. carbonarius growth but reduced OTA by 26.5%. As for the phenolic extracts of the anise, chamomile, fennel, rosemary, and thyme, their effects on
OTA production were lower than those found with the EOs in our previous study [17]. In fact, the thyme phenolic extracts reduced OTA production by 47.5% but had no effect on the growth of A.
Antioxidants 2017, 6, 44 7 of 11

Chapitre 1
86
carbonarius. The EO of the thyme acted differently: at 5 µL mL−1 it completely blocked the fungal
growth, and at 1 µL mL−1 it reduced OTA by up to 90% (this reduction was in correlation with growth
reduction). As for the anise, chamomile, and rosemary, their capacity on reducing OTA production was lower than their corresponding EOs: anise phenolic extracts only reduced OTA by 35.25% although its
EO reduced it by 76.6% and 83.9% (at 1 and 5 µL mL−1, respectively). Chamomile phenolic extracts
reduced it by 32.16%, its EO at 1 µL mL−1 by 67.5%, and at 5 µL mL−1 by 78.1%. The same reduction
profile was obtained with the phenolic extracts and EOs of the rosemary: the OTA was reduced by
14.01% with the phenolic extracts, 53.7% and 78.3% with rosemary EO when used at 1 and 5 µL mL−1,
respectively. Surprisingly, the fennel phenolics did not reduce OTA although its EO at 5 µL mL−1
reduced it by 88.9% (the highest reduction obtained in our previous study). These differences may be attributed to the role of the active ingredients of the EOs that are implicated in the repression of the OTA biosynthetic genes expression of A. carbonarius (reductions reached 99.2% for the acpks gene
responsible for the early steps of OTA biosynthesis). Despite the rarity of studies on the antifungal and antimycotoxigenic effects of total phenolic
extract, the active components found in these extracts were thoroughly studied. In general, eugenol
(basil), vanillic acid (sage), caffeic acid (mint), rosmarinic acid (mint), p-coumaric acid (cumin), and
cinnamic derivatives (bay leaves) are the main active component responsible for the antioxidant activity
of the phenolic extracts [23–27]. The caffeic, cinnamic, ferulic and vanillic acids were proven to control
aflatoxigenic fungi and AFB1 production as well as fumonisin on maize during storage [28,29].
Likewise, Palumbo et al. [30] found that OTA can be reduced by the use of different phenolic
antioxidant such as 4-hydroxybezoic acid on A. carbonarius, A. sulphureus, A. alliaceus, and A. lanosus,
vanillic acid on A. albertensis and A. elegans, as well as catechin on A. sulphureus. Some authors reported that the antioxidant activity of different plant extracts depends on their phenolic
content, while others found no such correlation, because of the presence of other active ingredients in each
plant [31–33]. Moreover, da Cruz Cabral, et al. [34] stated that the potential of plant extracts to decrease
fungal growth and/or mycotoxin production depends on their composition and the nature of the solvent
used for the extraction. In fact, the solvents with a polar nature have a better penetration capacity than none
polar ones, enabling them to extract a wider variety of compounds from the plant tissues. The acetone that
we used in this study, as well as the methanol was found to be the best solvents for the extraction of
antifungal compounds [35,36]. Furthermore, the type of the phenolic structure was proven to be more
important than the concentration: molecules with a hydroxyl group having a system of delocalized electrons
in the phenolic structure have the highest antioxidant activity [37]. To date, the mechanisms of action of
active compounds in plant extracts are not completely understood. Nevertheless, numerous authors support
the idea of the existence of three aspects for their inhibitory functions: first, the enzymes responsible for
intracellular functions can be altered by the presence of −OH groups, and are able to form hydrogen bonds
with those enzymes. Secondly, the rigidity and integrity of the hypha cell wall can be lost due to the
interaction of these compounds with the membrane enzymes of the fungi. Lastly, the rupture of the
cytoplasmic membrane can be achieved by the change of permeability of the cell membranes and granulation
of the cytoplasm. In addition, the hydrophobicity of certain compounds found in the EOs extracts allows
them to cross the cell membrane and change their permeability for cations such as H+ and K+, thus changing
the flow of protons and the pH of the cells, affecting their chemical compositions and activities [34]. Phenolic
compounds are also capable of altering the fungal cell permeability, resulting in the loss of macromolecules
from the cell interior and interacting with the proteins of the membrane, leading to their structure and
functionality deformation [38]. As for the phenolic extracts and EOs that enhanced OTA production, such as bay leaves extracts
and fenugreek EO at 1 µL mL−1, Prakash et al. [39] reported that the use of low concentrations of Piper
betle L. EO on A. flavus cultures increased AFB1 production, implicating that low fungicide doses create
some stress condition which was responsible for the production of more secondary metabolites as a
defense mechanism by the fungus. The same observation was noted by Wu et al. [40] who found that
F. oxysporum biomass was reduced with ferulic acid that increased its mycotoxin production by 227.7%.
Antioxidants 2017, 6, 44 8 of 11
Chapitre 1
87
The different macroscopic aspects of A. carbonarius S402 between the control and the treated
samples were highly noticed in this study. In fact, the extracts enhanced radial growth, and reduced
the sporulation of the fungus, resulting in OTA reduction. For example, adding 250 µL mL−1 of cumin
phenolic extracts to SGM medium caused a radial growth increment (47.8%), OTA reduction (37.3%),
and the cultures were dominated by the presence of white mycelium. These transformations were observed by Ferreira et al. [41] who found that the use of curcumin EO at 1% on A. flavus cultures did
not only reduce sporulation by 95.78%, but also decreased the viability of the remaining spores to 100%.
A. parasiticus manifested the same results when it was cultured with thyme’s EO. In fact, after 5 days of
culture, its sporulation capacity was reduced by 95% [42]. 5. Conclusion
The natural chemical structure of phenolic compounds and essential oils provides them with the
potential of being acceptable antifungal and antimycotoxigenic agents for application on food matrices.
This study demonstrated that EOs could strongly reduce OTA rather than reducing the growth of A.
carbonarius. They are more efficient than the phenolic compounds extracted from the same plants,
reaching 70% and 80% for the EOs of the melissa and mint, respectively. As for the total phenolic
extracts such as mint, anise, and thyme, they were capable of only partially reducing OTA production
(69%, 35.25%, and 47.5%, respectively). This study is a first step toward reducing the occurrence of OTA
and its daily ingestion by humans. Nevertheless, in order for it to succeed, a deeper more detailed study
should be conducted on the efficiency of these natural compounds on other ochratoxigenic and
mycotoxigenic species.
Acknowledgments: The authors would like to thank the Research Council of Saint−Joseph University (Lebanon),
and the Polytechnic National Institute of Toulouse (INPT), as well as the French Institute−Campus France and the
National Council for Scientific Research, Lebanon (CNRS-L) for the financial support of Rachelle El Khoury. Author Contributions: Florence Mathieu, Ali Atoui, Andre El Khoury, and Richard G. Maroun conceived,
supervised, and designed the experiments. Rachelle El Khoury performed the experiments. Rachelle El Khoury,
Ali Atoui, Andre El Khoury, and Florence Mathieu wrote the paper. Ali Atoui contributed to qRT-PCR
performance and data analysis. Hiba Kawtharani and Anthony El Khoury helped with the experiments.
Conflicts of Interest: The authors declare no conflict of interest. References 1. Park, J.W.; Chung, S.H.; Kim, Y.B. Ochratoxin a in korean food commodities: Occurrence and safety
evaluation. J. Agric. Food Chem. 2005, 53, 4637–4642. 2. Pietri, A.; Bertuzzi, T.; Pallaroni, L.; Piva, G., IV. Occurrence of ochratoxin A in italian wines. Food addit.
Contam. 2001, 18, 647–654. 3. Overy, D.P.; Seifert, K.A.; Savard, M.E.; Frisvad, J.C. Spoilage fungi and their mycotoxins in commercially
marketed chestnuts. Int. J. Food Microbiol. 2003, 88, 69–77. 4. Juodeikiene, G.; Bartkiene, E.; Basinskiene, L.; Matusevicius, P. Mycotoxin decontamination aspects in food,
feed and renewables using fermentation processes.In Structure and Function of Food Engineering; In Tech Open
Access Publisher: Rijeka, Croatia, 2012. 5. Piskorska-Pliszczyńska, J.; Juszkiewicz, T. Tissue deposition and passage into eggs of ochratoxin A in
Japanese quail. J. Environ. Pathol. Toxicol. Oncol. 1989, 10, 8–10. 6. Publication, E.; Larsen, J.C. Opinion of the Scientific Panel on Contaminants in Food Chain on a Request from the
Commission Related to Ochratoxin A (OTA) as Undesirable Substance in Animal Feed; European Food Safety
Authority: Parma, Italy, 2004. 7. Mally, A.; Keim-Heusler, H.; Amberg, A.; Kurz, M.; Zepnik, H.; Mantle, P.; Völkel, W.; Hard, G.C.; Dekant, W.
Biotransformation and nephrotoxicity of ochratoxin B in rats. Toxicol.Appl. Pharmacol. 2005, 206, 43–53. 8. Stoev, S.D.; Denev, S.; Dutton, M.F.; Njobeh, P.B.; Mosonik, J.S.; Steenkamp, P.A.; Petkov, I. Complex etiology
and pathology of mycotoxic nephropathy in south african pigs. Mycotoxin Res. 2010, 26, 31–46.
Antioxidants 2017, 6, 44 9 of 11
Chapitre 1
88
9. Maruya, K.; Reddy, V.; Hayes, A.W.; Berndt, W.O. Embryocidal, fetotoxic and teratogenic effects of
ochratoxin A in rats. Toxicology 1982, 25, 175–185. 10. World Health Organization, International Agency for Research on Cancer.Some naturally occuring
substances: Food items and constituents, heterocyclic aromatic amines and mycotoxins. IARC Monogr. Eval.
Carcinog. Risk Chem. Hum. 1993, 56, 489–521. 11. Joint FAO/WHO Codex Alimentarius Commission, Joint FAO/WHO Food Standards Programme, World
Health Organization. Codex Alimentarius: Food Hygiene, Basic Texts; Food & Agriculture Org.: Rome, Italy,
2003. 12. Khalesi, M.; Khatib, N. The effects of different ecophysiological factors on ochratoxin A production.
Environ. Toxicol. Pharmacol. 2011, 32, 113–121. 13. Jayashree, T.; Subramanyam, C. Oxidative stress as a prerequisite for aflatoxin production by Aspergillus
parasiticus. Free Radic. Biol. Med. 2000, 29, 981–985. 14. Boutigny, A.L.; Barreau, C.; Atanasova-Penichon, V.; Verdal-Bonnin, M.N.; Pinson-Gadais, L.; Richard-
Forget, F. Ferulic acid, an efficient inhibitor of type B trichothecene biosynthesis and Tri gene expression in
Fusarium liquid cultures. Mycol. Res. 2009, 113, 746–753. 15. Kim, J.H.; Yu, J.; Mahoney, N.; Chan, K.L.; Molyneux, R.J.; Varga, J.; Bhatnagar, D.; Cleveland, T.E.; Nierman,
W.C.; Campbell, B.C. Elucidation of the functional genomics of antioxidant-based inhibition of aflatoxin
biosynthesis. Int. J. Food Microbiol. 2008, 122, 49–60. 16. Passone, M.; Resnik, S.; Etcheverry, M. In vitro effect of phenolic antioxidants on germination, growth and
aflatoxin b1 accumulation by peanut aspergillus section flavi. J. Appl. Microbiol. 2005, 99, 682–691. 17. El Khoury, R.; Atoui, A.; Verheecke, C.; Maroun, R.; El Khoury, A.; Mathieu, F. Essential oils modulate gene
expression and ochratoxin A production in aspergillus carbonarius. Toxins 2016, 8, 242. 18. El Khoury, A.; Rizk, T.; Lteif, R.; Azouri, H.; Delia, M.-L.; Lebrihi, A. Occurrence of ochratoxin A-and aflatoxin
B1-producing fungi in lebanese grapes and ochratoxin A content in musts and finished wines during 2004. J.
Agric. Food Chem. 2006, 54, 8977–8982. 19. Bejaoui, H.; Mathieu, F.; Taillandier, P.; Lebrihi, A. Ochratoxin A removal in synthetic and natural grape
juices by selected oenological Saccharomyces strains. J. Appl. Microbiol. 2004, 97, 1038–1044. 20. Panda, P.; Aiko, V.; Mehta, A. Effect of aqueous extracts of Mentha arvensis (mint) and Piper betle (betel) on
growth and citrinin production from toxigenic Penicillium citrinum. J. Food Sci. Technol. 2015, 52, 3466– 3474. 21. Basílico, M.Z.; Basílico, J.C. Inhibitory effects of some spice essential oils on Aspergillus ochraceus NRRL 3174
growth and ochratoxin A production. Lett. Appl. Microbiol. 1999, 29, 238–241.
22. Hitokoto, H.; Morozumi, S.; Wauke, T.; Sakai, S.; Kurata, H. Inhibitory effects of spices on growth and toxin
production of toxigenic fungi. Appl. Environ. Microbiol. 1980, 39, 818–822. 23. Oktay, M.; Gülçin, İ.; Küfrevioğlu, Ö.İ. Determination of in vitro antioxidant activity of fennel (Foeniculum
vulgare) seed extracts. LWT−Food Sci. Technol. 2003, 36, 263–271. 24. Lee, S.-J.; Umano, K.; Shibamoto, T.; Lee, K.-G. Identification of volatile components in basil (Ocimum
basilicum L.) and thyme leaves (Thymus vulgaris L.) and their antioxidant properties. Food Chem. 2005, 91, 131–
137. 25. Zheng, W.; Wang, S.Y. Antioxidant activity and phenolic compounds in selected herbs. J. Agric.Food Chem.
2001, 49, 5165–5170. 26. Shan, B.; Cai, Y.Z.; Sun, M.; Corke, H. Antioxidant capacity of 26 spice extracts and characterization of their
phenolic constituents. J. Agric.Food Chem. 2005, 53, 7749–7759. 27. Zohra, S.F.; Meriem, B.; Samira, S.; Alsayadi-Muneer, M. Phytochemical screening and identification of some
compounds from mallow. J. Nat. Prod. Plant Resour. 2012, 2, 512–516. 28. Nesci, A.; Gsponer, N.; Etcheverry, M. Natural maize phenolic acids for control of aflatoxigenic fungi on
maize. J. Food Sci. 2007, 72, M180−M185. 29. Samapundo, S.; De Meulenaer, B.; Osei−Nimoh, D.; Lamboni, Y.; Debevere, J.; Devlieghere, F. Can phenolic
compounds be used for the protection of corn from fungal invasion and mycotoxin contamination during
storage? Food Microbiol. 2007, 24, 465–473. 30. Palumbo, J.D.; O’Keeffe, T.L.; Mahoney, N.E. Inhibition of ochratoxin A production and growth of
Aspergillus species by phenolic antioxidant compounds. Mycopathologia 2007, 164, 241–248. 31. Yang, J.-H.; Lin, H.-C.; Mau, J.-L. Antioxidant properties of several commercial mushrooms. Food chem. 2002,
77, 229–235.
Chapitre 1
89
32. Maillard, M.-N.; Berset, C. Evolution of antioxidant activity during kilning: Role of insoluble bound phenolic
acids of barley and malt. J. Agric. Food Chem. 1995, 43, 1789–1793. 33. Heinonen, I.M.; Lehtonen, P.J.; Hopia, A.I. Antioxidant activity of berry and fruit wines and liquors. J. Agric.
Food Chem. 1998, 46, 25–31. 34. Da Cruz Cabral, L.; Fernandez Pinto, V.; Patriarca, A. Application of plant derived compounds to control
fungal spoilage and mycotoxin production in foods. Int. J. Food Microbiol. 2013, 166, 1–14. 35. Cakir, A.; Kordali, S.; Kilic, H.; Kaya, E. Antifungal properties of essential oil and crude extracts of Hypericum
linarioides Bosse. Biochem. Syst. Ecol. 2005, 33, 245–256. 36. Mahlo, S.M.; McGaw, L.J.; Eloff, J.N. Antifungal activity of leaf extracts from south african trees against plant
pathogens. Crop Prot. 2010, 29, 1529–1533. 37. Oliveira, M.d.S.; Furlong, E.B. Screening of antifungal and antimycotoxigenic activity of plant phenolic
extracts. World Mycotoxin J. 2008, 1, 139–146. 38. Fung, D.Y.C.; Taylor, S.U.E.; Kahan, J. Effects of butylated hydroxyanisole (BHA) and butylated
hydroxytoluene (BHT) on growth and aflatoxin production of Aspergillus flavus. J. Food Saf. 1977, 1, 39– 51. 39. Prakash, B.; Shukla, R.; Singh, P.; Kumar, A.; Mishra, P.K.; Dubey, N.K. Efficacy of chemically characterized
Piper betle L. essential oil against fungal and aflatoxin contamination of some edible commodities and its
antioxidant activity. Int. J. Food Microbiol. 2010, 142, 114–119. 40. Wu, H.-S.; Luo, J.; Raza, W.; Liu, Y.-X.; Gu, M.; Chen, G.; Hu, X.-F.; Wang, J.-H.; Mao, Z.-S.; Shen, Q.-R. Effect
of exogenously added ferulic acid on in vitroFusarium oxysporum f. Sp. niveum. Sci. Hortic. 2010, 124, 448–
453. 41. Ferreira, F.D.; Mossini, S.A.G.; Ferreira, F.M.D.; Arrotéia, C.C.; da Costa, C.L.; Nakamura, C.V.; Junior,
M.M.The inhibitory effects of Curcuma longa L. essential oil and curcumin on Aspergillus flavus link growth
and morphology. Sci. World J. 2013, 2013, 6. 42. Silva, F.C.D.; Chalfoun, S.M.; Siqueira, V.M.D.; Botelho, D.M.D.S.; Lima, N.; Batista, L.R. Evaluation of
antifungal activity of essential oils against potentially mycotoxigenic Aspergillus flavus and Aspergillus
parasiticus. Rev. Bras. Farmacogn. 2012, 22, 1002–1010.
© 2017 by the authors. Submitted for possible open access publication under the terms
and conditions of the Creative Commons Attribution (CC BY) license
(http://creativecommons.org/licenses/by/4.0/).
Chapitre 1
90
III. Conclusion
La comparaison entre les effets des huiles essentielles et des composés phénoliques
nous a permis de conclure que l’emploi de certains de ces composés n’a pas gravement
affecté la masse sèche d’A. carbonarius S402, cependant leur effet sur la production de
l’OTA était remarquable.
Effectivement, les huiles essentielles des feuilles de laurier, de la menthe et de la
mélisse ont réduit considérablement l’OTA de 72, 70 et 80% respectivement pour
chaque huile.
L’utilisation des composés phénoliques a été efficace contre la production de
l’OTA mais d’une ampleur moindre à celle des huiles essentielles, à l’exception du
fenugrec qui, son huile essentielle (à 1 µL/mL) a augmenté d’avantage la production
de l’OTA (45.1%) pourtant ses composés phénoliques l’ont inhibé (32.0%).
Afin de mieux comprendre le mode d’action des huiles essentilles qui n’ont pas
affecté la croissance fongique mais qui ont inhibé remarquablement la production de
l’OTA, nous nous sommes foaclisés dans la suite de notre travail à l’évaluation de
l’impact de ses huiles sur l’expression des gènes de biosynthèse de l’OTA chez A.
carbonarius S402.

91
92
Chapitre 2
Huiles essentielles : agents
antiochratoxinogènes, antifongiques
et réprimeurs des gènes de
biosynthèse chez Aspergillus
carbonarius
Chapitre 2
93
I. Introduction
Obtenues par hydrodistillation du matériel végétal, les huiles essentielles sont
riches en composés potentiellement bioactifs. Beaucoup sont connues pour avoir une
activité antimicrobienne grâce à leurs divers composés antioxydants, tels que les
polyphénols, les phénols, les flavonoïdes etc. Leur activité microbienne inhérente est
communément liée à la structure chimique de leurs composants actifs, à la
concentration dans laquelle ils sont présents et à leurs interactions avec la matière
vivante. Le fait qu’elles soient constituées par une grande variété de composés actifs,
leur confère d’avantages différents modes d’action, et leur donne la capacité de cibler
plusieurs fonctions au niveau de la cellule fongique. Evidemment, leur faible masse
moléculaires et propriétés lipophiles, leurs permettent de traverser la membrane
cellulaire fongique, provoquant ainsi des lésions irréversibles de la paroi et les
organelles cellulaires, ce qui leur confère leur propriétés antifongiques. D’autres
huiles essentielles ne possèdent pas un pouvoir fongicide mais sont pourtant
capables d’inhiber la production de l’OTA sans affecter significativement la masse du
champignon producteur.
Les huiles essentielles étudiées dans le Chapitre 1 ont montré une importante
capacité d’inhibition de l’OTA sans avoir inhibé la croissance fongique. Celles-ci ont
été sélectionnées afin d’évaluer leur effet sur l’expression des gènes impliqués dans
la biosynthèse de l’OTA chez A. carbonarius. Jusqu’à nos jours, uniquement trois
gènes de biosynthèse de l’OTA ont été séquencé chez ce champignon (acpks,
acOTApks et acOTAnrps) et deux gènes de régulation (veA et laeA).
Cette évaluation a été réalisée sur un milieu nommé Synthetic Grape Medium ou
SGM, dont sa composition est proche à celle du raisin, pendant 4 jours, avec une
température maintenue stable à 28 °C.

Chapitre 2
94
II. Article publié : Essential Oils Modulate Gene Expression and Ochratoxin A
Production in Aspergillus carbonarius, Toxins (8), 8-242.
TOXINS
Article
Essential Oils Modulate Gene Expression and
Ochratoxin A Production in Aspergillus carbonarius
Rachelle El Khoury 1,2, Ali Atoui 3,*, Carol Verheecke 2, Richard Maroun 1, Andre El Khoury 1 and Florence Mathieu 2
1 Laboratoire de Mycologie et Sécurité Alimentaire (LMSA), Centre d’analyse et de Recherche
(CAR), Campus des Sciences et Technologie, Université Saint-Joseph, Mkalles-Beyrouth 1107-
2050, Lebanon; [email protected] (R.E.K.); [email protected] (R.M.);
[email protected] (A.E.K.)
2 Laboratoire de Génie Chimique, Université de Toulouse, CNRS, INPT, UPS, Toulouse 31326, France; [email protected] (C.V.); [email protected] (F.M.)
3 Laboratory of Microbiology, Department of Natural Sciences and Earth, Faculty of Sciences I, Lebanese University, Hadath Campus, Beirut P.O Box 11-8281, Lebanon
* Correspondence: [email protected]; Tel.: +961-1-450-811
Academic Editor: Antonio Moretti
Received: 21 June 2016; Accepted: 9 August 2016; Published: 19 August 2016
Abstract: Ochratoxin A (OTA) is a mycotoxin, mainly produced on grapes by Aspergillus carbonarius,
that causes massive health problems for humans. This study aims to reduce the occurrence of OTA
by using the ten following essential oils (E.Os): fennel, cardamom, anise, chamomile, celery,
cinnamon, thyme, taramira, oregano and rosemary at 1 µL/mL and 5 µL/mL for each E.O. As a matter
of fact, their effects on the OTA production and the growth of A. carbonarius S402 cultures were
evaluated, after four days at 28° C on a Synthetic Grape Medium (SGM). Results showed that A.
carbonarius growth was reduced up to 100%, when cultured with the E.Os of cinnamon, taramira,
and oregano at both concentrations and the thyme at 5 µL/mL. As for the other six E.Os, their effect
on A. carbonarius growth was insignificant, but highly important on the OTA production.
Interestingly, the fennel E.O at 5 µL/mL reduced the OTA production up to 88.9% compared to the
control, with only 13.8% of fungal growth reduction. We further investigated the effect of these E.Os
on the expression levels of the genes responsible for the OTA biosynthesis (acOTApks and acOTAnrps
along with the acpks gene) as well as the two regulatory genes laeA and vea, using the quantitative
Reverse Transcription-Polymerase Chain Reaction (qRT-PCR) method. The results revealed that
these six E.Os reduced the expression of the five studied genes, where the ackps was downregulated
by 99.2% (the highest downregulation in this study) with 5 µL/mL of fennel E.O. As for the acOTApks,
Chapitre 2
95
acOTAnrps, veA and laeA, their reduction levels ranged between 10% and 96% depending on the
nature of the E.O and its concentration in the medium.
Keywords: Aspergillus carbonarius; Ochratoxin A; gene expression; essential oils
1. Introduction
Mycotoxins are secondary metabolites produced by a wide range of filamentous fungi which
have adverse effects on humans, animals and crops that result in illnesses and economic losses [1]. The
most known mycotoxins are the aflatoxins, patulin, citrinin, fumonisin B1, zearalenone and the
Ochratoxin A (OTA). In fact, OTA is produced by different species of Aspergillus and Penicillium such
as A. ochraceus, A. carbonarius, P. verrucosum and P. nordicum. However, A. carbonarius is considered to
be the main producer of OTA on coffee and grapes [2]. OTA has nephrotoxic, hepatotoxic, teratogenic,
and immunotoxic effects on several animal species [3] and was classified by the International Agency
for Research on Cancer (IARC) in 1993, as a possible human carcinogen (group 2B) [4]. Additionally,
it was associated with the acute renal failure in humans [5] and liver cancer in animals after a long-
term exposure with the molecule [6].
Chemical and physical treatments are considered to be inefficient at removing the OTA from
grapes and wine without altering their organoleptic properties [7]. Hence, the awareness of the
hazardous effects of chemical preservatives has led the scientific community to search for naturally
occurring molecules that are able to reduce OTA production without altering the fungal growth, thus
preventing its replacement by other undesired mycotoxigenic fungi.
Essential oils (E.Os), herbs and spices antimicrobial properties have been acknowledged and
used since ancient times for therapy and food preservation. Thus many studies were carried out on
their ability to reduce mycelial growth and/or mycotoxins production by different mycotoxigenic
fungi. Soliman and Badeaa [8] found that the E.Os of the thyme, cinnamon, marigold, spearmint, basil
and quyssum had inhibitory activities against the growth of A. flavus, A. parasiticus, A. ochraceus and
Fusarium verticillioides. Similar results were obtained by Basílico and Basílico [9], who found that the
mint and oregano E.Os also had a complete inhibitory effect on the growth of A. ochraceus.
To date, the biosynthetic pathway of OTA in A. carbonarius has not yet been completely elucidated
and only few genes have been discovered. However, it was confirmed by several studies that the OTA
biosynthesis pathway contains a polykétide synthase (PKS) and a non ribosomal peptide synthase
(NRPS) family. A study conducted by Gallo et al. [10] identified and characterized an acpks gene in A.
carbonarius that encodes a conserved ketosynthase and acyl transferase domains, and found that the
OTA production strongly depended on the expression levels of the acpks gene, proving the implication
of this gene in the OTA biosynthesis. Those same authors have identified the acOTApks gene that has
a different function from acpks, the previously described gene. AcOTApks encodes an AcOTApks
protein that belongs to the (HR)-PKS family, and contains a putative methyltransferase domain likely
responsible for the addition of the methyl group to the OTA polyketide structure [11]. Another
characterized OTA biosynthesis gene in A. carbonarius is the acOTAnrps which was proven to be
essential for OTA, OTα and OTB biosynthesis and is located about 900 nt upstream of a pks gene [12].
Furthermore, the OTA biosynthesis in A. carbonarius is
Toxins 2016, 8, 242 2 of 14
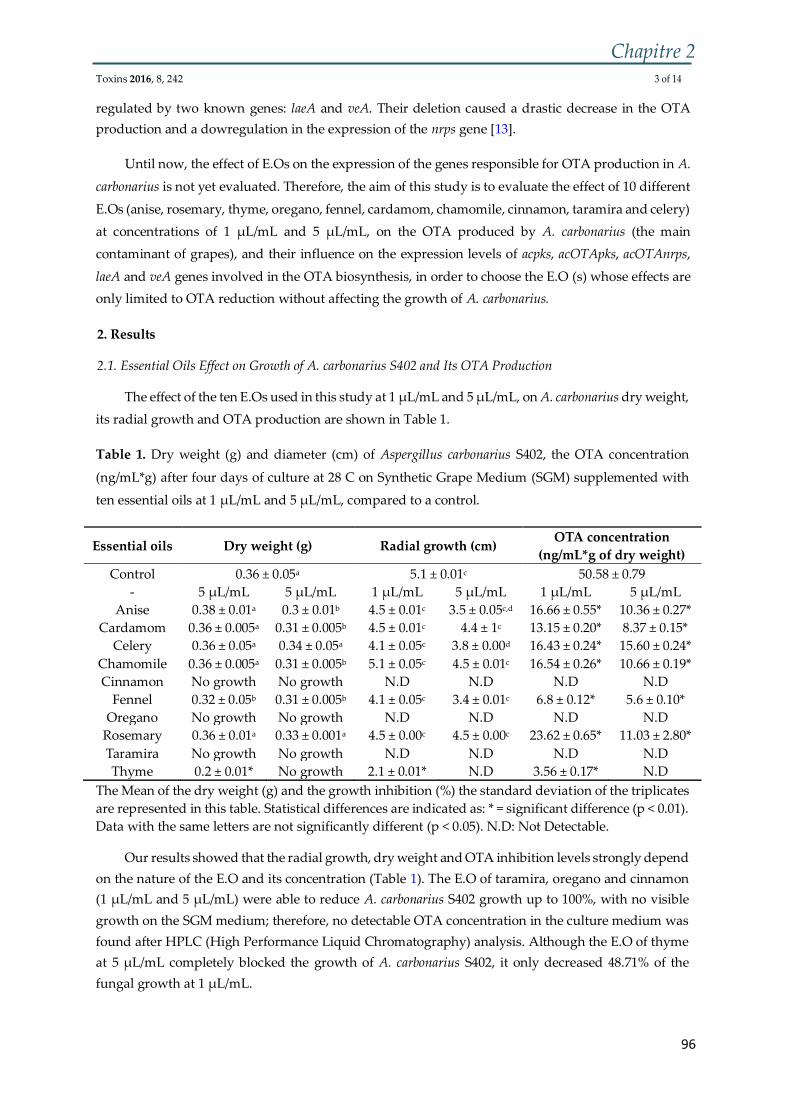
Chapitre 2
96
regulated by two known genes: laeA and veA. Their deletion caused a drastic decrease in the OTA
production and a dowregulation in the expression of the nrps gene [13].
Until now, the effect of E.Os on the expression of the genes responsible for OTA production in A.
carbonarius is not yet evaluated. Therefore, the aim of this study is to evaluate the effect of 10 different
E.Os (anise, rosemary, thyme, oregano, fennel, cardamom, chamomile, cinnamon, taramira and celery)
at concentrations of 1 µL/mL and 5 µL/mL, on the OTA produced by A. carbonarius (the main
contaminant of grapes), and their influence on the expression levels of acpks, acOTApks, acOTAnrps,
laeA and veA genes involved in the OTA biosynthesis, in order to choose the E.O (s) whose effects are
only limited to OTA reduction without affecting the growth of A. carbonarius.
2. Results
2.1. Essential Oils Effect on Growth of A. carbonarius S402 and Its OTA Production
The effect of the ten E.Os used in this study at 1 µL/mL and 5 µL/mL, on A. carbonarius dry weight,
its radial growth and OTA production are shown in Table 1.
Table 1. Dry weight (g) and diameter (cm) of Aspergillus carbonarius S402, the OTA concentration
(ng/mL*g) after four days of culture at 28 C on Synthetic Grape Medium (SGM) supplemented with
ten essential oils at 1 µL/mL and 5 µL/mL, compared to a control.
The Mean of the dry weight (g) and the growth inhibition (%) the standard deviation of the triplicates
are represented in this table. Statistical differences are indicated as: * = significant difference (p < 0.01).
Data with the same letters are not significantly different (p < 0.05). N.D: Not Detectable.
Our results showed that the radial growth, dry weight and OTA inhibition levels strongly depend
on the nature of the E.O and its concentration (Table 1). The E.O of taramira, oregano and cinnamon
(1 µL/mL and 5 µL/mL) were able to reduce A. carbonarius S402 growth up to 100%, with no visible
growth on the SGM medium; therefore, no detectable OTA concentration in the culture medium was
found after HPLC (High Performance Liquid Chromatography) analysis. Although the E.O of thyme
at 5 µL/mL completely blocked the growth of A. carbonarius S402, it only decreased 48.71% of the
fungal growth at 1 µL/mL.
Toxins 2016, 8, 242 3 of 14
Essential oils Dry weight (g) Radial growth (cm) OTA concentration
(ng/mL*g of dry weight)
Control 0.36 ± 0.05a 5.1 ± 0.01c 50.58 ± 0.79
‐ 5 µL/mL 5 µL/mL 1 µL/mL 5 µL/mL 1 µL/mL 5 µL/mL
Anise 0.38 ± 0.01a 0.3 ± 0.01b 4.5 ± 0.01c 3.5 ± 0.05c,d 16.66 ± 0.55* 10.36 ± 0.27*
Cardamom 0.36 ± 0.005a 0.31 ± 0.005b 4.5 ± 0.01c 4.4 ± 1c 13.15 ± 0.20* 8.37 ± 0.15*
Celery 0.36 ± 0.05a 0.34 ± 0.05a 4.1 ± 0.05c 3.8 ± 0.00d 16.43 ± 0.24* 15.60 ± 0.24*
Chamomile 0.36 ± 0.005a 0.31 ± 0.005b 5.1 ± 0.05c 4.5 ± 0.01c 16.54 ± 0.26* 10.66 ± 0.19*
Cinnamon No growth No growth N.D N.D N.D N.D
Fennel 0.32 ± 0.05b 0.31 ± 0.005b 4.1 ± 0.05c 3.4 ± 0.01c 6.8 ± 0.12* 5.6 ± 0.10*
Oregano No growth No growth N.D N.D N.D N.D
Rosemary 0.36 ± 0.01a 0.33 ± 0.001a 4.5 ± 0.00c 4.5 ± 0.00c 23.62 ± 0.65* 11.03 ± 2.80*
Taramira No growth No growth N.D N.D N.D N.D
Thyme 0.2 ± 0.01* No growth 2.1 ± 0.01* N.D 3.56 ± 0.17* N.D
Chapitre 2
97
E.Os of the fennel, cardamom, chamomile, rosemary, anise and the celery at 1 µL/mL and 5
µL/mL, showed a slight effect on the dry weight and radial growth of A. carbonarius S402 but a
significant impact on the OTA production. A reduction of 88.9% in OTA was reached when 5 µL/mL
of fennel E.O was added to the SGM medium, while it only reduced 13% of the fungal growth.
Additionally, this E.O at 1 µL/mL was able to reduce the OTA to 86.6%, with no significant impact on
the radial growth (33.3%) and the dry weight (11%). Cardamom, chamomile, rosemary, anise and
celery E.Os at 1 µL/mL, also had an important effect in OTA reduction that reached 74.2%, 67.5,%
53.7%, 76.6%, and 68.5% respectively, with growth reduction that ranged between 0% and 11%
(cardamom and celery (0%), anise (5%), chamomile and rosemary (11%)). OTA reduction was higher,
when the E.O concentrations were at 5 µL/mL reaching 83.5% for cardamom E.O with only 13% of dry
weight reduction. The OTA reduction percentages were almost the same for the E.Os of chamomile
(79.1%), rosemary (78.3%), and celery (77.1%), with a growth reduction of 13%, 8% and 5%,
respectively. Lastly, the E.O of anise reduced the fungal growth to 16% with 83.9% of OTA
concentration reduction.
2.2. Microscopic Morphology Evaluation
Scanning Electron Microscopy (SEM) of A. carbonarius S402 treated with 1 µL/mL and 5 µL/mL
of fennel E.O compared to untreated samples showed that the application of the fennel E.O at 1 µL/mL
did not affect the size of the conidial head. For instance, the conidial head of the untreated samples
measured 107 µm (Figure 1A), similar to the treated sample with 1 µL/mL (102 µm) (Figure 1C). When
the SGM medium was supplemented with 5 µL/mL of fennel E.O, the results were different: the
conidial head was smaller and more compact than those in control condition, and measured 84 µm
(Figure 1E), i.e., 21.4% lesser than the control.
Toxins 2016, 8, 242 4 of 14
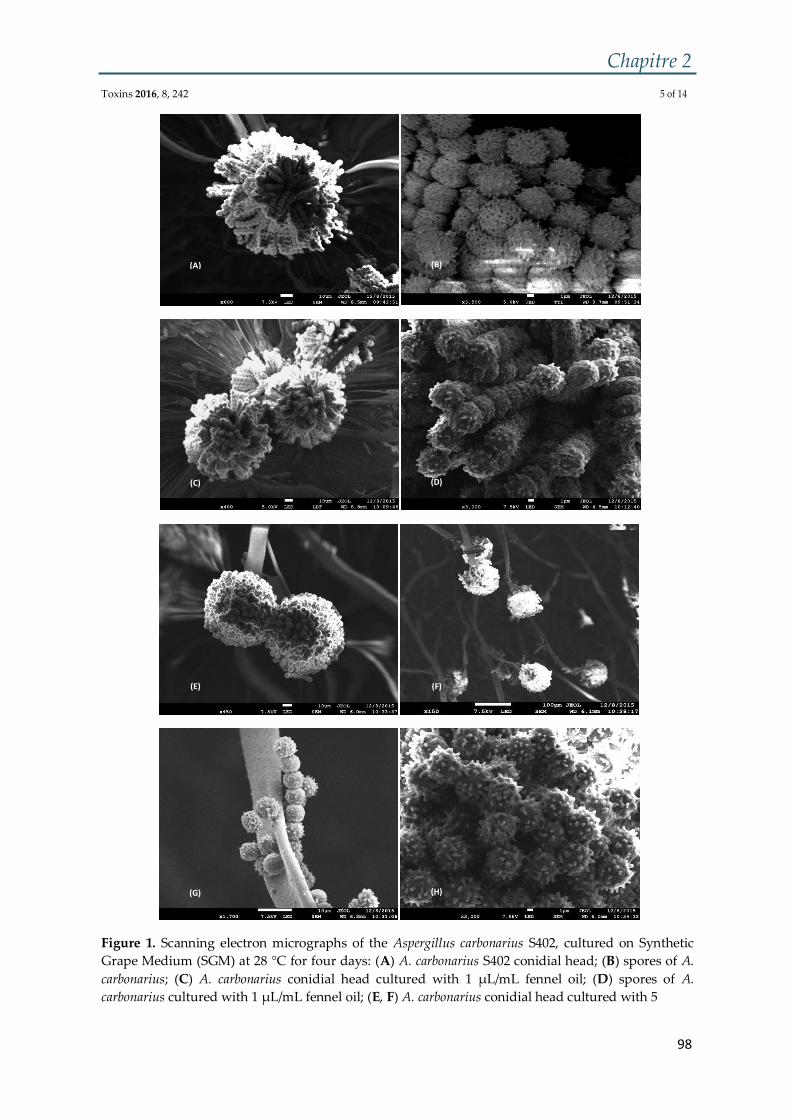
Chapitre 2
98
Figure 1. Scanning electron micrographs of the Aspergillus carbonarius S402, cultured on Synthetic
Grape Medium (SGM) at 28 °C for four days: (A) A. carbonarius S402 conidial head; (B) spores of A.
carbonarius; (C) A. carbonarius conidial head cultured with 1 µL/mL fennel oil; (D) spores of A.
carbonarius cultured with 1 µL/mL fennel oil; (E, F) A. carbonarius conidial head cultured with 5
Toxins 2016, 8, 242 5 of 14
(A) (B)
(C) (D)
(E) (F)
(G) (H)
Chapitre 2
99
µL/mL fennel oil; (G) conidiophores of A. carbonarius cultured with 5 µL/mL fennel oil with
abnormally placed spores; and (H) spores of A. carbonarius cultured with 5 µL/mL fennel oil.
As for the spore concentration, a non-significant variation was observed between the untreated
A. carbonarius and the cultures treated with 1 µL/mL and 5 µL/mL of fennel E.O. In fact, the results
showed that the untreated samples had a concentration of 17 x 166 spores/mL, whereas the cultures
treated with 1 µL/mL and 5 µL/mL of fennel E.O had a concentrations of 15.8 x 10⁶ spores/mL and
16.1 x 10⁶ spores/mL respectively.
2.3. Analysis of Genes Expression Involved in OTA Biosynthesis by A. carbonarius
To better understand the OTA reduction by the E.Os that did not affect the fungal growth, the
expressions of two known biosynthetic genes involved in the OTA biosynthesis (acOTApks and
acOTAnrps) as well as the acpks gene and the two regulatory genes (veA and laeA) were evaluated by
qRT-PCR.
The expression levels of the target genes were normalized by the expression of the reference
gene (β-tubulin was chosen as reference gene, as shown in the Supplementary Material, Figure S1)
and were expressed relative to the control. Table 2 shows the relative expression values of the target
genes of A. carbonarius S402 cultured with the six E.Os, along with the OTA reduction.
Results showed that expression level of the target genes in the presence of 1 µL/mL of E.Os varied
depending on the nature of the E.O. In fact the E.O of the chamomile, was able to significantly
downregulate all the target genes. Others, such as cardamom, rosemary, anise, fennel and celery E.Os,
were only able to affect specific genes but had no effect on the others. As a matter of fact, the acpks
was significantly downregulated when A. carbonarius was cultured with the six E.Os at 1 µL/mL.
Notably, its expression was reduced by 96% by the E.O of the fennel, 50% and 90% by the celery and
rosemary E.Os respectively, accompanied by an OTA reduction that reached 86.9%, 68.8% and 53.7%
respectively for each E.O. As for the cardamom, chamomile and anise E.Os, they were able to equally
reduce this gene expression by 80% and had approximately the same effect on OTA production, as
they reduced it to 74.2% and 76.9% by cardamom and anise E.O, respectively, and to 67.5% by the
chamomile E.O.
As for the acOTApks, its expression was not downregulated by all of the six E.Os. In fact, E.O of
the rosemary had no significant effect on this gene’s expression while the other tested E.Os reduced
the acOTApks by 99%, 86%, 88%, 81% and 76% for the fennel, cardamom, chamomile, anise and celery
E.Os, respectively. While acOTAnrps expression was equally reduced by the E.Os of cardamom,
chamomile and rosemary by 80%, its expression was not affected by the fennel, celery and anise E.Os.
Regarding the regulatory genes veA and laeA, they were both not affected by the E.Os of the
anise and celery. The veA expression was reduced by approximately 90% with the E.Os of the fennel
and rosemary, along with 55% and 63% by the E.Os of cardamom and chamomile respectively. As
for the laeA, it was downregulated by 92%, 71% and 80% with the E.Os of the
Toxins 2016, 8, 242 6 of 14
Toxins 2016, 8, 242 7 of 14
Chapitre 2
100
fennel, chamomile and rosemary respectively. However, the E.O of the cardamom had no significant
effect on the laeA expression.
At 5 µL/mL, the six E.Os were able to significantly reduce the expressions of the five studied
genes. For instance, the acpks was highly downregulated by the E.O of the fennel, reaching 99.2% of
reduction, followed by the chamomile, rosemary, cardamom and celery E.Os with 98%, 95%, 90%,
85% and 70% reduction, respectively.
As for the acOTApks, its expression was reduced up to 99.9% with the fennel E.O, the highest
gene downregulation in this study. Moreover, this E.O decreased the OTA production up to 88.6%
yet reduced the fungal growth by only 13.6%. The E.Os of the cardamom, rosemary and chamomile
also had major effects on the expression of the acOTApks. In fact they reduced its expression by 98%,
96% and 95%, respectively, coupled with an OTA reduction by 83.5%, 78.3% and 79.1%, respectively,
for each E.O. In addition, celery and anise E.Os downregulated acOTApks by 81%, and 86%
respectively as well as the OTA production by 77.1% and 83.9% for each E.O respectively. As for the
E.O of fennel, rosemary and anise, they were able to reduce the acOTAnrps expression by 98% for
both fennel and rosemary, and 99% for anise. Regarding the rest of the E.Os, the cardamom, celery
and chamomile, they also reduced this gene expression by 84%, 82% and 52% respectively.
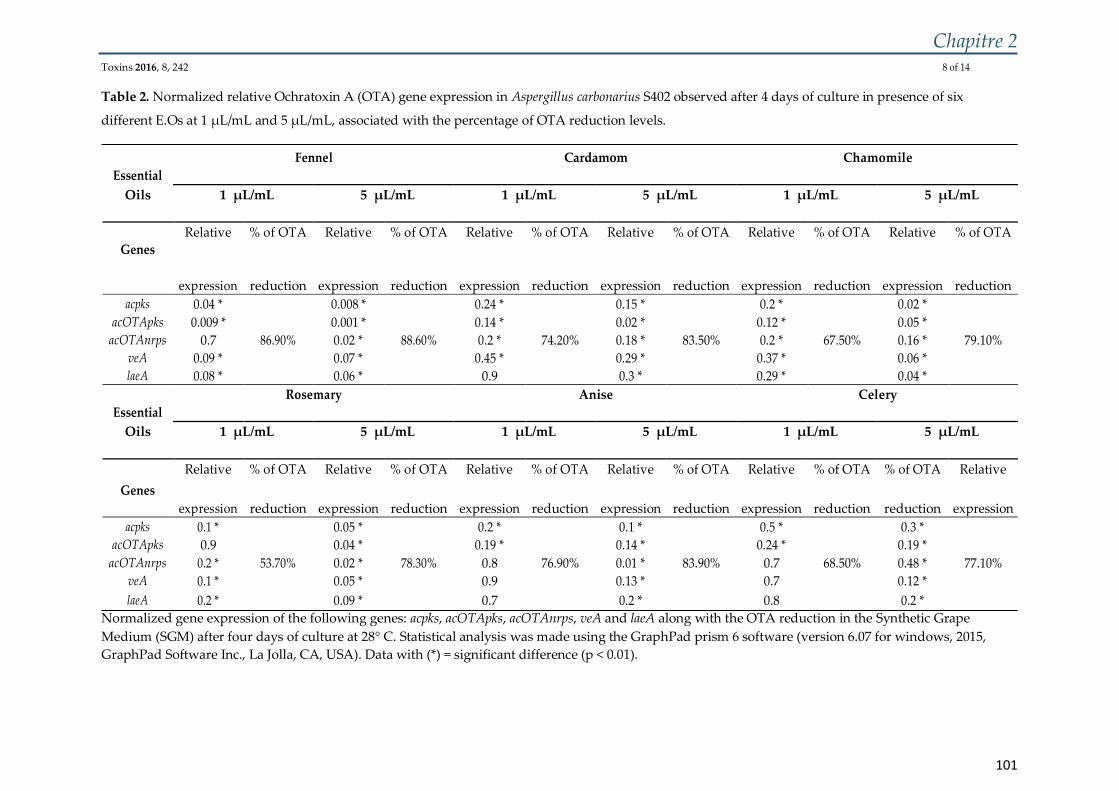
Chapitre 2
101
Table 2. Normalized relative Ochratoxin A (OTA) gene expression in Aspergillus carbonarius S402 observed after 4 days of culture in presence of six
different E.Os at 1 µL/mL and 5 µL/mL, associated with the percentage of OTA reduction levels.
Essential
Fennel Cardamom Chamomile
Oils 1 µL/mL 5 µL/mL 1 µL/mL 5 µL/mL 1 µL/mL 5 µL/mL
Genes
Relative % of OTA Relative % of OTA Relative % of OTA Relative % of OTA Relative % of OTA Relative % of OTA
expression reduction expression reduction expression reduction expression reduction expression reduction expression reduction
acpks 0.04 * 0.008 * 0.24 * 0.15 * 0.2 * 0.02 *
acOTApks 0.009 * 0.001 * 0.14 * 0.02 * 0.12 * 0.05 *
acOTAnrps 0.7 86.90% 0.02 * 88.60% 0.2 * 74.20% 0.18 * 83.50% 0.2 * 67.50% 0.16 * 79.10%
veA 0.09 * 0.07 * 0.45 * 0.29 * 0.37 * 0.06 *
laeA 0.08 * 0.06 * 0.9 0.3 * 0.29 * 0.04 *
Essential
Rosemary Anise Celery
Oils 1 µL/mL 5 µL/mL 1 µL/mL 5 µL/mL 1 µL/mL 5 µL/mL
Genes
Relative % of OTA Relative % of OTA Relative % of OTA Relative % of OTA Relative % of OTA % of OTA Relative
expression reduction expression reduction expression reduction expression reduction expression reduction reduction expression
acpks 0.1 * 0.05 * 0.2 * 0.1 * 0.5 * 0.3 *
acOTApks 0.9 0.04 * 0.19 * 0.14 * 0.24 * 0.19 *
acOTAnrps 0.2 * 53.70% 0.02 * 78.30% 0.8 76.90% 0.01 * 83.90% 0.7 68.50% 0.48 * 77.10%
veA 0.1 * 0.05 * 0.9 0.13 * 0.7 0.12 *
laeA 0.2 * 0.09 * 0.7 0.2 * 0.8 0.2 *
Normalized gene expression of the following genes: acpks, acOTApks, acOTAnrps, veA and laeA along with the OTA reduction in the Synthetic Grape
Medium (SGM) after four days of culture at 28° C. Statistical analysis was made using the GraphPad prism 6 software (version 6.07 for windows, 2015,
GraphPad Software Inc., La Jolla, CA, USA). Data with (*) = significant difference (p < 0.01).
Toxins 2016, 8, 242 8 of 14
Chapitre 2
102
Finally the veA and laeA expressions were nearly the same when A. carbonarius was cultured with
the E.Os of the fennel (93% and 94%), cardamom (71% and 70%), chamomile (94% and 96%), rosemary
(95% and 91%), anise (87% and 80%) and lastly celery (88% and 80%), respectively, for each gene.
3. Discussion
Until now, studies have shown that the E.Os can reduce OTA production by reducing fungal
growth. Nevertheless, few were able to prove that OTA could also be inhibited without significantly
reducing the fungal growth. To that purpose, this work was dedicated to finding an E.O capable of
reducing the OTA produced by A. carbonarius, without significantly altering its growth, thus preserving
the natural balance of the microbial ecosystem and mostly preventing the occurrence of other
mycotoxigenic fungi.
However, few works were able to prove that the reduction of OTA production could be associated
with the downregulation of the expression of genes responsible for the OTA biosynthesis in A.
carbonarius. In this study, we investigated the effects of ten E.Os on OTA production by A. carbonarius
S402 and we found that four of these E.Os, taramira, oregano, cinnamon and thyme, completely
blocked OTA production by preventing the growth of A. carbonarius S402 cultures. These findings are
consistent with other studies found in the literature, which tested the effect of some E.Os on the growth
of other mycotoxigenic fungi. In fact, Hua et al. [14] found that A. ochraceus fungal growth was
completely blocked by using the E.O of cinnamon, a natural and synthetic cinnamaldehyde with a
concentration of 500 µL/L for the three E.Os. Moreover, the antifungal activities of the cinnamon was
studied over the years and proven to be effective against mould growth [8,15–17]. These results
regarding the E.O of the cinnamon are consistent with our results, stating that the growth of A.
carbonarius S402 was completely blocked with the use of this E.O. The oregano E.O also had a great
antifungal activity, preventing the growth of A. niger, F. oxysporum and Penicillium spp. in YES broth,
at a concentration of 0.1 mL/mL [18]. Additionally, the carvacrol and thymol were identified as the
main components of the oregano E.O, responsible for its antifungal activities [19–21]. Similarly, the E.O
of the thyme also showed an antifungal effect on the growth of F. verticillioides, A. parasiticus, A. flavus
and A. parasiticus due to the presence of the thymol, thyme’s main component [22–24].
However, the E.O of anise, fennel, cardamom and chamomile did not show a significant antifungal
activity against A. carbonarius at the concentrations used in this study. The E.O of anise at 1500 µL/L,
when used on A. ochraceus on a Malt Extract Agar medium (MEA) [14] did not show a significant effect
on the growth of the fungus, which similar to our results but contradict those of Soliman and Badeaa
[8] who found that at 500 ppm, this E.O blocked the growth of A. flavus, A. ochraceus, A. parasiticus and
F. verticillioides on PDA medium (Potato Dextrose Agar) after 5–7 days of culture. Furthermore, these
same authors found that the E.O of the fennel at 3000 ppm blocked the growth of the four tested fungi,
also contradicting with our results, stating that, even at 5 µL/mL (0.5%), this E.O only reduced A.
carbonarius S402 growth by 13.8% compared to a control. A study conducted by Bansod and Rai [25]
showed that the MIC of the fennel E.O against the growth of A.
Toxins 2016, 8, 242 9 of 14
Toxins 2016, 8, 242 10 of 14
Chapitre 2
103
fumigatus and A. niger was at 2% of this E.O, which means that in order to block the growth of these
two fungi, a concentration 4 times higher than ours was needed. The reasons behind these differences
could be numerous; first of all, they may be associated with the fact that in our study, we did not extract
the E.Os from the plants but instead we bought them from the market; consequently, the extraction
methods may vary and alter the antifungal activity of the E.Os. Furthermore, different species of fungi
do not have similar spores density or similar growth rates (A. carbonarius has a negligible ratio of (spores
dry weight)/(biomass dry weight) on DG18 agar medium compared to A. flavus and A. ochraceus, but it
has a significantly higher biomass density than the other two fungi due to its larger conidial size
compared to A. flavus and A. ochraceus, respectively) [26], consequently causing the E.Os to perform
differently on different fungal species. Lastly, these contradictions may be associated with the different
types of media used in both studies along with the incubation period.
According to Baydar et al. [27] the antifungal properties of E.Os can be attributed to the presence
of phenolic compounds such as eugenol, anethole, carvacol, precursors r-cimene and g-terpinolene and
isomers of thymol. Furthermore, they have low molecular weight and lipophilic properties that allows
them to easily penetrate cell membrane [28] causing irreversible cell wall damage and cellular organelle
as well as affecting the pH homeostasis and equilibrium of inorganic ions [29–31]. Another study on
the mode of action of E.Os on fungal growth suggested that A. conyzoides E.O was able to cross the
plasma membrane of A. flavus and interact with the membrane structures of cytoplasmic organelles
thus preventing the fungal growth [32].
Regarding the expression levels of the genes involved in the OTA biosynthesis pathway, in
presence of E.O, few studies were found in the literature on this topic. Nevertheless, Murthy et al. [33]
noticed that the reduction of OTA production was not correlated with the growth reduction of A.
ochraceus after inoculating the medium with increasing doses of Ajowan Ethanolic Extract (AEE). At 50
and 150 mL/g of AEE, inhibition of OTA production was higher than the reduction of fungal growth.
Similarly, Hua, Xing, Selvaraj, Wang, Zhao, Zhou, Liu and Liu [14] also noticed a decreased growth of
A. ochraceus by 75–150 mg/mL of citral E.O, but the OTA production was completely blocked, therefore
suggesting that the reduction was not correlated with the growth reduction, but rather to the
suppression of transcription of OTA biosynthesis genes. In fact, they found that the transcription of the
pks gene (responsible for the synthesis of the polyketide dihydro-isocoumarin and involved in the first
steps of the OTA biosynthetic pathway) was completely inhibited by 75–150 mg/mL of citral E.O.
Likewise; a study conducted by Caceres et al. [34] on the reduction of aflatoxin B1 (AFB1) produced by
A. flavus showed that all the genes (except for aflT) of the AFB1 cluster were drastically downregulated
when A. flavus was cultured with 0.5 mM of eugenol, resulting an extreme AFB1 reduction with no
significant impact on the fungal growth. In the same manner, our study revealed that six of the tested
E.Os (anise, fennel, cardamom, chamomile, celery and rosemary) reduced significantly the OTA from
the medium without equally reducing the fungal growth. These results suggest that this OTA reduction
was not associated with the growth reduction but rather with the repression of certain biosynthetic
genes. Fennel, cardamom, chamomile, rosemary, anise and celery E.Os downregulated acpks,
acOTApks, acOTAnrps, laeA and veA genes, involved in the synthesis of the appropriate enzymes
involved in the OTA biosynthesis. A similar study revealed that the expression of acOTApks gene in A.
carbonarius was also reduced by the addition of 0.065 mg/mL of the hydroxycynnamic acids such as p-
coumaric and ferulic acids [35]. Our findings suggest that the E.Os
Chapitre 2
104
used in this study have different ways to reduce OTA from the medium without affecting the fungal
growth. Some were able to downregulate the regulatory genes (laeA and veA) such as the fennel,
chamomile and rosemary E.Os at 1 µL/mL and consequently reducing the expression of the genes
responsible for the OTA biosynthesis (acpks, acOTApks and acOTAnrps). Others, such as the anise and
celery E.Os at 1 µL/mL did not have significant effect on the expressions of laeA and veA, but they were
able to downregulate directly the acpks, acOTApks and acOTAnrps genes, suggesting that different types
of E.Os has different mode of action on the OTA biosynthesis genes. Similarly, a study was conducted
on F.culmorum cultured with 0.5 mM of ferulic acid showed that this compound reduced the
trichotecene type B production by reducing up to 5.4 times the expression levels of several tri genes
involved in the biosynthesis pathway [36]. Furthermore, AFB1 production was reduced by adding the
caffeic acid in culture with A. flavus, resulting in the downregulation of the aflatoxins biosynthesis
genes in A. flavus, reducing 6.6 fold the aflD, 7.1 aflM, 9.1 aflP and 1.5 aflS gene without affecting the
fungal growth [37]. Moreover, another study conducted by Yoshinari et al. [38] found that AFG1
production in A. parasiticus was reduced by using E.O of the chamomile that inhibited the cytochrome
P450 synthesis (CYPA), enzyme implicated in the AFG1 production. Additionally, due to the similarity
between the CYPA and TRI4 (an enzyme responsible for trichothecenes early biosynthesis), the E.O of
chamomile was also able to decrease the 3-acetyldeoxynivalenol (3-ADON) production in F.
graminearum by reducing the TRI4 enzyme.
Regarding the microscopic aspects of A. carbonarius cultured with 1 µL/mL and 5 µL/mL of fennel
E.O, the morphology of the conidial head and the spores remained unchanged, contrary to other results
found in the literature. For instance, Hua, Xing, Selvaraj, Wang, Zhao, Zhou, Liu and Liu [14] found
that the treatment of A. ochraceus with different concentrations of natural cinnamaldehyde, citral and
eugenol E.Os showed alteration in the morphology of the hyphæ that appeared collapsed and
abnormal, correlated with an OTA reduction. Moreover, the E.O of Cinnamomum zeylanicum caused an
interesting inhibition of spore germination in A. flavus, A. fumigatus and A. niger also causing alterations
in the hyphal development, a loss in pigmentation and a lack of sporulation [39]. Another similar study
conducted by Sharma and Tripathi [40] showed that the E.O of Citrus sinensis at 0.5 µg/mL caused a
distortion of the A. niger mycelium, squashed and flattened the conidiophores bearing damaged
conidial head. In our case, the E.O of the fennel used in this study highly reduced OTA production
without altering the growth of A. carbonarius S402 or the microscopic aspects of the fungus.
Our findings, along with the data collected from previous studies, indicate that the use of the E.Os
on food and crops could be one of the solutions to reduce the OTA from culture media produced by A.
carbonarius. Some of these E.Os, including anise, celery, cardamom, chamomile, rosemary and fennel,
were able to reduce the OTA by repressing the expressions of the genes involved in the OTA
biosynthesis without particularly affecting the fungal growth; thus not altering the natural microbial
balance.
4. Conclusions
The inhibitory effects of ten E.Os on the OTA production of A. carbonarius S402 and their effect on
the expression of the genes involved in OTA biosynthesis were evaluated in this study. The E.Os
Toxins 2016, 8, 242 11 of 14
Chapitre 2
105
of cinnamon, thyme, oregano and taramira showed an antifungal activity and prevented the growth of
A. carbonarius S402 cultured on SGM medium. Nevertheless, the objective of our study was to find one
or several E.O that has no significant effect on A. carbonarius growth, but rather on OTA production.
For this aim, we found that the E.O of fennel at 5 µL/mL was the most effective E.O in terms of
downregulating the OTA biosynthesis and regulatory genes of A. carbonarius, in correlation with a
drastic reduction in the OTA production. In addition, this E.O did not alter the morphology of the
fungus’ conidial heads or the sporulation after four days of culture on SGM medium. Similarly, the E.O
of the chamomile, cardamom, celery, rosemary and the anise did not show any antifungal activities and
thus did not have a significant effect on the growth of the fungus, but only reduced the OTA production
by reducing the genes expressions responsible for this production.
5. Materials and Methods
5.1. Essential Oils
Ten E.Os were chosen in order to evaluate their influence on the growth of A. carbonarius and on
OTA production: rosemary (Rosmarinu sofficinalis), anise (Pimpinella anisum), chamomile (Chamaemelum
nobile), fennel (Foeniculum vulgare), thyme (Thymus vulgaris), oregano (Origanum vulgare), taramira
(Eruca sativ), cinnamon (Cinnamomum verum), cardamom (Elettaria cardamomum) and celery (Apium
graveolens). These E.Os were purchased from the local Lebanese market (Tyr, Lebanon), and were used
with no additional treatment.
5.2. Strain and Culture Conditions
A. carbonarius strain S402 was provided by the LGC-UMR 5503 (Chemical Engineering
Laboratories) located in the Superior National School of Agronomy, in Toulouse France. This strain was
sub-cultured in Czapec-Yeast-Agar medium (CYA) as described by El Khoury, Rizk, Lteif, Azouri,
Delia and Lebrihi [2] for 4 days at 28° C. A spore suspension was prepared by adding 8 mL of a sterile
Tween 80 (0.005%) solution and scrapping the surface of the cultures with a sterile Pasteur Pipette
(Chase Scientific Glass, Inc., Rokwood, TN, USA). The spore count was evaluated by using Neubauer
haemocytometer (Superior, Marienfeld, Lauda-Konigshofen, Germany), the concentration was
adjusted to 106 spore/mL and spore suspension was then kept at 4° C for further use. The culture was
then conducted on a Synthetic Grape Medium (SGM), prepared following the instructions described
by Bejaoui et al. [41].
Each E.O (at 1 µL/mL and 5 µL/mL) was mixed to 20 mL of the SGM medium before pouring the
mix into Petri dishes. In order to compare and evaluate the effect of the E.Os on A. carbonarius growth
and on OTA production, a control culture was prepared without adding any E.O to the SGM medium.
A sterilized transparent cellophane film was placed on the surface of the medium, and then 106 spores
of A. carbonarius were inoculated at the center of the film. The growth of A. carbonarius was estimated
by the radial growth (cm) and the dry weight (g), both after 4 days of culture. A. carbonarius dry weight
was evaluated by weighing the mycelium after its desiccation (placing the transparent film carrying
the culture at 100° C for 24 h). As for the radial growth, diameters measurements of A. carbonarius
cultures were taken after 4 days of incubation at 28° C.
All assays were carried out in triplicates for each condition.
Toxins 2016, 8, 242 12 of 14
Chapitre 2
106
5.3. Scanning Electron Microscopy (SEM) for Morphologic Study and Spores Count
The fennel E.O at 1 µL/mL and 5 µL/mL was chosen among the ten E.Os to observe its effect on
the spores and conidia morphology of A. carbonarius in comparison with the control on SGM medium.
This E.O was chosen in order to investigate its effect on the fungal sporulation since it had the greatest
effect on the OTA production without altering significantly the growth of A. carbonarius. After 4 days
of culture at 28° C, the fungus was desiccated at 75 °C for 24 h, prepared for the SEM by coating the
samples with 40 nm of gold under vacuum and then viewed with the MEB-FEG (Field Emission Gun);
model JSM 7100F (JOEL, Freising, Germany). The spore concentration was assessed using a Neubauer
haemocytometer (Superior, Marienfeld, Lauda-Konigshofen, Germany), after taking 4 agar plugs from
each condition and mixed with 5 mL of distilled water. The tubes were then shaken vigorously using
vortex mixer for 3 min. Samples were made in triplicates and the mean number of spores was
considered.
5.4. OTA Extraction and HPLC Analysis
After the incubation period, 3 agar plugs (0.5 cm diameter) were extracted from each SGM
medium, placed in 3 mL microtubes and weighed. One milliliter of HPLC grade methanol was added,
and the mix was incubated and shaken for 60 min at room temperature. After centrifugation at 13,000
r.p.m (round per minute), the aqueous phase was separated from the debris and diluted with 20 mL
phosphate buffer. OTA was then purified using Ochraprep immunoaffinity columns (R-Biopharm,
Glasgow, Scotland) by injecting the mix into the columns using a syringe. OTA was eluted by adding
1.5 mL of methanol/acetic acid (98:2, v/v) followed by 1.5 mL of distilled water. After filtering with 0.4
µm filters (Sartorius stedim, Biotech), the OTA extract was stored at 4 °C before quantification.
OTA quantification was done with a Water Alliance HPLC system using an Utisphere ODB
column, C18 (150 4.6 mm, 5 µm, 120 Å) (Interchim, Montluçon, France) at 30 °C. A 30 min isocratic flow
was delivered at 49% of eluent A: acidified water (0.2% of acetic acid) and 51% of eluent B: acetonitrile.
A flow rate of 1 mL/min was used and 10 µL of extract were injected into the apparatus. OTA was
detected by a fluorescent detector at 333/440 nm excitation/emission wavelengths. Peak identity was
confirmed by analyzing absorption spectrum with a diode array detector coupled to the system. OTA
concentrations were calculated based on a standard calibration curve.
5.5. RNA Extraction, cDNA Synthesis and qRT-PCR
For genes expressions analysis, culture conditions were the same as those described in Section 5.2.
After 4 days at 28° C, the cellophane film was separated from the surface of the SGM medium and the
mycelium was then carefully cut out from the cellophane, ground in liquid nitrogen and stored at -80°
C. Total RNA was extracted from the frozen mycelium using the RNeasy kit (Qiagen, Düsseldorf,
Germany) following the manufacturer protocol and then treated with DNase I Amplification Grade
(Sigma-Aldrich, St. Louis, MO, USA). The quality and quantity of the total RNA was assessed using the
Experion RNA analysis kit (version 3.20, 2015, BioRad, Marnes-la-Coquette, France). The single strand
cDNA was synthesized from 1 µg of total RNA using the Advantage RT-for-PCR kit (Clontech,
Mountain View, CA, USA) following the manufacturer protocol.
Toxins 2016, 8, 242 13 of 14
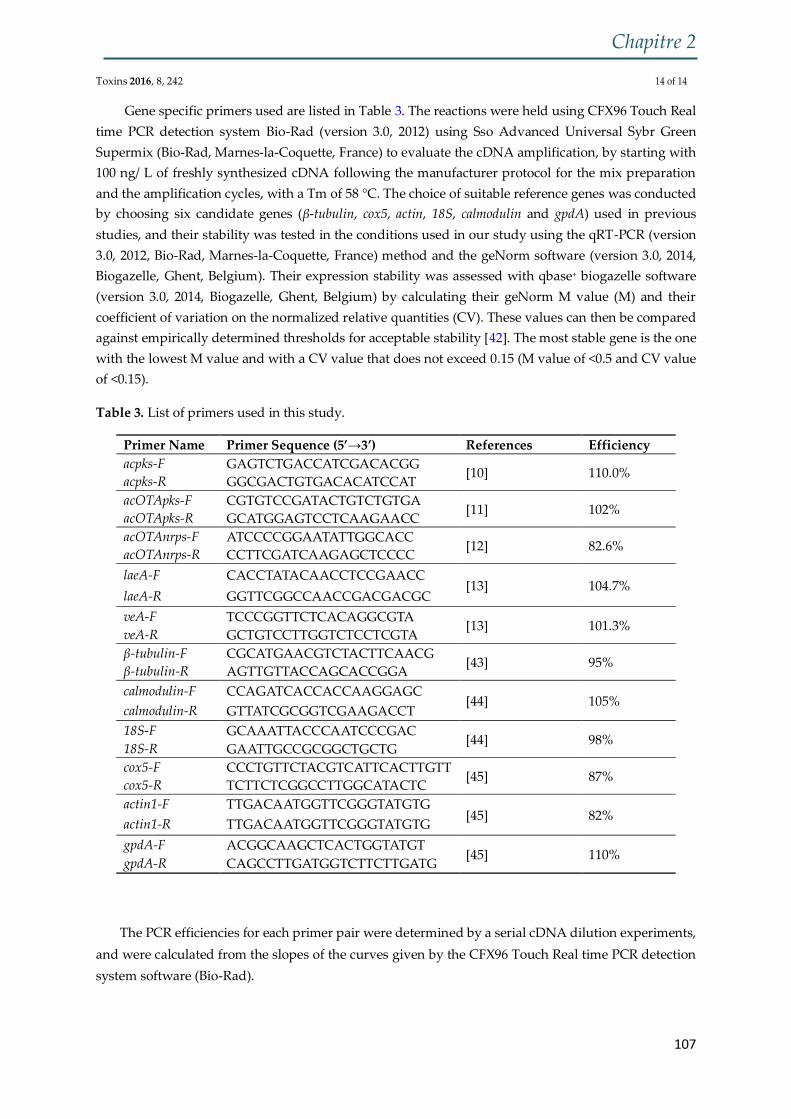
Chapitre 2
107
Gene specific primers used are listed in Table 3. The reactions were held using CFX96 Touch Real
time PCR detection system Bio-Rad (version 3.0, 2012) using Sso Advanced Universal Sybr Green
Supermix (Bio-Rad, Marnes-la-Coquette, France) to evaluate the cDNA amplification, by starting with
100 ng/ L of freshly synthesized cDNA following the manufacturer protocol for the mix preparation
and the amplification cycles, with a Tm of 58 °C. The choice of suitable reference genes was conducted
by choosing six candidate genes (β-tubulin, cox5, actin, 18S, calmodulin and gpdA) used in previous
studies, and their stability was tested in the conditions used in our study using the qRT-PCR (version
3.0, 2012, Bio-Rad, Marnes-la-Coquette, France) method and the geNorm software (version 3.0, 2014,
Biogazelle, Ghent, Belgium). Their expression stability was assessed with qbase+ biogazelle software
(version 3.0, 2014, Biogazelle, Ghent, Belgium) by calculating their geNorm M value (M) and their
coefficient of variation on the normalized relative quantities (CV). These values can then be compared
against empirically determined thresholds for acceptable stability [42]. The most stable gene is the one
with the lowest M value and with a CV value that does not exceed 0.15 (M value of <0.5 and CV value
of <0.15).
Table 3. List of primers used in this study.
Primer Name Primer Sequence (5’→3’) References Efficiency
acpks-F GAGTCTGACCATCGACACGG [10] 110.0%
acpks-R GGCGACTGTGACACATCCAT
acOTApks-F CGTGTCCGATACTGTCTGTGA [11] 102%
acOTApks-R GCATGGAGTCCTCAAGAACC
acOTAnrps-F ATCCCCGGAATATTGGCACC [12] 82.6%
acOTAnrps-R CCTTCGATCAAGAGCTCCCC
laeA-F CACCTATACAACCTCCGAACC [13] 104.7%
laeA-R GGTTCGGCCAACCGACGACGC
veA-F TCCCGGTTCTCACAGGCGTA [13] 101.3%
veA-R GCTGTCCTTGGTCTCCTCGTA
β-tubulin-F CGCATGAACGTCTACTTCAACG [43] 95%
β-tubulin-R AGTTGTTACCAGCACCGGA
calmodulin-F CCAGATCACCACCAAGGAGC [44] 105%
calmodulin-R GTTATCGCGGTCGAAGACCT
18S-F GCAAATTACCCAATCCCGAC [44] 98%
18S-R GAATTGCCGCGGCTGCTG
cox5-F CCCTGTTCTACGTCATTCACTTGTT [45] 87%
cox5-R TCTTCTCGGCCTTGGCATACTC
actin1-F TTGACAATGGTTCGGGTATGTG [45] 82%
actin1-R TTGACAATGGTTCGGGTATGTG
gpdA-F ACGGCAAGCTCACTGGTATGT [45] 110%
gpdA-R CAGCCTTGATGGTCTTCTTGATG
The PCR efficiencies for each primer pair were determined by a serial cDNA dilution experiments,
and were calculated from the slopes of the curves given by the CFX96 Touch Real time PCR detection
system software (Bio-Rad).
Toxins 2016, 8, 242 14 of 14

Chapitre 2
108
5.6. Statistical Analysis
Data regarding the dry weight, radial growth, OTA concentrations and genes expressions were
analyzed through one-way analysis of variance (ANOVA) and paired t-test using GraphPad (version
6.07 for windows, 2015, GraphPad Software Inc., La Jolla, CA, USA) prism 6 software.
Supplementary Materials: The following is available online at www.mdpi.com/2072-
6651/8/8/242/s1.,Figure S1 Genorm M value of the six candidate reference genes: -tubulin, calmodulin,
cytochrome c oxydase subunit V (cox5), 18S, actin (actin1) and glyceraldehydes 3-phosphate
dehydrogenase (gdpA). The most stable gene is the one with the lowest M value.
Acknowledgments: The authors would like to thank the Research Council of Saint-Joseph University
(Lebanon),and the Polytechnic National Institute of Toulouse (INPT), as well as the French Institute-
Campus France and the National Council for Scientific Research, Lebanon (CNRS-L) for the financial
support of Rachelle El Khoury.
Author Contributions: Florence Mathieu, Ali Atoui, Andre El Khoury and Richard Maroun conceived,
supervisedand designed the experiments. Rachelle El Khoury performed the experiments. Rachelle El
Khoury, Ali Atoui and Florence Mathieu wrote the paper. Carol Verheecke and Ali Atoui contributed
to qRT-PCR performance and data analysis.
Conflicts of Interest: The authors declare no conflict of interest.
Abbreviations
The following abbreviations are used in this manuscript:
A. carbonarius Aspergillus carbonarius
qRT-PCR Quantitative Reverse Transcription-Polymerase Chain Reaction
OTA Ochratoxin A
IARC International Agency for Research on Cancer
E.O Essential oil
SGM Synthetic Grape Medium
HPLC High Performance Liquid Chromatography
mM Milliomolar
N.D Not detectable
r.p.m Round per minute
Supplementary material
1. Choice of a suitable reference gene for the gene expression study
In order to appropriately choose a reference gene for this study, β-tubulin, calmodulin, cytochrome c
oxydase subunit V (cox5), 18S, actin (actin1) and glyceraldehydes 3-phosphate dehydrogenase (gdpA) genes
were tested using the GeNorm software (version 6.07 for windows, 2015, La Jolla, California, CA, USA).
Results showed that β-tubulin (geNorm M=0.2) and the actin (geNorm M=0.24) genes displayed a higher
stability regardless the cultures conditions, and can be successfully used in our study as reference genes
(Figure S1). For this reason, β-tubulin was selected as the reference gene.
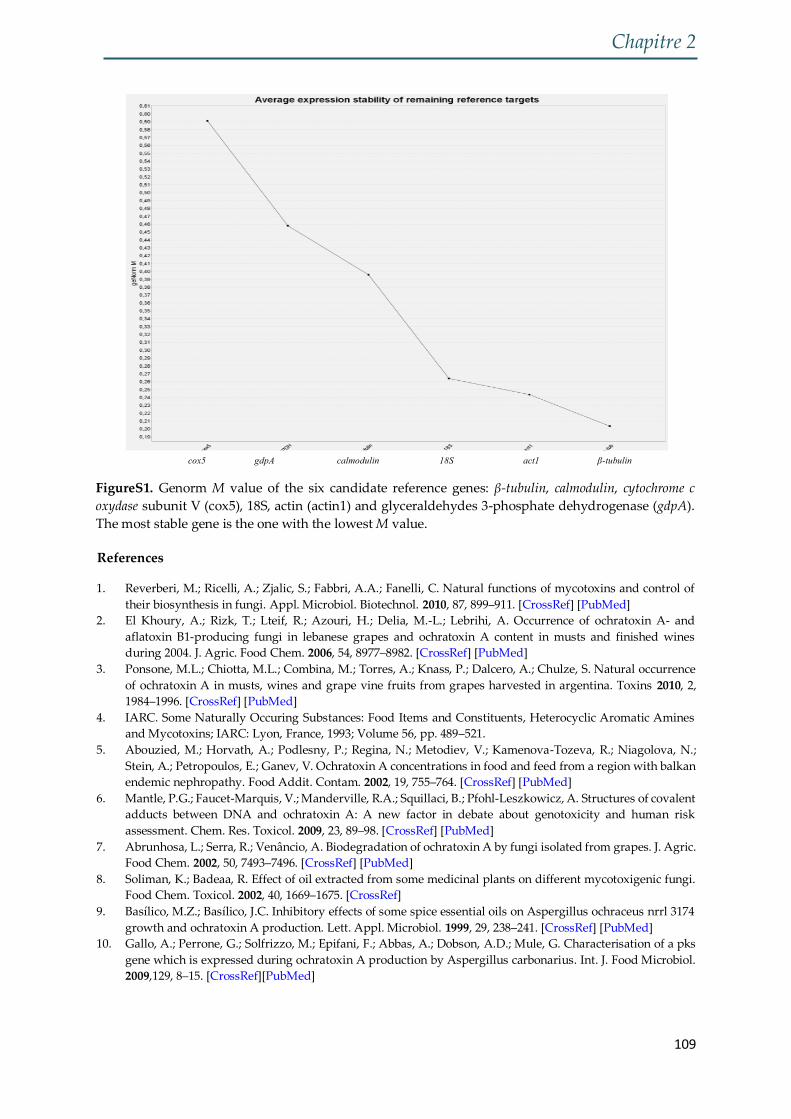
Chapitre 2
109
FigureS1. Genorm M value of the six candidate reference genes: β-tubulin, calmodulin, cytochrome c
oxydase subunit V (cox5), 18S, actin (actin1) and glyceraldehydes 3-phosphate dehydrogenase (gdpA).
The most stable gene is the one with the lowest M value.
References
1. Reverberi, M.; Ricelli, A.; Zjalic, S.; Fabbri, A.A.; Fanelli, C. Natural functions of mycotoxins and control of
their biosynthesis in fungi. Appl. Microbiol. Biotechnol. 2010, 87, 899–911. [CrossRef] [PubMed]
2. El Khoury, A.; Rizk, T.; Lteif, R.; Azouri, H.; Delia, M.-L.; Lebrihi, A. Occurrence of ochratoxin A- and
aflatoxin B1-producing fungi in lebanese grapes and ochratoxin A content in musts and finished wines
during 2004. J. Agric. Food Chem. 2006, 54, 8977–8982. [CrossRef] [PubMed]
3. Ponsone, M.L.; Chiotta, M.L.; Combina, M.; Torres, A.; Knass, P.; Dalcero, A.; Chulze, S. Natural occurrence
of ochratoxin A in musts, wines and grape vine fruits from grapes harvested in argentina. Toxins 2010, 2,
1984–1996. [CrossRef] [PubMed]
4. IARC. Some Naturally Occuring Substances: Food Items and Constituents, Heterocyclic Aromatic Amines
and Mycotoxins; IARC: Lyon, France, 1993; Volume 56, pp. 489–521.
5. Abouzied, M.; Horvath, A.; Podlesny, P.; Regina, N.; Metodiev, V.; Kamenova-Tozeva, R.; Niagolova, N.;
Stein, A.; Petropoulos, E.; Ganev, V. Ochratoxin A concentrations in food and feed from a region with balkan
endemic nephropathy. Food Addit. Contam. 2002, 19, 755–764. [CrossRef] [PubMed]
6. Mantle, P.G.; Faucet-Marquis, V.; Manderville, R.A.; Squillaci, B.; Pfohl-Leszkowicz, A. Structures of covalent
adducts between DNA and ochratoxin A: A new factor in debate about genotoxicity and human risk
assessment. Chem. Res. Toxicol. 2009, 23, 89–98. [CrossRef] [PubMed]
7. Abrunhosa, L.; Serra, R.; Venâncio, A. Biodegradation of ochratoxin A by fungi isolated from grapes. J. Agric.
Food Chem. 2002, 50, 7493–7496. [CrossRef] [PubMed]
8. Soliman, K.; Badeaa, R. Effect of oil extracted from some medicinal plants on different mycotoxigenic fungi.
Food Chem. Toxicol. 2002, 40, 1669–1675. [CrossRef]
9. Basílico, M.Z.; Basílico, J.C. Inhibitory effects of some spice essential oils on Aspergillus ochraceus nrrl 3174
growth and ochratoxin A production. Lett. Appl. Microbiol. 1999, 29, 238–241. [CrossRef] [PubMed]
10. Gallo, A.; Perrone, G.; Solfrizzo, M.; Epifani, F.; Abbas, A.; Dobson, A.D.; Mule, G. Characterisation of a pks
gene which is expressed during ochratoxin A production by Aspergillus carbonarius. Int. J. Food Microbiol.
2009,129, 8–15. [CrossRef][PubMed]
cox5 gdpA calmodulin 18S act1 β-tubulin
Chapitre 2
110
11. Gallo, A.; Knox, B.P.; Bruno, K.S.; Solfrizzo, M.; Baker, S.E.; Perrone, G. Identification and characterization of
the polyketide synthase involved in ochratoxin A biosynthesis in Aspergillus carbonarius. Int. J. Food
Microbiol. 2014,179, 10–17. [CrossRef][PubMed]
12. Gallo, A.; Bruno, K.S.; Solfrizzo, M.; Perrone, G.; Mule, G.; Visconti, A.; Baker, S.E. New insight into the
ochratoxin A biosynthetic pathway through deletion of a nonribosomal peptide synthetase gene in
Aspergillus carbonarius. Appl. Environ. Microbiol. 2012, 78, 8208–8218. [CrossRef] [PubMed]
13. Crespo-Sempere, A.; Marin, S.; Sanchis, V.; Ramos, A.J. Vea and laea transcriptional factors regulate
ochratoxin A biosynthesis in Aspergillus carbonarius. Int. J. Food Microbiol. 2013, 166, 479–486. [CrossRef]
[PubMed]
14. Hua, H.; Xing, F.; Selvaraj, J.N.; Wang, Y.; Zhao, Y.; Zhou, L.; Liu, X.; Liu, Y. Inhibitory effect of essential oils
on Aspergillus ochraceus growth and ochratoxin A production. PLoS ONE 2014, 9. [CrossRef] [PubMed]
15. Ryu, D.; Holt, D.L. Growth inhibition of Penicillium expansum by several commonly used food ingredients.
J. Food Prot. 1993, 56, 862–867.
16. Sinha, K.; Sinha, A.; Prasad, G. The effect of clove and cinnamon oils on growth of and aflatoxin production
by Aspergillus flavus. Lett. Appl. Microbiol. 1993, 16, 114–117. [CrossRef]
17. Patkar, K.; Usha, C.; Shetty, H.S.; Paster, N.; Lacey, J. Effect of spice essential oils on growth and aflatoxin b1
production by Aspergillus flavus. Lett. Appl. Microbiol. 1993, 17, 49–51. [CrossRef]
18. Daouk, R.K.; Dagher, S.M.; Sattout, E.J. Antifungal activity of the essential oil of Origanum syriacum l.
J. Food Prot. 1995, 58, 1147–1149.
19. Lukas, B.; Schmiderer, C.; Franz, C.; Novak, J. Composition of essential oil compounds from different syrian
populations of Origanum syriacum L. (lamiaceae). J. Agric. Food Chem. 2009, 57, 1362–1365. [CrossRef]
[PubMed]
20. Sokovi´c, M.; Tzakou, O.; Pitarokili, D.; Couladis, M. Antifungal activities of selected aromatic plants growing
wild in greece. Food/Nahrung 2002, 46, 317–320. [CrossRef]
21. da Cruz Cabral, L.; Fernandez Pinto, V.; Patriarca, A. Application of plant derived compounds to control
fungal spoilage and mycotoxin production in foods. Int. J. Food Microbiol. 2013, 166, 1–14. [CrossRef]
[PubMed]
22. Omidbeygi, M.; Barzegar, M.; Hamidi, Z.; Naghdibadi, H. Antifungal activity of thyme, summer savory and
clove essential oils against Aspergillus flavus in liquid medium and tomato paste. Food Control 2007, 18,
1518–1523. [CrossRef]
23. Rasooli, I.; Abyaneh, M.R. Inhibitory effects of thyme oils on growth and aflatoxin production by Aspergillus
parasiticus. Food Control 2004, 15, 479–483. [CrossRef]
24. Dambolena, J.S.; Lopez, A.G.; Canepa, M.C.; Theumer, M.G.; Zygadlo, J.A.; Rubinstein, H.R. Inhibitory effect
of cyclic terpenes (limonene, menthol, menthone and thymol) on Fusarium verticillioides mrc 826 growth
and fumonisin b1 biosynthesis. Toxicon Off. J. Int. Soc. Toxinol. 2008, 51, 37–44. [CrossRef] [PubMed]
25. Bansod, S.; Rai, M. Antifungal activity of essential oils from indian medicinal plants against human
pathogenic Aspergillus fumigatus and A. Niger. World J. Med. Sci. 2008, 3, 81–88.
26. Marín, S.; Ramos, A.J.; Sanchis, V. Comparison of methods for the assessment of growth of food spoilage
moulds in solid substrates. Int. J. Food Microbiol. 2005, 99, 329–341. [CrossRef] [PubMed]
27. Baydar, H.; Sagdiç,˘ O.; Özkan, G.; Karadogan,˘ T. Antibacterial activity and composition of essential oils
from origanum, thymbra and satureja species with commercial importance in turkey. Food Control 2004, 15,
169–172. [CrossRef]
28. Pawar, V.; Thaker, V. In vitro efficacy of 75 essential oils against Aspergillus niger. Mycoses 2006, 49, 316–
323. [CrossRef] [PubMed]
29. Helal, G.; Sarhan, M.; Abu Shahla, A.; Abou El-Khair, E. Effects of cymbopogon citratus l. Essential oil on the
growth, morphogenesis and aflatoxin production of Aspergillus flavus mL2-strain. J. Basic Microbiol. 2007,
47, 5–15. [CrossRef] [PubMed]
30. Lambert, R.; Skandamis, P.N.; Coote, P.J.; Nychas, G.J. A study of the minimum inhibitory concentration
and mode of action of oregano essential oil, thymol and carvacrol. J. Appl. Microbiol. 2001, 91, 453–462.
[CrossRef] [PubMed]
31. Rasooli, I.; Owlia, P. Chemoprevention by thyme oils of Aspergillus parasiticus growth and aflatoxin
production. Phytochemistry 2005, 66, 2851–2856. [CrossRef] [PubMed]
32. Esper, R.H.; Gonçalez, E.; Felicio, R.C.; Felicio, J.D. Fungicidal activity and constituents of Ageratum
conyzoides essential oil from three regions in são paulo state, brazil. Arq. Inst. Biol. 2015, 82, 1–4. [CrossRef]
33. Murthy, P.S.; Borse, B.B.; Khanum, H.; Srinivas, P. Inhibitory effects of ajowan (trachyspermum ammi)
ethanolic extract on A. ochraceus growth and ochratoxin production. Turk. J. Biol. 2009, 33, 211–217.
Chapitre 2
111
34. Caceres, I.; El Khoury, R.; Medina, A.; Lippi, Y.; Naylies, C.; Atoui, A.; El Khoury, A.; Oswald, I.P.; Bailly,
J.D.; Puel, O. Deciphering the anti-aflatoxinogenic properties of eugenol using a large-scale q-PCR approach.
Toxins 2016, 8. [CrossRef] [PubMed]
35. Ferrara, M.; Gallo, A.; Scalzo, R.L.; Haidukowski, M.; Picchi, V.; Perrone, G. Inhibition of ochratoxin a
production in Aspergillus carbonarius by hydroxycinnamic acids from grapes. World Mycotoxin J. 2015, 8,
283–289. [CrossRef]
36. Boutigny, A.L.; Barreau, C.; Atanasova-Penichon, V.; Verdal-Bonnin, M.N.; Pinson-Gadais, L.; Richard-
Forget, F. Ferulic acid, an efficient inhibitor of type b trichothecene biosynthesis and Tri gene expression in
Fusarium liquid cultures. Mycol. Res. 2009, 113, 746–753. [CrossRef] [PubMed]
37. Kim, D.; Yukl, E.T.; Moënne-Loccoz, P.; Ortiz de Montellano, P.R. Fungal heme oxygenases: Functional
expression and characterization of Hmx1 from Saccharomyces cerevisiae and Cahmx1 from candida
albicans. Biochemistry 2006, 45, 14772–14780. [CrossRef] [PubMed]
38. Yoshinari, T.; Yaguchi, A.; Takahashi-Ando, N.; Kimura, M.; Takahashi, H.; Nakajima, T.; Sugita-Konishi, Y.;
Nagasawa, H.; Sakuda, S. Spiroethers of german chamomile inhibit production of aflatoxin G1 and
trichothecene mycotoxin by inhibiting cytochrome p450 monooxygenases involved in their biosynthesis.
FEMS Microbiol. Lett. 2008, 284, 184–190. [CrossRef] [PubMed]
39. Carmo, E.S.; Lima, E.D.O.; Souza, E.L.D.; Sousa, F.B.D. Effect of Cinnamomum zeylanicum blume essential
oil on the rowth and morphogenesis of some potentially pathogenic Aspergillus species. Braz. J. Microbiol.
2008, 39, 91–97. [CrossRef] [PubMed]
40. Sharma, N.; Tripathi, A. Effects of citrus sinensis (L.) osbeck epicarp essential oil on growth and
morphogenesis of Aspergillus niger (L.) van tieghem. Microbiol. Res. 2008, 163, 337–344. [CrossRef]
[PubMed]
41. Bejaoui, H.; Mathieu, F.; Taillandier, P.; Lebrihi, A. Ochratoxin A removal in synthetic and natural grape
juices by selected oenological saccharomyces strains. J. Appl. Microbiol. 2004, 97, 1038–1044. [CrossRef]
[PubMed]
42. Hellemans, J.; Mortier, G.; De Paepe, A.; Speleman, F.; Vandesompele, J. Qbase relative quantification
framework and software for management and automated analysis of real-time quantitative PCR data.
Genome Biol. 2007, 8. [CrossRef] [PubMed]
43. Cabañes, F.J.; Bragulat, M.R.; Castellá, G. Characterization of nonochratoxigenic strains of Aspergillus
carbonarius from grapes. Food Microbiol. 2013, 36, 135–141. [CrossRef] [PubMed]
44. The National Center for Biotechnology Information advances science and health by providing access to
biomedical and genomic information. Available online: http://www.ncbi.nlm.nih.gov/ (accessed on 30
January 2014).
45. Verheecke, C.; Liboz, T.; Anson, P.; Diaz, R.; Mathieu, F. Reduction of aflatoxin production by Aspergillus
flavus and Aspergillus parasiticus in interaction with streptomyces. Microbiology 2015, 161, 967–972.
[CrossRef] [PubMed]
© 2016 by the authors; licensee MDPI, Basel, Switzerland. This article is an open access
article distributed under the terms and conditions of the Creative Commons Attribution
(CC-BY) license (http://creativecommons.org/licenses/by/4.0/).
Chapitre 2
112
III. Conclusion
Parmi les dix huiles essentielles testées, quatre ont pu inhiber la croissance d’A.
carbonarius S402 dont l’huile essentielles du thym, de l’origan, du taramira et de la
cannelle. Ces dernières, vu leur pouvoir antifongique, ont été exclues de l’étude sur
l’expression des gènes de biosynthèse de l’OTA chez A. carbonarius.
Ces travaux ont permis d’associer la réduction de la production de l’OTA (non
linéaire avec la réduction de la croissance fongique) à la répression des gènes de
biosynthèse, surtout l’acOTApks (99%) en présence de l’huile essentielle du fenouille à
5 µL/mL.
Toutes les huiles ont pu affecter l’expression des deux gènes de régulation veA et
laeA. Les niveaux de réduction les plus élevés ont été atteint quand les huiles ont été
employées à 5 µL/mL : le fenouil (30 et 40%), la cardamome (71 et 70%), la camomille
(94 et 96%), le romarin (95 et 91%), l’anis (87 et 80%) et le céleri (88 et 80%)
respectivement pour veA et laeA.
Nous avons également démontré que l’huile essentielle du fenouil n’a pas
engendré des changements sévères dans la morphologie microscopique d’A.
carbonarius. En effet son emploi n’a eu aucun effet sur la sporulation pourtant elle a
provoqué une faible diminution dans la taille des têtes conidiales (21.4% de réduction
comparées au control).

113
114
Chapitre 3
Détoxification de l’OTA par des
actinobactéries isolées du sol :
adhésion, biodégradation et
répression des gènes de biosynthèse
de l’OTA chez Aspergillus
carbonarius
Chapitre 3
115
I. Introduction
Malgré l’efficacité des méthodes préventives, la détoxification de l’OTA des
denrées alimentaires reste une nécessité afin de délivrer des produits qui respectent
les normes imposées et qu’ils soient consommables par les êtres humains. Pour cela,
nous nous sommes intéressés de poursuivre la lutte contre l’OTA non seulement pour
prévenir sa production, mais aussi pour réduire sa présence des matrices alimentaires.
Suite à une étude bibliographique approfondie sur cette thématique, nous avons
choisi d’examiner l’effet des souches d’actinomycètes, vu leur capacité à endurer les
conditions climatiques chaudes et leur présence ubiquitaire dans le sol.
En effet, les actinobactéries sont rarement évaluées pour leur capacité de réduire
les mycotoxines, pourtant les études sur les bactéries lactiques sont nombreuses sur
cet égard. L’inconvénient de l’application de ces dernières revient à leur pouvoir de
fermentation lactique, qui, dans certains cas, n’est pas désirée.
Afin d’établir un profil propre à chaque souche, nous avons procéder à tester leur
capacité à (1) adhérer l’OTA à leur surface, (2) dégrader l’OTA et (3) prévenir la
production de cette toxine en réprimant les gènes responsables de sa biosynthèse chez
A. carbonarius.
L’étude de l’adhésion a été réalisée dans une solution non nutritive PBS (Phosphate
Buffer Solution) afin de prévenir la biodégradation de l’OTA et avoir des faux positifs.
Cependant, la biodégradation de cette toxine a été évaluée dans un milieu nutritif
nommé ISP2 liquide (International Streptomyces Project-2) pendant 5 jours à 28 °C.
Afin d’éliminer l’effet de l’adhésion de l’OTA par ces bactéries, nous avons testé la
capacité des surnageants bactériens à métaboliser l’OTA.
Finalement, nous nous sommes intéressés d’évaluer l’influence des souches
d’actinomycètes sur l’expression des gènes de biosynthèse de l’OTA. Cette étude a été
Chapitre 3
116
réalisée suite à une coculture entre A. carbonarius S402 et les souches bactériennes sur
un milieu solide nommé PDA (Potato Dextrose Agar), avec une température de 28 °C
pendant 5 jours de culture.
Ce travail a permis d’établir un profil de détoxification propre à chaque souche,
puisque chacune d’entre elle a réagit d’une manière différente des autres. Certaines
(AT8, AT10 et SN7) ont pu dégrader l’OTA sans avoir aucun effet sur l’expression des
gènes. D’autres (ML5, G10 et PT1) ont affecté d’une manière significative cette
expression tout en gardant leur capacité de dégradation. Toutes les souches ont
montré un pouvoir d’adhésion de l’OTA sur leur surface, surtout après 60 minutes
d’incubation.
II. Article soumis dans la revue Toxins
Article
Ability of Soil Isolated Actinobacteria Strains to Prevent, Bind and Biodegrade Ochratoxin A
Abstract: Ochratoxin A (OTA) is one of the most important mycotoxin that contaminates several
agricultural products, more particularly cereals, grapes, maize, barley, spices and coffee. The aim of
this project was to reduce the levels of OTA by supplementing the artificially contaminated solutions
with seven strains of actinobacteria (AT10, AT8, SN7, MS1, ML5, G10 and PT1) in order to evaluate
their capacity on binding and metabolizing the OTA as well as their ability to reduce the expression of
the genes responsible for its production in A. carbonarius. In the first part of this study, we evaluated
the capacity of Streptomyces strains on binding OTA on their surfaces after 0, 30 and 60 minutes of
incubation with PBS solution supplemented with OTA. In the second part, we tested the ability of these
strains as well as their supernatants to detoxify the ISP2 medium. Finally, we studied the effect of the
Streptomyces cocultured with Aspergillus carbonarius on the expression of the OTA biosynthesis genes.
Results showed that among the strains co-cultured with A. carbonarius, the strain G10 was able to reduce
the expression of acpks, acOTApks, acOTAnrps and vea genes, thus reducing OTA from solid PDA
medium to 13.50% of reduction. This strain was remarkably able to detoxify and bind OTA up to
47.07%. Strain AT8 was stronger in detoxifying OTA (52.61%) but had no significant effect on the
studied genes expression.
Keywords: Ochratoxin A; actinobacteria; biocontrol; binding; detoxification; genes expression
1. Introduction
Chapitre 3
117
Ochratoxin A (OTA) is a secondary metabolite produced by molds of the genera Aspergillus and
Penicillium on several food commodities in pre and post-harvest conditions [1-3]. The dangerous effects
of OTA on human health (carcinogen group 2B) [4] as well as its impact on economic losses [5], made
the prevention of this toxin production and/or detoxification from food an important task for the
scientific community. Several biocontrol approaches were elaborated to prevent the fungal growth or
the production of OTA with plant extracts, more particularly essential oils and phenolic compounds
[6-8]. Others were focused on treating the contaminated food with living organisms such as lactic acid
bacteria (LAB) and yeasts, to reduce the OTA concentration. This biological decontamination is either
performed by OTA biodegradation using microorganisms and their enzymes [9-11], or by binding the
toxin on the cell wall surface of these microorganisms [12-14]. Both approaches helped reduce OTA
without significant losses in nutritive values since no harmful chemicals were used in this treatment of
contaminated food [15-18]. For instance, Lactobacillus bulgaricus was able to biodegrade 94% of the OTA
added to the cultures after 24h of incubation [19]. Similarly, Saccharomyces cerevisiae eliminated 41% of
OTA via enzymatic degradation after 24h at 30 °C. On the other hand, Turbic, et al. [20] claimed that
OTA reduction by Lb. rhamnosus strains (76% of reduction) was caused by the adsorption of this toxin
onto the LAB cell walls, since the acid treated bacteria were more effective to remove OTA than the
viable ones after 2h at 37 °C.
Actinobacteria are Gram-positif bacteria that can be found in soil, and contain Streptomyces one of
the largest of bacterial genera. Streptomyces and other actinobacteria are major contributors to biological
buffering of soils, and are a source of many antibiotics [21,22]. The antifungal and antimycotoxigenic
effects of actinobacteria were tested by Verheecke, et al. [23], when they evaluated the effect of 16 strains
of Streptomyces on aflatoxin B (AFB) detoxification, and found that reduction levels ranged between
15.6 and 82.2% for the tested strains. When they further investigated the reason behind these reductions,
they found that AFB inhibitions were not related to adsorption, but rather to the repression of AFB
biosynthesis genes in A. flavus. Nevertheless, the ability of Streptomyces on reducing OTA has not been
yet established. Hence, the aim of this study was to evaluate the effect of seven Streptomyces strains
named AT10, AT8, SN7, MS1, ML5, G10 and PT1 on OTA levels, and investigate the mode of action of
each strain whether they degrade OTA, bind it to their cell walls, as well as their effect on the expression
of the genes responsible for OTA biosynthesis (acpks, acOTApks, acOTAnrps) and the regulatory genes
(veA and laeA) in A. carbonarius S402.
2. Results
2.1. Kinetics of OTA binding to actinobacerial cell wall
The PBS contaminated with 45.12 ng/mL of OTA and inoculated with the tested bacterial strains
was examined after 0, 30 and 60 minutes for the remaining OTA concentration. Reductions were all
significant compared to the control. Nevertheless, the levels were not the same for all the strains (Table
1). For example, AT10, AT8, SN7, G10 and PT1 were the most effective strains, as they reduced 25.62,
16.07, 33.93, 16.23 and 24.85% respectively, after 60 min of incubation. Levels of inhibition were higher
at 60 min than at 30 min for all the strains. Since this study was handled in a non nutritive solution
(PBS), the observed reductions could not be attributed to an enzymatic activity of the actinobacteria.
Moreover, the sums of the reduced OTA with the washed OTA extracted from the pellets were equal
to the initial concentration (45.12±1.2). This observation confirms that the reduced OTA is only due to
the ability of the strains to bind OTA onto their cell walls.
Table 1: Kinetics of OTA binding to actinobacterial strains in PBS solution for 0, 30 and 60 mins.
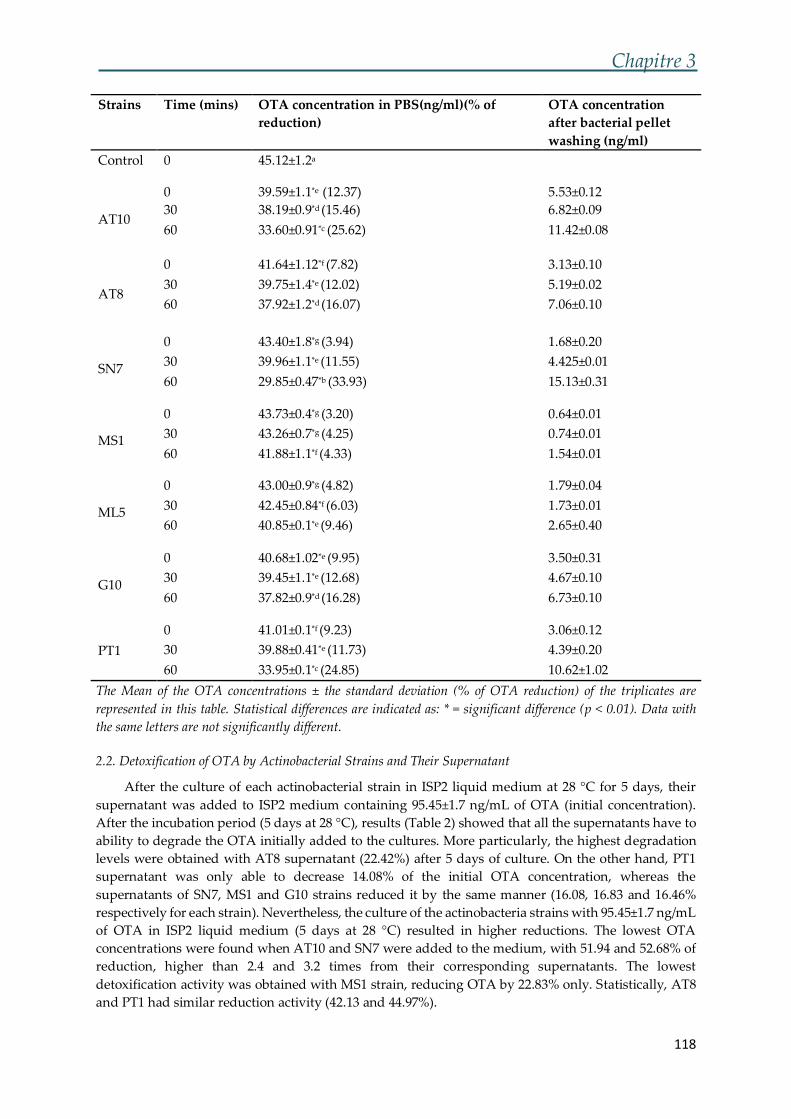
Chapitre 3
118
Strains Time (mins) OTA concentration in PBS(ng/ml)(% of
reduction)
OTA concentration
after bacterial pellet
washing (ng/ml)
Control 0 45.12±1.2a
AT10
0 39.59±1.1*e (12.37) 5.53±0.12
30 38.19±0.9*d (15.46) 6.82±0.09
60 33.60±0.91*c (25.62) 11.42±0.08
AT8
0 41.64±1.12*f (7.82) 3.13±0.10
30 39.75±1.4*e (12.02) 5.19±0.02
60 37.92±1.2*d (16.07) 7.06±0.10
SN7
0 43.40±1.8*g (3.94) 1.68±0.20
30 39.96±1.1*e (11.55) 4.425±0.01
60 29.85±0.47*b (33.93) 15.13±0.31
MS1
0 43.73±0.4*g (3.20) 0.64±0.01
30 43.26±0.7*g (4.25) 0.74±0.01
60 41.88±1.1*f (4.33) 1.54±0.01
ML5
0 43.00±0.9*g (4.82) 1.79±0.04
30 42.45±0.84*f (6.03) 1.73±0.01
60 40.85±0.1*e (9.46) 2.65±0.40
G10
0 40.68±1.02*e (9.95) 3.50±0.31
30 39.45±1.1*e (12.68) 4.67±0.10
60 37.82±0.9*d (16.28) 6.73±0.10
PT1
0 41.01±0.1*f (9.23) 3.06±0.12
30 39.88±0.41*e (11.73) 4.39±0.20
60 33.95±0.1*c (24.85) 10.62±1.02
The Mean of the OTA concentrations ± the standard deviation (% of OTA reduction) of the triplicates are
represented in this table. Statistical differences are indicated as: * = significant difference (p < 0.01). Data with
the same letters are not significantly different.
2.2. Detoxification of OTA by Actinobacterial Strains and Their Supernatant
After the culture of each actinobacterial strain in ISP2 liquid medium at 28 °C for 5 days, their
supernatant was added to ISP2 medium containing 95.45±1.7 ng/mL of OTA (initial concentration).
After the incubation period (5 days at 28 °C), results (Table 2) showed that all the supernatants have to
ability to degrade the OTA initially added to the cultures. More particularly, the highest degradation
levels were obtained with AT8 supernatant (22.42%) after 5 days of culture. On the other hand, PT1
supernatant was only able to decrease 14.08% of the initial OTA concentration, whereas the
supernatants of SN7, MS1 and G10 strains reduced it by the same manner (16.08, 16.83 and 16.46%
respectively for each strain). Nevertheless, the culture of the actinobacteria strains with 95.45±1.7 ng/mL
of OTA in ISP2 liquid medium (5 days at 28 °C) resulted in higher reductions. The lowest OTA
concentrations were found when AT10 and SN7 were added to the medium, with 51.94 and 52.68% of
reduction, higher than 2.4 and 3.2 times from their corresponding supernatants. The lowest
detoxification activity was obtained with MS1 strain, reducing OTA by 22.83% only. Statistically, AT8
and PT1 had similar reduction activity (42.13 and 44.97%).
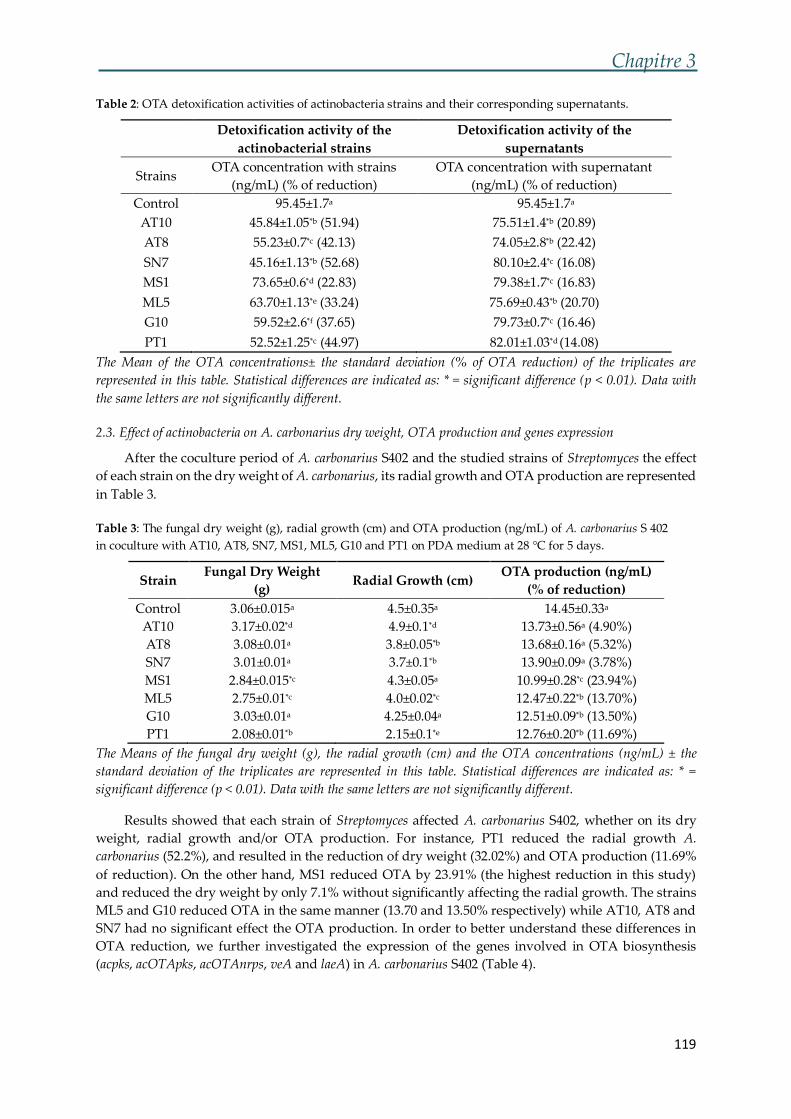
Chapitre 3
119
Table 2: OTA detoxification activities of actinobacteria strains and their corresponding supernatants.
Detoxification activity of the
actinobacterial strains
Detoxification activity of the
supernatants
Strains OTA concentration with strains
(ng/mL) (% of reduction)
OTA concentration with supernatant
(ng/mL) (% of reduction)
Control 95.45±1.7a 95.45±1.7a
AT10 45.84±1.05*b (51.94) 75.51±1.4*b (20.89)
AT8 55.23±0.7*c (42.13) 74.05±2.8*b (22.42)
SN7 45.16±1.13*b (52.68) 80.10±2.4*c (16.08)
MS1 73.65±0.6*d (22.83) 79.38±1.7*c (16.83)
ML5 63.70±1.13*e (33.24) 75.69±0.43*b (20.70)
G10 59.52±2.6*f (37.65) 79.73±0.7*c (16.46)
PT1 52.52±1.25*c (44.97) 82.01±1.03*d (14.08)
The Mean of the OTA concentrations± the standard deviation (% of OTA reduction) of the triplicates are
represented in this table. Statistical differences are indicated as: * = significant difference (p < 0.01). Data with
the same letters are not significantly different.
2.3. Effect of actinobacteria on A. carbonarius dry weight, OTA production and genes expression
After the coculture period of A. carbonarius S402 and the studied strains of Streptomyces the effect
of each strain on the dry weight of A. carbonarius, its radial growth and OTA production are represented
in Table 3.
Table 3: The fungal dry weight (g), radial growth (cm) and OTA production (ng/mL) of A. carbonarius S 402
in coculture with AT10, AT8, SN7, MS1, ML5, G10 and PT1 on PDA medium at 28 °C for 5 days.
Strain Fungal Dry Weight
(g) Radial Growth (cm)
OTA production (ng/mL)
(% of reduction)
Control 3.06±0.015a 4.5±0.35a 14.45±0.33a
AT10 3.17±0.02*d 4.9±0.1*d 13.73±0.56a (4.90%)
AT8 3.08±0.01a 3.8±0.05*b 13.68±0.16a (5.32%)
SN7 3.01±0.01a 3.7±0.1*b 13.90±0.09a (3.78%)
MS1 2.84±0.015*c 4.3±0.05a 10.99±0.28*c (23.94%)
ML5 2.75±0.01*c 4.0±0.02*c 12.47±0.22*b (13.70%)
G10 3.03±0.01a 4.25±0.04a 12.51±0.09*b (13.50%)
PT1 2.08±0.01*b 2.15±0.1*e 12.76±0.20*b (11.69%)
The Means of the fungal dry weight (g), the radial growth (cm) and the OTA concentrations (ng/mL) ± the
standard deviation of the triplicates are represented in this table. Statistical differences are indicated as: * =
significant difference (p < 0.01). Data with the same letters are not significantly different.
Results showed that each strain of Streptomyces affected A. carbonarius S402, whether on its dry
weight, radial growth and/or OTA production. For instance, PT1 reduced the radial growth A.
carbonarius (52.2%), and resulted in the reduction of dry weight (32.02%) and OTA production (11.69%
of reduction). On the other hand, MS1 reduced OTA by 23.91% (the highest reduction in this study)
and reduced the dry weight by only 7.1% without significantly affecting the radial growth. The strains
ML5 and G10 reduced OTA in the same manner (13.70 and 13.50% respectively) while AT10, AT8 and
SN7 had no significant effect the OTA production. In order to better understand these differences in
OTA reduction, we further investigated the expression of the genes involved in OTA biosynthesis
(acpks, acOTApks, acOTAnrps, veA and laeA) in A. carbonarius S402 (Table 4).
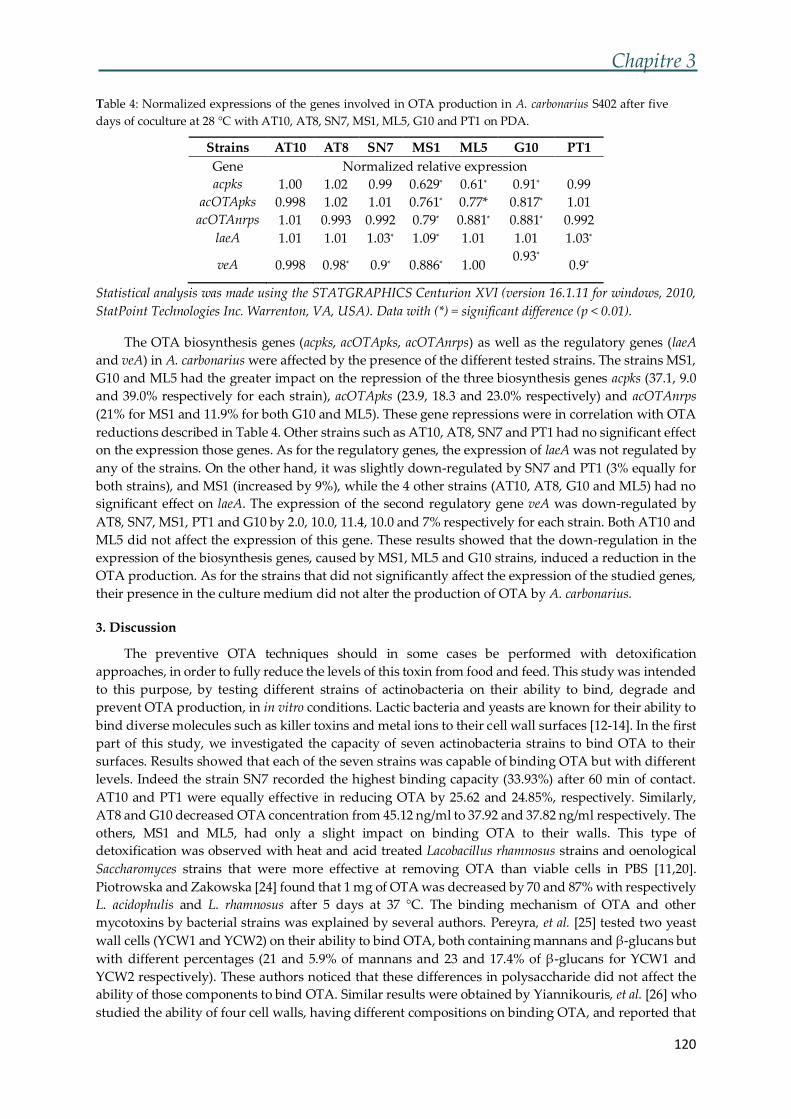
Chapitre 3
120
Table 4: Normalized expressions of the genes involved in OTA production in A. carbonarius S402 after five
days of coculture at 28 °C with AT10, AT8, SN7, MS1, ML5, G10 and PT1 on PDA.
Strains AT10 AT8 SN7 MS1 ML5 G10 PT1
Gene Normalized relative expression
acpks 1.00 1.02 0.99 0.629* 0.61* 0.91* 0.99
acOTApks 0.998 1.02 1.01 0.761* 0.77* 0.817* 1.01
acOTAnrps 1.01 0.993 0.992 0.79* 0.881* 0.881* 0.992
laeA 1.01 1.01 1.03* 1.09* 1.01 1.01 1.03*
veA 0.998 0.98* 0.9* 0.886* 1.00 0.93*
0.9*
Statistical analysis was made using the STATGRAPHICS Centurion XVI (version 16.1.11 for windows, 2010,
StatPoint Technologies Inc. Warrenton, VA, USA). Data with (*) = significant difference (p < 0.01).
The OTA biosynthesis genes (acpks, acOTApks, acOTAnrps) as well as the regulatory genes (laeA
and veA) in A. carbonarius were affected by the presence of the different tested strains. The strains MS1,
G10 and ML5 had the greater impact on the repression of the three biosynthesis genes acpks (37.1, 9.0
and 39.0% respectively for each strain), acOTApks (23.9, 18.3 and 23.0% respectively) and acOTAnrps
(21% for MS1 and 11.9% for both G10 and ML5). These gene repressions were in correlation with OTA
reductions described in Table 4. Other strains such as AT10, AT8, SN7 and PT1 had no significant effect
on the expression those genes. As for the regulatory genes, the expression of laeA was not regulated by
any of the strains. On the other hand, it was slightly down-regulated by SN7 and PT1 (3% equally for
both strains), and MS1 (increased by 9%), while the 4 other strains (AT10, AT8, G10 and ML5) had no
significant effect on laeA. The expression of the second regulatory gene veA was down-regulated by
AT8, SN7, MS1, PT1 and G10 by 2.0, 10.0, 11.4, 10.0 and 7% respectively for each strain. Both AT10 and
ML5 did not affect the expression of this gene. These results showed that the down-regulation in the
expression of the biosynthesis genes, caused by MS1, ML5 and G10 strains, induced a reduction in the
OTA production. As for the strains that did not significantly affect the expression of the studied genes,
their presence in the culture medium did not alter the production of OTA by A. carbonarius.
3. Discussion
The preventive OTA techniques should in some cases be performed with detoxification
approaches, in order to fully reduce the levels of this toxin from food and feed. This study was intended
to this purpose, by testing different strains of actinobacteria on their ability to bind, degrade and
prevent OTA production, in in vitro conditions. Lactic bacteria and yeasts are known for their ability to
bind diverse molecules such as killer toxins and metal ions to their cell wall surfaces [12-14]. In the first
part of this study, we investigated the capacity of seven actinobacteria strains to bind OTA to their
surfaces. Results showed that each of the seven strains was capable of binding OTA but with different
levels. Indeed the strain SN7 recorded the highest binding capacity (33.93%) after 60 min of contact.
AT10 and PT1 were equally effective in reducing OTA by 25.62 and 24.85%, respectively. Similarly,
AT8 and G10 decreased OTA concentration from 45.12 ng/ml to 37.92 and 37.82 ng/ml respectively. The
others, MS1 and ML5, had only a slight impact on binding OTA to their walls. This type of
detoxification was observed with heat and acid treated Lacobacillus rhamnosus strains and oenological
Saccharomyces strains that were more effective at removing OTA than viable cells in PBS [11,20].
Piotrowska and Zakowska [24] found that 1 mg of OTA was decreased by 70 and 87% with respectively
L. acidophulis and L. rhamnosus after 5 days at 37 °C. The binding mechanism of OTA and other
mycotoxins by bacterial strains was explained by several authors. Pereyra, et al. [25] tested two yeast
wall cells (YCW1 and YCW2) on their ability to bind OTA, both containing mannans and β-glucans but
with different percentages (21 and 5.9% of mannans and 23 and 17.4% of β-glucans for YCW1 and
YCW2 respectively). These authors noticed that these differences in polysaccharide did not affect the
ability of those components to bind OTA. Similar results were obtained by Yiannikouris, et al. [26] who
studied the ability of four cell walls, having different compositions on binding OTA, and reported that
Chapitre 3
121
there were no changes in the amount of OTA adsorbed. The mechanism of OTA elimination by binding
with microorganisms is a rapid process. Indeed, it was found that a period of half an hour of contact
between LAB cells and OTA was enough to remove more than 80% of the total OTA removed
throughout the experiment that lasted 24h and no major changes were observed until the end of the
experiment [27]. These observations were similar to those obtained by El-Nezami, et al. [28] who found
that even at 0 min, 80% of the AFB1 was removed by two strains of L. rhamnosus. The binding
mechanism of OTA with actinobacteria strains has not been yet elucidated. Nevertheless, it was
thoroughly explained for Gram-positive bacteria, a group of which actinobacteria are a part of. In fact,
Piotrowska [27] found that cells which had their cell wall partially removed, bound the OTA less than
the non modified cells, which proves the implication of the cell walls in this type of detoxification.
Moreover, Escherichia coli, Gram-negative bacteria, was found not able to bind toxins, that was
attributed to its moderately hydrophilic surface (rich in lipopolysaccharides). While LAB bacteria have
a similar wall composition, they have hydrophobic pockets on their wall surfaces that confers the
bacteria the ability to bind OTA [29].
In this study we found that the supernatant of each of the tested strains had a slight but significant
effect on OTA reduction in ISP2 liquid medium after 5 days of incubation. Reduction levels were even
higher when the strains were cultured in ISP2 liquid medium contaminated with 95.45 ng/mL of OTA.
Indeed, AT8 supernatant was capable of degrading 22.42% of the OTA, while the strain itself reduced
42.13% of the added OTA. Some authors assumed that biodegradation of OTA is also involved in the
food detoxification process. Viable L. acidophilus cells were able to reduce OTA (95% after 4h) more
efficiently than non viable cells [30]. Similarly, S. cerevisiae was able to degrade 38% of this toxin after
24h, without any descriptions on the type of the resulting metabolites [10]. Schatzmayr, et al. [31]
explained this process when he noticed that Trichosporum, Rhodotorula and Cryptococcus strains
biodegraded OTA through the hydrolysis of the amide bond, resulting in OTα and L-β-phenylalanine
accumulation. This type of degradation mechanism can be adopted in detoxification techniques, since
both of the resulting metabolites are virtually non-toxic. Other studies suggested that biodegradation
can be achieved via the cleavage of the lactone ring, resulting in the formation of an opened lactone
form of OTA that exhibited similar toxicity of OTA in rats [9].
In the third part of this study, results showed that MS1, G10 and ML5 strains had a significant
impact on the expression of acpks, acOTApks and acOTAnrps in A. carbonarius S402, that eventually
resulted in the reduction of OTA production by 23.91, 13.50 and 11.69 respectively for each strain,
whereas the coculture of A. carbonarius S402 with the other 4 strains (AT10, AT8, PT1 and SN7) did not
affect the expression of these genes. This type of mode of action was studied by Verheecke, et al. [32]
on A. flavus and A. parasiticus and found that some actinobacteria strains (S27 and S17) did not
significantly affect the expression of AFB biosynthetic genes, while others (S06, S13 and S35) had a great
impact on several genes (S06 down-regulated aflS expression by 100%).
This study showed that the application of different actinobacteria strains might reduce the OTA
contamination, since each strain acted differently when it was put in contact with this toxin. OTA
detoxification (binding and biodegradation) with actinobacteria strains might be more effective than
preventing the production of this toxin. Further studies are required on this topic, in order to evaluate
the effect of the studied bacteria on the integrity of the decontaminated food.
4. Materials and methods
4.1. Actinobacteria and A. carbonarius strains
Several actinobacteria strains, previously isolated from Algerian soils were chosen for our study.
In order to revive these strains (AT10, AT8, SN7, MS1, ML5, G10 and PT1), they were first sub-cultured
for 4 days at 28°C, on an ISP2 (International Streptomyces Project 2) agar medium (4.0g yeast extract,
10.0g malt extract, 4.0g dextrose, 20.0g agar, 1L tap water, pH adjusted to 7.2). In parallel, A. carbonarius
spores solution was prepared in the same manner described in our previous work [8]. The spores count
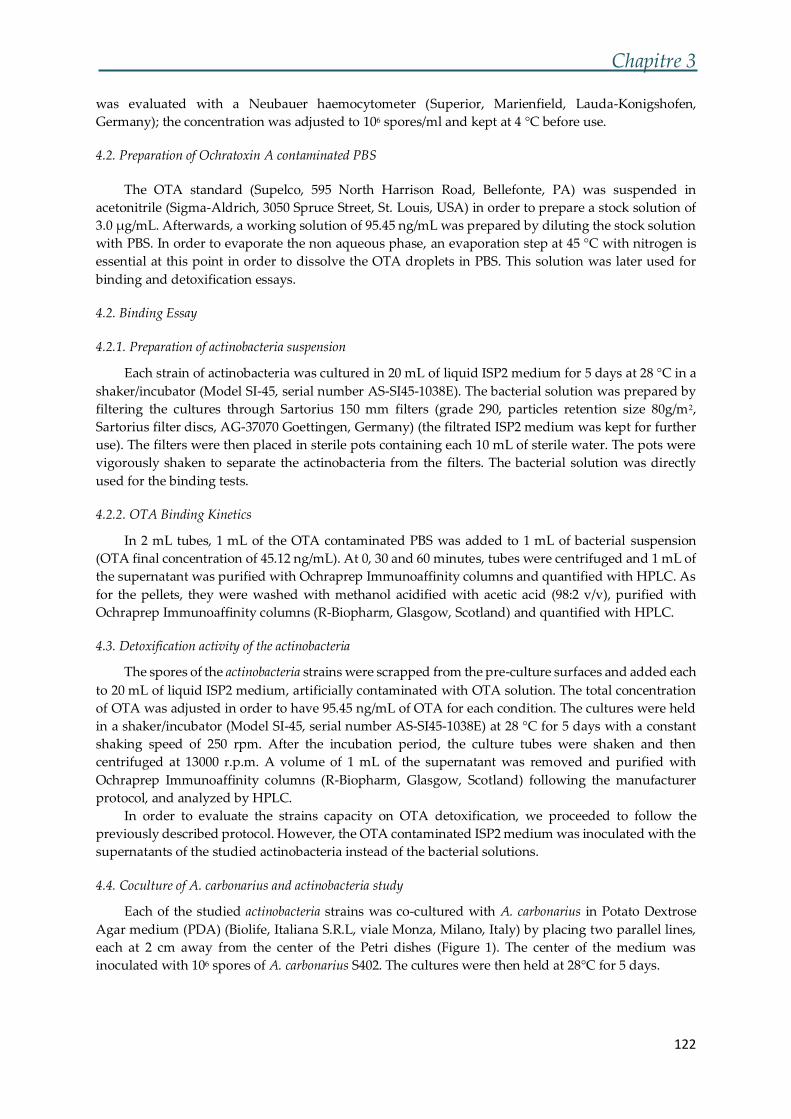
Chapitre 3
122
was evaluated with a Neubauer haemocytometer (Superior, Marienfield, Lauda-Konigshofen,
Germany); the concentration was adjusted to 106 spores/ml and kept at 4 °C before use.
4.2. Preparation of Ochratoxin A contaminated PBS
The OTA standard (Supelco, 595 North Harrison Road, Bellefonte, PA) was suspended in
acetonitrile (Sigma-Aldrich, 3050 Spruce Street, St. Louis, USA) in order to prepare a stock solution of
3.0 µg/mL. Afterwards, a working solution of 95.45 ng/mL was prepared by diluting the stock solution
with PBS. In order to evaporate the non aqueous phase, an evaporation step at 45 °C with nitrogen is
essential at this point in order to dissolve the OTA droplets in PBS. This solution was later used for
binding and detoxification essays.
4.2. Binding Essay
4.2.1. Preparation of actinobacteria suspension
Each strain of actinobacteria was cultured in 20 mL of liquid ISP2 medium for 5 days at 28 °C in a
shaker/incubator (Model SI-45, serial number AS-SI45-1038E). The bacterial solution was prepared by
filtering the cultures through Sartorius 150 mm filters (grade 290, particles retention size 80g/m2,
Sartorius filter discs, AG-37070 Goettingen, Germany) (the filtrated ISP2 medium was kept for further
use). The filters were then placed in sterile pots containing each 10 mL of sterile water. The pots were
vigorously shaken to separate the actinobacteria from the filters. The bacterial solution was directly
used for the binding tests.
4.2.2. OTA Binding Kinetics
In 2 mL tubes, 1 mL of the OTA contaminated PBS was added to 1 mL of bacterial suspension
(OTA final concentration of 45.12 ng/mL). At 0, 30 and 60 minutes, tubes were centrifuged and 1 mL of
the supernatant was purified with Ochraprep Immunoaffinity columns and quantified with HPLC. As
for the pellets, they were washed with methanol acidified with acetic acid (98:2 v/v), purified with
Ochraprep Immunoaffinity columns (R-Biopharm, Glasgow, Scotland) and quantified with HPLC.
4.3. Detoxification activity of the actinobacteria
The spores of the actinobacteria strains were scrapped from the pre-culture surfaces and added each
to 20 mL of liquid ISP2 medium, artificially contaminated with OTA solution. The total concentration
of OTA was adjusted in order to have 95.45 ng/mL of OTA for each condition. The cultures were held
in a shaker/incubator (Model SI-45, serial number AS-SI45-1038E) at 28 °C for 5 days with a constant
shaking speed of 250 rpm. After the incubation period, the culture tubes were shaken and then
centrifuged at 13000 r.p.m. A volume of 1 mL of the supernatant was removed and purified with
Ochraprep Immunoaffinity columns (R-Biopharm, Glasgow, Scotland) following the manufacturer
protocol, and analyzed by HPLC.
In order to evaluate the strains capacity on OTA detoxification, we proceeded to follow the
previously described protocol. However, the OTA contaminated ISP2 medium was inoculated with the
supernatants of the studied actinobacteria instead of the bacterial solutions.
4.4. Coculture of A. carbonarius and actinobacteria study
Each of the studied actinobacteria strains was co-cultured with A. carbonarius in Potato Dextrose
Agar medium (PDA) (Biolife, Italiana S.R.L, viale Monza, Milano, Italy) by placing two parallel lines,
each at 2 cm away from the center of the Petri dishes (Figure 1). The center of the medium was
inoculated with 106 spores of A. carbonarius S402. The cultures were then held at 28°C for 5 days.
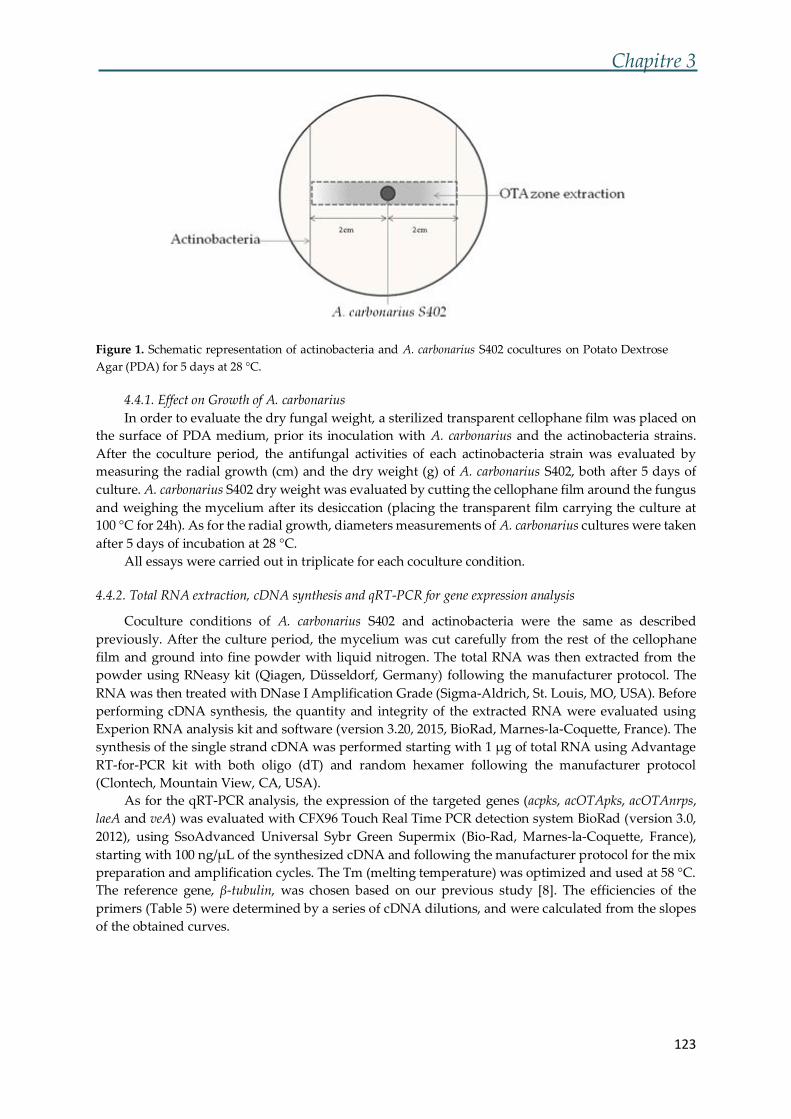
Chapitre 3
123
Figure 1. Schematic representation of actinobacteria and A. carbonarius S402 cocultures on Potato Dextrose
Agar (PDA) for 5 days at 28 °C.
4.4.1. Effect on Growth of A. carbonarius
In order to evaluate the dry fungal weight, a sterilized transparent cellophane film was placed on
the surface of PDA medium, prior its inoculation with A. carbonarius and the actinobacteria strains.
After the coculture period, the antifungal activities of each actinobacteria strain was evaluated by
measuring the radial growth (cm) and the dry weight (g) of A. carbonarius S402, both after 5 days of
culture. A. carbonarius S402 dry weight was evaluated by cutting the cellophane film around the fungus
and weighing the mycelium after its desiccation (placing the transparent film carrying the culture at
100 °C for 24h). As for the radial growth, diameters measurements of A. carbonarius cultures were taken
after 5 days of incubation at 28 °C.
All essays were carried out in triplicate for each coculture condition.
4.4.2. Total RNA extraction, cDNA synthesis and qRT-PCR for gene expression analysis
Coculture conditions of A. carbonarius S402 and actinobacteria were the same as described
previously. After the culture period, the mycelium was cut carefully from the rest of the cellophane
film and ground into fine powder with liquid nitrogen. The total RNA was then extracted from the
powder using RNeasy kit (Qiagen, Düsseldorf, Germany) following the manufacturer protocol. The
RNA was then treated with DNase I Amplification Grade (Sigma-Aldrich, St. Louis, MO, USA). Before
performing cDNA synthesis, the quantity and integrity of the extracted RNA were evaluated using
Experion RNA analysis kit and software (version 3.20, 2015, BioRad, Marnes-la-Coquette, France). The
synthesis of the single strand cDNA was performed starting with 1 µg of total RNA using Advantage
RT-for-PCR kit with both oligo (dT) and random hexamer following the manufacturer protocol
(Clontech, Mountain View, CA, USA).
As for the qRT-PCR analysis, the expression of the targeted genes (acpks, acOTApks, acOTAnrps,
laeA and veA) was evaluated with CFX96 Touch Real Time PCR detection system BioRad (version 3.0,
2012), using SsoAdvanced Universal Sybr Green Supermix (Bio-Rad, Marnes-la-Coquette, France),
starting with 100 ng/µL of the synthesized cDNA and following the manufacturer protocol for the mix
preparation and amplification cycles. The Tm (melting temperature) was optimized and used at 58 °C.
The reference gene, β-tubulin, was chosen based on our previous study [8]. The efficiencies of the
primers (Table 5) were determined by a series of cDNA dilutions, and were calculated from the slopes
of the obtained curves.
Chapitre 3
124
Table 5: List of primers used in this study
Primer name Primer sequence (5’ 3’) References Efficiency
acpks-F
acpks-R
GAGTCTGACCATCGACACGG
GGCGACTGTGACACATCCAT [33] 95.0%
acOTApks-F
acOTApks-R
CGTGTCCGATACTGTCTGTGA
GCATGGAGTCCTCAAGAACC [34] 98.5%
acOTAnrps-F
acOTAnrps-R
ATCCCCGGAATATTGGCACC
CCTTCGATCAAGAGCTCCCC [35] 102.1%
laeA-F
laeA-R
CACCTATACAACCTCCGAACC
GGTTCGGCCAACCGACGACGC [36] 100.7%
veA-F
veA-R
TCCCGGTTCTCACAGGCGTA
GCTGTCCTTGGTCTCCTCGTA [36] 99.3%
β-tubulin-F
β-tubulin-R
CGCATGAACGTCTACTTCAACG
AGTTGTTACCAGCACCGGA [37] 101.1%
4.5. OTA extraction
The OTA concentration was performed by extracting 3 agar plugs from the PDA medium, with
0.5 cm diameter each. OTA was extracted by adding 1 mL of methanol and shaken for 1 hour. After the
incubation period, the mix was centrifuged at 13000 rpm (round per minute) for 20 minutes. The
supernatant containing the OTA was then purified with Ochraprep immunoaffinity columns (R-
Biopharm, Glasgow, Scotland) following the manufacturer protocol.
4.6. HPLC analysis
The concentration of the purified OTA was evaluated with Water Alliance HPLC system using an
Utisphere ODB column, C18 (150 x 4.6 mm, 5 µm, 120 Å) (Interchim, Montluçon, France) at 30 °C. The
isocratic flow (flow rate of 1 mL/min) was composed of 49% acidified water (0.2% of acetic acid) and
51% acetonitrile for 30 min of run. The volume of the injected extract was set at 100 µL and OTA was
detected after 8 minutes of run, by a fluorescent detector at 333/440 nm excitation/emission
wavelengths.
4.7. Statistical analysis
All the data in this study were analyzed through One-Way Analysis Of Variance (ANOVA) and
paired t-test using STATGRAPHICS Centurion XVI (version 16.1.11 for windows, 2010, StatPoint
Technologies Inc. Warrenton, VA, USA).
Conflicts of Interest: The authors declare no conflict of interest.
List of Abbreviations
A. carbonarius: Aspergillus carbonarius
qRT-PCR : Quantitative Reverse Transcription-Polymerase Chain Reaction
OTA: Ochratoxin A
LAB: Lactic Acid Bacteria
AFB: Aflatoxin
PDA: Potato Dextrose Agar
ISP2: International Streptomyces Project-2
PBS: Phosphate Buffer Solution
HPLC: High Performance Liquid Chromatography
rpm: Round per minute
Chapitre 3
125
References
1. Park, J.W.; Chung, S.-H.; Kim, Y.-B. Ochratoxin a in korean food commodities: Occurrence and safety
evaluation. Journal of Agricultural and Food Chemistry 2005, 53, 4637-4642.
2. Overy, D.P.; Seifert, K.A.; Savard, M.E.; Frisvad, J.C. Spoilage fungi and their mycotoxins in commercially
marketed chestnuts. International journal of food microbiology 2003, 88, 69-77.
3. Juodeikiene, G.; Bartkiene, E.; Basinskiene, L.; Matusevicius, P. Mycotoxin decontamination aspects in food,
feed and renewables using fermentation processes. INTECH Open Access Publisher: 2012.
4. El Khoury, A.; Rizk, T.; Lteif, R.; Azouri, H.; Delia, M.-L.; Lebrihi, A. Occurrence of ochratoxin a- and aflatoxin
b1-producing fungi in lebanese grapes and ochratoxin a content in musts and finished wines during 2004.
Journal of Agricultural and Food Chemistry 2006, 54, 8977-8982.
5. IARC. Some naturally occuring substances: Food items and constituents, heterocyclic aromatic amines and
mycotoxins. IARC Monographs on the Evaluation of Carcinogenic Risks to Humans; World Health
Organization: Lyon, Fance 1993, 56, 489-521.
6. Wu, F.; Bui-Klimke, T.; Naumoff Shields, K. Potential economic and health impacts of ochratoxin a regulatory
standards. World Mycotoxin Journal 2014, 7, 387-398.
7. Hua, H.; Xing, F.; Selvaraj, J.N.; Wang, Y.; Zhao, Y.; Zhou, L.; Liu, X.; Liu, Y. Inhibitory effect of essential oils
on aspergillus ochraceus growth and ochratoxin a production. PloS one 2014, 9, e108285.
8. Murthy, P.S.; Borse, B.B.; Khanum, H.; Srinivas, P. Inhibitory effects of ajowan (trachyspermum ammi)
ethanolic extract on a. Ochraceus growth and ochratoxin production. Turkish Journal of Biology 2009, 33, 211-
217.
9. El Khoury, R.; Atoui, A.; Verheecke, C.; Maroun, R.; El Khoury, A.; Mathieu, F. Essential oils modulate gene
expression and ochratoxin a production in aspergillus carbonarius. Toxins 2016, 8.
10. Abrunhosa, L.; Paterson, R.R.; Venancio, A. Biodegradation of ochratoxin a for food and feed
decontamination. Toxins 2010, 2, 1078-1099.
11. Böhm, J.; Grajewski, J.; Asperger, H.; Cecon, B.; Rabus, B.; Razzazi, E. Study on biodegradation of some a-and
b-trichothecenes and ochratoxin a by use of probiotic microorganisms. Mycotoxin research 2000, 16, 70-74.
12. Bejaoui, H.; Mathieu, F.; Taillandier, P.; Lebrihi, A. Ochratoxin a removal in synthetic and natural grape juices
by selected oenological saccharomyces strains. J Appl Microbiol 2004, 97, 1038-1044.
13. Brady, D.; Stoll, A.; Starke, L.; Duncan, J. Chemical and enzymatic extraction of heavy metal binding polymers
from isolated cell walls of saccharomyces cerevisiae. Biotechnology and bioengineering 1994, 44, 297-302.
14. Bolognani, F.; Rumney, C.; Rowland, I. Influence of carcinogen binding by lactic acid-producing bacteria on
tissue distribution and in vivo mutagenicity of dietary carcinogens. Food and Chemical Toxicology 1997, 35,
535-545.
15. Santos, A.; Marquina, D.; Leal, J.; Peinado, J. (1→ 6)-β-d-glucan as cell wall receptor for pichia
membranifaciens killer toxin. Applied and environmental microbiology 2000, 66, 1809-1813.
16. Bata, Á.; Lásztity, R. Detoxification of mycotoxin-contaminated food and feed by microorganisms. Trends in
Food Science & Technology 1999, 10, 223-228.
17. Patharajan, S.; Reddy, K.; Karthikeyan, V.; Spadaro, D.; Lore, A.; Gullino, M.; Garibaldi, A. Potential of yeast
antagonists on invitro biodegradation of ochratoxin a. Food Control 2011, 22, 290-296.
18. Styriak, I.; Conková, E. Microbial binding and biodegradation of mycotoxins. Veterinary and human
toxicology 2002, 44, 358-361.
19. Varga, J.; Péteri, Z.; Tábori, K.; Téren, J.; Vágvölgyi, C. Degradation of ochratoxin a and other mycotoxins by
rhizopus isolates. International journal of food microbiology 2005, 99, 321-328.
20. Bielecki, S.; Tramper, J.; Polak, J. The biodegradation of ochratoxin a in food products by lactic acid bacteria
and baker's yeast. Food Biotechnology 2000, 17, 307.
21. Turbic, A.; Ahokas, J.; Haskard, C. Selective in vitro binding of dietary mutagens, individually or in
combination, by lactic acid bacteria. Food additives & contaminants 2002, 19, 144-152.
22. Ningthoujam, S.; Sanasam, S.; Tamreihao, K.; Nimaich, S. Antagonistic activities of local actinomycete isolates
against rice fungal pathogens. African journal of microbiology research 2009, 3, 737-742.
23. Hogan, C.M. Bacteria. Encyclopedia of Earth. Washington DC: National Council for Science and the
Environment 2010.
Chapitre 3
126
24. Verheecke, C.; Liboz, T.; Darriet, M.; Sabaou, N.; Mathieu, F. In vitro interaction of actinomycetes isolates
with aspergillus flavus: Impact on aflatoxins b1 and b2 production. Lett Appl Microbiol 2014, 58, 597-603.
25. Piotrowska, M.; Zakowska, Z. The elimination of ochratoxin a by lactic acid bacteria strains. Polish Journal of
Microbiology 2005, 54, 279-286.
26. Pereyra, C.M.; Cavaglieri, L.R.; Keller, K.M.; Maris, S.; Chiacchiera, C.A.d.R.R.; Dalcero, A.M. In vitro
ochratoxin a adsorption by commercial yeast cell walls. Revista Brasileira de Medicina Veterinária 2015,
7(1):25-28.
27. Yiannikouris, A.; André, G.; Poughon, L.; François, J.; Dussap, C.-G.; Jeminet, G.; Bertin, G.; Jouany, J.-P.
Chemical and conformational study of the interactions involved in mycotoxin complexation with β-d-
glucans. Biomacromolecules 2006, 7, 1147-1155.
28. Piotrowska, M. The adsorption of ochratoxin a by lactobacillus species. Toxins 2014, 6, 2826-2839.
29. El-Nezami, H.; Kankaanpaa, P.; Salminen, S.; Ahokas, J. Ability of dairy strains of lactic acid bacteria to bind
a common food carcinogen, aflatoxin b 1. Food and Chemical Toxicology 1998, 36, 321-326.
30. Haskard, C.A.; El-Nezami, H.S.; Kankaanpää, P.E.; Salminen, S.; Ahokas, J.T. Surface binding of aflatoxin b1
by lactic acid bacteria. Applied and environmental microbiology 2001, 67, 3086-3091.
31. Fuchs, S.; Sontag, G.; Stidl, R.; Ehrlich, V.; Kundi, M.; Knasmüller, S. Detoxification of patulin and ochratoxin
a, two abundant mycotoxins, by lactic acid bacteria. Food and Chemical Toxicology 2008, 46, 1398-1407.
32. Schatzmayr, G.; Heidler, D.; Fuchs, E.; Nitsch, S.; Mohnl, M.; Täubel, M.; Loibner, A.; Braun, R.; Binder, E.
Investigation of different yeast strains for the detoxification of ochratoxin a. Mycotoxin research 2003, 19, 124-
128.
33. Verheecke, C.; Liboz, T.; Anson, P.; Diaz, R.; Mathieu, F. Reduction of aflatoxin production by aspergillus
flavus and aspergillus parasiticus in interaction with streptomyces. Microbiology 2015, 161, 967-972.
34. Gallo, A.; Perrone, G.; Solfrizzo, M.; Epifani, F.; Abbas, A.; Dobson, A.D.; Mule, G. Characterisation of a pks
gene which is expressed during ochratoxin a production by aspergillus carbonarius. International journal of
food microbiology 2009, 129, 8-15.
35. Gallo, A.; Knox, B.P.; Bruno, K.S.; Solfrizzo, M.; Baker, S.E.; Perrone, G. Identification and characterization of
the polyketide synthase involved in ochratoxin a biosynthesis in aspergillus carbonarius. International
journal of food microbiology 2014, 179, 10-17.
36. Gallo, A.; Bruno, K.S.; Solfrizzo, M.; Perrone, G.; Mule, G.; Visconti, A.; Baker, S.E. New insight into the
ochratoxin a biosynthetic pathway through deletion of a nonribosomal peptide synthetase gene in aspergillus
carbonarius. Appl Environ Microbiol 2012, 78, 8208-8218.
37. Crespo-Sempere, A.; Marin, S.; Sanchis, V.; Ramos, A.J. Vea and laea transcriptional factors regulate
ochratoxin a biosynthesis in aspergillus carbonarius. International journal of food microbiology 2013, 166,
479-486.
38. Cabañes, F.J.; Bragulat, M.R.; Castellá, G. Characterization of nonochratoxigenic strains of aspergillus
carbonarius from grapes. Food Microbiology 2013, 36, 135-141.
© 2017 by the authors. Submitted for possible open access publication under the
terms and conditions of the Creative Commons Attribution (CC BY) license
(http://creativecommons.org/licenses/by/4.0/).
III. Conclusion
En conclusion, la réduction de l’OTA peut être achevée soit en employant des
agents antioxydants, soit en réduisant sa disponibilité par des méthodes
enzymatiques ou d’adhésion. Notre étude a montré que l’emploi des souches
Chapitre 3
127
d’actinomycètes, pourra effectivement conduire à la réduction des taux d’OTA selon
la nature de la souche.
En effet, les souches MS1, ML5 et G10 ont pu réprimer l’expression des gènes de
biosynthèse (acpks, acOTApks et acOTAnrps) induisant ainsi à une inhibition de la
production de l’OTA par A. carbonarius S402. La souche ML5 était la plus efficace,
puisqu’elle a inhibé l’expression du gène acpks de 39%, le fait qui a entrainer une baisse
de 13.70% de la production de l’OTA.
Pourtant cette souche n’était pas parmi les souches les plus puissantes qui ont pu
adhérer l’OTA à leur surface.
La souche SN7 avait l’effet la plus remarquable. En effet, elle a inhibé jusqu’à
33.93% de l’OTA présent dans la solution PBS. En plus, cette même souche a pu
dégrader significativement l’OTA après 5 jours d’incubation dans le milieu PDA,
réduisant ainsi 52.68% de l’OTA préalablement ajoutée au milieu de culture.

128

129
Discussion générale et
perspectives

130
Discussion générale
131
Les composés phénoliques et les huiles essentielles extraits des feuilles, des tiges,
des racines ainsi que des grains des plantes possèdent un large spectre d’activité
biologique et peuvent fournir des alternatives potentielles aux fongicides toxiques
actuellement utilisés pour contrôler la croissance des champignons avant et après la
récolte.
Effectivement la première partie de notre étude a montré que l’emploi de ces deux
types d’extraits a contribué d’une part à la réduction de la croissance fongique,
observée uniquement avec l’emploi des huiles essentielles (huiles essentielles du
thym, cannelle, taramira et origan) et d’autre part à l’inhibition de la production de
l’OTA, sans forcément touché à la croissance fongique. Ce type de réduction a été
obtenu en utilisant les composés phénoliques et les huiles essentielles des plantes
suivantes : fenouil, céleri, cardamome, camomille, anis, romarin, feuille de laurier,
cumin, fenugrec, mélisse, menthe et sauge. Ces résultats sont similaires à ceux obtenus
par d’autres auteurs, qui ont évalué l’effet de divers extraits végétaux sur la croissance
des champignons mycotoxinogènes et leur capacité à produire les mycotoxines propre
à chaque espèce étudiée (Basílico and Basílico, 1999, Boutigny et al., 2009, Cakir et al.,
2005, da Cruz Cabral et al., 2013, Ferreira et al., 2013, Fuchs et al., 2008).
Des études approfondies ont expliqué le mode d’action des huiles essentielles sur
les champignons et bien d’autres microorganismes. En effet, les propriétés
antifongiques de ces huiles dépendent principalement des caractéristiques
quantitatives et qualitatives de leurs composants actifs (Ibrahim et al., 2015). Des
groupes fonctionnels tels que l’alcool, les phénols, les terpènes et les cétones ainsi que
l’existence d’une certaine corrélation synergique entre les composants totaux. En plus,
leur amphipathie leur amène à interagir avec la biomembrane et montrer une activité
microbienne (Veldhuizen et al., 2006, Tripathi et al., 2009). Le mécanisme est attribué
au noyau benzénique hydrophobe et aux chaînes latérales aliphatiques enfouies dans
la partie hydrophobe interne de la membrane, ainsi que la partie hydrophile de la
molécule qui interagit avec la partie polaire de la membrane. Une autre explication est
Discussion générale
132
basée sur l’implication du groupe hydroxyle dans la formation des liaisons hydrogène
et l’acidité de ces composés phénoliques (Cristani et al., 2007).
D’autres auteurs ont mis une hypothèse qui atteste que les effets antifongiques des
huiles essentielles reviennent à leur toxicité sur la fonctionnalité et la structure de la
membrane cellulaire, en inhibant la respiration et la perméabilité de la membrane du
champignon (Sikkema et al., 1995). A des doses plus élevées, ces huiles provoquent
des dommages cellulaires irréversibles à cette membrane conduisant ainsi à la perte
de l’homéostasie et la mort cellulaire (Carson et al., 2002). Conner and Beuchat (1984)
ont attribué l’effet antifongique des huiles essentielles aux interactions de ces
dernières avec les enzymes cellulaires impliquées dans la production d’énergie et la
synthèse des composants structurels des cellules microbiennes.
D’un autre point de vue, Omidbeygi et al. (2007) ont suggéré que les composants
des huiles essentielles pénètrent dans la membrane cellulaire et interagissent avec les
protéines de la membrane, conduisant à un flux de protons vers l’extérieur de la
cellule, le fait qui provoque la mort cellulaire. D’une autre part, il a été indiqué par
Lucini et al. (2006) que les monoterpènes présents dans les huiles essentielles
provoquent l’inhibition de la croissance du mycélium en augmentant la concentration
des peroxydes lipidiques tels que les radicaux hydroxyles, alkoxyle et alkoperoxyle,
activant ainsi la voie de l’apoptose cellulaire.
Un autre mode d’action des huiles essentielles a été récemment mis en évidence
pour les huiles n’ayant pas un effet sur la croissance du champignon producteur de
mycotoxine mais plutôt sur la production des ces toxines. Plusieurs auteurs ont
remarqué que l’emploi des huiles essentielles ou de leurs composants actifs, a inhibé
la production de l’OTA et que cette réduction n’était pas en corrélation avec la
réduction de la masse fongique (Murthy et al., 2009, Hua et al., 2014, Ferrara et al.,
2015). Cette diminution de la production a été attribuée à la répression de l’expression
des gènes impliqués dans la biosynthèse de cette toxine. Ces observations sont
Discussion générale
133
similaires à celles obtenues et élaborées dans le deuxième chapitre de cette étude.
Effectivement, les huiles essentielles du fenouil, cardamome, camomille, romarin, anis
et céleri ont réduit la production de l’OTA en réduisant l’expression des gènes acpks,
acOTApks, acOTAnrps ainsi que les gènes de régulation veA et laeA.
La détoxification des mycotoxines est achevée par l’élimination, l’inactivation ou
la dégradation des mycotoxines présentes dans les commodités contaminées (Kabak
et al., 2006). Ces dernières années ont témoignées l’intérêt croissant pour détoxifier
l’OTA par des microorganismes, tels que les bactéries, les levures et les champignons.
Effectivement, la dégradation de l’OTA par divers microorganismes a été élaborée par
plusieurs auteurs au cours des années. Özpinar et al. (1999) ont découvert que les
microorganismes présents dans le rumen, surtout les protozoaires, hydrolysent l’OTA
en OTα, un métabolite dont sa toxicité est inférieure à celle de l’OTA. D’autres études
ont montré la capacité de différents microorganismes à dégrader l’OTA, tels que
Phenylobacterium immobile (Wegst and Lingens, 1983), Acinobacter calcoaticus (Hwanga
and Draughon, 1994), Trichosporon mycotoxinivorans (Schatzmayr et al., 2006),
brevibacterium spp. (Rodriguez et al., 2011), Pediococcus parvulus (Abrunhosa et al.,
2014), Aspergillus spp. (Varga et al., 2000) ainsi que les bactéries lactiques. L’étude de
la dégradation de l’OTA a été poursuivie sur des bactéries lactiques appartenant
généralement au genre Lactobacillus vue leurs effets bénéfiques et leurs propriétés
probiotiques (Naidu et al., 1999). Effectivement, L. acidophilus, L. helveticus, L.
sanfranciscensis et L. rhamnosus sont les bactéries lactiques les plus efficaces contre la
décontamination de l’OTA par dégradation enzymatique après 40h de contact (70.5,
67.1, 52.0 et 87.5% respectivement pour ces souches) (Piotrowska and Zakowska,
2005).
Nos résultats sont similaires à ceux trouvés dans la littérature, puisque les tests ont
montré qu’en présence des surnageant des sept souches d’actinomycètes, les taux
d’OTA ont diminué significativement, tout en dépendant de la souche utilisée. C’est
ainsi que le surnageant de la souche SN7 a réduit 22.46% l’OTA (taux de réduction le

Discussion générale
134
plus élevé), le fait qui signifie que la bactérie a produit naturellement des enzymes
capables de cliver l’OTA et diminuer par la suite sa disponibilité. Cependant, la
culture de la souche SN7 en présence de l’OTA a diminué d’avantage ce taux, arrivant
à 52.68% pour cette souche. L’activité enzymatiques des bactéries issues du sol contre
l’OTA a été évalué par De Bellis et al. (2015) qui ont trouvé que l’Acinetobacter
calcoaceticus 396.1 et Acinetobacter sp. neg1 (isolées du sol des vignobles) ont pu
transformer l’OTA en OTα après 5 jours de culture sur le milieu de culture BHI (Brain
Heart Infusion broth). Egalement, d’autres rapports ont montré que les bactéries
isolées des sols agricoles représentent une source intéressante de microorganismes
ayant la capacité de dégrader les mycotoxines (Islam et al., 2012, Sato et al., 2012). En
effet, les bactéries du sol, telles que Pseudomonas spp. et Acinetobacter spp. sont
capables de convertir un important nombre de composés aromatiques, jouant ainsi un
rôle primordiale dans la biodégradation des molécules toxiques présentes dans les
sols contaminés (Cao et al., 2009). Les souches d’actinomycètes décrites dans cette
étude peuvent avoir la même voie de dégradation reconnue chez d’autres
microorganismes (Abrunhosa et al., 2010), en dégradant l’OTA par l’hydrolyse de la
liaison amide, provoquant ainsi la libération de l’OTα, considéré comme non toxique
(Xiao et al., 1995, Bittner et al., 2015). Plusieurs peptidases sont impliquées dans cette
catalyse, telle que l’enzyme carboxypeptidase A isolée du pancréas bovin (Doster and
Sinnhuber, 1972), une enzyme du type lipase disponible dans le commerce (Stander et
al., 2001), une enzyme protéique isolée d’A. niger (Abrunhosa et al., 2006) ainsi que la
carboxypeptidase Y isolée de S. cerevisiae (Abrunhosa et al., 2010).
Les différences entre les taux de réductions de l’OTA entre les surnageants de
bactéries et les bactéries mêmes après 5 jours de culture dans le milieu ISP2 liquide,
nous a poussés à examiner le pouvoir d’adhésion des sept souches utilisées. La
confirmation de cette hypothèse a été exécutée suite à une cinétique entre les souches
de bactéries et l’OTA mises en contact dans une solution non nutritive (PBS). Après
une heure d’incubation, le taux d’OTA a diminué d’une manière significative par

Discussion générale
135
toutes les souches. La souche SN7 avait le pouvoir d’adhésion le plus fort,
puisqu’après 60 mins, elle a pu adhérer 33.93% de l’OTA à sa surface. Cette quantité
a été relarguée après le lavage du culot bactérien par une solution de méthanol
acidifiée (2% acide acétique). En effet, L. acidophilus VM20, L. plantarum, L. brevi and L.
sanfranciscensis ont provoqué une diminution dans les taux d’OTA variant entre 14.8%
(L. sanfranciscensis) et 95% (L. acidophilus VM20) dans la solution non nutritive PBS
(Petchkongkaew et al., 2008, Piotrowska, 2014). Ces résultats sont similaires aux
nôtres, comme toutes les actinobactéries testées ont pu réduire significativement
l’OTA ajoutée à la solution PBS. En 2014, Piotrowska (2014) ont observé que le temps
d’adhésion de l’OTA à la surface des bactéries lactiques est un processus très rapide
(85% de l’OTA a été réduite après 30 minutes de contact). Similairement, les résultats
de notre étude montrent que la souche SN7 a pu adhérer 33.93% de l’OTA après 60
minutes, sachant que même après 5 jours de culture ce taux a atteint 36.60%
(augmentation de 2.67% seulement). Selon la littérature, la liaison des mycotoxines
aux biomasses bactériennes se fait par le biais des composants de la paroi cellulaire,
puisque les bactéries dépourvues de cette paroi perdent leur capacité à adhérer les
mycotoxines. Les composants impliqués dans ce processus sont les peptidoglycanes
et les polysaccharides ainsi que les acides teichoiques et lipoteichoiques (Zhang and
Ohta, 1991, Niderkorn et al., 2009). Le facteur principal responsable de l’élimination
des toxines revient probablement à la nature hydrophobe de la paroi cellulaire
bactérienne (Haskard et al., 2001, Haskard et al., 2000).

Perspectives
136
Les huiles essentielles sont des extraits complexes, constitués de plusieurs
composés pouvant déclencher une réponse cellulaire et des modifications au niveau
transcriptomique qui peuvent ne pas être forcément liés à son effet
antiochratoxinogène. La purification d’un ou de plusieurs composants actifs des
huiles possédant ce pouvoir, pourra être une piste intéressante afin de lutter contre
l’OTA, et d’évaluer leur possibilité d’application aux champs et dans les silos de
stockage ainsi que sur des denrées alimentaires.
Le but de notre projet est de se débarrasser de l’OTA afin de limiter les pertes
économiques ainsi que les dégâts sanitaires causés par cette toxine. Afin de respecter
ce but, nous souhaitons étudier l’effet des huiles essentielles, des composés
phénoliques ainsi que les actinobactéries sur la santé de l’homme d’une part et la
qualité organoleptique du produit traité d’une autre part.
La troisième partie de notre étude qui portait sur la détoxification de l’OTA a été
réalisée en utilisant sept souches d’actinomycètes. Pour compléter cette étude, il sera
bien convenable de continuer de travailler sur d’autres souches d’actinomycètes afin
de trouver une ou plusieurs souches ayant un potentiel réducteur intéressant de
l’OTA.
Il est généralement préférable d’éliminer l’OTA par adhésion que par dégradation
enzymatique, vu l’absence de l’apparition des métabolites de dégradation. Pour cette
raison, une étude approfondie sur l’optimisation de la capacité d’adhésion des
souches d’actinomycètes est souhaitée, en travaillant sur l’augmentation des sites
d’adhésion propre à chaque souche par divers techniques physiques et/ou chimiques.
Références
137
ABARCA, M. L. B., M.R.; CASTELLA, G.; CABANES, F.J. (1994). OchratoxinA production by strains of Aspergillus niger var. niger. Appl. Environ. Microbiol., 2650-2652.
ABBAS, A., COGHLAN, A., O'CALLAGHAN, J., GARCIA-ESTRADA, C., MARTIN, J. F. and DOBSON, A. D. (2013). Functional characterization of the polyketide synthase gene required for ochratoxin A biosynthesis in Penicillium verrucosum. International journal of food microbiology, 161, 172-81.
ABRUNHOSA, L., INÊS, A., RODRIGUES, A. I., GUIMARÃES, A., PEREIRA, V. L., PARPOT, P., MENDES-FAIA, A. and VENÂNCIO, A. (2014). Biodegradation of ochratoxin A by Pediococcus parvulus isolated from Douro wines. International journal of food microbiology, 188, 45-52.
ABRUNHOSA, L., PATERSON, R. R. and VENANCIO, A. (2010). Biodegradation of ochratoxin a for food and feed decontamination. Toxins, 2, 1078-99.
ABRUNHOSA, L., SANTOS, L. and VENÂNCIO, A. (2006). Degradation of ochratoxin A by proteases and by a crude enzyme of Aspergillus niger. Food Biotechnology, 20, 231-242.
AFSSA (2009). Evaluation des risques liés à la présence de mycotoxines dans les chaines alimentaires humaine et animale-Rapport final.
AKUECHE, E., ANJORIN, S., HARCOURT, B., KANA, D., ADEBOYE, E., SHEHU, I., AKANDE, R., ADELEKE, A., SHONOWO, O. and ADESANMI, C. (2012). Studies on fungal load, total aflatoxins and ochratoxin A contents of gamma-irradiated and non-irradiated Sesamum indicum grains from Abuja markets, Nigeria. Kasetsart J Nat Sci, 46, 371-82.
ALDERMAN, S. C., COATS, D. D., CROWE, F. J. and BUTLER, M. D. (1998). Occurrence and distribution of ergot and estimates of seed loss in Kentucky bluegrass grown for seed in central Oregon. Plant Disease, 82, 89-93.
AMÉZQUETA, S., GONZÁLEZ-PEÑAS, E., MURILLO-ARBIZU, M. and LÓPEZ DE CERAIN, A. (2009). Ochratoxin A decontamination: A review. Food Control, 20, 326-333.
AMOUTZIAS, G. D., VAN DE PEER, Y. and MOSSIALOS, D. (2008). Evolution and taxonomic distribution of nonribosomal peptide and polyketide synthases. Future microbiology, 3, 361-370.
ANGIONI, A., CABONI, P., GARAU, A., FARRIS, A., ORRO, D., BUDRONI, M. and CABRAS, P. (2007). In vitro interaction between ochratoxin A and different strains of Saccharomyces cerevisiae and Kloeckera apiculata. Journal of Agricultural and Food Chemistry, 55, 2043-2048.
ARUNACHALAM, C. and DOOHAN, F. M. (2013). Trichothecene toxicity in eukaryotes: Cellular and molecular mechanisms in plants and animals. Toxicology letters, 217, 149-158.
ASHIQ, S. (2015). Natural occurrence of mycotoxins in food and feed: Pakistan perspective. Comprehensive Reviews in Food Science and Food Safety, 14, 159-175.
ASSANTE, G., LOCCI, R., CAMARDA, L., MERLINI, L. and NASINI, G. (1977). Screening of the genus Cercospora for secondary metabolites. Phytochemistry, 16, 243-247.
AYDOGDU, H. and GUCER, Y. (2009). Microfungi and mycotoxins of grapes and grape products. Trakia J Sci, 7, 211-214.
AZIZ, N. and MOUSSA, L. (1997). Influence of white light, near ‐ UV irradiation and other
environmental conditions on production of aflatoxin B1 by Aspergillus flavus and ochratoxin A by Aspergillus ochraceus. Food/Nahrung, 41, 150-154.
AZIZ, N. H., MOUSSA, L. A. and FAR, F. M. (2004). Reduction of fungi and mycotoxins formation in
seeds by gamma‐radiation. Journal of food safety, 24, 109-127.
BACHA, N., ATOUI, A., MATHIEU, F., LIBOZ, T. and LEBRIHI, A. (2009). Aspergillus westerdijkiae polyketide synthase gene “aoks1” is involved in the biosynthesis of ochratoxin A. Fungal Genetics and Biology, 46, 77-84.
BACHA, N., MATHIEU, F., LIBOZ, T. and LEBRIHI, A. (2012). Polyketide synthase gene aolc35-12 controls the differential expression of ochratoxin a gene aoks1 in Aspergillus westerdijkiae. World Mycotoxin Journal, 5, 177-186.
BACON, C. W., LYONS, P. C., PORTER, J. K. and ROBBINS, J. D. (1986). Ergot toxicity from endophyte-infected grasses: a review. Agronomy journal, 78, 106-116.
Références
138
BAKKALI, F., AVERBECK, S., AVERBECK, D. and IDAOMAR, M. (2008). Biological effects of essential oils – A review. Food and Chemical Toxicology, 46, 446-475.
BARBERIS, C., ASTORECA, A., FERNANDEZ-JURI, M. G., DALCERO, A. M. and MAGNOLI, C. (2010). Effect of antioxidant mixtures on growth and ochratoxin A production of Aspergillus section Nigri species under different water activity conditions on peanut meal extract agar. Toxins, 2, 1399-1413.
BARBOSA, T. S., PEREYRA, C. M., SOLEIRO, C. A., DIAS, E. O., OLIVEIRA, A. A., KELLER, K. M., SILVA, P. P., CAVAGLIERI, L. R. and ROSA, C. A. (2013). Mycobiota and mycotoxins present in finished fish feeds from farms in the Rio de Janeiro State, Brazil. International Aquatic Research, 5, 1-9.
BARRETT-BEE, K. and DIXON, G. (1994). Ergosterol biosynthesis inhibition: a target for antifungal agents. Acta Biochimica Polonica, 42, 465-479.
BASÍLICO, M. Z. and BASÍLICO, J. C. (1999). Inhibitory effects of some spice essential oils on Aspergillus ochraceus NRRL 3174 growth and ochratoxin A production. Letters in Applied Microbiology, 29, 238-241.
BATTILANI, P., BARBANO, C., MARIN, S., SANCHIS, V., KOZAKIEWICZ, Z. and MAGAN, N. (2006a). Mapping of Aspergillus section Nigri in Southern Europe and Israel based on geostatistical analysis. International journal of food microbiology, 111, S72-S82.
BATTILANI, P., MAGAN, N. and LOGRIECO, A. (2006b). European research on ochratoxin A in grapes and wine. International journal of food microbiology, 111, Supplement 1, S2-S4.
BATTILANI, P., PIETRI, A., BERTUZZI, T., LANGUASCO, L., GIORNI, P. and KOZAKIEWICZ, Z. (2003). Occurrence of ochratoxin A–producing fungi in grapes grown in Italy. Journal of Food Protection®, 66, 633-636.
BAYDAR, H., SAĞDIÇ, O., ÖZKAN, G. and KARADOĞAN, T. (2004). Antibacterial activity and composition of essential oils from Origanum, Thymbra and Satureja species with commercial importance in Turkey. Food Control, 15, 169-172.
BAYMAN, P. B., J.L.; DOSTER, M.A.; MICHAILIDES, T.J.; MAHONEY, N.E. (2002). Ochratoxin production by Aspergillus ochraceus group and Aspergillus alliaceus. Appl. Environ. Microbiol., 2326-2329.
BAYRAM, Ö. and BRAUS, G. H. (2012). Coordination of secondarymetabolism and development in fungi: the velvet familyof regulatory proteins. FEMS microbiology reviews, 36, 1-24.
BAYRAM, O., KRAPPMANN, S., NI, M., BOK, J. W., HELMSTAEDT, K., VALERIUS, O., BRAUS-STROMEYER, S., KWON, N. J., KELLER, N. P., YU, J. H. and BRAUS, G. H. (2008). VelB/VeA/LaeA complex coordinates light signal with fungal development and secondary metabolism. Science, 320, 1504-6.
BEJAOUI, H., MATHIEU, F., TAILLANDIER, P. and LEBRIHI, A. (2004). Ochratoxin A removal in synthetic and natural grape juices by selected oenological Saccharomyces strains. J Appl Microbiol, 97, 1038-44.
BELLI, N., MARIN, S., ARGILES, E., RAMOS, A. J. and SANCHIS, V. (2007). Effect of chemical treatments on ochratoxigenic fungi and common mycobiota of grapes (Vitis vinifera). Journal of Food Protection®, 70, 157-163.
BENNETT, J. W. and KLICH, M. (2003). Mycotoxins. Clinical Microbiology Reviews, 16, 497-516. BEVILACQUA, A., PETRUZZI, L., CORBO, M. R., BAIANO, A., GAROFALO, C. and SINIGAGLIA, M. (2014).
Ochratoxin A released back into the medium by Saccharomyces cerevisiae as a function of the strain, washing medium and fermentative conditions. Journal of the Science of Food and Agriculture, 94, 3291-3295.
BHATNAGAR, D., EHRLICH, K. and CLEVELAND, T. (2003). Molecular genetic analysis and regulation of aflatoxin biosynthesis. Applied microbiology and biotechnology, 61, 83-93.
BITTNER, A., CRAMER, B., HARRER, H. and HUMPF, H.-U. (2015). Structure elucidation and in vitro cytotoxicity of ochratoxin α amide, a new degradation product of ochratoxin A. Mycotoxin research, 31, 83-90.
Références
139
BIZAJ, E., MAVRI, J., CUS, F. and RASPOR, A. (2009). Removal of ochratoxin A in Saccharomyces cerevisiae liquid cultures. S Afr J Enol Vitic, 30, 151-155.
BLAIR, D. (1989). Uncertainties in Pesticide Risk Estimation and Consumer Concern. Nutrition Today, 24, 13-19.
BLEVE, G., GRIECO, F., COZZI, G., LOGRIECO, A. and VISCONTI, A. (2006). Isolation of epiphytic yeasts with potential for biocontrol of< i> Aspergillus carbonarius</i> and< i> A. niger</i> on grape. International journal of food microbiology, 108, 204-209.
BOERMANS, H. J. and LEUNG, M. C. (2007). Mycotoxins and the pet food industry: toxicological evidence and risk assessment. International journal of food microbiology, 119, 95-102.
BOK, J. W. and KELLER, N. P. (2004). LaeA, a regulator of secondary metabolism in Aspergillus spp. Eukaryotic cell, 3, 527-535.
BOUDRA, H. (2002). La contamination par les moisissures et les mycotoxines des fourrages conservés signification et prévention. Institut National de la Recherche Agronomique (INRA), 60-62.
BOUDRA, H., LE BARS, P. and LE BARS, J. (1995). Thermostability of Ochratoxin A in wheat under two moisture conditions. Applied and environmental microbiology, 61, 1156-1158.
BOUTIGNY, A. L., BARREAU, C., ATANASOVA-PENICHON, V., VERDAL-BONNIN, M. N., PINSON-GADAIS, L. and RICHARD-FORGET, F. (2009). Ferulic acid, an efficient inhibitor of type B trichothecene biosynthesis and Tri gene expression in Fusarium liquid cultures. Mycol Res, 113, 746-53.
BREDENKAMP, M. W., DILLEN, J. L., VAN ROOYEN, P. H. and STEYN, P. S. (1989). Crystal structures and conformational analysis of ochratoxin A and B: Probing the chemical structure causing toxicity. Journal of the Chemical Society, Perkin Transactions 2, 1835-1839.
BROWN, M., SZCZECH, G. M. and PURMALIS, B. (1976). Teratogenic and toxic effects of ochratoxin A in rats. Toxicology and Applied Pharmacology, 37, 331-338.
BRUININK, A., RASONYI, T. and SIDLER, C. (1998). Differences in neurotoxic effects of ochratoxin A,
ochracin and ochratoxin‐αin vitro. Natural toxins, 6, 173-177.
BRUL, S. and KLIS, F. M. (1999). Mechanistic and mathematical inactivation studies of food spoilage fungi. Fungal Genetics and Biology, 27, 199-208.
BRYDEN, W. L. (2007). Mycotoxins in the food chain: human health implications. Asia Pacific journal of clinical nutrition, 16, 95-101.
BUCHELI, P. and TANIWAKI, M. H. (2002). Research on the origin, and on the impact of post-harvest handling and manufacturing on the presence of ochratoxin A in coffee. Food Addit Contam, 19, 655-65.
BUDAVARI, S., O'NEIL, M. J., SMITH, A. and HECKELMAN, P. E. (1989). The Merck Index, Merck & Co. Inc., Rahway, NJ, 1008.
CABAÑES, F. J., ACCENSI, F., BRAGULAT, M. R., ABARCA, M. L., CASTELLÁ, G., MINGUEZ, S. and PONS, A. (2002). What is the source of ochratoxin A in wine? International journal of food microbiology, 79, 213-215.
CADDICK, M. X., BROWNLEE, A. G. and ARST JR, H. N. (1986). Regulation of gene expression by pH of the growth medium in Aspergillus nidulans. Molecular and General Genetics MGG, 203, 346-353.
CAKIR, A., KORDALI, S., KILIC, H. and KAYA, E. (2005). Antifungal properties of essential oil and crude extracts of Hypericum linarioides Bosse. Biochemical Systematics and Ecology, 33, 245-256.
CANO-SANCHO, G., MARIN, S., RAMOS, A. and SANCHIS, V. (2009). Survey of patulin occurrence in apple juice and apple products in Catalonia, Spain, and an estimate of dietary intake. Food Additives and Contaminants: Part B, 2, 59-65.
CAO, B., NAGARAJAN, K. and LOH, K.-C. (2009). Biodegradation of aromatic compounds: current status and opportunities for biomolecular approaches. Applied microbiology and biotechnology, 85, 207-228.
CARIDI, A., GALVANO, F., TAFURI, A. and RITIENI, A. (2006). Ochratoxin A removal during winemaking. Enzyme and Microbial Technology, 40, 122-126.
Références
140
CARSON, C. F., MEE, B. J. and RILEY, T. V. (2002). Mechanism of action of Melaleuca alternifolia (tea tree) oil on Staphylococcus aureus determined by time-kill, lysis, leakage, and salt tolerance assays and electron microscopy. Antimicrobial agents and chemotherapy, 46, 1914-1920.
CAST (2003). Council for Agriculture Science and Technology-Task force report. CASTELLARI, M., VERSARI, A., FABIANI, A., PARPINELLO, G. P. and GALASSI, S. (2001). Removal of
ochratoxin A in red wines by means of adsorption treatments with commercial fining agents. Journal of Agricultural and Food Chemistry, 49, 3917-3921.
CECCHINI, F., MORASSUT, M., MORUNO, E. G. and DI STEFANO, R. (2006). Influence of yeast strain on ochratoxin A content during fermentation of white and red must. Food Microbiology, 23, 411-417.
CHU, F. S. and LI, G. Y. (1994). Simultaneous occurrence of fumonisin B1 and other mycotoxins in moldy corn collected from the People's Republic of China in regions with high incidences of esophageal cancer. Applied and environmental microbiology, 60, 847-852.
CIEGLER, A. (1972). Bioproduction of ochratoxin A and penicillic acid by members of the Aspergillus ochraceus group. Can. J. Microbiol., 631-636.
CIEGLER, A., FENNELL, D., MINTZLAFF, H.-J. and LEISTNER, L. (1972). Ochratoxin synthesis byPenicillium species. Naturwissenschaften, 59, 365-366.
CIEGLER, A. F., D.J.; SANSIG, G.A.; DETROY, R.W.; BENNETT, G.A. (1973). Mycotoxin-producing strains of Penicillium viridactum: Classification into subgroups,. Appl Microbiol, 271-278.
COMMISION, E. (2006). Commission Regulation (EC) No 1881/2006 of 19 December 2006 setting maximum levels for certain contaminants in foodstuff. 2006R1881-EN-01.09. 2014-014.001-1.
COMMISSION, E. E. (2004). Reports on tasks for scientific cooperation (SCOOP) Task 3.2. 11. Assessment of the dietary exposure to arsenic, cadmium, lead and mercury of the population of the EU Member States Directorate General health and Consumer Protection.
CONNER, D. and BEUCHAT, L. (1984). Effects of essential oils from plants on growth of food spoilage yeasts. Journal of food science, 49, 429-434.
CONNER, D., BEUCHAT, L., WORTHINGTON, R. and HITCHCOCK, H. (1984). Effects of essential oils and oleoresins of plants on ethanol production, respiration and sporulation of yeasts. International journal of food microbiology, 1, 63-74.
COZZI, G., PERRONE, G., EPIFANI, F., PASCALE, M. and VISCONTI, A. (Year) Published. Epidemiology of ochratoxin A producing fungi in Apulian vineyards. XII International IUPAC Symposium on Mycotoxins and Phycotoxins, 2007. 21-25.
CRESPO-SEMPERE, A., MARIN, S., SANCHIS, V. and RAMOS, A. J. (2013). VeA and LaeA transcriptional factors regulate ochratoxin A biosynthesis in Aspergillus carbonarius. International journal of food microbiology, 166, 479-86.
CRESPO-SEMPERE, A., SELMA-LAZARO, C., PALUMBO, J. D., GONZALEZ-CANDELAS, L. and MARTINEZ-CULEBRAS, P. V. (2016). Effect of oxidant stressors and phenolic antioxidants on the ochratoxigenic fungus Aspergillus carbonarius. J Sci Food Agric, 96, 169-77.
CRISTANI, M., D'ARRIGO, M., MANDALARI, G., CASTELLI, F., SARPIETRO, M. G., MICIELI, D., VENUTI, V., BISIGNANO, G., SAIJA, A. and TROMBETTA, D. (2007). Interaction of four monoterpenes contained in essential oils with model membranes: implications for their antibacterial activity. Journal of Agricultural and Food Chemistry, 55, 6300-6308.
DA CRUZ CABRAL, L., FERNANDEZ PINTO, V. and PATRIARCA, A. (2013). Application of plant derived compounds to control fungal spoilage and mycotoxin production in foods. International journal of food microbiology, 166, 1-14.
DAKOVIĆ, A., TOMAŠEVIĆ-ČANOVIĆ, M., DONDUR, V., ROTTINGHAUS, G. E., MEDAKOVIĆ, V. and ZARIĆ, S. (2005). Adsorption of mycotoxins by organozeolites. Colloids and Surfaces B: biointerfaces, 46, 20-25.
Références
141
DAKOVIĆ, A., TOMAŠEVIĆ-ČANOVIĆ, M., ROTTINGHAUS, G., DONDUR, V. and MAŠIĆ, Z. (2003). Adsorption of ochratoxin A on octadecyldimethyl benzyl ammonium exchanged-clinoptilolite-heulandite tuff. Colloids and Surfaces B: biointerfaces, 30, 157-165.
DE BELLIS, P., TRISTEZZA, M., HAIDUKOWSKI, M., FANELLI, F., SISTO, A., MULÈ, G. and GRIECO, F. (2015). Biodegradation of ochratoxin A by bacterial strains isolated from vineyard soils. Toxins, 7, 5079-5093.
DE COSTA, P. and BEZERRA, P. (2009). Fungicides: Chemistry, Environmental Impact, and Health Effects, Nova Biomedical Books.
DEBERGHES, P., BETBEDER, A., BOISARD, F., BLANC, R., DELABY, J., KRIVOBOK, S., STEIMAN, R., SEIGLE-MURANDI, F. and CREPPY, E. (1995). Detoxification of ochratoxin A, a food contaminant: prevention of growth of Aspergillus ochraceus and its production of ochratoxin A. Mycotoxin research, 11, 37-47.
DEBERGHES, P., DEFFIEUX, G., GHARBI, A., BETBEDER, A., BOISARD, F., BLANC, R., DELABY, J. and CREPPY, E. (1993). Detoxification de l’ochratoxine A par des moyens physiques, chimiques et enzymatiques. Hum. Ochratoxicosis Pathol, 231, 75-82.
DENYER, S. and HUGO, W. (1991). Biocide-induced damage to the bacterial cyctoplasmic membrane. Society for Applied Bacteriology. Technical Series, 27, 171-187.
DEVEGOWDA, G., RAJU, M., AFZALI, N. and SWAMY, H. (1998). Mycotoxin picture worldwide: novel solutions for their counteraction. Feed Compounder (United Kingdom).
DORN, G. (1965). Genetic analysis of the phosphatases in Aspergillus nidulans. Genetical research, 6, 13-26.
DOSTER, R. and SINNHUBER, R. (1972). Comparative rates of hydrolysis of ochratoxins A and B in vitro. Food and cosmetics toxicology, 10, 389-394.
DRUSCH, S. and RAGAB, W. (2003). Mycotoxins in fruits, fruit juices, and dried fruits. Journal of Food Protection®, 66, 1514-1527.
EDRINGTON, T., KAMPS-HOLTZAPPLE, C., HARVEY, R., KUBENA, L., ELISSALDE, M. and ROTTINGHAUS, G. (1995). Acute hepatic and renal toxicity in lambs dosed with fumonisin-containing culture material. Journal of animal science, 73, 508-515.
EL KHOURY, A. and ATOUI, A. (2010). Ochratoxin a: general overview and actual molecular status. Toxins, 2, 461-93.
ELAROUSSI, M., MOHAMED, F., EL BARKOUKY, E., ATTA, A., ABDOU, A. and HATAB, M. (2006). Experimental ochratoxicosis in broiler chickens. Avian Pathology, 35, 263-269.
ESPEJO, F. J. and ARMADA, S. (2009). Effect of activated carbon on ochratoxin A reduction in “Pedro Ximenez” sweet wine made from off-vine dried grapes. European Food Research and Technology, 229, 255-262.
ESPESO, E. A., TILBURN, J., SÁNCHEZ-PULIDO, L., BROWN, C. V., VALENCIA, A., ARST, H. N. and PEÑALVA, M. A. (1997). Specific DNA recognition by the Aspergillus nidulans three zinc finger transcription factor PacC. Journal of molecular biology, 274, 466-480.
FANELLI, F., SCHMIDT-HEYDT, M., HAIDUKOWSKI, M., GEISEN, R., LOGRIECO, A. and MULÉ, G. (2012). Influence of light on growth, conidiation and the mutual regulation of fumonisin B2 and ochratoxin A biosynthesis by Aspergillus niger. World Mycotoxin Journal, 5, 169-176.
FAO-WHO (2013). PROPOSED DRAFT ANNEX FOR THE PREVENTION AND REDUCTION OF AFLATOXINS AND OCHRATOXIN A CONTAMINATION IN SORGHUM (CODE OF PRACTICE FOR THE PREVENTION AND REDUCTION OF MYCOTOXIN CONTAMINATION IN CEREALS (CAC/RCP 51-2003)). Codex Alimentarius Commission.
FAO (2009). CODE OF PRACTICE FOR THE PREVENTION AND REDUCTION OF OCHRATOXIN A CONTAMINATION IN COFFEE. CAC/RCP 69-2009.
FÄRBER, P. and GEISEN, R. (2004). Analysis of differentially-expressed ochratoxin A biosynthesis genes of Penicillium nordicum. European journal of plant pathology, 110, 661-669.
Références
142
FEIER, D. and TOFANA, M. (Year) Published. Ochratoxin A–Toxicological Aspects. Bulletin of University of Agricultural Sciences and Veterinary Medicine Cluj-Napoca. Agriculture, 2009. University of Agricultural Sciences and Veterinary Medicine, 308-312.
FERRACIN, L. M., FIER, C. B., VIEIRA, M. L., MONTEIRO-VITORELLO, C. B., VARANI ADE, M., ROSSI, M. M., MULLER-SANTOS, M., TANIWAKI, M. H., THIE IAMANAKA, B. and FUNGARO, M. H. (2012). Strain-specific polyketide synthase genes of Aspergillus niger. International journal of food microbiology, 155, 137-45.
FERRARA, M., GALLO, A., SCALZO, R. L., HAIDUKOWSKI, M., PICCHI, V. and PERRONE, G. (2015). Inhibition of ochratoxin A production in Aspergillus carbonarius by hydroxycinnamic acids from grapes. World Mycotoxin Journal, 8, 283-289.
FERRARA, M., PERRONE, G., GAMBACORTA, L., EPIFANI, F., SOLFRIZZO, M. and GALLO, A. (2016). Identification of a Halogenase Involved in the Biosynthesis of Ochratoxin A in Aspergillus carbonarius. Appl Environ Microbiol, 82, 5631-41.
FERREIRA, F., #XE1, DIAS, V., MOSSINI, S. A. G., FERREIRA, F. M. D., ARROT, #XE9, IA, C. C., DA COSTA, C. L., NAKAMURA, C. V. and MACHINSKI JUNIOR, M. (2013). The Inhibitory Effects of Curcuma longa L. Essential Oil and Curcumin on Aspergillus flavus Link Growth and Morphology. The Scientific World Journal, 2013, 6.
FIRSVAD, J. and THRANE, U. (1996). Mycotoxin production by food–borne fungi. Introduction to FoodBorne Fungi. Centraalbureau voor Schimmelcultures Baarn, The Netherlands, 251-260.
FRISVAD, J. C. and FILTENBORG, O. (1983). Classification of terverticillate penicillia based on profiles of mycotoxins and other secondary metabolites. Applied and environmental microbiology, 46, 1301-1310.
FRISVAD, J. C. and SAMSON, R. A. (2004). Penicillium subgenus Penicillium-A guide to identification of food and air-borne terverticillate Penicillia and their mycotoxins. Studies in Mycology.
FRISVAD, J. C. F., J.M.; HOUBRAKEN, J.A.M.P.; KUIJPERS, A.F.A.; SAMSON, R.A. (2004). New ochratoxin A producing species of Aspergillus section Circumdati. Stud.. Mycol, 23-43.
FRISVAD, J. C. T., U.; SAMSON, R.A.; PITT, J.I. (2006). Important mycotxins and the fungi which produce them. Adv. Food mycol, 3-31.
FUCHS, S., SONTAG, G., STIDL, R., EHRLICH, V., KUNDI, M. and KNASMÜLLER, S. (2008). Detoxification of patulin and ochratoxin A, two abundant mycotoxins, by lactic acid bacteria. Food and Chemical Toxicology, 46, 1398-1407.
GAFFOOR, I. and TRAIL, F. (2006). Characterization of two polyketide synthase genes involved in zearalenone biosynthesis in Gibberella zeae. Applied and environmental microbiology, 72, 1793-1799.
GALLO, A., BRUNO, K. S., SOLFRIZZO, M., PERRONE, G., MULE, G., VISCONTI, A. and BAKER, S. E. (2012). New insight into the ochratoxin A biosynthetic pathway through deletion of a nonribosomal peptide synthetase gene in Aspergillus carbonarius. Appl Environ Microbiol, 78, 8208-18.
GALLO, A., FERRARA, M. and PERRONE, G. (2013). Phylogenetic study of polyketide synthases and nonribosomal peptide synthetases involved in the biosynthesis of mycotoxins. Toxins, 5, 717-42.
GALLO, A., KNOX, B. P., BRUNO, K. S., SOLFRIZZO, M., BAKER, S. E. and PERRONE, G. (2014). Identification and characterization of the polyketide synthase involved in ochratoxin A biosynthesis in Aspergillus carbonarius. International journal of food microbiology, 179, 10-7.
GAMBUTI, A., STROLLO, D., GENOVESE, A., UGLIANO, M., RITIENI, A. and MOIO, L. (2005). Influence of enological practices on ochratoxin A concentration in wine. American Journal of Enology and Viticulture, 56, 155-162.
GARDINER, D. M. and HOWLETT, B. J. (2005). Bioinformatic and expression analysis of the putative gliotoxin biosynthetic gene cluster of Aspergillus fumigatus. FEMS Microbiology Letters, 248, 241-248.
GEISEN, R., MAYER, Z., KAROLEWIEZ, A. and FARBER, P. (2004). Development of a Real Time PCR system for detection of Penicillium nordicum and for monitoring ochratoxin A production in

Références
143
foods by targeting the ochratoxin polyketide synthase gene. Systematic and applied microbiology, 27, 501-7.
GEISEN, R., SCHMIDT-HEYDT, M. and KAROLEWIEZ, A. (2006). A gene cluster of the ochratoxin A biosynthetic genes inPenicillium. Mycotoxin research, 22, 134-141.
GIL-SERNA, J., GONZÁLEZ-SALGADO, A., GONZÁLEZ-JAÉN, M. T., VÁZQUEZ, C. and PATIÑO, B. (2009). ITS-based detection and quantification of Aspergillus ochraceus and Aspergillus westerdijkiae in grapes and green coffee beans by real-time quantitative PCR. International journal of food microbiology, 131, 162-167.
GIL-SERNA, J., VÁZQUEZ, C., GONZÁLEZ-JAÉN, M. T. and PATIÑO, B. (2015). Clustered array of ochratoxin A biosynthetic genes in Aspergillus steynii and their expression patterns in permissive conditions. International journal of food microbiology, 214, 102-108.
GILANI, S. H., BANCROFT, J. and REILY, M. (1978). Teratogenicity of ochratoxin A in chick embryos. Toxicology and Applied Pharmacology, 46, 543-546.
GOCMEN, A., PETERS, H., CRIPPS, D., MORRIS, C. and DOGRAMACI, I. (1985). Porphyria turcica: hexachlorobenzene-induced porphyria. IARC scientific publications, 567-573.
GOLIŃSKI, P., HULT, K., GRABARKIEWICZ-SZCZESNA, J., CHEŁKOWSKI, J., KNEBLEWSKI, P. and SZEBIOTKO, K. (1984). Mycotoxic porcine nephropathy and spontaneous occurrence of ochratoxin A residues in kidneys and blood of Polish swine. Applied and environmental microbiology, 47, 1210-1212.
HAIGHTON, L. A., LYNCH, B. S., MAGNUSON, B. A. and NESTMANN, E. R. (2012). A reassessment of risk associated with dietary intake of ochratoxin A based on a lifetime exposure model. Critical reviews in toxicology, 42, 147-168.
HALÁSZ, A., LÁSZTITY, R., ABONYI, T. and BATA, Á. (2009). Decontamination of mycotoxin-containing food and feed by biodegradation. Food Reviews International, 25, 284-298.
HARRIS, J. P. and MANTLE, P. G. (2001). Biosynthesis of ochratoxins by Aspergillus ochraceus. Phytochemistry, 58, 709-716.
HASHEM, A., ABD-ALLAH, E. F., AL-OBEED, R. S., ALQARAWI, A. A. and ALWATHNANI, H. A. (2015). Effect of carbon, nitrogen sources and water activity on growth and ochratoxin production of Aspergillus carbonarius (bainier) thom. Jundishapur journal of microbiology, 8.
HASKARD, C., BINNION, C. and AHOKAS, J. (2000). Factors affecting the sequestration of aflatoxin by Lactobacillusrhamnosus strain GG. Chemico-biological interactions, 128, 39-49.
HASKARD, C. A., EL-NEZAMI, H. S., KANKAANPÄÄ, P. E., SALMINEN, S. and AHOKAS, J. T. (2001). Surface binding of aflatoxin B1 by lactic acid bacteria. Applied and environmental microbiology, 67, 3086-3091.
HAYES, A. W., MELTON, R. and SMITH, S. J. (1974). Effect of aflatoxin B1, ochratoxin and rubratoxin B on a protozoan, Tetrahymena pyriformis HSM. Bulletin of environmental contamination and toxicology, 11, 321-325.
HENDRICKSE, R., COULTER, J., LAMPLUGH, S., MACFARLANE, S., WILLIAMS, T., OMER, M. and SULIMAN, G. (1982). Aflatoxins and kwashiorkor: a study in Sudanese children. Br Med J (Clin Res Ed), 285, 843-846.
HESSELTINE, C. W. V., E.E.; FENNELL, D.I., SMIT, /M./L.; SHOTWELL, O.L. (1972). Aspergilli as ochratoxin producers. Mycologia, 539-550.
HEUSSNER, A. H. and BINGLE, L. E. (2015). Comparative ochratoxin toxicity: a review of the available data. Toxins, 7, 4253-4282.
HONG, S. Y., ROZE, L. V., WEE, J. and LINZ, J. E. (2013). Evidence that a transcription factor regulatory network coordinates oxidative stress response and secondary metabolism in aspergilli. Microbiologyopen, 2, 144-160.
HORIE, Y. (1995). Productivity of ochratoxin A of Aspergillus carbonarius in Aspergillus section nigri. Nippon Kingakki Kaiho, 73-76.
Références
144
HUA, H., XING, F., SELVARAJ, J. N., WANG, Y., ZHAO, Y., ZHOU, L., LIU, X. and LIU, Y. (2014). Inhibitory effect of essential oils on Aspergillus ochraceus growth and ochratoxin A production. PloS one, 9, e108285.
HUFF, W., KUBENA, L., HARVEY, R. and PHILLIPS, T. (1992). Efficacy of hydrated sodium calcium aluminosilicate to reduce the individual and combined toxicity of aflatoxin and ochratoxin A. Poultry Science, 71, 64-69.
HUFF, W. E. and HAMILTON, P. B. (1979). Mycotoxins-their biosynthesis in fungi: Ochratoxins-metabolites of combined pathways. Journal of Food Protection®, 42, 815-820.
HUFF, W. E., WYATT, R., TUCKER, T. and HAMILTON, P. (1974). Ochratoxicosis in the broiler chicken. Poultry Science, 53, 1585-1591.
HUFFMAN, J., GERBER, R. and DU, L. (2010). Recent advancements in the biosynthetic mechanisms for
polyketide‐derived mycotoxins. Biopolymers, 93, 764-776.
HUSSEIN, H. S. and BRASEL, J. M. (2001). Toxicity, metabolism, and impact of mycotoxins on humans and animals. Toxicology, 167, 101-134.
HWANGA, C.-A. and DRAUGHON, F. A. (1994). Degradation of ochratoxin A by Acinetobacter calcoaceticus. Journal of Food Protection®, 57, 410-414.
IARC (1993). Some naturally occuring substances: Food items and constituents, heterocyclic aromatic amines and mycotoxins. IARC Monographs on the Evaluation of Carcinogenic Risks to Humans; World Health Organization: Lyon, Fance, 56, 489-521.
IBRAHIM, N. A., MOHAMMED, M., FARID, M. A. and ABDEL-WAHED, N. A. (2015). Chemical composition, antimicrobial and antifungal activities of essential oils of the leaves of Aegle marmelos (L.) Correa growing in Egypt.
ISLAM, R., ZHOU, T., YOUNG, J. C., GOODWIN, P. H. and PAULS, K. P. (2012). Aerobic and anaerobic de-epoxydation of mycotoxin deoxynivalenol by bacteria originating from agricultural soil. World Journal of Microbiology and Biotechnology, 28, 7-13.
ISMAIEL, A. A. and PAPENBROCK, J. (2014). The effects of patulin from Penicillium vulpinum on seedling growth, root tip ultrastructure and glutathione content of maize. European journal of plant pathology, 139, 497-509.
JOINT, F. (2001). Safety evaluation of certain mycotoxins in food. Fifty-sixth meeting of the Joint FAO/WHO Expert Committee on Food Additives (JECFA). WHO food additives series, 47.
JOINT FAO/WHO CODEX ALIMENTARIUS, J. F. W. F. S. P., WORLD HEALTH ORGANIZATION (2003). Codex Alimentarius: Food hygiene, basic texts, Food & Agriculture Org.
JORDAN, J. K. (2009). Ready-to-eat dry fruit products and process. Google Patents. JORGENSEN, K. (1998). Survey of pork, poultry, coffee, beer and pulses for ochratoxin A. Food additives
& contaminants, 15, 550-554. JOUANY, J., YIANNIKOURIS, A. and BERTIN, G. (2009). Risk assessment of mycotoxins in ruminants and
ruminant products. Options Mediterranéennes, A, 85, 205-224. KABAK, B. and DOBSON, A. D. (2009). Biological strategies to counteract the effects of mycotoxins.
Journal of Food Protection®, 72, 2006-2016. KABAK, B., DOBSON, A. D. and VAR, I. L. (2006). Strategies to prevent mycotoxin contamination of food
and animal feed: a review. Critical Reviews in Food Science and Nutrition, 46, 593-619. KALEMBA, D. and KUNICKA, A. (2003). Antibacterial and Antifungal Properties of Essential Oils. Current
Medicinal Chemistry, 10, 813-829. KANAPITSAS, A., BATRINOU, A., ARAVANTINOS, A., SFLOMOS, C. and MARKAKI, P. (2016). Gamma
radiation inhibits the production of Ochratoxin A by Aspergillus carbonarius. Development of a method for OTA determination in raisins. Food Bioscience, 15, 42-48.
KAPETANAKOU, A. E., PANAGOU, E. Z., GIALITAKI, M., DROSINOS, E. H. and SKANDAMIS, P. N. (2009). Evaluating the combined effect of water activity, pH and temperature on ochratoxin A production by Aspergillus ochraceus and Aspergillus carbonarius οn culture medium and Corinth raisins. Food Control, 20, 725-732.
Références
145
KAROLEWIEZ, A. and GEISEN, R. (2005). Cloning a part of the ochratoxin A biosynthetic gene cluster of Penicillium nordicum and characterization of the ochratoxin polyketide synthase gene. Systematic and applied microbiology, 28, 588-95.
KELLER, N. P., NESBITT, C., SARR, B., PHILLIPS, T. D. and BUROW, G. B. (1997). pH regulation of sterigmatocystin and aflatoxin biosynthesis in Aspergillus spp. Phytopathology, 87, 643-648.
KELLER, N. P., TURNER, G. and BENNETT, J. W. (2005). Fungal secondary metabolism—from biochemistry to genomics. Nature Reviews Microbiology, 3, 937-947.
KIM, D., YUKL, E. T., MOËNNE-LOCCOZ, P. and ORTIZ DE MONTELLANO, P. R. (2006). Fungal heme oxygenases: functional expression and characterization of Hmx1 from Saccharomyces cerevisiae and CaHmx1 from Candida albicans. Biochemistry, 45, 14772-14780.
KIM, J. H., YU, J., MAHONEY, N., CHAN, K. L., MOLYNEUX, R. J., VARGA, J., BHATNAGAR, D., CLEVELAND, T. E., NIERMAN, W. C. and CAMPBELL, B. C. (2008). Elucidation of the functional genomics of antioxidant-based inhibition of aflatoxin biosynthesis. International journal of food microbiology, 122, 49-60.
KOCIĆ-TANACKOV, S., DIMIĆ, G., TANACKOV, I., PEJIN, D., MOJOVIĆ, L. and PEJIN, J. (2012). The inhibitory effect of oregano extract on the growth of Aspergillus spp. and on sterigmatocystin biosynthesis. LWT - Food Science and Technology, 49, 14-20.
KOVALSKY, P. (2014). Climate change and mycotoxin prevalence. KROGH, P., HALD, B., GJERTSEN, P. and MYKEN, F. (1974). Fate of ochratoxin A and citrinin during
malting and brewing experiments. Applied microbiology, 28, 31-34. KROHN, K., BAHRAMSARI, R., FLÖRKE, U., LUDEWIG, K., KLICHE-SPORY, C., MICHEL, A., AUST, H.-J.,
DRAEGER, S., SCHULZ, B. and ANTUS, S. (1997). Dihydroisocoumarins from fungi: Isolation, structure elucidation, circular dichroism and biological activity. Phytochemistry, 45, 313-320.
KUIPER-GOODMAN, T. and SCOTT, P. M. (1989). Risk assessment of the mycotoxin ochratoxin A. Biomed Environ Sci, 2, 179-248.
KUMAGAI, S. (1985). Ochratoxin A: Plasma concentration and excretion into bile and urine in albumin-deficient rats. Food and Chemical Toxicology, 23, 941-943.
LARSEN, A. I., LAKSEN, A., JEPSEN, J. R. and JØRGENSEN, R. (1990). Contact allergy to the fungicide benomyl? Contact dermatitis, 22, 278-281.
LARSEN, T. O. S., A.; SMEDSGAARD, J. (2001). Biochemical characterization of ochratoxin A-producing stains of the genus Penicillium. Appl. Environ. Microbiol., 3630-3635.
LEA, T., STEIEN, K. and STØRMER, F. C. (1989). Mechanism of ochratoxin A-induced immunosuppression. Mycopathologia, 107, 153-159.
LEGAN, J. (2000). Cereals and cereal products. The Microbiological Safety and Quality of Food, 1, 759-783.
LEONG, S.-L. L., HOCKING, A., PITT, J., KAZI, B., EMMETT, R. and SCOTT, E. S. (2006). Australian research on ochratoxigenic fungi and ochratoxin A. International journal of food microbiology, 111, S10-S17.
LEONG, Y.-H., ISMAIL, N., LATIF, A. A. and AHMAD, R. (2010). Aflatoxin occurrence in nuts and commercial nutty products in Malaysia. Food Control, 21, 334-338.
LI, S., MARQUARDT, R. R., FROHLICH, A. A., VITTI, T. G. and CROW, G. (1997). Pharmacokinetics of Ochratoxin A and Its Metabolites in Rats. Toxicology and Applied Pharmacology, 145, 82-90.
LLEWELLYN, G., O'DONNELL, W. and DASHEK, W. (1984). Aflatoxin influences on seed germination and root elongation by two cultivars of Glycine max and uptake of 65 Zn-ZnCl2 by the cultivars. Mycopathologia, 86, 129-136.
LUCINI, E., ZUNINO, M., LOPEZ, M. and ZYGADLO, J. (2006). Effect of Monoterpenes on Lipid Composition and Sclerotial Development of Sclerotium cepivorum Berk. Journal of Phytopathology, 154, 441-446.
LUND, F. and FRISVAD, J. C. (2003). Penicillium verrucosum in wheat and barley indicates presence of ochratoxin A. Journal of applied microbiology, 95, 1117-1123.
Références
146
LUNN, R. M., LANGLOIS, R. G., HSIEH, L. L., THOMPSON, C. L. and BELL, D. A. (1999). XRCC1 polymorphisms: effects on aflatoxin B1-DNA adducts and glycophorin A variant frequency. Cancer research, 59, 2557-2561.
MA, Y. and WINK, M. (2008). Lobeline, a piperidine alkaloid from Lobelia can reverse P-gp dependent multidrug resistance in tumor cells. Phytomedicine, 15, 754-758.
MAAROUFI, K., PFOHL-LESZKOWICZ, A., ACHOUR, A., EL MAY, M., GROSSE, Y., HAMMAMI, M., ELLOUZ, F., CREPPY, E. and BACHA, H. (1993). [Ochratoxin A genotoxicity, relation to renal tumors]. Archives de l'Institut Pasteur de Tunis, 71, 21-31.
MAGAN, N. and ALDRED, D. (2005). Conditions of formation of ochratoxin A in drying, transport and in different commodities. Food additives and contaminants, 22, 10-16.
MAGAN, N., SANCHIS, V. and ALDRED, D. (2004). Role of spoilage fungi in seed deterioration. Fungal biotechnology in agricultural, food and environmental applications, 311-323.
MAHFOUD, R., MARESCA, M., GARMY, N. and FANTINI, J. (2002). The mycotoxin patulin alters the barrier function of the intestinal epithelium: mechanism of action of the toxin and protective effects of glutathione. Toxicology and Applied Pharmacology, 181, 209-218.
MAHONEY, N. and MOLYNEUX, R. J. (2004). Phytochemical inhibition of aflatoxigenicity in Aspergillus flavus by constituents of walnut (Juglans regia). Journal of Agricultural and Food Chemistry, 52, 1882-1889.
MAJERUS, P. and KAPP, K. (2002). Reports on tasks for scientific cooperation. Report of experts participating in Task, 3.
MALLY, A. (2012). Ochratoxin A and mitotic disruption: mode of action analysis of renal tumor formation by ochratoxin A. Toxicological Sciences, 127, 315-330.
MALLY, A. and DEKANT, W. (2009). Mycotoxins and the kidney: modes of action for renal tumor formation by ochratoxin A in rodents. Molecular Nutrition & Food Research, 53, 467-478.
MALLY, A., KEIM-HEUSLER, H., AMBERG, A., KURZ, M., ZEPNIK, H., MANTLE, P., VÖLKEL, W., HARD, G. C. and DEKANT, W. (2005). Biotransformation and nephrotoxicity of ochratoxin B in rats. Toxicology and Applied Pharmacology, 206, 43-53.
MARAGOS, C. (2010). Zearalenone occurrence and human exposure. World Mycotoxin Journal, 3, 369-383.
MARIN, S., RAMOS, A., CANO-SANCHO, G. and SANCHIS, V. (2013). Mycotoxins: occurrence, toxicology, and exposure assessment. Food and Chemical Toxicology, 60, 218-237.
MARTÍN, J. F., CASQUEIRO, J., KOSALKOVÁ, K. and MARCOS, A. T. (1999). Penicillin and cephalosporin biosynthesis: mechanism of carbon catabolite regulation of penicillin production. Antonie van Leeuwenhoek, 75, 21-31.
MARUYA, K., REDDY, V., HAYES, A. W. and BERNDT, W. O. (1982). Embryocidal, fetotoxic and teratogenic effects of ochratoxin A in rats. Toxicology, 25, 175-185.
MCLEAN, M. (1996). The phytotoxicity ofFusarium metabolites: An update since 1989. Mycopathologia, 133, 163-179.
MCLEAN, M., BERJAK, P., WATT, M. and DUTTON, M. (1992). The effects of aflatoxin B1 on immature germinating maize (Zea mays) embryos. Mycopathologia, 119, 181-190.
MECA, G., BLAIOTTA, G. and RITIENI, A. (2010). Reduction of ochratoxin A during the fermentation of Italian red wine Moscato. Food Control, 21, 579-583.
MEDEIROS, F. H. V. D., MARTINS, S. J., ZUCCHI, T. D., MELO, I. S. D., BATISTA, L. R. and MACHADO, J. D. C. (2012). Biological control of mycotoxin-producing molds. Ciência e Agrotecnologia, 36, 483-497.
MEDINA, Á., MATEO, R., VALLE-ALGARRA, F. M., MATEO, E. M. and JIMÉNEZ, M. (2007). Effect of carbendazim and physicochemical factors on the growth and ochratoxin A production of< i> Aspergillus carbonarius</i> isolated from grapes. International journal of food microbiology, 119, 230-235.
MESCHINI, S., MARRA, M., CALCABRINI, A., FEDERICI, E., GALEFFI, C. and ARANCIA, G. (2003). Voacamine, a bisindolic alkaloid from Peschiera fuchsiaefolia, enhances the cytotoxic effect of
Références
147
doxorubicin on multidrug-resistant tumor cells. International Journal of Oncology, 23, 1505-1513.
MÜLLER, H. M. and AMEND, R. (1997). Formation and disappearance of mycophenolic acid, patulin, penicillic acid and PR toxin in maize silage inoculated with Penicillium roqueforti. Archives of Animal Nutrition, 50, 213-225.
MURTHY, P. S., BORSE, B. B., KHANUM, H. and SRINIVAS, P. (2009). Inhibitory effects of Ajowan (Trachyspermum ammi) ethanolic extract on A. ochraceus growth and ochratoxin production. Turkish Journal of Biology, 33, 211-217.
NAIDU, A., BIDLACK, W. and CLEMENS, R. (1999). Probiotic spectra of lactic acid bacteria (LAB). Critical Reviews in Food Science and Nutrition, 39, 13-126.
NAPOLITANO, A., FOGLIANO, V., TAFURI, A. and RITIENI, A. (2007). Natural occurrence of ochratoxin A and antioxidant activities of green and roasted coffees and corresponding byproducts. Journal of Agricultural and Food Chemistry, 55, 10499-10504.
NELSON, P. E., DIGNANI, M. C. and ANAISSIE, E. J. (1994). Taxonomy, biology, and clinical aspects of Fusarium species. Clinical Microbiology Reviews, 7, 479-504.
NIDERKORN, V., MORGAVI, D., ABOAB, B., LEMAIRE, M. and BOUDRA, H. (2009). Cell wall component and mycotoxin moieties involved in the binding of fumonisin B1 and B2 by lactic acid bacteria. Journal of applied microbiology, 106, 977-985.
NIELSEN, K. F., MOGENSEN, J. M., JOHANSEN, M., LARSEN, T. O. and FRISVAD, J. C. (2009). Review of secondary metabolites and mycotoxins from the Aspergillus niger group. Analytical and Bioanalytical Chemistry, 395, 1225-1242.
NORRED, R. T. R. A. W. P. (1999). Mycotoxin prevention and decontamination – a case study on maize. Atti Third Joint FAO/WHO/UNEP international conference on mycotoxins.
O'BRIEN, E. and DIETRICH, D. R. (2005). Ochratoxin A: the continuing enigma. CRC Critical Reviews in Toxicology, 35, 33-60.
O'CALLAGHAN, J. (2003). A polyketide synthase gene required for ochratoxin A biosynthesis in Aspergillus ochraceus. Microbiology, 149, 3485-3491.
O'CALLAGHAN, J., STAPLETON, P. C. and DOBSON, A. D. (2006). Ochratoxin A biosynthetic genes in Aspergillus ochraceus are differentially regulated by pH and nutritional stimuli. Fungal genetics and biology : FG & B, 43, 213-21.
OLIVARES-MARÍN, M., DEL PRETE, V., GARCIA-MORUNO, E., FERNÁNDEZ-GONZÁLEZ, C., MACÍAS-GARCÍA, A. and GÓMEZ-SERRANO, V. (2009). The development of an activated carbon from cherry stones and its use in the removal of ochratoxin A from red wine. Food Control, 20, 298-303.
OLSEN, M., JONSSON, N., MAGAN, N., BANKS, J., FANELLI, C., RIZZO, A., HAIKAR, A., DOBSON, A., FRISVAD, J. and HOLMES, S. (2003). Prevention of Ochratoxin A in Cereals. OTA PREV. Final Report. Quality of Life and Management of Living Resources. Project No. QLK1-CT-1999-00433.
OMIDBEYGI, M., BARZEGAR, M., HAMIDI, Z. and NAGHDIBADI, H. (2007). Antifungal activity of thyme, summer savory and clove essential oils against Aspergillus flavus in liquid medium and tomato paste. Food Control, 18, 1518-1523.
ONIONS, A., ALLSOPP, D. and EGGINS, H. (1981). Smith’s Introduction to Industrial Mycology Edward Arnold. London, l98l.
OVERY, D. P., SEIFERT, K. A., SAVARD, M. E. and FRISVAD, J. C. (2003). Spoilage fungi and their mycotoxins in commercially marketed chestnuts. International journal of food microbiology, 88, 69-77.
ÖZPINAR, H., AUGONYTE, G. and DROCHNER, W. (1999). Inactivation of ochratoxin in ruminal fluid with variation of pH-value and fermentation parameters in an in vitro system. environmental toxicology and pharmacology, 7, 1-9.
Références
148
PALUMBO, J. D., O’KEEFFE, T. L. and MAHONEY, N. E. (2007). Inhibition of ochratoxin A production and growth of Aspergillus species by phenolic antioxidant compounds. Mycopathologia, 164, 241-248.
PARK, J. W., CHUNG, S.-H. and KIM, Y.-B. (2005). Ochratoxin A in Korean food commodities: occurrence and safety evaluation. Journal of Agricultural and Food Chemistry, 53, 4637-4642.
PASSAMANI, F. R. F., HERNANDES, T., LOPES, N. A., BASTOS, S. C., SANTIAGO, W. D., CARDOSO, M. D. G. and BATISTA, L. R. (2014). Effect of temperature, water activity, and pH on growth and production of ochratoxin A by Aspergillus niger and Aspergillus carbonarius from brazilian grapes. Journal of Food Protection®, 77, 1947-1952.
PASSONE, M. A., GIRARDI, N. S. and ETCHEVERRY, M. (2012). Evaluation of the control ability of five essential oils against Aspergillus section Nigri growth and ochratoxin A accumulation in peanut meal extract agar conditioned at different water activities levels. International journal of food microbiology, 159, 198-206.
PENALVA, M. A., TILBURN, J., BIGNELL, E. and ARST, H. N., JR. (2008). Ambient pH gene regulation in fungi: making connections. Trends Microbiol, 16, 291-300.
PETCHKONGKAEW, A., TAILLANDIER, P., GASALUCK, P. and LEBRIHI, A. (2008). Isolation of Bacillus spp.
from Thai fermented soybean (Thua‐nao): screening for aflatoxin B1 and ochratoxin A
detoxification. Journal of applied microbiology, 104, 1495-1502. PETRUZZI, L., BEVILACQUA, A., BAIANO, A., BENEDUCE, L., CORBO, M. and SINIGAGLIA, M. (2014a). In
vitro removal of ochratoxin A by two strains of Saccharomyces cerevisiae and their performances under fermentative and stressing conditions. Journal of applied microbiology, 116, 60-70.
PETRUZZI, L., CORBO, M. R., BAIANO, A., BENEDUCE, L., SINIGAGLIA, M. and BEVILACQUA, A. (2015). In vivo stability of the complex ochratoxin A–Saccharomyces cerevisiae starter strains. Food Control, 50, 516-520.
PETRUZZI, L., SINIGAGLIA, M., CORBO, M. R., CAMPANIELLO, D., SPERANZA, B. and BEVILACQUA, A. (2014b). Decontamination of ochratoxin A by yeasts: Possible approaches and factors leading to toxin removal in wine. Applied microbiology and biotechnology, 98, 6555-6567.
PETTERSSON, H. (1995). Trichothecene occurrence in European cereals-a review. Landbauforschung Voelkenrode. Sonderheft (Germany).
PETZINGER, E. and WEIDENBACH, A. (2002). Mycotoxins in the food chain: the role of ochratoxins. Livestock Production Science, 76, 245-250.
PFOHL-LESZKOWICZ, A. and MANDERVILLE, R. A. (2011). An update on direct genotoxicity as a molecular mechanism of ochratoxin a carcinogenicity. Chemical research in toxicology, 25, 252-262.
PFOHL‐LESZKOWICZ, A. and MANDERVILLE, R. A. (2007). Ochratoxin A: An overview on toxicity and
carcinogenicity in animals and humans. Molecular Nutrition & Food Research, 51, 61-99.
PFOHL‐LESZKOWICZ, A., PINELLI, E., BARTSCH, H., MOHR, U. and CASTEGNARO, M. (1998). Sex‐and
strain‐specific expression of cytochrome P450s in Ochratoxin A‐induced genotoxicity and
carcinogenicity in rats. Molecular carcinogenesis, 23, 76-85. PIETRI, A., BERTUZZI, T., PALLARONI, L. and PIVA IV, G. (2001). Occurrence of ochratoxin A in Italian
wines. Food additives & contaminants, 18, 647-654. PIOTROWSKA, M. (2014). The adsorption of ochratoxin A by Lactobacillus species. Toxins, 6, 2826-
2839. PIOTROWSKA, M. and ZAKOWSKA, Z. (2005). The elimination of ochratoxin A by lactic acid bacteria
strains. Polish Journal of Microbiology, 54, 279-286. PITT, J., BASILICO, J., ABARCA, M. and LOPEZ, C. (2000). Mycotoxins and toxigenic fungi. Medical
mycology, 38, 41-46.
Références
149
PITT, J. I. (1987). Penicillium viridicatum, Penicillium verrucosum, and production of ochratoxin A. Appl. Environ. Microbiol., 266-269.
PRAKASH, B., KEDIA, A., MISHRA, P. K. and DUBEY, N. (2015). Plant essential oils as food preservatives to control moulds, mycotoxin contamination and oxidative deterioration of agri-food commodities–Potentials and challenges. Food Control, 47, 381-391.
PRAKASH, B., SINGH, P., KEDIA, A. and DUBEY, N. (2012). Assessment of some essential oils as food preservatives based on antifungal, antiaflatoxin, antioxidant activities and in vivo efficacy in food system. Food Research International, 49, 201-208.
PUEL, O., GALTIER, P. and OSWALD, I. P. (2010). Biosynthesis and toxicological effects of patulin. Toxins, 2, 613-631.
RAI, M. K., BONDE, S. R., INGLE, A. P. and GADE, A. K. (2012). Mycotoxin: rapid detection, differentiation and safety. Journal of Pharmaceutical Education and Research, 3, 22.
REFAI, M., AZIZ, N., EL-FAR, F. and HASSAN, A. (1996). Detection of ochratoxin produced by A. ochraceus in feedstuffs and its control by γ radiation. Applied radiation and isotopes, 47, 617-621.
REVERBERI, M., GAZZETTI, K., PUNELLI, F., SCARPARI, M., ZJALIC, S., RICELLI, A., FABBRI, A. A. and FANELLI, C. (2012). Aoyap1 regulates OTA synthesis by controlling cell redox balance in Aspergillus ochraceus. Applied microbiology and biotechnology, 95, 1293-1304.
REVERBERI, M., ZJALIC, S., PUNELLI, F., RICELLI, A., FABBRI, A. A. and FANELLI, C. (2007). Apyap1 affects aflatoxin biosynthesis during Aspergillus parasiticus growth in maize seeds. Food additives and contaminants, 24, 1070-1075.
RHEE, S. G., WOO, H. A., KIL, I. S. and BAE, S. H. (2012). Peroxiredoxin functions as a peroxidase and a regulator and sensor of local peroxides. Journal of Biological Chemistry, 287, 4403-4410.
RICHARD, J. L. (2007). Some major mycotoxins and their mycotoxicoses—An overview. International journal of food microbiology, 119, 3-10.
RINGOT, D. C., A.; SCHNEIDER, Y.J.; LARONDELLE, Y. (2006). Toxicokinetics and toxicodynamics of ochratoxin A, an update. Chem. Biol. Interact., 18–46.
RISPAIL, N., SOANES, D. M., ANT, C., CZAJKOWSKI, R., GRÜNLER, A., HUGUET, R., PEREZ-NADALES, E., POLI, A., SARTOREL, E. and VALIANTE, V. (2009). Comparative genomics of MAP kinase and calcium–calcineurin signalling components in plant and human pathogenic fungi. Fungal Genetics and Biology, 46, 287-298.
RODRÍGUEZ, A., RODRÍGUEZ, M., LUQUE, M. I., JUSTESEN, A. F. and CÓRDOBA, J. J. (2011). Quantification of ochratoxin A-producing molds in food products by SYBR Green and TaqMan real-time PCR methods. International journal of food microbiology, 149, 226-235.
RODRIGUEZ, H., REVERON, I., DORIA, F., COSTANTINI, A., DE LAS RIVAS, B., MUNOZ, R. and GARCIA-MORUNO, E. (2011). Degradation of ochratoxin a by Brevibacterium species. Journal of Agricultural and Food Chemistry, 59, 10755-10760.
ROMERO, S., ALBERTO, M. and VAAMONDE, G. (2010). Effect of gallic acid on Aspergillus carbonarius growth and ochratoxin A production. World Mycotoxin Journal, 3, 45-48.
ROMERO, S. M., ALBERTO, M. R., MANCA DE NADRA, M. C. and VAAMONDE, G. (2009). Inhibition of growth and ochratoxin A biosynthesis in Aspergillus carbonarius by flavonoid and nonflavonoid compounds. Mycotoxin research, 25, 165.
RONNE, H. (1995). Glucose repression in fungi. Trends in genetics, 11, 12-17. ROSA, C., MAGNOLI, C., FRAGA, M., DALCERO, A. and SANTANA, D. (2004). Occurrence of ochratoxin
A in wine and grape juice marketed in Rio de Janeiro, Brazil. Food additives and contaminants, 21, 358-364.
RUIJTER, G. J. and VISSER, J. (1997). Carbon repression in Aspergilli. FEMS Microbiology Letters, 151, 103-114.
RUMORA, L. and ŽANIĆ GRUBIŠIĆ, T. (2009). A journey through mitogen-activated protein kinase and ochratoxin A interactions. Arhiv za higijenu rada i toksikologiju, 60, 449-455.
Références
150
RUSTOM, I. (1997). Aflatoxin in food and feed: occurrence, legislation and inactivation by physical methods. Food chemistry, 59, 57-67.
SAMSON, R. A., NOONIM, P., MEIJER, M., HOUBRAKEN, J., FRISVAD, J. C. and VARGA, J. (2007). Diagnostic tools to identify black aspergilli. Studies in Mycology, 59, 129-145.
SAMSON, R. A. H., J.A.M.P.; KUIPERS, A.F.A.; FRANK, J.M.; FRISVAD, J.C. (2004). New ochratoxin A or sclerotium producing species in Aspergillus section Nigri. Stud. Mycol., 45-61.
SARTORI, D., MASSI, F. P., FERRANTI, L. S. and FUNGARO, M. H. P. (2014). Identification of genes differentially expressed between ochratoxin-producing and non-producing strains of Aspergillus westerdijkiae. Indian journal of microbiology, 54, 41-45.
SATO, I., ITO, M., ISHIZAKA, M., IKUNAGA, Y., SATO, Y., YOSHIDA, S., KOITABASHI, M. and TSUSHIMA, S. (2012). Thirteen novel deoxynivalenol-degrading bacteria are classified within two genera with distinct degradation mechanisms. FEMS Microbiology Letters, 327, 110-117.
SAVINO, M., LIMOSANI, P. and GARCIA-MORUNO, E. (2007). Reduction of ochratoxin A contamination in red wines by oak wood fragments. American Journal of Enology and Viticulture, 58, 97-101.
SCHATZMAYR, G., HEIDLER, D., FUCHS, E. and BINDER, E.-M. (2012). Microorganism for biological detoxification of mycotoxins, namely ochratoxins and/or zearalenons, as well as method and use thereof. Google Patents.
SCHATZMAYR, G., HEIDLER, D., FUCHS, E., BINDER, E., LOIBNER, A. and BRAUN, R. (2002). Evidence of ochratoxin A-detoxification activity of rumen fluid, intestinal fluid and soil samples as well as isolation of relevant microorganisms from these environments. Mycotoxin research, 18, 183-187.
SCHATZMAYR, G., HEIDLER, D., FUCHS, E., NITSCH, S., MOHNL, M., TÄUBEL, M., LOIBNER, A., BRAUN, R. and BINDER, E. (2003). Investigation of different yeast strains for the detoxification of ochratoxin A. Mycotoxin research, 19, 124-128.
SCHATZMAYR, G., ZEHNER, F., TÄUBEL, M., SCHATZMAYR, D., KLIMITSCH, A., LOIBNER, A. P. and BINDER, E. M. (2006). Microbiologicals for deactivating mycotoxins. Molecular Nutrition & Food Research, 50, 543-551.
SCHMIDT-HEYDT, M., GRAF, E., BATZLER, J. and GEISEN, R. (2011a). The application of transcriptomics to understand the ecological reasons of ochratoxin a biosynthesis by Penicillium nordicum on sodium chloride rich dry cured foods. Trends in Food Science & Technology, 22, S39-S48.
SCHMIDT-HEYDT, M., GRAF, E., STOLL, D. and GEISEN, R. (2012). The biosynthesis of ochratoxin A by Penicillium as one mechanism for adaptation to NaCl rich foods. Food Microbiology, 29, 233-241.
SCHMIDT-HEYDT, M., RÜFER, C., RAUPP, F., BRUCHMANN, A., PERRONE, G. and GEISEN, R. (2011b). Influence of light on food relevant fungi with emphasis on ochratoxin producing species. International journal of food microbiology, 145, 229-237.
SCHMIDT-HEYDT, M., STOLL, D., SCHÜTZ, P. and GEISEN, R. (2015). Oxidative stress induces the biosynthesis of citrinin by Penicillium verrucosum at the expense of ochratoxin. International journal of food microbiology, 192, 1-6.
SCHNEIDER, E. P. and DICKERT, K. J. (1994). Health Costs and Benefits of Fungicide Use in Agricultur: A Literature Review. Journal of Agromedicine, 1, 19-37.
SCHWARZER, D. and MARAHIEL, M. A. (2001). Multimodular biocatalysts for natural product assembly. Naturwissenschaften, 88, 93-101.
SCOTT, P. (1996). Effects of processing and detoxification treatments on ochratoxin A: introduction. Food additives and contaminants, 13, 19-21.
SIKKEMA, J., DE BONT, J. and POOLMAN, B. (1995). Mechanisms of membrane toxicity of hydrocarbons. Microbiological reviews, 59, 201-222.
SILVA, A., GALLI, R., GRAZIOLI, B. and FUMI, M. D. (2003). Metodi di riduzione di residui di ocratossina A nei vini. Industrie delle bevande, 32, 467-472.
ŠIMOVIĆ, M., DELAŠ, F., GRADVOL, V., KOCEVSKI, D. and PAVLOVIĆ, H. (2014). Antifungal effect of eugenol and carvacrol against foodborne pathogens Aspergillus carbonarius and Penicillium
Références
151
roqueforti in improving safety of fresh-cut watermelon. Journal of Intercultural Ethnopharmacology, 3, 91-96.
SKAUG, M. A. (1999). Analysis of Norwegian milk and infant formulas for ochratoxin A. Food additives & contaminants, 16, 75-78.
ŠKRINJAR, M., RAŠIĆ, J. L. and STOJIČIĆ, V. (1996). Lowering of ochratoxin A level in milk by yoghurt bacteria and bifidobacteria. Folia microbiologica, 41, 26-28.
SOLEAS, G. J., YAN, J. and GOLDBERG, D. M. (2001). Assay of ochratoxin A in wine and beer by high-pressure liquid chromatography photodiode array and gas chromatography mass selective detection. Journal of Agricultural and Food Chemistry, 49, 2733-2740.
SOLIMAN, K. and BADEAA, R. (2002). Effect of oil extracted from some medicinal plants on different mycotoxigenic fungi. Food and Chemical Toxicology, 40, 1669-1675.
SPARRINGA, R. and OWENS, J. (1999). Glucosamine content of tempe mould, Rhizopus oligosporus. International journal of food microbiology, 47, 153-157.
STANDER, M. A., STEYN, P. S., VAN DER WESTHUIZEN, F. H. and PAYNE, B. E. (2001). A kinetic study into the hydrolysis of the ochratoxins and analogues by carboxypeptidase A. Chemical research in toxicology, 14, 302-304.
STOEV, S. (1998). The role of ochratoxin A as a possible cause of Balkan endemic nephropathy and its risk evaluation. Veterinary and human toxicology, 40, 352-360.
STOEV, S. D., DENEV, S., DUTTON, M. F., NJOBEH, P. B., MOSONIK, J. S., STEENKAMP, P. A. and PETKOV, I. (2010a). Complex etiology and pathology of mycotoxic nephropathy in South African pigs. Mycotoxin research, 26, 31-46.
STOEV, S. D. and DENEV, S. A. (2013). Porcine/chicken or human nephropathy as the result of joint mycotoxins interaction. Toxins, 5, 1503-1530.
STOEV, S. D., DUTTON, M. F., NJOBEH, P. B., MOSONIK, J. S. and STEENKAMP, P. A. (2010b). Mycotoxic nephropathy in Bulgarian pigs and chickens: complex aetiology and similarity to Balkan Endemic Nephropathy. Food additives and contaminants, 27, 72-88.
STOLL, D., SCHMIDT-HEYDT, M. and GEISEN, R. (2013). Differences in the Regulation of Ochratoxin A by the HOG Pathway in Penicillium and Aspergillus in Response to High Osmolar Environments. Toxins, 5, 1282.
STRIJBIS, K. and DISTEL, B. (2010). Intracellular acetyl unit transport in fungal carbon metabolism. Eukaryotic cell, 9, 1809-1815.
STUDER-ROHR, I., DIETRICH, D. R., SCHLATTER, J. and SCHLATTER, C. (1995). The occurrence of ochratoxin A in coffee. Food and Chemical Toxicology, 33, 341-355.
SWEENEY, M. J. and DOBSON, A. D. (1998). Mycotoxin production by Aspergillus, Fusarium and Penicillium species. International journal of food microbiology, 43, 141-158.
TANGNI, E., PONCHAUT, S., MAUDOUX, M., ROZENBERG, R. and LARONDELLE, Y. (2002). Ochratoxin A in domestic and imported beers in Belgium: occurrence and exposure assessment. Food additives & contaminants, 19, 1169-1179.
TANGNI, E., SIMONIS, J., LARONDELLE, Y. and DE MEEUS, D. (2005). Decontaminating and detoxifying liquid food media, especially beer, using insoluble vegetable fibers to adsorb mycotoxins. Patent number WO2005007794-A1.
TATSADJIEU, N., DONGMO, P. J., NGASSOUM, M., ETOA, F. and MBOFUNG, C. (2009). Investigations on the essential oil of Lippia rugosa from Cameroon for its potential use as antifungal agent against Aspergillus flavus Link ex. Fries. Food Control, 20, 161-166.
THIMM, N., SCHWAIGHOFER, B., OTTNER, F., FRÖSCHL, H., GREIFENENDER, S. and BINDER, E. (2001). Adsorption of mycotoxins. Mycotoxin research, 17, 219-223.
THOMAS B.T., O. M. O., AGU G.C., LAKUNLE O.M., DAVIES A. (2015). In Silico Sequence Analysis of Pks Gene of Ochratoxin A Producing Aspergillus Section Nigri. International Journal of Genetics (2): 48-52.
Références
152
TILBURN, J., SARKAR, S., WIDDICK, D., ESPESO, E., OREJAS, M., MUNGROO, J., PENALVA, M. and ARST JR, H. (1995). The Aspergillus PacC zinc finger transcription factor mediates regulation of both acid-and alkaline-expressed genes by ambient pH. The EMBO Journal, 14, 779.
TJAMOS, S., ANTONIOU, P., KAZANTZIDOU, A., ANTONOPOULOS, D., PAPAGEORGIOU, I. and TJAMOS,
E. (2004). Aspergillus niger and Aspergillus carbonarius in Corinth Raisin and Wine‐Producing
Vineyards in Greece: Population Composition, Ochratoxin A Production and Chemical Control. Journal of Phytopathology, 152, 250-255.
TOLOUEE, M., ALINEZHAD, S., SABERI, R., ESLAMIFAR, A., ZAD, S. J., JAIMAND, K., TAEB, J., REZAEE, M.-B., KAWACHI, M., SHAMS-GHAHFAROKHI, M. and RAZZAGHI-ABYANEH, M. (2010). Effect of Matricaria chamomilla L. flower essential oil on the growth and ultrastructure of Aspergillus niger van Tieghem. International journal of food microbiology, 139, 127-133.
TRIONÉ, D. and DUMEAU, F. (2000). Influence de différents traitements sur la concentration en ochratoxine A des vins rouges. Revue des oenologues et des techniques vitivinicoles et oenologicques: magazine trimestriel d'information professionnelle, 27, 37-38.
TRIPATHI, A., SHARMA, N. and SHARMA, V. (2009). In vitro efficacy of Hyptis suaveolens L.(Poit.) essential oil on growth and morphogenesis of Fusarium oxysporum f. sp. gladioli (Massey) Snyder & Hansen. World Journal of Microbiology and Biotechnology, 25, 503-512.
TRIVEDI, A. B., DOI, E. and KITABATAKE, N. (1992). Detoxification of ochratoxin A on heating under acidic and alkaline conditions. Bioscience, biotechnology, and biochemistry, 56, 741-745.
VALERO, A., OLIVÁN, S., MARÍN, S., SANCHIS, V. and RAMOS, A. J. (2007). Effect of intra and interspecific interaction on OTA production by A. section Nigri in grapes during dehydration. Food Microbiology, 24, 254-259.
VAN DER MERWE, K., STEYN, P., FOURIE, L., SCOTT, D. B. and THERON, J. (1965). Ochratoxin A, a toxic metabolite produced by Aspergillus ochraceus Wilh.
VAN DER MERWE, K. J. S., P.S.; FOURIE, L.; SCOTT, D.B.; THERON, J.J. (1965). Ochratoxin A, a toxic metabolite produced by Aspergillus ochraceus Wilh. Nature, 1112-1113.
VAN WALBEEK, W. S., P.M.; HARWIG, J; LAWRENCE, J.W. (1969). A new source of ochratoxin A. A. Can. J. Microbiol, 1281-1285.
VAR, I., KABAK, B. and ERGINKAYA, Z. (2008). Reduction in ochratoxin A levels in white wine, following treatment with activated carbon and sodium bentonite. Food Control, 19, 592-598.
VARGA, J., KEVEI, E., RINYU, E., TÉREN, J. and KOZAKIEWICZ, Z. (1996). Ochratoxin production by Aspergillus species. Applied and environmental microbiology, 62, 4461-4464.
VARGA, J., RIGÓ, K. and TÉREN, J. (2000). Degradation of ochratoxin A by Aspergillus species. International journal of food microbiology, 59, 1-7.
VARGA, J. K., E.; RINYU, E.; TÉREN, J.; KOZAKIEWICZ, Z. (1996). Ochratoxin production by Aspergillus species. Appl. Environ. Microbiol., 4461-4464.
VELDHUIZEN, E. J., TJEERDSMA-VAN BOKHOVEN, J. L., ZWEIJTZER, C., BURT, S. A. and HAAGSMAN, H. P. (2006). Structural requirements for the antimicrobial activity of carvacrol. Journal of Agricultural and Food Chemistry, 54, 1874-1879.
VERGER, P., VOLATIER, J. and DUFOUR, A. (1999). Estimation des niveaux théoriques d’ingestion d’aflatoxines et d’ochratoxine. Les mycotoxines dans l’alimentation: Evaluation et gestion du risque, 371-384.
VETTORAZZI, A., GONZÁLEZ-PEÑAS, E. and DE CERAIN, A. L. (2014). Ochratoxin A kinetics: A review of analytical methods and studies in rat model. Food and Chemical Toxicology, 72, 273-288.
VETTORAZZI, A., VAN DELFT, J. and DE CERAIN, A. L. (2013). A review on ochratoxin A transcriptomic studies. Food and Chemical Toxicology, 59, 766-783.
VISCONTI, A., PERRONE, G., COZZI, G. and SOLFRIZZO, M. (2008). Managing ochratoxin A risk in the grape-wine food chain. Food additives and contaminants, 25, 193-202.
WANG, L., WANG, Y., WANG, Q., LIU, F., SELVARAJ, J. N., LIU, L., XING, F., ZHAO, Y., ZHOU, L. and LIU, Y. (2015). Functional characterization of new polyketide synthase genes involved in ochratoxin A biosynthesis in Aspergillus ochraceus fc-1. Toxins, 7, 2723-2738.
Références
153
WEGST, W. and LINGENS, F. (1983). Bacterial degradation of ochratoxin A. FEMS Microbiology Letters, 17, 341-344.
WINK, M. (2012). Secondary metabolites from plants inhibiting ABC transporters and reversing resistance of cancer cells and microbes to cytotoxic and antimicrobial agents. Frontiers in microbiology, 3, 130.
WINK, M. and SCHIMMER, O. (2010). Molecular modes of action of defensive secondary metabolites. Functions and biotechnology of plant secondary metabolites, 39, 21-161.
XIAO, H., MARQUARDT, R. R., FROHLICH, A. A. and LING, Y. Z. (1995). Synthesis and structural elucidation of analogs of ochratoxin A. Journal of Agricultural and Food Chemistry, 43, 524-530.
YIN, W. and KELLER, N. P. (2011). Transcriptional regulatory elements in fungal secondary metabolism. The Journal of Microbiology, 49, 329-339.
YOU, M., WICKRAMARATNE, D. B., SILVA, G. L., CHAI, H., CHAGWEDERA, T. E., FARNSWORTH, N. R., CORDELL, G. A., KINGHORN, A. D. and PEZZUTO, J. M. (1995). (-)-Roemerine, an aporphine alkaloid from Annona senegalensis that reverses the multidrug-resistance phenotype with cultured cells. J Nat Prod, 58, 598-604.
YU, J., CHANG, P.-K., EHRLICH, K. C., CARY, J. W., BHATNAGAR, D., CLEVELAND, T. E., PAYNE, G. A., LINZ, J. E., WOLOSHUK, C. P. and BENNETT, J. W. (2004). Clustered pathway genes in aflatoxin biosynthesis. Applied and environmental microbiology, 70, 1253-1262.
ZHANG, X. B. and OHTA, Y. (1991). Binding of mutagens by fractions of the cell wall skeleton of lactic acid bacteria on mutagens. Journal of dairy science, 74, 1477-1481.
ZIMMERLI, B. and DICK, R. (1996). Ochratoxin A in table wine and grape‐juice: Occurrence and risk
assessment∗. Food additives & contaminants, 13, 655-668. ZINEDINE, A., SORIANO, J. M., MOLTO, J. C. and MANES, J. (2007). Review on the toxicity, occurrence,
metabolism, detoxification, regulations and intake of zearalenone: an oestrogenic mycotoxin. Food and Chemical Toxicology, 45, 1-18.