Embed Size (px)
Citation preview
En vue de l'obtention du
DOCTORAT DE L'UNIVERSITÉ DE TOULOUSEDélivré par :
Institut National Polytechnique de Toulouse (INP Toulouse)Discipline ou spécialité :
Génie Électrique
Présentée et soutenue par :M. DAVID MAGIN FLOREZ RUBIO
le lundi 20 janvier 2014
Titre :
Unité de recherche :
Ecole doctorale :
SOURCES D'ALIMENTATION ELECTRIQUE POUR L'ETUDE ETL'UTILISATION EFFICACE DES LAMPES EXCIMER DBD
Génie Electrique, Electronique, Télécommunications (GEET)
Laboratoire Plasma et conversion d'Energie (LAPLACE)Directeur(s) de Thèse :
M. HUBERT PIQUETM. RAFAEL DIEZ
Rapporteurs :M. DIEGO ECHEVERRY, UNIVERSIDAD DEL VALLEM. MARCOS ALONSO, UNIVERSIDAD DE OVIEDO
Membre(s) du jury :1 M. FREDY RUIZ, PONTIFICIA UNIVERSIDAD JAVERIANA BOGOTA, Président2 M. GEORGES ZISSIS, UNIVERSITE TOULOUSE 3, Membre2 M. HUBERT PIQUET, INP TOULOUSE, Membre2 M. RAFAEL DIEZ, PONTIFICIA UNIVERSIDAD JAVERIANA BOGOTA, Membre

i
Acknowledgements
The works presented in this doctoral thesis have been developed within the researchgroups CEPIT of the Pontificia Universidad Javeriana in Bogota, Colombia, and G-ENESYS of the Laboratoire Plasma et Conversion d’Energie (LAPLACE), unité mixtede recherche CNRS-INPT-UPS nº 5213 in Toulouse, France.The financial support of this doctoral thesis has been provided by: the Colombian
national agency for the science and technology COLCIENCIAS, COLFUTURO, la cor-poration pour les études en France CEF from the french ambassay in Bogota and thebi-national program ECOS-NORD.To begin I express my sincere gratitude to Professors Marcos Alonso, Diego Echeverry,
and Georges Zissis for accepting to examine this work, for their valuable review andconstructive discussions. In the same manner, I acknowledge Professor Fredy Ruiz forhis valuable cooperation being the president of the Jury, facilitating the well developmentof the multi-national exam committee.The Directors of this thesis, Professor Rafael Diez and Professor Hubert Piquet, de-
serve my genuine gratefulness for allowing me to being part of their motivating re-searches, for their engaged guidance of my work and for transmitting to me their rigorousresearch methodology. The accomplishment of this thesis co-direction has been possiblethanks to their commitment with the international scientific cooperation.Furthermore my thankfulness is:In Colombia to Dr. Carlos Parra, Director of the Doctorado en Ingeniería at Pontificia
Universidad Javeriana for receiving me at the program and for his support for the welldevelopment of the international co-direction. To Professors Karim Hay, Gabriel Perillaand Camilo Otálora for apporting their ideas, experience and knowledge to the project.In France to Monsieur Christian Laurent and Monsieur Maurice Fadel, Directeur and
Directeur Adjoint respectively, of the LAPLACE for accepting me to be part of thelaboratory. To Monsieur Xavier Roboam, Director of the G-ENESYS group, for his gen-tle receiving among a team of exceptional professionals and researchers. To MonsieurEric Bru, from who I really appreciate the constant and kindly cooperation and helpfulteachings during my stays at LAPLACE laboratory. To Monsieur Jean-Marc Blacquierefor his valuable advise for the improvement and implementation of the converters de-veloped during this research and to Monsieur Sebastien Vinnac for his help with theimplementation. To Monsieur Antoine Belinger for his active participation at the eval-uation process of my doctoral studies and his help with the spectrometry of the lamp.To Monsieur Sounil Bhosle for his fundamental contribution providing the project withthe DBD Excilamps and help in the understanding of this technology.To the society Trojan UV, in particular to Dr. Gordon Knight and Farnaz Daynouri
for receving me at their headquarters and allowing me to learn about their researchunits.I say thanks in a more familiar way to:Xavier Bonnin pour sa grande contribution au projet de recherche avec ses développe-
ments sur le transformateur et surtout pour sa visite en Colombie, son amitié et générosité
David Flórez Power supplies for the study and efficient use of DBD excimer UV lamps
ii
pendant mon séjour en France; ce remerciement est extensive bien sur á Virginie, Yannet Cassandre pour leur aimable accueil chez eux.Alaric et Priscilla Montenon pour leur amitié, les gentilles invitations et les délicieux
repas.Djibrillah pour sa visite en Colombie et son aide lors de mes premiers jours au
LAPLACE.Agradezco a Diego Botero por su generosidad, simpatía y ayuda incondicional durante
mis estadías en Toulouse sin las cuales no me habría divertido tanto, también le quieroagradecer por habernos esperado estóicamente en medio de la nieve.A mi familia entera, quienes me han alentado y apoyado en todo sentido durante los
momentos difíciles de esta aventura. Estoy seguro que no habría logrado llegar a realizareste doctorado sin los valores y enseñanzas que Stella y Aroldo nos inculcaron.Finalmente a mi amada Malu, por tantos años, tantos viajes y tantos paisajes. A ella
corresponde gran parte del buen término de esta tesis.
Power supplies for the study and efficient use of DBD excimer UV lamps David Flórez
iii
Résumé: Avec l’objectif d’améliorer le rendement des lampes à excimères (Excil-ampe) à décharge à barrière diélectrique (DBD), un convertisseur en mode de courant,qui permet un ajustement précis de la puissance électrique injectée dans ce type deslampes, à été conçu et mis en œuvre. Ce convertisseur fournit à la lampe un courantde forme d’onde carrée contrôlé au moyen de trois paramètres: l’amplitude, la fréquenceet le rapport cyclique, pour obtenir un contrôle total de l’énergie électrique transmiseà l’excilampe DBD. La mise en œuvre intègre un transformateur élévateur comme in-terface entre la lampe et un commutateur. Les expériences démontrent le principe defonctionnement de ce convertisseur, y compris les mesures de puissance du rayonnementUV. Les degrés de liberté du convertisseur sont utilisées pour analyser le comportementde la lampe sous différentes combinaisons de ces trois paramètres, et sont utilisés pourdéterminer le point de fonctionnement optimal de la lampe. Ensuite, un convertisseur àrésonance du type onduleur série, est proposé pour alimenter la lampe avec une grandeefficacité électrique. Afin de contrôler effectivement la puissance de la lampe, le modede fonctionnement de ce convertisseur utilise le mode de conduction discontinue et lacommutation douce (ZCS), avec lequel on obtient aussi de faibles émissions électromag-nétiques et l’on réduit les pertes de commutation. Les relations mathématiques obtenusà partir de l’analyse du diagramme de phase, ont été validées par des simulations et avecdes résultats expérimentaux. Enfin, différentes topologies d’alimentations pour DBDsont comparées analytiquement et expérimentalement pour évaluer objectivement lesavantages de chaque approche. Une des perspectives de ce travail est l’application del’alimentation en créneaux pour l’étude de la performance d’autres types de réacteurs etd’excilampes DBD.Mots clef: DBD, lampe à excimères, source de courant, convertisseur à résonance, UV.
Abstract: With the aim to provide a scientific tool for the enhancement of the Dielec-tric Barrier Discharge (DBD) Excimer Lamps (Excilamp) performance, a current-modeconverter that allows an accurate adjustment of the electrical power injected into oneof those lamps, is designed and implemented. With the proposed converter, the cur-rent supplied to the lamp has a square shape, controlled by means of three parameters:amplitude, duty cycle and frequency, which provides full control of the lamp electri-cal power. Implementation is made considering a step-up transformer interfacing thehigh-voltage lamp with the converter. Experiments demonstrate the operating principleof this converter, including UV power measurements for a DBD XeCl Excilamp. Thecapabilities of the converter are used to analyze the lamp behavior under different com-binations of these three parameters, illustrating its capabilities for finding the optimaloperating point. Then a series-resonant inverter for the supply of DBD) excilamp isproposed. In order to effectively control the lamp power, the operating mode of thisconverter combines discontinuous current-mode and soft-commutation (ZCS), obtainingas well low electromagnetic emissions, and reduced switching losses. The mathemati-cal relationships obtained from state plane analysis, are validated with simulations andexperimental results. Finally, several topologies of DBDs power supplies are comparedanalytical and experimentally to elucidate the advantages of each approach. After this
David Flórez Power supplies for the study and efficient use of DBD excimer UV lamps

iv
work, one of the perspectives is the application of the square-shape supply in the per-formance study of other types of DBD excilamps and DBD reactors.Keywords: DBD, excilamp, current source, resonant converter, UV.
Power supplies for the study and efficient use of DBD excimer UV lamps David Flórez
Contents
Introduction 1
1. Literature review 91.1. DBD Excimer UV lamps . . . . . . . . . . . . . . . . . . . . . . . . . . . . 9
1.1.1. Operating Principle . . . . . . . . . . . . . . . . . . . . . . . . . . 91.1.2. Operating Conditions . . . . . . . . . . . . . . . . . . . . . . . . . 111.1.3. Modeling . . . . . . . . . . . . . . . . . . . . . . . . . . . . . . . . 14
1.2. Power supplies for DBDs . . . . . . . . . . . . . . . . . . . . . . . . . . . . 161.2.1. Controlling the DBD excilamp power . . . . . . . . . . . . . . . . . 161.2.2. Current Mode Supplies for DBDs . . . . . . . . . . . . . . . . . . . 181.2.3. Voltage Mode Supplies for DBD . . . . . . . . . . . . . . . . . . . 23
1.3. Characteristics of Commercial DBD Excilamp Based Systems . . . . . . . 261.4. Summary . . . . . . . . . . . . . . . . . . . . . . . . . . . . . . . . . . . . 27
2. Parametric Control of the DBD Excilamp Electrical Power 332.1. Control of Lamp Power with Three Degrees of Freedom . . . . . . . . . . 33
2.1.1. Choice of the Current Waveform . . . . . . . . . . . . . . . . . . . 332.1.2. Lamp Power Computation . . . . . . . . . . . . . . . . . . . . . . . 34
2.2. Square-shape Current Supply Design . . . . . . . . . . . . . . . . . . . . . 362.2.1. Current Inverter Operation . . . . . . . . . . . . . . . . . . . . . . 362.2.2. Constant Current Source . . . . . . . . . . . . . . . . . . . . . . . 38
2.3. Considerations for implementation . . . . . . . . . . . . . . . . . . . . . . 452.3.1. Frequency of the Lamp Current . . . . . . . . . . . . . . . . . . . . 452.3.2. Output Current and Voltage . . . . . . . . . . . . . . . . . . . . . 452.3.3. The Step-up Transformer . . . . . . . . . . . . . . . . . . . . . . . 46
2.4. Components selection . . . . . . . . . . . . . . . . . . . . . . . . . . . . . 502.4.1. Transformer . . . . . . . . . . . . . . . . . . . . . . . . . . . . . . . 502.4.2. Inductance . . . . . . . . . . . . . . . . . . . . . . . . . . . . . . . 572.4.3. Switches . . . . . . . . . . . . . . . . . . . . . . . . . . . . . . . . . 57
2.5. Implementation Results . . . . . . . . . . . . . . . . . . . . . . . . . . . . 572.5.1. User Interface for the Operating Point Adjustment . . . . . . . . . 582.5.2. Experimental Bench . . . . . . . . . . . . . . . . . . . . . . . . . . 592.5.3. Lamp Power Adjustment . . . . . . . . . . . . . . . . . . . . . . . 592.5.4. Efficiency . . . . . . . . . . . . . . . . . . . . . . . . . . . . . . . . 622.5.5. UV radiation . . . . . . . . . . . . . . . . . . . . . . . . . . . . . . 64
2.6. Conclusions . . . . . . . . . . . . . . . . . . . . . . . . . . . . . . . . . . . 64
vi Contents
3. Parametric Study of the Operating Point Influence on the DBD ExcilampPerformance 693.1. Experimental Set-up . . . . . . . . . . . . . . . . . . . . . . . . . . . . . . 703.2. Impact of the Lamp Current Intensity . . . . . . . . . . . . . . . . . . . . 72
3.2.1. Impact of J Over the UV Production . . . . . . . . . . . . . . . . 723.2.2. Impact of J Over the Electrical and UV Waveforms . . . . . . . . 743.2.3. Impact of J Over the Lamp Model Parameters . . . . . . . . . . . 763.2.4. Impact of J Over the Discharge Regime . . . . . . . . . . . . . . . 77
3.3. Impact of the Lamp Operating Frequency . . . . . . . . . . . . . . . . . . 793.3.1. Impact of flp Over the UV Production . . . . . . . . . . . . . . . . 793.3.2. Impact of flp Over the Electrical and UV Waveforms . . . . . . . . 803.3.3. Impact of flp Over the Lamp Model Parameters . . . . . . . . . . . 823.3.4. Impact of flp Over the Discharge Regime . . . . . . . . . . . . . . . 83
3.4. Best Performance Operating Conditions . . . . . . . . . . . . . . . . . . . 843.5. Conclusions . . . . . . . . . . . . . . . . . . . . . . . . . . . . . . . . . . . 86
4. High Efficiency DBD Power Supply Working at the Optimal Operating Point 914.1. Topology: SRI Operated in DCM . . . . . . . . . . . . . . . . . . . . . . . 91
4.1.1. State plane analysis . . . . . . . . . . . . . . . . . . . . . . . . . . 944.1.2. State plane: before breakdown trajectory . . . . . . . . . . . . . . 944.1.3. State plane: after breakdown trajectory . . . . . . . . . . . . . . . 964.1.4. Operating conditions . . . . . . . . . . . . . . . . . . . . . . . . . . 97
4.2. Components Selection and Simulations . . . . . . . . . . . . . . . . . . . . 1034.2.1. Operating Point . . . . . . . . . . . . . . . . . . . . . . . . . . . . 1034.2.2. Switches . . . . . . . . . . . . . . . . . . . . . . . . . . . . . . . . . 1034.2.3. Step-up Transformer . . . . . . . . . . . . . . . . . . . . . . . . . . 1044.2.4. Inductance Value . . . . . . . . . . . . . . . . . . . . . . . . . . . . 1044.2.5. Simulations . . . . . . . . . . . . . . . . . . . . . . . . . . . . . . . 105
4.3. Experimental Results . . . . . . . . . . . . . . . . . . . . . . . . . . . . . . 1074.3.1. Electrical Waveforms . . . . . . . . . . . . . . . . . . . . . . . . . . 1074.3.2. Performances . . . . . . . . . . . . . . . . . . . . . . . . . . . . . . 109
4.4. Conclusions . . . . . . . . . . . . . . . . . . . . . . . . . . . . . . . . . . . 111
5. DBD Supplies comparison 1135.1. Analytical Design . . . . . . . . . . . . . . . . . . . . . . . . . . . . . . . . 115
5.1.1. Boost Based Converter . . . . . . . . . . . . . . . . . . . . . . . . . 1155.1.2. Buck-Boost based converter . . . . . . . . . . . . . . . . . . . . . . 120
5.2. Converters Design and Simulations . . . . . . . . . . . . . . . . . . . . . . 1245.2.1. SRI design . . . . . . . . . . . . . . . . . . . . . . . . . . . . . . . 1245.2.2. Boost-based design . . . . . . . . . . . . . . . . . . . . . . . . . . . 1265.2.3. Buck-Boost-based design . . . . . . . . . . . . . . . . . . . . . . . 1285.2.4. Square-shape design . . . . . . . . . . . . . . . . . . . . . . . . . . 1295.2.5. Simulations . . . . . . . . . . . . . . . . . . . . . . . . . . . . . . . 130
5.3. Experimental results . . . . . . . . . . . . . . . . . . . . . . . . . . . . . . 131
Power supplies for the study and efficient use of DBD excimer UV lamps David Flórez
Contents vii
5.4. Conclusions . . . . . . . . . . . . . . . . . . . . . . . . . . . . . . . . . . . 133
6. General Conclusions 135
A. Appendix. Résumé de la Thèse en Français 153
David Flórez Power supplies for the study and efficient use of DBD excimer UV lamps

List of Figures
0.1. UV absorbance of the DNA [0.4, p. 2-7] . . . . . . . . . . . . . . . . . . . . . 20.2. Main UV artificial sources. From left to right: LED [0.8], HID Mercury-vapor
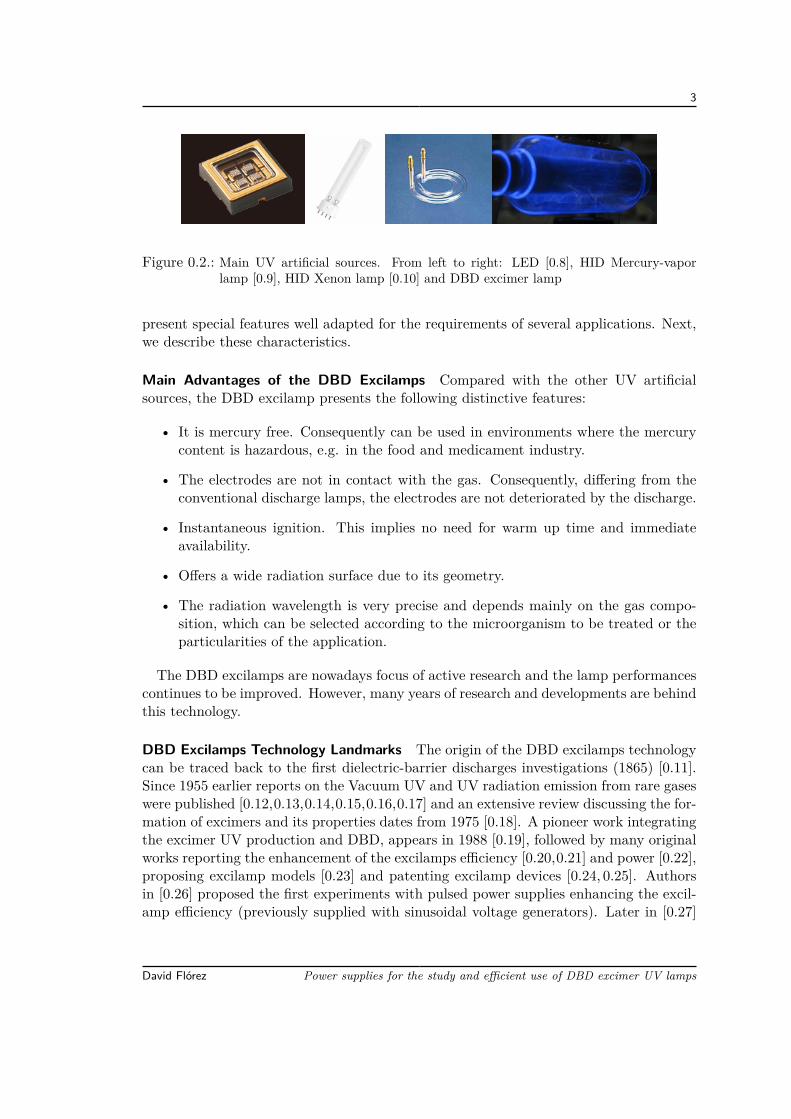
lamp [0.9], HID Xenon lamp [0.10] and DBD excimer lamp . . . . . . . . . . . 3
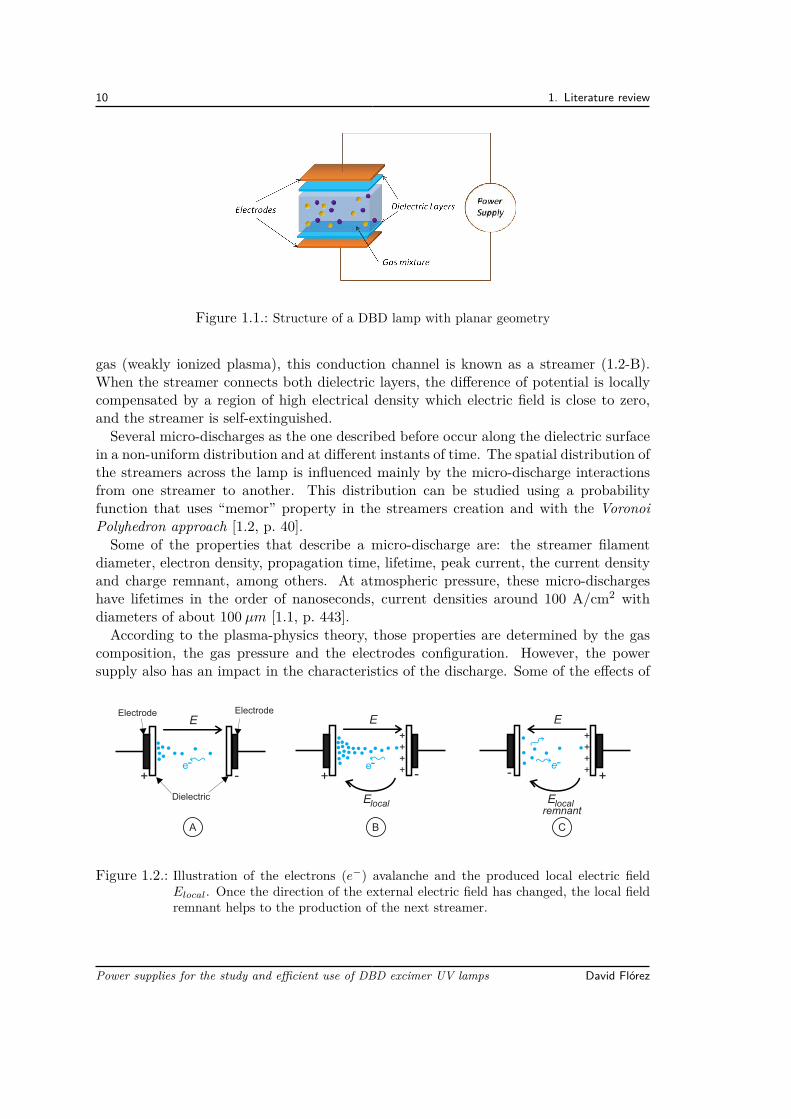
1.1. Structure of a DBD lamp with planar geometry . . . . . . . . . . . . . . . . . 101.2. Illustration of the electrons (e−) avalanche and the produced local electric field
Elocal. Once the direction of the external electric field has changed, the localfield remnant helps to the production of the next streamer. . . . . . . . . . . . 10
1.3. Collisions in a DBD excimer lamp filled with XeCl gas . . . . . . . . . . . . . . 111.4. Lower excited states of energy (B, C, D) of an exciplex and the radiative transi-
tions to the ground state (A, X). As appears in [1.4, p. 194] . . . . . . . . . . . 121.5. Electrical model of the DBD lamp . . . . . . . . . . . . . . . . . . . . . . . . 141.6. Structure of a coaxial DBD lamp . . . . . . . . . . . . . . . . . . . . . . . . . 151.7. Charge-Voltage Lissajous figure of an ozone reactor [1.18, p. 13] . . . . . . . . . 161.8. Lamp current path before (left) and after (right) gas breakdown . . . . . . . . . 171.9. Left: Boost-based DBD power supply designed to operate in DCM [1.22]. Right:
the corresponding lamp voltage and current waveforms obtained from simulation. 191.10. Left: The Adaptive Pulse topology proposed in [1.23, p. 85,144] Right: the
corresponding lamp voltage and current waveforms obtained experimentally. . . 201.11. Left: Flyback topology based DBD power supply designed to operate in current-
mode. Right: the corresponding lamp voltage and current waveforms obtainedfrom simulation. . . . . . . . . . . . . . . . . . . . . . . . . . . . . . . . . . 21
1.12. Left: Buck-Boost topology based DBD power supply designed to operate incurrent-mode. Right: the corresponding lamp voltage and current waveformsobtained from simulation. . . . . . . . . . . . . . . . . . . . . . . . . . . . . 22
1.13. Experimental waveforms of the Buck-Boost-based converter operating in DCM.Left: Inductance current iL and lamp current ilamp Right: Computed conduc-tance current igas and measured UV instantaneous response UV . [1.6] . . . . . . 22
1.14. Left: Universal-sinusoidal topology based on the Buck-Boost topology, proposedin [1.27]. Right: The experimental DBD voltage and current burst. . . . . . . . 23
1.15. Schematic of a voltage-pulse generator [1.35, p. 601] (A) and a Forward basedsinusoidal voltage source [1.20] (B) . . . . . . . . . . . . . . . . . . . . . . . . 24
1.16. Top: Schematic used for simulation of a voltage source connected to the DBDexcilamp. Bottom: The DBD lamp voltage and current simulated waveforms,obtained for an imposed voltage are shown. . . . . . . . . . . . . . . . . . . . 25
1.17. Xeradex lamp by Osram . . . . . . . . . . . . . . . . . . . . . . . . . . . . . 27
x List of Figures
2.1. Square-waveform current applied to the lamp ilp, the gas conductance currentiG (top) and voltages calculated using the lamp model (bottom). . . . . . . . . 34
2.2. Topology of the two-quadrant chopper based DBD Power Supply . . . . . . . . 362.3. Example sequence of the inverter switches control signals . . . . . . . . . . . . 372.4. Inverter switches characteristic. . . . . . . . . . . . . . . . . . . . . . . . . . 372.5. Theoretical waveform of vbridge according to (2.2.1) . . . . . . . . . . . . . . . 382.6. Output current ripple with fc < flp (top) with the corresponding inverter and
control voltage (bottom). A current spike exceeding the hysteresis limits is ob-served, this spike occurs because Vin < Vlp. . . . . . . . . . . . . . . . . . . . 40
2.7. Minimum value of L as a function of Vin to obtain: a controller operating fre-quency below 40 kHz (solid line) and a maximum controller error equal to 5%of J (dashed line). Values calculated using (2.2.10) and (2.2.16) respectively,with the following parameters: ∆hyst = 5%(J), Vth=1.3 kV, Cd=85 pF, Dlp=1,flp=50 kHz, J=300 mA. . . . . . . . . . . . . . . . . . . . . . . . . . . . . . 44
2.8. Current source switches characteristic. . . . . . . . . . . . . . . . . . . . . . . 442.9. Lamp power as a function of the lamp current frequency, for different values of Vlp. 462.10. Transformer model with the parasitic elements . . . . . . . . . . . . . . . . . . 472.11. Simulation waveforms illustrating the impact of the transformer parasitic elements 492.12. Transversal view of the transformer coils arrangement . . . . . . . . . . . . . . 512.13. Low-capacitance transformer Bode plot . . . . . . . . . . . . . . . . . . . . . 522.14. Comparison of the experimental and calculated Bode plots. . . . . . . . . . . . 532.15. Waveforms obtained using the low-capacitance transformer without connection
to ground (left) and with connection of one terminal to ground (right) . . . . . 542.16. Transformer model to explain the grounding effect . . . . . . . . . . . . . . . . 542.17. . . . . . . . . . . . . . . . . . . . . . . . . . . . . . . . . . . . . . . . . . . 552.18. Alternative transformer Bode plot . . . . . . . . . . . . . . . . . . . . . . . . 552.19. Waveforms obtained using the first (top) and the new transformer (bottom) with-
out connection to ground (left) and with connection of one terminal to ground(right). For the second transformer, ignd is substantially reduced and the lampignition is achieved. . . . . . . . . . . . . . . . . . . . . . . . . . . . . . . . 56
2.20. Screen-shot of the software interface used to define the converter operating point 582.21. Square-shape DBD Power supply blocks diagram. . . . . . . . . . . . . . . . . 582.22. Constant amplitude current pulses injected into the lamp for different flp values
(left) and the corresponding vlp waveform (right) . . . . . . . . . . . . . . . . 592.23. For a given frequency, the same lamp power can be obtained for different com-
binations of J and Dlp . . . . . . . . . . . . . . . . . . . . . . . . . . . . . . 602.24. Lamp power as a function of the lamp current amplitude, for flp = 80 kHz. The
duty cycles are placed next to data points. . . . . . . . . . . . . . . . . . . . . 602.25. Lamp power as a function of the lamp current frequency, for Dlp = 50%. The J
values (in mA) are placed next to data points. . . . . . . . . . . . . . . . . . . 612.26. Lamp power as a function of the lamp current duty cycle, for J = 189mA. The
lamp operating frequencies (in kHz) are placed next to data points. . . . . . . . 62
Power supplies for the study and efficient use of DBD excimer UV lamps David Flórez
List of Figures xi
2.27. Lamp voltage, current and UV instantaneous response, for three operating pointsnear to the maximum output voltage and current of the converter. . . . . . . . 63
3.1. DBD excilamp dimensions. A picture of the actual lamp is superposed to thelamp drawing in order to show the aspect of the electrodes . . . . . . . . . . . 70
3.2. Experimental bench. . . . . . . . . . . . . . . . . . . . . . . . . . . . . . . . 703.3. Left: Change in the temperature of the excilamp electrodes for a particular
operating point. Right: Excilamp UV power variation in the time due to heating,for a particular operating point. . . . . . . . . . . . . . . . . . . . . . . . . . 71
3.4. Impact of the excilamp current intensity in the UV output for flp=50 kHz (left)and flp=80 kHz (right) . . . . . . . . . . . . . . . . . . . . . . . . . . . . . . 72
3.5. Impact of the excilamp current intensity in the UV output for flp=110 kHz (left)and flp=140 kHz (right) . . . . . . . . . . . . . . . . . . . . . . . . . . . . . 73
3.6. Impact of the excilamp current intensity in the UV output for flp=170 kHz (left)and flp=200 kHz (right) . . . . . . . . . . . . . . . . . . . . . . . . . . . . . 74
3.7. Comparison of the current and UV waveforms for different values of J . . . . . 753.8. The experimental lamp current and UV (in arbitrary units) waveforms are shown
together in order to demonstrate the similarity between both signals. flp=80 kHz 763.9. Lamp Charge-Voltage plot for different values of current intensity at constant
current frequency and injected power. . . . . . . . . . . . . . . . . . . . . . . 773.10. Changes in the visual aspect of the discharges with the increase of the current
intensity. flp = 70 kHz, Plp = 80W , J = 95, 116, 133, 154, 171, 186mA (fromleft to right) . . . . . . . . . . . . . . . . . . . . . . . . . . . . . . . . . . . 78
3.11. Impact of the operating frequency in the UV output for J=250 mA (left) andfor J=189 mA (right) . . . . . . . . . . . . . . . . . . . . . . . . . . . . . . 79
3.12. Impact of the operating frequency in the UV output for J=128 mA (left) andfor J=67 mA (right) . . . . . . . . . . . . . . . . . . . . . . . . . . . . . . . 80
3.13. Comparison of the current and UV waveforms for J = 250mA . . . . . . . . . . 813.14. Lamp Charge-Voltage plane for different values of current frequency at constant
current intensity and injected power. . . . . . . . . . . . . . . . . . . . . . . . 833.15. Changes in the visual aspect of the discharges with the increase of the operating
frequency. flp = 50, 60, 70, 80, 90, 100 kHz (from left to right), Plp=80 W, J=100mA . . . . . . . . . . . . . . . . . . . . . . . . . . . . . . . . . . . . . . . 84
3.16. Excilamp relative radiation efficiency as a function of the injected energy, fordifferent values of lamp current intensity (left) and lamp operating frequency(right) . . . . . . . . . . . . . . . . . . . . . . . . . . . . . . . . . . . . . . 85
3.17. Excilamp UV power as a function of the injected electrical power, with thecorresponding lamp current frequency (left) and lamp operating intensity (right) 86
4.1. The proposed series-resonant inverter . . . . . . . . . . . . . . . . . . . . . . 924.2. The SRI operating sequences (bottom). Theoretical waveforms for lamp current,
lamp voltage and gas voltage (top). . . . . . . . . . . . . . . . . . . . . . . . 93
David Flórez Power supplies for the study and efficient use of DBD excimer UV lamps
xii List of Figures
4.3. Two operating conditions before breakdown are plotted in the state plane: Whenthe gas breakdown happens before the peak current (left) and after the peakcurrent (right). Only the positive current half-cycle is shown. . . . . . . . . . . 95
4.4. Two operating conditions are plotted in the state plane after breakdown: Whenthe gas breakdown happens before the peak current (left) and after the peakcurrent (right). Only the positive current cycle is shown. . . . . . . . . . . . . 96
4.5. Transient response from simulation. Unstable state plane for V in > V th (left),stable state plane for V in < V th (right). . . . . . . . . . . . . . . . . . . . . . 98
4.6. Theoretical lamp power as a function of the converter input voltage, calculatedwith (4.1.39) (Vth=1.31 kV, Cg=28 pF, Cd=85 pF). Vink is the limit betweenoperating cases A and B. Vth is the asymptote of the Plp function. . . . . . . . 102
4.7. Converter circuit and DBD electrical model used for simulation . . . . . . . . . 1044.8. Waveforms comparison from simulation (top) and from the experimental valida-
tion (bottom). flp = 80kHz, Vin = 115V . . . . . . . . . . . . . . . . . . . . . 1054.9. Theoretical lamp power as a function of the converter input voltage calculated
with (4.1.39) and simulation results including the transformer parasitic elements(Vth=1.31 kV, Cg=28 pF, Cd=85 pF). . . . . . . . . . . . . . . . . . . . . . . 106
4.10. Experimental electrical waveforms of the lamp, the transformer primary sidevoltage and the inductance current. . . . . . . . . . . . . . . . . . . . . . . . 108
4.11. Theoretical, simulated and experimental lamp power as a function of the con-verter input voltage. The theoretical values are calculated with (4.1.39) (Vth=1.31kV, Cg=28 pF, Cd=85 pF). The schematic used for simulation is presented inFig.4.7 . . . . . . . . . . . . . . . . . . . . . . . . . . . . . . . . . . . . . . 108
4.12. Measured efficiencies of the SRI for different values of output power at flp=80kHz.1094.13. UV waveform and Excilamp current for the SRI. . . . . . . . . . . . . . . . . . 1104.14. FFT of the lamp current for SRI and Square waveform current-source topologies. 111
5.1. Schematics of the DBD supplies under study . . . . . . . . . . . . . . . . . . . 1145.2. Boost-based converter operating sequences (top) with the output current wave-
form (bottom). . . . . . . . . . . . . . . . . . . . . . . . . . . . . . . . . . . 1165.3. State planes for the Boost-based converter in DCM. Before (left) and after (right)
gas breakdown. For two operating cases: When the gas breakdown happensbefore the peak current (A) and after the peak current (B) . . . . . . . . . . . 117
5.4. Power delivered to the lamp by the Boost-based converter for different values ofinductance charge time. . . . . . . . . . . . . . . . . . . . . . . . . . . . . . 118
5.5. Buck-Boost-based converter output current waveform (bottom) with the corre-sponding operating sequences (bottom) . . . . . . . . . . . . . . . . . . . . . 121
5.6. State planes for the Buck-Boost-based converter in DCM. Before (left) and af-ter (right) gas breakdown. For two operating cases: When the gas breakdownhappens before the peak current (A) and after the peak current (B) . . . . . . 122
5.7. Power delivered to the lamp by the Buck-Boost-based converter for differentvalues of inductance charge time. . . . . . . . . . . . . . . . . . . . . . . . . . 123
Power supplies for the study and efficient use of DBD excimer UV lamps David Flórez
List of Figures xiii
5.8. For an operating frequency flp=60 kHz, the inductance charge time, Tch, plusthe lamp current pulse, Tpulse, must be smaller than Tlp/2=8 µs. In this figure,Tch + Tpulse is plotted as function of Vin. . . . . . . . . . . . . . . . . . . . . . 127
5.9. Simulation waveforms of the four topologies. . . . . . . . . . . . . . . . . . . . 1305.10. Experimental waveforms of the four topologies. Plp = 106W , flp = 60kHz . . . 132
David Flórez Power supplies for the study and efficient use of DBD excimer UV lamps

List of Tables
2.1. Equivalent electrical parameters of a XeCl DBD Excilamp . . . . . . . . . 452.2. Comparison of some High-Voltage MOSFET devices specifications (Source:
www.digikey.com) . . . . . . . . . . . . . . . . . . . . . . . . . . . . . . . . 472.3. Transformer materials and construction characteristics . . . . . . . . . . . 512.4. Alternative transformer and converter efficiencies . . . . . . . . . . . . . . 572.5. Converter efficiency for different inverter frequencies, with Vlp=5 kV and
J=250 mA . . . . . . . . . . . . . . . . . . . . . . . . . . . . . . . . . . . 62
3.1. Equivalent lamp parameters and standard deviation obtained from theCharge-Voltage Lissajous figures shown in Fig.3.9 . . . . . . . . . . . . . . 77
3.2. Equivalent lamp parameters and standard deviation obtained from theCharge-Voltage Lissajous figures shown in Fig.3.14. J=250 mA . . . . . . 82
3.3. Point of maximum lamp efficiency within the operating range of the ex-periments . . . . . . . . . . . . . . . . . . . . . . . . . . . . . . . . . . . . 85
4.1. Theoretical operating point . . . . . . . . . . . . . . . . . . . . . . . . . . 103
5.1. Main equations of the four topologies. . . . . . . . . . . . . . . . . . . . . 1255.2. Operating Point for the SRI converter. Vin = 1175V V , L = 25mH . . . . 1265.3. Operating Point for the Boost-based converter. Vin = 850V , L = 28.3mH,
Tch = 4.36 µs . . . . . . . . . . . . . . . . . . . . . . . . . . . . . . . . . . 1285.4. Operating Point for the Buck-Boost-based converter. Vin = 2.4 kV , L =
38.1mH, Tch = 3.32 µs . . . . . . . . . . . . . . . . . . . . . . . . . . . . 1295.5. Operating Point for the Square-shape converter. . . . . . . . . . . . . . . 1295.6. Converters efficiencies comparison. Electrical power supplied to the lamp:
Plp = 106W . . . . . . . . . . . . . . . . . . . . . . . . . . . . . . . . . . . 131

Introduction
As reported by the United Nations “in the year 2011, 768 million people were stillwithout access to improved sources of drinking water while 2.5 billion people did not useimproved sanitation” [0.1]. In the particular case of Colombia, the quality of the drinkingwater provided at the 35% of rural areas does not meet the required standards [0.2] andmost of the superficial water sources are not ready for human consumption [0.3]. Thisharmful situation for many communities, is at the origin of this doctorate work.This thesis is developed in the context of a research project that aims for the design
and implementation of a water disinfection system prototype, based on UV radiationgenerated by a Dielectric Barrier Discharge excimer lamp. This project is supported byCOLCIENCIAS, ICETEX, and the ECOS-NORD program.The Dielectric Barrier Discharge excimer lamps (DBD excilamps) is an emerging and
competitive technology for the efficient production of Ultra-Violet radiation (UV). TheUV has well known germicidal properties and the use of UV in disinfection brings severaladvantages when compared with chemical based methods. The benefits of the DBDexcimer lamps (presented later in this Section) together with the advantages of the UVradiation to decontaminate, have motivated the proposal of a water decontaminationsystem based on this technology.The development of the proposed water decontamination system, implies the con-
currence of diverse areas of knowledge like bacteriology, hydrology, mechanics, plasmascience and electronics. In this doctoral thesis, we are focused in a particular aspect ofthe decontamination system: the challenge of enhancing the performance of the DBDexcilamp as UV source and the development of a high efficiency power supply for thislamp technology. Although, given the context of this research, the DBD UV excilampsis the focus of our interest, it is important to note that the developments proposed inthis thesis can be pertinent for other type of DBD reactors.
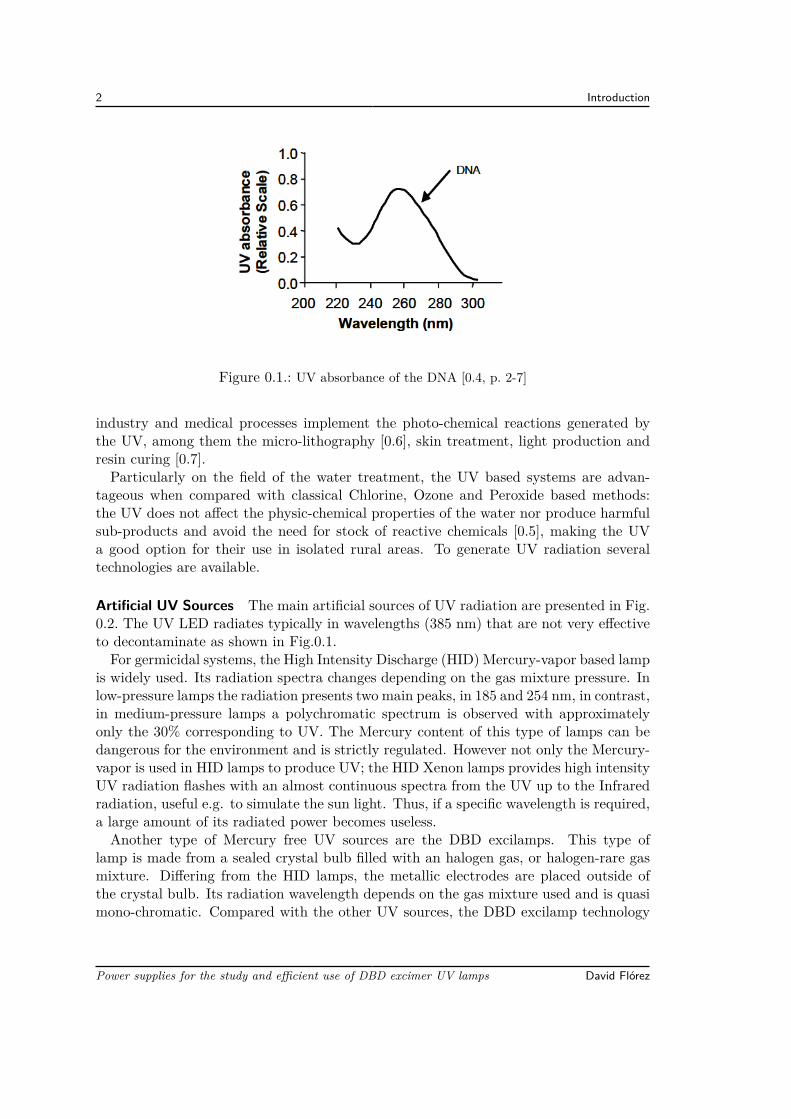
What is the Ultra-Violet (UV) Radiation Useful for? The sun is the only naturalsource of UV radiation found in earth and its UV radiation plays an important rolein natural processes, for example for the human beings synthesis of vitamin D and thenatural control of microorganisms concentrations due to the UV germicidal property.The germicidal property of the UV is caused in part by the damage that the UV radiationcan produce to the cells Nucleic Acids. The DNA absorption at different wavelengths ofUV is shown in Fig.0.1, which gives the radiation wavelengths that causes more damagesto cells.For years the germicidal property of the UV radiation has been exploited in decon-
tamination systems employing artificial UV sources [0.5] and nowadays a wide range of
2 Introduction
Figure 0.1.: UV absorbance of the DNA [0.4, p. 2-7]
industry and medical processes implement the photo-chemical reactions generated bythe UV, among them the micro-lithography [0.6], skin treatment, light production andresin curing [0.7].Particularly on the field of the water treatment, the UV based systems are advan-
tageous when compared with classical Chlorine, Ozone and Peroxide based methods:the UV does not affect the physic-chemical properties of the water nor produce harmfulsub-products and avoid the need for stock of reactive chemicals [0.5], making the UVa good option for their use in isolated rural areas. To generate UV radiation severaltechnologies are available.
Artificial UV Sources The main artificial sources of UV radiation are presented in Fig.0.2. The UV LED radiates typically in wavelengths (385 nm) that are not very effectiveto decontaminate as shown in Fig.0.1.For germicidal systems, the High Intensity Discharge (HID) Mercury-vapor based lamp
is widely used. Its radiation spectra changes depending on the gas mixture pressure. Inlow-pressure lamps the radiation presents two main peaks, in 185 and 254 nm, in contrast,in medium-pressure lamps a polychromatic spectrum is observed with approximatelyonly the 30% corresponding to UV. The Mercury content of this type of lamps can bedangerous for the environment and is strictly regulated. However not only the Mercury-vapor is used in HID lamps to produce UV; the HID Xenon lamps provides high intensityUV radiation flashes with an almost continuous spectra from the UV up to the Infraredradiation, useful e.g. to simulate the sun light. Thus, if a specific wavelength is required,a large amount of its radiated power becomes useless.Another type of Mercury free UV sources are the DBD excilamps. This type of
lamp is made from a sealed crystal bulb filled with an halogen gas, or halogen-rare gasmixture. Differing from the HID lamps, the metallic electrodes are placed outside ofthe crystal bulb. Its radiation wavelength depends on the gas mixture used and is quasimono-chromatic. Compared with the other UV sources, the DBD excilamp technology
Power supplies for the study and efficient use of DBD excimer UV lamps David Flórez
3
Figure 0.2.: Main UV artificial sources. From left to right: LED [0.8], HID Mercury-vaporlamp [0.9], HID Xenon lamp [0.10] and DBD excimer lamp
present special features well adapted for the requirements of several applications. Next,we describe these characteristics.
Main Advantages of the DBD Excilamps Compared with the other UV artificialsources, the DBD excilamp presents the following distinctive features:
• It is mercury free. Consequently can be used in environments where the mercurycontent is hazardous, e.g. in the food and medicament industry.
• The electrodes are not in contact with the gas. Consequently, differing from theconventional discharge lamps, the electrodes are not deteriorated by the discharge.
• Instantaneous ignition. This implies no need for warm up time and immediateavailability.
• Offers a wide radiation surface due to its geometry.
• The radiation wavelength is very precise and depends mainly on the gas compo-sition, which can be selected according to the microorganism to be treated or theparticularities of the application.
The DBD excilamps are nowadays focus of active research and the lamp performancescontinues to be improved. However, many years of research and developments are behindthis technology.
DBD Excilamps Technology Landmarks The origin of the DBD excilamps technologycan be traced back to the first dielectric-barrier discharges investigations (1865) [0.11].Since 1955 earlier reports on the Vacuum UV and UV radiation emission from rare gaseswere published [0.12,0.13,0.14,0.15,0.16,0.17] and an extensive review discussing the for-mation of excimers and its properties dates from 1975 [0.18]. A pioneer work integratingthe excimer UV production and DBD, appears in 1988 [0.19], followed by many originalworks reporting the enhancement of the excilamps efficiency [0.20,0.21] and power [0.22],proposing excilamp models [0.23] and patenting excilamp devices [0.24, 0.25]. Authorsin [0.26] proposed the first experiments with pulsed power supplies enhancing the excil-amp efficiency (previously supplied with sinusoidal voltage generators). Later in [0.27]
David Flórez Power supplies for the study and efficient use of DBD excimer UV lamps
4 Introduction
the current mode power supply for this application, was proposed. One of the first re-ported works of decontamination using UV from DBD excilamps is [0.28], published in2001. The research in excilamps for UV production continues and extensive reviews ofthe excilamps technology and their applications can be found in [0.11, p. 27], [0.12], [0.29]-[0.30].Thanks to this long history of investigations on the DBD, their operating fundamentals
and physical understanding are well known today. Additionally, different types of powersupplies have been evaluated and implemented for many different industrial and medicalapplications. Nevertheless, we have found that there are still possibilities to improve theefficiency and performance of the power supplies for DBD excilamps. Particularly, thefollowing improvement opportunities have been detected.
Improvement Opportunities Nowadays, the mechanisms and phenomena behind theDBD excilamps technology are not totally explained and understood, for example:
• The correlation between the lamp radiative efficiency and the lamp operating pointhas not been clearly established.
• A deeper insight about the impact of the operating conditions (current intensity,operating voltage, frequency, etc.) in the existing excilamp electrical models, isneeded.
• The efficiency of the DBD power supplies can be enhanced through the optimiza-tion of a power supply that assures the power delivered to the lamp and theoperating point, taking into account the DBD excilamp model and the parasiticelements of the system.
If these topics of the excilamps technology are developed:
• More UV could be obtained with less energy, which is particularly important fordecontamination applications because that makes easier the connection to a lowpower renewable source of energy.
• The UV power per lamp unit area could be increased, reducing the size of theDBD excilamp.
• A more fitted lamp equivalent model could be used to design more reliable andefficient power supplies.
• A better understanding of the physic-chemical mechanisms of the excimers couldbe elucidated.
Objectives According to the research project context and based on the ideas exposedbefore concerning the DBD excilamps technology, this doctoral research has been ori-ented to the enhancement of the DBD excilamp performance as UV source, through the
Power supplies for the study and efficient use of DBD excimer UV lamps David Flórez
5
study of the lamp intrinsic performance, the supply-lamp interactions and the develop-ment of a high efficiency power supply for this lamp technology.In this sense, the first objective of this thesis is:
• The development of a power supply adapted to the DBD excimer UV lamp understudy, capable of controlling the lamp power and the operating point by means ofthree degrees of freedom of the lamp current: operating frequency, amplitude andduty cycle.
The subsequent objective is:
• To determine the optimal operating point of the lamp, from the point of viewof the conversion from electrical power to UV radiation power, within the powersupply operating range.
And finally,
• The development, implementation and validation of a power supply to operateat the lamp optimal operating point, and maximizing the supply performance interms of:
– Electrical efficiency.– Coupling to the electrical network or to a renewable source of energy (photo-
voltaic, micro-hydroelectric).
This thesis is organized as follows. In Chapter 1, a literature review of the DBDexcilamps technology is presented. Based on this information, the basic concepts behindthe conception of a DBD power supply are explained, complemented by a general reviewof the power supplies already divulged in the literature.Then, according to the first objective of this thesis, the development and validation of
an innovative power supply that allows the adjustment of the DBD lamp electrical powerwith three Degrees Of Freedom (D.O.F), is presented. Exploiting this new capability oflamp power and operating point adjustment, a parametric study of the operating pointimpact over the lamp UV production is performed (Chapter 3), finding the optimal oper-ating conditions for the lamp under study: On the basis of the parametric study resultsand with the aim of increasing the lamp-supply performance, a converter conceived witha high-efficiency criteria and to work at the optimal lamp operating point, is proposedin Chapter 4.Finally, an analytical and experimental comparison of the proposed supplies and other
high-efficiency topologies, working at the DBD excilamp optimal operating point, ispresented and analyzed.
David Flórez Power supplies for the study and efficient use of DBD excimer UV lamps
Bibliography
[0.1] United Nations, “Drinking water, sanitation & hygiene. statistics, graphs andmaps.” http://www.unwater.org/statistics_san.html, Nov. 2013.
[0.2] Defensoria del Pueblo - Colombia, DIAGNOSTICO DE LA CALIDAD DEL AGUAPARA CONSUMO HUMANO ANO 2010. Defensoria del Pueblo de Colombia, Nov.2011.
[0.3] Instituto de Hidrologia, Meteorologia y Estudios Ambientales, Estudio Nacionaldel Agua 2010. Bogota D.C.: IDEAM, 2010.
[0.4] United States Environmental Protection Agency, ULTRAVIOLET DISINFEC-TION GUIDANCE MANUAL FOR THE FINAL LONG TERM 2 ENHANCEDSURFACE WATER TREATMENT RULE. EPA, Nov. 2006.
[0.5] I. Soloshenko, V. Y. Bazhenov, V. A. Khomich, V. V. Tsiolko, and N. G.Potapchenko, “Comparative research of efficiency of water decontamination by UVradiation of cold hollow cathode discharge plasma versus that of low- and medium-pressure mercury lamps,” IEEE Transactions on Plasma Science, vol. 34, no. 4,pp. 1365–1369, 2006.
[0.6] C. Dorval Dion and J. Tavares, “Photo-initiated chemical vapor deposition as ascalable particle functionalization technology (a practical review),” Powder Tech-nology, vol. 239, pp. 484–491, May 2013.
[0.7] M. Wertheimer, A. Fozza, and A. Holländer, “Industrial processing of polymers bylow-pressure plasmas: the role of VUV radiation,” Nuclear Instruments and Meth-ods in Physics Research Section B: Beam Interactions with Materials and Atoms,vol. 151, pp. 65–75, May 1999.
[0.8] NICHIA CORPORATION, “UV-LED.” http://www.nichia.co.jp/en/product/uvled.html, 2013.
[0.9] OSRAM GmbH, “PURITEC HNS germicidal ultraviolet lamps.”http://www.osram.com/osram_com/products/lamps/specialty-lamps/ultraviolet-lamps/puritec-hns/index.jsp?productId=ZMP_86446.
[0.10] Xenon corporation, “About xenon flashlamps.” http://www.xenoncorp.com/lamps.html, 2013.
Bibliography 7
[0.11] U. Kogelschatz, “Dielectric-barrier discharges: Their history, discharge physics,and industrial applications,” Plasma Chemistry and Plasma Processing, vol. 23,no. 1, pp. 1–46, 2003.
[0.12] M. Lomaev, E. Sosnin, and V. Tarasenko, “Excilamps and their applications,”Progress in Quantum Electronics, vol. 36, pp. 51–97, Jan. 2012.
[0.13] P. G. WILKINSON and Y. TANAKA, “New xenon-light source for the vacuumultraviolet,” Journal of the Optical Society of America, vol. 45, pp. 344–349, May1955.
[0.14] Y. TANAKA, “Continuous emission spectra of rare gases in the vacuum ultravioletregion,” Journal of the Optical Society of America, vol. 45, pp. 710–713, Sept. 1955.
[0.15] B. Stevens and E. Hutton, “Radiative life-time of the pyrene dimer and the possi-ble role of excited dimers in energy transfer processes,” Nature, vol. 186, pp. 1045–1046, June 1960.
[0.16] W. C. Ermler, Y. S. Lee, K. S. Pitzer, and N. W. Winter, “Ab initio effectivecore potentials including relativistic effects. II. potential energy curves for xe2,”The Journal of Chemical Physics, vol. 69, pp. 976–983, Aug. 1978.
[0.17] R. J. DeYoung and W. R. Weaver, “Spectra from nuclear-excited plasmas,” Jour-nal of the Optical Society of America, vol. 70, pp. 500–506, May 1980.
[0.18] J. B. Birks, “Excimers,” Reports on Progress in Physics, vol. 38, p. 903, Aug.1975.
[0.19] B. Eliasson and U. Kogelschatz, “UV excimer radiation from dielectric-barrierdischarges,” Applied Physics B Photophysics and Laser Chemistry, vol. 46, pp. 299–303, Aug. 1988.
[0.20] J.-Y. Zhang and I. W. Boyd, “Efficient excimer ultraviolet sources from a dielectricbarrier discharge in rare-gas/halogen mixtures,” Journal of Applied Physics, vol. 80,no. 2, p. 633, 1996.
[0.21] E. A. Sosnin, M. I. Lomaev, A. N. Panchenko, V. S. Skakun, and V. F. Tarasenko,“Glow and barrier discharge efficient excilamps,” in Proc. SPIE (V. F. Tarasenko,G. V. Mayer, and G. G. Petrash, eds.), vol. 3403, pp. 308–313, June 1998.
[0.22] V. Tarasenko, M. Lomaev, A. Panchenko, V. Skakun, E. Sosnin, and A. Fedenev,“High-energy lasers and high-power excilamps,” in , Summaries of papers presentedat the Conference on Lasers and Electro-Optics, 1996. CLEO ’96, pp. 375–, 1996.
[0.23] B. Eliasson and U. Kogelschatz, “Modeling and applications of silent dischargeplasmas,” IEEE Transactions on Plasma Science, vol. 19, pp. 309–323, Apr. 1991.
David Flórez Power supplies for the study and efficient use of DBD excimer UV lamps
8 Bibliography
[0.24] B. Turner and J. T. Dolan, “Excimer lamp with high pressure fill,” Nov. 1997.U.S. Classification: 313/570; 313/568; 313/571; 313/572; 315/39; 315/246; 315/248;315/344 International Classification: H01J 6112; H01J 6120.
[0.25] Zoran Falkenstein, USHIO America Inc., “Development of an excimer UV lightsource system for water treatment.” http://www.revistavirtualpro.com/files/TIE04_200701.pdf.
[0.26] V. F. Tarasenko, A. V. Krivonosenko, M. I. Lomaev, V. S. Skakun, E. A. Sosnin,and D. V. Shitz, “High-power excilamps with short-pulse duration,” in Proc. SPIE,vol. 4065, pp. 826–835, 2000.
[0.27] R. Diez-Medina, Alimentation de puissance d’une lampe exciplexe à déchargeà barrière diélectrique, en vue du contrôle du rayonnement. PhD thesis, INPT,Toulouse, 2008.
[0.28] A. Laroussi, F. C. Dobbs, Z. Wei, A. Doblin, L. Ball, K. Moreira, F. Dyer, andJ. Richardson, “Effects of excimer UV radiation on microorganisms,” in PulsedPower Plasma Science, 2001. IEEE Conference Record - Abstracts, pp. 321–, 2001.
[0.29] M. I. Lomaev, V. S. Skakun, E. A. Sosnin, V. F. Tarasenko, D. V. Shitts, andM. V. Erofeev, “Excilamps efficient sources of spontaneous UV and VUV radiation,”Physics-Uspekhi, vol. 46, pp. 193–209, Feb. 2003.
[0.30] Thomas Openlander, “Mercury-free sources of VUV/UV radiation: applicationof modern excimer lamps (excilamps) for water and air treatment1,” Journal ofEnvironmental Engineering and Science, vol. 6, pp. 253–264, May 2007.
Power supplies for the study and efficient use of DBD excimer UV lamps David Flórez
1. Literature review
The conception and analysis of power supplies for DBD excilamps, as for any other typeof supply, requires a model of the load. The different DBD excilamp models found inthe literature, are constructed from the theory and phenomena involved in the operationof this lamp technology. Accordingly, first in this Chapter, the DBD UV excilampsoperating theory is described. On the basis of these operating fundamentals, an electricalmodel of the DBD excilamp, necessary for the power supplies design, is selected. Then,using the lamp model as starting point, the power supply characteristics to achieve thecontrol of the lamp power, are determined. On this scope, some excilamp power suppliesproposed prior to this thesis, are studied and finally, some examples of commerciallyavailable DBD excilamp based systems and their typical performances are mentioned.
1.1. DBD Excimer UV lampsThe production of UV radiation in an excimer lamp is explained from the mechanismsinvolved in the creation of excited unstable molecules called excited dimmers (excimers)or excited complex (exciplexes); to simplify the terms we will refer to both of themas excimers. These excimers are created by means of an electric discharge that canbe generated by different means. One of the techniques to produce this discharge isthe Dielectric Barrier Discharge (DBD). In particular, the DBD is well adapted for theexcitation of an excilamp because it benefits the homogeneity of the discharges andconsequently produces a more uniform radiation along the lamp surface.Therefore, two main phenomena involved in the DBD excilamp operation can be high-
lighted: The production of a Dielectric Barrier Discharge and the creation of excimers.Accordingly, in this Section first the mechanisms involved in the operation of a DBDand its role on the UV production, are described. Then, using some results from pre-vious works, the influence of the power supply in the UV radiation of an excimer lampis explained. On the basis of this theory, the modeling of DBD excilamps is introducedand an electrical model of the lamp, suitable for the power supplies design, is selected.
1.1.1. Operating Principle
A DBD is produced when an electric discharge occurs between two electrodes whichare separated at least with one dielectric layer, as shown in Fig.1.1. The DBD creationis initiated by an avalanche of electrons, produced by an electric field applied betweenthe lamp electrodes (1.2-A). After [1.1], following the avalanche, occurs the transitionto a self-sustained current, which flows through the “channel” formed by the ionized
10 1. Literature review
Figure 1.1.: Structure of a DBD lamp with planar geometry
gas (weakly ionized plasma), this conduction channel is known as a streamer (1.2-B).When the streamer connects both dielectric layers, the difference of potential is locallycompensated by a region of high electrical density which electric field is close to zero,and the streamer is self-extinguished.Several micro-discharges as the one described before occur along the dielectric surface
in a non-uniform distribution and at different instants of time. The spatial distribution ofthe streamers across the lamp is influenced mainly by the micro-discharge interactionsfrom one streamer to another. This distribution can be studied using a probabilityfunction that uses “memor” property in the streamers creation and with the VoronoiPolyhedron approach [1.2, p. 40].Some of the properties that describe a micro-discharge are: the streamer filament
diameter, electron density, propagation time, lifetime, peak current, the current densityand charge remnant, among others. At atmospheric pressure, these micro-dischargeshave lifetimes in the order of nanoseconds, current densities around 100 A/cm2 withdiameters of about 100 µm [1.1, p. 443].According to the plasma-physics theory, those properties are determined by the gas
composition, the gas pressure and the electrodes configuration. However, the powersupply also has an impact in the characteristics of the discharge. Some of the effects of
E
+ -
Elocal
++++e-
E
+-
Elocal
++++
remnant
e-
E
+ -e-
Electrode Electrode
Dielectric
A B C
Figure 1.2.: Illustration of the electrons (e−) avalanche and the produced local electric fieldElocal. Once the direction of the external electric field has changed, the local fieldremnant helps to the production of the next streamer.
Power supplies for the study and efficient use of DBD excimer UV lamps David Flórez
1.1. DBD Excimer UV lamps 11
increasing the power supplied to the DBD are the production of more micro-dischargesper unit time [1.2, p. 30–49] and the change in the discharge regime. The establishmentof an homogeneous instead of a filamentary discharge, has been achieved thanks to theuse of special electrodes and power supply operating conditions [1.3].
UV Production The DBD is produced in a volume containing a gas. The collisionsof the emitted electrons with the gas atoms (or molecules) produce the atom transitionfrom a ground state to an excited electronic state (ions). The gas atoms or moleculescontained in a DBD excilamp are associated among them only in the excited state ofenergy. When this association is produced, a new excited specie is created.If this gas is composed by only one element, the created specie is called an excited
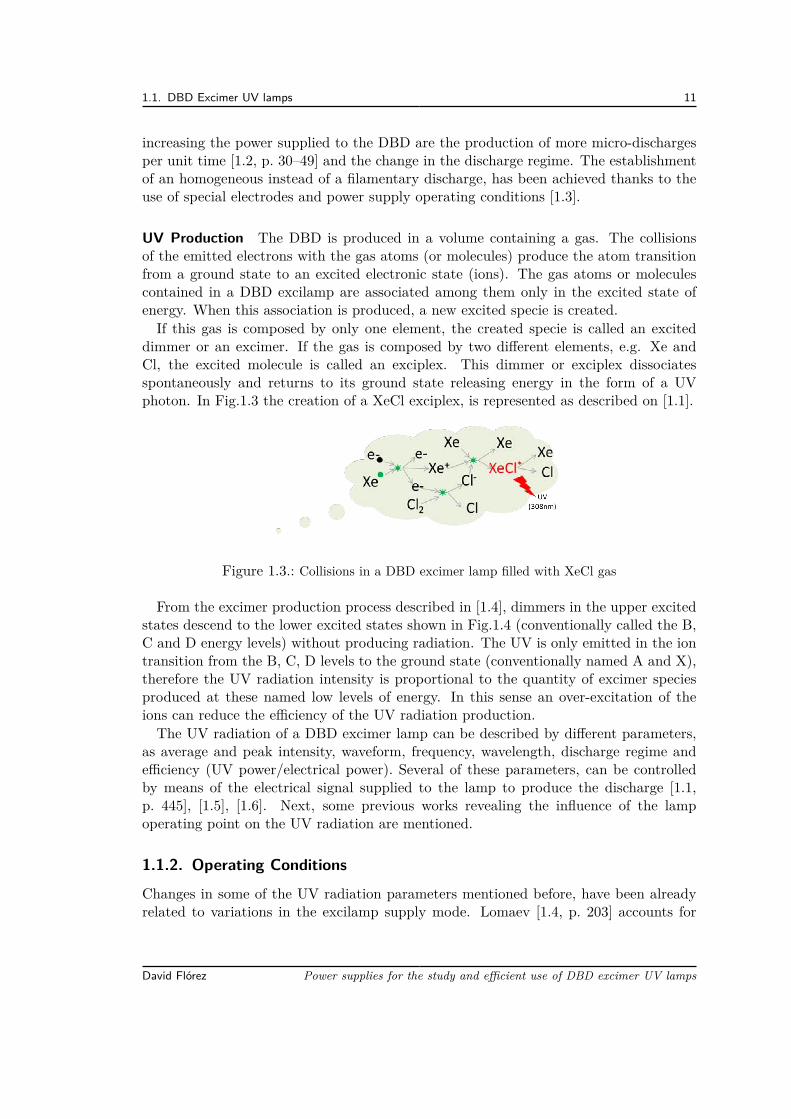
dimmer or an excimer. If the gas is composed by two different elements, e.g. Xe andCl, the excited molecule is called an exciplex. This dimmer or exciplex dissociatesspontaneously and returns to its ground state releasing energy in the form of a UVphoton. In Fig.1.3 the creation of a XeCl exciplex, is represented as described on [1.1].
Figure 1.3.: Collisions in a DBD excimer lamp filled with XeCl gas
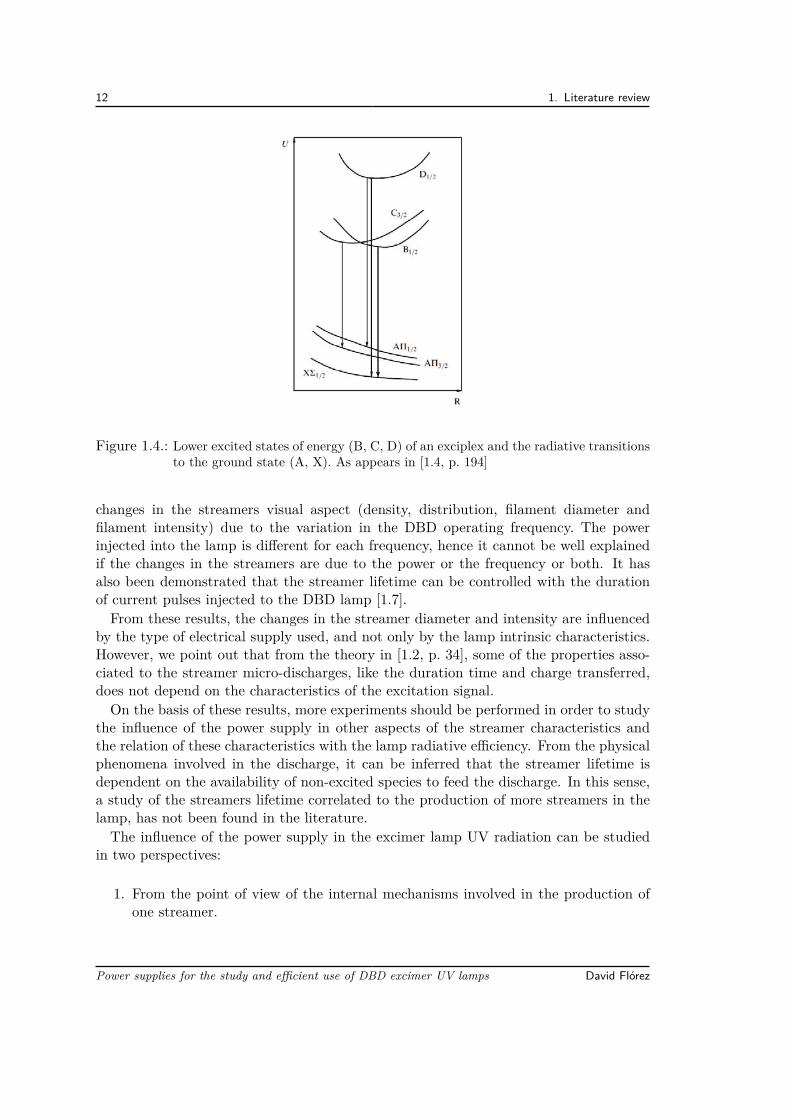
From the excimer production process described in [1.4], dimmers in the upper excitedstates descend to the lower excited states shown in Fig.1.4 (conventionally called the B,C and D energy levels) without producing radiation. The UV is only emitted in the iontransition from the B, C, D levels to the ground state (conventionally named A and X),therefore the UV radiation intensity is proportional to the quantity of excimer speciesproduced at these named low levels of energy. In this sense an over-excitation of theions can reduce the efficiency of the UV radiation production.The UV radiation of a DBD excimer lamp can be described by different parameters,
as average and peak intensity, waveform, frequency, wavelength, discharge regime andefficiency (UV power/electrical power). Several of these parameters, can be controlledby means of the electrical signal supplied to the lamp to produce the discharge [1.1,p. 445], [1.5], [1.6]. Next, some previous works revealing the influence of the lampoperating point on the UV radiation are mentioned.
1.1.2. Operating ConditionsChanges in some of the UV radiation parameters mentioned before, have been alreadyrelated to variations in the excilamp supply mode. Lomaev [1.4, p. 203] accounts for
David Flórez Power supplies for the study and efficient use of DBD excimer UV lamps
12 1. Literature review
Figure 1.4.: Lower excited states of energy (B, C, D) of an exciplex and the radiative transitionsto the ground state (A, X). As appears in [1.4, p. 194]
changes in the streamers visual aspect (density, distribution, filament diameter andfilament intensity) due to the variation in the DBD operating frequency. The powerinjected into the lamp is different for each frequency, hence it cannot be well explainedif the changes in the streamers are due to the power or the frequency or both. It hasalso been demonstrated that the streamer lifetime can be controlled with the durationof current pulses injected to the DBD lamp [1.7].From these results, the changes in the streamer diameter and intensity are influenced
by the type of electrical supply used, and not only by the lamp intrinsic characteristics.However, we point out that from the theory in [1.2, p. 34], some of the properties asso-ciated to the streamer micro-discharges, like the duration time and charge transferred,does not depend on the characteristics of the excitation signal.On the basis of these results, more experiments should be performed in order to study
the influence of the power supply in other aspects of the streamer characteristics andthe relation of these characteristics with the lamp radiative efficiency. From the physicalphenomena involved in the discharge, it can be inferred that the streamer lifetime isdependent on the availability of non-excited species to feed the discharge. In this sense,a study of the streamers lifetime correlated to the production of more streamers in thelamp, has not been found in the literature.The influence of the power supply in the excimer lamp UV radiation can be studied
in two perspectives:
1. From the point of view of the internal mechanisms involved in the production ofone streamer.
Power supplies for the study and efficient use of DBD excimer UV lamps David Flórez
1.1. DBD Excimer UV lamps 13
2. And from the production of all the excimers in the whole ensemble of the lamp.
Production of one streamer From the point of view of a single streamer there ex-ists two main phases: the current propagation and the dissipation [1.2]. The currentpropagation and the related avalanche of excimers production occurs when the criticalgas voltage Vth is reached, in consequence, the faster Vth is reached the faster the UVradiation starts. Given the capacitive behavior of the lamp, the time to produce thegas breakdown can be controlled by means of injecting a controlled current into the gascapacitance. As higher this current, shorter is the necessary time to produce the gasbreakdown.From the DBD theory in [1.2], after the streamer occurs, its lifetime, dissipation time,
among other properties, are inherent to the gas composition, pressure and electrodesconfiguration. To produce a second streamer in the same place without inverting thepolarity of the external electric field, requires more energy that the one necessary toproduce the precedent streamer, due to the remnant local electric field. Hence, if morecharges are transferred in the same direction to the dielectric, is more probable to producea new streamer in another place. Additionally, as exposed in [1.4], exciting the gas speciesto the upper energy levels will not produce additional UV radiation, in consequence itshould be more UV-efficient to stop the supply immediately after the streamer dies-outand to wait until the ionized channel dissipates to invert the voltage and produce a newstreamer in the opposite direction.
The lamp ensemble From the point of view of the whole lamp, each streamer alongthe lamp surface starts at a different instant of time and influences the production ofother streamers by means of the micro-discharge interactions.The quantity of streamers per unit time depends on the electrical power injected
into the gas [1.2, p. 34]. Given a streamer diameter and current density that dependsmainly on the gas properties, it could be possible to calculate how much charge mustbe transferred to the dielectric in a single pulse of current to produce the necessarystreamer quantity that fills the lamp area. Taking into account the streamer lifetimeand the relaxation time of electrons (e.g. in the order of 40 ns at atmospheric pressure)and of ions (in the order of few µs) an approximation of the optimal frequency of thecurrent could be calculated. For example, from the DBD streamer parameters reportedin [1.2, p. 33], with a streamer diameter about 200 µm and a current density of 0.1A/cm2
per streamer, to fill a 10x10 cm surface area of a dielectric barrier, 50 streamers shouldbe necessary, which corresponds to 315 mA of total conducted current. Suppose that thedrifting ions remain in the discharge gap for 10 µs, in this case an excitation repetitionrate of 100 kHz allows the ions to dissipate from the discharge volume.However, in contrast to the fixed streamer lifetime predicted by the theory, authors
in [1.7,1.8] have clearly established a tight correlation between the current pulse durationand the discharge streamer existence. Also, the temporal response of the UV radiationproduced by the streamer is governed by the current pulse span.
David Flórez Power supplies for the study and efficient use of DBD excimer UV lamps
14 1. Literature review
Now that the operating principle of the DBD excilamps has been explained, the elec-trical modeling of the lamp is reviewed with the aim to establish a useful model toconceive and design its power supply.
1.1.3. Modeling
Different approximations have been already used to develop DBD excilamp models;DBD reactors models oriented to a spatio-temporal description of the plasma, are con-structed on the basis of the dynamic of particles and the Maxwell’s equations. Thosephysics-based models are useful for accurate simulation of the discharge creation anddistributions [1.9]. The DBD behavior can be described by a set of partial differentialequations used for finite element models [1.10], [1.11] and in the estimation of the ex-cilamps UV output [1.12]. Equivalent electrical models, developed on the basis of thedifferential equations representation, have been built, providing fast identification andvalidation of the equivalent parameters [1.13,1.14], [1.15, p. 22].
Cg
Cd+vlp
-
Dielectriccapacitance
Gas capacitance
ilp Gas conductance
+vCg__
+vCd__
i
-Vth
Vthv
G
Figure 1.5.: Electrical model of the DBD lamp
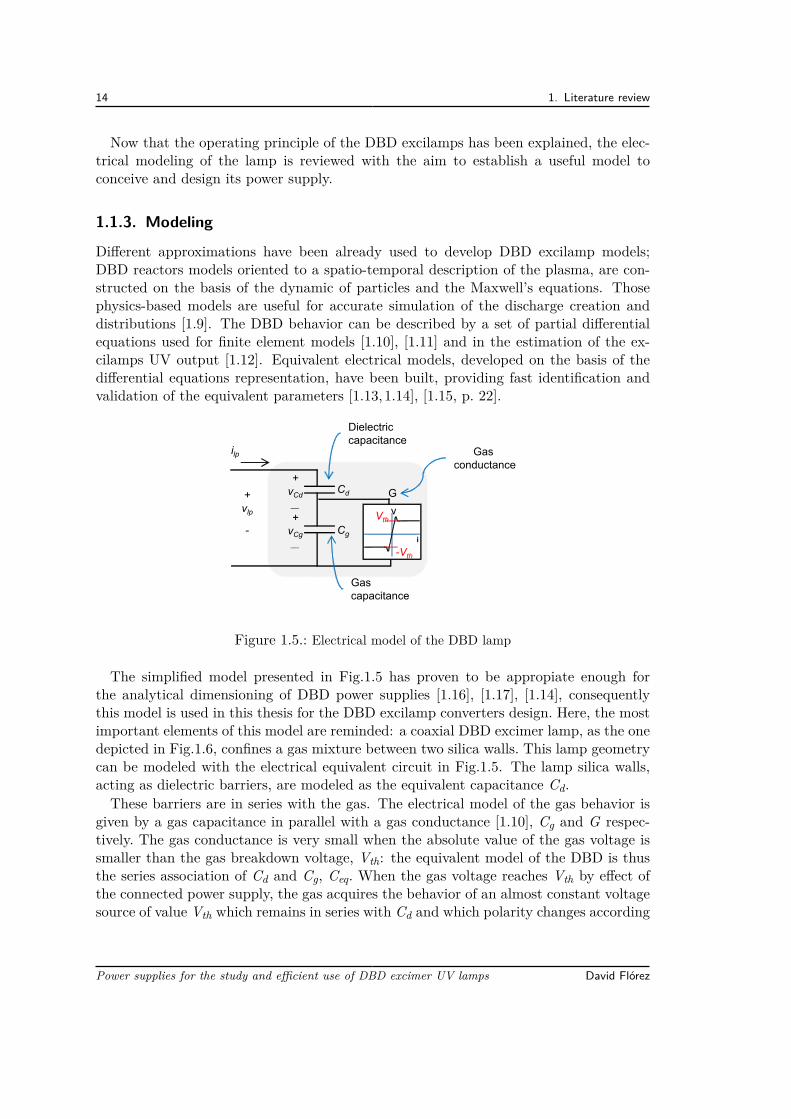
The simplified model presented in Fig.1.5 has proven to be appropiate enough forthe analytical dimensioning of DBD power supplies [1.16], [1.17], [1.14], consequentlythis model is used in this thesis for the DBD excilamp converters design. Here, the mostimportant elements of this model are reminded: a coaxial DBD excimer lamp, as the onedepicted in Fig.1.6, confines a gas mixture between two silica walls. This lamp geometrycan be modeled with the electrical equivalent circuit in Fig.1.5. The lamp silica walls,acting as dielectric barriers, are modeled as the equivalent capacitance Cd.These barriers are in series with the gas. The electrical model of the gas behavior is
given by a gas capacitance in parallel with a gas conductance [1.10], Cg and G respec-tively. The gas conductance is very small when the absolute value of the gas voltage issmaller than the gas breakdown voltage, Vth: the equivalent model of the DBD is thusthe series association of Cd and Cg, Ceq. When the gas voltage reaches Vth by effect ofthe connected power supply, the gas acquires the behavior of an almost constant voltagesource of value Vth which remains in series with Cd and which polarity changes according
Power supplies for the study and efficient use of DBD excimer UV lamps David Flórez
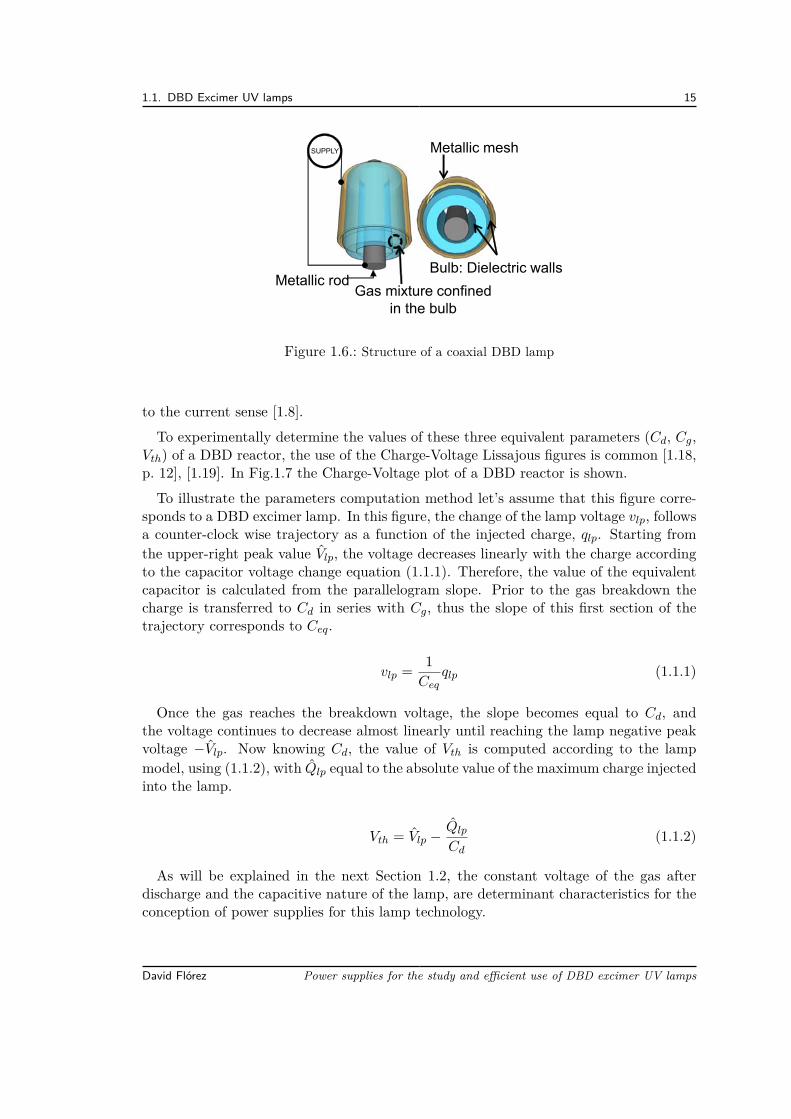
1.1. DBD Excimer UV lamps 15
Metallic mesh
Metallic rodBulb: Dielectric walls
SUPPLY
Gas mixture confinedin the bulb
Figure 1.6.: Structure of a coaxial DBD lamp
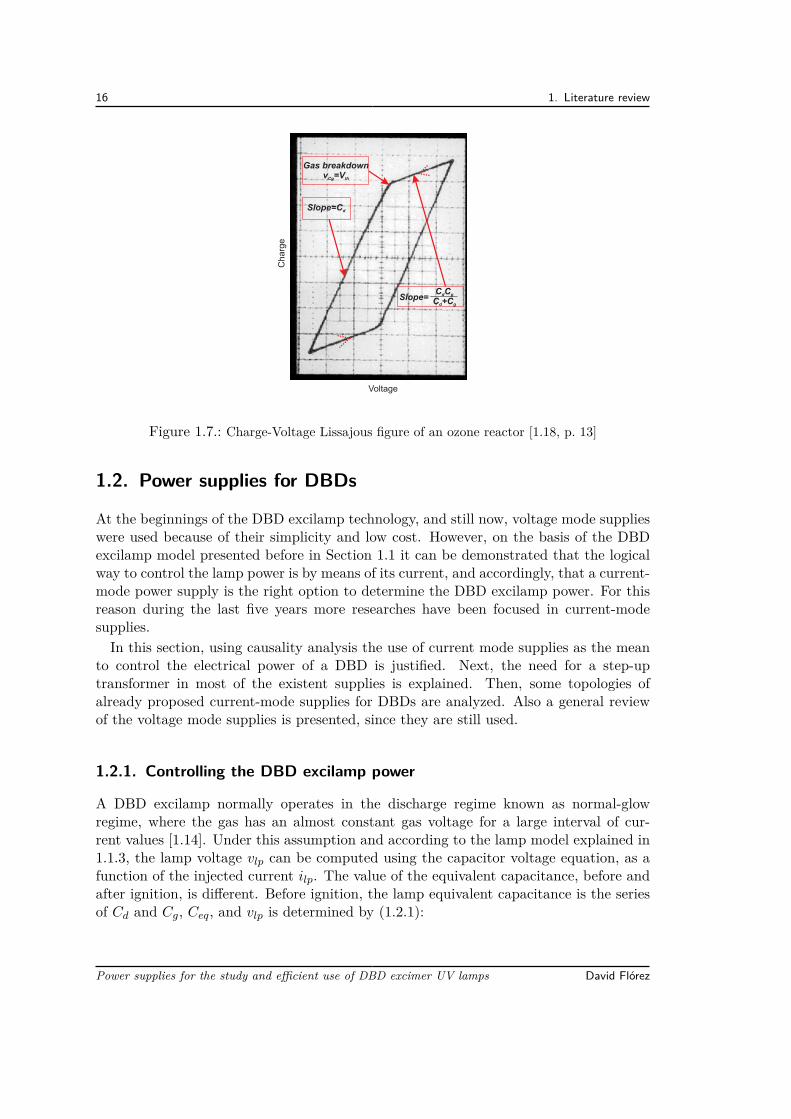
to the current sense [1.8].To experimentally determine the values of these three equivalent parameters (Cd, Cg,
Vth) of a DBD reactor, the use of the Charge-Voltage Lissajous figures is common [1.18,p. 12], [1.19]. In Fig.1.7 the Charge-Voltage plot of a DBD reactor is shown.To illustrate the parameters computation method let’s assume that this figure corre-
sponds to a DBD excimer lamp. In this figure, the change of the lamp voltage vlp, followsa counter-clock wise trajectory as a function of the injected charge, qlp. Starting fromthe upper-right peak value Vlp, the voltage decreases linearly with the charge accordingto the capacitor voltage change equation (1.1.1). Therefore, the value of the equivalentcapacitor is calculated from the parallelogram slope. Prior to the gas breakdown thecharge is transferred to Cd in series with Cg, thus the slope of this first section of thetrajectory corresponds to Ceq.
vlp = 1Ceq
qlp (1.1.1)
Once the gas reaches the breakdown voltage, the slope becomes equal to Cd, andthe voltage continues to decrease almost linearly until reaching the lamp negative peakvoltage −Vlp. Now knowing Cd, the value of Vth is computed according to the lampmodel, using (1.1.2), with Qlp equal to the absolute value of the maximum charge injectedinto the lamp.
Vth = Vlp −Qlp
Cd(1.1.2)
As will be explained in the next Section 1.2, the constant voltage of the gas afterdischarge and the capacitive nature of the lamp, are determinant characteristics for theconception of power supplies for this lamp technology.
David Flórez Power supplies for the study and efficient use of DBD excimer UV lamps
16 1. Literature review
Voltage
Charge
Slope=
Gas breakdownv =VCg th
Slope=Cd
C Cd g
C +Cd g
Figure 1.7.: Charge-Voltage Lissajous figure of an ozone reactor [1.18, p. 13]
1.2. Power supplies for DBDs
At the beginnings of the DBD excilamp technology, and still now, voltage mode supplieswere used because of their simplicity and low cost. However, on the basis of the DBDexcilamp model presented before in Section 1.1 it can be demonstrated that the logicalway to control the lamp power is by means of its current, and accordingly, that a current-mode power supply is the right option to determine the DBD excilamp power. For thisreason during the last five years more researches have been focused in current-modesupplies.In this section, using causality analysis the use of current mode supplies as the mean
to control the electrical power of a DBD is justified. Next, the need for a step-uptransformer in most of the existent supplies is explained. Then, some topologies ofalready proposed current-mode supplies for DBDs are analyzed. Also a general reviewof the voltage mode supplies is presented, since they are still used.
1.2.1. Controlling the DBD excilamp power
A DBD excilamp normally operates in the discharge regime known as normal-glowregime, where the gas has an almost constant gas voltage for a large interval of cur-rent values [1.14]. Under this assumption and according to the lamp model explained in1.1.3, the lamp voltage vlp can be computed using the capacitor voltage equation, as afunction of the injected current ilp. The value of the equivalent capacitance, before andafter ignition, is different. Before ignition, the lamp equivalent capacitance is the seriesof Cd and Cg, Ceq, and vlp is determined by (1.2.1):
Power supplies for the study and efficient use of DBD excimer UV lamps David Flórez
1.2. Power supplies for DBDs 17
vlp(t < tbr) = vlp(to) + 1Cg
∫ t
to
ilp(τ) dτ + 1Cd
∫ t
to
ilp(τ) dτ = vlp(to) + 1Ceq
∫ t
to
ilp(τ) dτ
(1.2.1)With tbr equal to the time instant at which the gas voltage reaches Vth due to ilp,
producing the gas breakdown.
Cg
Cd+vlp
-
ilp
i
-Vth
Vthv
+vCg__
+vCd__
Cg
Cd+vlp
-
ilp
i
-Vth
Vthv
+vCg__
+vCd__
G G
Figure 1.8.: Lamp current path before (left) and after (right) gas breakdown
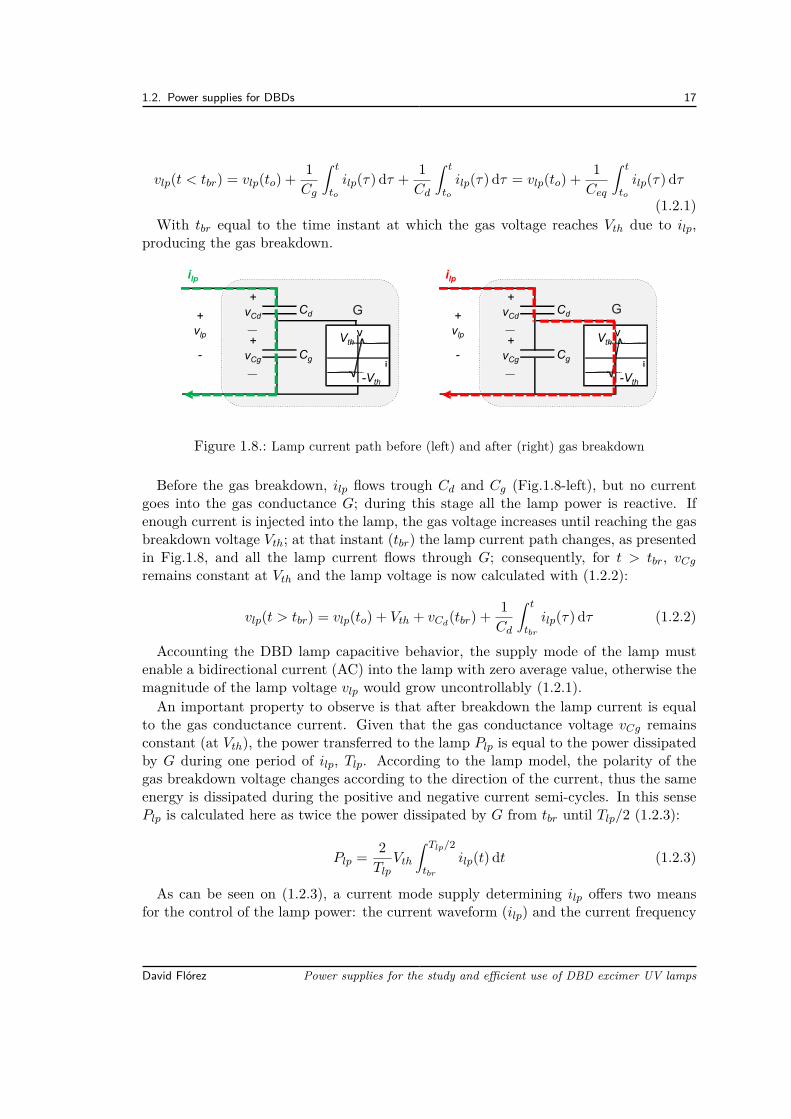
Before the gas breakdown, ilp flows trough Cd and Cg (Fig.1.8-left), but no currentgoes into the gas conductance G; during this stage all the lamp power is reactive. Ifenough current is injected into the lamp, the gas voltage increases until reaching the gasbreakdown voltage Vth; at that instant (tbr) the lamp current path changes, as presentedin Fig.1.8, and all the lamp current flows through G; consequently, for t > tbr, vCg
remains constant at Vth and the lamp voltage is now calculated with (1.2.2):
vlp(t > tbr) = vlp(to) + Vth + vCd(tbr) + 1
Cd
∫ t
tbr
ilp(τ) dτ (1.2.2)
Accounting the DBD lamp capacitive behavior, the supply mode of the lamp mustenable a bidirectional current (AC) into the lamp with zero average value, otherwise themagnitude of the lamp voltage vlp would grow uncontrollably (1.2.1).An important property to observe is that after breakdown the lamp current is equal
to the gas conductance current. Given that the gas conductance voltage vCg remainsconstant (at Vth), the power transferred to the lamp Plp is equal to the power dissipatedby G during one period of ilp, Tlp. According to the lamp model, the polarity of thegas breakdown voltage changes according to the direction of the current, thus the sameenergy is dissipated during the positive and negative current semi-cycles. In this sensePlp is calculated here as twice the power dissipated by G from tbr until Tlp/2 (1.2.3):
Plp = 2Tlp
Vth
∫ Tlp/2
tbr
ilp(t) dt (1.2.3)
As can be seen on (1.2.3), a current mode supply determining ilp offers two meansfor the control of the lamp power: the current waveform (ilp) and the current frequency
David Flórez Power supplies for the study and efficient use of DBD excimer UV lamps
18 1. Literature review
(1/Tlp). This property leads to the choice of a current-mode power supply to assure thecontrol of the power injected into the lamp. This fact has been validated experimentally,using a current-mode semi-resonant converter [1.6, 1.7].Additionally, another interesting property of the DBD power, demonstrated by T.C.
Manley [1.19], is that the DBD reactor power depends on the reactor peak voltage (Vlp)and not on the voltage waveform [1.18, p. 11]. In his work, Manley has found a DBDpower formula which is expressed here in function of the DBD lamp parameters (1.2.4).
Plp = 4flpVthCd
(Vlp −
VthCg
Ceq
)(1.2.4)
In this formula the lamp power depends on the three parameters of the DBDmodel, thelamp voltage frequency (flp) and the lamp peak voltage (Vlp). However, it is importantto note that the fact that Plp depends on Vlp do not means that by using a voltagesource, the DBD reactor voltage can be easily controlled. When using a current-modesupply, Vlp is calculated according to (1.2.1) and (1.2.2).The Manley’s equation is useful for the power supply dimensioning. It allows to
compute for example the lamp peak voltage for a given lamp power and operatingfrequency and accordingly to determine the DBD supply operating voltage.Now that the lamp power control by means of the lamp current has been demon-
strated, next some current mode DBD power supplies already found in the literature arepresented.
1.2.2. Current Mode Supplies for DBDsAs explained in the precedent Section 1.2.1, to precisely determine the DBD power,the control of its current is necessary, an this current must be alternating with zeroaverage value to avoid uncontrolled growing of the lamp voltage and damage in theconverter. The control of the DBDs current has been already achieved with differentapproaches. For a better understanding of these topologies, first is explained why astep-up transformer is incorporated in most of the already proposed DBD supplies andthen some of these current mode converters are described.
The need for a transformer
For a proper operation of the supply, a zero average value of the lamp current is notenough; the maximum lamp voltage must be determined. From the Manley’s equation,the lamp peak voltage is function of the desired lamp power and the lamp equivalentparameters. Typically in DBD excilamps Cg is smaller than Cd and are in the order ofpF, Vth is of some kV and the operating frequency is about tens to hundreds of kHz.Accordingly, for lamp powers in the order of some tens of Watts, Vlp values up to 10kVare commonly found.This level of Vlp is hardly tolerated by currently available high speed switches. One
of the most cost-effective ways to reduce the voltage in the electronic devices of the
Power supplies for the study and efficient use of DBD excimer UV lamps David Flórez
1.2. Power supplies for DBDs 19
converter, is by connecting a step-up transformer between the supply and the DBDlamp.The main drawback of using the step-up transformer, is the impact of its parasitic
elements on the supply; they affect the efficiency and are also a source of limitations onthe lamp operating range [1.17, Chap.3]. In Section 2.3.3, the impact of the transformerparasitic elements on the supply operation is studied in detail.Despite the transformer use implications, in most of the power supplies for DBDs
already proposed a step-up high voltage transformer is found. What is more, the trans-former parasitic elements such as the magnetizing inductance are used in some DBDsupplies as part of the converter design. With descriptive purposes the step-up trans-former is not always included in the schematics of the converters explained next.
Proposed Converters
Some of the first proposed current-mode supplies for DBD excilamps are found in [1.20,1.21]. Their operating principle is the use of an inductance (that shapes the current)and the equivalent capacitance of the DBD, to produce a resonant circuit. The maincharacteristic of these converters is the use of Discontinuous Conduction Mode (DCM).Thanks to this operating mode, the DBD lamp current all along the converter operatingsequence is determined analytically and on this basis the power injected into the DBDis predicted.To employ a resonant converter as a power supply for the DBD lamp has sense because
this type of converter profits the capacitive nature of the DBD load, and also can providean inherent current source behavior, while reducing the switching losses in the powersemiconductors. This feature is especially important in this application due to the highoperating frequencies of the DBDs (tens to hundreds of kHz).One of the proposals found in [1.21] is a Boost-based resonant converter topology.
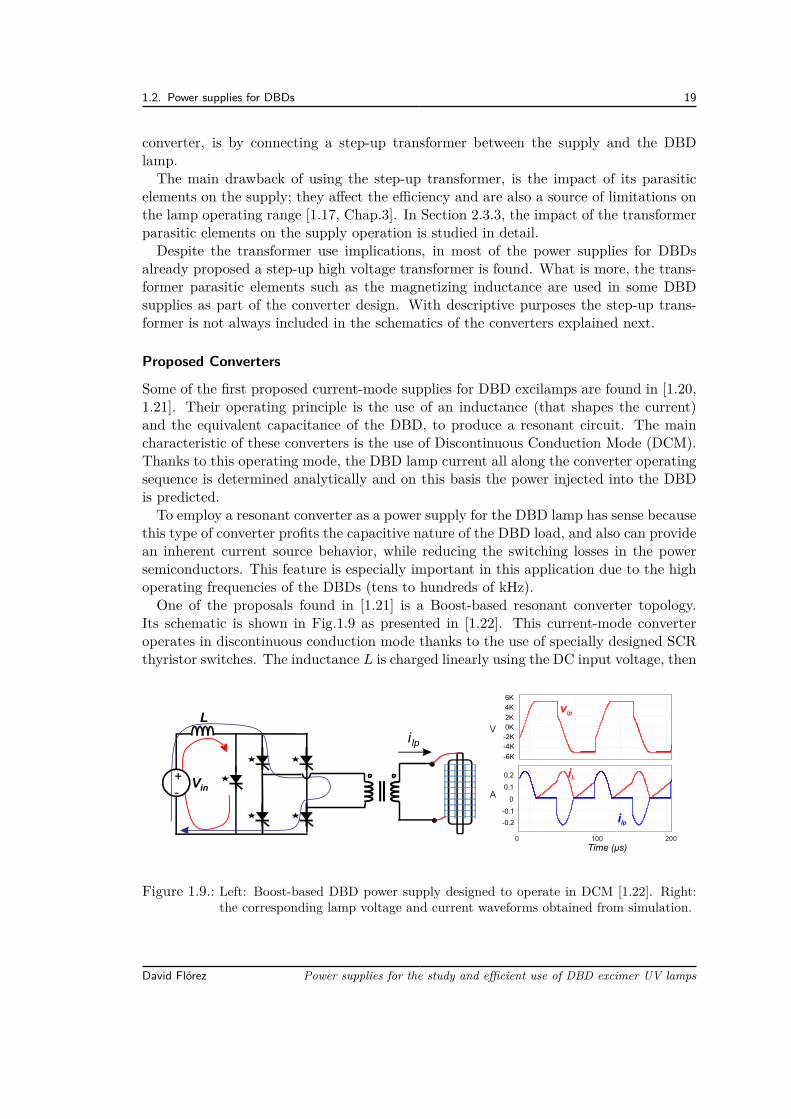
Its schematic is shown in Fig.1.9 as presented in [1.22]. This current-mode converteroperates in discontinuous conduction mode thanks to the use of specially designed SCRthyristor switches. The inductance L is charged linearly using the DC input voltage, then
Vin
L
+-
i lp
iL
ilp
vlp
0K
-2K
-4K
-6K
2K
4K
6K
0
-0.1
-0.2
0.1
0.2
V
A
Time (μs)0 100 200
Figure 1.9.: Left: Boost-based DBD power supply designed to operate in DCM [1.22]. Right:the corresponding lamp voltage and current waveforms obtained from simulation.
David Flórez Power supplies for the study and efficient use of DBD excimer UV lamps
20 1. Literature review
when the desired value of current is reached, the inductance in series with the voltagesource are connected to the DBD lamp, starting the resonance and the current injectioninto the lamp. The resonance finishes when the current is equal to zero thanks to thethyristor-like switches. For the next half cycle the other bridge diagonal is turned-on,injecting a negative current pulse into the DBD and a symmetrical bipolar voltage in theDBD is obtained as shown in 1.9-right. In this converter the DBD lamp power can becontrolled by means of the DC input voltage, the charge time of the inductance and/orby the bridge switching frequency.Another Boost-based power supply for DBD, shown in Fig.1.10-left, has been proposed
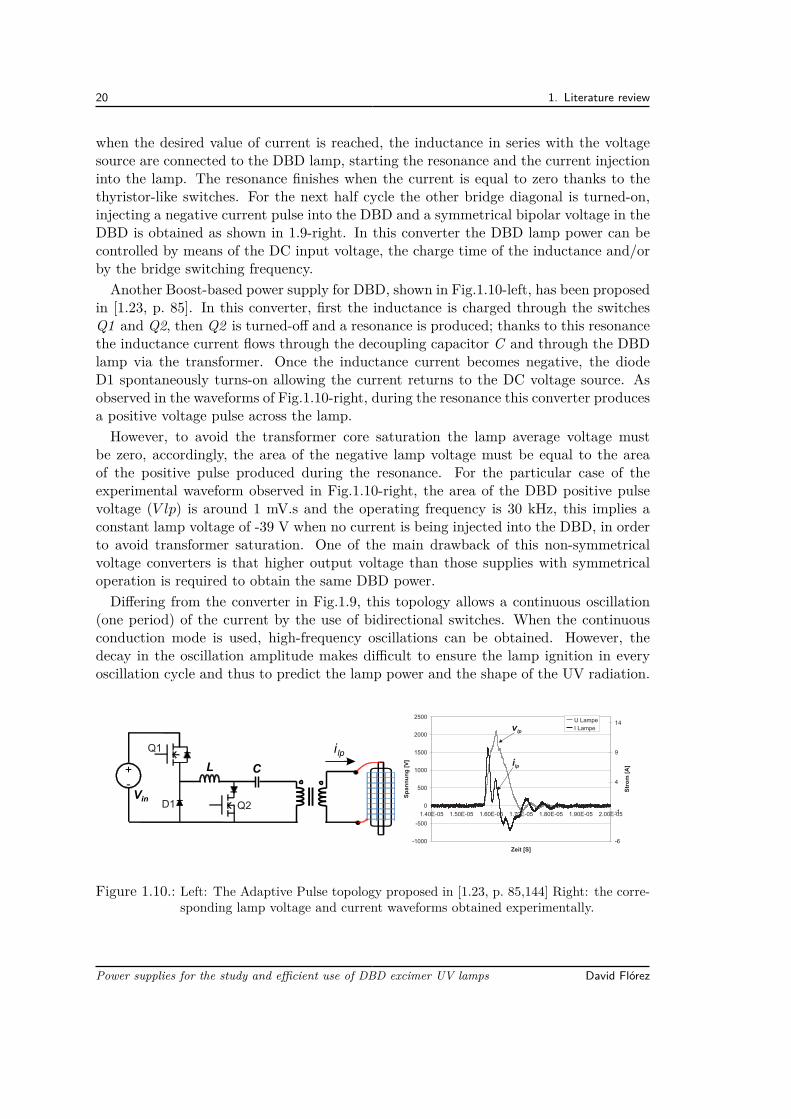
in [1.23, p. 85]. In this converter, first the inductance is charged through the switchesQ1 and Q2, then Q2 is turned-off and a resonance is produced; thanks to this resonancethe inductance current flows through the decoupling capacitor C and through the DBDlamp via the transformer. Once the inductance current becomes negative, the diodeD1 spontaneously turns-on allowing the current returns to the DC voltage source. Asobserved in the waveforms of Fig.1.10-right, during the resonance this converter producesa positive voltage pulse across the lamp.However, to avoid the transformer core saturation the lamp average voltage must
be zero, accordingly, the area of the negative lamp voltage must be equal to the areaof the positive pulse produced during the resonance. For the particular case of theexperimental waveform observed in Fig.1.10-right, the area of the DBD positive pulsevoltage (V lp) is around 1 mV.s and the operating frequency is 30 kHz, this implies aconstant lamp voltage of -39 V when no current is being injected into the DBD, in orderto avoid transformer saturation. One of the main drawback of this non-symmetricalvoltage converters is that higher output voltage than those supplies with symmetricaloperation is required to obtain the same DBD power.Differing from the converter in Fig.1.9, this topology allows a continuous oscillation
(one period) of the current by the use of bidirectional switches. When the continuousconduction mode is used, high-frequency oscillations can be obtained. However, thedecay in the oscillation amplitude makes difficult to ensure the lamp ignition in everyoscillation cycle and thus to predict the lamp power and the shape of the UV radiation.
ilp
vlp
Vin
L+-
C
i lpQ1
Q2D1
Figure 1.10.: Left: The Adaptive Pulse topology proposed in [1.23, p. 85,144] Right: the corre-sponding lamp voltage and current waveforms obtained experimentally.
Power supplies for the study and efficient use of DBD excimer UV lamps David Flórez
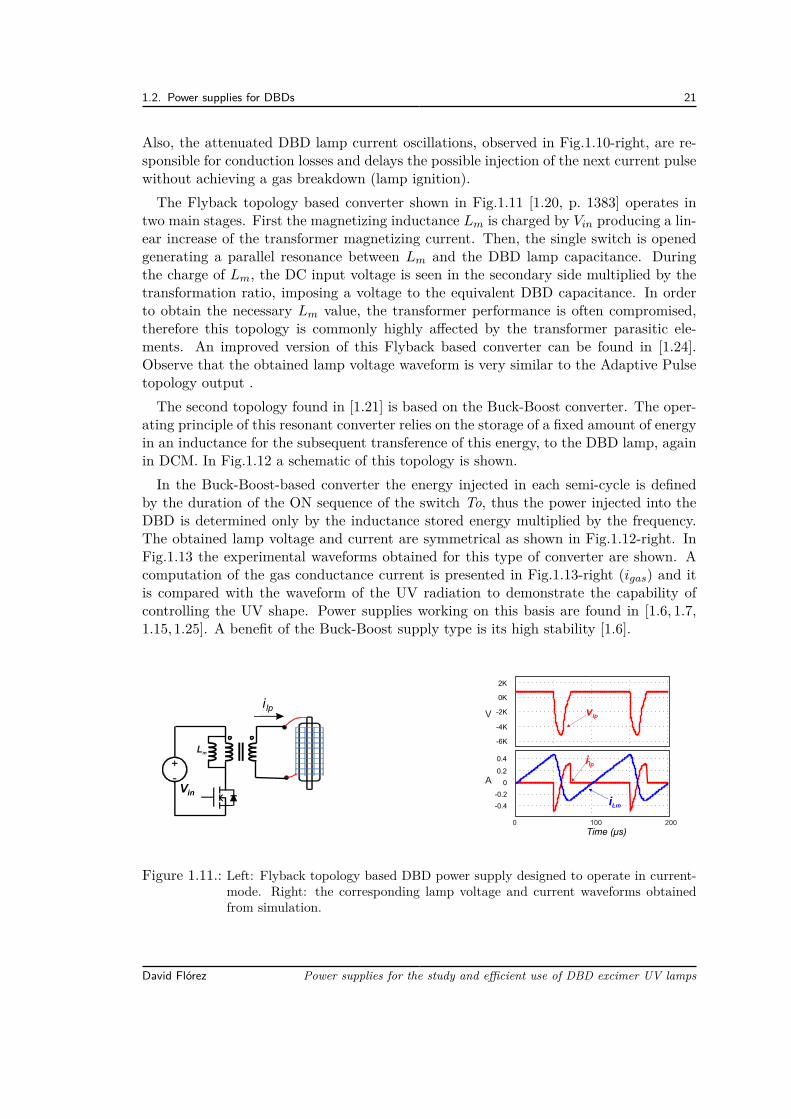
1.2. Power supplies for DBDs 21
Also, the attenuated DBD lamp current oscillations, observed in Fig.1.10-right, are re-sponsible for conduction losses and delays the possible injection of the next current pulsewithout achieving a gas breakdown (lamp ignition).The Flyback topology based converter shown in Fig.1.11 [1.20, p. 1383] operates in
two main stages. First the magnetizing inductance Lm is charged by Vin producing a lin-ear increase of the transformer magnetizing current. Then, the single switch is openedgenerating a parallel resonance between Lm and the DBD lamp capacitance. Duringthe charge of Lm, the DC input voltage is seen in the secondary side multiplied by thetransformation ratio, imposing a voltage to the equivalent DBD capacitance. In orderto obtain the necessary Lm value, the transformer performance is often compromised,therefore this topology is commonly highly affected by the transformer parasitic ele-ments. An improved version of this Flyback based converter can be found in [1.24].Observe that the obtained lamp voltage waveform is very similar to the Adaptive Pulsetopology output .The second topology found in [1.21] is based on the Buck-Boost converter. The oper-
ating principle of this resonant converter relies on the storage of a fixed amount of energyin an inductance for the subsequent transference of this energy, to the DBD lamp, againin DCM. In Fig.1.12 a schematic of this topology is shown.In the Buck-Boost-based converter the energy injected in each semi-cycle is defined
by the duration of the ON sequence of the switch To, thus the power injected into theDBD is determined only by the inductance stored energy multiplied by the frequency.The obtained lamp voltage and current are symmetrical as shown in Fig.1.12-right. InFig.1.13 the experimental waveforms obtained for this type of converter are shown. Acomputation of the gas conductance current is presented in Fig.1.13-right (igas) and itis compared with the waveform of the UV radiation to demonstrate the capability ofcontrolling the UV shape. Power supplies working on this basis are found in [1.6, 1.7,1.15,1.25]. A benefit of the Buck-Boost supply type is its high stability [1.6].
Vin
+-
Lm
i lp0K
-2K
-4K
-6K
2K
0
-0.2
-0.4
0.2
0.4
Time (μs)0 100 200
V
A
ilp
vlp
iLm
Figure 1.11.: Left: Flyback topology based DBD power supply designed to operate in current-mode. Right: the corresponding lamp voltage and current waveforms obtainedfrom simulation.
David Flórez Power supplies for the study and efficient use of DBD excimer UV lamps
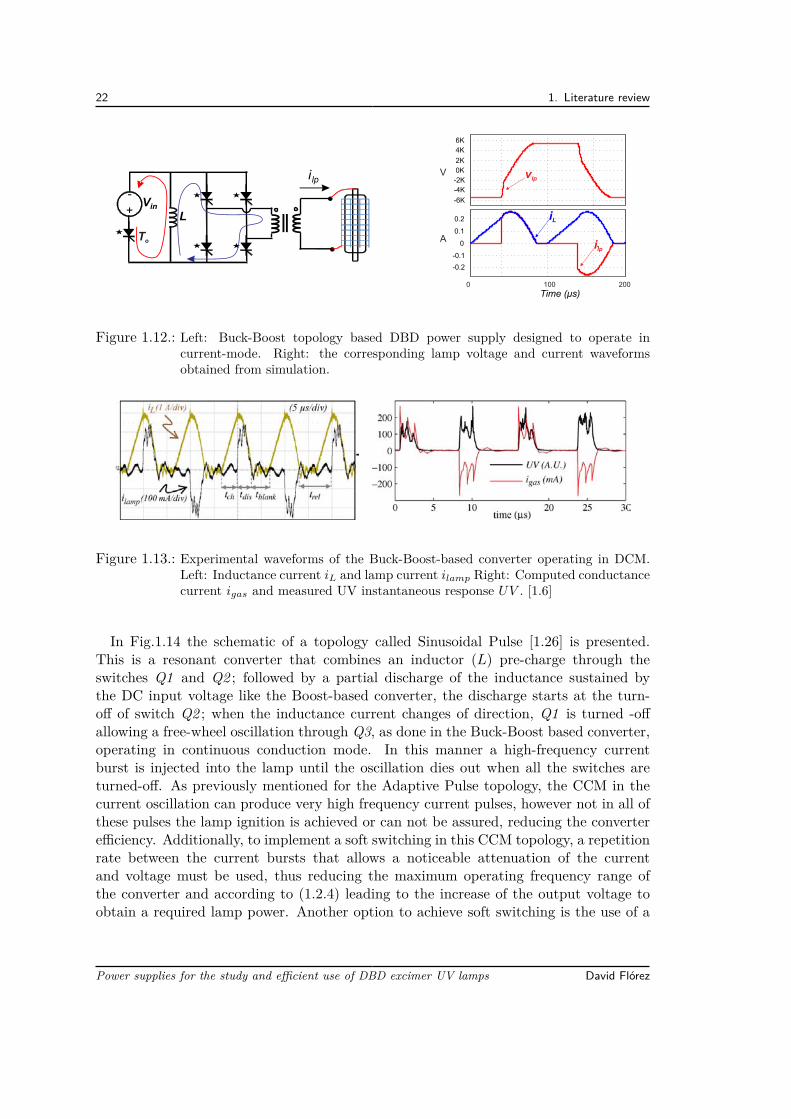
22 1. Literature review
Vin
L
+-
i lp0K
-2K
-4K
-6K
2K
4K
6K
0
-0.1
-0.2
0.1
0.2
Time (μs)0 100 200
vlp
ilp
iL
V
ATo
Figure 1.12.: Left: Buck-Boost topology based DBD power supply designed to operate incurrent-mode. Right: the corresponding lamp voltage and current waveformsobtained from simulation.
Figure 1.13.: Experimental waveforms of the Buck-Boost-based converter operating in DCM.Left: Inductance current iL and lamp current ilamp Right: Computed conductancecurrent igas and measured UV instantaneous response UV . [1.6]
In Fig.1.14 the schematic of a topology called Sinusoidal Pulse [1.26] is presented.This is a resonant converter that combines an inductor (L) pre-charge through theswitches Q1 and Q2 ; followed by a partial discharge of the inductance sustained bythe DC input voltage like the Boost-based converter, the discharge starts at the turn-off of switch Q2 ; when the inductance current changes of direction, Q1 is turned -offallowing a free-wheel oscillation through Q3, as done in the Buck-Boost based converter,operating in continuous conduction mode. In this manner a high-frequency currentburst is injected into the lamp until the oscillation dies out when all the switches areturned-off. As previously mentioned for the Adaptive Pulse topology, the CCM in thecurrent oscillation can produce very high frequency current pulses, however not in all ofthese pulses the lamp ignition is achieved or can not be assured, reducing the converterefficiency. Additionally, to implement a soft switching in this CCM topology, a repetitionrate between the current bursts that allows a noticeable attenuation of the currentand voltage must be used, thus reducing the maximum operating frequency range ofthe converter and according to (1.2.4) leading to the increase of the output voltage toobtain a required lamp power. Another option to achieve soft switching is the use of a
Power supplies for the study and efficient use of DBD excimer UV lamps David Flórez
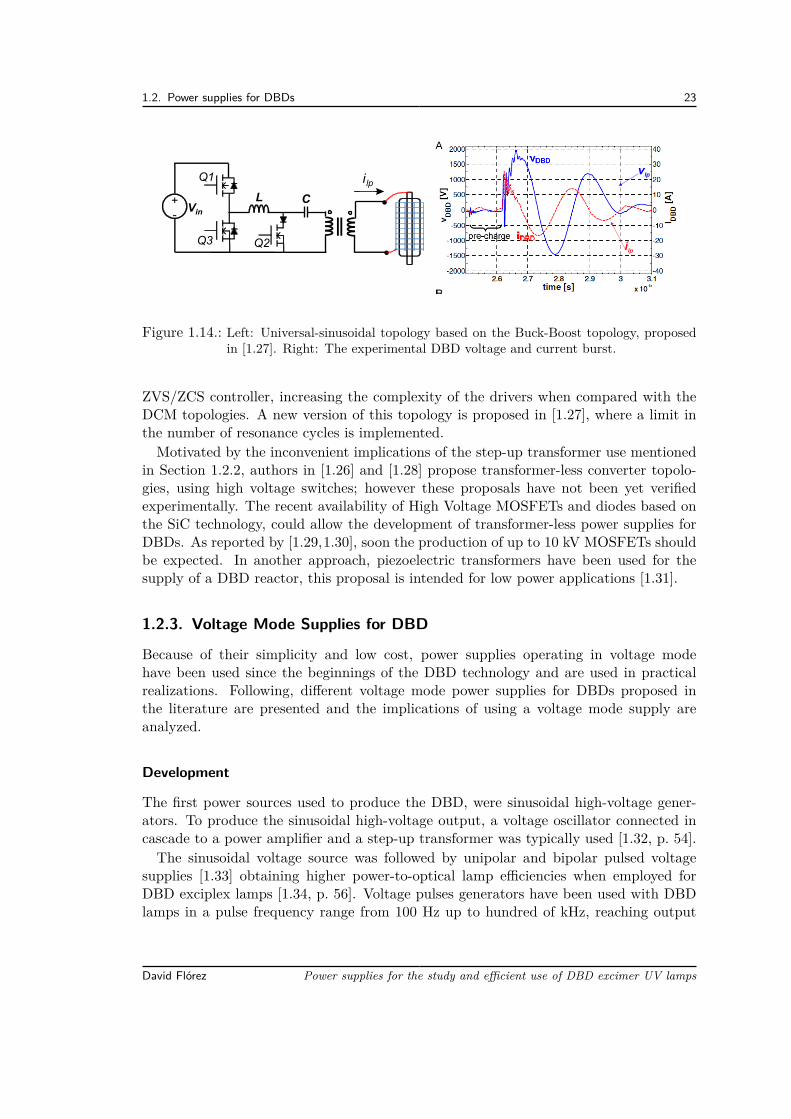
1.2. Power supplies for DBDs 23
Vin
L+-
C
i lpvlp
ilp
Q1
Q2Q3
Figure 1.14.: Left: Universal-sinusoidal topology based on the Buck-Boost topology, proposedin [1.27]. Right: The experimental DBD voltage and current burst.
ZVS/ZCS controller, increasing the complexity of the drivers when compared with theDCM topologies. A new version of this topology is proposed in [1.27], where a limit inthe number of resonance cycles is implemented.Motivated by the inconvenient implications of the step-up transformer use mentioned
in Section 1.2.2, authors in [1.26] and [1.28] propose transformer-less converter topolo-gies, using high voltage switches; however these proposals have not been yet verifiedexperimentally. The recent availability of High Voltage MOSFETs and diodes based onthe SiC technology, could allow the development of transformer-less power supplies forDBDs. As reported by [1.29,1.30], soon the production of up to 10 kV MOSFETs shouldbe expected. In another approach, piezoelectric transformers have been used for thesupply of a DBD reactor, this proposal is intended for low power applications [1.31].
1.2.3. Voltage Mode Supplies for DBD
Because of their simplicity and low cost, power supplies operating in voltage modehave been used since the beginnings of the DBD technology and are used in practicalrealizations. Following, different voltage mode power supplies for DBDs proposed inthe literature are presented and the implications of using a voltage mode supply areanalyzed.
Development
The first power sources used to produce the DBD, were sinusoidal high-voltage gener-ators. To produce the sinusoidal high-voltage output, a voltage oscillator connected incascade to a power amplifier and a step-up transformer was typically used [1.32, p. 54].The sinusoidal voltage source was followed by unipolar and bipolar pulsed voltage
supplies [1.33] obtaining higher power-to-optical lamp efficiencies when employed forDBD exciplex lamps [1.34, p. 56]. Voltage pulses generators have been used with DBDlamps in a pulse frequency range from 100 Hz up to hundred of kHz, reaching output
David Flórez Power supplies for the study and efficient use of DBD excimer UV lamps
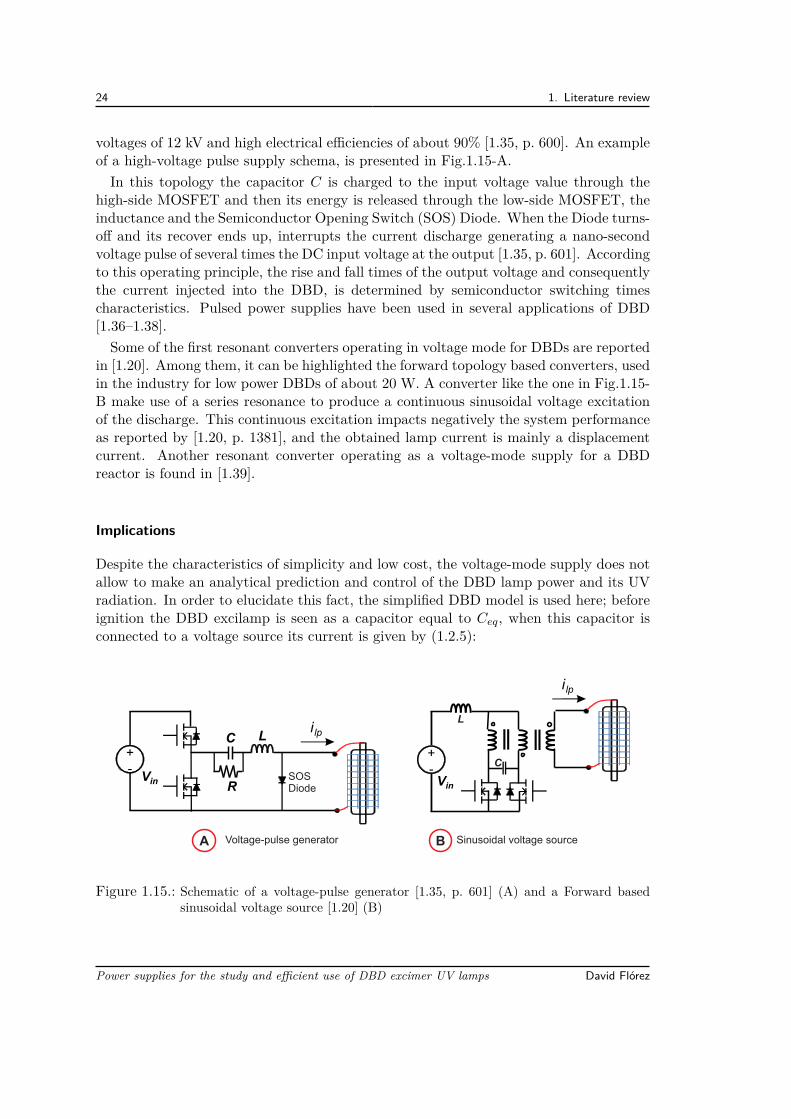
24 1. Literature review
voltages of 12 kV and high electrical efficiencies of about 90% [1.35, p. 600]. An exampleof a high-voltage pulse supply schema, is presented in Fig.1.15-A.In this topology the capacitor C is charged to the input voltage value through the
high-side MOSFET and then its energy is released through the low-side MOSFET, theinductance and the Semiconductor Opening Switch (SOS) Diode. When the Diode turns-off and its recover ends up, interrupts the current discharge generating a nano-secondvoltage pulse of several times the DC input voltage at the output [1.35, p. 601]. Accordingto this operating principle, the rise and fall times of the output voltage and consequentlythe current injected into the DBD, is determined by semiconductor switching timescharacteristics. Pulsed power supplies have been used in several applications of DBD[1.36–1.38].Some of the first resonant converters operating in voltage mode for DBDs are reported
in [1.20]. Among them, it can be highlighted the forward topology based converters, usedin the industry for low power DBDs of about 20 W. A converter like the one in Fig.1.15-B make use of a series resonance to produce a continuous sinusoidal voltage excitationof the discharge. This continuous excitation impacts negatively the system performanceas reported by [1.20, p. 1381], and the obtained lamp current is mainly a displacementcurrent. Another resonant converter operating as a voltage-mode supply for a DBDreactor is found in [1.39].
Implications
Despite the characteristics of simplicity and low cost, the voltage-mode supply does notallow to make an analytical prediction and control of the DBD lamp power and its UVradiation. In order to elucidate this fact, the simplified DBD model is used here; beforeignition the DBD excilamp is seen as a capacitor equal to Ceq, when this capacitor isconnected to a voltage source its current is given by (1.2.5):
Sinusoidal voltage sourceB
Vin
+-
L
C
i lp
Vin
L
+-
C
R
A Voltage-pulse generator
i lp
SOS Diode
Figure 1.15.: Schematic of a voltage-pulse generator [1.35, p. 601] (A) and a Forward basedsinusoidal voltage source [1.20] (B)
Power supplies for the study and efficient use of DBD excimer UV lamps David Flórez
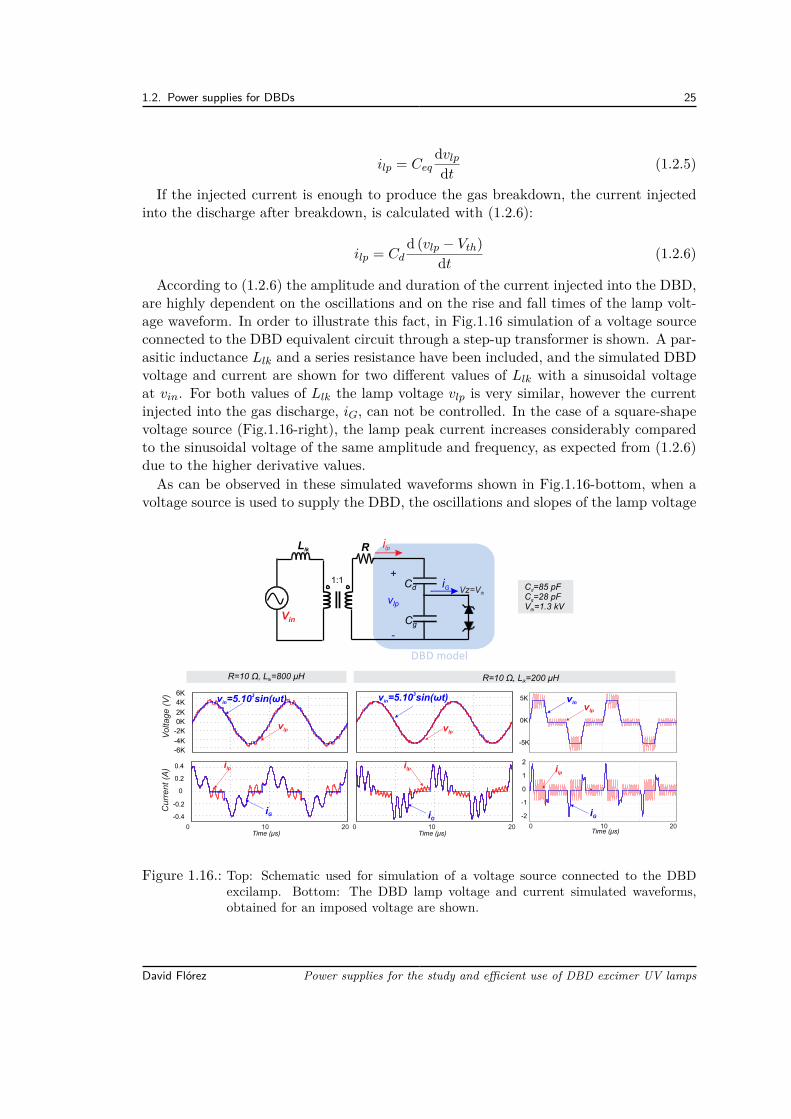
1.2. Power supplies for DBDs 25
ilp = Ceqdvlp
dt (1.2.5)
If the injected current is enough to produce the gas breakdown, the current injectedinto the discharge after breakdown, is calculated with (1.2.6):
ilp = Cdd (vlp − Vth)
dt (1.2.6)
According to (1.2.6) the amplitude and duration of the current injected into the DBD,are highly dependent on the oscillations and on the rise and fall times of the lamp volt-age waveform. In order to illustrate this fact, in Fig.1.16 simulation of a voltage sourceconnected to the DBD equivalent circuit through a step-up transformer is shown. A par-asitic inductance Llk and a series resistance have been included, and the simulated DBDvoltage and current are shown for two different values of Llk with a sinusoidal voltageat vin. For both values of Llk the lamp voltage vlp is very similar, however the currentinjected into the gas discharge, iG, can not be controlled. In the case of a square-shapevoltage source (Fig.1.16-right), the lamp peak current increases considerably comparedto the sinusoidal voltage of the same amplitude and frequency, as expected from (1.2.6)due to the higher derivative values.As can be observed in these simulated waveforms shown in Fig.1.16-bottom, when a
voltage source is used to supply the DBD, the oscillations and slopes of the lamp voltage
ilp
DBD model
+
vlp
-
Cg
Cd
Vin
Llk R
Vz=Vth
1:1 iG C =85 pFd
C =28 pFg
V =1.3 kVth
0
-0.2
-0.4
0.2
0.4
0
Vo
lta
ge
(V
)C
urr
en
t (A
)
vlp
3v =5.10 sin(ωt)in
vlp
Time (μs)0 10 20
iG
ilp
R=10 Ω, L =800 μHlk R=10 Ω, L =200 μHlk
0K
-2K
-4K
-6K
2K
4K
6K
10 20Time (μs)
ilp
iG
0K
-5K
5K
0
-1
-2
1
2
0 10 20
iG
ilp
vinvlp
Time (μs)
3v =5.10 sin(ωt)in
Figure 1.16.: Top: Schematic used for simulation of a voltage source connected to the DBDexcilamp. Bottom: The DBD lamp voltage and current simulated waveforms,obtained for an imposed voltage are shown.
David Flórez Power supplies for the study and efficient use of DBD excimer UV lamps
26 1. Literature review
are very sensitive to the commutation times of the switches in the case of square-shapeor pulsed waveforms, and to the parasitic elements of the converter, e.g. the switchingtimes of the MOSFETs or the SOS Diode, the voltage source output impedance andthe leakage inductance Llk. These parameters are different from one device to anotherand change with the temperature, thus to determine the characteristics of the dischargeand an analytical prediction of the gas breakdown and lamp power is not practical. Incontrast, when the DBD current is controlled by means of a current-mode supply, theinjected power does not depend on the hardly controlled changes of the lamp voltagewaveform. Accordingly, the use of a current mode supply is the best choice to control theDBD excilamp power and to assure the repeatability of the converter operating point.From the outlook presented in this Section, an evolution of the DBD power supplies,
since the beginnings of this technology is evidenced. These developments have made ofthe DBD UV excilamps a commercially viable technology and nowadays this technologyis found in industrial products. Next, the performance of some available DBD basedcommercial systems are presented.
1.3. Characteristics of Commercial DBD Excilamp BasedSystems
Currently, commercial systems incorporating both DBD excilamps and its power suppliesare available. Since 2001, Ushio America Inc. has proposed the development of excimerbased UV systems for water treatment [1.40, 1.41]. Heraeus provides water treatmentsystems based on high power (3 kW) excimer UV systems [1.42, 1.43], which are water-cooled. They offer 172, 222, 282 and 308 nm radiation wavelenghts. The 222 nm and282 nm systems are suggested for inactivation of microorganisms.Another case is the DBD ECG power supply designed for the Xeradex excimer lamp
by the enterprise Osram Gmbh which allows, as reported by the company, an irradiationefficiency of 40%. This level of efficiency is achieved thanks to the pulsed operatingmode [1.44]. The circuit topology of this supply is not of public domain. Also for theXeradex lamp, a converter based on the Forward topology, similar to the one presentedin Fig.1.15-B and called Single Switch Resonant Inverter with Energy Feedback has beenpatented [1.20]. This resonant inverter is intended for lamp powers around 20 Watt.In the side of the DBD excilamps performance, the typical efficiency of DBD-Excimer
lamps is about 15% for lamps containing halogens (e.g. XeCl) and up to 40% for lampscontaining only rare gases (e.g. Xe2) [1.4, 1.45]. The lifetimes are between 1000-5000hours [1.4]. Typically the gas breakdown voltage is less than 10 kV, but depends onthe gas pressure and the gap between electrodes; for lamps with large gap betweenelectrodes, the breakdown voltage can be reduced by placing a metal wire inside the gasdischarge region, this wire works as a guide for the first gas ignition [1.45].Currently, the DBD excimer lamps perform levels of efficiency and lifetimes lower
than those of commercial Mercury Low Pressure and Medium Pressure lamps. How-ever its performances are acceptable by the industry for particular applications wherethe Mercury vapor content is not allowed, or where an specific radiation wavelength is
Power supplies for the study and efficient use of DBD excimer UV lamps David Flórez
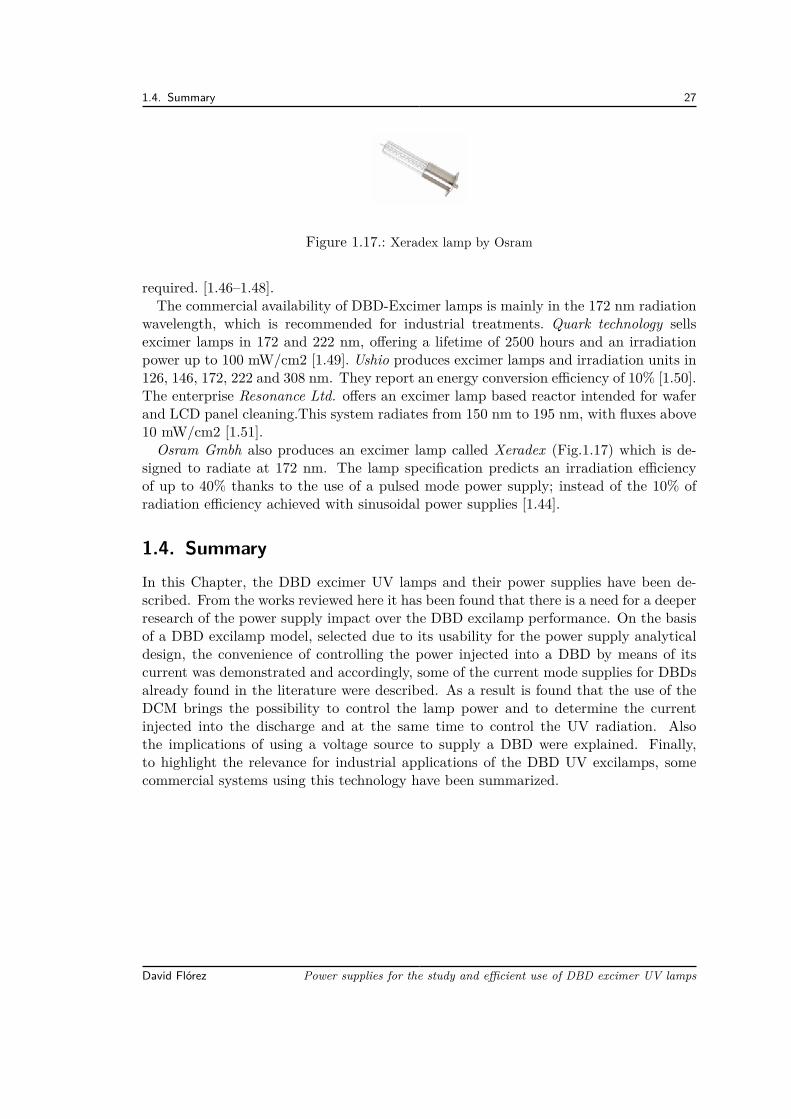
1.4. Summary 27
Figure 1.17.: Xeradex lamp by Osram
required. [1.46–1.48].The commercial availability of DBD-Excimer lamps is mainly in the 172 nm radiation
wavelength, which is recommended for industrial treatments. Quark technology sellsexcimer lamps in 172 and 222 nm, offering a lifetime of 2500 hours and an irradiationpower up to 100 mW/cm2 [1.49]. Ushio produces excimer lamps and irradiation units in126, 146, 172, 222 and 308 nm. They report an energy conversion efficiency of 10% [1.50].The enterprise Resonance Ltd. offers an excimer lamp based reactor intended for waferand LCD panel cleaning.This system radiates from 150 nm to 195 nm, with fluxes above10 mW/cm2 [1.51].Osram Gmbh also produces an excimer lamp called Xeradex (Fig.1.17) which is de-
signed to radiate at 172 nm. The lamp specification predicts an irradiation efficiencyof up to 40% thanks to the use of a pulsed mode power supply; instead of the 10% ofradiation efficiency achieved with sinusoidal power supplies [1.44].
1.4. SummaryIn this Chapter, the DBD excimer UV lamps and their power supplies have been de-scribed. From the works reviewed here it has been found that there is a need for a deeperresearch of the power supply impact over the DBD excilamp performance. On the basisof a DBD excilamp model, selected due to its usability for the power supply analyticaldesign, the convenience of controlling the power injected into a DBD by means of itscurrent was demonstrated and accordingly, some of the current mode supplies for DBDsalready found in the literature were described. As a result is found that the use of theDCM brings the possibility to control the lamp power and to determine the currentinjected into the discharge and at the same time to control the UV radiation. Alsothe implications of using a voltage source to supply a DBD were explained. Finally,to highlight the relevance for industrial applications of the DBD UV excilamps, somecommercial systems using this technology have been summarized.
David Flórez Power supplies for the study and efficient use of DBD excimer UV lamps
Bibliography
[1.1] R. Hippler, H. Kersten, M. Schmidt, and K. H. Schoenbach, eds., Low TemperaturePlasmas: Fundamentals, Technologies and Techniques. Wiley-VCH, 2 ed., Mar.2008.
[1.2] Hartnett, James, Transport Phenomena in Plasma. Academic Press, Oct. 2007.
[1.3] X. Bonnin, H. Piquet, N. Naude, C. Bouzidi, N. Gherardi, and J.-M. Blaquiere,“Design of a current converter to maximize the power into homogeneous dielectricbarrier discharge (DBD) devices,” The European Physical Journal Applied Physics,July 2013.
[1.4] M. I. Lomaev, V. S. Skakun, E. A. Sosnin, V. F. Tarasenko, D. V. Shitts, andM. V. Erofeev, “Excilamps efficient sources of spontaneous UV and VUV radiation,”Physics-Uspekhi, vol. 46, pp. 193–209, Feb. 2003.
[1.5] H. Piquet, S. Bhosle, R. Diez, M. Cousineau, M. Djibrillah, D. Le Thanh, A. N.Dagang, and G. Zissis, “Control of the UV flux of a XeCl dielectric barrier dischargeexcilamp through its current variation,” Quantum Electronics, vol. 42, pp. 157–164,Feb. 2012.
[1.6] R. Diez, H. Piquet, M. Cousineau, and S. Bhosle, “Current-mode power converterfor radiation control in DBD excimer lamps,” IEEE Transactions on IndustrialElectronics, vol. 59, no. 4, pp. 1912–1919, 2012.
[1.7] H. Piquet, S. Bhosle, R. Diez, and M. V. Erofeev, “Pulsed current-mode supplyof dielectric barrier discharge excilamps for the control of the radiated ultravioletpower,” IEEE Transactions on Plasma Science, vol. 38, pp. 2531–2538, Oct. 2010.
[1.8] R. Diez, H. Piquet, and S. Bhosle, “Control of the UV emission of an excimer lampby means of a current-mode power supply,” in Industrial Electronics, 2009. IECON’09. 35th Annual Conference of IEEE, pp. 3500–3505, IEEE, Nov. 2009.
[1.9] J. P. Verboncoeur, “Particle simulation of plasmas: review and advances,” PlasmaPhysics and Controlled Fusion, vol. 47, p. A231, May 2005.
[1.10] A. Oda, Y. Sakai, H. Akashi, and H. Sugawara, “One-dimensional modelling oflow-frequency and high-pressure xe barrier discharges for the design of excimerlamps,” Journal of Physics D: Applied Physics, vol. 32, p. 2726, Nov. 1999.
Bibliography 29
[1.11] S. Bhosle, G. Zissis, J.-J. Damelincourt, A. Capdevila, K. Gupta, F. Dawson, andV. Tarasenko, “Implementation of an efficiency indicator in an electrical modeling ofa dielectric barrier discharge lamp,” in Conference Record of the 2006 IEEE IndustryApplications Conference, 2006. 41st IAS Annual Meeting, vol. 4, pp. 1784–1790,2006.
[1.12] L. T. Doanh, S. Bhosle, G. Zissis, and H. Piquet, “Estimation of the light out-put power and efficiency of a XeCl dielectric barrier discharge exciplex lamp usingone-dimensional drift-diffusion model for various voltage waveforms,” IEEE Trans-actions on Industry Applications, vol. 49, no. 1, pp. 331–340, 2013.
[1.13] S. Bhosle, G. Zissis, J. Damelincourt, A. Capdevila, K. Gupta, F. Dawson, andV. Tarasenko, “Electrical modeling of an homogeneous dielectric barrier discharge(DBD),” in Fourtieth IAS Annual Meeting. Conference Record of the 2005, vol. 4,pp. 2315–2319, IEEE, Oct. 2005.
[1.14] R. Díez, J.-P. Salanne, H. Piquet, S. Bhosle, and G. Zissis, “Predictive model of aDBD lamp for power supply design and method for the automatic identification ofits parameters,” The European Physical Journal - Applied Physics, vol. 37, no. 03,pp. 307–313, 2007.
[1.15] A. El-Deib, Modeling of and Driver Design for a Dielectric Barrier DischargeLamp. Thesis, University of Toronto, Aug. 2010. PhD.
[1.16] A. Flores-Fuentes, R. Pena-Eguiluz, R. Lopez-Callejas, A. Mercado-Cabrera,R. Valencia-Alvarado, S. Barocio-Delgado, and A. de la Piedad-Beneitez, “Elec-trical model of an atmospheric pressure dielectric barrier discharge cell,” IEEETransactions on Plasma Science, vol. 37, pp. 128–134, Jan. 2009.
[1.17] M. A. Djibrillah, Éléments de conception d’un générateur électrique pourl’alimentation d’un dispositif à décharge à barrière diélectrique (DBD). INPT, Apr.2011.
[1.18] U. Kogelschatz, “Dielectric-barrier discharges: Their history, discharge physics,and industrial applications,” Plasma Chemistry and Plasma Processing, vol. 23,no. 1, pp. 1–46, 2003.
[1.19] T. C. Manley, “The electric characteristics of the ozonator discharge,” Transac-tions of The Electrochemical Society, vol. 84, pp. 83–96, Oct. 1943.
[1.20] W. Sowa and R. Lecheler, “Lamp driver concepts for dielectric barrier dischargelamps and evaluation of a 110 w ballast,” in Industry Applications Conference, 2004.39th IAS Annual Meeting. Conference Record of the 2004 IEEE, vol. 2, pp. 1379–1385, IEEE, 2004.
[1.21] R. Diez-Medina, Alimentation de puissance d’une lampe exciplexe à déchargeà barrière diélectrique, en vue du contrôle du rayonnement. PhD thesis, INPT,Toulouse, 2008.
David Flórez Power supplies for the study and efficient use of DBD excimer UV lamps
30 Bibliography
[1.22] R. Diez, H. Piquet, S. Bhosle, J.-M. Blaquiere, and N. Roux, “Design of a currentconverter for the study of the UV emission in DBD excilamps,” in IEEE Interna-tional Symposium on Industrial Electronics, 2008. ISIE 2008, pp. 62–67, 2008.
[1.23] H.-P. Daub, Ein adaptives Impuls-EVG zum Betrieb von dielektrisch behindertenGasentladungslampen. PhD thesis, KIT Scientific Publishing, Karlsruhe, 2010.
[1.24] A. El-Deib, F. Dawson, G. van Eerden, S. Bhosle, G. Zissis, and T. D. Le, “Anal-ysis and experimental validation of a new current-controlled driver for a dielectricbarrier discharge lamp,” IEEE Transactions on Industry Applications, vol. 47, no. 4,pp. 1971–1982, 2011.
[1.25] M. Cousineau, R. Diez, H. Piquet, and O. Durrieu, “Synthesized high-frequencythyristor for dielectric barrier discharge excimer lamps,” IEEE Transactions onIndustrial Electronics, vol. 59, no. 4, pp. 1920–1928, 2012.
[1.26] M. Meisser, R. Kling, and W. Heering, “Universal resonant topology for highfrequency pulsed operation of dielectric barrier discharge light sources,” in 2011Twenty-Sixth Annual IEEE Applied Power Electronics Conference and Exposition(APEC), pp. 1180–1187, 2011.
[1.27] M. Meißer, Resonant Behaviour of Pulse Generators for the Efficient Drive ofOptical Radiation Sources Based on Dielectric Barrier Discharges. PhD thesis,KIT Scientific Publishing, Karlsruhe, 2013.
[1.28] A. El-Deib, F. Dawson, and G. Zissis, “Transformer-less current controlled driverfor a dielectric barrier discharge lamp using HV silicon carbide (SiC) switchingdevices,” in Energy Conversion Congress and Exposition (ECCE), 2011 IEEE,pp. 1124–1131, IEEE, Sept. 2011.
[1.29] W.-S. Lee, K.-W. Chu, C.-F. Huang, L.-S. Lee, M.-J. Tsai, K.-Y. Lee, and F. Zhao,“Design and fabrication of 4h-sic lateral high-voltage devices on a semi-insulatingsubstrate,” IEEE Transactions on Electron Devices, vol. 59, no. 3, pp. 754–760,2012.
[1.30] A. Bolotnikov, P. Losee, K. Matocha, J. Glaser, J. Nasadoski, L. Wang, A. Elasser,S. Arthur, Z. Stum, P. Sandvik, Y. Sui, T. Johnson, J. Sabate, and L. Stevanovic,“3.3kV SiC MOSFETs designed for low on-resistance and fast switching,” in 201224th International Symposium on Power Semiconductor Devices and ICs (ISPSD),pp. 389–392, 2012.
[1.31] J. Alonso, C. Ordiz, M. Dalla-Costa, J. Ribas, and J. Cardesin, “High voltagepower supply for ozone generation based on piezoelectric transformer,” in Confer-ence Record of the 2007 IEEE Industry Applications Conference, 2007. 42nd IASAnnual Meeting, pp. 1901–1908, 2007.
Power supplies for the study and efficient use of DBD excimer UV lamps David Flórez
Bibliography 31
[1.32] M. I. Lomaev, V. S. Skakun, V. F. Tarasenko, and D. V. Shitts, “Excilamps basedon xenon dimers excited by a barrier discharge,” Journal of Optical Technology,vol. 79, no. 8, pp. 498–502, 2012.
[1.33] V. F. Tarasenko, A. V. Krivonosenko, M. I. Lomaev, V. S. Skakun, E. A. Sosnin,and D. V. Shitz, “High-power excilamps with short-pulse duration,” in Proc. SPIE,vol. 4065, pp. 826–835, 2000.
[1.34] M. Lomaev, E. Sosnin, and V. Tarasenko, “Excilamps and their applications,”Progress in Quantum Electronics, vol. 36, pp. 51–97, Jan. 2012.
[1.35] M. I. Lomaev, E. A. Sosnin, V. F. Tarasenko, D. V. Shits, V. S. Skakun, M. V.Erofeev, and A. A. Lisenko, “Capacitive and barrier discharge excilamps and theirapplications (review),” Instruments and Experimental Techniques, vol. 49, pp. 595–616, Oct. 2006.
[1.36] A. Shams Taleghani, A. Shadaram, and M. Mirzaei, “Effects of duty cycles ofthe plasma actuators on improvement of pressure distribution above a NLF0414airfoil,” IEEE Transactions on Plasma Science, vol. 40, pp. 1434–1440, May 2012.
[1.37] S. Zhang, W. Wang, L. Jia, Z. Liu, Y. Yang, and L. Dai, “Rotational, vibrational,and excitation temperatures in bipolar nanosecond-pulsed diffuse dielectric-barrier-discharge plasma at atmospheric pressure,” IEEE Transactions on Plasma Science,vol. 41, pp. 350–354, Feb. 2013.
[1.38] T. Kuroki, T. Oishi, T. Yamamoto, and M. Okubo, “Bromomethane decompo-sition using a pulsed dielectric barrier discharge,” IEEE Transactions on IndustryApplications, vol. 49, pp. 293–297, Jan. 2013.
[1.39] S. Kalisiak, M. Holub, and T. Jakubowski, “Resonant inverter with output volt-age pulse-phase-shift control for DBD plasma reactor supply,” in 13th EuropeanConference on Power Electronics and Applications, 2009. EPE ’09, pp. 1–9, 2009.
[1.40] Zoran Falkenstein, USHIO America Inc., “Development of an excimer UV lightsource system for water treatment.” http://www.revistavirtualpro.com/files/TIE04_200701.pdf.
[1.41] Z. Falkenstein, “Dielectric barrier discharge-driven (V)UV light source for fluidtreatment,” July 2002.
[1.42] Heraeus Noblelight LLC., “High power excimer UV system.” http://www.heraeus-noblelight.com/media/webmedia_local/media/pdf/uv/UVP16E_high_power_excimer_system.pdf.
[1.43] Heraeus Noblelight LLC., “Ultraviolet light for water treatment.”http://www.heraeus-noblelight.com/media/webmedia_local/media/pdf/uv/UVP06_EN_Wasser.pdf.
David Flórez Power supplies for the study and efficient use of DBD excimer UV lamps
32 Bibliography
[1.44] OSRAM GmbH, “Xeradex excimer lamps.” http://www.osram.com/osram_com/applications/industrial-applications/ozone-production/index.jsp.
[1.45] A. Voronov, “Mercury free UV-light sources based on excimer lamps,” in 17th In-ternational Conference on Gas Discharges and Their Applications, 2008. GD 2008,pp. 501–504, 2008.
[1.46] I. Soloshenko, V. Y. Bazhenov, V. A. Khomich, V. V. Tsiolko, and N. G.Potapchenko, “Comparative research of efficiency of water decontamination by UVradiation of cold hollow cathode discharge plasma versus that of low- and medium-pressure mercury lamps,” IEEE Transactions on Plasma Science, vol. 34, no. 4,pp. 1365–1369, 2006.
[1.47] WOLFGANG HEERING, “UV SOURCES – basics, properties and applications,”IUVA NEWS, vol. 6, pp. 7–13, Dec. 2004.
[1.48] S. Schalk, V. Adam, E. Arnold, K. Brieden, A. Voronov, and H. D. Witzke,“UV-lamps for disinfection and advanced oxidation–Lamp types, technologies andapplications,” IUVA news, vol. 8, no. 1, p. 32–37, 2006.
[1.49] Quark Technology Co. Ltd., “Products information - excimer VUV lamp.” http://www.quark-tec.com/english/product/5.html.
[1.50] USHIO Inc., “Excimer lamps and excimer irradiation unit.” http://www.ushio.co.jp/en/products/list/lamp/lamp_10.html.
[1.51] Resonance Ltd., “REX4 excimer lamp.” http://www.resonance.on.ca/rex4.htm.
Power supplies for the study and efficient use of DBD excimer UV lamps David Flórez
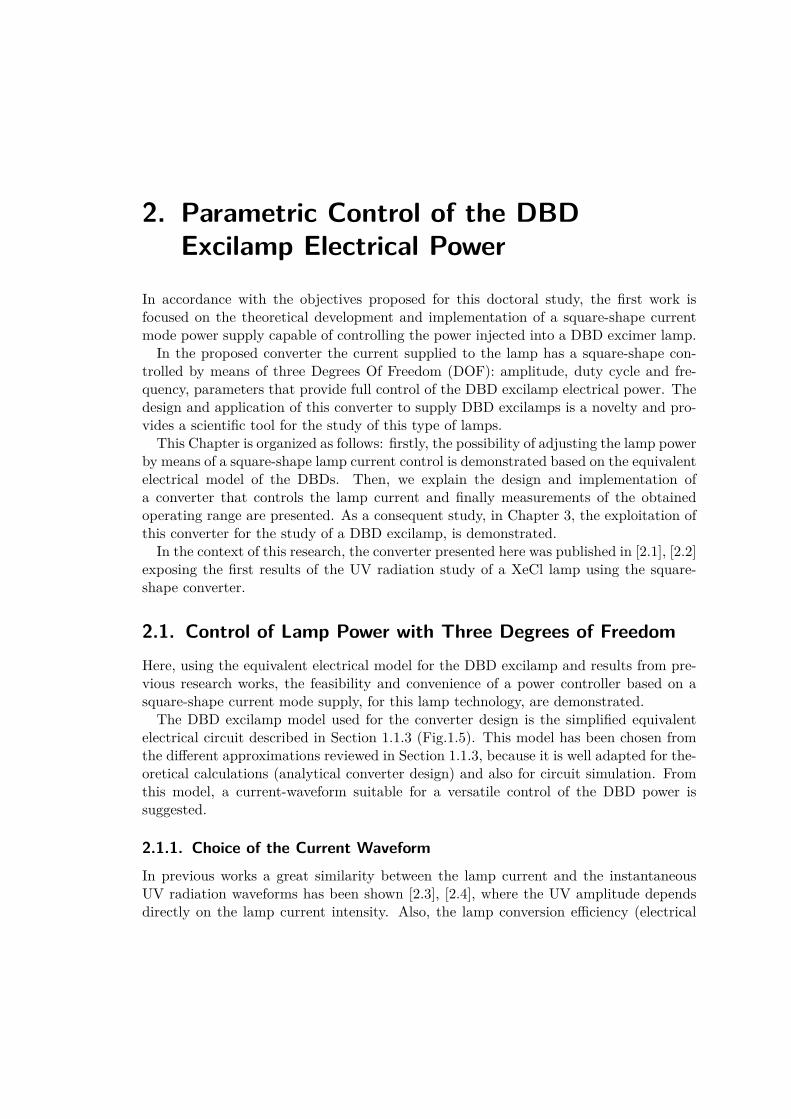
2. Parametric Control of the DBDExcilamp Electrical Power
In accordance with the objectives proposed for this doctoral study, the first work isfocused on the theoretical development and implementation of a square-shape currentmode power supply capable of controlling the power injected into a DBD excimer lamp.In the proposed converter the current supplied to the lamp has a square-shape con-
trolled by means of three Degrees Of Freedom (DOF): amplitude, duty cycle and fre-quency, parameters that provide full control of the DBD excilamp electrical power. Thedesign and application of this converter to supply DBD excilamps is a novelty and pro-vides a scientific tool for the study of this type of lamps.This Chapter is organized as follows: firstly, the possibility of adjusting the lamp power
by means of a square-shape lamp current control is demonstrated based on the equivalentelectrical model of the DBDs. Then, we explain the design and implementation ofa converter that controls the lamp current and finally measurements of the obtainedoperating range are presented. As a consequent study, in Chapter 3, the exploitation ofthis converter for the study of a DBD excilamp, is demonstrated.In the context of this research, the converter presented here was published in [2.1], [2.2]
exposing the first results of the UV radiation study of a XeCl lamp using the square-shape converter.
2.1. Control of Lamp Power with Three Degrees of FreedomHere, using the equivalent electrical model for the DBD excilamp and results from pre-vious research works, the feasibility and convenience of a power controller based on asquare-shape current mode supply, for this lamp technology, are demonstrated.The DBD excilamp model used for the converter design is the simplified equivalent
electrical circuit described in Section 1.1.3 (Fig.1.5). This model has been chosen fromthe different approximations reviewed in Section 1.1.3, because it is well adapted for the-oretical calculations (analytical converter design) and also for circuit simulation. Fromthis model, a current-waveform suitable for a versatile control of the DBD power issuggested.
2.1.1. Choice of the Current WaveformIn previous works a great similarity between the lamp current and the instantaneousUV radiation waveforms has been shown [2.3], [2.4], where the UV amplitude dependsdirectly on the lamp current intensity. Also, the lamp conversion efficiency (electrical
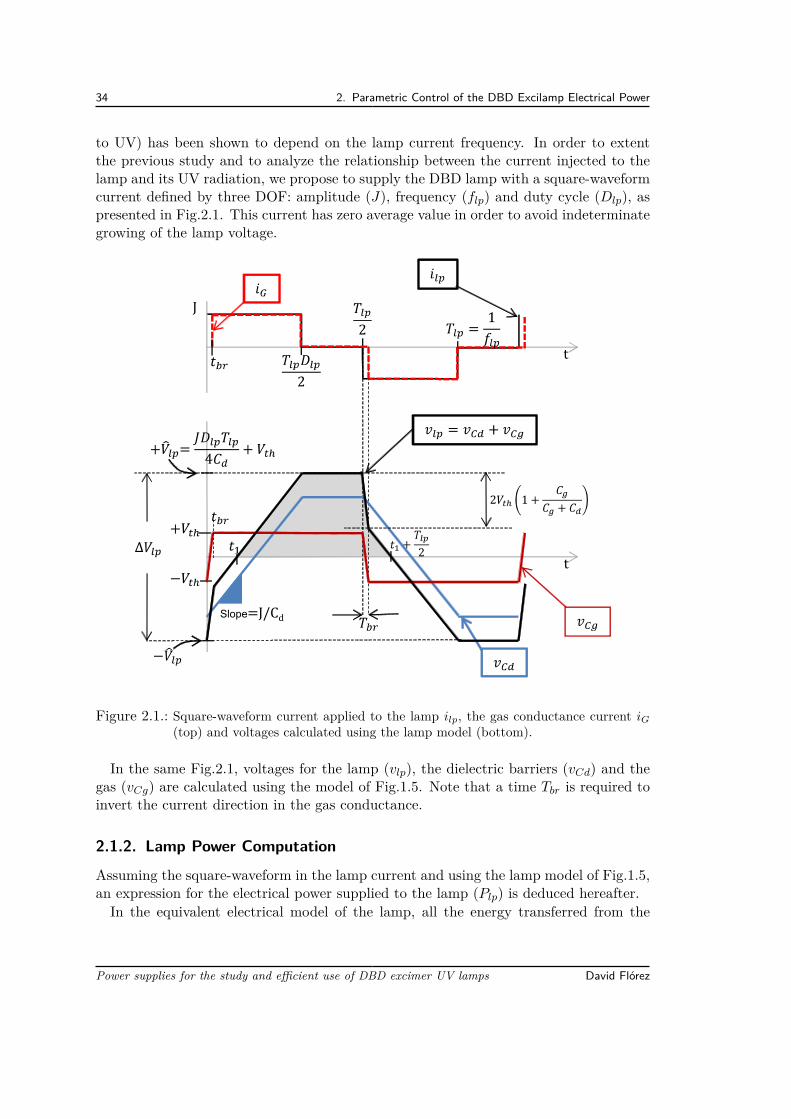
34 2. Parametric Control of the DBD Excilamp Electrical Power
to UV) has been shown to depend on the lamp current frequency. In order to extentthe previous study and to analyze the relationship between the current injected to thelamp and its UV radiation, we propose to supply the DBD lamp with a square-waveformcurrent defined by three DOF: amplitude (J), frequency (flp) and duty cycle (Dlp), aspresented in Fig.2.1. This current has zero average value in order to avoid indeterminategrowing of the lamp voltage.
t
Slope=J/Cd
t
J
Figure 2.1.: Square-waveform current applied to the lamp ilp, the gas conductance current iG(top) and voltages calculated using the lamp model (bottom).
In the same Fig.2.1, voltages for the lamp (vlp), the dielectric barriers (vCd) and thegas (vCg) are calculated using the model of Fig.1.5. Note that a time Tbr is required toinvert the current direction in the gas conductance.
2.1.2. Lamp Power Computation
Assuming the square-waveform in the lamp current and using the lamp model of Fig.1.5,an expression for the electrical power supplied to the lamp (Plp) is deduced hereafter.In the equivalent electrical model of the lamp, all the energy transferred from the
Power supplies for the study and efficient use of DBD excimer UV lamps David Flórez
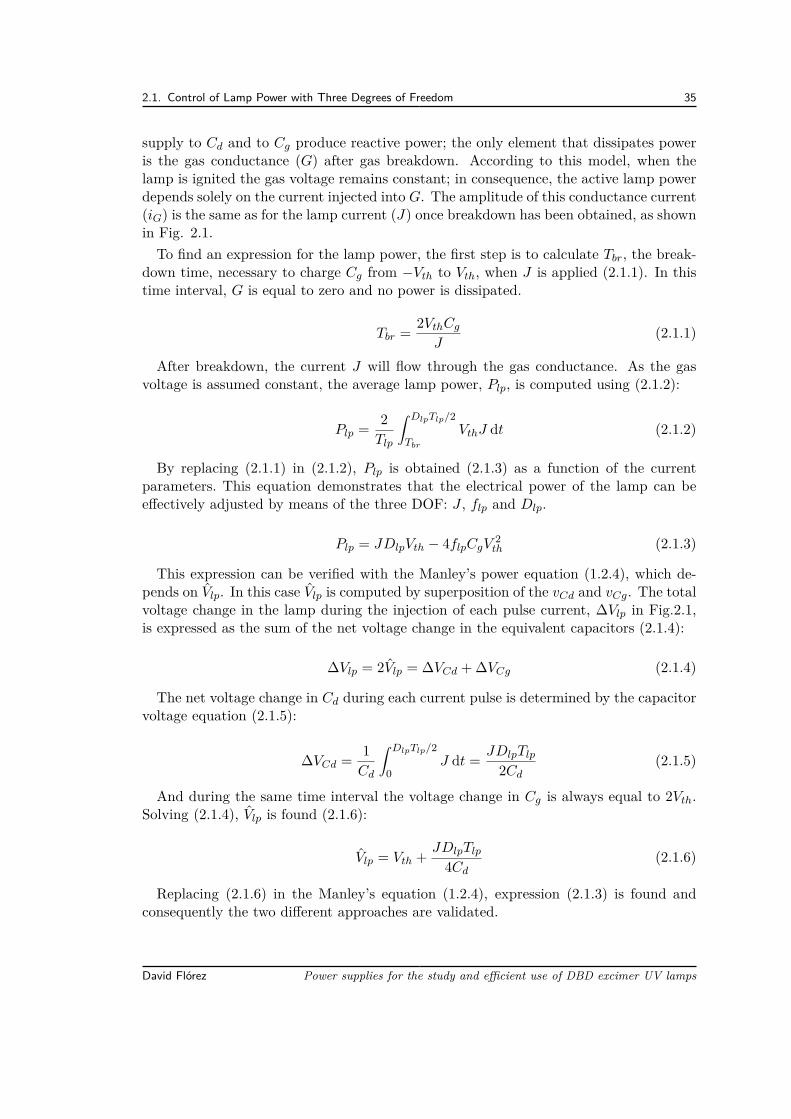
2.1. Control of Lamp Power with Three Degrees of Freedom 35
supply to Cd and to Cg produce reactive power; the only element that dissipates poweris the gas conductance (G) after gas breakdown. According to this model, when thelamp is ignited the gas voltage remains constant; in consequence, the active lamp powerdepends solely on the current injected into G. The amplitude of this conductance current(iG) is the same as for the lamp current (J) once breakdown has been obtained, as shownin Fig. 2.1.To find an expression for the lamp power, the first step is to calculate Tbr, the break-
down time, necessary to charge Cg from −Vth to Vth, when J is applied (2.1.1). In thistime interval, G is equal to zero and no power is dissipated.
Tbr = 2VthCg
J(2.1.1)
After breakdown, the current J will flow through the gas conductance. As the gasvoltage is assumed constant, the average lamp power, Plp, is computed using (2.1.2):
Plp = 2Tlp
∫ DlpTlp/2
Tbr
VthJ dt (2.1.2)
By replacing (2.1.1) in (2.1.2), Plp is obtained (2.1.3) as a function of the currentparameters. This equation demonstrates that the electrical power of the lamp can beeffectively adjusted by means of the three DOF: J , flp and Dlp.
Plp = JDlpVth − 4flpCgV2
th (2.1.3)
This expression can be verified with the Manley’s power equation (1.2.4), which de-pends on Vlp. In this case Vlp is computed by superposition of the vCd and vCg. The totalvoltage change in the lamp during the injection of each pulse current, ∆Vlp in Fig.2.1,is expressed as the sum of the net voltage change in the equivalent capacitors (2.1.4):
∆Vlp = 2Vlp = ∆VCd + ∆VCg (2.1.4)
The net voltage change in Cd during each current pulse is determined by the capacitorvoltage equation (2.1.5):
∆VCd = 1Cd
∫ DlpTlp/2
0J dt = JDlpTlp
2Cd(2.1.5)
And during the same time interval the voltage change in Cg is always equal to 2Vth.Solving (2.1.4), Vlp is found (2.1.6):
Vlp = Vth + JDlpTlp
4Cd(2.1.6)
Replacing (2.1.6) in the Manley’s equation (1.2.4), expression (2.1.3) is found andconsequently the two different approaches are validated.
David Flórez Power supplies for the study and efficient use of DBD excimer UV lamps
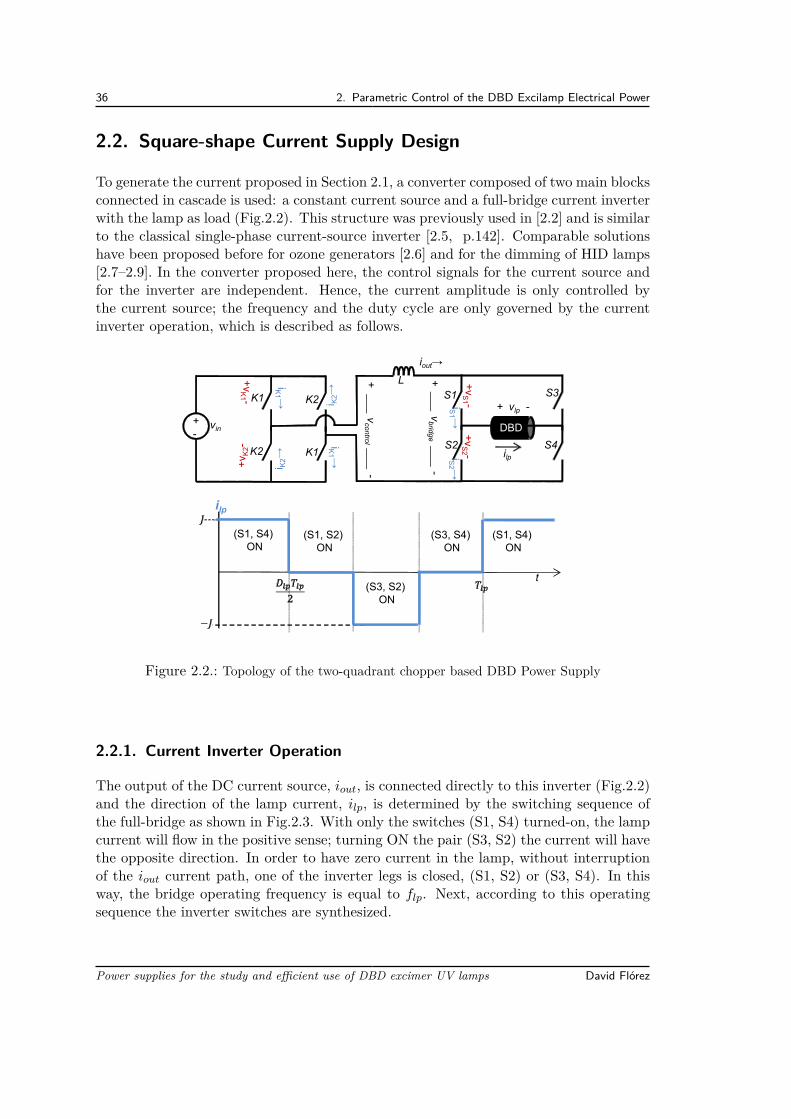
36 2. Parametric Control of the DBD Excilamp Electrical Power
2.2. Square-shape Current Supply Design
To generate the current proposed in Section 2.1, a converter composed of two main blocksconnected in cascade is used: a constant current source and a full-bridge current inverterwith the lamp as load (Fig.2.2). This structure was previously used in [2.2] and is similarto the classical single-phase current-source inverter [2.5, p.142]. Comparable solutionshave been proposed before for ozone generators [2.6] and for the dimming of HID lamps[2.7–2.9]. In the converter proposed here, the control signals for the current source andfor the inverter are independent. Hence, the current amplitude is only controlled bythe current source; the frequency and the duty cycle are only governed by the currentinverter operation, which is described as follows.
(S1, S4) ON
(S1, S2) ON
(S3, S2) ON
(S3, S4) ON
(S1, S4) ON
vin
K1
L + v
brid
ge
-
ilp
S1
S4
S3
S2
+ vlp -
+-
DBD
iout→
+v
K1 -
iK1 →
i K2→
+v K
2-
+v
S1 -
+v
S2 -
iS1 →
iS2 →
K1 K2
K2iK
1 →
i K2→
+ v
con
trol
-
t
ilp
Figure 2.2.: Topology of the two-quadrant chopper based DBD Power Supply
2.2.1. Current Inverter Operation
The output of the DC current source, iout, is connected directly to this inverter (Fig.2.2)and the direction of the lamp current, ilp, is determined by the switching sequence ofthe full-bridge as shown in Fig.2.3. With only the switches (S1, S4) turned-on, the lampcurrent will flow in the positive sense; turning ON the pair (S3, S2) the current will havethe opposite direction. In order to have zero current in the lamp, without interruptionof the iout current path, one of the inverter legs is closed, (S1, S2) or (S3, S4). In thisway, the bridge operating frequency is equal to flp. Next, according to this operatingsequence the inverter switches are synthesized.
Power supplies for the study and efficient use of DBD excimer UV lamps David Flórez
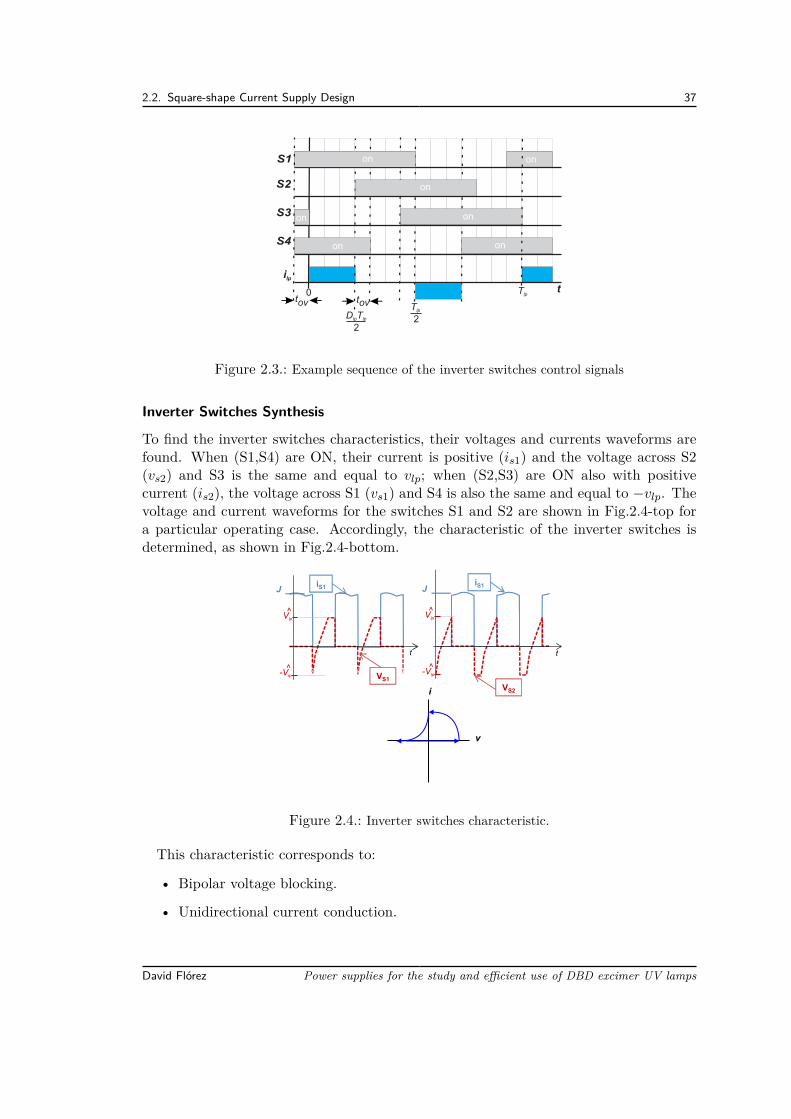
2.2. Square-shape Current Supply Design 37
tov
S1
S2
S3
S4
on
on
on
on
0 tTlp
tov
on
on
on
ilp
Tlp
2D Tlp lp
2
Figure 2.3.: Example sequence of the inverter switches control signals
Inverter Switches Synthesis
To find the inverter switches characteristics, their voltages and currents waveforms arefound. When (S1,S4) are ON, their current is positive (is1) and the voltage across S2(vs2) and S3 is the same and equal to vlp; when (S2,S3) are ON also with positivecurrent (is2), the voltage across S1 (vs1) and S4 is also the same and equal to −vlp. Thevoltage and current waveforms for the switches S1 and S2 are shown in Fig.2.4-top fora particular operating case. Accordingly, the characteristic of the inverter switches isdetermined, as shown in Fig.2.4-bottom.
J
t
iS1
VS1
J
t
VS2
iS1
i
v
Vlp
^
-Vlp
^
Vlp
^
-Vlp
^
Figure 2.4.: Inverter switches characteristic.
This characteristic corresponds to:
• Bipolar voltage blocking.
• Unidirectional current conduction.
David Flórez Power supplies for the study and efficient use of DBD excimer UV lamps
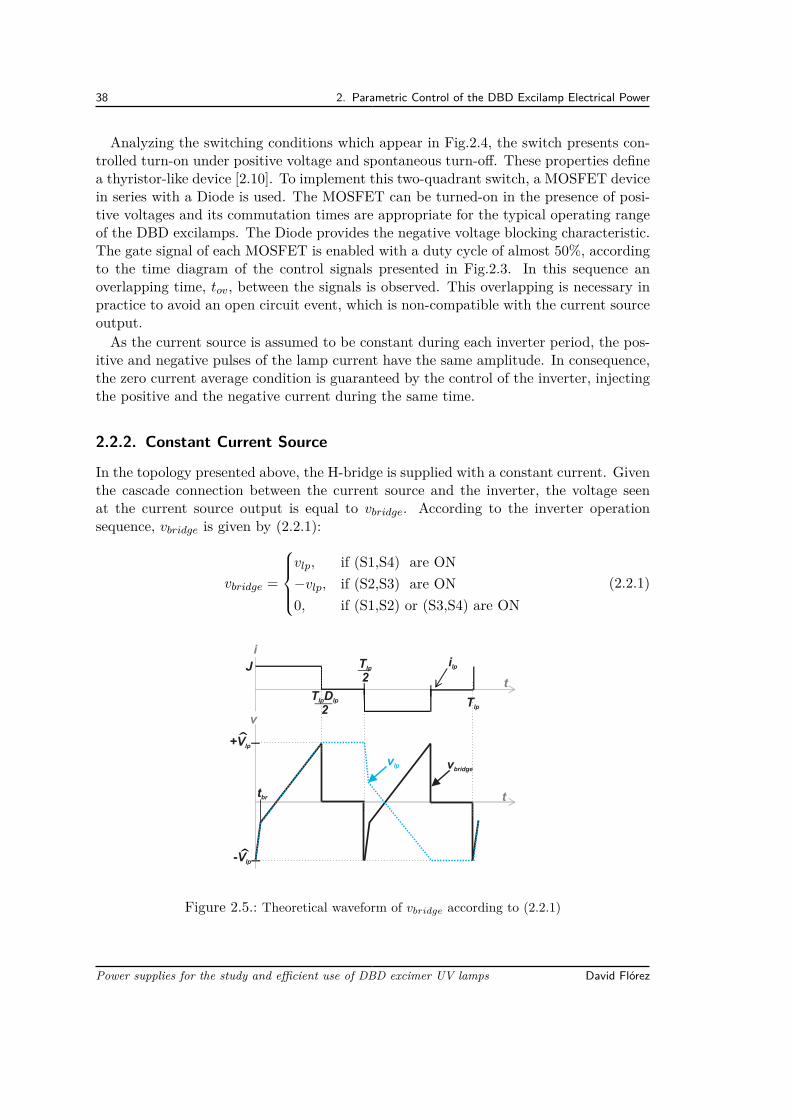
38 2. Parametric Control of the DBD Excilamp Electrical Power
Analyzing the switching conditions which appear in Fig.2.4, the switch presents con-trolled turn-on under positive voltage and spontaneous turn-off. These properties definea thyristor-like device [2.10]. To implement this two-quadrant switch, a MOSFET devicein series with a Diode is used. The MOSFET can be turned-on in the presence of posi-tive voltages and its commutation times are appropriate for the typical operating rangeof the DBD excilamps. The Diode provides the negative voltage blocking characteristic.The gate signal of each MOSFET is enabled with a duty cycle of almost 50%, accordingto the time diagram of the control signals presented in Fig.2.3. In this sequence anoverlapping time, tov, between the signals is observed. This overlapping is necessary inpractice to avoid an open circuit event, which is non-compatible with the current sourceoutput.As the current source is assumed to be constant during each inverter period, the pos-
itive and negative pulses of the lamp current have the same amplitude. In consequence,the zero current average condition is guaranteed by the control of the inverter, injectingthe positive and the negative current during the same time.
2.2.2. Constant Current Source
In the topology presented above, the H-bridge is supplied with a constant current. Giventhe cascade connection between the current source and the inverter, the voltage seenat the current source output is equal to vbridge. According to the inverter operationsequence, vbridge is given by (2.2.1):
vbridge =
vlp, if (S1,S4) are ON−vlp, if (S2,S3) are ON0, if (S1,S2) or (S3,S4) are ON
(2.2.1)
Tlp
2
T Dlp lp
2Tlp
+Vlp
vbridge
-Vlp
vlp
J
t
t
ilp
tbr
v
i
Figure 2.5.: Theoretical waveform of vbridge according to (2.2.1)
Power supplies for the study and efficient use of DBD excimer UV lamps David Flórez
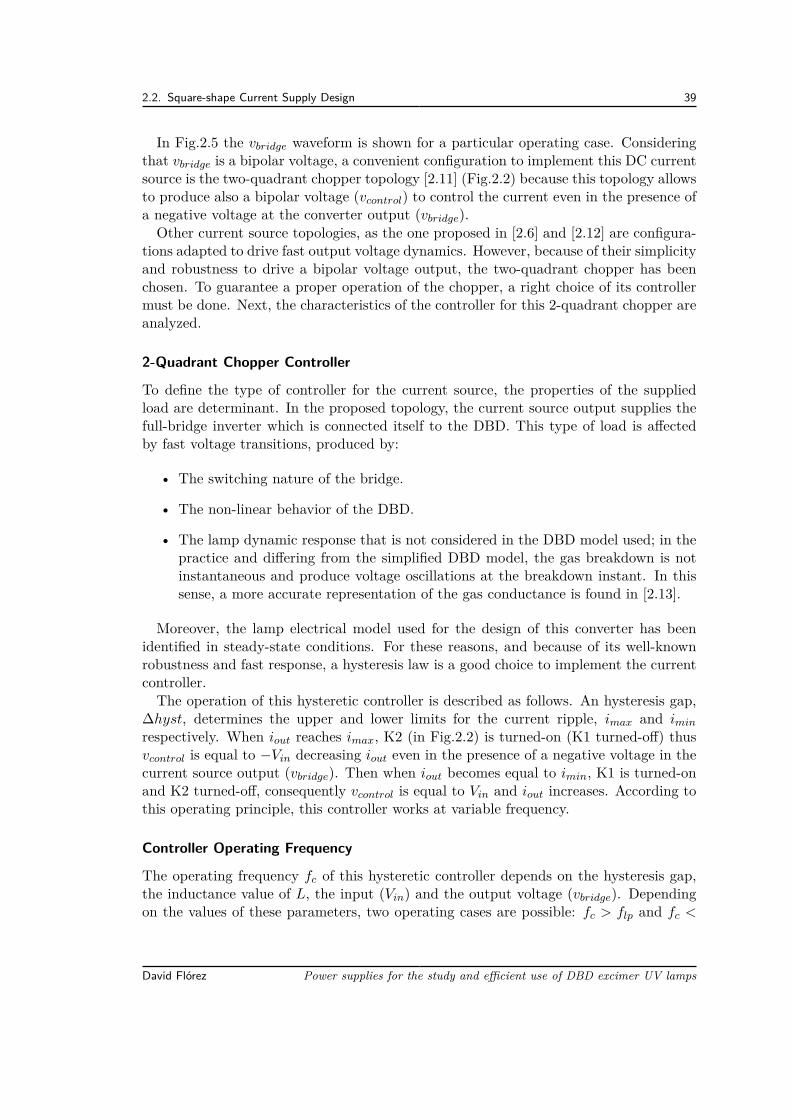
2.2. Square-shape Current Supply Design 39
In Fig.2.5 the vbridge waveform is shown for a particular operating case. Consideringthat vbridge is a bipolar voltage, a convenient configuration to implement this DC currentsource is the two-quadrant chopper topology [2.11] (Fig.2.2) because this topology allowsto produce also a bipolar voltage (vcontrol) to control the current even in the presence ofa negative voltage at the converter output (vbridge).Other current source topologies, as the one proposed in [2.6] and [2.12] are configura-
tions adapted to drive fast output voltage dynamics. However, because of their simplicityand robustness to drive a bipolar voltage output, the two-quadrant chopper has beenchosen. To guarantee a proper operation of the chopper, a right choice of its controllermust be done. Next, the characteristics of the controller for this 2-quadrant chopper areanalyzed.
2-Quadrant Chopper Controller
To define the type of controller for the current source, the properties of the suppliedload are determinant. In the proposed topology, the current source output supplies thefull-bridge inverter which is connected itself to the DBD. This type of load is affectedby fast voltage transitions, produced by:
• The switching nature of the bridge.
• The non-linear behavior of the DBD.
• The lamp dynamic response that is not considered in the DBD model used; in thepractice and differing from the simplified DBD model, the gas breakdown is notinstantaneous and produce voltage oscillations at the breakdown instant. In thissense, a more accurate representation of the gas conductance is found in [2.13].
Moreover, the lamp electrical model used for the design of this converter has beenidentified in steady-state conditions. For these reasons, and because of its well-knownrobustness and fast response, a hysteresis law is a good choice to implement the currentcontroller.The operation of this hysteretic controller is described as follows. An hysteresis gap,
∆hyst, determines the upper and lower limits for the current ripple, imax and imin
respectively. When iout reaches imax, K2 (in Fig.2.2) is turned-on (K1 turned-off) thusvcontrol is equal to −Vin decreasing iout even in the presence of a negative voltage in thecurrent source output (vbridge). Then when iout becomes equal to imin, K1 is turned-onand K2 turned-off, consequently vcontrol is equal to Vin and iout increases. According tothis operating principle, this controller works at variable frequency.
Controller Operating Frequency
The operating frequency fc of this hysteretic controller depends on the hysteresis gap,the inductance value of L, the input (Vin) and the output voltage (vbridge). Dependingon the values of these parameters, two operating cases are possible: fc > flp and fc <
David Flórez Power supplies for the study and efficient use of DBD excimer UV lamps
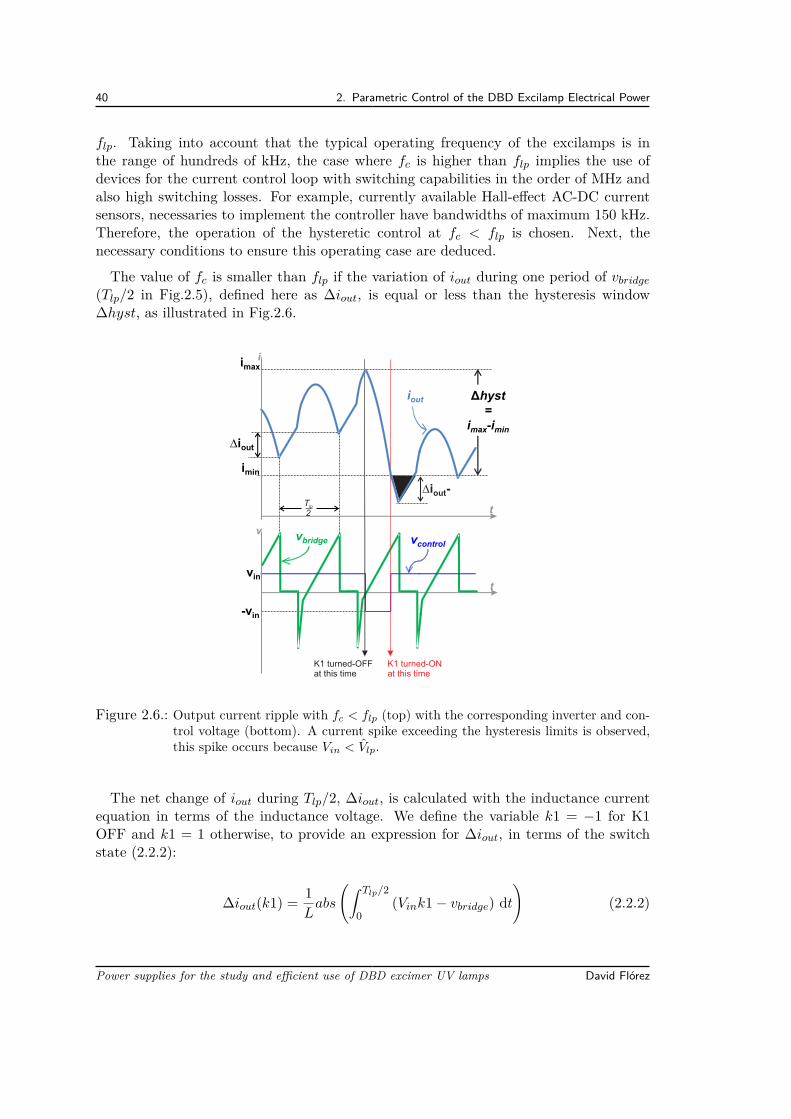
40 2. Parametric Control of the DBD Excilamp Electrical Power
flp. Taking into account that the typical operating frequency of the excilamps is inthe range of hundreds of kHz, the case where fc is higher than flp implies the use ofdevices for the current control loop with switching capabilities in the order of MHz andalso high switching losses. For example, currently available Hall-effect AC-DC currentsensors, necessaries to implement the controller have bandwidths of maximum 150 kHz.Therefore, the operation of the hysteretic control at fc < flp is chosen. Next, thenecessary conditions to ensure this operating case are deduced.
The value of fc is smaller than flp if the variation of iout during one period of vbridge
(Tlp/2 in Fig.2.5), defined here as ∆iout, is equal or less than the hysteresis window∆hyst, as illustrated in Fig.2.6.
∆iout-
vbridge vcontrol
t
t
iout
imax
imin
vin
-vin
Δhyst=
imax-imin
∆iout
K1 turned-OFF at this time
K1 turned-ON at this time
Tlp
2
i
v
Figure 2.6.: Output current ripple with fc < flp (top) with the corresponding inverter and con-trol voltage (bottom). A current spike exceeding the hysteresis limits is observed,this spike occurs because Vin < Vlp.
The net change of iout during Tlp/2, ∆iout, is calculated with the inductance currentequation in terms of the inductance voltage. We define the variable k1 = −1 for K1OFF and k1 = 1 otherwise, to provide an expression for ∆iout, in terms of the switchstate (2.2.2):
∆iout(k1) = 1Labs
(∫ Tlp/2
0(Vink1− vbridge) dt
)(2.2.2)
Power supplies for the study and efficient use of DBD excimer UV lamps David Flórez
2.2. Square-shape Current Supply Design 41
Solving the integral for Vin, (2.2.3) is expressed as (2.2.3):
∆iout(k1) = 1L.abs
(k1.VinTlp
2 −∫ Tlp/2
0vbridge dt
)(2.2.3)
Given that vbridge is equal to vlp during the duty cycle and zero in the rest of the timeinterval (2.2.1), we can write (2.2.4):
∫ Tlp/2
0vbridge dt =
∫ TlpDlp/2
0vlp dt (2.2.4)
vlp is equal to the sum of vCd and vCg, and as can be inferred from Fig.2.1, the integralof vCd is equal to zero for the same time span. Consequently (2.2.5):
∫ Tlp/2
0vbridge dt =
∫ TlpDlp/2
0vCg dt (2.2.5)
Solving (2.2.5) and replacing in (2.2.3) is found (2.2.6):
∆iout(k1) = 1L.abs
(k1.VinTlp
2 + Vth
(TlpDlp
2 − Tbr
))(2.2.6)
For k1 = 1, we obtain the iout increment during Tlp/2 and for k1 = −1, the decrementfor the same time span. And now the period of the controller Tc, is calculated as afunction of Tlp, with the necessary number of iout increments and decrements to coverthe hysteresis window (∆hyst in Fig.2.6) and multiplying by the vbridge period (2.2.7):
Tc =( ∆hyst
∆iout(1) + ∆hyst∆iout(−1)
)Tlp
2 (2.2.7)
With (2.2.8),∆hyst = imax − imin (2.2.8)
Solving, we obtain the switching frequency of the hysteretic controller (2.2.9):
fc =2((
VinTlp
2
)2− V 2
th
(TlpDlp
2 − Tbr
)2)
L∆hystVinT 2lp
(2.2.9)
Maximizing (2.2.9) with Dlp = 0 and Tbr small enough to be neglected, we obtainthe minimum value of L (2.2.10), in order to assure an fc always below the maximumdesired frequency of the hysteretic controller, fcmax:
L = Vin
2fcmax(∆hyst) (2.2.10)
In the other controller operating case, with fc higher than flp, (2.2.6) is no more valid.In this case fc changes with the instantaneous value of vbridge and is calculated based onthe time it takes iout to go over the hysteresis gap, Tgap, (2.2.11), with Tgap < Tlp/2:
David Flórez Power supplies for the study and efficient use of DBD excimer UV lamps
42 2. Parametric Control of the DBD Excilamp Electrical Power
∆hyst = 1L
∫ to+Tgap
to
(k1Vin − vbridge) dt (2.2.11)
Additionally, as can be observed in (2.2.6), the increment and decrement of iout de-pends on the value of Vin and also Vin allows to limit the controller frequency (2.2.9).Following, the impact of the Vin value on the chopper operation is analyzed.
Main DC Input Voltage of the 2-Quadrant Chopper
According to the hysteretic controller operation described in Section 2.2.2, the inductanceinput port (Vcontrol) is connected to Vin or −Vin in order to increase or decrease iout,respectively. Therefore, to assure an instantaneous control of iout independently of theinverter and the controller operating frequencies (flp and fc respectively), Vin must begreater than the positive peak value of vbridge, and −Vin smaller than the negative peakvalue of vbridge, which are Vlp and −Vlp in that order (Fig.2.1).However, a lower value of Vin can be used. If Vin is smaller than Vlp but greater
than the average value of vbridge, the instantaneous control characteristic is lost but, asdemonstrated below, control of the average of iout is still possible and accurate. Thisproperty is useful if a voltage source greater than Vlp is not available, if the cost of thesystem should be reduced or to reduce fc (2.2.9).To compute the average value of vbridge (2.2.12) we consider half the lamp period
(2.2.12):
vbridge = 2Tlp
∫ Tlp/2
0vbridge dt (2.2.12)
Using the expression previously deduced in (2.2.5) and replacing in (2.2.12), vbridge isfound (2.2.13):
vbridge = Vth (DlpTlp − 2Tbr)Tlp
(2.2.13)
To find the minimum necessary Vin, we take the maximum value for the average ofvbridge. The worst case is obtained for Dlp=1 and Tbr much smaller compared to Tlp; inthis case vbridge = Vth. Then Vin should be selected greater than Vth to control iout inaverage. If this condition is fulfilled, as can be deduced from (2.2.6), an increment anddecrement of iout can be always accomplished. Nevertheless in this case instantaneouscontrol of iout is not possible because the current can exceed the hysteresis limits, asexplained below.When K2 is turned-on (K1 turned-off) in order to decrease iout and this commutation
instant coincides with a value of vbridge more negative than -Vin, iout will continue toincrease until vbridge > −Vin. In a similar manner, when K1 is turned-on (K2 turned-off)to rise the current value, iout will continue to fall if the vbridge instantaneous value ishigher than Vin (∆iout(k1 = −1) in Fig.2.6). In consequence, in some cases iout canpresent spikes exceeding the hysteretic limit points (imax, imin in Fig.2.6), however the
Power supplies for the study and efficient use of DBD excimer UV lamps David Flórez
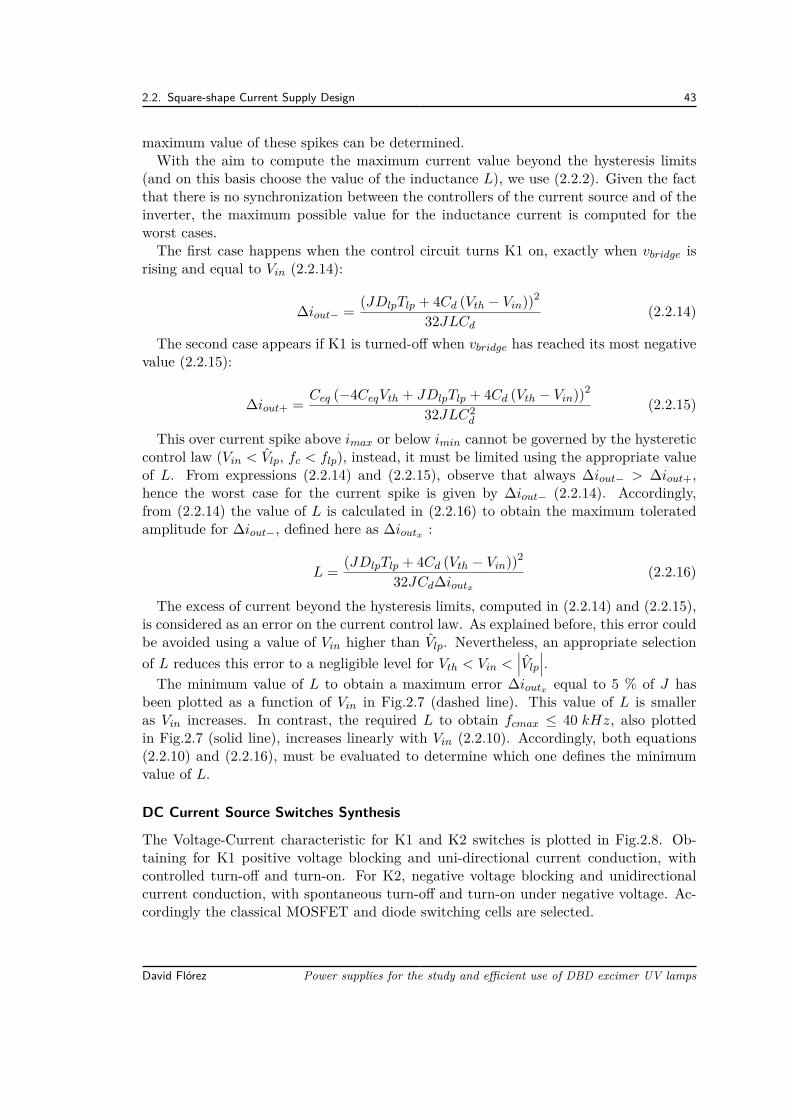
2.2. Square-shape Current Supply Design 43
maximum value of these spikes can be determined.With the aim to compute the maximum current value beyond the hysteresis limits
(and on this basis choose the value of the inductance L), we use (2.2.2). Given the factthat there is no synchronization between the controllers of the current source and of theinverter, the maximum possible value for the inductance current is computed for theworst cases.The first case happens when the control circuit turns K1 on, exactly when vbridge is
rising and equal to Vin (2.2.14):
∆iout− = (JDlpTlp + 4Cd (Vth − Vin))2
32JLCd(2.2.14)
The second case appears if K1 is turned-off when vbridge has reached its most negativevalue (2.2.15):
∆iout+ = Ceq (−4CeqVth + JDlpTlp + 4Cd (Vth − Vin))2
32JLC2d
(2.2.15)
This over current spike above imax or below imin cannot be governed by the hystereticcontrol law (Vin < Vlp, fc < flp), instead, it must be limited using the appropriate valueof L. From expressions (2.2.14) and (2.2.15), observe that always ∆iout− > ∆iout+,hence the worst case for the current spike is given by ∆iout− (2.2.14). Accordingly,from (2.2.14) the value of L is calculated in (2.2.16) to obtain the maximum toleratedamplitude for ∆iout−, defined here as ∆ioutx :
L = (JDlpTlp + 4Cd (Vth − Vin))2
32JCd∆ioutx
(2.2.16)
The excess of current beyond the hysteresis limits, computed in (2.2.14) and (2.2.15),is considered as an error on the current control law. As explained before, this error couldbe avoided using a value of Vin higher than Vlp. Nevertheless, an appropriate selectionof L reduces this error to a negligible level for Vth < Vin <
∣∣∣Vlp
∣∣∣.The minimum value of L to obtain a maximum error ∆ioutx equal to 5 % of J has
been plotted as a function of Vin in Fig.2.7 (dashed line). This value of L is smalleras Vin increases. In contrast, the required L to obtain fcmax ≤ 40 kHz, also plottedin Fig.2.7 (solid line), increases linearly with Vin (2.2.10). Accordingly, both equations(2.2.10) and (2.2.16), must be evaluated to determine which one defines the minimumvalue of L.
DC Current Source Switches Synthesis
The Voltage-Current characteristic for K1 and K2 switches is plotted in Fig.2.8. Ob-taining for K1 positive voltage blocking and uni-directional current conduction, withcontrolled turn-off and turn-on. For K2, negative voltage blocking and unidirectionalcurrent conduction, with spontaneous turn-off and turn-on under negative voltage. Ac-cordingly the classical MOSFET and diode switching cells are selected.
David Flórez Power supplies for the study and efficient use of DBD excimer UV lamps
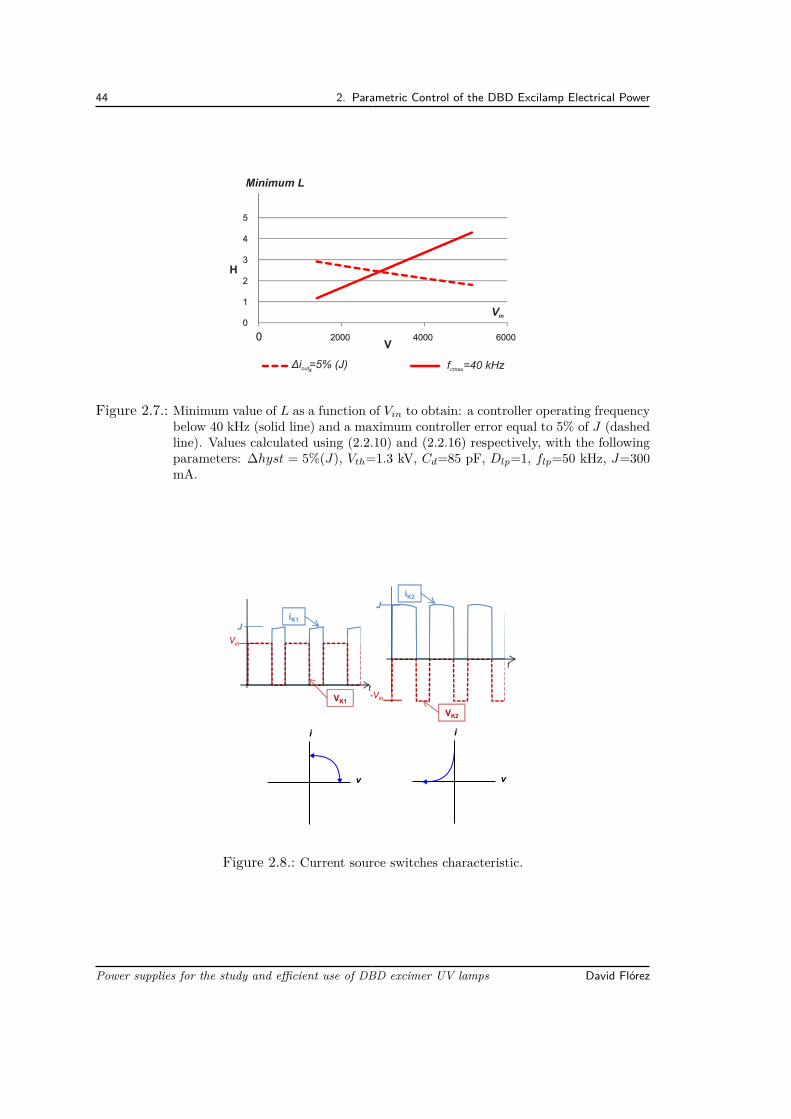
44 2. Parametric Control of the DBD Excilamp Electrical Power
0
1
2
3
4
5
0 2000 4000 6000
Δi =5% (J)outx f =40 kHzcmax
Minimum L
H
Vin
V
Figure 2.7.: Minimum value of L as a function of Vin to obtain: a controller operating frequencybelow 40 kHz (solid line) and a maximum controller error equal to 5% of J (dashedline). Values calculated using (2.2.10) and (2.2.16) respectively, with the followingparameters: ∆hyst = 5%(J), Vth=1.3 kV, Cd=85 pF, Dlp=1, flp=50 kHz, J=300mA.
VK2
iK2
-Vin
J
t
Vin
J
t
iK1
VK1
i
v
i
v
Figure 2.8.: Current source switches characteristic.
Power supplies for the study and efficient use of DBD excimer UV lamps David Flórez
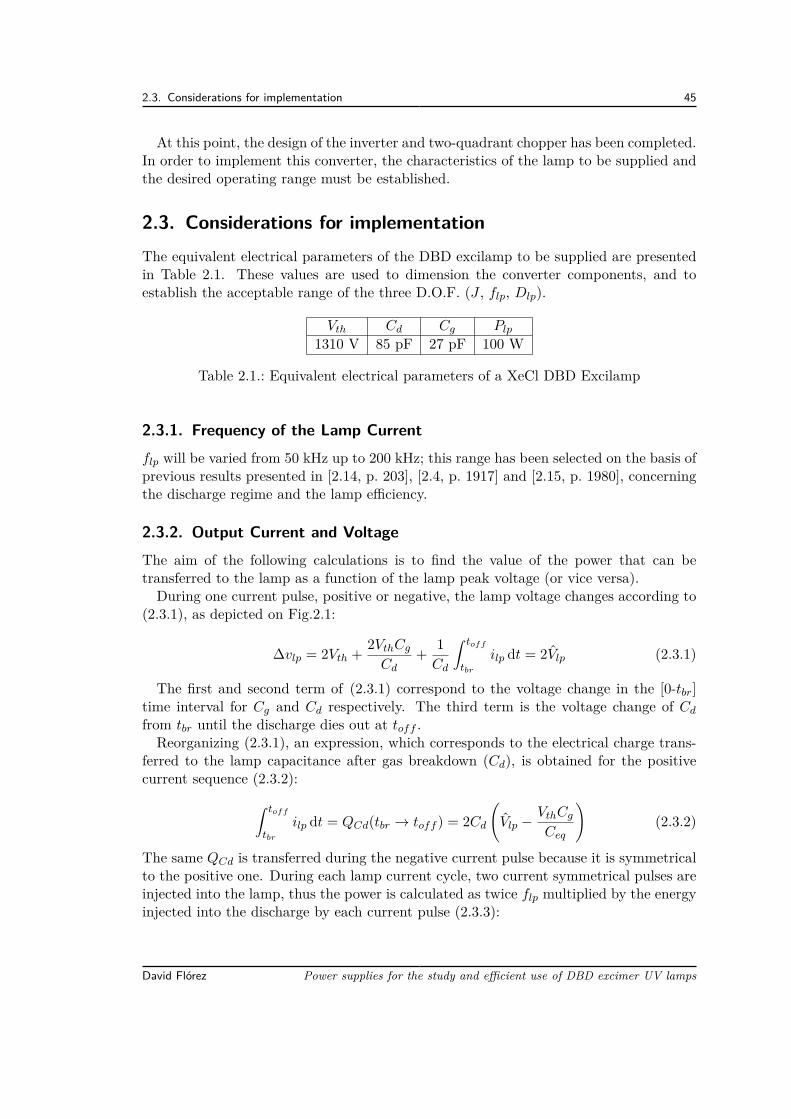
2.3. Considerations for implementation 45
At this point, the design of the inverter and two-quadrant chopper has been completed.In order to implement this converter, the characteristics of the lamp to be supplied andthe desired operating range must be established.
2.3. Considerations for implementationThe equivalent electrical parameters of the DBD excilamp to be supplied are presentedin Table 2.1. These values are used to dimension the converter components, and toestablish the acceptable range of the three D.O.F. (J , flp, Dlp).
Vth Cd Cg Plp
1310 V 85 pF 27 pF 100 W
Table 2.1.: Equivalent electrical parameters of a XeCl DBD Excilamp
2.3.1. Frequency of the Lamp Currentflp will be varied from 50 kHz up to 200 kHz; this range has been selected on the basis ofprevious results presented in [2.14, p. 203], [2.4, p. 1917] and [2.15, p. 1980], concerningthe discharge regime and the lamp efficiency.
2.3.2. Output Current and VoltageThe aim of the following calculations is to find the value of the power that can betransferred to the lamp as a function of the lamp peak voltage (or vice versa).During one current pulse, positive or negative, the lamp voltage changes according to
(2.3.1), as depicted on Fig.2.1:
∆vlp = 2Vth + 2VthCg
Cd+ 1Cd
∫ toff
tbr
ilp dt = 2Vlp (2.3.1)
The first and second term of (2.3.1) correspond to the voltage change in the [0-tbr]time interval for Cg and Cd respectively. The third term is the voltage change of Cd
from tbr until the discharge dies out at toff .Reorganizing (2.3.1), an expression, which corresponds to the electrical charge trans-
ferred to the lamp capacitance after gas breakdown (Cd), is obtained for the positivecurrent sequence (2.3.2):
∫ toff
tbr
ilp dt = QCd(tbr → toff ) = 2Cd
(Vlp −
VthCg
Ceq
)(2.3.2)
The same QCd is transferred during the negative current pulse because it is symmetricalto the positive one. During each lamp current cycle, two current symmetrical pulses areinjected into the lamp, thus the power is calculated as twice flp multiplied by the energyinjected into the discharge by each current pulse (2.3.3):
David Flórez Power supplies for the study and efficient use of DBD excimer UV lamps
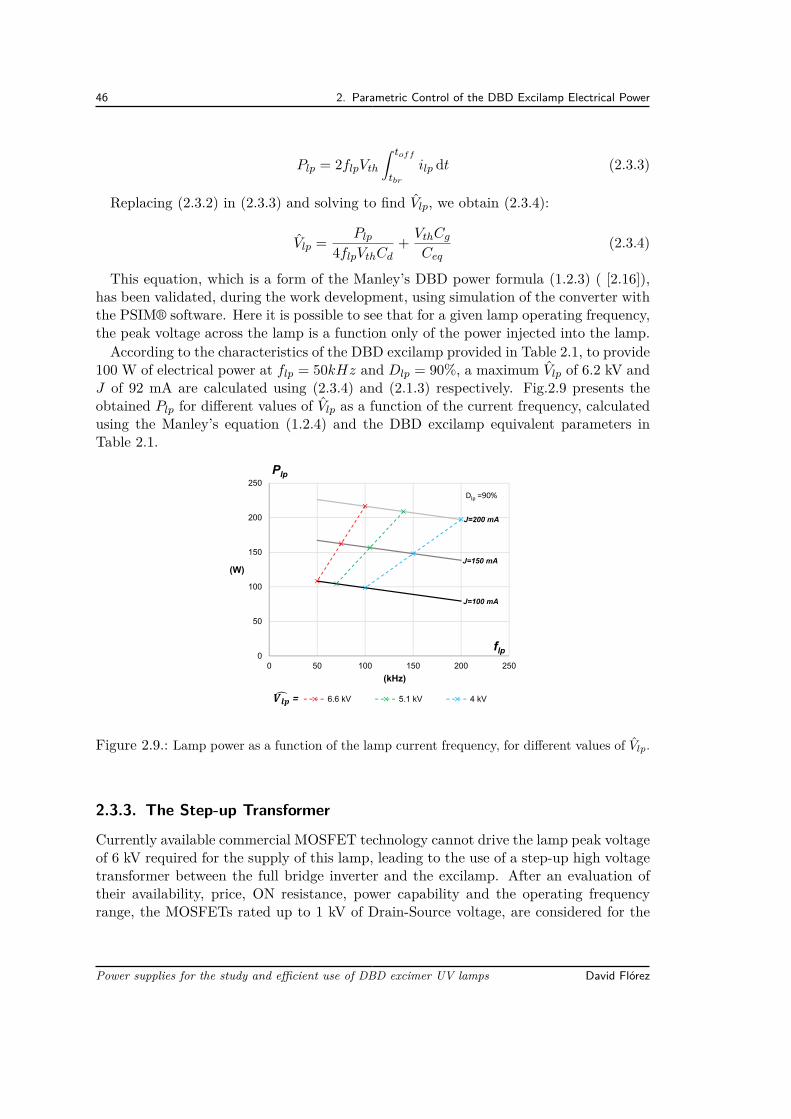
46 2. Parametric Control of the DBD Excilamp Electrical Power
Plp = 2flpVth
∫ toff
tbr
ilp dt (2.3.3)
Replacing (2.3.2) in (2.3.3) and solving to find Vlp, we obtain (2.3.4):
Vlp = Plp
4flpVthCd+ VthCg
Ceq(2.3.4)
This equation, which is a form of the Manley’s DBD power formula (1.2.3) ( [2.16]),has been validated, during the work development, using simulation of the converter withthe PSIM® software. Here it is possible to see that for a given lamp operating frequency,the peak voltage across the lamp is a function only of the power injected into the lamp.According to the characteristics of the DBD excilamp provided in Table 2.1, to provide
100 W of electrical power at flp = 50kHz and Dlp = 90%, a maximum Vlp of 6.2 kV andJ of 92 mA are calculated using (2.3.4) and (2.1.3) respectively. Fig.2.9 presents theobtained Plp for different values of Vlp as a function of the current frequency, calculatedusing the Manley’s equation (1.2.4) and the DBD excilamp equivalent parameters inTable 2.1.
0
50
100
150
200
250
0 50 100 150 200 250
Plp
(W)
(kHz)
6.6 kV 5.1 kV 4 kV
Dlp =90%
=
J=100 mA
J=150 mA
J=200 mA
flp
Figure 2.9.: Lamp power as a function of the lamp current frequency, for different values of Vlp.
2.3.3. The Step-up Transformer
Currently available commercial MOSFET technology cannot drive the lamp peak voltageof 6 kV required for the supply of this lamp, leading to the use of a step-up high voltagetransformer between the full bridge inverter and the excilamp. After an evaluation oftheir availability, price, ON resistance, power capability and the operating frequencyrange, the MOSFETs rated up to 1 kV of Drain-Source voltage, are considered for the
Power supplies for the study and efficient use of DBD excimer UV lamps David Flórez
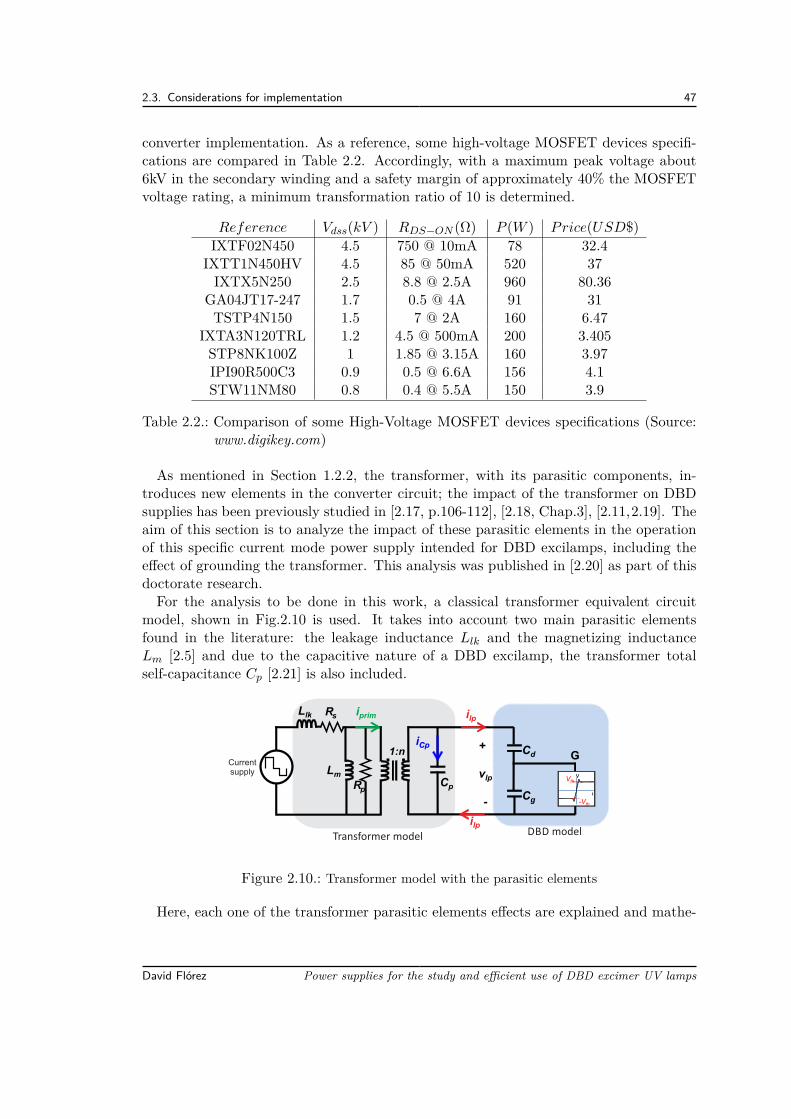
2.3. Considerations for implementation 47
converter implementation. As a reference, some high-voltage MOSFET devices specifi-cations are compared in Table 2.2. Accordingly, with a maximum peak voltage about6kV in the secondary winding and a safety margin of approximately 40% the MOSFETvoltage rating, a minimum transformation ratio of 10 is determined.
Reference Vdss(kV ) RDS−ON (Ω) P (W ) Price(USD$)IXTF02N450 4.5 750 @ 10mA 78 32.4
IXTT1N450HV 4.5 85 @ 50mA 520 37IXTX5N250 2.5 8.8 @ 2.5A 960 80.36
GA04JT17-247 1.7 0.5 @ 4A 91 31TSTP4N150 1.5 7 @ 2A 160 6.47
IXTA3N120TRL 1.2 4.5 @ 500mA 200 3.405STP8NK100Z 1 1.85 @ 3.15A 160 3.97IPI90R500C3 0.9 0.5 @ 6.6A 156 4.1STW11NM80 0.8 0.4 @ 5.5A 150 3.9
Table 2.2.: Comparison of some High-Voltage MOSFET devices specifications (Source:www.digikey.com)
As mentioned in Section 1.2.2, the transformer, with its parasitic components, in-troduces new elements in the converter circuit; the impact of the transformer on DBDsupplies has been previously studied in [2.17, p.106-112], [2.18, Chap.3], [2.11,2.19]. Theaim of this section is to analyze the impact of these parasitic elements in the operationof this specific current mode power supply intended for DBD excilamps, including theeffect of grounding the transformer. This analysis was published in [2.20] as part of thisdoctorate research.For the analysis to be done in this work, a classical transformer equivalent circuit
model, shown in Fig.2.10 is used. It takes into account two main parasitic elementsfound in the literature: the leakage inductance Llk and the magnetizing inductanceLm [2.5] and due to the capacitive nature of a DBD excilamp, the transformer totalself-capacitance Cp [2.21] is also included.
G. .1:n
Cp
iprim ilp
+
vlp
-
ilp
iCp
Cg
Cd
i
-Vth
Vthv
Llk
Lm
DBD modelTransformer model
Current supply
Rs
Rp
Figure 2.10.: Transformer model with the parasitic elements
Here, each one of the transformer parasitic elements effects are explained and mathe-
David Flórez Power supplies for the study and efficient use of DBD excimer UV lamps
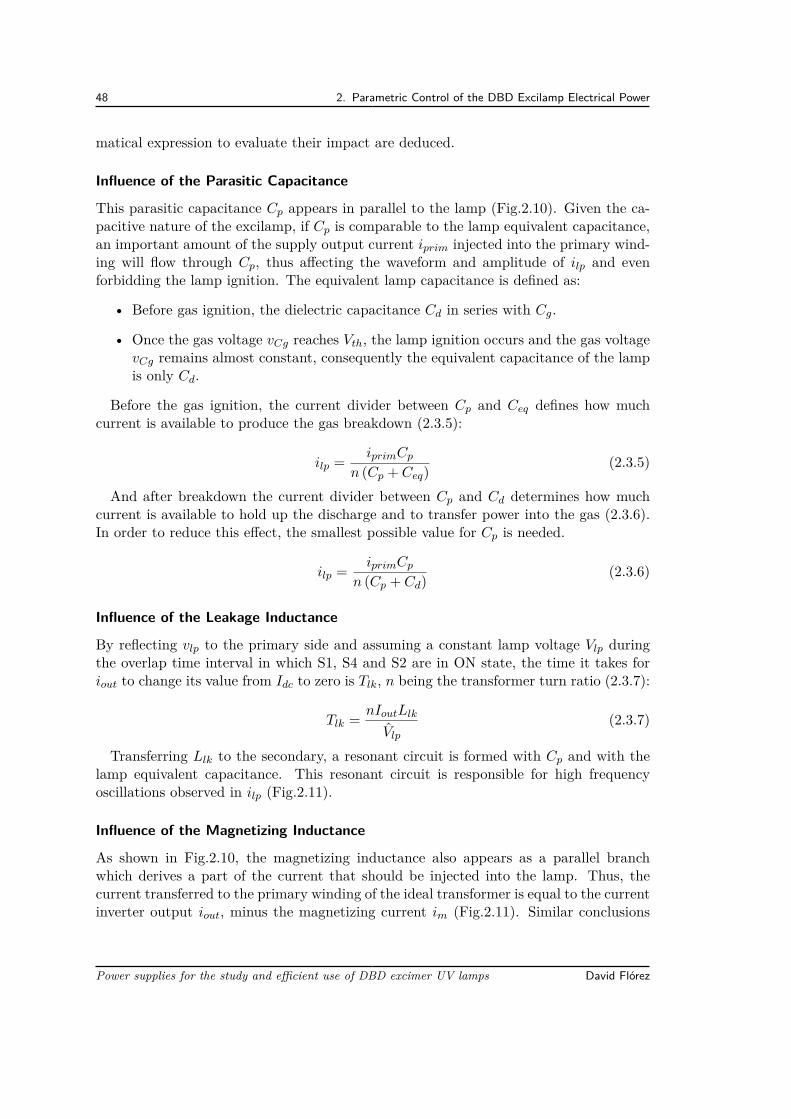
48 2. Parametric Control of the DBD Excilamp Electrical Power
matical expression to evaluate their impact are deduced.
Influence of the Parasitic Capacitance
This parasitic capacitance Cp appears in parallel to the lamp (Fig.2.10). Given the ca-pacitive nature of the excilamp, if Cp is comparable to the lamp equivalent capacitance,an important amount of the supply output current iprim injected into the primary wind-ing will flow through Cp, thus affecting the waveform and amplitude of ilp and evenforbidding the lamp ignition. The equivalent lamp capacitance is defined as:
• Before gas ignition, the dielectric capacitance Cd in series with Cg.
• Once the gas voltage vCg reaches Vth, the lamp ignition occurs and the gas voltagevCg remains almost constant, consequently the equivalent capacitance of the lampis only Cd.
Before the gas ignition, the current divider between Cp and Ceq defines how muchcurrent is available to produce the gas breakdown (2.3.5):
ilp = iprimCp
n (Cp + Ceq) (2.3.5)
And after breakdown the current divider between Cp and Cd determines how muchcurrent is available to hold up the discharge and to transfer power into the gas (2.3.6).In order to reduce this effect, the smallest possible value for Cp is needed.
ilp = iprimCp
n (Cp + Cd) (2.3.6)
Influence of the Leakage Inductance
By reflecting vlp to the primary side and assuming a constant lamp voltage Vlp duringthe overlap time interval in which S1, S4 and S2 are in ON state, the time it takes foriout to change its value from Idc to zero is Tlk, n being the transformer turn ratio (2.3.7):
Tlk = nIoutLlk
Vlp
(2.3.7)
Transferring Llk to the secondary, a resonant circuit is formed with Cp and with thelamp equivalent capacitance. This resonant circuit is responsible for high frequencyoscillations observed in ilp (Fig.2.11).
Influence of the Magnetizing Inductance
As shown in Fig.2.10, the magnetizing inductance also appears as a parallel branchwhich derives a part of the current that should be injected into the lamp. Thus, thecurrent transferred to the primary winding of the ideal transformer is equal to the currentinverter output iout, minus the magnetizing current im (Fig.2.11). Similar conclusions
Power supplies for the study and efficient use of DBD excimer UV lamps David Flórez
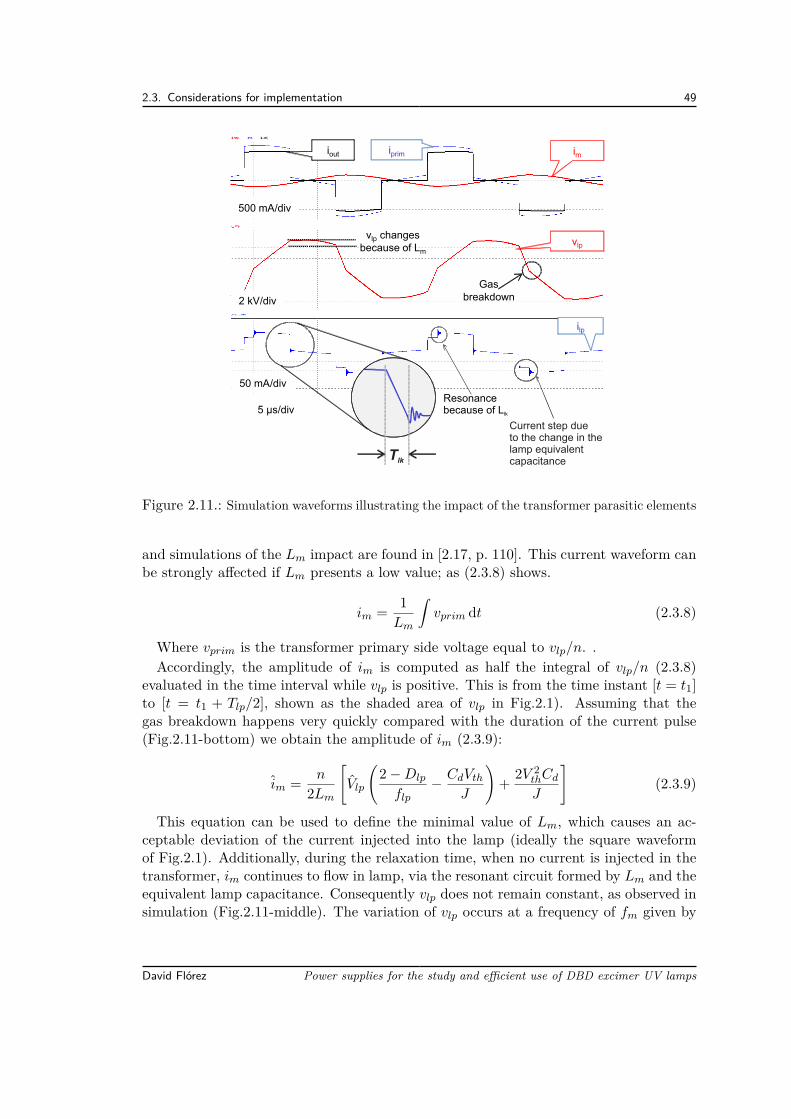
2.3. Considerations for implementation 49
vlp
imiprimiout
500 mA/div
5 μs/div
2 kV/div
Gas breakdown
vlp changes because of Lm
50 mA/div
ilp
Resonancebecause of L lk
Tlk
Current step dueto the change in thelamp equivalentcapacitance
Figure 2.11.: Simulation waveforms illustrating the impact of the transformer parasitic elements
and simulations of the Lm impact are found in [2.17, p. 110]. This current waveform canbe strongly affected if Lm presents a low value; as (2.3.8) shows.
im = 1Lm
∫vprim dt (2.3.8)
Where vprim is the transformer primary side voltage equal to vlp/n. .Accordingly, the amplitude of im is computed as half the integral of vlp/n (2.3.8)
evaluated in the time interval while vlp is positive. This is from the time instant [t = t1]to [t = t1 + Tlp/2], shown as the shaded area of vlp in Fig.2.1). Assuming that thegas breakdown happens very quickly compared with the duration of the current pulse(Fig.2.11-bottom) we obtain the amplitude of im (2.3.9):
im = n
2Lm
[Vlp
(2−Dlp
flp− CdVth
J
)+ 2V 2
thCd
J
](2.3.9)
This equation can be used to define the minimal value of Lm, which causes an ac-ceptable deviation of the current injected into the lamp (ideally the square waveformof Fig.2.1). Additionally, during the relaxation time, when no current is injected in thetransformer, im continues to flow in lamp, via the resonant circuit formed by Lm and theequivalent lamp capacitance. Consequently vlp does not remain constant, as observed insimulation (Fig.2.11-middle). The variation of vlp occurs at a frequency of fm given by
David Flórez Power supplies for the study and efficient use of DBD excimer UV lamps
50 2. Parametric Control of the DBD Excilamp Electrical Power
(2.3.10) with a maximum decay calculated in expression (2.3.11). Using these equations,the impact of Lm in the current waveform can be calculated.
fm = 12π√Lm (Cp + Ceq)n2
(2.3.10)
∆vm = im4πfm (Cp + Ceq)n2 (2.3.11)
From the ideas exposed before and as should be expected from the ideal transformermodel, Lm must be maximized and Cp minimized to reduce their impact in the supplyoperation. In order to obtain higher values of Lm the number of transformer turnsmust be high and in contrast, as demonstrated in [2.22, 2.23], a high number of turnsincrease the value of Cp. To obtain a balance between these opposite criteria, theminimum possible transformer turns ratio, 10 in this case, should be selected. Next,the transformer design to accomplish the required characteristics is presented, togetherwith the choice of the other converter components.
2.4. Components selection
On the basis of the considerations presented in Section 2.3, the design of the high-voltagetransformer and its characterization is presented first. Then, the choice of the currentsource inductance value and the references of the converter switches, are justified.
2.4.1. Transformer
According to the lamp specifications, power supply operating range and considering theimpact of the parasitic elements described in the precedent Section 2.3.3, a transformerhas been designed, manufactured and tested for this converter. With the aim to evaluatethe transformer performance, an experimental measurement of the obtained parasiticelements values and experimental waveforms of interest are presented.
Electrical Requirements
In Section 2.3.2 was determined a maximum Vlp of about 6 kV (Plp = 100 W, flp =50kHz). Accordingly, in Section 2.3.3 a 1:10 transformation ratio is selected, in order toobtain a peak voltage of 600 V in the primary side and across the inverter semiconductors.In the other hand, using (2.1.3) and (2.1.6) a maximum lamp peak current of about150 mA is calculated to supply 100 W at 200 kHz with Dlp = 80 %. With 1:10 astransformation ratio, 1.5 A peak current is driven by the primary winding. With thiscurrent intensity and a maximum operating frequency of 200 kHz, skin and proximityeffects become important and the use of Litz wire is necessary. On the basis of theseoperating conditions, a transformer construction is proposed.
Power supplies for the study and efficient use of DBD excimer UV lamps David Flórez
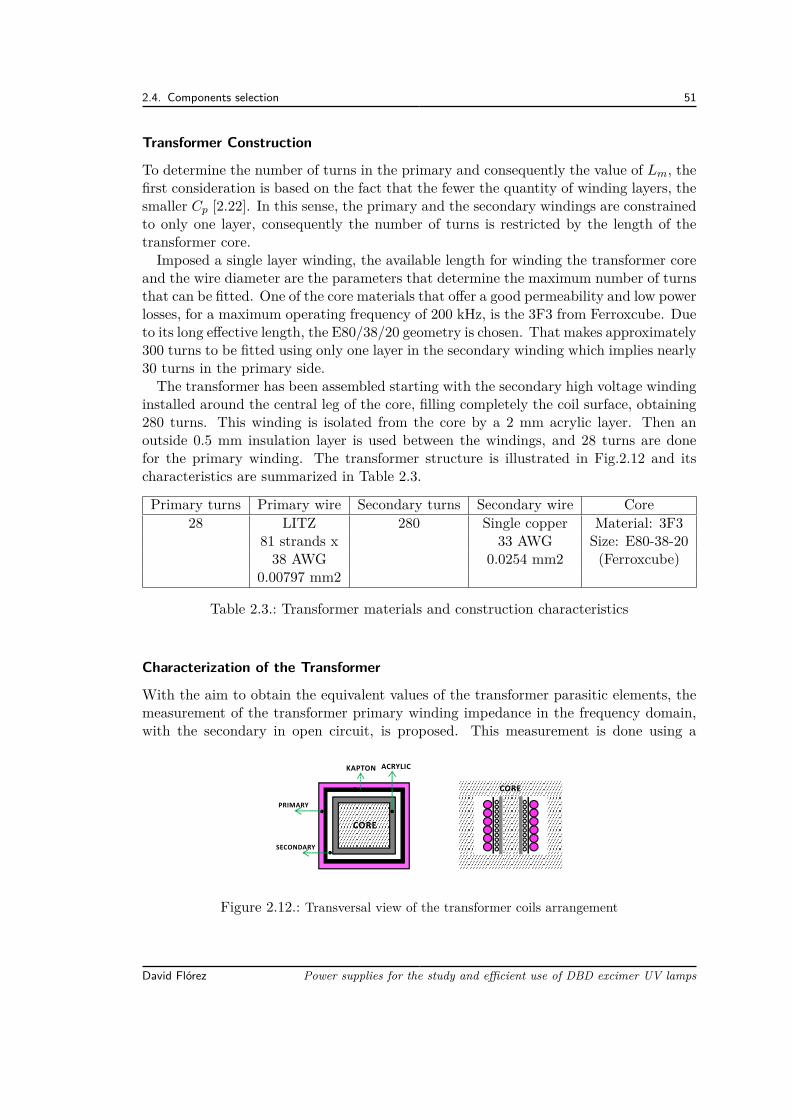
2.4. Components selection 51
Transformer Construction
To determine the number of turns in the primary and consequently the value of Lm, thefirst consideration is based on the fact that the fewer the quantity of winding layers, thesmaller Cp [2.22]. In this sense, the primary and the secondary windings are constrainedto only one layer, consequently the number of turns is restricted by the length of thetransformer core.Imposed a single layer winding, the available length for winding the transformer core
and the wire diameter are the parameters that determine the maximum number of turnsthat can be fitted. One of the core materials that offer a good permeability and low powerlosses, for a maximum operating frequency of 200 kHz, is the 3F3 from Ferroxcube. Dueto its long effective length, the E80/38/20 geometry is chosen. That makes approximately300 turns to be fitted using only one layer in the secondary winding which implies nearly30 turns in the primary side.The transformer has been assembled starting with the secondary high voltage winding
installed around the central leg of the core, filling completely the coil surface, obtaining280 turns. This winding is isolated from the core by a 2 mm acrylic layer. Then anoutside 0.5 mm insulation layer is used between the windings, and 28 turns are donefor the primary winding. The transformer structure is illustrated in Fig.2.12 and itscharacteristics are summarized in Table 2.3.
Primary turns Primary wire Secondary turns Secondary wire Core28 LITZ 280 Single copper Material: 3F3
81 strands x 33 AWG Size: E80-38-2038 AWG 0.0254 mm2 (Ferroxcube)
0.00797 mm2
Table 2.3.: Transformer materials and construction characteristics
Characterization of the Transformer
With the aim to obtain the equivalent values of the transformer parasitic elements, themeasurement of the transformer primary winding impedance in the frequency domain,with the secondary in open circuit, is proposed. This measurement is done using a
CORE
CORE
ACRYLIC
PRIMARY
SECONDARY
KAPTON
Figure 2.12.: Transversal view of the transformer coils arrangement
David Flórez Power supplies for the study and efficient use of DBD excimer UV lamps
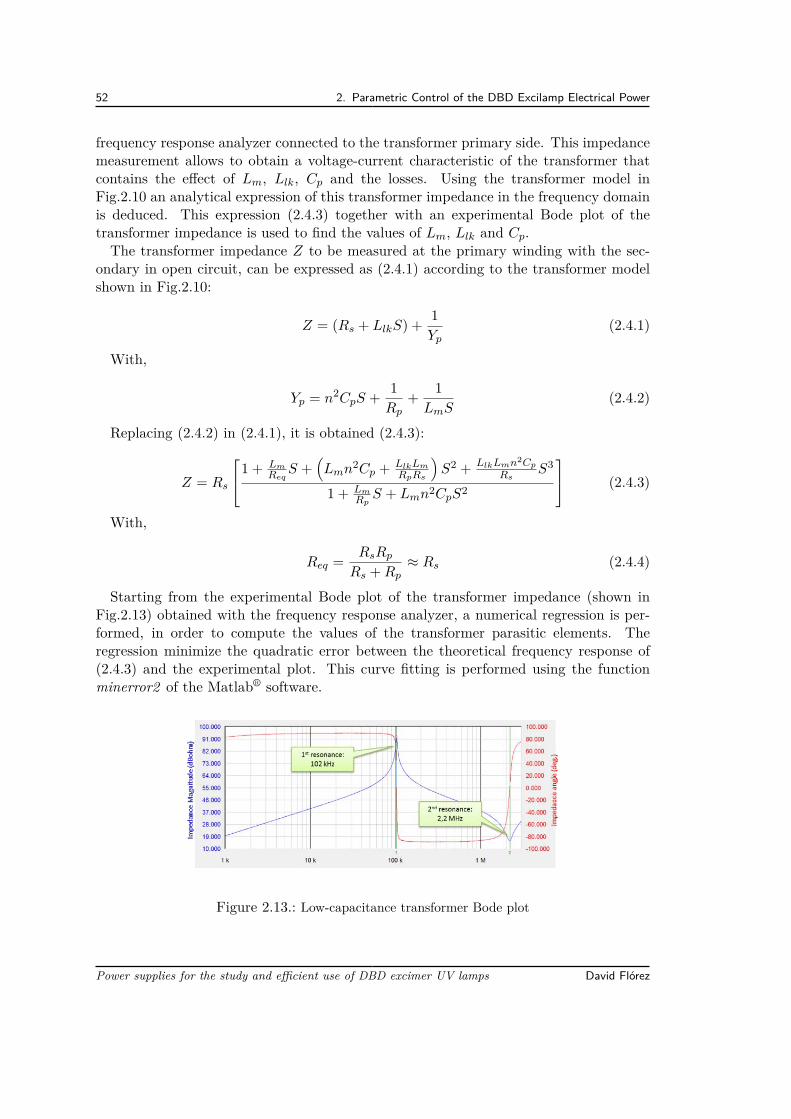
52 2. Parametric Control of the DBD Excilamp Electrical Power
frequency response analyzer connected to the transformer primary side. This impedancemeasurement allows to obtain a voltage-current characteristic of the transformer thatcontains the effect of Lm, Llk, Cp and the losses. Using the transformer model inFig.2.10 an analytical expression of this transformer impedance in the frequency domainis deduced. This expression (2.4.3) together with an experimental Bode plot of thetransformer impedance is used to find the values of Lm, Llk and Cp.The transformer impedance Z to be measured at the primary winding with the sec-
ondary in open circuit, can be expressed as (2.4.1) according to the transformer modelshown in Fig.2.10:
Z = (Rs + LlkS) + 1Yp
(2.4.1)
With,
Yp = n2CpS + 1Rp
+ 1LmS
(2.4.2)
Replacing (2.4.2) in (2.4.1), it is obtained (2.4.3):
Z = Rs
1 + LmReq
S +(Lmn
2Cp + LlkLm
RpRs
)S2 + LlkLmn2Cp
RsS3
1 + LmRpS + Lmn2CpS2
(2.4.3)
With,
Req = RsRp
Rs +Rp≈ Rs (2.4.4)
Starting from the experimental Bode plot of the transformer impedance (shown inFig.2.13) obtained with the frequency response analyzer, a numerical regression is per-formed, in order to compute the values of the transformer parasitic elements. Theregression minimize the quadratic error between the theoretical frequency response of(2.4.3) and the experimental plot. This curve fitting is performed using the functionminerror2 of the Matlab® software.
Figure 2.13.: Low-capacitance transformer Bode plot
Power supplies for the study and efficient use of DBD excimer UV lamps David Flórez
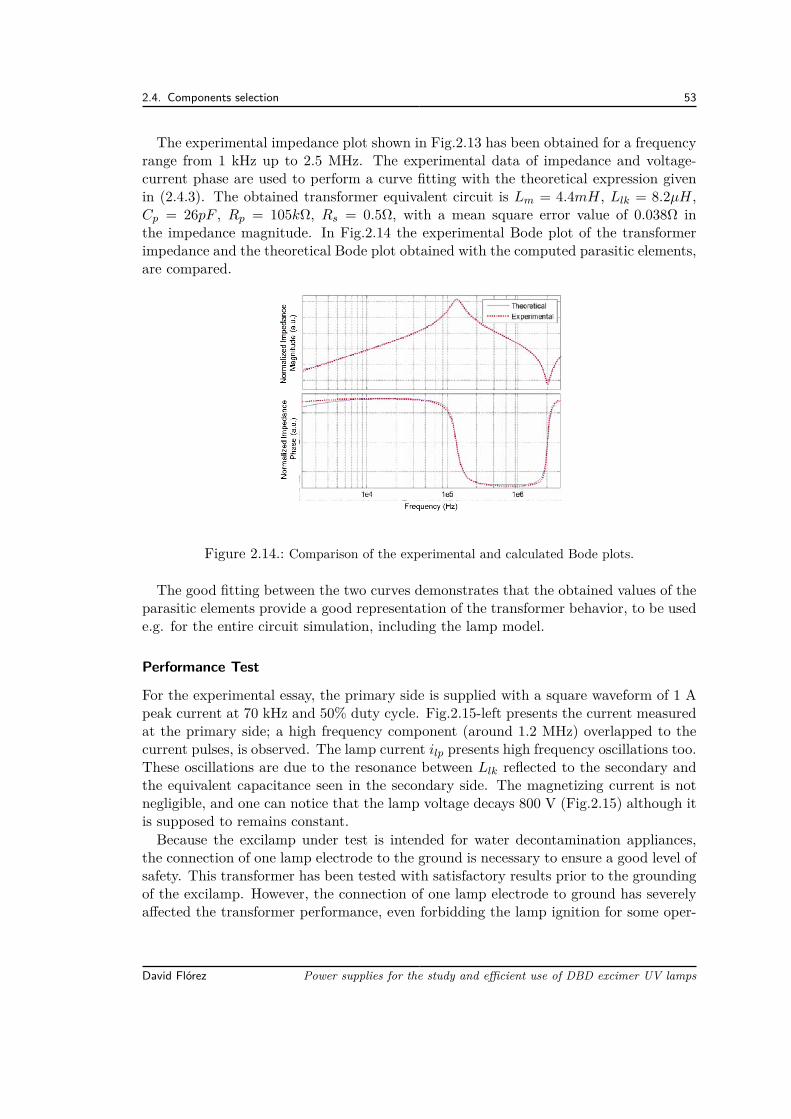
2.4. Components selection 53
The experimental impedance plot shown in Fig.2.13 has been obtained for a frequencyrange from 1 kHz up to 2.5 MHz. The experimental data of impedance and voltage-current phase are used to perform a curve fitting with the theoretical expression givenin (2.4.3). The obtained transformer equivalent circuit is Lm = 4.4mH, Llk = 8.2µH,Cp = 26pF , Rp = 105kΩ, Rs = 0.5Ω, with a mean square error value of 0.038Ω inthe impedance magnitude. In Fig.2.14 the experimental Bode plot of the transformerimpedance and the theoretical Bode plot obtained with the computed parasitic elements,are compared.
Figure 2.14.: Comparison of the experimental and calculated Bode plots.
The good fitting between the two curves demonstrates that the obtained values of theparasitic elements provide a good representation of the transformer behavior, to be usede.g. for the entire circuit simulation, including the lamp model.
Performance Test
For the experimental essay, the primary side is supplied with a square waveform of 1 Apeak current at 70 kHz and 50% duty cycle. Fig.2.15-left presents the current measuredat the primary side; a high frequency component (around 1.2 MHz) overlapped to thecurrent pulses, is observed. The lamp current ilp presents high frequency oscillations too.These oscillations are due to the resonance between Llk reflected to the secondary andthe equivalent capacitance seen in the secondary side. The magnetizing current is notnegligible, and one can notice that the lamp voltage decays 800 V (Fig.2.15) although itis supposed to remains constant.Because the excilamp under test is intended for water decontamination appliances,
the connection of one lamp electrode to the ground is necessary to ensure a good level ofsafety. This transformer has been tested with satisfactory results prior to the groundingof the excilamp. However, the connection of one lamp electrode to ground has severelyaffected the transformer performance, even forbidding the lamp ignition for some oper-
David Flórez Power supplies for the study and efficient use of DBD excimer UV lamps
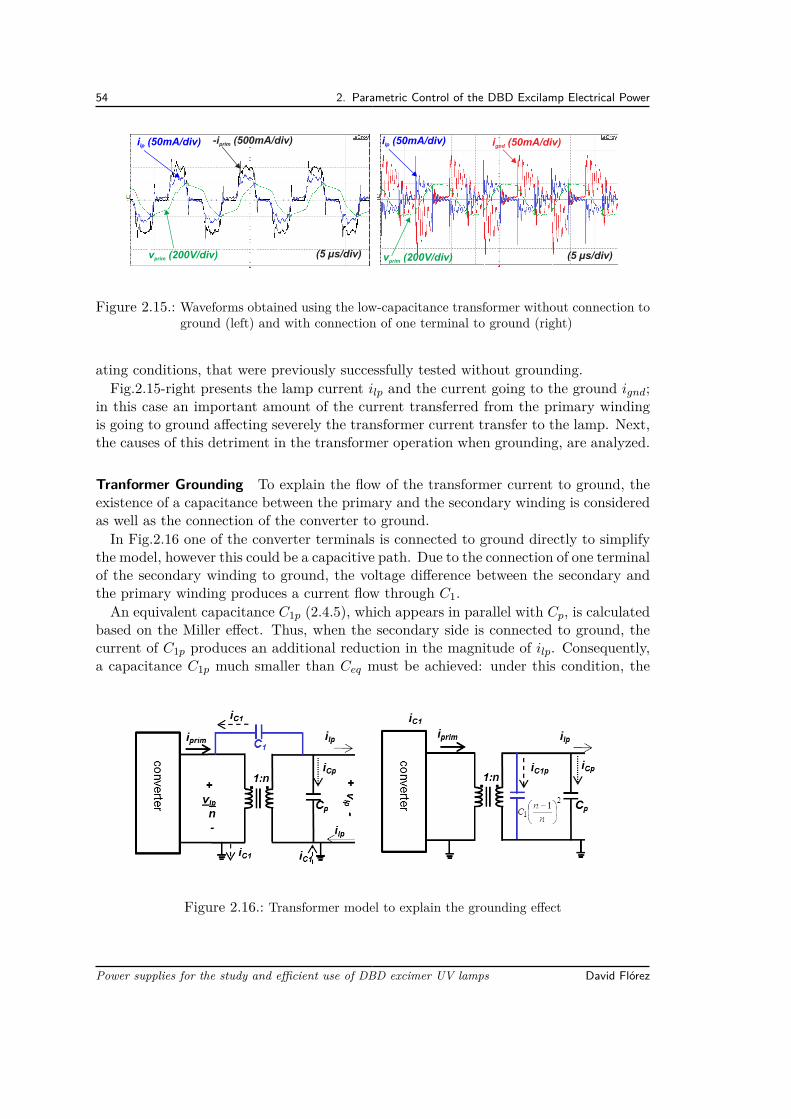
54 2. Parametric Control of the DBD Excilamp Electrical Power
i (50mA/div)lp-i (500mA/div)prim
v (200V/div)prim(5 µs/div)
i (50mA/div)lp
v (200V/div)prim
i (50mA/div)gnd
(5 µs/div)
Figure 2.15.: Waveforms obtained using the low-capacitance transformer without connection toground (left) and with connection of one terminal to ground (right)
ating conditions, that were previously successfully tested without grounding.Fig.2.15-right presents the lamp current ilp and the current going to the ground ignd;
in this case an important amount of the current transferred from the primary windingis going to ground affecting severely the transformer current transfer to the lamp. Next,the causes of this detriment in the transformer operation when grounding, are analyzed.
Tranformer Grounding To explain the flow of the transformer current to ground, theexistence of a capacitance between the primary and the secondary winding is consideredas well as the connection of the converter to ground.In Fig.2.16 one of the converter terminals is connected to ground directly to simplify
the model, however this could be a capacitive path. Due to the connection of one terminalof the secondary winding to ground, the voltage difference between the secondary andthe primary winding produces a current flow through C1.An equivalent capacitance C1p (2.4.5), which appears in parallel with Cp, is calculated
based on the Miller effect. Thus, when the secondary side is connected to ground, thecurrent of C1p produces an additional reduction in the magnitude of ilp. Consequently,a capacitance C1p much smaller than Ceq must be achieved: under this condition, the
Figure 2.16.: Transformer model to explain the grounding effect
Power supplies for the study and efficient use of DBD excimer UV lamps David Flórez
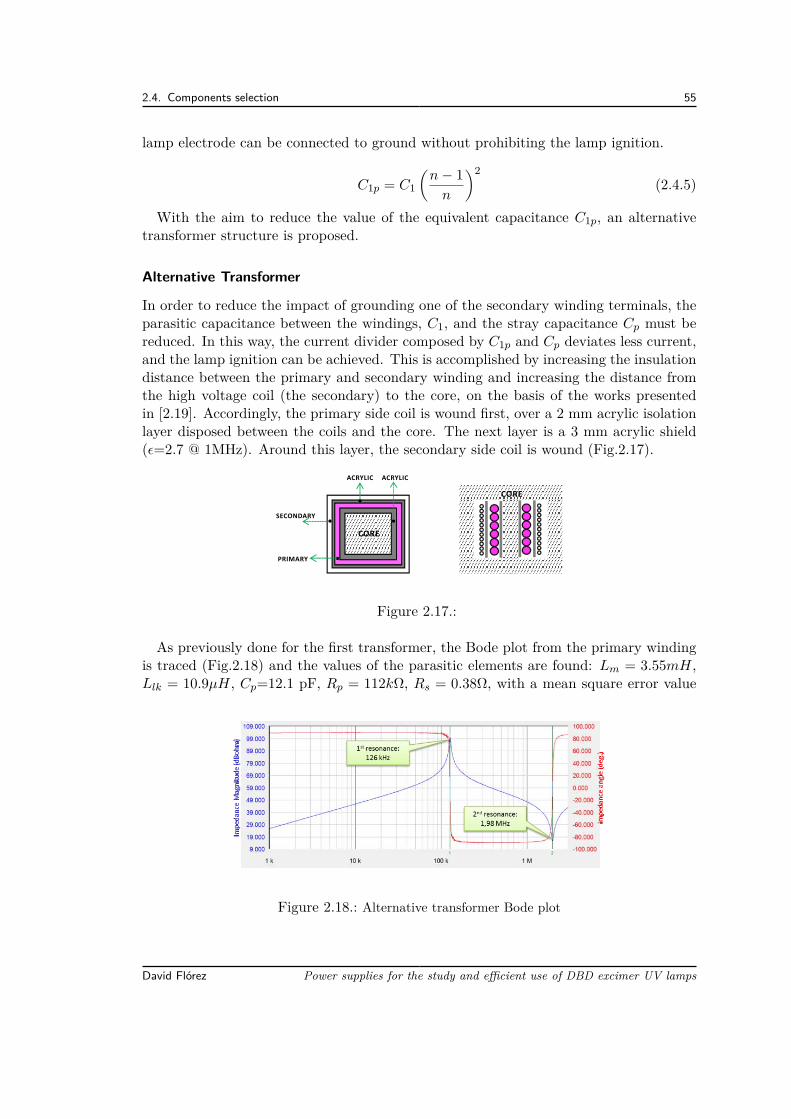
2.4. Components selection 55
lamp electrode can be connected to ground without prohibiting the lamp ignition.
C1p = C1
(n− 1n
)2(2.4.5)
With the aim to reduce the value of the equivalent capacitance C1p, an alternativetransformer structure is proposed.
Alternative Transformer
In order to reduce the impact of grounding one of the secondary winding terminals, theparasitic capacitance between the windings, C1, and the stray capacitance Cp must bereduced. In this way, the current divider composed by C1p and Cp deviates less current,and the lamp ignition can be achieved. This is accomplished by increasing the insulationdistance between the primary and secondary winding and increasing the distance fromthe high voltage coil (the secondary) to the core, on the basis of the works presentedin [2.19]. Accordingly, the primary side coil is wound first, over a 2 mm acrylic isolationlayer disposed between the coils and the core. The next layer is a 3 mm acrylic shield(ε=2.7 @ 1MHz). Around this layer, the secondary side coil is wound (Fig.2.17).
CORE
ACRYLIC
SECONDARY
ACRYLIC
PRIMARY
CORE
Figure 2.17.:
As previously done for the first transformer, the Bode plot from the primary windingis traced (Fig.2.18) and the values of the parasitic elements are found: Lm = 3.55mH,Llk = 10.9µH, Cp=12.1 pF, Rp = 112kΩ, Rs = 0.38Ω, with a mean square error value
Figure 2.18.: Alternative transformer Bode plot
David Flórez Power supplies for the study and efficient use of DBD excimer UV lamps
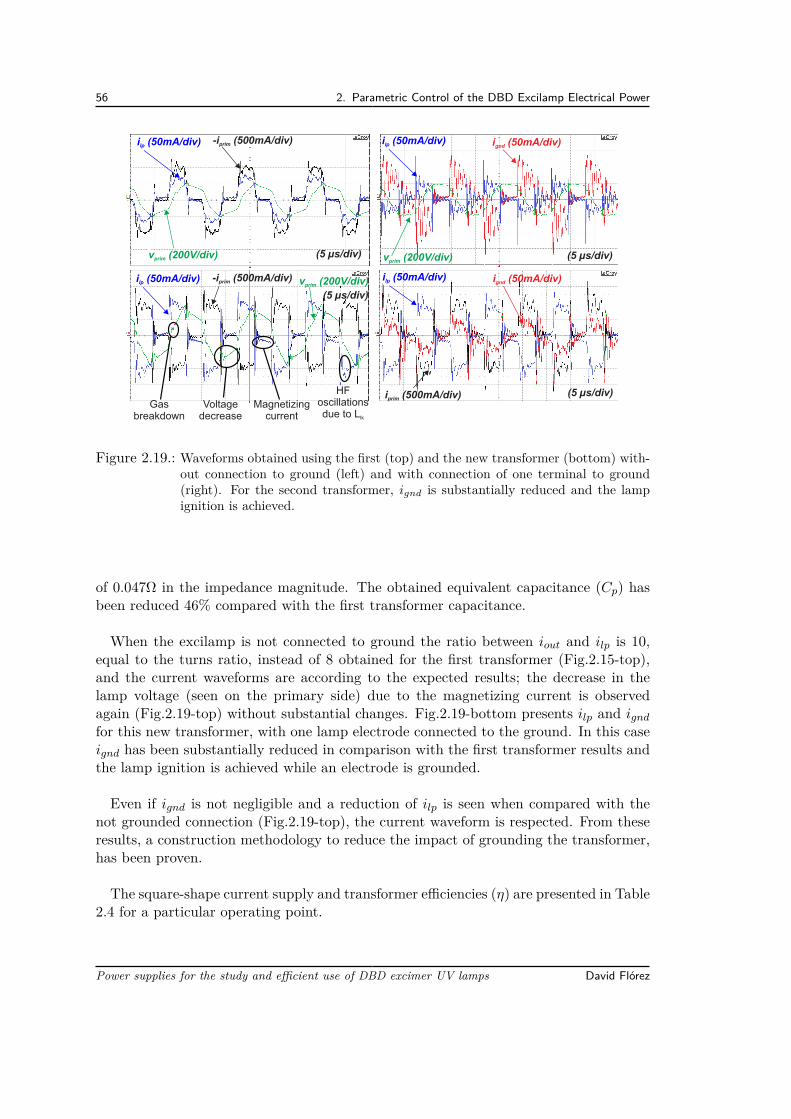
56 2. Parametric Control of the DBD Excilamp Electrical Power
i (50mA/div)lp-i (500mA/div)prim
v (200V/div)prim(5 µs/div)
i (50mA/div)lp i (50mA/div)gnd
i (500mA/div)prim
i (50mA/div)lp
v (200V/div)prim
i (50mA/div)gnd
(5 µs/div)
(5 µs/div)
i (50mA/div)lp-i (500mA/div)prim v (200V/div)prim
Gasbreakdown
Voltagedecrease
Magnetizingcurrent
HF oscillationsdue to Llk
(5 µs/div)
Figure 2.19.: Waveforms obtained using the first (top) and the new transformer (bottom) with-out connection to ground (left) and with connection of one terminal to ground(right). For the second transformer, ignd is substantially reduced and the lampignition is achieved.
of 0.047Ω in the impedance magnitude. The obtained equivalent capacitance (Cp) hasbeen reduced 46% compared with the first transformer capacitance.
When the excilamp is not connected to ground the ratio between iout and ilp is 10,equal to the turns ratio, instead of 8 obtained for the first transformer (Fig.2.15-top),and the current waveforms are according to the expected results; the decrease in thelamp voltage (seen on the primary side) due to the magnetizing current is observedagain (Fig.2.19-top) without substantial changes. Fig.2.19-bottom presents ilp and ignd
for this new transformer, with one lamp electrode connected to the ground. In this caseignd has been substantially reduced in comparison with the first transformer results andthe lamp ignition is achieved while an electrode is grounded.
Even if ignd is not negligible and a reduction of ilp is seen when compared with thenot grounded connection (Fig.2.19-top), the current waveform is respected. From theseresults, a construction methodology to reduce the impact of grounding the transformer,has been proven.
The square-shape current supply and transformer efficiencies (η) are presented in Table2.4 for a particular operating point.
Power supplies for the study and efficient use of DBD excimer UV lamps David Flórez
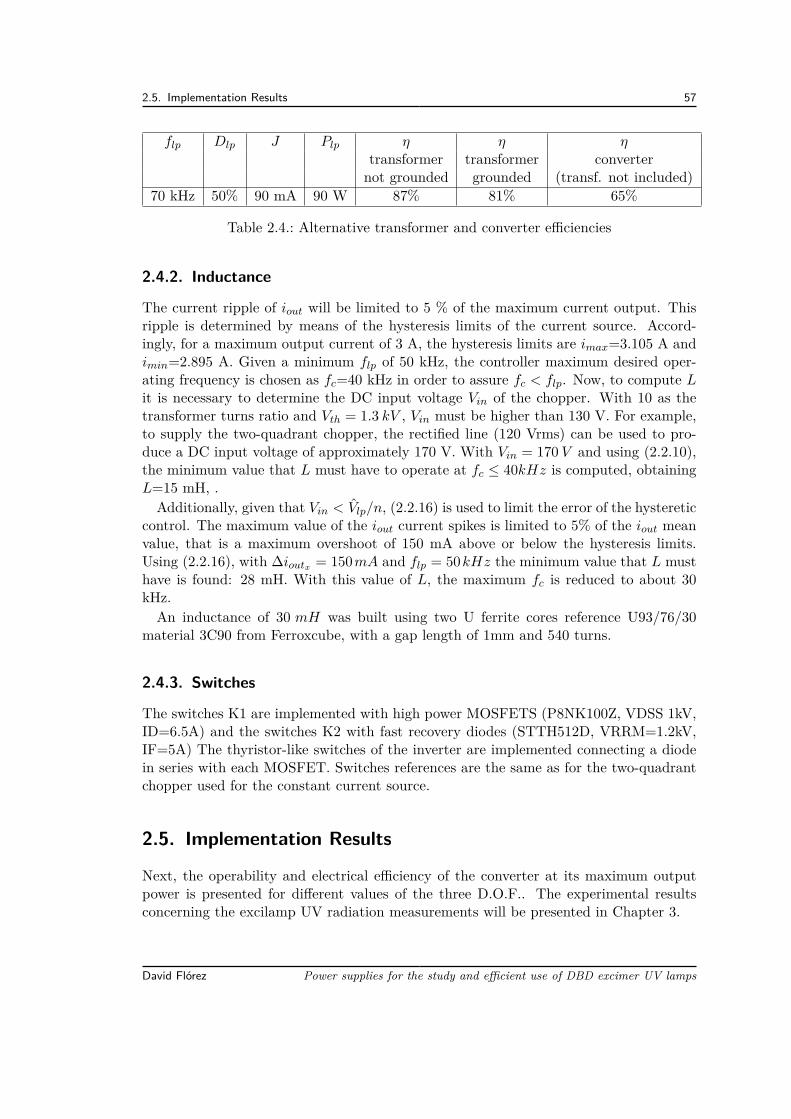
2.5. Implementation Results 57
flp Dlp J Plp η η ηtransformer transformer converternot grounded grounded (transf. not included)
70 kHz 50% 90 mA 90 W 87% 81% 65%
Table 2.4.: Alternative transformer and converter efficiencies
2.4.2. Inductance
The current ripple of iout will be limited to 5 % of the maximum current output. Thisripple is determined by means of the hysteresis limits of the current source. Accord-ingly, for a maximum output current of 3 A, the hysteresis limits are imax=3.105 A andimin=2.895 A. Given a minimum flp of 50 kHz, the controller maximum desired oper-ating frequency is chosen as fc=40 kHz in order to assure fc < flp. Now, to compute Lit is necessary to determine the DC input voltage Vin of the chopper. With 10 as thetransformer turns ratio and Vth = 1.3 kV , Vin must be higher than 130 V. For example,to supply the two-quadrant chopper, the rectified line (120 Vrms) can be used to pro-duce a DC input voltage of approximately 170 V. With Vin = 170 V and using (2.2.10),the minimum value that L must have to operate at fc ≤ 40kHz is computed, obtainingL=15 mH, .Additionally, given that Vin < Vlp/n, (2.2.16) is used to limit the error of the hysteretic
control. The maximum value of the iout current spikes is limited to 5% of the iout meanvalue, that is a maximum overshoot of 150 mA above or below the hysteresis limits.Using (2.2.16), with ∆ioutx = 150mA and flp = 50kHz the minimum value that L musthave is found: 28 mH. With this value of L, the maximum fc is reduced to about 30kHz.An inductance of 30 mH was built using two U ferrite cores reference U93/76/30
material 3C90 from Ferroxcube, with a gap length of 1mm and 540 turns.
2.4.3. Switches
The switches K1 are implemented with high power MOSFETS (P8NK100Z, VDSS 1kV,ID=6.5A) and the switches K2 with fast recovery diodes (STTH512D, VRRM=1.2kV,IF=5A) The thyristor-like switches of the inverter are implemented connecting a diodein series with each MOSFET. Switches references are the same as for the two-quadrantchopper used for the constant current source.
2.5. Implementation Results
Next, the operability and electrical efficiency of the converter at its maximum outputpower is presented for different values of the three D.O.F.. The experimental resultsconcerning the excilamp UV radiation measurements will be presented in Chapter 3.
David Flórez Power supplies for the study and efficient use of DBD excimer UV lamps
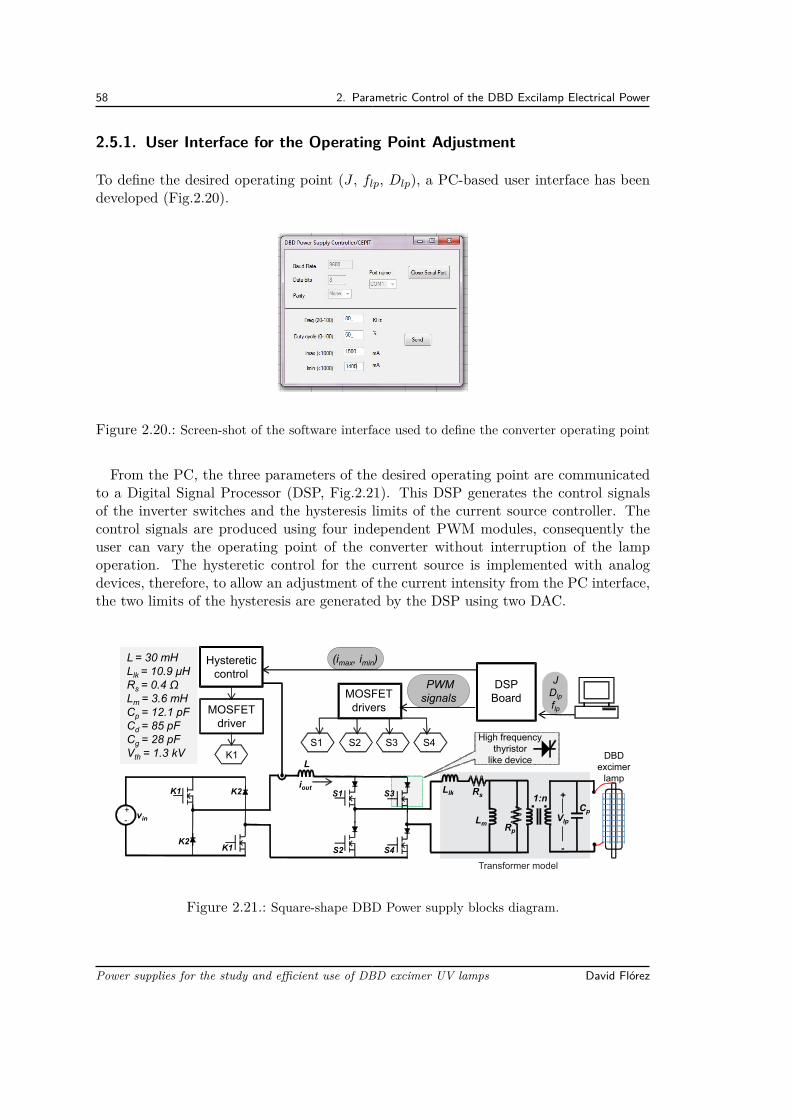
58 2. Parametric Control of the DBD Excilamp Electrical Power
2.5.1. User Interface for the Operating Point Adjustment
To define the desired operating point (J , flp, Dlp), a PC-based user interface has beendeveloped (Fig.2.20).
Figure 2.20.: Screen-shot of the software interface used to define the converter operating point
From the PC, the three parameters of the desired operating point are communicatedto a Digital Signal Processor (DSP, Fig.2.21). This DSP generates the control signalsof the inverter switches and the hysteresis limits of the current source controller. Thecontrol signals are produced using four independent PWM modules, consequently theuser can vary the operating point of the converter without interruption of the lampoperation. The hysteretic control for the current source is implemented with analogdevices, therefore, to allow an adjustment of the current intensity from the PC interface,the two limits of the hysteresis are generated by the DSP using two DAC.
PWM signals
. .
JDlp
flp
S3 S4S2S1
vin
L
S1
S4
S3
S2
+
Vlp
-
+-
iout1:n
Llk Rs
Lm
Cp
High frequency thyristor
like device
L = 30 mHLlk = 10.9 μHRs = 0.4 ΩLm = 3.6 mHCp = 12.1 pFCd = 85 pFCg = 28 pFVth = 1.3 kV
K1
K1
K2
K2
Hystereticcontrol
DSPBoardMOSFET
drivers
K1 DBD excimer
lamp
(imax, imin)
Rp
MOSFETdriver
Transformer model
Figure 2.21.: Square-shape DBD Power supply blocks diagram.
Power supplies for the study and efficient use of DBD excimer UV lamps David Flórez
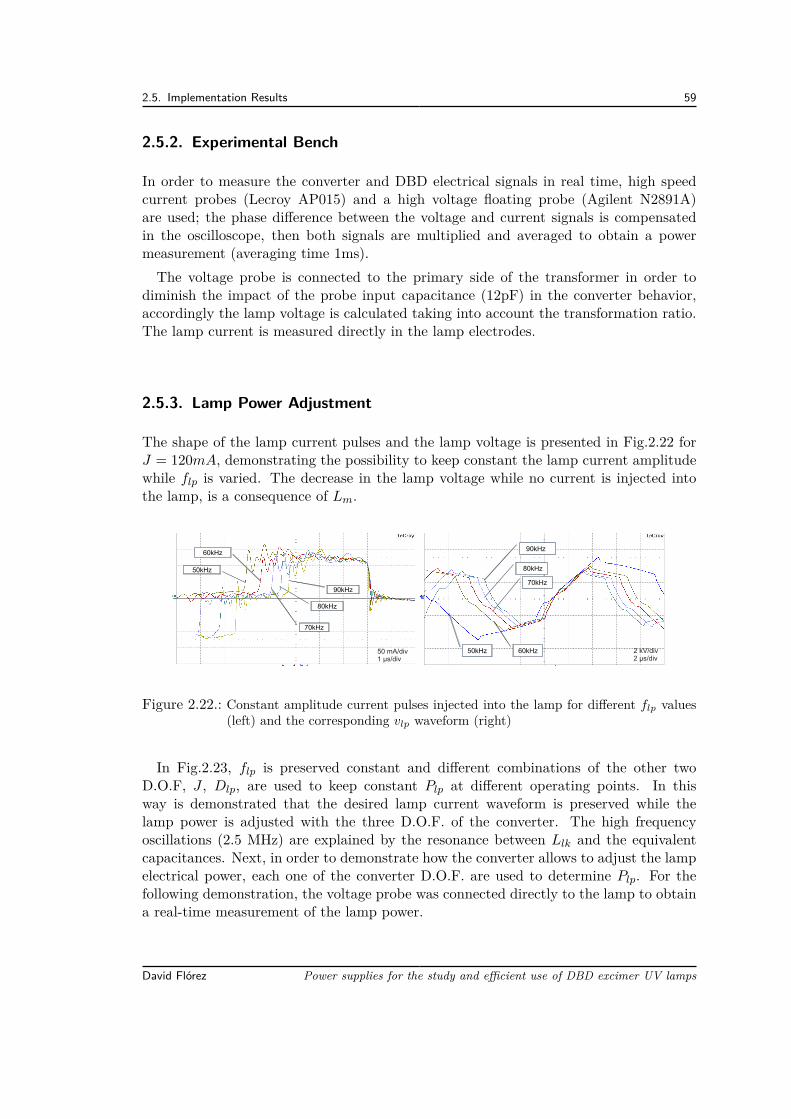
2.5. Implementation Results 59
2.5.2. Experimental Bench
In order to measure the converter and DBD electrical signals in real time, high speedcurrent probes (Lecroy AP015) and a high voltage floating probe (Agilent N2891A)are used; the phase difference between the voltage and current signals is compensatedin the oscilloscope, then both signals are multiplied and averaged to obtain a powermeasurement (averaging time 1ms).The voltage probe is connected to the primary side of the transformer in order to
diminish the impact of the probe input capacitance (12pF) in the converter behavior,accordingly the lamp voltage is calculated taking into account the transformation ratio.The lamp current is measured directly in the lamp electrodes.
2.5.3. Lamp Power Adjustment
The shape of the lamp current pulses and the lamp voltage is presented in Fig.2.22 forJ = 120mA, demonstrating the possibility to keep constant the lamp current amplitudewhile flp is varied. The decrease in the lamp voltage while no current is injected intothe lamp, is a consequence of Lm.
70kHz
90kHz
80kHz
60kHz
50kHz
50 mA/div1 µs/div
90kHz
60kHz
80kHz
70kHz
50kHz 2 kV/div2 µs/div
Figure 2.22.: Constant amplitude current pulses injected into the lamp for different flp values(left) and the corresponding vlp waveform (right)
In Fig.2.23, flp is preserved constant and different combinations of the other twoD.O.F, J , Dlp, are used to keep constant Plp at different operating points. In thisway is demonstrated that the desired lamp current waveform is preserved while thelamp power is adjusted with the three D.O.F. of the converter. The high frequencyoscillations (2.5 MHz) are explained by the resonance between Llk and the equivalentcapacitances. Next, in order to demonstrate how the converter allows to adjust the lampelectrical power, each one of the converter D.O.F. are used to determine Plp. For thefollowing demonstration, the voltage probe was connected directly to the lamp to obtaina real-time measurement of the lamp power.
David Flórez Power supplies for the study and efficient use of DBD excimer UV lamps
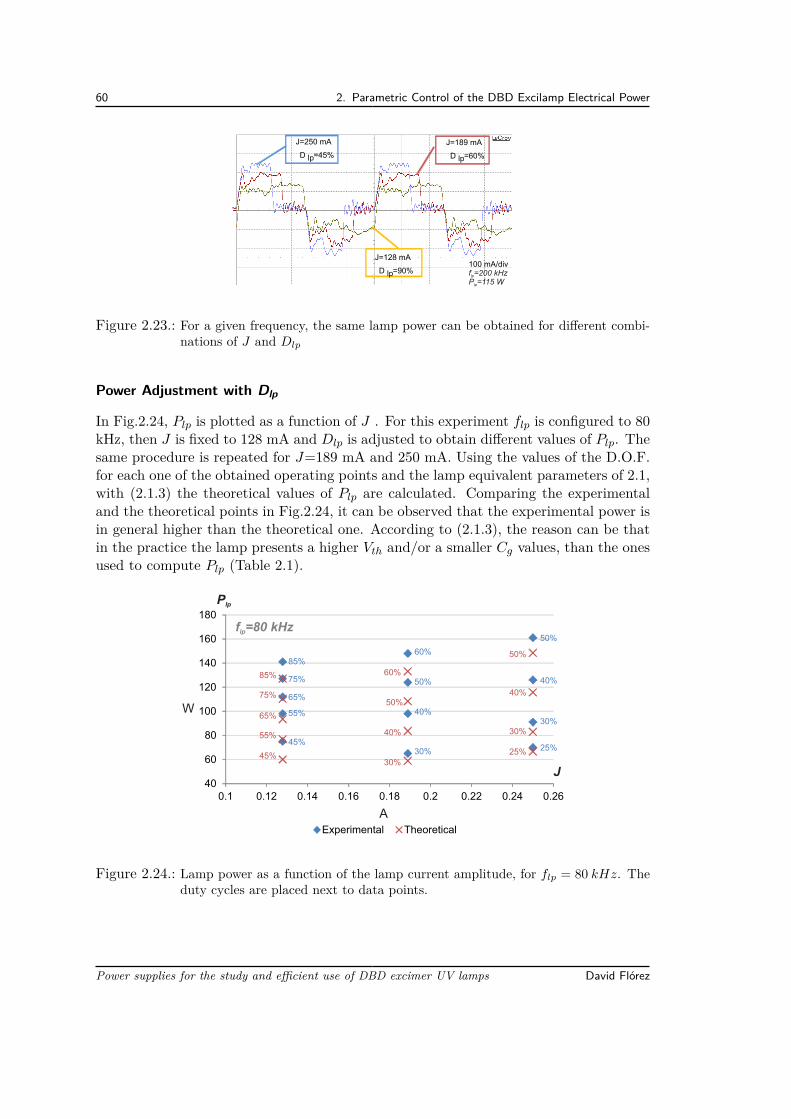
60 2. Parametric Control of the DBD Excilamp Electrical Power
J=250 mA
D lp=45%
J=189 mA
D lp=60%
J=128 mA
D lp=90%100 mA/divf =200 kHzlp
P =115 Wlp
Figure 2.23.: For a given frequency, the same lamp power can be obtained for different combi-nations of J and Dlp
Power Adjustment with Dlp
In Fig.2.24, Plp is plotted as a function of J . For this experiment flp is configured to 80kHz, then J is fixed to 128 mA and Dlp is adjusted to obtain different values of Plp. Thesame procedure is repeated for J=189 mA and 250 mA. Using the values of the D.O.F.for each one of the obtained operating points and the lamp equivalent parameters of 2.1,with (2.1.3) the theoretical values of Plp are calculated. Comparing the experimentaland the theoretical points in Fig.2.24, it can be observed that the experimental power isin general higher than the theoretical one. According to (2.1.3), the reason can be thatin the practice the lamp presents a higher Vth and/or a smaller Cg values, than the onesused to compute Plp (Table 2.1).
40
60
80
100
120
140
160
180
0.1 0.12 0.14 0.16 0.18 0.2 0.22 0.24 0.26
Experimental Theoretical
85%
75%
65%
55%
45%
50%
40%
30%
25%30%
40%
50%
60%
50%
40%
30%
25%30%
40%
50%
60%85%
75%
65%
55%
45%
Plp
W
A
f =80 kHzlp
J
Figure 2.24.: Lamp power as a function of the lamp current amplitude, for flp = 80 kHz. Theduty cycles are placed next to data points.
Power supplies for the study and efficient use of DBD excimer UV lamps David Flórez
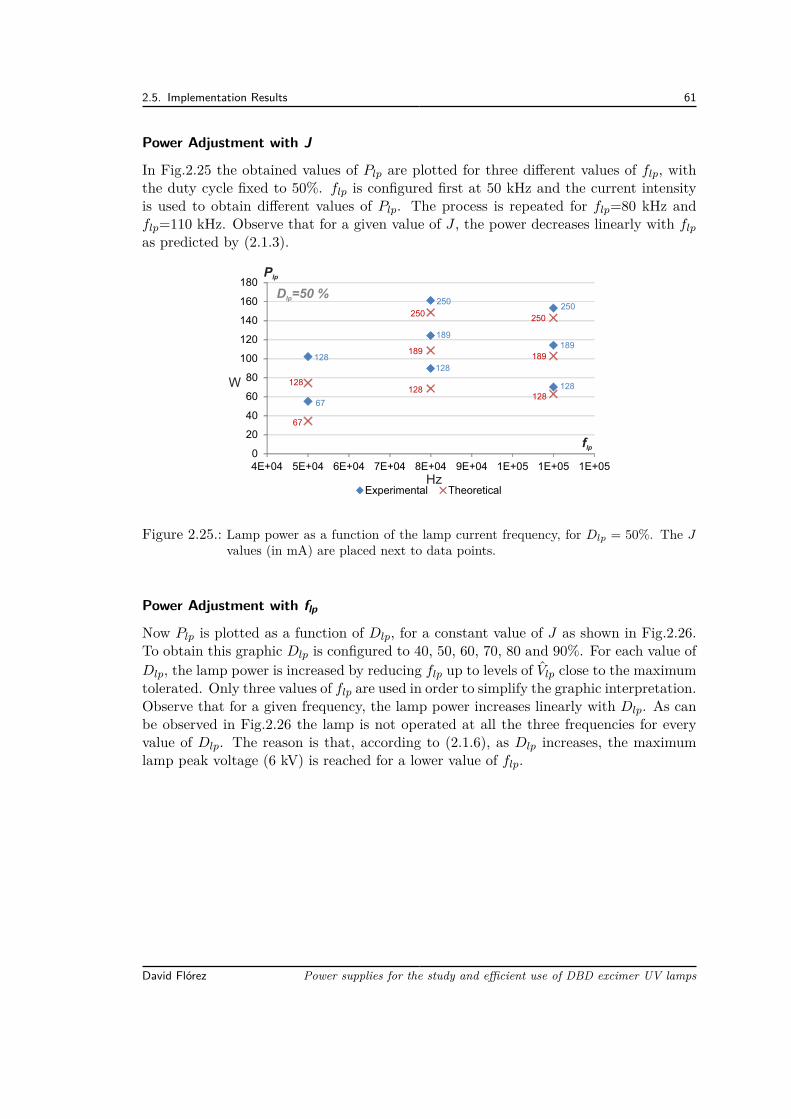
2.5. Implementation Results 61
Power Adjustment with J
In Fig.2.25 the obtained values of Plp are plotted for three different values of flp, withthe duty cycle fixed to 50%. flp is configured first at 50 kHz and the current intensityis used to obtain different values of Plp. The process is repeated for flp=80 kHz andflp=110 kHz. Observe that for a given value of J , the power decreases linearly with flp
as predicted by (2.1.3).
0
20
40
60
80
100
120
140
160
180
4E+04 5E+04 6E+04 7E+04 8E+04 9E+04 1E+05 1E+05 1E+05
Experimental Theoretical
128
67
250
189
128
250
189
128
128
67
250
189
128
250
189
128
Plp
W
Hz
D =50 %lp
flp
Figure 2.25.: Lamp power as a function of the lamp current frequency, for Dlp = 50%. The Jvalues (in mA) are placed next to data points.
Power Adjustment with flp
Now Plp is plotted as a function of Dlp, for a constant value of J as shown in Fig.2.26.To obtain this graphic Dlp is configured to 40, 50, 60, 70, 80 and 90%. For each value ofDlp, the lamp power is increased by reducing flp up to levels of Vlp close to the maximumtolerated. Only three values of flp are used in order to simplify the graphic interpretation.Observe that for a given frequency, the lamp power increases linearly with Dlp. As canbe observed in Fig.2.26 the lamp is not operated at all the three frequencies for everyvalue of Dlp. The reason is that, according to (2.1.6), as Dlp increases, the maximumlamp peak voltage (6 kV) is reached for a lower value of flp.
David Flórez Power supplies for the study and efficient use of DBD excimer UV lamps
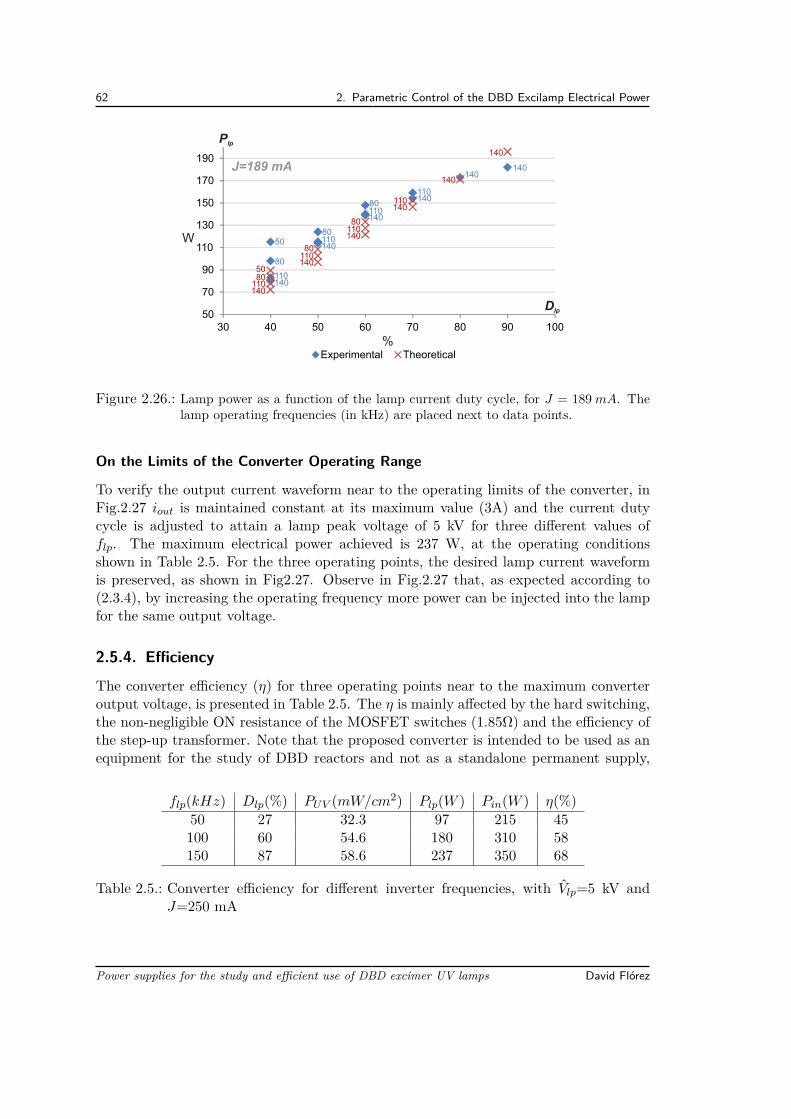
62 2. Parametric Control of the DBD Excilamp Electrical Power
50
70
90
110
130
150
170
190
30 40 50 60 70 80 90 100
Experimental Theoretical
1401108050
140110
80
50
14011080
14011080
140110
140
140
14011080
14011080
140110
140140
Plp
W
%
J=189 mA
Dlp
Figure 2.26.: Lamp power as a function of the lamp current duty cycle, for J = 189 mA. Thelamp operating frequencies (in kHz) are placed next to data points.
On the Limits of the Converter Operating Range
To verify the output current waveform near to the operating limits of the converter, inFig.2.27 iout is maintained constant at its maximum value (3A) and the current dutycycle is adjusted to attain a lamp peak voltage of 5 kV for three different values offlp. The maximum electrical power achieved is 237 W, at the operating conditionsshown in Table 2.5. For the three operating points, the desired lamp current waveformis preserved, as shown in Fig2.27. Observe in Fig.2.27 that, as expected according to(2.3.4), by increasing the operating frequency more power can be injected into the lampfor the same output voltage.
2.5.4. EfficiencyThe converter efficiency (η) for three operating points near to the maximum converteroutput voltage, is presented in Table 2.5. The η is mainly affected by the hard switching,the non-negligible ON resistance of the MOSFET switches (1.85Ω) and the efficiency ofthe step-up transformer. Note that the proposed converter is intended to be used as anequipment for the study of DBD reactors and not as a standalone permanent supply,
flp(kHz) Dlp(%) PUV (mW/cm2) Plp(W ) Pin(W ) η(%)50 27 32.3 97 215 45100 60 54.6 180 310 58150 87 58.6 237 350 68
Table 2.5.: Converter efficiency for different inverter frequencies, with Vlp=5 kV andJ=250 mA
Power supplies for the study and efficient use of DBD excimer UV lamps David Flórez
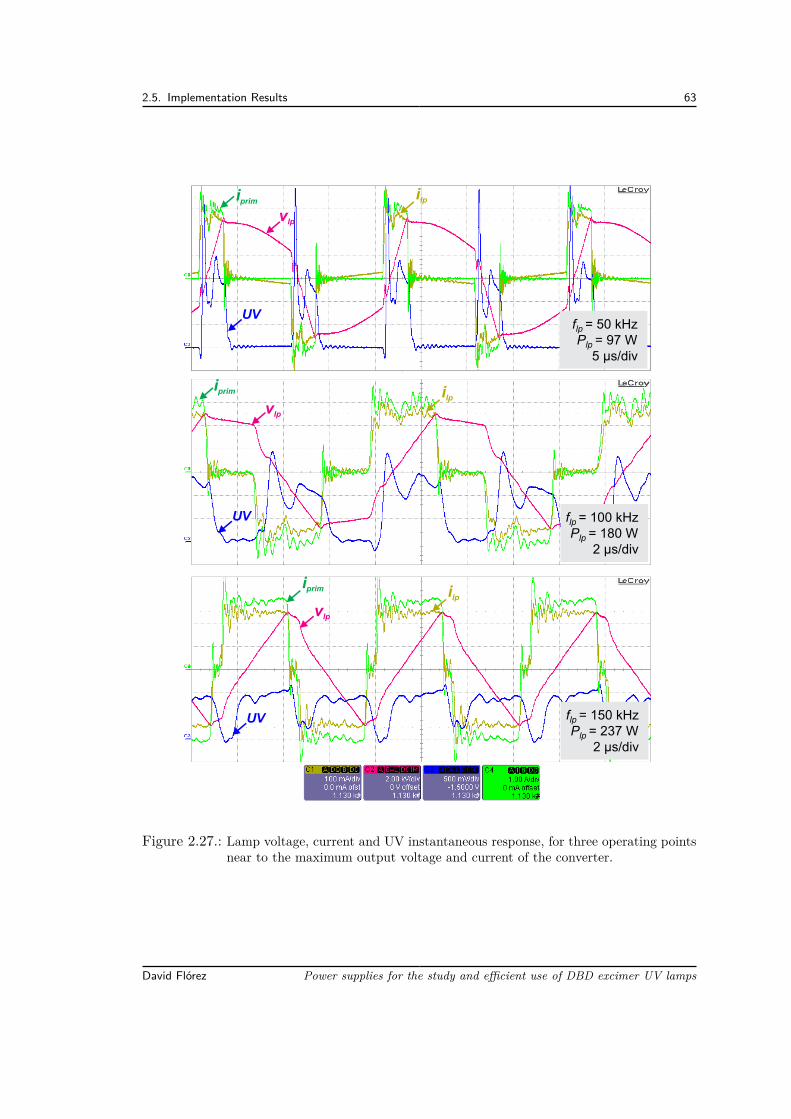
2.5. Implementation Results 63
flp = 50 kHzPlp = 97 W
5 µs/div
flp = 100 kHzPlp = 180 W
2 µs/div
flp = 150 kHzPlp = 237 W
2 µs/div
vlp
vlp
vlp
ilp
ilpiprim
iprim
iprim
UV
UV
UV
ilp
Figure 2.27.: Lamp voltage, current and UV instantaneous response, for three operating pointsnear to the maximum output voltage and current of the converter.
David Flórez Power supplies for the study and efficient use of DBD excimer UV lamps
64 2. Parametric Control of the DBD Excilamp Electrical Power
consequently its design criteria has been focused in the respect of the proposed currentwaveform and not in reduction of the power losses for a particular operating point.
2.5.5. UV radiationThe UV radiation instantaneous response, obtained in the limits of the converter oper-ating range, is presented in Fig.2.27. This UV waveform was acquired using a photo-detector THORLABS PDA-25K, configured in the 20dB gain setting. It is possible tosee that the instantaneous UV radiation follows the absolute value of the lamp current,except during the Tbr time. Also from Fig.2.27, a reduction in the UV pulse inten-sity when the frequency increases, for the same injected current amplitude, is observed.Hence, an impact of the operating on the UV radiation characteristics is deduced. Onthe basis of this experimental test, is demonstrated that the average power, intensity,duration and frequency of the UV radiation pulses can be controlled with the D.O.F.of proposed converter. As a subsequent research work, a comprehensive study of theoperating point impact over the UV radiation production and over the DBD excimerlamp performance, is presented in Chapter 3.
2.6. ConclusionsWith the proposed current-mode power supply, the electrical power and the UV radiationof a DBD Excimer lamp can be effectively adjusted by means of controlling the lampcurrent using three D.O.F.: amplitude, frequency and duty cycle.Through the use of this converter a suitable method to study the UV radiation of
DBD excimer lamps, is demonstrated. The experimental operating test of this converterperformed with a XeCl DBD excilamp, has demonstrated that the lamp model used forthe converter design is appropriate.
Power supplies for the study and efficient use of DBD excimer UV lamps David Flórez
Bibliography[2.1] D. Flórez, R. Díez, A. Hay, G. Perilla, F. Ruiz, and H. Piquet, “Programmable
current converter synthesis for the evaluation of UV radiation of excimer lamps,”in 2010 IEEE ANDESCON, pp. 1–6, 2010.
[2.2] D. Florez, R. Diez, K. Hay, and H. Piquet, “DBD excimer lamp power supplywith fully controlled operating conditions,” in 2012 13th International Conferenceon Optimization of Electrical and Electronic Equipment (OPTIM), pp. 1346–1352,2012.
[2.3] H. Piquet, S. Bhosle, R. Diez, M. Cousineau, M. Djibrillah, D. Le Thanh, A. N.Dagang, and G. Zissis, “Control of the UV flux of a XeCl dielectric barrier dischargeexcilamp through its current variation,” Quantum Electronics, vol. 42, pp. 157–164,Feb. 2012.
[2.4] R. Diez, H. Piquet, M. Cousineau, and S. Bhosle, “Current-mode power converterfor radiation control in DBD excimer lamps,” IEEE Transactions on IndustrialElectronics, vol. 59, no. 4, pp. 1912–1919, 2012.
[2.5] R. W. Erickson and D. Maksimovic, Fundamentals of Power Electronics. Springer,Jan. 2001.
[2.6] J. M. Alonso, C. Ordiz, D. Gacio, J. Ribas, and A. J. Calleja, “Closed-loop reg-ulated power supply for ozone generation based on buck converter and current-fedpush-pull resonant inverter,” Sept. 2009.
[2.7] F. Diaz, F. Azcondo, C. Brañas, R. Casanueva, and R. Zane, “Digitally controlledlow-frequency square-wave electronic ballast with resonant ignition and power loop,”IEEE Transactions on Industry Applications, vol. 46, no. 6, pp. 2222–2232, 2010.
[2.8] A. V. Stankovic, L. Nerone, and P. Kulkarni, “Modified synchronous-buck con-verter for a dimmable HID electronic ballast,” IEEE Transactions on IndustrialElectronics, vol. 59, pp. 1815–1824, Apr. 2012.
[2.9] A. L. Kirsten, M. A. Dalla Costa, C. Rech, R. N. do Prado, and T. B. Marchesan,“Digital control strategy for HID lamp electronic ballasts,” IEEE Transactions onIndustrial Electronics, vol. 60, pp. 608–618, Feb. 2013.
[2.10] M. Cousineau, R. Diez, H. Piquet, and O. Durrieu, “Synthesized high-frequencythyristor for dielectric barrier discharge excimer lamps,” IEEE Transactions onIndustrial Electronics, vol. 59, no. 4, pp. 1920–1928, 2012.
66 Bibliography
[2.11] X. Bonnin, H. Piquet, N. Naude, C. Bouzidi, N. Gherardi, and J.-M. Blaquiere,“Design of a current converter to maximize the power into homogeneous dielectricbarrier discharge (DBD) devices,” The European Physical Journal Applied Physics,July 2013.
[2.12] D. Gacio, J. Alonso, A. Calleja, J. Garcia, and M. Rico-Secades, “A universal-input single-stag2e high-power-factor power supply for HB-LEDs based on in-tegrated buck-flyback converter,” IEEE Transactions on Industrial Electronics,vol. 58, no. 2, pp. 589–599, 2011.
[2.13] R. Díez, J.-P. Salanne, H. Piquet, S. Bhosle, and G. Zissis, “Predictive model of aDBD lamp for power supply design and method for the automatic identification ofits parameters,” The European Physical Journal - Applied Physics, vol. 37, no. 03,pp. 307–313, 2007.
[2.14] M. I. Lomaev, V. S. Skakun, E. A. Sosnin, V. F. Tarasenko, D. V. Shitts, andM. V. Erofeev, “Excilamps efficient sources of spontaneous UV and VUV radiation,”Physics-Uspekhi, vol. 46, pp. 193–209, Feb. 2003.
[2.15] A. El-Deib, F. Dawson, G. van Eerden, S. Bhosle, G. Zissis, and T. D. Le, “Anal-ysis and experimental validation of a new current-controlled driver for a dielectricbarrier discharge lamp,” IEEE Transactions on Industry Applications, vol. 47, no. 4,pp. 1971–1982, 2011.
[2.16] T. C. Manley, “The electric characteristics of the ozonator discharge,” Transac-tions of The Electrochemical Society, vol. 84, pp. 83–96, Oct. 1943.
[2.17] R. Diez-Medina, Alimentation de puissance d’une lampe exciplexe à déchargeà barrière diélectrique, en vue du contrôle du rayonnement. PhD thesis, INPT,Toulouse, 2008.
[2.18] M. A. Djibrillah, Éléments de conception d’un générateur électrique pourl’alimentation d’un dispositif à décharge à barrière diélectrique (DBD). INPT, Apr.2011.
[2.19] X. Bonnin, H. Piquet, D. Florez, R. Diez, and X. Bonnin, “Designing the highvoltage transformer of power supplies for dbd: windings arrangment to reduce theparasitic capacitive effects,” in Power Electronics and Applications (EPE), 201315th European Conference on, Sept. 2013.
[2.20] D. Florez, X. Bonnin, H. Piquet, and R. Diez, “Impact of the transformer inthe current mode supply of dielectric barrier discharge excimer lamps,” (BrazilianPower Electronics Conference (COBEP 2013), Gramaos, Brasil), Oct. 2013.
[2.21] L. Dalessandro, F. da Silveira Cavalcante, and J. W. Kolar, “Self-capacitanceof high-voltage transformers,” IEEE Transactions on Power Electronics, vol. 22,pp. 2081–2092, Sept. 2007.
Power supplies for the study and efficient use of DBD excimer UV lamps David Flórez
Bibliography 67
[2.22] F. Blache, J. P. Keradec, and B. Cogitore, “Stray capacitances of two wind-ing transformers: equivalent circuit, measurements, calculation and lowering,” in ,Conference Record of the 1994 IEEE Industry Applications Society Annual Meeting,1994, pp. 1211–1217 vol.2, 1994.
[2.23] J. Biela and J. Kolar, “Using transformer parasitics for resonant converters -a review of the calculation of the stray capacitance of transformers,” in IndustryApplications Conference, 2005. Fourtieth IAS Annual Meeting. Conference Recordof the 2005, vol. 3, pp. 1868–1875 Vol. 3, 2005.
David Flórez Power supplies for the study and efficient use of DBD excimer UV lamps

3. Parametric Study of the Operating PointInfluence on the DBD ExcilampPerformance
In the precedent Chapter, a power supply useful for the study of DBD excilamps has beenpresented. The exploitation of this converter with a XeCl DBD excilamp is covered here.For this study, the lamp is supplied varying each one of the operating point parameters(D.O.F. of the converter) and the impact of each parameter on the following excilampcharacteristics are presented and discussed:
• The UV power: together with Plp, gives a measurement of the excilamp efficiency.
• The UV waveform: allows to understand the effect of the operating point in theinstantaneous response of the UV production and to correlate it with the lampcurrent waveform.
• The lamp electrical model: provides information about the lamp electrical behaviorat different operating conditions.
• Pictures of the discharge: to detect a change in the discharge regime.
Explained in the first part of this Chapter is the experimental bench used for theUV radiation measurements. Using this experimental set-up a first study is developed.For the first experiment the current frequency flp is held constant, the intensity J isconfigured at a first set-point value, and then, using the current duty cycle Dlp, differentvalues of lamp electrical power Plp are obtained. The process is repeated for othervalues of J , and for each operating point the lamp operation is analyzed, showing theeffect of this parameter over the lamp performance. For a second experiment, flp is theparameter to be evaluated. To do that, J is fixed, flp is configured at the first operatingfrequency and using Dlp, the lamp power is increased. Again, the process is repeatedfor several values of flp and pertinent results regarding the impact of flp over the lampperformance, are provided. From these results the UV power obtained at similar levelsof excitation power can be compared for different operating conditions. We concludethe Chapter with an analysis of all the tested operating points from the point of view ofthe lamp efficiency, to find the lamp operating conditions with the best electrical-to-UVconversion ratio and also the operating points that maximize the UV output power.
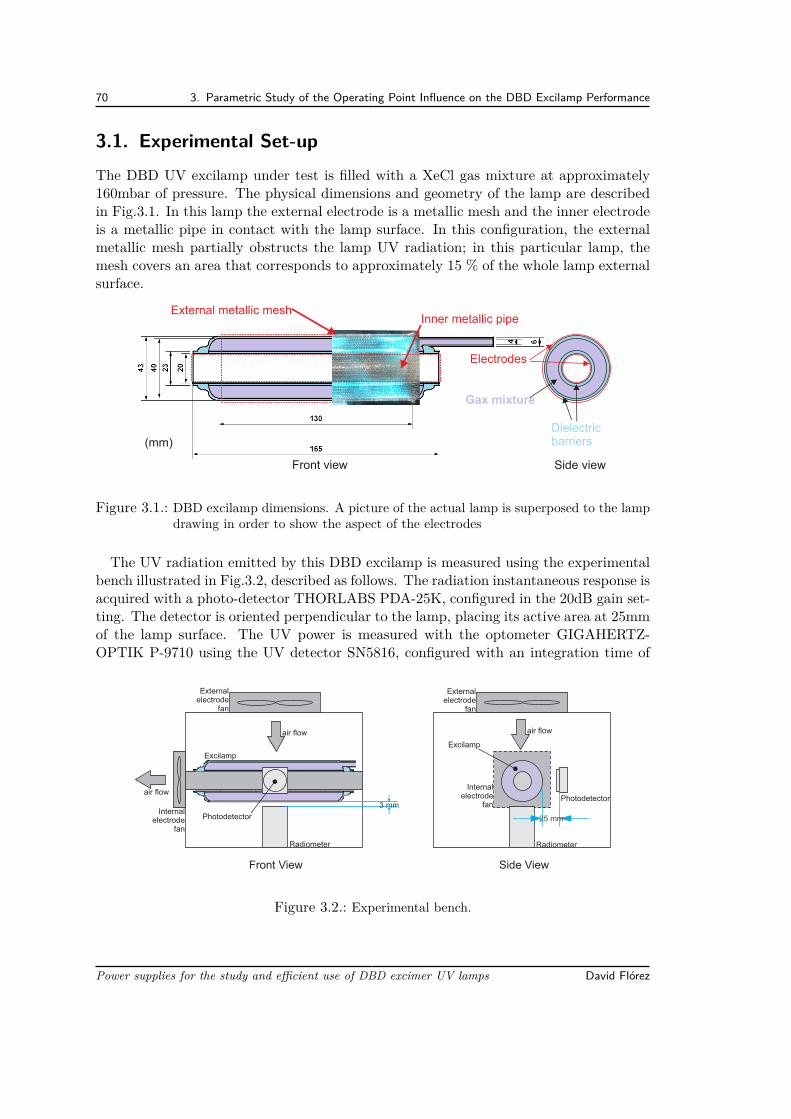
70 3. Parametric Study of the Operating Point Influence on the DBD Excilamp Performance
3.1. Experimental Set-upThe DBD UV excilamp under test is filled with a XeCl gas mixture at approximately160mbar of pressure. The physical dimensions and geometry of the lamp are describedin Fig.3.1. In this lamp the external electrode is a metallic mesh and the inner electrodeis a metallic pipe in contact with the lamp surface. In this configuration, the externalmetallic mesh partially obstructs the lamp UV radiation; in this particular lamp, themesh covers an area that corresponds to approximately 15 % of the whole lamp externalsurface.
Dielectricbarriers
Gax mixture
Electrodes
(mm)
Front view Side view
Inner metallic pipeExternal metallic mesh
Figure 3.1.: DBD excilamp dimensions. A picture of the actual lamp is superposed to the lampdrawing in order to show the aspect of the electrodes
The UV radiation emitted by this DBD excilamp is measured using the experimentalbench illustrated in Fig.3.2, described as follows. The radiation instantaneous response isacquired with a photo-detector THORLABS PDA-25K, configured in the 20dB gain set-ting. The detector is oriented perpendicular to the lamp, placing its active area at 25mmof the lamp surface. The UV power is measured with the optometer GIGAHERTZ-OPTIK P-9710 using the UV detector SN5816, configured with an integration time of
air flow
air flow
Radiometer
External electrode
fan
Internal electrode
fan
25 mm
Photodetector
Radiometer
External electrode
fan
Internal electrode
fan
air flow
Front View Side View
Photodetector
Excilamp
Excilamp
3 mm
Figure 3.2.: Experimental bench.
Power supplies for the study and efficient use of DBD excimer UV lamps David Flórez
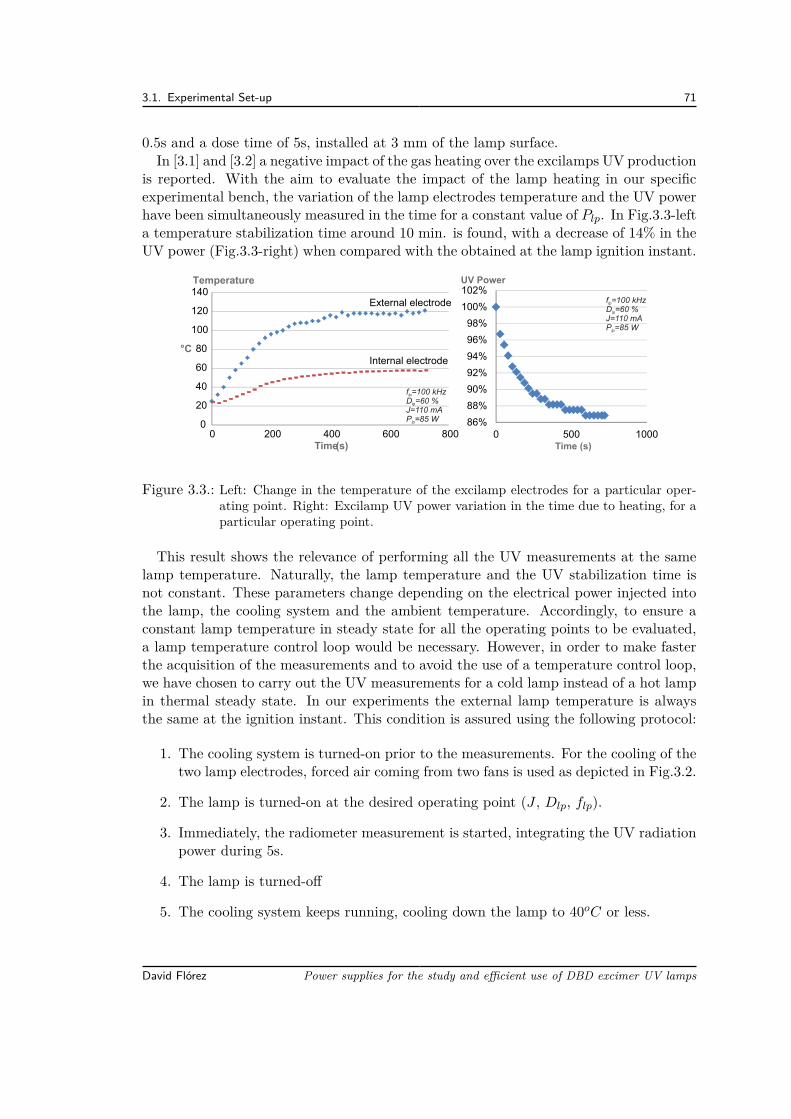
3.1. Experimental Set-up 71
0.5s and a dose time of 5s, installed at 3 mm of the lamp surface.In [3.1] and [3.2] a negative impact of the gas heating over the excilamps UV production
is reported. With the aim to evaluate the impact of the lamp heating in our specificexperimental bench, the variation of the lamp electrodes temperature and the UV powerhave been simultaneously measured in the time for a constant value of Plp. In Fig.3.3-lefta temperature stabilization time around 10 min. is found, with a decrease of 14% in theUV power (Fig.3.3-right) when compared with the obtained at the lamp ignition instant.
Time (s)
UV Power
86%
88%
90%
92%
94%
96%
98%
100%
102%
0 500 1000
f =100 kHzlp
D =60 %lp
J=110 mAP =85 Wlp
0
20
40
60
80
100
120
140
0 200 400 600 800Time (s)
External electrode
Internal electrode
Temperature
°C
f =100 kHzlp
D =60 %lp
J=110 mAP =85 Wlp
Figure 3.3.: Left: Change in the temperature of the excilamp electrodes for a particular oper-ating point. Right: Excilamp UV power variation in the time due to heating, for aparticular operating point.
This result shows the relevance of performing all the UV measurements at the samelamp temperature. Naturally, the lamp temperature and the UV stabilization time isnot constant. These parameters change depending on the electrical power injected intothe lamp, the cooling system and the ambient temperature. Accordingly, to ensure aconstant lamp temperature in steady state for all the operating points to be evaluated,a lamp temperature control loop would be necessary. However, in order to make fasterthe acquisition of the measurements and to avoid the use of a temperature control loop,we have chosen to carry out the UV measurements for a cold lamp instead of a hot lampin thermal steady state. In our experiments the external lamp temperature is alwaysthe same at the ignition instant. This condition is assured using the following protocol:
1. The cooling system is turned-on prior to the measurements. For the cooling of thetwo lamp electrodes, forced air coming from two fans is used as depicted in Fig.3.2.
2. The lamp is turned-on at the desired operating point (J , Dlp, flp).
3. Immediately, the radiometer measurement is started, integrating the UV radiationpower during 5s.
4. The lamp is turned-off
5. The cooling system keeps running, cooling down the lamp to 40oC or less.
David Flórez Power supplies for the study and efficient use of DBD excimer UV lamps
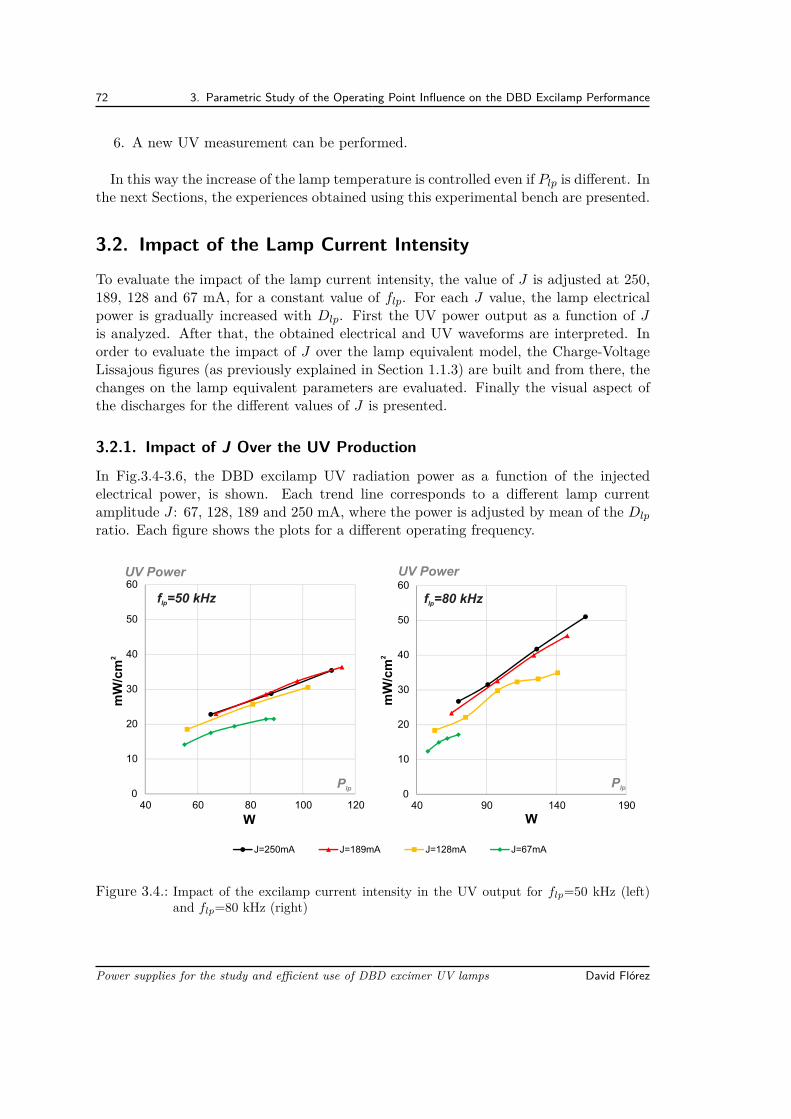
72 3. Parametric Study of the Operating Point Influence on the DBD Excilamp Performance
6. A new UV measurement can be performed.
In this way the increase of the lamp temperature is controlled even if Plp is different. Inthe next Sections, the experiences obtained using this experimental bench are presented.
3.2. Impact of the Lamp Current IntensityTo evaluate the impact of the lamp current intensity, the value of J is adjusted at 250,189, 128 and 67 mA, for a constant value of flp. For each J value, the lamp electricalpower is gradually increased with Dlp. First the UV power output as a function of Jis analyzed. After that, the obtained electrical and UV waveforms are interpreted. Inorder to evaluate the impact of J over the lamp equivalent model, the Charge-VoltageLissajous figures (as previously explained in Section 1.1.3) are built and from there, thechanges on the lamp equivalent parameters are evaluated. Finally the visual aspect ofthe discharges for the different values of J is presented.
3.2.1. Impact of J Over the UV ProductionIn Fig.3.4-3.6, the DBD excilamp UV radiation power as a function of the injectedelectrical power, is shown. Each trend line corresponds to a different lamp currentamplitude J : 67, 128, 189 and 250 mA, where the power is adjusted by mean of the Dlp
ratio. Each figure shows the plots for a different operating frequency.
0
10
20
30
40
50
60
40 90 140 190
J=250mA J=189mA J=128mA J=67mA
W
UV Power
2mW/cm
f =80 kHzlp
Plp0
10
20
30
40
50
60
40 60 80 100 120
f =50 kHzlp
W
UV Power
2mW/cm
Plp
Figure 3.4.: Impact of the excilamp current intensity in the UV output for flp=50 kHz (left)and flp=80 kHz (right)
Power supplies for the study and efficient use of DBD excimer UV lamps David Flórez
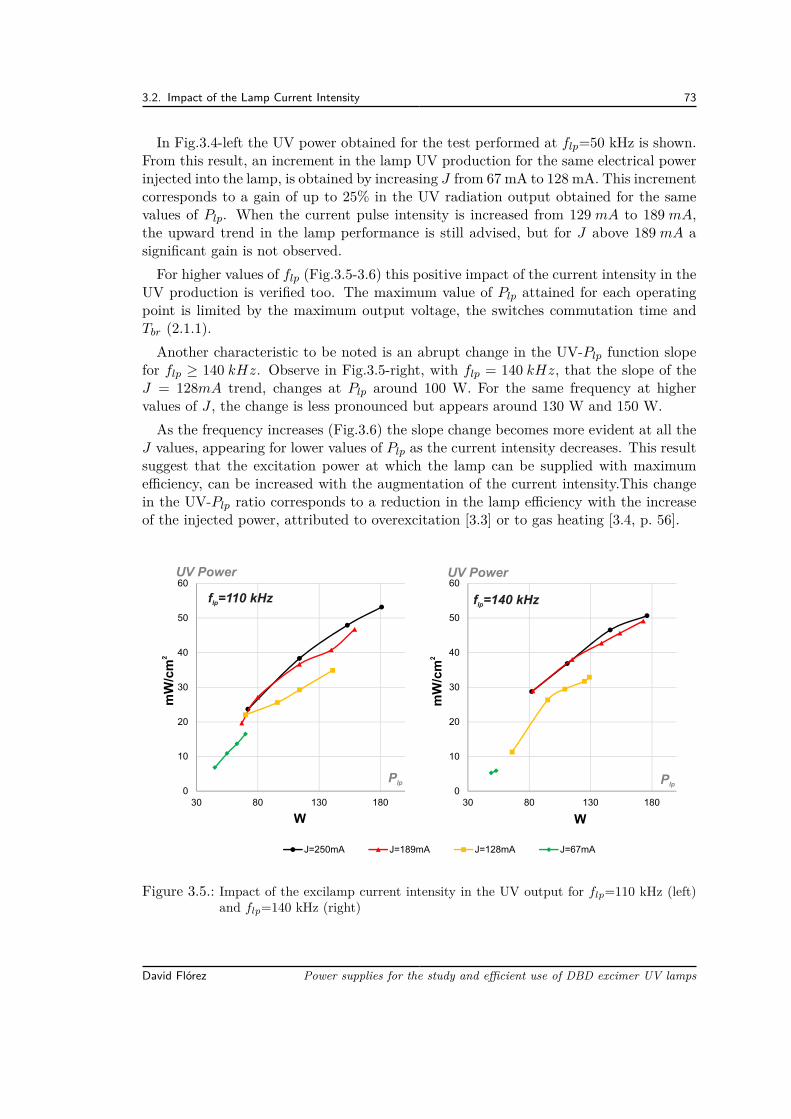
3.2. Impact of the Lamp Current Intensity 73
In Fig.3.4-left the UV power obtained for the test performed at flp=50 kHz is shown.From this result, an increment in the lamp UV production for the same electrical powerinjected into the lamp, is obtained by increasing J from 67 mA to 128 mA. This incrementcorresponds to a gain of up to 25% in the UV radiation output obtained for the samevalues of Plp. When the current pulse intensity is increased from 129 mA to 189 mA,the upward trend in the lamp performance is still advised, but for J above 189 mA asignificant gain is not observed.For higher values of flp (Fig.3.5-3.6) this positive impact of the current intensity in the
UV production is verified too. The maximum value of Plp attained for each operatingpoint is limited by the maximum output voltage, the switches commutation time andTbr (2.1.1).Another characteristic to be noted is an abrupt change in the UV-Plp function slope
for flp ≥ 140 kHz. Observe in Fig.3.5-right, with flp = 140 kHz, that the slope of theJ = 128mA trend, changes at Plp around 100 W. For the same frequency at highervalues of J , the change is less pronounced but appears around 130 W and 150 W.As the frequency increases (Fig.3.6) the slope change becomes more evident at all the
J values, appearing for lower values of Plp as the current intensity decreases. This resultsuggest that the excitation power at which the lamp can be supplied with maximumefficiency, can be increased with the augmentation of the current intensity.This changein the UV-Plp ratio corresponds to a reduction in the lamp efficiency with the increaseof the injected power, attributed to overexcitation [3.3] or to gas heating [3.4, p. 56].
0
10
20
30
40
50
60
30 80 130 1800
10
20
30
40
50
60
30 80 130 180
J=250mA J=189mA J=128mA J=67mA
W
UV Power
f =110 kHzlp
2mW/cm
W
UV Power
2mW/cm
f =140 kHzlp
PlpPlp
Figure 3.5.: Impact of the excilamp current intensity in the UV output for flp=110 kHz (left)and flp=140 kHz (right)
David Flórez Power supplies for the study and efficient use of DBD excimer UV lamps
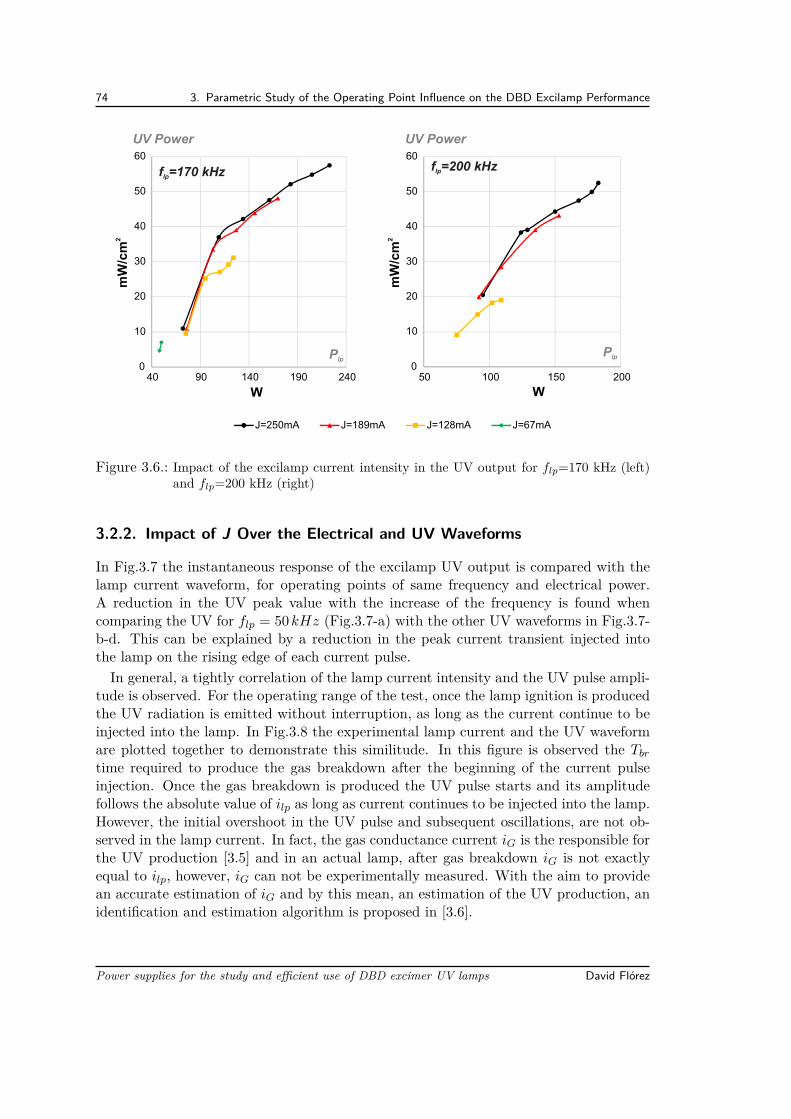
74 3. Parametric Study of the Operating Point Influence on the DBD Excilamp Performance
J=250mA J=189mA J=128mA J=67mA
0
10
20
30
40
50
60
40 90 140 190 2400
10
20
30
40
50
60
50 100 150 200
W
UV Power
2mW/cm
W
UV Power
2mW/cm
f =200 kHzlpf =170 kHzlp
PlpPlp
Figure 3.6.: Impact of the excilamp current intensity in the UV output for flp=170 kHz (left)and flp=200 kHz (right)
3.2.2. Impact of J Over the Electrical and UV Waveforms
In Fig.3.7 the instantaneous response of the excilamp UV output is compared with thelamp current waveform, for operating points of same frequency and electrical power.A reduction in the UV peak value with the increase of the frequency is found whencomparing the UV for flp = 50kHz (Fig.3.7-a) with the other UV waveforms in Fig.3.7-b-d. This can be explained by a reduction in the peak current transient injected intothe lamp on the rising edge of each current pulse.In general, a tightly correlation of the lamp current intensity and the UV pulse ampli-
tude is observed. For the operating range of the test, once the lamp ignition is producedthe UV radiation is emitted without interruption, as long as the current continue to beinjected into the lamp. In Fig.3.8 the experimental lamp current and the UV waveformare plotted together to demonstrate this similitude. In this figure is observed the Tbr
time required to produce the gas breakdown after the beginning of the current pulseinjection. Once the gas breakdown is produced the UV pulse starts and its amplitudefollows the absolute value of ilp as long as current continues to be injected into the lamp.However, the initial overshoot in the UV pulse and subsequent oscillations, are not ob-served in the lamp current. In fact, the gas conductance current iG is the responsible forthe UV production [3.5] and in an actual lamp, after gas breakdown iG is not exactlyequal to ilp, however, iG can not be experimentally measured. With the aim to providean accurate estimation of iG and by this mean, an estimation of the UV production, anidentification and estimation algorithm is proposed in [3.6].
Power supplies for the study and efficient use of DBD excimer UV lamps David Flórez
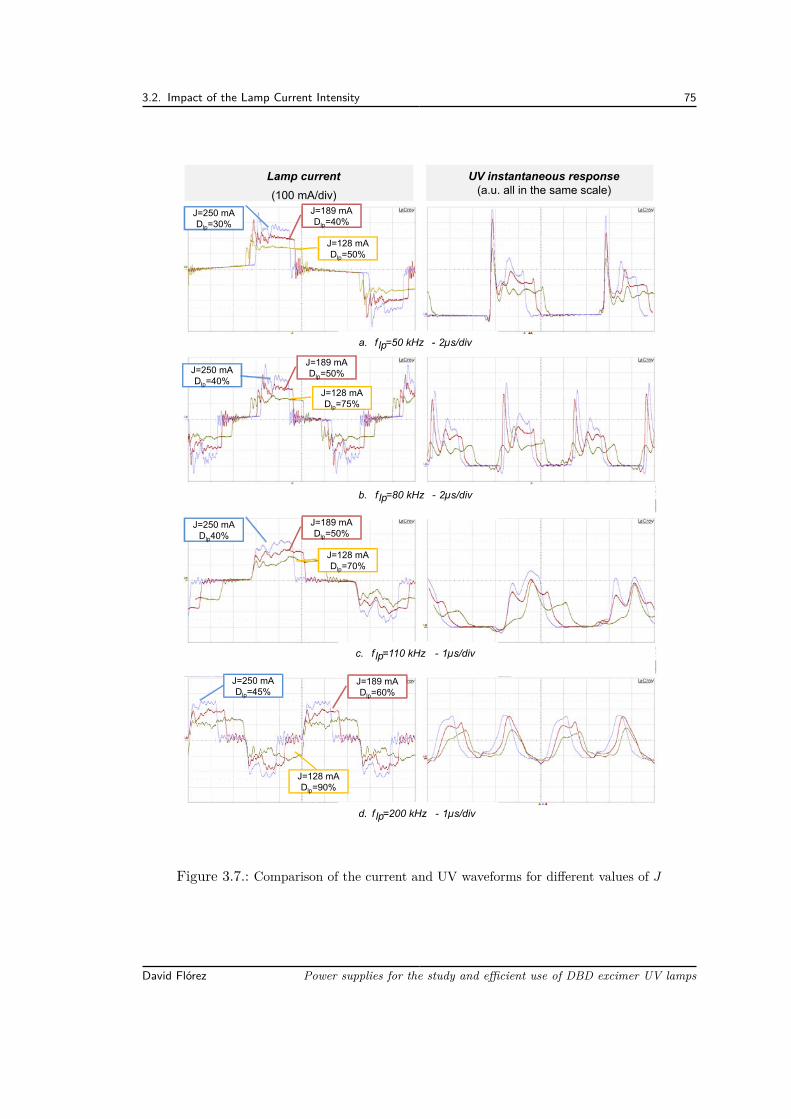
3.2. Impact of the Lamp Current Intensity 75
J=250 mADlp=30%
J=189 mADlp=40%
J=128 mADlp=50%
J=250 mADlp=40%
J=189 mADlp=50%
J=128 mADlp=75%
b. f lp=80 kHz - 2µs/div
J=250 mADlp40%
J=189 mADlp=50%
J=128 mADlp=70%
c. f lp=110 kHz - 1µs/div
J=250 mADlp=45%
J=189 mADlp=60%
J=128 mADlp=90%
d. f lp=200 kHz - 1µs/div
a. f lp=50 kHz - 2µs/div
Lamp current
(100 mA/div)
UV instantaneous response (a.u. all in the same scale)
Figure 3.7.: Comparison of the current and UV waveforms for different values of J
David Flórez Power supplies for the study and efficient use of DBD excimer UV lamps
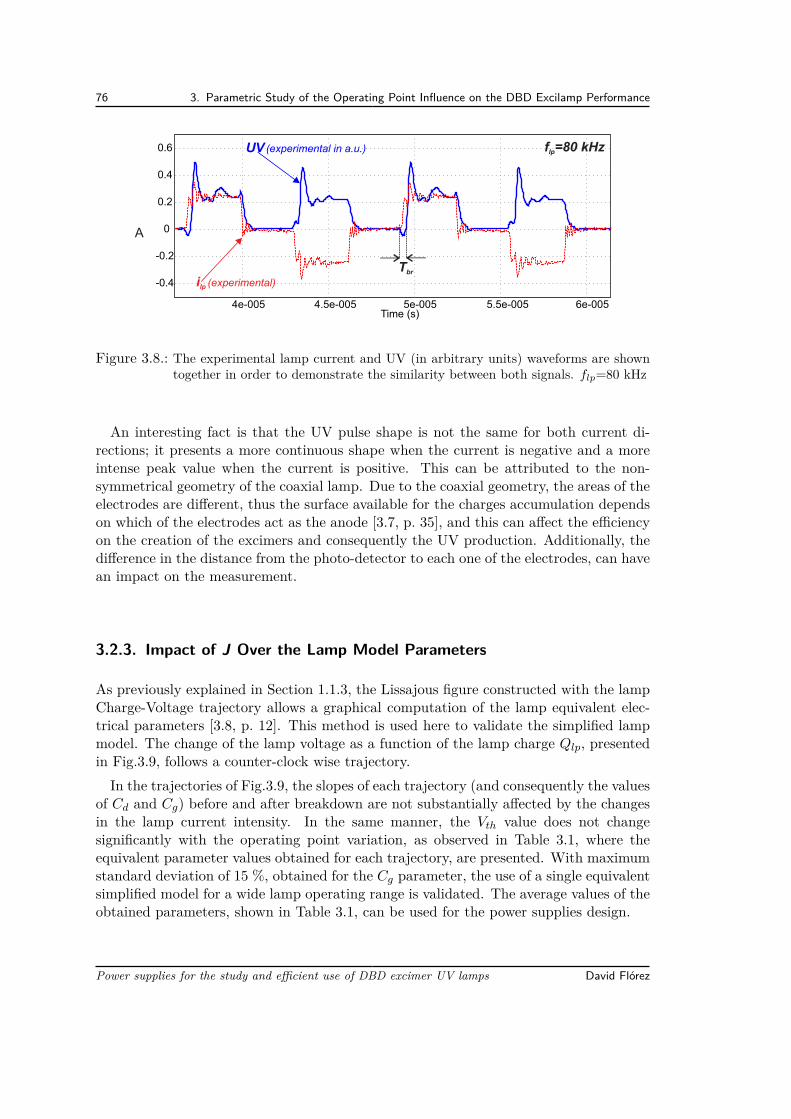
76 3. Parametric Study of the Operating Point Influence on the DBD Excilamp Performance
i (experimental) lp
UV (experimental in a.u.)
A
4e-005 4.5e-005 5e-005 5.5e-005 6e-005Time (s)
0
-0.2
-0.4
0.2
0.4
0.6 f =80 kHzlp
Tbr
Figure 3.8.: The experimental lamp current and UV (in arbitrary units) waveforms are showntogether in order to demonstrate the similarity between both signals. flp=80 kHz
An interesting fact is that the UV pulse shape is not the same for both current di-rections; it presents a more continuous shape when the current is negative and a moreintense peak value when the current is positive. This can be attributed to the non-symmetrical geometry of the coaxial lamp. Due to the coaxial geometry, the areas of theelectrodes are different, thus the surface available for the charges accumulation dependson which of the electrodes act as the anode [3.7, p. 35], and this can affect the efficiencyon the creation of the excimers and consequently the UV production. Additionally, thedifference in the distance from the photo-detector to each one of the electrodes, can havean impact on the measurement.
3.2.3. Impact of J Over the Lamp Model Parameters
As previously explained in Section 1.1.3, the Lissajous figure constructed with the lampCharge-Voltage trajectory allows a graphical computation of the lamp equivalent elec-trical parameters [3.8, p. 12]. This method is used here to validate the simplified lampmodel. The change of the lamp voltage as a function of the lamp charge Qlp, presentedin Fig.3.9, follows a counter-clock wise trajectory.In the trajectories of Fig.3.9, the slopes of each trajectory (and consequently the values
of Cd and Cg) before and after breakdown are not substantially affected by the changesin the lamp current intensity. In the same manner, the Vth value does not changesignificantly with the operating point variation, as observed in Table 3.1, where theequivalent parameter values obtained for each trajectory, are presented. With maximumstandard deviation of 15 %, obtained for the Cg parameter, the use of a single equivalentsimplified model for a wide lamp operating range is validated. The average values of theobtained parameters, shown in Table 3.1, can be used for the power supplies design.
Power supplies for the study and efficient use of DBD excimer UV lamps David Flórez
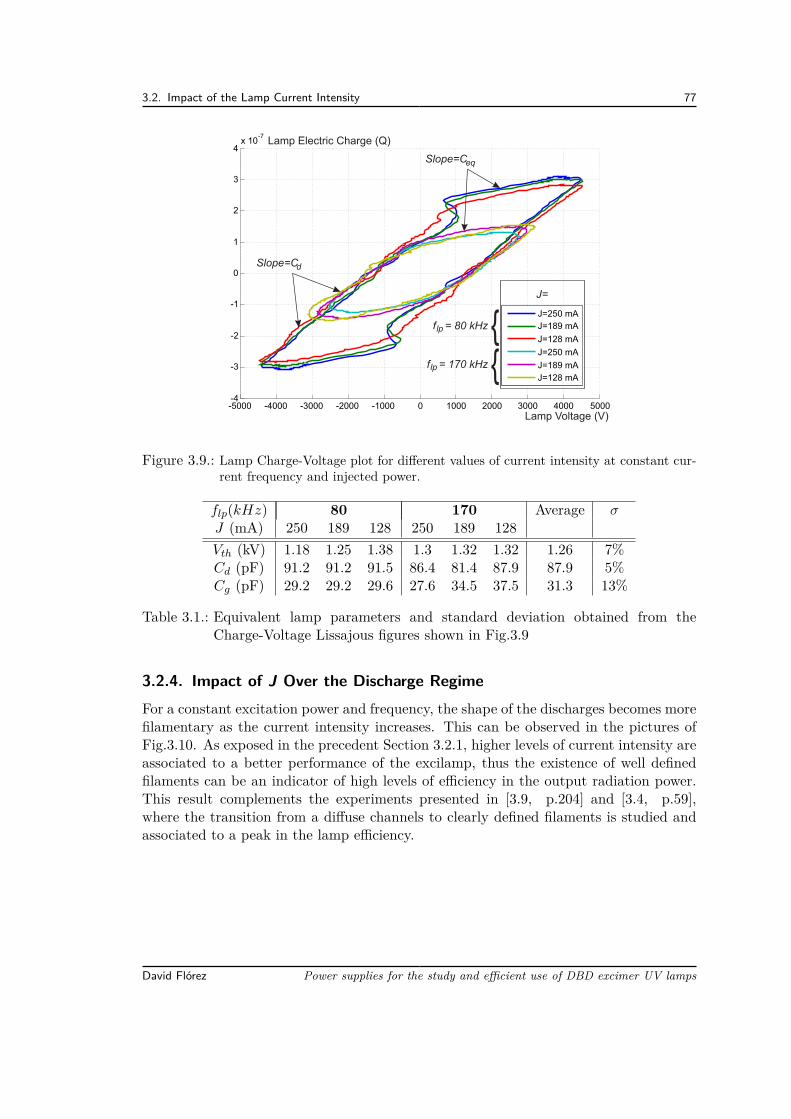
3.2. Impact of the Lamp Current Intensity 77
-5000 -4000 -3000 -2000 -1000 0 1000 2000 3000 4000 5000-4
-3
-2
-1
0
1
2
3
4x 10
-7
J=250 mA
J=189 mA
J=128 mA
J=250 mA
J=189 mA
J=128 mA
J=
lpf = 80 kHz
lpf = 170 kHz
Lamp Electric Charge (Q)
Lamp Voltage (V)
Slope=Ceq
Slope=Cd
Figure 3.9.: Lamp Charge-Voltage plot for different values of current intensity at constant cur-rent frequency and injected power.
flp(kHz) 80 170 Average σJ (mA) 250 189 128 250 189 128Vth (kV) 1.18 1.25 1.38 1.3 1.32 1.32 1.26 7%Cd (pF) 91.2 91.2 91.5 86.4 81.4 87.9 87.9 5%Cg (pF) 29.2 29.2 29.6 27.6 34.5 37.5 31.3 13%
Table 3.1.: Equivalent lamp parameters and standard deviation obtained from theCharge-Voltage Lissajous figures shown in Fig.3.9
3.2.4. Impact of J Over the Discharge RegimeFor a constant excitation power and frequency, the shape of the discharges becomes morefilamentary as the current intensity increases. This can be observed in the pictures ofFig.3.10. As exposed in the precedent Section 3.2.1, higher levels of current intensity areassociated to a better performance of the excilamp, thus the existence of well definedfilaments can be an indicator of high levels of efficiency in the output radiation power.This result complements the experiments presented in [3.9, p.204] and [3.4, p.59],where the transition from a diffuse channels to clearly defined filaments is studied andassociated to a peak in the lamp efficiency.
David Flórez Power supplies for the study and efficient use of DBD excimer UV lamps
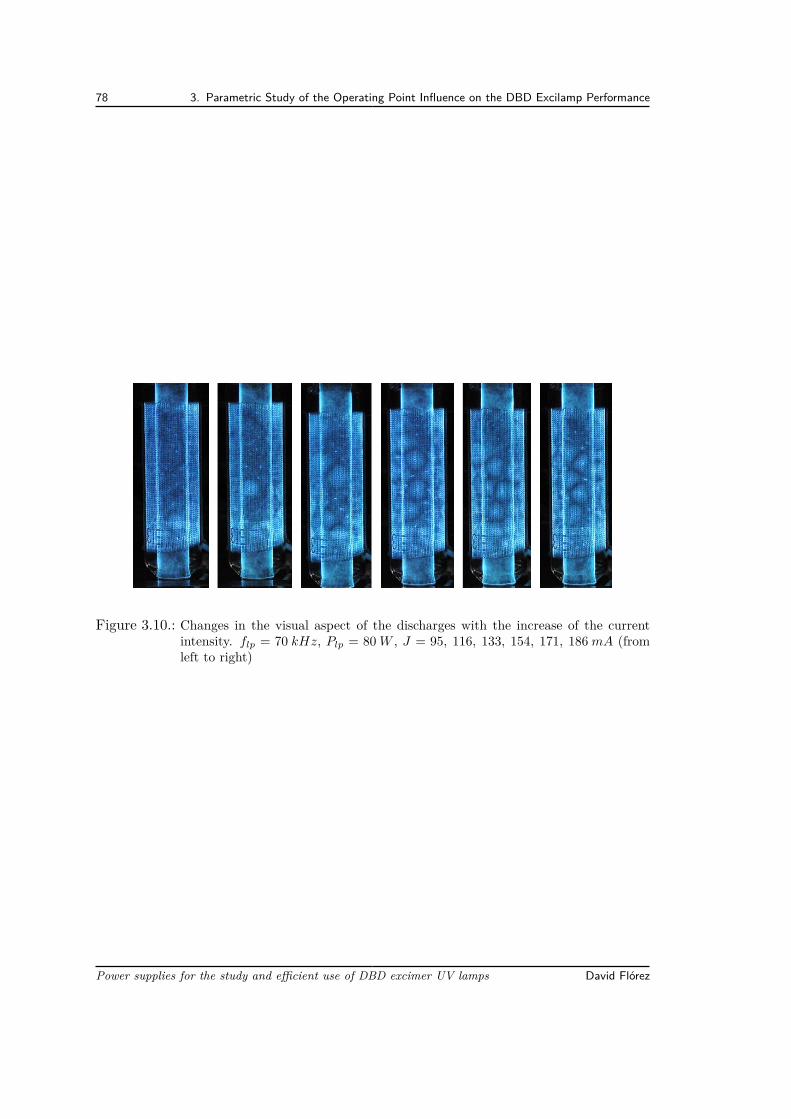
78 3. Parametric Study of the Operating Point Influence on the DBD Excilamp Performance
Figure 3.10.: Changes in the visual aspect of the discharges with the increase of the currentintensity. flp = 70 kHz, Plp = 80 W , J = 95, 116, 133, 154, 171, 186 mA (fromleft to right)
Power supplies for the study and efficient use of DBD excimer UV lamps David Flórez
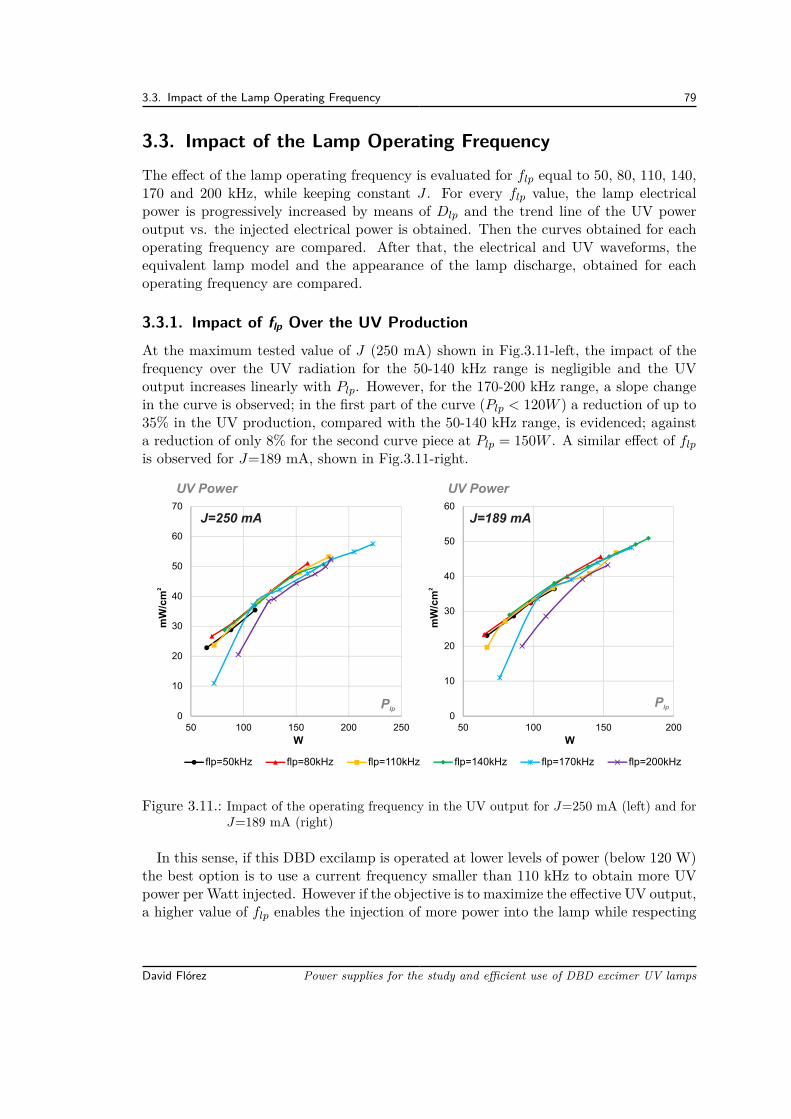
3.3. Impact of the Lamp Operating Frequency 79
3.3. Impact of the Lamp Operating FrequencyThe effect of the lamp operating frequency is evaluated for flp equal to 50, 80, 110, 140,170 and 200 kHz, while keeping constant J . For every flp value, the lamp electricalpower is progressively increased by means of Dlp and the trend line of the UV poweroutput vs. the injected electrical power is obtained. Then the curves obtained for eachoperating frequency are compared. After that, the electrical and UV waveforms, theequivalent lamp model and the appearance of the lamp discharge, obtained for eachoperating frequency are compared.
3.3.1. Impact of flp Over the UV ProductionAt the maximum tested value of J (250 mA) shown in Fig.3.11-left, the impact of thefrequency over the UV radiation for the 50-140 kHz range is negligible and the UVoutput increases linearly with Plp. However, for the 170-200 kHz range, a slope changein the curve is observed; in the first part of the curve (Plp < 120W ) a reduction of up to35% in the UV production, compared with the 50-140 kHz range, is evidenced; againsta reduction of only 8% for the second curve piece at Plp = 150W . A similar effect of flp
is observed for J=189 mA, shown in Fig.3.11-right.
flp=50kHz flp=80kHz flp=110kHz flp=140kHz flp=170kHz flp=200kHz
UV Power
0
10
20
30
40
50
60
50 100 150 200
2mW/cm
W
UV Power
2mW/cm
W
0
10
20
30
40
50
60
70
50 100 150 200 250
PlpPlp
J=250 mA J=189 mA
Figure 3.11.: Impact of the operating frequency in the UV output for J=250 mA (left) and forJ=189 mA (right)
In this sense, if this DBD excilamp is operated at lower levels of power (below 120 W)the best option is to use a current frequency smaller than 110 kHz to obtain more UVpower per Watt injected. However if the objective is to maximize the effective UV output,a higher value of flp enables the injection of more power into the lamp while respecting
David Flórez Power supplies for the study and efficient use of DBD excimer UV lamps
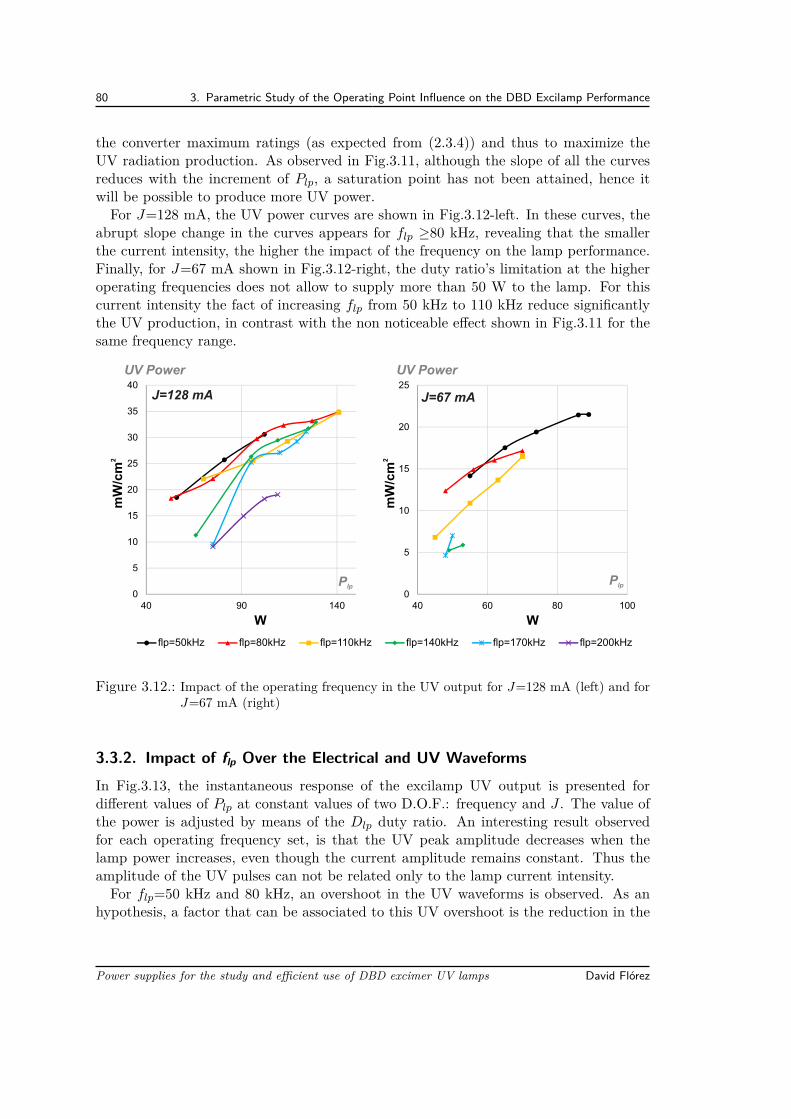
80 3. Parametric Study of the Operating Point Influence on the DBD Excilamp Performance
the converter maximum ratings (as expected from (2.3.4)) and thus to maximize theUV radiation production. As observed in Fig.3.11, although the slope of all the curvesreduces with the increment of Plp, a saturation point has not been attained, hence itwill be possible to produce more UV power.For J=128 mA, the UV power curves are shown in Fig.3.12-left. In these curves, the
abrupt slope change in the curves appears for flp ≥80 kHz, revealing that the smallerthe current intensity, the higher the impact of the frequency on the lamp performance.Finally, for J=67 mA shown in Fig.3.12-right, the duty ratio’s limitation at the higheroperating frequencies does not allow to supply more than 50 W to the lamp. For thiscurrent intensity the fact of increasing flp from 50 kHz to 110 kHz reduce significantlythe UV production, in contrast with the non noticeable effect shown in Fig.3.11 for thesame frequency range.
0
5
10
15
20
25
40 60 80 1000
5
10
15
20
25
30
35
40
40 90 140
J=67 mA
W
UV Power
J=128 mA
2mW/cm
W
UV Power2
mW/cm
flp=50kHz flp=80kHz flp=110kHz flp=140kHz flp=170kHz flp=200kHz
PlpPlp
Figure 3.12.: Impact of the operating frequency in the UV output for J=128 mA (left) and forJ=67 mA (right)
3.3.2. Impact of flp Over the Electrical and UV WaveformsIn Fig.3.13, the instantaneous response of the excilamp UV output is presented fordifferent values of Plp at constant values of two D.O.F.: frequency and J . The value ofthe power is adjusted by means of the Dlp duty ratio. An interesting result observedfor each operating frequency set, is that the UV peak amplitude decreases when thelamp power increases, even though the current amplitude remains constant. Thus theamplitude of the UV pulses can not be related only to the lamp current intensity.For flp=50 kHz and 80 kHz, an overshoot in the UV waveforms is observed. As an
hypothesis, a factor that can be associated to this UV overshoot is the reduction in the
Power supplies for the study and efficient use of DBD excimer UV lamps David Flórez
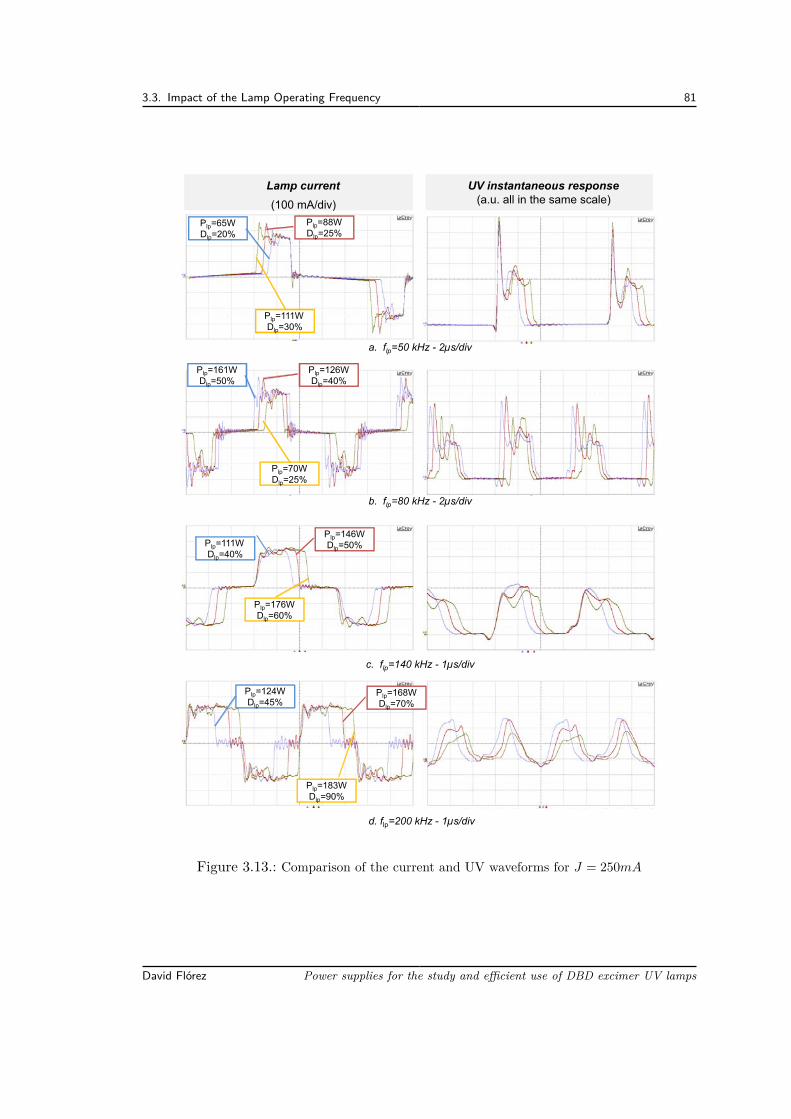
3.3. Impact of the Lamp Operating Frequency 81
Lamp current
(100 mA/div)
UV instantaneous response (a.u. all in the same scale)
a. flp=50 kHz - 2µs/div
Plp=161WDlp=50%
Plp=126WDlp=40%
Plp=70WDlp=25%
b. flp=80 kHz - 2µs/div
Plp=111WDlp=40%
Plp=146WDlp=50%
Plp=176WDlp=60%
c. flp=140 kHz - 1µs/div
Plp=124WDlp=45%
Plp=168WDlp=70%
Plp=183WDlp=90%
d. flp=200 kHz - 1µs/div
Plp=65WDlp=20%
Plp=88WDlp=25%
Plp=111WDlp=30%
Figure 3.13.: Comparison of the current and UV waveforms for J = 250mA
David Flórez Power supplies for the study and efficient use of DBD excimer UV lamps
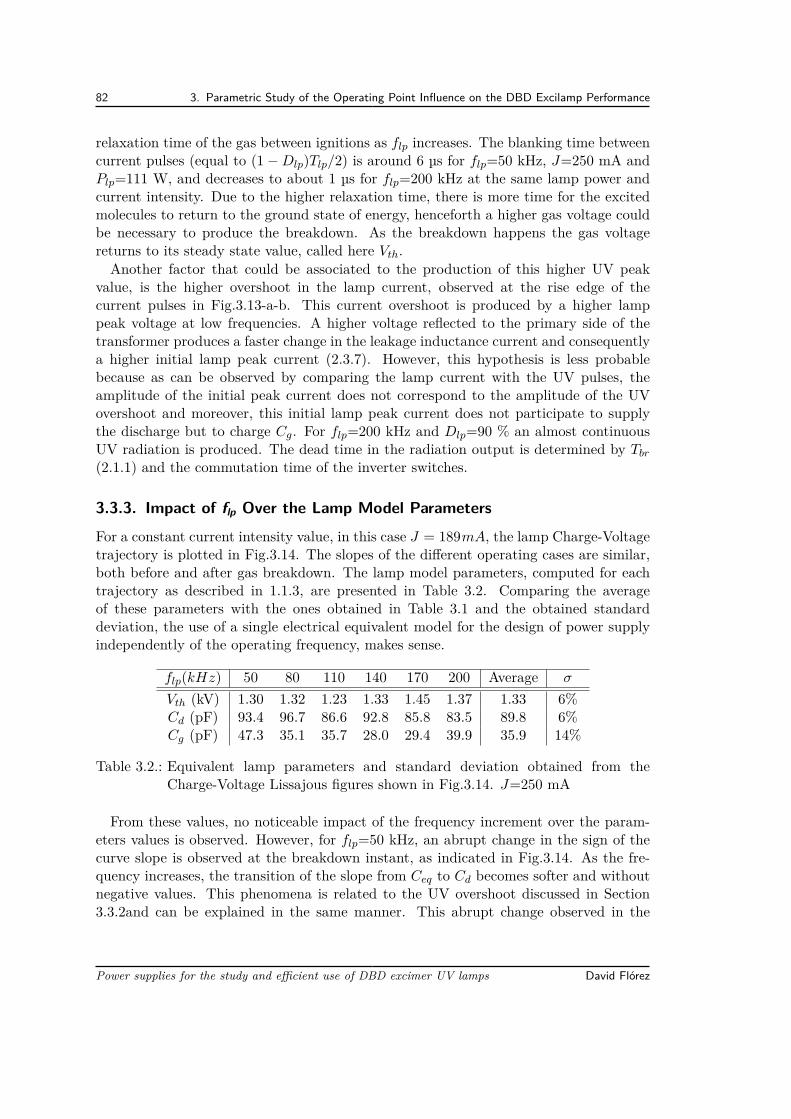
82 3. Parametric Study of the Operating Point Influence on the DBD Excilamp Performance
relaxation time of the gas between ignitions as flp increases. The blanking time betweencurrent pulses (equal to (1−Dlp)Tlp/2) is around 6 µs for flp=50 kHz, J=250 mA andPlp=111 W, and decreases to about 1 µs for flp=200 kHz at the same lamp power andcurrent intensity. Due to the higher relaxation time, there is more time for the excitedmolecules to return to the ground state of energy, henceforth a higher gas voltage couldbe necessary to produce the breakdown. As the breakdown happens the gas voltagereturns to its steady state value, called here Vth.Another factor that could be associated to the production of this higher UV peak
value, is the higher overshoot in the lamp current, observed at the rise edge of thecurrent pulses in Fig.3.13-a-b. This current overshoot is produced by a higher lamppeak voltage at low frequencies. A higher voltage reflected to the primary side of thetransformer produces a faster change in the leakage inductance current and consequentlya higher initial lamp peak current (2.3.7). However, this hypothesis is less probablebecause as can be observed by comparing the lamp current with the UV pulses, theamplitude of the initial peak current does not correspond to the amplitude of the UVovershoot and moreover, this initial lamp peak current does not participate to supplythe discharge but to charge Cg. For flp=200 kHz and Dlp=90 % an almost continuousUV radiation is produced. The dead time in the radiation output is determined by Tbr
(2.1.1) and the commutation time of the inverter switches.
3.3.3. Impact of flp Over the Lamp Model ParametersFor a constant current intensity value, in this case J = 189mA, the lamp Charge-Voltagetrajectory is plotted in Fig.3.14. The slopes of the different operating cases are similar,both before and after gas breakdown. The lamp model parameters, computed for eachtrajectory as described in 1.1.3, are presented in Table 3.2. Comparing the averageof these parameters with the ones obtained in Table 3.1 and the obtained standarddeviation, the use of a single electrical equivalent model for the design of power supplyindependently of the operating frequency, makes sense.
flp(kHz) 50 80 110 140 170 200 Average σ
Vth (kV) 1.30 1.32 1.23 1.33 1.45 1.37 1.33 6%Cd (pF) 93.4 96.7 86.6 92.8 85.8 83.5 89.8 6%Cg (pF) 47.3 35.1 35.7 28.0 29.4 39.9 35.9 14%
Table 3.2.: Equivalent lamp parameters and standard deviation obtained from theCharge-Voltage Lissajous figures shown in Fig.3.14. J=250 mA
From these values, no noticeable impact of the frequency increment over the param-eters values is observed. However, for flp=50 kHz, an abrupt change in the sign of thecurve slope is observed at the breakdown instant, as indicated in Fig.3.14. As the fre-quency increases, the transition of the slope from Ceq to Cd becomes softer and withoutnegative values. This phenomena is related to the UV overshoot discussed in Section3.3.2and can be explained in the same manner. This abrupt change observed in the
Power supplies for the study and efficient use of DBD excimer UV lamps David Flórez
3.3. Impact of the Lamp Operating Frequency 83
-6000 -4000 -2000 0 2000 4000 6000-5
-4
-3
-2
-1
0
1
2
3
4
5x 10
-7
J=189 mA
Lamp electric charge (Q)
Slope=Ceq
Slope=Cd
50
80
110
140
170
200
lpf (kHz) =
Lamp voltage (V)
Negative slope at thegas breakdown
Figure 3.14.: Lamp Charge-Voltage plane for different values of current frequency at constantcurrent intensity and injected power.
Lissajous figure can be observed also in the time domain regarding the vlp waveformshown in Fig.2.27. In this figure it can be observed that, at the gas breakdown instant,a brief oscillation of vlp appears for flp=50 kHz; for flp=100 kHz, at the gas breakdownvlp remains almost constant during a short time; and for flp=50 kHz, there is a softchange in the slope in the transition from before and after the breakdown.
3.3.4. Impact of flp Over the Discharge Regime
Pictures in Fig.3.15 have been taken for a constant excilamp excitation power, suppliedat a constant value of current intensity. Each picture corresponds to a different valueof operating frequency. As can be observed, no change in the visual aspect of thedischarge is noticed for this operating frequency range (50-100 kHz). The UV power thatcorresponds to these picture presents a slight decrease of 6 % with the increase of flp. Inconclusion, the visual aspect of the streamers remains diffuse and the UV production doesnot change significantly. Comparing this behavior with pictures in Fig.3.10 where thechange of the discharge from diffuse to filamentary has been accompanied by an increaseon the UV power, a relation between the filamentary appearance of the streamers anda high UV production efficiency, can be suggested.
David Flórez Power supplies for the study and efficient use of DBD excimer UV lamps
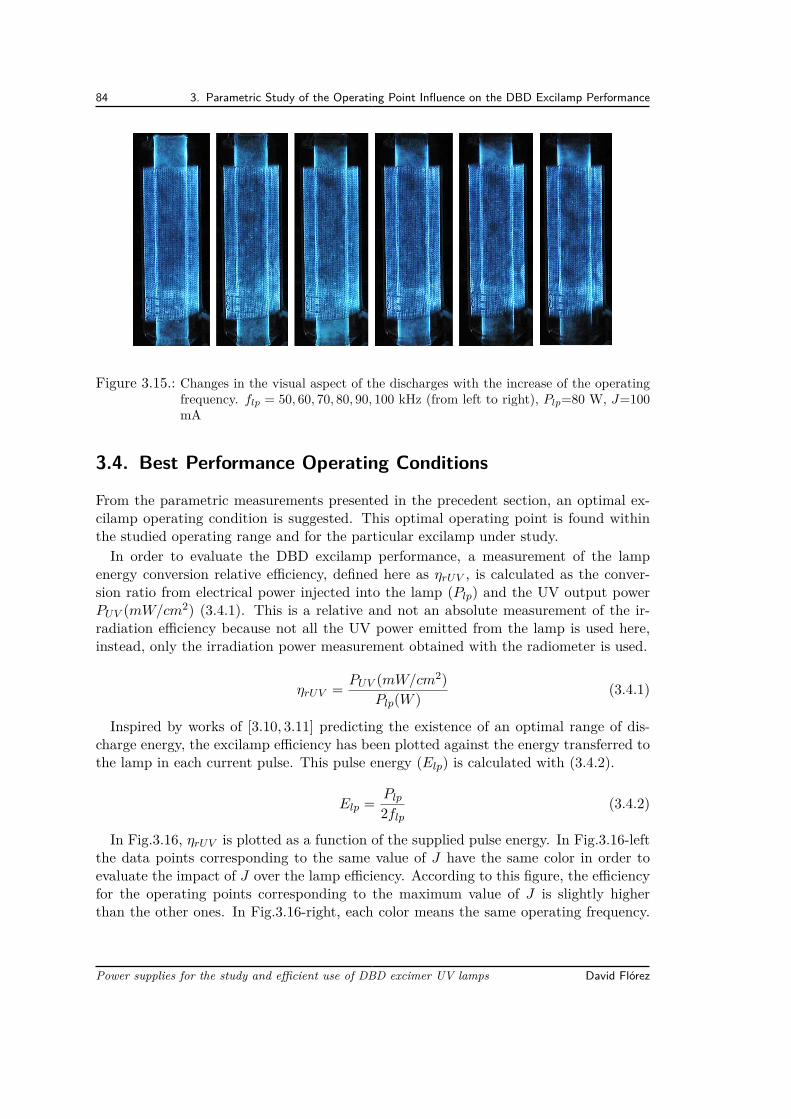
84 3. Parametric Study of the Operating Point Influence on the DBD Excilamp Performance
Figure 3.15.: Changes in the visual aspect of the discharges with the increase of the operatingfrequency. flp = 50, 60, 70, 80, 90, 100 kHz (from left to right), Plp=80 W, J=100mA
3.4. Best Performance Operating Conditions
From the parametric measurements presented in the precedent section, an optimal ex-cilamp operating condition is suggested. This optimal operating point is found withinthe studied operating range and for the particular excilamp under study.In order to evaluate the DBD excilamp performance, a measurement of the lamp
energy conversion relative efficiency, defined here as ηrUV , is calculated as the conver-sion ratio from electrical power injected into the lamp (Plp) and the UV output powerPUV (mW/cm2) (3.4.1). This is a relative and not an absolute measurement of the ir-radiation efficiency because not all the UV power emitted from the lamp is used here,instead, only the irradiation power measurement obtained with the radiometer is used.
ηrUV = PUV (mW/cm2)Plp(W ) (3.4.1)
Inspired by works of [3.10, 3.11] predicting the existence of an optimal range of dis-charge energy, the excilamp efficiency has been plotted against the energy transferred tothe lamp in each current pulse. This pulse energy (Elp) is calculated with (3.4.2).
Elp = Plp
2flp(3.4.2)
In Fig.3.16, ηrUV is plotted as a function of the supplied pulse energy. In Fig.3.16-leftthe data points corresponding to the same value of J have the same color in order toevaluate the impact of J over the lamp efficiency. According to this figure, the efficiencyfor the operating points corresponding to the maximum value of J is slightly higherthan the other ones. In Fig.3.16-right, each color means the same operating frequency.
Power supplies for the study and efficient use of DBD excimer UV lamps David Flórez
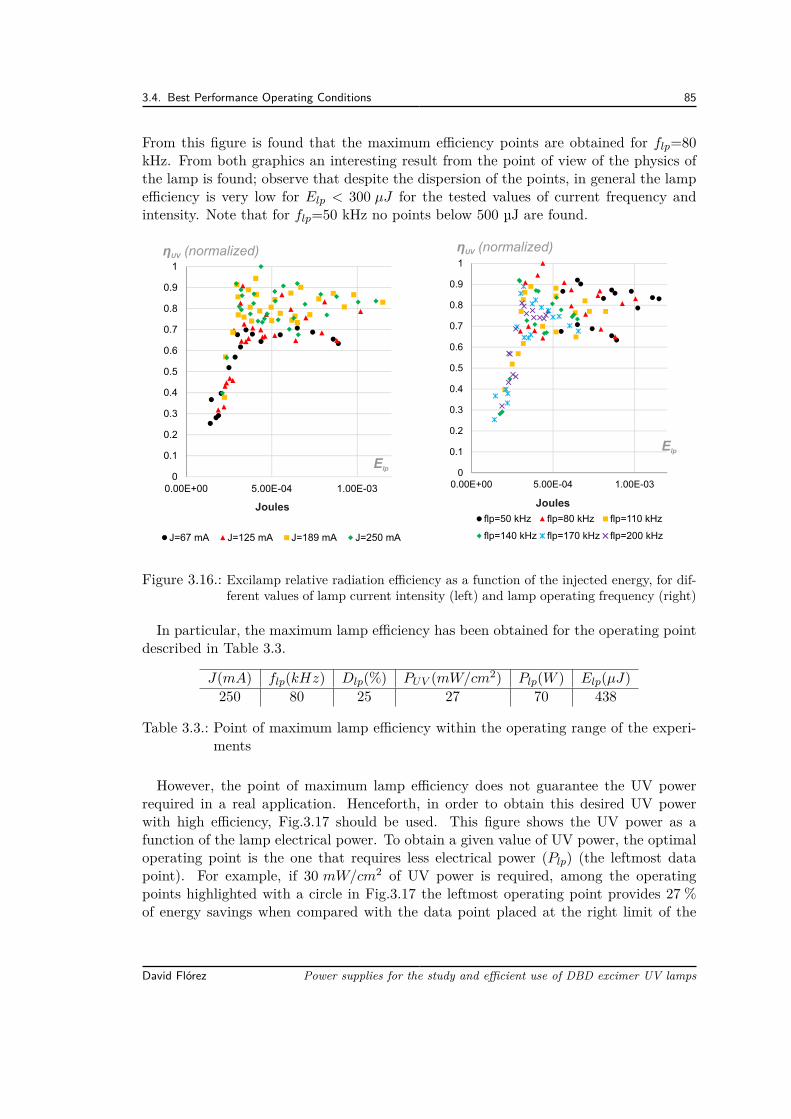
3.4. Best Performance Operating Conditions 85
From this figure is found that the maximum efficiency points are obtained for flp=80kHz. From both graphics an interesting result from the point of view of the physics ofthe lamp is found; observe that despite the dispersion of the points, in general the lampefficiency is very low for Elp < 300 µJ for the tested values of current frequency andintensity. Note that for flp=50 kHz no points below 500 µJ are found.
0
0.1
0.2
0.3
0.4
0.5
0.6
0.7
0.8
0.9
1
0.00E+00 5.00E-04 1.00E-03
J=67 mA J=125 mA J=189 mA J=250 mA
η (normalized)UV
Joules
E lp0
0.1
0.2
0.3
0.4
0.5
0.6
0.7
0.8
0.9
1
0.00E+00 5.00E-04 1.00E-03
flp=50 kHz flp=80 kHz flp=110 kHz
flp=140 kHz flp=170 kHz flp=200 kHz
η (normalized)UV
Joules
E lp
Figure 3.16.: Excilamp relative radiation efficiency as a function of the injected energy, for dif-ferent values of lamp current intensity (left) and lamp operating frequency (right)
In particular, the maximum lamp efficiency has been obtained for the operating pointdescribed in Table 3.3.
J(mA) flp(kHz) Dlp(%) PUV (mW/cm2) Plp(W ) Elp(µJ)250 80 25 27 70 438
Table 3.3.: Point of maximum lamp efficiency within the operating range of the experi-ments
However, the point of maximum lamp efficiency does not guarantee the UV powerrequired in a real application. Henceforth, in order to obtain this desired UV powerwith high efficiency, Fig.3.17 should be used. This figure shows the UV power as afunction of the lamp electrical power. To obtain a given value of UV power, the optimaloperating point is the one that requires less electrical power (Plp) (the leftmost datapoint). For example, if 30 mW/cm2 of UV power is required, among the operatingpoints highlighted with a circle in Fig.3.17 the leftmost operating point provides 27 %of energy savings when compared with the data point placed at the right limit of the
David Flórez Power supplies for the study and efficient use of DBD excimer UV lamps
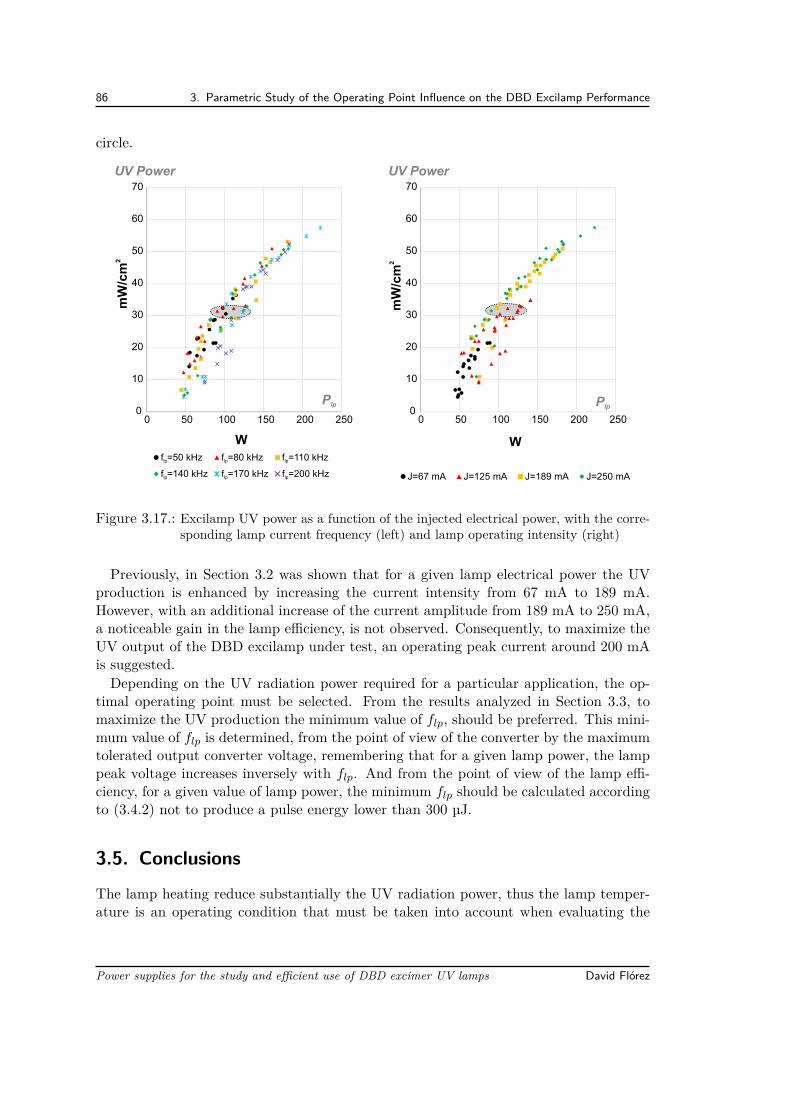
86 3. Parametric Study of the Operating Point Influence on the DBD Excilamp Performance
circle.
W
UV Power
2mW/cm
0
10
20
30
40
50
60
70
0 50 100 150 200 250
Plp
W
UV Power
2mW/cm
0
10
20
30
40
50
60
70
0 50 100 150 200 250
Plp
f =50 kHzlp f =80 kHzlp f =110 kHzlp
f =140 kHzlp f =170 kHzlp f =200 kHzlp J=67 mA J=125 mA J=189 mA J=250 mA
Figure 3.17.: Excilamp UV power as a function of the injected electrical power, with the corre-sponding lamp current frequency (left) and lamp operating intensity (right)
Previously, in Section 3.2 was shown that for a given lamp electrical power the UVproduction is enhanced by increasing the current intensity from 67 mA to 189 mA.However, with an additional increase of the current amplitude from 189 mA to 250 mA,a noticeable gain in the lamp efficiency, is not observed. Consequently, to maximize theUV output of the DBD excilamp under test, an operating peak current around 200 mAis suggested.Depending on the UV radiation power required for a particular application, the op-
timal operating point must be selected. From the results analyzed in Section 3.3, tomaximize the UV production the minimum value of flp, should be preferred. This mini-mum value of flp is determined, from the point of view of the converter by the maximumtolerated output converter voltage, remembering that for a given lamp power, the lamppeak voltage increases inversely with flp. And from the point of view of the lamp effi-ciency, for a given value of lamp power, the minimum flp should be calculated accordingto (3.4.2) not to produce a pulse energy lower than 300 µJ.
3.5. ConclusionsThe lamp heating reduce substantially the UV radiation power, thus the lamp temper-ature is an operating condition that must be taken into account when evaluating the
Power supplies for the study and efficient use of DBD excimer UV lamps David Flórez
3.5. Conclusions 87
DBD excilamp performance. The DBD excilamp UV production is positively affectedby the increase of the current intensity. However, for the particular experimental benchstudied here, there is no important gain in the lamp performance above 189 mA ofcurrent intensity. In contrast, the simplified equivalent electrical model of the lamp isbarely affected by the changes in the operating point.The existence of well defined filaments in the discharge is associated to better levels
of UV production efficiency than those measured for non or less filamentary operatingpoints. The amplitude and duration of the UV radiation pulses are governed by thelamp current intensity and the current pulse duration respectively.The energy injected into the lamp to produce the discharge, seems to has an influence
in the lamp performance. For all the tested operating points and for this particular XeClDBD excilamp, the better performances have been obtained with energy pulses higherthan 300 µJ . Additionally it has been demonstrated that by only changing the DBDexcilamp operating point, the lamp performance can be drastically improved.Finally, we point out that the methodology used for the presented study, incorporat-
ing the use of the Square-shape current mode supply, has demonstrated to be a valuabletool for the evaluation of DBD excimer lamps. According to [3.4, p. 54] the maximumefficiency conditions can differ depending on the gas mixture of the excilamp, conse-quently, a comparative study of different types of gas mixtures DBD excilamps, is oneof the perspectives of this work.
David Flórez Power supplies for the study and efficient use of DBD excimer UV lamps
Bibliography[3.1] Haruaki Akashi, Akinori Odam, and Yosuke Sakai, “Effect of gas heating on ex-
cimer distribution in DBD xe excimer lamp,” in 28th ICPIG Conference Records,(Prague, Czech Republic), July 2007.
[3.2] F. Marchal, N. Sewraj, G. Jabbour, P. R. Akerreta, and G. Ledru, “Temperaturedependence of xenon excimer formations using two-photon absorption laser-inducedfluorescence,” Journal of Physics B: Atomic, Molecular and Optical Physics, vol. 43,p. 235210, Dec. 2010.
[3.3] R. J. Carman and R. P. Mildren, “Computer modelling of a short-pulse exciteddielectric barrier discharge xenon excimer lamp ( 172 nm),” Journal of Physics D:Applied Physics, vol. 36, pp. 19–33, Jan. 2003.
[3.4] M. I. Lomaev, V. S. Skakun, V. F. Tarasenko, and D. V. Shitts, “Excilamps basedon xenon dimers excited by a barrier discharge,” Journal of Optical Technology,vol. 79, no. 8, pp. 498–502, 2012.
[3.5] S. Bhosle, G. Zissis, J.-J. Damelincourt, A. Capdevila, K. Gupta, F. Dawson, andV. Tarasenko, “Implementation of an efficiency indicator in an electrical modeling ofa dielectric barrier discharge lamp,” in Conference Record of the 2006 IEEE IndustryApplications Conference, 2006. 41st IAS Annual Meeting, vol. 4, pp. 1784–1790,2006.
[3.6] A. Lopez, H. Piquet, D. Patino, R. Diez, and X. Bonnin, “Parameters identificationand gas behavior characterization of DBD systems,” IEEE Transactions on PlasmaScience, vol. 41, no. 8, pp. 2335–2342, 2013.
[3.7] Hartnett, James, Transport Phenomena in Plasma. Academic Press, Oct. 2007.
[3.8] U. Kogelschatz, “Dielectric-barrier discharges: Their history, discharge physics, andindustrial applications,” Plasma Chemistry and Plasma Processing, vol. 23, no. 1,pp. 1–46, 2003.
[3.9] M. I. Lomaev, V. S. Skakun, E. A. Sosnin, V. F. Tarasenko, D. V. Shitts, andM. V. Erofeev, “Excilamps efficient sources of spontaneous UV and VUV radiation,”Physics-Uspekhi, vol. 46, pp. 193–209, Feb. 2003.
[3.10] A. M. Razhev and A. A. Zhupikov, “Influence of the specific pump power onthe output energy and efficiency of a 223-nm gas-discharge-pumped excimer KrCllaser,” Quantum Electronics, vol. 38, p. 1005, Nov. 2008.
Bibliography 89
[3.11] A. M. Boichenko, “The effect of the excitation power on the emission efficiency ofbarrier- and glow-discharge pumped exciplex and excimer lamps,” Laser Physics,vol. 14, no. 8, pp. 1036–1044, 2004.
David Flórez Power supplies for the study and efficient use of DBD excimer UV lamps


4. High Efficiency DBD Power SupplyWorking at the Optimal Operating Point
On the basis of the DBD lamp electrical model, it has been proven that the DBDelectrical power can be controlled by means of its current instead of using its voltage(Section 1.2). Morevover, by means of the lamp current, the UV temporal response canbe also controlled, because, as mentioned in Section 1.1, the fitting between the UVinstantaneous response and the lamp current waveform after gas breakdown, has beendemonstrated [4.1, 4.2].Accordingly, in Section 2 a square-waveform current supply with three degrees of
freedom, has been designed to study the radiation of DBD lamps. Using this pro-grammable converter, optimal DBD excilamp operating conditions were determined inChapter 3. However this fully-controlled converter presents hard-switching, diminishingthe efficiency and producing EMI.In order to increase the converter-lamp ensemble efficiency, the present Chapter pro-
poses to supply the lamp at a fixed operating condition employing a Zero Current Switch-ing (ZCS) converter, differing from existing power supplies for DBDs in the followingaspects:
• Zero current switching (ZCS) is achieved in all the switches at turn-on and turn-off,also respecting the current mode operation.
• The converter is designed to work at an optimal operating point of the DBDexcilamp, based on the parametric study presented in Chapter 3.
This Chapter is organized as follows: Section 4.1 explains the converter operatingprinciple using the simplified lamp model and develops the mathematical relationshipsfor the design of the converter, based on the state plane analysis. The proposed con-verter design is distinguished from previous developments, by the use of three equivalentelectrical parameters of the DBD model (Cd,Cg,Vth). Section 4.2 dimensions the compo-nents for a specific XeCl excimer lamp and verifies the previous theoretical developments.Experimental results and conclusions are given in Sections 4.3 and 4.4, respectively.
4.1. Topology: SRI Operated in DCMThe classical topology of the series resonant current inverter (SRI), shown in Fig.4.1,combines a current source behavior [4.3], [4.4], [4.5] with the capability of ZCS. For thisreason this topology is chosen to implement the proposed DBD current supply.
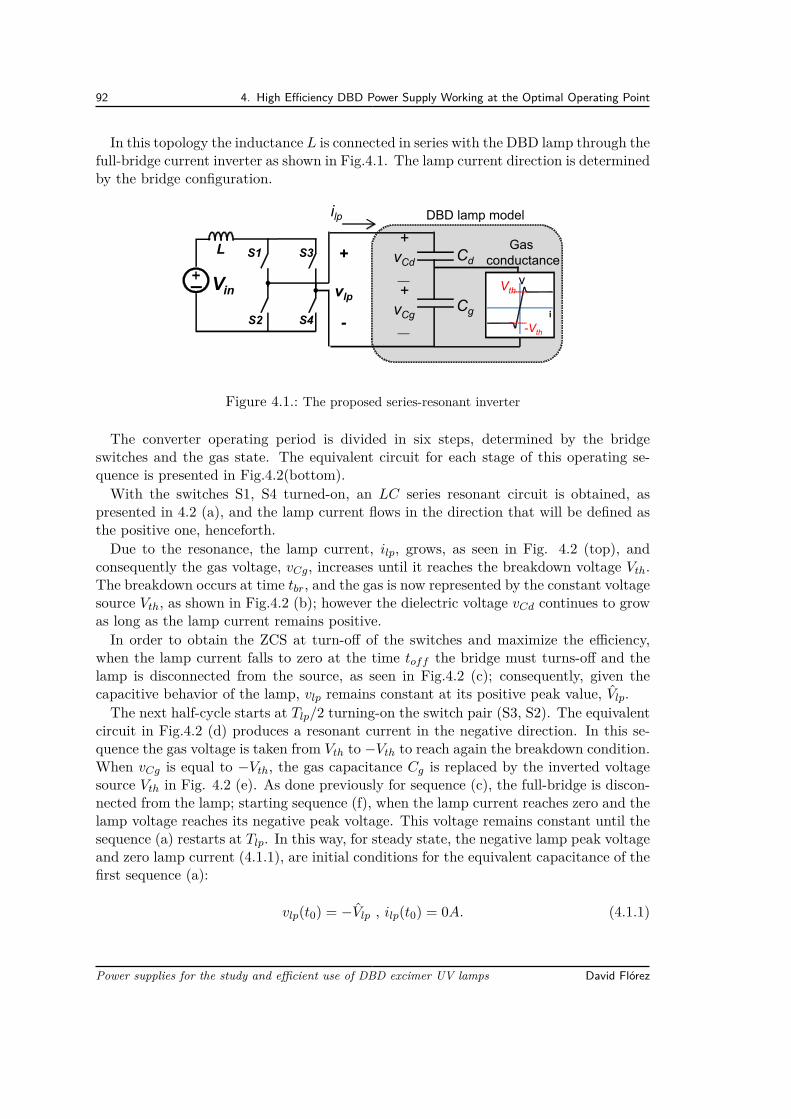
92 4. High Efficiency DBD Power Supply Working at the Optimal Operating Point
In this topology the inductance L is connected in series with the DBD lamp through thefull-bridge current inverter as shown in Fig.4.1. The lamp current direction is determinedby the bridge configuration.
Vin
L S1
S4
S3
S2Cg
Cd+
vlp
-
DBD lamp modelilp
i
-Vth
Vthv
Gas conductance
+vCg__
+vCd__
Figure 4.1.: The proposed series-resonant inverter
The converter operating period is divided in six steps, determined by the bridgeswitches and the gas state. The equivalent circuit for each stage of this operating se-quence is presented in Fig.4.2(bottom).With the switches S1, S4 turned-on, an LC series resonant circuit is obtained, as
presented in 4.2 (a), and the lamp current flows in the direction that will be defined asthe positive one, henceforth.Due to the resonance, the lamp current, ilp, grows, as seen in Fig. 4.2 (top), and
consequently the gas voltage, vCg, increases until it reaches the breakdown voltage Vth.The breakdown occurs at time tbr, and the gas is now represented by the constant voltagesource Vth, as shown in Fig.4.2 (b); however the dielectric voltage vCd continues to growas long as the lamp current remains positive.In order to obtain the ZCS at turn-off of the switches and maximize the efficiency,
when the lamp current falls to zero at the time toff the bridge must turns-off and thelamp is disconnected from the source, as seen in Fig.4.2 (c); consequently, given thecapacitive behavior of the lamp, vlp remains constant at its positive peak value, Vlp.The next half-cycle starts at Tlp/2 turning-on the switch pair (S3, S2). The equivalent
circuit in Fig.4.2 (d) produces a resonant current in the negative direction. In this se-quence the gas voltage is taken from Vth to −Vth to reach again the breakdown condition.When vCg is equal to −Vth, the gas capacitance Cg is replaced by the inverted voltagesource Vth in Fig. 4.2 (e). As done previously for sequence (c), the full-bridge is discon-nected from the lamp; starting sequence (f), when the lamp current reaches zero and thelamp voltage reaches its negative peak voltage. This voltage remains constant until thesequence (a) restarts at Tlp. In this way, for steady state, the negative lamp peak voltageand zero lamp current (4.1.1), are initial conditions for the equivalent capacitance of thefirst sequence (a):
vlp(t0) = −Vlp , ilp(t0) = 0A. (4.1.1)
Power supplies for the study and efficient use of DBD excimer UV lamps David Flórez
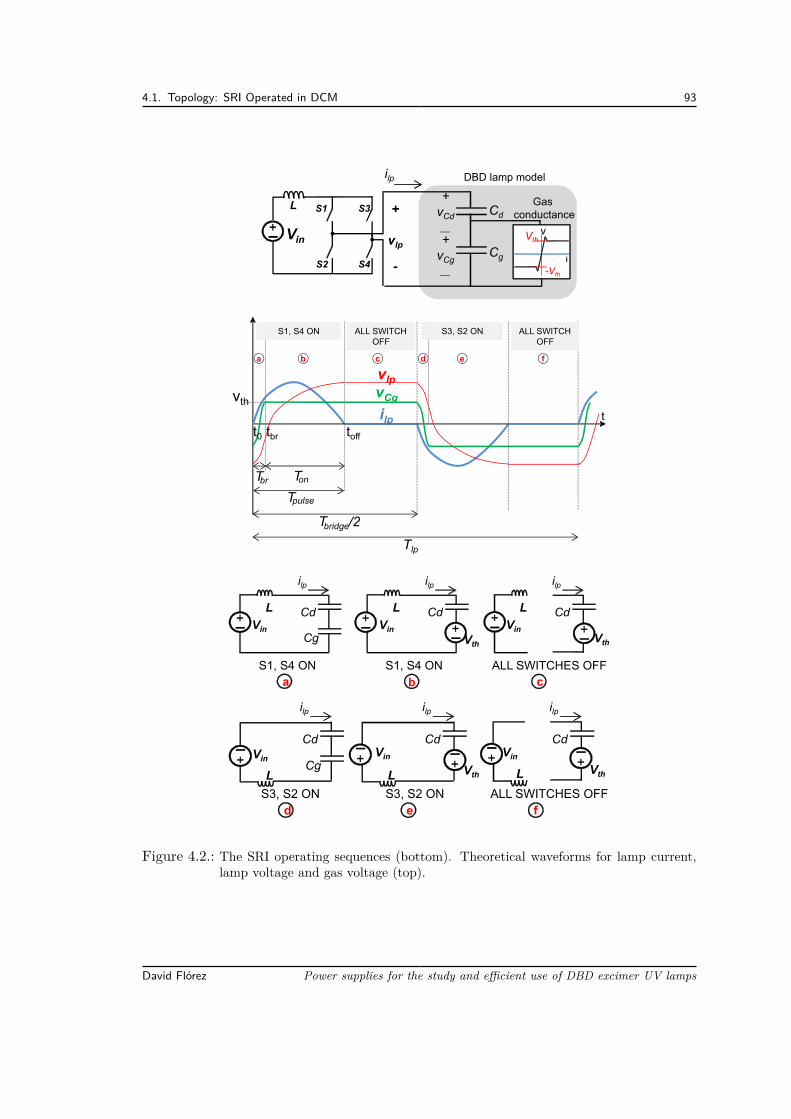
4.1. Topology: SRI Operated in DCM 93
Vin
L S1
S4
S3
S2Cg
Cd+
vlp
-
DBD lamp modelilp
i
-Vth
Vthv
Gas conductance
+vCg__
+vCd__
b
ilp
Cg
Cd
a
Vin
L
ilp
Cd
c
Vin
L
Vth
ilp
CdVin
L
Vth
S1, S4 ON S1, S4 ON ALL SWITCHES OFF
fe
ilp
Cg
Cd
d
Vin
L
ilp
CdVin
VthL
ilp
CdVin
L Vth
S3, S2 ON S3, S2 ON ALL SWITCHES OFF
Tpulse
ilp t
Tlp
feba c d
vCg
tbrt0 toff
ALL SWITCH OFF
S1, S4 ON ALL SWITCH OFF
S3, S2 ON
vth
vlp
Tbridge/2
TonTbr
Figure 4.2.: The SRI operating sequences (bottom). Theoretical waveforms for lamp current,lamp voltage and gas voltage (top).
David Flórez Power supplies for the study and efficient use of DBD excimer UV lamps
94 4. High Efficiency DBD Power Supply Working at the Optimal Operating Point
Using the DCM selected in this work, the lamp operating frequency is defined by onlythe bridge operation, as presented in Fig. 4.2 (top).The achievement of this DCM mode is implemented thanks to a specific switch, which
is presented in Section 4.2. The converter is designed using the state plane analysis[4.3], [4.6]. This method allows the determination of the operating conditions for theconverter-lamp system, using the equivalent circuits from Fig. 4.2 (bottom). Despitestate plane analysis can be used to find transient response, only the steady-state analyticexpressions are presented in this Chapter. Hereafter, the sequences corresponding to thepositive current are analyzed; due to symmetry, the study of the negative cycle leads tosimilar results.
4.1.1. State plane analysisThe state plane analysis is used to plot the current-voltage behavior of a resonant circuit.Fig.4.2 (a) shows the resonant equivalent circuit before gas breakdown occurs. Normal-ized units are used, leading to the plot of circular clockwise trajectories [4.3] to describethe current-voltage characteristic for the lamp before ignition, as will be presented inFig. 4.3:
u = vlp
Vth(4.1.2)
j = ilpVth
√L
Ceq, with Ceq = CdCg
Cd + Cg(4.1.3)
After the gas breaks down, the equivalent resonant circuit changes as shown in Fig.4.2 (b) with vCg constant and equal to Vth. Therefore, a new state plane is used. Thisnew plane shown in Fig.4.4, draws the normalized current-voltage characteristic for thedielectric capacitor, being the dielectric current equal to the lamp current.As the equivalent capacitance changes from Ceq to Cd, normalization is redefined as
follows, using * as notation to remember that these variables correspond to the ignitedlamp. These variables are used after:
u∗ = vCd
Vth= vlp − vCg
Vth= vlp
Vth− 1 = u− 1 (4.1.4)
j∗ = ilpVth
√L
Cd(4.1.5)
Note that j∗ does not have the same normalization as j, because the lamp equivalentcapacitance change.
4.1.2. State plane: before breakdown trajectoryTwo operating cases for the equivalent resonant circuit before lamp ignition, are shownin Fig.4.3: in the state plane of the operating case (A) the lamp peak current is not
Power supplies for the study and efficient use of DBD excimer UV lamps David Flórez
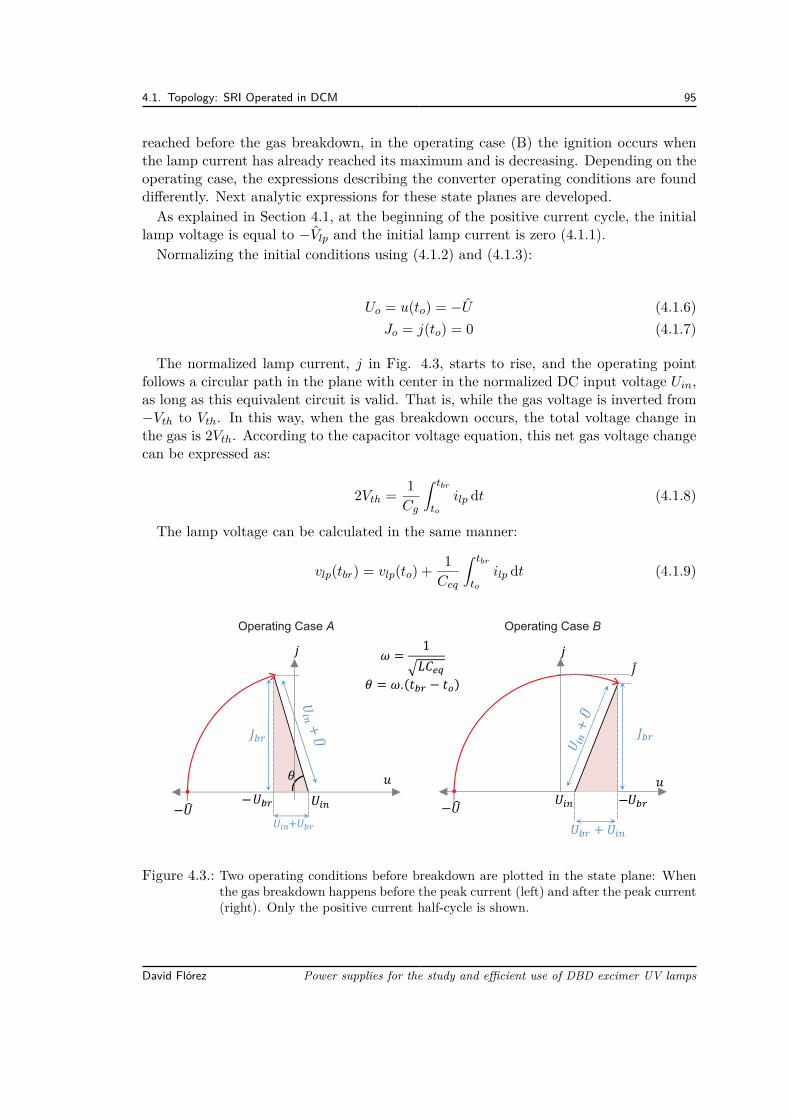
4.1. Topology: SRI Operated in DCM 95
reached before the gas breakdown, in the operating case (B) the ignition occurs whenthe lamp current has already reached its maximum and is decreasing. Depending on theoperating case, the expressions describing the converter operating conditions are founddifferently. Next analytic expressions for these state planes are developed.As explained in Section 4.1, at the beginning of the positive current cycle, the initial
lamp voltage is equal to −Vlp and the initial lamp current is zero (4.1.1).Normalizing the initial conditions using (4.1.2) and (4.1.3):
Uo = u(to) = −U (4.1.6)Jo = j(to) = 0 (4.1.7)
The normalized lamp current, j in Fig. 4.3, starts to rise, and the operating pointfollows a circular path in the plane with center in the normalized DC input voltage Uin,as long as this equivalent circuit is valid. That is, while the gas voltage is inverted from−Vth to Vth. In this way, when the gas breakdown occurs, the total voltage change inthe gas is 2Vth. According to the capacitor voltage equation, this net gas voltage changecan be expressed as:
2Vth = 1Cg
∫ tbr
to
ilp dt (4.1.8)
The lamp voltage can be calculated in the same manner:
vlp(tbr) = vlp(to) + 1Ceq
∫ tbr
to
ilp dt (4.1.9)
Operating Case A Operating Case B
Figure 4.3.: Two operating conditions before breakdown are plotted in the state plane: Whenthe gas breakdown happens before the peak current (left) and after the peak current(right). Only the positive current half-cycle is shown.
David Flórez Power supplies for the study and efficient use of DBD excimer UV lamps
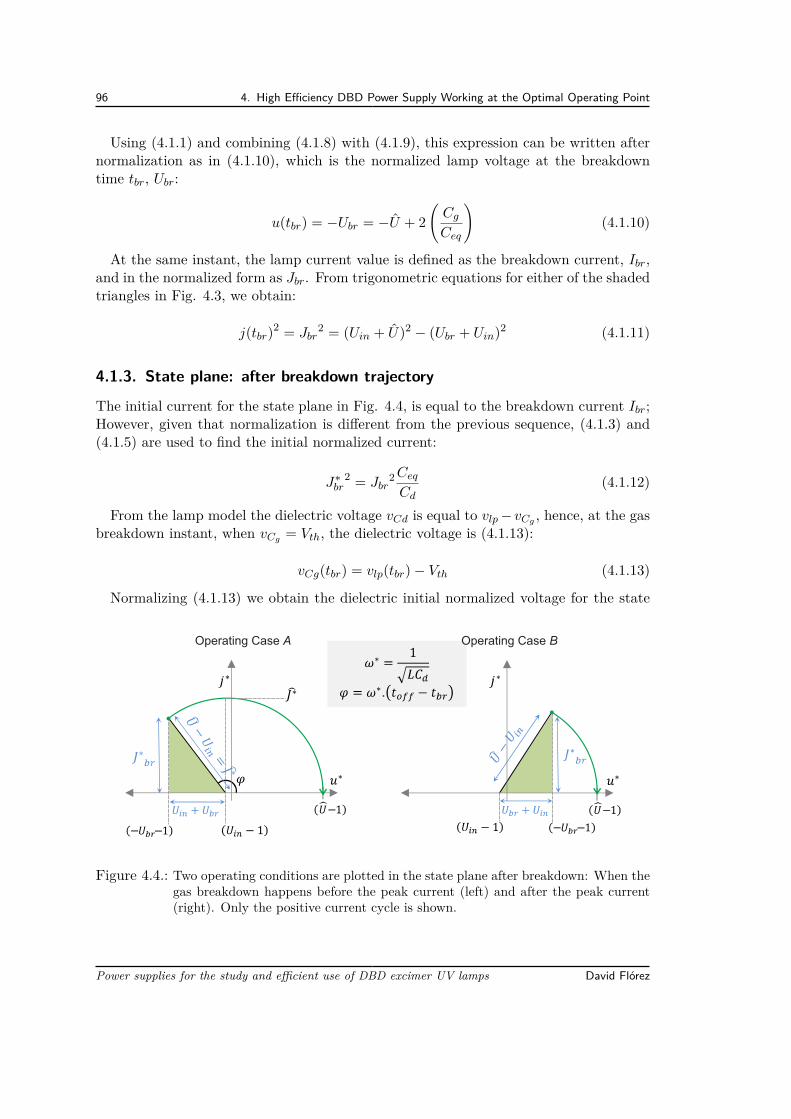
96 4. High Efficiency DBD Power Supply Working at the Optimal Operating Point
Using (4.1.1) and combining (4.1.8) with (4.1.9), this expression can be written afternormalization as in (4.1.10), which is the normalized lamp voltage at the breakdowntime tbr, Ubr:
u(tbr) = −Ubr = −U + 2(Cg
Ceq
)(4.1.10)
At the same instant, the lamp current value is defined as the breakdown current, Ibr,and in the normalized form as Jbr. From trigonometric equations for either of the shadedtriangles in Fig. 4.3, we obtain:
j(tbr)2 = Jbr2 = (Uin + U)2 − (Ubr + Uin)2 (4.1.11)
4.1.3. State plane: after breakdown trajectory
The initial current for the state plane in Fig. 4.4, is equal to the breakdown current Ibr;However, given that normalization is different from the previous sequence, (4.1.3) and(4.1.5) are used to find the initial normalized current:
J∗br
2 = Jbr2Ceq
Cd(4.1.12)
From the lamp model the dielectric voltage vCd is equal to vlp− vCg , hence, at the gasbreakdown instant, when vCg = Vth, the dielectric voltage is (4.1.13):
vCg(tbr) = vlp(tbr)− Vth (4.1.13)
Normalizing (4.1.13) we obtain the dielectric initial normalized voltage for the state
Operating Case A Operating Case B
Figure 4.4.: Two operating conditions are plotted in the state plane after breakdown: When thegas breakdown happens before the peak current (left) and after the peak current(right). Only the positive current cycle is shown.
Power supplies for the study and efficient use of DBD excimer UV lamps David Flórez
4.1. Topology: SRI Operated in DCM 97
plane in Fig.4.4, u∗(tbr) (4.1.14):
u∗(tbr) = −U∗br − 1 (4.1.14)
Given that the voltage normalization constant is the same (Vth) for both state planes,before and after gas breakdown, we can write (4.1.15):
u∗(tbr) = −Ubr − 1 (4.1.15)
Now, using geometrical relations for either of the shaded triangles in the state planeof Fig. 4.4, we can write (4.1.16):
J∗br
2 = (U − Uin)2 − (Ubr + Uin)2 (4.1.16)
In order to find U in terms of the normalized input voltage Uin we proceed as follows.First, replacing (4.1.12) in (4.1.16), we obtain: (4.1.17)
Jbr2Ceq
Cd= (U − Uin)2 − (Ubr + Uin)2 (4.1.17)
Now, Jbr is replaced by the expression given in (4.1.11):(4.1.18)[(Uin + U
)2− (Ubr + Uin)2
].Ceq
Cd=(U − Uin
)2− (Ubr + Uin)2 (4.1.18)
Using (4.1.10), Ubr is substituted for an expression in terms of U . Solving the resultingequation, we find the lamp normalized peak voltage value in steady state (4.1.19):
U = 1 + Cg
Cd (1− Uin) (4.1.19)
and de-normalizing (4.1.19), the lamp peak voltage is found: (4.1.20)
Vlp = Vth + Vth2Cg
Cd(Vth − Vin) (4.1.20)
One should point out that the lamp peak voltage depends only on the input voltageand the parameters of the lamp, but not on the inductance value.
4.1.4. Operating conditions
In this Section is shown that the stability of the converter depends on the input voltagevalue. Once in the stability region, the two operating cases studied before (lamp peakcurrent reached after and before the gas breakdown) are considered for the computationfor the operating conditions.
David Flórez Power supplies for the study and efficient use of DBD excimer UV lamps
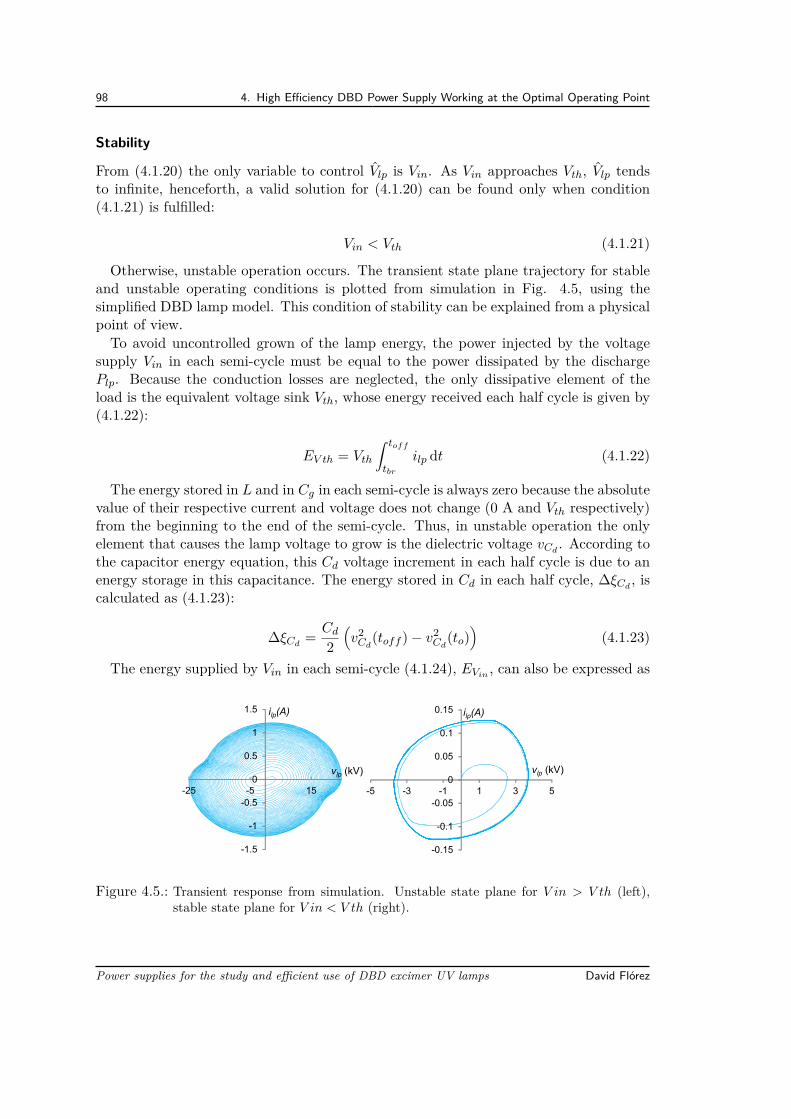
98 4. High Efficiency DBD Power Supply Working at the Optimal Operating Point
Stability
From (4.1.20) the only variable to control Vlp is Vin. As Vin approaches Vth, Vlp tendsto infinite, henceforth, a valid solution for (4.1.20) can be found only when condition(4.1.21) is fulfilled:
Vin < Vth (4.1.21)
Otherwise, unstable operation occurs. The transient state plane trajectory for stableand unstable operating conditions is plotted from simulation in Fig. 4.5, using thesimplified DBD lamp model. This condition of stability can be explained from a physicalpoint of view.To avoid uncontrolled grown of the lamp energy, the power injected by the voltage
supply Vin in each semi-cycle must be equal to the power dissipated by the dischargePlp. Because the conduction losses are neglected, the only dissipative element of theload is the equivalent voltage sink Vth, whose energy received each half cycle is given by(4.1.22):
EV th = Vth
∫ toff
tbr
ilp dt (4.1.22)
The energy stored in L and in Cg in each semi-cycle is always zero because the absolutevalue of their respective current and voltage does not change (0 A and Vth respectively)from the beginning to the end of the semi-cycle. Thus, in unstable operation the onlyelement that causes the lamp voltage to grow is the dielectric voltage vCd
. According tothe capacitor energy equation, this Cd voltage increment in each half cycle is due to anenergy storage in this capacitance. The energy stored in Cd in each half cycle, ∆ξCd
, iscalculated as (4.1.23):
∆ξCd= Cd
2(v2
Cd(toff )− v2
Cd(to)
)(4.1.23)
The energy supplied by Vin in each semi-cycle (4.1.24), EVin , can also be expressed as
-1.5
-1
-0.5
0
0.5
1
1.5
-25 -5 15
-0.15
-0.1
-0.05
0
0.05
0.1
0.15
-5 -3 -1 1 3 5
vlp (kV) vlp (kV)
ilp(A) ilp(A)
Figure 4.5.: Transient response from simulation. Unstable state plane for V in > V th (left),stable state plane for V in < V th (right).
Power supplies for the study and efficient use of DBD excimer UV lamps David Flórez
4.1. Topology: SRI Operated in DCM 99
∆ξCdplus EV th (4.1.22), obtaining: (4.1.25)
EVin = Vin
∫ toff
to
ilp dt (4.1.24)
Vin
∫ toff
to
ilp dt = ∆ξCd + Vth
∫ toff
tbr
ilp dt (4.1.25)
According to (4.1.23), to avoid uncontrolled grown of vCd, the term ∆ξCd
in (4.1.25)must be equal to zero: (4.1.26)
Vin
∫ toff
to
ilp dt = Vth
∫ toff
tbr
ilp dt (4.1.26)
Spreading the integral at the left hand term of (4.1.26), is found (4.1.27):
Vin
∫ tbr
to
ilp dt+ Vin
∫ toff
tbr
ilp dt = Vth
∫ toff
tbr
ilp dt (4.1.27)
And solving (4.1.27), is obtained: (4.1.28)
Vin
∫ tbr
to
ilp dt = (Vth − Vin)∫ toff
tbr
ilp dt (4.1.28)
Because the integrals in (4.1.28) are always positive terms, this condition implies thatVth − Vin must be positive too. Consequently Vin < Vth to ensure stability.
Lamp Peak Current Reached Before and After the Discharge
Within the stability operating range there exist two operating cases: (1) the lamp cur-rent reaches its maximum, Ilp, after the gas breakdown and (2) the maximum currentis reached before the gas breakdown. Each operating case is described by different stateplanes, as shown in Fig.4.3 and Fig.4.4, and the lamp peak current Ilp, must be founddifferently depending on the operating case (Fig.4.4-left) or (Fig.4.3-right). The bound-ary condition between these two cases is obtained graphically from the state planes inFig.4.3 for a normalized input voltage Uin equal to Ubr (4.1.10). Using (4.1.10) it ispossible to find (4.1.29):
Uin = −U + 2(Cg
Ceq
)(4.1.29)
Replacing (4.1.19) in (4.1.29) and de-normalizing we find the critical value of the inputvoltage Vink
that determines the limit between the two operating cases as:
Vink= Vth
(1 + Cg
Cd
(1−
√Cd
Ceq
))(4.1.30)
For an input voltage greater than this critical value Vink, the normalized peak lamp
David Flórez Power supplies for the study and efficient use of DBD excimer UV lamps
100 4. High Efficiency DBD Power Supply Working at the Optimal Operating Point
current, J∗lp, is equal to the radius of the semi-circumference traced for the corresponding
state plane (Fig.4.4-left) (4.1.31):
J∗lp = Ulp − Uin (4.1.31)
De-normalizing is found (4.1.32):
Ilp = (Vlp − Vin)√Cd
L(4.1.32)
Otherwise, for Uin < Uink, the state plane in Fig.4.3-right is used to find (4.1.33):
Ilp = (Vlp + Vin)√Ceq
L(4.1.33)
The operating case A allows to maximize the current injected into the discharge.Consequently, according to results presented in Section 3.2, this operating case benefitsthe lamp performance. In this sense, this is the desired operating case. Accordingly, theconverter analytic expressions developed hereafter are given for this operating condition.
Output Power
Now that the lamp peak voltage as a function of the converter input variables is known(4.1.20), an expression for the lamp average power, Plp, can be found replacing (4.1.20)in the Manley’s power formula (1.2.4). Alternatively Plp can be calculated as twice(positive and negative sequences) the power dissipated by the gas conductance from thetime tbr until the discharge dies out at toff (Fig. 4.2), obtaining:
Plp = 2flpVth
∫ toff
tbr
ilp dt (4.1.34)
Which can be expressed as a function of the charge transferred to Cd (QCd) from thebreakdown instant until the discharge dies off:
Plp = 2flpVthQCd(tbr → toff) (4.1.35)
Since, the total variation of the lamp voltage in each semi-cycle, ∆Vlp can be expressedas the addition of the net voltage change in Cg and Cd:
∆Vlp = ∆VCg (to → tbr) + ∆VCd(to → tbr) + ∆VCd
(tbr → toff ) (4.1.36)
∆Vlp = 2Vth + 2VthCg
Cd+ 1
2CdQCd(tbr → toff ) = 2Vlp (4.1.37)
Solving (4.1.37) for QCd(tbr → toff ) and replacing in (4.1.35), Plp is found: (4.1.38)
Power supplies for the study and efficient use of DBD excimer UV lamps David Flórez
4.1. Topology: SRI Operated in DCM 101
Plp = 4flpVthCd
(Vlp −
VthCg
Ceq
)(4.1.38)
To notice that (4.1.38) is the same Manley’s DBD power formula (1.2.3) [4.7].Replacing (4.1.20) in (4.1.38), an expression of the DBD power as a function of Vin is
obtained ((4.1.39)):
Plp = 4flpVth2Cg ×
(Vth
Vth − Vin− 1
)(4.1.39)
From (4.1.30) the minimum input voltage to obtain the operating case A is known.Replacing Vink
(4.1.30) in (4.1.39), the minimum lamp power for this operating case isfound: (4.1.40)
Plpmin= 4flpVth
2
Cd√
CdCeq − 1
− Cg
(4.1.40)
Expression (4.1.39) shows that Plp can be adjusted by means of two degrees of freedom:Vin and flp. Because Plp changes linearly with flp, it is a convenient variable for thepower control. Plp as a function of Vin is shown in Fig.4.6, calculated using the lampequivalent model parameters of Table 2.1. From this figure it can be observed that asthe function approaches to the asymptote Vt, small perturbations in Vin can producelarge variations in the output power. Although adjusting flp a linear control of Plp canbe implemented, it has a limit that is calculated next.
Bridge Operating Frequency
For proper operation of the converter, the bridge must be operated at a switching fre-quency flp which allows the current to fall to zero before the beginning of a new switchingsequence. Thus, considering the lamp current waveforms in Fig. 4.2, condition (4.1.41)should be fulfilled:
Tpulse <1
2flp(4.1.41)
Tpulse is calculated as the time it takes to produce the gas breakdown, Tbr, plus theduration of the discharge, Ton:
Tpulse = Tbr + Ton (4.1.42)
For the operating case A, Tbr and Ton are found using the resonance frequency andangles of their corresponding state planes, shown in Fig.4.3-left and Fig.4.4-left, respec-tively:
Tpulse = θ
ω+ ϕ
ω∗ (4.1.43)
David Flórez Power supplies for the study and efficient use of DBD excimer UV lamps
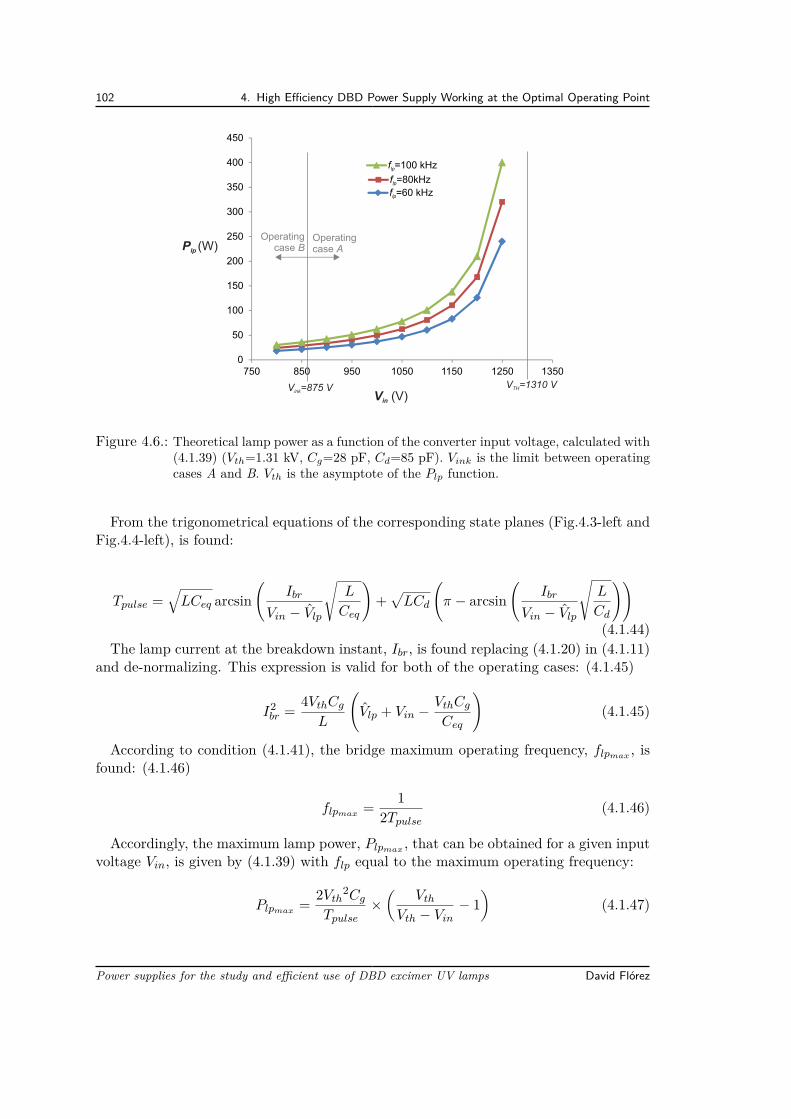
102 4. High Efficiency DBD Power Supply Working at the Optimal Operating Point
0
50
100
150
200
250
300
350
400
450
750 850 950 1050 1150 1250 1350
f =80kHzlp
f =60 kHzlp
f =100 kHzlp
V =875 VinkV =1310 VTH
P (W)lp
V (V)in
Operating case A
Operatingcase B
Figure 4.6.: Theoretical lamp power as a function of the converter input voltage, calculated with(4.1.39) (Vth=1.31 kV, Cg=28 pF, Cd=85 pF). Vink is the limit between operatingcases A and B. Vth is the asymptote of the Plp function.
From the trigonometrical equations of the corresponding state planes (Fig.4.3-left andFig.4.4-left), is found:
Tpulse =√LCeq arcsin
(Ibr
Vin − Vlp
√L
Ceq
)+√LCd
(π − arcsin
(Ibr
Vin − Vlp
√L
Cd
))
(4.1.44)The lamp current at the breakdown instant, Ibr, is found replacing (4.1.20) in (4.1.11)
and de-normalizing. This expression is valid for both of the operating cases: (4.1.45)
I2br = 4VthCg
L
(Vlp + Vin −
VthCg
Ceq
)(4.1.45)
According to condition (4.1.41), the bridge maximum operating frequency, flpmax , isfound: (4.1.46)
flpmax = 12Tpulse
(4.1.46)
Accordingly, the maximum lamp power, Plpmax , that can be obtained for a given inputvoltage Vin, is given by (4.1.39) with flp equal to the maximum operating frequency:
Plpmax = 2Vth2Cg
Tpulse×(
Vth
Vth − Vin− 1
)(4.1.47)
Power supplies for the study and efficient use of DBD excimer UV lamps David Flórez
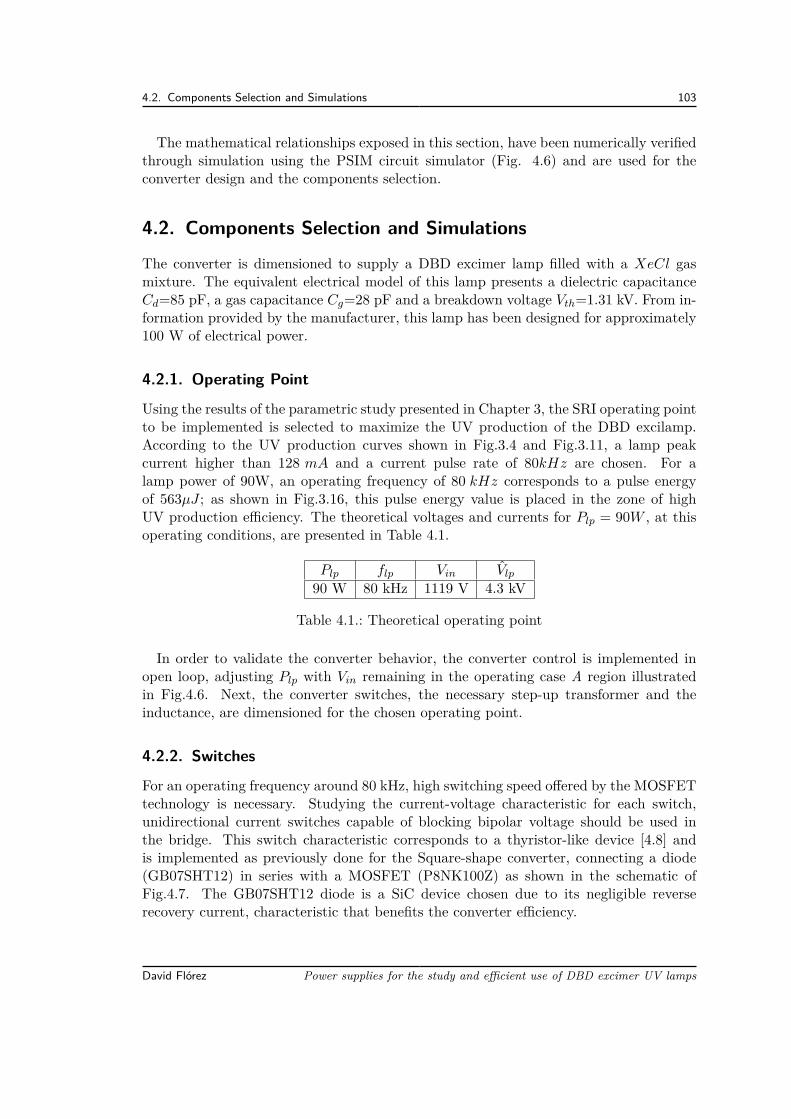
4.2. Components Selection and Simulations 103
The mathematical relationships exposed in this section, have been numerically verifiedthrough simulation using the PSIM circuit simulator (Fig. 4.6) and are used for theconverter design and the components selection.
4.2. Components Selection and Simulations
The converter is dimensioned to supply a DBD excimer lamp filled with a XeCl gasmixture. The equivalent electrical model of this lamp presents a dielectric capacitanceCd=85 pF, a gas capacitance Cg=28 pF and a breakdown voltage Vth=1.31 kV. From in-formation provided by the manufacturer, this lamp has been designed for approximately100 W of electrical power.
4.2.1. Operating Point
Using the results of the parametric study presented in Chapter 3, the SRI operating pointto be implemented is selected to maximize the UV production of the DBD excilamp.According to the UV production curves shown in Fig.3.4 and Fig.3.11, a lamp peakcurrent higher than 128 mA and a current pulse rate of 80kHz are chosen. For alamp power of 90W, an operating frequency of 80 kHz corresponds to a pulse energyof 563µJ ; as shown in Fig.3.16, this pulse energy value is placed in the zone of highUV production efficiency. The theoretical voltages and currents for Plp = 90W , at thisoperating conditions, are presented in Table 4.1.
Plp flp Vin Vlp
90 W 80 kHz 1119 V 4.3 kV
Table 4.1.: Theoretical operating point
In order to validate the converter behavior, the converter control is implemented inopen loop, adjusting Plp with Vin remaining in the operating case A region illustratedin Fig.4.6. Next, the converter switches, the necessary step-up transformer and theinductance, are dimensioned for the chosen operating point.
4.2.2. Switches
For an operating frequency around 80 kHz, high switching speed offered by the MOSFETtechnology is necessary. Studying the current-voltage characteristic for each switch,unidirectional current switches capable of blocking bipolar voltage should be used inthe bridge. This switch characteristic corresponds to a thyristor-like device [4.8] andis implemented as previously done for the Square-shape converter, connecting a diode(GB07SHT12) in series with a MOSFET (P8NK100Z) as shown in the schematic ofFig.4.7. The GB07SHT12 diode is a SiC device chosen due to its negligible reverserecovery current, characteristic that benefits the converter efficiency.
David Flórez Power supplies for the study and efficient use of DBD excimer UV lamps
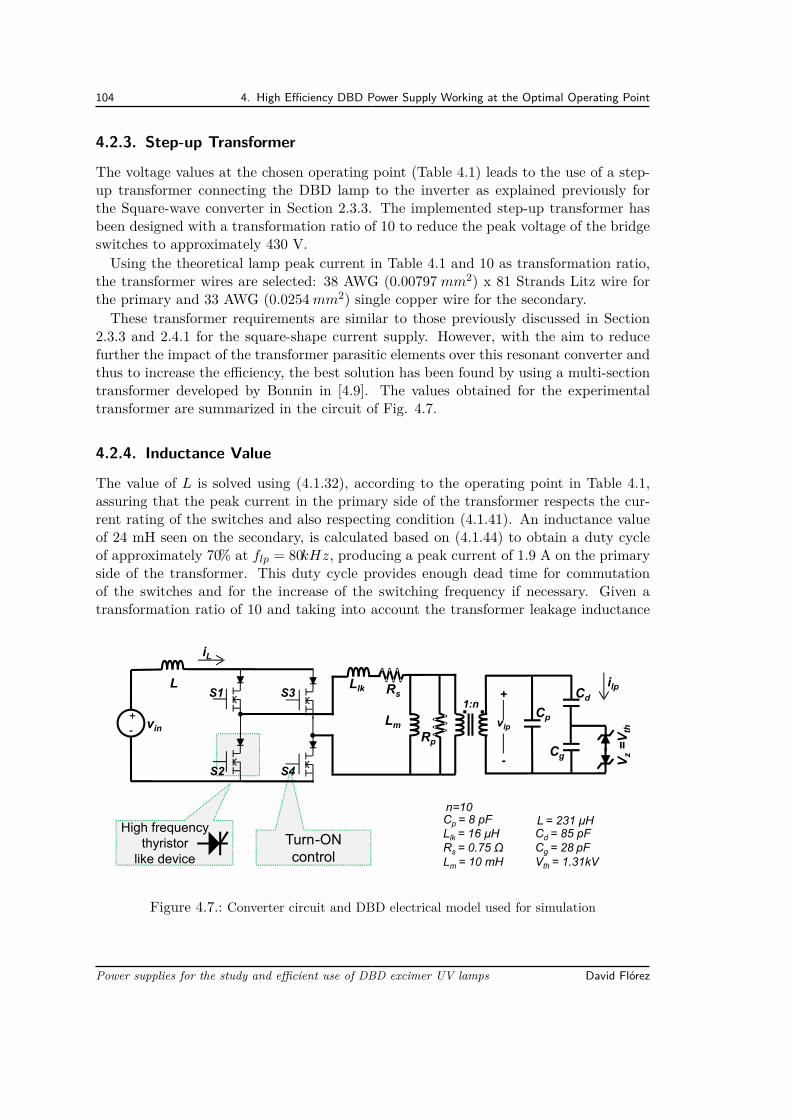
104 4. High Efficiency DBD Power Supply Working at the Optimal Operating Point
4.2.3. Step-up Transformer
The voltage values at the chosen operating point (Table 4.1) leads to the use of a step-up transformer connecting the DBD lamp to the inverter as explained previously forthe Square-wave converter in Section 2.3.3. The implemented step-up transformer hasbeen designed with a transformation ratio of 10 to reduce the peak voltage of the bridgeswitches to approximately 430 V.Using the theoretical lamp peak current in Table 4.1 and 10 as transformation ratio,
the transformer wires are selected: 38 AWG (0.00797 mm2) x 81 Strands Litz wire forthe primary and 33 AWG (0.0254mm2) single copper wire for the secondary.These transformer requirements are similar to those previously discussed in Section
2.3.3 and 2.4.1 for the square-shape current supply. However, with the aim to reducefurther the impact of the transformer parasitic elements over this resonant converter andthus to increase the efficiency, the best solution has been found by using a multi-sectiontransformer developed by Bonnin in [4.9]. The values obtained for the experimentaltransformer are summarized in the circuit of Fig. 4.7.
4.2.4. Inductance Value
The value of L is solved using (4.1.32), according to the operating point in Table 4.1,assuring that the peak current in the primary side of the transformer respects the cur-rent rating of the switches and also respecting condition (4.1.41). An inductance valueof 24 mH seen on the secondary, is calculated based on (4.1.44) to obtain a duty cycleof approximately 70% at flp = 80kHz, producing a peak current of 1.9 A on the primaryside of the transformer. This duty cycle provides enough dead time for commutationof the switches and for the increase of the switching frequency if necessary. Given atransformation ratio of 10 and taking into account the transformer leakage inductance
Turn-ONcontrol
. .vin
lpS1
S4
S3
S2
+
vlp
-
+-
1:n
lk
LmCp
Cd
Cg
Vz=Vth
Rs
High frequency thyristor
like device
L = 231 μHn=10
Llk = 16 μHRs = 0.75 Ω Lm = 10 mH
Cp = 8 pFCd = 85 pFCg = 28 pFVth = 1.31 kV
Rp
L i
iL
L
Figure 4.7.: Converter circuit and DBD electrical model used for simulation
Power supplies for the study and efficient use of DBD excimer UV lamps David Flórez
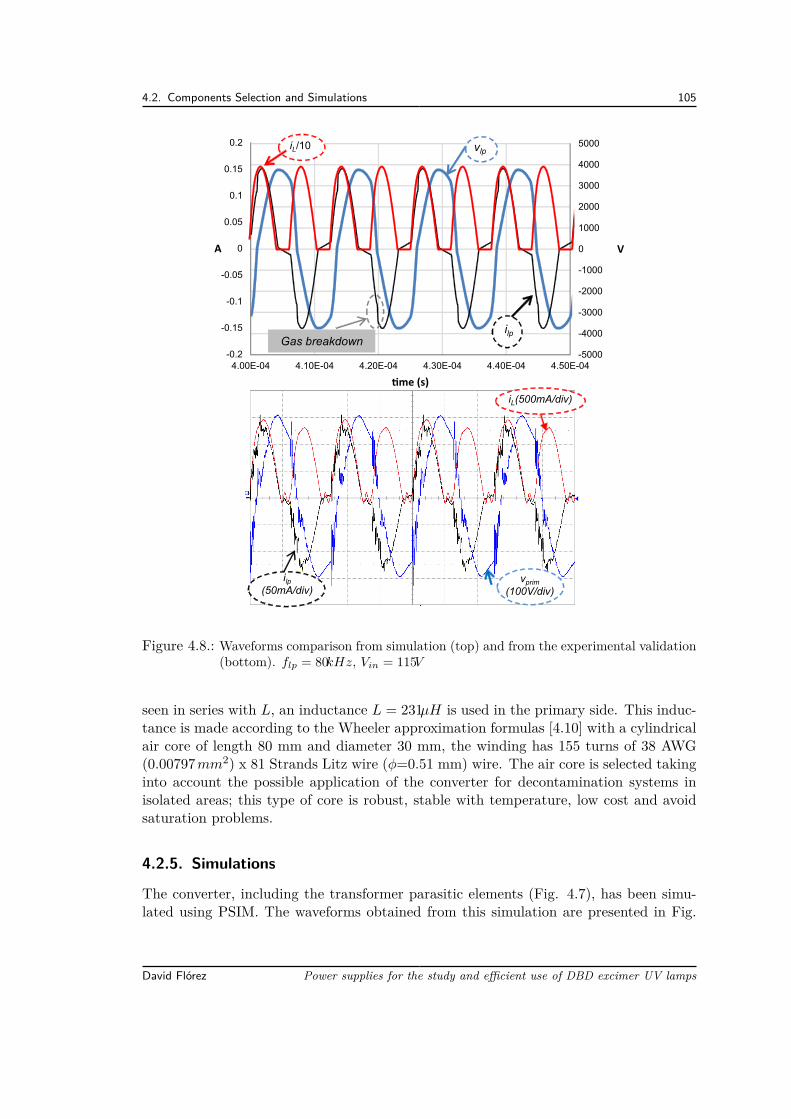
4.2. Components Selection and Simulations 105
-5000
-4000
-3000
-2000
-1000
0
1000
2000
3000
4000
5000
4.00E-04 4.10E-04 4.20E-04 4.30E-04 4.40E-04 4.50E-04
V
me (s)
-0.2
-0.15
-0.1
-0.05
0
0.05
0.1
0.15
0.2
A
iL/10 vlp
ilpGas breakdown
iL(500mA/div)
ilp(50mA/div)
vprim
(100V/div)
Figure 4.8.: Waveforms comparison from simulation (top) and from the experimental validation(bottom). flp = 80kHz, Vin = 115V
seen in series with L, an inductance L = 231µH is used in the primary side. This induc-tance is made according to the Wheeler approximation formulas [4.10] with a cylindricalair core of length 80 mm and diameter 30 mm, the winding has 155 turns of 38 AWG(0.00797mm2) x 81 Strands Litz wire (φ=0.51 mm) wire. The air core is selected takinginto account the possible application of the converter for decontamination systems inisolated areas; this type of core is robust, stable with temperature, low cost and avoidsaturation problems.
4.2.5. Simulations
The converter, including the transformer parasitic elements (Fig. 4.7), has been simu-lated using PSIM. The waveforms obtained from this simulation are presented in Fig.
David Flórez Power supplies for the study and efficient use of DBD excimer UV lamps
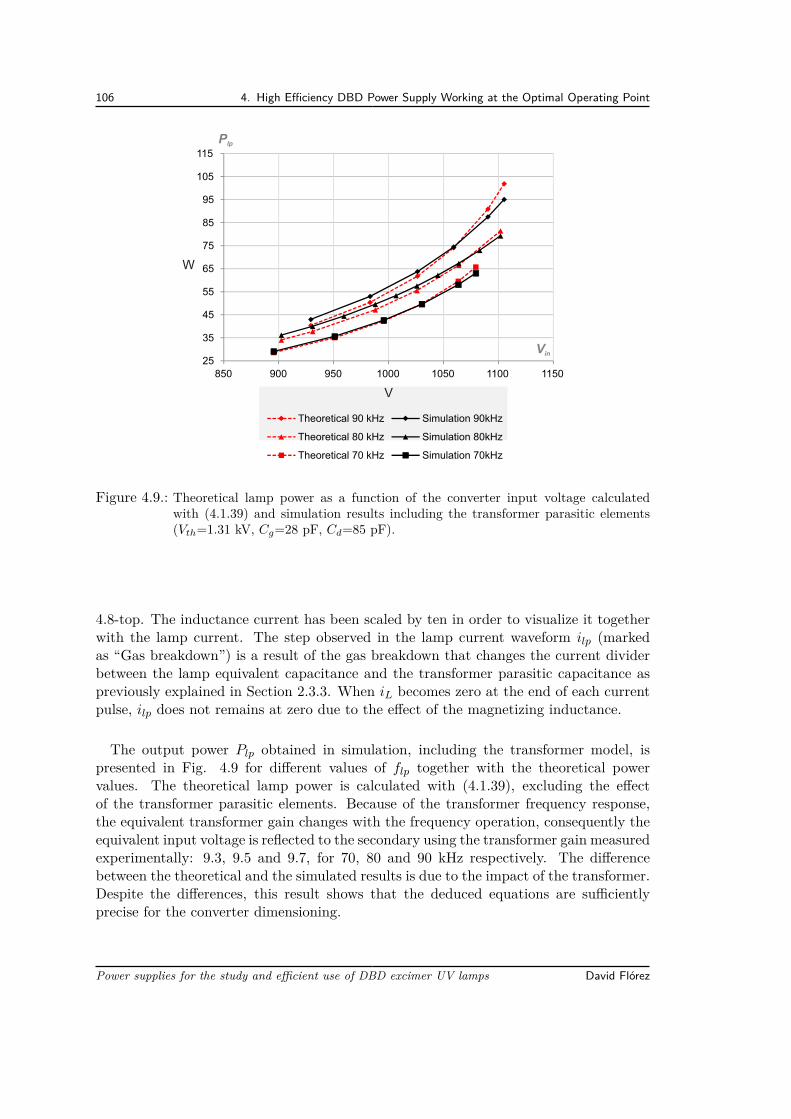
106 4. High Efficiency DBD Power Supply Working at the Optimal Operating Point
25
35
45
55
65
75
85
95
105
115
850 900 950 1000 1050 1100 1150
Theoretical 90 kHz Simulation 90kHz
Theoretical 80 kHz Simulation 80kHz
Theoretical 70 kHz Simulation 70kHz
Plp
W
Vin
V
Figure 4.9.: Theoretical lamp power as a function of the converter input voltage calculatedwith (4.1.39) and simulation results including the transformer parasitic elements(Vth=1.31 kV, Cg=28 pF, Cd=85 pF).
4.8-top. The inductance current has been scaled by ten in order to visualize it togetherwith the lamp current. The step observed in the lamp current waveform ilp (markedas “Gas breakdown”) is a result of the gas breakdown that changes the current dividerbetween the lamp equivalent capacitance and the transformer parasitic capacitance aspreviously explained in Section 2.3.3. When iL becomes zero at the end of each currentpulse, ilp does not remains at zero due to the effect of the magnetizing inductance.
The output power Plp obtained in simulation, including the transformer model, ispresented in Fig. 4.9 for different values of flp together with the theoretical powervalues. The theoretical lamp power is calculated with (4.1.39), excluding the effectof the transformer parasitic elements. Because of the transformer frequency response,the equivalent transformer gain changes with the frequency operation, consequently theequivalent input voltage is reflected to the secondary using the transformer gain measuredexperimentally: 9.3, 9.5 and 9.7, for 70, 80 and 90 kHz respectively. The differencebetween the theoretical and the simulated results is due to the impact of the transformer.Despite the differences, this result shows that the deduced equations are sufficientlyprecise for the converter dimensioning.
Power supplies for the study and efficient use of DBD excimer UV lamps David Flórez
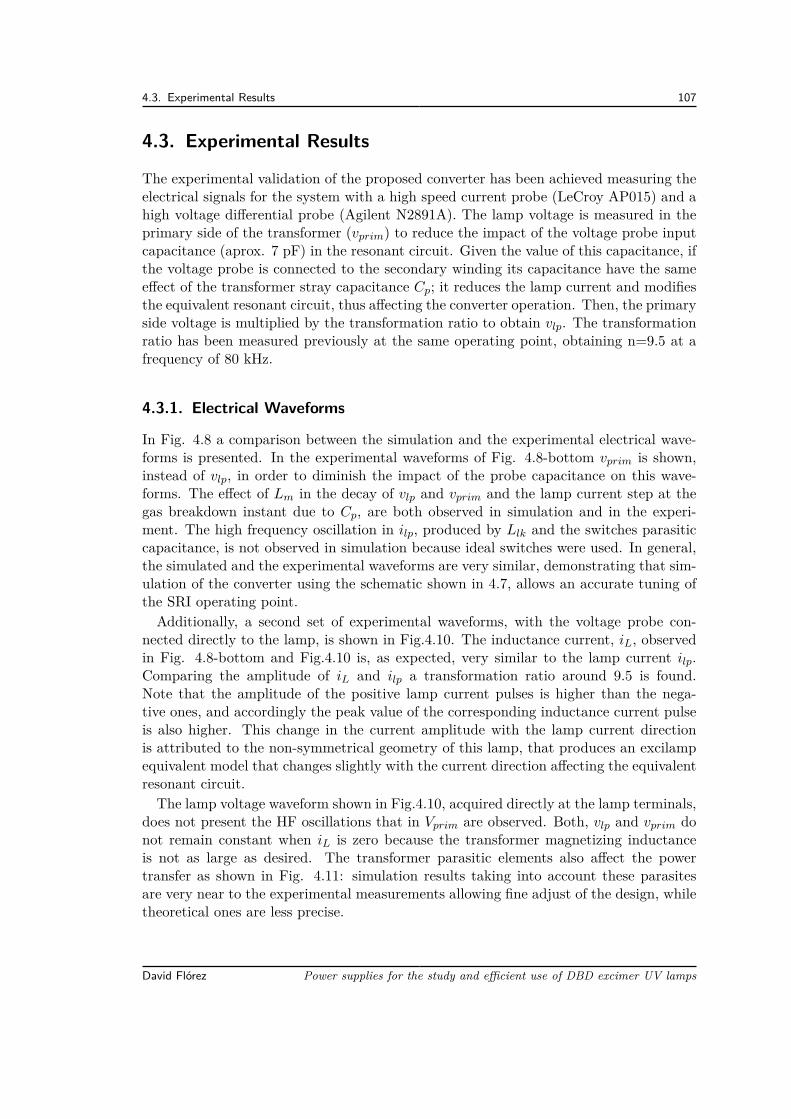
4.3. Experimental Results 107
4.3. Experimental Results
The experimental validation of the proposed converter has been achieved measuring theelectrical signals for the system with a high speed current probe (LeCroy AP015) and ahigh voltage differential probe (Agilent N2891A). The lamp voltage is measured in theprimary side of the transformer (vprim) to reduce the impact of the voltage probe inputcapacitance (aprox. 7 pF) in the resonant circuit. Given the value of this capacitance, ifthe voltage probe is connected to the secondary winding its capacitance have the sameeffect of the transformer stray capacitance Cp; it reduces the lamp current and modifiesthe equivalent resonant circuit, thus affecting the converter operation. Then, the primaryside voltage is multiplied by the transformation ratio to obtain vlp. The transformationratio has been measured previously at the same operating point, obtaining n=9.5 at afrequency of 80 kHz.
4.3.1. Electrical Waveforms
In Fig. 4.8 a comparison between the simulation and the experimental electrical wave-forms is presented. In the experimental waveforms of Fig. 4.8-bottom vprim is shown,instead of vlp, in order to diminish the impact of the probe capacitance on this wave-forms. The effect of Lm in the decay of vlp and vprim and the lamp current step at thegas breakdown instant due to Cp, are both observed in simulation and in the experi-ment. The high frequency oscillation in ilp, produced by Llk and the switches parasiticcapacitance, is not observed in simulation because ideal switches were used. In general,the simulated and the experimental waveforms are very similar, demonstrating that sim-ulation of the converter using the schematic shown in 4.7, allows an accurate tuning ofthe SRI operating point.Additionally, a second set of experimental waveforms, with the voltage probe con-
nected directly to the lamp, is shown in Fig.4.10. The inductance current, iL, observedin Fig. 4.8-bottom and Fig.4.10 is, as expected, very similar to the lamp current ilp.Comparing the amplitude of iL and ilp a transformation ratio around 9.5 is found.Note that the amplitude of the positive lamp current pulses is higher than the nega-tive ones, and accordingly the peak value of the corresponding inductance current pulseis also higher. This change in the current amplitude with the lamp current directionis attributed to the non-symmetrical geometry of this lamp, that produces an excilampequivalent model that changes slightly with the current direction affecting the equivalentresonant circuit.The lamp voltage waveform shown in Fig.4.10, acquired directly at the lamp terminals,
does not present the HF oscillations that in Vprim are observed. Both, vlp and vprim donot remain constant when iL is zero because the transformer magnetizing inductanceis not as large as desired. The transformer parasitic elements also affect the powertransfer as shown in Fig. 4.11: simulation results taking into account these parasitesare very near to the experimental measurements allowing fine adjust of the design, whiletheoretical ones are less precise.
David Flórez Power supplies for the study and efficient use of DBD excimer UV lamps
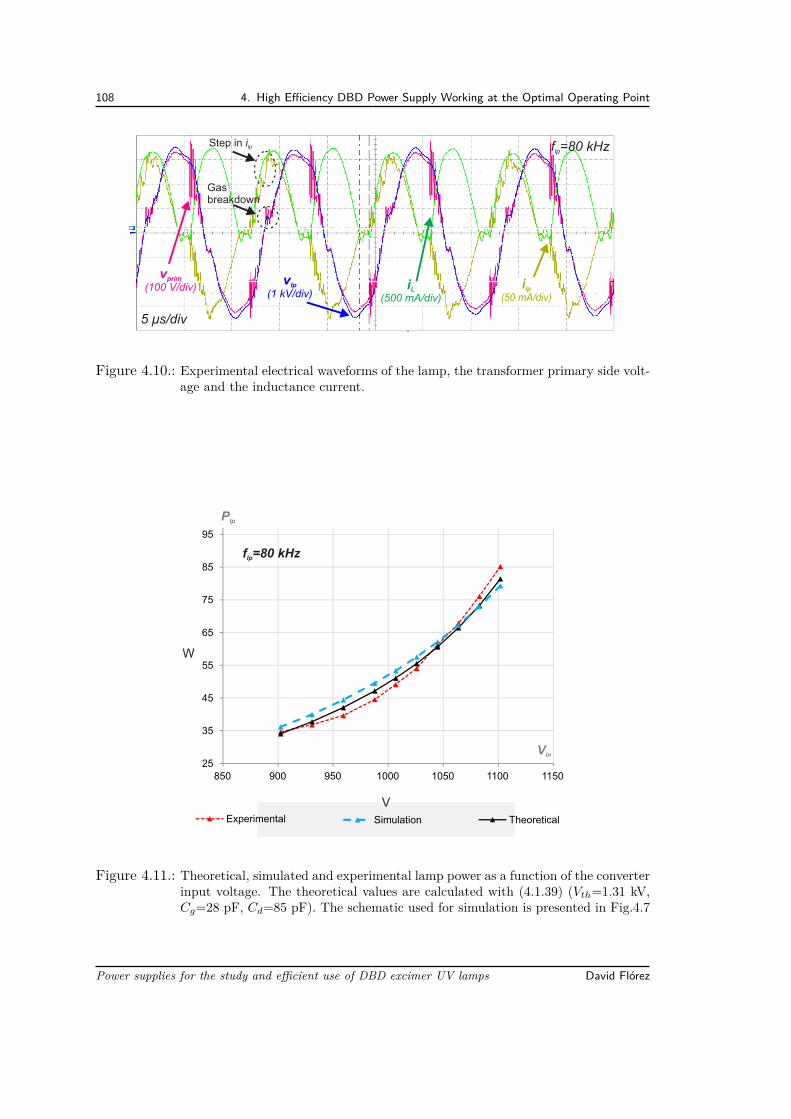
108 4. High Efficiency DBD Power Supply Working at the Optimal Operating Point
f =80 kHzlp
5 μs/div
vprim
(100 V/div)vlp
(1 kV/div)iL
(500 mA/div)ilp
(50 mA/div)
Step in ilp
Gas breakdown
Figure 4.10.: Experimental electrical waveforms of the lamp, the transformer primary side volt-age and the inductance current.
25
35
45
55
65
75
85
95
850 900 950 1000 1050 1100 1150
Experimental TheoreticalSimulation
Plp
W
Vin
V
f =80 kHzlp
Figure 4.11.: Theoretical, simulated and experimental lamp power as a function of the converterinput voltage. The theoretical values are calculated with (4.1.39) (Vth=1.31 kV,Cg=28 pF, Cd=85 pF). The schematic used for simulation is presented in Fig.4.7
Power supplies for the study and efficient use of DBD excimer UV lamps David Flórez
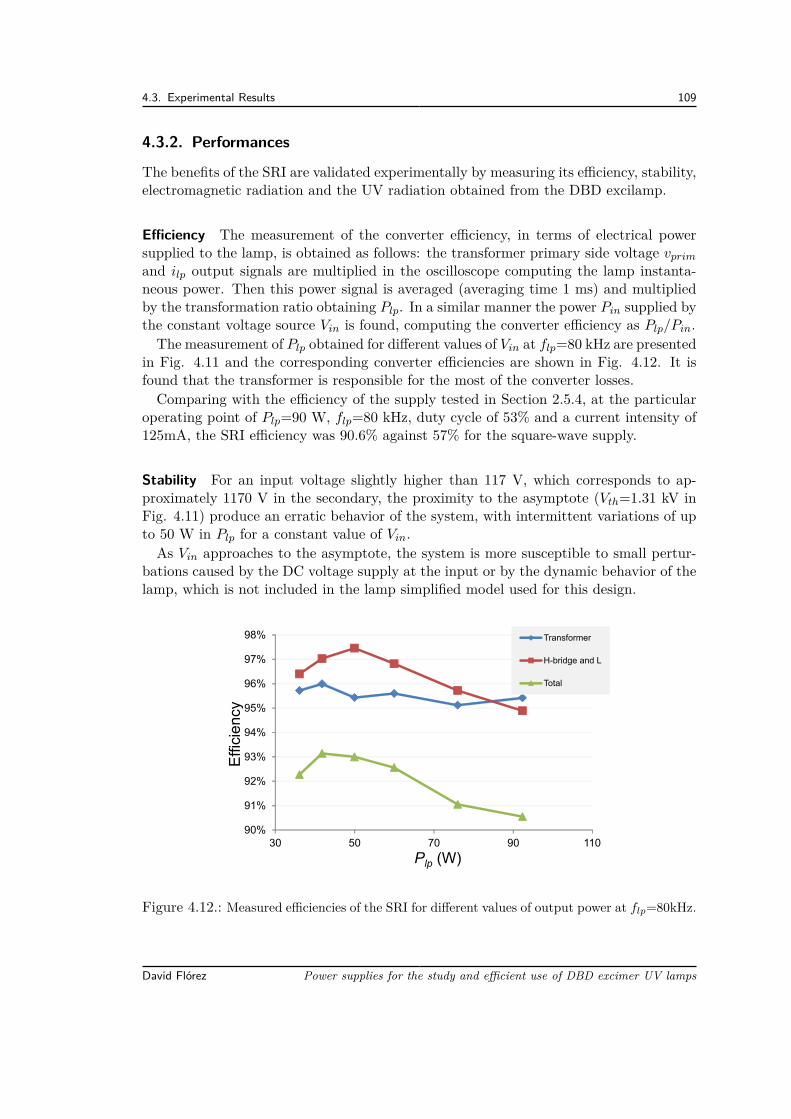
4.3. Experimental Results 109
4.3.2. Performances
The benefits of the SRI are validated experimentally by measuring its efficiency, stability,electromagnetic radiation and the UV radiation obtained from the DBD excilamp.
Efficiency The measurement of the converter efficiency, in terms of electrical powersupplied to the lamp, is obtained as follows: the transformer primary side voltage vprim
and ilp output signals are multiplied in the oscilloscope computing the lamp instanta-neous power. Then this power signal is averaged (averaging time 1 ms) and multipliedby the transformation ratio obtaining Plp. In a similar manner the power Pin supplied bythe constant voltage source Vin is found, computing the converter efficiency as Plp/Pin.The measurement of Plp obtained for different values of Vin at flp=80 kHz are presented
in Fig. 4.11 and the corresponding converter efficiencies are shown in Fig. 4.12. It isfound that the transformer is responsible for the most of the converter losses.Comparing with the efficiency of the supply tested in Section 2.5.4, at the particular
operating point of Plp=90 W, flp=80 kHz, duty cycle of 53% and a current intensity of125mA, the SRI efficiency was 90.6% against 57% for the square-wave supply.
Stability For an input voltage slightly higher than 117 V, which corresponds to ap-proximately 1170 V in the secondary, the proximity to the asymptote (Vth=1.31 kV inFig. 4.11) produce an erratic behavior of the system, with intermittent variations of upto 50 W in Plp for a constant value of Vin.As Vin approaches to the asymptote, the system is more susceptible to small pertur-
bations caused by the DC voltage supply at the input or by the dynamic behavior of thelamp, which is not included in the lamp simplified model used for this design.
90%
91%
92%
93%
94%
95%
96%
97%
98%
30 50 70 90 110
Transformer
H-bridge and L
Total
Plp (W)
Effi
cie
ncy
Figure 4.12.: Measured efficiencies of the SRI for different values of output power at flp=80kHz.
David Flórez Power supplies for the study and efficient use of DBD excimer UV lamps
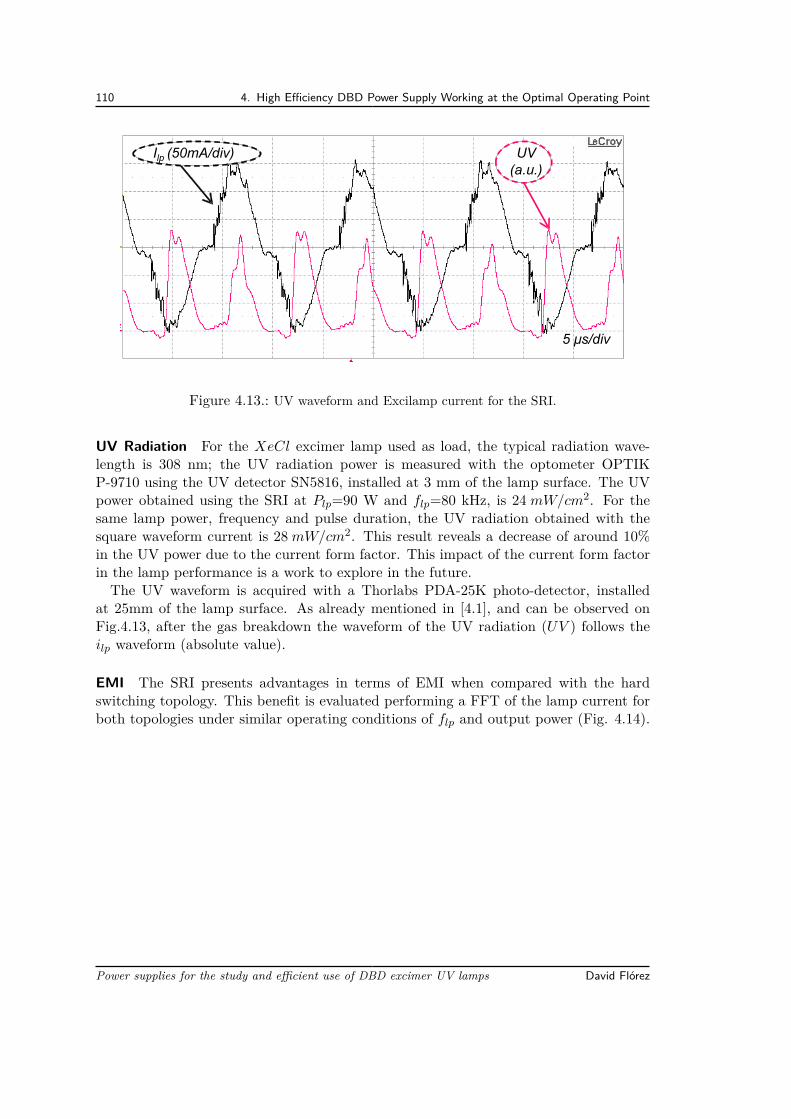
110 4. High Efficiency DBD Power Supply Working at the Optimal Operating Point
Ilp (50mA/div) UV(a.u.)
5 μs/div
Figure 4.13.: UV waveform and Excilamp current for the SRI.
UV Radiation For the XeCl excimer lamp used as load, the typical radiation wave-length is 308 nm; the UV radiation power is measured with the optometer OPTIKP-9710 using the UV detector SN5816, installed at 3 mm of the lamp surface. The UVpower obtained using the SRI at Plp=90 W and flp=80 kHz, is 24 mW/cm2. For thesame lamp power, frequency and pulse duration, the UV radiation obtained with thesquare waveform current is 28 mW/cm2. This result reveals a decrease of around 10%in the UV power due to the current form factor. This impact of the current form factorin the lamp performance is a work to explore in the future.The UV waveform is acquired with a Thorlabs PDA-25K photo-detector, installed
at 25mm of the lamp surface. As already mentioned in [4.1], and can be observed onFig.4.13, after the gas breakdown the waveform of the UV radiation (UV ) follows theilp waveform (absolute value).
EMI The SRI presents advantages in terms of EMI when compared with the hardswitching topology. This benefit is evaluated performing a FFT of the lamp current forboth topologies under similar operating conditions of flp and output power (Fig. 4.14).
Power supplies for the study and efficient use of DBD excimer UV lamps David Flórez
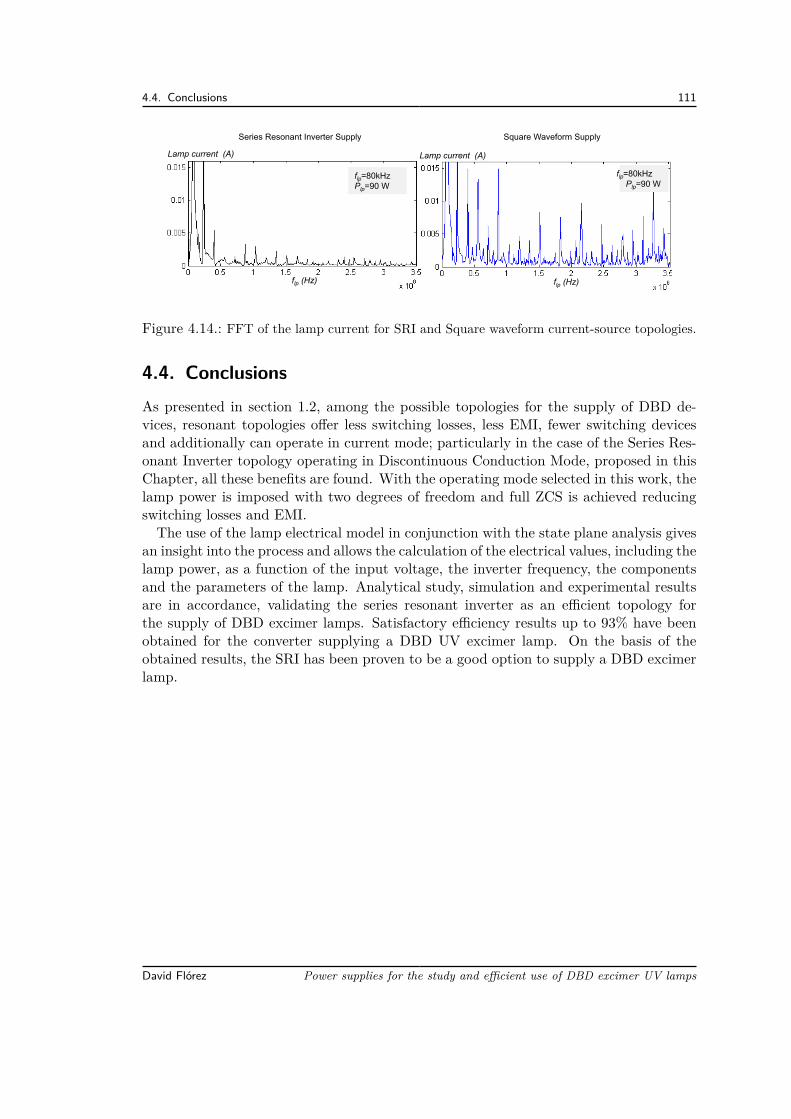
4.4. Conclusions 111
flp=80kHzPlp=90 W
Square Waveform Supply
flp (Hz)
Series Resonant Inverter Supply
flp=80kHzPlp=90 W
flp (Hz)
Lamp current (A) Lamp current (A)
Figure 4.14.: FFT of the lamp current for SRI and Square waveform current-source topologies.
4.4. ConclusionsAs presented in section 1.2, among the possible topologies for the supply of DBD de-vices, resonant topologies offer less switching losses, less EMI, fewer switching devicesand additionally can operate in current mode; particularly in the case of the Series Res-onant Inverter topology operating in Discontinuous Conduction Mode, proposed in thisChapter, all these benefits are found. With the operating mode selected in this work, thelamp power is imposed with two degrees of freedom and full ZCS is achieved reducingswitching losses and EMI.The use of the lamp electrical model in conjunction with the state plane analysis gives
an insight into the process and allows the calculation of the electrical values, including thelamp power, as a function of the input voltage, the inverter frequency, the componentsand the parameters of the lamp. Analytical study, simulation and experimental resultsare in accordance, validating the series resonant inverter as an efficient topology forthe supply of DBD excimer lamps. Satisfactory efficiency results up to 93% have beenobtained for the converter supplying a DBD UV excimer lamp. On the basis of theobtained results, the SRI has been proven to be a good option to supply a DBD excimerlamp.
David Flórez Power supplies for the study and efficient use of DBD excimer UV lamps
Bibliography[4.1] R. Diez, H. Piquet, and S. Bhosle, “Control of the UV emission of an excimer lamp
by means of a current-mode power supply,” in Industrial Electronics, 2009. IECON’09. 35th Annual Conference of IEEE, pp. 3500–3505, IEEE, Nov. 2009.
[4.2] H. Piquet, S. Bhosle, R. Diez, and M. V. Erofeev, “Pulsed current-mode supplyof dielectric barrier discharge excilamps for the control of the radiated ultravioletpower,” IEEE Transactions on Plasma Science, vol. 38, pp. 2531–2538, Oct. 2010.
[4.3] Y. Chéron, C. Goodman, and T. Meynard, Soft commutation. London [u.a.: Chap-man & Hall, 1992.
[4.4] R. Casanueva, F. J. Azcondo, and S. Bracho, “Series–parallel resonant converterfor an EDM power supply,” Journal of Materials Processing Technology, vol. 149,pp. 172–177, June 2004.
[4.5] R. Casanueva, F. Azcondo, and C. Brañas, “Output current sensitivity analysisof the resonant inverter: Current-source design criteria,” IEEE Transactions onIndustrial Electronics, vol. 54, no. 3, pp. 1560–1568, 2007.
[4.6] R. Oruganti and F. Lee, “Resonant power processors, part I—State plane analysis,”IEEE Transactions on Industry Applications, vol. IA-21, no. 6, pp. 1453–1460, 1985.
[4.7] T. C. Manley, “The electric characteristics of the ozonator discharge,” Transactionsof The Electrochemical Society, vol. 84, pp. 83–96, Oct. 1943.
[4.8] M. Cousineau, R. Diez, H. Piquet, and O. Durrieu, “Synthesized high-frequencythyristor for dielectric barrier discharge excimer lamps,” IEEE Transactions onIndustrial Electronics, vol. 59, no. 4, pp. 1920–1928, 2012.
[4.9] X. Bonnin, H. Piquet, D. Florez, R. Diez, and X. Bonnin, “Designing the highvoltage transformer of power supplies for dbd: windings arrangment to reduce theparasitic capacitive effects,” in Power Electronics and Applications (EPE), 201315th European Conference on, Sept. 2013.
[4.10] Wheeler, H.A., “Simple inductance formulas for radio coils,” in Proc. I.R.E,vol. 16, p. 1398, Oct. 1928.
5. DBD Supplies comparison
In Chapter 3, some parameters of the UV radiation, like the duration, amplitude andshape of the UV pulses and the radiated power, have been demonstrated to be controlledwith the current injected into the lamp by means of a square-shape current mode con-verter. Also, the capability to control the UV radiation using a soft-switching resonantconverter operating in current mode has been established in Chapter 4.The present Chapter have a view of four different converter structures that comply
with the current mode approach and presents a comparison of those structures, madein terms of electric efficiency, waveform of the UV radiation and their impact on theluminous efficacy.To introduce this comparison, the schematics and operating sequences of the four
topologies are developed using the simplified DBD model shown in Fig.1.5. Then, bymeans of an analytical development the main mathematical expressions describing theconverters operating point, are computed. Using these mathematical expressions, theconverter design methodology and simulations validating the converter equations, areproposed. As experimental result, a comparison of the UV radiation and the convertersefficiency is presented for a particular operating point, under similar conditions of UVpulse duration, lamp power and current frequency, for all the four topologies.
Topologies to be Compared In Fig.5.1 the schematics of the four topologies to becompared, are presented. One of the converters included in this comparison is the rect-angular current waveform presented in Chapter 2, shown in Fig.5.1-top with the currentinverter replaced by a push-pull inverter, using a two primary winding transformer, re-ducing the number of switches and the control circuitry. The other three topologiesare resonant-based current supplies operating in DCM, assuring the control of the lamppower, including: the SRI inverter proposed in Chapter 4, presented here also with thepush-pull inverter instead of the full-bridge; the Boost-based converter found in [5.1](Fig.1.9) and the Buck-Boost-based supply developed in [5.2] (Fig.1.12).Accordingly, only the operation of the Boost and the Buck-Boost based supplies are
developed in this Section, differing from previous analysis in [5.3] and [5.2] where thetime to produce the discharge Tbr each half-cycle was neglected. The Boost-based andthe Buck-Boost based converters are resonant structures differing from the SRI in thecurrent waveform injected into the lamp and the number of switches. In order to simplifythe equations and the converters comparison, the transformer turns ratio is assumed asn=1.
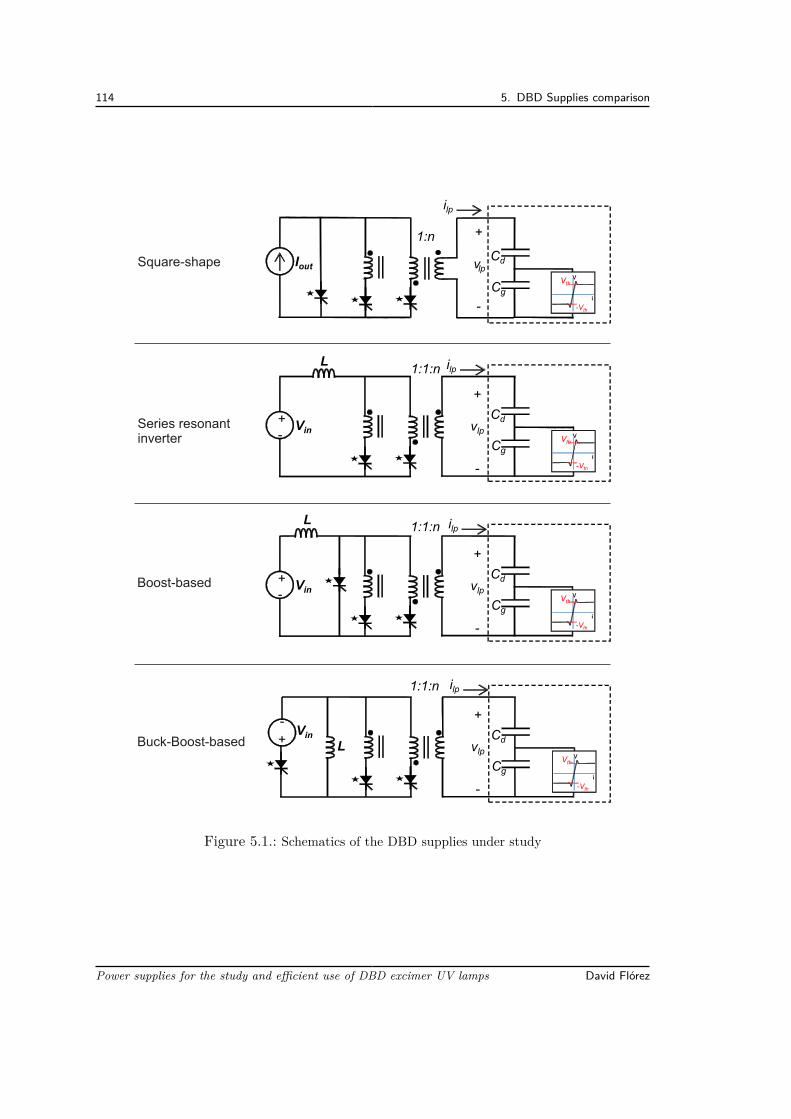
114 5. DBD Supplies comparison
Vin
L
+- +
vlp
-
Cg
Cd
1:1:n
Vin
L
+-
+
vlp
-
Cg
Cd
1:1:n
Vin
L
+-
+
vlp
-
ilp
Cg
Cd
1:1:n
+
vlp
-
Cg
Cd
1:n
IoutSquare-shape
Series resonant inverter
Boost-based
Buck-Boost-based
ilp
ilp
ilp
i
-Vth
Vthv
i
-Vth
Vthv
i
-Vth
Vthv
i
-Vth
Vthv
Figure 5.1.: Schematics of the DBD supplies under study
Power supplies for the study and efficient use of DBD excimer UV lamps David Flórez
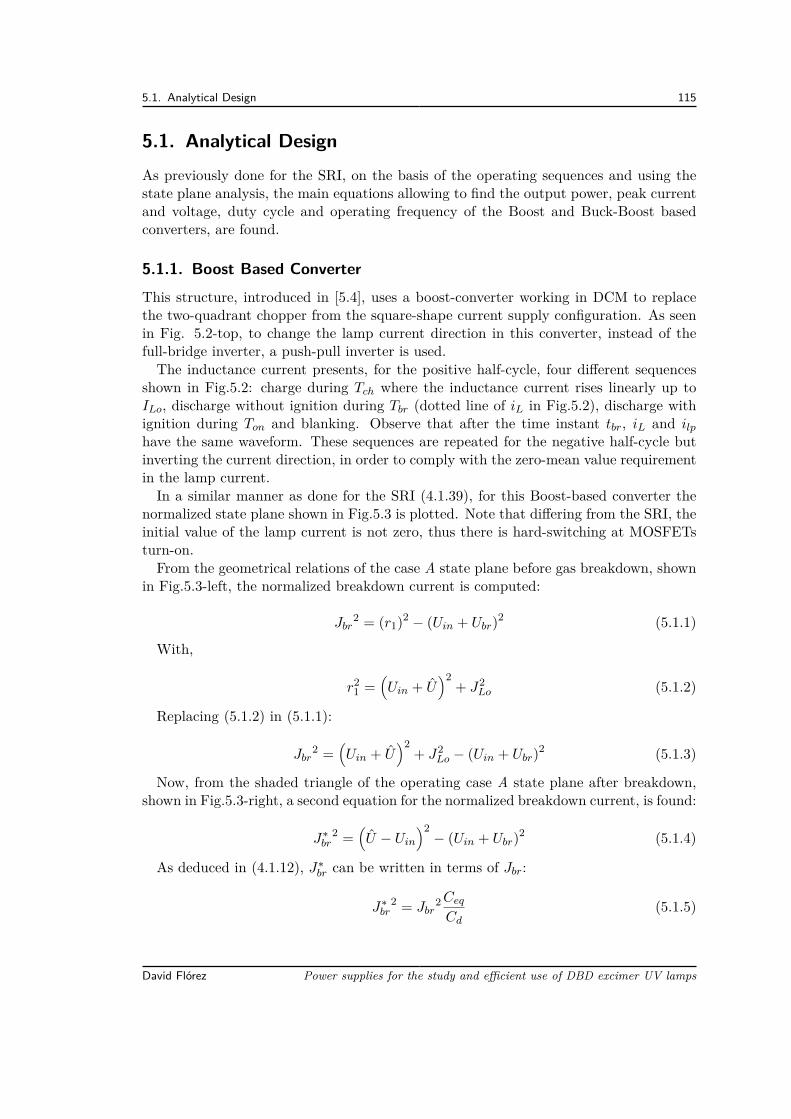
5.1. Analytical Design 115
5.1. Analytical DesignAs previously done for the SRI, on the basis of the operating sequences and using thestate plane analysis, the main equations allowing to find the output power, peak currentand voltage, duty cycle and operating frequency of the Boost and Buck-Boost basedconverters, are found.
5.1.1. Boost Based ConverterThis structure, introduced in [5.4], uses a boost-converter working in DCM to replacethe two-quadrant chopper from the square-shape current supply configuration. As seenin Fig. 5.2-top, to change the lamp current direction in this converter, instead of thefull-bridge inverter, a push-pull inverter is used.The inductance current presents, for the positive half-cycle, four different sequences
shown in Fig.5.2: charge during Tch where the inductance current rises linearly up toILo, discharge without ignition during Tbr (dotted line of iL in Fig.5.2), discharge withignition during Ton and blanking. Observe that after the time instant tbr, iL and ilphave the same waveform. These sequences are repeated for the negative half-cycle butinverting the current direction, in order to comply with the zero-mean value requirementin the lamp current.In a similar manner as done for the SRI (4.1.39), for this Boost-based converter the
normalized state plane shown in Fig.5.3 is plotted. Note that differing from the SRI, theinitial value of the lamp current is not zero, thus there is hard-switching at MOSFETsturn-on.From the geometrical relations of the case A state plane before gas breakdown, shown
in Fig.5.3-left, the normalized breakdown current is computed:
Jbr2 = (r1)2 − (Uin + Ubr)2 (5.1.1)
With,
r21 =
(Uin + U
)2+ J2
Lo (5.1.2)
Replacing (5.1.2) in (5.1.1):
Jbr2 =
(Uin + U
)2+ J2
Lo − (Uin + Ubr)2 (5.1.3)
Now, from the shaded triangle of the operating case A state plane after breakdown,shown in Fig.5.3-right, a second equation for the normalized breakdown current, is found:
J∗br
2 =(U − Uin
)2− (Uin + Ubr)2 (5.1.4)
As deduced in (4.1.12), J∗br can be written in terms of Jbr:
J∗br
2 = Jbr2Ceq
Cd(5.1.5)
David Flórez Power supplies for the study and efficient use of DBD excimer UV lamps
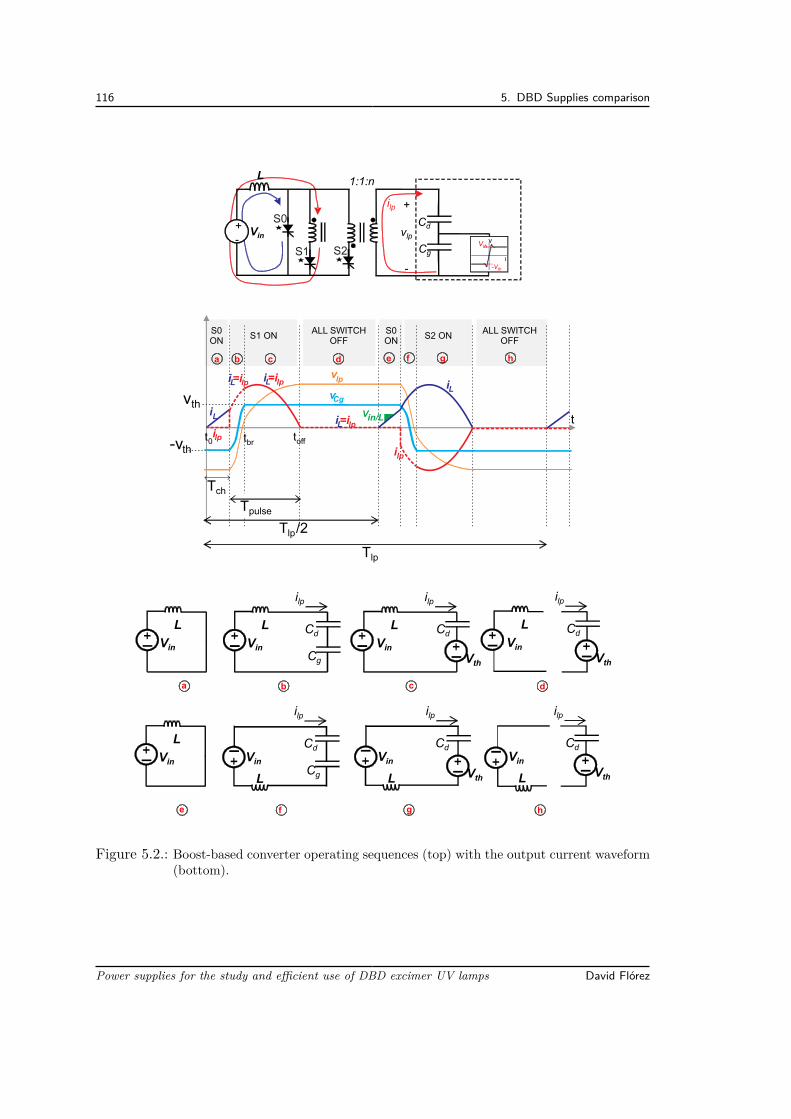
116 5. DBD Supplies comparison
Vin
L
+-
+
vlp
-
Cg
Cd
1:1:n
ilp
S1 S2
S0
Vin
L
ilp
Cg
Cd
Vin
L
ilp
Cd
Vin
L
Vth
ilp
Cd
Vin
L
Vth
Vin
L
ilp
Cg
Cd
Vin
L
ilp
Cd
Vth
ilp
Cd
Vin
L Vth
ba c d
fe g h
Vin
L
-vth
Tpulse
t
Tlp
ba c d
vCg
tbrt0 toff
ALL SWITCHOFF
S1 ONALL SWITCH
OFF
vth
vlp
Tlp/2
Tch
Vin/L
S0ON
S2 ONS0ON
iL
iL=ilp iL=ilp
ilp
iL=ilpilp
iL
fe g h
i
-Vth
Vthv
Figure 5.2.: Boost-based converter operating sequences (top) with the output current waveform(bottom).
Power supplies for the study and efficient use of DBD excimer UV lamps David Flórez
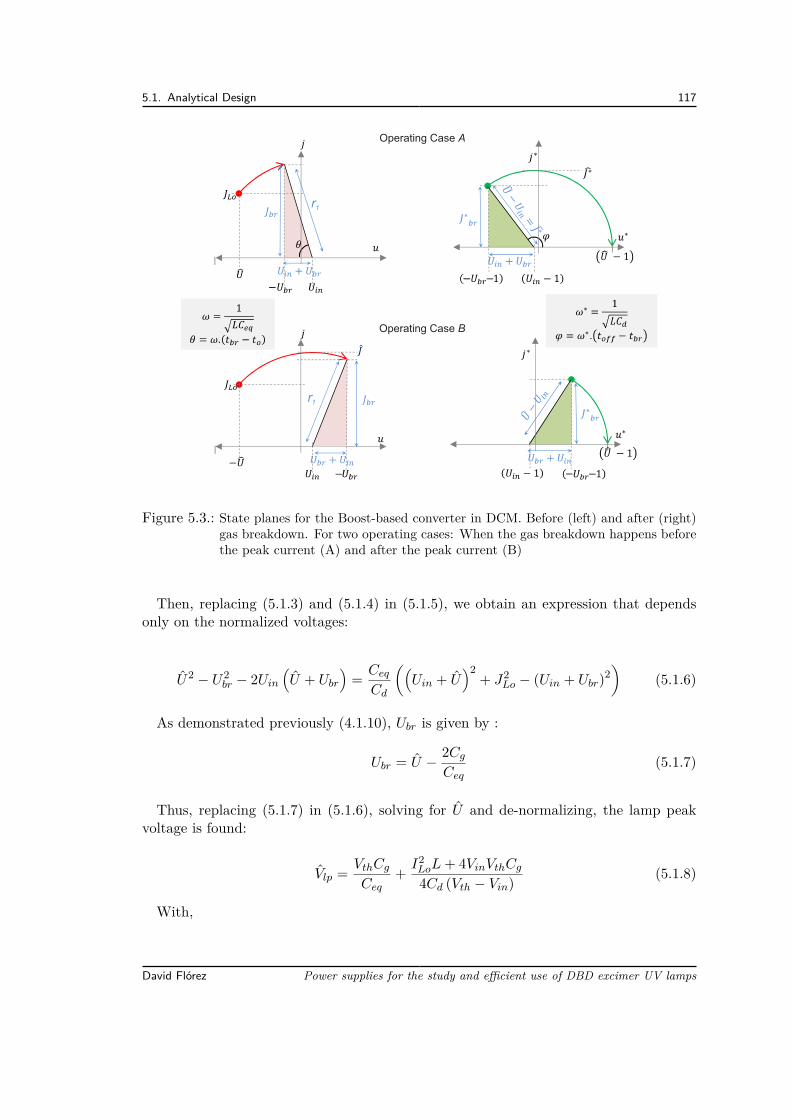
5.1. Analytical Design 117
Operating Case A
Operating Case B
r1
r1
Figure 5.3.: State planes for the Boost-based converter in DCM. Before (left) and after (right)gas breakdown. For two operating cases: When the gas breakdown happens beforethe peak current (A) and after the peak current (B)
Then, replacing (5.1.3) and (5.1.4) in (5.1.5), we obtain an expression that dependsonly on the normalized voltages:
U2 − U2br − 2Uin
(U + Ubr
)= Ceq
Cd
((Uin + U
)2+ J2
Lo − (Uin + Ubr)2)
(5.1.6)
As demonstrated previously (4.1.10), Ubr is given by :
Ubr = U − 2Cg
Ceq(5.1.7)
Thus, replacing (5.1.7) in (5.1.6), solving for U and de-normalizing, the lamp peakvoltage is found:
Vlp = VthCg
Ceq+ I2
LoL+ 4VinVthCg
4Cd (Vth − Vin) (5.1.8)
With,
David Flórez Power supplies for the study and efficient use of DBD excimer UV lamps
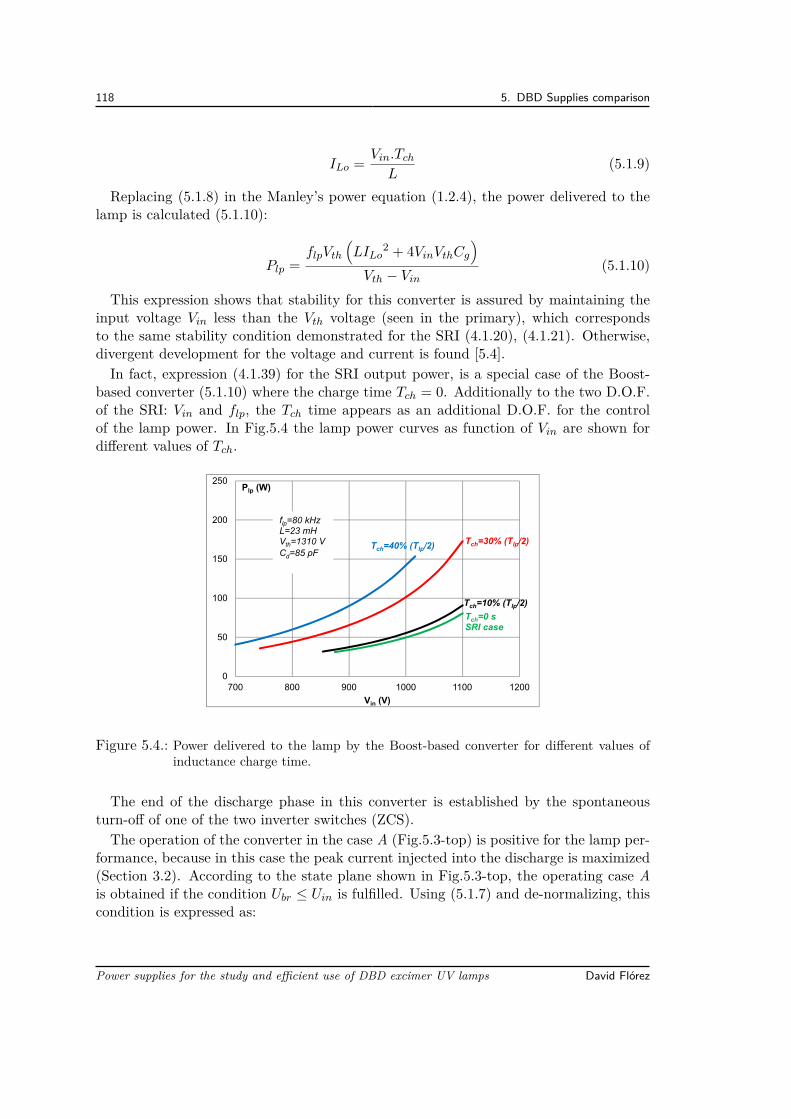
118 5. DBD Supplies comparison
ILo = Vin.Tch
L(5.1.9)
Replacing (5.1.8) in the Manley’s power equation (1.2.4), the power delivered to thelamp is calculated (5.1.10):
Plp =flpVth
(LILo
2 + 4VinVthCg
)
Vth − Vin(5.1.10)
This expression shows that stability for this converter is assured by maintaining theinput voltage Vin less than the Vth voltage (seen in the primary), which correspondsto the same stability condition demonstrated for the SRI (4.1.20), (4.1.21). Otherwise,divergent development for the voltage and current is found [5.4].In fact, expression (4.1.39) for the SRI output power, is a special case of the Boost-
based converter (5.1.10) where the charge time Tch = 0. Additionally to the two D.O.F.of the SRI: Vin and flp, the Tch time appears as an additional D.O.F. for the controlof the lamp power. In Fig.5.4 the lamp power curves as function of Vin are shown fordifferent values of Tch.
0
50
100
150
200
250
700 800 900 1000 1100 1200
Plp (W)
Vin (V)
flp=80 kHzL=23 mHVth=1310 V
Cd=85 pF
Tch=0 sSRI case
Tch=10% (Tlp/2)
Tch=30% (Tlp/2)Tch=40% (Tlp/2)
Figure 5.4.: Power delivered to the lamp by the Boost-based converter for different values ofinductance charge time.
The end of the discharge phase in this converter is established by the spontaneousturn-off of one of the two inverter switches (ZCS).The operation of the converter in the case A (Fig.5.3-top) is positive for the lamp per-
formance, because in this case the peak current injected into the discharge is maximized(Section 3.2). According to the state plane shown in Fig.5.3-top, the operating case Ais obtained if the condition Ubr ≤ Uin is fulfilled. Using (5.1.7) and de-normalizing, thiscondition is expressed as:
Power supplies for the study and efficient use of DBD excimer UV lamps David Flórez
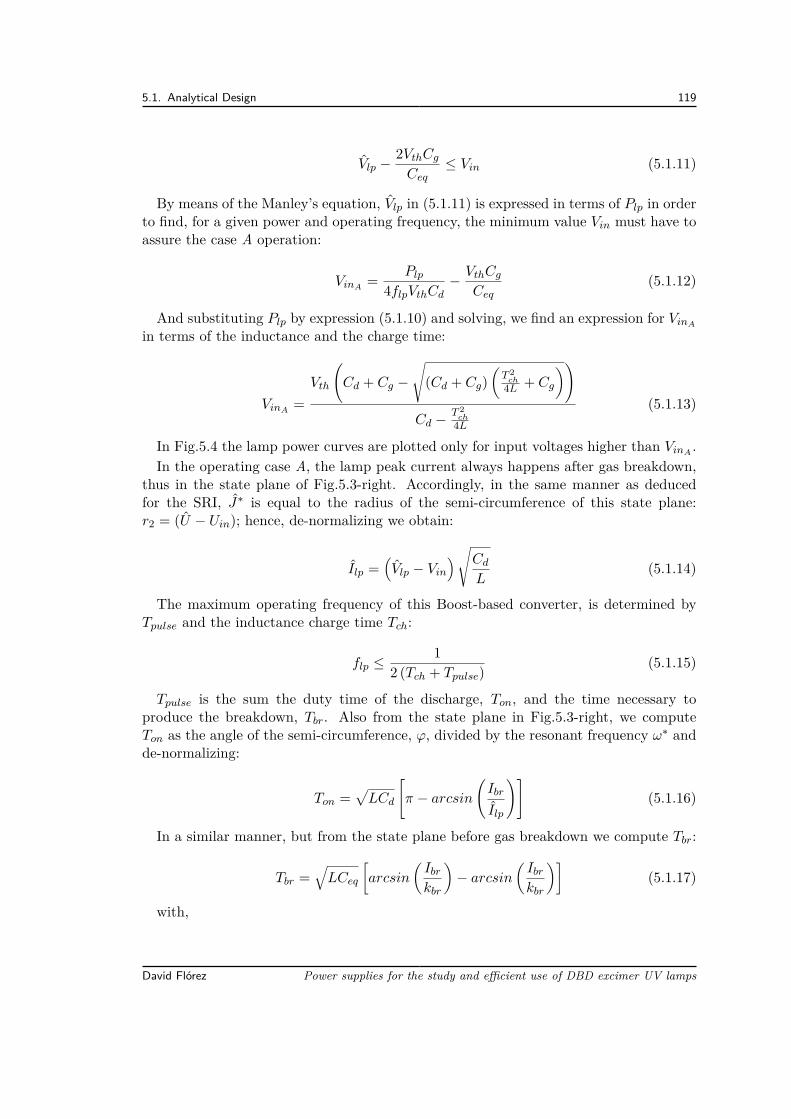
5.1. Analytical Design 119
Vlp −2VthCg
Ceq≤ Vin (5.1.11)
By means of the Manley’s equation, Vlp in (5.1.11) is expressed in terms of Plp in orderto find, for a given power and operating frequency, the minimum value Vin must have toassure the case A operation:
VinA = Plp
4flpVthCd− VthCg
Ceq(5.1.12)
And substituting Plp by expression (5.1.10) and solving, we find an expression for VinA
in terms of the inductance and the charge time:
VinA =Vth
(Cd + Cg −
√(Cd + Cg)
(T 2
ch4L + Cg
))
Cd − T 2ch
4L
(5.1.13)
In Fig.5.4 the lamp power curves are plotted only for input voltages higher than VinA .In the operating case A, the lamp peak current always happens after gas breakdown,
thus in the state plane of Fig.5.3-right. Accordingly, in the same manner as deducedfor the SRI, J∗ is equal to the radius of the semi-circumference of this state plane:r2 = (U − Uin); hence, de-normalizing we obtain:
Ilp =(Vlp − Vin
)√Cd
L(5.1.14)
The maximum operating frequency of this Boost-based converter, is determined byTpulse and the inductance charge time Tch:
flp ≤1
2 (Tch + Tpulse) (5.1.15)
Tpulse is the sum the duty time of the discharge, Ton, and the time necessary toproduce the breakdown, Tbr. Also from the state plane in Fig.5.3-right, we computeTon as the angle of the semi-circumference, ϕ, divided by the resonant frequency ω∗ andde-normalizing:
Ton =√LCd
[π − arcsin
(Ibr
Ilp
)](5.1.16)
In a similar manner, but from the state plane before gas breakdown we compute Tbr:
Tbr =√LCeq
[arcsin
(Ibr
kbr
)− arcsin
(Ibr
kbr
)](5.1.17)
with,
David Flórez Power supplies for the study and efficient use of DBD excimer UV lamps
120 5. DBD Supplies comparison
kbr =
√√√√(Vlp + Vin
)2Ceq
L+ I2
Lo (5.1.18)
And finally, Ibr is computed replacing (5.1.8) and (5.1.7) in (5.1.3):
Ibr =√(
I2Lo + 4VthVinCg
L
)(1 + VthCg
(Vth − Vin)C − d
)(5.1.19)
In this Section the mathematical expressions describing the operation of the Boost-based converter have been deduced. Comparing the lamp power expression of this con-verter (5.1.10) with the SRI, is found that the Boost-based can supply more power forthe same input voltage. Additionally, using the Tch time as an additional D.O.F., avariety of input voltage values can be used to obtain a desired operating point. Theprice to pay, compared with the SRI, is the loss of the zero current switching at theswitches turn-on and the need for an additional switch.
5.1.2. Buck-Boost based converterThis converter, using a buck-boost in DCM as the unidirectional current source, hasthe same charge and discharge stages as the Boost-based converter, as shown in Fig.5.5.However the inductance discharge is not sustained by the DC input voltage, as observedin the equivalent circuits (b) and (c) on Fig.5.5-bottom. Accordingly, this converterworks as a bidirectional DCM Flyback converter, as detailed in [5.3]. Only the energystored in the inductance, during the charge phase, is sent to the lamp during eachdischarge phase.Because only the energy stored by L is transferred to the lamp, the lamp power can
be easily computed as twice the inductance energy, multiplied by the lamp operatingfrequency:
Plp = flpLILo2 = flp (VinTch)2
L(5.1.20)
As can be observed in (5.1.20), the lamp power is proportional to the square of theDC input voltage and the inductance charge time. Using this expression for Plp, thelamp peak voltage can be found again using the Manley’s power equation (1.2.4):
Vlp = VthCg
Ceq+ VinTch
2
4LCdVth(5.1.21)
Differing from the Boost-based topology, the Buck-Boost converter is stable for all thevalues of the input voltage, as demonstrated in [5.1]. Here, ZCS is assured only at theend of the discharge sequence, as for the Boost-based topology.In Fig.5.6 the state plane analysis for this Buck-Boost converter is shown. Observe
that all the semi-circumferences before breakdown are traced around zero. Accordingto the state plane shown in Fig.5.6-top, the limit between the operating case A and B
Power supplies for the study and efficient use of DBD excimer UV lamps David Flórez
5.1. Analytical Design 121
is obtained when −Ubr ≤ 0. Using this condition and replacing (5.1.21) in (4.1.10), theminimum value of Vin necessary to work in the operating case A, VinA is found (5.1.22):
Vin
L
+- +
vlp
-
ilp
Cg
Cd
1:1:n
Vin
L
ilp
Cg
CdL
ilp
CdL
Vth
ilp
CdL
Vth
Vin
L
ilp
Cg
Cd
L
ilp
Cd
Vth
ilp
Cd
L Vth
ba c d
fe g h
L
-vth
Tpulse
t
Tlp
ba c d
vCg
tbrt0 toff
ALL SWITCHOFF
S1 ONALL SWITCH
OFF
vth
vlp
Tlp/2
Tch
S0ON
S2 ONS0ON
iL
iL=ilp iL=ilp
ilp
iL=ilpilp
fe g h
Vin/L
iL
i
-Vth
Vthv
Figure 5.5.: Buck-Boost-based converter output current waveform (bottom) with the corre-sponding operating sequences (bottom)
David Flórez Power supplies for the study and efficient use of DBD excimer UV lamps
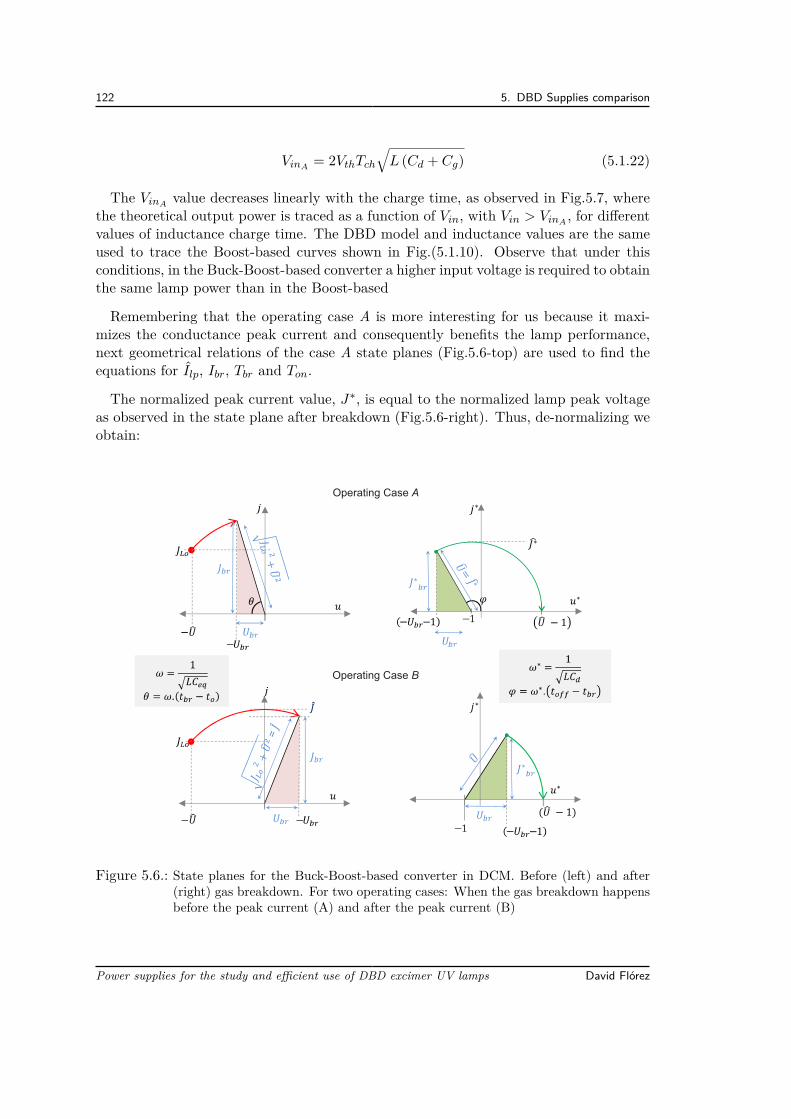
122 5. DBD Supplies comparison
VinA = 2VthTch
√L (Cd + Cg) (5.1.22)
The VinA value decreases linearly with the charge time, as observed in Fig.5.7, wherethe theoretical output power is traced as a function of Vin, with Vin > VinA , for differentvalues of inductance charge time. The DBD model and inductance values are the sameused to trace the Boost-based curves shown in Fig.(5.1.10). Observe that under thisconditions, in the Buck-Boost-based converter a higher input voltage is required to obtainthe same lamp power than in the Boost-based
Remembering that the operating case A is more interesting for us because it maxi-mizes the conductance peak current and consequently benefits the lamp performance,next geometrical relations of the case A state planes (Fig.5.6-top) are used to find theequations for Ilp, Ibr, Tbr and Ton.
The normalized peak current value, J∗, is equal to the normalized lamp peak voltageas observed in the state plane after breakdown (Fig.5.6-right). Thus, de-normalizing weobtain:
Operating Case A
Operating Case B
Figure 5.6.: State planes for the Buck-Boost-based converter in DCM. Before (left) and after(right) gas breakdown. For two operating cases: When the gas breakdown happensbefore the peak current (A) and after the peak current (B)
Power supplies for the study and efficient use of DBD excimer UV lamps David Flórez
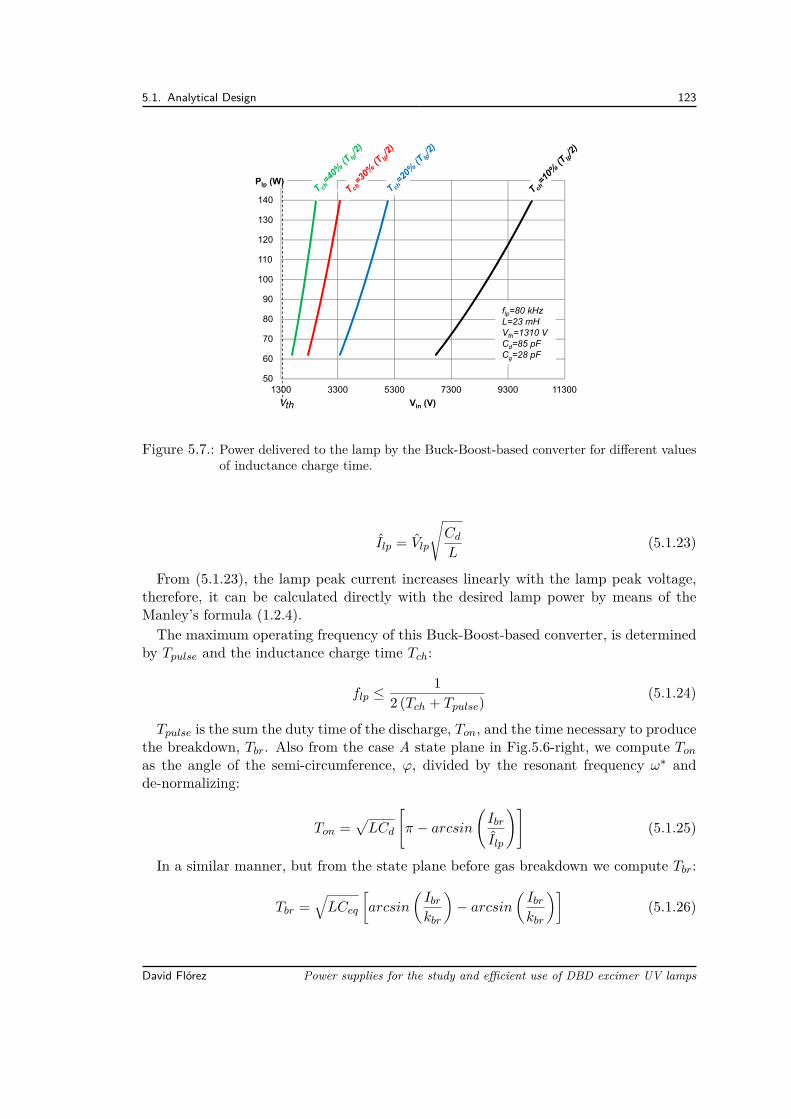
5.1. Analytical Design 123
50
60
70
80
90
100
110
120
130
140
150
1300 3300 5300 7300 9300 11300
Plp (W)
Vin (V)
flp=80 kHzL=23 mHVth=1310 VCd=85 pFCg=28 pF
Vth
Figure 5.7.: Power delivered to the lamp by the Buck-Boost-based converter for different valuesof inductance charge time.
Ilp = Vlp
√Cd
L(5.1.23)
From (5.1.23), the lamp peak current increases linearly with the lamp peak voltage,therefore, it can be calculated directly with the desired lamp power by means of theManley’s formula (1.2.4).The maximum operating frequency of this Buck-Boost-based converter, is determined
by Tpulse and the inductance charge time Tch:
flp ≤1
2 (Tch + Tpulse) (5.1.24)
Tpulse is the sum the duty time of the discharge, Ton, and the time necessary to producethe breakdown, Tbr. Also from the case A state plane in Fig.5.6-right, we compute Ton
as the angle of the semi-circumference, ϕ, divided by the resonant frequency ω∗ andde-normalizing:
Ton =√LCd
[π − arcsin
(Ibr
Ilp
)](5.1.25)
In a similar manner, but from the state plane before gas breakdown we compute Tbr:
Tbr =√LCeq
[arcsin
(Ibr
kbr
)− arcsin
(Ibr
kbr
)](5.1.26)
David Flórez Power supplies for the study and efficient use of DBD excimer UV lamps
124 5. DBD Supplies comparison
with,
kbr =
√V 2
lpCeq
L+ I2
Lo (5.1.27)
And finally, Ibr is computed replacing (5.1.8) and (5.1.7) in (5.1.3):
Ibr = ILo
√Cg
Ceq(5.1.28)
The precedent equations, together with the SRI, Boost-based and Square waveformconverter formulas for the operating case A, are presented in Table.5.1. From this com-parative table, note that to obtain the same Vlp value and hence, the same lamp power,the converter that requires the minimum input voltage is the Boost-based. Observe thatfor the resonant converters, the expression for Ton is the same, however this time andalso Tbr can be adjusted by means of Tch in the Boost and Buck-Boost based converters.
5.2. Converters Design and Simulations
Here, on the basis of the best lamp performance conditions identified in Section 3 anoperating point is chosen, and accordingly the four different types of converters undercomparison are designed. For simplicity, the designs are done assuming a transformationratio equal to one, thus all the values are computed as seen on the secondary side of thetransformer. The operating condition selected for the converters design is: Plp=100 W,flp=60 kHz and a discharge time Ton = 3.5 µs.Using the DBD lamp model in Table.2.1 and the Manley’s equation (1.2.4), a lamp
peak voltage of 5.48 kV is found.
5.2.1. SRI design
To obtain 100 W of output power from the SRI, a DC input voltage of 1.17 kV iscomputed with (4.1.39). According to (4.1.30), the minimum value of Vin to obtain theoperating case A is 875 V, thus the equations of the operating case A can be used.In the expression of Ton for the SRI in Table.5.1, the factor (Ibr/Ilp) is observed.
Solving this factor, the expression (5.2.1) is found:
Ibr
Ilp
= 1Vlp − Vin
√√√√4VthCg
Cd
(Vlp + Vin −
VthCg
Ceq
)(5.2.1)
Because Vin and Vlp are known, the equation (5.2.1) is a constant. Replacing (5.2.1)
Power supplies for the study and efficient use of DBD excimer UV lamps David Flórez
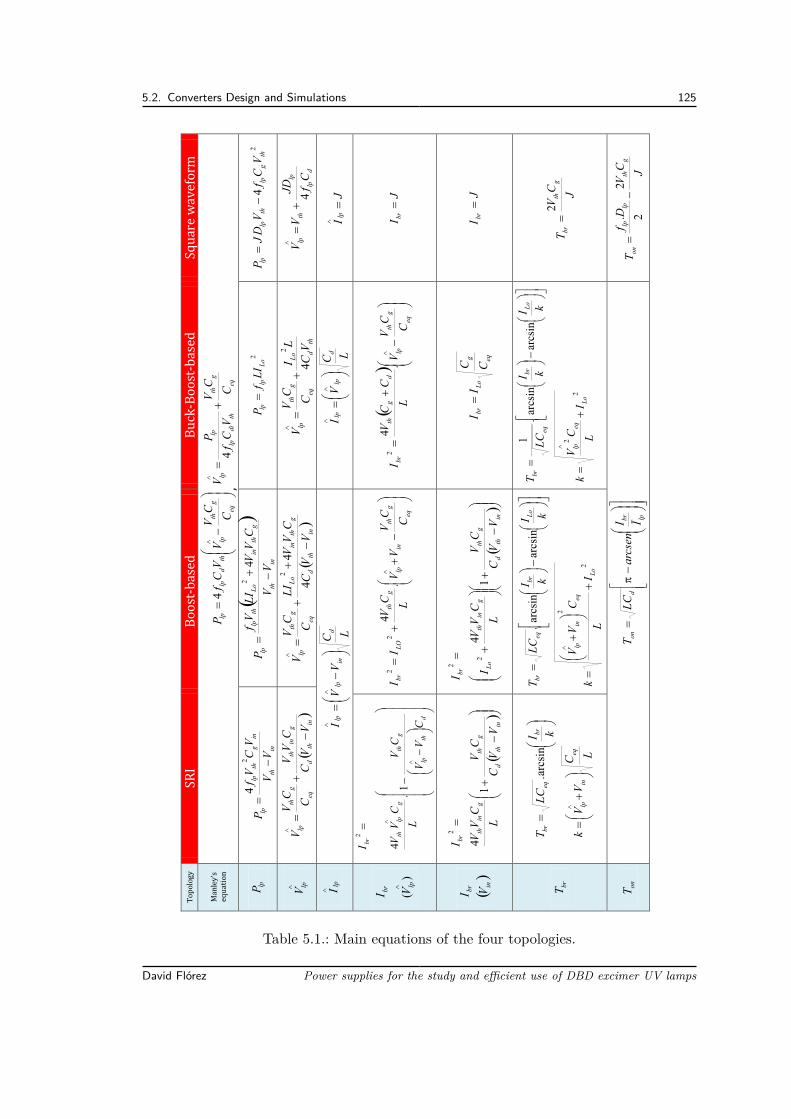
5.2. Converters Design and Simulations 125
equation
eq
gth
lpth
dlp
lpC
CV
VV
Cf
P4
eq
gth
thdi
lp
lp
lpC
CV
VC
f
PV
4
lpPin
th
ing
thlp
lpV
V
VC
Vf
P
24
inth
gth
inLo
thlp
lpV
V
CV
VLI
Vf
P
4
22
Lo
lplp
LI
fP
24
thg
lpth
lplp
VC
fV
DJ
P
lpV
in
thd
gin
th
eq
gth
lpV
VC
CV
V
C
CV
V
inth
d
gth
inLo
eq
gth
lpV
VC
CV
VLI
C
CV
V
4
42
thd
Lo
eq
gth
lpV
C
LI
C
CV
V4
2
dlp
lp
thlp
CfJD
VV
4
lpI
LCV
VI
din
lplp
LCV
Id
lplp
JI l
p
)(
lp
br VI
dth
lp
gth
glp
th
br
CV
V
CV
L
CV
VI
1.
4
2
eq
gth
inlp
gth
LO
br
C
CV
VV
LCV
II
.4
22
eq
gth
lp
dg
th
brC
CV
VL
CC
VI
.4
2
JI b
r
in
br VI
inth
d
gth
gin
th
br
VV
C
CV
L
CV
VI
14
2
inth
d
gth
gin
th
Lo
br
VV
C
CV
L
CV
VII
14
2
2
eqg
Lo
brCC
II
JI b
r
brT
LCV
Vk
kILC
T
eq
inlp
breq
br
arcs
in.
2
2
arcs
inar
csin
.
Lo
eqin
lp
Lo
breq
br
IL
CV
V
k
kI
kILC
T
2
2
arcs
inar
csin
.1
Lo
eqlp
Lo
br
eq
br
ILC
Vk
kI
kI
LC
T
JCV
Tg
th
br
2
onT
lpbr
don
IIarcsen
LC
T
JC
VD
fT
gth
lplp
on
2
2.
Table 5.1.: Main equations of the four topologies.
David Flórez Power supplies for the study and efficient use of DBD excimer UV lamps
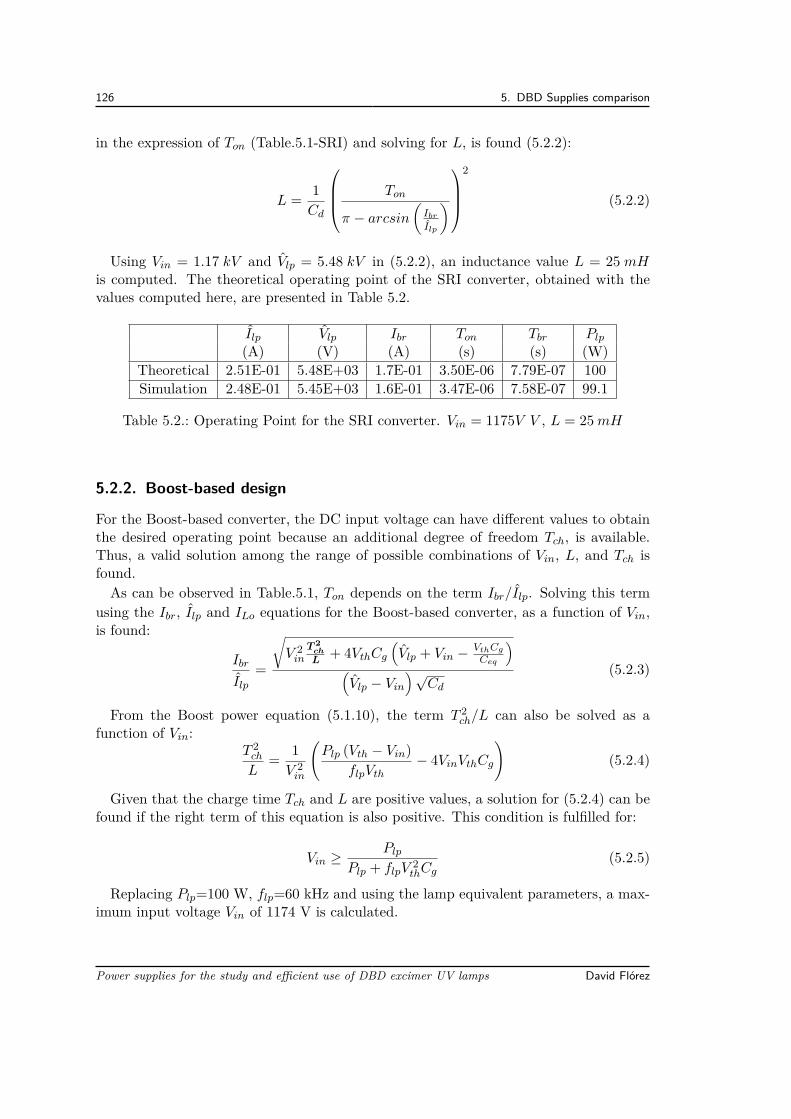
126 5. DBD Supplies comparison
in the expression of Ton (Table.5.1-SRI) and solving for L, is found (5.2.2):
L = 1Cd
Ton
π − arcsin(
Ibr
Ilp
)
2
(5.2.2)
Using Vin = 1.17 kV and Vlp = 5.48 kV in (5.2.2), an inductance value L = 25 mHis computed. The theoretical operating point of the SRI converter, obtained with thevalues computed here, are presented in Table 5.2.
Ilp Vlp Ibr Ton Tbr Plp
(A) (V) (A) (s) (s) (W)Theoretical 2.51E-01 5.48E+03 1.7E-01 3.50E-06 7.79E-07 100Simulation 2.48E-01 5.45E+03 1.6E-01 3.47E-06 7.58E-07 99.1
Table 5.2.: Operating Point for the SRI converter. Vin = 1175V V , L = 25mH
5.2.2. Boost-based design
For the Boost-based converter, the DC input voltage can have different values to obtainthe desired operating point because an additional degree of freedom Tch, is available.Thus, a valid solution among the range of possible combinations of Vin, L, and Tch isfound.As can be observed in Table.5.1, Ton depends on the term Ibr/Ilp. Solving this term
using the Ibr, Ilp and ILo equations for the Boost-based converter, as a function of Vin,is found:
Ibr
Ilp
=
√V 2
inT 2
chL
+ 4VthCg
(Vlp + Vin − VthCg
Ceq
)
(Vlp − Vin
)√Cd
(5.2.3)
From the Boost power equation (5.1.10), the term T 2ch/L can also be solved as a
function of Vin:T 2
ch
L= 1V 2
in
(Plp (Vth − Vin)
flpVth− 4VinVthCg
)(5.2.4)
Given that the charge time Tch and L are positive values, a solution for (5.2.4) can befound if the right term of this equation is also positive. This condition is fulfilled for:
Vin ≥Plp
Plp + flpV2
thCg(5.2.5)
Replacing Plp=100 W, flp=60 kHz and using the lamp equivalent parameters, a max-imum input voltage Vin of 1174 V is calculated.
Power supplies for the study and efficient use of DBD excimer UV lamps David Flórez
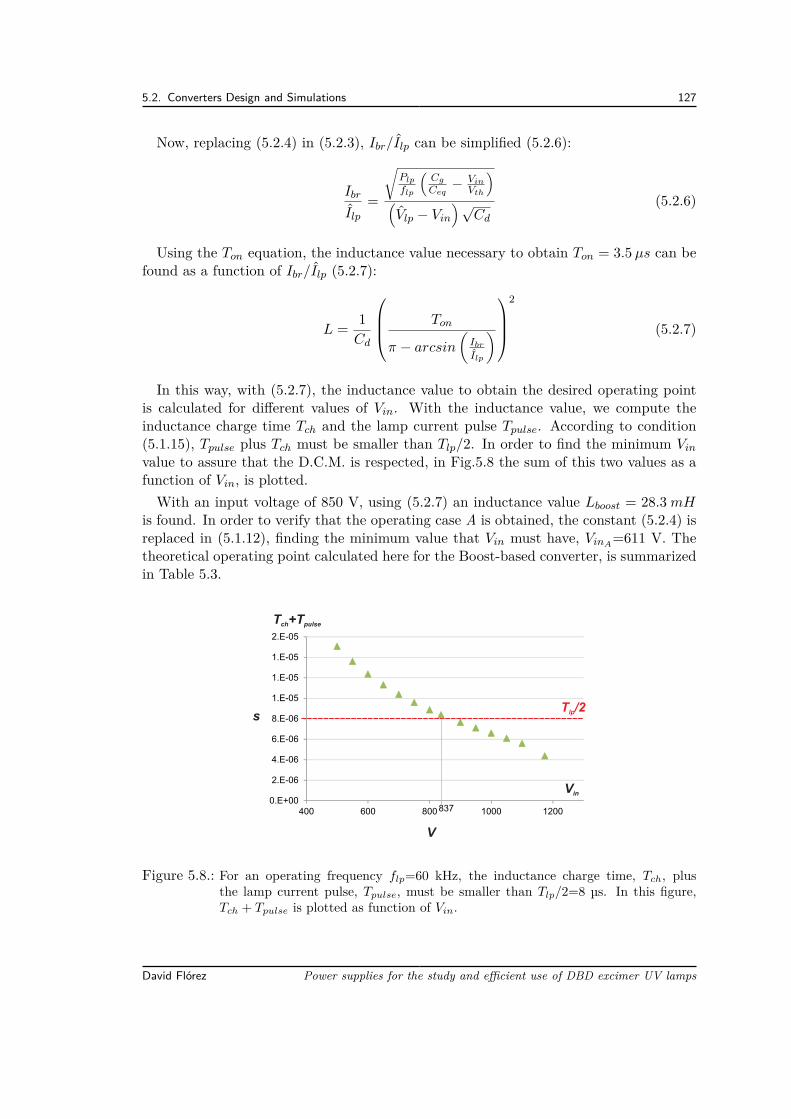
5.2. Converters Design and Simulations 127
Now, replacing (5.2.4) in (5.2.3), Ibr/Ilp can be simplified (5.2.6):
Ibr
Ilp
=
√Plp
flp
(Cg
Ceq− Vin
Vth
)
(Vlp − Vin
)√Cd
(5.2.6)
Using the Ton equation, the inductance value necessary to obtain Ton = 3.5 µs can befound as a function of Ibr/Ilp (5.2.7):
L = 1Cd
Ton
π − arcsin(
Ibr
Ilp
)
2
(5.2.7)
In this way, with (5.2.7), the inductance value to obtain the desired operating pointis calculated for different values of Vin. With the inductance value, we compute theinductance charge time Tch and the lamp current pulse Tpulse. According to condition(5.1.15), Tpulse plus Tch must be smaller than Tlp/2. In order to find the minimum Vin
value to assure that the D.C.M. is respected, in Fig.5.8 the sum of this two values as afunction of Vin, is plotted.With an input voltage of 850 V, using (5.2.7) an inductance value Lboost = 28.3 mH
is found. In order to verify that the operating case A is obtained, the constant (5.2.4) isreplaced in (5.1.12), finding the minimum value that Vin must have, VinA=611 V. Thetheoretical operating point calculated here for the Boost-based converter, is summarizedin Table 5.3.
T +Tch pulse
0.E+00
2.E-06
4.E-06
6.E-06
8.E-06
1.E-05
1.E-05
1.E-05
2.E-05
400 600 800 1000 1200
T /2lp
Vin
s
V
837
Figure 5.8.: For an operating frequency flp=60 kHz, the inductance charge time, Tch, plusthe lamp current pulse, Tpulse, must be smaller than Tlp/2=8 µs. In this figure,Tch + Tpulse is plotted as function of Vin.
David Flórez Power supplies for the study and efficient use of DBD excimer UV lamps
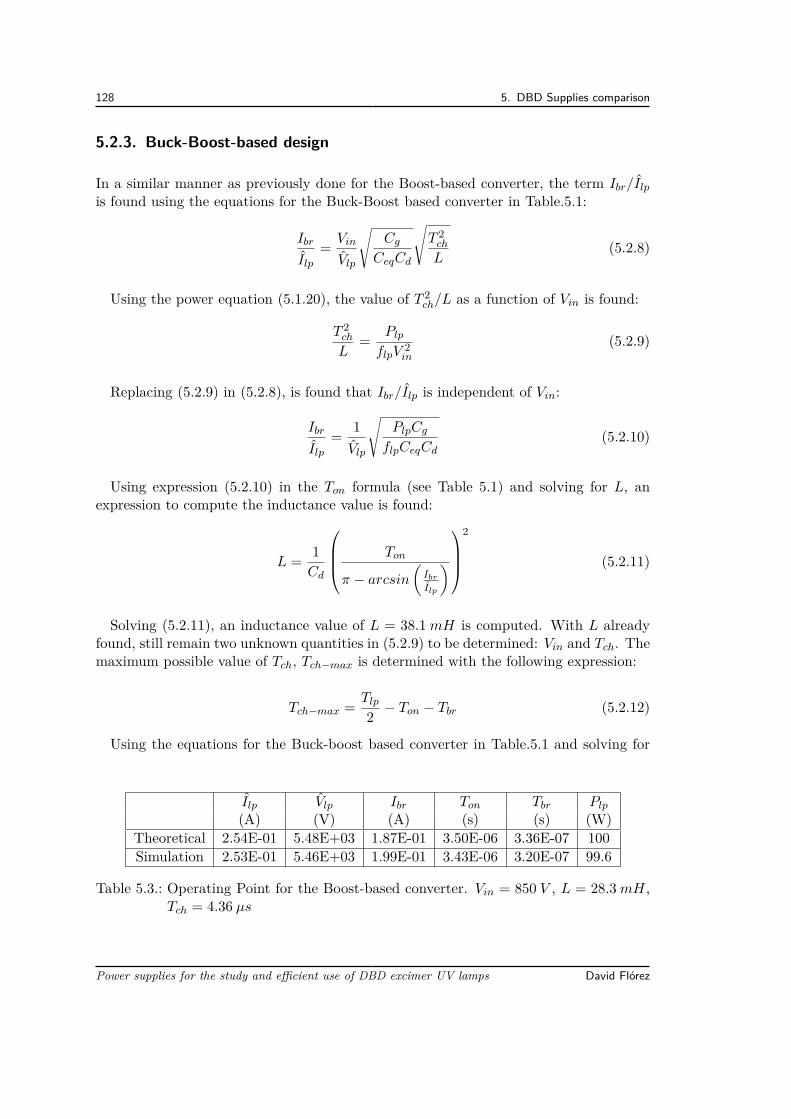
128 5. DBD Supplies comparison
5.2.3. Buck-Boost-based design
In a similar manner as previously done for the Boost-based converter, the term Ibr/Ilp
is found using the equations for the Buck-Boost based converter in Table.5.1:
Ibr
Ilp
= Vin
Vlp
√Cg
CeqCd
√T 2
ch
L(5.2.8)
Using the power equation (5.1.20), the value of T 2ch/L as a function of Vin is found:
T 2ch
L= Plp
flpV2
in
(5.2.9)
Replacing (5.2.9) in (5.2.8), is found that Ibr/Ilp is independent of Vin:
Ibr
Ilp
= 1Vlp
√PlpCg
flpCeqCd(5.2.10)
Using expression (5.2.10) in the Ton formula (see Table 5.1) and solving for L, anexpression to compute the inductance value is found:
L = 1Cd
Ton
π − arcsin(
Ibr
Ilp
)
2
(5.2.11)
Solving (5.2.11), an inductance value of L = 38.1 mH is computed. With L alreadyfound, still remain two unknown quantities in (5.2.9) to be determined: Vin and Tch. Themaximum possible value of Tch, Tch−max is determined with the following expression:
Tch−max = Tlp
2 − Ton − Tbr (5.2.12)
Using the equations for the Buck-boost based converter in Table.5.1 and solving for
Ilp Vlp Ibr Ton Tbr Plp
(A) (V) (A) (s) (s) (W)Theoretical 2.54E-01 5.48E+03 1.87E-01 3.50E-06 3.36E-07 100Simulation 2.53E-01 5.46E+03 1.99E-01 3.43E-06 3.20E-07 99.6
Table 5.3.: Operating Point for the Boost-based converter. Vin = 850 V , L = 28.3 mH,Tch = 4.36 µs
Power supplies for the study and efficient use of DBD excimer UV lamps David Flórez
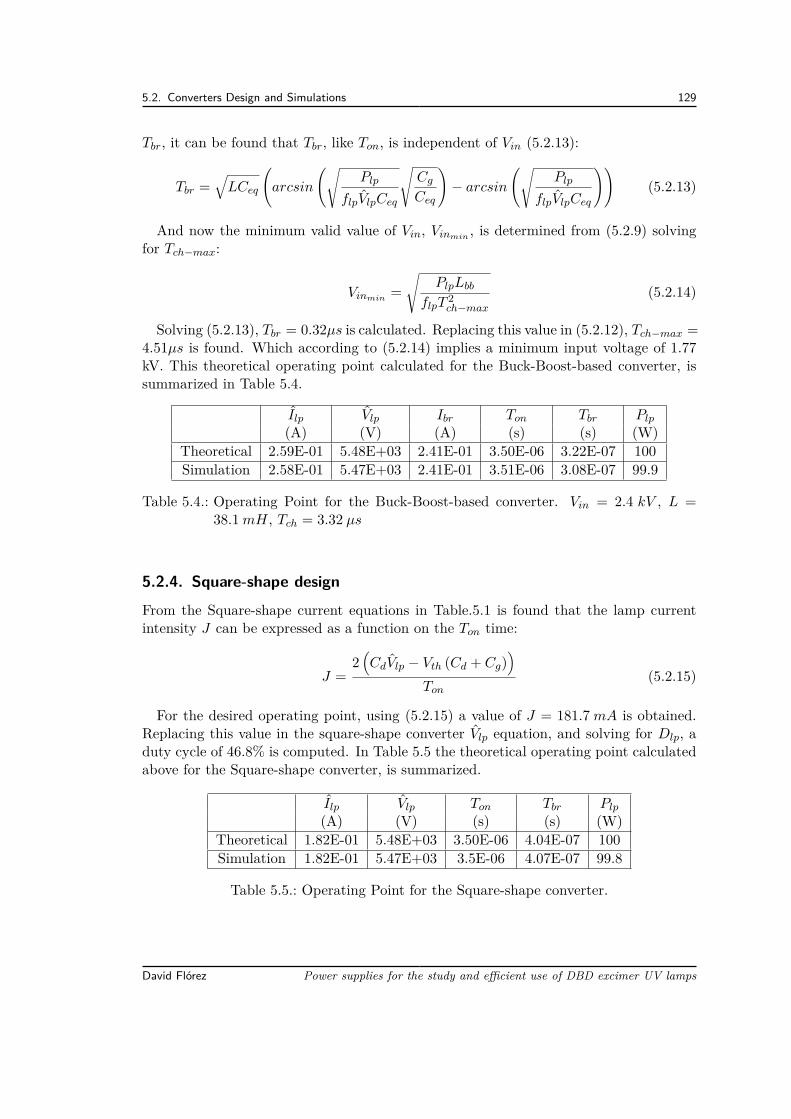
5.2. Converters Design and Simulations 129
Tbr, it can be found that Tbr, like Ton, is independent of Vin (5.2.13):
Tbr =√LCeq
(arcsin
(√Plp
flpVlpCeq
√Cg
Ceq
)− arcsin
(√Plp
flpVlpCeq
))(5.2.13)
And now the minimum valid value of Vin, Vinmin , is determined from (5.2.9) solvingfor Tch−max:
Vinmin =√
PlpLbb
flpT2ch−max
(5.2.14)
Solving (5.2.13), Tbr = 0.32µs is calculated. Replacing this value in (5.2.12), Tch−max =4.51µs is found. Which according to (5.2.14) implies a minimum input voltage of 1.77kV. This theoretical operating point calculated for the Buck-Boost-based converter, issummarized in Table 5.4.
Ilp Vlp Ibr Ton Tbr Plp
(A) (V) (A) (s) (s) (W)Theoretical 2.59E-01 5.48E+03 2.41E-01 3.50E-06 3.22E-07 100Simulation 2.58E-01 5.47E+03 2.41E-01 3.51E-06 3.08E-07 99.9
Table 5.4.: Operating Point for the Buck-Boost-based converter. Vin = 2.4 kV , L =38.1mH, Tch = 3.32 µs
5.2.4. Square-shape designFrom the Square-shape current equations in Table.5.1 is found that the lamp currentintensity J can be expressed as a function on the Ton time:
J =2(CdVlp − Vth (Cd + Cg)
)
Ton(5.2.15)
For the desired operating point, using (5.2.15) a value of J = 181.7 mA is obtained.Replacing this value in the square-shape converter Vlp equation, and solving for Dlp, aduty cycle of 46.8% is computed. In Table 5.5 the theoretical operating point calculatedabove for the Square-shape converter, is summarized.
Ilp Vlp Ton Tbr Plp
(A) (V) (s) (s) (W)Theoretical 1.82E-01 5.48E+03 3.50E-06 4.04E-07 100Simulation 1.82E-01 5.47E+03 3.5E-06 4.07E-07 99.8
Table 5.5.: Operating Point for the Square-shape converter.
David Flórez Power supplies for the study and efficient use of DBD excimer UV lamps
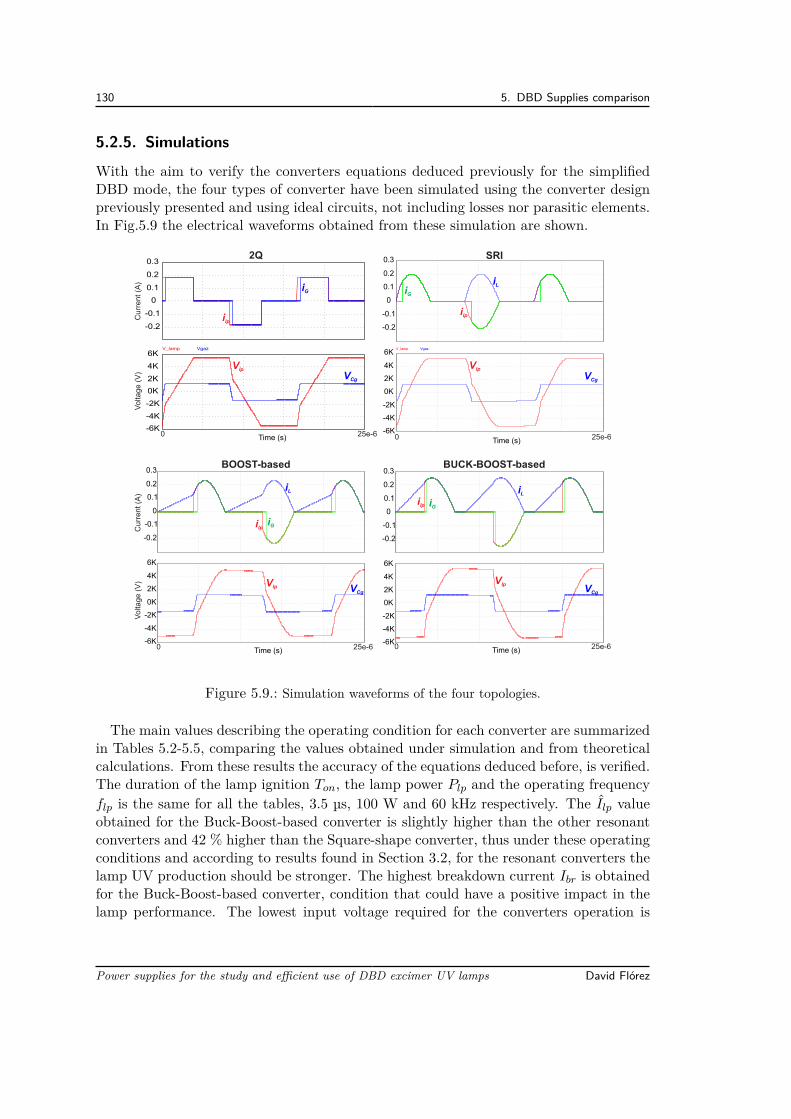
130 5. DBD Supplies comparison
5.2.5. Simulations
With the aim to verify the converters equations deduced previously for the simplifiedDBD mode, the four types of converter have been simulated using the converter designpreviously presented and using ideal circuits, not including losses nor parasitic elements.In Fig.5.9 the electrical waveforms obtained from these simulation are shown.
BOOST-based
0
-0.1
-0.2
0.1
0.2
0.3
Time (s)
0K
-2K
-4K
-6K
2K
4K
6K
BUCK-BOOST-based
0
-0.1
-0.2
0.1
0.2
0.3
0K
-2K
-4K
-6K
2K
4K
6K
0
-0.1
-0.2
0.1
0.2
0.3
0K
-2K
-4K
-6K
2K
4K
6KV_lamp Vgaz
SRI
0
-0.1
-0.2
0.1
0.2
0.3
0K
-2K
-4K
-6K
2K
4K
6KV_lamp Vgaz
2Q
0 25e-6 Time (s)0 25e-6
Time (s)0 25e-6Time (s)0 25e-6
Vlp Vlp
VlpVlp
VCg VCg
VCgVCg
iL iL
iLiG iG
ilp
iG
iG
ilp
ilp
ilpCu
rre
nt
(A)
Cu
rre
nt
(A)
Vo
ltag
e (
V)
Vo
ltag
e (
V)
Figure 5.9.: Simulation waveforms of the four topologies.
The main values describing the operating condition for each converter are summarizedin Tables 5.2-5.5, comparing the values obtained under simulation and from theoreticalcalculations. From these results the accuracy of the equations deduced before, is verified.The duration of the lamp ignition Ton, the lamp power Plp and the operating frequencyflp is the same for all the tables, 3.5 µs, 100 W and 60 kHz respectively. The Ilp valueobtained for the Buck-Boost-based converter is slightly higher than the other resonantconverters and 42 % higher than the Square-shape converter, thus under these operatingconditions and according to results found in Section 3.2, for the resonant converters thelamp UV production should be stronger. The highest breakdown current Ibr is obtainedfor the Buck-Boost-based converter, condition that could have a positive impact in thelamp performance. The lowest input voltage required for the converters operation is
Power supplies for the study and efficient use of DBD excimer UV lamps David Flórez
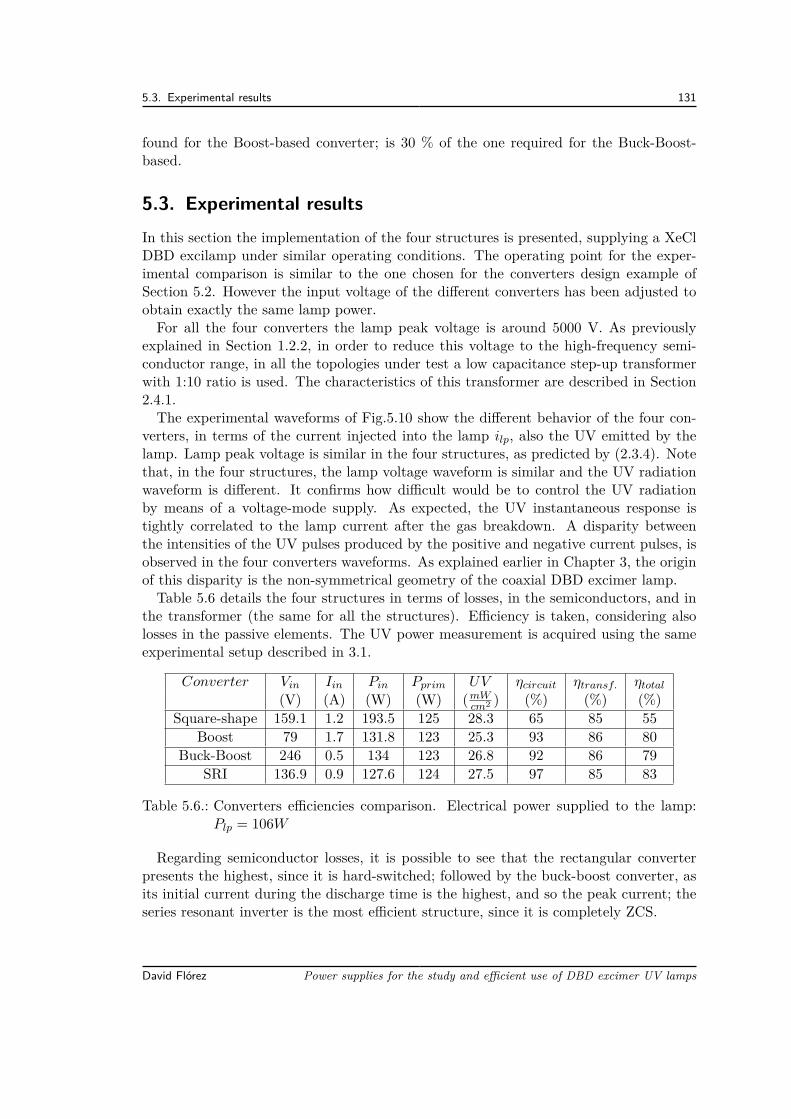
5.3. Experimental results 131
found for the Boost-based converter; is 30 % of the one required for the Buck-Boost-based.
5.3. Experimental resultsIn this section the implementation of the four structures is presented, supplying a XeClDBD excilamp under similar operating conditions. The operating point for the exper-imental comparison is similar to the one chosen for the converters design example ofSection 5.2. However the input voltage of the different converters has been adjusted toobtain exactly the same lamp power.For all the four converters the lamp peak voltage is around 5000 V. As previously
explained in Section 1.2.2, in order to reduce this voltage to the high-frequency semi-conductor range, in all the topologies under test a low capacitance step-up transformerwith 1:10 ratio is used. The characteristics of this transformer are described in Section2.4.1.The experimental waveforms of Fig.5.10 show the different behavior of the four con-
verters, in terms of the current injected into the lamp ilp, also the UV emitted by thelamp. Lamp peak voltage is similar in the four structures, as predicted by (2.3.4). Notethat, in the four structures, the lamp voltage waveform is similar and the UV radiationwaveform is different. It confirms how difficult would be to control the UV radiationby means of a voltage-mode supply. As expected, the UV instantaneous response istightly correlated to the lamp current after the gas breakdown. A disparity betweenthe intensities of the UV pulses produced by the positive and negative current pulses, isobserved in the four converters waveforms. As explained earlier in Chapter 3, the originof this disparity is the non-symmetrical geometry of the coaxial DBD excimer lamp.Table 5.6 details the four structures in terms of losses, in the semiconductors, and in
the transformer (the same for all the structures). Efficiency is taken, considering alsolosses in the passive elements. The UV power measurement is acquired using the sameexperimental setup described in 3.1.
Converter Vin Iin Pin Pprim UV ηcircuit ηtransf. ηtotal
(V) (A) (W) (W) (mWcm2 ) (%) (%) (%)
Square-shape 159.1 1.2 193.5 125 28.3 65 85 55Boost 79 1.7 131.8 123 25.3 93 86 80
Buck-Boost 246 0.5 134 123 26.8 92 86 79SRI 136.9 0.9 127.6 124 27.5 97 85 83
Table 5.6.: Converters efficiencies comparison. Electrical power supplied to the lamp:Plp = 106W
Regarding semiconductor losses, it is possible to see that the rectangular converterpresents the highest, since it is hard-switched; followed by the buck-boost converter, asits initial current during the discharge time is the highest, and so the peak current; theseries resonant inverter is the most efficient structure, since it is completely ZCS.
David Flórez Power supplies for the study and efficient use of DBD excimer UV lamps
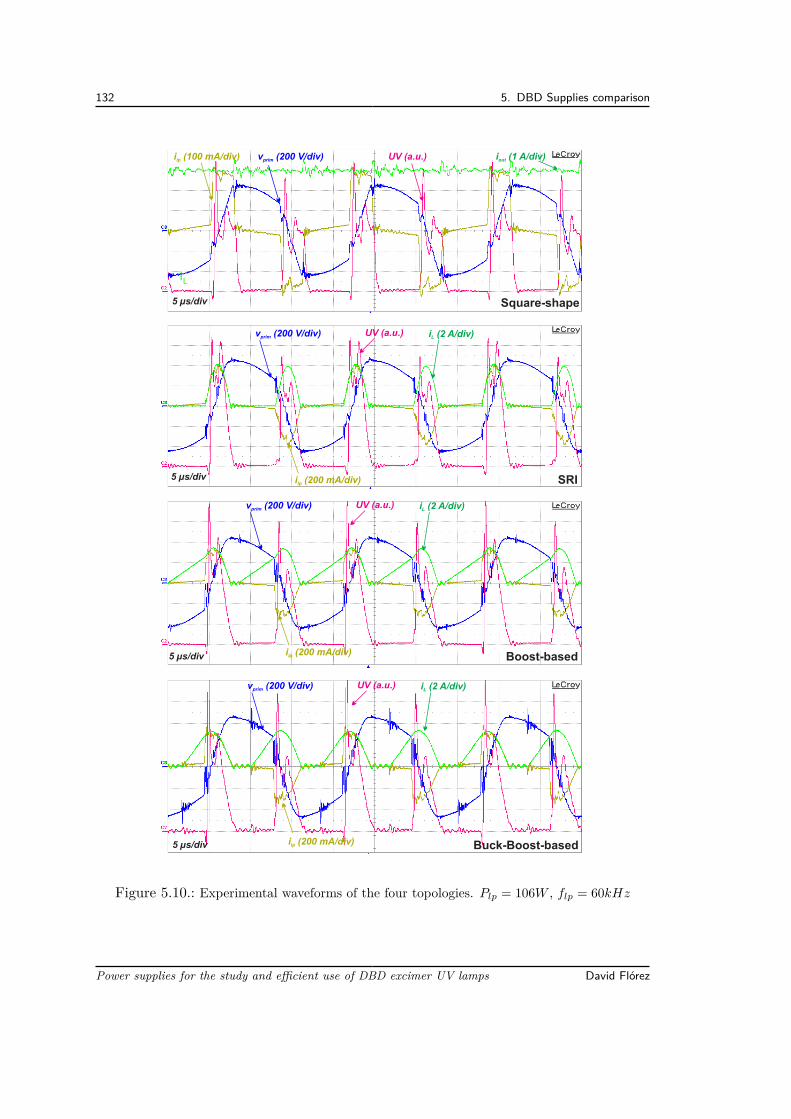
132 5. DBD Supplies comparison
Buck-Boost-basedi (200 mA/div)lp
v (200 V/div)primUV (a.u.) i (2 A/div)L
5 µs/div
Boost-basedi (200 mA/div)lp
v (200 V/div)primUV (a.u.) i (2 A/div)L
5 µs/div
SRIi (200 mA/div)lp
v (200 V/div)primUV (a.u.) i (2 A/div)L
5 µs/div
Square-shape
i (100 mA/div)lp
iL
v (200 V/div)prim UV (a.u.) i (1 A/div)out
5 µs/div
Figure 5.10.: Experimental waveforms of the four topologies. Plp = 106W , flp = 60kHz
Power supplies for the study and efficient use of DBD excimer UV lamps David Flórez
5.4. Conclusions 133
Since the electrical lamp power is the same for all the structures, as well as theduration and energy of each pulse, the differences in the luminous efficiency of thelamp are determined by the current shape. The lowest UV power was obtained forthe Boost-based converter, this UV corresponds to 89 % of the one obtained with theSquare-shape supply. Considering the results of the parametric study concerning theimpact of the current intensity (Section 3.2), this reduction in the UV production isexplained by the lamp current intensity difference between the converters. In this sense,the lowest lamp peak current and luminous power were obtained for the Boost and theBuck-Boost based converters, as can be observed in Fig.5.10. The dissimilarities in theUV production efficiency found in this experimental comparison, can be compensatedadjusting the converters operating point in order to increase the peak lamp current forthe same injected power.
5.4. ConclusionsBy comparing the UV and lamp voltage waveforms obtained with the tested topologies,the difficulty to control the UV radiation from DBD excilamps using voltage modesupplies is experimentally validated. For the compared resonant topologies operatingunder similar conditions, a similar level of electrical efficiency has been measured. Thesquare-shape current has demonstrated to be slightly more effective in terms of UVproduction than the resonant current waveforms.The main analytical expressions of four DBDs current-mode DBD power supplies,
three of them resonant topologies, have been obtained on the basis of the DBD simpli-fied model. Those expressions allow to design the presented converters and to evaluatethe convenience of these topologies according to the specifications of the intended appli-cation.The Square-shape supply topology offers a large operating range and full control of
the operating point with three degrees of freedom; these characteristics are useful forapplications requiring a fine adjustment of the UV radiation and lamp operating point,for example in laboratory test and industrial processes.Among the topologies compared here, the SRI converter features the lowest number
of switches. This characteristic make of this converter a good candidate for low costapplications. Also, the SRI is the only of these converters with full Z.C.S., thus iswell adapted for EMI sensitive applications and for scenarios where maximum electricalefficiency is required.In some applications the DC input voltage available to supply the DBD converter is
a constraint, e.g. battery operated equipment. In this case the Boost-based converteris a good option because this topology allows to obtain a determined operating condi-tion from a DC input voltage lower than the voltage required for the other evaluatedconverters. Consequently by using this converter, the required transformer turns ratiois reduced and also the need for a voltage step-up stage can be eliminated.Finally, the high-stability of the Buck-Boost-based converter is a valuable attribute
for open loop operation.
David Flórez Power supplies for the study and efficient use of DBD excimer UV lamps
Bibliography[5.1] R. Diez, H. Piquet, S. Bhosle, and J.-M. Blaquiere, “Current mode converter for
dielectric barrier discharge lamp,” in IEEE Power Electronics Specialists Conference,2008. PESC 2008, pp. 2485–2491, 2008.
[5.2] H. Piquet, S. Bhosle, R. Diez, and M. V. Erofeev, “Pulsed current-mode supplyof dielectric barrier discharge excilamps for the control of the radiated ultravioletpower,” IEEE Transactions on Plasma Science, vol. 38, pp. 2531–2538, Oct. 2010.
[5.3] R. Diez, H. Piquet, M. Cousineau, and S. Bhosle, “Current-mode power converterfor radiation control in DBD excimer lamps,” IEEE Transactions on Industrial Elec-tronics, vol. 59, no. 4, pp. 1912–1919, 2012.
[5.4] R. Diez, H. Piquet, S. Bhosle, J.-M. Blaquiere, and N. Roux, “Design of a currentconverter for the study of the UV emission in DBD excilamps,” in IEEE InternationalSymposium on Industrial Electronics, 2008. ISIE 2008, pp. 62–67, 2008.
6. General ConclusionsThe main objective of this thesis was the enhancement of the DBD excimer UV lampsystems efficiency. With this aim, a process covering two main stages has been conceived:The first stage of this process is the study of the lamp best performance operating con-ditions and the second is the enhancement of the lamp power supply electrical efficiency.For the first stage, a study of the lamp operating point impact over the lamp perfor-
mance was proposed. To make possible this performance study, a new scientific tool thatprovides full control and flexibility to adjust the DBD lamp power has been developed.This tool is a current-mode power supply capable of injecting a square-shape current intothe DBD lamp with three degrees of freedom on its current output waveform: currentintensity, duty cycle and frequency.Using this novel equipment with a XeCl DBD UV excilamp, the effect of the lamp
current intensity, frequency and pulse energy over the UV radiation and over the lampefficiency was revealed. From the obtained results (for the tested operating range) thevalue of the injected pulse energy has been found to be a determinant factor in the lampefficiency. Pulse energies above 300µJ , are found to provide the best lamp performanceoperating conditions. Additionally, for a given value of lamp electrical power, the use oflow-frequency and high-intensity currents has demonstrated to benefits the UV radiationoutput. However a decrease on the lamp performance gain for current intensities above190mA has been established.For the second stage of this optimization process, a high-efficiency converter has been
conceived and implemented, designed to work at the optimal lamp operating point foundusing the square-shape current supply. In order to achieve the high-efficiency requirementfor this specific application, a resonant converter that operates on the basis of the seriesresonant inverter, featuring zero current switching (Z.C.S) at turn-on and turn-off ofthe switches and Discontinuous Conduction Mode (D.C.M), has been designed. Thefull Z.C.S minimizes the switching losses; the D.C.M. benefits the system performanceensuring that only the highest current intensity pulse is used to sustain the gas discharge.Using this converter, a maximum electrical efficiency of 94% has been achieved.After this work, one of the perspectives is the application of the square-shape supply
in the performance study of other types of DBD excilamps and DBD reactors. One ofthe possible applications, already verified in preliminary experiments, is the evaluationof the DBD excimer UV lamp disinfection efficacy as a function of the operating point.With changes in the square-shape converter design and implementing different semi-conductor technologies, the DBD excimer lamp studies can be extended to operatingranges different to the one achieved in this thesis, for example supplying the lamp witha current in the range of MHz. Additionally, the development of transformer-less DBDpower supplies, profiting the new technologies in HV semiconductors, is an interesting

136 6. General Conclusions
possibility that could allow to reduce the DBD supplies size while increasing its efficiencyand reliability.
Power supplies for the study and efficient use of DBD excimer UV lamps David Flórez
Bibliography for Chapter 0
[0.1] United Nations, “Drinking water, sanitation & hygiene. statistics, graphs andmaps.” http://www.unwater.org/statistics_san.html, Nov. 2013.
[0.2] Defensoria del Pueblo - Colombia, DIAGNOSTICO DE LA CALIDAD DEL AGUAPARA CONSUMO HUMANO ANO 2010. Defensoria del Pueblo de Colombia, Nov.2011.
[0.3] Instituto de Hidrologia, Meteorologia y Estudios Ambientales, Estudio Nacionaldel Agua 2010. Bogota D.C.: IDEAM, 2010.
[0.4] United States Environmental Protection Agency, ULTRAVIOLET DISINFEC-TION GUIDANCE MANUAL FOR THE FINAL LONG TERM 2 ENHANCEDSURFACE WATER TREATMENT RULE. EPA, Nov. 2006.
[0.5] I. Soloshenko, V. Y. Bazhenov, V. A. Khomich, V. V. Tsiolko, and N. G.Potapchenko, “Comparative research of efficiency of water decontamination by UVradiation of cold hollow cathode discharge plasma versus that of low- and medium-pressure mercury lamps,” IEEE Transactions on Plasma Science, vol. 34, no. 4,pp. 1365–1369, 2006.
[0.6] C. Dorval Dion and J. Tavares, “Photo-initiated chemical vapor deposition as ascalable particle functionalization technology (a practical review),” Powder Tech-nology, vol. 239, pp. 484–491, May 2013.
[0.7] M. Wertheimer, A. Fozza, and A. Holländer, “Industrial processing of polymers bylow-pressure plasmas: the role of VUV radiation,” Nuclear Instruments and Meth-ods in Physics Research Section B: Beam Interactions with Materials and Atoms,vol. 151, pp. 65–75, May 1999.
[0.8] NICHIA CORPORATION, “UV-LED.” http://www.nichia.co.jp/en/product/uvled.html, 2013.
[0.9] OSRAM GmbH, “PURITEC HNS germicidal ultraviolet lamps.”http://www.osram.com/osram_com/products/lamps/specialty-lamps/ultraviolet-lamps/puritec-hns/index.jsp?productId=ZMP_86446.
[0.10] Xenon corporation, “About xenon flashlamps.” http://www.xenoncorp.com/lamps.html, 2013.
138 Bibliography for Chapter 0
[0.11] U. Kogelschatz, “Dielectric-barrier discharges: Their history, discharge physics,and industrial applications,” Plasma Chemistry and Plasma Processing, vol. 23,no. 1, pp. 1–46, 2003.
[0.12] M. Lomaev, E. Sosnin, and V. Tarasenko, “Excilamps and their applications,”Progress in Quantum Electronics, vol. 36, pp. 51–97, Jan. 2012.
[0.13] P. G. WILKINSON and Y. TANAKA, “New xenon-light source for the vacuumultraviolet,” Journal of the Optical Society of America, vol. 45, pp. 344–349, May1955.
[0.14] Y. TANAKA, “Continuous emission spectra of rare gases in the vacuum ultravioletregion,” Journal of the Optical Society of America, vol. 45, pp. 710–713, Sept. 1955.
[0.15] B. Stevens and E. Hutton, “Radiative life-time of the pyrene dimer and the possi-ble role of excited dimers in energy transfer processes,” Nature, vol. 186, pp. 1045–1046, June 1960.
[0.16] W. C. Ermler, Y. S. Lee, K. S. Pitzer, and N. W. Winter, “Ab initio effectivecore potentials including relativistic effects. II. potential energy curves for xe2,”The Journal of Chemical Physics, vol. 69, pp. 976–983, Aug. 1978.
[0.17] R. J. DeYoung and W. R. Weaver, “Spectra from nuclear-excited plasmas,” Jour-nal of the Optical Society of America, vol. 70, pp. 500–506, May 1980.
[0.18] J. B. Birks, “Excimers,” Reports on Progress in Physics, vol. 38, p. 903, Aug.1975.
[0.19] B. Eliasson and U. Kogelschatz, “UV excimer radiation from dielectric-barrierdischarges,” Applied Physics B Photophysics and Laser Chemistry, vol. 46, pp. 299–303, Aug. 1988.
[0.20] J.-Y. Zhang and I. W. Boyd, “Efficient excimer ultraviolet sources from a dielectricbarrier discharge in rare-gas/halogen mixtures,” Journal of Applied Physics, vol. 80,no. 2, p. 633, 1996.
[0.21] E. A. Sosnin, M. I. Lomaev, A. N. Panchenko, V. S. Skakun, and V. F. Tarasenko,“Glow and barrier discharge efficient excilamps,” in Proc. SPIE (V. F. Tarasenko,G. V. Mayer, and G. G. Petrash, eds.), vol. 3403, pp. 308–313, June 1998.
[0.22] V. Tarasenko, M. Lomaev, A. Panchenko, V. Skakun, E. Sosnin, and A. Fedenev,“High-energy lasers and high-power excilamps,” in , Summaries of papers presentedat the Conference on Lasers and Electro-Optics, 1996. CLEO ’96, pp. 375–, 1996.
[0.23] B. Eliasson and U. Kogelschatz, “Modeling and applications of silent dischargeplasmas,” IEEE Transactions on Plasma Science, vol. 19, pp. 309–323, Apr. 1991.
Power supplies for the study and efficient use of DBD excimer UV lamps David Flórez
Bibliography for Chapter 0 139
[0.24] B. Turner and J. T. Dolan, “Excimer lamp with high pressure fill,” Nov. 1997.U.S. Classification: 313/570; 313/568; 313/571; 313/572; 315/39; 315/246; 315/248;315/344 International Classification: H01J 6112; H01J 6120.
[0.25] Zoran Falkenstein, USHIO America Inc., “Development of an excimer UV lightsource system for water treatment.” http://www.revistavirtualpro.com/files/TIE04_200701.pdf.
[0.26] V. F. Tarasenko, A. V. Krivonosenko, M. I. Lomaev, V. S. Skakun, E. A. Sosnin,and D. V. Shitz, “High-power excilamps with short-pulse duration,” in Proc. SPIE,vol. 4065, pp. 826–835, 2000.
[0.27] R. Diez-Medina, Alimentation de puissance d’une lampe exciplexe à déchargeà barrière diélectrique, en vue du contrôle du rayonnement. PhD thesis, INPT,Toulouse, 2008.
[0.28] A. Laroussi, F. C. Dobbs, Z. Wei, A. Doblin, L. Ball, K. Moreira, F. Dyer, andJ. Richardson, “Effects of excimer UV radiation on microorganisms,” in PulsedPower Plasma Science, 2001. IEEE Conference Record - Abstracts, pp. 321–, 2001.
[0.29] M. I. Lomaev, V. S. Skakun, E. A. Sosnin, V. F. Tarasenko, D. V. Shitts, andM. V. Erofeev, “Excilamps efficient sources of spontaneous UV and VUV radiation,”Physics-Uspekhi, vol. 46, pp. 193–209, Feb. 2003.
[0.30] Thomas Openlander, “Mercury-free sources of VUV/UV radiation: applicationof modern excimer lamps (excilamps) for water and air treatment1,” Journal ofEnvironmental Engineering and Science, vol. 6, pp. 253–264, May 2007.
David Flórez Power supplies for the study and efficient use of DBD excimer UV lamps
Bibliography for Chapter 1
[1.1] R. Hippler, H. Kersten, M. Schmidt, and K. H. Schoenbach, eds., Low TemperaturePlasmas: Fundamentals, Technologies and Techniques. Wiley-VCH, 2 ed., Mar.2008.
[1.2] Hartnett, James, Transport Phenomena in Plasma. Academic Press, Oct. 2007.
[1.3] X. Bonnin, H. Piquet, N. Naude, C. Bouzidi, N. Gherardi, and J.-M. Blaquiere,“Design of a current converter to maximize the power into homogeneous dielectricbarrier discharge (DBD) devices,” The European Physical Journal Applied Physics,July 2013.
[1.4] M. I. Lomaev, V. S. Skakun, E. A. Sosnin, V. F. Tarasenko, D. V. Shitts, andM. V. Erofeev, “Excilamps efficient sources of spontaneous UV and VUV radiation,”Physics-Uspekhi, vol. 46, pp. 193–209, Feb. 2003.
[1.5] H. Piquet, S. Bhosle, R. Diez, M. Cousineau, M. Djibrillah, D. Le Thanh, A. N.Dagang, and G. Zissis, “Control of the UV flux of a XeCl dielectric barrier dischargeexcilamp through its current variation,” Quantum Electronics, vol. 42, pp. 157–164,Feb. 2012.
[1.6] R. Diez, H. Piquet, M. Cousineau, and S. Bhosle, “Current-mode power converterfor radiation control in DBD excimer lamps,” IEEE Transactions on IndustrialElectronics, vol. 59, no. 4, pp. 1912–1919, 2012.
[1.7] H. Piquet, S. Bhosle, R. Diez, and M. V. Erofeev, “Pulsed current-mode supplyof dielectric barrier discharge excilamps for the control of the radiated ultravioletpower,” IEEE Transactions on Plasma Science, vol. 38, pp. 2531–2538, Oct. 2010.
[1.8] R. Diez, H. Piquet, and S. Bhosle, “Control of the UV emission of an excimer lampby means of a current-mode power supply,” in Industrial Electronics, 2009. IECON’09. 35th Annual Conference of IEEE, pp. 3500–3505, IEEE, Nov. 2009.
[1.9] J. P. Verboncoeur, “Particle simulation of plasmas: review and advances,” PlasmaPhysics and Controlled Fusion, vol. 47, p. A231, May 2005.
[1.10] A. Oda, Y. Sakai, H. Akashi, and H. Sugawara, “One-dimensional modelling oflow-frequency and high-pressure xe barrier discharges for the design of excimerlamps,” Journal of Physics D: Applied Physics, vol. 32, p. 2726, Nov. 1999.
Bibliography for Chapter 1 141
[1.11] S. Bhosle, G. Zissis, J.-J. Damelincourt, A. Capdevila, K. Gupta, F. Dawson, andV. Tarasenko, “Implementation of an efficiency indicator in an electrical modeling ofa dielectric barrier discharge lamp,” in Conference Record of the 2006 IEEE IndustryApplications Conference, 2006. 41st IAS Annual Meeting, vol. 4, pp. 1784–1790,2006.
[1.12] L. T. Doanh, S. Bhosle, G. Zissis, and H. Piquet, “Estimation of the light out-put power and efficiency of a XeCl dielectric barrier discharge exciplex lamp usingone-dimensional drift-diffusion model for various voltage waveforms,” IEEE Trans-actions on Industry Applications, vol. 49, no. 1, pp. 331–340, 2013.
[1.13] S. Bhosle, G. Zissis, J. Damelincourt, A. Capdevila, K. Gupta, F. Dawson, andV. Tarasenko, “Electrical modeling of an homogeneous dielectric barrier discharge(DBD),” in Fourtieth IAS Annual Meeting. Conference Record of the 2005, vol. 4,pp. 2315–2319, IEEE, Oct. 2005.
[1.14] R. Díez, J.-P. Salanne, H. Piquet, S. Bhosle, and G. Zissis, “Predictive model of aDBD lamp for power supply design and method for the automatic identification ofits parameters,” The European Physical Journal - Applied Physics, vol. 37, no. 03,pp. 307–313, 2007.
[1.15] A. El-Deib, Modeling of and Driver Design for a Dielectric Barrier DischargeLamp. Thesis, University of Toronto, Aug. 2010. PhD.
[1.16] A. Flores-Fuentes, R. Pena-Eguiluz, R. Lopez-Callejas, A. Mercado-Cabrera,R. Valencia-Alvarado, S. Barocio-Delgado, and A. de la Piedad-Beneitez, “Elec-trical model of an atmospheric pressure dielectric barrier discharge cell,” IEEETransactions on Plasma Science, vol. 37, pp. 128–134, Jan. 2009.
[1.17] M. A. Djibrillah, Éléments de conception d’un générateur électrique pourl’alimentation d’un dispositif à décharge à barrière diélectrique (DBD). INPT, Apr.2011.
[1.18] U. Kogelschatz, “Dielectric-barrier discharges: Their history, discharge physics,and industrial applications,” Plasma Chemistry and Plasma Processing, vol. 23,no. 1, pp. 1–46, 2003.
[1.19] T. C. Manley, “The electric characteristics of the ozonator discharge,” Transac-tions of The Electrochemical Society, vol. 84, pp. 83–96, Oct. 1943.
[1.20] W. Sowa and R. Lecheler, “Lamp driver concepts for dielectric barrier dischargelamps and evaluation of a 110 w ballast,” in Industry Applications Conference, 2004.39th IAS Annual Meeting. Conference Record of the 2004 IEEE, vol. 2, pp. 1379–1385, IEEE, 2004.
[1.21] R. Diez-Medina, Alimentation de puissance d’une lampe exciplexe à déchargeà barrière diélectrique, en vue du contrôle du rayonnement. PhD thesis, INPT,Toulouse, 2008.
David Flórez Power supplies for the study and efficient use of DBD excimer UV lamps
142 Bibliography for Chapter 1
[1.22] R. Diez, H. Piquet, S. Bhosle, J.-M. Blaquiere, and N. Roux, “Design of a currentconverter for the study of the UV emission in DBD excilamps,” in IEEE Interna-tional Symposium on Industrial Electronics, 2008. ISIE 2008, pp. 62–67, 2008.
[1.23] H.-P. Daub, Ein adaptives Impuls-EVG zum Betrieb von dielektrisch behindertenGasentladungslampen. PhD thesis, KIT Scientific Publishing, Karlsruhe, 2010.
[1.24] A. El-Deib, F. Dawson, G. van Eerden, S. Bhosle, G. Zissis, and T. D. Le, “Anal-ysis and experimental validation of a new current-controlled driver for a dielectricbarrier discharge lamp,” IEEE Transactions on Industry Applications, vol. 47, no. 4,pp. 1971–1982, 2011.
[1.25] M. Cousineau, R. Diez, H. Piquet, and O. Durrieu, “Synthesized high-frequencythyristor for dielectric barrier discharge excimer lamps,” IEEE Transactions onIndustrial Electronics, vol. 59, no. 4, pp. 1920–1928, 2012.
[1.26] M. Meisser, R. Kling, and W. Heering, “Universal resonant topology for highfrequency pulsed operation of dielectric barrier discharge light sources,” in 2011Twenty-Sixth Annual IEEE Applied Power Electronics Conference and Exposition(APEC), pp. 1180–1187, 2011.
[1.27] M. Meißer, Resonant Behaviour of Pulse Generators for the Efficient Drive ofOptical Radiation Sources Based on Dielectric Barrier Discharges. PhD thesis,KIT Scientific Publishing, Karlsruhe, 2013.
[1.28] A. El-Deib, F. Dawson, and G. Zissis, “Transformer-less current controlled driverfor a dielectric barrier discharge lamp using HV silicon carbide (SiC) switchingdevices,” in Energy Conversion Congress and Exposition (ECCE), 2011 IEEE,pp. 1124–1131, IEEE, Sept. 2011.
[1.29] W.-S. Lee, K.-W. Chu, C.-F. Huang, L.-S. Lee, M.-J. Tsai, K.-Y. Lee, and F. Zhao,“Design and fabrication of 4h-sic lateral high-voltage devices on a semi-insulatingsubstrate,” IEEE Transactions on Electron Devices, vol. 59, no. 3, pp. 754–760,2012.
[1.30] A. Bolotnikov, P. Losee, K. Matocha, J. Glaser, J. Nasadoski, L. Wang, A. Elasser,S. Arthur, Z. Stum, P. Sandvik, Y. Sui, T. Johnson, J. Sabate, and L. Stevanovic,“3.3kV SiC MOSFETs designed for low on-resistance and fast switching,” in 201224th International Symposium on Power Semiconductor Devices and ICs (ISPSD),pp. 389–392, 2012.
[1.31] J. Alonso, C. Ordiz, M. Dalla-Costa, J. Ribas, and J. Cardesin, “High voltagepower supply for ozone generation based on piezoelectric transformer,” in Confer-ence Record of the 2007 IEEE Industry Applications Conference, 2007. 42nd IASAnnual Meeting, pp. 1901–1908, 2007.
Power supplies for the study and efficient use of DBD excimer UV lamps David Flórez
Bibliography for Chapter 1 143
[1.32] M. I. Lomaev, V. S. Skakun, V. F. Tarasenko, and D. V. Shitts, “Excilamps basedon xenon dimers excited by a barrier discharge,” Journal of Optical Technology,vol. 79, no. 8, pp. 498–502, 2012.
[1.33] V. F. Tarasenko, A. V. Krivonosenko, M. I. Lomaev, V. S. Skakun, E. A. Sosnin,and D. V. Shitz, “High-power excilamps with short-pulse duration,” in Proc. SPIE,vol. 4065, pp. 826–835, 2000.
[1.34] M. Lomaev, E. Sosnin, and V. Tarasenko, “Excilamps and their applications,”Progress in Quantum Electronics, vol. 36, pp. 51–97, Jan. 2012.
[1.35] M. I. Lomaev, E. A. Sosnin, V. F. Tarasenko, D. V. Shits, V. S. Skakun, M. V.Erofeev, and A. A. Lisenko, “Capacitive and barrier discharge excilamps and theirapplications (review),” Instruments and Experimental Techniques, vol. 49, pp. 595–616, Oct. 2006.
[1.36] A. Shams Taleghani, A. Shadaram, and M. Mirzaei, “Effects of duty cycles ofthe plasma actuators on improvement of pressure distribution above a NLF0414airfoil,” IEEE Transactions on Plasma Science, vol. 40, pp. 1434–1440, May 2012.
[1.37] S. Zhang, W. Wang, L. Jia, Z. Liu, Y. Yang, and L. Dai, “Rotational, vibrational,and excitation temperatures in bipolar nanosecond-pulsed diffuse dielectric-barrier-discharge plasma at atmospheric pressure,” IEEE Transactions on Plasma Science,vol. 41, pp. 350–354, Feb. 2013.
[1.38] T. Kuroki, T. Oishi, T. Yamamoto, and M. Okubo, “Bromomethane decompo-sition using a pulsed dielectric barrier discharge,” IEEE Transactions on IndustryApplications, vol. 49, pp. 293–297, Jan. 2013.
[1.39] S. Kalisiak, M. Holub, and T. Jakubowski, “Resonant inverter with output volt-age pulse-phase-shift control for DBD plasma reactor supply,” in 13th EuropeanConference on Power Electronics and Applications, 2009. EPE ’09, pp. 1–9, 2009.
[1.40] Zoran Falkenstein, USHIO America Inc., “Development of an excimer UV lightsource system for water treatment.” http://www.revistavirtualpro.com/files/TIE04_200701.pdf.
[1.41] Z. Falkenstein, “Dielectric barrier discharge-driven (V)UV light source for fluidtreatment,” July 2002.
[1.42] Heraeus Noblelight LLC., “High power excimer UV system.” http://www.heraeus-noblelight.com/media/webmedia_local/media/pdf/uv/UVP16E_high_power_excimer_system.pdf.
[1.43] Heraeus Noblelight LLC., “Ultraviolet light for water treatment.”http://www.heraeus-noblelight.com/media/webmedia_local/media/pdf/uv/UVP06_EN_Wasser.pdf.
David Flórez Power supplies for the study and efficient use of DBD excimer UV lamps
144 Bibliography for Chapter 1
[1.44] OSRAM GmbH, “Xeradex excimer lamps.” http://www.osram.com/osram_com/applications/industrial-applications/ozone-production/index.jsp.
[1.45] A. Voronov, “Mercury free UV-light sources based on excimer lamps,” in 17th In-ternational Conference on Gas Discharges and Their Applications, 2008. GD 2008,pp. 501–504, 2008.
[1.46] I. Soloshenko, V. Y. Bazhenov, V. A. Khomich, V. V. Tsiolko, and N. G.Potapchenko, “Comparative research of efficiency of water decontamination by UVradiation of cold hollow cathode discharge plasma versus that of low- and medium-pressure mercury lamps,” IEEE Transactions on Plasma Science, vol. 34, no. 4,pp. 1365–1369, 2006.
[1.47] WOLFGANG HEERING, “UV SOURCES – basics, properties and applications,”IUVA NEWS, vol. 6, pp. 7–13, Dec. 2004.
[1.48] S. Schalk, V. Adam, E. Arnold, K. Brieden, A. Voronov, and H. D. Witzke,“UV-lamps for disinfection and advanced oxidation–Lamp types, technologies andapplications,” IUVA news, vol. 8, no. 1, p. 32–37, 2006.
[1.49] Quark Technology Co. Ltd., “Products information - excimer VUV lamp.” http://www.quark-tec.com/english/product/5.html.
[1.50] USHIO Inc., “Excimer lamps and excimer irradiation unit.” http://www.ushio.co.jp/en/products/list/lamp/lamp_10.html.
[1.51] Resonance Ltd., “REX4 excimer lamp.” http://www.resonance.on.ca/rex4.htm.
Power supplies for the study and efficient use of DBD excimer UV lamps David Flórez
Bibliography for Chapter 2[2.1] D. Flórez, R. Díez, A. Hay, G. Perilla, F. Ruiz, and H. Piquet, “Programmable
current converter synthesis for the evaluation of UV radiation of excimer lamps,”in 2010 IEEE ANDESCON, pp. 1–6, 2010.
[2.2] D. Florez, R. Diez, K. Hay, and H. Piquet, “DBD excimer lamp power supplywith fully controlled operating conditions,” in 2012 13th International Conferenceon Optimization of Electrical and Electronic Equipment (OPTIM), pp. 1346–1352,2012.
[2.3] H. Piquet, S. Bhosle, R. Diez, M. Cousineau, M. Djibrillah, D. Le Thanh, A. N.Dagang, and G. Zissis, “Control of the UV flux of a XeCl dielectric barrier dischargeexcilamp through its current variation,” Quantum Electronics, vol. 42, pp. 157–164,Feb. 2012.
[2.4] R. Diez, H. Piquet, M. Cousineau, and S. Bhosle, “Current-mode power converterfor radiation control in DBD excimer lamps,” IEEE Transactions on IndustrialElectronics, vol. 59, no. 4, pp. 1912–1919, 2012.
[2.5] R. W. Erickson and D. Maksimovic, Fundamentals of Power Electronics. Springer,Jan. 2001.
[2.6] J. M. Alonso, C. Ordiz, D. Gacio, J. Ribas, and A. J. Calleja, “Closed-loop reg-ulated power supply for ozone generation based on buck converter and current-fedpush-pull resonant inverter,” Sept. 2009.
[2.7] F. Diaz, F. Azcondo, C. Brañas, R. Casanueva, and R. Zane, “Digitally controlledlow-frequency square-wave electronic ballast with resonant ignition and power loop,”IEEE Transactions on Industry Applications, vol. 46, no. 6, pp. 2222–2232, 2010.
[2.8] A. V. Stankovic, L. Nerone, and P. Kulkarni, “Modified synchronous-buck con-verter for a dimmable HID electronic ballast,” IEEE Transactions on IndustrialElectronics, vol. 59, pp. 1815–1824, Apr. 2012.
[2.9] A. L. Kirsten, M. A. Dalla Costa, C. Rech, R. N. do Prado, and T. B. Marchesan,“Digital control strategy for HID lamp electronic ballasts,” IEEE Transactions onIndustrial Electronics, vol. 60, pp. 608–618, Feb. 2013.
[2.10] M. Cousineau, R. Diez, H. Piquet, and O. Durrieu, “Synthesized high-frequencythyristor for dielectric barrier discharge excimer lamps,” IEEE Transactions onIndustrial Electronics, vol. 59, no. 4, pp. 1920–1928, 2012.
146 Bibliography for Chapter 2
[2.11] X. Bonnin, H. Piquet, N. Naude, C. Bouzidi, N. Gherardi, and J.-M. Blaquiere,“Design of a current converter to maximize the power into homogeneous dielectricbarrier discharge (DBD) devices,” The European Physical Journal Applied Physics,July 2013.
[2.12] D. Gacio, J. Alonso, A. Calleja, J. Garcia, and M. Rico-Secades, “A universal-input single-stag2e high-power-factor power supply for HB-LEDs based on in-tegrated buck-flyback converter,” IEEE Transactions on Industrial Electronics,vol. 58, no. 2, pp. 589–599, 2011.
[2.13] R. Díez, J.-P. Salanne, H. Piquet, S. Bhosle, and G. Zissis, “Predictive model of aDBD lamp for power supply design and method for the automatic identification ofits parameters,” The European Physical Journal - Applied Physics, vol. 37, no. 03,pp. 307–313, 2007.
[2.14] M. I. Lomaev, V. S. Skakun, E. A. Sosnin, V. F. Tarasenko, D. V. Shitts, andM. V. Erofeev, “Excilamps efficient sources of spontaneous UV and VUV radiation,”Physics-Uspekhi, vol. 46, pp. 193–209, Feb. 2003.
[2.15] A. El-Deib, F. Dawson, G. van Eerden, S. Bhosle, G. Zissis, and T. D. Le, “Anal-ysis and experimental validation of a new current-controlled driver for a dielectricbarrier discharge lamp,” IEEE Transactions on Industry Applications, vol. 47, no. 4,pp. 1971–1982, 2011.
[2.16] T. C. Manley, “The electric characteristics of the ozonator discharge,” Transac-tions of The Electrochemical Society, vol. 84, pp. 83–96, Oct. 1943.
[2.17] R. Diez-Medina, Alimentation de puissance d’une lampe exciplexe à déchargeà barrière diélectrique, en vue du contrôle du rayonnement. PhD thesis, INPT,Toulouse, 2008.
[2.18] M. A. Djibrillah, Éléments de conception d’un générateur électrique pourl’alimentation d’un dispositif à décharge à barrière diélectrique (DBD). INPT, Apr.2011.
[2.19] X. Bonnin, H. Piquet, D. Florez, R. Diez, and X. Bonnin, “Designing the highvoltage transformer of power supplies for dbd: windings arrangment to reduce theparasitic capacitive effects,” in Power Electronics and Applications (EPE), 201315th European Conference on, Sept. 2013.
[2.20] D. Florez, X. Bonnin, H. Piquet, and R. Diez, “Impact of the transformer inthe current mode supply of dielectric barrier discharge excimer lamps,” (BrazilianPower Electronics Conference (COBEP 2013), Gramaos, Brasil), Oct. 2013.
[2.21] L. Dalessandro, F. da Silveira Cavalcante, and J. W. Kolar, “Self-capacitanceof high-voltage transformers,” IEEE Transactions on Power Electronics, vol. 22,pp. 2081–2092, Sept. 2007.
Power supplies for the study and efficient use of DBD excimer UV lamps David Flórez
Bibliography for Chapter 2 147
[2.22] F. Blache, J. P. Keradec, and B. Cogitore, “Stray capacitances of two wind-ing transformers: equivalent circuit, measurements, calculation and lowering,” in ,Conference Record of the 1994 IEEE Industry Applications Society Annual Meeting,1994, pp. 1211–1217 vol.2, 1994.
[2.23] J. Biela and J. Kolar, “Using transformer parasitics for resonant converters -a review of the calculation of the stray capacitance of transformers,” in IndustryApplications Conference, 2005. Fourtieth IAS Annual Meeting. Conference Recordof the 2005, vol. 3, pp. 1868–1875 Vol. 3, 2005.
David Flórez Power supplies for the study and efficient use of DBD excimer UV lamps
Bibliography for Chapter 3[3.1] Haruaki Akashi, Akinori Odam, and Yosuke Sakai, “Effect of gas heating on ex-
cimer distribution in DBD xe excimer lamp,” in 28th ICPIG Conference Records,(Prague, Czech Republic), July 2007.
[3.2] F. Marchal, N. Sewraj, G. Jabbour, P. R. Akerreta, and G. Ledru, “Temperaturedependence of xenon excimer formations using two-photon absorption laser-inducedfluorescence,” Journal of Physics B: Atomic, Molecular and Optical Physics, vol. 43,p. 235210, Dec. 2010.
[3.3] R. J. Carman and R. P. Mildren, “Computer modelling of a short-pulse exciteddielectric barrier discharge xenon excimer lamp ( 172 nm),” Journal of Physics D:Applied Physics, vol. 36, pp. 19–33, Jan. 2003.
[3.4] M. I. Lomaev, V. S. Skakun, V. F. Tarasenko, and D. V. Shitts, “Excilamps basedon xenon dimers excited by a barrier discharge,” Journal of Optical Technology,vol. 79, no. 8, pp. 498–502, 2012.
[3.5] S. Bhosle, G. Zissis, J.-J. Damelincourt, A. Capdevila, K. Gupta, F. Dawson, andV. Tarasenko, “Implementation of an efficiency indicator in an electrical modeling ofa dielectric barrier discharge lamp,” in Conference Record of the 2006 IEEE IndustryApplications Conference, 2006. 41st IAS Annual Meeting, vol. 4, pp. 1784–1790,2006.
[3.6] A. Lopez, H. Piquet, D. Patino, R. Diez, and X. Bonnin, “Parameters identificationand gas behavior characterization of DBD systems,” IEEE Transactions on PlasmaScience, vol. 41, no. 8, pp. 2335–2342, 2013.
[3.7] Hartnett, James, Transport Phenomena in Plasma. Academic Press, Oct. 2007.
[3.8] U. Kogelschatz, “Dielectric-barrier discharges: Their history, discharge physics, andindustrial applications,” Plasma Chemistry and Plasma Processing, vol. 23, no. 1,pp. 1–46, 2003.
[3.9] M. I. Lomaev, V. S. Skakun, E. A. Sosnin, V. F. Tarasenko, D. V. Shitts, andM. V. Erofeev, “Excilamps efficient sources of spontaneous UV and VUV radiation,”Physics-Uspekhi, vol. 46, pp. 193–209, Feb. 2003.
[3.10] A. M. Razhev and A. A. Zhupikov, “Influence of the specific pump power onthe output energy and efficiency of a 223-nm gas-discharge-pumped excimer KrCllaser,” Quantum Electronics, vol. 38, p. 1005, Nov. 2008.
Bibliography for Chapter 3 149
[3.11] A. M. Boichenko, “The effect of the excitation power on the emission efficiency ofbarrier- and glow-discharge pumped exciplex and excimer lamps,” Laser Physics,vol. 14, no. 8, pp. 1036–1044, 2004.
David Flórez Power supplies for the study and efficient use of DBD excimer UV lamps
Bibliography for Chapter 4[4.1] R. Diez, H. Piquet, and S. Bhosle, “Control of the UV emission of an excimer lamp
by means of a current-mode power supply,” in Industrial Electronics, 2009. IECON’09. 35th Annual Conference of IEEE, pp. 3500–3505, IEEE, Nov. 2009.
[4.2] H. Piquet, S. Bhosle, R. Diez, and M. V. Erofeev, “Pulsed current-mode supplyof dielectric barrier discharge excilamps for the control of the radiated ultravioletpower,” IEEE Transactions on Plasma Science, vol. 38, pp. 2531–2538, Oct. 2010.
[4.3] Y. Chéron, C. Goodman, and T. Meynard, Soft commutation. London [u.a.: Chap-man & Hall, 1992.
[4.4] R. Casanueva, F. J. Azcondo, and S. Bracho, “Series–parallel resonant converterfor an EDM power supply,” Journal of Materials Processing Technology, vol. 149,pp. 172–177, June 2004.
[4.5] R. Casanueva, F. Azcondo, and C. Brañas, “Output current sensitivity analysisof the resonant inverter: Current-source design criteria,” IEEE Transactions onIndustrial Electronics, vol. 54, no. 3, pp. 1560–1568, 2007.
[4.6] R. Oruganti and F. Lee, “Resonant power processors, part I—State plane analysis,”IEEE Transactions on Industry Applications, vol. IA-21, no. 6, pp. 1453–1460, 1985.
[4.7] T. C. Manley, “The electric characteristics of the ozonator discharge,” Transactionsof The Electrochemical Society, vol. 84, pp. 83–96, Oct. 1943.
[4.8] M. Cousineau, R. Diez, H. Piquet, and O. Durrieu, “Synthesized high-frequencythyristor for dielectric barrier discharge excimer lamps,” IEEE Transactions onIndustrial Electronics, vol. 59, no. 4, pp. 1920–1928, 2012.
[4.9] X. Bonnin, H. Piquet, D. Florez, R. Diez, and X. Bonnin, “Designing the highvoltage transformer of power supplies for dbd: windings arrangment to reduce theparasitic capacitive effects,” in Power Electronics and Applications (EPE), 201315th European Conference on, Sept. 2013.
[4.10] Wheeler, H.A., “Simple inductance formulas for radio coils,” in Proc. I.R.E,vol. 16, p. 1398, Oct. 1928.
Bibliography for Chapter 5[5.1] R. Diez, H. Piquet, S. Bhosle, and J.-M. Blaquiere, “Current mode converter for
dielectric barrier discharge lamp,” in IEEE Power Electronics Specialists Conference,2008. PESC 2008, pp. 2485–2491, 2008.
[5.2] H. Piquet, S. Bhosle, R. Diez, and M. V. Erofeev, “Pulsed current-mode supplyof dielectric barrier discharge excilamps for the control of the radiated ultravioletpower,” IEEE Transactions on Plasma Science, vol. 38, pp. 2531–2538, Oct. 2010.
[5.3] R. Diez, H. Piquet, M. Cousineau, and S. Bhosle, “Current-mode power converterfor radiation control in DBD excimer lamps,” IEEE Transactions on Industrial Elec-tronics, vol. 59, no. 4, pp. 1912–1919, 2012.
[5.4] R. Diez, H. Piquet, S. Bhosle, J.-M. Blaquiere, and N. Roux, “Design of a currentconverter for the study of the UV emission in DBD excilamps,” in IEEE InternationalSymposium on Industrial Electronics, 2008. ISIE 2008, pp. 62–67, 2008.


A. Appendix. Résumé de la Thèse enFrançais
Table des matières
Introduction 1
1 Contrôle Paramétrique de la Puissance Électrique d’une Excilamp DBD 51.1 Contrôle de la Puissance Avec Trois Dégrées de Liberté . . . . . . . . . . 5
1.1.1 Fonctionnement de l’Onduleur de Courant . . . . . . . . . . . . . . 51.1.2 Source de Courant Continue . . . . . . . . . . . . . . . . . . . . . . 7
1.2 Considérations Relatives à la Mise en œuvre . . . . . . . . . . . . . . . . . 81.3 Sélection des Composants . . . . . . . . . . . . . . . . . . . . . . . . . . . 101.4 Résultats de l’Implémentation . . . . . . . . . . . . . . . . . . . . . . . . . 111.5 Conclusions . . . . . . . . . . . . . . . . . . . . . . . . . . . . . . . . . . . 14
2 Étude Paramétrique de l’Impact du Point de Fonctionnement sur le rendementde l’Excilamp DBD 172.1 Conditions de Mesure . . . . . . . . . . . . . . . . . . . . . . . . . . . . . 172.2 Impact de l’Intensité du Courant . . . . . . . . . . . . . . . . . . . . . . . 172.3 Impact de la Fréquence d’Opération . . . . . . . . . . . . . . . . . . . . . 202.4 Point Optimal de Fonctionnement . . . . . . . . . . . . . . . . . . . . . . 212.5 Conclusions . . . . . . . . . . . . . . . . . . . . . . . . . . . . . . . . . . . 24
3 Générateur Électrique à Haut Rendement pour l’Alimentation de la DBD auPoint d’Opération Optimal 263.1 Topologie . . . . . . . . . . . . . . . . . . . . . . . . . . . . . . . . . . . . 263.2 Sélection des Composants et Simulations . . . . . . . . . . . . . . . . . . . 283.3 Résultats Expérimentaux . . . . . . . . . . . . . . . . . . . . . . . . . . . 313.4 Comparaison Avec des Autres Topologies . . . . . . . . . . . . . . . . . . 333.5 Conclusions . . . . . . . . . . . . . . . . . . . . . . . . . . . . . . . . . . . 35
4 Conclusions 37

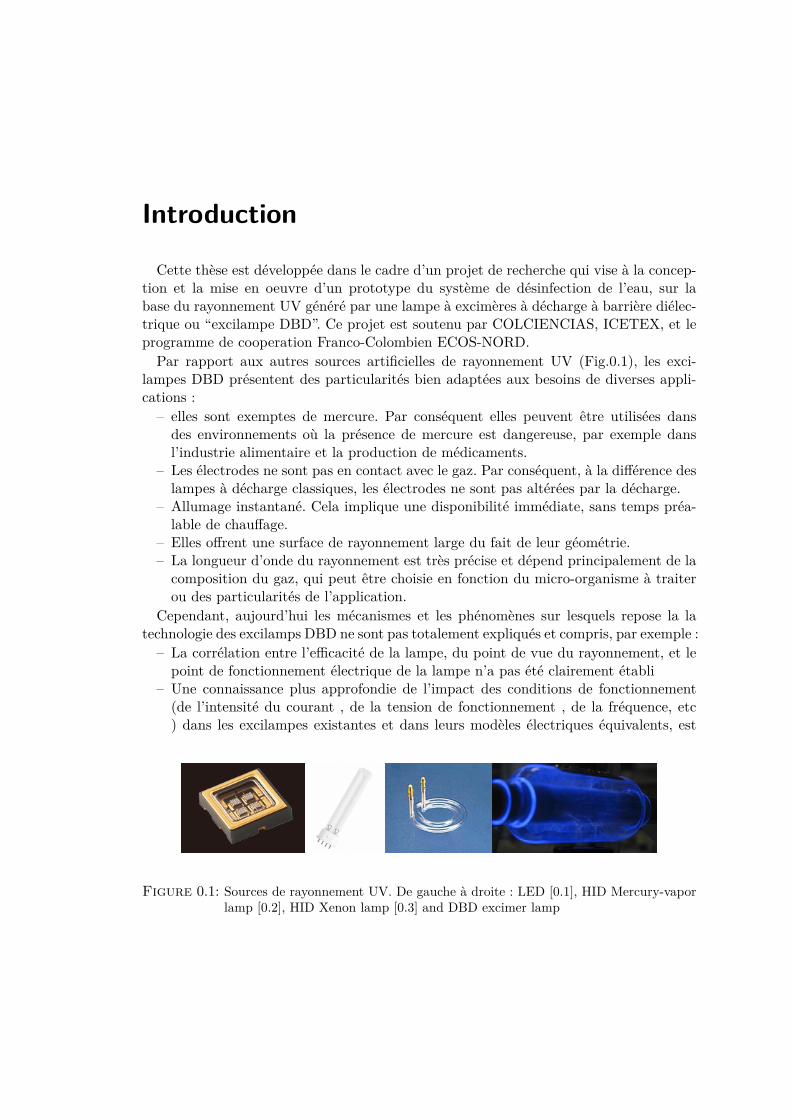
Introduction
Cette thèse est développée dans le cadre d’un projet de recherche qui vise à la concep-tion et la mise en oeuvre d’un prototype du système de désinfection de l’eau, sur labase du rayonnement UV généré par une lampe à excimères à décharge à barrière diélec-trique ou “excilampe DBD”. Ce projet est soutenu par COLCIENCIAS, ICETEX, et leprogramme de cooperation Franco-Colombien ECOS-NORD.Par rapport aux autres sources artificielles de rayonnement UV (Fig.0.1), les exci-
lampes DBD présentent des particularités bien adaptées aux besoins de diverses appli-cations :– elles sont exemptes de mercure. Par conséquent elles peuvent être utilisées dansdes environnements où la présence de mercure est dangereuse, par exemple dansl’industrie alimentaire et la production de médicaments.
– Les électrodes ne sont pas en contact avec le gaz. Par conséquent, à la différence deslampes à décharge classiques, les électrodes ne sont pas altérées par la décharge.
– Allumage instantané. Cela implique une disponibilité immédiate, sans temps préa-lable de chauffage.
– Elles offrent une surface de rayonnement large du fait de leur géométrie.– La longueur d’onde du rayonnement est très précise et dépend principalement de lacomposition du gaz, qui peut être choisie en fonction du micro-organisme à traiterou des particularités de l’application.
Cependant, aujourd’hui les mécanismes et les phénomènes sur lesquels repose la latechnologie des excilamps DBD ne sont pas totalement expliqués et compris, par exemple :– La corrélation entre l’efficacité de la lampe, du point de vue du rayonnement, et lepoint de fonctionnement électrique de la lampe n’a pas été clairement établi
– Une connaissance plus approfondie de l’impact des conditions de fonctionnement(de l’intensité du courant , de la tension de fonctionnement , de la fréquence, etc) dans les excilampes existantes et dans leurs modèles électriques équivalents, est
Figure 0.1: Sources de rayonnement UV. De gauche à droite : LED [0.1], HID Mercury-vaporlamp [0.2], HID Xenon lamp [0.3] and DBD excimer lamp
2 Introduction
nécessaire.– L’efficacité des alimentations DBD peut être améliorée grâce à l’optimisation dubloc d’alimentation qui produit la puissance fournie à la lampe et l’optimisation dupoint de fonctionnement, tenant compte des caractéristiques des excilampes DBDet des composants parasites des éléments du système.
On peut attendre de progrès effectués dans ces directions les avantages suivants :– Plus de rayonnement UV pourrait être obtenu avec moins d’énergie électrique, cequi est particulièrement important pour les applications de décontamination envisa-gées, car ceci faciliterait la connexion à une source d’énergie renouvelable de faiblepuissance.
– La puissance de la lampe UV par unité de surface pourrait être augmentée, ce quiréduirait la taille de la lampe DBD à excimère.
– Un modèle équivalent de la lampe plus adapté pourrait être mis au point pour uneconception plus fiable du système et des alimentations plus efficaces.
– cette démarche pourrait aider á une meilleure compréhension des mécanismes physico-chimiques des excimères.
Objectives Dans le contexte du projet de recherche et sur la base des idées exposéesplus haut concernant la technologie des excilampes à DBD, cette thèse de doctorat estorientée en vue de l’amélioration de la performance des excilampes à DBD en tant quesource UV, à travers l’étude des performances intrinsèques de la lampe, des interactionsalimentation-lampe et le développement d’une nouvelle alimentation à haute efficacité.Dans ce sens, les objectifs proposés sont les suivants :– Le développement d’une alimentation électrique adaptée à la lampe excimère UV,capable de contrôler la puissance de la lampe et le point de fonctionnement au moyende trois degrés de liberté caractéristiques du courant de la lampe : la fréquence defonctionnement, l’amplitude et le rapport cyclique.
– la détermination du point de fonctionnement optimal de la lampe, en adoptant lepoint de vue de la conversion de l’énergie électrique à la puissance de rayonnementUV,.
– Le développement, la mise en œuvre et la validation d’une alimentation destinée àmaintenir le système au point optimal de fonctionnement de la lampe, et à maximiserla performance de l’offre vis-à-vis : - de l’efficacité électrique. - du couplage auréseau électrique ou à une source d’énergie renouvelable (photovoltaïque, micro-hydroélectrique).
Power supplies for the study and efficient use of DBD excimer UV lamps David Flórez
Bibliographie[0.1] NICHIA CORPORATION, “UV-LED.” http://www.nichia.co.jp/en/product/
uvled.html, 2013.[0.2] OSRAM GmbH, “PURITEC HNS germicidal ultraviolet lamps.” http://www.
osram.com/osram_com/products/lamps/specialty-lamps/ultraviolet-lamps/puritec-hns/index.jsp?productId=ZMP_86446.
[0.3] Xenon corporation, “About xenon flashlamps.” http://www.xenoncorp.com/lamps.html, 2013.

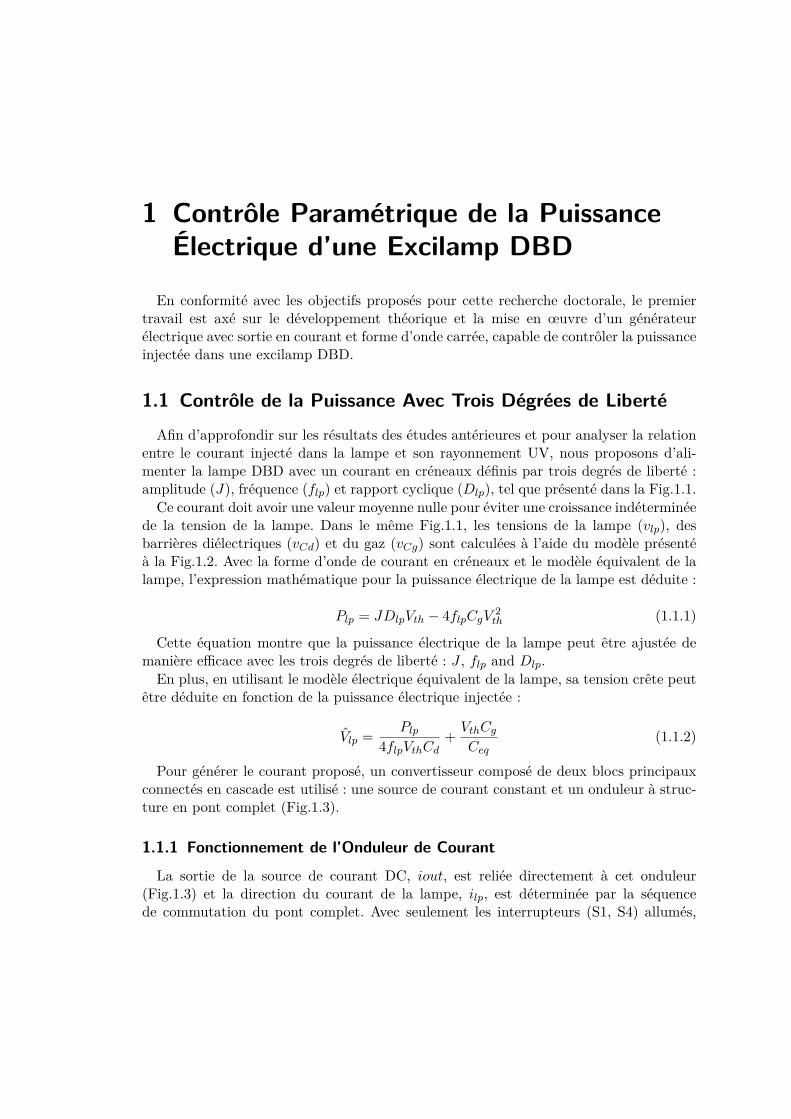
1 Contrôle Paramétrique de la PuissanceÉlectrique d’une Excilamp DBD
En conformité avec les objectifs proposés pour cette recherche doctorale, le premiertravail est axé sur le développement théorique et la mise en œuvre d’un générateurélectrique avec sortie en courant et forme d’onde carrée, capable de contrôler la puissanceinjectée dans une excilamp DBD.
1.1 Contrôle de la Puissance Avec Trois Dégrées de LibertéAfin d’approfondir sur les résultats des études antérieures et pour analyser la relation
entre le courant injecté dans la lampe et son rayonnement UV, nous proposons d’ali-menter la lampe DBD avec un courant en créneaux définis par trois degrés de liberté :amplitude (J), fréquence (flp) et rapport cyclique (Dlp), tel que présenté dans la Fig.1.1.Ce courant doit avoir une valeur moyenne nulle pour éviter une croissance indéterminée
de la tension de la lampe. Dans le même Fig.1.1, les tensions de la lampe (vlp), desbarrières diélectriques (vCd) et du gaz (vCg) sont calculées à l’aide du modèle présentéà la Fig.1.2. Avec la forme d’onde de courant en créneaux et le modèle équivalent de lalampe, l’expression mathématique pour la puissance électrique de la lampe est déduite :
Plp = JDlpVth − 4flpCgV2
th (1.1.1)
Cette équation montre que la puissance électrique de la lampe peut être ajustée demanière efficace avec les trois degrés de liberté : J , flp and Dlp.En plus, en utilisant le modèle électrique équivalent de la lampe, sa tension crête peut
être déduite en fonction de la puissance électrique injectée :
Vlp = Plp
4flpVthCd+ VthCg
Ceq(1.1.2)
Pour générer le courant proposé, un convertisseur composé de deux blocs principauxconnectés en cascade est utilisé : une source de courant constant et un onduleur à struc-ture en pont complet (Fig.1.3).
1.1.1 Fonctionnement de l’Onduleur de CourantLa sortie de la source de courant DC, iout, est reliée directement à cet onduleur
(Fig.1.3) et la direction du courant de la lampe, ilp, est déterminée par la séquencede commutation du pont complet. Avec seulement les interrupteurs (S1, S4) allumés,
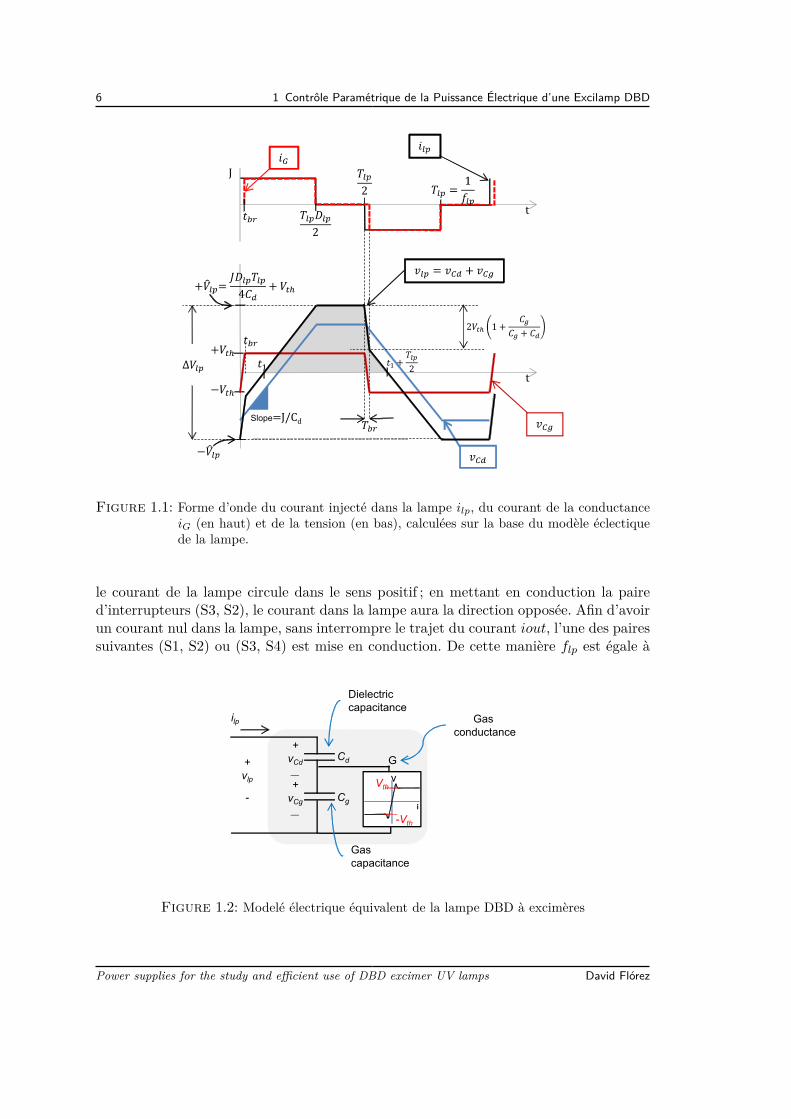
6 1 Contrôle Paramétrique de la Puissance Électrique d’une Excilamp DBD
t
Slope=J/Cd
t
J
Figure 1.1: Forme d’onde du courant injecté dans la lampe ilp, du courant de la conductanceiG (en haut) et de la tension (en bas), calculées sur la base du modèle éclectiquede la lampe.
le courant de la lampe circule dans le sens positif ; en mettant en conduction la paired’interrupteurs (S3, S2), le courant dans la lampe aura la direction opposée. Afin d’avoirun courant nul dans la lampe, sans interrompre le trajet du courant iout, l’une des pairessuivantes (S1, S2) ou (S3, S4) est mise en conduction. De cette manière flp est égale à
Cg
Cd+vlp
-
Dielectriccapacitance
Gas capacitance
ilp Gas conductance
+vCg__
+vCd__
i
-Vth
Vthv
G
Figure 1.2: Modelé électrique équivalent de la lampe DBD à excimères
Power supplies for the study and efficient use of DBD excimer UV lamps David Flórez
1.1 Contrôle de la Puissance Avec Trois Dégrées de Liberté 7
(S1, S4) ON
(S1, S2) ON
(S3, S2) ON
(S3, S4) ON
(S1, S4) ON
vin
K1
L + v
brid
ge
-
ilp
S1
S4
S3
S2
+ vlp -
+-
DBD
iout→
+v
K1 -
iK1 →
i K2→
+v K
2-
+v
S1 -
+v
S2 -
iS1 →
iS2 →
K1 K2
K2
iK1 →
i K2→
+ v
con
trol
-
t
ilp
Figure 1.3: Topologie du générateur pour DBD, construit sur la base de l’hacheur à deuxquadrants
la fréquence de fonctionnement du pont.À partir de l’analyse des conditions de commutation, on déduit que les interrupteurs
ont un amorçage commandé sous tension positive et un blocage spontanée à l’annulationde leur courant. Ces propriétés définissent un dispositif du type thyristor comme décriten [1.1]. Pour mettre en œuvre ce type d’interrupteur, un dispositif MOSFET en sérieavec une diode est utilisé.
1.1.2 Source de Courant Continue
En considérant que la tension aux bornes de sortie de la source de courant, vbridge,est une tension bipolaire, une configuration pratique pour mettre en œuvre la source decourant continu est la topologie du hacheur de deux-quadrants [1.2] (Fig.1.3).Une charge de type DBD présente des transitions rapides de haute tension. Pour cette
raison, et à cause de sa robustesse bien connue et de sa réponse rapide, la loi de contrôlepar hystérésis est un bon choix pour mettre en œuvre le contrôleur de la source decourant continue.Compte tenu que la fréquence de fonctionnement typique des excilampes est de l’ordre
de centaines de kHz, si fc est définie supérieur à flp ceci impliquerait l’utilisation dedispositifs à commutation à des fréquences de l’ordre du MHz causant des pertes parcommutation élevées. En conséquence, le fonctionnement de la commande à hystérésisest choisi tel que fc < flp.La valeur minimale de L, afin d’obtenir une valeur de fc toujours inférieure à la
fréquence maximale souhaitée du contrôleur hystérésis, fcmax est donnée par :
David Flórez Power supplies for the study and efficient use of DBD excimer UV lamps
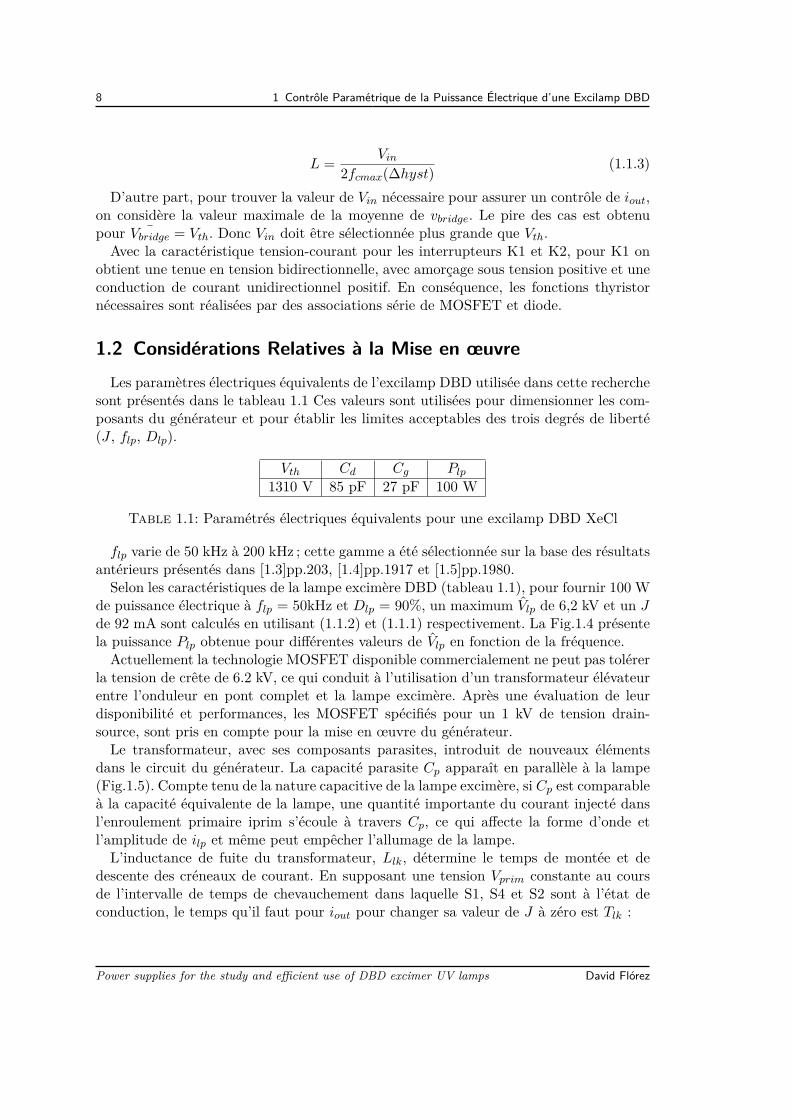
8 1 Contrôle Paramétrique de la Puissance Électrique d’une Excilamp DBD
L = Vin
2fcmax(∆hyst) (1.1.3)
D’autre part, pour trouver la valeur de Vin nécessaire pour assurer un contrôle de iout,on considère la valeur maximale de la moyenne de vbridge. Le pire des cas est obtenupour ¯Vbridge = Vth. Donc Vin doit être sélectionnée plus grande que Vth.Avec la caractéristique tension-courant pour les interrupteurs K1 et K2, pour K1 on
obtient une tenue en tension bidirectionnelle, avec amorçage sous tension positive et uneconduction de courant unidirectionnel positif. En conséquence, les fonctions thyristornécessaires sont réalisées par des associations série de MOSFET et diode.
1.2 Considérations Relatives à la Mise en œuvreLes paramètres électriques équivalents de l’excilamp DBD utilisée dans cette recherche
sont présentés dans le tableau 1.1 Ces valeurs sont utilisées pour dimensionner les com-posants du générateur et pour établir les limites acceptables des trois degrés de liberté(J , flp, Dlp).
Vth Cd Cg Plp
1310 V 85 pF 27 pF 100 W
Table 1.1: Paramétrés électriques équivalents pour une excilamp DBD XeCl
flp varie de 50 kHz à 200 kHz ; cette gamme a été sélectionnée sur la base des résultatsantérieurs présentés dans [1.3]pp.203, [1.4]pp.1917 et [1.5]pp.1980.Selon les caractéristiques de la lampe excimère DBD (tableau 1.1), pour fournir 100 W
de puissance électrique à flp = 50kHz et Dlp = 90%, un maximum Vlp de 6,2 kV et un Jde 92 mA sont calculés en utilisant (1.1.2) et (1.1.1) respectivement. La Fig.1.4 présentela puissance Plp obtenue pour différentes valeurs de Vlp en fonction de la fréquence.Actuellement la technologie MOSFET disponible commercialement ne peut pas tolérer
la tension de crête de 6.2 kV, ce qui conduit à l’utilisation d’un transformateur élévateurentre l’onduleur en pont complet et la lampe excimère. Après une évaluation de leurdisponibilité et performances, les MOSFET spécifiés pour un 1 kV de tension drain-source, sont pris en compte pour la mise en œuvre du générateur.Le transformateur, avec ses composants parasites, introduit de nouveaux éléments
dans le circuit du générateur. La capacité parasite Cp apparaît en parallèle à la lampe(Fig.1.5). Compte tenu de la nature capacitive de la lampe excimère, si Cp est comparableà la capacité équivalente de la lampe, une quantité importante du courant injecté dansl’enroulement primaire iprim s’écoule à travers Cp, ce qui affecte la forme d’onde etl’amplitude de ilp et même peut empêcher l’allumage de la lampe.L’inductance de fuite du transformateur, Llk, détermine le temps de montée et de
descente des créneaux de courant. En supposant une tension Vprim constante au coursde l’intervalle de temps de chevauchement dans laquelle S1, S4 et S2 sont à l’état deconduction, le temps qu’il faut pour iout pour changer sa valeur de J à zéro est Tlk :
Power supplies for the study and efficient use of DBD excimer UV lamps David Flórez
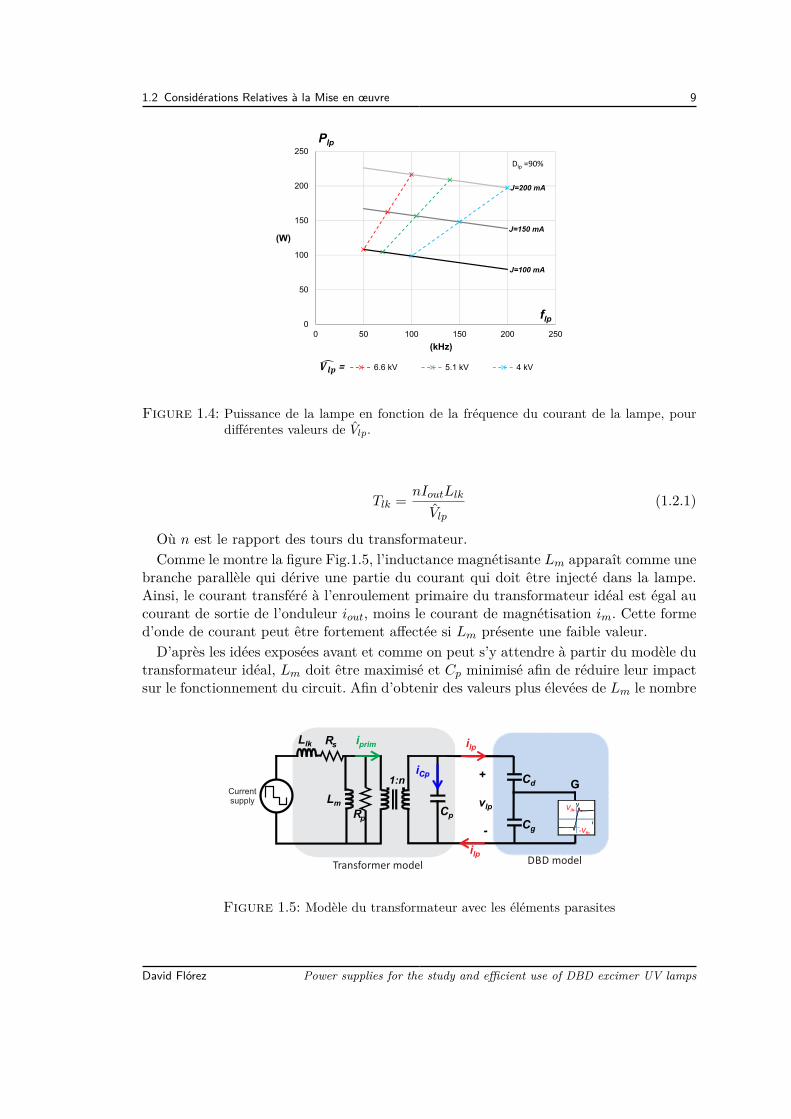
1.2 Considérations Relatives à la Mise en œuvre 9
0
50
100
150
200
250
0 50 100 150 200 250
Plp
(W)
(kHz)
6.6 kV 5.1 kV 4 kV
Dlp =90%
=
J=100 mA
J=150 mA
J=200 mA
flp
Figure 1.4: Puissance de la lampe en fonction de la fréquence du courant de la lampe, pourdifférentes valeurs de Vlp.
Tlk = nIoutLlk
Vlp
(1.2.1)
Où n est le rapport des tours du transformateur.Comme le montre la figure Fig.1.5, l’inductance magnétisante Lm apparaît comme une
branche parallèle qui dérive une partie du courant qui doit être injecté dans la lampe.Ainsi, le courant transféré à l’enroulement primaire du transformateur idéal est égal aucourant de sortie de l’onduleur iout, moins le courant de magnétisation im. Cette formed’onde de courant peut être fortement affectée si Lm présente une faible valeur.D’après les idées exposées avant et comme on peut s’y attendre à partir du modèle du
transformateur idéal, Lm doit être maximisé et Cp minimisé afin de réduire leur impactsur le fonctionnement du circuit. Afin d’obtenir des valeurs plus élevées de Lm le nombre
G. .1:n
Cp
iprim ilp
+
vlp
-
ilp
iCp
Cg
Cd
i
-Vth
Vthv
Llk
Lm
DBD modelTransformer model
Current supply
Rs
Rp
Figure 1.5: Modèle du transformateur avec les éléments parasites
David Flórez Power supplies for the study and efficient use of DBD excimer UV lamps
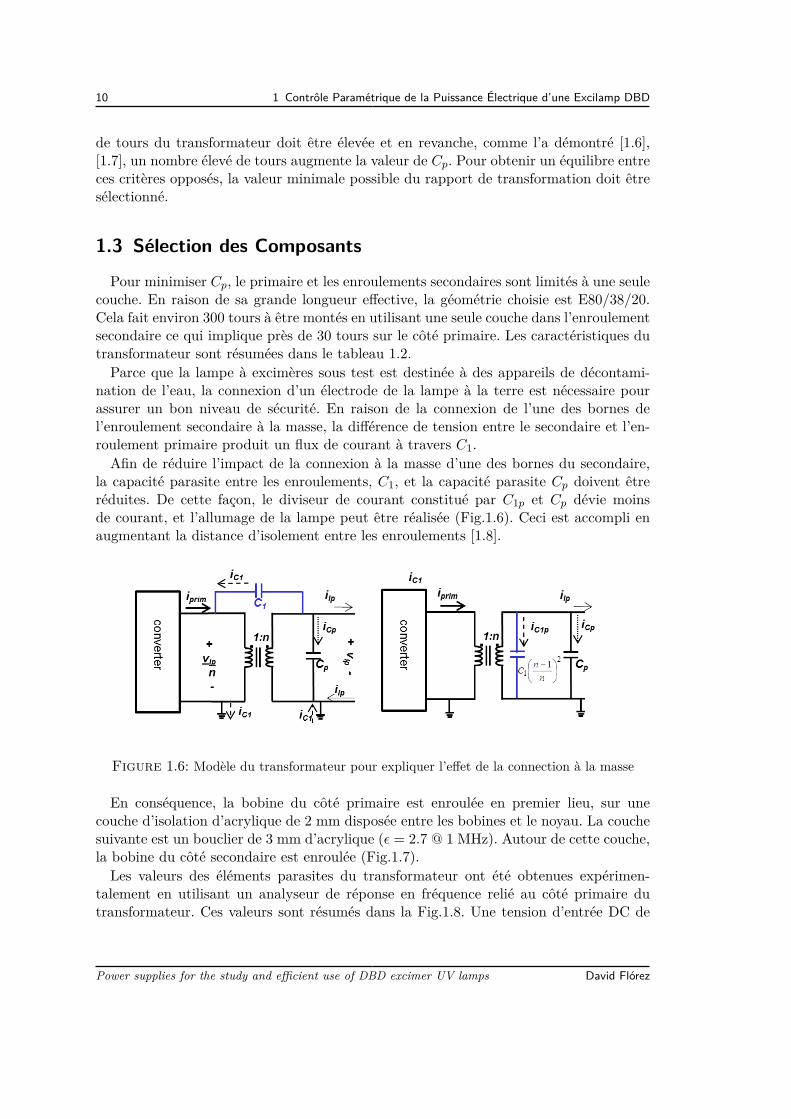
10 1 Contrôle Paramétrique de la Puissance Électrique d’une Excilamp DBD
de tours du transformateur doit être élevée et en revanche, comme l’a démontré [1.6],[1.7], un nombre élevé de tours augmente la valeur de Cp. Pour obtenir un équilibre entreces critères opposés, la valeur minimale possible du rapport de transformation doit êtresélectionné.
1.3 Sélection des ComposantsPour minimiser Cp, le primaire et les enroulements secondaires sont limités à une seule
couche. En raison de sa grande longueur effective, la géométrie choisie est E80/38/20.Cela fait environ 300 tours à être montés en utilisant une seule couche dans l’enroulementsecondaire ce qui implique près de 30 tours sur le côté primaire. Les caractéristiques dutransformateur sont résumées dans le tableau 1.2.Parce que la lampe à excimères sous test est destinée à des appareils de décontami-
nation de l’eau, la connexion d’un électrode de la lampe à la terre est nécessaire pourassurer un bon niveau de sécurité. En raison de la connexion de l’une des bornes del’enroulement secondaire à la masse, la différence de tension entre le secondaire et l’en-roulement primaire produit un flux de courant à travers C1.Afin de réduire l’impact de la connexion à la masse d’une des bornes du secondaire,
la capacité parasite entre les enroulements, C1, et la capacité parasite Cp doivent êtreréduites. De cette façon, le diviseur de courant constitué par C1p et Cp dévie moinsde courant, et l’allumage de la lampe peut être réalisée (Fig.1.6). Ceci est accompli enaugmentant la distance d’isolement entre les enroulements [1.8].
Figure 1.6: Modèle du transformateur pour expliquer l’effet de la connection à la masse
En conséquence, la bobine du côté primaire est enroulée en premier lieu, sur unecouche d’isolation d’acrylique de 2 mm disposée entre les bobines et le noyau. La couchesuivante est un bouclier de 3 mm d’acrylique (ε = 2.7 @ 1 MHz). Autour de cette couche,la bobine du côté secondaire est enroulée (Fig.1.7).Les valeurs des éléments parasites du transformateur ont été obtenues expérimen-
talement en utilisant un analyseur de réponse en fréquence relié au côté primaire dutransformateur. Ces valeurs sont résumés dans la Fig.1.8. Une tension d’entrée DC de
Power supplies for the study and efficient use of DBD excimer UV lamps David Flórez
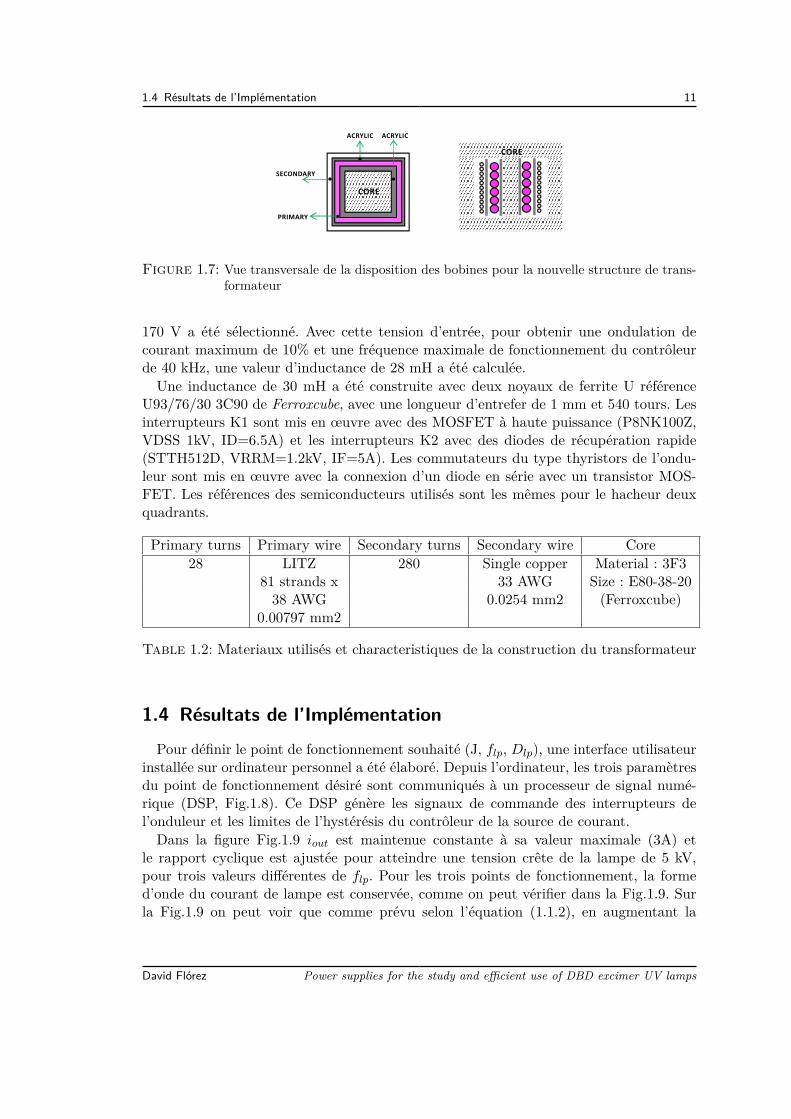
1.4 Résultats de l’Implémentation 11
CORE
ACRYLIC
SECONDARY
ACRYLIC
PRIMARY
CORE
Figure 1.7: Vue transversale de la disposition des bobines pour la nouvelle structure de trans-formateur
170 V a été sélectionné. Avec cette tension d’entrée, pour obtenir une ondulation decourant maximum de 10% et une fréquence maximale de fonctionnement du contrôleurde 40 kHz, une valeur d’inductance de 28 mH a été calculée.Une inductance de 30 mH a été construite avec deux noyaux de ferrite U référence
U93/76/30 3C90 de Ferroxcube, avec une longueur d’entrefer de 1 mm et 540 tours. Lesinterrupteurs K1 sont mis en œuvre avec des MOSFET à haute puissance (P8NK100Z,VDSS 1kV, ID=6.5A) et les interrupteurs K2 avec des diodes de récupération rapide(STTH512D, VRRM=1.2kV, IF=5A). Les commutateurs du type thyristors de l’ondu-leur sont mis en œuvre avec la connexion d’un diode en série avec un transistor MOS-FET. Les références des semiconducteurs utilisés sont les mêmes pour le hacheur deuxquadrants.
Primary turns Primary wire Secondary turns Secondary wire Core28 LITZ 280 Single copper Material : 3F3
81 strands x 33 AWG Size : E80-38-2038 AWG 0.0254 mm2 (Ferroxcube)
0.00797 mm2
Table 1.2: Materiaux utilisés et characteristiques de la construction du transformateur
1.4 Résultats de l’ImplémentationPour définir le point de fonctionnement souhaité (J, flp, Dlp), une interface utilisateur
installée sur ordinateur personnel a été élaboré. Depuis l’ordinateur, les trois paramètresdu point de fonctionnement désiré sont communiqués à un processeur de signal numé-rique (DSP, Fig.1.8). Ce DSP génère les signaux de commande des interrupteurs del’onduleur et les limites de l’hystérésis du contrôleur de la source de courant.Dans la figure Fig.1.9 iout est maintenue constante à sa valeur maximale (3A) et
le rapport cyclique est ajustée pour atteindre une tension crête de la lampe de 5 kV,pour trois valeurs différentes de flp. Pour les trois points de fonctionnement, la formed’onde du courant de lampe est conservée, comme on peut vérifier dans la Fig.1.9. Surla Fig.1.9 on peut voir que comme prévu selon l’équation (1.1.2), en augmentant la
David Flórez Power supplies for the study and efficient use of DBD excimer UV lamps
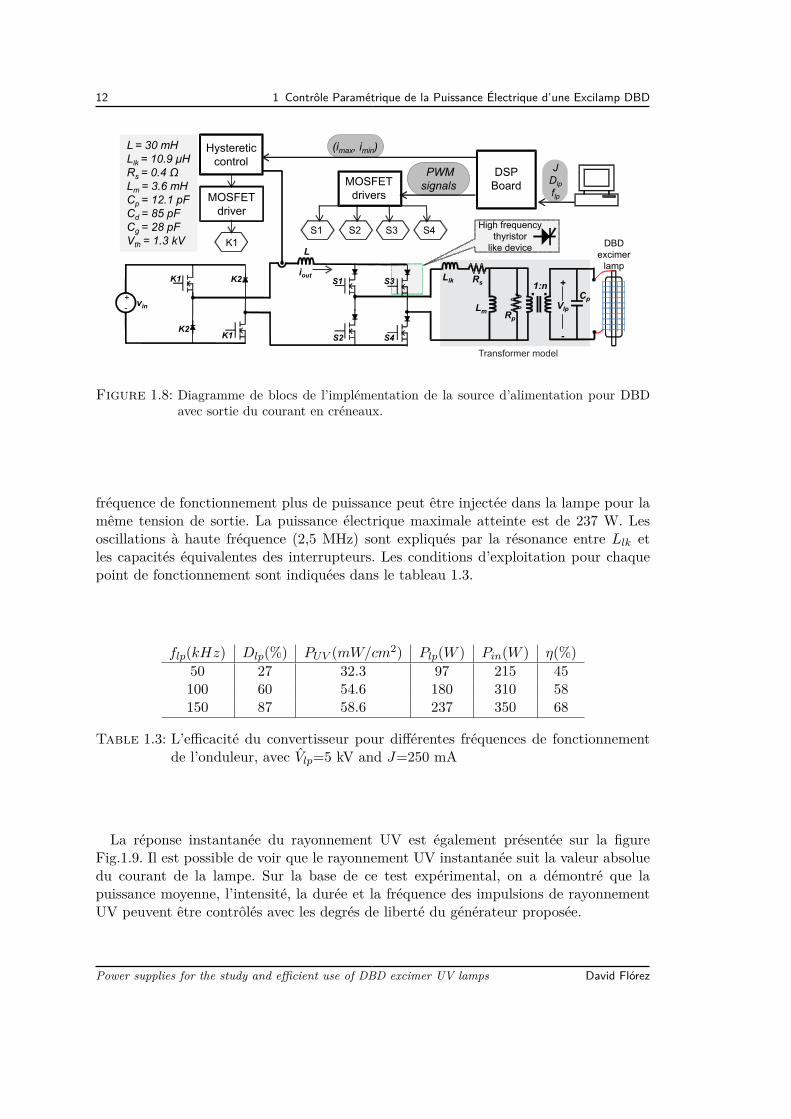
12 1 Contrôle Paramétrique de la Puissance Électrique d’une Excilamp DBD
PWM signals
. .
JDlp
flp
S3 S4S2S1
vin
L
S1
S4
S3
S2
+
Vlp
-
+-
iout1:n
Llk Rs
Lm
Cp
High frequency thyristor
like device
L = 30 mHLlk = 10.9 μHRs = 0.4 ΩLm = 3.6 mHCp = 12.1 pFCd = 85 pFCg = 28 pFVth = 1.3 kV
K1
K1
K2
K2
Hystereticcontrol
DSPBoardMOSFET
drivers
K1 DBD excimer
lamp
(imax, imin)
Rp
MOSFETdriver
Transformer model
Figure 1.8: Diagramme de blocs de l’implémentation de la source d’alimentation pour DBDavec sortie du courant en créneaux.
fréquence de fonctionnement plus de puissance peut être injectée dans la lampe pour lamême tension de sortie. La puissance électrique maximale atteinte est de 237 W. Lesoscillations à haute fréquence (2,5 MHz) sont expliqués par la résonance entre Llk etles capacités équivalentes des interrupteurs. Les conditions d’exploitation pour chaquepoint de fonctionnement sont indiquées dans le tableau 1.3.
flp(kHz) Dlp(%) PUV (mW/cm2) Plp(W ) Pin(W ) η(%)50 27 32.3 97 215 45100 60 54.6 180 310 58150 87 58.6 237 350 68
Table 1.3: L’efficacité du convertisseur pour différentes fréquences de fonctionnementde l’onduleur, avec Vlp=5 kV and J=250 mA
La réponse instantanée du rayonnement UV est également présentée sur la figureFig.1.9. Il est possible de voir que le rayonnement UV instantanée suit la valeur absoluedu courant de la lampe. Sur la base de ce test expérimental, on a démontré que lapuissance moyenne, l’intensité, la durée et la fréquence des impulsions de rayonnementUV peuvent être contrôlés avec les degrés de liberté du générateur proposée.
Power supplies for the study and efficient use of DBD excimer UV lamps David Flórez
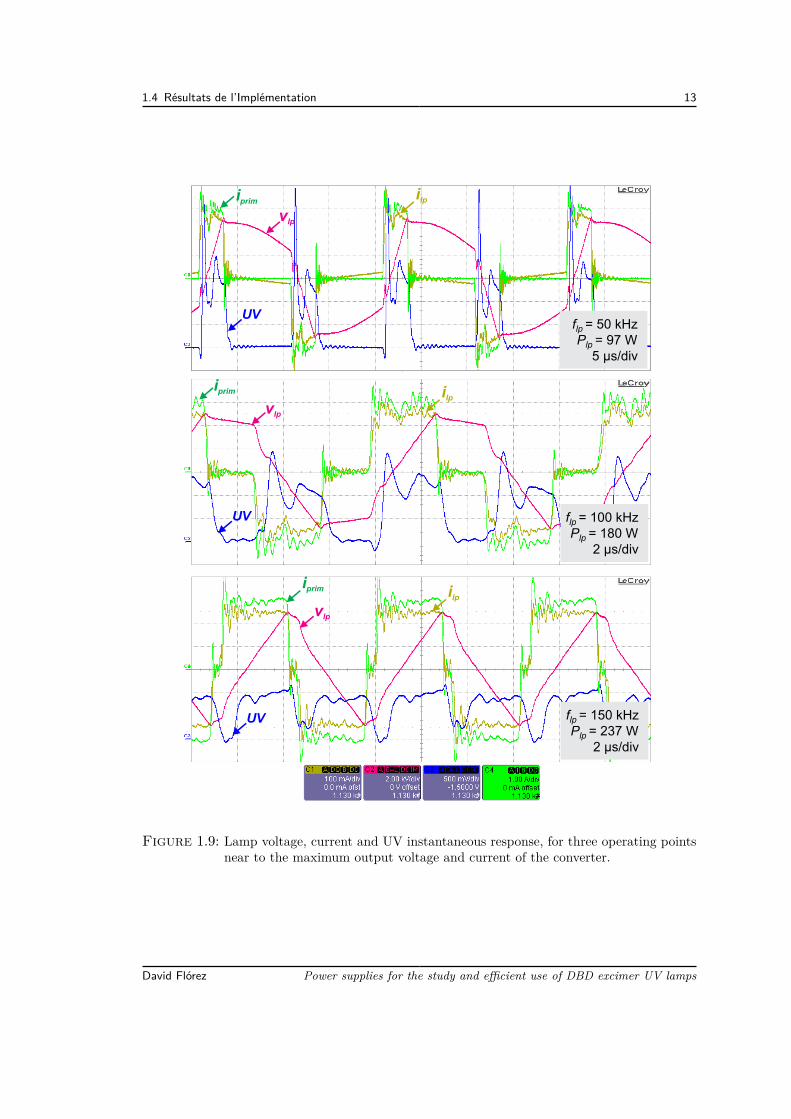
1.4 Résultats de l’Implémentation 13
flp = 50 kHzPlp = 97 W
5 µs/div
flp = 100 kHzPlp = 180 W
2 µs/div
flp = 150 kHzPlp = 237 W
2 µs/div
vlp
vlp
vlp
ilp
ilpiprim
iprim
iprim
UV
UV
UV
ilp
Figure 1.9: Lamp voltage, current and UV instantaneous response, for three operating pointsnear to the maximum output voltage and current of the converter.
David Flórez Power supplies for the study and efficient use of DBD excimer UV lamps
14 1 Contrôle Paramétrique de la Puissance Électrique d’une Excilamp DBD
1.5 ConclusionsAvec l’alimentation en mode courant proposée, la puissance électrique et le rayon-
nement UV d’une excilamp DBD peuvent être ajustés de manière efficace, en utilisantla commande du courant de la lampe à l’aide de trois degrés de liberté : Amplitude,fréquence et rapport cyclique.Grâce à l’utilisation de ce générateur, un procédé approprié pour étudier le rayonne-
ment UV des lampes DBD à excimères , est démontrée. Le test expérimental de fonc-tionnement de ce convertisseur, effectué avec un excilamp DBD XeCl, a montré que lemodèle de la lampe utilisée pour la conception convertisseur est approprié.
Power supplies for the study and efficient use of DBD excimer UV lamps David Flórez
Bibliographie[1.1] M. Cousineau, R. Diez, H. Piquet, and O. Durrieu, “Synthesized high-frequency
thyristor for dielectric barrier discharge excimer lamps,” IEEE Transactions on In-dustrial Electronics, vol. 59, no. 4, pp. 1920–1928, 2012.
[1.2] X. Bonnin, H. Piquet, N. Naude, C. Bouzidi, N. Gherardi, and J.-M. Blaquiere,“Design of a current converter to maximize the power into homogeneous dielectricbarrier discharge (DBD) devices,” The European Physical Journal Applied Physics,July 2013.
[1.3] M. I. Lomaev, V. S. Skakun, E. A. Sosnin, V. F. Tarasenko, D. V. Shitts, andM. V. Erofeev, “Excilamps efficient sources of spontaneous UV and VUV radiation,”Physics-Uspekhi, vol. 46, pp. 193–209, Feb. 2003.
[1.4] R. Diez, H. Piquet, M. Cousineau, and S. Bhosle, “Current-mode power conver-ter for radiation control in DBD excimer lamps,” IEEE Transactions on IndustrialElectronics, vol. 59, no. 4, pp. 1912–1919, 2012.
[1.5] A. El-Deib, F. Dawson, G. van Eerden, S. Bhosle, G. Zissis, and T. D. Le, “Ana-lysis and experimental validation of a new current-controlled driver for a dielectricbarrier discharge lamp,” IEEE Transactions on Industry Applications, vol. 47, no. 4,pp. 1971–1982, 2011.
[1.6] F. Blache, J. P. Keradec, and B. Cogitore, “Stray capacitances of two winding trans-formers : equivalent circuit, measurements, calculation and lowering,” in , Confe-rence Record of the 1994 IEEE Industry Applications Society Annual Meeting, 1994,pp. 1211–1217 vol.2, 1994.
[1.7] J. Biela and J. Kolar, “Using transformer parasitics for resonant converters - areview of the calculation of the stray capacitance of transformers,” in Industry Ap-plications Conference, 2005. Fourtieth IAS Annual Meeting. Conference Record ofthe 2005, vol. 3, pp. 1868–1875 Vol. 3, 2005.
[1.8] X. Bonnin, H. Piquet, D. Florez, R. Diez, and X. Bonnin, “Designing the highvoltage transformer of power supplies for dbd : windings arrangment to reduce theparasitic capacitive effects,” in Power Electronics and Applications (EPE), 2013 15thEuropean Conference on, Sept. 2013.

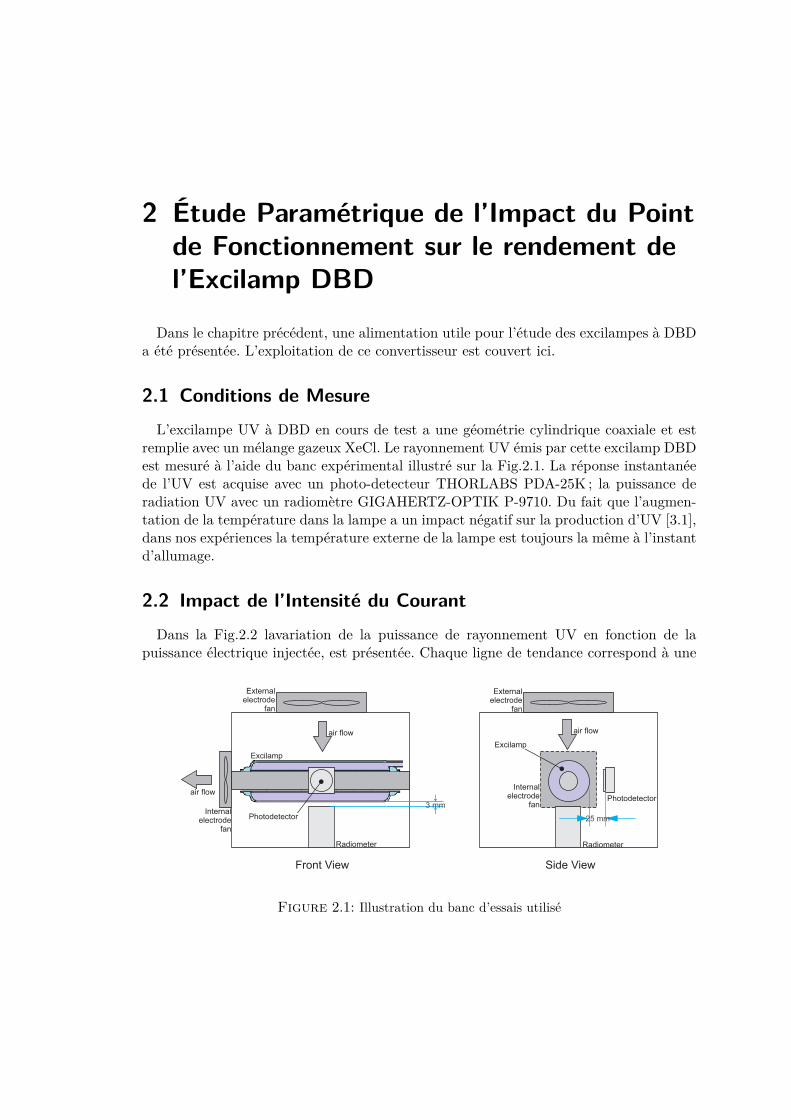
2 Étude Paramétrique de l’Impact du Pointde Fonctionnement sur le rendement del’Excilamp DBD
Dans le chapitre précédent, une alimentation utile pour l’étude des excilampes à DBDa été présentée. L’exploitation de ce convertisseur est couvert ici.
2.1 Conditions de MesureL’excilampe UV à DBD en cours de test a une géométrie cylindrique coaxiale et est
remplie avec un mélange gazeux XeCl. Le rayonnement UV émis par cette excilamp DBDest mesuré à l’aide du banc expérimental illustré sur la Fig.2.1. La réponse instantanéede l’UV est acquise avec un photo-detecteur THORLABS PDA-25K ; la puissance deradiation UV avec un radiomètre GIGAHERTZ-OPTIK P-9710. Du fait que l’augmen-tation de la température dans la lampe a un impact négatif sur la production d’UV [3.1],dans nos expériences la température externe de la lampe est toujours la même à l’instantd’allumage.
2.2 Impact de l’Intensité du CourantDans la Fig.2.2 lavariation de la puissance de rayonnement UV en fonction de la
puissance électrique injectée, est présentée. Chaque ligne de tendance correspond à une
air flow
air flow
Radiometer
External electrode
fan
Internal electrode
fan
25 mm
Photodetector
Radiometer
External electrode
fan
Internal electrode
fan
air flow
Front View Side View
Photodetector
Excilamp
Excilamp
3 mm
Figure 2.1: Illustration du banc d’essais utilisé
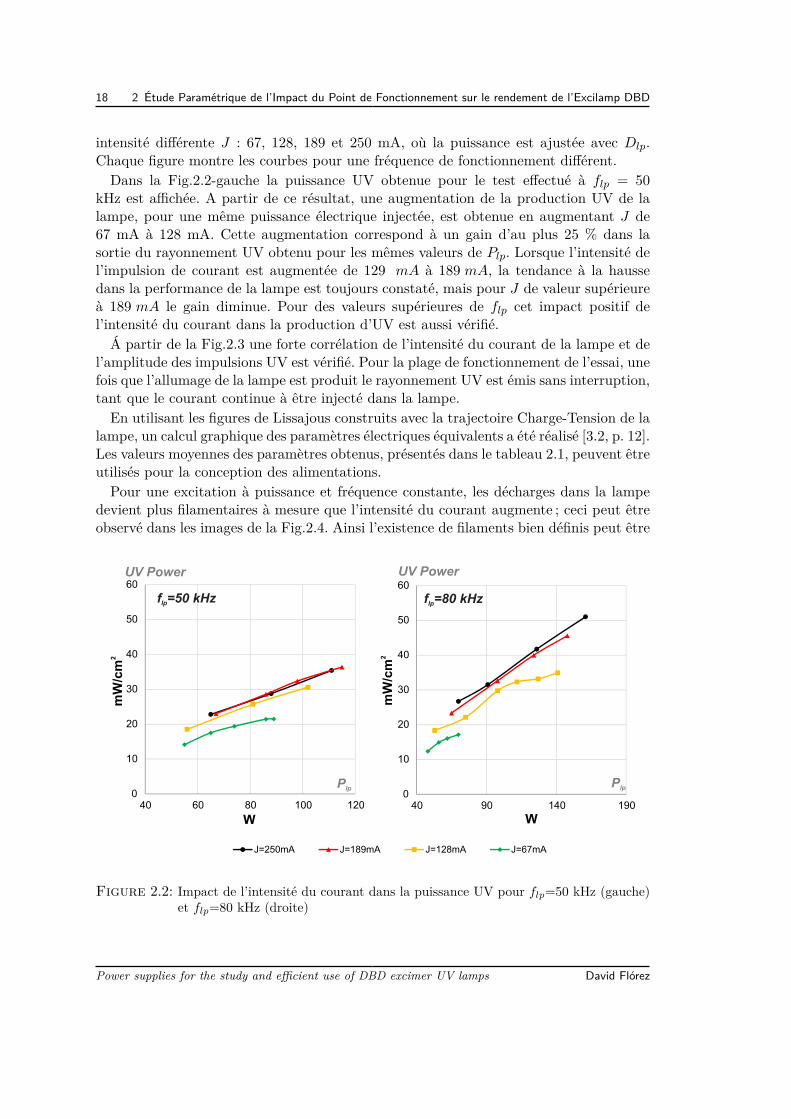
18 2 Étude Paramétrique de l’Impact du Point de Fonctionnement sur le rendement de l’Excilamp DBD
intensité différente J : 67, 128, 189 et 250 mA, où la puissance est ajustée avec Dlp.Chaque figure montre les courbes pour une fréquence de fonctionnement différent.Dans la Fig.2.2-gauche la puissance UV obtenue pour le test effectué à flp = 50
kHz est affichée. A partir de ce résultat, une augmentation de la production UV de lalampe, pour une même puissance électrique injectée, est obtenue en augmentant J de67 mA à 128 mA. Cette augmentation correspond à un gain d’au plus 25 % dans lasortie du rayonnement UV obtenu pour les mêmes valeurs de Plp. Lorsque l’intensité del’impulsion de courant est augmentée de 129 mA à 189 mA, la tendance à la haussedans la performance de la lampe est toujours constaté, mais pour J de valeur supérieureà 189 mA le gain diminue. Pour des valeurs supérieures de flp cet impact positif del’intensité du courant dans la production d’UV est aussi vérifié.Á partir de la Fig.2.3 une forte corrélation de l’intensité du courant de la lampe et de
l’amplitude des impulsions UV est vérifié. Pour la plage de fonctionnement de l’essai, unefois que l’allumage de la lampe est produit le rayonnement UV est émis sans interruption,tant que le courant continue à être injecté dans la lampe.En utilisant les figures de Lissajous construits avec la trajectoire Charge-Tension de la
lampe, un calcul graphique des paramètres électriques équivalents a été réalisé [3.2, p. 12].Les valeurs moyennes des paramètres obtenus, présentés dans le tableau 2.1, peuvent êtreutilisés pour la conception des alimentations.Pour une excitation à puissance et fréquence constante, les décharges dans la lampe
devient plus filamentaires à mesure que l’intensité du courant augmente ; ceci peut êtreobservé dans les images de la Fig.2.4. Ainsi l’existence de filaments bien définis peut être
0
10
20
30
40
50
60
40 90 140 190
J=250mA J=189mA J=128mA J=67mA
W
UV Power
2mW/cm
f =80 kHzlp
Plp0
10
20
30
40
50
60
40 60 80 100 120
f =50 kHzlp
W
UV Power
2mW/cm
Plp
Figure 2.2: Impact de l’intensité du courant dans la puissance UV pour flp=50 kHz (gauche)et flp=80 kHz (droite)
Power supplies for the study and efficient use of DBD excimer UV lamps David Flórez
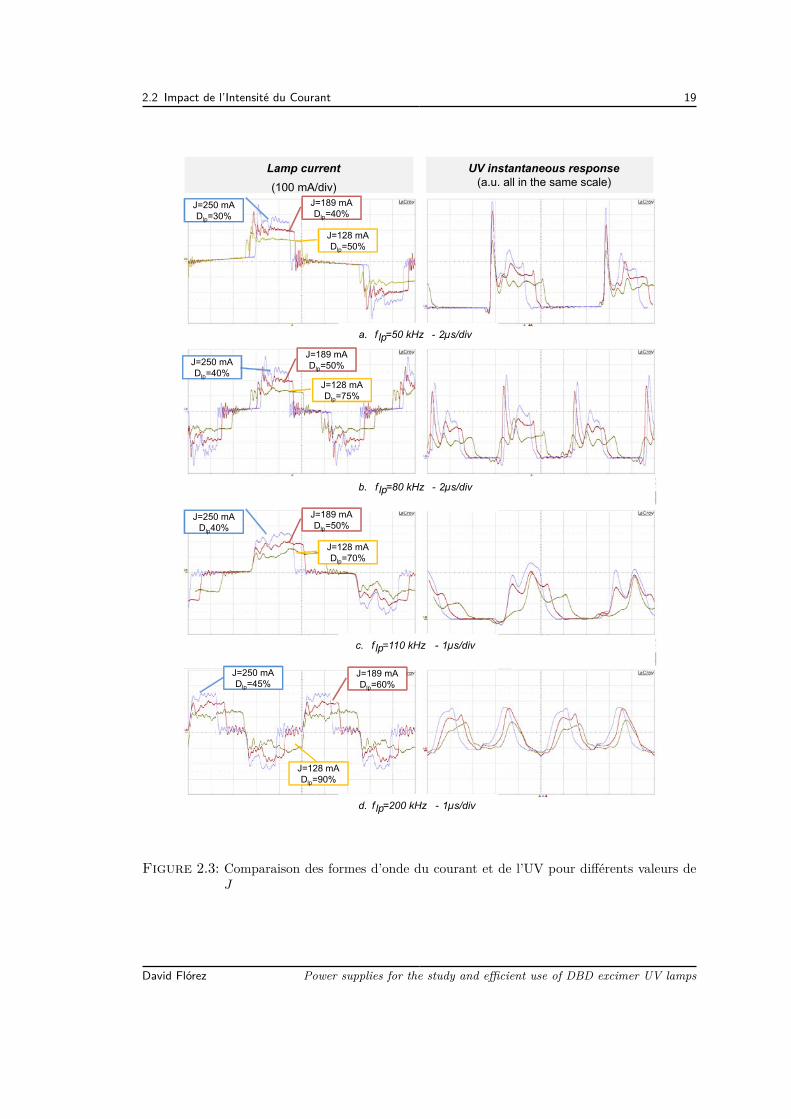
2.2 Impact de l’Intensité du Courant 19
J=250 mADlp=30%
J=189 mADlp=40%
J=128 mADlp=50%
J=250 mADlp=40%
J=189 mADlp=50%
J=128 mADlp=75%
b. f lp=80 kHz - 2µs/div
J=250 mADlp40%
J=189 mADlp=50%
J=128 mADlp=70%
c. f lp=110 kHz - 1µs/div
J=250 mADlp=45%
J=189 mADlp=60%
J=128 mADlp=90%
d. f lp=200 kHz - 1µs/div
a. f lp=50 kHz - 2µs/div
Lamp current
(100 mA/div)
UV instantaneous response (a.u. all in the same scale)
Figure 2.3: Comparaison des formes d’onde du courant et de l’UV pour différents valeurs deJ
David Flórez Power supplies for the study and efficient use of DBD excimer UV lamps
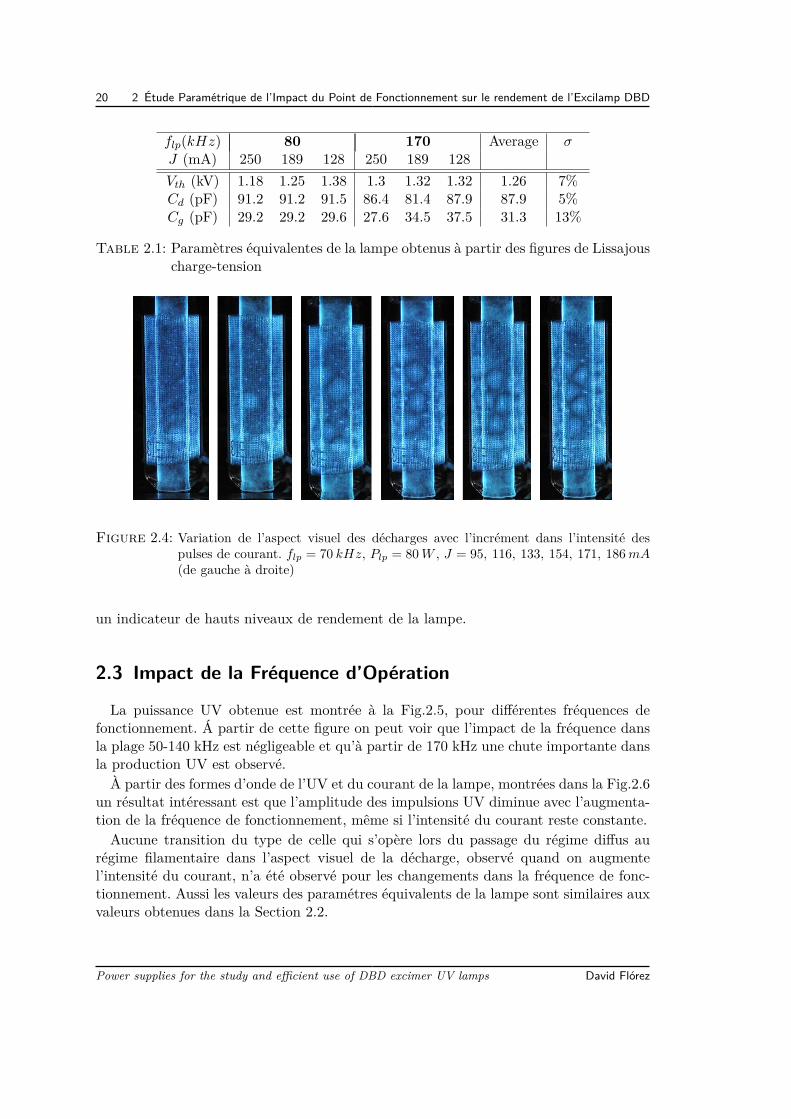
20 2 Étude Paramétrique de l’Impact du Point de Fonctionnement sur le rendement de l’Excilamp DBD
flp(kHz) 80 170 Average σJ (mA) 250 189 128 250 189 128Vth (kV) 1.18 1.25 1.38 1.3 1.32 1.32 1.26 7%Cd (pF) 91.2 91.2 91.5 86.4 81.4 87.9 87.9 5%Cg (pF) 29.2 29.2 29.6 27.6 34.5 37.5 31.3 13%
Table 2.1: Paramètres équivalentes de la lampe obtenus à partir des figures de Lissajouscharge-tension
Figure 2.4: Variation de l’aspect visuel des décharges avec l’incrément dans l’intensité despulses de courant. flp = 70 kHz, Plp = 80W , J = 95, 116, 133, 154, 171, 186mA(de gauche à droite)
un indicateur de hauts niveaux de rendement de la lampe.
2.3 Impact de la Fréquence d’Opération
La puissance UV obtenue est montrée à la Fig.2.5, pour différentes fréquences defonctionnement. Á partir de cette figure on peut voir que l’impact de la fréquence dansla plage 50-140 kHz est négligeable et qu’à partir de 170 kHz une chute importante dansla production UV est observé.À partir des formes d’onde de l’UV et du courant de la lampe, montrées dans la Fig.2.6
un résultat intéressant est que l’amplitude des impulsions UV diminue avec l’augmenta-tion de la fréquence de fonctionnement, même si l’intensité du courant reste constante.Aucune transition du type de celle qui s’opère lors du passage du régime diffus au
régime filamentaire dans l’aspect visuel de la décharge, observé quand on augmentel’intensité du courant, n’a été observé pour les changements dans la fréquence de fonc-tionnement. Aussi les valeurs des paramétres équivalents de la lampe sont similaires auxvaleurs obtenues dans la Section 2.2.
Power supplies for the study and efficient use of DBD excimer UV lamps David Flórez
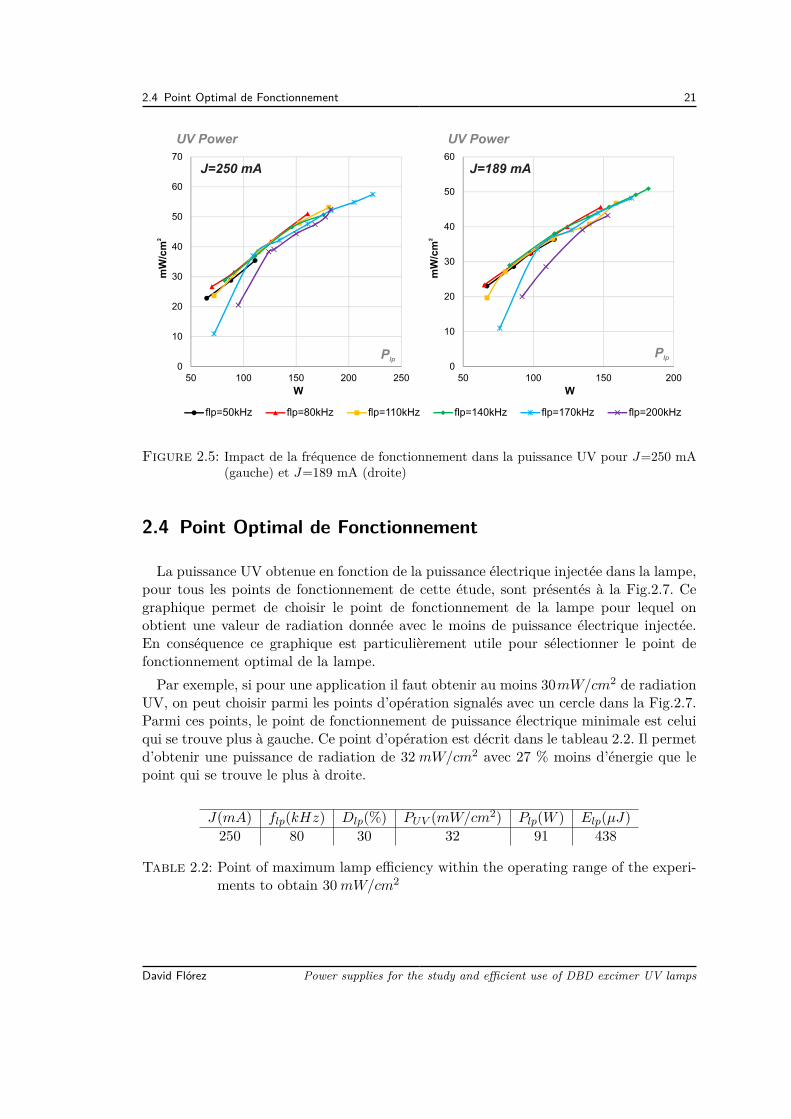
2.4 Point Optimal de Fonctionnement 21
flp=50kHz flp=80kHz flp=110kHz flp=140kHz flp=170kHz flp=200kHz
UV Power
0
10
20
30
40
50
60
50 100 150 200
2mW/cm
W
UV Power2
mW/cm
W
0
10
20
30
40
50
60
70
50 100 150 200 250
PlpPlp
J=250 mA J=189 mA
Figure 2.5: Impact de la fréquence de fonctionnement dans la puissance UV pour J=250 mA(gauche) et J=189 mA (droite)
2.4 Point Optimal de Fonctionnement
La puissance UV obtenue en fonction de la puissance électrique injectée dans la lampe,pour tous les points de fonctionnement de cette étude, sont présentés à la Fig.2.7. Cegraphique permet de choisir le point de fonctionnement de la lampe pour lequel onobtient une valeur de radiation donnée avec le moins de puissance électrique injectée.En conséquence ce graphique est particulièrement utile pour sélectionner le point defonctionnement optimal de la lampe.Par exemple, si pour une application il faut obtenir au moins 30mW/cm2 de radiation
UV, on peut choisir parmi les points d’opération signalés avec un cercle dans la Fig.2.7.Parmi ces points, le point de fonctionnement de puissance électrique minimale est celuiqui se trouve plus à gauche. Ce point d’opération est décrit dans le tableau 2.2. Il permetd’obtenir une puissance de radiation de 32 mW/cm2 avec 27 % moins d’énergie que lepoint qui se trouve le plus à droite.
J(mA) flp(kHz) Dlp(%) PUV (mW/cm2) Plp(W ) Elp(µJ)250 80 30 32 91 438
Table 2.2: Point of maximum lamp efficiency within the operating range of the experi-ments to obtain 30mW/cm2
David Flórez Power supplies for the study and efficient use of DBD excimer UV lamps
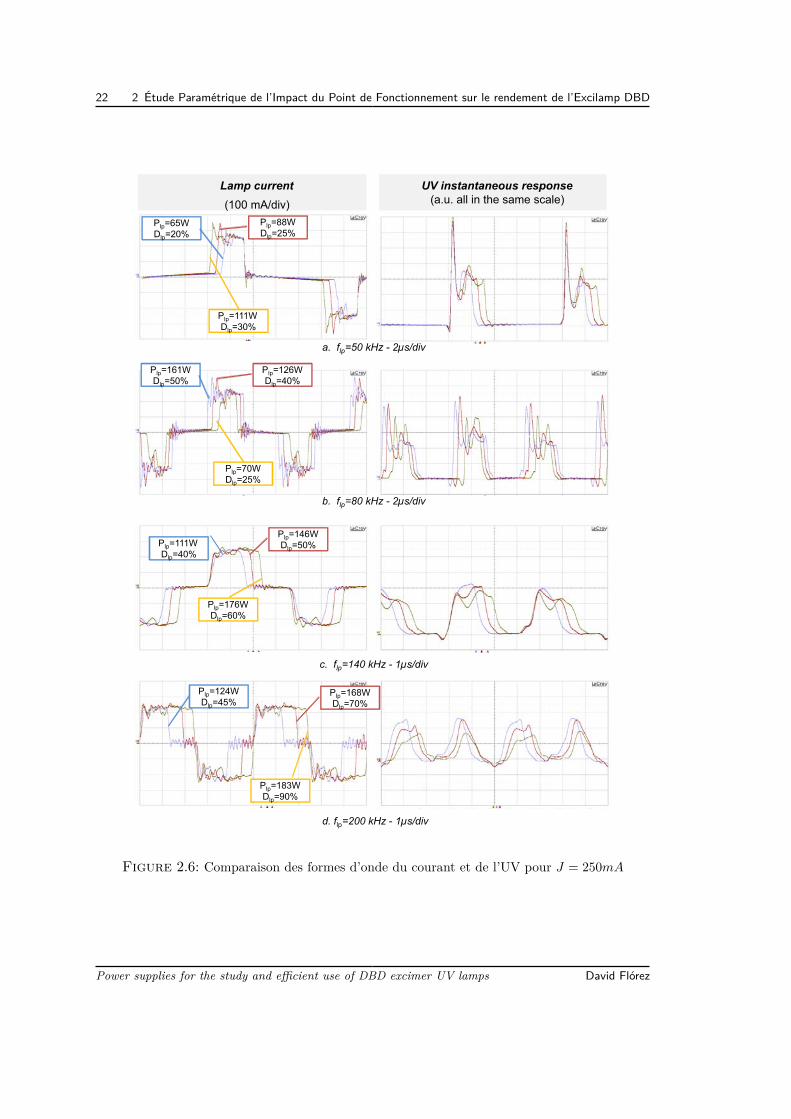
22 2 Étude Paramétrique de l’Impact du Point de Fonctionnement sur le rendement de l’Excilamp DBD
Lamp current
(100 mA/div)
UV instantaneous response (a.u. all in the same scale)
a. flp=50 kHz - 2µs/div
Plp=161WDlp=50%
Plp=126WDlp=40%
Plp=70WDlp=25%
b. flp=80 kHz - 2µs/div
Plp=111WDlp=40%
Plp=146WDlp=50%
Plp=176WDlp=60%
c. flp=140 kHz - 1µs/div
Plp=124WDlp=45%
Plp=168WDlp=70%
Plp=183WDlp=90%
d. flp=200 kHz - 1µs/div
Plp=65WDlp=20%
Plp=88WDlp=25%
Plp=111WDlp=30%
Figure 2.6: Comparaison des formes d’onde du courant et de l’UV pour J = 250mA
Power supplies for the study and efficient use of DBD excimer UV lamps David Flórez
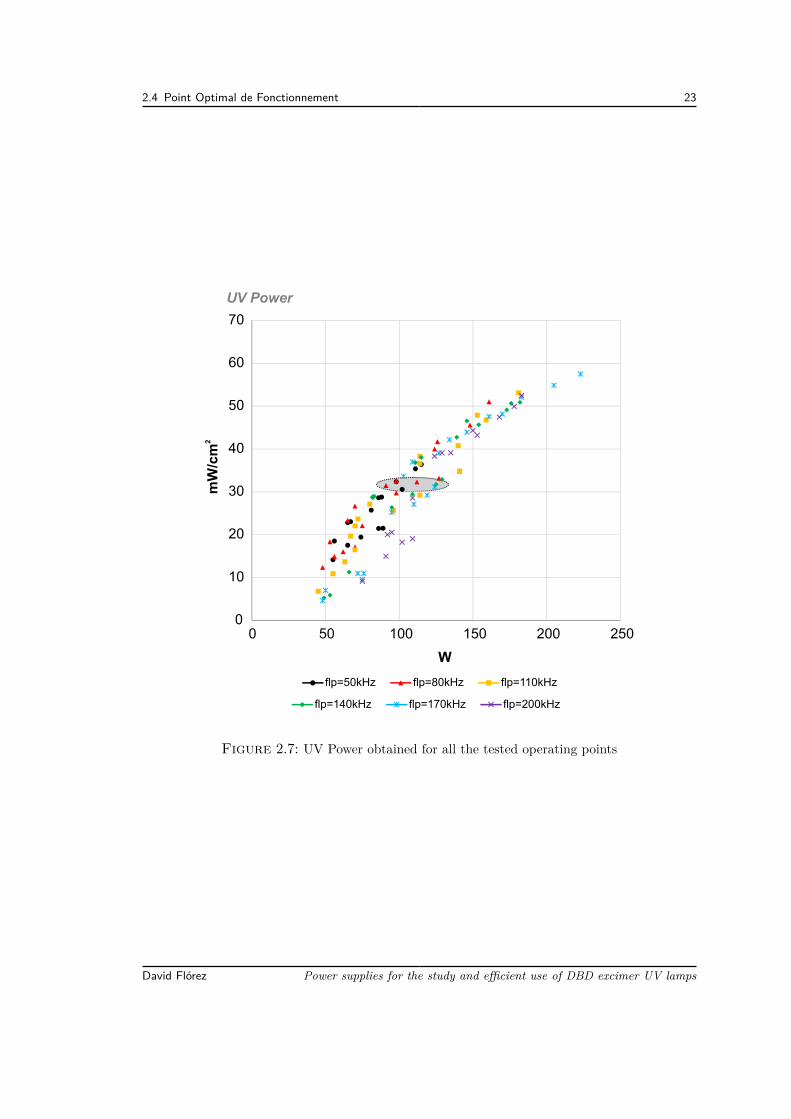
2.4 Point Optimal de Fonctionnement 23
0
10
20
30
40
50
60
70
0 50 100 150 200 250
W
UV Power
2mW/cm
flp=50kHz flp=80kHz flp=110kHz
flp=140kHz flp=170kHz flp=200kHz
Figure 2.7: UV Power obtained for all the tested operating points
David Flórez Power supplies for the study and efficient use of DBD excimer UV lamps
24 2 Étude Paramétrique de l’Impact du Point de Fonctionnement sur le rendement de l’Excilamp DBD
2.5 ConclusionsLa production de l’UV est positivement influencée par l’augmentation de l’intensité du
courant. Cependant, pour la plage expérimental étudiée ici, il n’y a pas de gain importantdans la performance de la lampe au-dessus de 189 mA pour l’intensité du courant. Enrevanche, le modèle électrique équivalent simplifié de la lampe est à peine affecté par leschangements dans le point de fonctionnement.L’existence de filaments bien définis dans la décharge est associée à des niveaux d’effi-
cacité UV meilleurs que ceux mesurés pour des points de fonctionnement non ou moinsfilamenteux.L’amplitude et la durée des impulsions de rayonnement UV sont régis par l’intensité
du courant de la lampe et la durée de l’impulsion de courant respectivement .L’énergie injectée dans la lampe pour produire la décharge, semble jouer un rôle dé-
terminant dans le rendement de la lampe. Pour tous les points de fonctionnement testéset pour cette excilampe XeCl DBD en particulier , les meilleures performances ont étéobtenues avec des impulsions d’énergie supérieurs à 300 µJ .
Power supplies for the study and efficient use of DBD excimer UV lamps David Flórez
Bibliographie[2.1] Haruaki Akashi, Akinori Odam, and Yosuke Sakai, “Effect of gas heating on excimer
distribution in DBD xe excimer lamp,” in 28th ICPIG Conference Records, (Prague,Czech Republic), July 2007.
[2.2] U. Kogelschatz, “Dielectric-barrier discharges : Their history, discharge physics, andindustrial applications,” Plasma Chemistry and Plasma Processing, vol. 23, no. 1,pp. 1–46, 2003.
[2.3] R. Casanueva, F. J. Azcondo, and S. Bracho, “Series–parallel resonant converterfor an EDM power supply,” Journal of Materials Processing Technology, vol. 149,pp. 172–177, June 2004.
[2.4] R. Casanueva, F. Azcondo, and C. Brañas, “Output current sensitivity analysisof the resonant inverter : Current-source design criteria,” IEEE Transactions onIndustrial Electronics, vol. 54, no. 3, pp. 1560–1568, 2007.
[2.5] Y. Chéron, C. Goodman, and T. Meynard, Soft commutation. London [u.a. :Chapman & Hall, 1992.
[2.6] R. Oruganti and F. Lee, “Resonant power processors, part I—State plane analysis,”IEEE Transactions on Industry Applications, vol. IA-21, no. 6, pp. 1453–1460, 1985.
[2.7] X. Bonnin, H. Piquet, D. Florez, R. Diez, and X. Bonnin, “Designing the highvoltage transformer of power supplies for dbd : windings arrangment to reduce theparasitic capacitive effects,” in Power Electronics and Applications (EPE), 201315th European Conference on, Sept. 2013.
[2.8] R. Diez, H. Piquet, and S. Bhosle, “Control of the UV emission of an excimer lampby means of a current-mode power supply,” in Industrial Electronics, 2009. IECON’09. 35th Annual Conference of IEEE, pp. 3500–3505, IEEE, Nov. 2009.
[2.9] R. Diez, H. Piquet, S. Bhosle, and J.-M. Blaquiere, “Current mode converter for die-lectric barrier discharge lamp,” in IEEE Power Electronics Specialists Conference,2008. PESC 2008, pp. 2485–2491, 2008.
[2.10] H. Piquet, S. Bhosle, R. Diez, and M. V. Erofeev, “Pulsed current-mode supplyof dielectric barrier discharge excilamps for the control of the radiated ultravioletpower,” IEEE Transactions on Plasma Science, vol. 38, pp. 2531–2538, Oct. 2010.
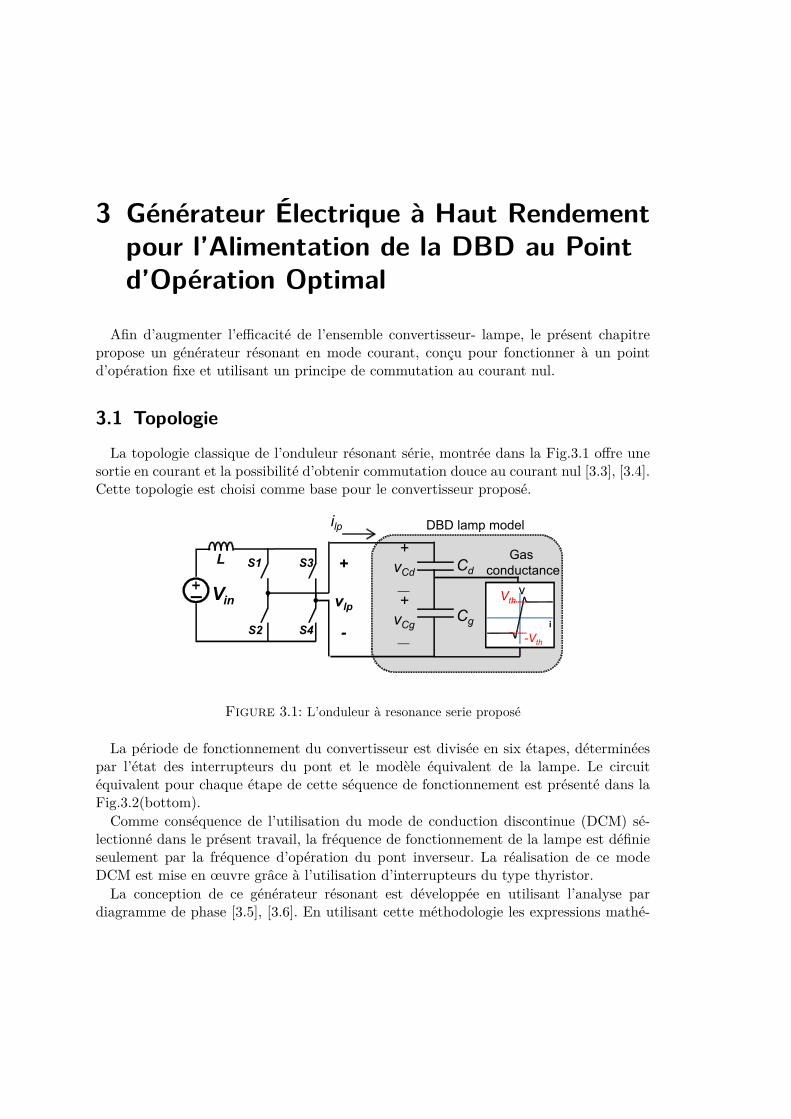
3 Générateur Électrique à Haut Rendementpour l’Alimentation de la DBD au Pointd’Opération Optimal
Afin d’augmenter l’efficacité de l’ensemble convertisseur- lampe, le présent chapitrepropose un générateur résonant en mode courant, conçu pour fonctionner à un pointd’opération fixe et utilisant un principe de commutation au courant nul.
3.1 TopologieLa topologie classique de l’onduleur résonant série, montrée dans la Fig.3.1 offre une
sortie en courant et la possibilité d’obtenir commutation douce au courant nul [3.3], [3.4].Cette topologie est choisi comme base pour le convertisseur proposé.
Vin
L S1
S4
S3
S2Cg
Cd+
vlp
-
DBD lamp modelilp
i
-Vth
Vthv
Gas conductance
+vCg__
+vCd__
Figure 3.1: L’onduleur à resonance serie proposé
La période de fonctionnement du convertisseur est divisée en six étapes, déterminéespar l’état des interrupteurs du pont et le modèle équivalent de la lampe. Le circuitéquivalent pour chaque étape de cette séquence de fonctionnement est présenté dans laFig.3.2(bottom).Comme conséquence de l’utilisation du mode de conduction discontinue (DCM) sé-
lectionné dans le présent travail, la fréquence de fonctionnement de la lampe est définieseulement par la fréquence d’opération du pont inverseur. La réalisation de ce modeDCM est mise en œuvre grâce à l’utilisation d’interrupteurs du type thyristor.La conception de ce générateur résonant est développée en utilisant l’analyse par
diagramme de phase [3.5], [3.6]. En utilisant cette méthodologie les expressions mathé-
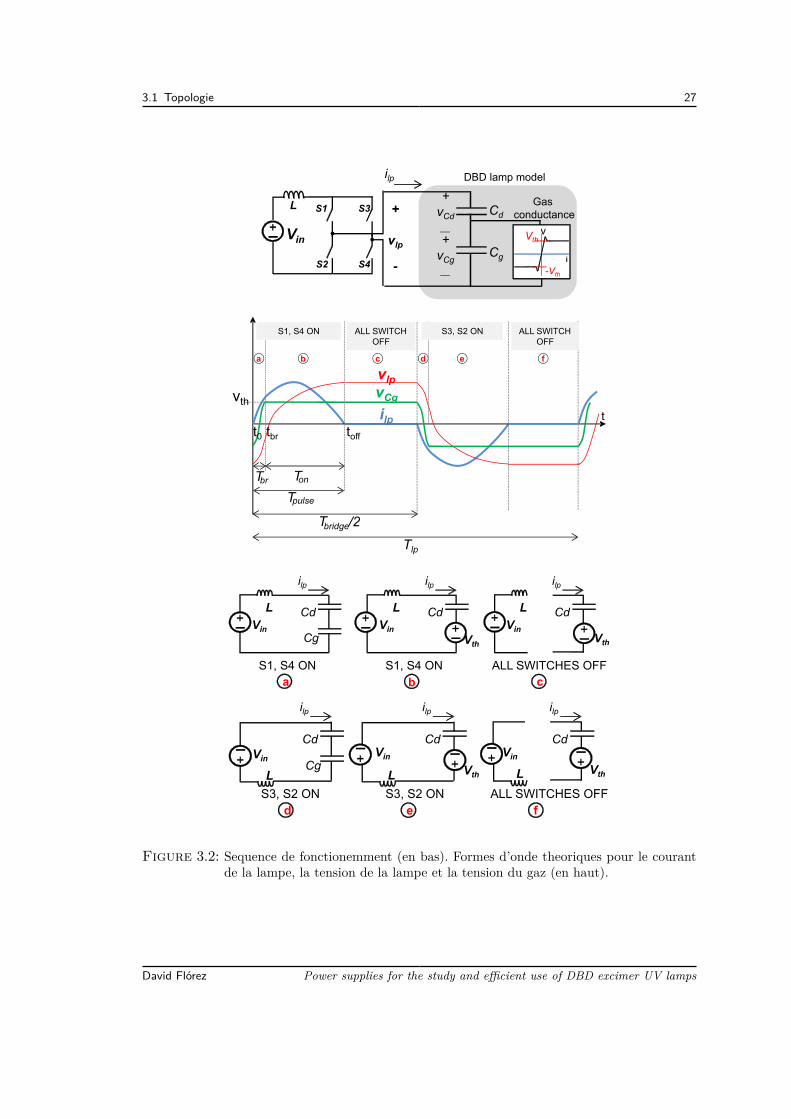
3.1 Topologie 27
Vin
L S1
S4
S3
S2Cg
Cd+
vlp
-
DBD lamp modelilp
i
-Vth
Vthv
Gas conductance
+vCg__
+vCd__
b
ilp
Cg
Cd
a
Vin
L
ilp
Cd
c
Vin
L
Vth
ilp
CdVin
L
Vth
S1, S4 ON S1, S4 ON ALL SWITCHES OFF
fe
ilp
Cg
Cd
d
Vin
L
ilp
CdVin
VthL
ilp
CdVin
L Vth
S3, S2 ON S3, S2 ON ALL SWITCHES OFF
Tpulse
ilp t
Tlp
feba c d
vCg
tbrt0 toff
ALL SWITCH OFF
S1, S4 ON ALL SWITCH OFF
S3, S2 ON
vth
vlp
Tbridge/2
TonTbr
Figure 3.2: Sequence de fonctionemment (en bas). Formes d’onde theoriques pour le courantde la lampe, la tension de la lampe et la tension du gaz (en haut).
David Flórez Power supplies for the study and efficient use of DBD excimer UV lamps
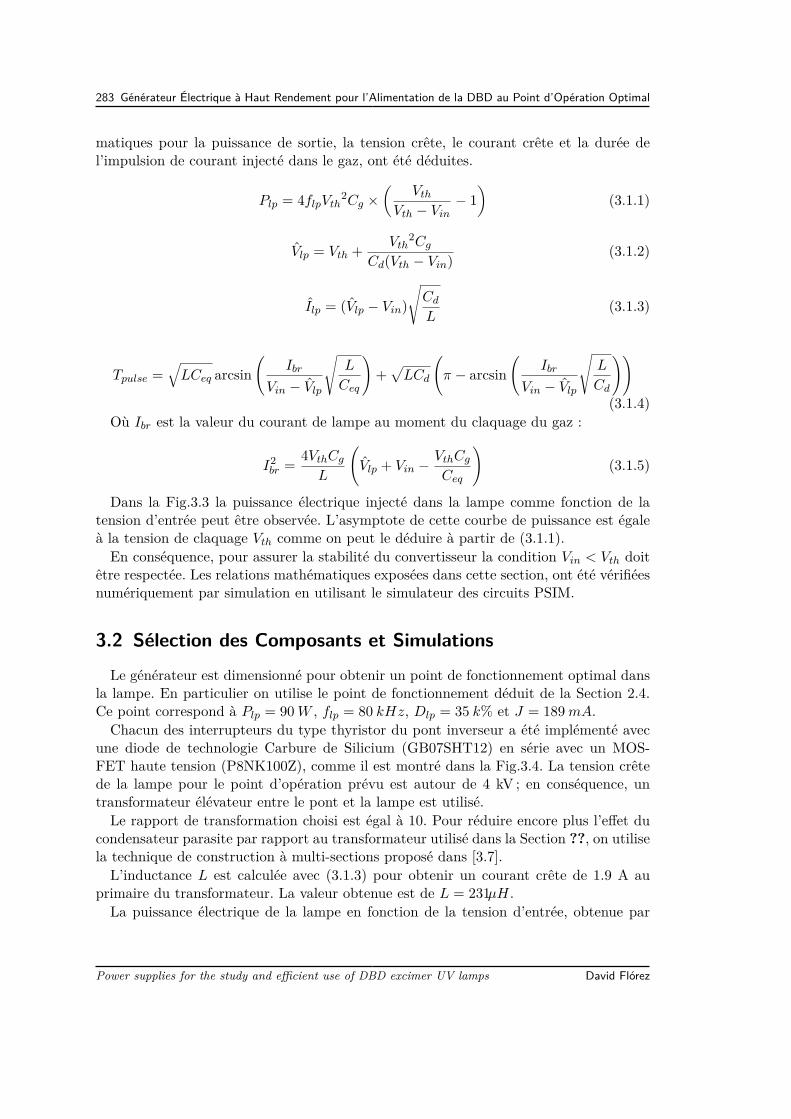
283 Générateur Électrique à Haut Rendement pour l’Alimentation de la DBD au Point d’Opération Optimal
matiques pour la puissance de sortie, la tension crête, le courant crête et la durée del’impulsion de courant injecté dans le gaz, ont été déduites.
Plp = 4flpVth2Cg ×
(Vth
Vth − Vin− 1
)(3.1.1)
Vlp = Vth + Vth2Cg
Cd(Vth − Vin) (3.1.2)
Ilp = (Vlp − Vin)√Cd
L(3.1.3)
Tpulse =√LCeq arcsin
(Ibr
Vin − Vlp
√L
Ceq
)+√LCd
(π − arcsin
(Ibr
Vin − Vlp
√L
Cd
))
(3.1.4)Où Ibr est la valeur du courant de lampe au moment du claquage du gaz :
I2br = 4VthCg
L
(Vlp + Vin − VthCg
Ceq
)(3.1.5)
Dans la Fig.3.3 la puissance électrique injecté dans la lampe comme fonction de latension d’entrée peut être observée. L’asymptote de cette courbe de puissance est égaleà la tension de claquage Vth comme on peut le déduire à partir de (3.1.1).En conséquence, pour assurer la stabilité du convertisseur la condition Vin < Vth doit
être respectée. Les relations mathématiques exposées dans cette section, ont été vérifiéesnumériquement par simulation en utilisant le simulateur des circuits PSIM.
3.2 Sélection des Composants et SimulationsLe générateur est dimensionné pour obtenir un point de fonctionnement optimal dans
la lampe. En particulier on utilise le point de fonctionnement déduit de la Section 2.4.Ce point correspond à Plp = 90W , flp = 80 kHz, Dlp = 35 k% et J = 189mA.Chacun des interrupteurs du type thyristor du pont inverseur a été implémenté avec
une diode de technologie Carbure de Silicium (GB07SHT12) en série avec un MOS-FET haute tension (P8NK100Z), comme il est montré dans la Fig.3.4. La tension crêtede la lampe pour le point d’opération prévu est autour de 4 kV ; en conséquence, untransformateur élévateur entre le pont et la lampe est utilisé.Le rapport de transformation choisi est égal à 10. Pour réduire encore plus l’effet du
condensateur parasite par rapport au transformateur utilisé dans la Section ??, on utilisela technique de construction à multi-sections proposé dans [3.7].L’inductance L est calculée avec (3.1.3) pour obtenir un courant crête de 1.9 A au
primaire du transformateur. La valeur obtenue est de L = 231µH.La puissance électrique de la lampe en fonction de la tension d’entrée, obtenue par
Power supplies for the study and efficient use of DBD excimer UV lamps David Flórez
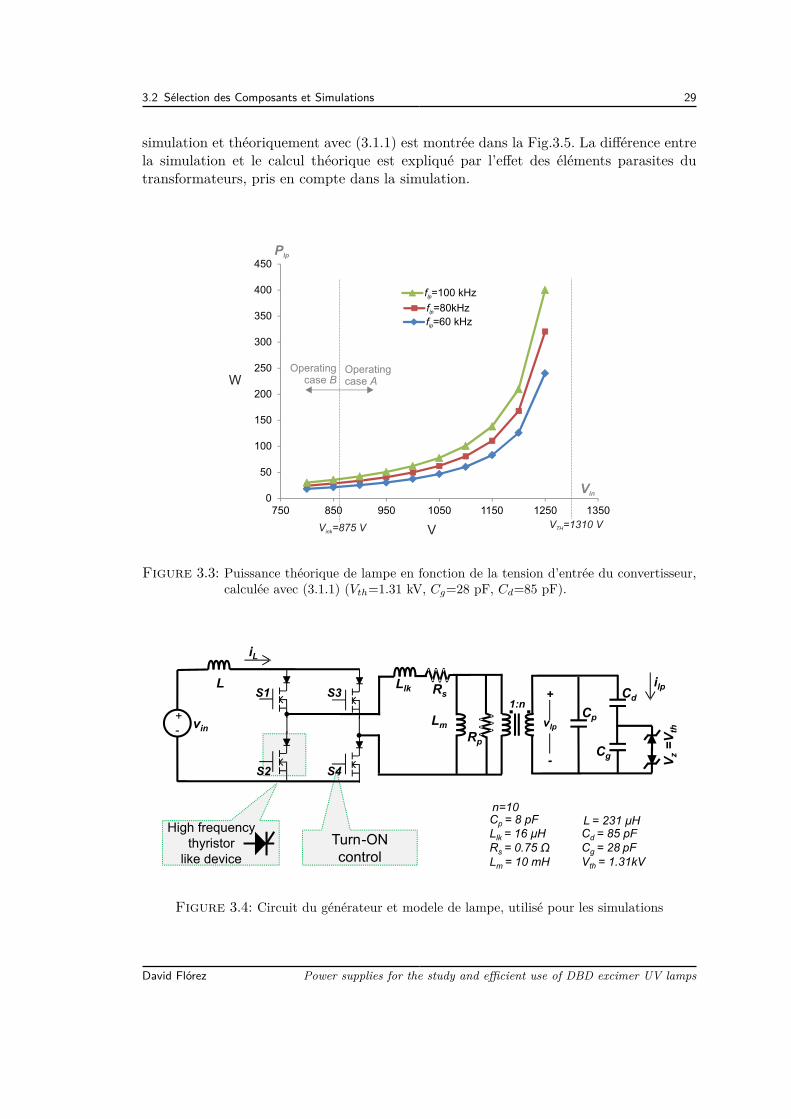
3.2 Sélection des Composants et Simulations 29
simulation et théoriquement avec (3.1.1) est montrée dans la Fig.3.5. La différence entrela simulation et le calcul théorique est expliqué par l’effet des éléments parasites dutransformateurs, pris en compte dans la simulation.
0
50
100
150
200
250
300
350
400
450
750 850 950 1050 1150 1250 1350
f =80kHzlp
f =60 kHzlp
f =100 kHzlp
V =875 VinkV =1310 VTH
Plp
W
Vin
V
Operating case A
Operatingcase B
Figure 3.3: Puissance théorique de lampe en fonction de la tension d’entrée du convertisseur,calculée avec (3.1.1) (Vth=1.31 kV, Cg=28 pF, Cd=85 pF).
Turn-ONcontrol
. .vin
lpS1
S4
S3
S2
+
vlp
-
+-
1:n
lk
LmCp
Cd
Cg
Vz=Vth
Rs
High frequency thyristor
like device
L = 231 μHn=10
Llk = 16 μHRs = 0.75 Ω Lm = 10 mH
Cp = 8 pFCd = 85 pFCg = 28 pFVth = 1.31 kV
Rp
L i
iL
L
Figure 3.4: Circuit du générateur et modele de lampe, utilisé pour les simulations
David Flórez Power supplies for the study and efficient use of DBD excimer UV lamps
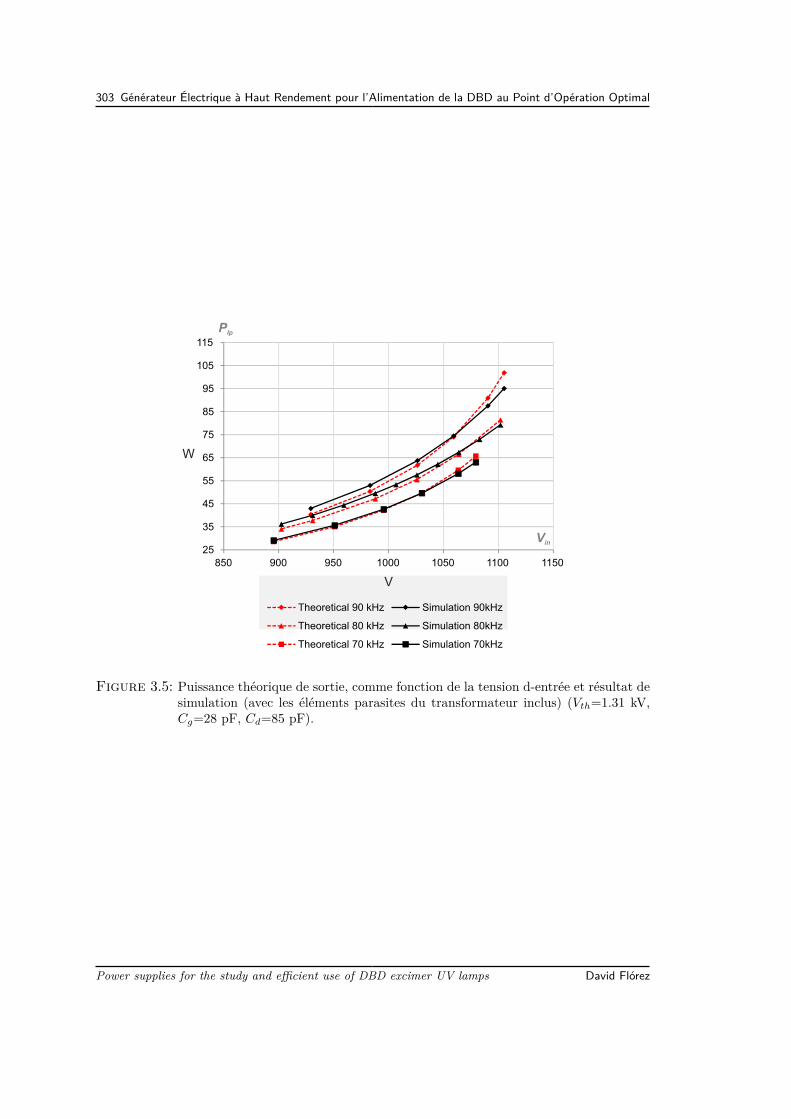
303 Générateur Électrique à Haut Rendement pour l’Alimentation de la DBD au Point d’Opération Optimal
25
35
45
55
65
75
85
95
105
115
850 900 950 1000 1050 1100 1150
Theoretical 90 kHz Simulation 90kHz
Theoretical 80 kHz Simulation 80kHz
Theoretical 70 kHz Simulation 70kHz
Plp
W
Vin
V
Figure 3.5: Puissance théorique de sortie, comme fonction de la tension d-entrée et résultat desimulation (avec les éléments parasites du transformateur inclus) (Vth=1.31 kV,Cg=28 pF, Cd=85 pF).
Power supplies for the study and efficient use of DBD excimer UV lamps David Flórez
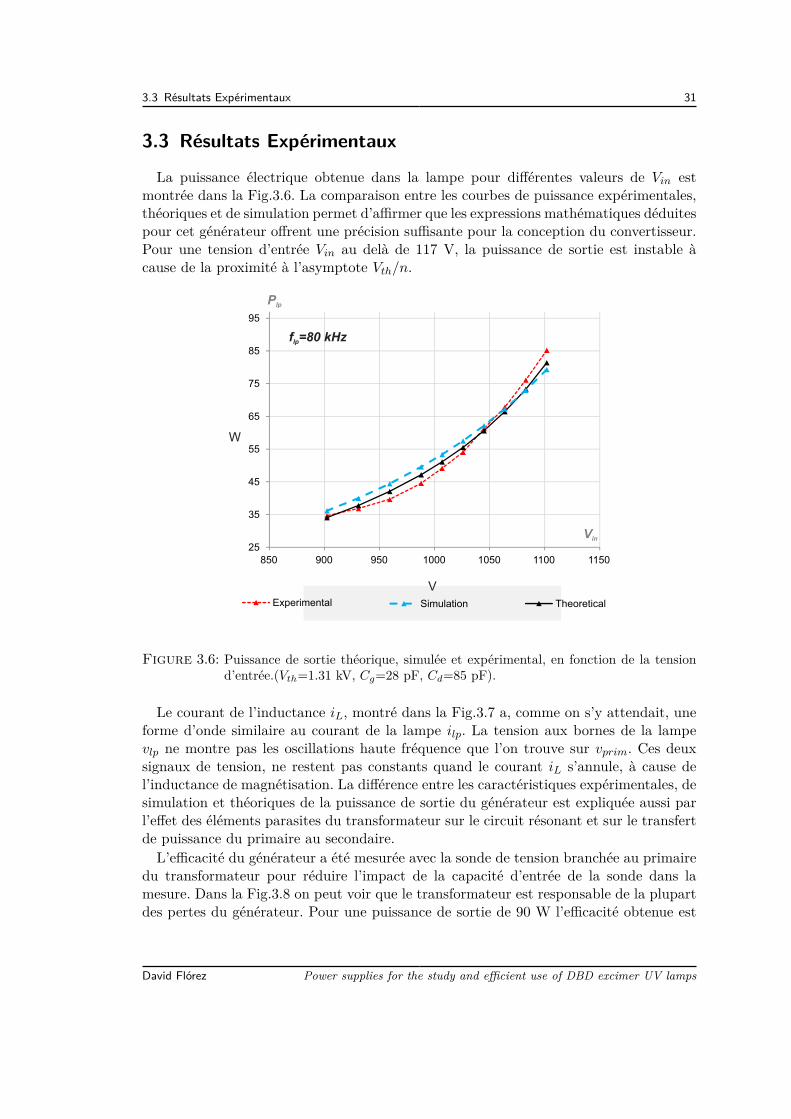
3.3 Résultats Expérimentaux 31
3.3 Résultats Expérimentaux
La puissance électrique obtenue dans la lampe pour différentes valeurs de Vin estmontrée dans la Fig.3.6. La comparaison entre les courbes de puissance expérimentales,théoriques et de simulation permet d’affirmer que les expressions mathématiques déduitespour cet générateur offrent une précision suffisante pour la conception du convertisseur.Pour une tension d’entrée Vin au delà de 117 V, la puissance de sortie est instable àcause de la proximité à l’asymptote Vth/n.
25
35
45
55
65
75
85
95
850 900 950 1000 1050 1100 1150
Experimental TheoreticalSimulation
Plp
W
Vin
V
f =80 kHzlp
Figure 3.6: Puissance de sortie théorique, simulée et expérimental, en fonction de la tensiond’entrée.(Vth=1.31 kV, Cg=28 pF, Cd=85 pF).
Le courant de l’inductance iL, montré dans la Fig.3.7 a, comme on s’y attendait, uneforme d’onde similaire au courant de la lampe ilp. La tension aux bornes de la lampevlp ne montre pas les oscillations haute fréquence que l’on trouve sur vprim. Ces deuxsignaux de tension, ne restent pas constants quand le courant iL s’annule, à cause del’inductance de magnétisation. La différence entre les caractéristiques expérimentales, desimulation et théoriques de la puissance de sortie du générateur est expliquée aussi parl’effet des éléments parasites du transformateur sur le circuit résonant et sur le transfertde puissance du primaire au secondaire.L’efficacité du générateur a été mesurée avec la sonde de tension branchée au primaire
du transformateur pour réduire l’impact de la capacité d’entrée de la sonde dans lamesure. Dans la Fig.3.8 on peut voir que le transformateur est responsable de la plupartdes pertes du générateur. Pour une puissance de sortie de 90 W l’efficacité obtenue est
David Flórez Power supplies for the study and efficient use of DBD excimer UV lamps
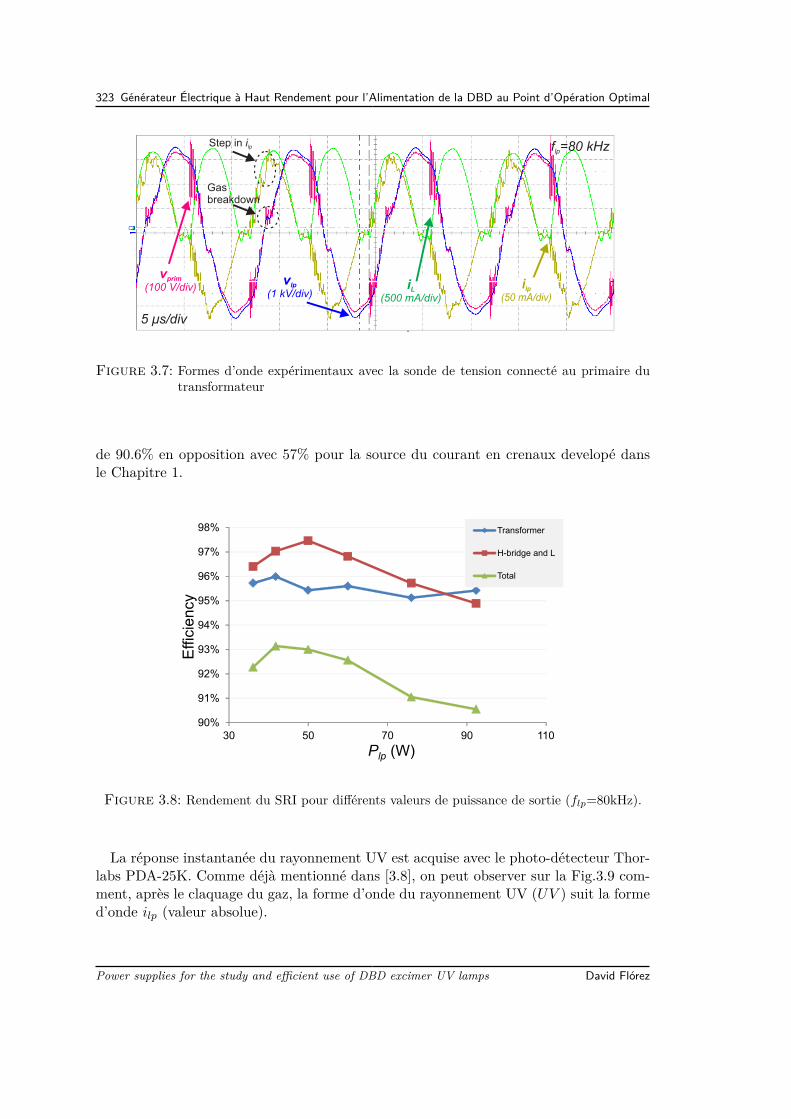
323 Générateur Électrique à Haut Rendement pour l’Alimentation de la DBD au Point d’Opération Optimal
f =80 kHzlp
5 μs/div
vprim
(100 V/div)vlp
(1 kV/div)iL
(500 mA/div)ilp
(50 mA/div)
Step in ilp
Gas breakdown
Figure 3.7: Formes d’onde expérimentaux avec la sonde de tension connecté au primaire dutransformateur
de 90.6% en opposition avec 57% pour la source du courant en crenaux developé dansle Chapitre 1.
90%
91%
92%
93%
94%
95%
96%
97%
98%
30 50 70 90 110
Transformer
H-bridge and L
Total
Plp (W)
Effi
ciency
Figure 3.8: Rendement du SRI pour différents valeurs de puissance de sortie (flp=80kHz).
La réponse instantanée du rayonnement UV est acquise avec le photo-détecteur Thor-labs PDA-25K. Comme déjà mentionné dans [3.8], on peut observer sur la Fig.3.9 com-ment, après le claquage du gaz, la forme d’onde du rayonnement UV (UV ) suit la formed’onde ilp (valeur absolue).
Power supplies for the study and efficient use of DBD excimer UV lamps David Flórez
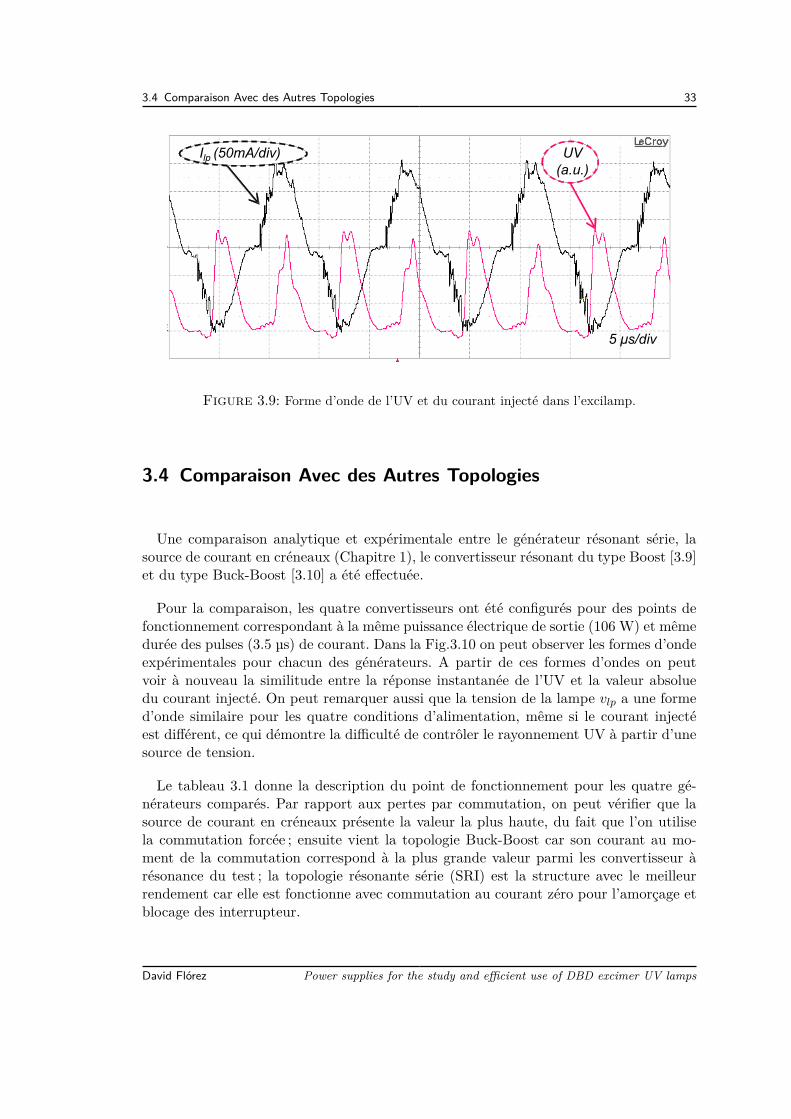
3.4 Comparaison Avec des Autres Topologies 33
Ilp (50mA/div) UV(a.u.)
5 μs/div
Figure 3.9: Forme d’onde de l’UV et du courant injecté dans l’excilamp.
3.4 Comparaison Avec des Autres Topologies
Une comparaison analytique et expérimentale entre le générateur résonant série, lasource de courant en créneaux (Chapitre 1), le convertisseur résonant du type Boost [3.9]et du type Buck-Boost [3.10] a été effectuée.
Pour la comparaison, les quatre convertisseurs ont été configurés pour des points defonctionnement correspondant à la même puissance électrique de sortie (106 W) et mêmedurée des pulses (3.5 µs) de courant. Dans la Fig.3.10 on peut observer les formes d’ondeexpérimentales pour chacun des générateurs. A partir de ces formes d’ondes on peutvoir à nouveau la similitude entre la réponse instantanée de l’UV et la valeur absoluedu courant injecté. On peut remarquer aussi que la tension de la lampe vlp a une formed’onde similaire pour les quatre conditions d’alimentation, même si le courant injectéest différent, ce qui démontre la difficulté de contrôler le rayonnement UV à partir d’unesource de tension.
Le tableau 3.1 donne la description du point de fonctionnement pour les quatre gé-nérateurs comparés. Par rapport aux pertes par commutation, on peut vérifier que lasource de courant en créneaux présente la valeur la plus haute, du fait que l’on utilisela commutation forcée ; ensuite vient la topologie Buck-Boost car son courant au mo-ment de la commutation correspond à la plus grande valeur parmi les convertisseur àrésonance du test ; la topologie résonante série (SRI) est la structure avec le meilleurrendement car elle est fonctionne avec commutation au courant zéro pour l’amorçage etblocage des interrupteur.
David Flórez Power supplies for the study and efficient use of DBD excimer UV lamps
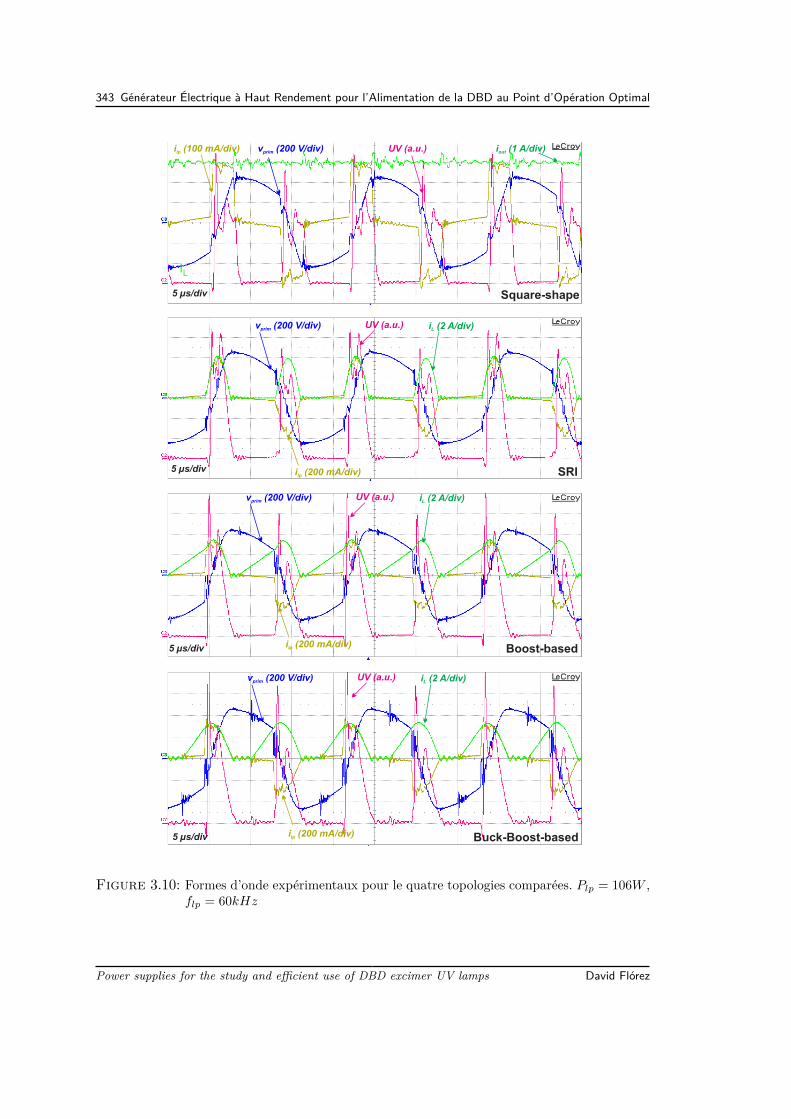
343 Générateur Électrique à Haut Rendement pour l’Alimentation de la DBD au Point d’Opération Optimal
Buck-Boost-basedi (200 mA/div)lp
v (200 V/div)primUV (a.u.) i (2 A/div)L
5 µs/div
Boost-basedi (200 mA/div)lp
v (200 V/div)primUV (a.u.) i (2 A/div)L
5 µs/div
SRIi (200 mA/div)lp
v (200 V/div)primUV (a.u.) i (2 A/div)L
5 µs/div
Square-shape
i (100 mA/div)lp
iL
v (200 V/div)prim UV (a.u.) i (1 A/div)out
5 µs/div
Figure 3.10: Formes d’onde expérimentaux pour le quatre topologies comparées. Plp = 106W ,flp = 60kHz
Power supplies for the study and efficient use of DBD excimer UV lamps David Flórez
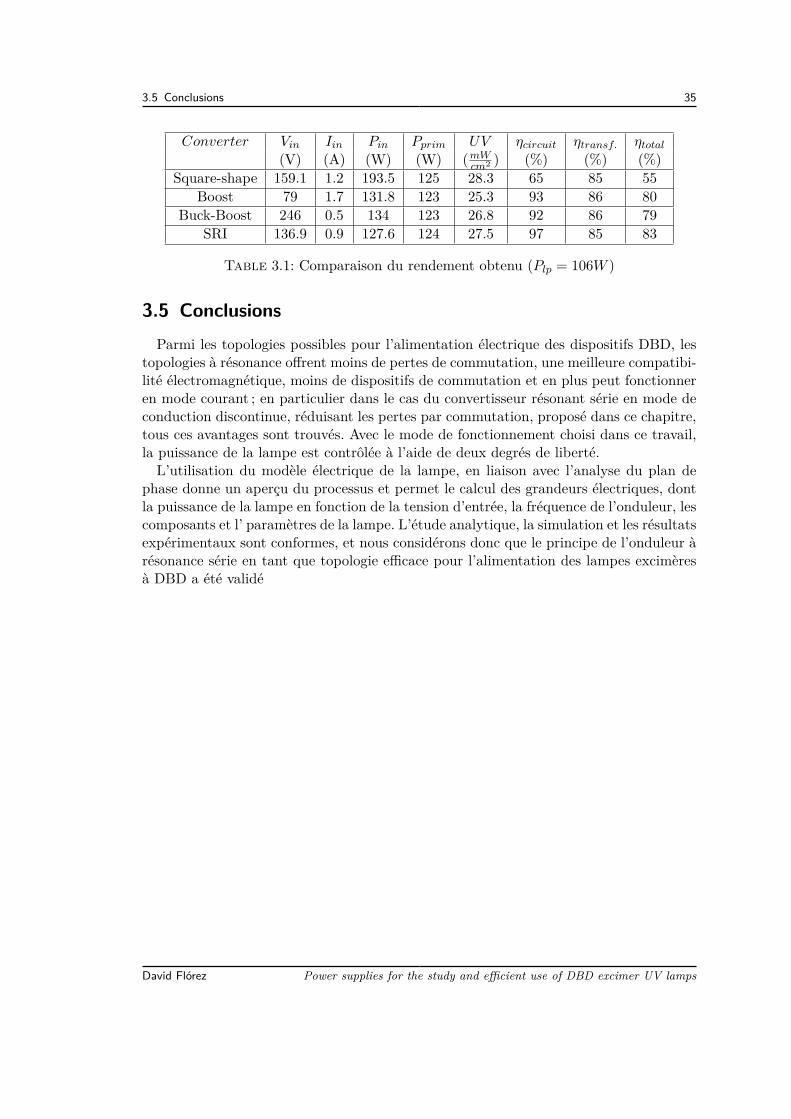
3.5 Conclusions 35
Converter Vin Iin Pin Pprim UV ηcircuit ηtransf. ηtotal
(V) (A) (W) (W) (mWcm2 ) (%) (%) (%)
Square-shape 159.1 1.2 193.5 125 28.3 65 85 55Boost 79 1.7 131.8 123 25.3 93 86 80
Buck-Boost 246 0.5 134 123 26.8 92 86 79SRI 136.9 0.9 127.6 124 27.5 97 85 83
Table 3.1: Comparaison du rendement obtenu (Plp = 106W )
3.5 ConclusionsParmi les topologies possibles pour l’alimentation électrique des dispositifs DBD, les
topologies à résonance offrent moins de pertes de commutation, une meilleure compatibi-lité électromagnétique, moins de dispositifs de commutation et en plus peut fonctionneren mode courant ; en particulier dans le cas du convertisseur résonant série en mode deconduction discontinue, réduisant les pertes par commutation, proposé dans ce chapitre,tous ces avantages sont trouvés. Avec le mode de fonctionnement choisi dans ce travail,la puissance de la lampe est contrôlée à l’aide de deux degrés de liberté.L’utilisation du modèle électrique de la lampe, en liaison avec l’analyse du plan de
phase donne un aperçu du processus et permet le calcul des grandeurs électriques, dontla puissance de la lampe en fonction de la tension d’entrée, la fréquence de l’onduleur, lescomposants et l’ paramètres de la lampe. L’étude analytique, la simulation et les résultatsexpérimentaux sont conformes, et nous considérons donc que le principe de l’onduleur àrésonance série en tant que topologie efficace pour l’alimentation des lampes excimèresà DBD a été validé
David Flórez Power supplies for the study and efficient use of DBD excimer UV lamps
Bibliographie[3.1] Haruaki Akashi, Akinori Odam, and Yosuke Sakai, “Effect of gas heating on excimer
distribution in DBD xe excimer lamp,” in 28th ICPIG Conference Records, (Prague,Czech Republic), July 2007.
[3.2] U. Kogelschatz, “Dielectric-barrier discharges : Their history, discharge physics, andindustrial applications,” Plasma Chemistry and Plasma Processing, vol. 23, no. 1,pp. 1–46, 2003.
[3.3] R. Casanueva, F. J. Azcondo, and S. Bracho, “Series–parallel resonant converterfor an EDM power supply,” Journal of Materials Processing Technology, vol. 149,pp. 172–177, June 2004.
[3.4] R. Casanueva, F. Azcondo, and C. Brañas, “Output current sensitivity analysisof the resonant inverter : Current-source design criteria,” IEEE Transactions onIndustrial Electronics, vol. 54, no. 3, pp. 1560–1568, 2007.
[3.5] Y. Chéron, C. Goodman, and T. Meynard, Soft commutation. London [u.a. :Chapman & Hall, 1992.
[3.6] R. Oruganti and F. Lee, “Resonant power processors, part I—State plane analysis,”IEEE Transactions on Industry Applications, vol. IA-21, no. 6, pp. 1453–1460, 1985.
[3.7] X. Bonnin, H. Piquet, D. Florez, R. Diez, and X. Bonnin, “Designing the highvoltage transformer of power supplies for dbd : windings arrangment to reduce theparasitic capacitive effects,” in Power Electronics and Applications (EPE), 201315th European Conference on, Sept. 2013.
[3.8] R. Diez, H. Piquet, and S. Bhosle, “Control of the UV emission of an excimer lampby means of a current-mode power supply,” in Industrial Electronics, 2009. IECON’09. 35th Annual Conference of IEEE, pp. 3500–3505, IEEE, Nov. 2009.
[3.9] R. Diez, H. Piquet, S. Bhosle, and J.-M. Blaquiere, “Current mode converter for die-lectric barrier discharge lamp,” in IEEE Power Electronics Specialists Conference,2008. PESC 2008, pp. 2485–2491, 2008.
[3.10] H. Piquet, S. Bhosle, R. Diez, and M. V. Erofeev, “Pulsed current-mode supplyof dielectric barrier discharge excilamps for the control of the radiated ultravioletpower,” IEEE Transactions on Plasma Science, vol. 38, pp. 2531–2538, Oct. 2010.
4 ConclusionsL’objectif principal de cette thèse était l’amélioration du rendement des systèmes de
lampes UV à excimères DBD. Avec ce but, un processus qui couvre deux grandes étapesa été conçu : La première étape de ce processus est l’étude des meilleures conditionsde fonctionnement de la performance de la lampe et la deuxième est l’amélioration durendement de la source d’alimentation électrique.Pour la première étape, une étude de l’impact du point de fonctionnement de la lampe
sur la performance de la lampe a été proposé. Pour rendre possible cette étude de laperformance, un nouvel outil scientifique qui fournit un contrôle complet et la flexibilitépour ajuster la puissance de la lampe DBD a été développé. Cet outil est une alimentationde courant en créneaux avec trois degrés de liberté sur sa forme d’onde de courant desortie : L’intensité du courant, le rapport cyclique et la fréquence.En exploitant cet équipement innovateur avec une excilamp UV XeCl DBD, l’impact
de l’intensité du courant de la lampe et de la fréquence a été révélé. A partir des résultatsobtenus (pour la plage de fonctionnement testée) la valeur de l’énergie de l’impulsioninjectée a été trouvée comme étant un facteur important dans le rendement de la lampe.Énergies d’impulsions au dessous de 300 µJ , se trouvent à fournir les meilleures condi-tions d’exploitation de la performance de la lampe. En outre, on á trové que pour unevaleur donnée de puissance électrique, l’utilisation de basse fréquence et de haute in-tensité des courants augmente la production d’ un rayonnement UV. Cependant, unediminution du gain dans le performance de la lampe pour des intensités de courantsupérieures 190mA a été établi. .Pour la deuxième étape de ce processus d’optimisation, un convertisseur à haut rende-
ment a été conçu et mis en œuvre, conçu pour fonctionner au point de fonctionnementoptimale de la lampe, trouvé avec l’étude paramétrique. Afin d’atteindre l’exigence dehaute efficacité pour cette application spécifique, un convertisseur résonant qui fonc-tionne sur la base de l’onduleur résonant série, avec commutation au courante zero(ZCS) et au mode de conduction discontinue (DCM), a été conçu. Le ZCS minimise lespertes de commutation et le DCM bénéficie la performance du système en assurant queseule les pulses de courant avec intensité las plus élevé sont utilisés pour maintenir ladécharge du gaz. Avec cet convertisseur, un rendement électrique maximum de 94% aété obtenu.


![IMMAN0UABLE L’IMMAN0UABLE - bdzoom.com · TOME 1. L’EDITO DE DÉCEMBRE L’équipe de [dBD] est particulièrement fi ère et ... Comme je lis ces titres avec mon accent portugais](https://img.pdfslide.fr/doc/110x75/5b9a9b0a09d3f21b2f8bbfe7/imman0uable-limman0uable-tome-1-ledito-de-decembre-lequipe-de.jpg)