Embed Size (px)
Citation preview
Publié par : Published by: Publicación de la:
Faculté des sciences de l’administration 2325, rue de la Terrasse Pavillon Palasis-Prince, Université Laval Québec (Québec) Canada G1V 0A6 Tél. Ph. Tel. : (418) 656-3644 Télec. Fax : (418) 656-7047
Édition électronique : Electronic publishing: Edición electrónica:
Pauline Tremblay Vice-décanat à la recherche Faculté des sciences de l’administration
Disponible sur Internet : Available on Internet Disponible por Internet :
http://www4.fsa.ulaval.ca/cms/site/fsa/accueil/recherche/publications/documentsdetravail [email protected]
DOCUMENT DE TRAVAIL 2012-016 Analogies Between Internet Networks and Logistics Service Networks: Challenges Involved in the Interconnection Rochdi SARRAJ Eric BALLOT Shenle PAN Benoît MONTREUIL Document de travail également publié par le Centre interuniversitaire de recherche sur les réseaux d’entreprise, la logistique et le transport, sous le numéro CIRRELT-2012-57
Version originale : Original manuscript: Version original:
ISBN – 978-2-89524-381-6
Série électronique mise à jour : On-line publication updated : Seria electrónica, puesta al dia
10-2012
Analogies Between Internet Networks and Logistics Service Networks: Challenges Involved in the Interconnection
Rochdi Sarraj1, Eric Ballot1, Shenle Pan1, Benoit Montreuil2
1. Centre de Gestion Scientifique, Mines ParisTech, Paris, France {rochdi.sarraj;Eric.ballot;shenle.pan}@mines-paristech.fr
2. Chaire de recherche du Canada en Ingénierie d’Entreprise
CIRRELT, Université Laval, Québec, Canada [email protected]
The essence of the content of this document is to be published in the Journal of Intelligent Manufacturing (2012)
ABSTRACT
Logistics networks supporting current supply chains are intertwined yet remain heterogeneous and only slightly interconnected. In computer networks, this stage was overtaken with the arrival of Internet. This paper explores the possible analogies and transpositions between computer networks, in particular Internet, and logistics service networks. To this end, a new logistical concept was proposed: The Physical Internet that aims at the interconnection of logistics service networks. The paper shows that there are strong similarities between these networks even though the basic differences between digital and physical objects prevent an integral transposition. To illustrate the pertinence of this analogy, the paper provides an assessment of the potential impact of interconnecting logistics networks with a stylised analytic model based on a method of continuous approximations.
Keywords: Logistics networks, Supply chain, Physical Internet, Analogy, Interconnection, Continuous approximation
2
1. Introduction The supply chain proposes a simplified picture of the logistic organization that emphasises the recurrent interdependence between the client and his supplier. However, real supply chains mobilise sets of suppliers and clients whose tree-like relationships geographically overlap to form complex supply networks with entangled flows (Stefanovic and Stefanovic 2008).
From this point of view, it is possible to assimilate all logistic services with a series of networks that, today, are independently evolving (design, dedicated truck, warehouse reserved for a company, etc.) while sharing infrastructures (roads, railways, etc.).
This independence of logistics networks leads to inefficiency by over-use of means often dedicated to each organization. Services providers, which could improve the functioning of logistics, do not solve this issue due to the difficulty for each of them, on a fragmented market, to find synergies between few and antagonist customers’ requirements.
One of the solutions to overcome the problem is collaboration. Nowadays collaboration is ever more studied and applied between distinct supply chains to globally improve the logistic efficiency of the collaborating partners. In this regard, some researches about collaborative networks have recently pointed out the importance of connecting networks to create synergy (Camarinha-Matos and Afsarmanesh 2005; Camarinha-Matos and Afsarmanesh 2007). A collaborative logistics network can be defined as a network with a variety of logistical entities (e.g., local logistics networks, service providers, suppliers or clients, etc.) that can be highly autonomous and geographically distributed yet share goals and a joint operating environment (Camarinha-Matos and Afsarmanesh 2005). For example one of the joint goals is often to optimise freight transport within the network. This goal, as well the concept of global interconnected and collaborative networks, naturally conducts us to think of the Digital Internet networks. From this point of view, the idea of an analogy between the Digital Internet and logistics networks was proposed by (Montreuil 2010).
The Digital Internet provides the best known interconnected networks, yet others exist such as in the evolving electric grid. In fact, fundamentally, the Internet is the interconnection of computer networks in a manner transparent to the user. It enables the transmission of data packets in the form of standardized formats (datagrams) through heterogeneous equipment. The Internet, that was at the beginning presented as a metaphor for the information highway where each element of information flows independently, was a break in the design of telecommunication networks and eventually became a revolution.
The recently introduced Physical Internet (Montreuil et al. 2010) proposes a new organization of logistics and transport. It proposes exploring the impact of the change from dissociated logistic services networks, without any coherence between them, to open logistics networks based on universal interconnectivity.
The first section of this paper highlights reasons for questioning the current organization of logistics. The second section examines the possible transposition of Digital Internet concepts on a new logistical organisation based on the Physical Internet. After defining the interconnection of networks, three main facets of Internet are analysed: the typology of the Internet networks, the routing in an interconnected network and its organisation. For each of these facets, the paper proposes analogies applicable to logistics, thereby specifying the concept of Physical Internet. The third section provides an illustration of the concept and a first assessment of its impact on freight transport. This demonstration provides an idea about the extent of the challenges between the performance of the current logistics organisation and that of Physical Internet, as well as many great research prospects.
3
2. Motivations for interconnecting logistic networks Improving performance and reducing cost of logistics and freight transport are familiar problems for which research has provided numerous solutions, such as improved logistics network optimisation (Chopra and Meindl 2004) and transport management (Daganzo 1984).
However, increased environmental concerns have an impact on supply chains and, in particular, on the induced transport (McKinnon and Piecyk 2009; Le and Lee 2011). For example, CO2 emission currently represents a major criterion that industrialists are trying to reduce. This especially concerns those involved in the transport of merchandises. Freight transportation alone accounts for 14 % of all CO2 emissions in France, thereby representing the main source of CO2 emission in that country. It is also growing considerably due to about 33 % increase in flow intensity every 10 to 15 years (Boissieu 2006; Citepa 2009).
Moreover, several studies have demonstrated the low level of use of resources in freight transport (McKinnon et al. 2003; Ballot and Fontane 2008). This is a source of potential improvement that is very difficult to achieve within current organisations.
Various methods have been proposed for optimising logistics to reduce the CO2 emission, such as horizontal cooperation (Cruijssen et al. 2007; Cheikhrouhou et al. 2010), supply chains pooling (Pan et al. 2010) and multimodal transport (Bontekoning and Priemus 2004; Groothedde et al. 2005). However, these approaches alone, even if they help improve the current situation, remain partial solutions. They are not sufficient to enable really reaching tough goals such as the European targets of a 20 % reduction in emissions by 2020 and 75 % by 2050 (Piecyk and McKinnon 2010). Such results require more radical changes in terms of organization, including in logistics that is the generator of freight transport demand.
The Physical Internet, the new logistics concept here examined, builds on an analogy with the Digital Internet that enabled the development of a global system of data transport across heterogeneous networks exploiting standard datagrams and protocols. The goal of the Physical Internet is to achieve locally focused systems with global reach that are more economically, environmentally, and socially efficient and sustainable than contemporary systems. As vividly expressed through collaborative work during the Physical Internet NSF Workshop held at Georgia Tech (Atlanta, U.S.A.) in May 2010 it is the natural evolution and integration of container standardization and intelligence, broadband communication, cloud computing, and deregulation in transport, catalysed by new logistics business models.
3. Analogy between Digital Internet and Physical Internet The analogy between the original Digital Internet and the novel Physical Internet can be expressed through three main characteristics: the interconnection of networks, the structure of the network of networks and the routing of objects across networks.
3.1 The interconnection of networks
Internet is said to be the network of networks since it represents the universal interconnection of computer networks.
3.1.1 The interconnection of digital networks
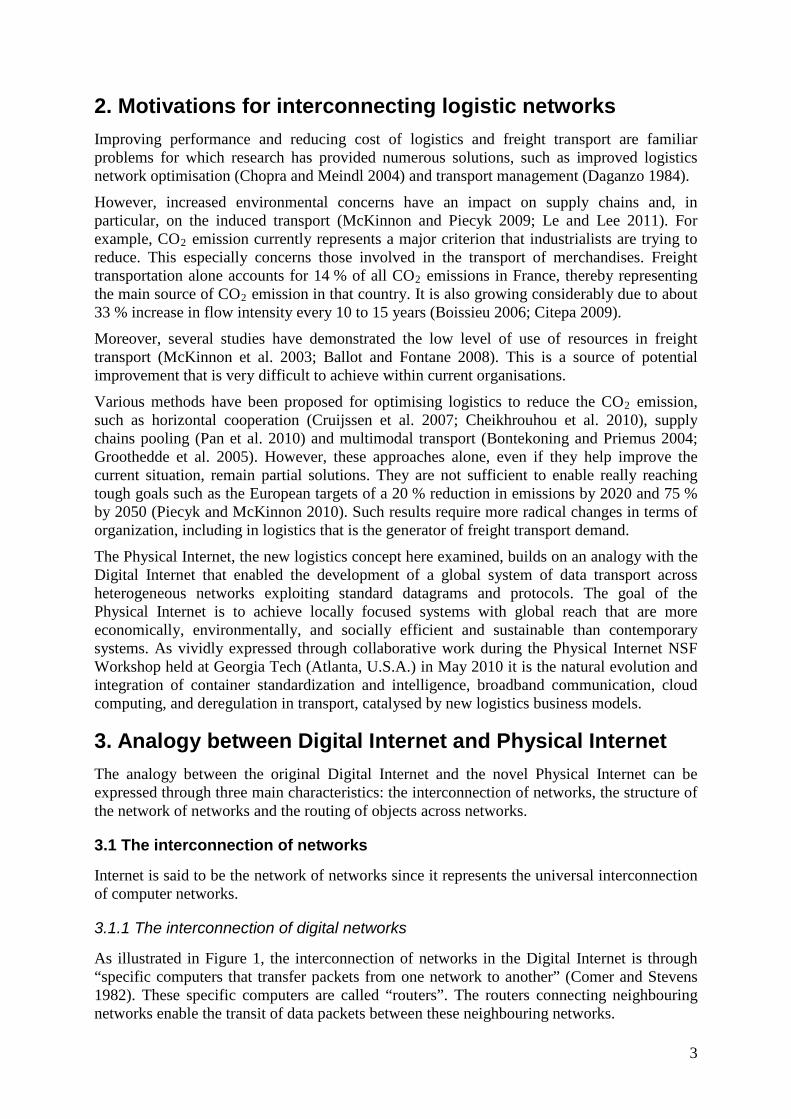
As illustrated in Figure 1, the interconnection of networks in the Digital Internet is through “specific computers that transfer packets from one network to another” (Comer and Stevens 1982). These specific computers are called “routers”. The routers connecting neighbouring networks enable the transit of data packets between these neighbouring networks.
4
These data packets, called datagrams, have standardised characteristics such as size and structure. By extension, in order to transit between two computers several networks apart, datagrams are sequentially transmitted via the routers interconnecting the different intermediate networks they pass through.
Figure 1: Interconnection of networks via the routers
The same operating logic is found within each of these networks, based on routers letting the network hosts communicate with each other and with outside networks. The router role is to dispatch datagrams, indicating upon their arrival the next router along their route to their final destination.
3.1.2 The interconnection of logistics networks
This section proposes how to transpose the Digital Internet interconnection of networks so as to interconnect a set of logistic service networks such as advocated by the Physical Internet concept.
Currently, in logistics, there are many company-defined service networks that are based on fixed and/or dedicated logistics plans. For example, the logistic service network between a supplier and the retailers it supplies, or yet the logistics network of an express carrier, are mostly dissociated from other networks and each actor in these networks works independently from the others.
The idea of the Physical Internet (PI, π) is to interconnect all of these logistic service networks through the transposition of the principles of the Internet. Therefore, the aim is for the universal interconnection of logistic networks.
Whereas the Digital Internet networks have the following physical elements: cables, hosts and routers, the Physical Internet faces a more complex reality in terms of physical elements.
Physically, a logistic service is carried out according to a transport service based on a network consisting of nodes (including distribution centres, warehouses, plants, etc.), arcs to define the goods transfer means by freight services (road, rail, maritime services, etc.) and final shippers/receivers (companies, organizations or individuals).
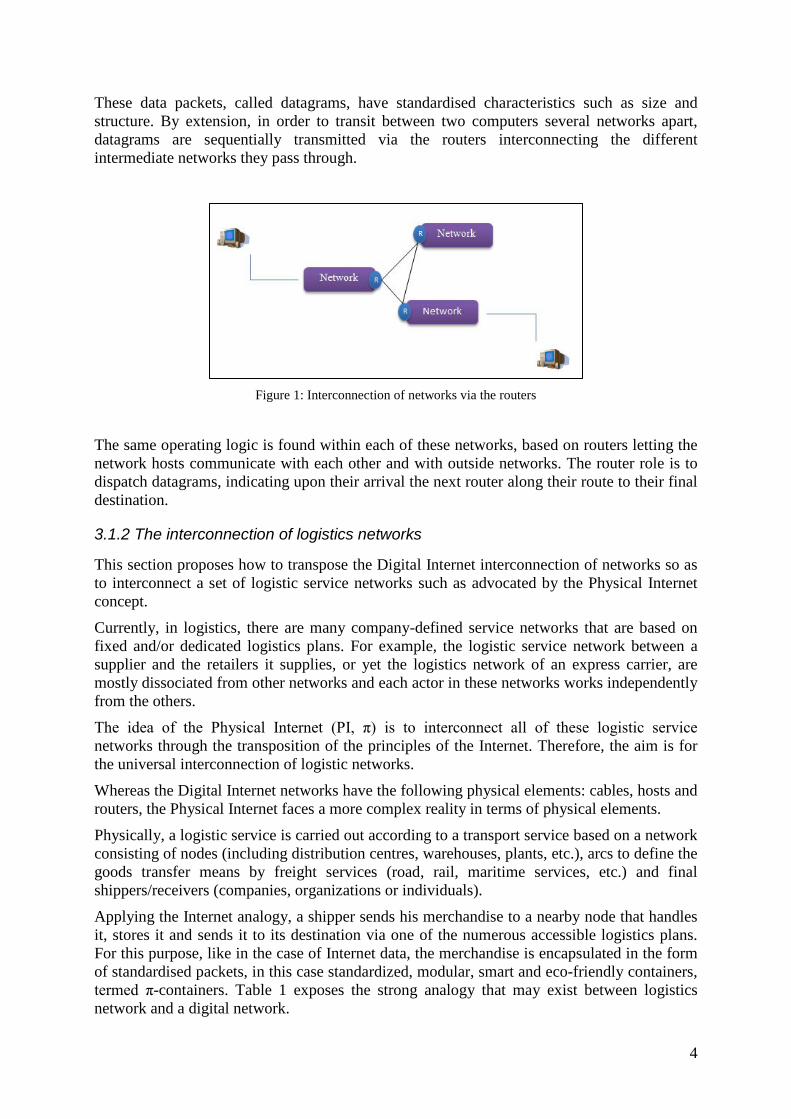
Applying the Internet analogy, a shipper sends his merchandise to a nearby node that handles it, stores it and sends it to its destination via one of the numerous accessible logistics plans. For this purpose, like in the case of Internet data, the merchandise is encapsulated in the form of standardised packets, in this case standardized, modular, smart and eco-friendly containers, termed π-containers. Table 1 exposes the strong analogy that may exist between logistics network and a digital network.
5
Network Internet Physical Internet Interconnection function
Flow Datagram π-Container Encapsulation of merchandise
Node
Router Hub Place of orientation (sorting),
change of mode, service provider.
Host (unique address) Supplier or consumer Place of containerisation and
de-containerisation
Arc Wire or wave connection Transport services Punctual or regular transport
between two nodes.
Table 1: Analogy between digital networks and physical networks
A host in the Digital Internet transposes into a place of entry or exit from the Physical Internet networks. It is a place where goods are containerised or de-containerised. It may also consist of a station on an assembly line, an aisle in a retail store or even someone’s home.
The interconnection between two logistics networks may also be made via the creation of new transport services between the nodes of two distinct networks. In fact, a shipper from one network may transmit its π-containers to a hub in another network. In addition, a node from one network may send π-containers to a node in another network. This leads to two networks interconnected through nodes providing the routing of π-containers from their source to their destination with the possibility of passing through intermediate networks. This very logical and intuitive way of interconnecting networks already exists in the form of traffic sharing agreements, although without possible generalization without global standardisation.
Moreover, it is also possible to interconnect two heterogeneous logistical networks by adding specific nodes, thereby providing for example the transit of π-containers between the local road networks and wide-area rail networks. This logic is also found in the interconnection of computing networks with the concept of Internet backbone1 (Peterson and Davie 2003; Tanenbaum 2003).
The next section examines the global structure of the interconnection of logistics networks enabling the Physical Internet.
3.2 The structure of the network of networks
3.2.1 Architecture of the Digital Internet network
Universal interconnectivity enables to connect any node to any other node. This does not mean that there is an arc from each node to each node. On the contrary, faced with the high number of Internet users, the Digital Internet network was designed to limit the number of arcs for reasons of investment and ease of routing. This is examined hereafter. 1 An Internet backbone is a computer network as part of long-haul networks over broadband Internet.
6
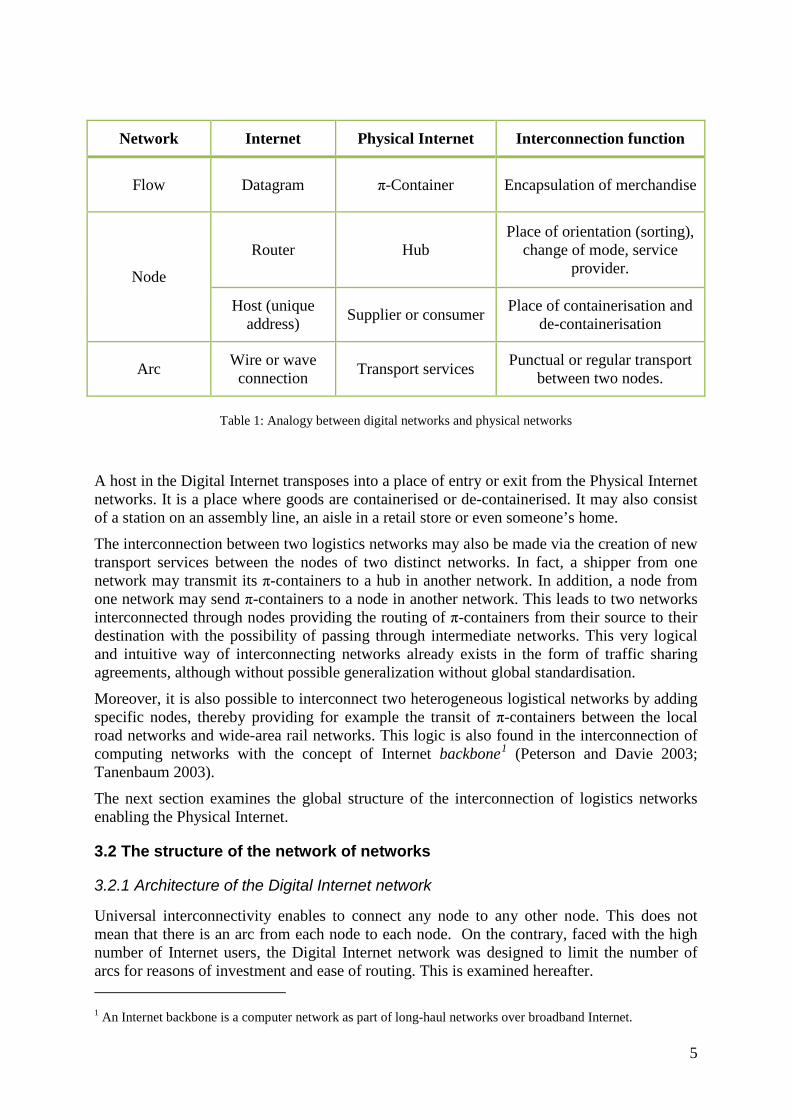
The Digital Internet has a fractal structure. Indeed its network topology is similar at all levels, from local to intercontinental networks. As shown in Figure 2, it consists, on its highest hierarchical level, of a set of large interconnected networks, called “Autonomous Systems” (AS). These were introduced since the Digital Internet is not controlled by a single administrator. Each AS is independently managed by a single operator. In general, an AS corresponds to a large public or private operator. Distinct AS communicate with each other via specific routers called “border routers”, using specialized protocols2. Within an AS, data is routed by so-called “internal routers” and internal communication is carried out with other types of protocols (Stewart III 1998; Huitema 1999; Hardy et al. 2002).
Figure 2: Internet concept map as a network interconnecting autonomous systems
These relationships between the distinct AS are functional, meaning that these AS may be geographically combined, concurrently operating in the same geographical area. In addition, each autonomous system consists of other networks that are “zones” (or “areas”). In both cases, we speak of sub-networks with or without their own management (protocols). This decomposition may continue at a third level with sub-networks of sub-networks and so on until reaching the local network or a host. There are not a specific number of levels in the Internet network. However, practice indicates that it is possible to distinguish three hierarchical levels, where the lowest level (level 1) corresponds in general to Digital Internet access providers (IAP) or intra-university routers (such as Rénater in France) (Hardy et al. 2002).
2 It’s a group of rules for exchanging messages (communicate) in or between computing systems.
7
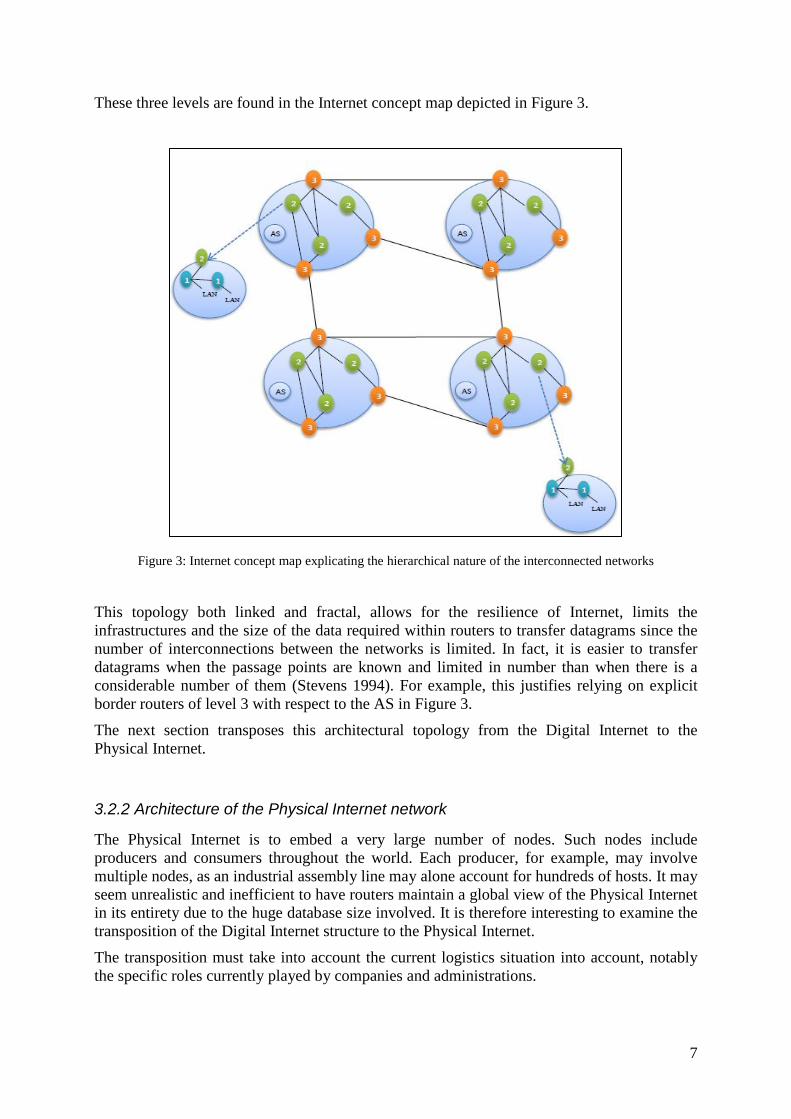
These three levels are found in the Internet concept map depicted in Figure 3.
Figure 3: Internet concept map explicating the hierarchical nature of the interconnected networks
This topology both linked and fractal, allows for the resilience of Internet, limits the infrastructures and the size of the data required within routers to transfer datagrams since the number of interconnections between the networks is limited. In fact, it is easier to transfer datagrams when the passage points are known and limited in number than when there is a considerable number of them (Stevens 1994). For example, this justifies relying on explicit border routers of level 3 with respect to the AS in Figure 3.
The next section transposes this architectural topology from the Digital Internet to the Physical Internet.
3.2.2 Architecture of the Physical Internet network
The Physical Internet is to embed a very large number of nodes. Such nodes include producers and consumers throughout the world. Each producer, for example, may involve multiple nodes, as an industrial assembly line may alone account for hundreds of hosts. It may seem unrealistic and inefficient to have routers maintain a global view of the Physical Internet in its entirety due to the huge database size involved. It is therefore interesting to examine the transposition of the Digital Internet structure to the Physical Internet.
The transposition must take into account the current logistics situation into account, notably the specific roles currently played by companies and administrations.
8
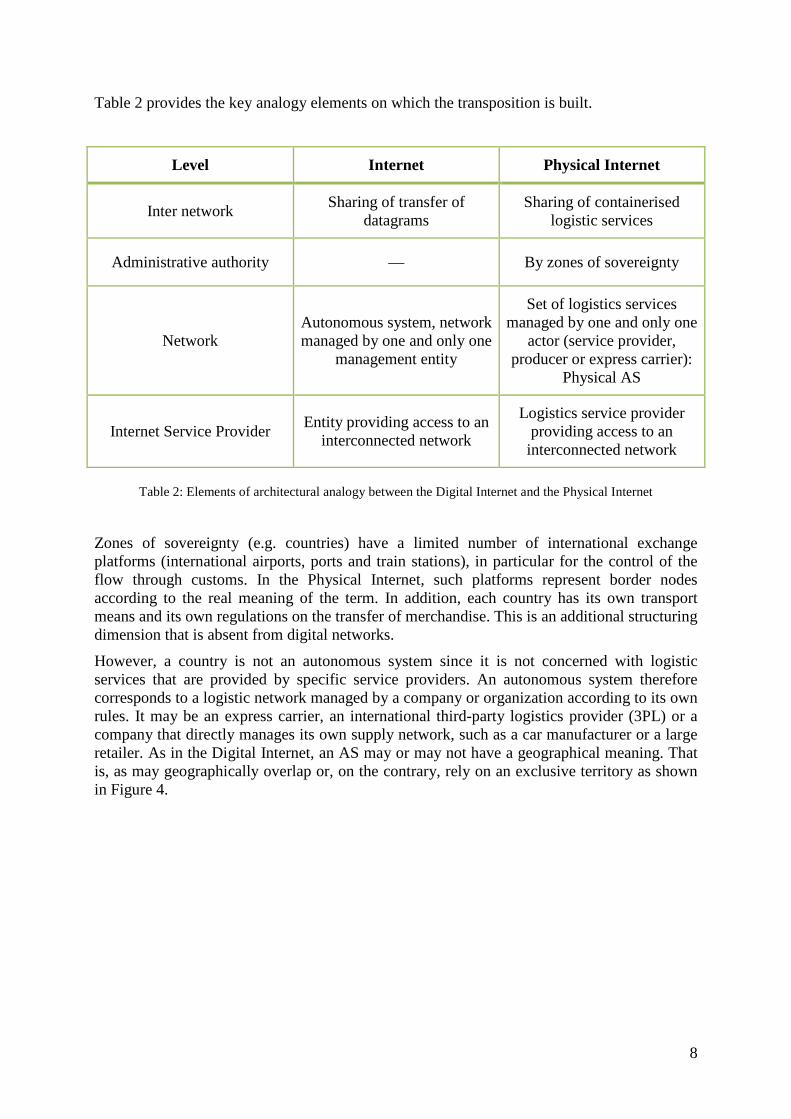
Table 2 provides the key analogy elements on which the transposition is built.
Level Internet Physical Internet
Inter network Sharing of transfer of datagrams
Sharing of containerised logistic services
Administrative authority — By zones of sovereignty
Network Autonomous system, network managed by one and only one
management entity
Set of logistics services managed by one and only one
actor (service provider, producer or express carrier):
Physical AS
Internet Service Provider Entity providing access to an interconnected network
Logistics service provider providing access to an
interconnected network
Table 2: Elements of architectural analogy between the Digital Internet and the Physical Internet
Zones of sovereignty (e.g. countries) have a limited number of international exchange platforms (international airports, ports and train stations), in particular for the control of the flow through customs. In the Physical Internet, such platforms represent border nodes according to the real meaning of the term. In addition, each country has its own transport means and its own regulations on the transfer of merchandise. This is an additional structuring dimension that is absent from digital networks.
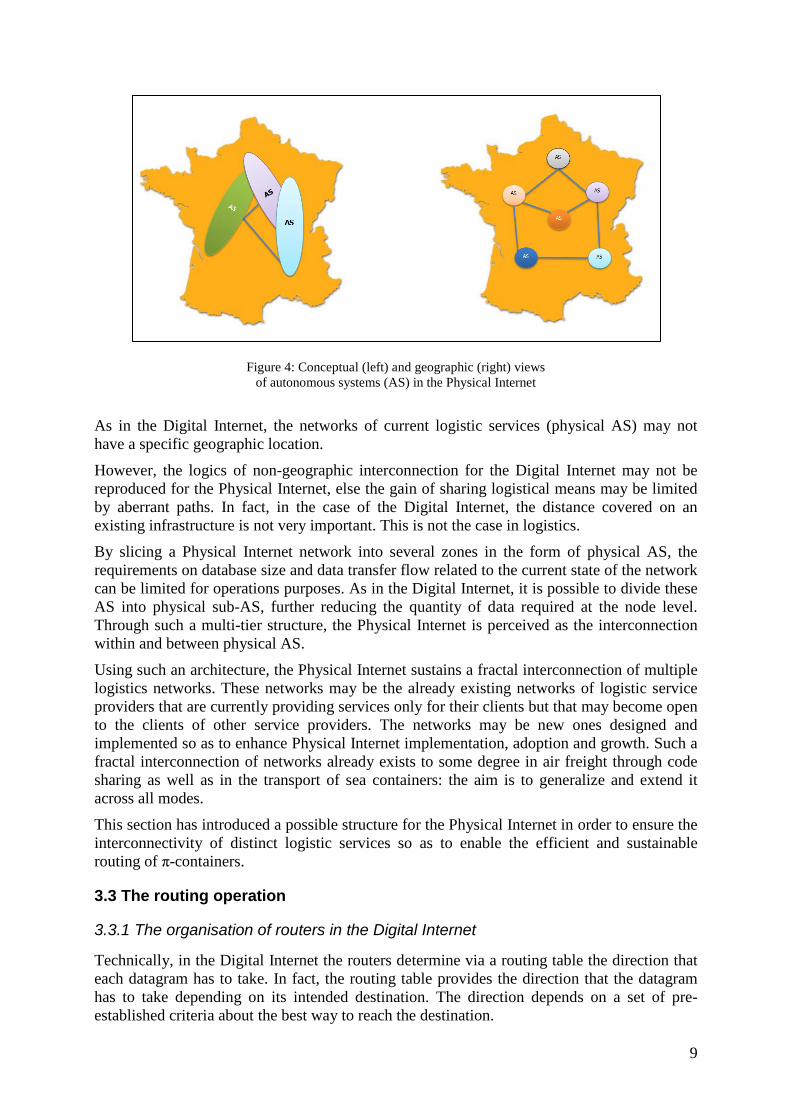
However, a country is not an autonomous system since it is not concerned with logistic services that are provided by specific service providers. An autonomous system therefore corresponds to a logistic network managed by a company or organization according to its own rules. It may be an express carrier, an international third-party logistics provider (3PL) or a company that directly manages its own supply network, such as a car manufacturer or a large retailer. As in the Digital Internet, an AS may or may not have a geographical meaning. That is, as may geographically overlap or, on the contrary, rely on an exclusive territory as shown in Figure 4.
9
Figure 4: Conceptual (left) and geographic (right) views of autonomous systems (AS) in the Physical Internet
As in the Digital Internet, the networks of current logistic services (physical AS) may not have a specific geographic location.
However, the logics of non-geographic interconnection for the Digital Internet may not be reproduced for the Physical Internet, else the gain of sharing logistical means may be limited by aberrant paths. In fact, in the case of the Digital Internet, the distance covered on an existing infrastructure is not very important. This is not the case in logistics.
By slicing a Physical Internet network into several zones in the form of physical AS, the requirements on database size and data transfer flow related to the current state of the network can be limited for operations purposes. As in the Digital Internet, it is possible to divide these AS into physical sub-AS, further reducing the quantity of data required at the node level. Through such a multi-tier structure, the Physical Internet is perceived as the interconnection within and between physical AS.
Using such an architecture, the Physical Internet sustains a fractal interconnection of multiple logistics networks. These networks may be the already existing networks of logistic service providers that are currently providing services only for their clients but that may become open to the clients of other service providers. The networks may be new ones designed and implemented so as to enhance Physical Internet implementation, adoption and growth. Such a fractal interconnection of networks already exists to some degree in air freight through code sharing as well as in the transport of sea containers: the aim is to generalize and extend it across all modes.
This section has introduced a possible structure for the Physical Internet in order to ensure the interconnectivity of distinct logistic services so as to enable the efficient and sustainable routing of π-containers.
3.3 The routing operation
3.3.1 The organisation of routers in the Digital Internet
Technically, in the Digital Internet the routers determine via a routing table the direction that each datagram has to take. In fact, the routing table provides the direction that the datagram has to take depending on its intended destination. The direction depends on a set of pre-established criteria about the best way to reach the destination.
10
The routing table provides the direction by stating the next router that the datagram has to take (Huitema 1999). By way of analogy, it is like a roundabout with direction panels for each destination and a road between two roundabouts representing a connection between two routers. The construction of its routing table is fairly complicated and its size depends on the networks that the correspondent router interconnects (Comer and Stevens 1982).
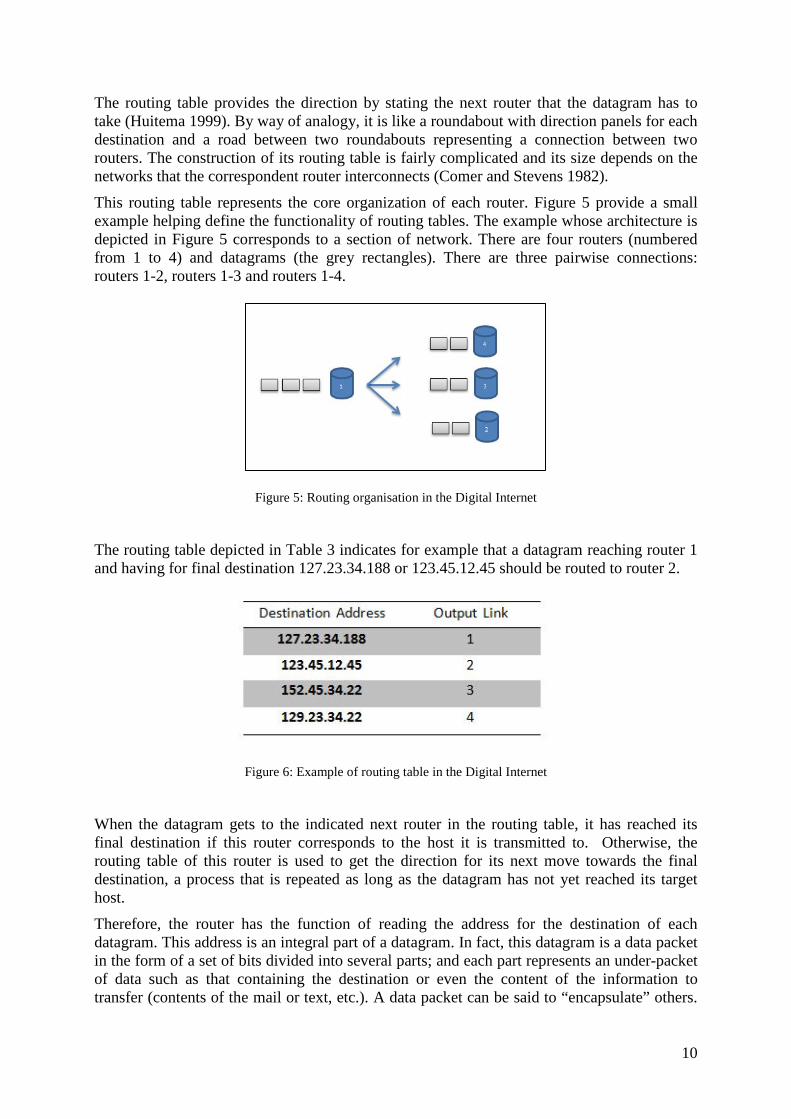
This routing table represents the core organization of each router. Figure 5 provide a small example helping define the functionality of routing tables. The example whose architecture is depicted in Figure 5 corresponds to a section of network. There are four routers (numbered from 1 to 4) and datagrams (the grey rectangles). There are three pairwise connections: routers 1-2, routers 1-3 and routers 1-4.
Figure 5: Routing organisation in the Digital Internet
The routing table depicted in Table 3 indicates for example that a datagram reaching router 1 and having for final destination 127.23.34.188 or 123.45.12.45 should be routed to router 2.
Figure 6: Example of routing table in the Digital Internet
When the datagram gets to the indicated next router in the routing table, it has reached its final destination if this router corresponds to the host it is transmitted to. Otherwise, the routing table of this router is used to get the direction for its next move towards the final destination, a process that is repeated as long as the datagram has not yet reached its target host.
Therefore, the router has the function of reading the address for the destination of each datagram. This address is an integral part of a datagram. In fact, this datagram is a data packet in the form of a set of bits divided into several parts; and each part represents an under-packet of data such as that containing the destination or even the content of the information to transfer (contents of the mail or text, etc.). A data packet can be said to “encapsulate” others.
11
In addition, during the transport phase (for example, between routers), the datagrams are encapsulated in “frames3” that may contain one or several datagrams.
Thereby, when a datagram reaches a router, it is extracted from the frame and is inserted in the waiting line before being processed. In fact, the router reads the heading of the datagrams and specially the part involving the destination. It then places the datagram on the corresponding exit portal and transfers it via another frame to the neighbouring router, and so on until it reaches its destination.
The next section transposes the concepts of encapsulation, datagrams, frames, waiting lines, and routing tables to the Physical Internet.
3.3.2 The routing operation in the Physical Internet
The ideas of encapsulating data packets in a datagram, of encapsulating such datagrams in frames for transportation purposes, and of de-capsulations and re-encapsulations being performed during the passages by the routers, may be transposed to logistics. This requires proposing a model encapsulating freight in standardised containers (equivalent to datagrams) interfaced on specific means of transport (equivalent to frames) (Ballot et al. 2010). The Physical Internet can be conceptualized as consisting of nodes that receive π-containers, and possibly sort and recompose the π-containers to optimise the transport in each segment. The set of π-containers obtained are then to be transferred according to the destination to the next node.
It is then possible to transpose to the Physical Internet the idea of routing table used in the Digital Internet. Such a routing table can be used in each router present at each node (e.g. π-hub), helping to determine the best next node to move a π-container in its way toward reaching its final destination. This best node depends on the preferred set of criteria, for example transport cost, delivery time and/or CO2 emissions. The analogy between the roles of the different physical components of the Digital Internet and the Physical Internet is reinforced, in particular between the routers and the π-hubs as illustrated in Table 3.
In the Digital Internet, the routing of datagrams outside or inside AS does not occur in the same way since the business model chosen is different, which is translated through multiple protocols. This distinction is also important regarding the relationships between the logistic service providers.
3 A frame is composed of a header, information that we want to transmit, and a postamble (trailer). A packet cannot pass directly over a network: it is encapsulated within a frame.
12
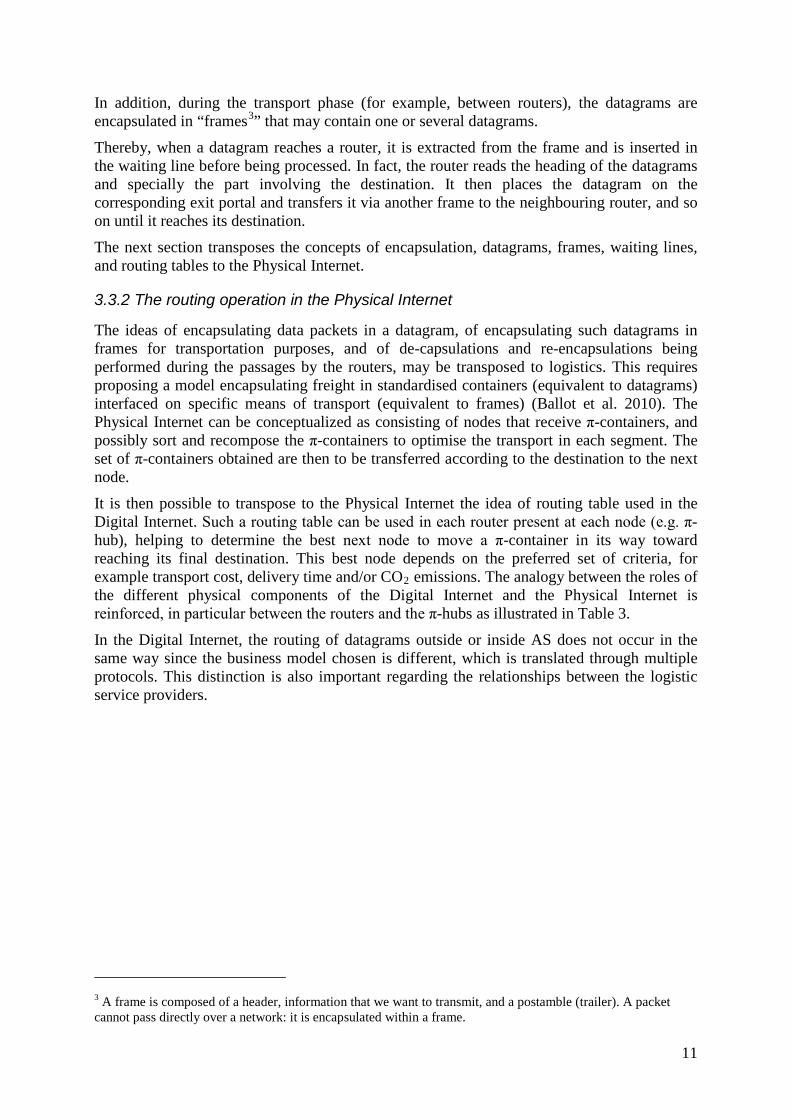
Function Digital Internet routers Physical Internet π-hubs
Receiving De framing and framing4 according to the network
protocols used
Unloading and/or decomposition of arriving π-containers
Routing Transfer following a table Selection of the next destination for each π-container
Shipment Framing according to the selected network
Composition of π-containers and loading on transport means
Table 3: Analogy between Digital Internet routers and Physical Internet π-hubs
The analogy between the routers and the nodes of the Physical Internet obviously has limits since the logistic function of the π-hubs is not summed up by routing. The construction of the Physical Internet should take into account the real needs of logistics such as the management of transport capacities and the sorting in π-hubs that is not raised in the same way as in the Digital Internet where the protocol agrees to “pay in order to see”, that is, to re-send other copied-datagrams if the originals were lost or victims of blocking. In the Physical Internet, the routing protocols between nodes such as π-hubs may use the best understanding of flow and estimate of their future state to prepare the routing. This is not the case in Digital Internet. In fact, the Physical Internet may benefit from a favourable ratio between its costs means and the one of collecting informations about these same means.
Having defined the main aspects of what will be the Physical Internet and validated the analogy, the next section assesses its potential improvement over the current logistics organisation. As a first approach, a simplified analytical model is proposed for both topologies and these analytical models are used to estimate the relative gains in terms of key metrics.
4. Potential of Physical Internet network compared to the current organisation
In order to analyse the impact of evolving from the current logistic organisation to a Physical Internet organisation, this section compares their flow travel and transport efficiency. In line with the exploratory nature of the paper, this is achieved via a theoretic model for a simple industry setting case in a given territory (Antonelli and Caroleo 2011).
Consider a territory of area A within which exists a total demand over a planning horizon. Assume that this demand is homogeneously distributed across the territory. The territory is divided in n regions and hosts R distributors. Each distributor possesses S stores for covering the set of regions. These stores are positioned randomly in a homogeneous manner.
4 Encapsulate Datagrams in Frames
Λ
13
They are supplied by regional distribution centers and each distributor owns one such regional distribution center per region. These distribution centers are themselves supplied from warehouses belonging to the suppliers. Consider that each supplier M has one warehouse fed by its P manufacturing plants. Each of these plants makes a different product and they are spread homogeneously across the territory. All suppliers have therefore the same number of plants and warehouses while all retailers have the same number of distribution centers and stores. This is a strong hypothesis, imposed for simplifying notations and readability of equations, which could be relaxed without much difficulty.
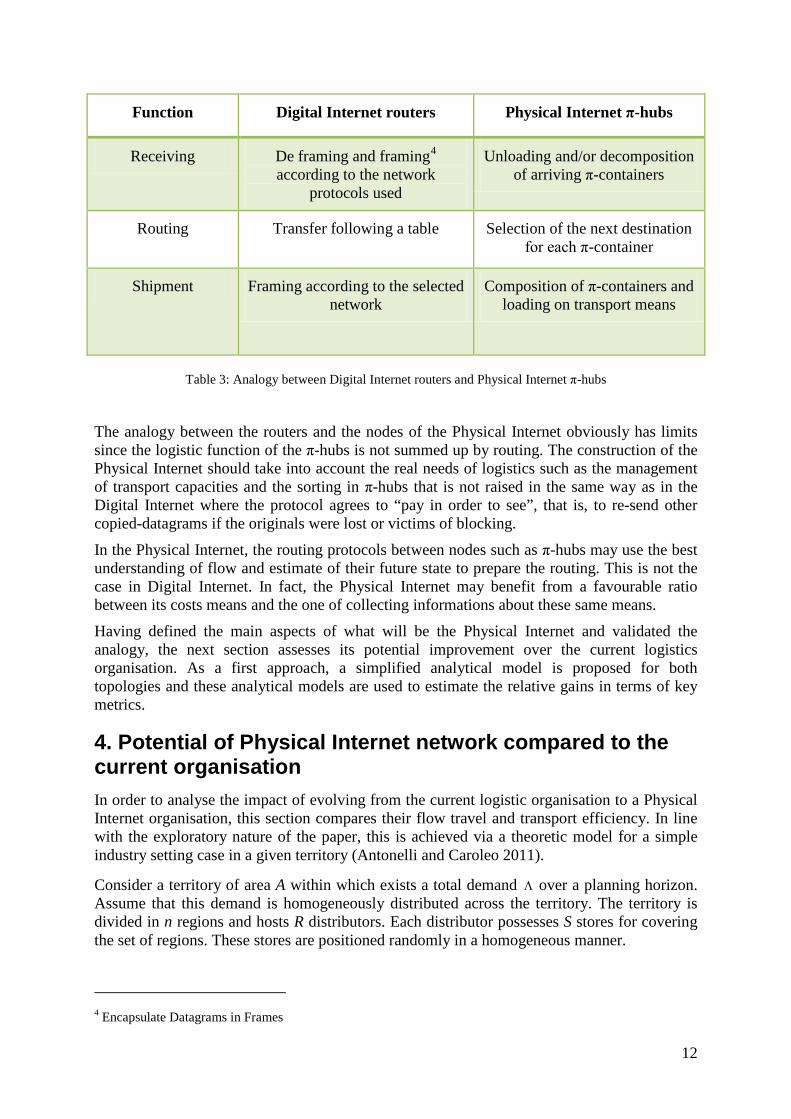
Figure 7: Contrasting in the left side a supplier-retailer instance of the coupling between the supplier’s warehouse and the retailer’s distribution centers in the current logistics model and, in the right side, the couplings between the regional AS (1π-hub for every AS) in the Physical Internet logistics model
Figure 7 illustrates the application of this model in a geographical space: a territory composed of seven hexagonal regions. On the left side of the figure focused on the current logistics model, there is a distribution center per region, as well as a warehouse per supplier at the center of the geographical space. These logistic nodes are not optimised in terms of quantity, only in terms of location. The left side of the figure shows also the coupling between a supplier’s warehouse and a retailer’s regional distribution centers: there are M times R instances of this schematic, corresponding to all supplier-retailer couplings. The distributed factories and stores are not depicted in Figure 7 even though they are present in both models.
The right side of Figure 7 is an illustration of PI relative to the current situation. Every region is represented by one autonomous system, with a single π-hub per AS. The π-hub corresponding to every AS represents both a Border and an Intern π-hub (Node). Every π-hub is the only Node that gives access from the AS to outside and concurrently provides access to the region from others AS (outside). The right side of Figure 7, focused on the Physical Internet model, has a single instance, showing the couplings between the regional π-hubs.
The model selected for evaluating both logistics organizations is based on the continuous approximation methodology (Daganzo 1984; Daganzo 2005). This approach, even though less precise than simulation or optimisation, is privileged here because it allows an analytical formalization and therefore enables an understanding of the factors differentiating the studied topological organizations.
14
4.1 Flow travel in the current logistics model
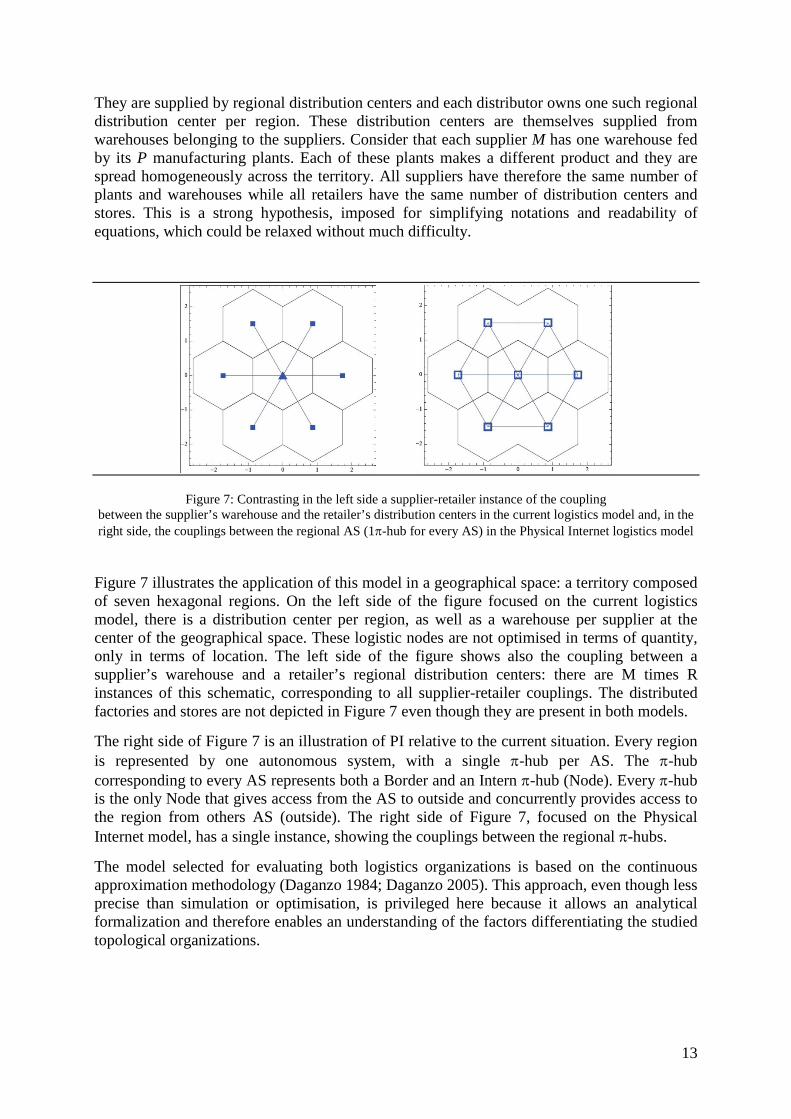
Each manufacturer-retailer (M-R) coupling presented on the left side of Figure 7 is in fact a segment of a classical supply chain model. It is constituted of a set of retailers operating stores fed by their distribution centers, and a set of manufacturing suppliers feeding from their factories a central warehouse supplying the retailers’ distribution centers, as shown in Figure 8. This chain could be extended downstream and upstream, yet it is already representative of supply chains for consumer goods, new vehicles, and so on.
Figure 8: Classical structure of a supply chain
In order to evaluate the current logistic organization, the flows are formalized for each segment of the supply chains. The first type of segment links a supplier’s plant and its warehouse. The number of such segments is equal to the product of the number M of suppliers and their number P of plants, or M⋅P. It is assumed that the total production equals to the total demand and that the production of each supplier is spread uniformly across its factories. Thus, the production of a specific plant can be computed through equation (1).
(1)
The expected flow travel can thus be defined as where is the expected Euclidean distance between a generic plant P and the generic warehouse WH.
In the same manner, the expected flow travel between a warehouse and a distribution center is given by with
(2)
Indeed, flows are segmented by producer, retailer and region.
Finally the downstream flows are regional flows realized through tours from each distribution center of a retailer to the stores it supplies. The volume to distribute is equal to the total demand divided by the number of retailers and regions.
(3)
λU =Λ
M ⋅ P
fU = λU ⋅ Ε(d(P,WH)) = λU ⋅ dU
Ε(d(P,WH))
fI = λI ⋅ Ε(d(WH,DC)) = λI ⋅ dI
λI =Λ
M ⋅ R⋅ n
λd
λd =Λ
R⋅ n
15
The distance to travel is estimated by the continuous approximation method (Daganzo 2005). The resulting estimation of the length of a tour serving the S/n stores (S is the number of stores) of a retailer in a region can be computed using equation (4) where A/n is the identical area of every region and k’ is a constant (k’=0.75 for Euclidean distance).
(4)
Flow travel from distribution centers to stores is defined based on the flow measure convention used in France for the European Commission statistics (European Commission 2008). With this convention flows supplied by delivery tours are counted as half the t.km, thus:
(5)
Define a as the length of a regional hexagonal side in Figure 7. The area of a region is thus 3√3.𝛼2
2 and the total area is 21√3.𝛼2
2.
It is necessary to compute the distance between a factory and the central warehouse for each supplier, the distance between a supplier’s warehouse and the distribution centers of a retailer, and the tour distances in the regions.
In order to compute the expected distance between a supplier’s factory and its central warehouse, the overall space is approximated by a disk of radius , which corresponds at
worst case to an error of 4% checked by Monte-Carlo simulation. The expected distance between a distributed factory and the central warehouse can thus be estimated to be 2/3 of the radius, so .
The expected distance between a supplier’s central warehouse and a regional distribution center of a retailer requires distinguishing seven cases. There are six regions for which the distance can be estimated as shown above as and there is the central region with an estimated zero, assuming approximate identical central location of both the warehouse and the distribution center in the region. Thus the expected distance between a regional distribution center and a warehouse can be estimated as
.
The expected distribution tour length, with substitution of specific area data and store number, is:
Summing all flow travel components allows estimating the expected total flow travel in the current logistics model through equation (6).
(6)
dd = ′ k Sn
⋅An
= ′ k n
S⋅ A since n ≥ 0
fd =12
λd ⋅ dd
32
3⋅ α
E(d(P,WH)) = 3⋅ α
3⋅ α
E(d(WH,DC)) =67
3⋅ α
E(dd ) =k'7
α 2 ⋅ S⋅212
3
Factual = λU dUUpper flows
∑ + λI dIInter flows∑ + λd dd
Distrib flows∑ = Λ⋅ α 3 + α
67
3 +12
⋅k'7
α 2 ⋅ S⋅212
3
16
4.2 Flows travel in the Physical Internet Model
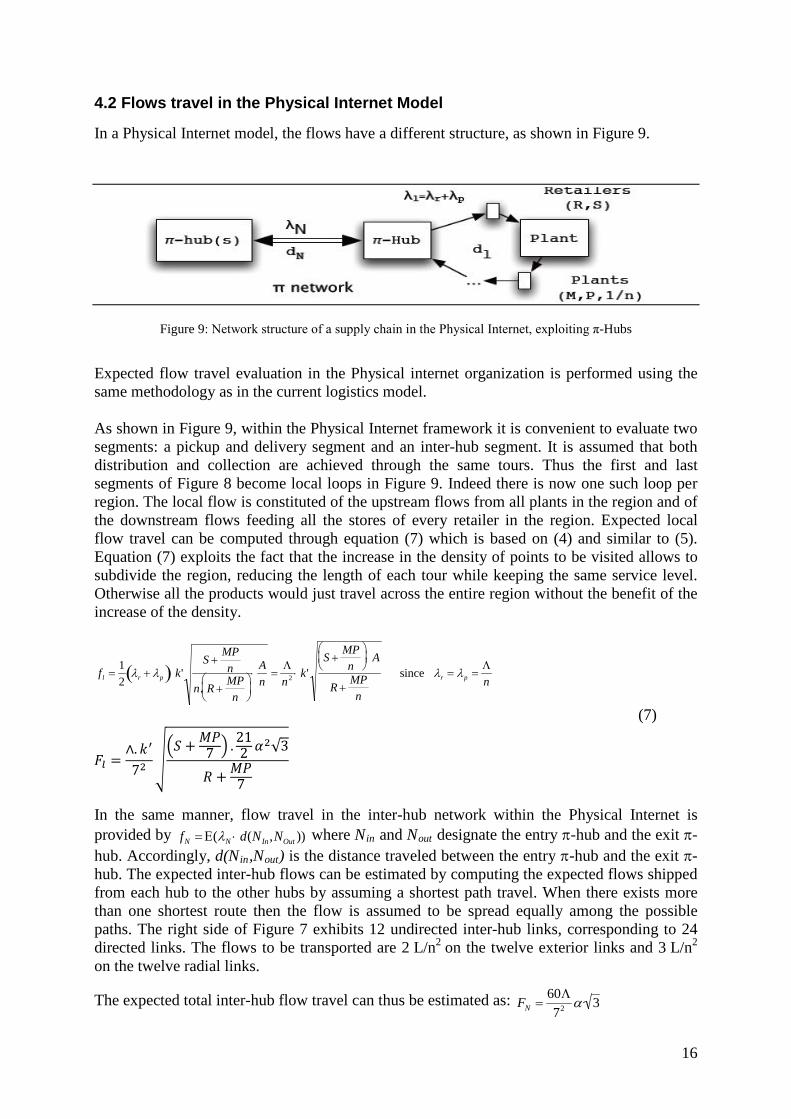
In a Physical Internet model, the flows have a different structure, as shown in Figure 9.
Figure 9: Network structure of a supply chain in the Physical Internet, exploiting π-Hubs
Expected flow travel evaluation in the Physical internet organization is performed using the same methodology as in the current logistics model. As shown in Figure 9, within the Physical Internet framework it is convenient to evaluate two segments: a pickup and delivery segment and an inter-hub segment. It is assumed that both distribution and collection are achieved through the same tours. Thus the first and last segments of Figure 8 become local loops in Figure 9. Indeed there is now one such loop per region. The local flow is constituted of the upstream flows from all plants in the region and of the downstream flows feeding all the stores of every retailer in the region. Expected local flow travel can be computed through equation (7) which is based on (4) and similar to (5). Equation (7) exploits the fact that the increase in the density of points to be visited allows to subdivide the region, reducing the length of each tour while keeping the same service level. Otherwise all the products would just travel across the entire region without the benefit of the increase of the density.
(7)
𝐹𝑙 =∧.𝑘′
72��𝑆 + 𝑀𝑃
7 � . 212 𝛼2√3
𝑅 + 𝑀𝑃7
In the same manner, flow travel in the inter-hub network within the Physical Internet is provided by where Nin and Nout designate the entry π-hub and the exit π-hub. Accordingly, d(Nin,Nout) is the distance traveled between the entry π-hub and the exit π-hub. The expected inter-hub flows can be estimated by computing the expected flows shipped from each hub to the other hubs by assuming a shortest path travel. When there exists more than one shortest route then the flow is assumed to be spread equally among the possible paths. The right side of Figure 7 exhibits 12 undirected inter-hub links, corresponding to 24 directed links. The flows to be transported are 2 L/n2 on the twelve exterior links and 3 L/n2 on the twelve radial links.
The expected total inter-hub flow travel can thus be estimated as:
fl =12
λr + λp( )⋅ k'S +
MPn
n. R +MPn
⋅
An
=Λn2 ⋅ k '
S +MPn
⋅ A
R +MPn
since λr = λp =Λn
fN = Ε(λN ⋅ d(NIn,NOut ))
FN =60Λ72 α 3
17
The expected overall flow travel for the Physical Internet model can thus be estimated through equation (8):
𝐹𝑃𝐼 = ∧
72 �60𝛼√3 + 𝑘′��𝑆+
𝑀𝑃7�.
212𝛼2√3
𝑅+𝑀𝑃
7
� (8)
Equations (6) and (8) enable to evaluate respectively the flow travel of the current logistics organization and of the PI. As a complement, it is also possible to determine a lower bound on the flow travel required to supply the overall demand from the plants to the retail stores. It corresponds to a direct flow of the required quantity from each plant to each store traveling the Euclidean distance separating the plants from the stores. This flow travel is provided by
. is defined as the expected distance between a generic plant P, with a non-substitutable product, and a generic store S. The flow between a plant and a specific store is provided by equation (9).
(9)
Given the complexity of the geographical space, the expected distance necessary for the computation of the lower bound on flow travel has been estimated using 1,000,000 Monte-Carlo simulation samplings, resulting in an expected . The lower bound on flow travel is thus estimated as .
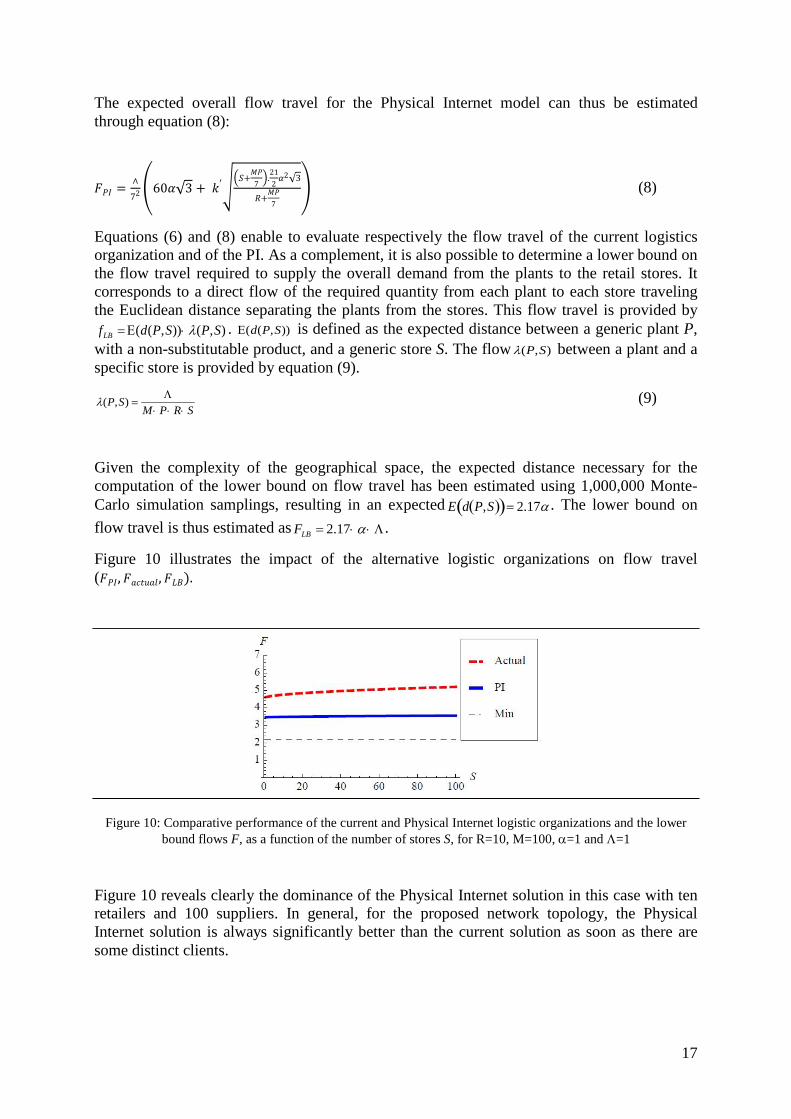
Figure 10 illustrates the impact of the alternative logistic organizations on flow travel (𝐹𝑃𝐼,𝐹𝑎𝑐𝑡𝑢𝑎𝑙,𝐹𝐿𝐵).
Figure 10: Comparative performance of the current and Physical Internet logistic organizations and the lower bound flows F, as a function of the number of stores S, for R=10, M=100, α=1 and Λ=1
Figure 10 reveals clearly the dominance of the Physical Internet solution in this case with ten retailers and 100 suppliers. In general, for the proposed network topology, the Physical Internet solution is always significantly better than the current solution as soon as there are some distinct clients.
fLB = Ε(d(P,S))⋅ λ(P,S)
Ε(d(P,S))
λ(P,S)
λ(P,S) =Λ
M ⋅ P⋅ R⋅ S
E d P,S( )( )= 2.17α
FLB = 2.17⋅ α⋅ Λ
18
4.3 Integrating the modelling of transport and its effectiveness
4.3.1 Modelling transport
Shifting from modelling flows to modelling transport requires dealing with two factors. The first is the organization of transport with fixed periods, full loads, and so on. The second is about defining the capacity of vehicles.
In order to represent a variety of cases and to approximate the current way of doing, the following hypotheses are made:
• The planning horizon is sliced in t periods which are to be used for supply when organized in a periodic way;
• The upstream transport between a plant and a warehouse, in the classical structure of the SC, is performed by full load trucks, fixing the expected time laps between departures;
• Transport between a warehouse and a distribution center is performed at a steady rhythm every t periods within the horizon, in the classical structure of the SC and between the π-hubs in the Physical Internet network;
• Transport between a distribution center and a store is performed through regional tours shortly spaced by the multiplicative inverse of x.t where x≥1. (ex: if t is equal to 1 week, there will be x.1 regional tours in a week)
Under these four hypotheses, it is possible to express the requirements in terms of transport means having an individual capacity v, for each of the preceding flow travel settings considered here as linehauls lh.
(10)
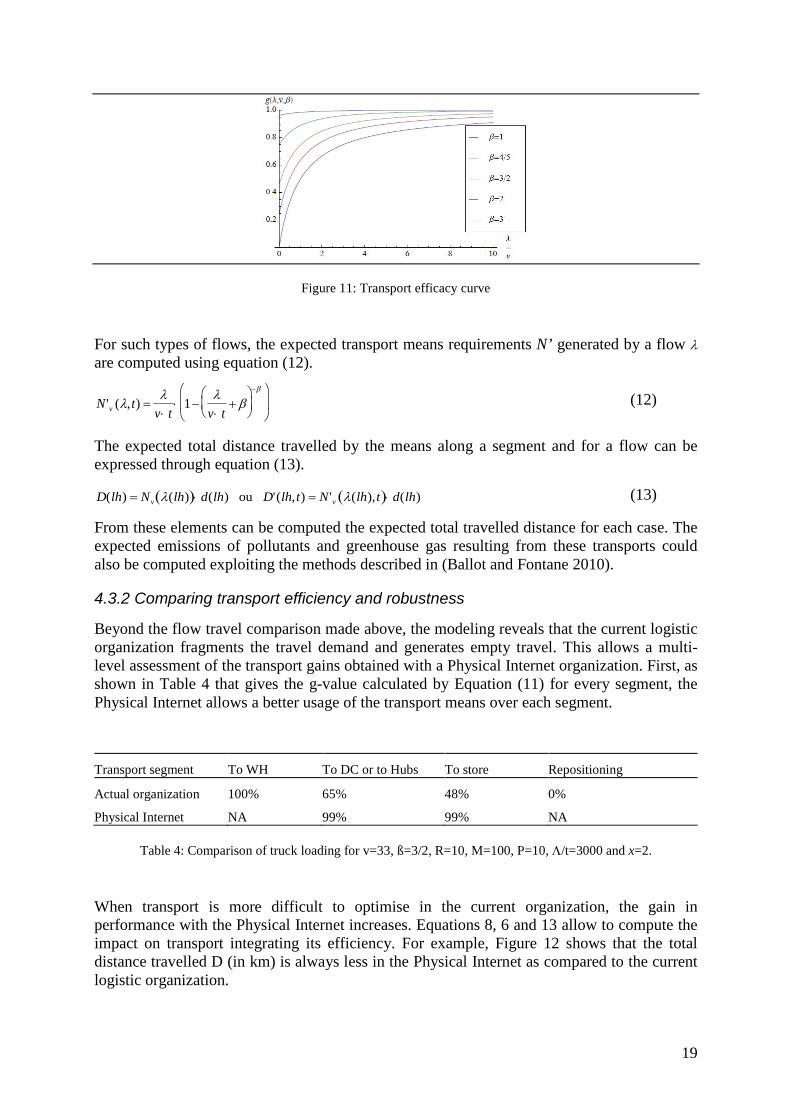
Starting with the flows not dealt with using full loads, but rather on a periodic basis, consider that the transport means efficacy is growing with the ratio between flow intensity and transport means capacity over a given transport segment. A function g expressing the transport efficiency (truckload by number of pallets) relative to the ratio between transport size and flow is used to model this effect. Formalized in equation (11), this function contains a parameter ß, that represents the level of transport organization, allowing to sweep through different situations, from a transport really hard to optimise, corresponding to ß =1, to a quasi perfect transport with ß=3.
(11)
Figure 11 illustrates the evolution of transport efficacy under distinct values of ß. When ß is set to 3, function g grows slightly from 0.96 to nearly one, always near perfect efficacy. When ß is set lower values to climb toward better efficacy is slower and reach at best a lower efficacy, e.g. roughly 0.9 when ß is set to one.
Nv (lh) =λ(lh)
v
g(λ,v,β) =1 −λv
+ β
−β
19
Figure 11: Transport efficacy curve
For such types of flows, the expected transport means requirements N’ generated by a flow λ are computed using equation (12).
(12)
The expected total distance travelled by the means along a segment and for a flow can be expressed through equation (13).
(13)
From these elements can be computed the expected total travelled distance for each case. The expected emissions of pollutants and greenhouse gas resulting from these transports could also be computed exploiting the methods described in (Ballot and Fontane 2010).
4.3.2 Comparing transport efficiency and robustness
Beyond the flow travel comparison made above, the modeling reveals that the current logistic organization fragments the travel demand and generates empty travel. This allows a multi-level assessment of the transport gains obtained with a Physical Internet organization. First, as shown in Table 4 that gives the g-value calculated by Equation (11) for every segment, the Physical Internet allows a better usage of the transport means over each segment.
Transport segment To WH To DC or to Hubs To store Repositioning
Actual organization 100% 65% 48% 0%
Physical Internet NA 99% 99% NA
Table 4: Comparison of truck loading for v=33, ß=3/2, R=10, M=100, P=10, Λ/t=3000 and x=2.
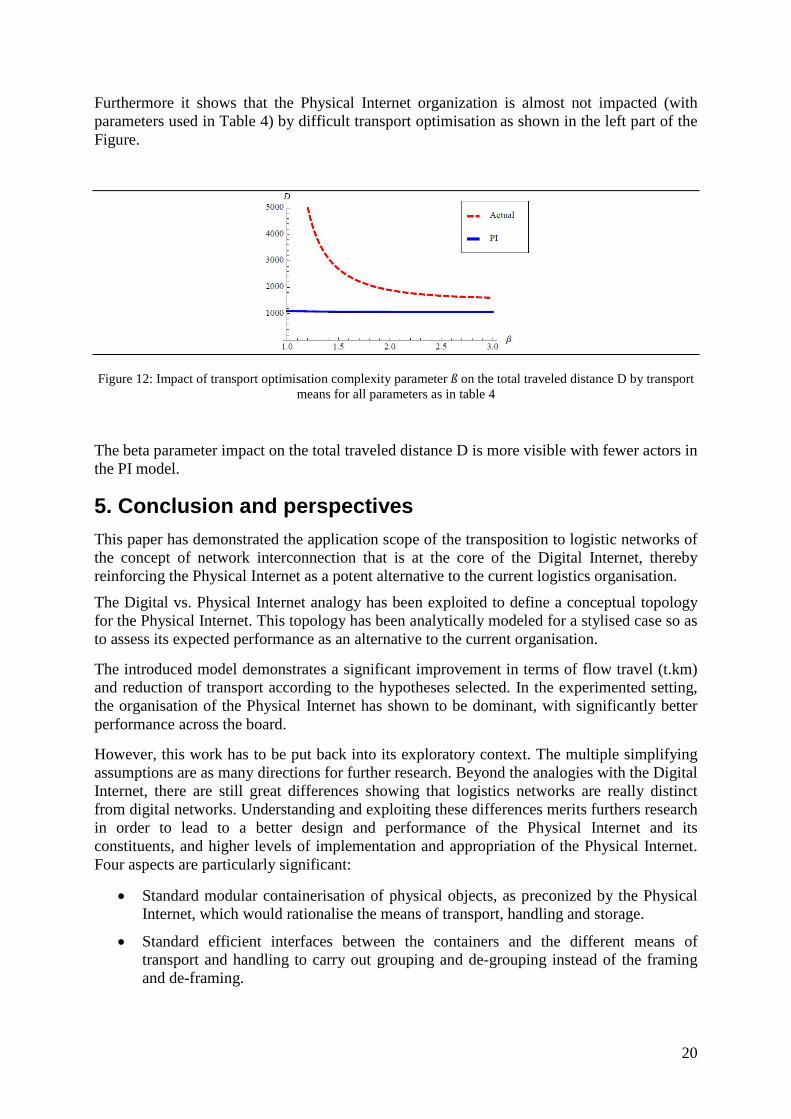
When transport is more difficult to optimise in the current organization, the gain in performance with the Physical Internet increases. Equations 8, 6 and 13 allow to compute the impact on transport integrating its efficiency. For example, Figure 12 shows that the total distance travelled D (in km) is always less in the Physical Internet as compared to the current logistic organization.
N 'v (λ,t) =λ
v⋅ t⋅ 1−
λv⋅ t
+ β
−β
D(lh) = Nv λ(lh)( )⋅ d(lh) ou D'(lh,t) = N 'v λ(lh),t( )⋅ d(lh)
20
Furthermore it shows that the Physical Internet organization is almost not impacted (with parameters used in Table 4) by difficult transport optimisation as shown in the left part of the Figure.
Figure 12: Impact of transport optimisation complexity parameter ß on the total traveled distance D by transport means for all parameters as in table 4
The beta parameter impact on the total traveled distance D is more visible with fewer actors in the PI model.
5. Conclusion and perspectives
This paper has demonstrated the application scope of the transposition to logistic networks of the concept of network interconnection that is at the core of the Digital Internet, thereby reinforcing the Physical Internet as a potent alternative to the current logistics organisation.
The Digital vs. Physical Internet analogy has been exploited to define a conceptual topology for the Physical Internet. This topology has been analytically modeled for a stylised case so as to assess its expected performance as an alternative to the current organisation.
The introduced model demonstrates a significant improvement in terms of flow travel (t.km) and reduction of transport according to the hypotheses selected. In the experimented setting, the organisation of the Physical Internet has shown to be dominant, with significantly better performance across the board.
However, this work has to be put back into its exploratory context. The multiple simplifying assumptions are as many directions for further research. Beyond the analogies with the Digital Internet, there are still great differences showing that logistics networks are really distinct from digital networks. Understanding and exploiting these differences merits furthers research in order to lead to a better design and performance of the Physical Internet and its constituents, and higher levels of implementation and appropriation of the Physical Internet. Four aspects are particularly significant:
• Standard modular containerisation of physical objects, as preconized by the Physical Internet, which would rationalise the means of transport, handling and storage.
• Standard efficient interfaces between the containers and the different means of transport and handling to carry out grouping and de-grouping instead of the framing and de-framing.
21
• Live and open publication of the capacities, performances and conditions of transport, selection, handling, etc., to effectively direct the flow to the most pertinent transport services. This amounts to proposing an “open” logistic infrastructure, the Physical Internet substituted for current dissociated logistics network.
• Standard open routing protocols based on the specific aspects of the merchandise and limited logistic capacities based on their publication as well as that of the flow. For this, the definition of a system of domain and geospatial addressing will be necessary.
An interesting future research avenue consists of extending the conceptual and analytical work here presented, with geographic zones that have been divided in a different way and real data so as to be able to study the reliability of these first results and clarify the issues on national or international levels. In this way, more precise results will be obtained for the potential operations and performance of the Physical Internet.
Another future research avenue consists of establishing a simulation model to characterise the improvements of the Physical Internet by experimenting its operational functioning. This work will help validate its functioning but will also help explore the characteristics of some of these elements. Several levels of details need to be taken into account, such as the containerisation of the merchandise and the routing protocols used, etc.
Along these lines, the authors are engaged in an international research project launched to assess through fine-granularity simulation the potential of the Physical Internet for improving the economical, environmental and societal efficiency and sustainability of the fast-moving consumer goods industry in France, based on flow of goods between two of the top French retailers and their 100 top suppliers.
22
6. References
Antonelli, D. and B. Caroleo (2011). "An integrated methodology for the analysis of collaboration in industry networks." Journal of Intelligent Manufacturing: 1-8.10.1007/s10845-011-0510-z
Ballot, E. and F. Fontane (2008). "Rendement et efficience du transport: un nouvel indicateur de performance." Revue Française de Gestion Industrielle 27(2): 41
Ballot, E. and F. Fontane (2010). Reducing greenhouse gas emissions through the collaboration of supply chains: lessons from French reatail chains. Production, plannig & control. 21: 640-650.
Ballot, E., R. Glardon and B. Montreuil (2010). Rapport Open Fret: Contribution à la conceptualisation et à la réalisation d'un Hub Rail_Route de l'Internet Physique. M. C. 52, PREDIT: Programme de recherhe et d'innovation dans les trasports terrestres.
Boissieu, C. (2006). Division par quatre des émissions de gaz à effet de serre de la France à l'horizon 2050, Ministère de l'Ecologie et du développement durable.
Bontekoning, Y. and H. Priemus (2004). "Breakthrough innovations in intermodal freight transport." Transportation Planning and Technology 27(5): 335-345
Camarinha-Matos, L. M. and H. Afsarmanesh (2005). "Collaborative networks: a new scientific discipline." Journal of Intelligent Manufacturing 16(4): 439-452.10.1007/s10845-005-1656-3
Camarinha-Matos, L. M. and H. Afsarmanesh (2007). "A comprehensive modeling framework for collaborative networked organizations." Journal of Intelligent Manufacturing 18(5): 529-542.10.1007/s10845-007-0063-3
Cheikhrouhou, N., G. Piot and M. Pouly (2010). "A multi-criteria model for the evaluation of business benefits in horizontal collaborative networks." Journal of Intelligent Manufacturing 21(3): 301-309.10.1007/s10845-008-0181-6
Chopra, S. and P. Meindl (2004). Supply Chain Mangement: Strategy, planning and operation, Prentice Hall.
Citepa (2009). Substances relatives à l'accroissement de l'effet de serre. Emissions dans l'air en France. France, Centre Interprofessionnel Techniques d'Etudes de la Pollution Atmosphérique.
Comer, D. E. and D. L. Stevens (1982). Internetworking with TCP/IP, Prentice-Hall. Cruijssen, F., M. Cools and W. Dullaert (2007). "Horizontal cooperation in logistics:
opportunities and impediments." Transportation Research Part E: Logistics and Transportation Review 43(2): 129-142
Daganzo, C. F. (1984). "The distance traveled to visit N points with a maximum of C stops per vehicle: An analytic model and an application." Transportation Science 18(4): 331-350
Daganzo, C. F. (2005). Logistics systems analysis, Springer. European Commission (2008). Methodologies used in surveys of road freight transport in
member states and candidate countries. Eurostat. Luxembourg, Eurostat. Groothedde, B., C. Ruijgrok and L. Tavasszy (2005). "Towards collaborative, intermodal hub
networks:: A case study in the fast moving consumer goods market." Transportation Research Part E: Logistics and Transportation Review 41(6): 567-583
Hardy, D., G. Malléus and J.-N. Méreur (2002). Networks: internet, telephony, multimedia: convergences and complementarities, Springer Verlag.
Huitema, C. (1999). Routing in the Internet (2nd Edition), Prentice Hall. Le, T. and T. R. Lee (2011). "Model selection with considering the CO2 emission alone the
global supply chain." Journal of Intelligent Manufacturing.doi:10.1007/s10845-011-0613-6
23
McKinnon, A., Y. Ge and D. Leuchars (2003). "Analysis of transport efficiency in the UK food supply chain." Logistics Research Centre, Heriot-Watt University, Edinburgh
McKinnon, A. C. and M. I. Piecyk (2009). "Measurement of CO2 emissions from road freight transport: A review of UK experience." Energy Policy 37(10): 3733-3742
Montreuil, B. (2010). Physical Internet Manifesto V1. 7: globally transforming the way physical objects are handled, moved, stored, realized, supplied and used [Online]. Québec, CA.
Montreuil, B., R. D. Meller and E. Ballot (2010). "Towards a physical Internet: The impact on logistics facilities and materials handling systems design and innovation." Progress in material handling research: 23
Pan, S., E. Ballot and F. Fontane (2010). "The reduction of greenhouse gas emissions from freight transport by pooling supply chains.", International Journal of Production Economics, In Press, accessible at http://www.sciencedirect.com/science/article/pii/S0925527310004160
Peterson, L. L. and B. S. Davie (2003). Computer networks: a systems approach, Morgan Kaufmann.
Piecyk, M. I. and A. C. McKinnon (2010). "Forecasting the carbon footprint of road freight transport in 2020." International Journal of Production Economics 128(1): 31-42
Stefanovic, D. and N. Stefanovic (2008). "Methodology for modeling and analysis of supply networks." Journal of Intelligent Manufacturing 19(4): 485-503.10.1007/s10845-008-0098-0
Stevens, W. R. (1994). TCP/IP Illustrated: the protocols, Addison-Wesley Professional. Stewart III, J. W. (1998). BGP4: inter-domain routing in the Internet, Addison-Wesley
Longman Publishing Co., Inc. Tanenbaum, A. S. (2003). Computer Networks 4th Edition, New Jersey: Prentice Hall.