Embed Size (px)
Citation preview
Economic Complexity, Value Chain Networks and Québec’s Global
Competitiveness
Yihan WangPh.D. Candidate, Department of International Business, HEC Montréal
Ekaterina TurkinaAssociate Professor, Department of International Business, HEC Montréal

Mon Pays
Mon pays ce n'est pas un pays, c'est l'hiver.
Mon jardin ce n'est pas un jardin, c'est la plaine.
Mon chemin ce n'est pas un chemin, c'est la neige.
My Country
My country is not a country, it's the winter.
My garden is not a garden, it's the plains.
My path is not a path, it's the snow.
- Gilles Vigneault
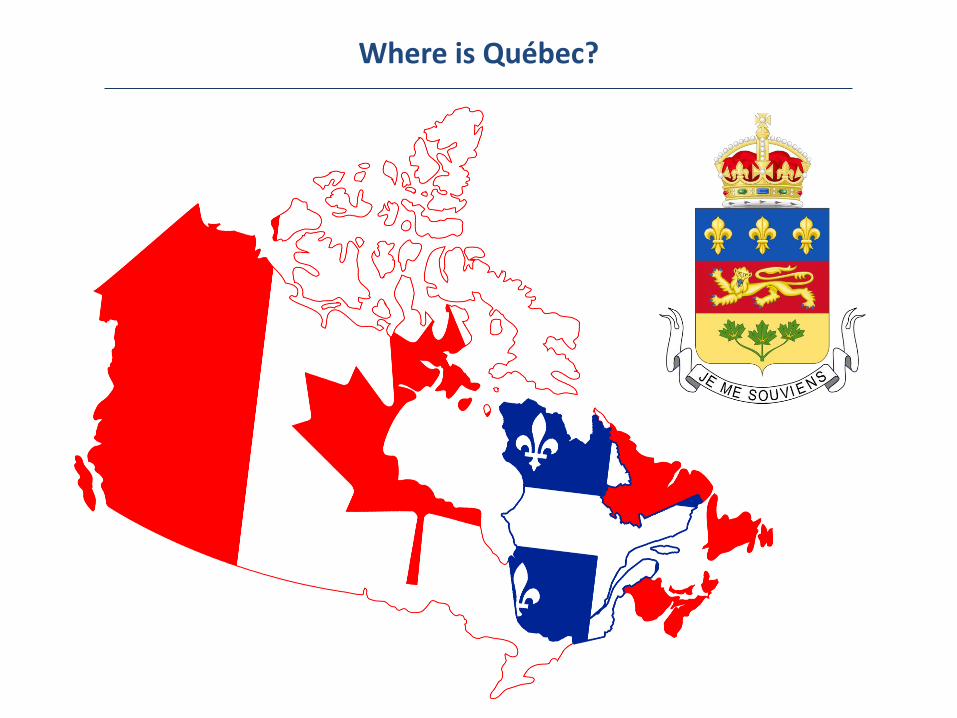
Where is Québec?
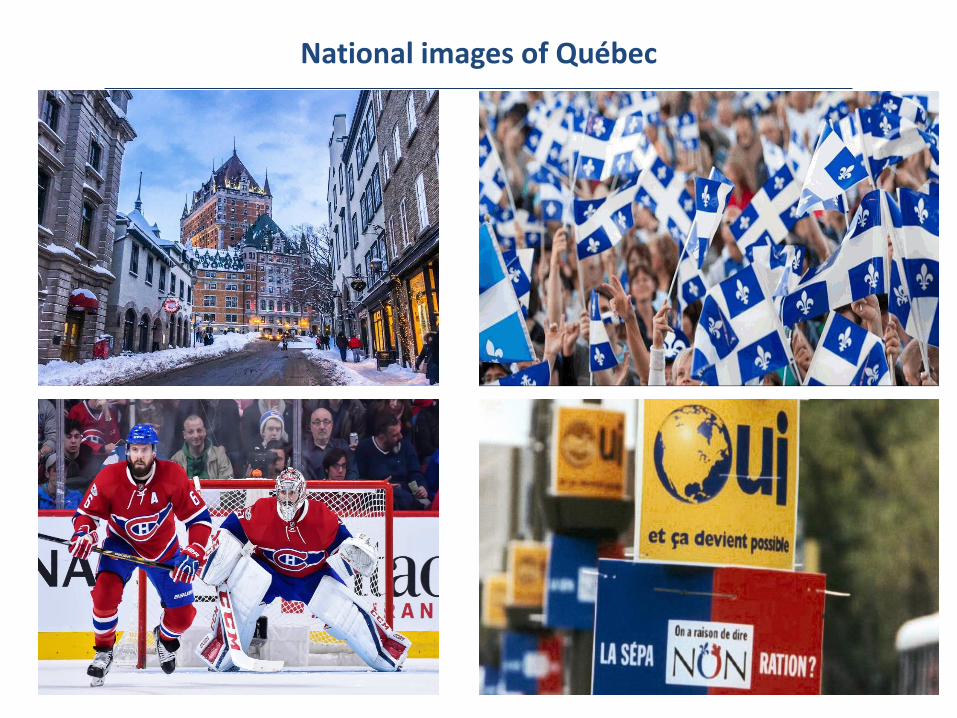
National images of Québec

• What are the most competitive economic sectors of Québec?• What are the potential sectors to attract FDIs Québec?
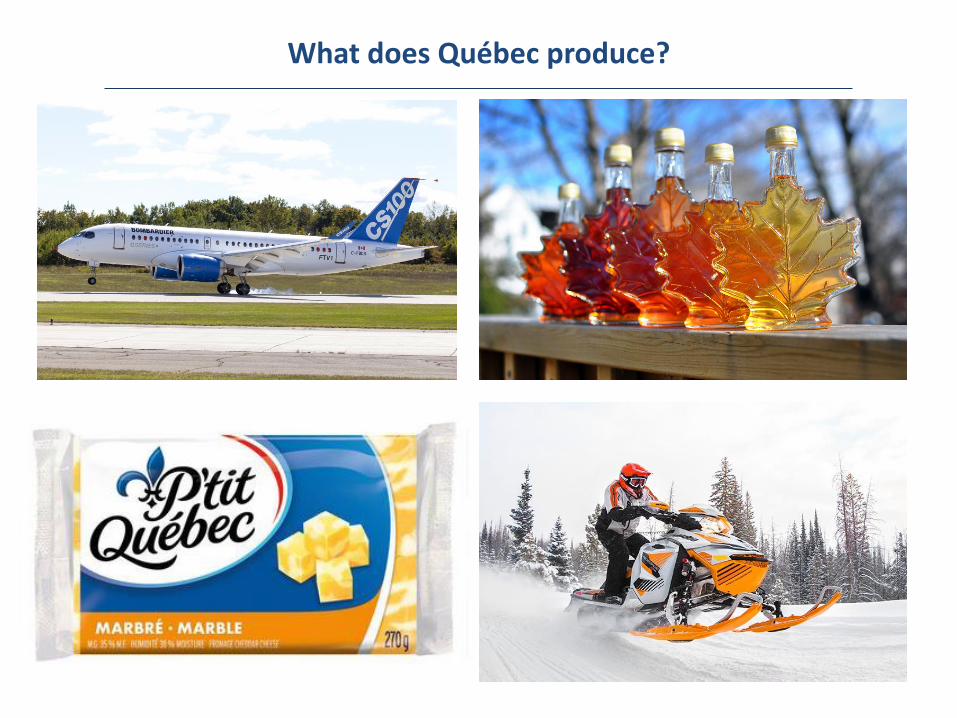
What does Québec produce?
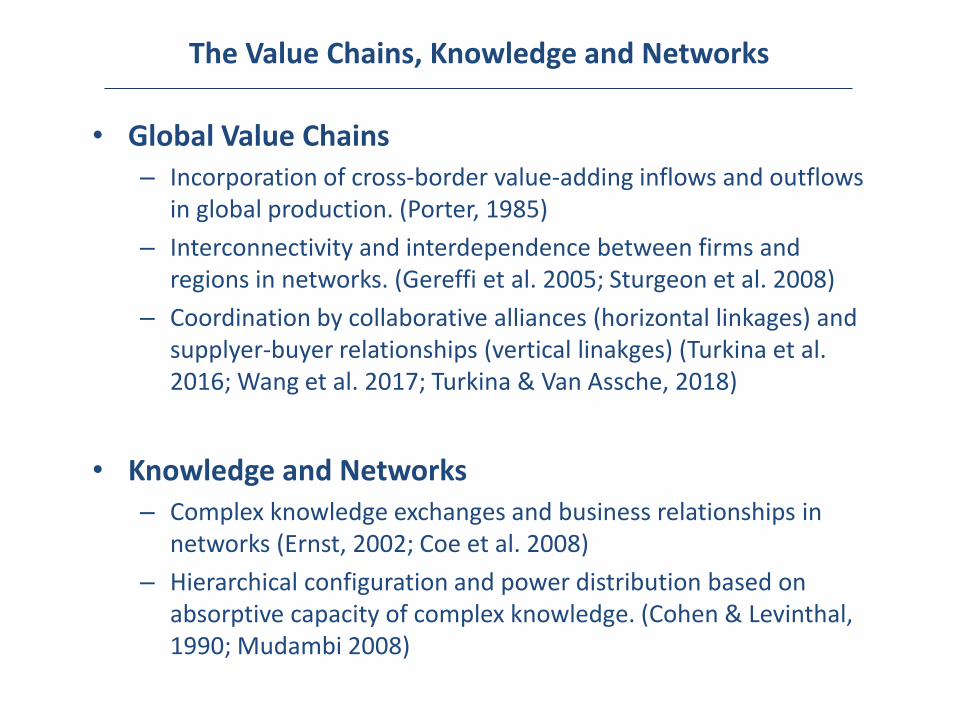
The Value Chains, Knowledge and Networks
• Global Value Chains– Incorporation of cross-border value-adding inflows and outflows
in global production. (Porter, 1985)
– Interconnectivity and interdependence between firms and regions in networks. (Gereffi et al. 2005; Sturgeon et al. 2008)
– Coordination by collaborative alliances (horizontal linkages) and supplyer-buyer relationships (vertical linakges) (Turkina et al. 2016; Wang et al. 2017; Turkina & Van Assche, 2018)
• Knowledge and Networks– Complex knowledge exchanges and business relationships in
networks (Ernst, 2002; Coe et al. 2008)
– Hierarchical configuration and power distribution based on absorptive capacity of complex knowledge. (Cohen & Levinthal, 1990; Mudambi 2008)
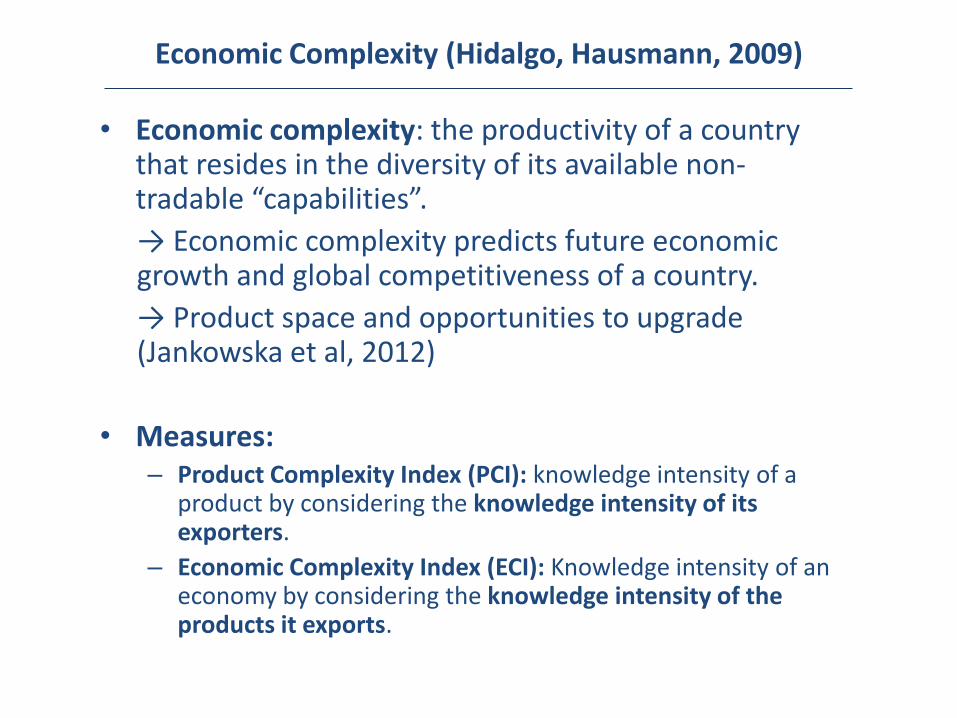
Economic Complexity (Hidalgo, Hausmann, 2009)
• Economic complexity: the productivity of a country that resides in the diversity of its available non-tradable “capabilities”.
→ Economic complexity predicts future economic growth and global competitiveness of a country.
→ Product space and opportunities to upgrade (Jankowska et al, 2012)
• Measures:– Product Complexity Index (PCI): knowledge intensity of a
product by considering the knowledge intensity of its exporters.
– Economic Complexity Index (ECI): Knowledge intensity of an economy by considering the knowledge intensity of the products it exports.
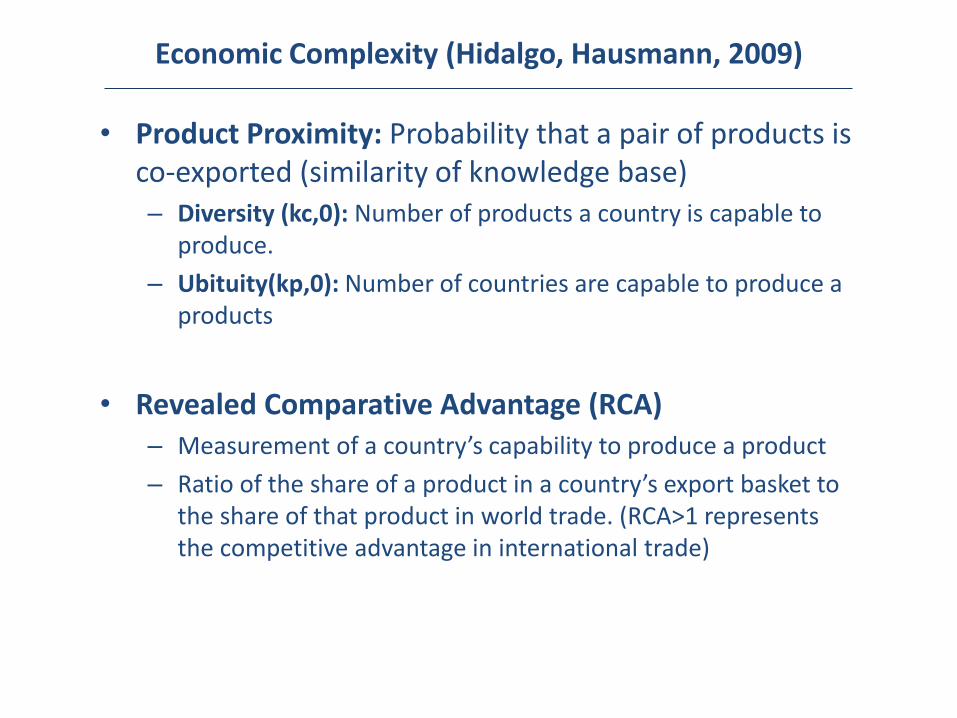
Economic Complexity (Hidalgo, Hausmann, 2009)
• Product Proximity: Probability that a pair of products is co-exported (similarity of knowledge base)– Diversity (kc,0): Number of products a country is capable to
produce.
– Ubituity(kp,0): Number of countries are capable to produce a products
• Revealed Comparative Advantage (RCA) – Measurement of a country’s capability to produce a product
– Ratio of the share of a product in a country’s export basket to the share of that product in world trade. (RCA>1 represents the competitive advantage in international trade)
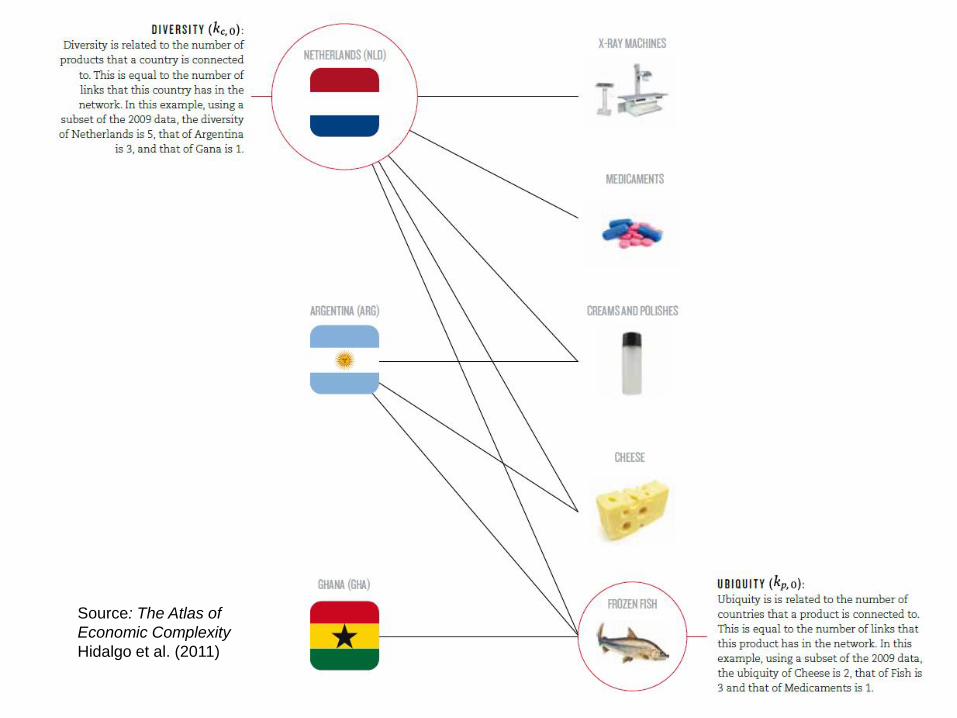
Source: The Atlas of
Economic Complexity
Hidalgo et al. (2011)
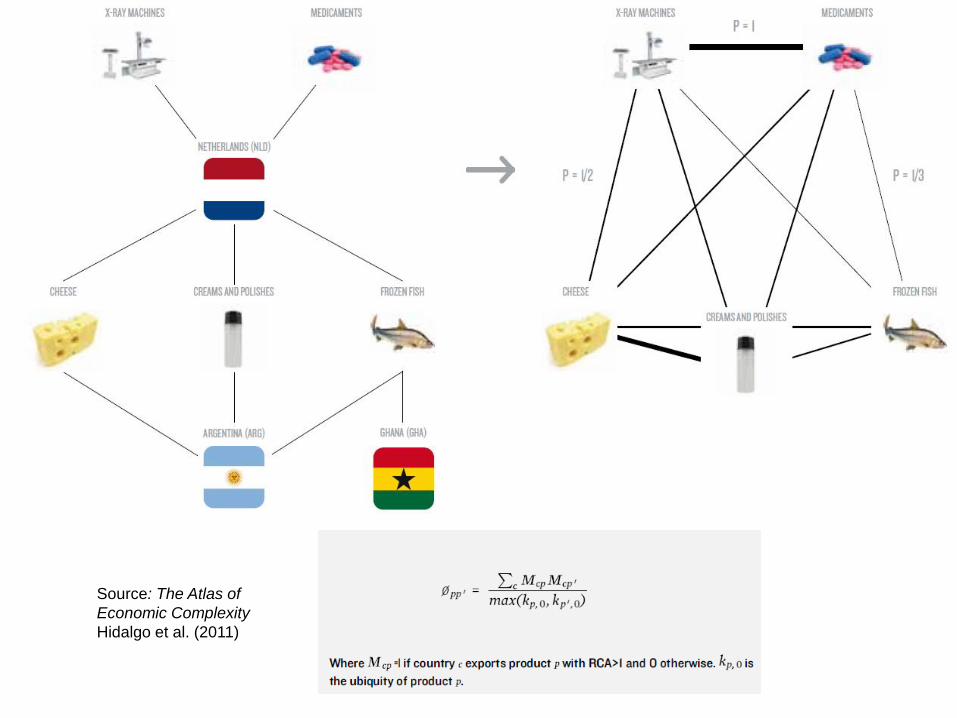
Source: The Atlas of
Economic Complexity
Hidalgo et al. (2011)
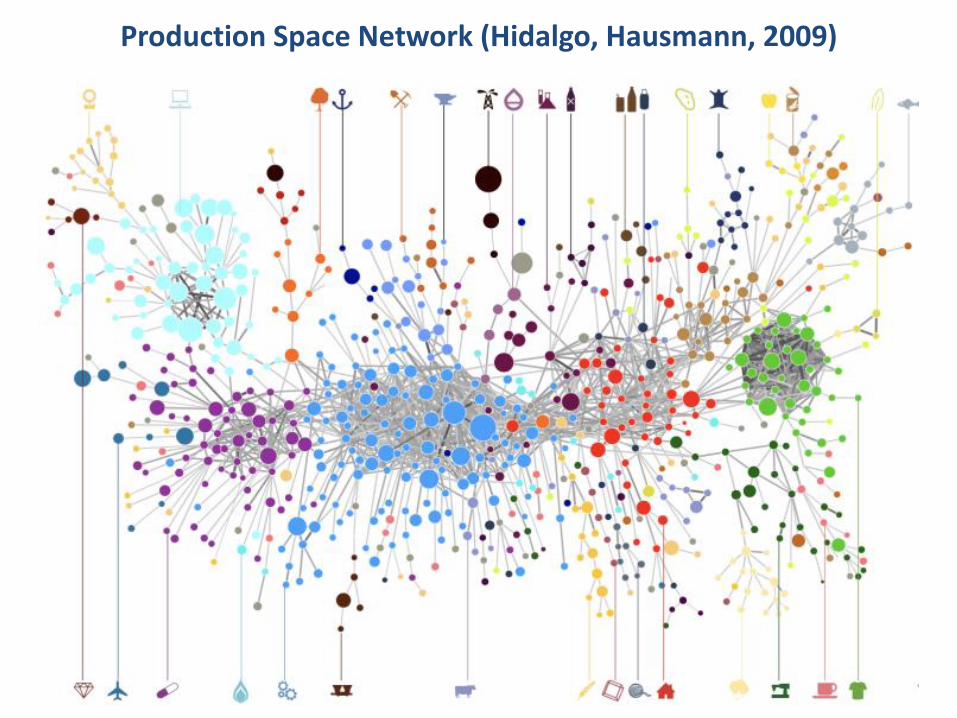
Production Space Network (Hidalgo, Hausmann, 2009)
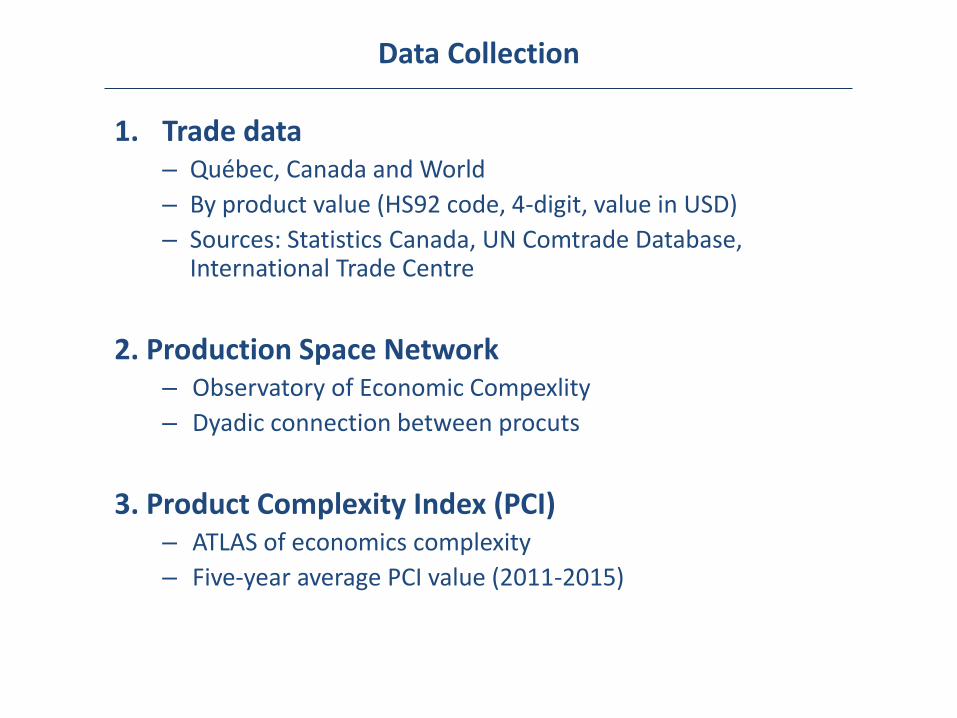
Data Collection
1. Trade data – Québec, Canada and World
– By product value (HS92 code, 4-digit, value in USD)
– Sources: Statistics Canada, UN Comtrade Database, International Trade Centre
2. Production Space Network– Observatory of Economic Compexlity
– Dyadic connection between procuts
3. Product Complexity Index (PCI)– ATLAS of economics complexity
– Five-year average PCI value (2011-2015)
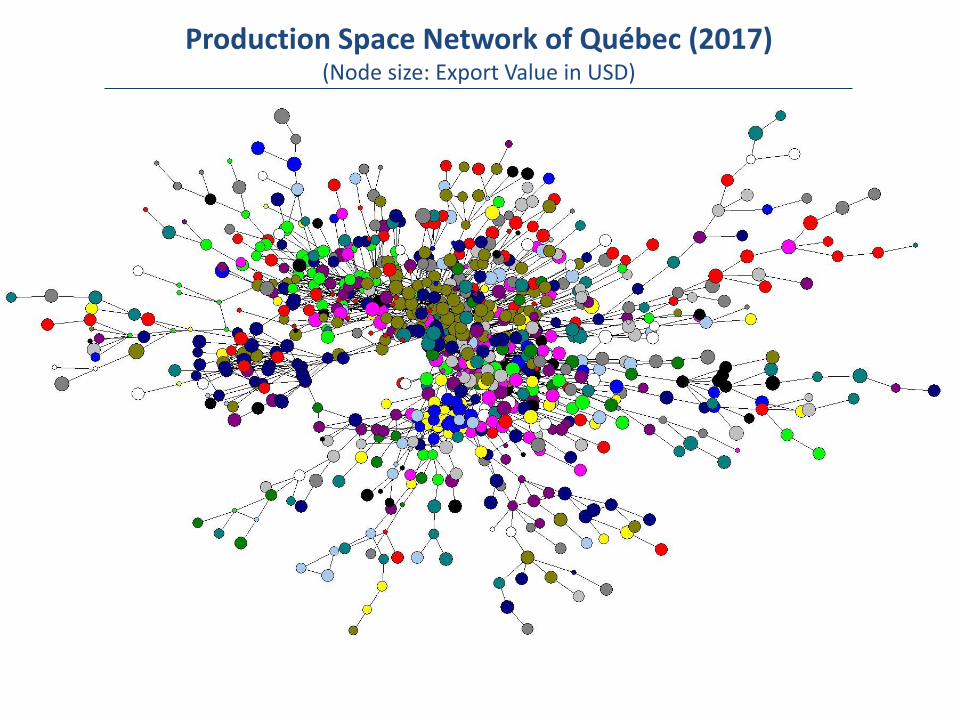
Production Space Network of Québec (2017)(Node size: Export Value in USD)

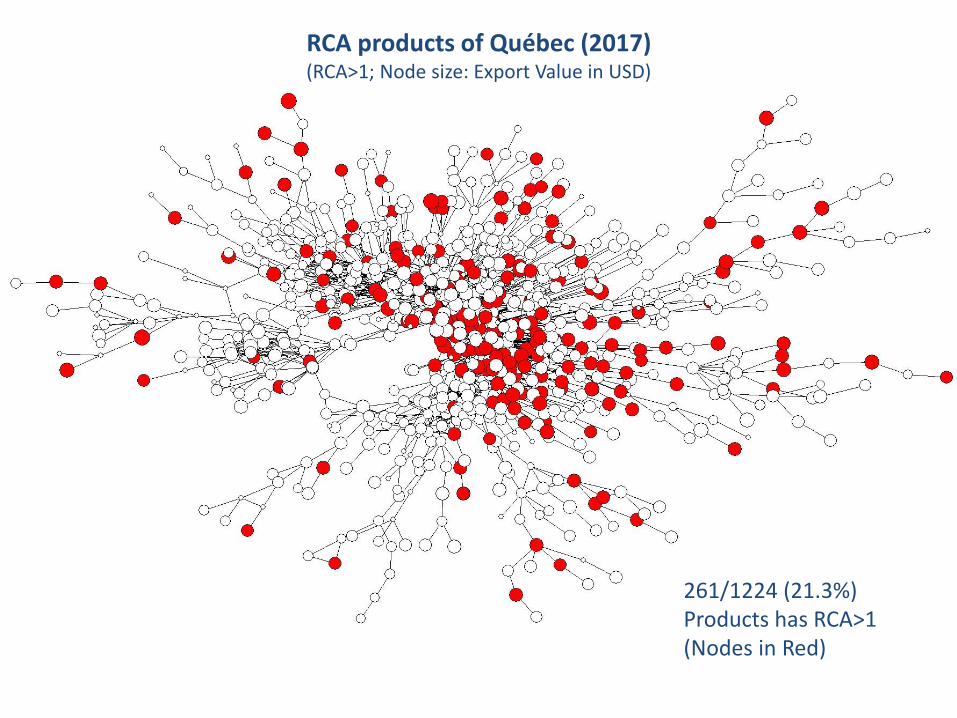
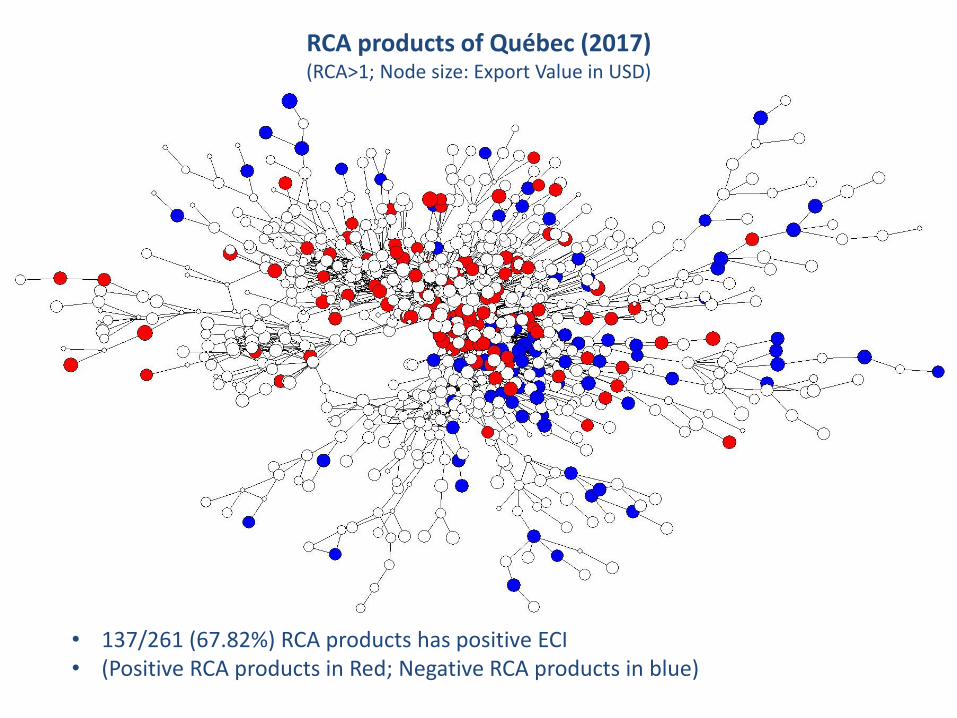
RCA products of Québec (2017)(RCA>1; Node size: Export Value in USD)
261/1224 (21.3%) Products has RCA>1 (Nodes in Red)
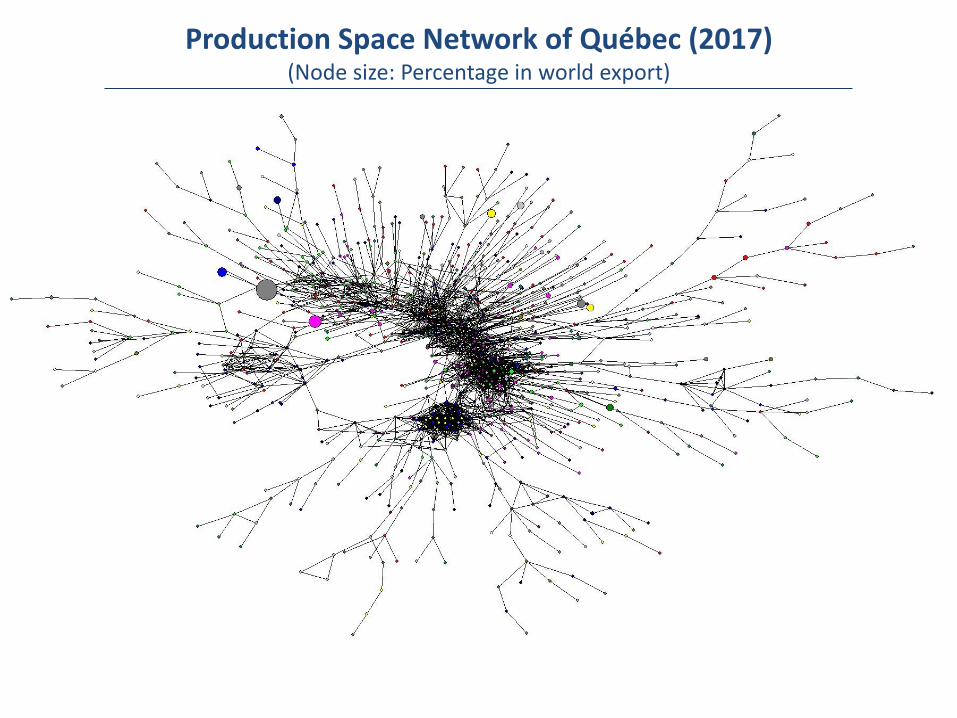
Production Space Network of Québec (2017)(Node size: Percentage in world export)
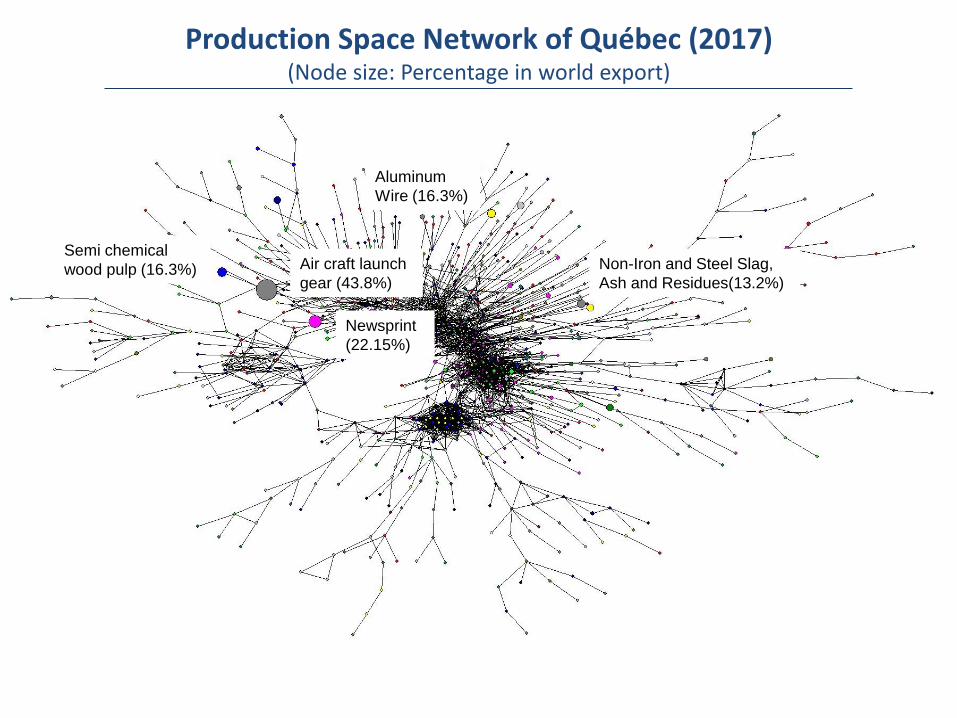
Production Space Network of Québec (2017)(Node size: Percentage in world export)
Air craft launch
gear (43.8%)
Semi chemical
wood pulp (16.3%)
Newsprint
(22.15%)
Aluminum
Wire (16.3%)
Non-Iron and Steel Slag,
Ash and Residues(13.2%)
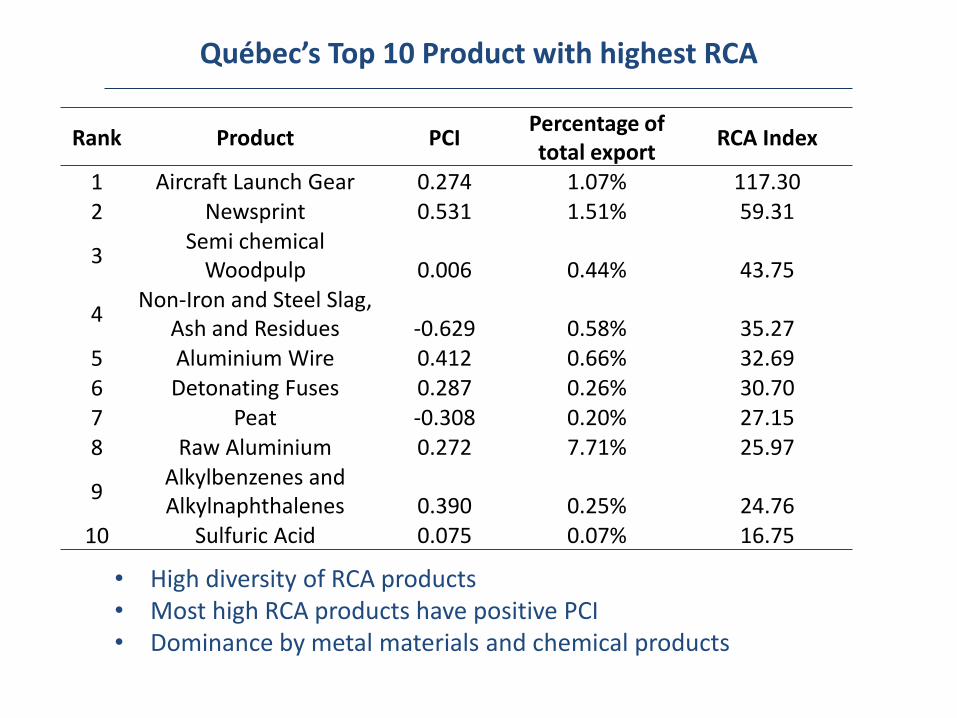
Québec’s Top 10 Product with highest RCA
• High diversity of RCA products• Most high RCA products have positive PCI• Dominance by metal materials and chemical products
Rank Product PCIPercentage of total export
RCA Index
1 Aircraft Launch Gear 0.274 1.07% 117.302 Newsprint 0.531 1.51% 59.31
3Semi chemical
Woodpulp 0.006 0.44% 43.75
4Non-Iron and Steel Slag,
Ash and Residues -0.629 0.58% 35.275 Aluminium Wire 0.412 0.66% 32.696 Detonating Fuses 0.287 0.26% 30.707 Peat -0.308 0.20% 27.158 Raw Aluminium 0.272 7.71% 25.97
9Alkylbenzenes and Alkylnaphthalenes 0.390 0.25% 24.76
10 Sulfuric Acid 0.075 0.07% 16.75
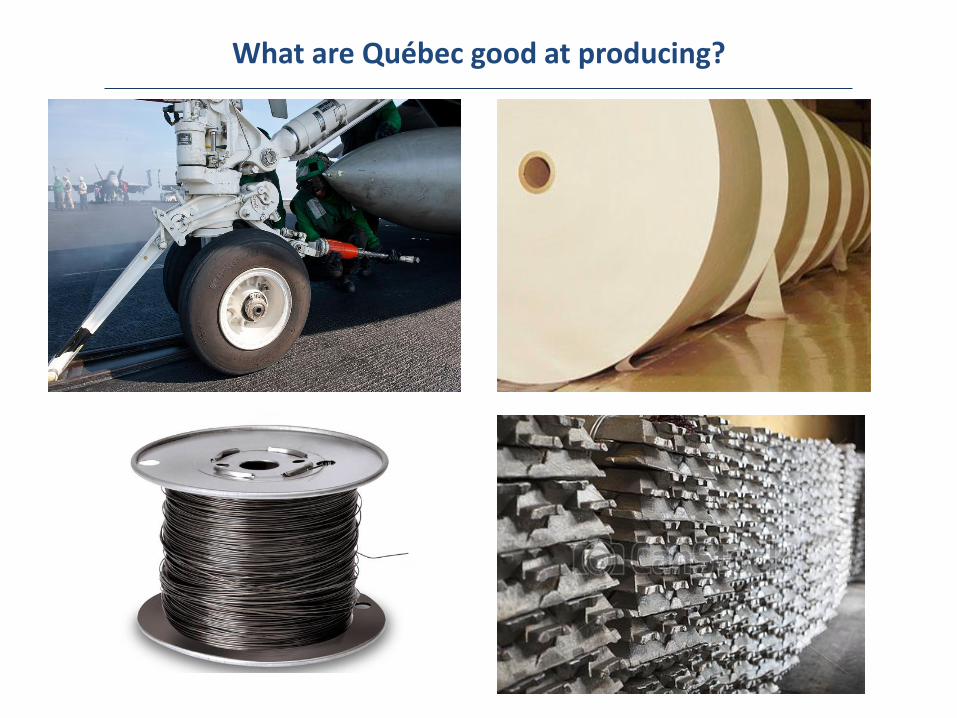
What are Québec good at producing?
RCA products of Québec (2017)(RCA>1; Node size: Export Value in USD)
261/1224 (21.3%) Products has RCA>1 (Nodes in Red)
RCA products of Québec (2017)(RCA>1; Node size: Export Value in USD)
• 137/261 (67.82%) RCA products has positive ECI• (Positive RCA products in Red; Negative RCA products in blue)
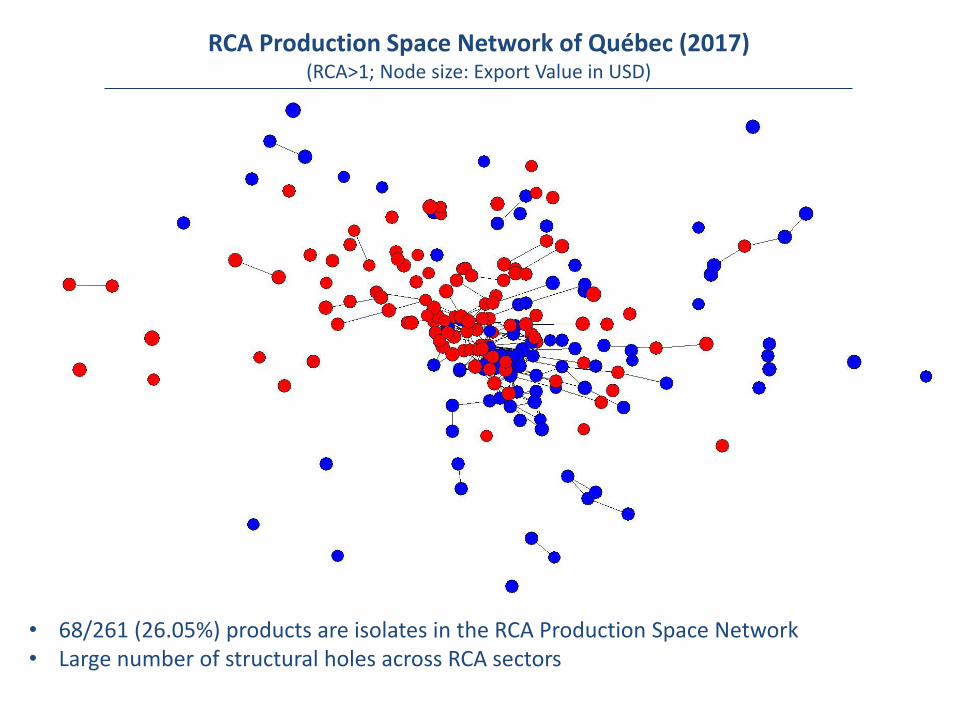
RCA Production Space Network of Québec (2017)(RCA>1; Node size: Export Value in USD)
• 68/261 (26.05%) products are isolates in the RCA Production Space Network• Large number of structural holes across RCA sectors
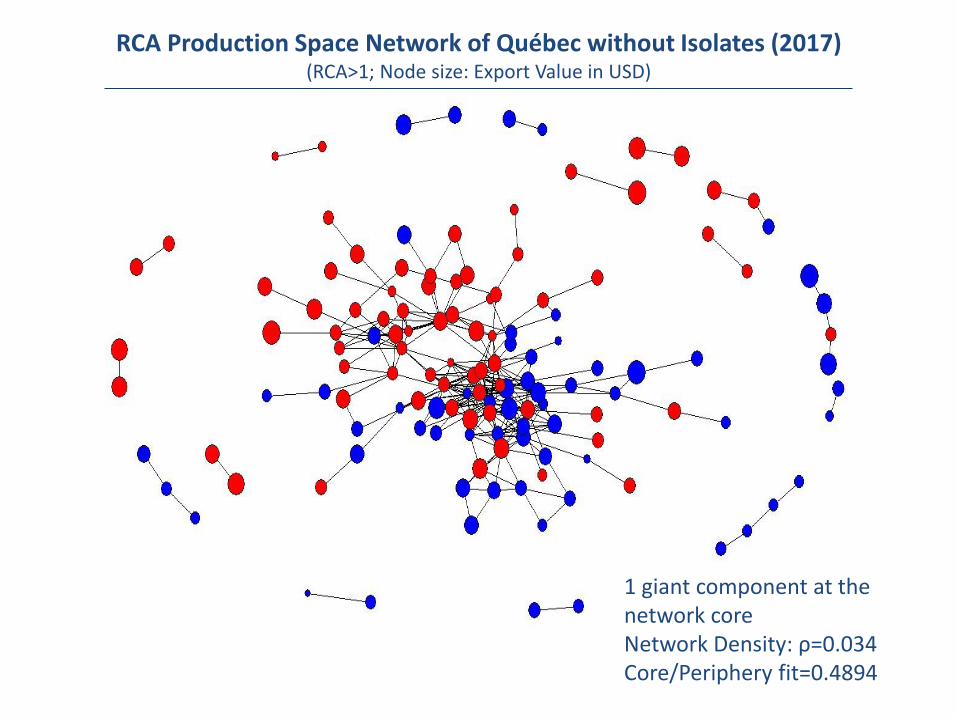
RCA Production Space Network of Québec without Isolates (2017)(RCA>1; Node size: Export Value in USD)
1 giant component at the network coreNetwork Density: ρ=0.034Core/Periphery fit=0.4894
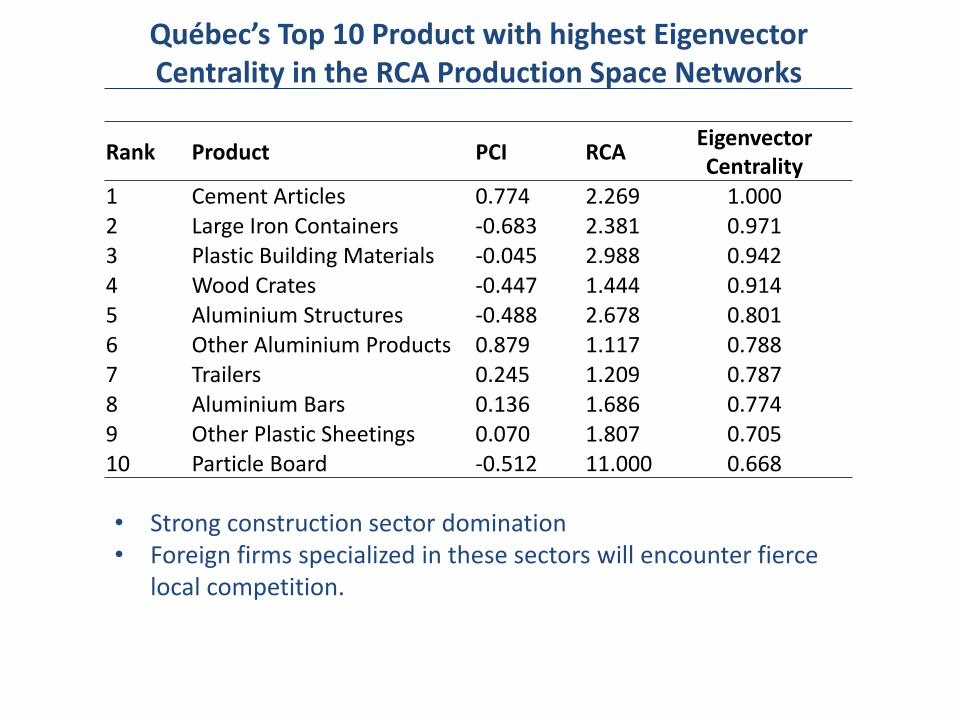
Québec’s Top 10 Product with highest EigenvectorCentrality in the RCA Production Space Networks
Rank Product PCI RCAEigenvector Centrality
1 Cement Articles 0.774 2.269 1.0002 Large Iron Containers -0.683 2.381 0.9713 Plastic Building Materials -0.045 2.988 0.9424 Wood Crates -0.447 1.444 0.9145 Aluminium Structures -0.488 2.678 0.8016 Other Aluminium Products 0.879 1.117 0.7887 Trailers 0.245 1.209 0.7878 Aluminium Bars 0.136 1.686 0.7749 Other Plastic Sheetings 0.070 1.807 0.70510 Particle Board -0.512 11.000 0.668
• Strong construction sector domination• Foreign firms specialized in these sectors will encounter fierce
local competition.

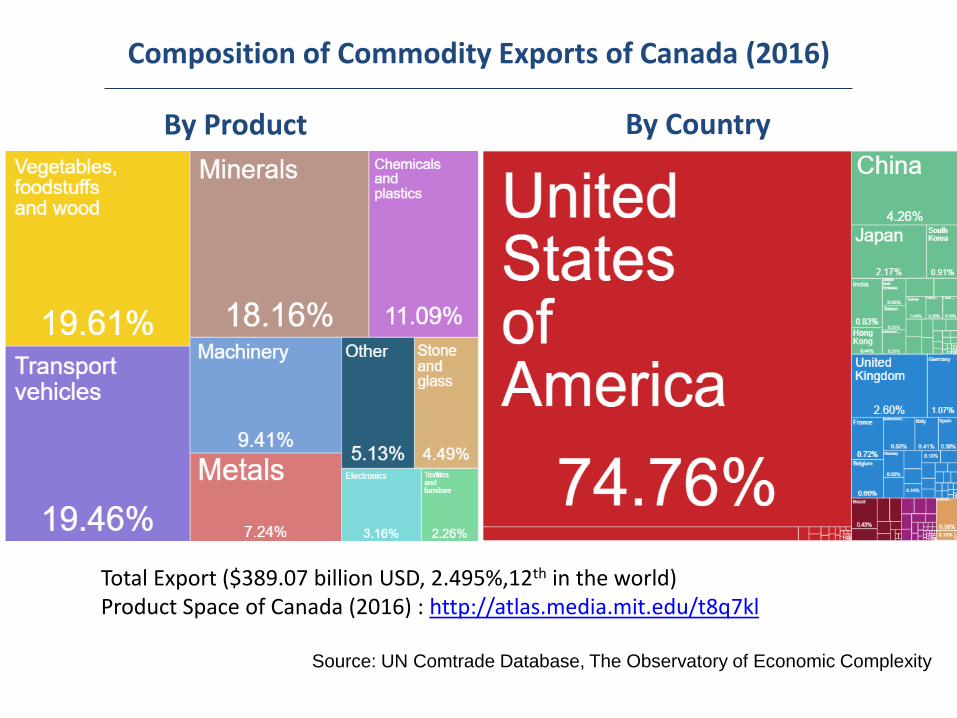
Composition of Commodity Exports of Canada (2016)
By Product By Country
Total Export ($389.07 billion USD, 2.495%,12th in the world)Product Space of Canada (2016) : http://atlas.media.mit.edu/t8q7kl
Source: UN Comtrade Database, The Observatory of Economic Complexity
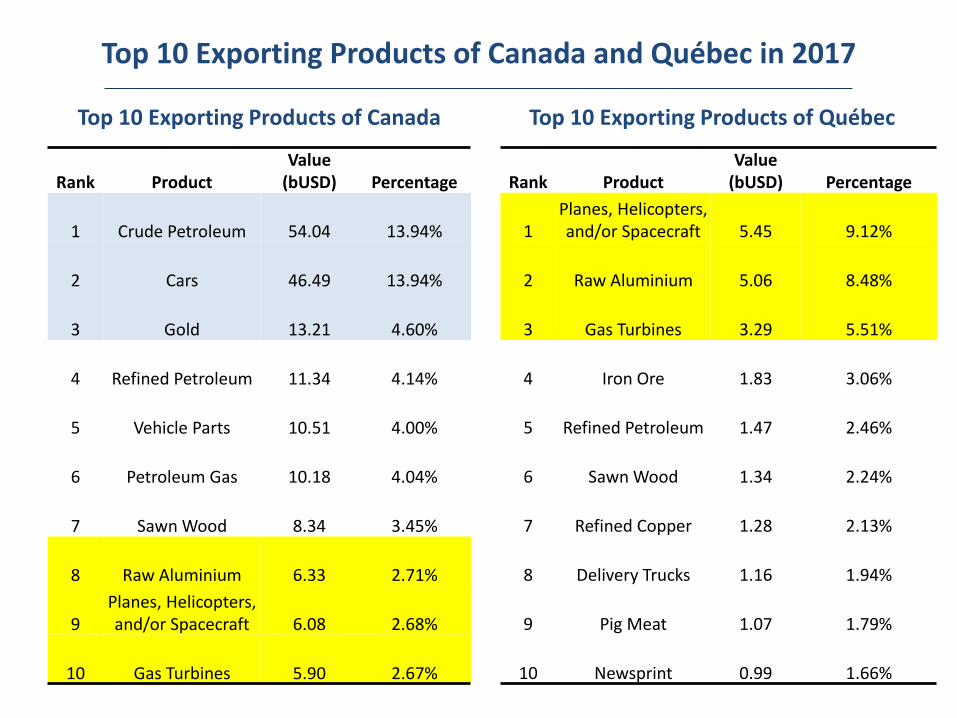
Top 10 Exporting Products of Canada and Québec in 2017
Top 10 Exporting Products of Canada Top 10 Exporting Products of Québec
Rank ProductValue
(bUSD) Percentage
1 Crude Petroleum 54.04 13.94%
2 Cars 46.49 13.94%
3 Gold 13.21 4.60%
4 Refined Petroleum 11.34 4.14%
5 Vehicle Parts 10.51 4.00%
6 Petroleum Gas 10.18 4.04%
7 Sawn Wood 8.34 3.45%
8 Raw Aluminium 6.33 2.71%
9Planes, Helicopters, and/or Spacecraft 6.08 2.68%
10 Gas Turbines 5.90 2.67%
Rank ProductValue
(bUSD) Percentage
1Planes, Helicopters, and/or Spacecraft 5.45 9.12%
2 Raw Aluminium 5.06 8.48%
3 Gas Turbines 3.29 5.51%
4 Iron Ore 1.83 3.06%
5 Refined Petroleum 1.47 2.46%
6 Sawn Wood 1.34 2.24%
7 Refined Copper 1.28 2.13%
8 Delivery Trucks 1.16 1.94%
9 Pig Meat 1.07 1.79%
10 Newsprint 0.99 1.66%
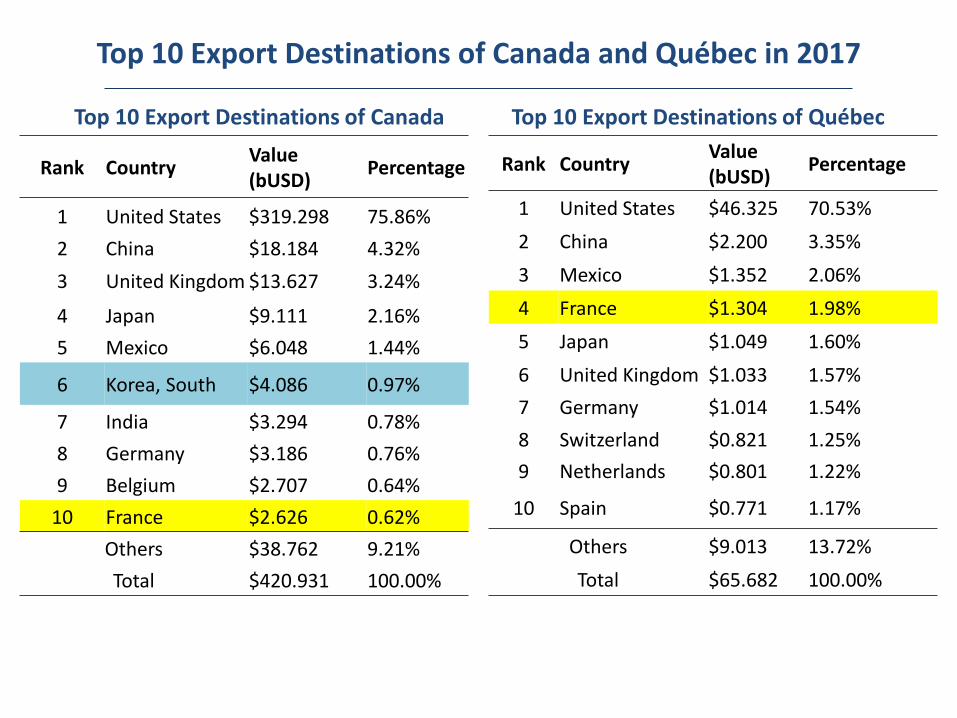
Top 10 Export Destinations of Canada and Québec in 2017
Top 10 Export Destinations of Canada Top 10 Export Destinations of Québec
Rank CountryValue (bUSD)
Percentage
1 United States $46.325 70.53%
2 China $2.200 3.35%
3 Mexico $1.352 2.06%
4 France $1.304 1.98%
5 Japan $1.049 1.60%
6 United Kingdom $1.033 1.57%
7 Germany $1.014 1.54%
8 Switzerland $0.821 1.25%
9 Netherlands $0.801 1.22%
10 Spain $0.771 1.17%
Others $9.013 13.72%
Total $65.682 100.00%
Rank CountryValue (bUSD)
Percentage
1 United States $319.298 75.86%
2 China $18.184 4.32%
3 United Kingdom $13.627 3.24%
4 Japan $9.111 2.16%
5 Mexico $6.048 1.44%
6 Korea, South $4.086 0.97%
7 India $3.294 0.78%
8 Germany $3.186 0.76%
9 Belgium $2.707 0.64%
10 France $2.626 0.62%
Others $38.762 9.21%
Total $420.931 100.00%
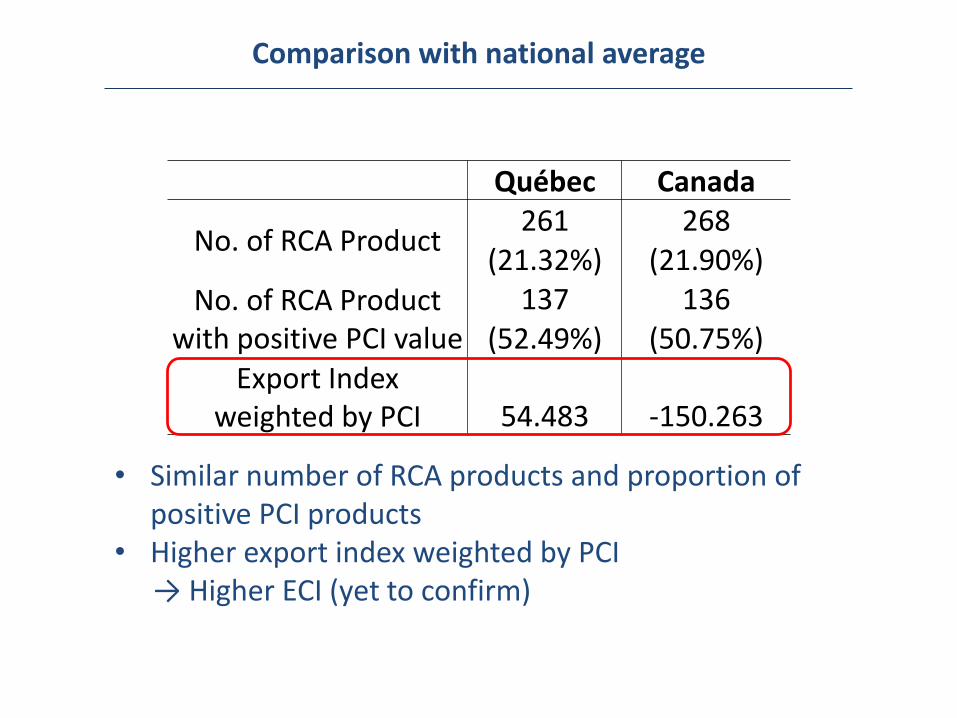
Comparison with national average
Québec Canada
No. of RCA Product261 268
(21.32%) (21.90%)
No. of RCA Product with positive PCI value
137 136(52.49%) (50.75%)
Export Index weighted by PCI 54.483 -150.263
• Similar number of RCA products and proportion of positive PCI products
• Higher export index weighted by PCI→ Higher ECI (yet to confirm)
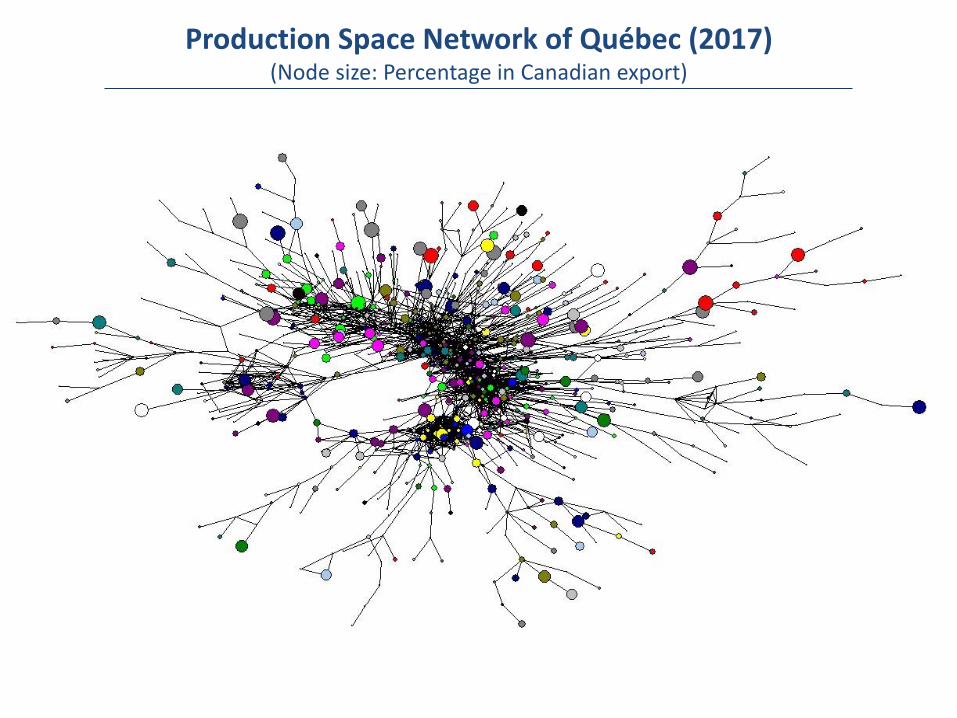
Production Space Network of Québec (2017)(Node size: Percentage in Canadian export)
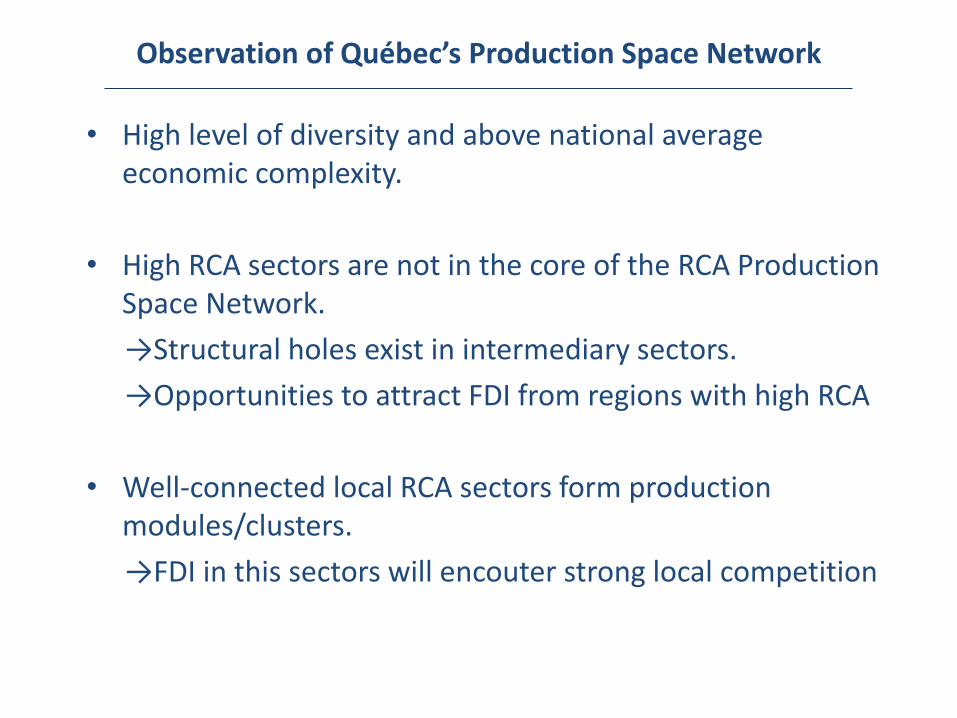
Observation of Québec’s Production Space Network
• High level of diversity and above national averageeconomic complexity.
• High RCA sectors are not in the core of the RCA Production Space Network.
→Structural holes exist in intermediary sectors.
→Opportunities to attract FDI from regions with high RCA
• Well-connected local RCA sectors form production modules/clusters.
→FDI in this sectors will encouter strong local competition
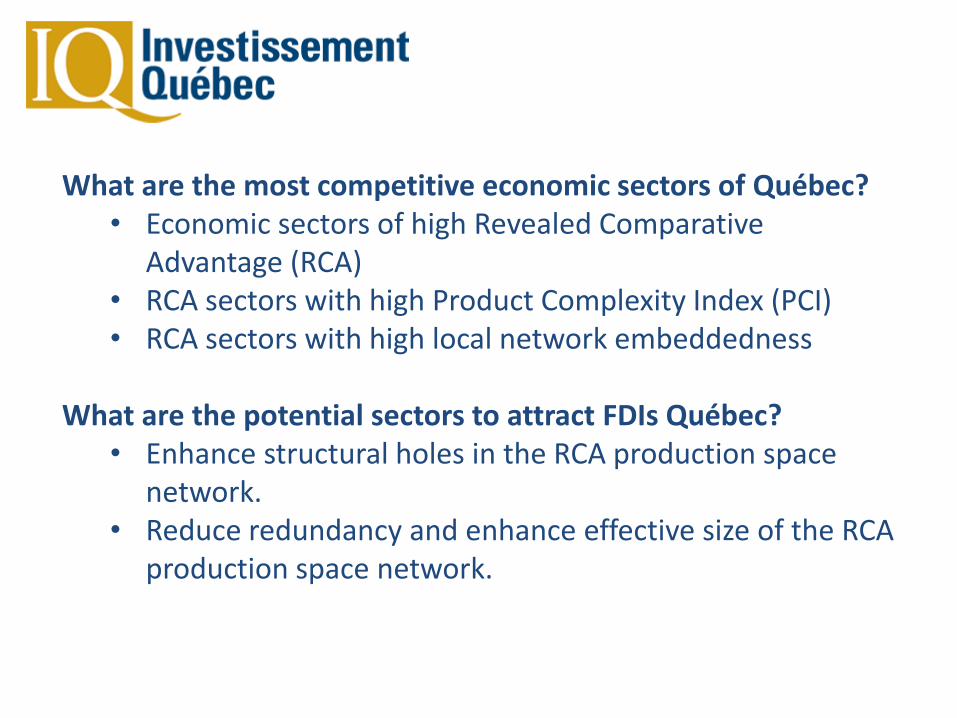
What are the most competitive economic sectors of Québec?• Economic sectors of high Revealed Comparative
Advantage (RCA)• RCA sectors with high Product Complexity Index (PCI)• RCA sectors with high local network embeddedness
What are the potential sectors to attract FDIs Québec?• Enhance structural holes in the RCA production space
network.• Reduce redundancy and enhance effective size of the RCA
production space network.
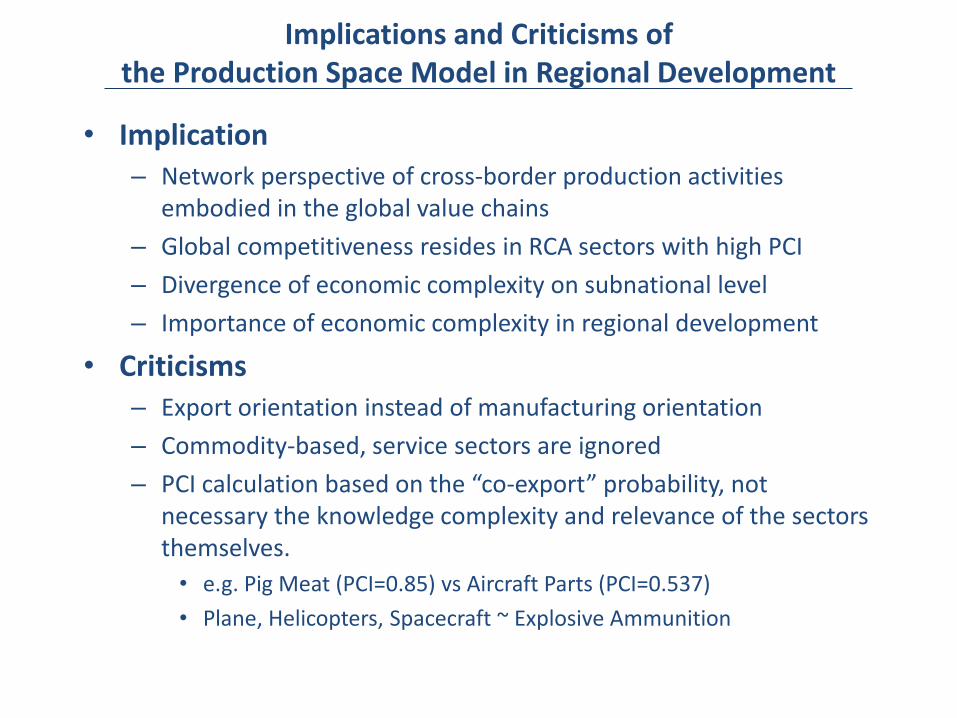
Implications and Criticisms of the Production Space Model in Regional Development
• Implication– Network perspective of cross-border production activities
embodied in the global value chains
– Global competitiveness resides in RCA sectors with high PCI
– Divergence of economic complexity on subnational level
– Importance of economic complexity in regional development
• Criticisms– Export orientation instead of manufacturing orientation
– Commodity-based, service sectors are ignored
– PCI calculation based on the “co-export” probability, not necessary the knowledge complexity and relevance of the sectors themselves.
• e.g. Pig Meat (PCI=0.85) vs Aircraft Parts (PCI=0.537)
• Plane, Helicopters, Spacecraft ~ Explosive Ammunition