Embed Size (px)
Citation preview
Effects of microstructure on water imbibition in sandstonesusing X-ray computed tomographyand neutron radiographyYixin Zhao1,2,3 , Shanbin Xue1, Songbai Han4, Zhongwei Chen5, Shimin Liu3, Derek Elsworth3,Linfeng He4, Jianchao Cai6 , Yuntao Liu4, and Dongfeng Chen4
1College of Resources and Safety Engineering, China University of Mining and Technology, Beijing, China, 2State KeyLaboratory of Coal Resources and Safe Mining, China University of Mining and Technology, Beijing, China, 3Energy andMineral Engineering, G3 Center and EMS Energy Institute, Pennsylvania State University, University Park, Pennsylvania, USA,4Neutron Scattering Laboratory, China Institute of Atomic Energy, Beijing, China, 5School of Mechanical and MiningEngineering, University of Queensland, Brisbane, Queensland, Australia, 6Institute of Geophysics and Geomatics, ChinaUniversity of Geosciences, Wuhan, China
Abstract Capillary imbibition in variably saturated porous media is important in defining displacementprocesses and transport in the vadose zone and in low-permeability barriers and reservoirs. Nonintrusiveimaging in real time offers the potential to examine critical impacts of heterogeneity and surface propertieson imbibition dynamics. Neutron radiography is applied as a powerful imaging tool to observe temporalchanges in the spatial distribution of water in porous materials. We analyze water imbibition in bothhomogeneous and heterogeneous low-permeability sandstones. Dynamic observations of the advance ofthe imbibition front with time are compared with characterizations of microstructure (via high-resolutionX-ray computed tomography (CT)), pore size distribution (Mercury Intrusion Porosimetry), and permeabilityof the contrasting samples. We use an automated method to detect the progress of wetting front with timeand link this to square-root-of-time progress. These data are used to estimate the effect of microstructure onwater sorptivity from a modified Lucas-Washburn equation. Moreover, a model is established to calculate themaximum capillary diameter by modifying the Hagen-Poiseuille and Young-Laplace equations based onfractal theory. Comparing the calculated maximum capillary diameter with the maximum pore diameter(from high-resolution CT) shows congruence between the two independent methods for the homogeneoussilty sandstone but less effectively for the heterogeneous sandstone. Finally, we use these data to linkobserved response with the physical characteristics of the contrasting media—homogeneous versusheterogeneous—and to demonstrate the sensitivity of sorptivity expressly to tortuosity rather than porosityin low-permeability sandstones.
1. Introduction
The study of multiphase flow in porous rocks is related to a broad field with important challenges [Bruce andKlute, 1956; Richards, 1931; Sahimi, 2011; Singh, 2016;Washburn, 1921]. The investigation of water imbibitionin porous rocks is important in a variety of contexts, including the recovery of hydrocarbons from ultralowpermeability reservoirs [Akin and Kovscek, 1999; Karpyn et al., 2009; Li and Horne, 2001, 2013], the disposalof nuclear waste [Hunt and Tompson, 2005; Sahimi, 2011; Tompson et al., 2006], the sequestration of CO2
[Doster et al., 2013; Herring et al., 2013], the environmental remediation [Faybishenko et al., 2005], and theprotection of buildings and groundwater [Birdsell et al., 2015; Cheng et al., 2015; Hall and Hoff, 2012].Several nondestructive techniques [Roels et al., 2004], including nuclear magnetic resonance (NMR) or mag-netic resonance imaging (MRI) [Carpenter et al., 1993; Leech et al., 2003; Pohlmeier et al., 2008a] and γ rayattenuation [Ferguson and Gardner, 1963; Nielsen, 1972; Nizovtsev et al., 2008], have been applied to probedistributions of water saturation and to study the dynamics of liquid transport in porous materials. The quan-titative study of water in porous media using NMR or MRI is limited by the range of pore sizes that can beimaged and the presence of paramagnetic elements in the samples [Chen et al., 2003; Haber-Pohlmeieret al., 2010; Jelinkova et al., 2011; Pohlmeier et al., 2008a]. As an alternative method to visualize fluid flow inporous materials, X-ray imaging can be applied to visualize porosity and equilibrium fluid distributions in por-ous materials [Bayer, 2005; Nabawy and David, 2016; Pease et al., 2012; Roels and Carmeliet, 2006; Schillaci et al.,2008; Tidwell et al., 2000]. For example, Roels and Carmeliet [2006] used microfocus X-ray radiography to
ZHAO ET AL. MICROSTRUCTURE EFFECT ON IMBIBITION 4963
PUBLICATIONSJournal of Geophysical Research: Solid Earth
RESEARCH ARTICLE10.1002/2016JB013786
Key Points:• A new method is presented to mapprogress of the wetting front byneutron radiography enablingeffective sorptivity to beindependently calculated for twokinds low-permeability sandstone
• High-resolution X-ray computedtomography is used to characterizethe microstructure of the investigatedsandstone including maximum porediameter, fractal dimension, andtortuosity
• Predictions of sorptivity are bestwhere the pore size distribution ismost uniform
Correspondence to:Y. Zhao,[email protected]
Citation:Zhao, Y., S. Xue, S. Han, Z. Chen, S. Liu,D. Elsworth, L. He, J. Cai, Y. Liu, andD. Chen (2017), Effects of microstructureon water imbibition in sandstones usingX-ray computed tomography andneutron radiography, J. Geophys. Res.Solid Earth, 122, 4963–4981,doi:10.1002/2016JB013786.
Received 23 NOV 2016Accepted 25 JUN 2017Accepted article online 27 JUN 2017Published online 18 JUL 2017
©2017. American Geophysical Union.All Rights Reserved.
determine moisture content profiles at different time steps during water imbibition in ceramic brick and cal-cium silicate samples. Akin et al. [2000] studied water imbibition in diatomite (high porosity, low permeabil-ity, and siliceous rock) and Berea sandstone samples by using X-ray computed tomography (CT). They foundimbibition rates of the diatomite rival and surpass those for sandstone although diatomite is roughly 100times less permeable than sandstone. David et al. [2008, 2011] investigated water imbibition processes inintact and damaged porous stones using X-ray CT scanning imaging and investigate the influence ofmechanical damage on fluid flow patterns. Pons et al. [2011] used similar methods to investigate the effectof compaction bands on water imbibition in the deformation regime formed under higher confining stres-ses. However, X-ray imaging is also subject to some limitations. X-rays interact with the electron cloud sur-rounding the nucleus of an atom, and its attenuation increases as the atomic number of the target materialincreases. Therefore, contrast agents (e.g., cesium chloride (CsCl) and salts) are helpful to differentiatebetween air and water in variably saturated porous media. However, care must be taken to ensure thatthe contrast agents do not alter the wetting behavior, such as contact angles and interfacial tensions [Kimet al., 2012].
Neutron imaging has unique advantages compared to X-ray imaging for investigating hydrogen-rich fluidsin abiotic nonhydrogenous porous media [Perfect et al., 2014]. Neutrons interact with atomic nuclei, andthis interaction does not show periodic regularity with the atomic number. Neutron imaging can easilyidentify light element-rich materials such as water and oil. However, it is relatively insensitive to metalssuch as Al [Anderson et al., 2009]. This unique feature of the interaction between neutron and lightelements makes neutrons ideally suitable to study the fluid phase behaviors and flow of hydrogen-richfluids within porous media. This is due to their strong attenuation by hydrogen in fluids and their relativeinsensitivity to both the gas phase in pores and rock constituents, such as quartz and clay minerals [Beerand Middleton, 2006]. However, as hydrogenous materials (e.g., water) are strongly neutron scatteringand they behave as contrast agents in neutron imaging, the object under investigation should contain onlytrace quantities.
More importantly, recent technical improvements in neutron imaging provide adequate spatial and temporalresolution to trace water flow and to obtain quantitative information on moisture content. Researchers haveobserved temporal changes in the spatial distribution of water in rocks [Dewanckele et al., 2014; Kang et al.,2013], soil [Carminati et al., 2008; Tullis et al., 1994], ceramics [Zhang et al., 2010], sand [Deinert et al., 2004;Vasin et al., 2008], bricks [Czachor et al., 2002; El Abd et al., 2009; Karoglou et al., 2005], and even nanoporousglass [Gruener et al., 2012] using two-dimensional (2-D) neutron radiography and three-dimensional (3-D)tomography. These measurements have been conducted at various centers worldwide—at Oak RidgeNational Laboratory in the USA, Paul Scherrer Institute in Switzerland, Helmholtz-Zentrum Berlin inGermany, and the Institute Laue Langevin in France [Hall et al., 2010; Hassanein et al., 2006; Perfect et al.,2014]. Jasti et al. [1987] were the first to acquire images of water movements in rock pores using neutronradiography. El Abd et al. [2009] determined the isothermal water diffusivity in fired clay brick using real-timeneutron radiography. Hassanein et al. [2006] investigated the water imbibition in three types of porous rocksincludingMansfield sandstone, porous Salem limestone, and Hindustan whetstone sampled from the state ofIndiana in the U.S., by thermal neutron radiography. Hall [2013] extracted local fluid flow velocities from ima-ging analysis of the neutron radiographs to quantify differential water uptake in an initially air-dry sandstonecore subjected to triaxial load compression. More recently, Cheng et al. [2015] presented the results of waterimbibition in the fractures of Berea sandstones specifically in the initial stage of imbibition. Kang et al. [2013]obtained the unsaturated diffusivity function and sorptivity of Berea sandstone from neutron images ofwater imbibition.
However, the Berea sandstone investigated by Kang et al. [2013] and Cheng et al. [2015] was a high Silica(SiO2) homogeneous pure sandstone with high porosity (0.19–0.25) and permeability (50–500 mD).Compared to high-porosity/permeability rocks, low-permeability rocks are fundamentally different due tothe existence of extensive pores and throats in micron and submicron size range and the dominance of highcapillary effects. Water imbibition in low-permeability sandstone with micron and even submicron pores alsohas broad engineering applications. For example, spontaneous imbibition is perhaps the most importantphenomenon in oil recovery from fractured reservoirs [Akin and Kovscek, 1999] and for carbon capture andstorage where capillary imbibition significantly influences the trapping of CO2 in ultralow permeability sand-stone saline aquifers [Herring et al., 2013; Xie et al., 2016].
Journal of Geophysical Research: Solid Earth 10.1002/2016JB013786
ZHAO ET AL. MICROSTRUCTURE EFFECT ON IMBIBITION 4964
Until now, water imbibition behavior in low-porosity/permeability sandstone has not been fully character-ized, especially for the effect of microstructure on water imbibition in low-permeability sandstones.Although water imbibition in high-porosity/permeability sandstones can provide some guidance for theresponse of low-permeability sandstone, significant differences may result due to the presence of occludedand dead-end pores or clay minerals, for example. Compared with the pore size distribution in high-permeability sandstones, the pore size mainly ranges from micron to submicron in low-permeability sand-stones, which means that, during the imbibition, water needs to overcome greater capillary pressure dueto the existence of air bubbles inside smaller pores. Meanwhile, the swelling and degradation of the clayminerals in the small pores of sandstones can narrow down or even completely close some effective poresand as a result weakens the pore connectivity and increases tortuous of flow path, all of which will signifi-cantly influence and complicate the water imbibition behaviors. Thus, in the current research, a comprehen-sive study of the dynamics of water imbibition in two different types of low-permeability sandstones wasperformed using neutron radiography. The characterization of the microstructures in the two types(heterogeneous and homogeneous) of sandstones was obtained by high-resolution X-ray computedtomography and Mercury Intrusion Porosimetry (MIP). Transient two-dimensional water flow was followedby neutron imaging. Based on the analyses of the neutron radiographs, a new approach was proposed todetermine the location of the wetting front, with the sorptivity measured for both specimens. A modifiedLucas-Washburn (L-W) equation based on the three-dimensional fractal dimension of microstructure was pro-posed. The related results based on the new theoretical model were comparatively evaluated by theexperimental results.
2. Theory Framework
The study of water imbibition in porous media can be traced back to the beginning of the twentieth century.Lucas [1918] and Washburn [1921] investigated water uptake in a single capillary tube together with thekinetic factors influencing water imbibition in porous media. The L-W equation was derived by applyingthe classical Hagen-Poiseuille (H-P) equation to laminar flow of a liquid meniscus in a capillary of radius r inwhich the capillary pressure pc is determined by the Young-Laplace (Y-L) equation [Hall and Hoff, 2012].The L-W equation is the basis of studying the water imbibition in porous media. However, the pore structureof natural porous media is complex and the pore dimensions vary significantly for different specimens. Thus,it is very important to characterize the pore structure of porous media and relate the microstructural featuresto theoretical models of spontaneous imbibition. Theoretical investigations related to microstructural effectson the imbibition process can be classified into three methods. The first is to modify the classical L-W equa-tion by considering the tortuosity or different geometrical shapes of the fluid channels or pore structures[Benavente et al., 2002; Cai et al., 2014; Hammecker et al., 2004; Kao and Hunt, 1996]. The second is of usingfractal models to quantify the pore structure in the process of spontaneous imbibition [Cai et al., 2010; Liand Zhao, 2011; Yu et al., 2014]. The last is of using the pore structures represented by periodic lattice or net-work to investigate water imbibition in a porous medium [Dullien et al., 1977; Joekar-Niasar et al., 2010;Leventis et al., 2000].
2.1. Sorptivity Model for Tortuosity and Geometrical Shape of Capillaries
Several classical theories have been established to describe the laminar flow of incompressible Newtonianliquid in capillary tubes [Hall and Hoff, 2012]. The classical H-P equation describes the flow rate q of an incom-pressible Newtonian liquid in a circular capillary as follows:
q ¼ π128
� λ4ΔPμL
(1)
where λ is the capillary diameter and L is the length of the capillary. ΔP represents the pressure drop along thecapillary and μ is the viscosity of water.
The L-Y equation gives an expression of ΔP in a cylindrical capillary as
ΔP ¼ 4σ cosθλ
(2)
where σ = 0.0728 N/m is the surface tension at the air-water interface and θ is the water-solid contact angle,normally taken as zero.
Journal of Geophysical Research: Solid Earth 10.1002/2016JB013786
ZHAO ET AL. MICROSTRUCTURE EFFECT ON IMBIBITION 4965
Thus, if the gravitational term is negligible, combining equations (1) and (2), the flow rate q in a circular capil-lary can be represented by
q ¼ π128
� λ4
μL� 4σ cosθ
λ(3)
Recently, Cai et al. [2014] derived a generalized model of wetting liquid mass imbibed in a porous mediumrepresented by a bundle of capillary tubes. In this model, the tortuosity τ and geometric correction factorαwere introduced to correct equations (1)–(3). Neglecting gravity effects, the infiltration velocity in a tortuouscapillary can be calculated as
vf ¼ α3λσ cosθ8μ
� 1Lf
(4)
where Lf is the length of the tortuous capillary and α is the geometric correction factor to account for the irre-gular pore structures. α = 1 represents a capillary with a circular cross section, α = 1.094 a square, andα = 1.186 an equilateral triangle [Pickard, 1981].
Moreover, the average tortuosity can be defined by τ = Lf/Le where Le is the height/elevation of the wettingliquid [Cai et al., 2014]. The velocity vf in the tortuous capillary can also be calculated by a straight line velocityvs as vf= τ � vs. The relationship between vf and vs can be extended to the situation of an average imbibitionvelocity as vf ¼ τ�vs . Here vf is the average tortuous imbibition velocity and vs is the average straight lineimbibition velocity for a bundle of capillaries. Thus, vs can be expressed as
vs ¼ vfτ¼ dLe
dt¼ α3λeσ cosθ
8μτ2� 1Le
(5)
where λe represents the central tendency of the tube diameters within the capillary bundle and t is theimbibition time. Integrating the right side of equation (5) from Le = 0 at t = 0 to Le at time t yields
Le ¼ffiffiffiffiffiffiffiffiffiffiffiffiffiffiffiffiffiffiffiffiffiα3λeσ cosθ
4μτ2
s� ffiffi
tp
(6)
The slope of a linear regression between the wetting front height and square root of invasion time was first
termed the sorptivity by Philip [1957]. Based on equation (6), the sorptivity S is given asffiffiffiffiffiffiffiffiffiffiffiffiffiffiffiα3λeσ cosθ
4μτ2
q.
2.2. Sorptivity Model Based On the Fractal Geometry of Capillaries
Katz et al. [1985] and Krohn et al. [1988] reported that the pore size distribution of natural porous media (orcapillaries) has the essential features of a fractal system. Based on the fractal characteristics of tortuouscapillary tubes, Cai et al. [2010] modified equation (3) by neglecting the effect of gravity. The flow rate q isrepresented as
q ¼ π128
� λ4
μLf� 4σ cosθ
λ(7)
Then, the total imbibition rate Q can be expressed as
Q ¼ �∫λmaxλmin
q λð ÞdN ¼ σ cosθ32μ
� λ3max
Leτ� πDf
3� Df� 1� β3�Df� �
(8)
wheredN ¼ �Df λDfmaxλ
� Dfþ1ð Þdλand β = λmin/λmax. λmax and λmin denote themaximum andminimum capillarydiameter, respectively. According to Feng et al. [2004], β is between 10�2 and 10�4 for the porous rocks withfractal features of microstructure. Df is the fractal dimension of the pore distribution.
If we may assume that the two-dimensional porosity of cross-sectional slices is equal to that in the three-dimensional specimen, then the average tortuous imbibition velocity can be calculated by vf ¼ Q= Aϕð Þ .Here A represents the total cross-sectional area of the porous medium and φ is the porosity. As mentioned
Journal of Geophysical Research: Solid Earth 10.1002/2016JB013786
ZHAO ET AL. MICROSTRUCTURE EFFECT ON IMBIBITION 4966
above,vf ¼ τ�vs and the average straight line velocity of water imbibition in a set of curved capillary tubes canbe calculated by
vs ¼ dLedt
¼ σ cosθ32μ
� λ3max
AφLeτ2� πDf 1-β3-Df
� �3-Df
(9)
Integrating equation (9) results in
Le ¼ffiffiffiffiffiffiffiffiffiffiffiffiffiffiffiffiffiffiffiffiffiffiffiffiffiffiffiffiffiffiffiffiffiffiffiffiffiffiffiffiffiffiffiffiffiffiffiffiffiffiffiffiffiσ cosθ16μ
� λ3max
Aφτ2� πDf 1-β3-Df
� �3-Df
s ffiffit
p(10)
Thus, the sorptivity S can be also defined by
S ¼ffiffiffiffiffiffiffiffiffiffiffiffiffiffiffiffiffiffiffiffiffiffiffiffiffiffiffiffiffiffiffiffiffiffiffiffiffiffiffiffiffiffiffiffiffiffiffiffiffiffiffiffiffiσ cosθ16μ
� λ3max
Aφτ2� πDf 1-β3-Df
� �3-Df
s(11)
and the maximum capillary diameter can be calculated by
λmax¼ffiffiffiffiffiffiffiffiffiffiffiffiffiffiffiffiffiffiffiffiffiffiffiffiffiffiffiffiffiffiffiffiffiffiffiffiffiffiffiffiffiffiffiffiffiffiffiffiffiffiffiffiffi16μAφτ2S2
σ cosθ� 3-Df
πDf� 1
1-β3-Df� �3
s(12)
Based on this theoretical framework, a comprehensive analysis was performed to relate the microstructure(X-ray CT) to imbibed samples to the observed sorptivity (neutron radiography).
3. Material and Methods3.1. The Specimen and Mineral Composition
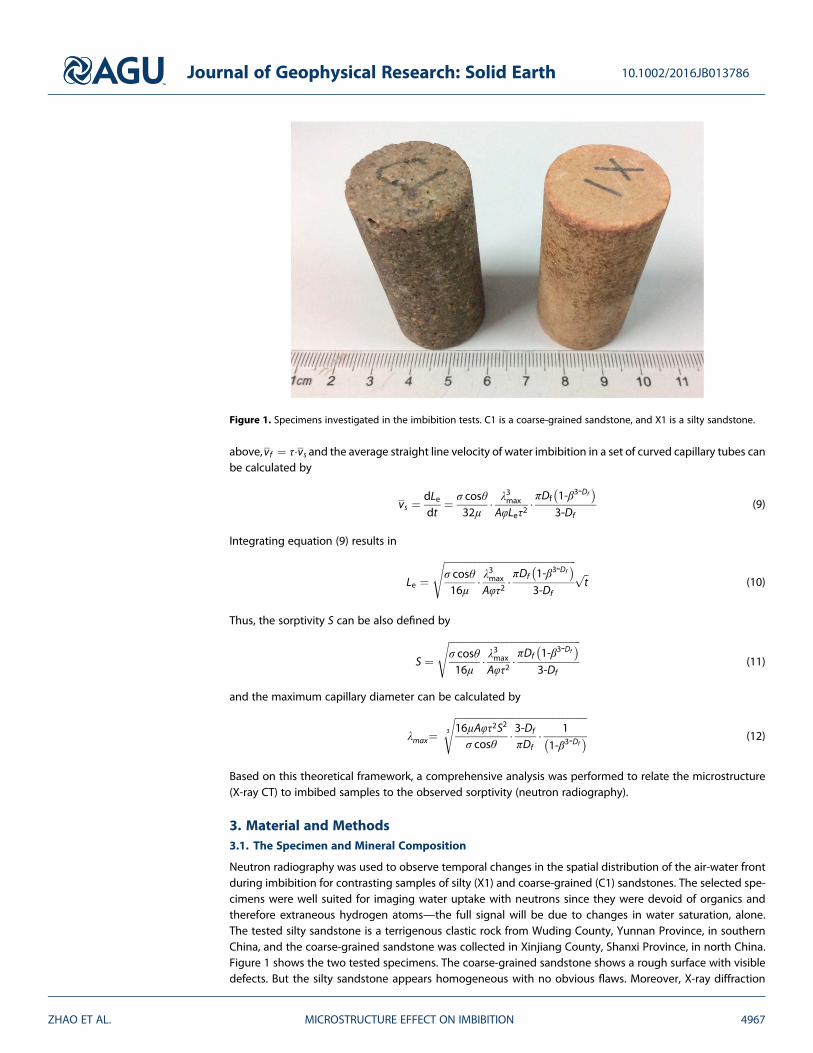
Neutron radiography was used to observe temporal changes in the spatial distribution of the air-water frontduring imbibition for contrasting samples of silty (X1) and coarse-grained (C1) sandstones. The selected spe-cimens were well suited for imaging water uptake with neutrons since they were devoid of organics andtherefore extraneous hydrogen atoms—the full signal will be due to changes in water saturation, alone.The tested silty sandstone is a terrigenous clastic rock from Wuding County, Yunnan Province, in southernChina, and the coarse-grained sandstone was collected in Xinjiang County, Shanxi Province, in north China.Figure 1 shows the two tested specimens. The coarse-grained sandstone shows a rough surface with visibledefects. But the silty sandstone appears homogeneous with no obvious flaws. Moreover, X-ray diffraction
Figure 1. Specimens investigated in the imbibition tests. C1 is a coarse-grained sandstone, and X1 is a silty sandstone.
Journal of Geophysical Research: Solid Earth 10.1002/2016JB013786
ZHAO ET AL. MICROSTRUCTURE EFFECT ON IMBIBITION 4967
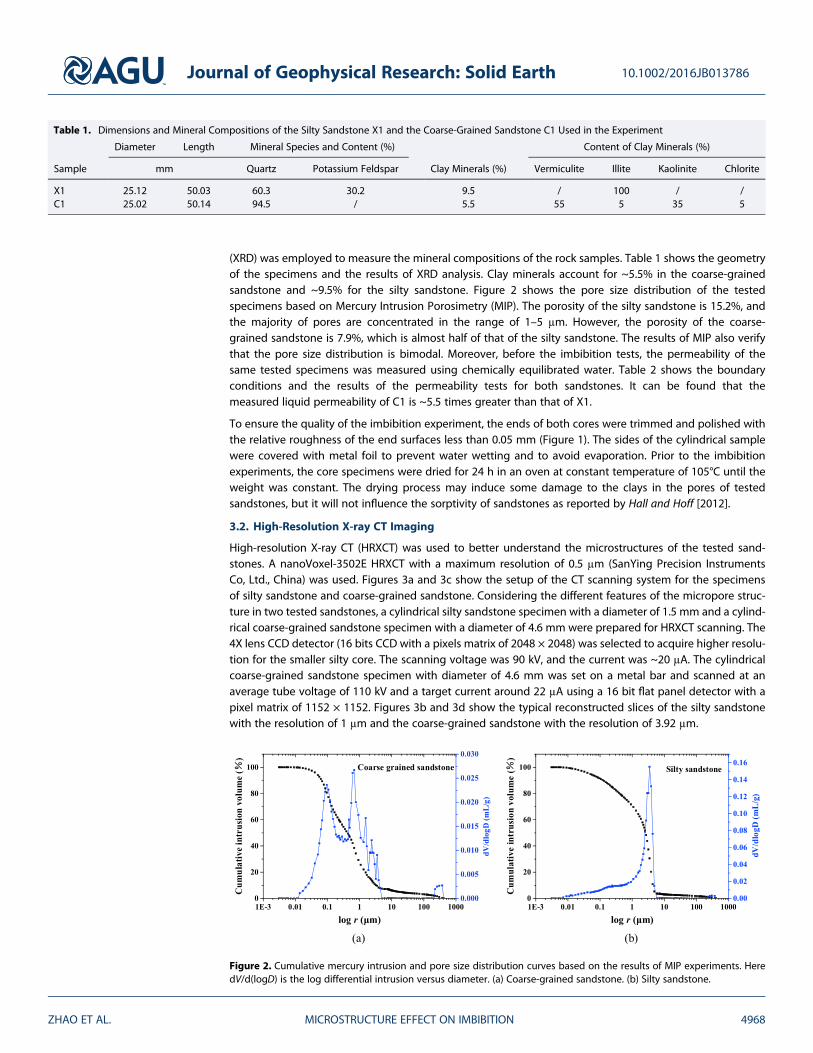
(XRD) was employed to measure the mineral compositions of the rock samples. Table 1 shows the geometryof the specimens and the results of XRD analysis. Clay minerals account for ~5.5% in the coarse-grainedsandstone and ~9.5% for the silty sandstone. Figure 2 shows the pore size distribution of the testedspecimens based on Mercury Intrusion Porosimetry (MIP). The porosity of the silty sandstone is 15.2%, andthe majority of pores are concentrated in the range of 1–5 μm. However, the porosity of the coarse-grained sandstone is 7.9%, which is almost half of that of the silty sandstone. The results of MIP also verifythat the pore size distribution is bimodal. Moreover, before the imbibition tests, the permeability of thesame tested specimens was measured using chemically equilibrated water. Table 2 shows the boundaryconditions and the results of the permeability tests for both sandstones. It can be found that themeasured liquid permeability of C1 is ~5.5 times greater than that of X1.
To ensure the quality of the imbibition experiment, the ends of both cores were trimmed and polished withthe relative roughness of the end surfaces less than 0.05 mm (Figure 1). The sides of the cylindrical samplewere covered with metal foil to prevent water wetting and to avoid evaporation. Prior to the imbibitionexperiments, the core specimens were dried for 24 h in an oven at constant temperature of 105°C until theweight was constant. The drying process may induce some damage to the clays in the pores of testedsandstones, but it will not influence the sorptivity of sandstones as reported by Hall and Hoff [2012].
3.2. High-Resolution X-ray CT Imaging
High-resolution X-ray CT (HRXCT) was used to better understand the microstructures of the tested sand-stones. A nanoVoxel-3502E HRXCT with a maximum resolution of 0.5 μm (SanYing Precision InstrumentsCo, Ltd., China) was used. Figures 3a and 3c show the setup of the CT scanning system for the specimensof silty sandstone and coarse-grained sandstone. Considering the different features of the micropore struc-ture in two tested sandstones, a cylindrical silty sandstone specimen with a diameter of 1.5 mm and a cylind-rical coarse-grained sandstone specimen with a diameter of 4.6 mm were prepared for HRXCT scanning. The4X lens CCD detector (16 bits CCD with a pixels matrix of 2048 × 2048) was selected to acquire higher resolu-tion for the smaller silty core. The scanning voltage was 90 kV, and the current was ~20 μA. The cylindricalcoarse-grained sandstone specimen with diameter of 4.6 mm was set on a metal bar and scanned at anaverage tube voltage of 110 kV and a target current around 22 μA using a 16 bit flat panel detector with apixel matrix of 1152 × 1152. Figures 3b and 3d show the typical reconstructed slices of the silty sandstonewith the resolution of 1 μm and the coarse-grained sandstone with the resolution of 3.92 μm.
Table 1. Dimensions and Mineral Compositions of the Silty Sandstone X1 and the Coarse-Grained Sandstone C1 Used in the Experiment
Sample
Diameter Length Mineral Species and Content (%)
Clay Minerals (%)
Content of Clay Minerals (%)
mm Quartz Potassium Feldspar Vermiculite Illite Kaolinite Chlorite
X1 25.12 50.03 60.3 30.2 9.5 / 100 / /C1 25.02 50.14 94.5 / 5.5 55 5 35 5
Figure 2. Cumulative mercury intrusion and pore size distribution curves based on the results of MIP experiments. HeredV/d(logD) is the log differential intrusion versus diameter. (a) Coarse-grained sandstone. (b) Silty sandstone.
Journal of Geophysical Research: Solid Earth 10.1002/2016JB013786
ZHAO ET AL. MICROSTRUCTURE EFFECT ON IMBIBITION 4968
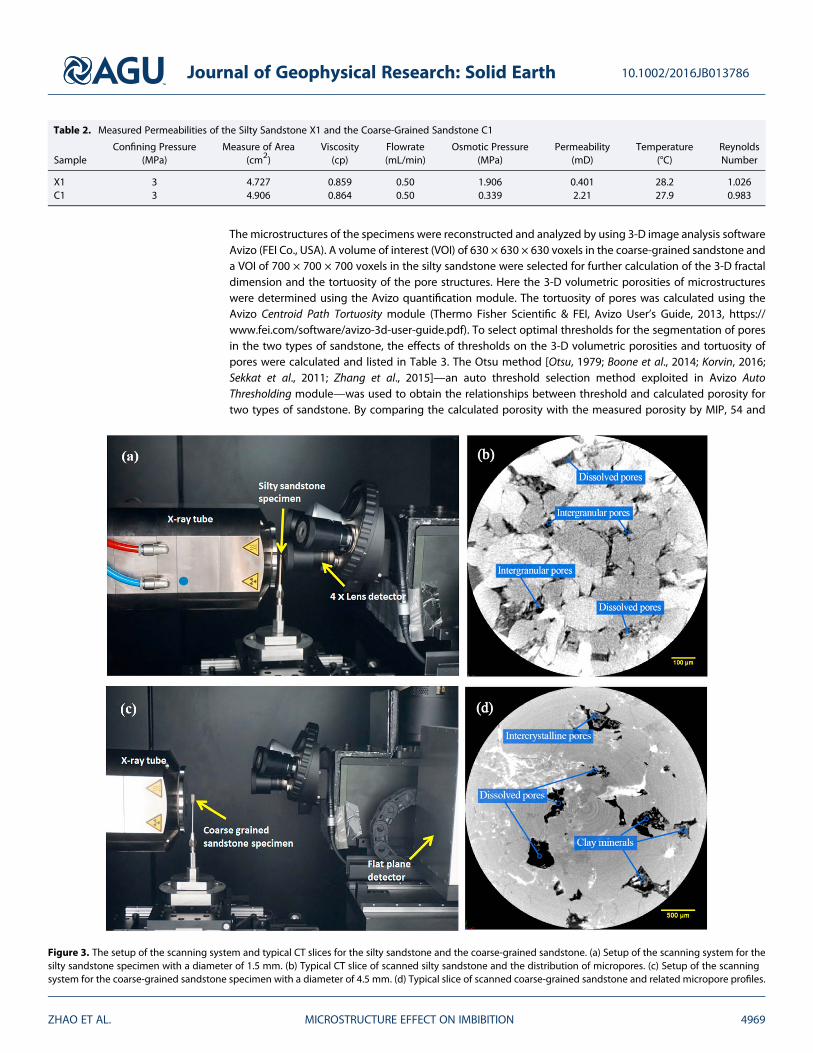
The microstructures of the specimens were reconstructed and analyzed by using 3-D image analysis softwareAvizo (FEI Co., USA). A volume of interest (VOI) of 630 × 630 × 630 voxels in the coarse-grained sandstone anda VOI of 700 × 700 × 700 voxels in the silty sandstone were selected for further calculation of the 3-D fractaldimension and the tortuosity of the pore structures. Here the 3-D volumetric porosities of microstructureswere determined using the Avizo quantification module. The tortuosity of pores was calculated using theAvizo Centroid Path Tortuosity module (Thermo Fisher Scientific & FEI, Avizo User’s Guide, 2013, https://www.fei.com/software/avizo-3d-user-guide.pdf). To select optimal thresholds for the segmentation of poresin the two types of sandstone, the effects of thresholds on the 3-D volumetric porosities and tortuosity ofpores were calculated and listed in Table 3. The Otsu method [Otsu, 1979; Boone et al., 2014; Korvin, 2016;Sekkat et al., 2011; Zhang et al., 2015]—an auto threshold selection method exploited in Avizo AutoThresholding module—was used to obtain the relationships between threshold and calculated porosity fortwo types of sandstone. By comparing the calculated porosity with the measured porosity by MIP, 54 and
Table 2. Measured Permeabilities of the Silty Sandstone X1 and the Coarse-Grained Sandstone C1
SampleConfining Pressure
(MPa)Measure of Area
(cm2)Viscosity(cp)
Flowrate(mL/min)
Osmotic Pressure(MPa)
Permeability(mD)
Temperature(°C)
ReynoldsNumber
X1 3 4.727 0.859 0.50 1.906 0.401 28.2 1.026C1 3 4.906 0.864 0.50 0.339 2.21 27.9 0.983
Figure 3. The setup of the scanning system and typical CT slices for the silty sandstone and the coarse-grained sandstone. (a) Setup of the scanning system for thesilty sandstone specimen with a diameter of 1.5 mm. (b) Typical CT slice of scanned silty sandstone and the distribution of micropores. (c) Setup of the scanningsystem for the coarse-grained sandstone specimen with a diameter of 4.5 mm. (d) Typical slice of scanned coarse-grained sandstone and related micropore profiles.
Journal of Geophysical Research: Solid Earth 10.1002/2016JB013786
ZHAO ET AL. MICROSTRUCTURE EFFECT ON IMBIBITION 4969
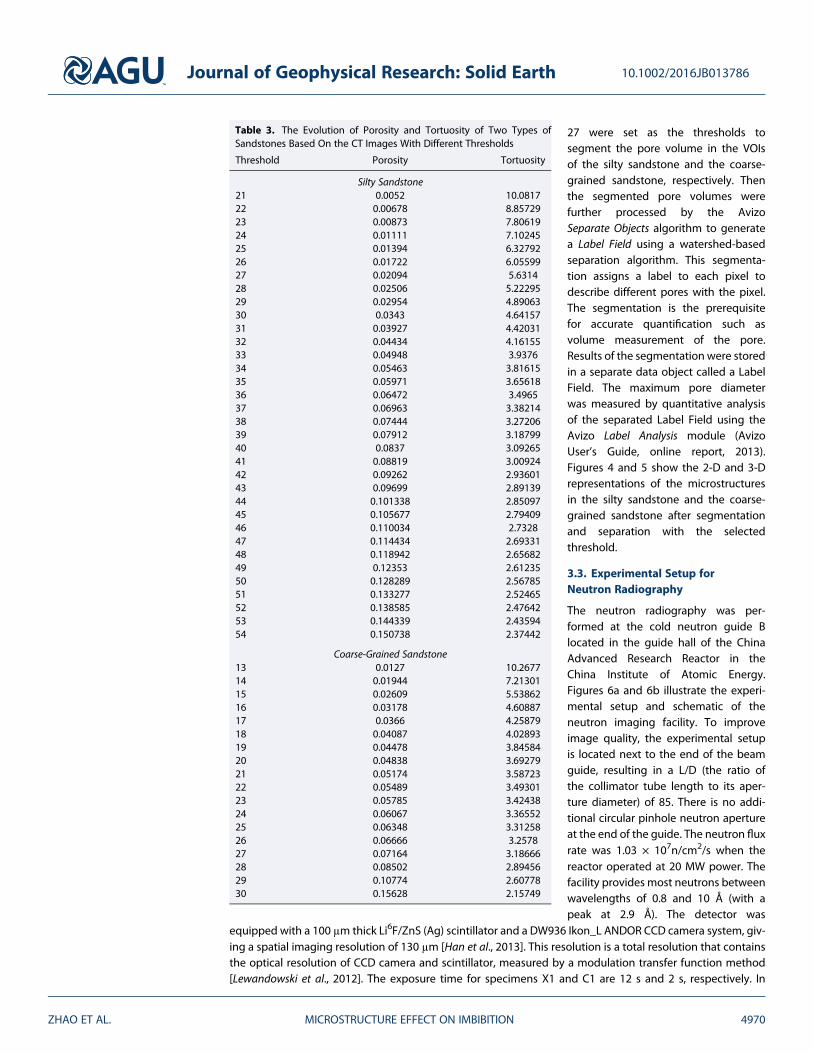
27 were set as the thresholds tosegment the pore volume in the VOIsof the silty sandstone and the coarse-grained sandstone, respectively. Thenthe segmented pore volumes werefurther processed by the AvizoSeparate Objects algorithm to generatea Label Field using a watershed-basedseparation algorithm. This segmenta-tion assigns a label to each pixel todescribe different pores with the pixel.The segmentation is the prerequisitefor accurate quantification such asvolume measurement of the pore.Results of the segmentation were storedin a separate data object called a LabelField. The maximum pore diameterwas measured by quantitative analysisof the separated Label Field using theAvizo Label Analysis module (AvizoUser’s Guide, online report, 2013).Figures 4 and 5 show the 2-D and 3-Drepresentations of the microstructuresin the silty sandstone and the coarse-grained sandstone after segmentationand separation with the selectedthreshold.
3.3. Experimental Setup forNeutron Radiography
The neutron radiography was per-formed at the cold neutron guide Blocated in the guide hall of the ChinaAdvanced Research Reactor in theChina Institute of Atomic Energy.Figures 6a and 6b illustrate the experi-mental setup and schematic of theneutron imaging facility. To improveimage quality, the experimental setupis located next to the end of the beamguide, resulting in a L/D (the ratio ofthe collimator tube length to its aper-ture diameter) of 85. There is no addi-tional circular pinhole neutron apertureat the end of the guide. The neutron fluxrate was 1.03 × 10⁷n/cm2/s when thereactor operated at 20 MW power. Thefacility provides most neutrons betweenwavelengths of 0.8 and 10 Å (with apeak at 2.9 Å). The detector was
equipped with a 100 μm thick Li6F/ZnS (Ag) scintillator and a DW936 Ikon_L ANDOR CCD camera system, giv-ing a spatial imaging resolution of 130 μm [Han et al., 2013]. This resolution is a total resolution that containsthe optical resolution of CCD camera and scintillator, measured by a modulation transfer function method[Lewandowski et al., 2012]. The exposure time for specimens X1 and C1 are 12 s and 2 s, respectively. In
Table 3. The Evolution of Porosity and Tortuosity of Two Types ofSandstones Based On the CT Images With Different Thresholds
Threshold Porosity Tortuosity
Silty Sandstone21 0.0052 10.081722 0.00678 8.8572923 0.00873 7.8061924 0.01111 7.1024525 0.01394 6.3279226 0.01722 6.0559927 0.02094 5.631428 0.02506 5.2229529 0.02954 4.8906330 0.0343 4.6415731 0.03927 4.4203132 0.04434 4.1615533 0.04948 3.937634 0.05463 3.8161535 0.05971 3.6561836 0.06472 3.496537 0.06963 3.3821438 0.07444 3.2720639 0.07912 3.1879940 0.0837 3.0926541 0.08819 3.0092442 0.09262 2.9360143 0.09699 2.8913944 0.101338 2.8509745 0.105677 2.7940946 0.110034 2.732847 0.114434 2.6933148 0.118942 2.6568249 0.12353 2.6123550 0.128289 2.5678551 0.133277 2.5246552 0.138585 2.4764253 0.144339 2.4359454 0.150738 2.37442
Coarse-Grained Sandstone13 0.0127 10.267714 0.01944 7.2130115 0.02609 5.5386216 0.03178 4.6088717 0.0366 4.2587918 0.04087 4.0289319 0.04478 3.8458420 0.04838 3.6927921 0.05174 3.5872322 0.05489 3.4930123 0.05785 3.4243824 0.06067 3.3655225 0.06348 3.3125826 0.06666 3.257827 0.07164 3.1866628 0.08502 2.8945629 0.10774 2.6077830 0.15628 2.15749
Journal of Geophysical Research: Solid Earth 10.1002/2016JB013786
ZHAO ET AL. MICROSTRUCTURE EFFECT ON IMBIBITION 4970
order to reduce dark current noise, the CCD camera was equipped with a Peltier cooling system and routinelycooled down to �60°C. For these measurements, the field of view is approximately 10 cm × 10 cm.
The experimental protocol includes the following: (1) obtain 10 flat field images (shutter opened withoutspecimen) and then 10 dark current images (shutter closed, no neutron illumination), respectively; (2) placethe specimen on the scintillator screen as shown in Figure 6c and take 10 images of the dried specimen; and(3) measure and monitor the water front invasion on a continuous time basis. An aluminum container is usedto supply water and placed on an elevatable platform. The aluminum container is filled with distilled water toa depth of 1 cm. During the monitoring of the water front, the water container is gradually raised until thebase of the specimen (approximately 5 mm) contacts the free surface of the water—this moment is definedas zero time. Images acquired from this moment are denoted as I(Wet). Because of the limitation of the experi-ment time for specimen X1, a total of 161 raw images was obtained and 54 images were processed to calcu-late the sorptivity in a time interval of ~41 s. This also causes the final water front to remain lower than 25 mmin the specimen (X1). For specimen C1, a total of 55 images was selected from 4545 raw images to calculatethe sorptivity. The time interval is 40 s for the first 20 selected images and 200 s for the remaining 35 images.
3.4. Neutron Image Processing and Parameter Estimation
For a monochromatic (single wavelength) beam traversing a homogeneous specimen, the measured inten-sity T is given by the Lambert-Beer law [Anderson et al., 2009]
T=T0 ¼ e�γω tð Þ (13)
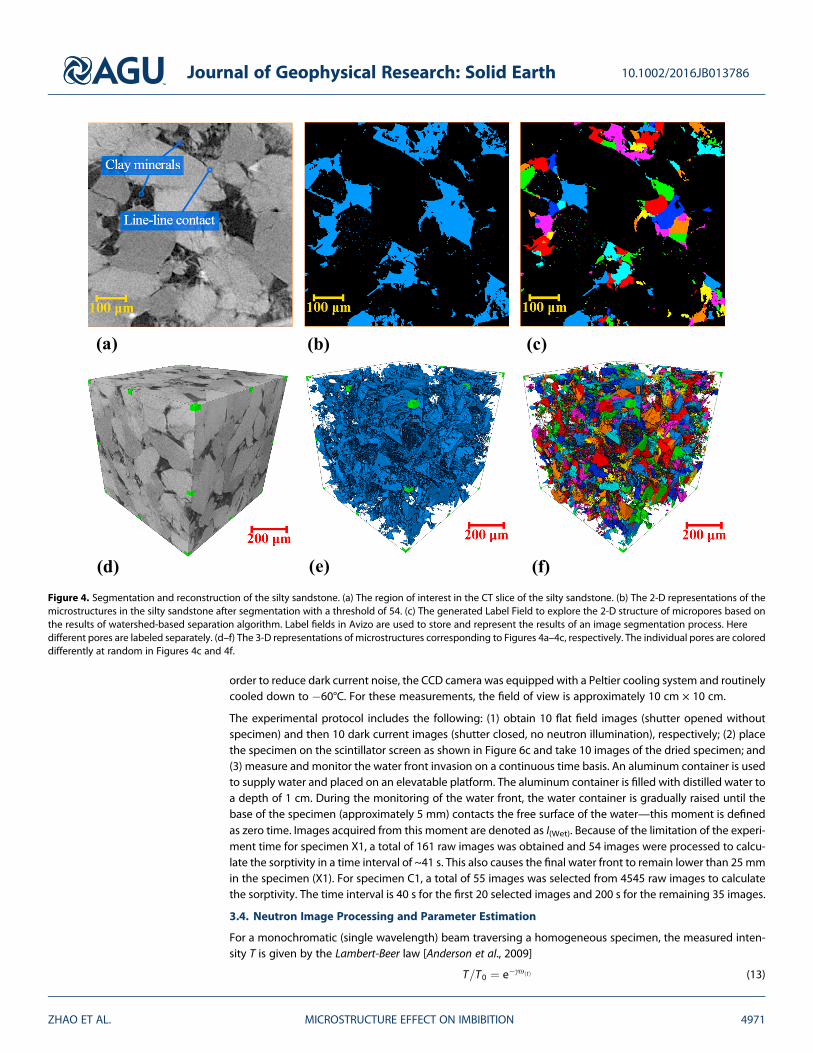
Figure 4. Segmentation and reconstruction of the silty sandstone. (a) The region of interest in the CT slice of the silty sandstone. (b) The 2-D representations of themicrostructures in the silty sandstone after segmentation with a threshold of 54. (c) The generated Label Field to explore the 2-D structure of micropores based onthe results of watershed-based separation algorithm. Label fields in Avizo are used to store and represent the results of an image segmentation process. Heredifferent pores are labeled separately. (d–f) The 3-D representations of microstructures corresponding to Figures 4a–4c, respectively. The individual pores are coloreddifferently at random in Figures 4c and 4f.
Journal of Geophysical Research: Solid Earth 10.1002/2016JB013786
ZHAO ET AL. MICROSTRUCTURE EFFECT ON IMBIBITION 4971
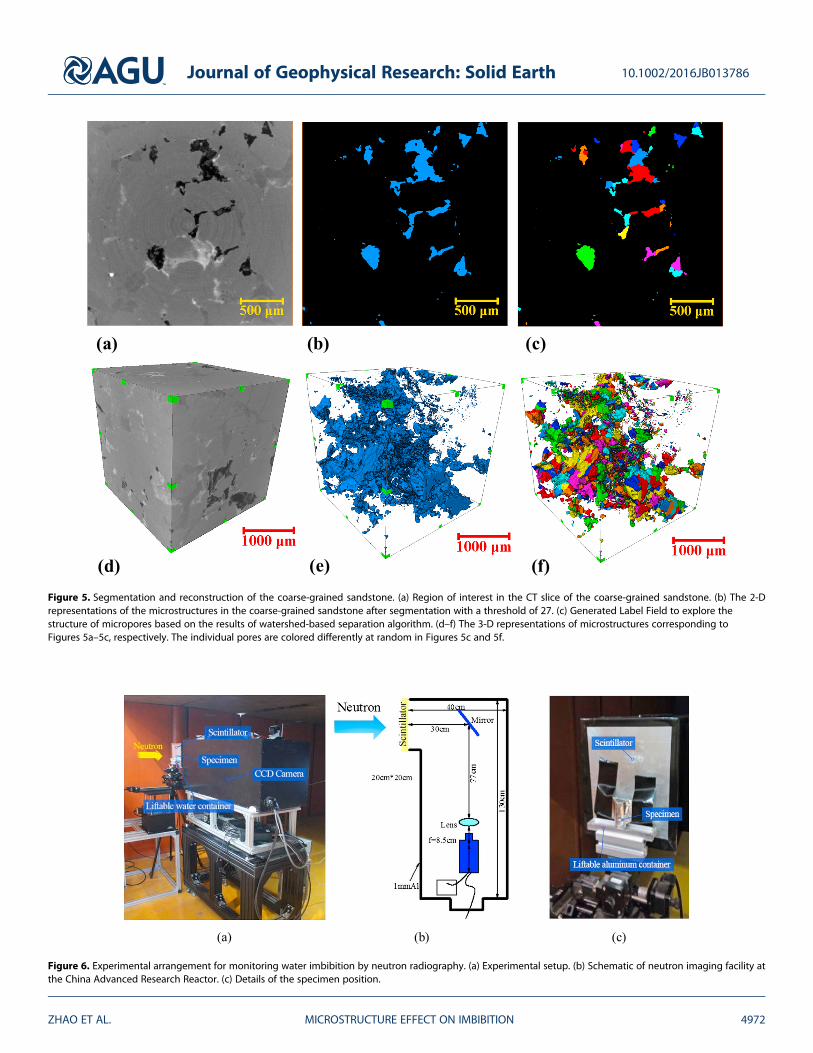
Figure 5. Segmentation and reconstruction of the coarse-grained sandstone. (a) Region of interest in the CT slice of the coarse-grained sandstone. (b) The 2-Drepresentations of the microstructures in the coarse-grained sandstone after segmentation with a threshold of 27. (c) Generated Label Field to explore thestructure of micropores based on the results of watershed-based separation algorithm. (d–f) The 3-D representations of microstructures corresponding toFigures 5a–5c, respectively. The individual pores are colored differently at random in Figures 5c and 5f.
Figure 6. Experimental arrangement for monitoring water imbibition by neutron radiography. (a) Experimental setup. (b) Schematic of neutron imaging facility atthe China Advanced Research Reactor. (c) Details of the specimen position.
Journal of Geophysical Research: Solid Earth 10.1002/2016JB013786
ZHAO ET AL. MICROSTRUCTURE EFFECT ON IMBIBITION 4972
where T is the transmitted intensity, T0 is the original intensity, γ is the attenuation coefficient of water, andω(t) is the time-dependent water thickness along the direction of neutron beam.
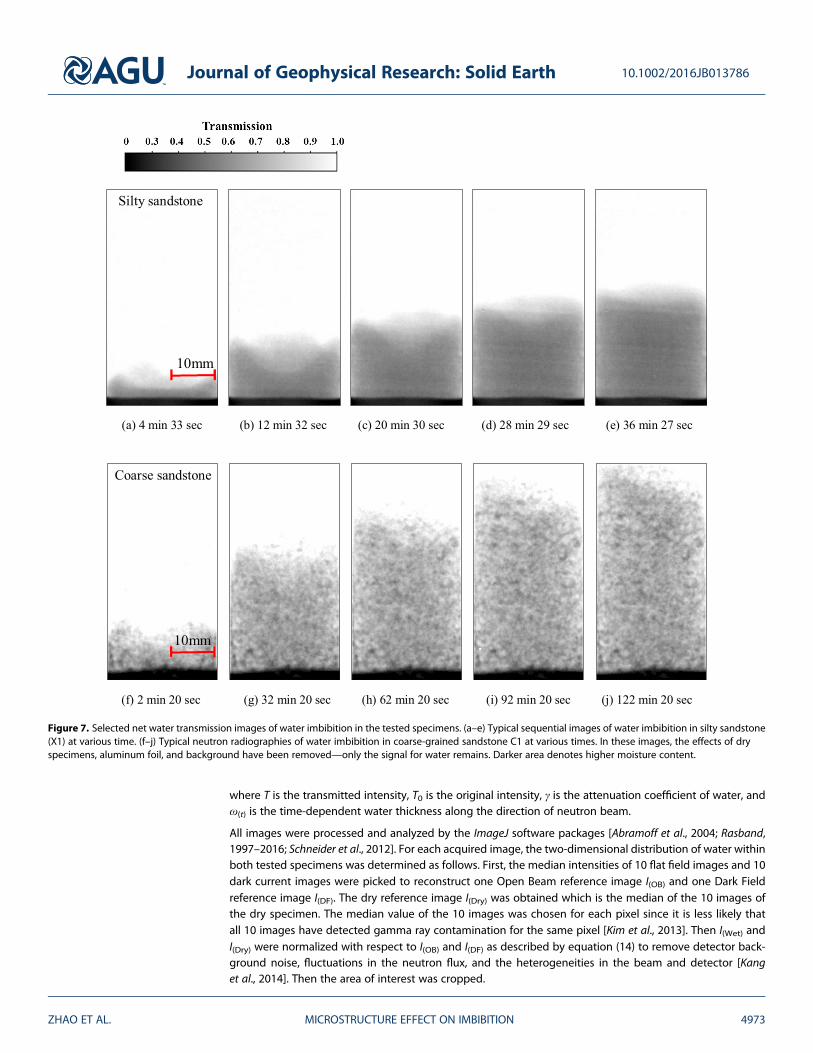
All images were processed and analyzed by the ImageJ software packages [Abramoff et al., 2004; Rasband,1997–2016; Schneider et al., 2012]. For each acquired image, the two-dimensional distribution of water withinboth tested specimens was determined as follows. First, the median intensities of 10 flat field images and 10dark current images were picked to reconstruct one Open Beam reference image I(OB) and one Dark Fieldreference image I(DF). The dry reference image I(Dry) was obtained which is the median of the 10 images ofthe dry specimen. The median value of the 10 images was chosen for each pixel since it is less likely thatall 10 images have detected gamma ray contamination for the same pixel [Kim et al., 2013]. Then I(Wet) andI(Dry) were normalized with respect to I(OB) and I(DF) as described by equation (14) to remove detector back-ground noise, fluctuations in the neutron flux, and the heterogeneities in the beam and detector [Kanget al., 2014]. Then the area of interest was cropped.
Figure 7. Selected net water transmission images of water imbibition in the tested specimens. (a–e) Typical sequential images of water imbibition in silty sandstone(X1) at various time. (f–j) Typical neutron radiographies of water imbibition in coarse-grained sandstone C1 at various times. In these images, the effects of dryspecimens, aluminum foil, and background have been removed—only the signal for water remains. Darker area denotes higher moisture content.
Journal of Geophysical Research: Solid Earth 10.1002/2016JB013786
ZHAO ET AL. MICROSTRUCTURE EFFECT ON IMBIBITION 4973
I0 Wetð Þ ¼ f k �I Wetð Þ-I DFð ÞI OBð Þ-I DFð Þ
(14)
In equation (14), I(Wet) can be substituted by I(Dry) to obtain I0 Dryð Þ. For the same specimen, all the images were
acquired under the same power of the neutron beam, the rescaling factor fk used to correct the fluctuationsin the neutron flux was taken as unity in this work.
The normalized wet images I0 Wetð Þwere divided by the normalized dry images I0 Dryð Þ to obtain the net water
transmission images In. Any attenuation effects associated with minerals in the specimen and the alumi-num foil tape were removed from images In. The transmission of images In on a pixel-by-pixel basis wasset equal to T/T0. The selected net water transmission images of specimens X1 and C1 are shown inFigure 7. Based on equation (13), it can be concluded that the smaller the transmission of the images In,the larger the water content.
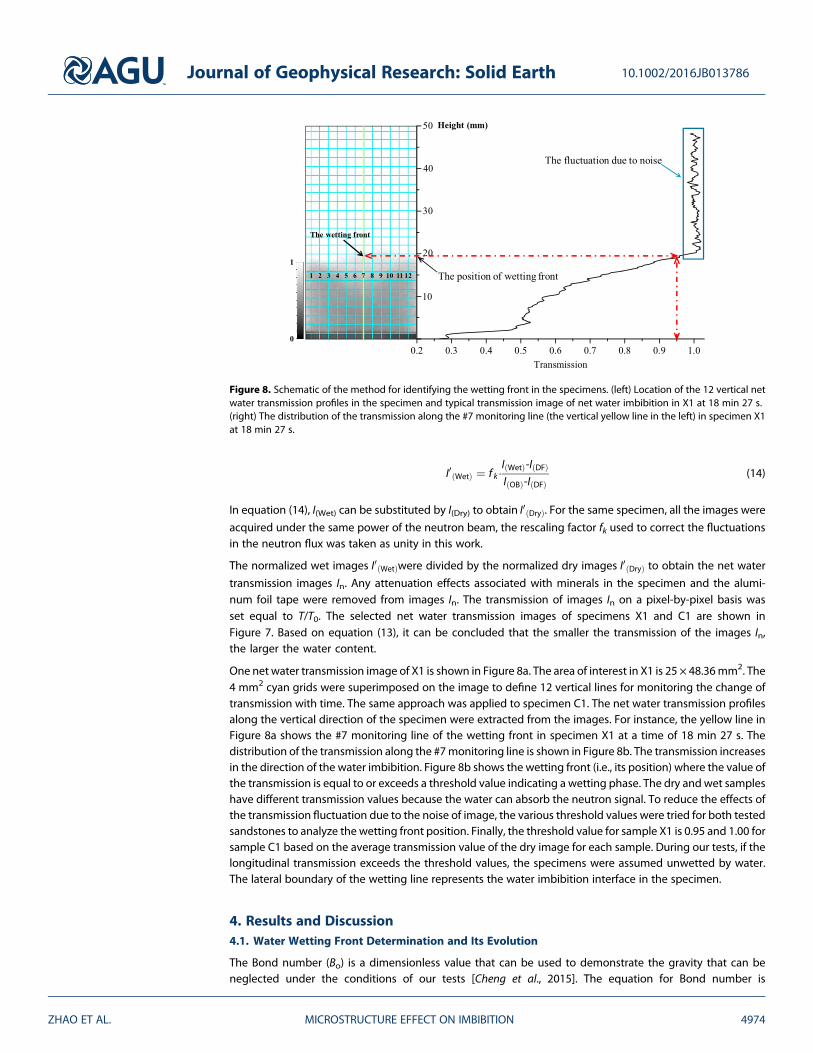
One net water transmission image of X1 is shown in Figure 8a. The area of interest in X1 is 25 × 48.36mm2. The4 mm2 cyan grids were superimposed on the image to define 12 vertical lines for monitoring the change oftransmission with time. The same approach was applied to specimen C1. The net water transmission profilesalong the vertical direction of the specimen were extracted from the images. For instance, the yellow line inFigure 8a shows the #7 monitoring line of the wetting front in specimen X1 at a time of 18 min 27 s. Thedistribution of the transmission along the #7monitoring line is shown in Figure 8b. The transmission increasesin the direction of the water imbibition. Figure 8b shows the wetting front (i.e., its position) where the value ofthe transmission is equal to or exceeds a threshold value indicating a wetting phase. The dry and wet sampleshave different transmission values because the water can absorb the neutron signal. To reduce the effects ofthe transmission fluctuation due to the noise of image, the various threshold values were tried for both testedsandstones to analyze the wetting front position. Finally, the threshold value for sample X1 is 0.95 and 1.00 forsample C1 based on the average transmission value of the dry image for each sample. During our tests, if thelongitudinal transmission exceeds the threshold values, the specimens were assumed unwetted by water.The lateral boundary of the wetting line represents the water imbibition interface in the specimen.
4. Results and Discussion4.1. Water Wetting Front Determination and Its Evolution
The Bond number (Bo) is a dimensionless value that can be used to demonstrate the gravity that can beneglected under the conditions of our tests [Cheng et al., 2015]. The equation for Bond number is
Figure 8. Schematic of the method for identifying the wetting front in the specimens. (left) Location of the 12 vertical netwater transmission profiles in the specimen and typical transmission image of net water imbibition in X1 at 18 min 27 s.(right) The distribution of the transmission along the #7 monitoring line (the vertical yellow line in the left) in specimen X1at 18 min 27 s.
Journal of Geophysical Research: Solid Earth 10.1002/2016JB013786
ZHAO ET AL. MICROSTRUCTURE EFFECT ON IMBIBITION 4974
BO= ρ � g � kw/σ. Here the density of water is ρ = 1000 kgm�3, the air-water interfacial tension is σ = 0.0728 N/mat 20°C, and the gravitational acceleration is g = 9.81 m s�2. kw represented intrinsic permeability of the rockwhich can be found in Table 2. Thus, the Bond number is 5.33 × 10�11 for the silty sandstone and 2.94 × 10�10
for the coarse grain sandstone, which are much smaller than one. So the contribution of gravity can beignored in our experiment. At macroscopic scale, spontaneous imbibition associated with a uniformwetting front occurs in a homogenous porous medium when water displaces dry air. This macroimbibitionphenomenon can be simplified as a one-dimensional problem. Considering the complexity ofmicrostructures in the tested sandstones, 12 vertical net water transmission profiles were set for eachspecimen, as shown in Figure 8a. The net water wetting front was monitored in space (laterally) and in time.
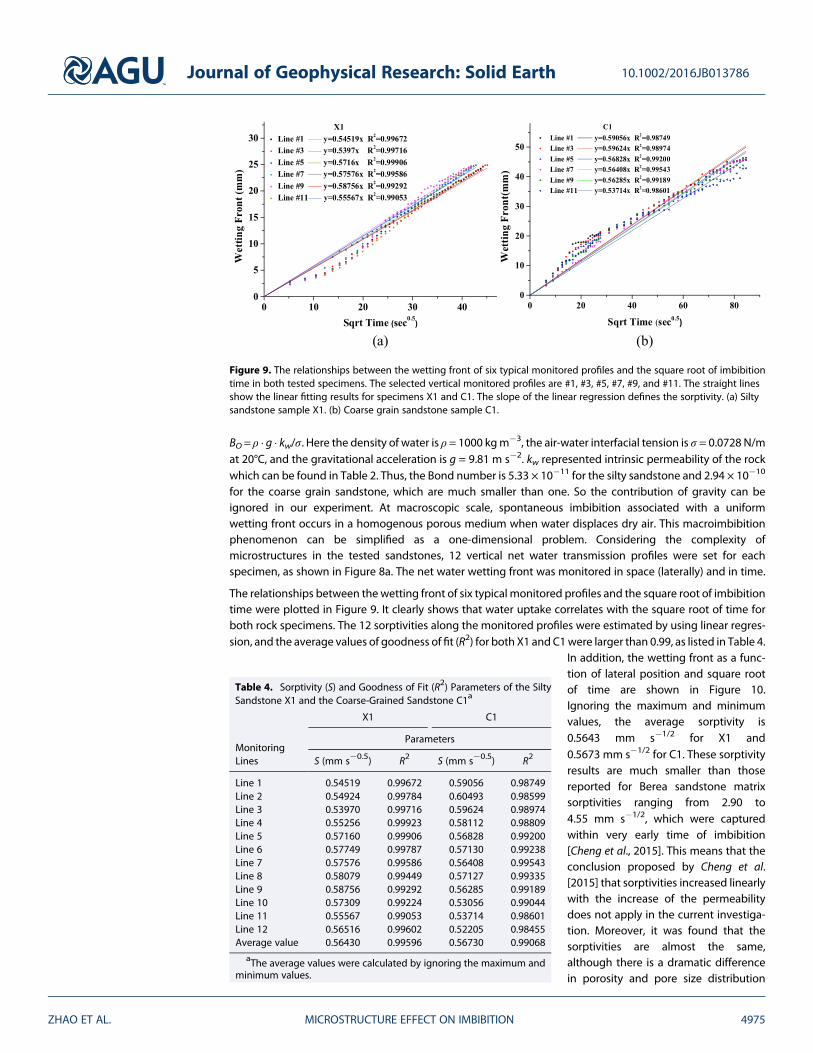
The relationships between thewetting front of six typical monitored profiles and the square root of imbibitiontime were plotted in Figure 9. It clearly shows that water uptake correlates with the square root of time forboth rock specimens. The 12 sorptivities along the monitored profiles were estimated by using linear regres-sion, and the average values of goodness of fit (R2) for both X1 and C1were larger than 0.99, as listed in Table 4.
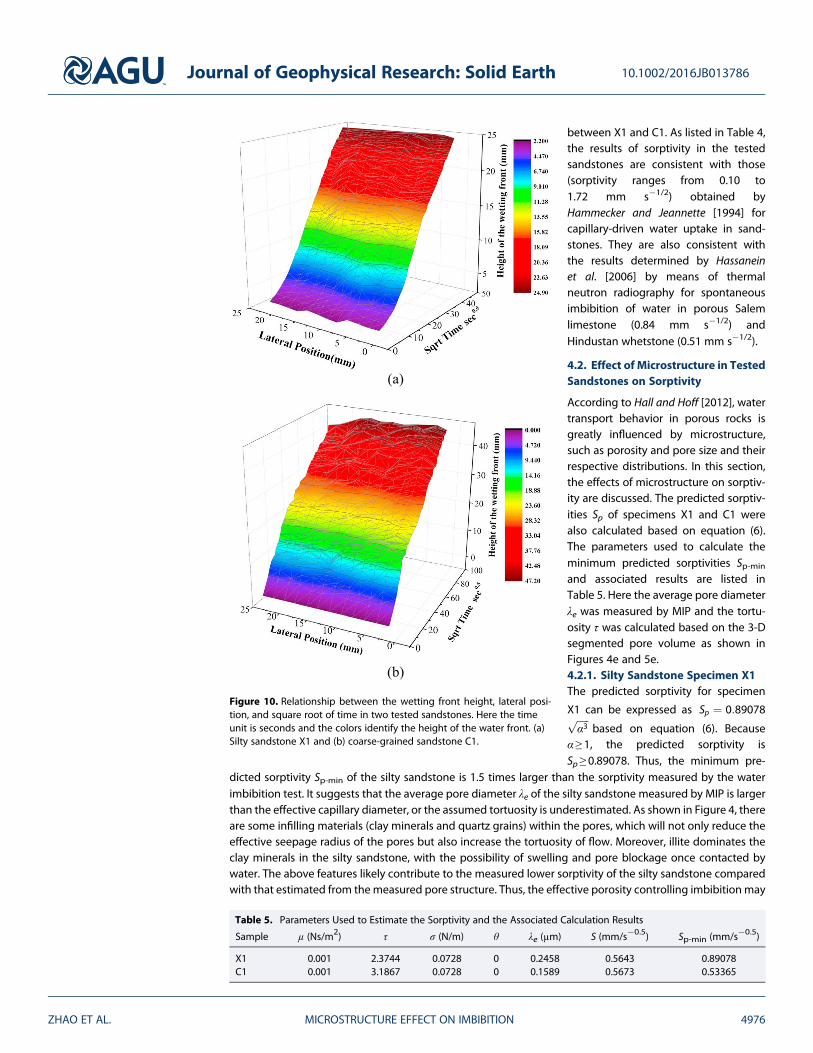
In addition, the wetting front as a func-tion of lateral position and square rootof time are shown in Figure 10.Ignoring the maximum and minimumvalues, the average sorptivity is0.5643 mm s�1/2 for X1 and0.5673 mm s�1/2 for C1. These sorptivityresults are much smaller than thosereported for Berea sandstone matrixsorptivities ranging from 2.90 to4.55 mm s�1/2, which were capturedwithin very early time of imbibition[Cheng et al., 2015]. This means that theconclusion proposed by Cheng et al.[2015] that sorptivities increased linearlywith the increase of the permeabilitydoes not apply in the current investiga-tion. Moreover, it was found that thesorptivities are almost the same,although there is a dramatic differencein porosity and pore size distribution
Figure 9. The relationships between the wetting front of six typical monitored profiles and the square root of imbibitiontime in both tested specimens. The selected vertical monitored profiles are #1, #3, #5, #7, #9, and #11. The straight linesshow the linear fitting results for specimens X1 and C1. The slope of the linear regression defines the sorptivity. (a) Siltysandstone sample X1. (b) Coarse grain sandstone sample C1.
Table 4. Sorptivity (S) and Goodness of Fit (R2) Parameters of the SiltySandstone X1 and the Coarse-Grained Sandstone C1a
MonitoringLines
X1 C1
Parameters
S (mm s�0.5) R2 S (mm s�0.5) R2
Line 1 0.54519 0.99672 0.59056 0.98749Line 2 0.54924 0.99784 0.60493 0.98599Line 3 0.53970 0.99716 0.59624 0.98974Line 4 0.55256 0.99923 0.58112 0.98809Line 5 0.57160 0.99906 0.56828 0.99200Line 6 0.57749 0.99787 0.57130 0.99238Line 7 0.57576 0.99586 0.56408 0.99543Line 8 0.58079 0.99449 0.57127 0.99335Line 9 0.58756 0.99292 0.56285 0.99189Line 10 0.57309 0.99224 0.53056 0.99044Line 11 0.55567 0.99053 0.53714 0.98601Line 12 0.56516 0.99602 0.52205 0.98455Average value 0.56430 0.99596 0.56730 0.99068
aThe average values were calculated by ignoring the maximum andminimum values.
Journal of Geophysical Research: Solid Earth 10.1002/2016JB013786
ZHAO ET AL. MICROSTRUCTURE EFFECT ON IMBIBITION 4975
between X1 and C1. As listed in Table 4,the results of sorptivity in the testedsandstones are consistent with those(sorptivity ranges from 0.10 to1.72 mm s�1/2) obtained byHammecker and Jeannette [1994] forcapillary-driven water uptake in sand-stones. They are also consistent withthe results determined by Hassaneinet al. [2006] by means of thermalneutron radiography for spontaneousimbibition of water in porous Salemlimestone (0.84 mm s�1/2) andHindustan whetstone (0.51 mm s�1/2).
4.2. Effect of Microstructure in TestedSandstones on Sorptivity
According to Hall and Hoff [2012], watertransport behavior in porous rocks isgreatly influenced by microstructure,such as porosity and pore size and theirrespective distributions. In this section,the effects of microstructure on sorptiv-ity are discussed. The predicted sorptiv-ities Sp of specimens X1 and C1 werealso calculated based on equation (6).The parameters used to calculate theminimum predicted sorptivities Sp-min
and associated results are listed inTable 5. Here the average pore diameterλe was measured by MIP and the tortu-osity τ was calculated based on the 3-Dsegmented pore volume as shown inFigures 4e and 5e.4.2.1. Silty Sandstone Specimen X1The predicted sorptivity for specimen
X1 can be expressed as Sp ¼ 0:89078ffiffiffiffiffiα3
pbased on equation (6). Because
α ≥ 1, the predicted sorptivity isSp ≥ 0.89078. Thus, the minimum pre-
dicted sorptivity Sp-min of the silty sandstone is 1.5 times larger than the sorptivity measured by the waterimbibition test. It suggests that the average pore diameter λe of the silty sandstone measured by MIP is largerthan the effective capillary diameter, or the assumed tortuosity is underestimated. As shown in Figure 4, thereare some infilling materials (clay minerals and quartz grains) within the pores, which will not only reduce theeffective seepage radius of the pores but also increase the tortuosity of flow. Moreover, illite dominates theclay minerals in the silty sandstone, with the possibility of swelling and pore blockage once contacted bywater. The above features likely contribute to the measured lower sorptivity of the silty sandstone comparedwith that estimated from themeasured pore structure. Thus, the effective porosity controlling imbibitionmay
Figure 10. Relationship between the wetting front height, lateral posi-tion, and square root of time in two tested sandstones. Here the timeunit is seconds and the colors identify the height of the water front. (a)Silty sandstone X1 and (b) coarse-grained sandstone C1.
Table 5. Parameters Used to Estimate the Sorptivity and the Associated Calculation Results
Sample μ (Ns/m2) τ σ (N/m) θ λe (μm) S (mm/s�0.5) Sp-min (mm/s�0.5)
X1 0.001 2.3744 0.0728 0 0.2458 0.5643 0.89078C1 0.001 3.1867 0.0728 0 0.1589 0.5673 0.53365
Journal of Geophysical Research: Solid Earth 10.1002/2016JB013786
ZHAO ET AL. MICROSTRUCTURE EFFECT ON IMBIBITION 4976
be overestimated by analyzing the CT images of dry specimen since it introduces an underestimation of thetortuosity. Finally, the spatial microstructure will contribute to a low capillary diameter and a high tortuosityfor water imbibition in the silty sandstone.4.2.2. Coarse-Grained Sandstone Specimen C1
The predicted sorptivity for specimen C1 is evaluated as 0:53365ffiffiffiffiffiα3
p, resulting in a predicted sorptivity of
Sp ≥ 0.53365 as α ≥ 1. Thus, the sorptivity measured by the previous water imbibition test is 1.06 times largerthan the minimum predicted value Sp-min. Compared to the predicted sorptivity of the silty sandstone, equa-tion (6) gives a closer estimate for the coarse-grained sandstone.
Table 5 shows that the minimum predicted sorptivity Sp-min and the measured sorptivity S are ~40% and~0.53% larger than that of the silty sandstone. But the porosity of the coarse-grained sandstone is 7.16%,which is nearly half of that of the silty sandstone. Previous research has noted that rocks with the porositylower than ~10%may have poor pore connectivity due to the shrinkage, closure, and elimination of the porethroats [Benavente et al., 2015; Doyen, 1988;Wong et al., 1984]. Figure 5e also verifies the poor connectivity ofthe coarse-grained sandstone. A low connectivity also likely results in a high tortuosity and low sorptivity ofthe coarse-grained sandstone. Thus, the pore size, clay minerals, and porosity control the capillary diameterand tortuosity and further determine the sorptivity during water imbibition in the low-permeability regime.
4.3. Determination of the Maximum Capillary Diameter for Sorptivity
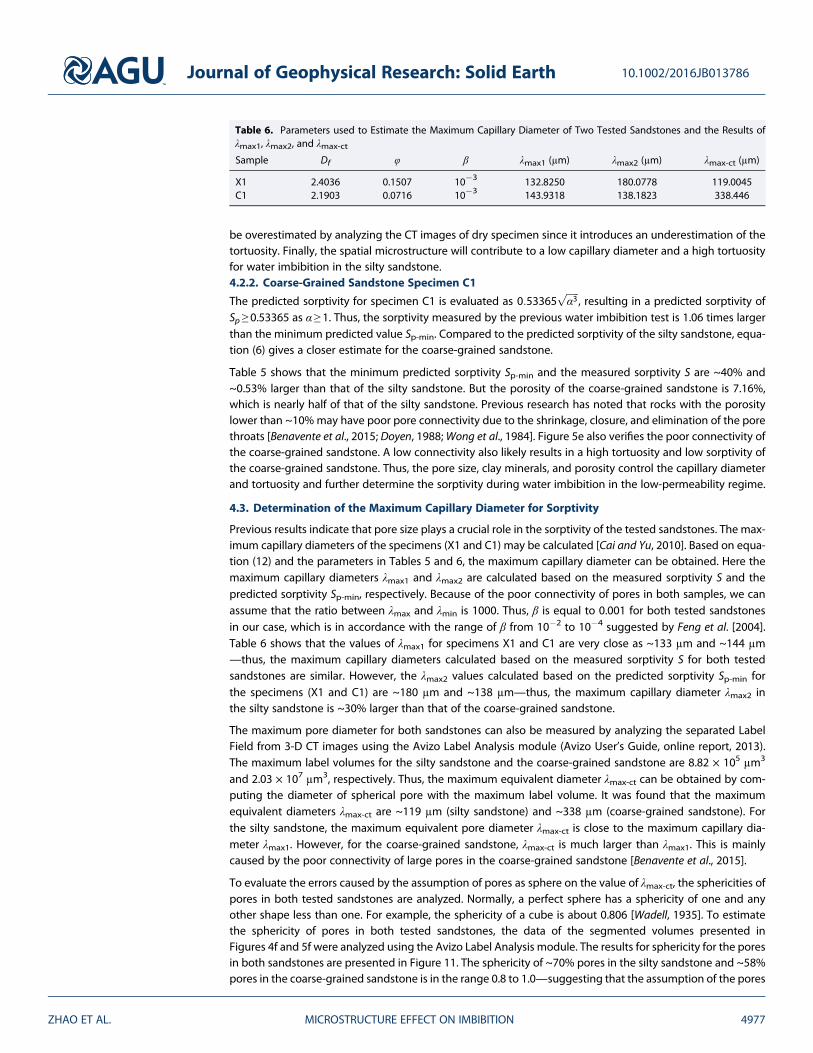
Previous results indicate that pore size plays a crucial role in the sorptivity of the tested sandstones. The max-imum capillary diameters of the specimens (X1 and C1) may be calculated [Cai and Yu, 2010]. Based on equa-tion (12) and the parameters in Tables 5 and 6, the maximum capillary diameter can be obtained. Here themaximum capillary diameters λmax1 and λmax2 are calculated based on the measured sorptivity S and thepredicted sorptivity Sp-min, respectively. Because of the poor connectivity of pores in both samples, we canassume that the ratio between λmax and λmin is 1000. Thus, β is equal to 0.001 for both tested sandstonesin our case, which is in accordance with the range of β from 10�2 to 10�4 suggested by Feng et al. [2004].Table 6 shows that the values of λmax1 for specimens X1 and C1 are very close as ~133 μm and ~144 μm—thus, the maximum capillary diameters calculated based on the measured sorptivity S for both testedsandstones are similar. However, the λmax2 values calculated based on the predicted sorptivity Sp-min forthe specimens (X1 and C1) are ~180 μm and ~138 μm—thus, the maximum capillary diameter λmax2 inthe silty sandstone is ~30% larger than that of the coarse-grained sandstone.
The maximum pore diameter for both sandstones can also be measured by analyzing the separated LabelField from 3-D CT images using the Avizo Label Analysis module (Avizo User’s Guide, online report, 2013).The maximum label volumes for the silty sandstone and the coarse-grained sandstone are 8.82 × 105 μm3
and 2.03 × 107 μm3, respectively. Thus, the maximum equivalent diameter λmax-ct can be obtained by com-puting the diameter of spherical pore with the maximum label volume. It was found that the maximumequivalent diameters λmax-ct are ~119 μm (silty sandstone) and ~338 μm (coarse-grained sandstone). Forthe silty sandstone, the maximum equivalent pore diameter λmax-ct is close to the maximum capillary dia-meter λmax1. However, for the coarse-grained sandstone, λmax-ct is much larger than λmax1. This is mainlycaused by the poor connectivity of large pores in the coarse-grained sandstone [Benavente et al., 2015].
To evaluate the errors caused by the assumption of pores as sphere on the value of λmax-ct, the sphericities ofpores in both tested sandstones are analyzed. Normally, a perfect sphere has a sphericity of one and anyother shape less than one. For example, the sphericity of a cube is about 0.806 [Wadell, 1935]. To estimatethe sphericity of pores in both tested sandstones, the data of the segmented volumes presented inFigures 4f and 5f were analyzed using the Avizo Label Analysis module. The results for sphericity for the poresin both sandstones are presented in Figure 11. The sphericity of ~70% pores in the silty sandstone and ~58%pores in the coarse-grained sandstone is in the range 0.8 to 1.0—suggesting that the assumption of the pores
Table 6. Parameters used to Estimate the Maximum Capillary Diameter of Two Tested Sandstones and the Results ofλmax1, λmax2, and λmax-ct
Sample Df φ β λmax1 (μm) λmax2 (μm) λmax-ct (μm)
X1 2.4036 0.1507 10�3 132.8250 180.0778 119.0045C1 2.1903 0.0716 10�3 143.9318 138.1823 338.446
Journal of Geophysical Research: Solid Earth 10.1002/2016JB013786
ZHAO ET AL. MICROSTRUCTURE EFFECT ON IMBIBITION 4977
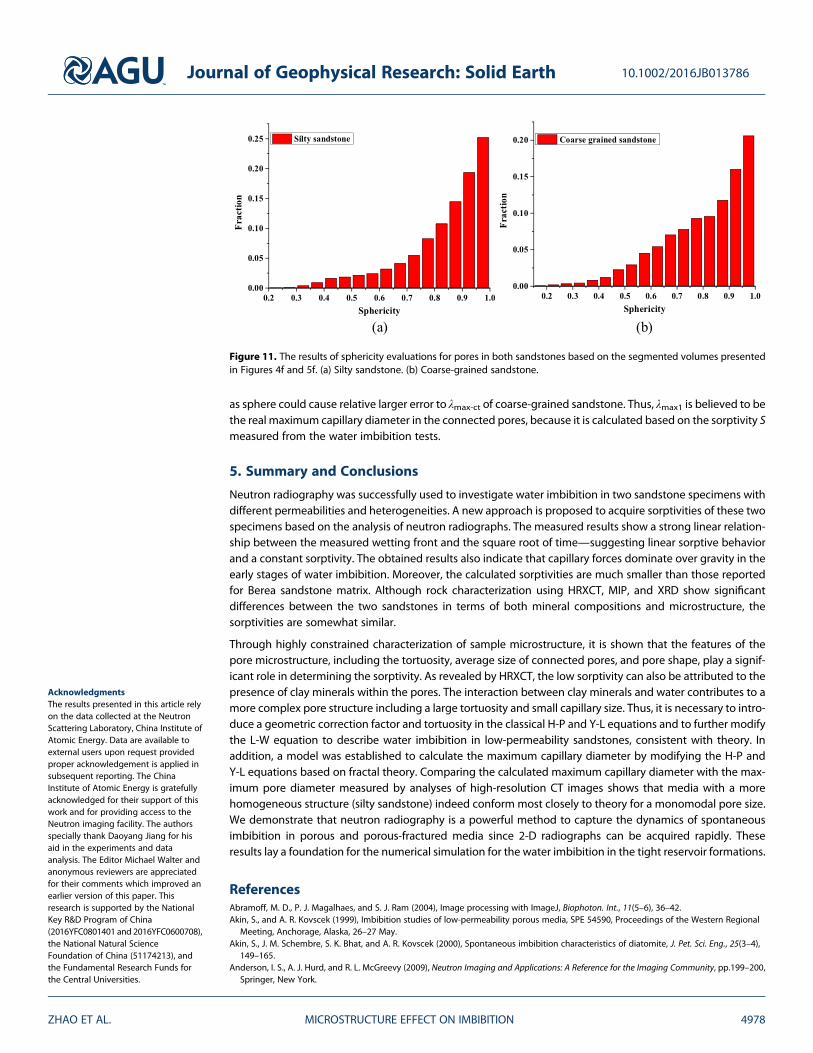
as sphere could cause relative larger error to λmax-ct of coarse-grained sandstone. Thus, λmax1 is believed to bethe real maximum capillary diameter in the connected pores, because it is calculated based on the sorptivity Smeasured from the water imbibition tests.
5. Summary and Conclusions
Neutron radiography was successfully used to investigate water imbibition in two sandstone specimens withdifferent permeabilities and heterogeneities. A new approach is proposed to acquire sorptivities of these twospecimens based on the analysis of neutron radiographs. The measured results show a strong linear relation-ship between the measured wetting front and the square root of time—suggesting linear sorptive behaviorand a constant sorptivity. The obtained results also indicate that capillary forces dominate over gravity in theearly stages of water imbibition. Moreover, the calculated sorptivities are much smaller than those reportedfor Berea sandstone matrix. Although rock characterization using HRXCT, MIP, and XRD show significantdifferences between the two sandstones in terms of both mineral compositions and microstructure, thesorptivities are somewhat similar.
Through highly constrained characterization of sample microstructure, it is shown that the features of thepore microstructure, including the tortuosity, average size of connected pores, and pore shape, play a signif-icant role in determining the sorptivity. As revealed by HRXCT, the low sorptivity can also be attributed to thepresence of clay minerals within the pores. The interaction between clay minerals and water contributes to amore complex pore structure including a large tortuosity and small capillary size. Thus, it is necessary to intro-duce a geometric correction factor and tortuosity in the classical H-P and Y-L equations and to further modifythe L-W equation to describe water imbibition in low-permeability sandstones, consistent with theory. Inaddition, a model was established to calculate the maximum capillary diameter by modifying the H-P andY-L equations based on fractal theory. Comparing the calculated maximum capillary diameter with the max-imum pore diameter measured by analyses of high-resolution CT images shows that media with a morehomogeneous structure (silty sandstone) indeed conform most closely to theory for a monomodal pore size.We demonstrate that neutron radiography is a powerful method to capture the dynamics of spontaneousimbibition in porous and porous-fractured media since 2-D radiographs can be acquired rapidly. Theseresults lay a foundation for the numerical simulation for the water imbibition in the tight reservoir formations.
ReferencesAbramoff, M. D., P. J. Magalhaes, and S. J. Ram (2004), Image processing with ImageJ, Biophoton. Int., 11(5–6), 36–42.Akin, S., and A. R. Kovscek (1999), Imbibition studies of low-permeability porous media, SPE 54590, Proceedings of the Western Regional
Meeting, Anchorage, Alaska, 26–27 May.Akin, S., J. M. Schembre, S. K. Bhat, and A. R. Kovscek (2000), Spontaneous imbibition characteristics of diatomite, J. Pet. Sci. Eng., 25(3–4),
149–165.Anderson, I. S., A. J. Hurd, and R. L. McGreevy (2009), Neutron Imaging and Applications: A Reference for the Imaging Community, pp.199–200,
Springer, New York.
Figure 11. The results of sphericity evaluations for pores in both sandstones based on the segmented volumes presentedin Figures 4f and 5f. (a) Silty sandstone. (b) Coarse-grained sandstone.
Journal of Geophysical Research: Solid Earth 10.1002/2016JB013786
ZHAO ET AL. MICROSTRUCTURE EFFECT ON IMBIBITION 4978
AcknowledgmentsThe results presented in this article relyon the data collected at the NeutronScattering Laboratory, China Institute ofAtomic Energy. Data are available toexternal users upon request providedproper acknowledgement is applied insubsequent reporting. The ChinaInstitute of Atomic Energy is gratefullyacknowledged for their support of thiswork and for providing access to theNeutron imaging facility. The authorsspecially thank Daoyang Jiang for hisaid in the experiments and dataanalysis. The Editor Michael Walter andanonymous reviewers are appreciatedfor their comments which improved anearlier version of this paper. Thisresearch is supported by the NationalKey R&D Program of China(2016YFC0801401 and 2016YFC0600708),the National Natural ScienceFoundation of China (51174213), andthe Fundamental Research Funds forthe Central Universities.

Bayer, A. (2005), X-ray Attenuation Techniques to Explore the Dynamics of Water in Porous Media, pp. 51–60, Ruperto Carola University ofHeidelberg, Heidelberg, Germany.
Beer, F. C. D., and M. F. Middleton (2006), Neutron radiography imaging, porosity and permeability in porous rocks, S. Afr. J. Geol., 109(4),541–550.
Benavente, D., P. Lock, M. Cura, and S. Ordóñez (2002), Predicting the capillary imbibition of porous rocks frommicrostructure, Transp. PorousMedia, 49(1), 59–76.
Benavente, D., C. Pla, N. Cueto, S. Galvañ, J. Martínez-Martínez, M. A. García-del-Cura, and S. Ordóñez (2015), Predicting water permeability insedimentary rocks from capillary imbibition and pore structure, Eng. Geol., 195, 301–311.
Birdsell, D. T., H. Rajaram, D. Dempsey, and H. S. Viswanathan (2015), Hydraulic fracturing fluid migration in the subsurface: A review andexpanded modeling results, Water Resour. Res., 51, 7159–7188. doi:10.1002/2015WR017810.
Boone, M. A., T. De Kock, T. Bultreys, G. De Schutter, P. Vontobel, L. Van Hoorebeke, and V. Cnudde (2014), 3D mapping of water in oolithiclimestone at atmospheric and vacuum saturation using X-ray micro-CT differential imaging, Mater. Charact., 97, 150–160.
Bruce, R. R., and A. Klute (1956), The measurement of soil moisture Diffusivity1, Soil Sci. Soc. Am. J., 20(4), 458–462.Cai, J., and B. Yu (2010), Prediction of maximum pore size of porous media based on fractal geometry, Fractals, 18(04), 417–423.Cai, J., B. Yu, M. Zou, and L. Luo (2010), Fractal characterization of spontaneous co-current imbibition in porous media, Energy Fuels, 24(3),
1860–1867.Cai, J., E. Perfect, C. L. Cheng, and X. Hu (2014), Generalized modeling of spontaneous imbibition based on Hagen-Poiseuille flow in tortuous
capillaries with variably shaped apertures, Langmuir, 30(18), 5142–5151.Carminati, A., A. Kaestner, P. Lehmann, and H. Flühler (2008), Unsaturated water flow across soil aggregate contacts, Adv. Water Resour., 31(9),
1221–1232.Carpenter, T. A., E. S. Davies, C. Hall, L. D. Hall, W. D. Hoff, and M. A. Wilson (1993), Capillary water migration in rock: Process and material
properties examined by NMR imaging, Mater. Struct., 26(5), 286–292.Chen, Q., M. K. Gingras, and B. J. Balcoma (2003), A magnetic resonance study of pore filling processes during spontaneous imbibition in
Berea sandstone, J. Chem. Phys. 119(18), 9609–9616.Cheng, C. L., E. Perfect, B. Donnelly, H. Z. Bilheux, A. S. Tremsin, L. D. McKay, V. H. DiStefano, J. C. Cai, and L. J. Santodonato (2015), Rapid
imbibition of water in fractures within unsaturated sedimentary rock, Adv. Water Resour., 77, 82–89.Czachor, A., E. El-Abd, and J. Milczarek (2002), Determination of capillary motion of water in bricks using neutron radiography, Acta Phys.
Polon., 102(2), 245–252.David, C., B. Menéndez, and J.-M. Mengus (2008), Influence of mechanical damage on fluid flow patterns investigated using CT scanning
imaging and acoustic emissions techniques, Geophys. Res. Lett., 35, L16313, doi:10.1029/2008GL034879.David, C., B. Menéndez, and J. M. Mengus (2011), X-ray imaging of water motion during capillary imbibition: Geometry and kinetics of water
front in intact and damaged porous rocks, J. Geophys. Res., 116, B03204, doi:10.1029/2010JB007972.Deinert, M. R., J. Y. Parlange, T. Steenhuis, J. Throop, K. Ünlü, and K. B. Cady (2004), Measurement of fluid contents and wetting front profiles
by real-time neutron radiography, J. Hydrol., 290(3–4), 192–201.Dewanckele, J., T. De Kock, G. Fronteau, H. Derluyn, P. Vontobel, M. Dierick, L. Van Hoorebeke, P. Jacobs, and V. Cnudde (2014), Neutron
radiography and X-ray computed tomography for quantifying weathering and water uptake processes inside porous limestone used asbuilding material, Mater. Charact., 88, 86–99.
Doster, F., J. M. Nordbotten, and M. A. Celia (2013), Impact of capillary hysteresis and trapping on vertically integrated models for CO2
storage, Adv. Water Resour., 62(2), 465–474.Doyen, P. M. (1988), Permeability, conductivity, and pore geometry of sandstone, J. Geophys. Res., 93(93), 7729–7740.Dullien, F. A. L., M. S. El-Sayed, and V. K. Batra (1977), Rate of capillary rise in porous media with nonuniform pores, J. Colloid Interface Sci.,
60(3), 497–506.El Abd, A., A. Czachor, and J. Milczarek (2009), Neutron radiography determination of water diffusivity in fired clay brick, Appl. Radiat. Isot.,67(4), 556–559.
Faybishenko, B., P. A. Witherspoon, and J. Gale (2005), Dynamics of Fluids and Transport in Fractured Rock, pp. 1–11, AGU, Washington, D. C.Feng, Y., B. Yu, M. Zou, and D. Zhang (2004), A generalized model for the effective thermal conductivity of porous media based on
self-similarity, J. Phys. D: Appl. Phys., 37(21), 3030–3040.Ferguson, H., and W. H. Gardner (1963), Diffusion theory applied to water flow data obtained using gamma ray Absorption1, Soil Sci. Soc. Am.
J., 27(3), 243–246.Gruener, S., Z. Sadjadi, H. E. Hermes, A. V. Kityk, K. Knorr, S. U. Egelhaaf, H. Rieger, and P. Huber (2012), Anomalous front broadening during
spontaneous imbibition in a matrix with elongated pores, Proc. Natl. Acad. Sci. U.S.A., 109(26), 10245–10250.Haber-Pohlmeier, S., S. Stapf, D. Van Dusschoten, and A. Pohlmeier (2010), Relaxation in a natural soil: Comparison of relaxometric imaging,
T1–T2 correlation and fast-field cycling NMR, Open Magn. Reson. J., 3(1), 57–62.Hall, C., and W. D. Hoff (2012), Water Transport in Brick, Stone and Concrete, 2nd ed., pp. 30–61, Spon Press, London.Hall, S. A. (2013), Characterization of fluid flow in a shear band in porous rock using neutron radiography, Geophys. Res. Lett., 40, 2613–2618
doi:10.1002/grl.50528.Hall, S. A., D. Hughes, and S. Rowe (2010), Local characterisation of fluid flow in sandstone with localised deformation features through fast
neutron imaging, EPJ Web of Conferences, 6, 22008.Hammecker, C., and D. Jeannette (1994), Modelling the capillary imbibition kinetics in sedimentary rocks role of petrographical features,
Transp. Porous Media, 17(3), 19.Hammecker, C., L. Barbiero, P. Boivin, J. L. Maeght, and E. H. B. Diaw (2004), A geometrical pore model for estimating the Microscopical pore
geometry of soil with infiltration measurements, Transp. Porous Media, 54(2), 193–219.Han, S., M. Wu, H. Wang, L. Hao, G. Wei, L. He, Y. Wang, Y. Liu, and D. Chen (2013), Design of Cold Neutron Imaging Facility at China Advanced
Research Reactor, Physics Procedia, 43, 73–78.Hassanein, R., H. O. Meyer, A. Carminati, M. Estermann, E. Lehmann, and P. Vontobel (2006), Investigation of water imbibition in porous stone
by thermal neutron radiography, J. Phys. D: Appl. Phys., 39(19), 4284–4291.Herring, A. L., E. J. Harper, L. Andersson, A. Sheppard, B. K. Bay, and D. Wildenschild (2013), Effect of fluid topology on residual nonwetting
phase trapping: Implications for geologic CO2 sequestration, Adv. Water Resour., 62(4), 47–58.Hunt, J. R., and A. F. Tompson (2005), Tracing long-term vadose zone processes at the Nevada Test Site, USA, Hydrol. Process., 19(17),
3383–3394.Jasti, J. K., J. T. Lindsay, and H. S. Fogler. (1987), Flow imaging in porous media using neutron radiography, in SPE Annual Technical Conference
and Exhibition, edited, Society of Petroleum Engineers.
Journal of Geophysical Research: Solid Earth 10.1002/2016JB013786
ZHAO ET AL. MICROSTRUCTURE EFFECT ON IMBIBITION 4979

Jelinkova, V., M. Snehota, A. Pohlmeier, D. van Dusschoten, and M. Cislerova (2011), Effects of entrapped residual air bubbles on tracertransport in heterogeneous soil: Magnetic resonance imaging study, Org. Geochem. 42, 991–998.
Joekar-Niasar, V., M. Prodanović, D. Wildenschild, and S. M. Hassanizadeh (2010), Network model investigation of interfacial area, capillarypressure and saturation relationships in granular porous media, Water Resour. Res., 46, W06526, doi:10.1029/2009WR008585.
Kang, M., E. Perfect, C. L. Cheng, H. Z. Bilheux, M. Gragg, D. M. Wright, J. M. Lamanna, J. Horita, and J. M. Warren (2013), Diffusivity andSorptivity of Berea sandstone determined using neutron radiography, Vadose Zone J., 12(3), 1712–1717.
Kang, M., E. Perfect, C. L. Cheng, H. Z. Bilheux, J. Lee, J. Horita, and J. M. Warren (2014), Multiple pixel-scale soil water retention curvesquantified by neutron radiography, Adv. Water Resour., 65, 1–8.
Kao, C. S., and J. R. Hunt (1996), Prediction of wetting front movement during one-dimensional infiltration into soils,Water Resour. Res., 32(1),55–64.
Karoglou, M., A. Moropoulou, A. Giakoumaki, and M. K. Krokida (2005), Capillary rise kinetics of some building materials, J. Colloid InterfaceSci., 284(1), 260–264.
Karpyn, Z. T., P. M. Halleck, and A. S. Grader (2009), An experimental study of spontaneous imbibition in fractured sandstone with contrastingsedimentary layers, J. Pet. Sci. Eng., 67(1–2), 48–56.
Katz, A. J., and A. H. Thompson (1985), Fractal sandstone pores: Implications for conductivity and pore formation, Phys. Rev. Lett., 54(12),1325–1328.
Kim, F. H., D. Penumadu, and D. S. Hussey (2012), Water distribution variation in partially saturated granular materials using neutron imaging,J. Geotech. Geoenviron., 138(2), 147–154.
Kim, F. H., D. Penumadu, J. Gregor, N. Kardjilov, and I. Manke (2013), High-resolution neutron and X-ray imaging of granular materials,J. Geotech. Geoenviron., 139(5), 715–723.
Korvin, G. (2016), Permeability from microscopy: Review of a dream, Arab. J. Sci. Eng., 41(6), 2045–2065.Krohn, C. E. (1988), Fractal measurements of sandstones, shales, and carbonates, J. Geophys. Res., 93(B4), 3297–3305.Leech, C., D. Lockington, and P. Dux (2003), Unsaturated diffusivity functions for concrete derived from NMR images, Mater. Struct., 36(6),
413–418.Leventis, A., D. A. Verganelakis, M. R. Halse, and J. B. Webber (2000), Capillary imbibition and pore characterisation in cement pastes, Transp.
Porous Media, 39(2), 143–157.Lewandowski, R., L. Cao, and D. Turkoglu (2012), Noise evaluation of a digital neutron imaging device, Nucl. Instrum. Methods Phys. Res., Sect.
A, 674, 46–50.Li, K., and R. N. Horne (2001), Characterization of spontaneous water imbibition into gas-saturated rocks, SPE J., 6(4), 375–384.Li, K., and H. Zhao (2011), Fractal prediction model of spontaneous imbibition rate, Transp. Porous Media, 91(2), 363–376.Li, K., and R. N. Horne (2013), An analytical scaling method for spontaneous imbibition in gas/water/rock systems, SPE J., 9(03), 322–329.Lucas, R. (1918), Rate of capillary ascension of liquids, Kolloid Z., 23(15), 15–22.Nabawy, B. S., and C. David (2016), X-ray CT scanning imaging for the Nubia sandstone as a tool for characterizing its capillary properties,
Geosci. J., 20(5), 691–704.Nielsen, A. F. (1972), Gamma-ray-attenuation used for measuring the moisture content and homogeneity of porous concrete, Build. Sci., 7(4),
257–263.Nizovtsev, M. I., S. V. Stankus, A. N. Sterlyagov, V. I. Terekhov, and R. A. Khairulin (2008), Determination of moisture diffusivity in porous
materials using gamma-method, Int. J. Heat Mass Transfer, 51(17–18), 4161–4167.Otsu, N. (1979), A threshold selection method from gray-level histograms, IEEE Trans. Syst. Man Cybern., 9(1), 62–66.Pease, B. J., G. A. Scheffler, and H. Janssen (2012), Monitoringmoisture movements in building materials using X-ray attenuation: Influence of
beam-hardening of polychromatic X-ray photon beams, Constr. Build. Mater., 36(3), 419–429.Perfect, E., C. L. Cheng, M. Kang, H. Z. Bilheux, J. M. Lamanna, M. J. Gragg, and D. M. Wright (2014), Neutron imaging of hydrogen-rich fluids in
geomaterials and engineered porous media: A review, Earth Sci. Rev., 129, 120–135.Philip, R. J. (1957), The theory of infiltration: 4. Sorptivity and algebraic infiltration equations, Soil Sci., 84(3), 257–264.Pickard, W. F. (1981), The ascent of sap in plants, Prog. Biophys. Mol. Biol., 37(37), 181–229.Pohlmeier, A., A. Orospeusquens, M. Javaux, M. I. Menzel, J. Vanderborght, J. Kaffanke, S. Romanzetti, J. Lindenmair, H. Vereecken, and
N. J. Shah (2008a), Changes in soil water content resulting from root uptake monitored by magnetic resonance imaging, Vadose Zone J.,7(3), 1010–1017.
Pons, A., C. David, J. Fortin, S. Stanchits, B. Menéndez, and J. M. Mengus (2011), X-ray imaging of water motion during capillary imbibitions: Astudy on how compaction bands impact fluid flow in Bentheim sandstone, J. Geophys. Res., 116, B03205, doi:10.1029/2010JB007973.
Rasband, W. S. (1997-2016), ImageJ, U.S. National Institutes of Health, Bethesda, Md. [Available at https://imagej.nih.gov/ij/.]Richards, L. A. (1931), Capillary conduction of liquids through porous mediums, J. Appl. Phys., 1(5), 318–333.Roels, S., and J. Carmeliet (2006), Analysis of moisture flow in porous materials using microfocus X-ray radiography, Int. J. Heat Mass Transfer,
49(25–26), 4762–4772.Roels, S., J. Carmeliet, H. Hens, O. C. G. Adan, H. J. P. Brocken, R. Cerny, Z. Pavlik, A. T. Ellis, C. Hall, and K. Kumaran (2004), A comparison of
different techniques to quantify moisture content profiles in porous building materials, J. Therm. Envel. Build. Sci., 27(4), 261–276.Sahimi, M. (2011), Flow and Transport in Porous Media and Fractured Rock: From Classical Methods to Modern Approaches, 2nd ed., pp. 1–7,143,
Wiley-VCH, Weinheim, Germany.Schillaci, T., M. Brai, A. Cimino, and A. L. Casto (2008), Study of capillary absorption kinetics by X-ray CT imaging techniques: A survey on
sedimentary rocks of Sicily, Conserv. Sci. Cult. Heri. Historical Tech. J., 8(1), 91–110.Schneider, C. A., W. S. Rasband, and K. W. Eliceiri (2012), NIH image to ImageJ: 25 years of image analysis, Nat. Methods, 9(7), 671–675.Sekkat, Z., H. Ishitobi, M. Tanabe, T. Hiramatsu, and S. Kawata (2011), On the application of focused ion beam nanotomography in
characterizing the 3D pore space geometry of Opalinus clay, Phys. Chem. Earth, 36(17), 1539–1544.Singh, H. (2016), A critical review of water uptake by shales, J. Nat. Gas Sci. Eng., 34, 751–766.Tidwell, V. C., L. C. Meigs, T. Christian-Frear, and C. M. Boney (2000), Effects of spatially heterogeneous porosity on matrix diffusion as
investigated by X-ray absorption imaging, J. Contam. Hydrol., 42(2–4), 285–302.Tompson, A. F. B., G. B. Hudson, D. K. Smith, and J. R. Hunt (2006), Analysis of radionuclide migration through a 200-m vadose zone following
a 16-year infiltration event, Adv. Water Resour., 29(2), 281–292.Tullis, B. P., J. T. Lindsay, and S. J. Wright (1994), The imaging of wetting front instabilities in porous media using neutron radioscopy,
Nondestruct. Test. Eval., 11(2–3), 97–106.Vasin, M., P. Lehmann, A. Kaestner, R. Hassanein, W. Nowak, R. Helmig, and I. Neuweiler (2008), Drainage in heterogeneous sand columns
with different geometric structures, Adv. Water Resour., 31(9), 1205–1220.
Journal of Geophysical Research: Solid Earth 10.1002/2016JB013786
ZHAO ET AL. MICROSTRUCTURE EFFECT ON IMBIBITION 4980

Wadell, H. (1935), Volume, shape, and roundness of quartz particles, J. Geol., 43, (3), 250–280.Washburn, E. W. (1921), The dynamics of capillary flow, Phys. Rev., 17(3), 273–283.Wong, P. Z., J. Koplik, and J. P. Tomanic (1984), Conductivity and permeability of rocks, Phys. Rev. B: Condens. Matter, 30(11), 6606–6614.Xie, J., Z. Ke-ni, W. Yong-sheng, Q. Li-qing, and G. Chao-Bin (2016), Performance assessment of CO2 geological storage in deep saline aquifers
in Ordos Basin, China, Rock and Soil Mechanics(1), 166–174+184.Yu, B., P. Xu, M. Zhou, J. Cai, and Q. Zheng (2014), Fractal Porous Media Transport, pp. 247–268, Science Press, Beijing.Zhang, L., Q. J. Kang, J. Yao, Y. Gao, Z. X. Sun, H. H. Liu, and A. J. Valocchi (2015), Pore scale simulation of liquid and gas two-phase flow based
on digital core technology, SCIENCE CHINA Technol. Sci., 58(8), 1375–1384.Zhang, P., F. H. Wittmann, T. Zhao, and E. H. Lehmann (2010), Neutron imaging of water penetration into cracked steel reinforced concrete,
Phys. B, 405(7), 1866–1871.
Journal of Geophysical Research: Solid Earth 10.1002/2016JB013786
ZHAO ET AL. MICROSTRUCTURE EFFECT ON IMBIBITION 4981