Embed Size (px)
Citation preview
1
EHP grooved Heat Pipe 0-G Heat Experiment
and 1-G test simulation
EHP
Paris SFT « Contrôle thermique des composants
électroniques par voie diphasique »Stephane Van Oost Paris 1th December 2005
2
Table of content :
0G Test of AG110 Heat Pipe “HEAT experiment”Objectives description
0G - 1G Static – 1G Rotating AG110 Heat Pipe test results Maximum Heat transport capabilityEvaporation and condensation heat transfer
1G Static – 1G Rotating AG200 Heat Pipe test results Maximum Heat transport capabilityEvaporation and condensation heat transfer
0G – 1G Rotating AG110 Thermal simulationTemperature map around the profileFluid distribution based on temperature map
Conclusions
3
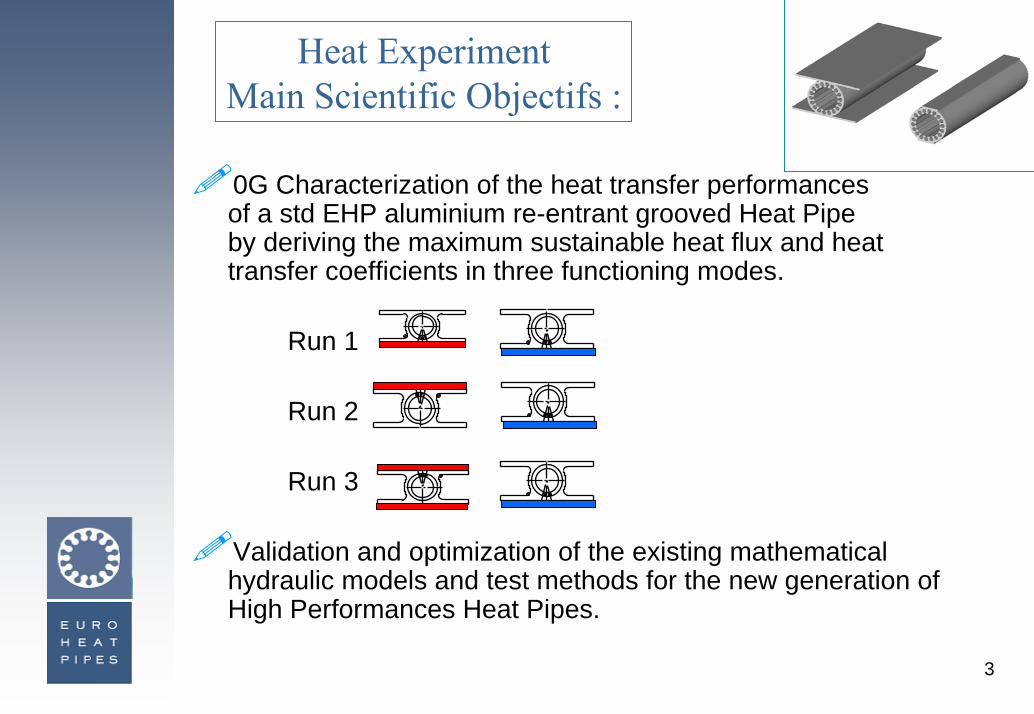
0G Characterization of the heat transfer performances of a std EHP aluminium re-entrant grooved Heat Pipe by deriving the maximum sustainable heat flux and heat transfer coefficients in three functioning modes.
Run 1
Run 2
Run 3
Validation and optimization of the existing mathematical hydraulic models and test methods for the new generation of High Performances Heat Pipes.
Heat ExperimentMain Scientific Objectifs :
4
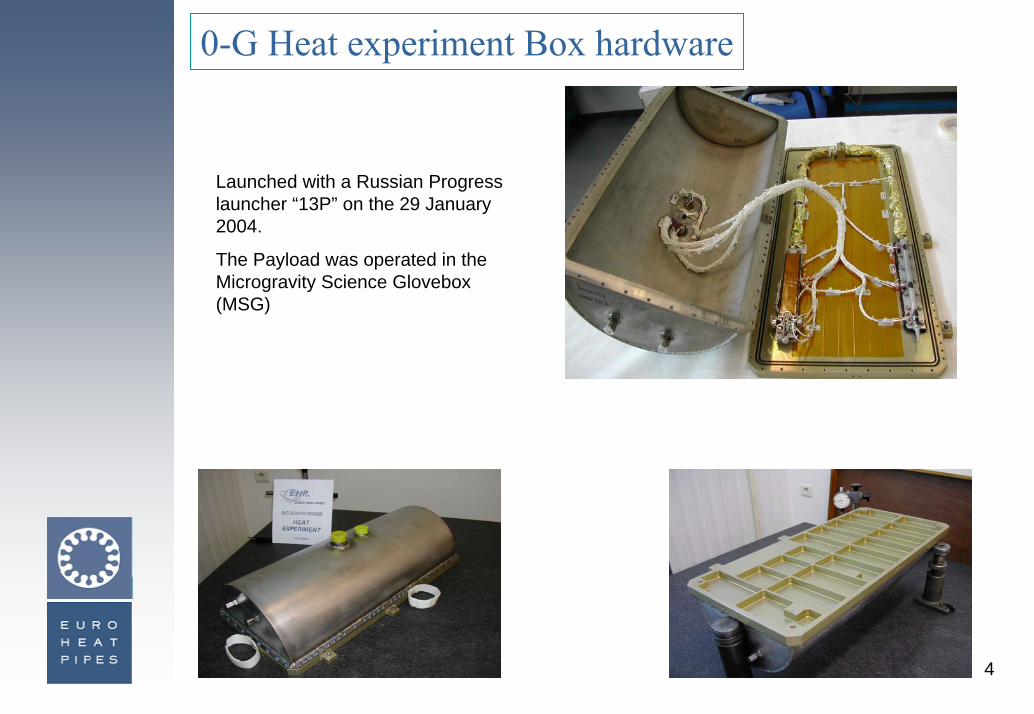
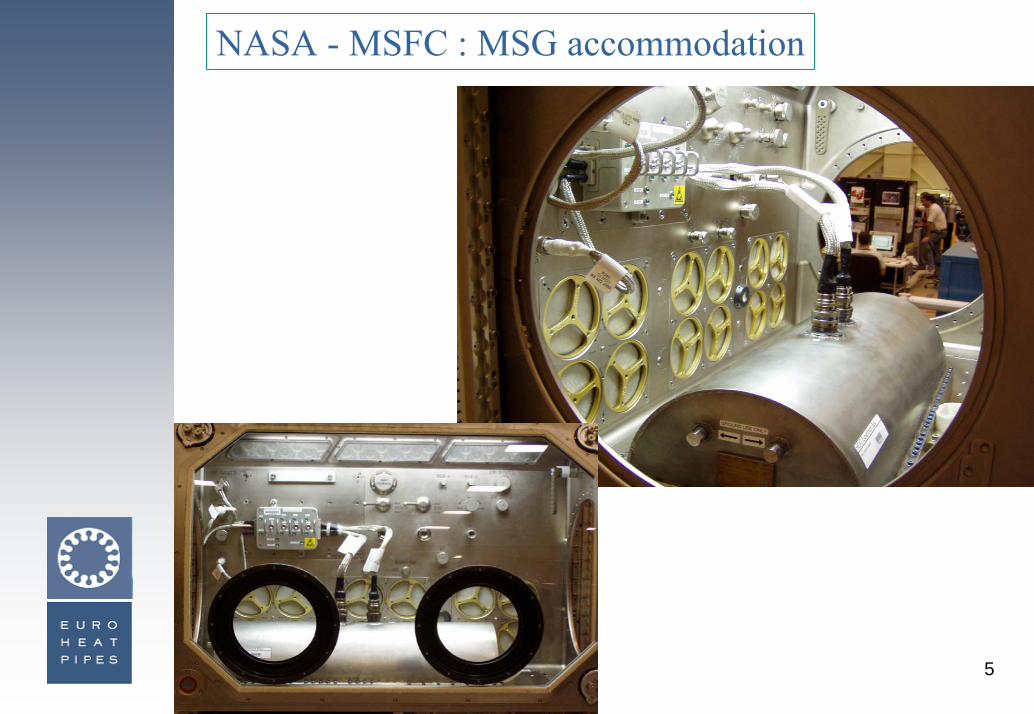
0-G Heat experiment Box hardware
Launched with a Russian Progress launcher “13P” on the 29 January 2004.
The Payload was operated in the Microgravity Science Glovebox(MSG)
5
NASA - MSFC : MSG accommodation
6
AG110 small heat pipe diameter 11 mm
- Maximum Heat Transport capability
- Heat transfer performances at evaporation and condensation interfaces
7
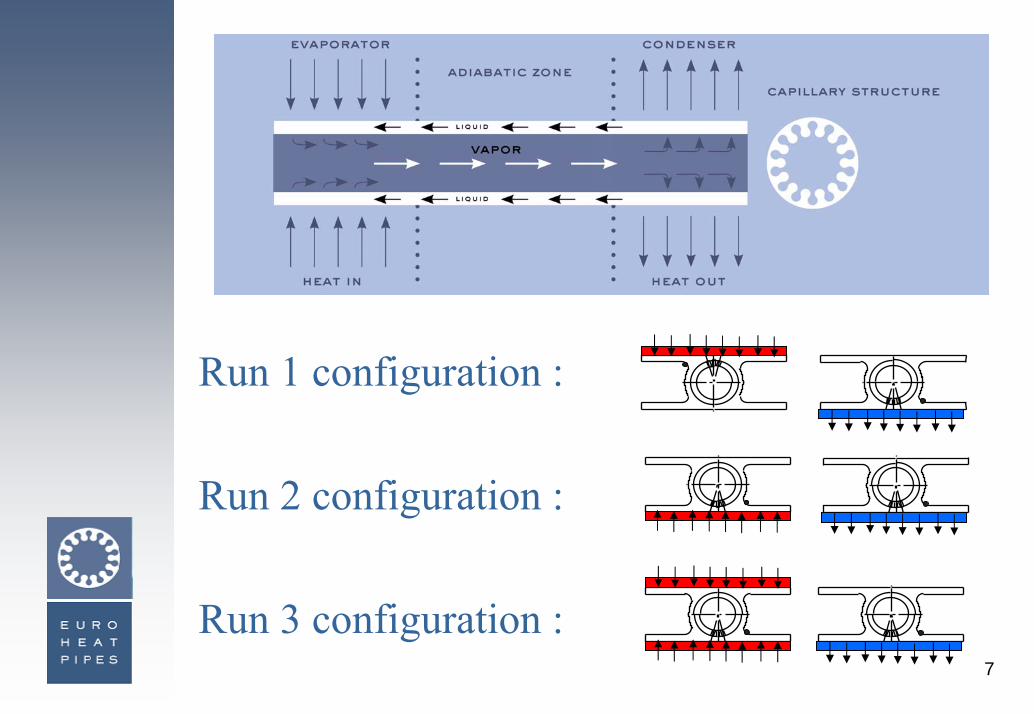
Run 1 configuration :
Run 2 configuration :
Run 3 configuration :
8
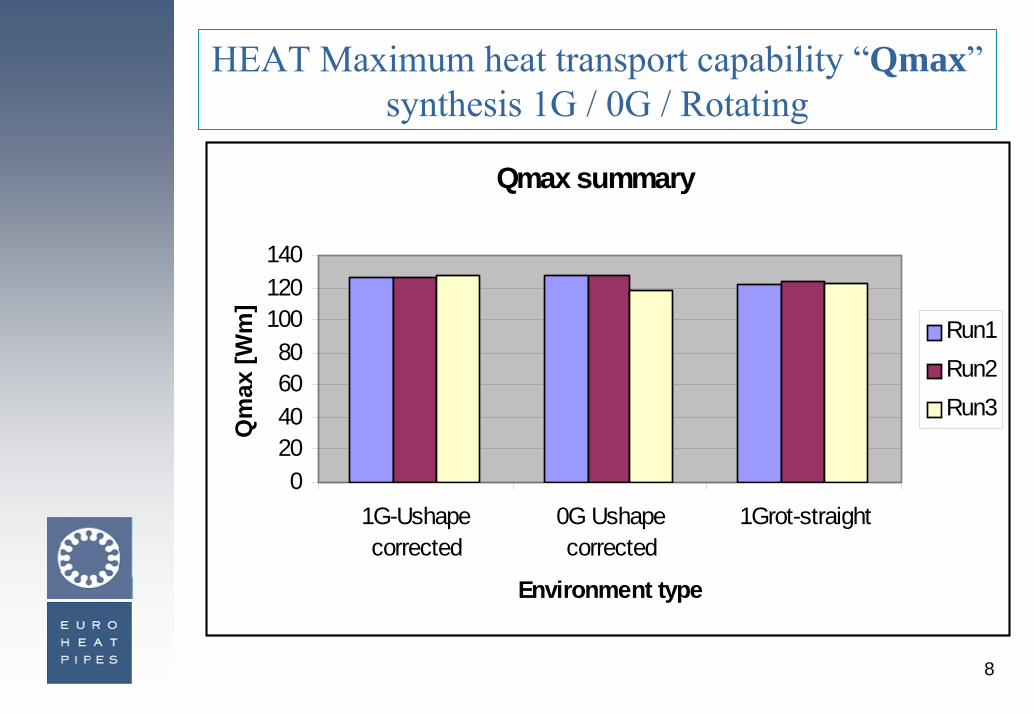
HEAT Maximum heat transport capability “Qmax” synthesis 1G / 0G / Rotating
Qmax summary
020406080
100120140
1G-Ushapecorrected
0G Ushapecorrected
1Grot-straight
Environment type
Qm
ax [W
m]
Run1Run2Run3
9
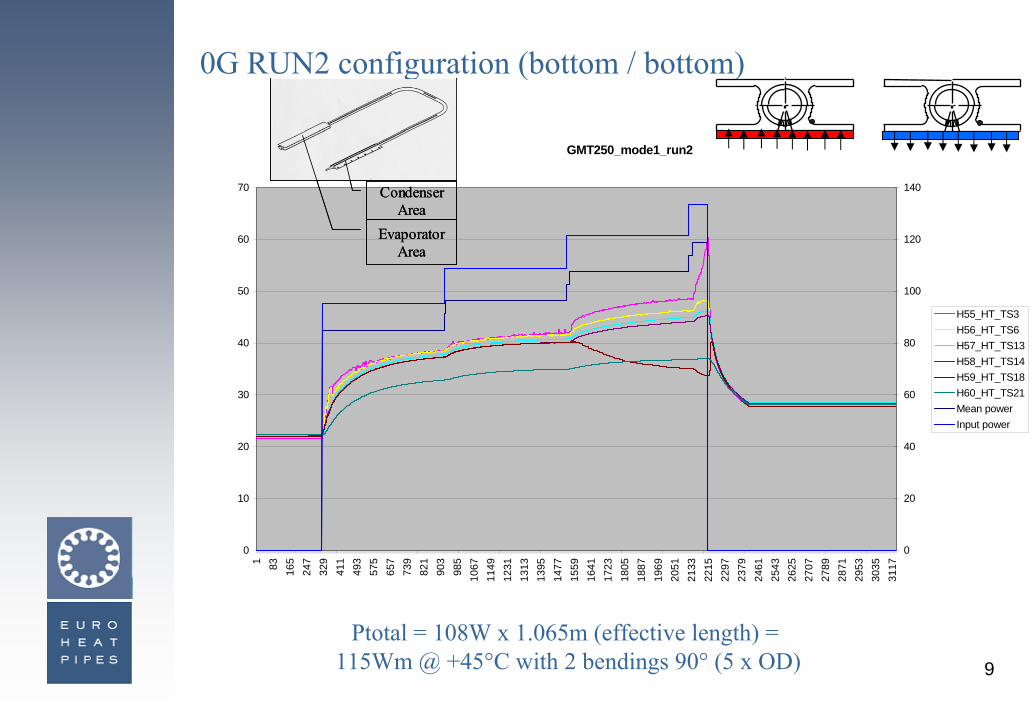
0G RUN2 configuration (bottom / bottom)
GMT250_mode1_run2
0
10
20
30
40
50
60
70
1 83 165
247
329
411
493
575
657
739
821
903
985
1067
1149
1231
1313
1395
1477
1559
1641
1723
1805
1887
1969
2051
2133
2215
2297
2379
2461
2543
2625
2707
2789
2871
2953
3035
3117
0
20
40
60
80
100
120
140
H55_HT_TS3H56_HT_TS6H57_HT_TS13H58_HT_TS14H59_HT_TS18H60_HT_TS21Mean powerInput power
Evaporator Area
Condenser Area
Evaporator Area
Condenser Area
Ptotal = 108W x 1.065m (effective length) = 115Wm @ +45°C with 2 bendings 90° (5 x OD)
10
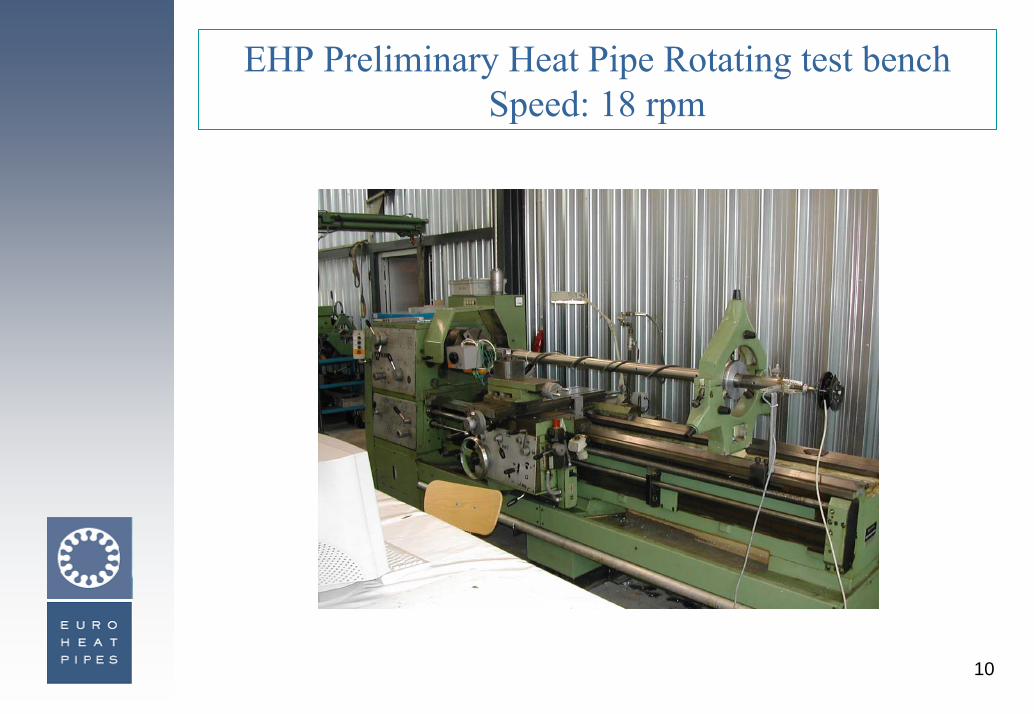
EHP Preliminary Heat Pipe Rotating test benchSpeed: 18 rpm
11
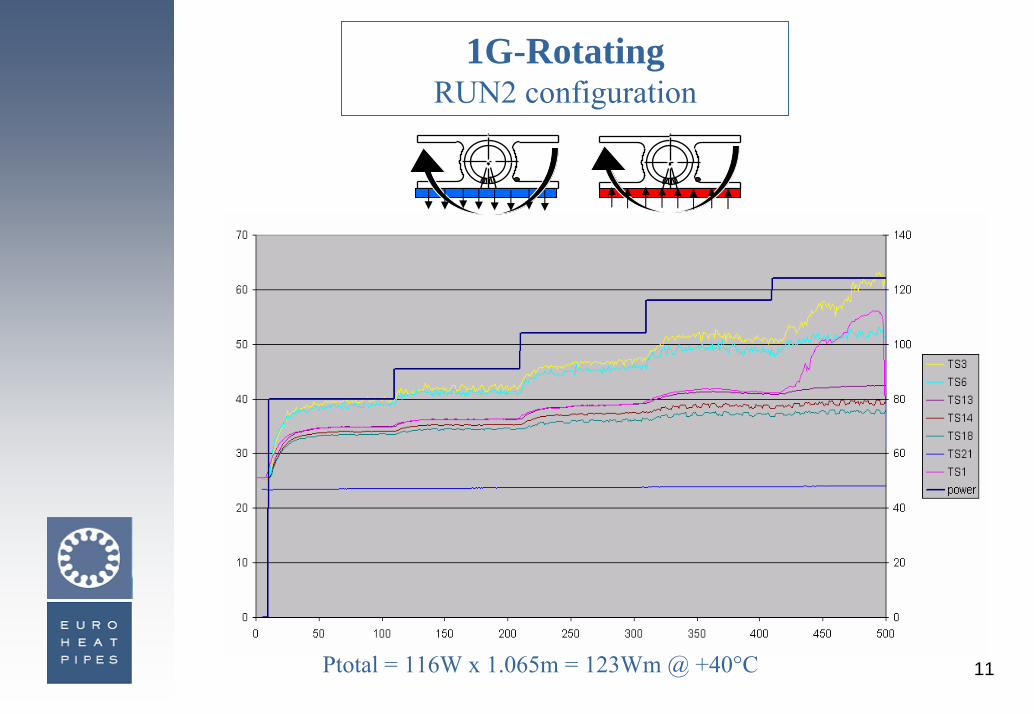
1G-RotatingRUN2 configuration
Ptotal = 116W x 1.065m = 123Wm @ +40°C
12
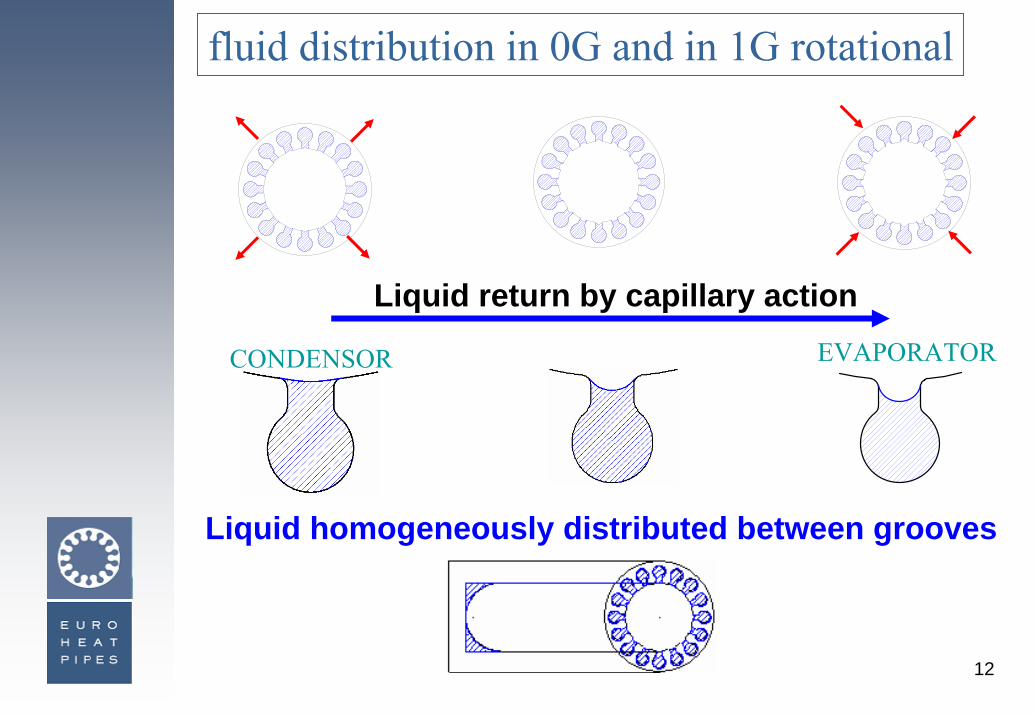
fluid distribution in 0G and in 1G rotational
Liquid return by capillary actionEVAPORATORCONDENSOR
Liquid homogeneously distributed between grooves
13
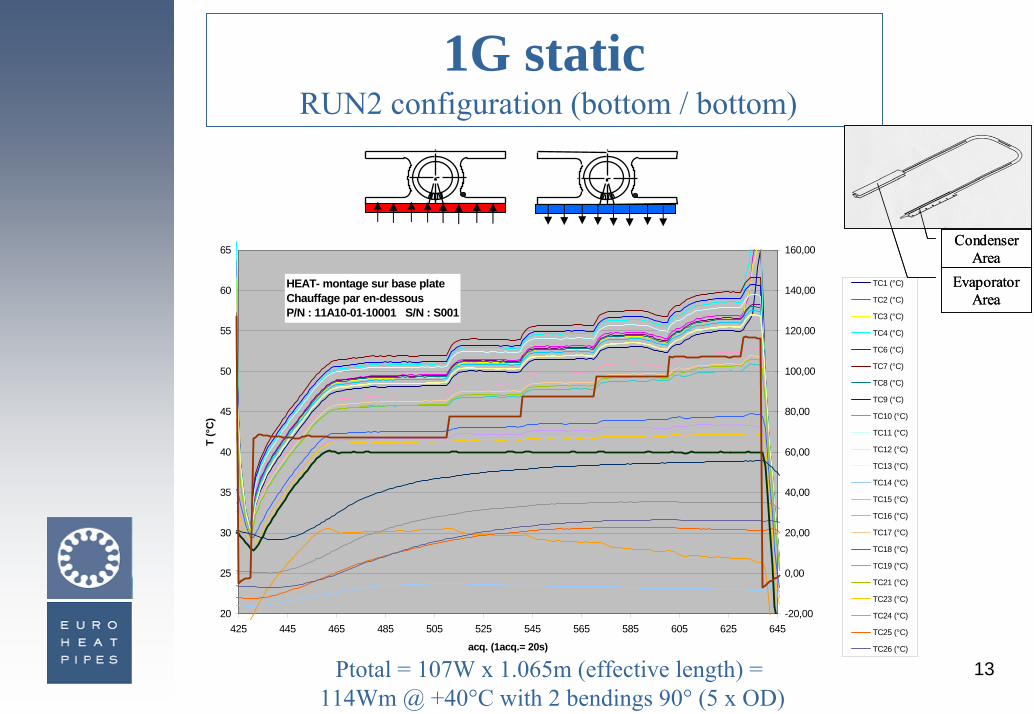
1G staticRUN2 configuration (bottom / bottom)
HEAT- montage sur base plate Chauffage par en-dessous P/N : 11A10-01-10001 S/N : S001
20
25
30
35
40
45
50
55
60
65
425 445 465 485 505 525 545 565 585 605 625 645
acq. (1acq.= 20s)
T (°
C)
-20,00
0,00
20,00
40,00
60,00
80,00
100,00
120,00
140,00
160,00
TC1 (°C)
TC2 (°C)
TC3 (°C)
TC4 (°C)
TC6 (°C)
TC7 (°C)
TC8 (°C)
TC9 (°C)
TC10 (°C)
TC11 (°C)
TC12 (°C)
TC13 (°C)
TC14 (°C)
TC15 (°C)
TC16 (°C)
TC17 (°C)
TC18 (°C)
TC19 (°C)
TC21 (°C)
TC23 (°C)
TC24 (°C)
TC25 (°C)
TC26 (°C)
Ptotal = 107W x 1.065m (effective length) = 114Wm @ +40°C with 2 bendings 90° (5 x OD)
Evaporator Area
Condenser Area
Evaporator Area
Condenser Area
14
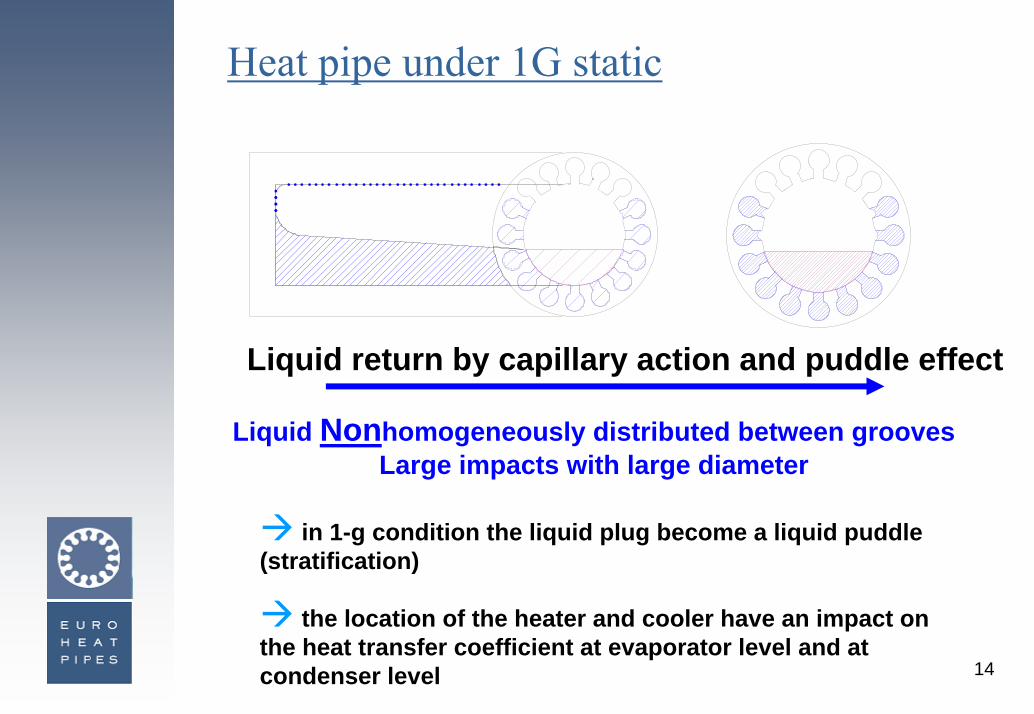
Heat pipe under 1G static
Liquid return by capillary action and puddle effect
Liquid Nonhomogeneously distributed between grooves Large impacts with large diameter
in 1-g condition the liquid plug become a liquid puddle (stratification)
the location of the heater and cooler have an impact on the heat transfer coefficient at evaporator level and at condenser level
15
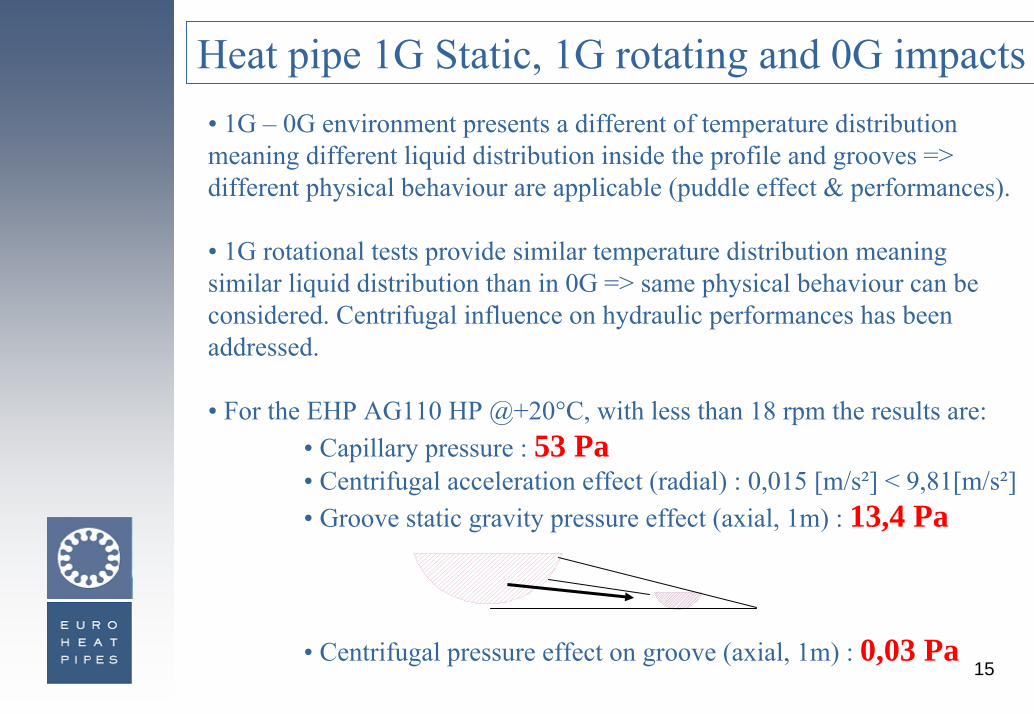
Heat pipe 1G Static, 1G rotating and 0G impacts• 1G – 0G environment presents a different of temperature distributionmeaning different liquid distribution inside the profile and grooves => different physical behaviour are applicable (puddle effect & performances).
• 1G rotational tests provide similar temperature distribution meaning similar liquid distribution than in 0G => same physical behaviour can be considered. Centrifugal influence on hydraulic performances has been addressed.
• For the EHP AG110 HP @+20°C, with less than 18 rpm the results are:• Capillary pressure : 53 Pa• Centrifugal acceleration effect (radial) : 0,015 [m/s²] < 9,81[m/s²]• Groove static gravity pressure effect (axial, 1m) : 13,4 Pa
• Centrifugal pressure effect on groove (axial, 1m) : 0,03 Pa
16
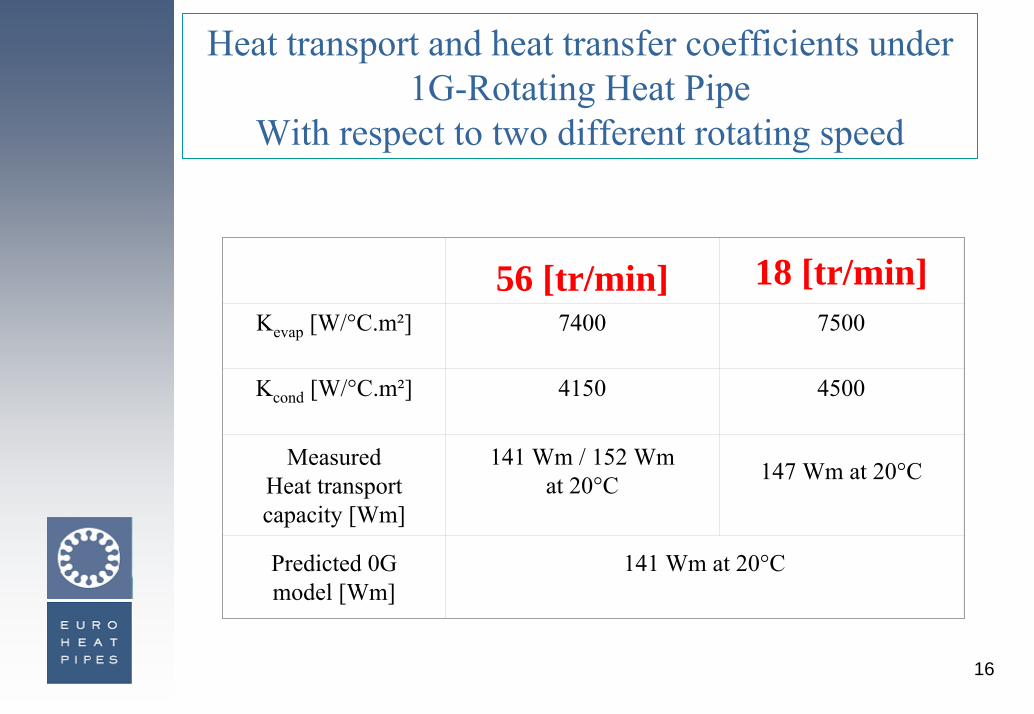
Heat transport and heat transfer coefficients under 1G-Rotating Heat Pipe
With respect to two different rotating speed
56 [tr/min] 18 [tr/min]Kevap [W/°C.m²] 7400 7500
Kcond [W/°C.m²] 4150 4500
MeasuredHeat transport capacity [Wm]
141 Wm / 152 Wm at 20°C 147 Wm at 20°C
Predicted 0G model [Wm]
141 Wm at 20°C
17
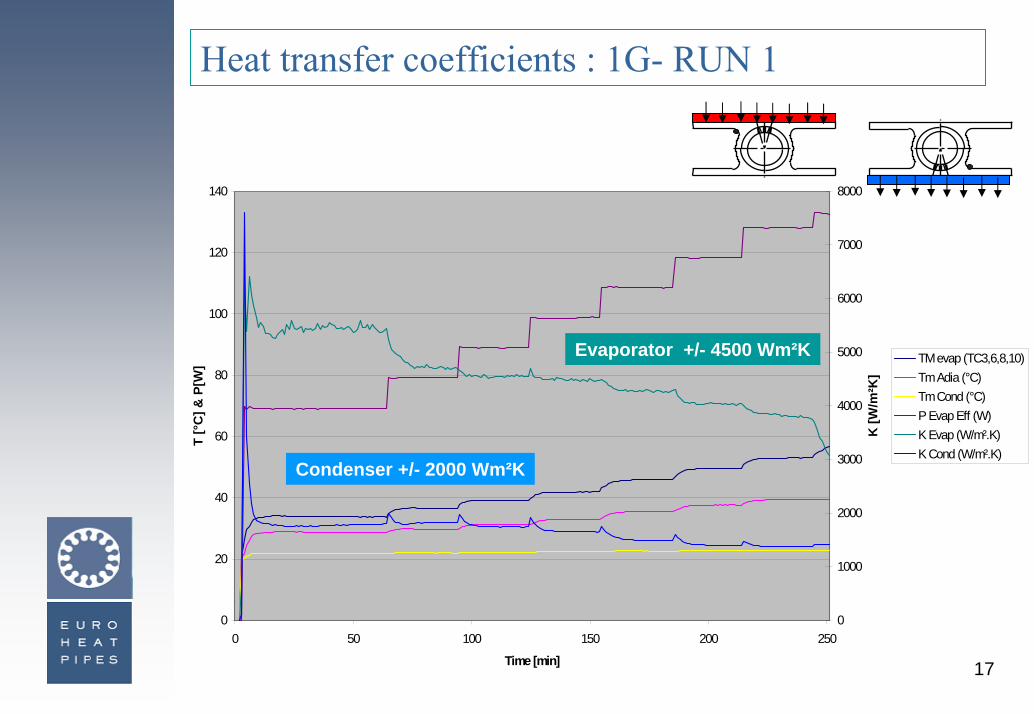
Heat transfer coefficients : 1G- RUN 1
0
20
40
60
80
100
120
140
0 50 100 150 200 250
Time [min]
T [°
C] &
P[W
]
0
1000
2000
3000
4000
5000
6000
7000
8000
K [W
/m²K
]
TM evap (TC3,6,8,10)Tm Adia (°C)Tm Cond (°C)P Evap Eff (W)K Evap (W/m².K)K Cond (W/m².K)
Condenser +/- 2000 Wm²K
Evaporator +/- 4500 Wm²K
18
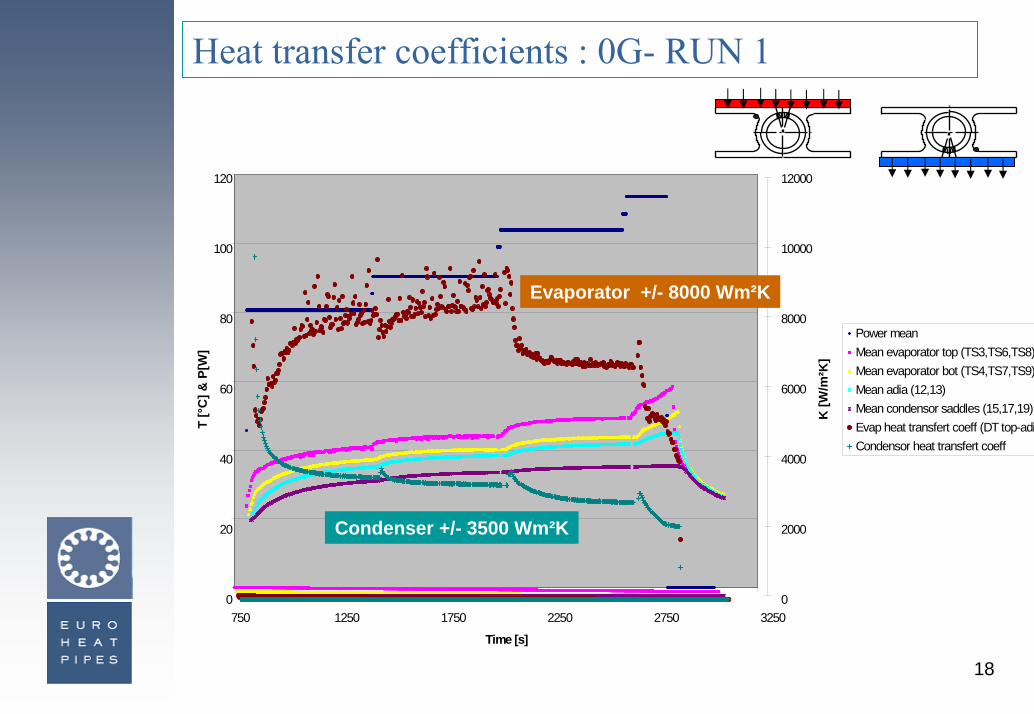
Heat transfer coefficients : 0G- RUN 1
0
20
40
60
80
100
120
750 1250 1750 2250 2750 3250
Time [s]
T [°
C] &
P[W
]
0
2000
4000
6000
8000
10000
12000
K [W
/m²K
]
Power meanMean evaporator top (TS3,TS6,TS8)Mean evaporator bot (TS4,TS7,TS9)Mean adia (12,13)Mean condensor saddles (15,17,19)Evap heat transfert coeff (DT top-adia)Condensor heat transfert coeff
Condenser +/- 3500 Wm²K
Evaporator +/- 8000 Wm²K
19
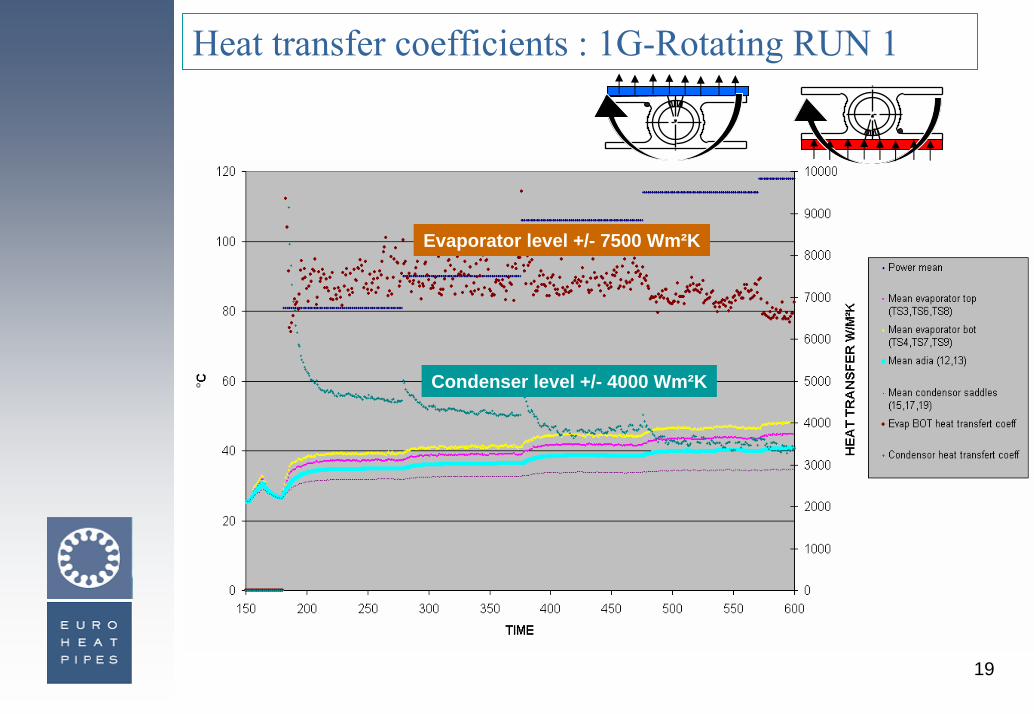
Heat transfer coefficients : 1G-Rotating RUN 1
Condenser level +/- 4000 Wm²K
Evaporator level +/- 7500 Wm²K
20
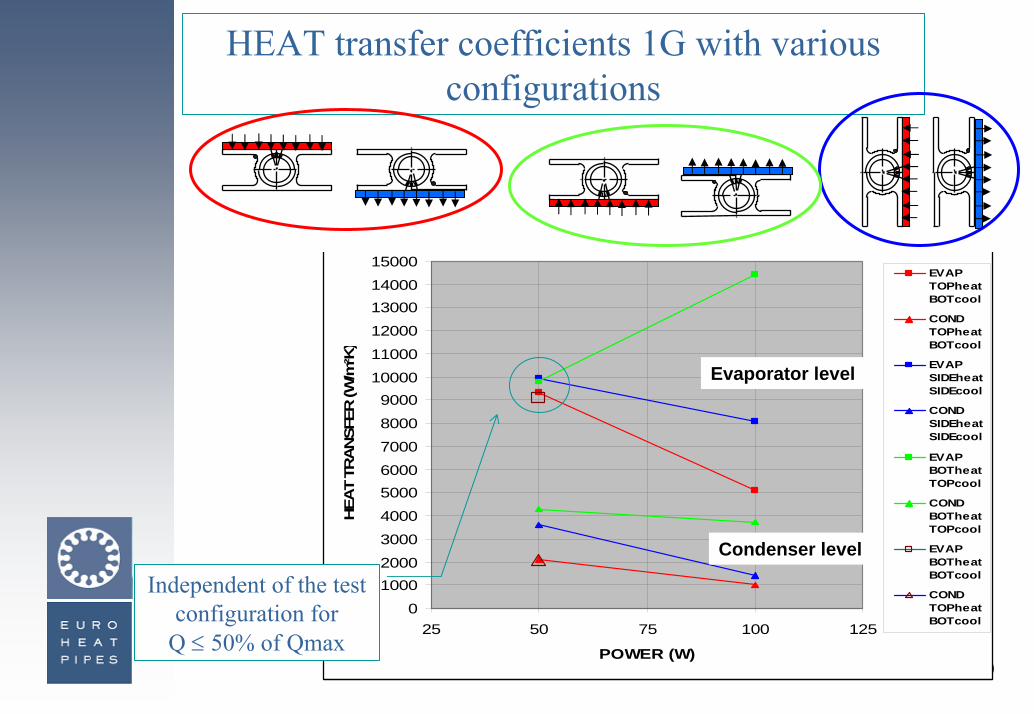
HEAT transfer coefficients 1G with various configurations
0
10002000
3000
4000
50006000
7000
8000
900010000
11000
12000
1300014000
15000
25 50 75 100 125
POWER (W)
HEA
T TR
AN
SFER
(W/m
²K)
EVAPTOPheatBOTcool
CONDTOPheatBOTcool
EVAPSIDEheatSIDEcool
CONDSIDEheatSIDEcool
EVAPBOTheatTOPcool
CONDBOTheatTOPcool
EVAPBOTheatBOTcool
CONDTOPheatBOTcool
Independent of the test configuration for
Q ≤ 50% of Qmax
Condenser level
Evaporator level
21
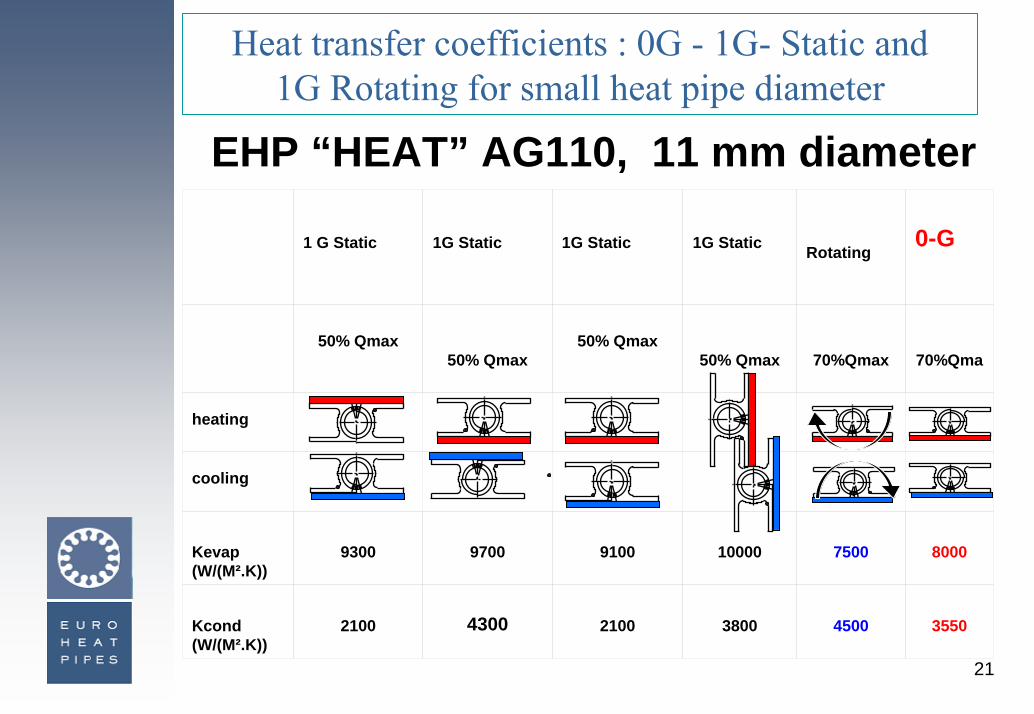
Heat transfer coefficients : 0G - 1G- Static and 1G Rotating for small heat pipe diameter
EHP “HEAT” AG110, 11 mm diameter
1 G Static 1G Static 1G Static 1G Static Rotating0-G
50% Qmax50% Qmax
50% Qmax50% Qmax 70%Qmax 70%Qma
heating
cooling
Kevap(W/(M².K))
9300 9700 9100 10000 7500 8000
Kcond(W/(M².K))
2100 4300 2100 3800 4500 3550
22
AG200 large heat pipe diameter 20 mm
1G tests conditions impact
- Maximum Heat Transport capability
- Heat transfer performances at evaporation and condensation interfaces
23
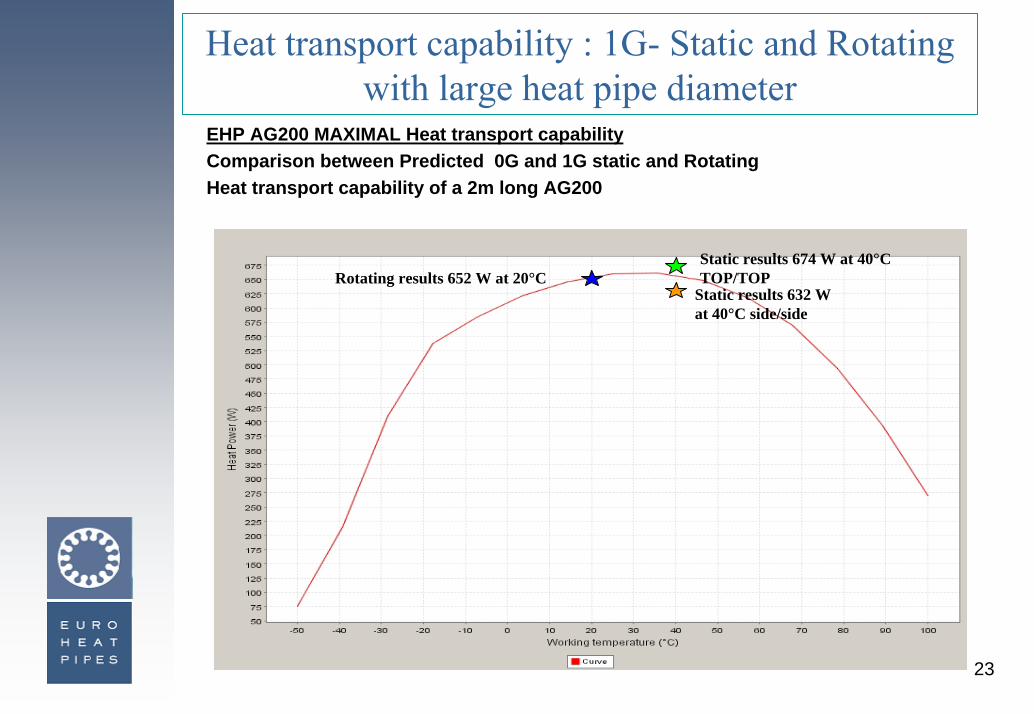
Heat transport capability : 1G- Static and Rotating with large heat pipe diameter
EHP AG200 MAXIMAL Heat transport capabilityComparison between Predicted 0G and 1G static and Rotating Heat transport capability of a 2m long AG200
Rotating results 652 W at 20°CStatic results 674 W at 40°C TOP/TOP
Static results 632 W at 40°C side/side
24
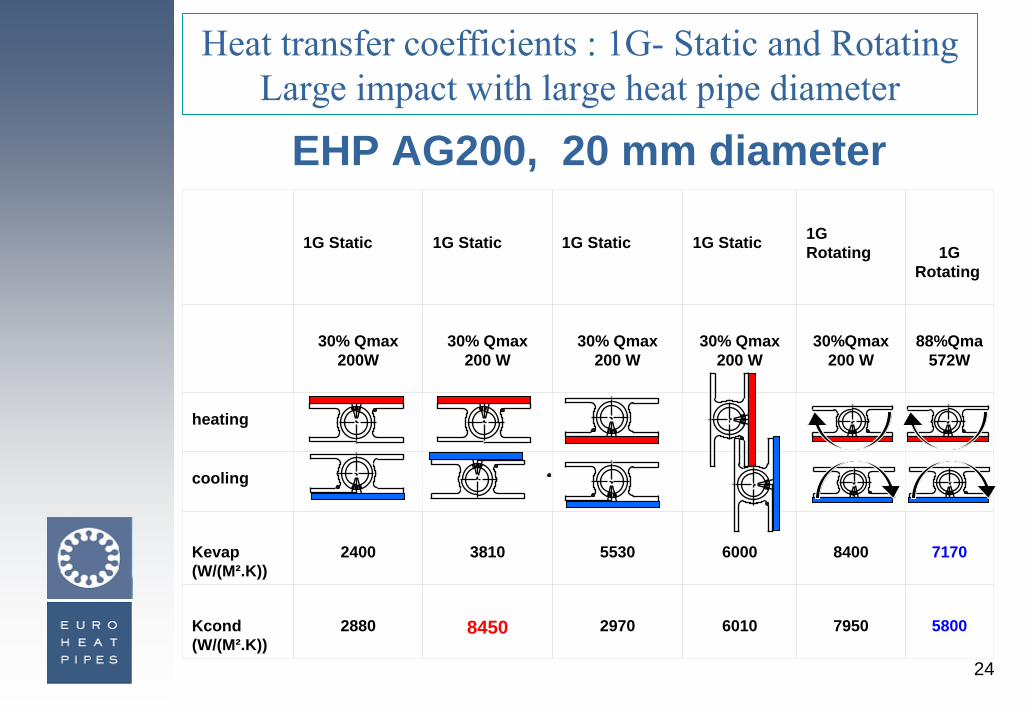
Heat transfer coefficients : 1G- Static and Rotating Large impact with large heat pipe diameter
EHP AG200, 20 mm diameter
1G Static 1G Static 1G Static 1G Static 1G Rotating 1G
Rotating
30% Qmax200W
30% Qmax200 W
30% Qmax200 W
30% Qmax200 W
30%Qmax 200 W
88%Qma 572W
heating
cooling
Kevap(W/(M².K))
2400 3810 5530 6000 8400 7170
Kcond(W/(M².K))
2880 8450 2970 6010 7950 5800
25
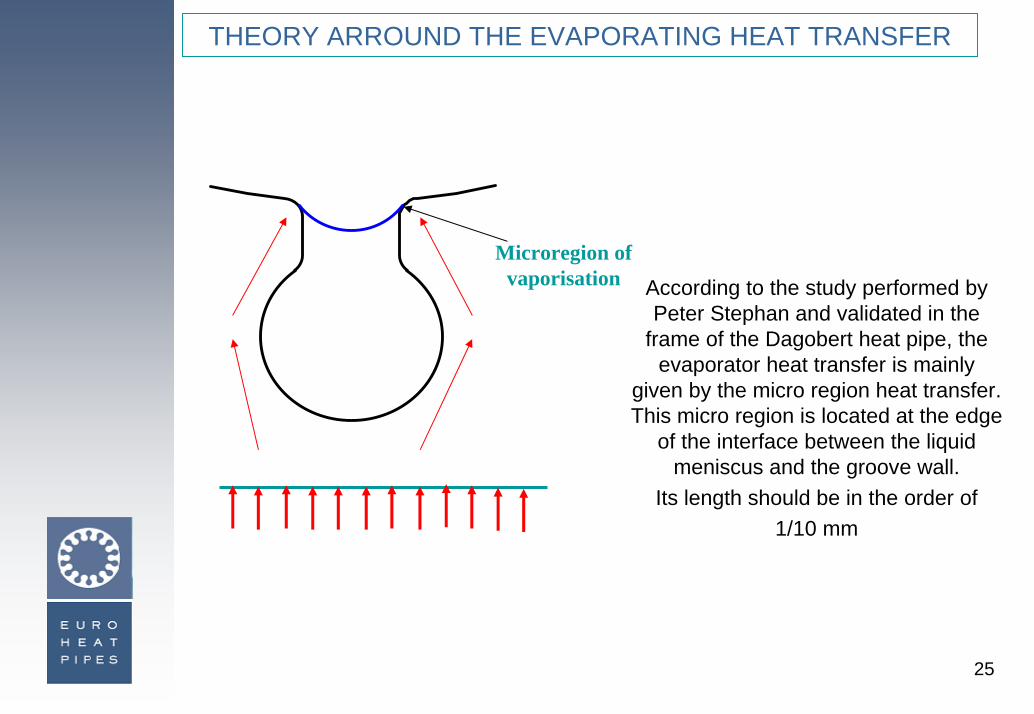
THEORY ARROUND THE EVAPORATING HEAT TRANSFER
Microregion of vaporisation According to the study performed by
Peter Stephan and validated in the frame of the Dagobert heat pipe, the
evaporator heat transfer is mainly given by the micro region heat transfer. This micro region is located at the edge
of the interface between the liquid meniscus and the groove wall.
Its length should be in the order of 1/10 mm

26
flight results recorded with the EHP AG110 “Heat Experiment” on board of the ISS
CASE 1: TWO SIDES HEATING
OG Test results and conditions:- Heating power 2 times 41W on each side- With an adiabatic temperature of = 44.2°C- The heated side temperature was = 46°C.If we assume that all grooves are primedthe following theoretical value is obtained.
OG mathematical results and conditions:- Heating power 2 times 41W on two sides- With an adiabatic temperature of = 44.2°C- If we tune the Microregion length at 0.1mm with a heat transfer coefficient of 250000W/m²K over this length,
The resulted heated side temperature correspond to the 0G at = 46°C
Temperature sensor
27
flight results recorded with the EHP AG110 “Heat Experiment” on board of the ISS con’t I
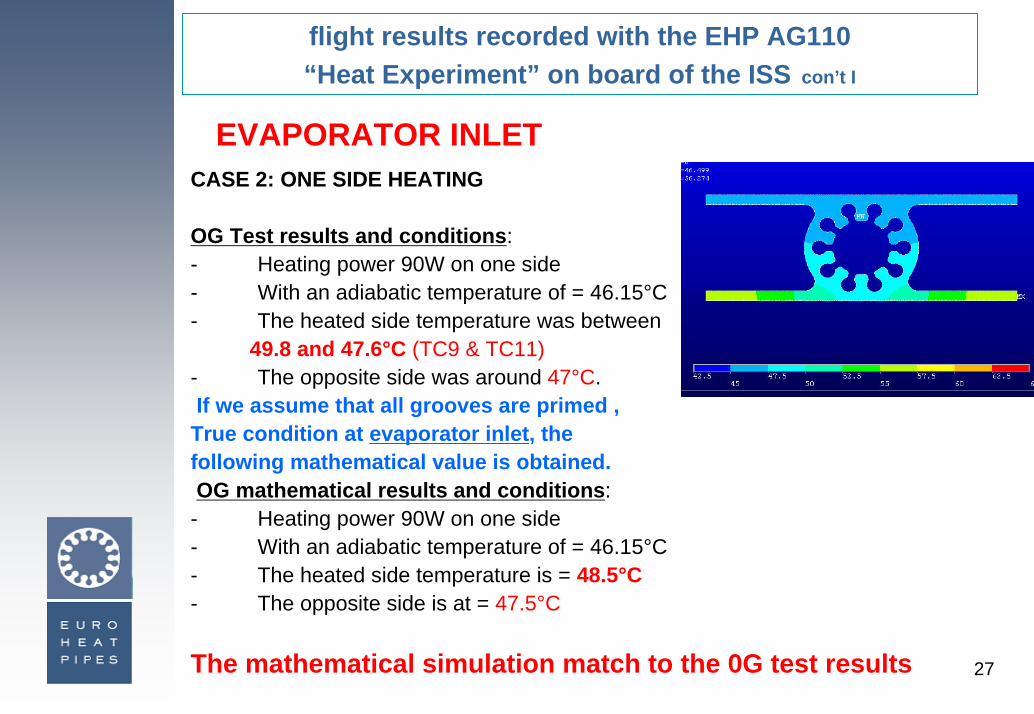
EVAPORATOR INLETCASE 2: ONE SIDE HEATING
OG Test results and conditions:- Heating power 90W on one side- With an adiabatic temperature of = 46.15°C- The heated side temperature was between
49.8 and 47.6°C (TC9 & TC11)- The opposite side was around 47°C.If we assume that all grooves are primed ,
True condition at evaporator inlet, the following mathematical value is obtained.OG mathematical results and conditions:- Heating power 90W on one side- With an adiabatic temperature of = 46.15°C- The heated side temperature is = 48.5°C- The opposite side is at = 47.5°C
The mathematical simulation match to the 0G test results
28
flight results recorded with the EHP AG110 “Heat Experiment” on board of the ISS con’t I
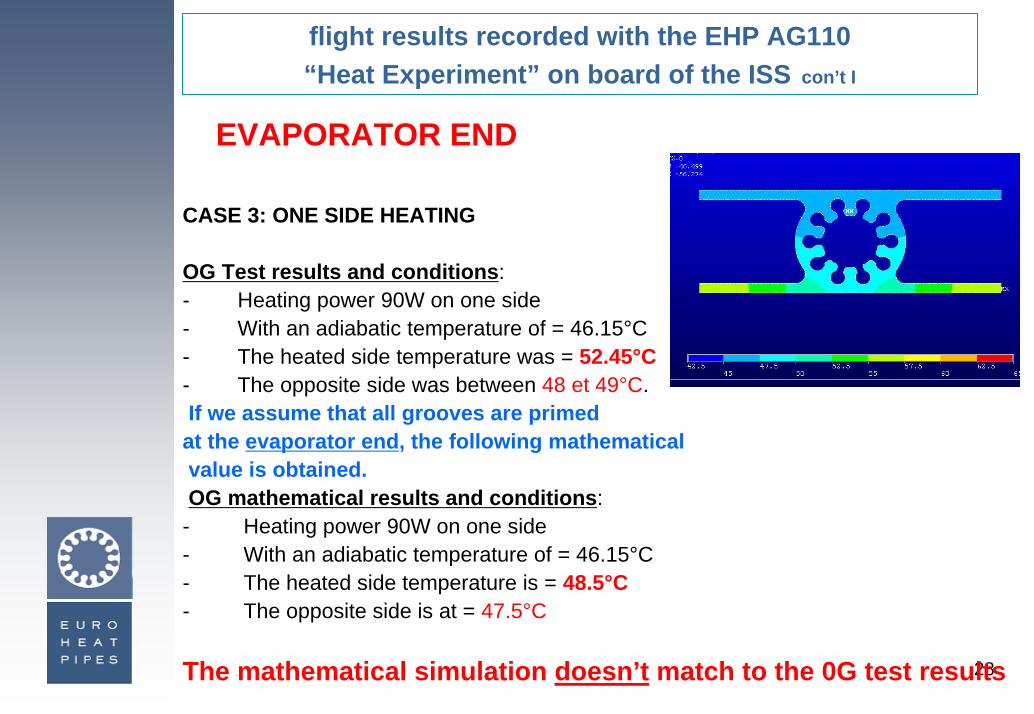
CASE 3: ONE SIDE HEATING
OG Test results and conditions:- Heating power 90W on one side- With an adiabatic temperature of = 46.15°C- The heated side temperature was = 52.45°C- The opposite side was between 48 et 49°C.If we assume that all grooves are primed
at the evaporator end, the following mathematicalvalue is obtained.OG mathematical results and conditions:- Heating power 90W on one side- With an adiabatic temperature of = 46.15°C- The heated side temperature is = 48.5°C- The opposite side is at = 47.5°C
The mathematical simulation doesn’t match to the 0G test results
EVAPORATOR END
29
flight results recorded with the EHP AG110 “Heat Experiment” on board of the ISS con’t II
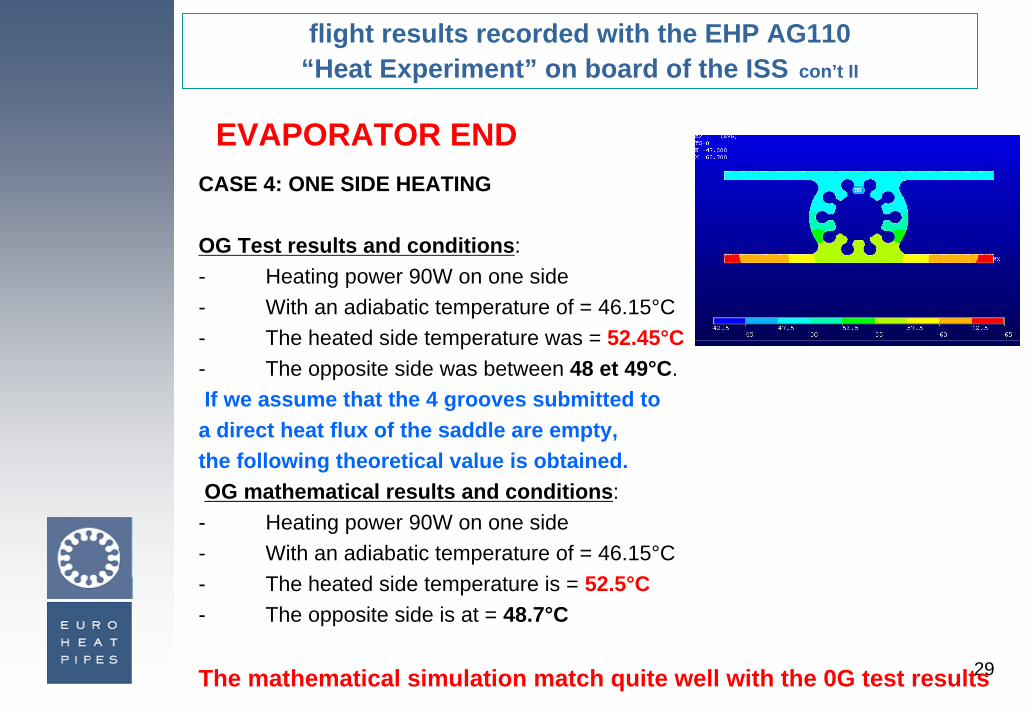
CASE 4: ONE SIDE HEATING
OG Test results and conditions:- Heating power 90W on one side- With an adiabatic temperature of = 46.15°C- The heated side temperature was = 52.45°C- The opposite side was between 48 et 49°C.If we assume that the 4 grooves submitted to
a direct heat flux of the saddle are empty, the following theoretical value is obtained.OG mathematical results and conditions:- Heating power 90W on one side- With an adiabatic temperature of = 46.15°C- The heated side temperature is = 52.5°C- The opposite side is at = 48.7°C
The mathematical simulation match quite well with the 0G test results
EVAPORATOR END
30
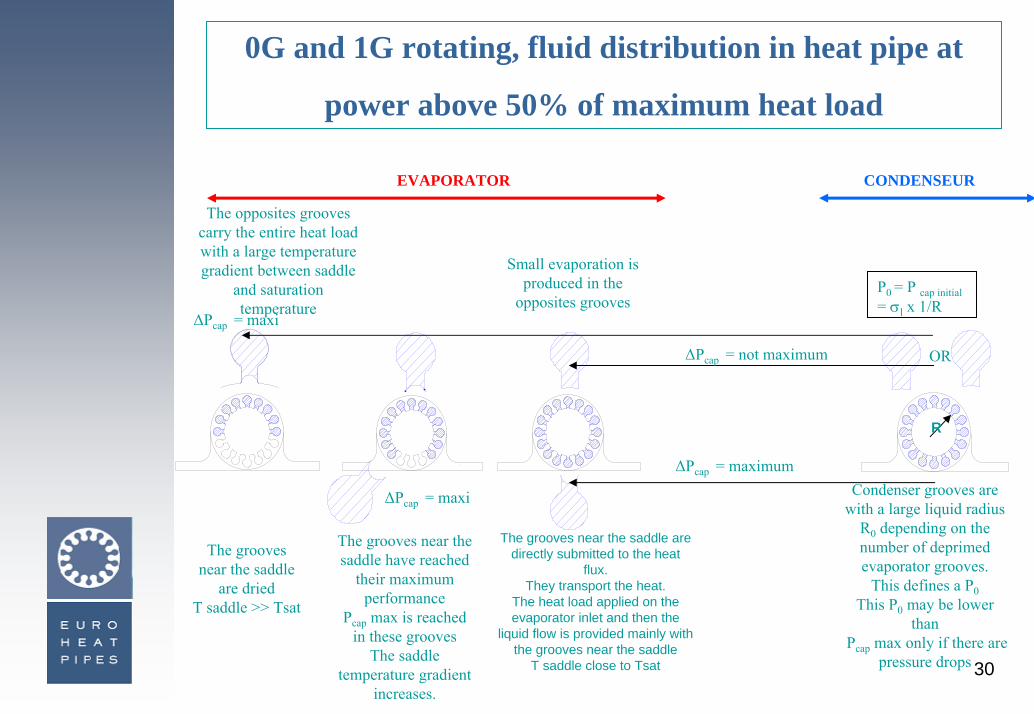
0G and 1G rotating, fluid distribution in heat pipe at
power above 50% of maximum heat load
EVAPORATOR CONDENSEUR
The grooves near the saddle are directly submitted to the heat
flux.They transport the heat.
The heat load applied on the evaporator inlet and then the
liquid flow is provided mainly with the grooves near the saddle
T saddle close to Tsat
Small evaporation is produced in the
opposites grooves
The opposites grooves carry the entire heat load with a large temperature gradient between saddle
and saturation temperature
Condenser grooves are with a large liquid radius
R0 depending on the number of deprimedevaporator grooves.
This defines a P0This P0 may be lower
thanPcap max only if there are
pressure drops
The grooves near the saddle
are driedT saddle >> Tsat
The grooves near the saddle have reached
their maximum performance
Pcap max is reached in these grooves
The saddle temperature gradient
increases.
P0 = P cap initial= σl x 1/R
R
∆Pcap = not maximum
∆Pcap = maximum
∆Pcap = maxi
OR
∆Pcap = maxi
31
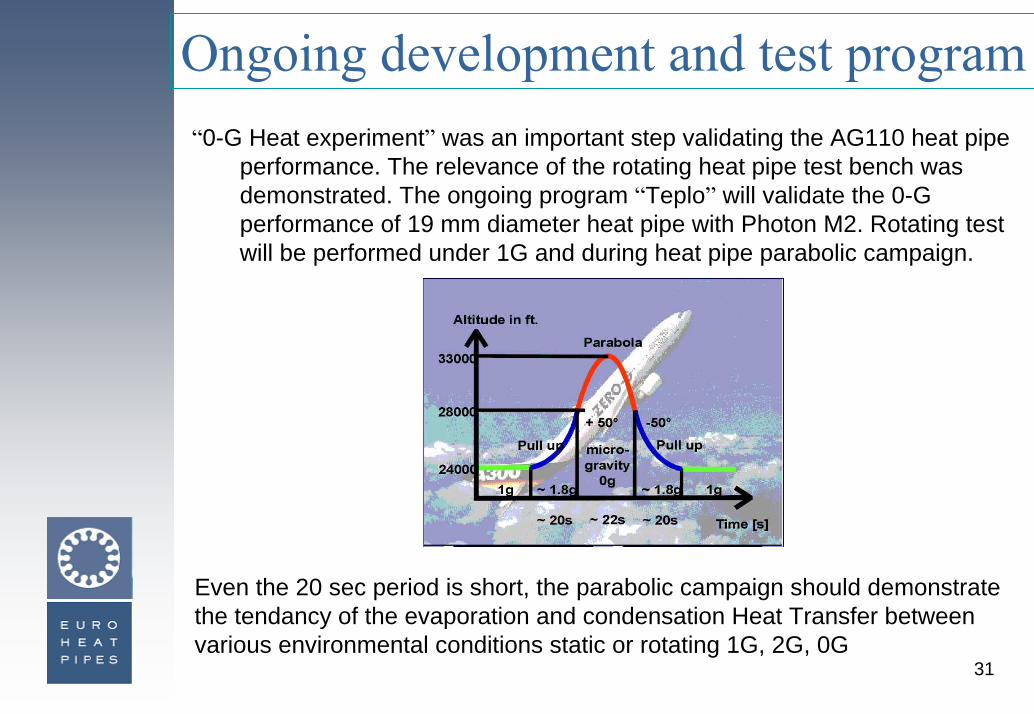
Ongoing development and test program“0-G Heat experiment” was an important step validating the AG110 heat pipe
performance. The relevance of the rotating heat pipe test bench was demonstrated. The ongoing program “Teplo” will validate the 0-G performance of 19 mm diameter heat pipe with Photon M2. Rotating test will be performed under 1G and during heat pipe parabolic campaign.
Even the 20 sec period is short, the parabolic campaign should demonstrate the tendancy of the evaporation and condensation Heat Transfer between various environmental conditions static or rotating 1G, 2G, 0G
32
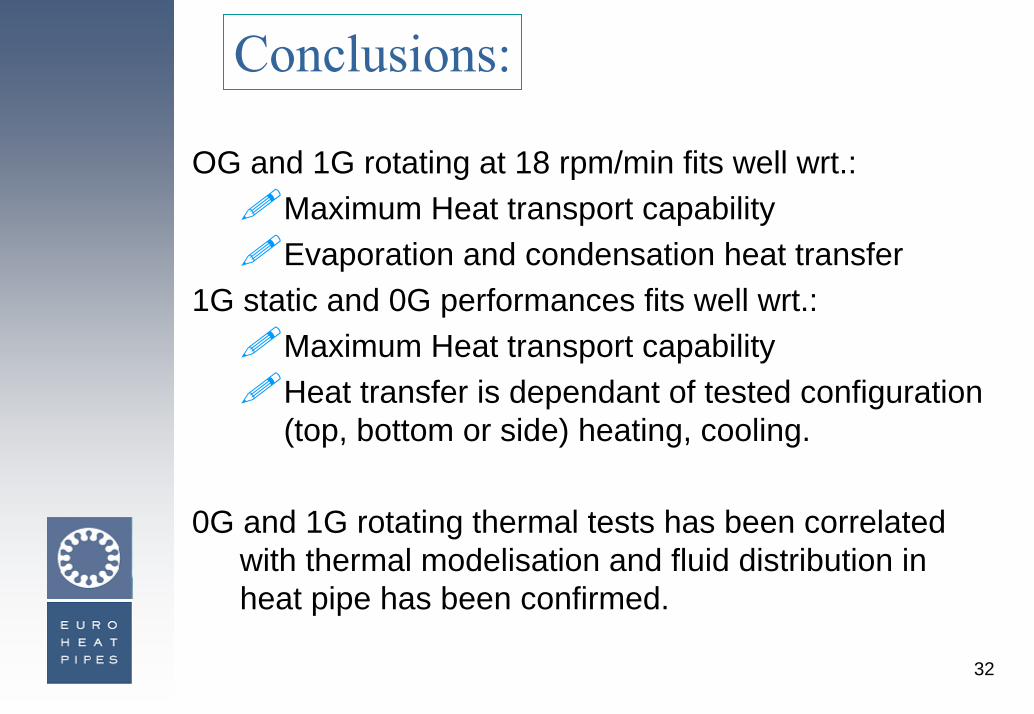
Conclusions:
OG and 1G rotating at 18 rpm/min fits well wrt.:Maximum Heat transport capabilityEvaporation and condensation heat transfer
1G static and 0G performances fits well wrt.:Maximum Heat transport capabilityHeat transfer is dependant of tested configuration (top, bottom or side) heating, cooling.
0G and 1G rotating thermal tests has been correlated with thermal modelisation and fluid distribution in heat pipe has been confirmed.