Embed Size (px)
Citation preview
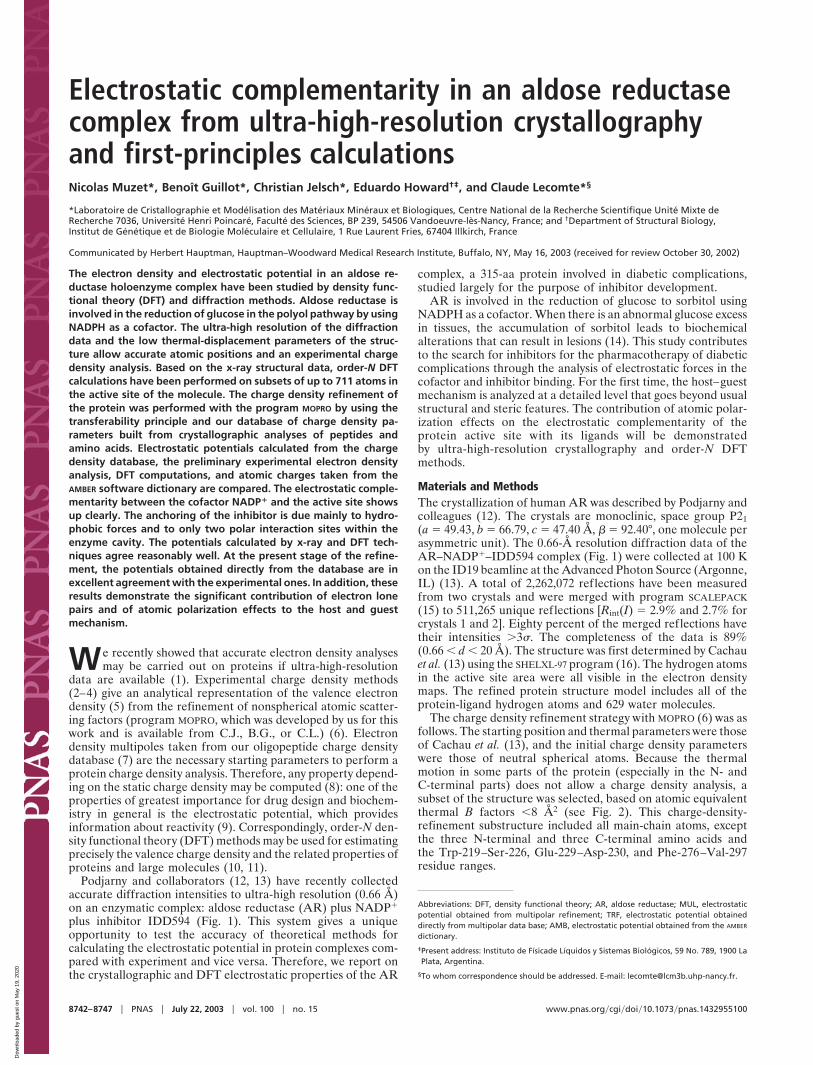
Electrostatic complementarity in an aldose reductasecomplex from ultra-high-resolution crystallographyand first-principles calculationsNicolas Muzet*, Benoıt Guillot*, Christian Jelsch*, Eduardo Howard†‡, and Claude Lecomte*§
*Laboratoire de Cristallographie et Modelisation des Materiaux Mineraux et Biologiques, Centre National de la Recherche Scientifique Unite Mixte deRecherche 7036, Universite Henri Poincare, Faculte des Sciences, BP 239, 54506 Vandoeuvre-les-Nancy, France; and †Department of Structural Biology,Institut de Genetique et de Biologie Moleculaire et Cellulaire, 1 Rue Laurent Fries, 67404 Illkirch, France
Communicated by Herbert Hauptman, Hauptman–Woodward Medical Research Institute, Buffalo, NY, May 16, 2003 (received for review October 30, 2002)
The electron density and electrostatic potential in an aldose re-ductase holoenzyme complex have been studied by density func-tional theory (DFT) and diffraction methods. Aldose reductase isinvolved in the reduction of glucose in the polyol pathway by usingNADPH as a cofactor. The ultra-high resolution of the diffractiondata and the low thermal-displacement parameters of the struc-ture allow accurate atomic positions and an experimental chargedensity analysis. Based on the x-ray structural data, order-N DFTcalculations have been performed on subsets of up to 711 atoms inthe active site of the molecule. The charge density refinement ofthe protein was performed with the program MOPRO by using thetransferability principle and our database of charge density pa-rameters built from crystallographic analyses of peptides andamino acids. Electrostatic potentials calculated from the chargedensity database, the preliminary experimental electron densityanalysis, DFT computations, and atomic charges taken from theAMBER software dictionary are compared. The electrostatic comple-mentarity between the cofactor NADP� and the active site showsup clearly. The anchoring of the inhibitor is due mainly to hydro-phobic forces and to only two polar interaction sites within theenzyme cavity. The potentials calculated by x-ray and DFT tech-niques agree reasonably well. At the present stage of the refine-ment, the potentials obtained directly from the database are inexcellent agreement with the experimental ones. In addition, theseresults demonstrate the significant contribution of electron lonepairs and of atomic polarization effects to the host and guestmechanism.
We recently showed that accurate electron density analysesmay be carried out on proteins if ultra-high-resolution
data are available (1). Experimental charge density methods(2–4) give an analytical representation of the valence electrondensity (5) from the refinement of nonspherical atomic scatter-ing factors (program MOPRO, which was developed by us for thiswork and is available from C.J., B.G., or C.L.) (6). Electrondensity multipoles taken from our oligopeptide charge densitydatabase (7) are the necessary starting parameters to perform aprotein charge density analysis. Therefore, any property depend-ing on the static charge density may be computed (8): one of theproperties of greatest importance for drug design and biochem-istry in general is the electrostatic potential, which providesinformation about reactivity (9). Correspondingly, order-N den-sity functional theory (DFT) methods may be used for estimatingprecisely the valence charge density and the related properties ofproteins and large molecules (10, 11).
Podjarny and collaborators (12, 13) have recently collectedaccurate diffraction intensities to ultra-high resolution (0.66 Å)on an enzymatic complex: aldose reductase (AR) plus NADP�
plus inhibitor IDD594 (Fig. 1). This system gives a uniqueopportunity to test the accuracy of theoretical methods forcalculating the electrostatic potential in protein complexes com-pared with experiment and vice versa. Therefore, we report onthe crystallographic and DFT electrostatic properties of the AR
complex, a 315-aa protein involved in diabetic complications,studied largely for the purpose of inhibitor development.
AR is involved in the reduction of glucose to sorbitol usingNADPH as a cofactor. When there is an abnormal glucose excessin tissues, the accumulation of sorbitol leads to biochemicalalterations that can result in lesions (14). This study contributesto the search for inhibitors for the pharmacotherapy of diabeticcomplications through the analysis of electrostatic forces in thecofactor and inhibitor binding. For the first time, the host–guestmechanism is analyzed at a detailed level that goes beyond usualstructural and steric features. The contribution of atomic polar-ization effects on the electrostatic complementarity of theprotein active site with its ligands will be demonstratedby ultra-high-resolution crystallography and order-N DFTmethods.
Materials and MethodsThe crystallization of human AR was described by Podjarny andcolleagues (12). The crystals are monoclinic, space group P21(a � 49.43, b � 66.79, c � 47.40 Å, � � 92.40°, one molecule perasymmetric unit). The 0.66-Å resolution diffraction data of theAR–NADP�–IDD594 complex (Fig. 1) were collected at 100 Kon the ID19 beamline at the Advanced Photon Source (Argonne,IL) (13). A total of 2,262,072 reflections have been measuredfrom two crystals and were merged with program SCALEPACK(15) to 511,265 unique reflections [Rint(I) � 2.9% and 2.7% forcrystals 1 and 2]. Eighty percent of the merged reflections havetheir intensities �3�. The completeness of the data is 89%(0.66 � d � 20 Å). The structure was first determined by Cachauet al. (13) using the SHELXL-97 program (16). The hydrogen atomsin the active site area were all visible in the electron densitymaps. The refined protein structure model includes all of theprotein-ligand hydrogen atoms and 629 water molecules.
The charge density refinement strategy with MOPRO (6) was asfollows. The starting position and thermal parameters were thoseof Cachau et al. (13), and the initial charge density parameterswere those of neutral spherical atoms. Because the thermalmotion in some parts of the protein (especially in the N- andC-terminal parts) does not allow a charge density analysis, asubset of the structure was selected, based on atomic equivalentthermal B factors �8 Å2 (see Fig. 2). This charge-density-refinement substructure included all main-chain atoms, exceptthe three N-terminal and three C-terminal amino acids andthe Trp-219–Ser-226, Glu-229–Asp-230, and Phe-276–Val-297residue ranges.
Abbreviations: DFT, density functional theory; AR, aldose reductase; MUL, electrostaticpotential obtained from multipolar refinement; TRF, electrostatic potential obtaineddirectly from multipolar data base; AMB, electrostatic potential obtained from the AMBER
dictionary.
‡Present address: Instituto de Fısicade Lıquidos y Sistemas Biologicos, 59 No. 789, 1900 LaPlata, Argentina.
§To whom correspondence should be addressed. E-mail: [email protected].
8742–8747 � PNAS � July 22, 2003 � vol. 100 � no. 15 www.pnas.org�cgi�doi�10.1073�pnas.1432955100
Dow
nloa
ded
by g
uest
on
May
19,
202
0
At first, a high-order spherical atom refinement was per-formed with MOPRO (6) on the nonhydrogen atoms of thesubstructure, to start the electron density refinement with theleast biased positional and thermal parameters. This refinementwas performed against high-resolution shells of decreasing size.The three successive resolution ranges used were 0.5–0.76 Å�1
(327,546 reflections), 0.6–0.76 Å�1 (216,984), and 0.65–0.76 Å�1
(152,454). A zero intensity over sigma cutoff, which correspondsto a completeness of 68% for the highest resolutionshell (0.7–0.76 Å�1), was applied. The high-order refinementstrategy consisted of alternate refinement of positional andanisotropic thermal motion parameters, without any stereo-chemical or dynamical restraints, until total convergence, foreach of the three resolution ranges. In each case, significantimprovements in the agreement factors R(F) and Rfree(F) wereobserved. For example, in the 0.6–0.76 Å�1 range, the R(F)[Rfree(F)] factor dropped from 12.68% (13.42%) to 12.23%(13.31%).
In the second stage of refinement, the starting electron densityparameters were transferred from our nonspherical atoms mul-tipole database (7) describing all of the chemical groups presentin proteins. All atoms of the protein were assigned nonsphericalscattering factors; water molecules were modeled as free oxygenatoms. The starting parameters for NADP� were from thecharge density analysis of NAD� (11), and spherical atomscattering factors were used for the IDD594 inhibitor compound.All hydrogen atoms were displaced along the XOH bonds tostandard bond distances obtained by neutron diffraction studies(17) and were subsequently kept fixed.
The transfer procedure led to an immediate improvement ofstatistical agreement indices, with the R(F) factor dropping from11.45% to 11.05% and Rfree(F) from 12.07% to 11.77% for467,214 reflections with I��I � 0 and 0 � s � 0.76 �1. Thisdecrease of the crystallographic R-factors, and the improvementof the resulting residual density, fully justify the multipolarparameters transfer procedure.
The electron density refinement was performed with MOPROfor the main-chain atoms (including hydrogen atoms) of thesubstructure described above, against the 456,477 reflections inthe 0.15- to 0.76-�1 resolution range. For the atoms of theprotein side chains, of the ligands and of the water molecules,only positions and thermal parameters were refined. This chargedensity analysis included the refinement of the multipolar pa-rameters and the valence populations. Electron density con-straints were applied, taking advantage of the chemical equiv-alence of the peptide units. Local symmetry constraints were
also applied, because only the nonzero multipole parameters ofthe databank were allowed to vary.
The low-resolution truncation makes some allowance for theproblem of the disordered solvent, because an exponential scalingmodel turned out not to be helpful at this stage of our study. Oneof the next improvements of the procedure will be to perform thebulk solvent correction using the flat solvent model (18).
This preliminary charge density refinement led to a descrip-tion of the average electron density and atomic charges along themain chain, which was subsequently used for a computation ofthe electrostatic potential obtained from multipolar refinement(MUL) (6). The resulting set of valence population parameters(Pv) for the protein main-chain atoms are as follows: C�, 4.04 (7);O, 6.32 (8); N, 5.12 (7); C, 4.09 (7); H�, 0.86 (9); HN, 0.81 (8)[R(F) factor drops from 10.21% to 10.10% and Rfree(F) from11.04% to 10.68% in the 0.15- to 0.76-�1 resolution range]. Theexperimental charge density refinement of the AR complex isstill being completed and will be reported in detail in a forth-coming paper.
DFT Calculations. All calculations were performed at the experi-mental geometry with the DFT program SIESTA (19, 20). Thissoftware allows calculations that scale linearly with, rather thanwith the cube of, the number of atoms in the system. This allowedthe study of large parts of the AR complex. Some of theapproximations made are described in this article, and a detaileddescription can be found in refs. 19–21.
Exchange and correlation of the Kohn–Sham theory (22) aretreated with the generalized gradient approximation functionalproposed by Perdew et al. (23). Core electrons were replaced byscalar-relativistic norm-conserving pseudopotentials generatedusing the Troullier–Martins scheme (24) in their fully nonlocalformulation (25). A uniform mesh with a plane-wave cutoff of 75Ry was used to represent the Hartree and exchange-correlationpotentials and the local part of the pseudopotential.
Valence electrons were described using a basis set of finite-rangenumerical atomic orbitals. Radial parts of these orbitals are basedon the scheme of pseudoatomic orbitals of Sankey and Niklewski(26), who proposed a scheme to build single-� bases. In SIESTA, thebases are generalized to arbitrarily complete bases up to double-�with polarization orbitals (21). The orbital confinement energiesused were defined in an earlier report (10), in which the final set ofcutoff values was selected so the electronic density would be
Fig. 1. Ribbon view of the AR-NADP� inhibitor complex (Left) and chemicalformula of the inhibitor IDD594 (Right).
Fig. 2. View of AR backbone structure with NADP� and inhibitor repre-sented in the same orientation as Fig. 1. Amino acids are colored according totheir average equivalent temperature factor. Blue, Beq � 4 Å2; green, 4 � Beq �6 Å2; orange, 6 � Beq � 8 Å2; red, Beq � 8 Å2.
Muzet et al. PNAS � July 22, 2003 � vol. 100 � no. 15 � 8743
BIO
PHYS
ICS
Dow
nloa
ded
by g
uest
on
May
19,
202
0
comparable to the experimental density in the database. Use ofthese finite-range orbitals, which give rise to sparse overlap andHamiltonian matrices, and of pseudo potentials in the Kleinman–Bylander factorized form, allows the Kohn–Sham Hamiltonian tobe built with order-N operations. More details on these techniquesare given in refs. 19–21.
The DFT quantum chemical modeling included (i) a substruc-ture consisting of 64 amino acid residues that surround the activesite: 18–22, 42–49, 76–81, 109–116, 121–123, 129–131, 158–161,182–184, 208–215, 297–312, and HOH464 (603 atoms); (ii) asubstructure consisting of the 64 active-site residues plus theNADP� cofactor (676 atoms); and (iii) a substructure includingthe same residues, plus the NADP� cofactor and the IDD594inhibitor (711 atoms).
For these calculations, the atomic positions were held fixed atthe crystallographic geometry. The 64 aa in the DFT-calculationsubstructure completely surround the cofactor NADP� nicotin-amide moiety and the inhibitor.
Electrostatic Potential. The experimental electrostatic potentialswere computed from the electron density at the refined geom-etry with ELECTROS (27) in two ways: first [electrostatic potentialobtained directly from multipolar data base (TRF) (7)], usingdirectly the charge density parameters transferred from themultipolar atoms database (7, 28); and, second (MUL), using theparameters obtained from the preliminary multipole refinementof the protein main-chain atoms. The experimental potential ofNADP� was derived from the NAD� charge density analysisreported previously (11).
The theoretical DFT potential was obtained from the SIESTAcalculations. For the analysis of the binding interactions, theelectrostatic potential of the cofactor NADP�, of the inhibitor,and of the enzyme active site were computed separately in vacuowithout any interaction and compared with the electrostaticpotential generated by the complex.
For the sake of comparison, the electrostatic potential ob-
tained from the AMBER dictionary (AMB) generated by theprotein without the cofactor was computed by using the pointcharges force field of the AMBER dictionary (29).
The electrostatic potential generated by the protein wascomputed in all cases using the 64-aa substructure surroundingthe active site (603 atoms).
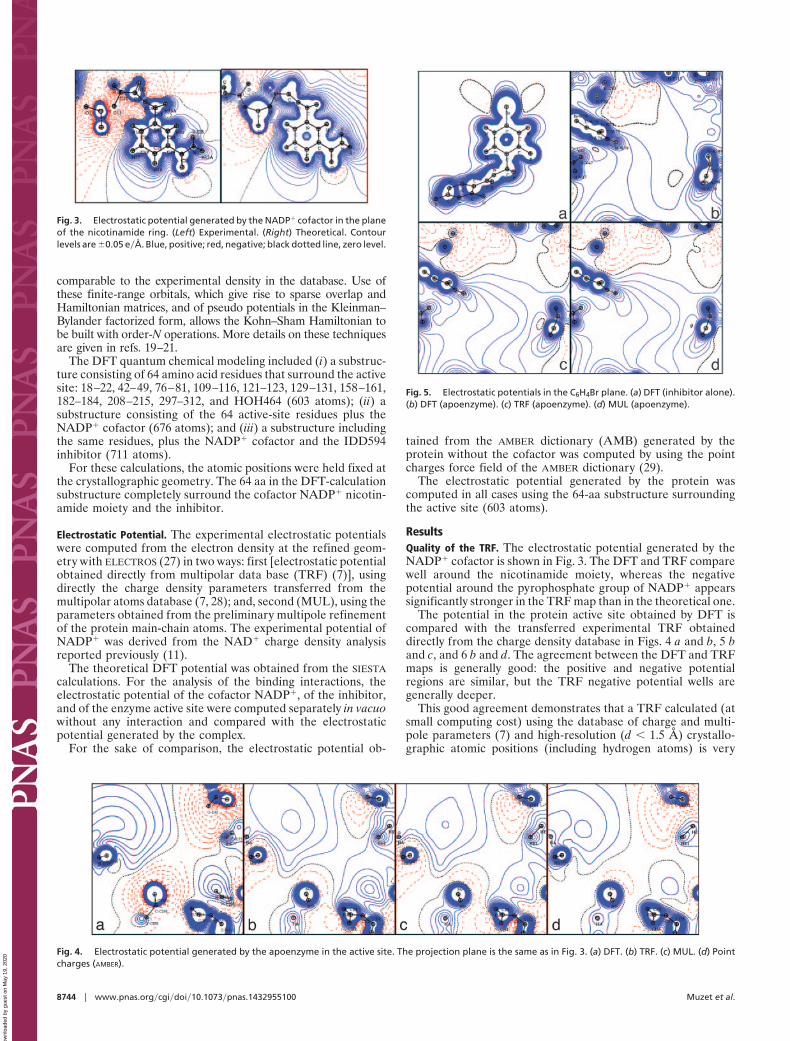
ResultsQuality of the TRF. The electrostatic potential generated by theNADP� cofactor is shown in Fig. 3. The DFT and TRF comparewell around the nicotinamide moiety, whereas the negativepotential around the pyrophosphate group of NADP� appearssignificantly stronger in the TRF map than in the theoretical one.
The potential in the protein active site obtained by DFT iscompared with the transferred experimental TRF obtaineddirectly from the charge density database in Figs. 4 a and b, 5 band c, and 6 b and d. The agreement between the DFT and TRFmaps is generally good: the positive and negative potentialregions are similar, but the TRF negative potential wells aregenerally deeper.
This good agreement demonstrates that a TRF calculated (atsmall computing cost) using the database of charge and multi-pole parameters (7) and high-resolution (d � 1.5 Å) crystallo-graphic atomic positions (including hydrogen atoms) is very
Fig. 3. Electrostatic potential generated by the NADP� cofactor in the planeof the nicotinamide ring. (Left) Experimental. (Right) Theoretical. Contourlevels are �0.05 e�Å. Blue, positive; red, negative; black dotted line, zero level.
Fig. 4. Electrostatic potential generated by the apoenzyme in the active site. The projection plane is the same as in Fig. 3. (a) DFT. (b) TRF. (c) MUL. (d) Pointcharges (AMBER).
Fig. 5. Electrostatic potentials in the C6H4Br plane. (a) DFT (inhibitor alone).(b) DFT (apoenzyme). (c) TRF (apoenzyme). (d) MUL (apoenzyme).
8744 � www.pnas.org�cgi�doi�10.1073�pnas.1432955100 Muzet et al.
Dow
nloa
ded
by g
uest
on
May
19,
202
0
reliable, and can be obtained routinely as soon as a high-resolution structure with hydrogen atoms is available.
Electrostatic Complementarity of Ligand–Protein Interactions.NADP� is naturally bound by AR to enable sugar hydroxylreduction. Although, in the crystal studied, the ligand is not asugar but an inhibitor, it is likely that NADP� interacts in a verysimilar way with the protein. The cofactor is made of fivefunctional groups, namely, nicotinamide, ribose, pyrophosphate,ribose, and adenine. In the studied complex, the first threegroups are buried within the active site, whereas the last two arepartly outside of the protein, solvated by water molecules.
The NADP� cofactor alone displays a large negative potentialaround the pyrophosphate group (DFT, �0.28 e�Å; TRF, �0.40e�Å) near the pyrophosphate oxygen atoms, and a positive poten-tial around the nicotinamide ring due to the global positive chargeof the protonated base (Fig. 3). The oxygen of the NADP� amidegroup generates a small negative potential (DFT, �0.04 e�Å; TRF,�0.04 e�Å3). The zero-level contour is very similar for the twomethods. Fig. 4 shows the electrostatic potential in the nicotinamidering plane generated by the apoenzyme alone calculated by theDFT, TRF, and MUL methods and from the AMBER point charges(AMB). As discussed previously, MUL and TRF are in excellentagreement.
In comparison with Fig. 3, DFT, MUL, and TRF apoenzymeelectrostatic potentials clearly display genuine complementaritywith the NADP� potential. To each negative potential regionaround the cofactor (pyrophosphate group and amide oxygenatom) corresponds a positive potential region in the active site:the enzyme positive regions are located near Pro-211 andSer-210 (Fig. 4) (DFT, �0.34; TRF, �0.18; MUL, �0.14; AMB,�0.14 e�Å) and near Asn-160-NH2 and His-110 N�2–H�2 (DFT,�0.20; TRF, �0.26; MUL, �0.12; AMB, �0.06 e�Å).
Fig. 4 also reveals two negative potential wells: one close toCys-298 S� (DFT, �0.18 e�Å; TRF, �0.06 e�Å; MUL, �0.08 e�Å;AMB, �0.04 e�Å) and the second one near Asp-43-O�1 (DFT,�0.28 e�Å; TRF, �0.14 e�Å; MUL, �0.14 e�Å; AMB, �0.18 e�Å).In the enzyme–cofactor interaction, these two negative potentialregions complement the strong positive potential of NADP�. The
second of the two negative potential wells is created by a specialconfiguration of at least 10 protein atoms: one sulfur atom (Cys-298S�) and nine oxygen atoms (Cys-298 O, Tyr-209 OH, Gln-183 O�1
and O, Asp-43 O�1, O�2 and O, and Thr-19 O and O�1), of whichall are nearly located in a plane almost perpendicular to thenicotinamide ring. An important point is that most of these atomsdo not interact directly with NADP�. Only three of them formhydrogen bonds with NADP�: Cys-298 S�, Asp-43 O�1, and Gln-183O (Fig. 2 and Table 1). It is clear that all other atoms contributethrough long-range electrostatic attraction to the binding of thecofactor. These results demonstrate that considering only theshort-range H bonds involved in the ligand binding clearly under-estimates the interaction strength.
Although there is a qualitative agreement among the fourtechniques of potential computation, some differences remain. Asignificant one is that the AMBER charges yield a weaker negativepotential near Cys-298 S�. Also, all of the positive AMB potentialsseem to be lower than the DFT, TRF, and MUL values. Thesimilarity of DFT, TRF, and MUL indicates that they are moreprecise than point-charge point potentials, apparently because theytake into account a certain degree of atomic polarization. Furthercrystallographic refinement of the side chains, including Cys-298 S�,will further clarify this point.
Inhibitor–Active Site Interactions. The chemical structure of theIDD594 inhibitor (Fig. 1) differs significantly from that ofglucose, but the inhibitor carboxylate group should bind in asimilar region of the enzyme active site as the reacting hydroxylgroup of glucose (13, 14). Because no high-resolution data existfor the glucose complex, the discussion will focus on inhibitorinteractions. The charge density refinement of the inhibitor wasdone ab initio, because of the lack of multipole values in thedatabase for the specific chemical groups. Therefore, theIDD594 electrostatic potentials displayed in the present studyare derived from the DFT calculations only. Fig. 5 gives the DFT
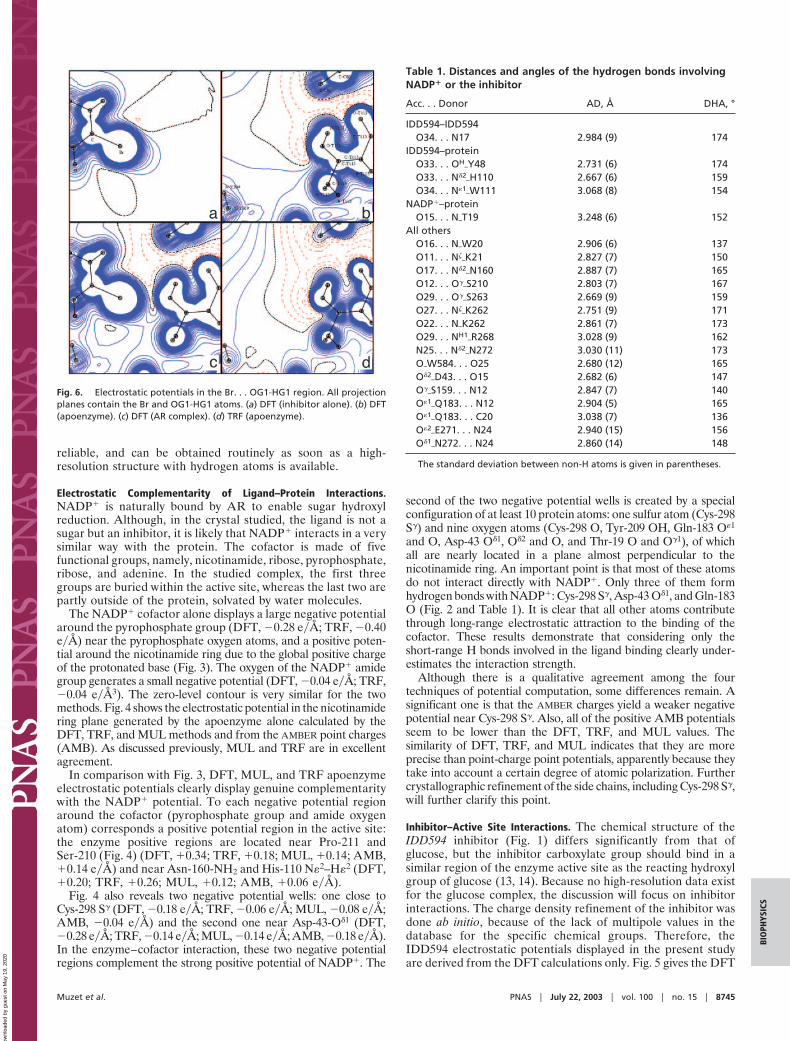
Fig. 6. Electrostatic potentials in the Br. . . OG1-HG1 region. All projectionplanes contain the Br and OG1-HG1 atoms. (a) DFT (inhibitor alone). (b) DFT(apoenzyme). (c) DFT (AR complex). (d) TRF (apoenzyme).
Table 1. Distances and angles of the hydrogen bonds involvingNADP� or the inhibitor
Acc. . . Donor AD, Å DHA, °
IDD594–IDD594O34. . . N17 2.984 (9) 174
IDD594–proteinO33. . . OH�Y48 2.731 (6) 174O33. . . N�2�H110 2.667 (6) 159O34. . . N�1�W111 3.068 (8) 154
NADP�–proteinO15. . . N�T19 3.248 (6) 152
All othersO16. . . N�W20 2.906 (6) 137O11. . . N��K21 2.827 (7) 150O17. . . N�2�N160 2.887 (7) 165O12. . . O��S210 2.803 (7) 167O29. . . O��S263 2.669 (9) 159O27. . . N��K262 2.751 (9) 171O22. . . N�K262 2.861 (7) 173O29. . . NH1�R268 3.028 (9) 162N25. . . N�2�N272 3.030 (11) 173O�W584. . . O25 2.680 (12) 165O�2�D43. . . O15 2.682 (6) 147O��S159. . . N12 2.847 (7) 140O�1�Q183. . . N12 2.904 (5) 165O�1�Q183. . . C20 3.038 (7) 136O�2�E271. . . N24 2.940 (15) 156O�1�N272. . . N24 2.860 (14) 148
The standard deviation between non-H atoms is given in parentheses.
Muzet et al. PNAS � July 22, 2003 � vol. 100 � no. 15 � 8745
BIO
PHYS
ICS
Dow
nloa
ded
by g
uest
on
May
19,
202
0
potential generated by the inhibitor. Except for the carboxylategroup, the potential is slightly positive without any large exten-sion, reflecting the hydrophobic nature of the compound. Anorthogonal view (not shown) gives similar information, except aslightly negative well (DFT value, �0.02 e�Å) in the vicinity ofthe Br-bearing aromatic ring leading to a �–� interaction withTrp-111. This contrasts with the binding of NADP�, which isstrongly electrostatic. Fig. 5 also shows that the correspondingcavity of the apoenzyme displays an overall low positive poten-tial, with two negative wells created by Cys-80 S� and the Thr-113hydroxyl group (DFT, �0.1 e�Å; TRF, �0.2 e�Å; MUL, �0.25e�Å). The experimental MUL and TRF maps give a negativepotential around Tyr-309 (TRF and MUL, �0.10 e�Å), whereasthe theoretical value is slightly positive (DFT, �0.02 e�Å).
The bromine atom of the inhibitor forms an exceptionally shortcontact with the O�1 oxygen atom of Thr-113 (distance, 3.0 Å). Aspointed out by Podjarny and colleagues (30), this is the shortestBr. . .O contact observed so far according to the Cambridge Struc-tural Database (31). Fig. 6 shows the potential around the bromineatom, within the protein complex, for the ligand alone, and for theactive site. The hydroxyl hydrogen atom of the Thr-113 is notdirected toward the bromine atom, as might have been expected,but is involved instead in a hydrogen bond with the Thr-113main-chain carbonyl (30). The negative potential due to the lone
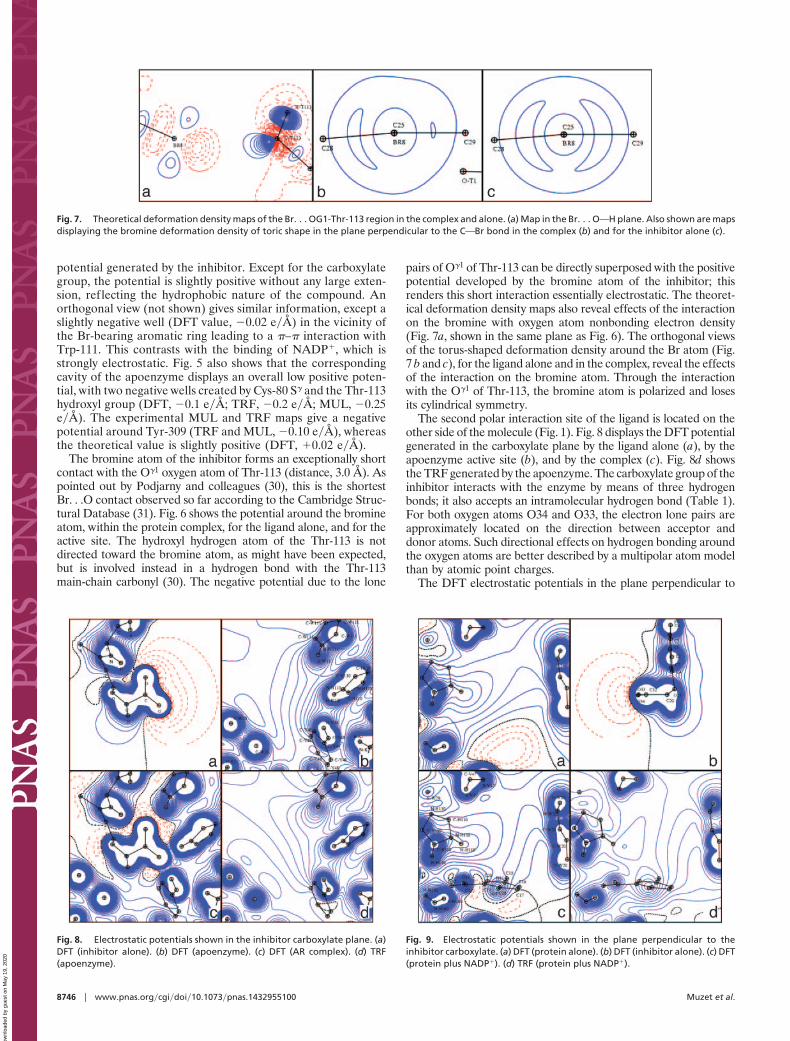
pairs of O�1 of Thr-113 can be directly superposed with the positivepotential developed by the bromine atom of the inhibitor; thisrenders this short interaction essentially electrostatic. The theoret-ical deformation density maps also reveal effects of the interactionon the bromine with oxygen atom nonbonding electron density(Fig. 7a, shown in the same plane as Fig. 6). The orthogonal viewsof the torus-shaped deformation density around the Br atom (Fig.7 b and c), for the ligand alone and in the complex, reveal the effectsof the interaction on the bromine atom. Through the interactionwith the O�1 of Thr-113, the bromine atom is polarized and losesits cylindrical symmetry.
The second polar interaction site of the ligand is located on theother side of the molecule (Fig. 1). Fig. 8 displays the DFT potentialgenerated in the carboxylate plane by the ligand alone (a), by theapoenzyme active site (b), and by the complex (c). Fig. 8d showsthe TRF generated by the apoenzyme. The carboxylate group of theinhibitor interacts with the enzyme by means of three hydrogenbonds; it also accepts an intramolecular hydrogen bond (Table 1).For both oxygen atoms O34 and O33, the electron lone pairs areapproximately located on the direction between acceptor anddonor atoms. Such directional effects on hydrogen bonding aroundthe oxygen atoms are better described by a multipolar atom modelthan by atomic point charges.
The DFT electrostatic potentials in the plane perpendicular to
Fig. 8. Electrostatic potentials shown in the inhibitor carboxylate plane. (a)DFT (inhibitor alone). (b) DFT (apoenzyme). (c) DFT (AR complex). (d) TRF(apoenzyme).
Fig. 9. Electrostatic potentials shown in the plane perpendicular to theinhibitor carboxylate. (a) DFT (protein alone). (b) DFT (inhibitor alone). (c) DFT(protein plus NADP�). (d) TRF (protein plus NADP�).
Fig. 7. Theoretical deformation density maps of the Br. . . OG1-Thr-113 region in the complex and alone. (a) Map in the Br. . . OOH plane. Also shown are mapsdisplaying the bromine deformation density of toric shape in the plane perpendicular to the COBr bond in the complex (b) and for the inhibitor alone (c).
8746 � www.pnas.org�cgi�doi�10.1073�pnas.1432955100 Muzet et al.
Dow
nloa
ded
by g
uest
on
May
19,
202
0
the inhibitor carboxylate are represented around the ligand alone(Fig. 9b), in the active site of the protein alone (Fig. 9a) and in theactive site of the protein–NADP� complex (Fig. 9c); the corre-sponding TRF is given Fig. 9d. Both Figs. 8 and 9 show the goodagreement between experimental and theoretical active site poten-tials, which confirms the feasibility of interaction analyses using thedatabase and high-resolution x-ray refinement only. There is a localcomplementarity between the potentials; in addition, several elec-trostatic potential saddle points, characteristic of H-bonds, can beobserved. The potential in the plane perpendicular to the inhibitorcarboxylate (Fig. 9) shows that the attraction of the ligand carbox-ylate requires the presence of the NADP� cofactor. The positivelycharged nicotinamide group contributes to the electrostaticcomplementarity and therefore to the anchoring of the inhibitorcarboxylate (Fig. 9 c and d). Indeed, without the cofactor (Fig. 9a),the protein active site displays a large negative potential that wouldhinder the binding of COO� (Fig. 9b).
Discussion and ConclusionObtaining accurate electrostatic properties to understand inter-actions among proteins, ligands, and cofactors is very challengingand has many potential applications in life sciences, as shown bythe increasing number of publications devoted to this topic. First,this research needs atomic resolution diffraction data to be ableto locate and refine the hydrogen atoms of the active site. Theuse of dipolar scattering factors for hydrogen atoms, as definedin our database, is necessary. Recent developments of diffractiontechniques at third-generation synchrotrons (32) and progress incryocrystallography (33) and protein crystallization promisemore high-resolution data, which will require nonspherical atommodels to yield more accurate atomic coordinates and thermal-displacement parameters. This will also permit more preciselocation of molecules and ions with important roles in bioelec-trostatics in the protein solvation shell. Given a well refinedhigh-resolution structure, electrostatic properties may be calcu-lated in different ways: directly by multipolar analysis or usingDFT (this work) and�or QM�MM methods (34–36) or by usingfragments experimentally (TRF; ref. 27 and this work) ortheoretically calculated (37–41), or by point charge models suchas AMBER (29), CHARMM (42), or GRASP (43).
This paper has demonstrated that DFT quality potentials canbe obtained quickly and almost routinely from high-resolution
diffraction data (TRF). Such a calculation can be routinelyperformed, at very low cost, with any protein structure at atomicresolution. An application of these methods to allosteric insulinhexamers is under way (R. H. Blessing, G. D. Smith, E. Ciszak,W. A. Pangborn, B.G., and C.L., unpublished data). A directdetermination from an accurate experimental charge distribu-tion transfer plus refinement is also possible, as shown in thispaper (MUL). But this latter possibility still needs further testingand development tests to define the best refinement strategies(even though the refinement program MOPRO is available) toensure that the resulting potential is more accurate than thedatabase-transferred one. This issue will be discussed in aforthcoming publication.
Concerning the complex AR–NADP� inhibitor, and enzy-mology more generally, this work reports, for the first time to ourbest knowledge, an experimental and theoretical analysis of theprotein host–guest interaction at the electrostatic level, i.e.,beyond geometrical or putative hydrogen bonding consider-ations. The roles of coulombic long-range interactions and ofatomic polarizability have been clearly evidenced in the AR–cofactor complex. The results show remarkable electrostaticapoenzyme–cofactor complementarity within the active site,and good hydrophilic�hydrophobic complementarity betweenthe enzyme and the inhibitor. The carboxylate group of theinhibitor is the source of the main polar interaction withthe enzyme, and the electrostatic complementarity is with thepositive potential produced by the NADP� cofactor. In addition,the polarizable bromine atom of the inhibitor forms a short polarcontact with an hydroxyl oxygen atom.
Further work is planned with AR to develop optimal chargedensity refinement and potential mapping strategies, and to eval-uate apoenzyme–cofactor–ligand electrostatic interaction energies.
We gratefully acknowledge A. Mitschler, A. Joachimiak, R. Sanishvili,B. Chevrier, and A. Podjarny for providing us with the crystallographicstructure factors and preliminary anisotropic refinements results on theAR-IDD594 complex; E. Artacho and M. V. Fernandez-Serra for helpon the SIESTA program; and M. M. Rohmer and M. Benard for helpfuldiscussions. Our colleague, V. Pichon-Pesme, is greatly acknowledgedfor the many discussions about the database. N.M. was supported by agrant from the Association pour la Recherche sur le Cancer, and B.G.was supported by a fellowship from the French Minister of Research andTechnology.
1. Jelsch, C., Teeter, M. M., Lamzin, V., Pichon-Pesme, V., Blessing, R. H. & Lecomte,C. (2000) Proc. Natl. Acad. Sci. USA 97, 3171–3176.
2. Lecomte, C. (1995) Adv. Mol. Struct. Res. 1, 261–302.3. Coppens, P. (1998) Acta Crystallogr. A 54, 779–788.4. Coppens, P. (1997) X-Ray Charge Densities and Chemical Bonding (Oxford Univ.
Press, Oxford).5. Hansen, N. K. & Coppens, P. (1978) Acta Crystallogr. A 34, 909–921.6. Guillot, B., Viry, L., Guillot, R., Lecomte, C. & Jelsch, C. (2001) J. Appl. Crystallogr.
34, 214–223.7. Pichon-Pesme, V., Lecomte, C. & Lachekar, H. (1995) J. Phys. Chem. 99, 6242–6250.8. Stewart, R. F. (1976) Acta Crystallogr. A 32, 565–574.9. Politzer, P. & Murray, J. S. (1993) Trans. Am. Crystallogr. Assoc. 26, 23–40.
10. Fernandez-Serra, M. V., Junquera, J., Jelsch, C., Lecomte, C. & Artacho, E. (2000)Solid State Commun. 116, 395–400.
11. Guillot, B., Muzet, N., Jelsch, C., Artacho, E. & Lecomte, C. (2003) J. Phys. Chem.,in press.
12. Lamour, V., Barth, P., Rogniaux, H., Poterszman, A., Howard, E., Mitschler, A., VanDorsselaer, A., Podjarny, A. & Moras, D. (1999) Acta Crystallogr. D 55, 721–723.
13. Cachau, R., Howard, E., Barth, P., Mitschler, A., Chevrier, B., Lamour, V., Joachimiak,A., Sanishvili, R., Van Zandt, M., Sibley, E., et al. (2000) J. Phys. [French] IV 10, 3–13.
14. Yabe-Nishimura, C. (1998) Pharmacol. Rev. 50, 21–32.15. Otwinowski, Z. & Minor, W. (1997) Methods Enzymol. 276, 307–326.16. Sheldrick, G. M. (1997) SHELXL-97, Program for the Refinement of Crystal Structures
(Univ. of Gottingen, Gottingen, Germany).17. Allen, F. (1986) Acta Crystallogr. B 42, 515–522.18. Jiang, J.-S. & Brunger, A. T. (1994) J. Mol. Biol. 243, 100–115.19. Sanchez-Portal, D., Ordejon, P., Artacho, E. & Soler, J. M. (1997) Int. J. Quantum
Chem. 65, 453–461.20. Soler, J. M., Artacho, E., Gale, J. D., Garcia, A., Junquera, J., Ordejon, P. &
Sanchez-Portal, D. (2002) J. Phys. Condens. Matter 14, 2745–2779.21. Artacho, E., Sanchez-Portal, D., Ordejon, P., Garcia, E. & Soler, J. M. (1999) Phys.
Stat. Sol. B 215, 809–817.
22. Kohn, W. & Sham, L. J. (1965) Phys. Rev. A At. Mol. Opt. Phys. 140, 1133–1136.23. Perdew, J. P., Burke, K. & Ernzerhof, M. (1996) Phys. Rev. Lett. 77, 3865–3868.24. Troullier, N. & Martins, J.-L. (1991) Phys. Rev. B Solid State 43, 1993–2006.25. Kleinman, L. & Bylander, D. M. (1982) Phys. Rev. Lett. 48, 1425–1428.26. Sankey, O. F. & Niklewski, D. J. (1989) Phys. Rev. B Solid State 40, 3979–3995.27. Bouhmaida, N., Ghermani, N.-E., Lecomte, C. & Thallal, A. (1999) Acta Crystallogr.
A 55, 729–738.28. Jelsch, C., Pichon-Pesme, V., Lecomte, C. & Aubry, A. (1998) Acta Crystallogr. D 54,
1306–1318.29. Bayly, C. I., Cieplak, P., Cornell, W. D. & Kollman, P. A. (1993) J. Phys. Chem. 97,
10269–10280.30. Howard, E. I., Sanishvili, R., Cachau, R. E., Mitschler, A., Chevrier, B., Barth, P.,
Lamour, V., Van Zandt, M., Sibley, E., Bon, C., et al. (2003) Proteins, in press.31. Allen, F. H. & Kennard, O. (1983) Chem. Design Automation News 8, 31–37.32. Longhi, S., Czjzek, M. & Cambillau, C. (1998) Curr. Opin. Struct. Biol. 8, 730–737.33. Samygina, V. R., Antonyuk, S. V., Lamzin, V. S. & Popov, A. N. (2000) Acta
Crystallogr. D 56, 595–603.34. Eurenius, K. P., Chatfield, D. C., Brooks, B. R. & Hodoscek, M. (1996) Int. J.
Quantum Chem. 60, 1189–2000.35. Gao, J. (1996) Acc. Chem. Res. 29, 298–305.36. Leach, A. R. (1996) in Molecular Modelling: Principles and Applications (Longman,
Essex, U.K.).37. Karle, J., Huang, L. & Massa, L. (1998) Pure Appl. Chem. 70, 319–324.38. Walker, P. D. & Mezey, P. G. (1994) J. Am. Chem. Soc. 116, 12022–12032.39. Bader, R. W. F. (1990) Atoms in Molecules: A Quantum Theory (Oxford Science, Oxford).40. Koritsanszky, T., Volkov, A. & Coppens, P. (2002) Acta Crystallogr. A 58, 464–472.41. Dittrich, B., Koritsanszky, T., Grosche, M., Scherer, W., Flaig, R., Wagner, A., Krane,
H. G., Kessler, H., Riemer, C., Schreurs, A. M. M. & Luger, P. (2002) Acta Crystallogr.B 58, 721–727.
42. Brooks, B. R., Bruccoleri, R. E., Olafson, B. D., States, D. J., Swaminathan, S. &Karplus, M. (1983) J. Comput. Chem. 4, 187–217.
43. Honig, B. & Nicholls, A. (1995) Science 268, 1144–1149.
Muzet et al. PNAS � July 22, 2003 � vol. 100 � no. 15 � 8747
BIO
PHYS
ICS
Dow
nloa
ded
by g
uest
on
May
19,
202
0

![First-time detection and identification of the ... · duction) and the results of standard biochemical tests [13]. These latter included niacin test, nitrate reductase test, and susceptibility](https://img.pdfslide.fr/doc/110x75/5f0b62587e708231d43040ee/first-time-detection-and-identification-of-the-duction-and-the-results-of-standard.jpg)