Embed Size (px)
Citation preview
Estimation of the Residual Gas Fractionin an HCCI-engine using Cylinder
Pressure
Niklas Ivansson
LiTH-ISY-EX-3441-2003May 26, 2003

Estimation of the Residual Gas Fractionin an HCCI-engine using Cylinder
Pressure
Examensarbete utfort i Fordonssystemvid Tekniska Hogskolan i Linkoping
av
Nikals Ivansson
Reg nr: LiTH-ISY-EX-3441
Supervisor: Mattias Bruce, DaimlerChryslerYlva Nilsson, Fordonssystem
Examiner: Lars Eriksson, Fordonssystem
Linkoping, May 26, 2003.

Avdelning, InstitutionDivision, Department
Datum:Date:
Sprak
Language
2 Svenska/Swedish
2 Engelska/English
2
RapporttypReport category
2 Licentiatavhandling
2 Examensarbete
2 C-uppsats
2 D-uppsats
2 Ovrig rapport
2
URL for elektronisk version
ISBN
ISRN
Serietitel och serienummerTitle of series, numbering
ISSN
Titel:
Title:
Forfattare:Author:
SammanfattningAbstract
NyckelordKeywords
The residual gas fraction is an important parameter to get good performancewith high efficiency and low emissions in the HCCI-engine.
The goal in this thesis is to formulate an algorithm for estimation of theresidual gas fraction based on the cylinder pressure. The estimation is improvedif also the exhaust gas temperature is used together with the cylinder pressure.
The formulated algorithm has then been tested on data from a single cylinderengine running in HCCI-mode during steady state conditions. An error of ±4%was noted compared with the residual gas fraction obtained from simulations.
The thesis also investigates the effects of some possible error sources.
Vehicular Systems
Dept. of Electrical Engineering May 26, 2003
LITH-ISY-EX-3441-2003
http://www.fs.isy.liu.se
May 26, 2003
Uppskattning av andelen residual gas i en HCCI-motormed hjalp av cylindertrycket
Estimation of the Residual Gas Fraction in an HCCI-engineusing Cylinder Pressure
Niklas Ivansson
××
HCCI-engine, Cylinder Pressure, Residual gas

Abstract and Acknowledgements i
Abstract
The residual gas fraction is an important parameter to get good performancewith high efficiency and low emissions in the HCCI-engine.
The goal in this thesis is to formulate an algorithm for estimation ofthe residual gas fraction based on the cylinder pressure. The estimationis improved if also the exhaust gas temperature is used together with thecylinder pressure.
The formulated algorithm has then been tested on data from a singlecylinder engine running in HCCI-mode during steady state conditions. Anerror of ±4% was noted compared with the residual gas fraction obtainedfrom simulations.
The thesis also investigates the effects of some possible error sources.
Keywords: HCCI-engine, Cylinder Pressure, Residual gas
Acknowledgments
This work have been done for DaimlerChrysler in Esslingen, Germany.I would like to thank everyone who has helped me during this work andmade my stay in Germany to a pleasant time.
Habo, May 2003
Niklas Ivansson
ii Notation
Notation
Symbols
θ Crank angleλ Normalized air/fuel ratiop PressureT TemperatureV VolumeA Aream MassB Cylinder borel Connecting rod lengtha Crank radiuscv Specific heat at constant volumecp Specific heat at constant pressureγ Ratio of specific heatsQLHV Lower heating valueηc Charge efficiencyCoC Completeness of CombustionQwall Heat losses to the wallQfuel Energy released by the fuelW Workn Engine speed
Abbreviations
EGR Exhaust Gas RecirculationTDC Top Dead CenterBDC Bottom Dead CenterHCCI Homogeneous Charge Compression IgnitionSI Spark IgnitionCI Compression IgnitionEVC Exhaust Valve Close
Contents iii
Contents
1 Introduction 11.1 Background . . . . . . . . . . . . . . . . . . . . . . . . . . . . 11.2 Methods . . . . . . . . . . . . . . . . . . . . . . . . . . . . . . 21.3 Thesis outline . . . . . . . . . . . . . . . . . . . . . . . . . . . 2
2 Engine 32.1 The Four Stroke Engine Cycle . . . . . . . . . . . . . . . . . . 32.2 The Diesel Engine . . . . . . . . . . . . . . . . . . . . . . . . 32.3 Air to fuel ratio, Lambda . . . . . . . . . . . . . . . . . . . . 32.4 First law of thermodynamics . . . . . . . . . . . . . . . . . . 42.5 Residual Gas . . . . . . . . . . . . . . . . . . . . . . . . . . . 5
3 HCCI-Engine 53.1 Valve timing . . . . . . . . . . . . . . . . . . . . . . . . . . . 6
4 Cylinder Pressure 64.1 Cycle to cycle variations . . . . . . . . . . . . . . . . . . . . . 74.2 Offset correction . . . . . . . . . . . . . . . . . . . . . . . . . 84.3 Mass fraction Burned . . . . . . . . . . . . . . . . . . . . . . 9
5 Algorithm 115.1 Pressure ratio . . . . . . . . . . . . . . . . . . . . . . . . . . . 115.2 Correction function . . . . . . . . . . . . . . . . . . . . . . . . 115.3 Charge efficiency . . . . . . . . . . . . . . . . . . . . . . . . . 125.4 Temperature and total mass in the cylinder . . . . . . . . . . 145.5 Iteration and constants . . . . . . . . . . . . . . . . . . . . . . 165.6 The Algorithm - Step by Step . . . . . . . . . . . . . . . . . . 175.7 Result . . . . . . . . . . . . . . . . . . . . . . . . . . . . . . . 175.8 Residual gas mass . . . . . . . . . . . . . . . . . . . . . . . . 185.9 Result with mrg . . . . . . . . . . . . . . . . . . . . . . . . . 205.10 Alternative formula . . . . . . . . . . . . . . . . . . . . . . . . 20
6 Sensitivity Analysis 216.1 Input parameters . . . . . . . . . . . . . . . . . . . . . . . . . 226.2 Approximations . . . . . . . . . . . . . . . . . . . . . . . . . . 23
7 Summary 257.1 Further investigations . . . . . . . . . . . . . . . . . . . . . . 26
iv List of Tables
References 27
Appendix A: Engine Data 28
Appendix B: Heat transfer 29
List of Figures
2.1 Volume vs Pressure in a conventional spark ignited engine ina log-log diagram . . . . . . . . . . . . . . . . . . . . . . . . . 4
3.1 Normalized valve lift for an SI-engine(a) and an HCCI-engine(b) 74.1 Crankangle vs Pressure (a) and Volume vs Pressure (b) . . . 84.2 Definition of the points used for mass fraction burned calcu-
lation . . . . . . . . . . . . . . . . . . . . . . . . . . . . . . . 104.3 Result of mass fraction burned calculation . . . . . . . . . . . 105.1 Definition of p1,p2 and ∆pcomb . . . . . . . . . . . . . . . . . 125.2 Correlation between ∆pcomb and Qfuel . . . . . . . . . . . . . 135.3 Flowchart over the algorithm . . . . . . . . . . . . . . . . . . 185.4 Result from the algorithm. . . . . . . . . . . . . . . . . . . . . 195.5 Flowchart over the algorithm with mrg . . . . . . . . . . . . . 205.6 Result from the algorithm with mrg . . . . . . . . . . . . . . 215.7 Result from the alternative formula . . . . . . . . . . . . . . . 22B.1 Comparison between (Qfuel −Qnetto) and the Approximation 30
List of Tables
5.1 The difference between mmin and mtot . . . . . . . . . . . . . 155.2 The dimensions of the HCCI-engine . . . . . . . . . . . . . . 186.1 Result of the sensitivity analysis . . . . . . . . . . . . . . . . 24A.1 Engine dimensions . . . . . . . . . . . . . . . . . . . . . . . . 28
1 Introduction 1
1 Introduction
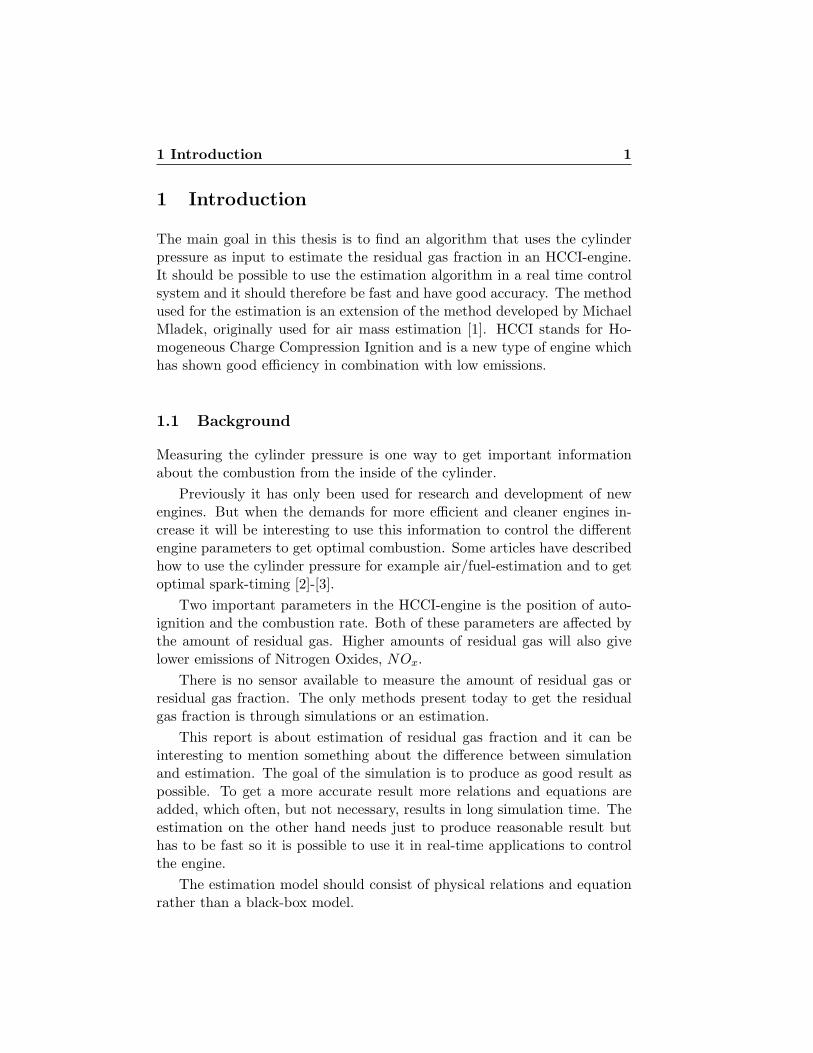
The main goal in this thesis is to find an algorithm that uses the cylinderpressure as input to estimate the residual gas fraction in an HCCI-engine.It should be possible to use the estimation algorithm in a real time controlsystem and it should therefore be fast and have good accuracy. The methodused for the estimation is an extension of the method developed by MichaelMladek, originally used for air mass estimation [1]. HCCI stands for Ho-mogeneous Charge Compression Ignition and is a new type of engine whichhas shown good efficiency in combination with low emissions.
1.1 Background
Measuring the cylinder pressure is one way to get important informationabout the combustion from the inside of the cylinder.
Previously it has only been used for research and development of newengines. But when the demands for more efficient and cleaner engines in-crease it will be interesting to use this information to control the differentengine parameters to get optimal combustion. Some articles have describedhow to use the cylinder pressure for example air/fuel-estimation and to getoptimal spark-timing [2]-[3].
Two important parameters in the HCCI-engine is the position of auto-ignition and the combustion rate. Both of these parameters are affected bythe amount of residual gas. Higher amounts of residual gas will also givelower emissions of Nitrogen Oxides, NOx.
There is no sensor available to measure the amount of residual gas orresidual gas fraction. The only methods present today to get the residualgas fraction is through simulations or an estimation.
This report is about estimation of residual gas fraction and it can beinteresting to mention something about the difference between simulationand estimation. The goal of the simulation is to produce as good result aspossible. To get a more accurate result more relations and equations areadded, which often, but not necessary, results in long simulation time. Theestimation on the other hand needs just to produce reasonable result buthas to be fast so it is possible to use it in real-time applications to controlthe engine.
The estimation model should consist of physical relations and equationrather than a black-box model.
2 1 Introduction
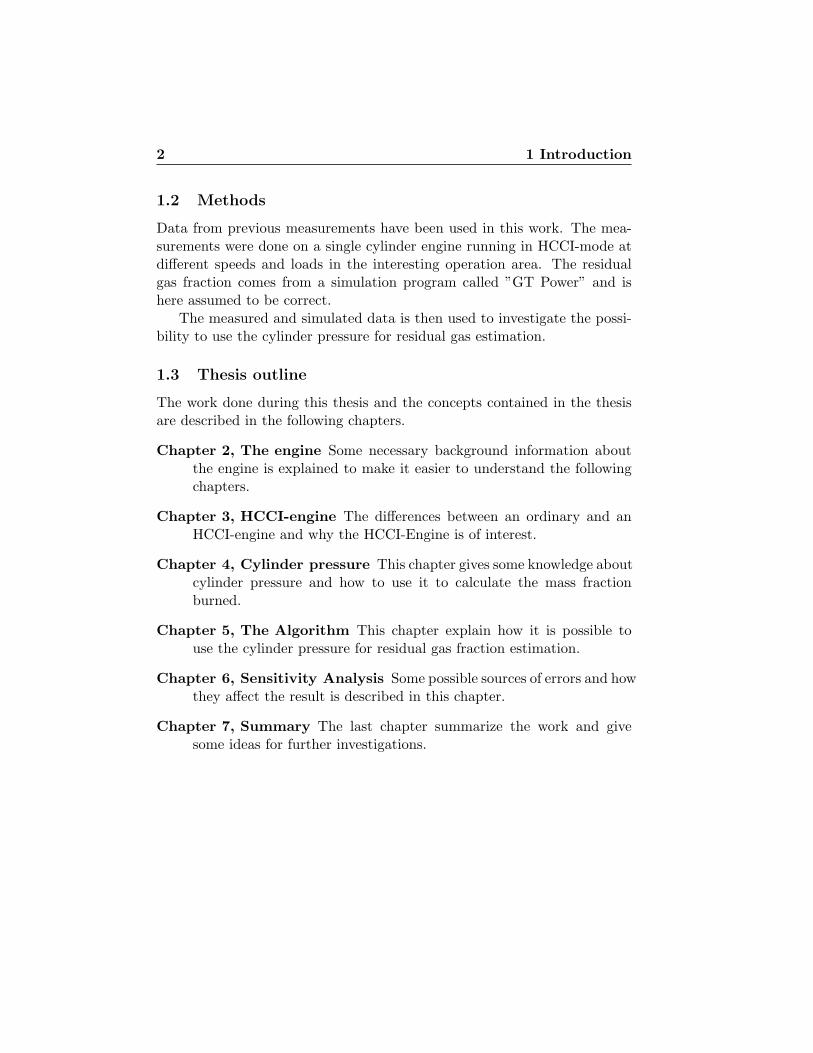
1.2 Methods
Data from previous measurements have been used in this work. The mea-surements were done on a single cylinder engine running in HCCI-mode atdifferent speeds and loads in the interesting operation area. The residualgas fraction comes from a simulation program called ”GT Power” and ishere assumed to be correct.
The measured and simulated data is then used to investigate the possi-bility to use the cylinder pressure for residual gas estimation.
1.3 Thesis outline
The work done during this thesis and the concepts contained in the thesisare described in the following chapters.
Chapter 2, The engine Some necessary background information aboutthe engine is explained to make it easier to understand the followingchapters.
Chapter 3, HCCI-engine The differences between an ordinary and anHCCI-engine and why the HCCI-Engine is of interest.
Chapter 4, Cylinder pressure This chapter gives some knowledge aboutcylinder pressure and how to use it to calculate the mass fractionburned.
Chapter 5, The Algorithm This chapter explain how it is possible touse the cylinder pressure for residual gas fraction estimation.
Chapter 6, Sensitivity Analysis Some possible sources of errors and howthey affect the result is described in this chapter.
Chapter 7, Summary The last chapter summarize the work and givesome ideas for further investigations.
2.3 Air to fuel ratio, Lambda 3
2 Engine
2.1 The Four Stroke Engine Cycle
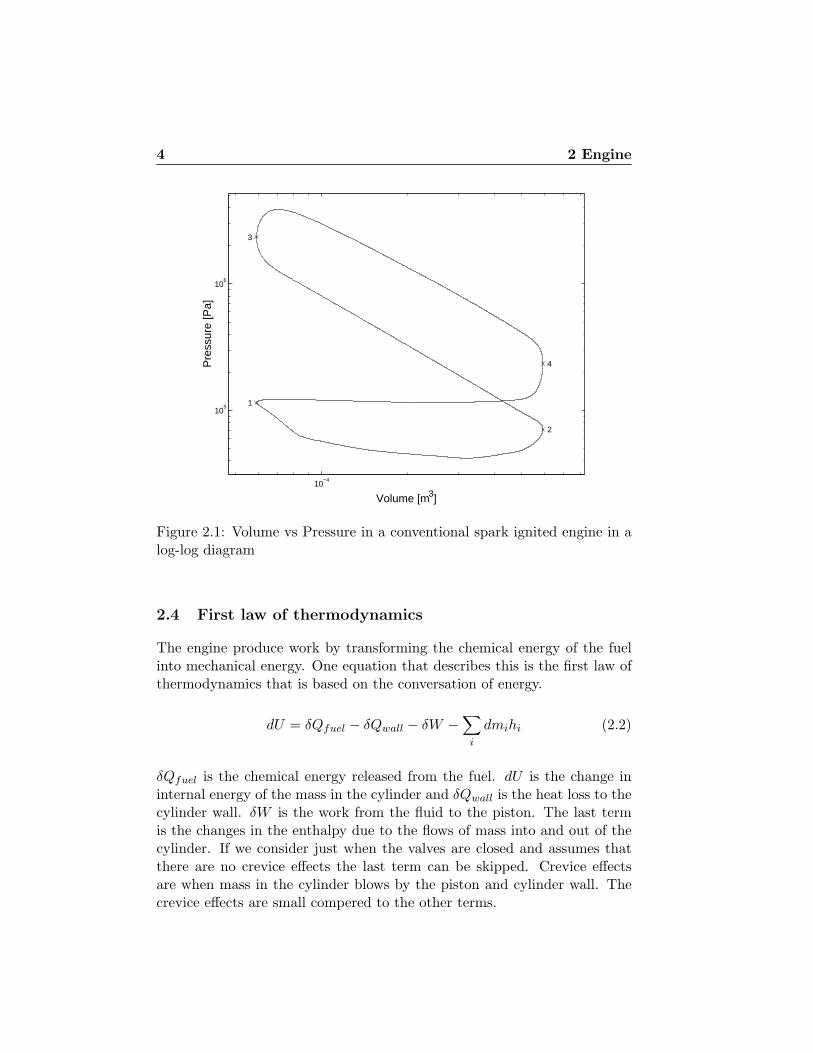
The normal gasoline engine used in modern cars is the four stroke Otto-engine. During one cycle the crank-shaft has two revolutions (720◦). Thedifferent strokes is shortly described below. The numbers 1-4 refers to thenumbers in the pressure-volume diagram, fig. 2.1.
Intake, TDC-BDC, 0-180◦, 1-2 The intake valve is open and the cylin-der is filled with new charge of fuel and air.
Compression, BDC-TDC, 180-360◦, 2-3 During the compression strokethe piston moves up and compress the charge. Shortly before the pis-ton reach the TDC (Top Dead Center) the spark plug ignites thecharge and the combustion starts.
Expansion,TDC-BDC,360-540◦, 3-4 During the combustion the gas ex-pands and pushes the piston down to BDC (Bottom Dead Center).
Exhaust, BDC-TDC, 540-720◦, 4-1 During the last stroke the exhaustvalve opens and the piston pushes the burned gases out of the cylinder.
The angles given here are valid for the ideal Otto cycle. The valves open atslightly different angles in a real engine. (See the section about valve timing3.1.)
2.2 The Diesel Engine
The Diesel engine or compression ignited (CI) engine has the same strokesas described above but there is some differences. During the intake strokeonly air is inducted to the cylinder. The air is then compressed and insteadof ignition by a spark, fuel is injected. The temperature of the compressedair is so high that the fuel ignites starts the combustion.
2.3 Air to fuel ratio, Lambda
The ratio between mass of air and mass of fuel which gives complete com-bustion without excess air is called the stoichiometry ratio, Lst. This ratiois about 14.7 for gasoline. The air/fuel ratio is often expressed using a rela-tive measure called lambda. Lambda is the ratio between the actual air/fuelratio divided with the stoichiometric ratio.
λ =mair/mfuel
Lst(2.1)
4 2 Engine
10−4
105
106
2
3
4
1
Volume [m3]
Pre
ssur
e [P
a]
Figure 2.1: Volume vs Pressure in a conventional spark ignited engine in alog-log diagram
2.4 First law of thermodynamics
The engine produce work by transforming the chemical energy of the fuelinto mechanical energy. One equation that describes this is the first law ofthermodynamics that is based on the conversation of energy.
dU = δQfuel − δQwall − δW −∑
i
dmihi (2.2)
δQfuel is the chemical energy released from the fuel. dU is the change ininternal energy of the mass in the cylinder and δQwall is the heat loss to thecylinder wall. δW is the work from the fluid to the piston. The last termis the changes in the enthalpy due to the flows of mass into and out of thecylinder. If we consider just when the valves are closed and assumes thatthere are no crevice effects the last term can be skipped. Crevice effectsare when mass in the cylinder blows by the piston and cylinder wall. Thecrevice effects are small compered to the other terms.
2.5 Residual Gas 5
2.5 Residual Gas
Residual gas is already burned gas from previous engine cycles that is leftin the cylinder. The main reason to use residual gas is to lower the amountof NOx that is formed. The temperature in the cylinder is so high thatthe nitrogen and oxygen in the air react and form NOx. By using residualgas the total mass in the cylinder is increased which means that also theheat capacity of the charge is increased. This results in lower maximumtemperature and in the end that less NOx is formed. There are two ways toincrease the amount of residual gas in the cylinder. Either through ExhaustGas Recycling, EGR, which is to lead back the exhaust gases to the cylinder,or to close the exhaust valve before all exhaust gas has left the cylinder. Thesecond alternative, when residual the residual gas stays in the cylinder, issometimes called internal EGR.
The amount of residual gas is often measured as a fraction of the totalmass and the definition of residual gas fraction is the ratio between the massof residual gas and the total mass:
xrg =mrg
mtot(2.3)
3 HCCI-Engine
Today the commonly used engines in modern cars today are either Spark-Ignited (SI) Otto-engines or Compression-Ignited (CI) Diesel-engines. Inthe spark ignited engine the fuel and air mixture is compressed and thecombustion starts when the spark-plug ignites the mixture. The flame thenpropagate through the cylinder to the cylinder walls. In the CI-engine onlyair is in the cylinder during the compression. The combustion starts whenthe fuel is injected to the cylinder. The late injection of the fuel in Diesel-engines makes the mixture inhomogeneous, which result in high emissionsof unburned particles, soot.
The higher demands for cleaner engines with lower fuel consumptiondrive the manufacturer to find alternatives. An alternative is the HCCI-engine, which has high efficiency and low emissions of NOx. The principleof the engine is something in between the SI and CI engine. The fuel and airare mixed together during the intake like in an SI-engine. The homogeneouscharge is then compressed and when the temperature is high enough thecharge auto-ignites. The temperature at the auto-ignition is about 1000K.
To reach this temperature there is need to increase the initial tempera-ture of the fuel and air. This is done by using residual gas which is warm
6 4 Cylinder Pressure
from previous cycles and already in the cylinder. The initial temperatureaffects the position of auto-ignition. By controlling the amount of residualgas, the temperature and position of auto-ignition can be controlled. Thelatter parameter is important to control for high efficiency.
Since the residual gas is already burned, it also slows down the com-bustion, which avoids problems with knock. If the combustion is too fast itcauses pressure oscillations which can damage the engine.
A third function of the residual gas is to lower the emission of NOx.The presence of residual gas increases the total mass of the cylinder charge,which results in increased heat capacity. This will lower the temperatureafter the combustion and a lower amount of NOx emissions is formed. Inan HCCI-engine the emissions are so low that no aftertreatment to reducethe NOx emissions is needed. In the HCCI-engine it is possible to have upto 80% residual gas compared to an SI-engine which can tolerate up to 20%residual gas.
The HCCI-engine has high efficiency during low load conditions com-pared to an ordinary SI-engine. And since the engine spends most of thetime in the car at low load conditions, it is also possible to reduce the fuelconsumption by using an HCCI-engine instead of the SI-engine.
3.1 Valve timing
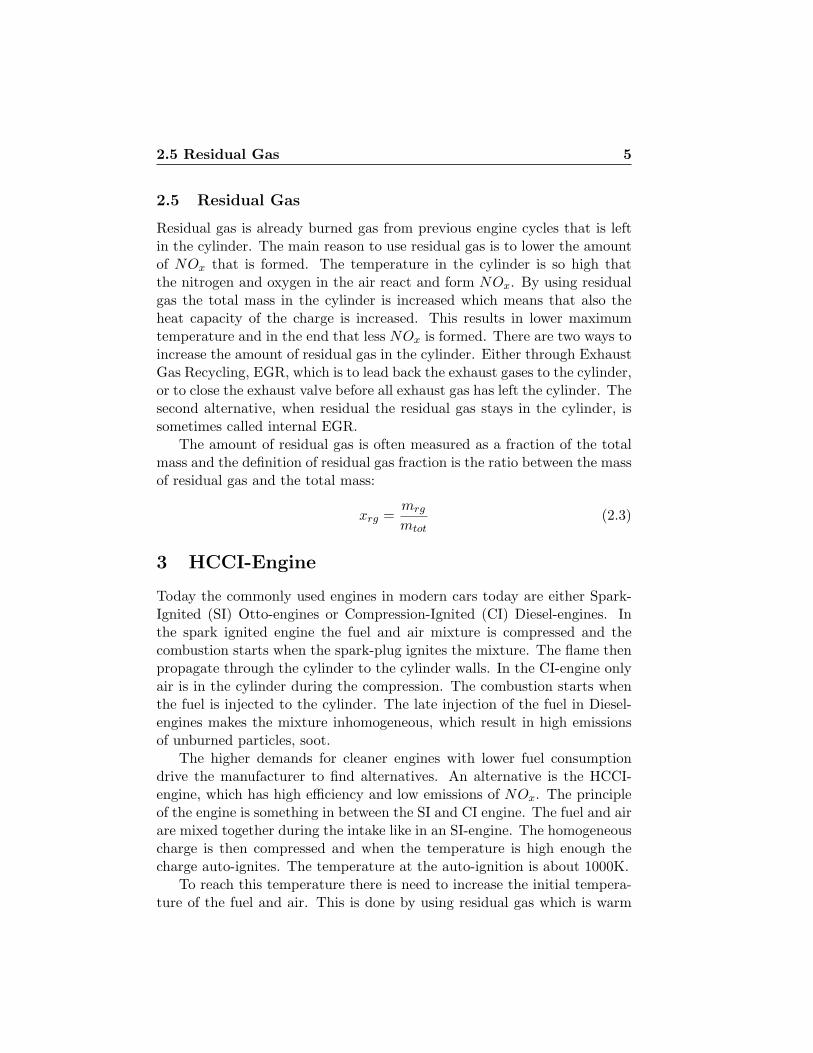
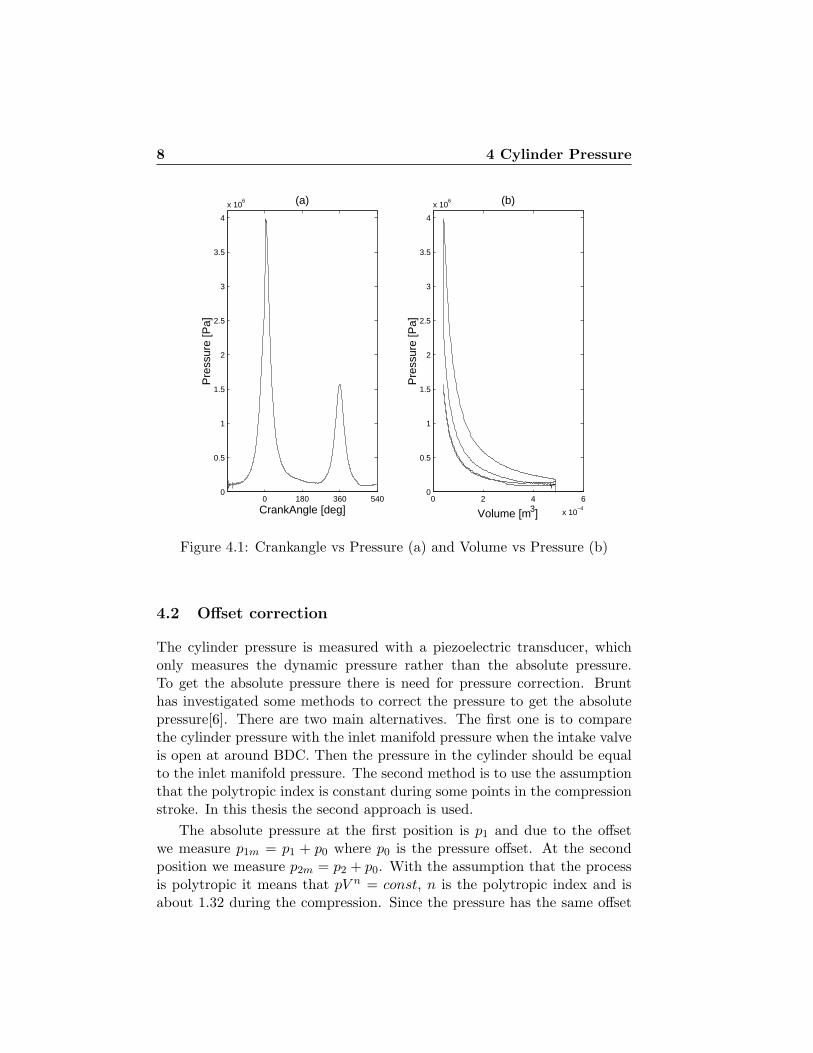
The valve timing for this HCCI-engine is used to control the amount ofresidual gas and it differs from an ordinary spark ignited engine. In anordinary engine the intake valve opens before the exhaust valve closes. Someof the exhaust gases will then flow back to the cylinder because the pressuredrop during the intake. This valve overlap, which can be seen in figure 3.1is an important factor that will affect the amount of residual gas in theSI-engine[4]. In the HCCI engine on the other hand the the exhaust valvecloses earlier and is totally closed before the intake valve opens. The reasonis to trap even more residual gas in the cylinder. This also the causes thesecond top seen in the pressure-crankangle diagram, fig. 4.1.
4 Cylinder Pressure
The cylinder pressure can give much information about the combustion pro-cess. Former the cylinder pressure has only been used as an important toolin research and development of new engines. But when the requirement ofbetter engine control increases it will also be interesting to use pressure sen-sors in production engines. Figure 4.1 shows a typical pressure vs crankangle
4.1 Cycle to cycle variations 7
0 180 360 540 7200
0.2
0.4
0.6
0.8
1
CrankAngle
Nor
mal
ized
val
ve li
ft(a)
ExhaustIntake
0 180 360 540 7200
0.2
0.4
0.6
0.8
1
CrankAngle
Nor
mal
ized
val
ve li
ft
(b)
ExhaustIntake
Figure 3.1: Normalized valve lift for an SI-engine(a) and an HCCI-engine(b)
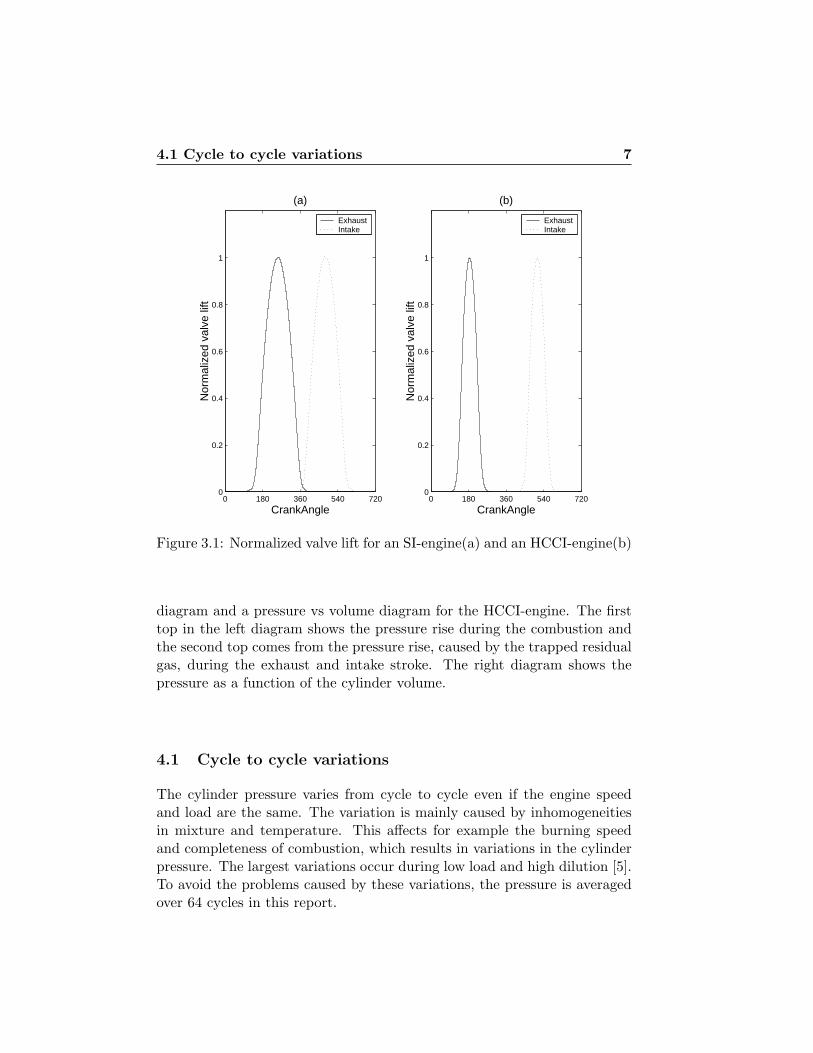
diagram and a pressure vs volume diagram for the HCCI-engine. The firsttop in the left diagram shows the pressure rise during the combustion andthe second top comes from the pressure rise, caused by the trapped residualgas, during the exhaust and intake stroke. The right diagram shows thepressure as a function of the cylinder volume.
4.1 Cycle to cycle variations
The cylinder pressure varies from cycle to cycle even if the engine speedand load are the same. The variation is mainly caused by inhomogeneitiesin mixture and temperature. This affects for example the burning speedand completeness of combustion, which results in variations in the cylinderpressure. The largest variations occur during low load and high dilution [5].To avoid the problems caused by these variations, the pressure is averagedover 64 cycles in this report.
8 4 Cylinder Pressure
0 180 360 5400
0.5
1
1.5
2
2.5
3
3.5
4
x 106 (a)
CrankAngle [deg]
Pre
ssur
e [P
a]
0 2 4 6
x 10−4
0
0.5
1
1.5
2
2.5
3
3.5
4
x 106 (b)
Volume [m3]
Pre
ssur
e [P
a]
Figure 4.1: Crankangle vs Pressure (a) and Volume vs Pressure (b)
4.2 Offset correction
The cylinder pressure is measured with a piezoelectric transducer, whichonly measures the dynamic pressure rather than the absolute pressure.To get the absolute pressure there is need for pressure correction. Brunthas investigated some methods to correct the pressure to get the absolutepressure[6]. There are two main alternatives. The first one is to comparethe cylinder pressure with the inlet manifold pressure when the intake valveis open at around BDC. Then the pressure in the cylinder should be equalto the inlet manifold pressure. The second method is to use the assumptionthat the polytropic index is constant during some points in the compressionstroke. In this thesis the second approach is used.
The absolute pressure at the first position is p1 and due to the offsetwe measure p1m = p1 + p0 where p0 is the pressure offset. At the secondposition we measure p2m = p2 + p0. With the assumption that the processis polytropic it means that pV n = const, n is the polytropic index and isabout 1.32 during the compression. Since the pressure has the same offset
4.3 Mass fraction Burned 9
at both positions it is then possible to calculate the offset[6].
(p1m + p0) V n1 = (p2m + p0) V n
2 (4.1)
p0 =p2m V n
2 − p1m V n1
V n1 − V n
2
(4.2)
4.3 Mass fraction Burned
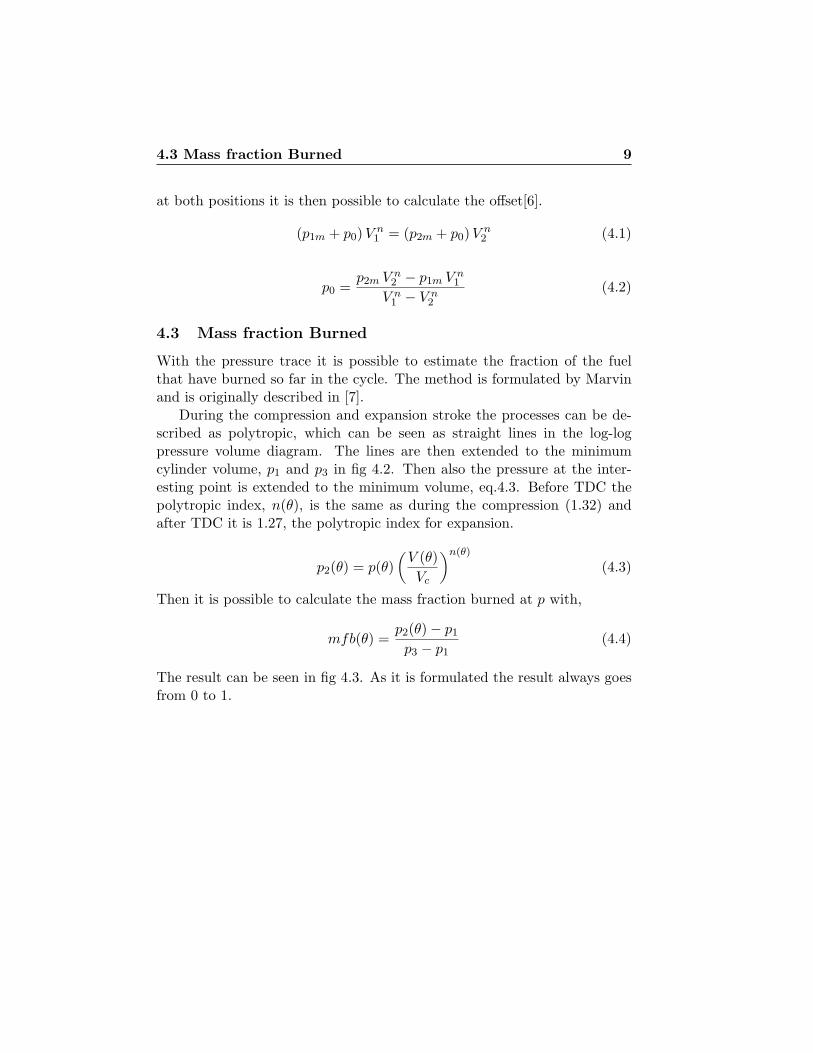
With the pressure trace it is possible to estimate the fraction of the fuelthat have burned so far in the cycle. The method is formulated by Marvinand is originally described in [7].
During the compression and expansion stroke the processes can be de-scribed as polytropic, which can be seen as straight lines in the log-logpressure volume diagram. The lines are then extended to the minimumcylinder volume, p1 and p3 in fig 4.2. Then also the pressure at the inter-esting point is extended to the minimum volume, eq.4.3. Before TDC thepolytropic index, n(θ), is the same as during the compression (1.32) andafter TDC it is 1.27, the polytropic index for expansion.
p2(θ) = p(θ)(
V (θ)Vc
)n(θ)
(4.3)
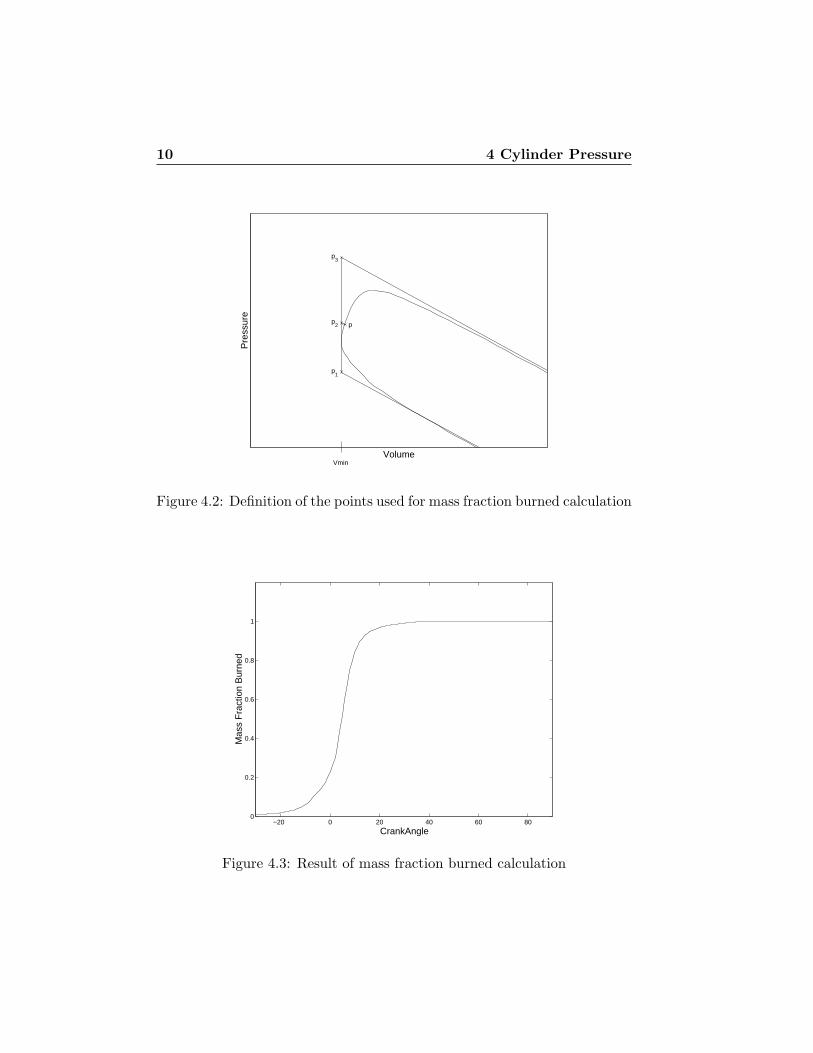
Then it is possible to calculate the mass fraction burned at p with,
mfb(θ) =p2(θ)− p1
p3 − p1(4.4)
The result can be seen in fig 4.3. As it is formulated the result always goesfrom 0 to 1.
10 4 Cylinder Pressure
p1
p3
p2 p
Volume
Pre
ssur
e
Vmin
Figure 4.2: Definition of the points used for mass fraction burned calculation
−20 0 20 40 60 800
0.2
0.4
0.6
0.8
1
CrankAngle
Mas
s F
ract
ion
Bur
ned
Figure 4.3: Result of mass fraction burned calculation
5.2 Correction function 11
5 Algorithm
This chapter will first describe the different parts of the algorithm and inthe end the whole algorithm is described step by step. The total mass inthe cylinder consists of fuel, air and residual gas.
mtot = mfuel + mair + mrg (5.1)
To estimate the residual gas fraction,(xrg), we are using the fact thatthe residual gas effects the total mass in the cylinder but do not take partin the combustion process. It works as dilution to the fuel in the same wayas the excessive air. It is possible to calculate the residual gas fraction if weknow the total mass and the amount of air and fuel in the cylinder. Thealgorithm should use the cylinder pressure as input.
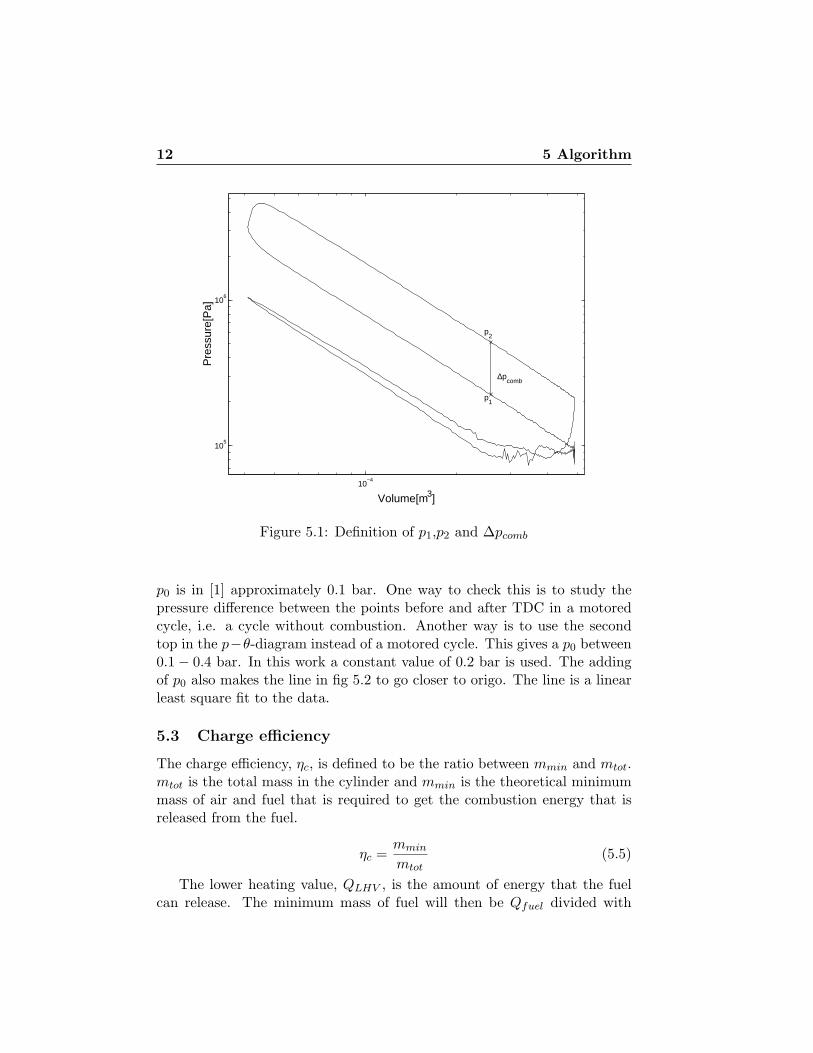
5.1 Pressure ratio
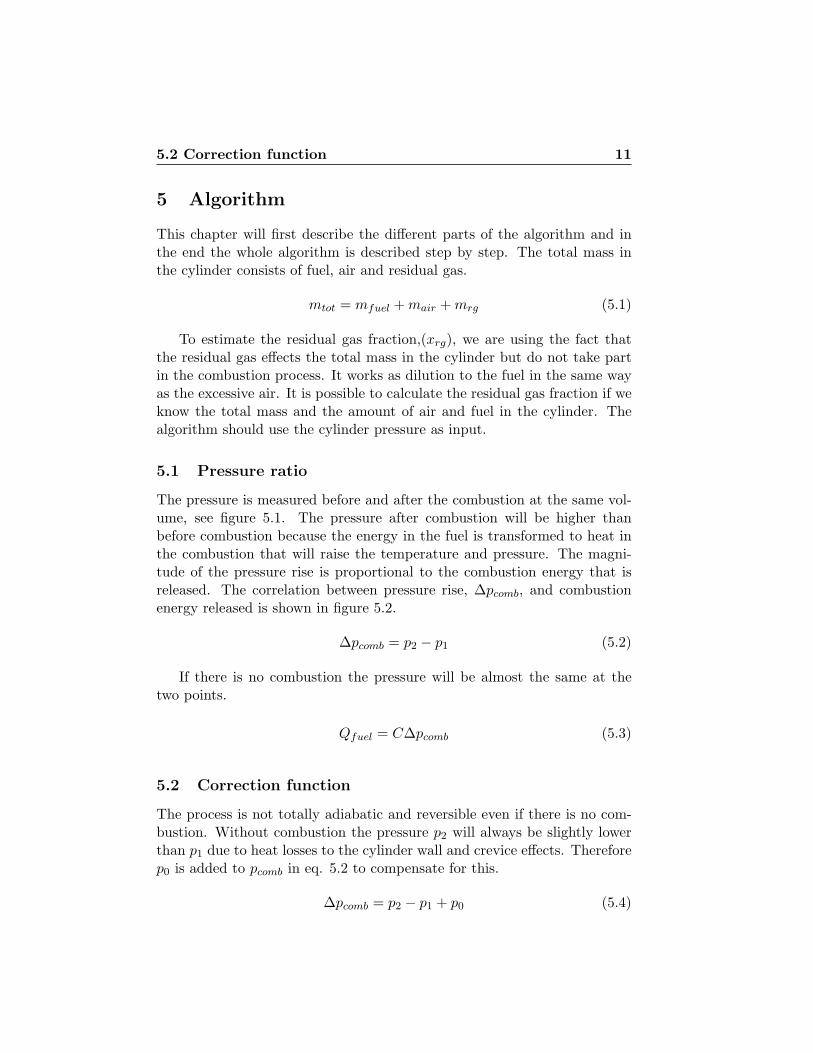
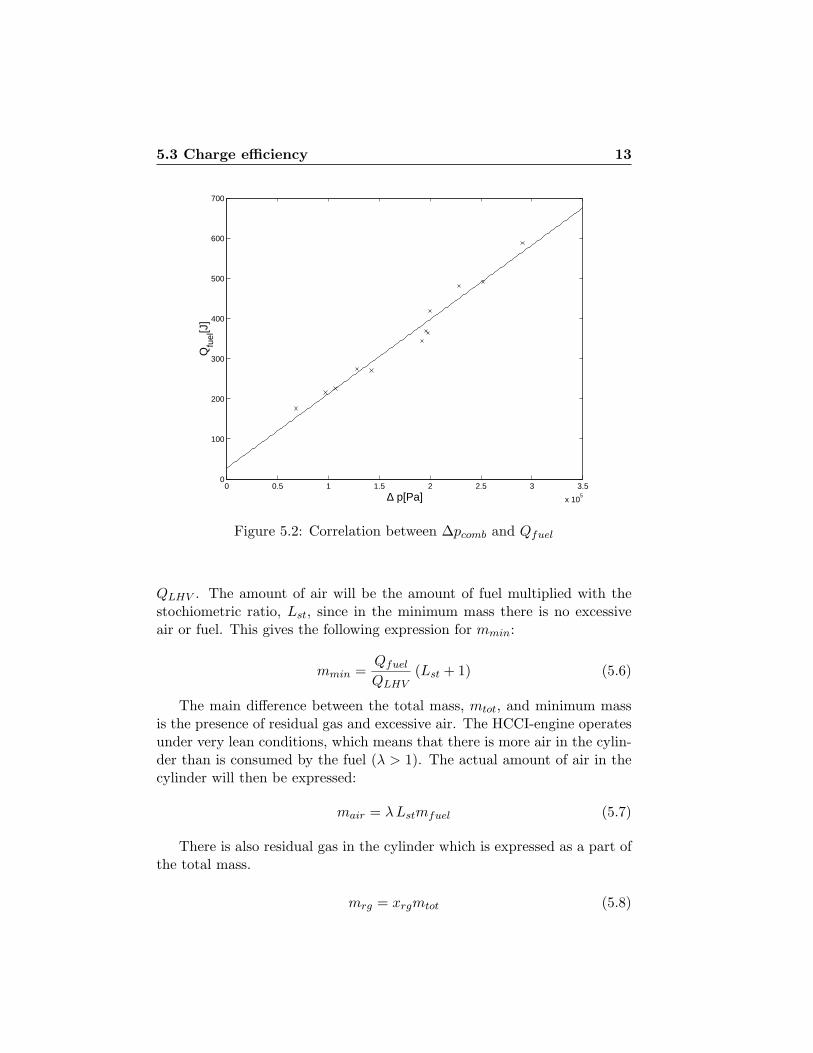
The pressure is measured before and after the combustion at the same vol-ume, see figure 5.1. The pressure after combustion will be higher thanbefore combustion because the energy in the fuel is transformed to heat inthe combustion that will raise the temperature and pressure. The magni-tude of the pressure rise is proportional to the combustion energy that isreleased. The correlation between pressure rise, ∆pcomb, and combustionenergy released is shown in figure 5.2.
∆pcomb = p2 − p1 (5.2)
If there is no combustion the pressure will be almost the same at thetwo points.
Qfuel = C∆pcomb (5.3)
5.2 Correction function
The process is not totally adiabatic and reversible even if there is no com-bustion. Without combustion the pressure p2 will always be slightly lowerthan p1 due to heat losses to the cylinder wall and crevice effects. Thereforep0 is added to pcomb in eq. 5.2 to compensate for this.
∆pcomb = p2 − p1 + p0 (5.4)
12 5 Algorithm
10−4
105
106
∆pcomb
p1
p2
Volume[m3]
Pre
ssur
e[P
a]
Figure 5.1: Definition of p1,p2 and ∆pcomb
p0 is in [1] approximately 0.1 bar. One way to check this is to study thepressure difference between the points before and after TDC in a motoredcycle, i.e. a cycle without combustion. Another way is to use the secondtop in the p−θ-diagram instead of a motored cycle. This gives a p0 between0.1− 0.4 bar. In this work a constant value of 0.2 bar is used. The addingof p0 also makes the line in fig 5.2 to go closer to origo. The line is a linearleast square fit to the data.
5.3 Charge efficiency
The charge efficiency, ηc, is defined to be the ratio between mmin and mtot.mtot is the total mass in the cylinder and mmin is the theoretical minimummass of air and fuel that is required to get the combustion energy that isreleased from the fuel.
ηc =mmin
mtot(5.5)
The lower heating value, QLHV , is the amount of energy that the fuelcan release. The minimum mass of fuel will then be Qfuel divided with
5.3 Charge efficiency 13
0 0.5 1 1.5 2 2.5 3 3.5
x 105
0
100
200
300
400
500
600
700
∆ p[Pa]
Qfu
el[J
]
Figure 5.2: Correlation between ∆pcomb and Qfuel
QLHV . The amount of air will be the amount of fuel multiplied with thestochiometric ratio, Lst, since in the minimum mass there is no excessiveair or fuel. This gives the following expression for mmin:
mmin =Qfuel
QLHV(Lst + 1) (5.6)
The main difference between the total mass, mtot, and minimum massis the presence of residual gas and excessive air. The HCCI-engine operatesunder very lean conditions, which means that there is more air in the cylin-der than is consumed by the fuel (λ > 1). The actual amount of air in thecylinder will then be expressed:
mair = λLstmfuel (5.7)
There is also residual gas in the cylinder which is expressed as a part ofthe total mass.
mrg = xrgmtot (5.8)
14 5 Algorithm
Another difference is that not all the fuel injected in the cylinder willburn. The amount that actually is burned is dependent of several param-eters. For example: The homogeneousness of the mixture, temperaturedifferences between the cylinder and cylinder wall and the magnitude of thecrevice flows. The amount of fuel in the minimum mass should be dividedwith the Completeness of Combustion, CoC.
mfuel =1
CoC
Qfuel
QLHV(5.9)
If the mixture is lean the Completeness of Combustion is high and about96-98% [8]. The completeness of combustion (CoC) will be more importantwhen single cycle data is treated. In this thesis it is handled as constant96%.
By combining eq. 5.7-5.9 we get the total mass:
mtot =1
1− xrg
(1
CoC
Qfuel
QLHV(λLst + 1)
)(5.10)
The differences between mmin and mtot are also summarized in table 5.1.If we put eq. 5.6 and 5.10 in the definition of charge efficiency we can
get the following expression for the residual gas fraction:
xrg = 1− ηc
CoC
(λLst + 1Lst + 1
)(5.11)
The Completeness of Combustion is set as a constant and lambda ismeasured with a lambda sensor. The cylinder pressure is used to estimatethe charge efficiency, ηc.
ηc =mmin
mtot=
C∆pcombp1V1
R1T1
= C ′ T1∆pcomb
p1(5.12)
The mmin is calculated with 5.3 and 5.6 and mtot is calculated withthe ideal gas law at 80◦BTDC. The gas constant, R1, and volume, V1 isincluded in a new constant, C ′. The only parameter still unknown is thetemperature, T1.
5.4 Temperature and total mass in the cylinder
By using the first law of thermodynamics it is possible to estimate thetemperature and total mass in the cylinder. The principle of the law isdescribed in 2.4. The internal energy difference between 80◦ BTDC and
5.4 Temperature and total mass in the cylinder 15
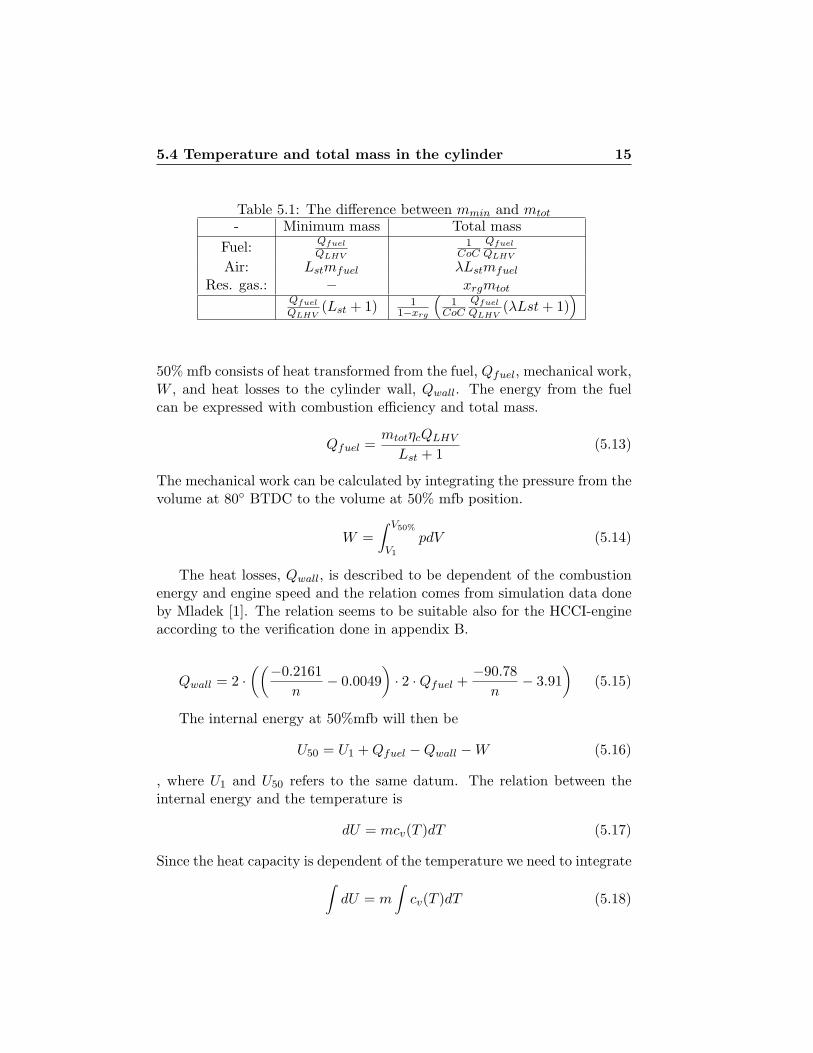
Table 5.1: The difference between mmin and mtot
- Minimum mass Total massFuel: Qfuel
QLHV
1CoC
Qfuel
QLHV
Air: Lstmfuel λLstmfuel
Res. gas.: − xrgmtotQfuel
QLHV(Lst + 1) 1
1−xrg
(1
CoCQfuel
QLHV(λLst + 1)
)
50% mfb consists of heat transformed from the fuel, Qfuel, mechanical work,W , and heat losses to the cylinder wall, Qwall. The energy from the fuelcan be expressed with combustion efficiency and total mass.
Qfuel =mtotηcQLHV
Lst + 1(5.13)
The mechanical work can be calculated by integrating the pressure from thevolume at 80◦ BTDC to the volume at 50% mfb position.
W =∫ V50%
V1
pdV (5.14)
The heat losses, Qwall, is described to be dependent of the combustionenergy and engine speed and the relation comes from simulation data doneby Mladek [1]. The relation seems to be suitable also for the HCCI-engineaccording to the verification done in appendix B.
Qwall = 2 ·((−0.2161
n− 0.0049
)· 2 ·Qfuel +
−90.78n
− 3.91)
(5.15)
The internal energy at 50%mfb will then be
U50 = U1 + Qfuel −Qwall −W (5.16)
, where U1 and U50 refers to the same datum. The relation between theinternal energy and the temperature is
dU = mcv(T )dT (5.17)
Since the heat capacity is dependent of the temperature we need to integrate∫
dU = m
∫cv(T )dT (5.18)
16 5 Algorithm
It can be rewritten to
U = mT1T
∫ T
0cv(T )dT (5.19)
If we set
cv =1T
∫ T
0cv(T )dT (5.20)
which then is estimated with a linear approximation. See the next section.Then the temperature can then be calculated.
T50 =U50
cv50 mtot(5.21)
5.5 Iteration and constants
The calculation of temperature and mass in the last section requires knowl-edge of the heat capacity, cv, and gas constant, R. These parameters arehowever dependent on the gas composition and cylinder temperature.
Since the calculation of the temperature and total mass requires theseparameters and the parameters are dependent on the temperature, the al-gorithm is iterated to achieve better result.
The gas constant is only dependent of the gas composition. Only withvery high temperatures there is a need to count for dissociation. Dissociationis the breakdown of molecules that can occur at high temperature. Forexample: carbondioxide breaks down to carbonmonoxide and oxygen. Theheat capacity is dependent of both the composition and the temperature.In this thesis the following linear approximations of cv are used[1].
cvrg50 = 0.2426T50 + 615.44[J/kgK] (5.22)
cvfg50 = 0.00482T50 + 738.4[J/kgK] (5.23)
cv50 = (1− xrg)cvfg + xrgcvrg (5.24)
The gas constants for the residual gas and the fresh charge are:
Rfg = 274[J/kgK] (5.25)
Rrg = 287[J/kgK] (5.26)
During the iterations the heat capacity and gas constant is updatedwhen a new T50 and xrg is estimated.
5.7 Result 17
5.6 The Algorithm - Step by Step
We now have all the equations to formulate the iterative algorithm. Anoverview over the algorithm can be seen in fig. 5.6.
Offset Correction Since the pressure sensors only are able to measurepressure changes, the first step in the algorithm will be to calculatethe absolute pressure. It is done with the method described in sec.4.2.
Mass fraction burned The algorithm uses the pressure at 50% mass frac-tion burned position so the next step is to find the that position withthe method described in sec.4.3
Pressure ratio and Mechanical work In the next step the pressure dif-ference between 80◦BTDC and 80◦ATDC is calculated. Also the me-chanical work from 80◦BTDC to 50% mass fraction burned positionis calculated.
First estimations T1 is set to 500K and a first estimation of total mass iscalculated with the ideal gas law and pressure at 80◦BTDC, (p1).
Charge efficiency and residual gas fraction The pressure ratio is usedto estimate the charge efficiency. It is also compensated as describedin the section about correction function 5.2. A first estimation of theresidual gas fraction is also made.
First law of thermodynamics The mechanical work, estimated Qfuel,Qwall together with the first law of thermodynamics are used to calcu-late the internal energy. The internal energy is then used to calculatea new total mass.
Iterative loop The calculation of total mass and temperature requiresknowledge of heat capacity and gas constant. These are then de-pendent on the gas composition and temperature. Therefore is thealgorithm iterated until the temperature stabilizes.
5.7 Result
The algorithm is tested on a single cylinder engine with the dimensionspresented in table 5.2. The test is done during steady state conditions at
18 5 Algorithm
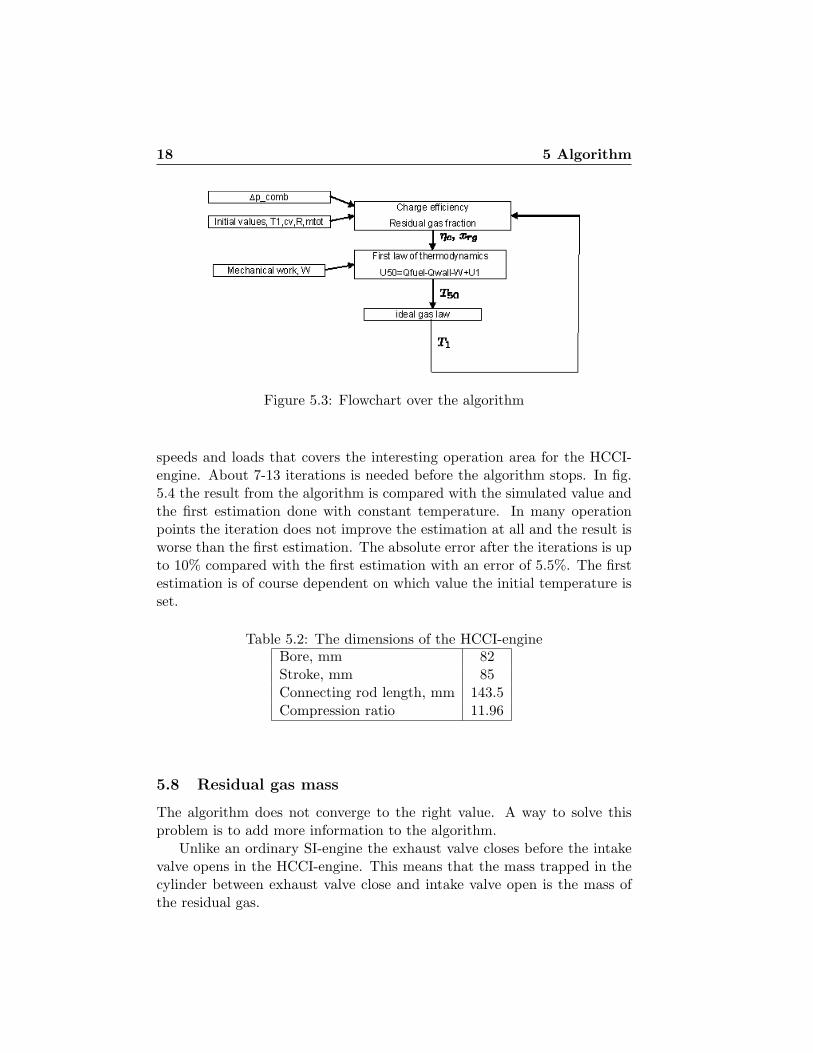
Figure 5.3: Flowchart over the algorithm
speeds and loads that covers the interesting operation area for the HCCI-engine. About 7-13 iterations is needed before the algorithm stops. In fig.5.4 the result from the algorithm is compared with the simulated value andthe first estimation done with constant temperature. In many operationpoints the iteration does not improve the estimation at all and the result isworse than the first estimation. The absolute error after the iterations is upto 10% compared with the first estimation with an error of 5.5%. The firstestimation is of course dependent on which value the initial temperature isset.
Table 5.2: The dimensions of the HCCI-engineBore, mm 82Stroke, mm 85Connecting rod length, mm 143.5Compression ratio 11.96
5.8 Residual gas mass
The algorithm does not converge to the right value. A way to solve thisproblem is to add more information to the algorithm.
Unlike an ordinary SI-engine the exhaust valve closes before the intakevalve opens in the HCCI-engine. This means that the mass trapped in thecylinder between exhaust valve close and intake valve open is the mass ofthe residual gas.
5.8 Residual gas mass 19
0 2 4 6 8 10 12
Operation point
Res
idua
l gas
frac
tion[
%]
Simulated valueFirst estimationAfter iterations
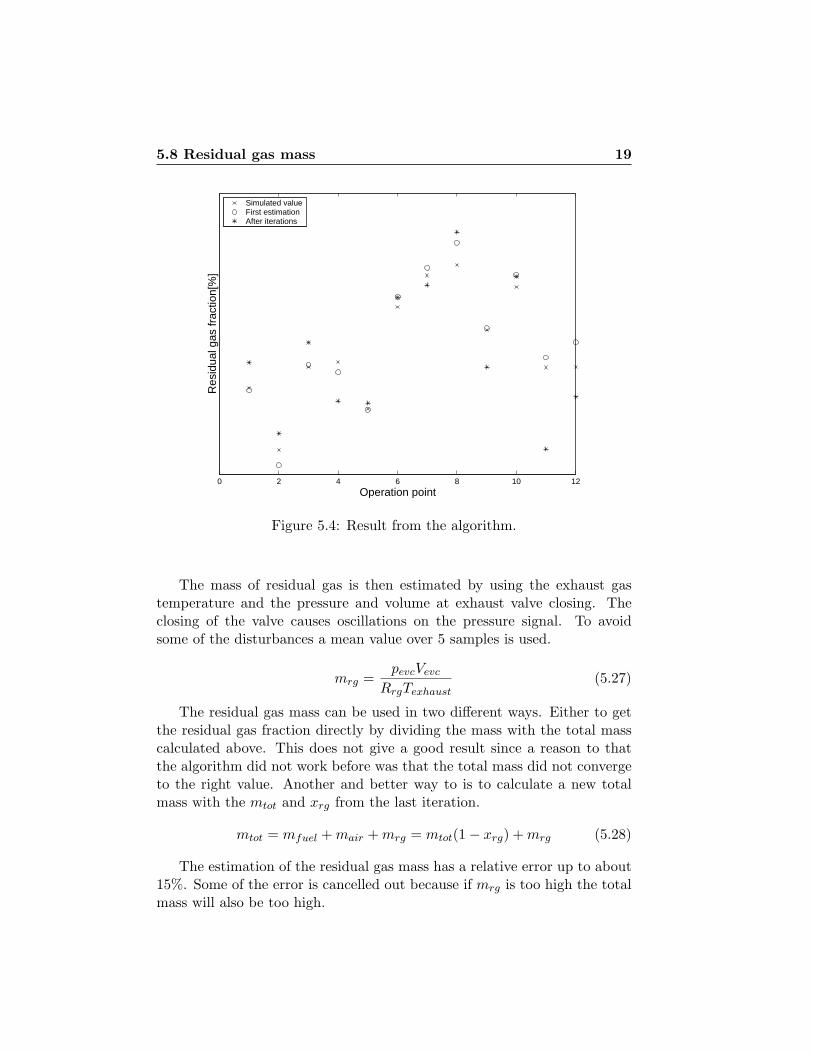
Figure 5.4: Result from the algorithm.
The mass of residual gas is then estimated by using the exhaust gastemperature and the pressure and volume at exhaust valve closing. Theclosing of the valve causes oscillations on the pressure signal. To avoidsome of the disturbances a mean value over 5 samples is used.
mrg =pevcVevc
RrgTexhaust(5.27)
The residual gas mass can be used in two different ways. Either to getthe residual gas fraction directly by dividing the mass with the total masscalculated above. This does not give a good result since a reason to thatthe algorithm did not work before was that the total mass did not convergeto the right value. Another and better way to is to calculate a new totalmass with the mtot and xrg from the last iteration.
mtot = mfuel + mair + mrg = mtot(1− xrg) + mrg (5.28)
The estimation of the residual gas mass has a relative error up to about15%. Some of the error is cancelled out because if mrg is too high the totalmass will also be too high.
20 5 Algorithm
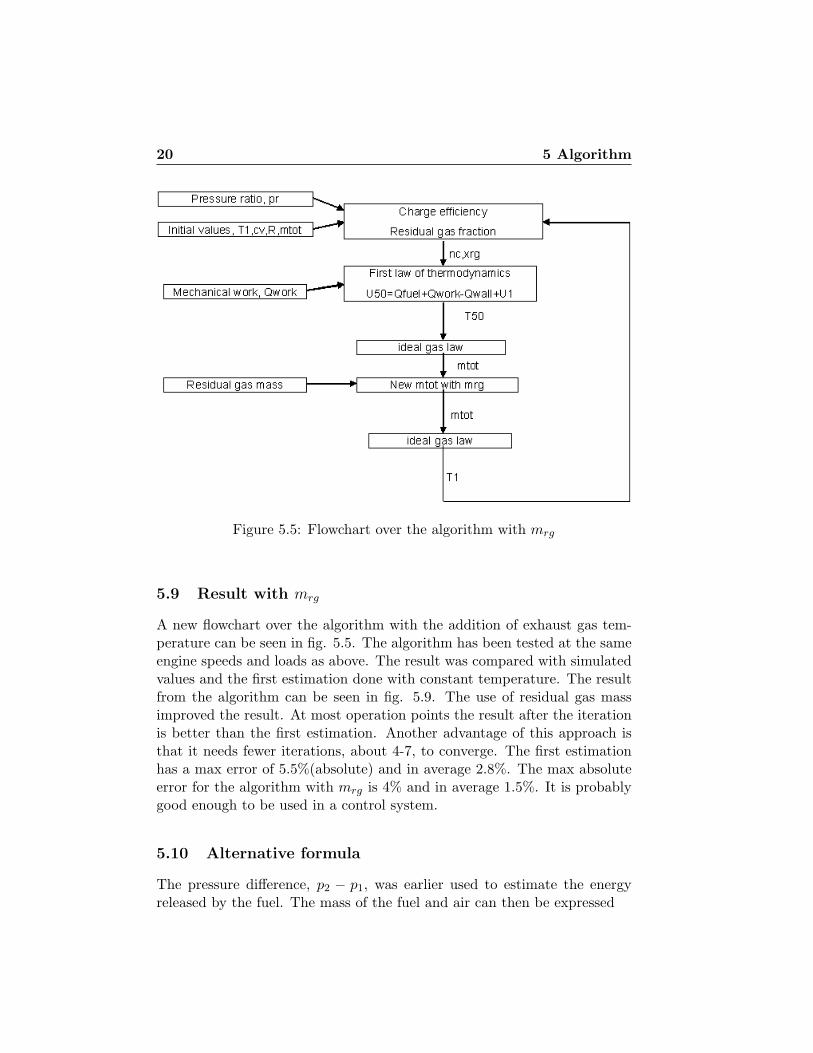
Figure 5.5: Flowchart over the algorithm with mrg
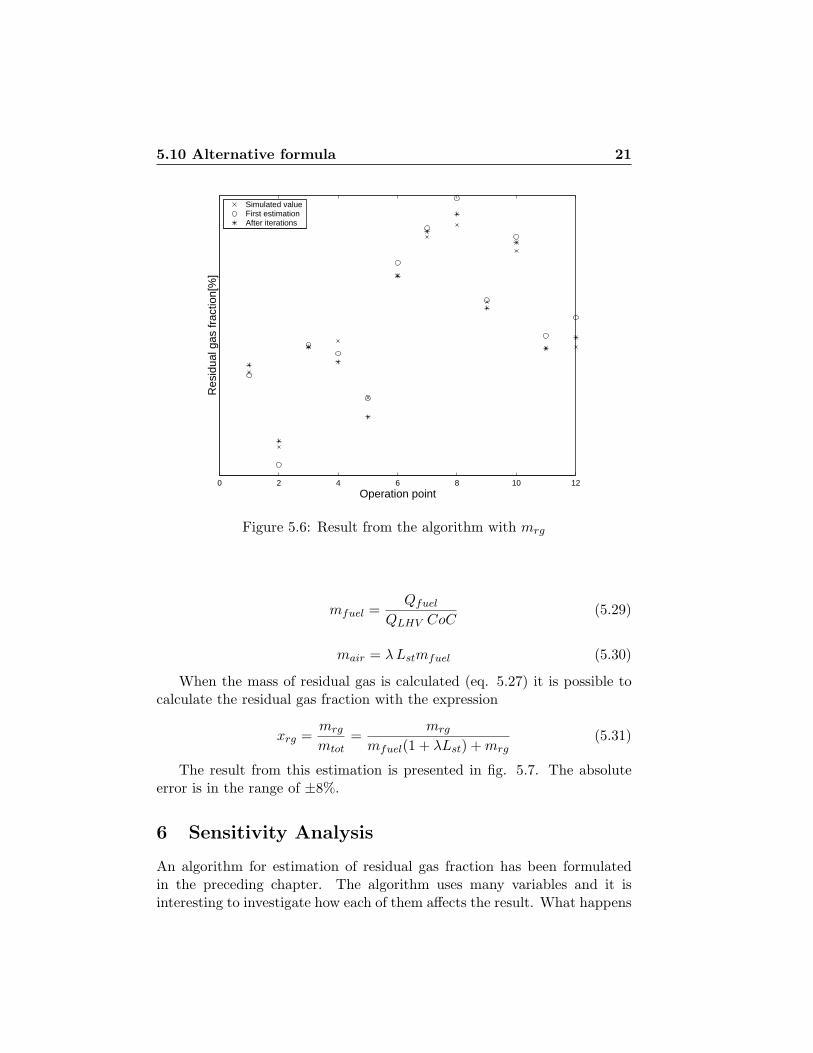
5.9 Result with mrg
A new flowchart over the algorithm with the addition of exhaust gas tem-perature can be seen in fig. 5.5. The algorithm has been tested at the sameengine speeds and loads as above. The result was compared with simulatedvalues and the first estimation done with constant temperature. The resultfrom the algorithm can be seen in fig. 5.9. The use of residual gas massimproved the result. At most operation points the result after the iterationis better than the first estimation. Another advantage of this approach isthat it needs fewer iterations, about 4-7, to converge. The first estimationhas a max error of 5.5%(absolute) and in average 2.8%. The max absoluteerror for the algorithm with mrg is 4% and in average 1.5%. It is probablygood enough to be used in a control system.
5.10 Alternative formula
The pressure difference, p2 − p1, was earlier used to estimate the energyreleased by the fuel. The mass of the fuel and air can then be expressed
5.10 Alternative formula 21
0 2 4 6 8 10 12
Operation point
Res
idua
l gas
frac
tion[
%]
Simulated valueFirst estimationAfter iterations
Figure 5.6: Result from the algorithm with mrg
mfuel =Qfuel
QLHV CoC(5.29)
mair = λLstmfuel (5.30)
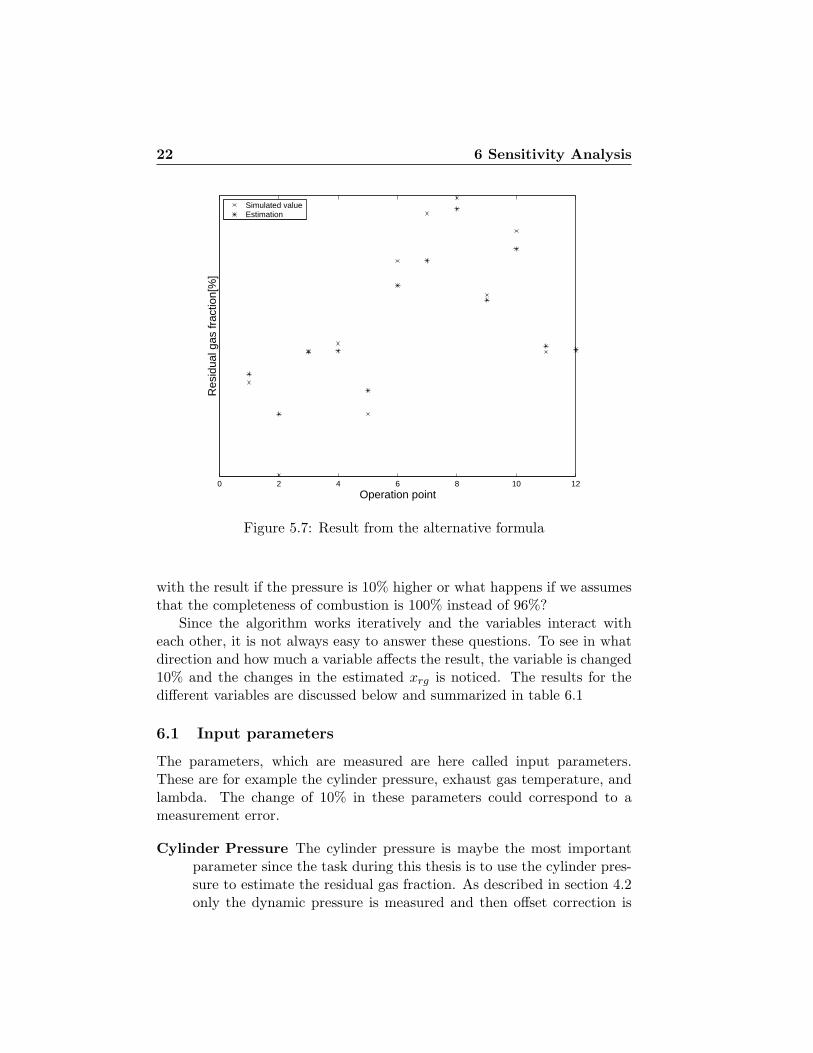
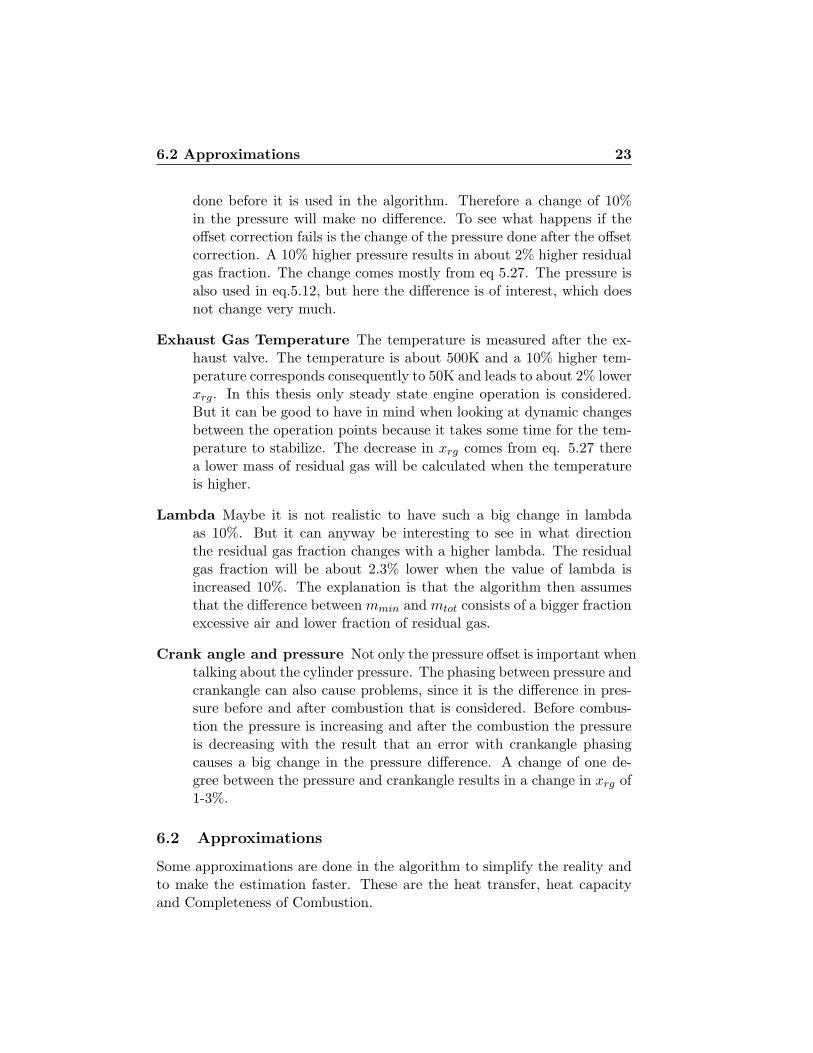
When the mass of residual gas is calculated (eq. 5.27) it is possible tocalculate the residual gas fraction with the expression
xrg =mrg
mtot=
mrg
mfuel(1 + λLst) + mrg(5.31)
The result from this estimation is presented in fig. 5.7. The absoluteerror is in the range of ±8%.
6 Sensitivity Analysis
An algorithm for estimation of residual gas fraction has been formulatedin the preceding chapter. The algorithm uses many variables and it isinteresting to investigate how each of them affects the result. What happens
22 6 Sensitivity Analysis
0 2 4 6 8 10 12
Operation point
Res
idua
l gas
frac
tion[
%]
Simulated valueEstimation
Figure 5.7: Result from the alternative formula
with the result if the pressure is 10% higher or what happens if we assumesthat the completeness of combustion is 100% instead of 96%?
Since the algorithm works iteratively and the variables interact witheach other, it is not always easy to answer these questions. To see in whatdirection and how much a variable affects the result, the variable is changed10% and the changes in the estimated xrg is noticed. The results for thedifferent variables are discussed below and summarized in table 6.1
6.1 Input parameters
The parameters, which are measured are here called input parameters.These are for example the cylinder pressure, exhaust gas temperature, andlambda. The change of 10% in these parameters could correspond to ameasurement error.
Cylinder Pressure The cylinder pressure is maybe the most importantparameter since the task during this thesis is to use the cylinder pres-sure to estimate the residual gas fraction. As described in section 4.2only the dynamic pressure is measured and then offset correction is
6.2 Approximations 23
done before it is used in the algorithm. Therefore a change of 10%in the pressure will make no difference. To see what happens if theoffset correction fails is the change of the pressure done after the offsetcorrection. A 10% higher pressure results in about 2% higher residualgas fraction. The change comes mostly from eq 5.27. The pressure isalso used in eq.5.12, but here the difference is of interest, which doesnot change very much.
Exhaust Gas Temperature The temperature is measured after the ex-haust valve. The temperature is about 500K and a 10% higher tem-perature corresponds consequently to 50K and leads to about 2% lowerxrg. In this thesis only steady state engine operation is considered.But it can be good to have in mind when looking at dynamic changesbetween the operation points because it takes some time for the tem-perature to stabilize. The decrease in xrg comes from eq. 5.27 therea lower mass of residual gas will be calculated when the temperatureis higher.
Lambda Maybe it is not realistic to have such a big change in lambdaas 10%. But it can anyway be interesting to see in what directionthe residual gas fraction changes with a higher lambda. The residualgas fraction will be about 2.3% lower when the value of lambda isincreased 10%. The explanation is that the algorithm then assumesthat the difference between mmin and mtot consists of a bigger fractionexcessive air and lower fraction of residual gas.
Crank angle and pressure Not only the pressure offset is important whentalking about the cylinder pressure. The phasing between pressure andcrankangle can also cause problems, since it is the difference in pres-sure before and after combustion that is considered. Before combus-tion the pressure is increasing and after the combustion the pressureis decreasing with the result that an error with crankangle phasingcauses a big change in the pressure difference. A change of one de-gree between the pressure and crankangle results in a change in xrg of1-3%.
6.2 Approximations
Some approximations are done in the algorithm to simplify the reality andto make the estimation faster. These are the heat transfer, heat capacityand Completeness of Combustion.
24 6 Sensitivity Analysis
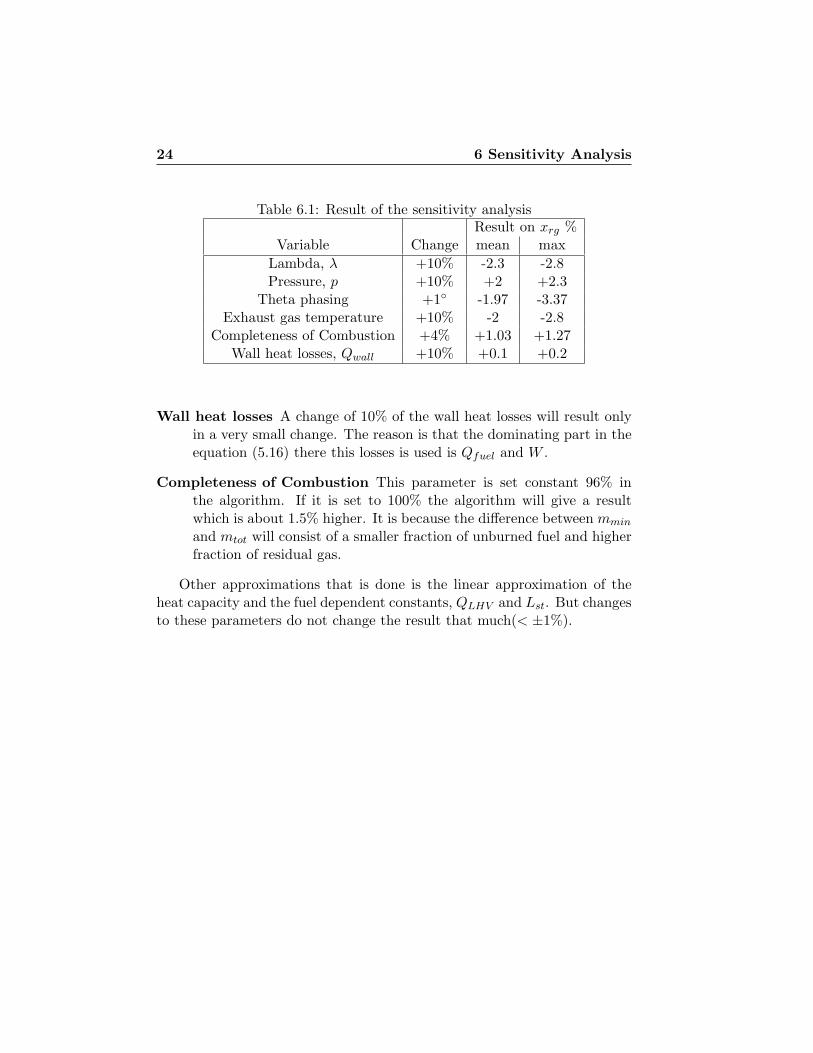
Table 6.1: Result of the sensitivity analysisResult on xrg %
Variable Change mean maxLambda, λ +10% -2.3 -2.8Pressure, p +10% +2 +2.3
Theta phasing +1◦ -1.97 -3.37Exhaust gas temperature +10% -2 -2.8
Completeness of Combustion +4% +1.03 +1.27Wall heat losses, Qwall +10% +0.1 +0.2
Wall heat losses A change of 10% of the wall heat losses will result onlyin a very small change. The reason is that the dominating part in theequation (5.16) there this losses is used is Qfuel and W .
Completeness of Combustion This parameter is set constant 96% inthe algorithm. If it is set to 100% the algorithm will give a resultwhich is about 1.5% higher. It is because the difference between mmin
and mtot will consist of a smaller fraction of unburned fuel and higherfraction of residual gas.
Other approximations that is done is the linear approximation of theheat capacity and the fuel dependent constants, QLHV and Lst. But changesto these parameters do not change the result that much(< ±1%).
6.2 Approximations 25
7 Summary
The HCCI-engine is a new kind of engine where the charge is homogenouslymixed during the intake and then compressed to auto-ignition. The enginehas shown high efficiency in combination with low emissions. But to achievethis there is need to control the position of auto-ignition and the combustionspeed. Both of these parameters are affected by the residual gas fraction.The residual gas is already burned gas left in the cylinder from previousengine cycles. In this report an algorithm for estimating the residual gasfraction with the cylinder pressure has been formulated. By measuring thecylinder pressure information is obtained about the combustion from theinside of the cylinder.
The residual gas fraction can be calculated from knowledge about theamount of fuel, air and the total mass in the cylinder. The pressure dif-ference between a point before and another point after the combustion cor-relates well with the energy released by the fuel, which gives the amountof fuel in the cylinder. The amount of air is then related to the fuel vialambda.
The total mass is related to the cylinder pressure via the ideal gas law.But it requires knowledge about the temperature in the cylinder. An at-tempt was made to use the first thermodynamic law together with a simpleapproximation of the wall heat losses to determine the temperature. Sincethe temperature is dependent of the mass, iterations between ideal gas lawand first law of thermodynamics were done. The iterations converged butto wrong temperature with the result that it did not improve the result.A constant cylinder temperature at a certain point produces better result.The reason to the iteration to fail is probably that the input, the pressurein this case, does not contain enough information or that the used model offirst thermodynamic law is too simple.
To improve the total mass estimation the exhaust gas temperature wasintroduced. The result was much better. Probably because the algorithmgets more information.
Since there is no method available to measure the residual gas fractionthe result from the algorithm was compared with simulated values. Differentengine speed and load is used and an error of ±4% was noted compared withthe simulated value. A problem due is that same data has been used bothto develop the algorithm as to test it. This will probably result in a poorerresult with other data. Further testes have to take place before the marginof error can be determined.
The influence of changes in the parameters has also been investigated.
26 7 Summary
The most parameters, if changed individually, only change the result witha few percent. But if several parameters are changed at the same time itmay cause a big errors in the result.
The algorithm is not mathematical complex and it requires only a smallnumber of iterations to converge when the exhaust temperature was used.Therefore is it possible to assume that there are no problems to imple-ment and get it running in a car. An implementation of the algorithm alsorequires, besides the pressure sensors, the exhaust gas temperature to bemeasured or estimated in some way. There is of course need for calibrationof the algorithm for every new kind of engine.
7.1 Further investigations
Dynamic estimation In this work only steady state behavior have beenstudied. It needs to be further investigated if there is possible to usesame approach when the engine is changing between the operationpoints.
Multi cylinder A data used in this thesis comes from a single cylinderengine. A multi cylinder engine will be more complicated since therecan be difference in temperature between the different cylinders. Thismay also affect the exhaust gas temperature and cause disturbance onthe algorithm used here.
References 27
References
[1] Michael Mladek. Cylinder Pressure for Control Purposes of Spark Igni-tion Engines. PhD thesis, ETH, 2003.
[2] Makoto Kawai Isao Fujii, Sizuo Yagi and Haruhiko Yoshikawa. Mbtcontrol utilizing crank angle of maximum combusiton pressure. SAEpaper No. 890759, 1989.
[3] Eric H. Gassenfeit j.David Powell. Algorithms for air-fuel ratio estima-tion using internal combustion engine cylinder pressure. SAE paper No.890300, 1989.
[4] John B. Heywood Jonathan W. Fox, Wai K. Cheng. A model for pre-dicting residual gas fraction in spark-ignition engines. SAE paper No.931025, 1993.
[5] Valeri Golovitchev Roy Ogink. Gasoline hcci modeling: An engine cyclesimulation code with a multi-zone combustion model. SAE paper No.2002-01-1745, 2002.
[6] Christopher R. Pond Michael F. J. Brunt. Evaluation of techniques forabsolute cylinder pressure correction. SAE paper No. 970030, 1997.
[7] C. F. Marvin. Combustion time in the engine cylinder and its effects onengine performence. NACA Tech Report 276, 1927.
[8] John B. Heywood. Internal Combustion Engine Fundamentals. Auto-motive Technology Series. McGraw-Hill, 1988.
[9] E. N. Balles K. M. Chun F.E. Nelson J. A. Ekchian J. B. HeywoodJ. A. Gatowski. Heat release analysis of engine pressure data. SAEpaper No. 841359, 1984.
28 Appendix A: Engine Data
Appendix A: Engine Data
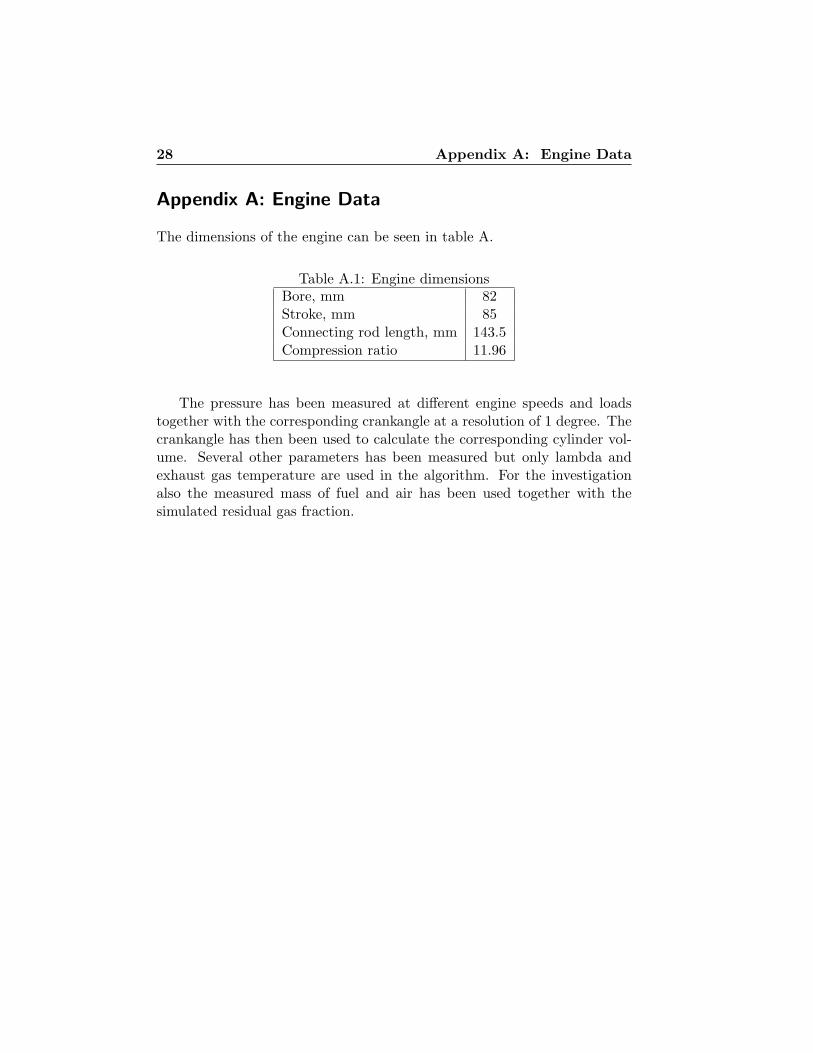
The dimensions of the engine can be seen in table A.
Table A.1: Engine dimensionsBore, mm 82Stroke, mm 85Connecting rod length, mm 143.5Compression ratio 11.96
The pressure has been measured at different engine speeds and loadstogether with the corresponding crankangle at a resolution of 1 degree. Thecrankangle has then been used to calculate the corresponding cylinder vol-ume. Several other parameters has been measured but only lambda andexhaust gas temperature are used in the algorithm. For the investigationalso the measured mass of fuel and air has been used together with thesimulated residual gas fraction.
Appendix B: Heat transfer 29
Appendix B: Heat transfer
The first law of thermodynamics
dU = δQfuel − δQwall − δW −∑
i
dmihi (B.1)
δQfuel is the chemical energy that is released from the fuel. dU is the changein internal energy of the mass in the cylinder and δQwall is the heat losses tothe cylinder wall. W is the work from the fluid to the piston. The last termis the changes in the enthalpy due to the flows of mass into and out from thecylinder. If we consider just when the valves are closed and assumes thatthere are no crevice effects the last term can be skipped. Crevice effectsare when mass in the cylinder blows by the piston and cylinder wall. Thecrevice effects are small compered to the other terms.
The internal energy can be expressed:
dU = mcvdT (B.2)
and with the ideal gas law it is possible to rewrite it as
dU = mcv d
(pV
mR
)= mcv
(V
mRdp +
p
mRdV
)(B.3)
,since there is no change in the mass.δW is as before
δW = pdV (B.4)
The relations between heat capacity, gas constant and γ are:
γ =cp
cv(B.5)
R = cp − cv (B.6)
Equation B.1 can then be written
Qwall = Qfuel −∫ θ50
θ1
(1
γ − 1V
dp
dθ+
γ
γ − 1pdV
dθ
)dθ (B.7)
Qfuel is calculated with the lower heating value, QLHV and CoC hereset to 98%.
Qfuel = 0.98 mfuelQLHV (B.8)
30 Appendix B: Heat transfer
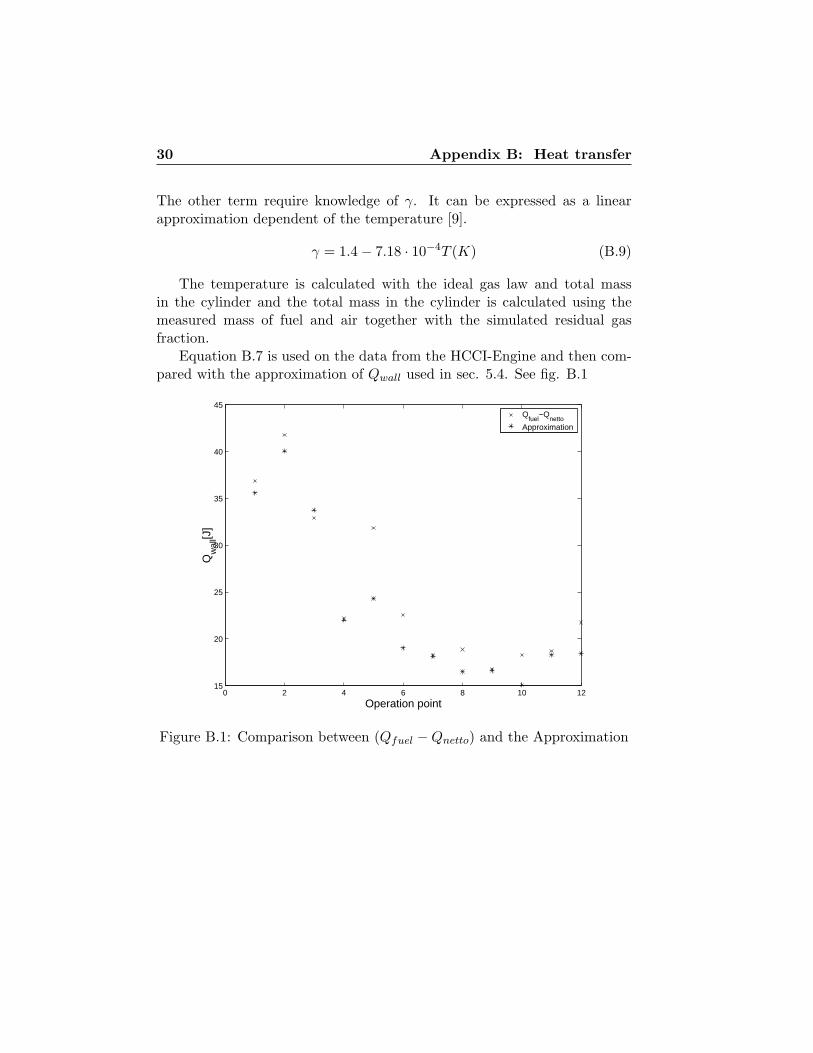
The other term require knowledge of γ. It can be expressed as a linearapproximation dependent of the temperature [9].
γ = 1.4− 7.18 · 10−4T (K) (B.9)
The temperature is calculated with the ideal gas law and total massin the cylinder and the total mass in the cylinder is calculated using themeasured mass of fuel and air together with the simulated residual gasfraction.
Equation B.7 is used on the data from the HCCI-Engine and then com-pared with the approximation of Qwall used in sec. 5.4. See fig. B.1
0 2 4 6 8 10 1215
20
25
30
35
40
45
Operation point
Qw
all[J
]
Qfuel
−Qnetto
Approximation
Figure B.1: Comparison between (Qfuel −Qnetto) and the Approximation