Embed Size (px)
Citation preview
Bulletin of the Marine Geology, Vol. 35, No. 2, December 2020, pp. 65 to 78
65
Estuary Changes of Cipunagara and Cimanuk River Using Landsat Imagery Spatial Analysis
Perubahan Muara Sungai Cipunagara dan Cimanuk melalui Analisis Spasial Citra Satelit Landsat
Wawan Hendriawan Nur, Marfasran Hendrizan, Ayu Utami Nurhidayati, Ahmad Fauzi Ismayanto
Research Center for Geotechnology – LIPI, Indonesia, Komplek LIPI, Jl. Sangkuriang Bandung, 40135
Corresponding author: [email protected]
(Received 24 September 2020; in revised form 28 September 2020; accepted 17 November 2020)
ABSTRACT: The north coastal Java located in the West Java, especially in Cirebon, Indramayu, andSubang, occurs loss and forming new land by abrasion and accretion processes. Observation using satelliteimagery can be used as an initial stage to determine the distribution of abrasion and accretion around thenorth coastal area. Observation of land changes was assigned using Landsat imagery from 1978 to 2020. Theresult shows that inland change was controlled by abrasion and accretion. It is occurred in Indramayu andSubang, especially in several areas around large rivers e.g. Cipunegara and Cimanuk Rivers. Estuary changesin the Cipunegara and Cimanuk Rivers were controlled by the high flux sediment deposition of the rivermouths affecting the new land forming due to the accretion process. Monitoring through Landsat satelliteimagery on the Cipunagara River from 1978 to 2020 shows that there was 205 Ha of new land. Remotesensing analysis in the Cimanuk River area shows that the estuary line from 1978 to 2020 experiencedaccretion or new land forming for 629 Ha.
Keywords: North coastal Java, accretion, Landsat, river estuary analysis, Cipunegara River, Cimanuk River
ABSTRAK : Kawasan pantai utara Jawa di Jawa Barat, khususnya daerah Cirebon, Indramayu, dan Subang,memiliki permasalahan hilang atau terbentuknya daratan baru melalui proses abrasi dan akresi. Pengamatanmengunakan citra dapat dijadikan tahapan awal untuk mengetahui sebaran abrasi dan akresi di sekitar wilayahpantai utara. Observasi perubahan daratan dilakukan dengan menggunakan citra landsat tahun 1978 dan 2020.Hasilnya memperlihatkan bahwa telah terjadi perubahan daratan, baik proses abrasi maupun akresi, di beberapawilayah di sekitar muara-muara sungai besar seperti Sungai Cipunegara dan Sungai Cimanuk. Perubahan muaraSungai Cipunegara dan Sungai Cimanuk lebih disebabkan oleh tingginya pengendapan sedimen pada muara sungaitersebut dan membentuk lahan baru karena proses akresi. Pemantauan melalui citra satelit di Sungai Cipunagaradata citra tahun 1978 sampai 2020 memperlihatkan penambahan lahan baru sebanyak 205 H. Analisis remotesensing citra di wilayah Sungai Cimanuk terlihat garis muara pantai pada tahun 1978 hingga tahun 2020 mengalamiakresi atau penambahan lahan baru 629 H.
Kata Kunci: Pantai utara Jawa, akresi, Landsat, analisis muara sungai, Sungai Cipunegara, Sungai Cimanuk
INTRODUCTIONEstuary is the area where rivers meet the sea and
have an important role in sediment budgets, salinity,sediment transport, currents, and delta reservations(Yadav et al., 2019). The estuary is formed by thesediment discharge that carried by the river as sedimenttransport and deposited into the estuary (Yadav et al.,2019). Sediment is an important factor for marinechanges controlled by grain size, sediment supply, andprevailing flow conditions (Hendrizan et al., 2020;2017; Nitsche et al., 2007). In addition, Sediment is
important for climate and ocean study in geologicaltimescales (Hendrizan et al., 2017; Liu et al., 2020;Praptisih and Cahyarini, 2016). Increasingsedimentation rate in river estuary or prograding of riverestuary/coastline known as accretion. It is an importantissue in Indonesia's current studies (Achiari et al., 2019;Pamungkas and Saraswati, 2020). The addition of newland areas due to accretion in the North Coastal Javaincluding Cimanuk River area was utilized specificallyfor agriculture since 2014-2018 (Pamungkas andSaraswati, 2020). Asides, problems related to the
Contributorship:All authors have a similar contribution as the main contributor to the article.
66 Wawan Hendriawan Nur, et al.
coastline also occur due to infrastructure developments,fisheries, and tourism, which affected the environmentin the coastal areas (Cahyarini, 2011; Pranoto, 2010).Therefore, it is necessary to study further to reconstructthe new regions formed due to the accretion process.
The north coastal Java in the West Java is aresearch area with several river estuaries, including theCipunegara River in Subang and the estuary ofCimanuk River. The accretion on Indramayu, in theCimanuk River delta is prograding (Prawiradisastra,2003; Astjario and Astawa, 2007) and has highsedimentation activity (Hehanusa et al., 1975).Measurement of the sedimentation rate in the CimanukRiver Delta based on current time-series, coastline, andthe distance from the delta to the north coastlines. Itindicates that the Cimanuk River Delta produces asedimentation rate of 200 meters/year (Hehanusa et al.,1975).
Thick clay sediment resulted from drillingsamples and geophysical records show that theCimanuk Delta produces a minimum sludge of 53.6million tonnes/year (Astjario and Astawa 2007). Highsedimentation rate in the Cimanuk River area led tounderstand the accretion possibilities in several riverestuaries on the northern coastal Java besides TheCimanuk River Delta. This study aims to determine
changes in the Cipunegara and Cimanuk River estuariesfrom satellite imagery analysis. The research area islocated in the delta of the north coastal Java, includingthe Cipunagara River Delta in Patimban Village,Pusakanagara Sub-District, and Subang. Meanwhile,the Cimanuk River Delta is located in IndramayuDistrict, which borders Subang District in the west,Cirebon District in the east, and Majalengka District inthe south.
Geological Setting
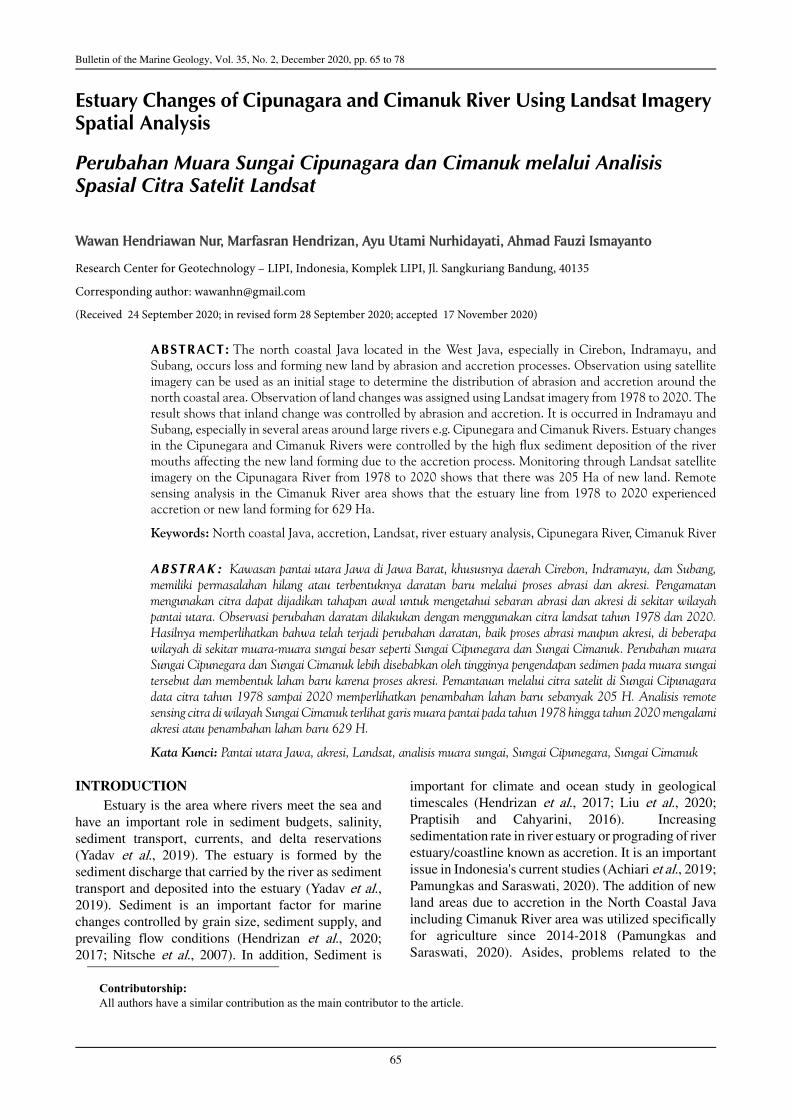
North Coastal Java from Subang to Cirebon(Figure 1) consists of several rock units, i.e alluvium,coastal deposit, deltaic deposit, and flood plain deposit(Abidin and Sutrisno, 1992; Achdan and Sudana, 1992;Silitonga et al., 1996). Alluvium spreads largely aroundCirebon and Indramayu, characterized by gravel, sand,and clay with gray color. The Alluvium is depositedalong a flood plain with less than 5 meters depth.Coastal deposit is deposited around Cirebon andIndramayu, characterized by swamp deposit, silt, andclay containing mollusk shells and coral. Deltaicdeposit formed in the area that contain clay, silt, andhumus. Flood plain deposit consist of tuffaceous clay,silt, and fine sand.
Figure 1. Geological map in the coastal of North Java from Subang to Cirebon (Abidin and Sutrisno, 1992; Achdanand Sudana, 1992; Silitonga et al., 1996)
Estuary Changes of Cipunagara and Cimanuk River Using Landsat Imagery Spatial Analysis 67
Topography on the north coastal of Java isrelatively low slope to flat that resulted in the coastalplain. In several areas, there were formed swamp,mangrove, and beach sand. Several factors influence thecharacteristics of the coast, including sediment type(Pradiwisastra, 2003). In general, the coastcharacteristics are influenced by the type of materialcarried by the river and deposited on the coast.Therefore, the beach elements are strongly influencedby the length of the river and the catchment area.
Cimanuk River is created bysmaller tributary, including CipelasRiver, Cilutung River, and CikeruhRiver. The upstream of Cimanuk Riveris located in Garut. The upstream ofCipelas River is in Sumedang. Theupstream area of Cilutung River is inKuningan, which originated fromCiremai Mountain's slope. Meanwhilethe upstream area of Cikeruh River is inMajalengka. The three tributaries of theCimanuk River flow in the youngvolcanic regions of the Quaternarydeposit (Ratman and Gafoer, 1998).Delta of Cimanuk River Delta is dividedinto two parts in the east and the west.The east coast is in the Indramayu district, and the westcoast is in the Krangkeng sub-district. The east coastarea experienced abrasion that covered ??958 ha area(Prawiradisastra, 2003). One of the region that affectedby abrasion is the Tirtamaya beach. The west coast areaexperienced abrasion that covered ??953 ha area(Prawiradisastra, 2003). Asides, the accretion alsooccurs around the Cimanuk River's mouth, whichaffected the sedimentation rate of 75m / year. Theaccretion is controlled by the growth of the newCimanuk delta, deforestation, and the decompactionprocess from the quaternary sediment (Prawiadisastra,2003).
Moreover, the influence of the climate changeassociated with sea level rise in Eretan, Losarang, andIndramayu regions also play a role in accretionaryactivities around the northern coast of Java (Rimbaman,1992). Sediment core data of shallow sediment drillingin the area obtained sediment deposit of 10 meters thick.It is estimated to decrease 6,000 years in the last sea-level rise (Rimbaman, 1992). Eretan, Losarang, andIndramayu regions show a progressive change situationfrom 1946 to 1978 (Rimbaman, 1992; Astjario andAstawa, 2007). Progradation occurs along 1 km in theeast Eretan region, developing Cimanuk Delta along 7km and shoreline abrasion along 0.5 km in the Eretanregion (Astjario and Astawa, 2007).
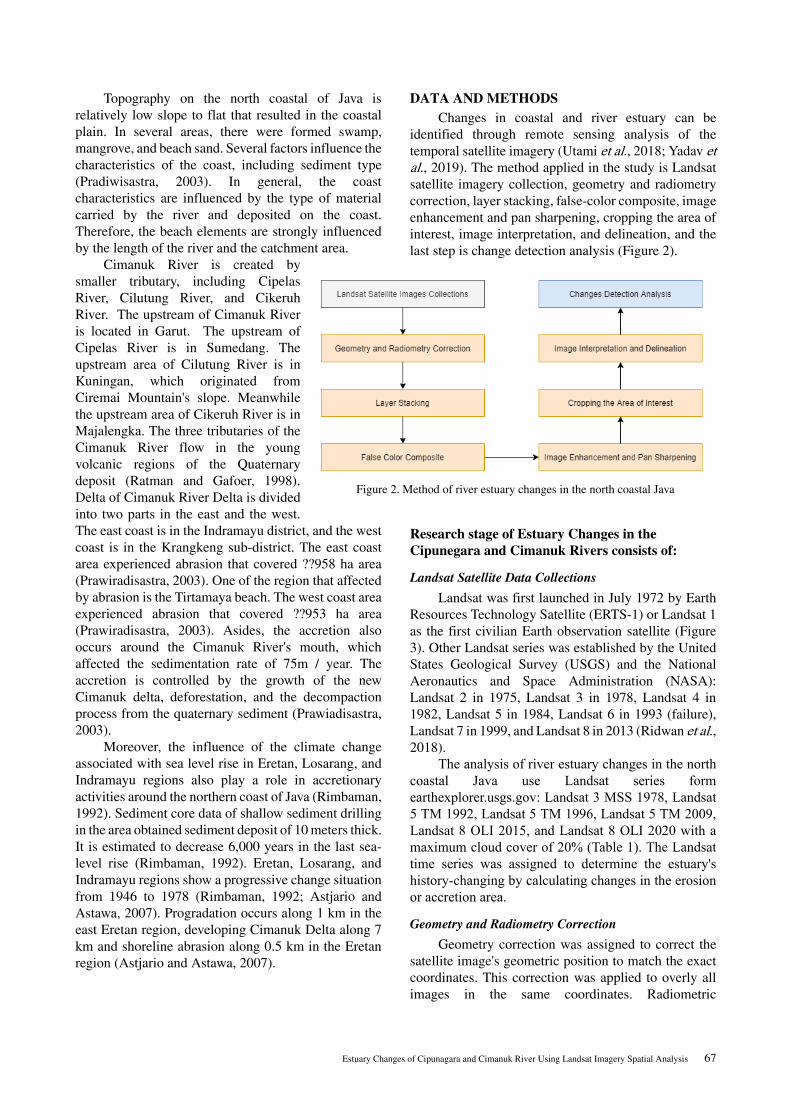
DATA AND METHODSChanges in coastal and river estuary can be
identified through remote sensing analysis of thetemporal satellite imagery (Utami et al., 2018; Yadav etal., 2019). The method applied in the study is Landsatsatellite imagery collection, geometry and radiometrycorrection, layer stacking, false-color composite, imageenhancement and pan sharpening, cropping the area ofinterest, image interpretation, and delineation, and thelast step is change detection analysis (Figure 2).
Research stage of Estuary Changes in the Cipunegara and Cimanuk Rivers consists of:
Landsat Satellite Data Collections
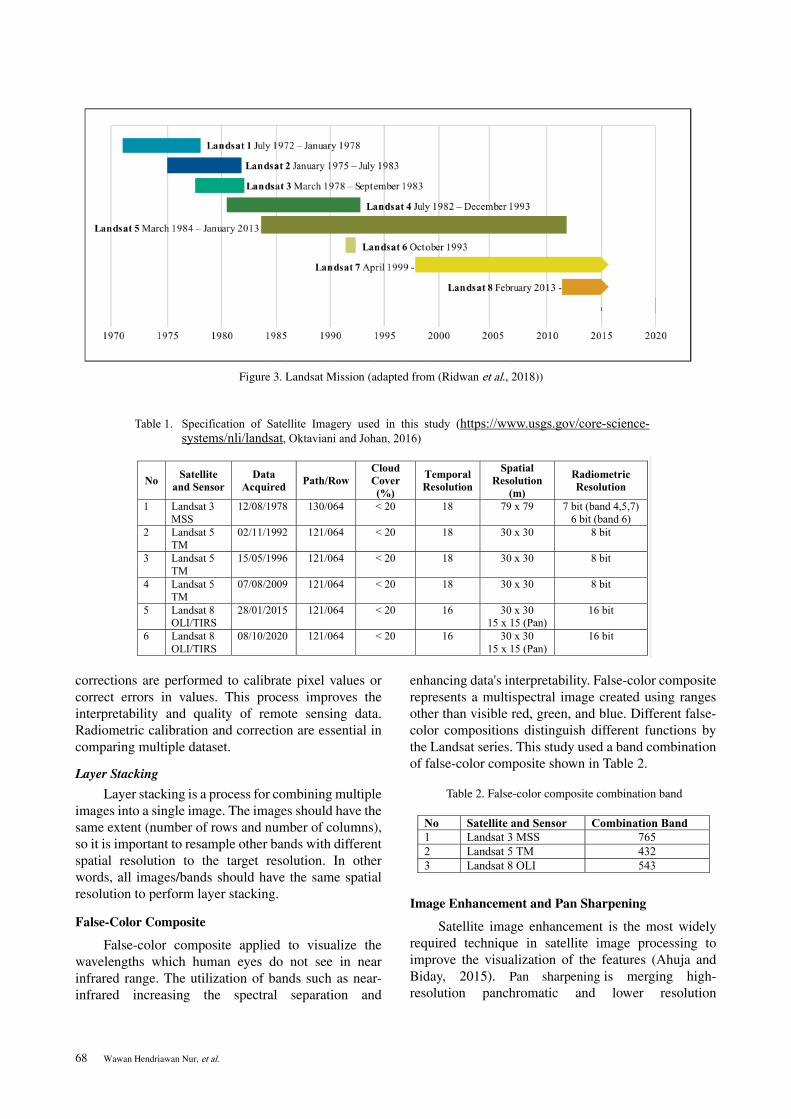
Landsat was first launched in July 1972 by EarthResources Technology Satellite (ERTS-1) or Landsat 1as the first civilian Earth observation satellite (Figure3). Other Landsat series was established by the UnitedStates Geological Survey (USGS) and the NationalAeronautics and Space Administration (NASA):Landsat 2 in 1975, Landsat 3 in 1978, Landsat 4 in1982, Landsat 5 in 1984, Landsat 6 in 1993 (failure),Landsat 7 in 1999, and Landsat 8 in 2013 (Ridwan et al.,2018).
The analysis of river estuary changes in the northcoastal Java use Landsat series formearthexplorer.usgs.gov: Landsat 3 MSS 1978, Landsat5 TM 1992, Landsat 5 TM 1996, Landsat 5 TM 2009,Landsat 8 OLI 2015, and Landsat 8 OLI 2020 with amaximum cloud cover of 20% (Table 1). The Landsattime series was assigned to determine the estuary'shistory-changing by calculating changes in the erosionor accretion area.
Geometry and Radiometry Correction
Geometry correction was assigned to correct thesatellite image's geometric position to match the exactcoordinates. This correction was applied to overly allimages in the same coordinates. Radiometric
Figure 2. Method of river estuary changes in the north coastal Java
68 Wawan Hendriawan Nur, et al.
corrections are performed to calibrate pixel values orcorrect errors in values. This process improves theinterpretability and quality of remote sensing data.Radiometric calibration and correction are essential incomparing multiple dataset.
Layer Stacking
Layer stacking is a process for combining multipleimages into a single image. The images should have thesame extent (number of rows and number of columns),so it is important to resample other bands with differentspatial resolution to the target resolution. In otherwords, all images/bands should have the same spatialresolution to perform layer stacking.
False-Color Composite
False-color composite applied to visualize thewavelengths which human eyes do not see in nearinfrared range. The utilization of bands such as near-infrared increasing the spectral separation and
enhancing data's interpretability. False-color compositerepresents a multispectral image created using rangesother than visible red, green, and blue. Different false-color compositions distinguish different functions bythe Landsat series. This study used a band combinationof false-color composite shown in Table 2.
Image Enhancement and Pan Sharpening
Satellite image enhancement is the most widelyrequired technique in satellite image processing toimprove the visualization of the features (Ahuja andBiday, 2015). Pan sharpening is merging high-resolution panchromatic and lower resolution
No Satellite and Sensor Combination Band 1 Landsat 3 MSS 765 2 Landsat 5 TM 4323 Landsat 8 OLI 543
Table 2. False-color composite combination band
Figure 3. Landsat Mission (adapted from (Ridwan et al., 2018))
No Satellite and Sensor
Data Acquired Path/Row
Cloud Cover (%)
Temporal Resolution
Spatial Resolution
(m)
Radiometric Resolution
1 Landsat 3 MSS
12/08/1978 130/064 < 20 18 79 x 79 7 bit (band 4,5,7) 6 bit (band 6)
2 Landsat 5 TM
02/11/1992 121/064 < 20 18 30 x 30
8 bit
3 Landsat 5 TM
15/05/1996 121/064 < 20 18 30 x 30 8 bit
4 Landsat 5 TM
07/08/2009 121/064 < 20 18 30 x 30 8 bit
5 Landsat 8 OLI/TIRS
28/01/2015 121/064 < 20 16 30 x 30 15 x 15 (Pan)
16 bit
6 Landsat 8 OLI/TIRS
08/10/2020 121/064 < 20 16 30 x 30 15 x 15 (Pan)
16 bit
Table 1. Specification of Satellite Imagery used in this study (https://www.usgs.gov/core-science-systems/nli/landsat, Oktaviani and Johan, 2016)
Estuary Changes of Cipunagara and Cimanuk River Using Landsat Imagery Spatial Analysis 69
multispectral imagery to create a single high-resolutioncolor image. Multispectral images have multiple bandsand a higher degree of spectral resolution, but often lackhigh spatial resolution (Table 1). On the other hand,Panchromatic images only one wide band of reflectancedata but tend to have a higher spatial resolution. Thepan-sharpening process merges the multispectral andpanchromatic images, which gives the best of bothimage types, high spectral resolution, and high spatialresolution. Pan sharpening done for Landsat 8, Band 5(0.85–0.88 øm) is in the red wavelength region, Band 4(0.64–0.67 øm) is in the green wavelength region, andband 3 (0.53 - 0.59 øm) is in the blue wavelength region.The 15 m panchromatic (Pan) band has a wavelength of0.50–0.68 øm, putting it within the red, green, and bluespectral regions (Johnson, 2014).
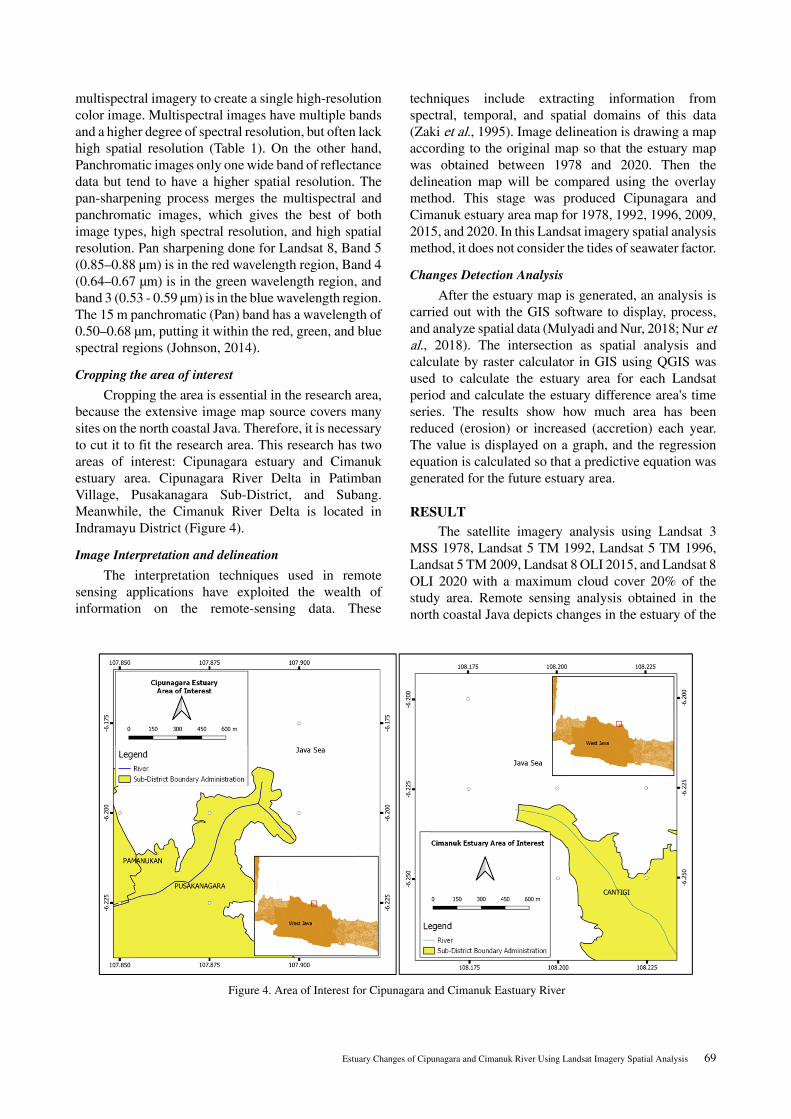
Cropping the area of interest
Cropping the area is essential in the research area,because the extensive image map source covers manysites on the north coastal Java. Therefore, it is necessaryto cut it to fit the research area. This research has twoareas of interest: Cipunagara estuary and Cimanukestuary area. Cipunagara River Delta in PatimbanVillage, Pusakanagara Sub-District, and Subang.Meanwhile, the Cimanuk River Delta is located inIndramayu District (Figure 4).
Image Interpretation and delineation
The interpretation techniques used in remotesensing applications have exploited the wealth ofinformation on the remote-sensing data. These
techniques include extracting information fromspectral, temporal, and spatial domains of this data(Zaki et al., 1995). Image delineation is drawing a mapaccording to the original map so that the estuary mapwas obtained between 1978 and 2020. Then thedelineation map will be compared using the overlaymethod. This stage was produced Cipunagara andCimanuk estuary area map for 1978, 1992, 1996, 2009,2015, and 2020. In this Landsat imagery spatial analysismethod, it does not consider the tides of seawater factor.
Changes Detection Analysis
After the estuary map is generated, an analysis iscarried out with the GIS software to display, process,and analyze spatial data (Mulyadi and Nur, 2018; Nur etal., 2018). The intersection as spatial analysis andcalculate by raster calculator in GIS using QGIS wasused to calculate the estuary area for each Landsatperiod and calculate the estuary difference area's timeseries. The results show how much area has beenreduced (erosion) or increased (accretion) each year.The value is displayed on a graph, and the regressionequation is calculated so that a predictive equation wasgenerated for the future estuary area.
RESULTThe satellite imagery analysis using Landsat 3
MSS 1978, Landsat 5 TM 1992, Landsat 5 TM 1996,Landsat 5 TM 2009, Landsat 8 OLI 2015, and Landsat 8OLI 2020 with a maximum cloud cover 20% of thestudy area. Remote sensing analysis obtained in thenorth coastal Java depicts changes in the estuary of the
Figure 4. Area of Interest for Cipunagara and Cimanuk Eastuary River
70 Wawan Hendriawan Nur, et al.
Cipunegara and Cimanuk Rivers in 1978 and 2020.Both estuary rivers show the prolongation of new landor accretion between 1978 and 2020 in the study area.Detail depiction of the estuary of the Cipunegara andCimanuk Rivers explained as follow:
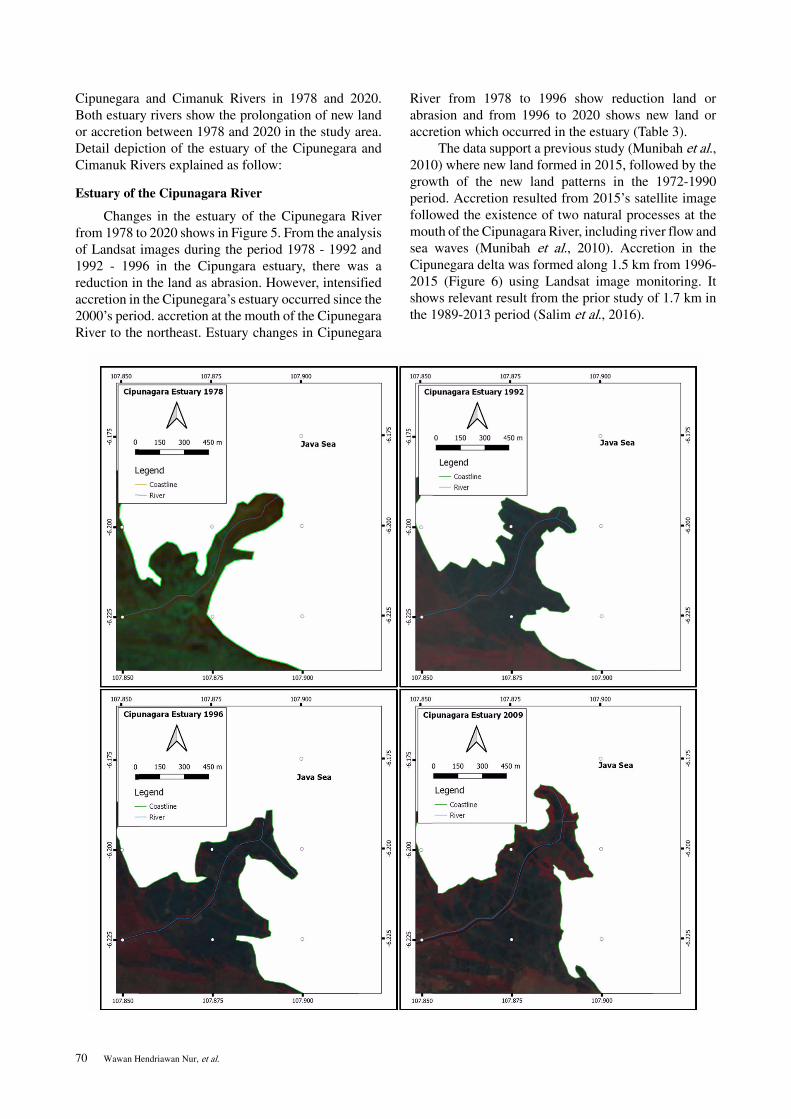
Estuary of the Cipunagara River
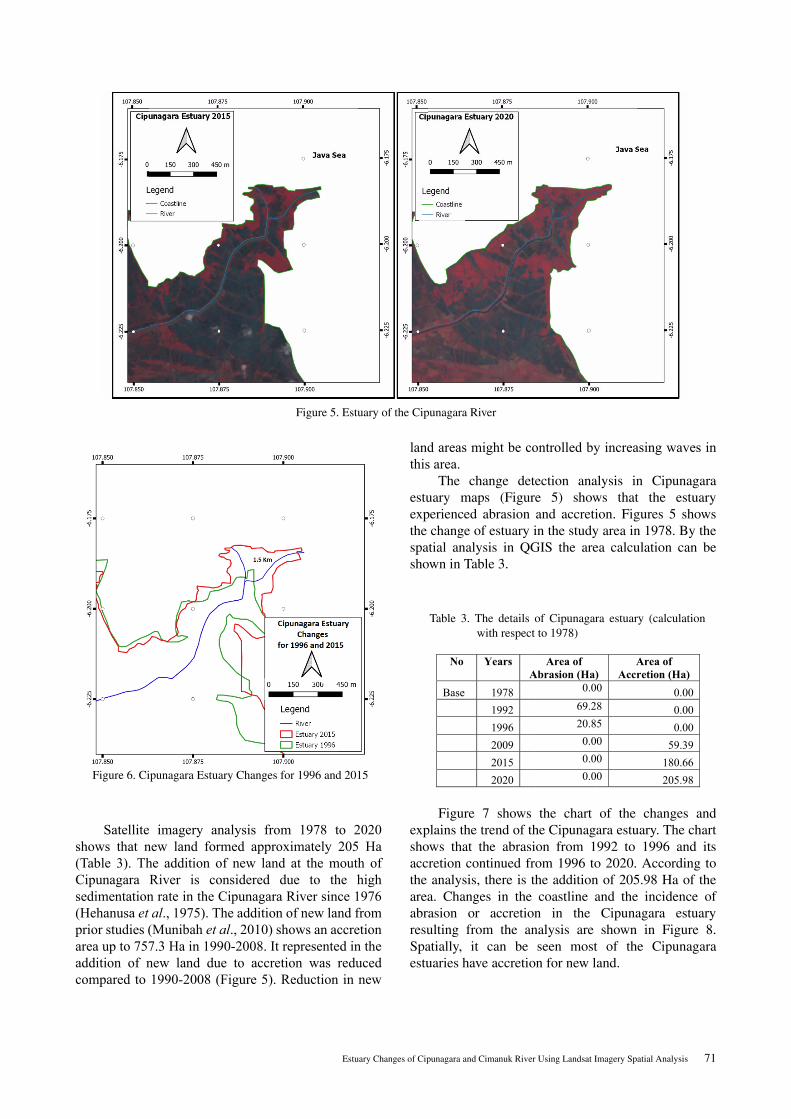
Changes in the estuary of the Cipunegara Riverfrom 1978 to 2020 shows in Figure 5. From the analysisof Landsat images during the period 1978 - 1992 and1992 - 1996 in the Cipungara estuary, there was areduction in the land as abrasion. However, intensifiedaccretion in the CipunegaraÊs estuary occurred since the2000Ês period. accretion at the mouth of the CipunegaraRiver to the northeast. Estuary changes in Cipunegara
River from 1978 to 1996 show reduction land orabrasion and from 1996 to 2020 shows new land oraccretion which occurred in the estuary (Table 3).
The data support a previous study (Munibah et al.,2010) where new land formed in 2015, followed by thegrowth of the new land patterns in the 1972-1990period. Accretion resulted from 2015Ês satellite imagefollowed the existence of two natural processes at themouth of the Cipunagara River, including river flow andsea waves (Munibah et al., 2010). Accretion in theCipunegara delta was formed along 1.5 km from 1996-2015 (Figure 6) using Landsat image monitoring. Itshows relevant result from the prior study of 1.7 km inthe 1989-2013 period (Salim et al., 2016).
Estuary Changes of Cipunagara and Cimanuk River Using Landsat Imagery Spatial Analysis 71
Satellite imagery analysis from 1978 to 2020shows that new land formed approximately 205 Ha(Table 3). The addition of new land at the mouth ofCipunagara River is considered due to the highsedimentation rate in the Cipunagara River since 1976(Hehanusa et al., 1975). The addition of new land fromprior studies (Munibah et al., 2010) shows an accretionarea up to 757.3 Ha in 1990-2008. It represented in theaddition of new land due to accretion was reducedcompared to 1990-2008 (Figure 5). Reduction in new
land areas might be controlled by increasing waves inthis area.
The change detection analysis in Cipunagaraestuary maps (Figure 5) shows that the estuaryexperienced abrasion and accretion. Figures 5 showsthe change of estuary in the study area in 1978. By thespatial analysis in QGIS the area calculation can beshown in Table 3.
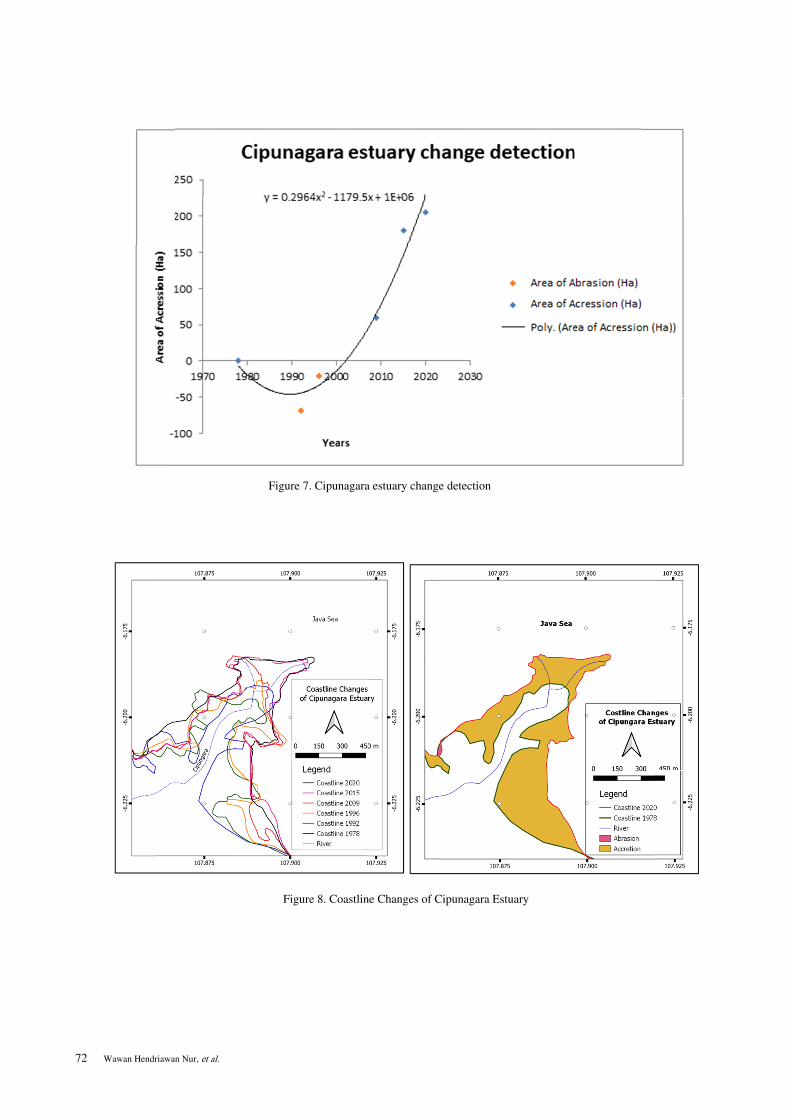
Figure 7 shows the chart of the changes andexplains the trend of the Cipunagara estuary. The chartshows that the abrasion from 1992 to 1996 and itsaccretion continued from 1996 to 2020. According tothe analysis, there is the addition of 205.98 Ha of thearea. Changes in the coastline and the incidence ofabrasion or accretion in the Cipunagara estuaryresulting from the analysis are shown in Figure 8.Spatially, it can be seen most of the Cipunagaraestuaries have accretion for new land.
Figure 5. Estuary of the Cipunagara River
Figure 6. Cipunagara Estuary Changes for 1996 and 2015
No
Base
Years A
1978 1992 1996 2009 2015 2020
Area of
Abrasion (Ha)0.0
69.220.80.00.00.0
) Area
Accretio0 8 5 0 0 0
a of on (Ha)
0.000.00 0.00
59.39 180.66 205.98
Table 3. The details of Cipunagara estuary (calculationwith respect to 1978)
72 Wawan Hendriawan Nur, et al.
Figure 7. Cipunagara estuary change detection
Figure 8. Coastline Changes of Cipunagara Estuary
Estuary Changes of Cipunagara and Cimanuk River Using Landsat Imagery Spatial Analysis 73
Cimanuk River Estuary
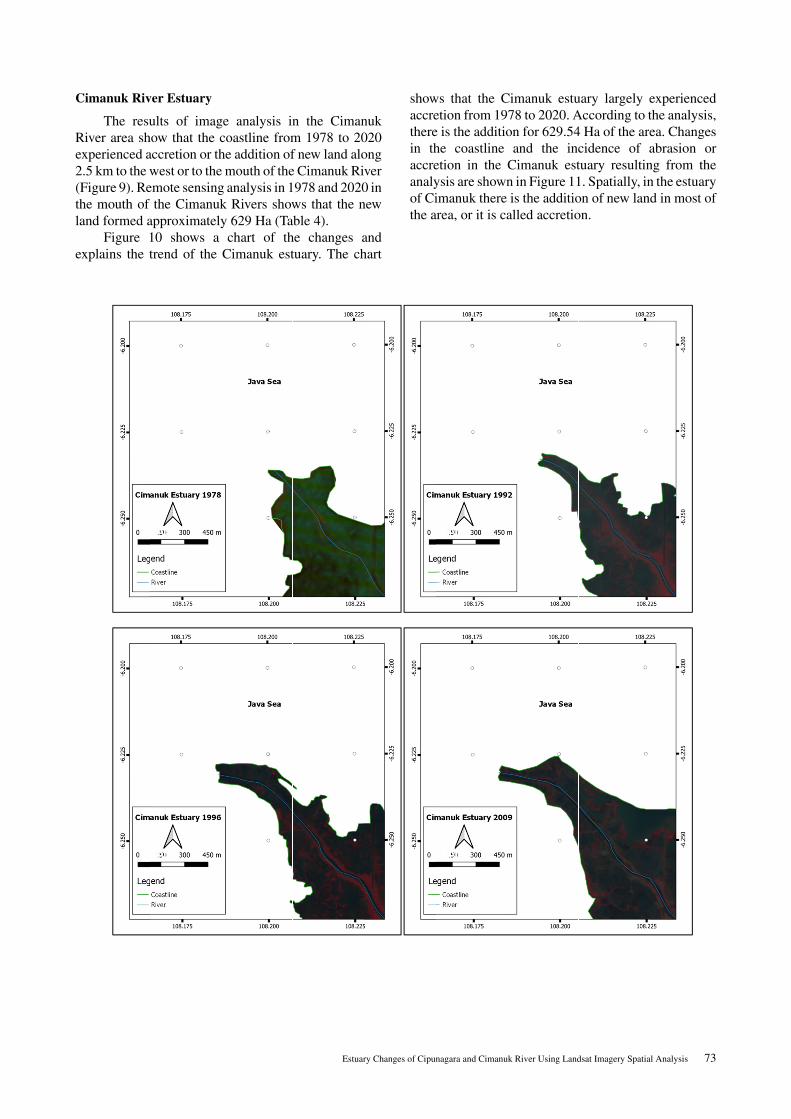
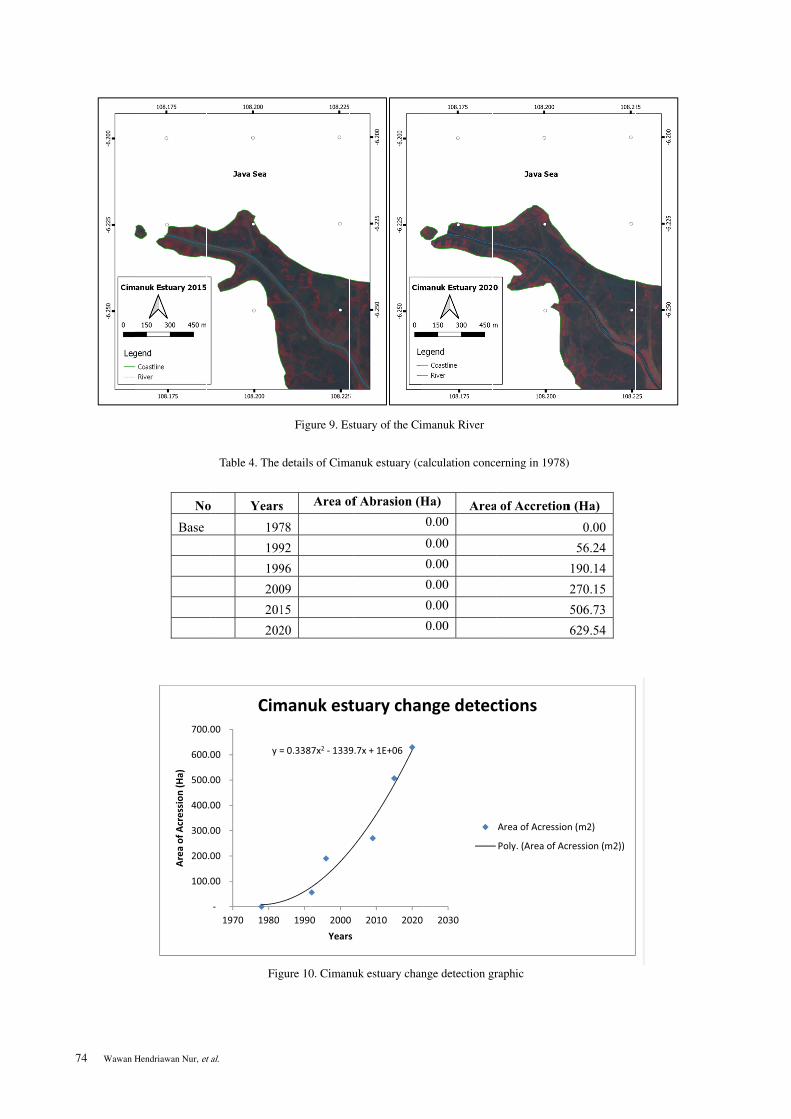
The results of image analysis in the CimanukRiver area show that the coastline from 1978 to 2020experienced accretion or the addition of new land along2.5 km to the west or to the mouth of the Cimanuk River(Figure 9). Remote sensing analysis in 1978 and 2020 inthe mouth of the Cimanuk Rivers shows that the newland formed approximately 629 Ha (Table 4).
Figure 10 shows a chart of the changes andexplains the trend of the Cimanuk estuary. The chart
shows that the Cimanuk estuary largely experiencedaccretion from 1978 to 2020. According to the analysis,there is the addition for 629.54 Ha of the area. Changesin the coastline and the incidence of abrasion oraccretion in the Cimanuk estuary resulting from theanalysis are shown in Figure 11. Spatially, in the estuaryof Cimanuk there is the addition of new land in most ofthe area, or it is called accretion.
74 Wawan Hendriawan Nur, et al.
Figure 9. Estuary of the Cimanuk River
Table 4. The details of Cimanuk estuary (calculation concerning in 1978)
NoBase
o Years197199199200201202
s Area of
78 92 96 09 15 20
f Abrasion (HHa) Area0.00 0.00 0.00 0.00 0.00 0.00
of Accretionn (Ha) 0.00
56.24 190.14 270.15 506.73 629.54
�10
�20
�30
�40
�50
�60
�70
Area�of�A
cression
�(Ha)�
��
00.00
00.00
00.00
00.00
00.00
00.00
00.00
1970
y�=�0.338
1980 1990
Cimanu
87x2���1339.7x�
0 2000 2Years�
uk�estua
+�1E+06�
2010 2020
ary�chan
2030
nge�detections
Area�of�A
Poly.�(Are
�
Acression�(m2)
ea�of�Acressio
)
n�(m2))
Figure 10. Cimanuk estuary change detection graphic
Estuary Changes of Cipunagara and Cimanuk River Using Landsat Imagery Spatial Analysis 75
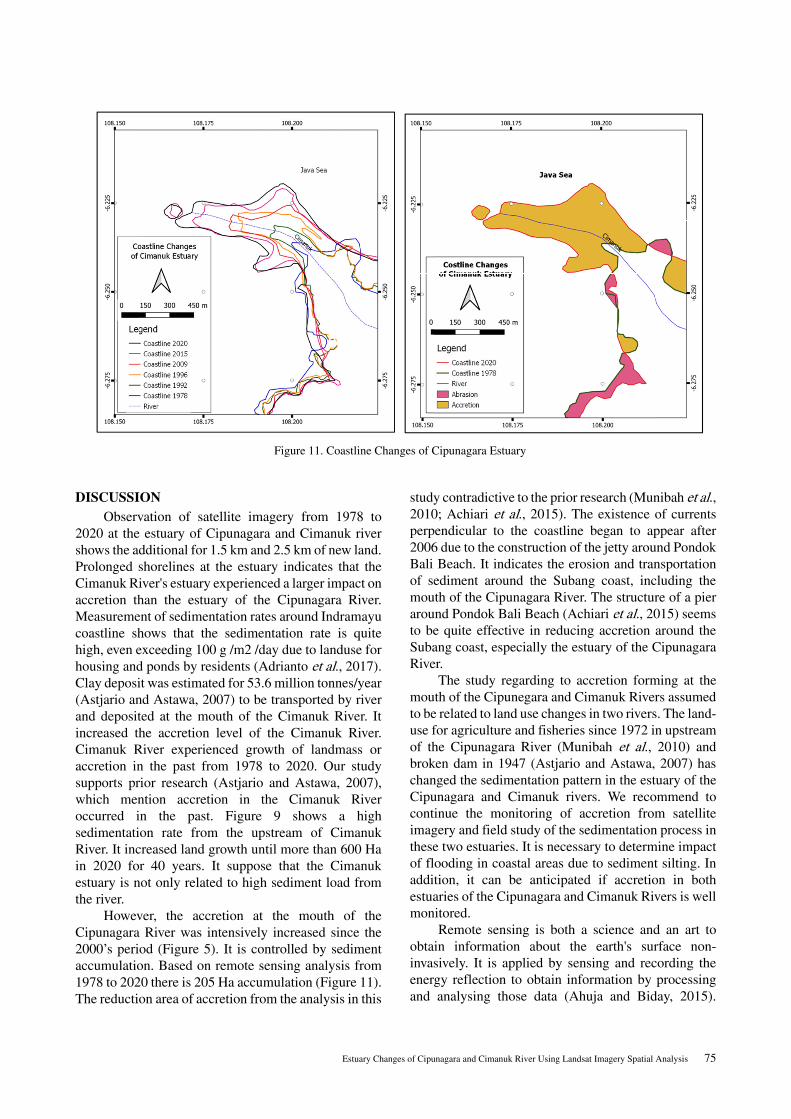
DISCUSSIONObservation of satellite imagery from 1978 to
2020 at the estuary of Cipunagara and Cimanuk rivershows the additional for 1.5 km and 2.5 km of new land.Prolonged shorelines at the estuary indicates that theCimanuk River's estuary experienced a larger impact onaccretion than the estuary of the Cipunagara River.Measurement of sedimentation rates around Indramayucoastline shows that the sedimentation rate is quitehigh, even exceeding 100 g /m2 /day due to landuse forhousing and ponds by residents (Adrianto et al., 2017).Clay deposit was estimated for 53.6 million tonnes/year(Astjario and Astawa, 2007) to be transported by riverand deposited at the mouth of the Cimanuk River. Itincreased the accretion level of the Cimanuk River.Cimanuk River experienced growth of landmass oraccretion in the past from 1978 to 2020. Our studysupports prior research (Astjario and Astawa, 2007),which mention accretion in the Cimanuk Riveroccurred in the past. Figure 9 shows a highsedimentation rate from the upstream of CimanukRiver. It increased land growth until more than 600 Hain 2020 for 40 years. It suppose that the Cimanukestuary is not only related to high sediment load fromthe river.
However, the accretion at the mouth of theCipunagara River was intensively increased since the2000Ês period (Figure 5). It is controlled by sedimentaccumulation. Based on remote sensing analysis from1978 to 2020 there is 205 Ha accumulation (Figure 11).The reduction area of accretion from the analysis in this
study contradictive to the prior research (Munibah et al.,2010; Achiari et al., 2015). The existence of currentsperpendicular to the coastline began to appear after2006 due to the construction of the jetty around PondokBali Beach. It indicates the erosion and transportationof sediment around the Subang coast, including themouth of the Cipunagara River. The structure of a pieraround Pondok Bali Beach (Achiari et al., 2015) seemsto be quite effective in reducing accretion around theSubang coast, especially the estuary of the CipunagaraRiver.
The study regarding to accretion forming at themouth of the Cipunegara and Cimanuk Rivers assumedto be related to land use changes in two rivers. The land-use for agriculture and fisheries since 1972 in upstreamof the Cipunagara River (Munibah et al., 2010) andbroken dam in 1947 (Astjario and Astawa, 2007) haschanged the sedimentation pattern in the estuary of theCipunagara and Cimanuk rivers. We recommend tocontinue the monitoring of accretion from satelliteimagery and field study of the sedimentation process inthese two estuaries. It is necessary to determine impactof flooding in coastal areas due to sediment silting. Inaddition, it can be anticipated if accretion in bothestuaries of the Cipunagara and Cimanuk Rivers is wellmonitored.
Remote sensing is both a science and an art toobtain information about the earth's surface non-invasively. It is applied by sensing and recording theenergy reflection to obtain information by processingand analysing those data (Ahuja and Biday, 2015).
Figure 11. Coastline Changes of Cipunagara Estuary
76 Wawan Hendriawan Nur, et al.
Remote sensing analysis can be used to calculate theestuary changes in the north coastal Java. This methodcan estimate the erosion or accretion in the past andpredict erosion and accretion in the future. Morespecific research must be carried out by field survey andsampling data at the research area for more detail study.
CONCLUSIONSAnalysis of shoreline changes was carried out
between 1978 and 2020 using Landsat data at theestuary of Cipunegara and Cimanuk River.Observations from Landsat data are used to determinechanges in coastlines that occur around the Subang,Indramayu, and Cirebon areas. The result show thatthere has been a change in the shoreline in several areas,especially around the mouths of large rivers such as theCipunegara and Cimanuk Rivers. The estuary changesin the Cipunegara and Cimanuk Rivers due to the highsediment deposition in the river mouth. The forming ofnew land controlled by the accretion process. Wesuppose that high sediment deposits in both riversoriginated from young volcanic regions of theQuaternary deposits at Ciremai Mountain. TheQuaternary deposits are transported through tributariesof Cimanuk and Cipunagara rivers until the mouth ofrivers. Monitoring through Landsat satellite imagery onthe Cipunagara River in 1978 and 2020, shows theaddition of the new land for 205 Ha of the area. Imageanalysis in the Cimanuk River area shows that theestuary line from 1978 to 2020 experienced accretion orforming of the new land for 629 Ha. However,continuous monitoring of accretion from satelliteimagery and a study of the sedimentation process inthese two estuaries is necessary to determine how farthe accretion rate will be in the future.
ACKNOWLEDGEMENTSWe acknowledge to Director of Research Center
for Geotechnology, Indonesian Institute of Sciences,which has allowed us to publish this research article atCipunegara and Cimanuk Rivers. We thank chiefscientist, Professor Dr. Wahyoe S. Hantoro, whoreviewed and helped to analysis the Landsat. We alsothank Andri Fauzy and Didik Prata Wijaya, who gavemuch input to complete this article well.
REFERENCESAbidin, H.Z., Sutrisno. 1992. Peta Geologi Lembar
Pamanukan, Jawa. Pusat Penelitian danPengembangan Geologi.
Achdan, A., Sudana, D. 1992. Peta Geologi LembarIndramayu, Jawa. Pusat Penelitian danPengembangan Geologi.
Achiari, H., Dinan, M.I. 2019. Sedimentation AnalysisBased on River Hydrological Discharge atCipunagara Estuary, Subang, Indonesia. IOPConf. Ser.: Earth Environ. Sci. 258 012021.
Achiari, H., Wiyono, A., Sasaki, J. 2015. CurrentCharacteristics and Shoreline Change atPondok-Bali, North Coast-West Java ofIndonesia. Procedia Earth and PlanetaryScience 14, p.161 – 165.
Adrianto, B., Hariyadi, Rochaddi, B. 2017. AnalisaLaju Sedimentasi di Muara SungaiKarongsong, Kabupaten Indramayu. JurnalOseanografi, vol. 6, no.1, h.10-21. http://ejournal‐s1.undip.ac.id/index.php/jose.
Ahuja, Stuti N., Biday, S. 2015. A Survey of SatelliteImage Enhancement Techniques. InternationalJournal of Science and Research, 6 (January),2319–7064. www.ijsr.net.
Astjario, P and Astawa, I.N. 2007. Prosespertumbuhan delta baru Sungai Cimanukhingga tahun 2002 di pantai timur KabupatenIndramayu, Pusat Penelitian dan PengembanganGeologi Kelautan, Jurnal Geologi KelautanVolume 5, No. 3.
Cahyarini, S. Y. 2011. Pertambahan penduduk, variasiinterannual suhu permukaan laut danpengaruhnya terhadap pertumbuhan linierkarang Porites di Kepulauan Seribu. JurnalLingkungan Dan Bencana Geologi, 2(1), 39–48.
Hehanusa, P. E., Hadiwisastra, S. and Djoehanah, S.1975. Sedimentasi delta baru Cimanuk. Geol.Indonesia 3(1), 21-35.
Hendrizan, M., Ningsih, N.S., Cahyarini, S.Y.,Mutiara, M.R., Setiadi, B., Anwar, I.P., Utami,D.A., Agusta, V.C. 2020. Centennial-MillennialClimate Variability in the Makassar Straitduring Early Holocene until the End of the LastDeglaciation. Int. Journals Ocean. Oceanogr.14, 197–220.
Hendrizan, M., Kuhnt, W., and Holbourn, A. 2017.Variability of Indonesian Throughflow andBorneo Runoff During the Last 14 kyr.Paleoceanography, 32, 1054–1069. https://doi.org/10.1002/2016PA003030.
https://www.usgs.gov/core‐science‐systems/nli/landsat. Accessed November 2020.
Johnson, B. 2014. Effects of pansharpening onvegetation indices. ISPRS International Journalof Geo-Information, 3(2), 507–522. https://doi.org/10.3390/ijgi3020507.
Estuary Changes of Cipunagara and Cimanuk River Using Landsat Imagery Spatial Analysis 77
Liu, S., Zhang, H., Shi, X., Chen, M. Te, Cao, P., Li,Z., Troa, R. A., Zuraida, R., Triarso, E., andMarfasran, H. 2020. Reconstruction ofmonsoon evolution in southernmost Sumatraover the past 35 kyr and its response to northernhemisphere climate changes. Progress in Earthand Planetary Science, 7(1). https://doi.org/10.1186/s40645-020-00349-9.
Mulyadi, D., and Nur, W. H. 2018. Aplikasi AnalitikHirarki Proses Untuk Ancaman Bahaya GempaDi Daerah Tanjung Lesung-Panimbang,Pandeglang. RISET Geologi DanPertambangan, 28 (1), 37. https://doi.org/10.14203/risetgeotam2018.v28.387.
Munibah, K., Iswati, A,. Tjahjono, B. 2010.Perubahan Garis Pantai Dan RegulasiPengelolaan Lahan Baru Di Delta Cipunagara,Subang, Jawa Barat. Globë Volume 12 No.2:151 – 159.
Nitsche, F. O., Ryan, W. B. F., Carbotte, S. M., Bell, R.E., Slagle, A., Bertinado, C., Flood, R., Kenna,T., and McHugh, C. 2007. Regional patternsand local variations of sediment distribution inthe Hudson River Estuary. Estuarine, Coastaland Shelf Science, 71(1–2), 259–277. https://doi.org/10.1016/j.ecss.2006.07.021.
Nur, W. H., Kumoro, Y., and Susilowati, Y. 2018. GISand Geodatabase Disaster Risk for SpatialPlanning. IOP Conference Series: Earth andEnvironmental Science, 118(1). https://doi.org/10.1088/1755-1315/118/1/012046.
Oktaviani, A., and Johan, Y. 2016. PerbandinganResolusi Spasial, Temporal Dan RadiometrikSerta Kendalanya. Jurnal Enggano, 1(2), 74–79.https://doi.org/10.31186/jenggano.1.2.74-79
Pamungkas, F. D. and Saraswati, R. 2020. Changes inthe west Delta of Ci Manuk in 2002 – 2018. IOPConf. Ser.: Earth Environ. Sci. 561 012026
Praptisih, P., and Cahyarini, Y. 2016. Sedimen SebagaiArsip Perubahan Lingkungan. Jurnal GeologiKelautan, 10(1), 53. https://doi.org/10.32693/jgk.10.1.2012.215
Prawiradisastra, S. 2003. Permasalahan Abrasi diwilayah pesisir Kabupaten Indramayu. Alami,vol. 8. No. 2.
Pranoto, 2007. Prediksi Perubahan Garis PantaiMenggunakan Model GENESIS. Berkala
Ilimiah Teknik Keairan, Vol. 13, No.3. ISSN0854-4549.
Ratman, N., Gafoer, S, 1998. Peta Geologi LembarJawa Barat. Skala 1 : 100.000. Edisi ke-2, PusatPenelitian dan Pengembangan Geologi,Bandung.
Ridwan, M. A., Radzi, N. A. M., Ahmad, W. S. H. M.W., Mustafa, I. S., Din, N. M., Jalil, Y. E., andIsa, A. M. 2018. Applications of Landsat-8Data?: a Survey. 7, 436–441.
Rimbaman, I. 1992. The role of sea level change on thecoastal environment of northern West Java (casestudy of Eretan, Losarang, and Indramayu).Journal of Southeast Asian earth Sciences, vol.7, no. 1, pp. 71-77.
Salim, A.G., Siringoringo, H.H., Narendra, B.H. 2016.Pengaruh Penutupan Mangrove TerhadapPerubahan Garis Pantai Dan Intrusi Air Laut DiHilir Das Ciasem Dan Das Cipunegara,Kabupaten Subang. J. Manusia DanLingkungan, Vol. 23, No.3. p. 319-326.
Silitonga, P.H., Masria, M., Suwarna, N. 1996. PetaGeologi Lembar Cirebon, Jawa. PusatPenelitian dan Pengembangan Geologi.
Utami, D. A., Reuning, L., and Cahyarini, S. Y. 2018.Satellite- and field-based facies mapping ofisolated carbonate platforms from theKepulauan Seribu Complex, Indonesia. TheDepositional Record, 4(2), 255–273. https://doi.org/10.1002/dep2.47.
Yadav, A., Makhdumi, W., and Dodamani, B. M. 2019.Estuary Change Analysis using LANDSATSatellite Imagery?: A Case Study of Kali RiverEstuary , West Coast of India Estuary ChangeAnalysis using LANDSAT Satellite Imagery?:A Case Study of Kali River Estuary , WestCoast of India. March 2020.
Zaki, M., El Tohamy, F., and Hassan, A. 1995. Landsatimage interpretation. Computational Statisticsand Data Analysis, 20(1), 75–97. https://doi.org/10.1016/0167-9473(94)00022-B.

78 Wawan Hendriawan Nur, et al.


![The bridge on the river Kwaï : film · The Bridge of the river Kwaï (1990) Paris : Hatier ; Paris : distrib. Hatier , 1990 (cop) Enregistrements (2) The river Kwai march. - [24]](https://img.pdfslide.fr/doc/110x75/611a5384e2db5310c917d28a/the-bridge-on-the-river-kwa-film-the-bridge-of-the-river-kwa-1990-paris.jpg)