Embed Size (px)
Citation preview
1180 S H O R T C O M M U N I C A T I O N S
the corrections for all the aberrations (see for example, Wilson, 1963) except for dispersion and the Lorentz- polarization factor.
Thus for the first iteration, we obtain the limits
O°i=sin-~{ ['~c+R(1)/2]~c sin 0c0} _A G
0 ~ = sin-~{ []~o-R(]O/2]~c sin 0c0} _ A a . (6)
!
The angles 0~1, 0~vi are rounded to the nearest 0 /values ; because of this rounding an exact knowledge of the spectral distr ibution is not required and only an ap- proximate value of 2c need be used in equations (6). The accuracy of 2c required for equations (6) depends of course both on the Bragg angle and on the magni tude of A 0; the weighted mean of the published peak values of a 1 and ae is sufficiently accurate for the back reflec- t ion region and the 3 0 values given above.
3. The centroid 0~ of the distr ibution between the (rounded) limits 0~i and 0~vl is calculated from equat ion (2) (replacing the unpr imed by the pr imed values) and an adjusted centroid 0cl is found from
0cl = 0~1+ A a . (7)
4. If 0Cl* 0c0, then 0c~ replaces 0c0 in equations (6) to calculate new limits 0~2, 0~v~. A new centroid 0c~ is then calculated as in step 3.
5. The process is i terated i t imes unti l 0c~ = 0c(~-~)= Ocn, at which point the limits are symmetr ic on a wave- length scale about the centroid. In practice, i is small - - at most two or three i terations are required.
6. Finally, the corrected centroid 0c(R) is found from
Oc(R) = OCn + AL (8)
where AL is the correction of the centroid to account for the effects of dispersion and the Lorentz-polarization factor (Ladell, Mack, Parrish & Taylor, 1959).
The necessity of using an equivalent measure of line position for the powder diffraction line and the spectral line has been discussed by Ladell, Parrish & Taylor (1959) and Pike & Wilson (1959). Because of this require- ment , the centroid ;tc of the incident spectral distribu- t ion for the same wavelength range as tha t u s e d in
determining Oc(R) must be known accurately in order to solve the Bragg equation for dhk l.
To determine 2c for a selected wavelength range R(2), the procedure is as follows:
1. An approximate centroid 2c, is chosen and the centroid 2Cl of the spectral distr ibution between the limits ~o1=2co+R(2)/2 and 2Nl=2co--R(2)/2 is calcu- lated.
2. The difference D~ =~c~-2c0 is used to determine new limits 202--;t01+D 1 and 2lv2=2gl+D~, and a new centroid 2c~ is calculated.
3. The process is i terated i t imes unti l Di=Dn= 2Cn-2c(n-1)=O, at which point the centroid ~cn lies midway between the limits. Then ~cn--,~c is the spectral centroid for the range R()~).
I t should be noted tha t experimental two-crystal spectrometer spectral distributions may require correc- tions for aberrations and tha t these corrections, if known, may be applied in a manner similar to tha t used for 0c(R). Standard values of 2c for a given radiation need be tabula ted only once for a series of ranges for use in solving the Bragg equation. Results of the determinat ion of 2c for various ranges for Cu K a and Fe Ka spectral distributions and the application of the above me thod to the de terminat ion of lattice parameters are being prepared for publication.
R e f e r e n c e s
LADELL, J., MACK, M., PARRISH, W. & TAYLOR, J. (1959). Acta Crypt. 12, 567.
LADELL, J., PARRISH, W. & TAYLOR, J. (1959). Acta Cryst. 12, 561.
PA~RIS~, W. & LOWITZSCE, K. (1959). Amer. Min. 44, 765.
PA~RIS~, W., MACK, M. & TAYLOR, J. (1963). J. Appl. Phys. 34, 2544.
PIKE, E. R. & WILSON, A. J. C. (1959). Brit. J. Appl. Phys. 10, 57.
WILSON, A. J. C. (1963). Mathematical Theory of X-Ray Powder Diffractometry. Eindhoven : Centrex Publ. Co.
ZEVIN, L. S., UMANSKII, M. M., KHEIKER, D. M. & PAN- CHENKO, ~-rV. M. (1961). Kristallografiya, 0, 348.
Acta Cryst. (1963). 16, 1180
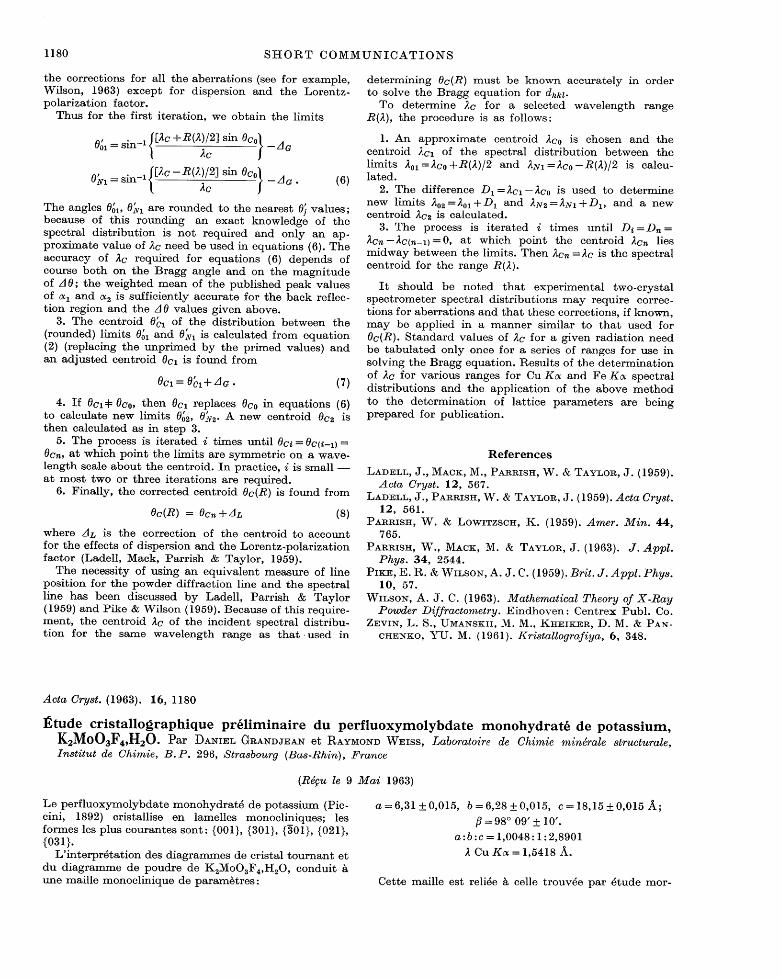
E t u d e c r i s t a l l o g r a p h i q u e p r ~ l i m i n a i r e d u p e r f l u o x y m o l y b d a t e m o n o h y d r a t ~ d e p o t a s s i u m , K2Mo03F4,H20. Par DANIEL ~RA_~DJEA_~ et I~AYIVIOI~D WEISS, Laboratoire de Chimie mindrale structurale, Institut de Chimie, B.P. 296, Strasbourg (Bus-Rhin), France
(Rd~u le 9 Mai 1963)
Le perf luoxymolybdate monohydrat4 de potassium (Pic- cini, 1892) cristallise en lamelles monocliniques; les formes les plus courantes sent : {001}, {301}, (301}, {021}, {031}.
L ' interpr4tat ion des diagrammes de cristal tournant et du diagramme de poudre de K2MoO3F4,H20 , conduit une maille monoclinique de param6tres:
a = 6 , 3 1 ± 0 , 0 1 5 , b=6 ,28±0 ,015 , c = 1 8 , 1 5 + 0 , 0 1 5 A ;
fl = 98 ° 09' _+ 10'. a: b : c -- 1,0048 : 1 : 2,8901
Cu Ka = 1,5418 A.
Cette maille est reli4e ~ celle trouv4e par 4rude mor-
S H O R T C OM1VIUI~IICATI 0 N S 1181
pho log ique p a r P icc in i (1895; see also Groth) , p a r u n c h a n g e m e n t d ' axes de m a t r i c e : I °°1
0 3 0 0 0 1
Les en reg i s t r emen t s des p lans r6c iproques s u i v a n t les axes [100] et [010] on t ~tg r~alisgs ~ l ' a ide d ' u n r6 t ig raphe R i m s k y - N o n i u s . Les ex t inc t ions sys t6ma t iques relev6es dans ces p lans son t d u type"
hO1 avee 1 = 2n + 1 e t 0k0 avec / c = 2n + 1
Ces ex t inc t ions sys t~ma t iques sont ca rac t~r i s t iques d u g roupe de symdt r i e m o n o c l i n i q u e P21/c.
Le n o m b r e de g r o u p e m e n t s K2MoO3Fa,H20 pa r mai l l e est de 4. (densit6 mesur~e : 3,00 g . cm -3, densi t~ calcul~e: 2,96 g.cm-3).
L a d ~ t e r m i n a t i o n de la s t r u c t u r e a t o m i q u e est en vo le d ' a c h ~ v e m e n t .
R ~ f 6 r e n c e s
GROTH, P. Chemische Kristallographie. 1, 598. PICCINI, A. (1892). Z. anorg. Chem. 1, 51. PICCINI, A. (1895). Z. anorg. Chem. 10, 443.
Acta Cryst. (1963). 16, 1181
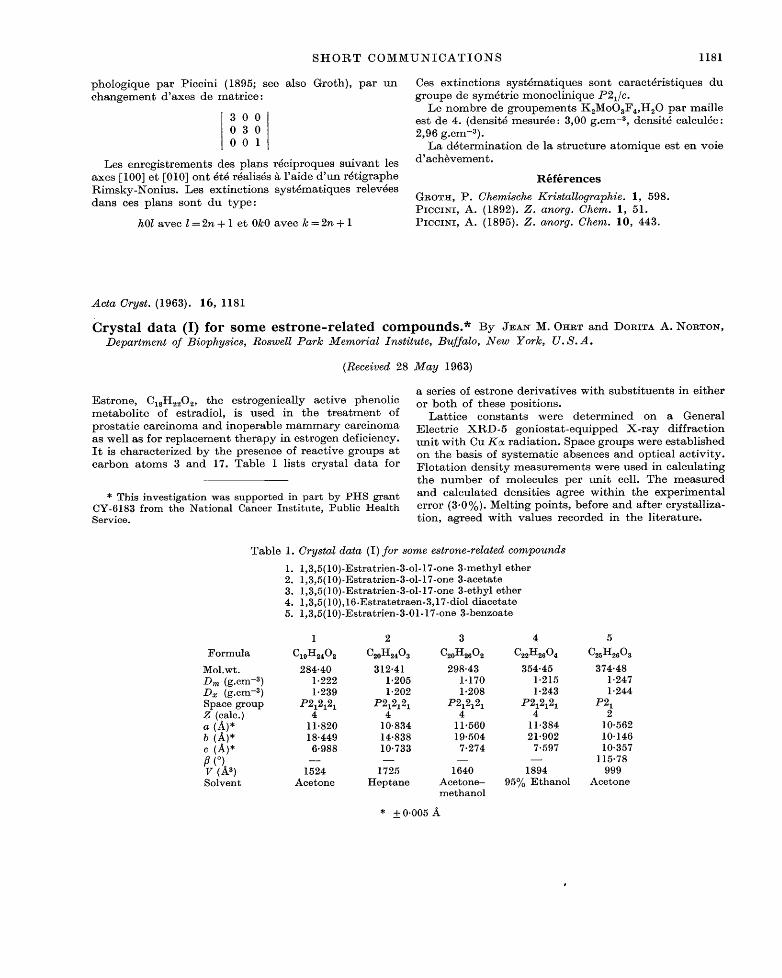
Crystal data (I) f o r s o m e estrone-related compounds.* B y JEA~ M. O m i t a n d DORITA A. NORTON, Department of Biophysics, Roswell Park Memorial Institute, Buffalo, New York, U . S . A .
(Received 28 May 1963)
Es t rone , C18H2202, t he es t rogen ica l ly ac t ive pheno l ic m e t a b o l i t e of es t radiol , is used in t he t r e a t m e n t of p ros ta t i c c a r c i n o m a a n d inope rab le m a m m a r y c a r c i n o m a as wel l as for r e p l a c e m e n t t h e r a p y in es t rogen def ic iency. I t is c h a r a c t e r i z e d b y the p resence of r eac t ive g roups a t c a r b o n a t o m s 3 a n d 17. Tab le 1 lists c rys ta l d a t a for
* This investigation was supported in part by PHS grant CY-6183 from the National Cancer Insti tute, Public Heal th Service.
a series of es t rone de r iva t ives wi th subs t i t uen t s in e i t he r or b o t h of these posi t ions .
L a t t i c e cons t an t s were d e t e r m i n e d on a Genera l E lec t r i c X R D - 5 g o n i o s t a t - e q u i p p e d X - r a y d i f f rac t ion u n i t w i t h Cu K s r ad ia t ion . Space g roups were es tab l i shed on the basis of s y s t e m a t i c absences a n d opt ica l ac t i v i t y . F l o t a t i o n dens i ty m e a s u r e m e n t s were used in ca lcu la t ing t h e n u m b e r of molecu les pe r u n i t cell. T h e m e a s u r e d a n d ca l cu l a t ed dens i t ies agree w i t h i n t he e x p e r i m e n t a l e r ro r (3.0%). Mel t ing poin ts , before a n d a f te r crys ta l l iza- t ion, ag reed w i t h va lues r eco rded in t he l i t e ra tu re .
Tab le 1. Crystal data ( I ) f o r some estrone-related compounds
1. 1,3,5(10)-Estratrien-3-ol-17-one 3-methyl ether 2. 1,3,5(10)-Estratrien-3-ol- 17-one 3-acetate 3. 1,3,5(10)-Estratrien-3-ol- 17-one 3-ethyl ether 4. 1,3,5 (10), 16-Estratetraen-3,17-diol diacetate 5. 1,3,5(10)-Estratrien-3-01-17-one 3-benzoate
1 2 3 4
Formula C19H2402 C o o H 2 4 0 3 C2oH2eO 2 022H2604 :Mol.wt. 284.40 312.41 298-43 354.45 Dm (g.cm -3) 1-222 1"205 1.170 1.215 Dx (g.cm -3) 1-239 1.202 1.208 1-243 Space group P212121 P212121 P212121 P212x21 Z (calc.) 4 4 4 4 a (A)* 11.820 10.834 11"560 11.384 b (A)* 18-449 14.838 19.504 21-902 c (/~)* 6.988 10.733 7.274 7.597 8 ( o ) - - _ _ _
V (A a) 1524 1725 1640 1894 Solvent Acetone Heptane Acetone- 95% Ethanol
methanol
5 025HpeOs
374.48 1.247 1.244
P21 2
10-562 10.146 10-357
115.78 999
Acetone
* _+ 0.005 A