Embed Size (px)
Citation preview
Evaluation du métabolismeEvaluation du métabolismeosseux et minéralosseux et minéral
René RizzoliRené Rizzoli
Service des maladies osseusesService des maladies osseuses[Centre collaborateur de l[Centre collaborateur de l’’OMS pour la prévention deOMS pour la prévention de
ll’’ostéoporose]ostéoporose]Département de réhabilitation et gériatrieDépartement de réhabilitation et gériatrie
Hôpitaux universitaires et Faculté de médecine de GenèveHôpitaux universitaires et Faculté de médecine de Genève
Lausanne, 13 mars 2008Lausanne, 13 mars 2008
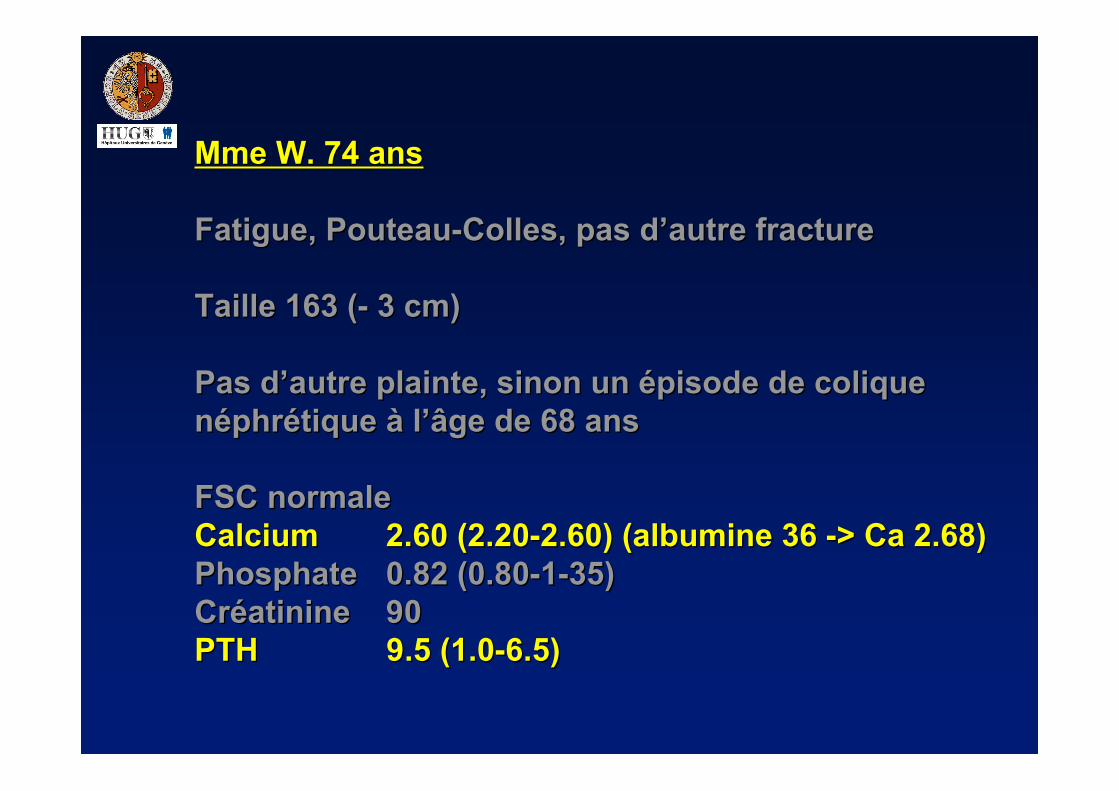
Mme W. 74 ansMme W. 74 ans
Fatigue, Fatigue, Pouteau-CollesPouteau-Colles, pas d, pas d’’autre fractureautre fracture
Taille 163 (- 3 cm)Taille 163 (- 3 cm)
Pas dPas d’’autre plainte, sinon un épisode deautre plainte, sinon un épisode decolique néphrétique à lcolique néphrétique à l’’âge de 68 ansâge de 68 ans
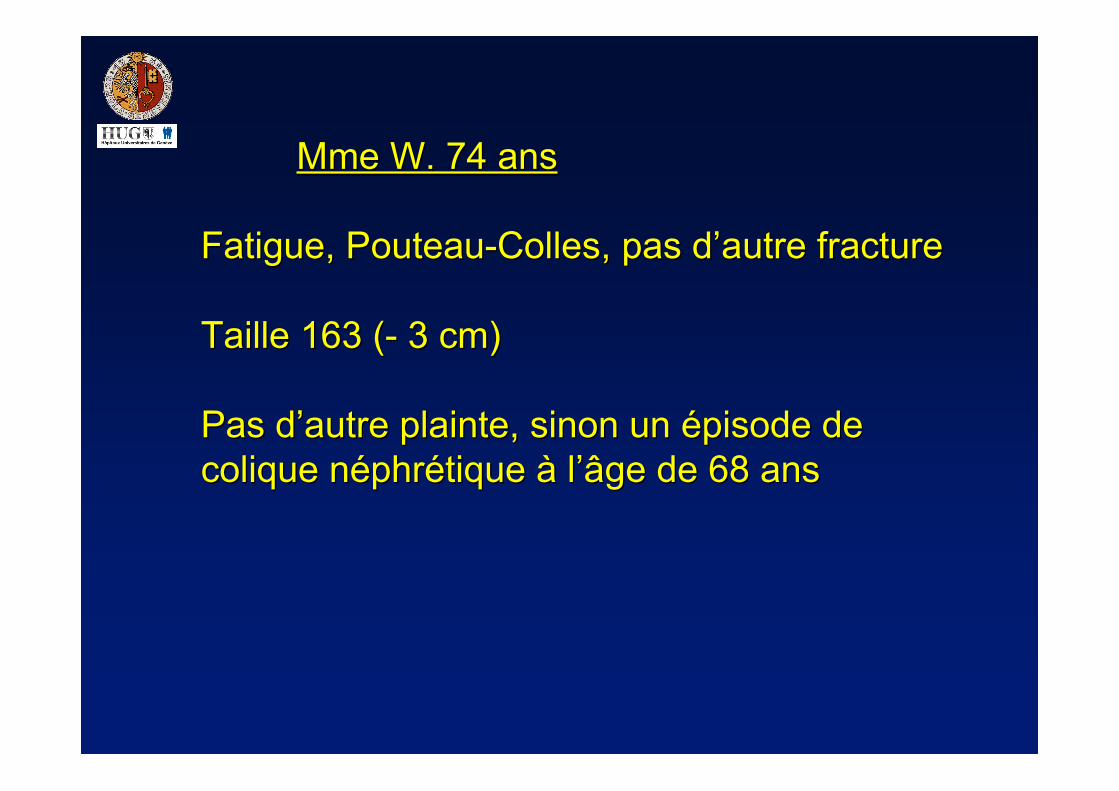
Mme W. 74 ansMme W. 74 ans
Fatigue, Fatigue, Pouteau-CollesPouteau-Colles, pas d, pas d’’autre fractureautre fracture
Taille 163 (- 3 cm)Taille 163 (- 3 cm)
Pas dPas d’’autre plainte, sinon un épisode de coliqueautre plainte, sinon un épisode de coliquenéphrétique à lnéphrétique à l’’âge de 68 ansâge de 68 ans
FSC normaleFSC normaleCalcium Calcium 2.60 (2.20-2.60)2.60 (2.20-2.60)PhosphatePhosphate 0.82 (0.80-1-35)0.82 (0.80-1-35)CréatinineCréatinine 9090
CalciumCalcium
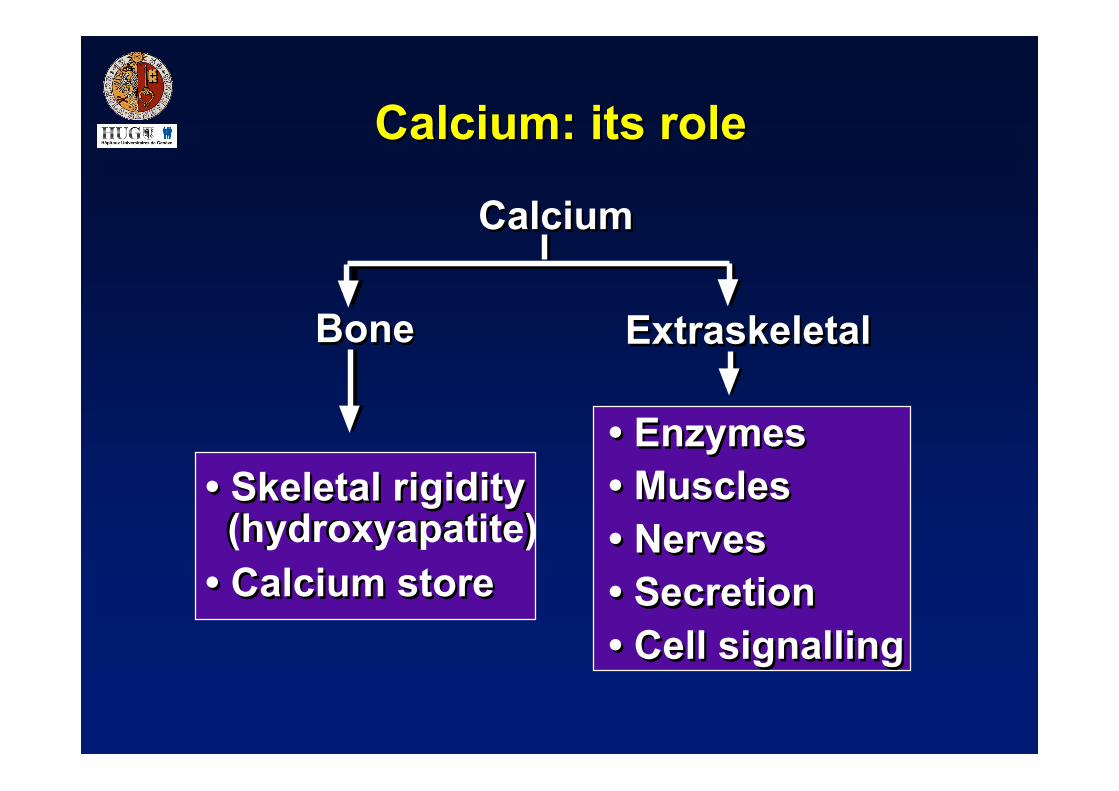
BoneBone Extraskeletal Extraskeletal
• Skeletal rigidity (hydroxyapatite)• Calcium store
• Skeletal rigidity (hydroxyapatite)• Calcium store
Calcium:Calcium: its role its role
• Enzymes• Muscles• Nerves• Secretion• Cell signalling
• Enzymes• Muscles• Nerves• Secretion• Cell signalling
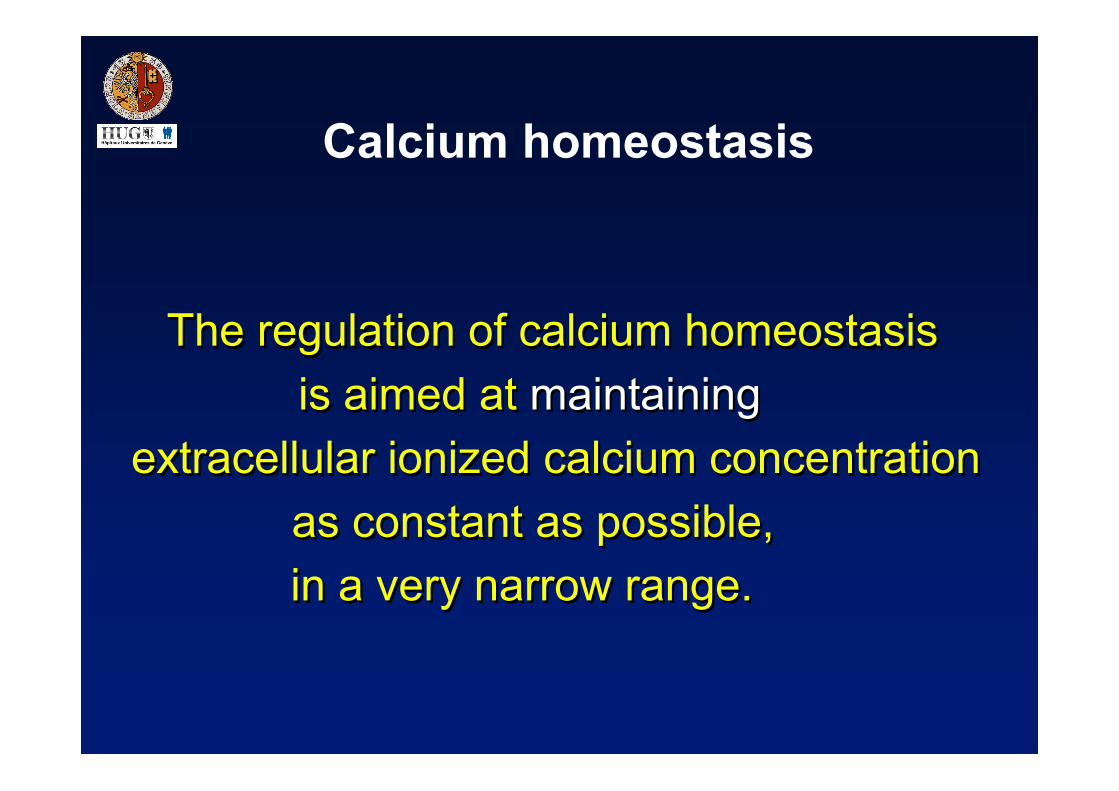
Calcium homeostasis
The regulation of calcium homeostasis is aimed at maintaining
extracellular ionized calcium concentration as constant as possible, in a very narrow range.
The regulation of calcium homeostasis is aimed at maintaining
extracellular ionized calcium concentration as constant as possible, in a very narrow range.
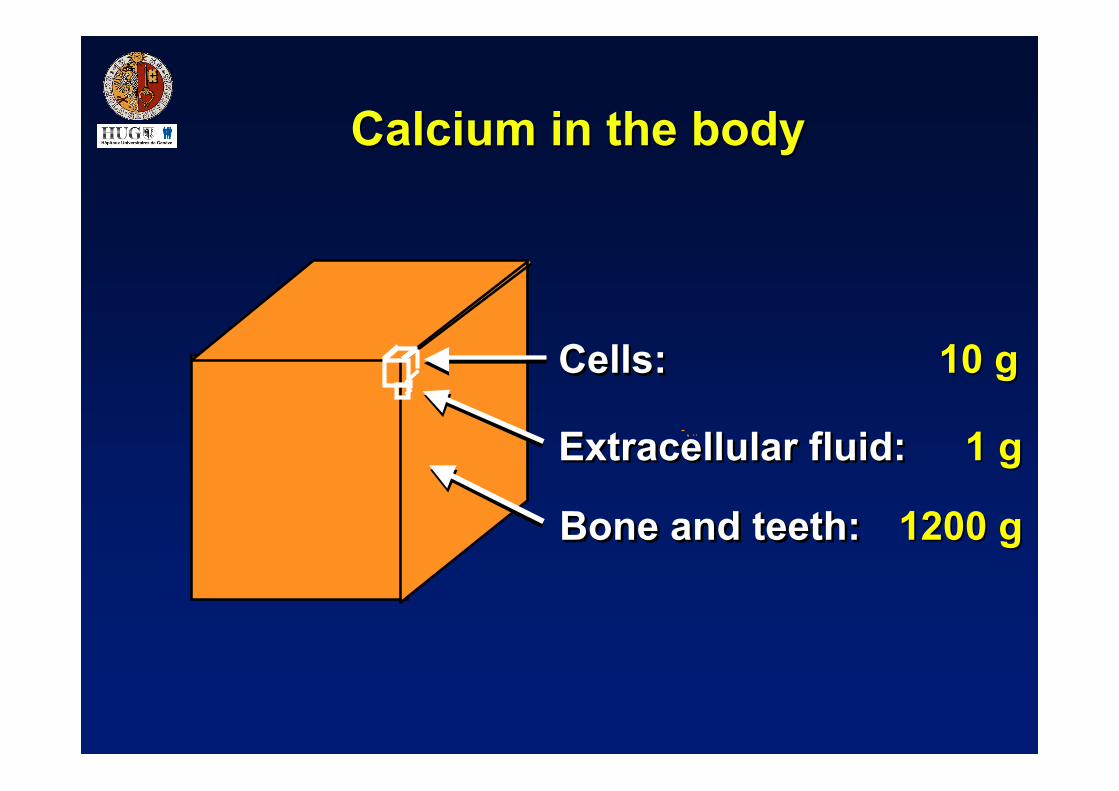
Calcium in the bodyCalcium in the body
Cells: Cells: Cells: 10 g10 g
Extracellular fluid: ExtracellularExtracellular fluid: fluid: 1 g1 g
Bone and teeth: Bone and teeth: Bone and teeth: 1200 g1200 g
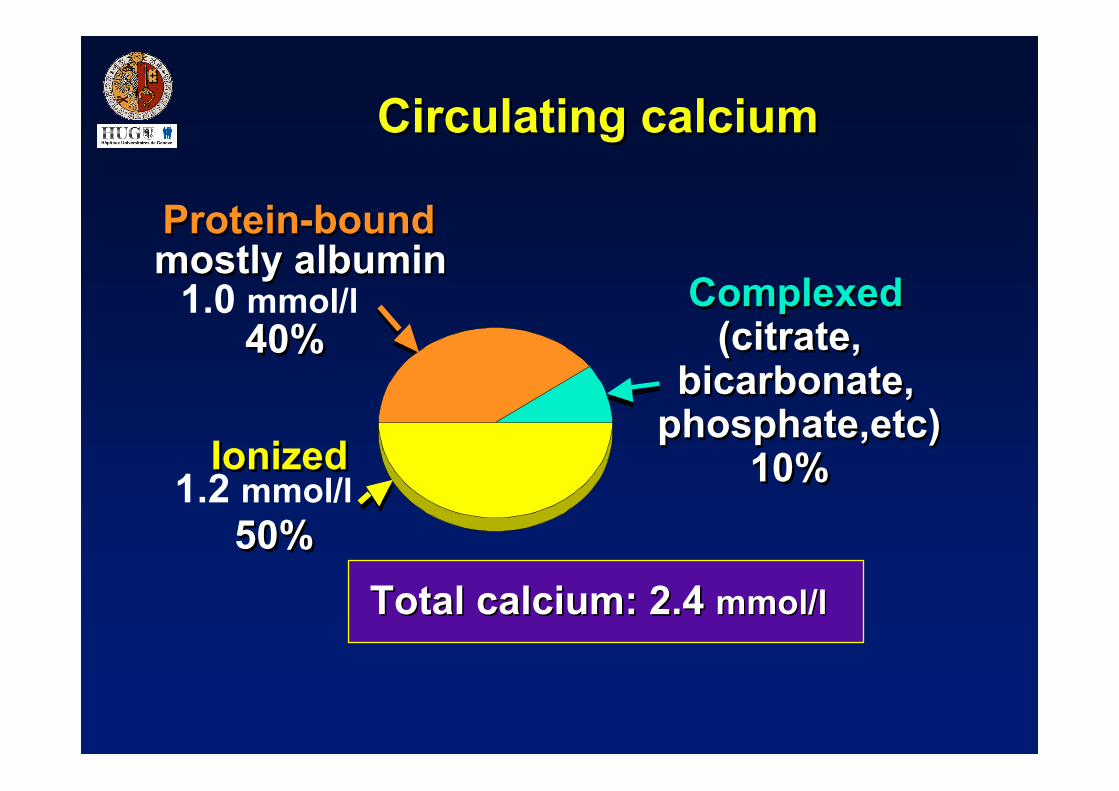
Circulating calciumCirculating calcium
Total calcium: 2.4 Total calcium: 2.4 mmol/lmmol/l
Protein-bound mostly albumin
40%
Protein-bound mostly albumin
1.0 mmol/l 40%
Complexed (citrate,
bicarbonate, phosphate,etc)
10%
Complexed (citrate,
bicarbonate, phosphate,etc)
10%Ionized
50%
Ionized 1.2 mmol/l
50%
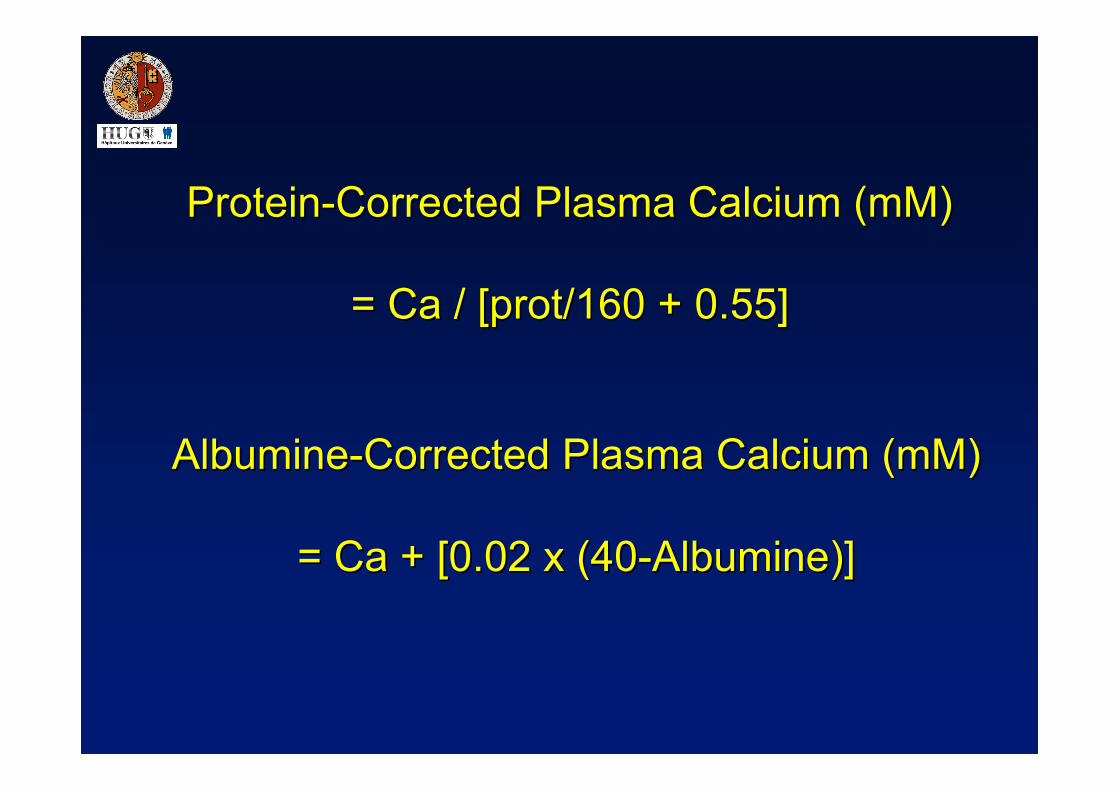
Protein-Corrected Protein-Corrected Plasma Calcium (mM)Plasma Calcium (mM)
= Ca / [= Ca / [prot/160 prot/160 + 0.55]+ 0.55]
Albumine-Corrected Albumine-Corrected Plasma Calcium (mM)Plasma Calcium (mM)
= Ca= Ca + [0.02 x (40-Albumine)]+ [0.02 x (40-Albumine)]
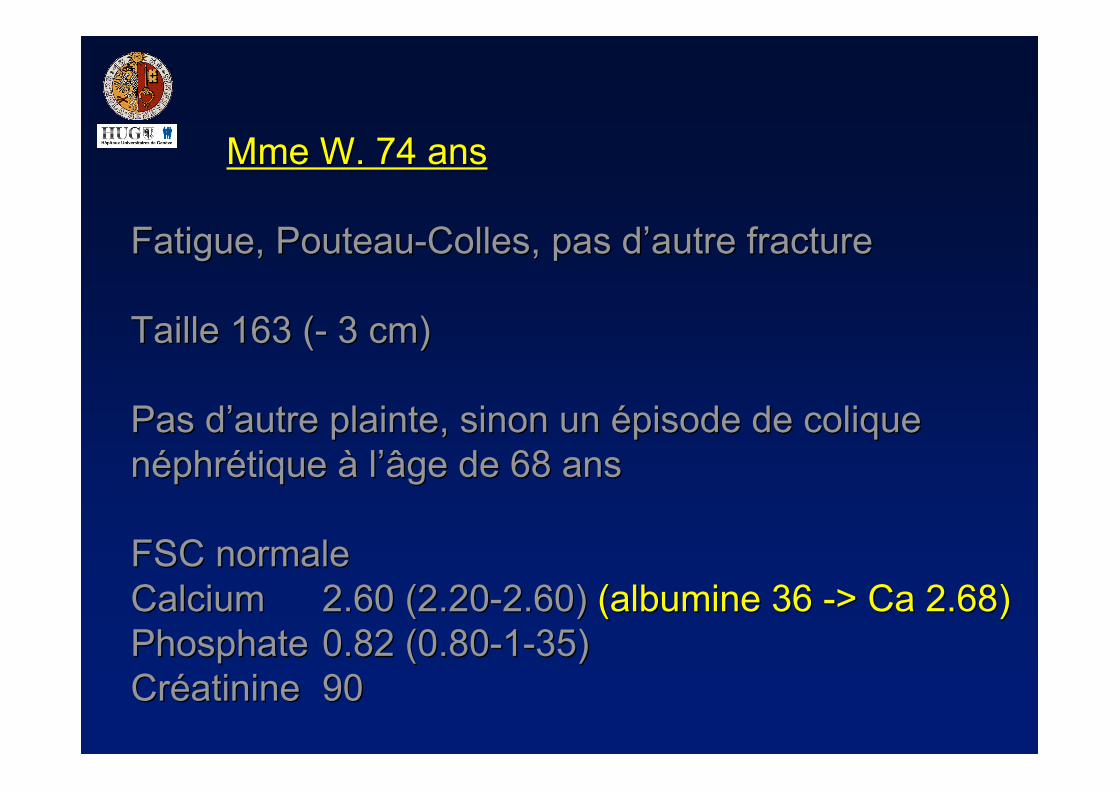
Mme W. 74 ansMme W. 74 ans
Fatigue, Fatigue, Pouteau-CollesPouteau-Colles, pas d, pas d’’autre fractureautre fracture
Taille 163 (- 3 cm)Taille 163 (- 3 cm)
Pas dPas d’’autre plainte, sinon un épisode de coliqueautre plainte, sinon un épisode de coliquenéphrétique à lnéphrétique à l’’âge de 68 ansâge de 68 ans
FSC normaleFSC normaleCalcium Calcium 2.60 (2.20-2.60)2.60 (2.20-2.60) (albumine 36 -> Ca 2.68) (albumine 36 -> Ca 2.68)PhosphatePhosphate 0.82 (0.80-1-35)0.82 (0.80-1-35)CréatinineCréatinine 9090
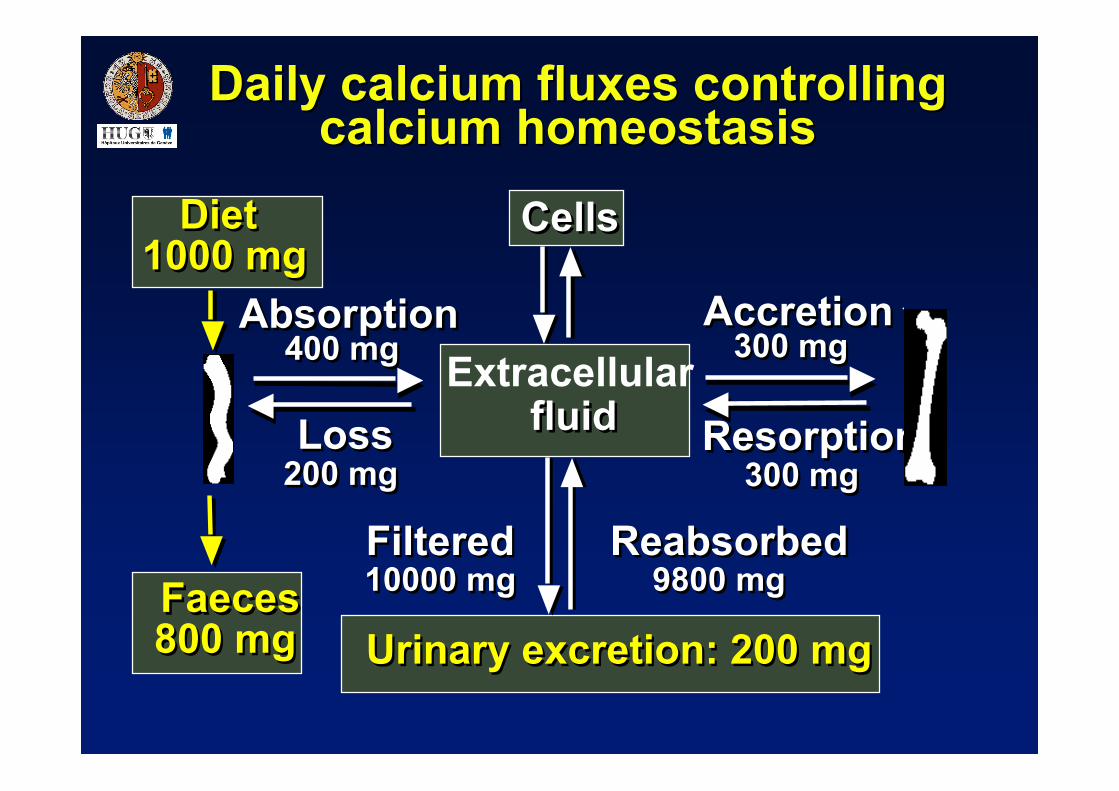
Daily calcium fluxes controllingDaily calcium fluxes controlling calcium homeostasiscalcium homeostasis
Diet 1000 mg
Diet 1000 mg
Faeces 800 mgFaeces 800 mg
Absorption 400 mg
Absorption 400 mg
Loss 200 mgLoss
200 mg
Filtered 10000 mgFiltered 10000 mg
Reabsorbed 9800 mg
Reabsorbed 9800 mg
CellsCells
fluid
Extracellular fluid
Urinary excretion: 200 mgUrinary excretion: 200 mg
Accretion 300 mg
Accretion 300 mg
Resorption 300 mg
Resorption 300 mg
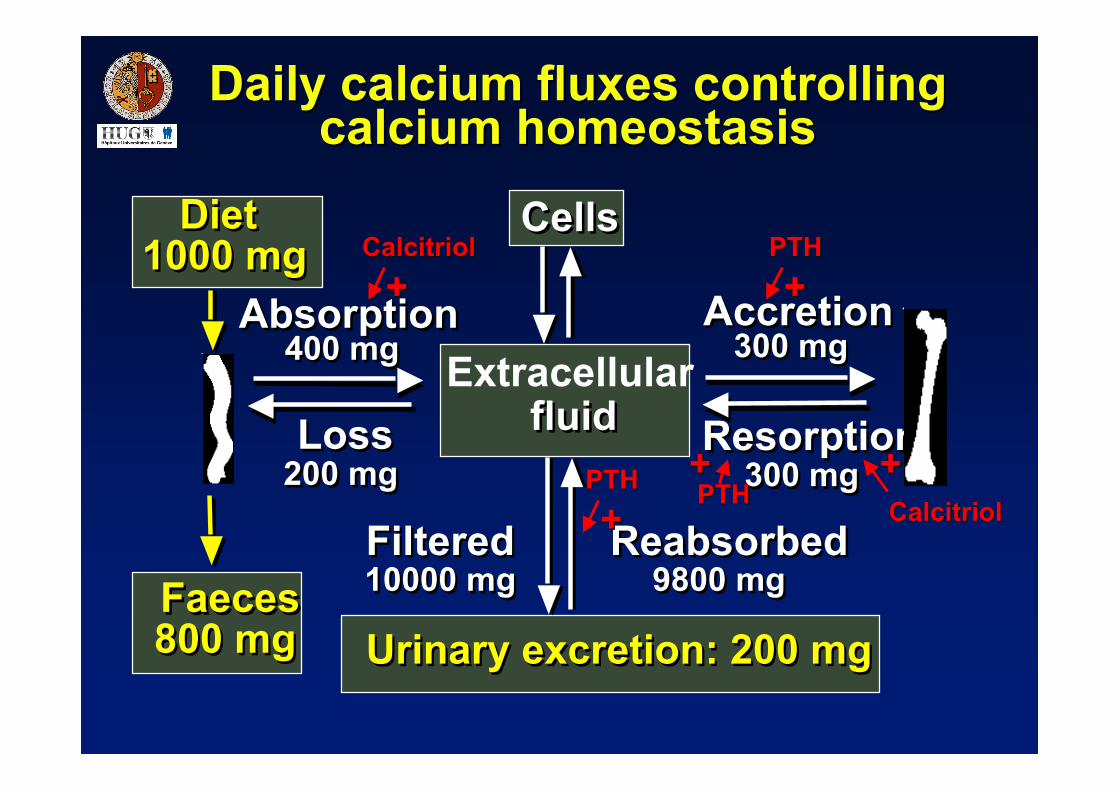
CalcitriolCalcitriol
CalcitriolCalcitriol
++
++
PTHPTH++
PTHPTH++
PTHPTH++
• Skeleton
• Skeleton
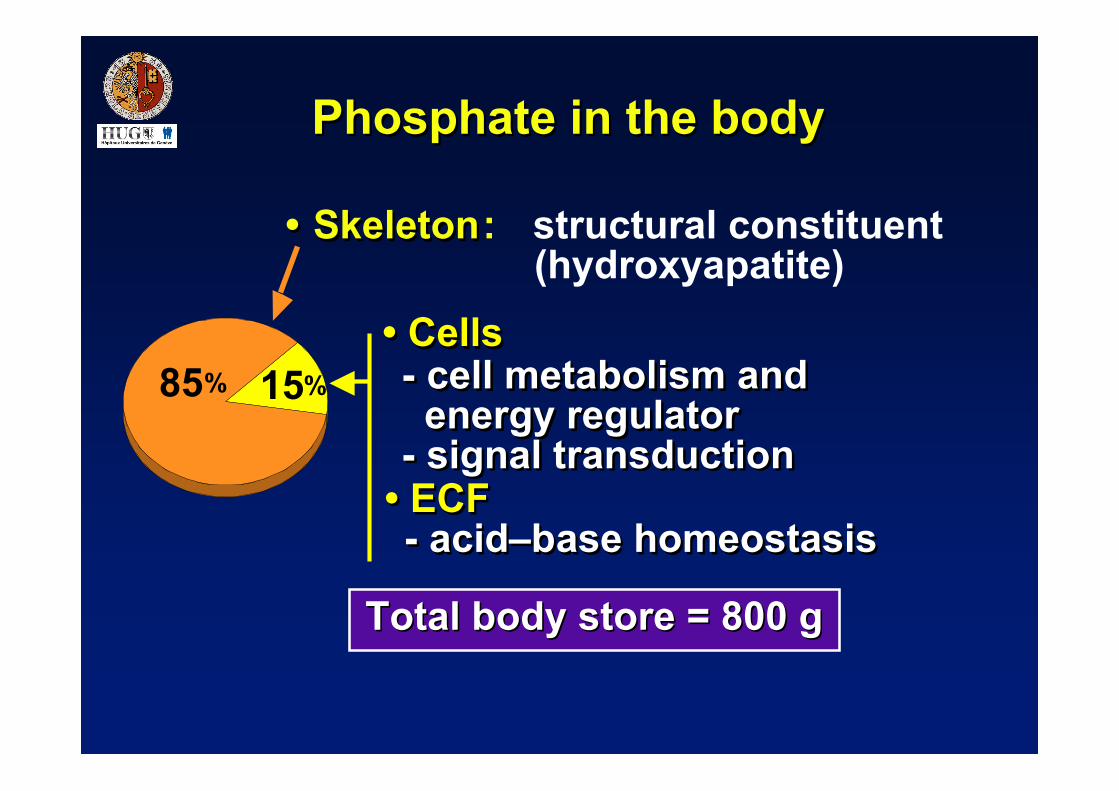
Phosphate in the bodyPhosphate in the body
: structural constituent (hydroxyapatite)
• Cells• Cells- cell metabolism and energy regulator - signal transduction
- cell metabolism and energy regulator - signal transduction
Total body store = 800 gTotal body store = 800 g
• ECF• ECF - acid–base homeostasis - acid–base homeostasis
85% 15%
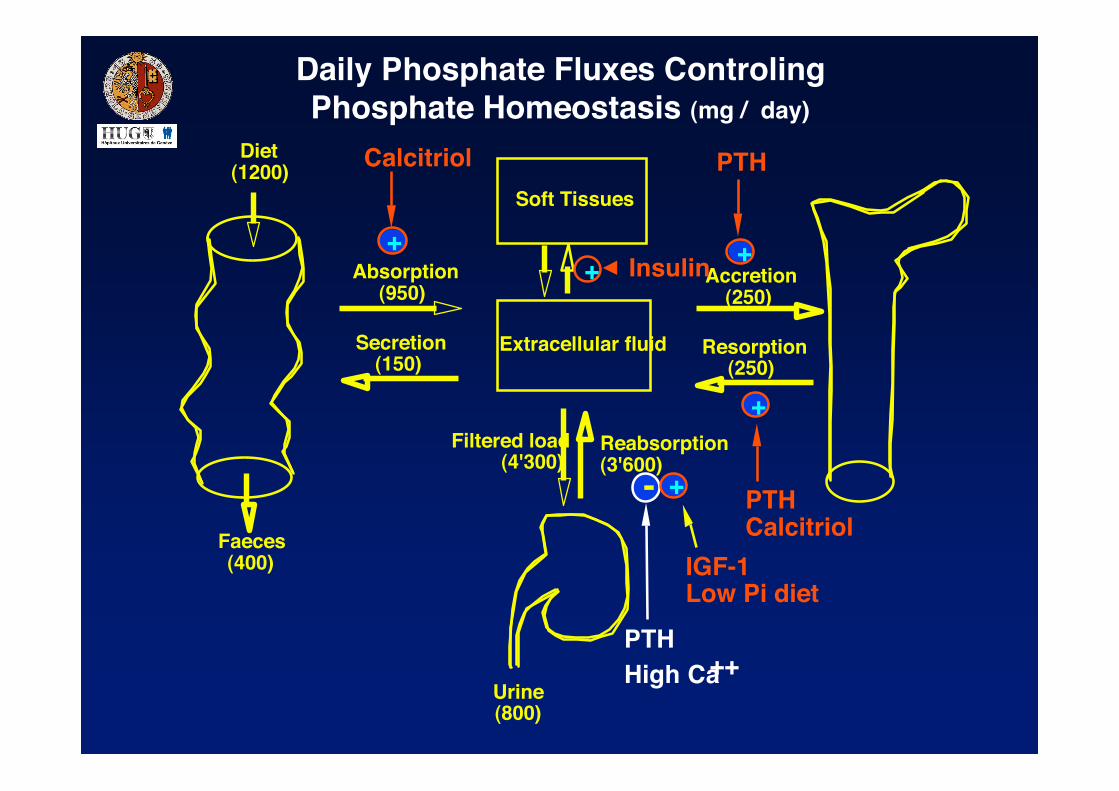
Daily Phosphate Fluxes ControlingPhosphate Homeostasis (mg / day)
Absorption(950)
Secretion (150)
Accretion(250)
Resorption(250)
Soft Tissues
Extracellular fluid
Diet (1200)
Faeces (400)
Filtered load(4'300)
Reabsorption(3'600)
Urine (800)
Absorption(950)
Secretion (150)
Accretion(250)
Resorption(250)
Soft Tissues
Extracellular fluid
Diet (1200)
Faeces (400)
Filtered load(4'300)
Reabsorption(3'600)
Urine (800)
PTHHigh Ca++
PTHCalcitriol
PTHCalcitriol
IGF-1Low Pi diet
+ +
+
+-
Insulin+
Daily Phosphate Fluxes ControlingPhosphate Homeostasis (mg / day)
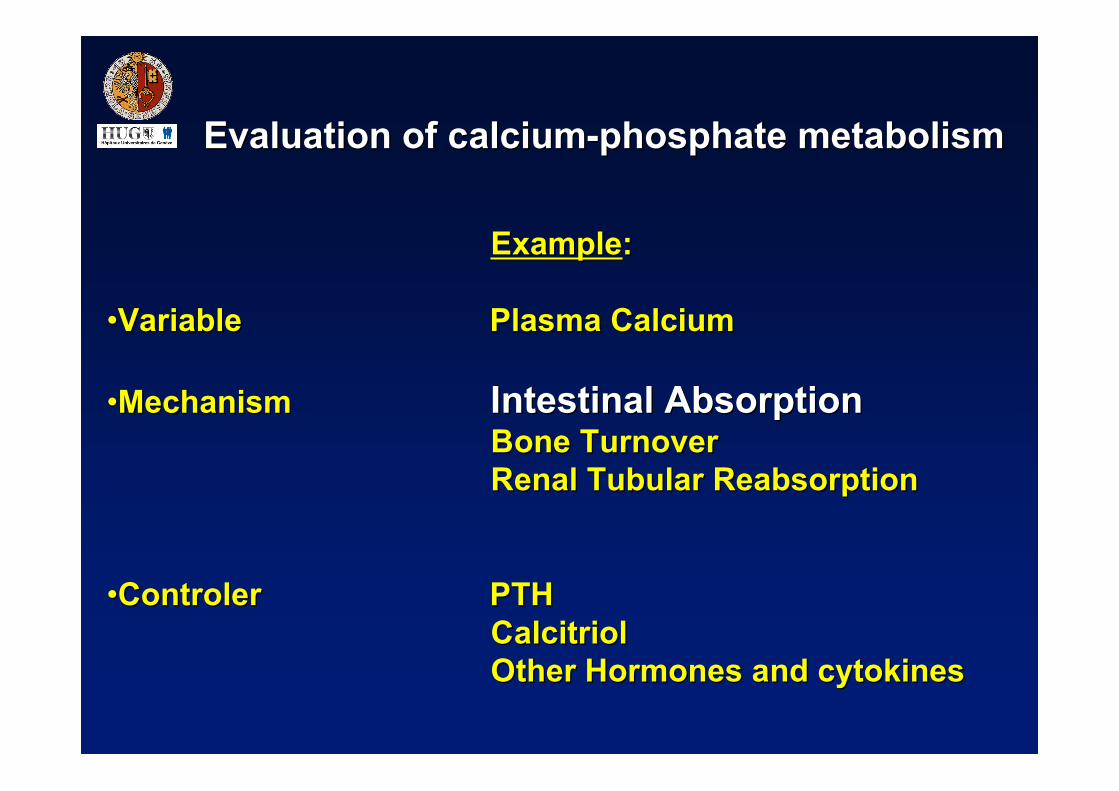
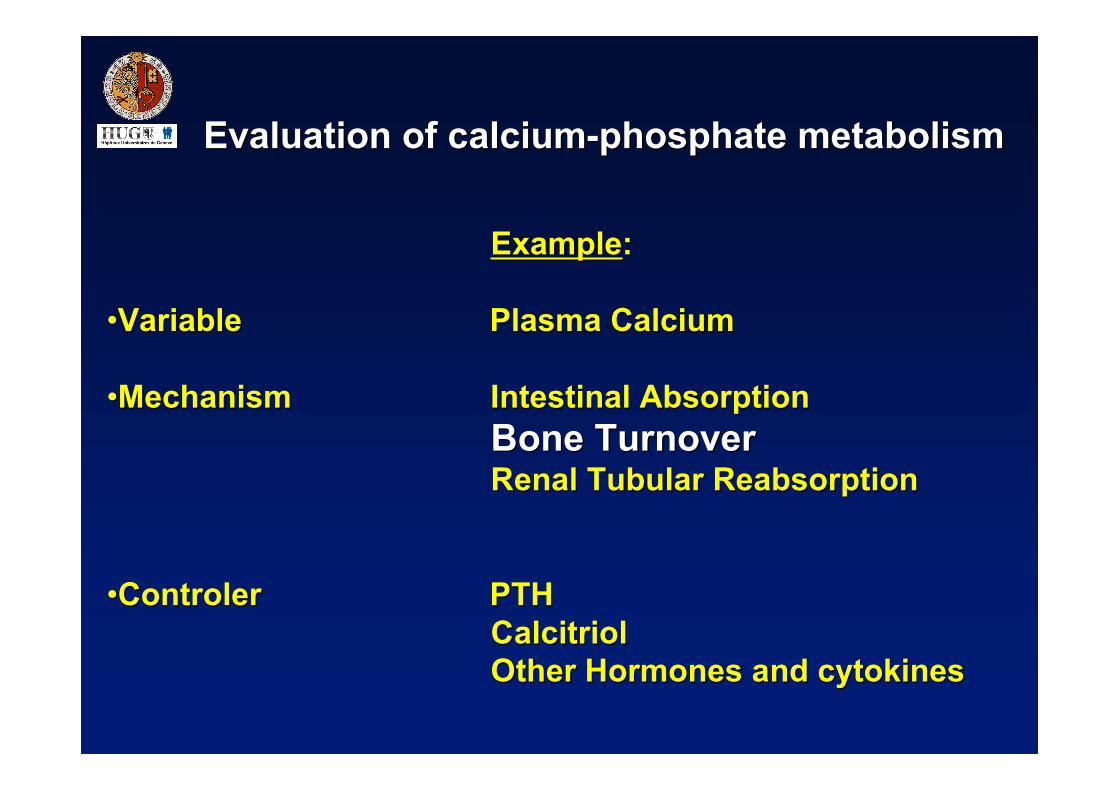
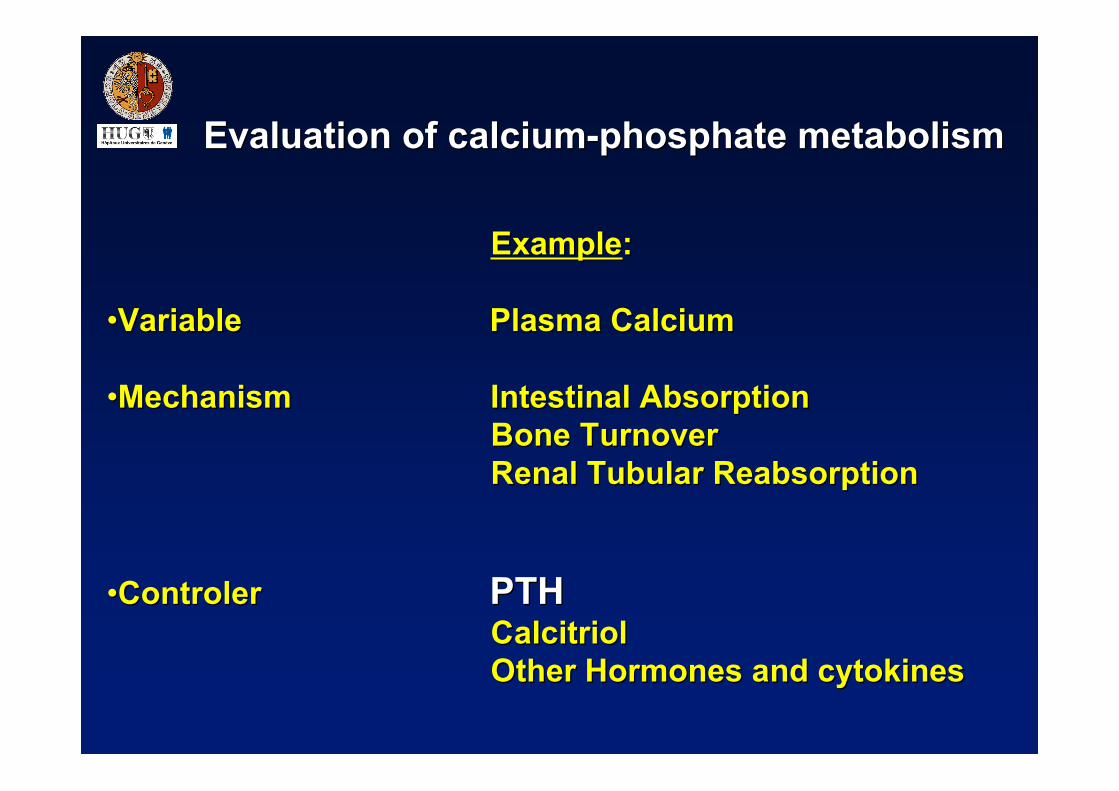
Evaluation of Evaluation of calcium-phosphate metabolismcalcium-phosphate metabolism
ExampleExample::
••VariableVariable Plasma CalciumPlasma Calcium
••MechanismMechanism Intestinal AbsorptionIntestinal AbsorptionBone Bone TurnoverTurnoverRenal Tubular ReabsorptionRenal Tubular Reabsorption
••ControlerControler PTHPTHCalcitriolCalcitriolOther Other Hormones Hormones and and cytokinescytokines
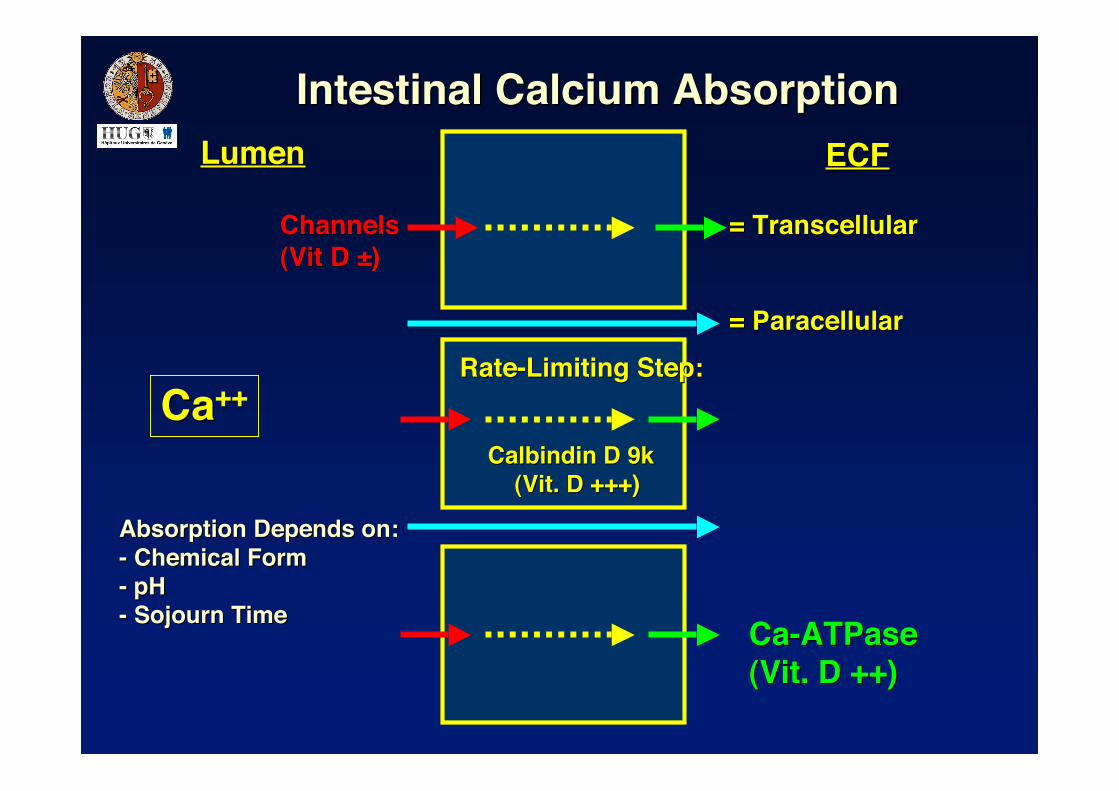
Intestinal Calcium AbsorptionIntestinal Calcium Absorption
Calbindin Calbindin D 9kD 9k (Vit. D +++) (Vit. D +++)
LumenLumen ECFECF
Ca-ATPaseCa-ATPase(Vit. D ++)(Vit. D ++)
ChannelsChannels(Vit D ±)(Vit D ±)
CaCa++++Rate-Rate-Limiting StepLimiting Step::
== Transcellular Transcellular
��= ��= ParacellularParacellular
Absorption Absorption Depends Depends on:on:-- Chemical Form Chemical Form- pH- pH-- Sojourn Sojourn Time Time
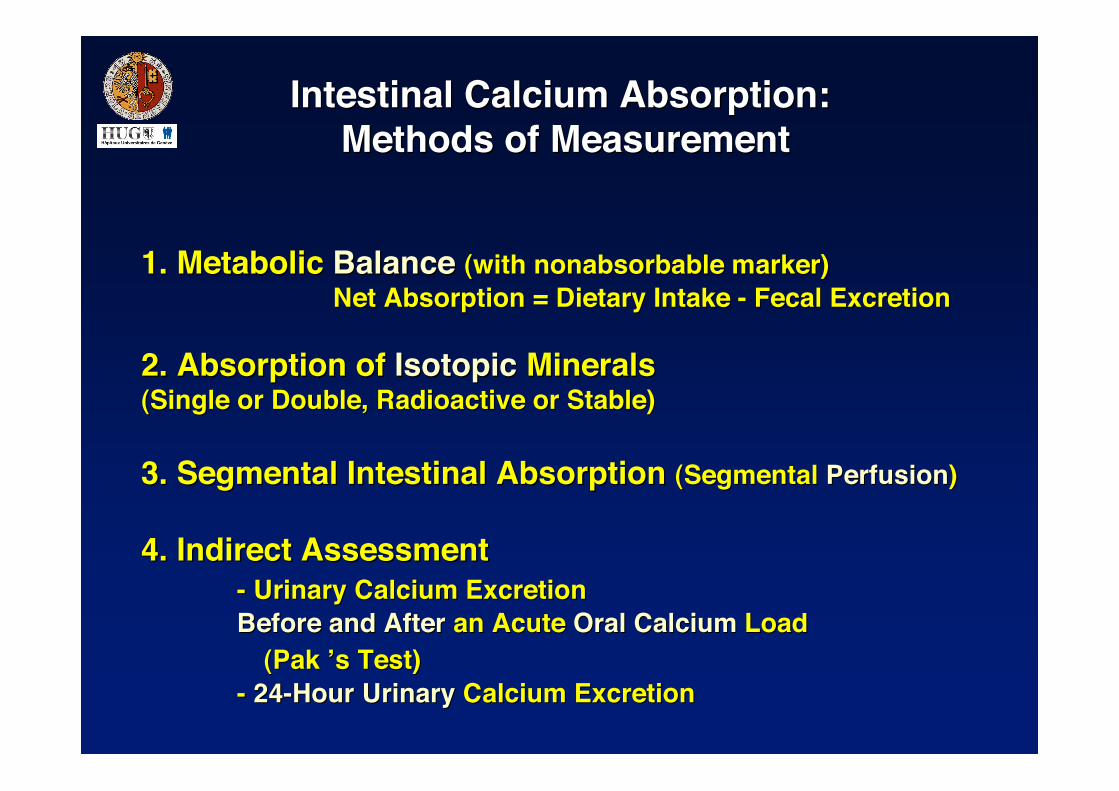
Intestinal Calcium Absorption:Intestinal Calcium Absorption: Methods Methods of of MeasurementMeasurement
1. 1. Metabolic Metabolic BalanceBalance ((with nonabsorbable with nonabsorbable marker)marker)Net Absorption = Net Absorption = Dietary Intake Dietary Intake - - Fecal ExcretionFecal Excretion
2. Absorption of 2. Absorption of IsotopicIsotopic Minerals Minerals (Single or Double, Radioactive or Stable)(Single or Double, Radioactive or Stable)
3. Segmental Intestinal Absorption 3. Segmental Intestinal Absorption (Segmental (Segmental PerfusionPerfusion))
4. Indirect 4. Indirect AssessmentAssessment- - Urinary Urinary Calcium Calcium Excretion Excretion Before and AfterBefore and After an Acute an Acute Oral CalciumOral Calcium LoadLoad ((PakPak ’’s Test)s Test)- - 24-Hour24-Hour Urinary Urinary Calcium Calcium ExcretionExcretion
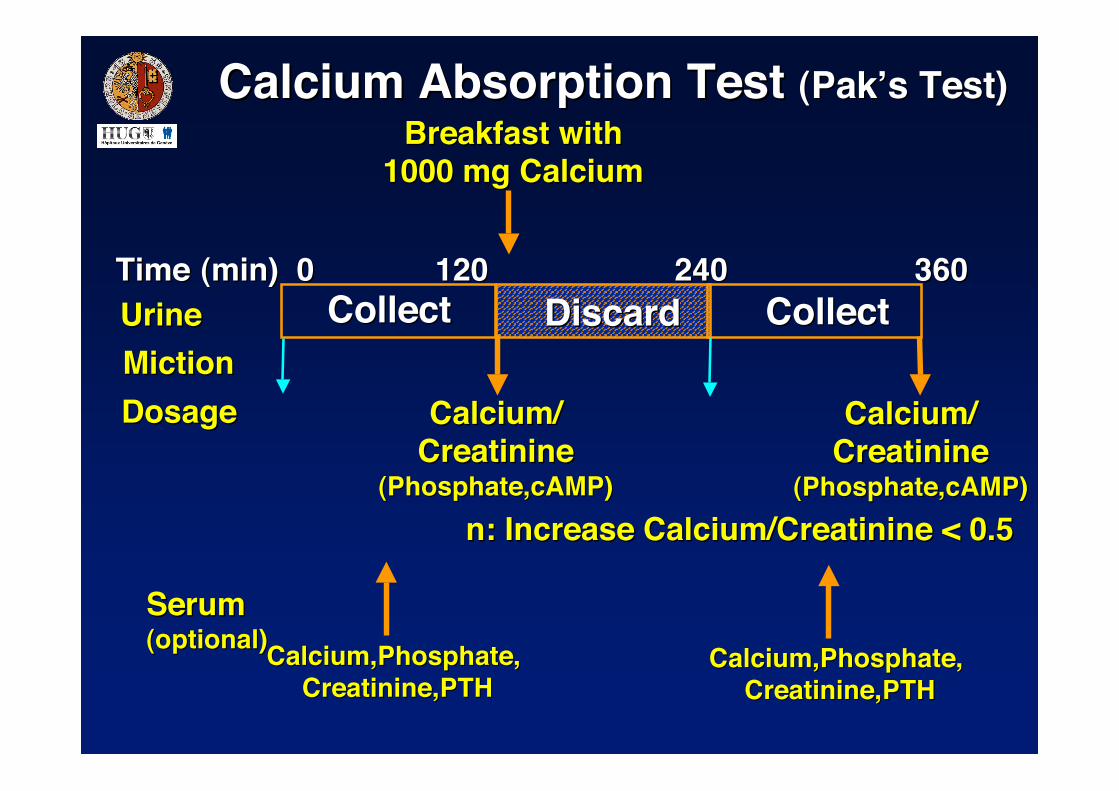
Calcium Absorption Test Calcium Absorption Test (Pak(Pak’’s Test)s Test)
TimeTime (min) 0(min) 0 120120 240240 360360UrineUrine CollectCollect CollectCollect
BreakfastBreakfast with with1000 mg Calcium1000 mg Calcium
DiscardDiscardMictionMiction
Calcium/Calcium/CreatinineCreatinine
(Phosphate,cAMP)(Phosphate,cAMP)
DosageDosage Calcium/Calcium/CreatinineCreatinine
(Phosphate,cAMP)(Phosphate,cAMP)
SerumSerum((optionaloptional))Calcium,Phosphate,Calcium,Phosphate,
CreatinineCreatinine,PTH,PTHCalcium,Phosphate,Calcium,Phosphate,
CreatinineCreatinine,PTH,PTH
n:n: Increase Increase Calcium/ Calcium/CreatinineCreatinine < 0.5 < 0.5
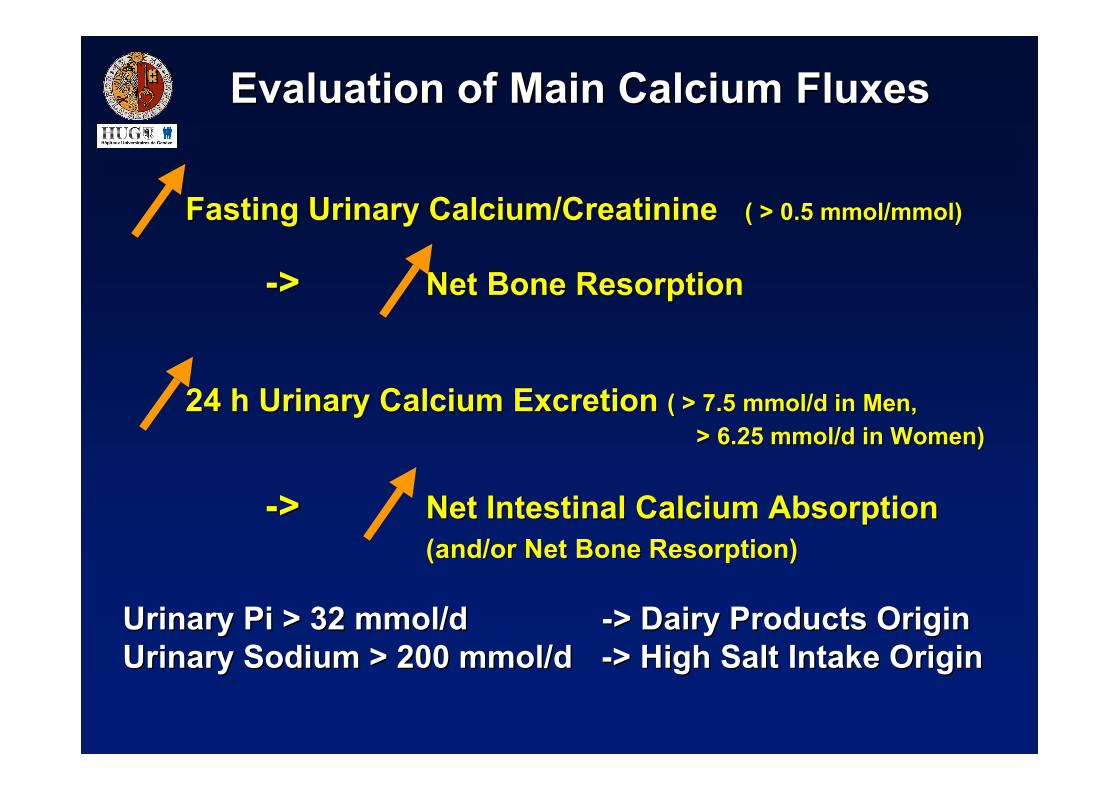
Evaluation of Main CalciumEvaluation of Main Calcium FluxesFluxes
Fasting Urinary Calcium/CreatinineFasting Urinary Calcium/Creatinine ( > 0.5( > 0.5 mmol/mmol mmol/mmol))
-> -> NetNet Bone Resorption Bone Resorption
24 h24 h Urinary Urinary CalciumCalcium Excretion Excretion ( > 7.5( > 7.5 mmol/d mmol/d inin Men Men,, > 6.25> 6.25 mmol/d mmol/d inin Women Women))
->-> Net Intestinal Calcium AbsorptionNet Intestinal Calcium Absorption((and/or and/or NetNet Bone Resorption Bone Resorption))
UrinaryUrinary Pi > 32 Pi > 32 mmol mmol/d /d -> -> Dairy Products OriginDairy Products OriginUrinaryUrinary Sodium > 200 Sodium > 200 mmol mmol/d /d -> -> HighHigh Salt Salt Intake Origin Intake Origin
Evaluation of Evaluation of calcium-phosphate metabolismcalcium-phosphate metabolism
ExampleExample::
••VariableVariable Plasma CalciumPlasma Calcium
••MechanismMechanism Intestinal AbsorptionIntestinal AbsorptionBone Bone TurnoverTurnoverRenal Tubular ReabsorptionRenal Tubular Reabsorption
••ControlerControler PTHPTHCalcitriolCalcitriolOther Other Hormones Hormones and and cytokinescytokines
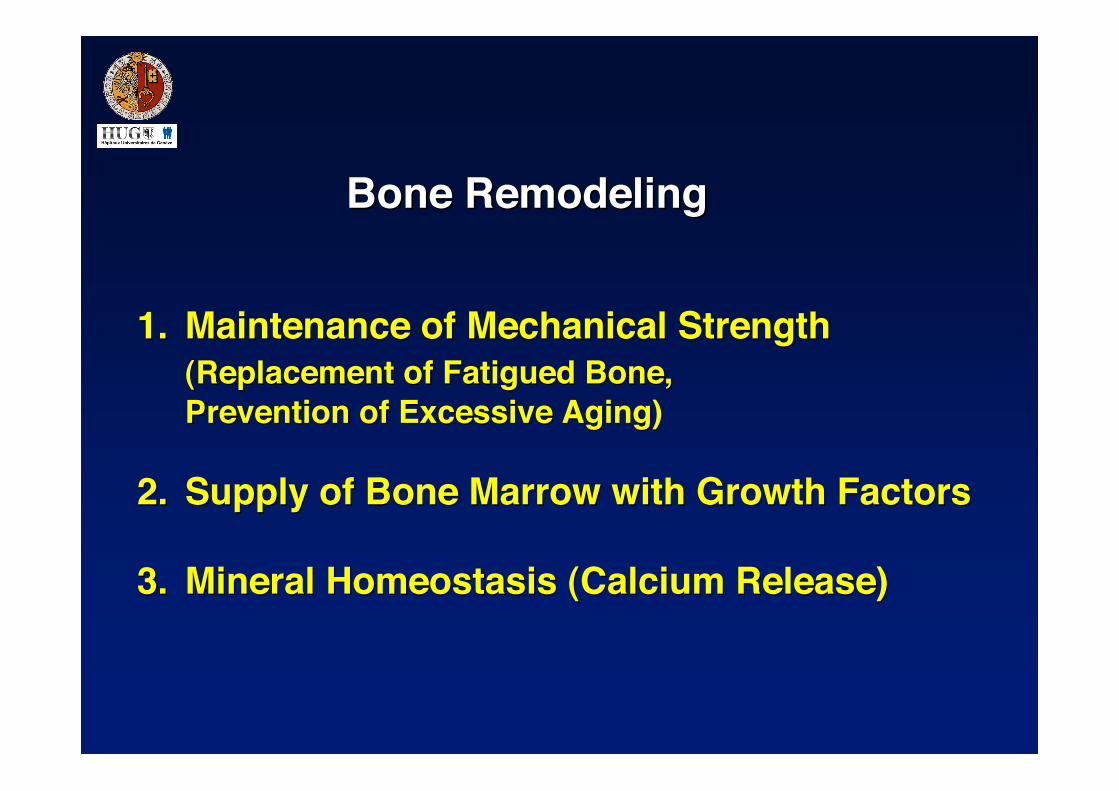
Bone RemodelingBone Remodeling
1.1. Maintenance of Maintenance of Mechanical StrengthMechanical Strength(Replacement of (Replacement of Fatigued BoneFatigued Bone, , Prevention Prevention of Excessive of Excessive AgingAging))
2.2. Supply Supply of of Bone Marrow with Growth FactorsBone Marrow with Growth Factors
3.3. Mineral Homeostasis Mineral Homeostasis (Calcium Release)(Calcium Release)
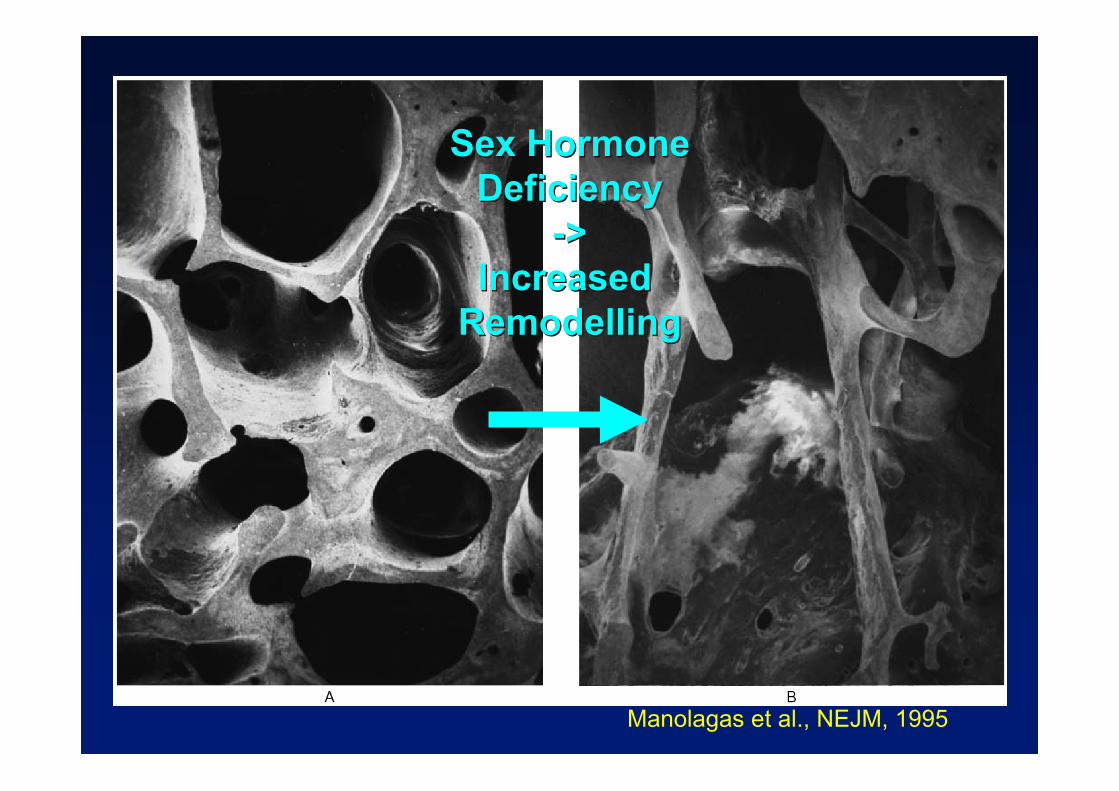
Manolagas et al., NEJM, 1995
Sex Sex HormoneHormoneDeficiencyDeficiency
->->Increased Increased
RemodellingRemodelling
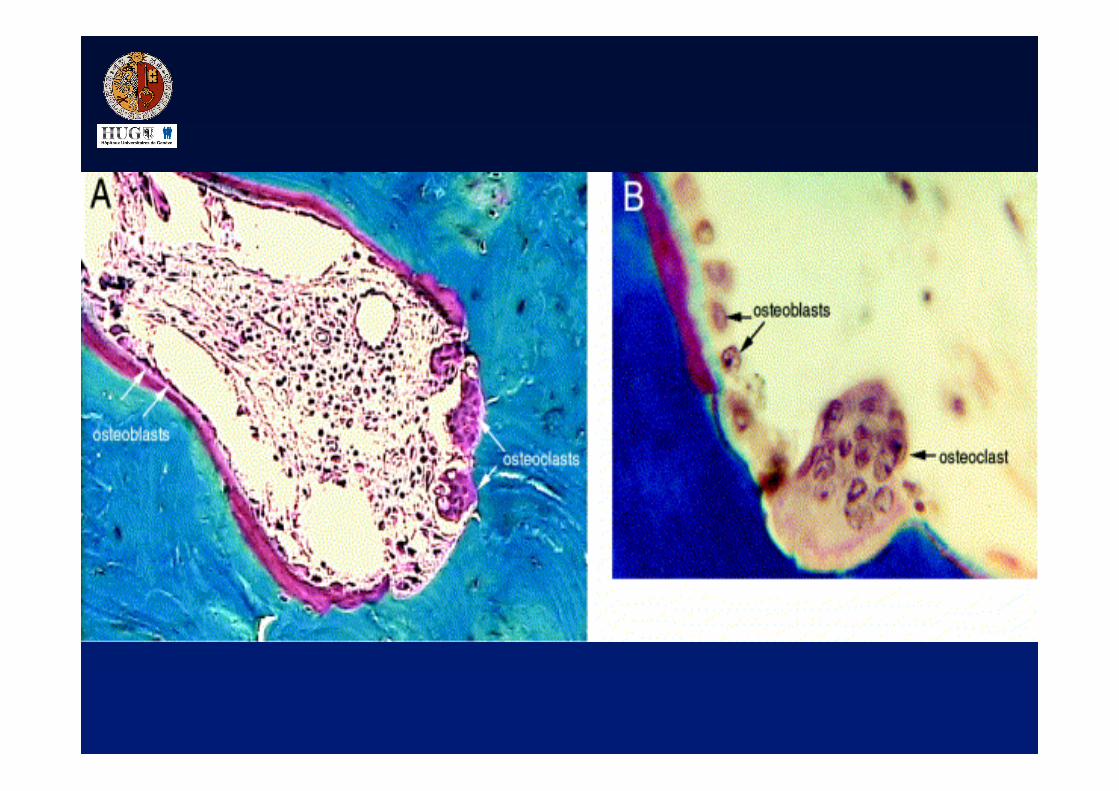
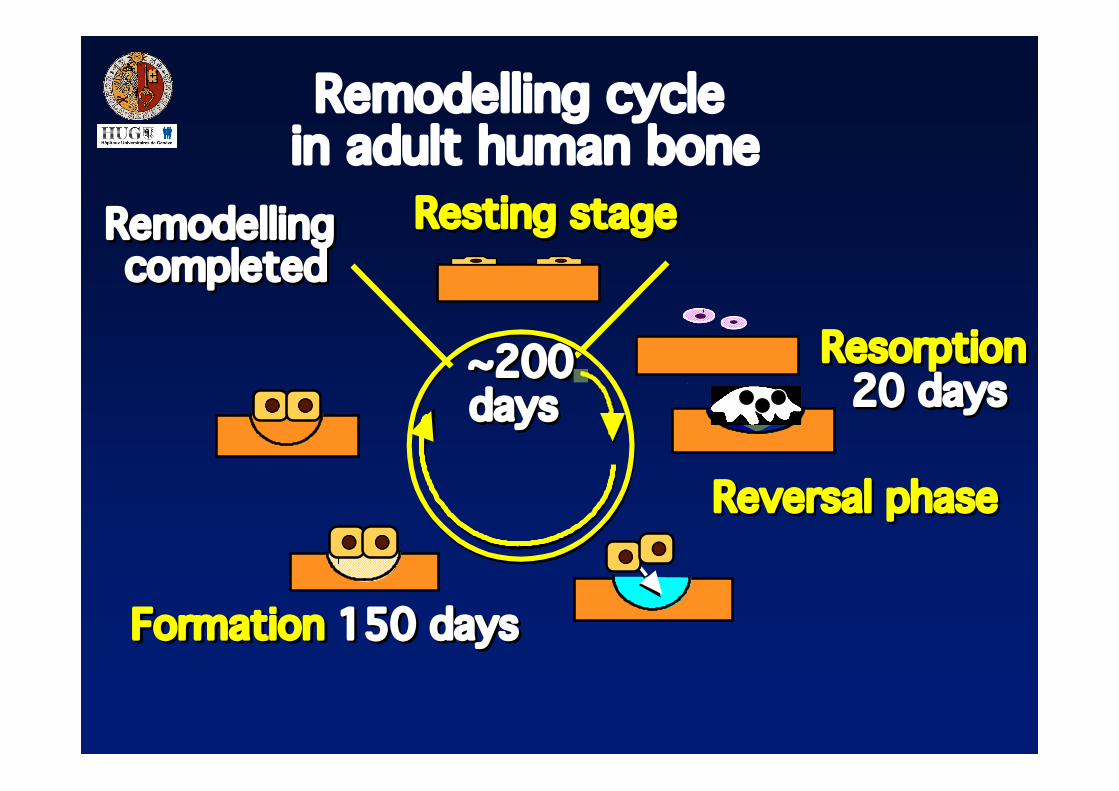
Remodelling cycle in adult human bone
Remodelling completed
Remodelling completed
Resting stageResting stage
Resorption 20 days
Resorption 20 days
Formation 150 daysFormation 150 days
Reversal phaseReversal phase
~200 days~200 days
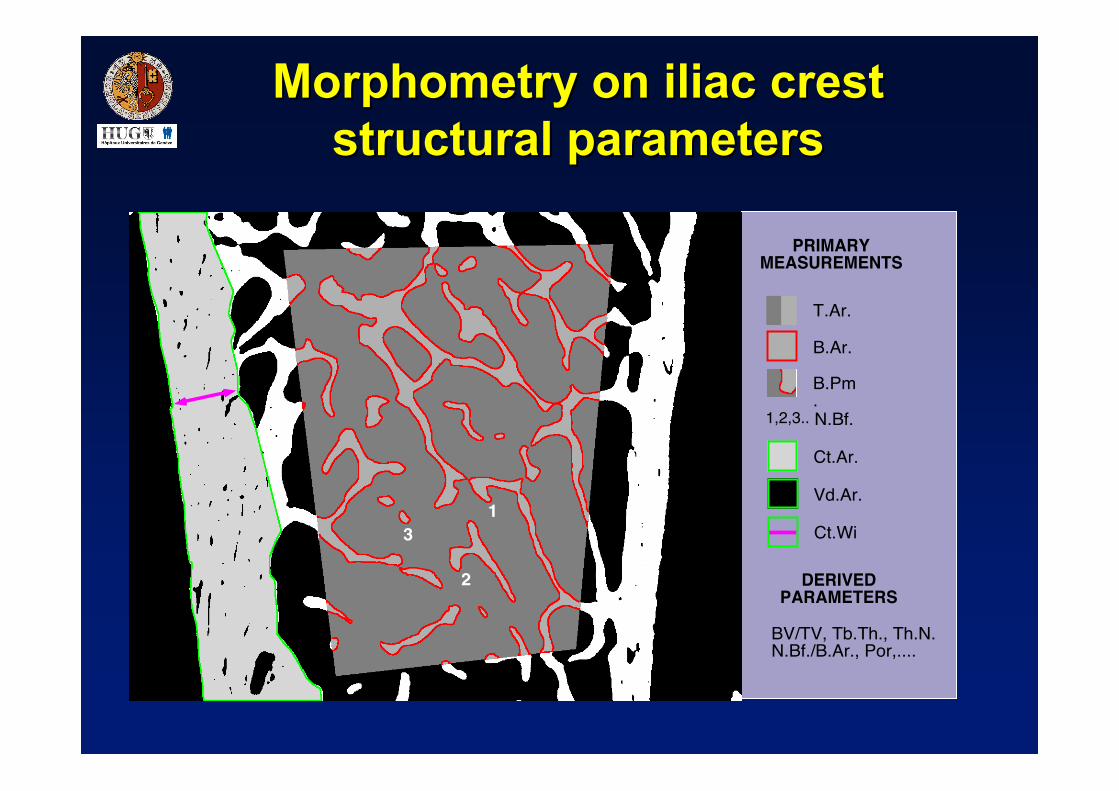
B.Ar.
B.Pm.
1,2,3..
Ct.Ar.
Ct.Wi
Vd.Ar.
T.Ar.
N.Bf.
PRIMARYMEASUREMENTS
DERIVEDPARAMETERS
BV/TV, Tb.Th., Th.N.N.Bf./B.Ar., Por,....
1
2
3
Morphometry Morphometry on iliac creston iliac creststructural parametersstructural parameters
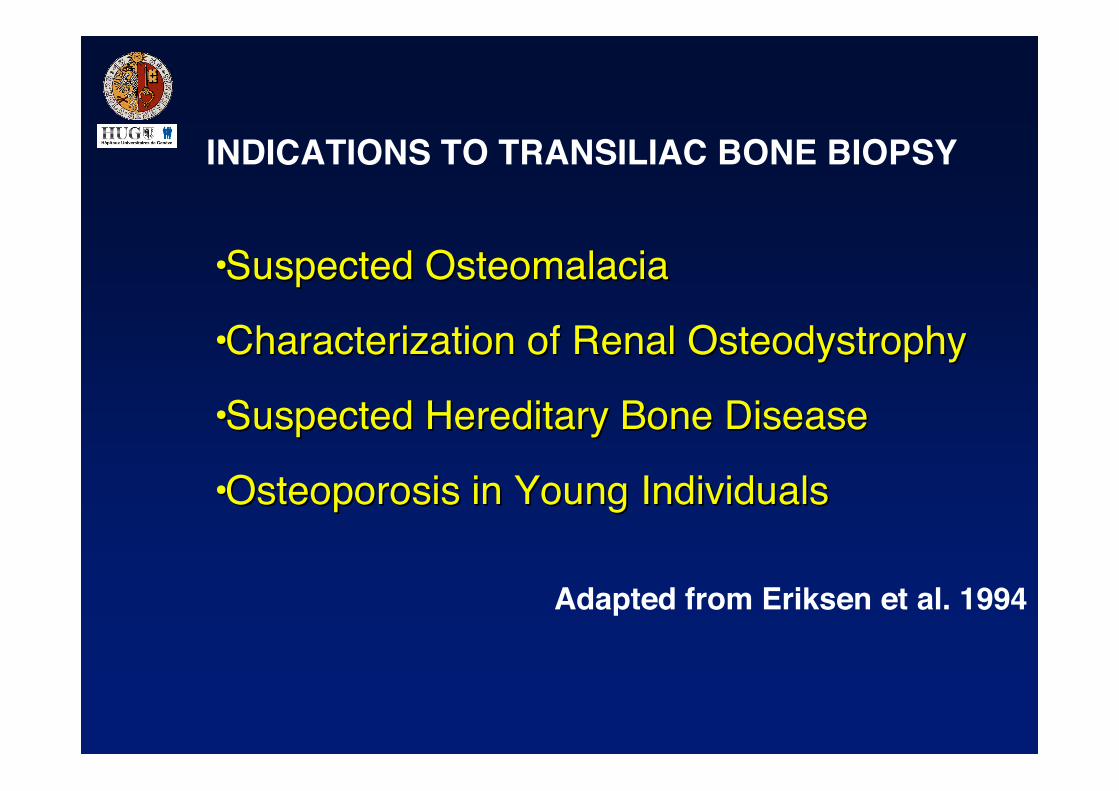
INDICATIONS TO TRANSILIAC BONE BIOPSY
••Suspected OsteomalaciaSuspected Osteomalacia
••Characterization Characterization of of Renal OsteodystrophyRenal Osteodystrophy
••Suspected Hereditary Bone DiseaseSuspected Hereditary Bone Disease
••Osteoporosis Osteoporosis in Youngin Young Individuals Individuals
Adapted from Eriksen et al. 1994
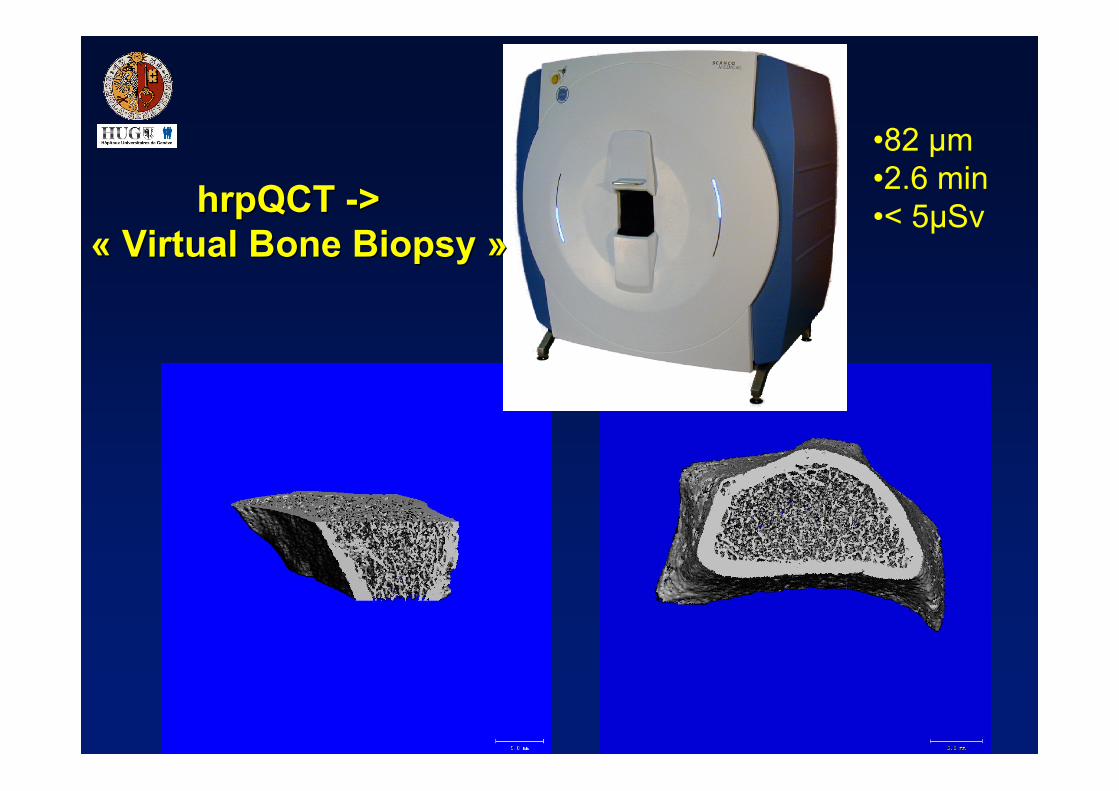
•82 µm•2.6 min•< 5µSvhrpQCT hrpQCT ->->
«« Virtual Virtual Bone BiopsyBone Biopsy »»
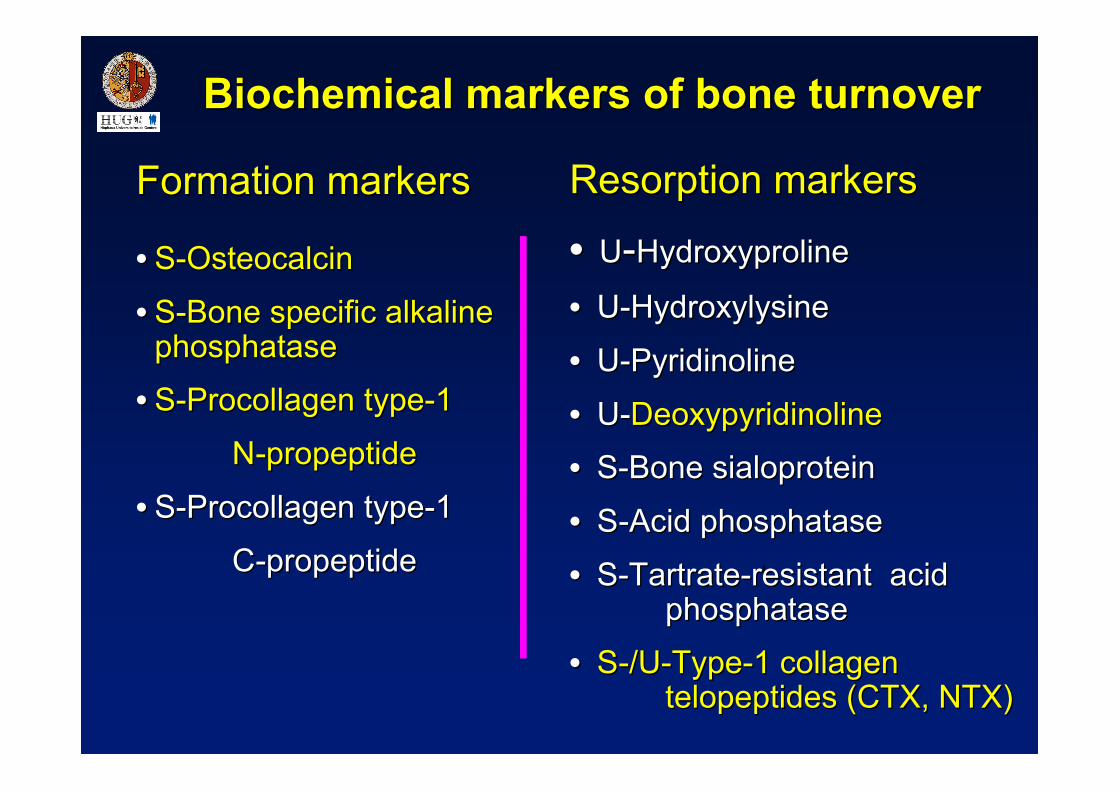
Biochemical markers of bone turnoverBiochemical markers of bone turnover
Formation markersFormation markers
•• S-OsteocalcinS-Osteocalcin
•• S-Bone specific alkaline S-Bone specific alkaline phosphatasephosphatase
•• S-Procollagen S-Procollagen type-1 type-1
N-propeptideN-propeptide
•• S-Procollagen S-Procollagen type-1 type-1
C-propeptideC-propeptide
Resorption markersResorption markers
•• UU--HydroxyprolineHydroxyproline
•• U-Hydroxylysine U-Hydroxylysine
•• U-Pyridinoline U-Pyridinoline
•• U- U-DeoxypyridinolineDeoxypyridinoline
•• S-Bone sialoprotein S-Bone sialoprotein
•• S-Acid S-Acid phosphatasephosphatase
•• S-Tartrate-resistant S-Tartrate-resistant acidacidphosphatasephosphatase
•• S-/U-Type-1 S-/U-Type-1 collagen collagen telopeptides telopeptides (CTX, NTX)(CTX, NTX)
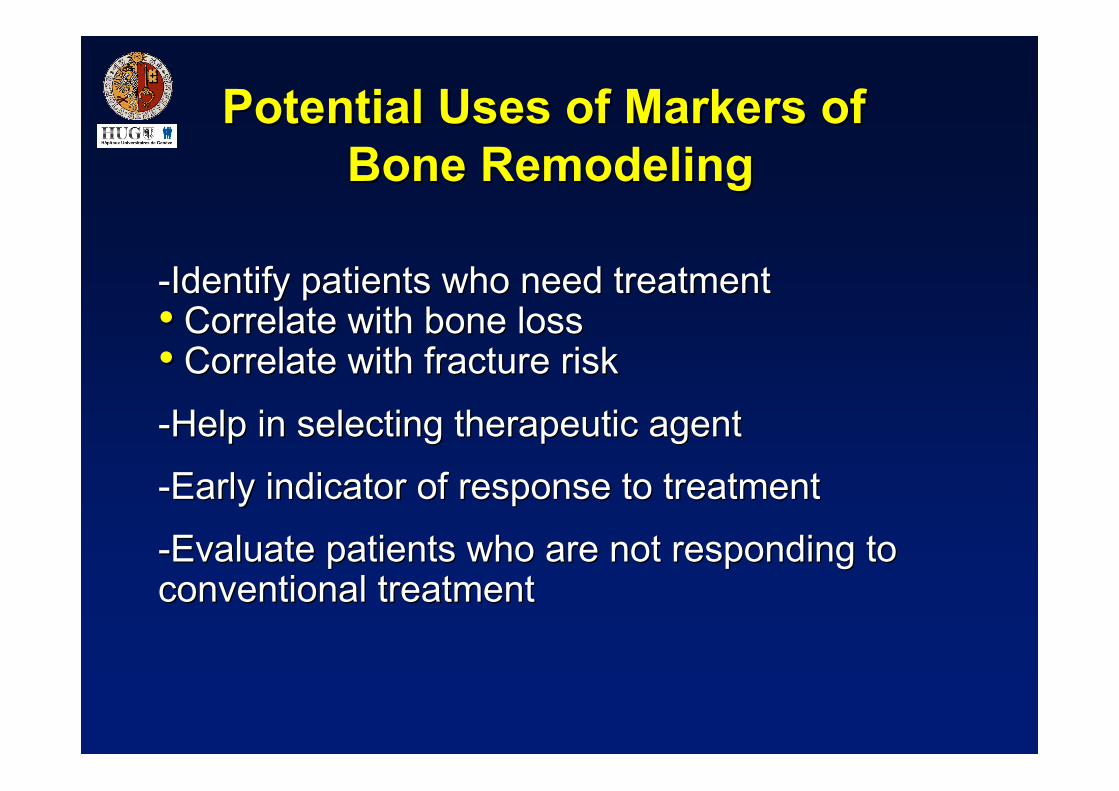
Potential Uses of Markers of Potential Uses of Markers of Bone RemodelingBone Remodeling
-Identify patients who need treatment-Identify patients who need treatment•• Correlate with bone lossCorrelate with bone loss•• Correlate with fracture riskCorrelate with fracture risk
-Help in selecting therapeutic agent-Help in selecting therapeutic agent
-Early indicator of response to treatment-Early indicator of response to treatment
-Evaluate patients who are not responding to-Evaluate patients who are not responding toconventional treatmentconventional treatment
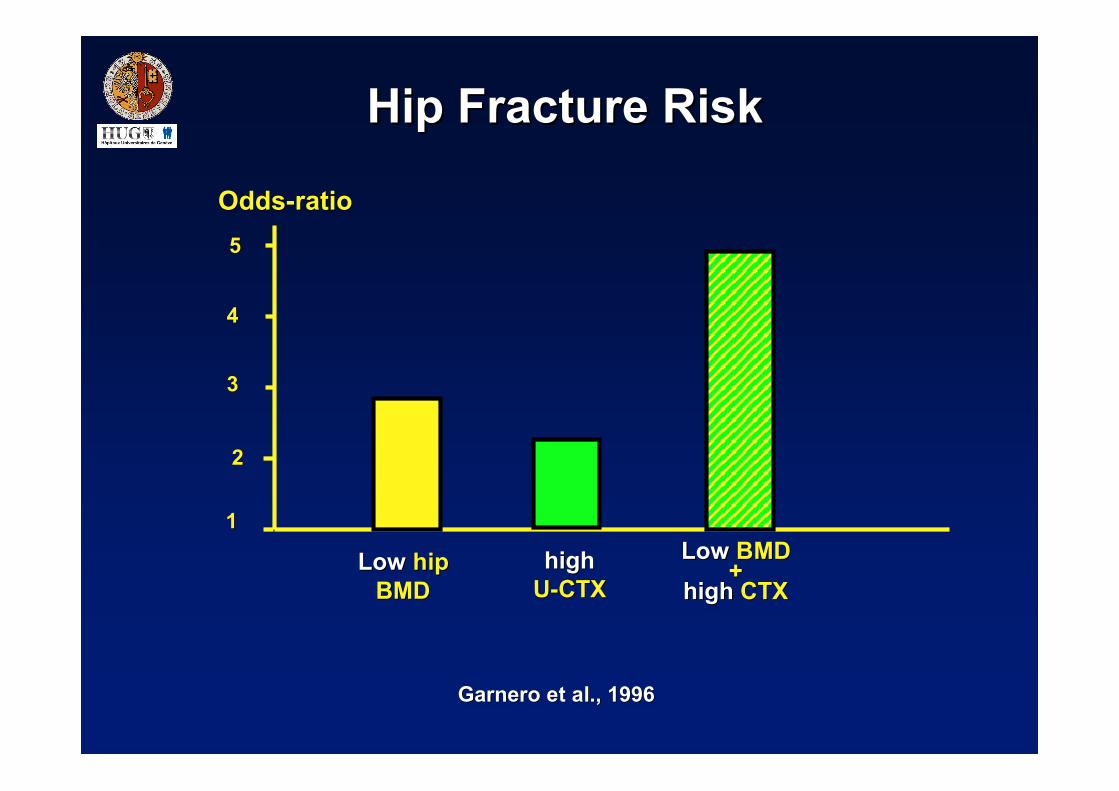
11
22
33
44
55
Odds-ratioOdds-ratio
LowLow hiphipBMDBMD
highhighU-CTXU-CTX
LowLow BMDBMD++
highhigh CTXCTX
Garnero Garnero et et alal., 1996., 1996
Hip Fracture Hip Fracture RiskRisk
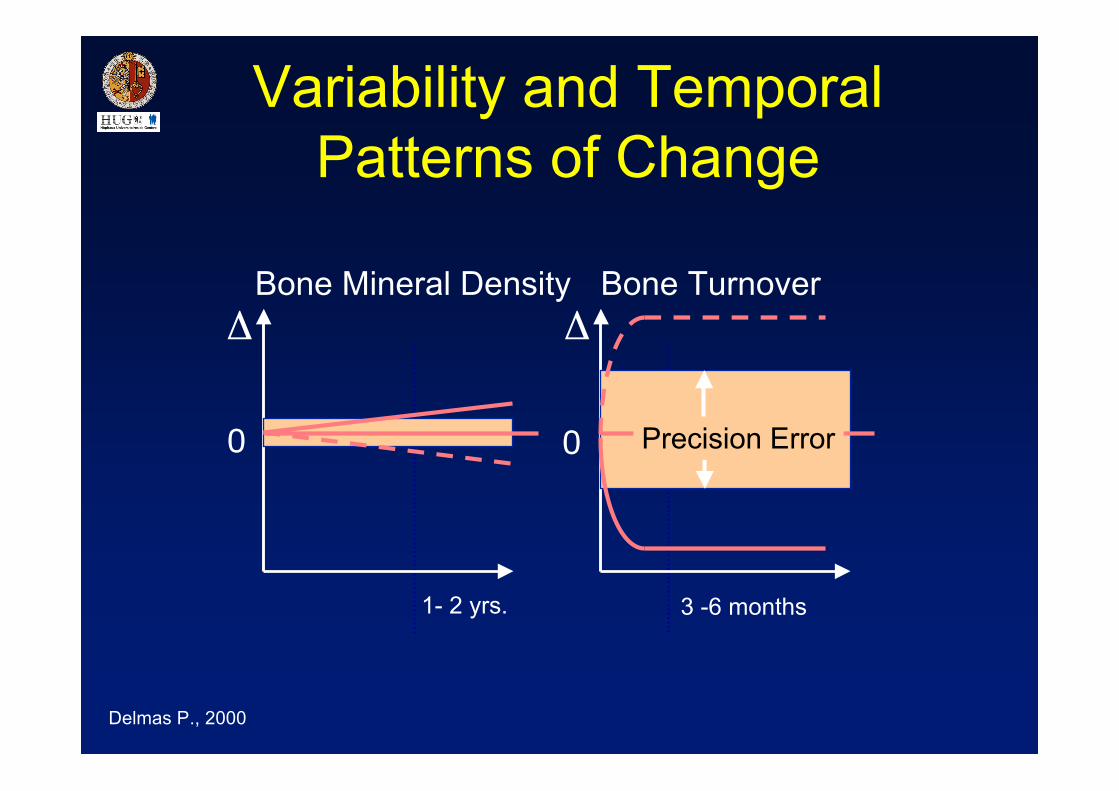
Variability and TemporalPatterns of Change
Delmas P., 2000
1- 2 yrs. 3 -6 months
Bone Mineral Density Bone TurnoverΔ Δ
Precision Error0 0
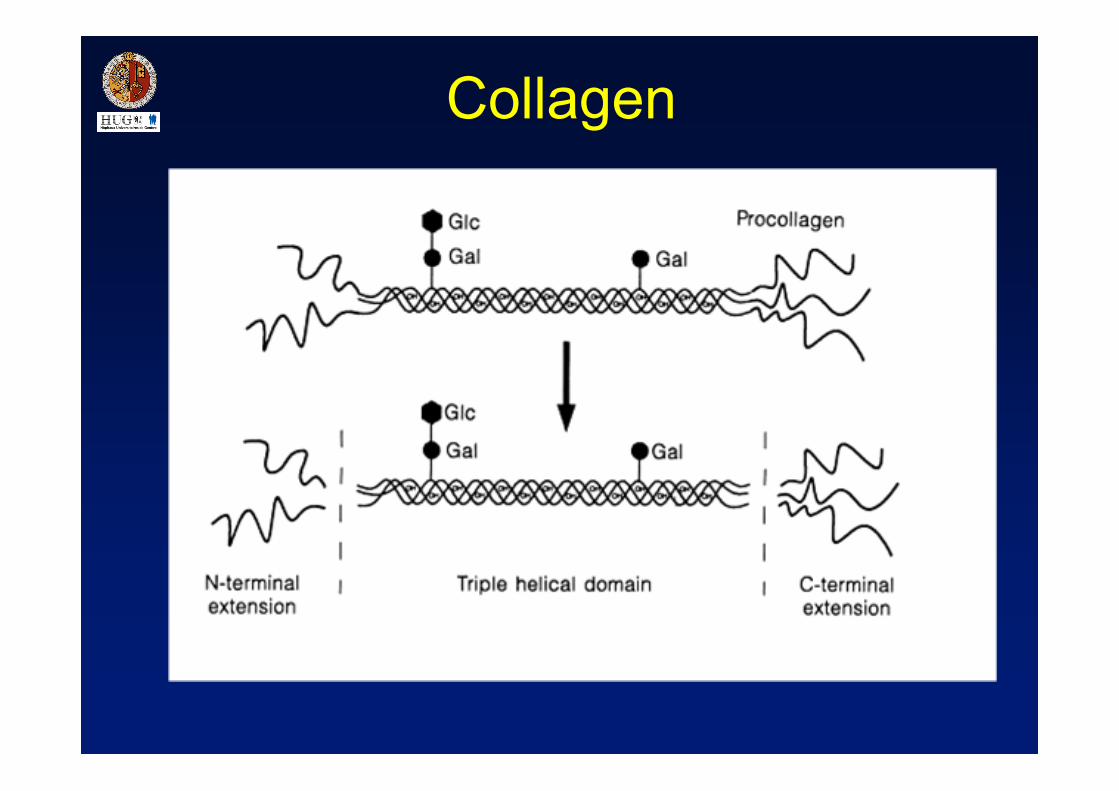
Collagen
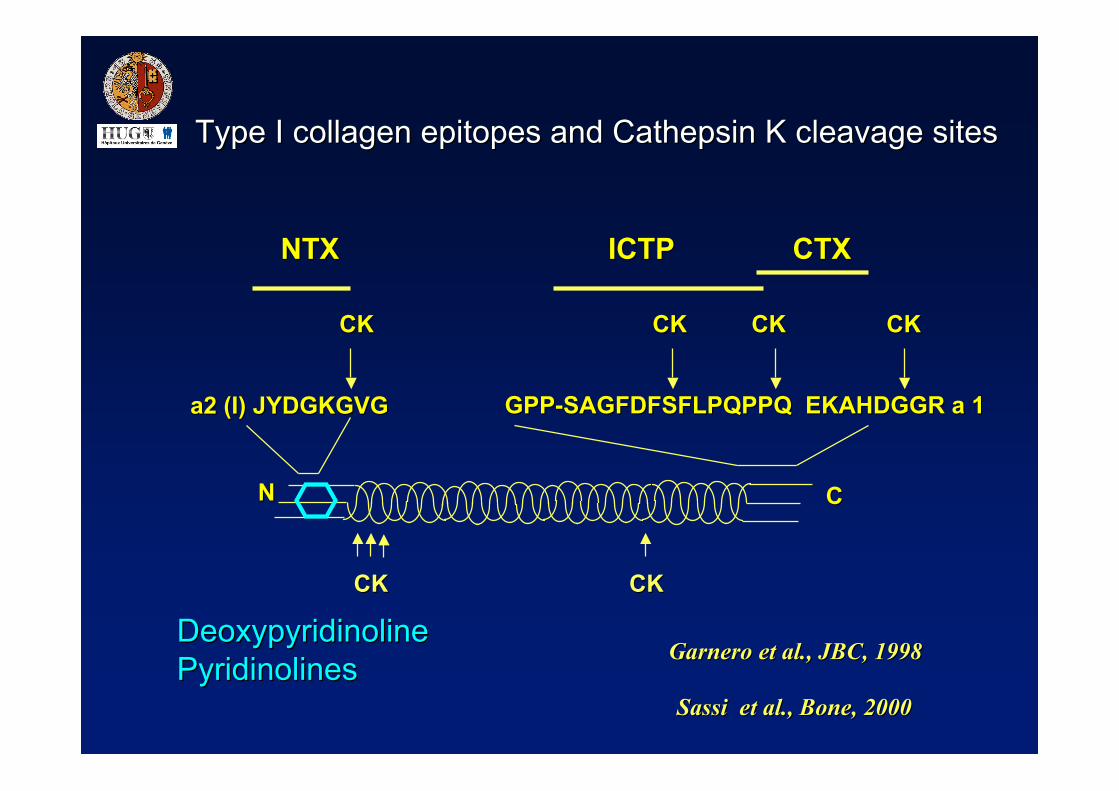
Type I Type I collagen epitopes and Cathepsin collagen epitopes and Cathepsin K K cleavage cleavage sitessites
NN CC
a2 (I) JYDGKGVGa2 (I) JYDGKGVG GPP-SAGFDFSFLPQPPQ EKAHDGGR a 1GPP-SAGFDFSFLPQPPQ EKAHDGGR a 1
NTXNTX CTXCTXICTPICTP
CKCK CKCK CKCK CKCK
CKCK CKCK
GarneroGarnero et et al al., JBC, 1998., JBC, 1998
Sassi Sassi etet al al., ., BoneBone, 2000, 2000
DeoxypyridinolineDeoxypyridinolinePyridinolinesPyridinolines
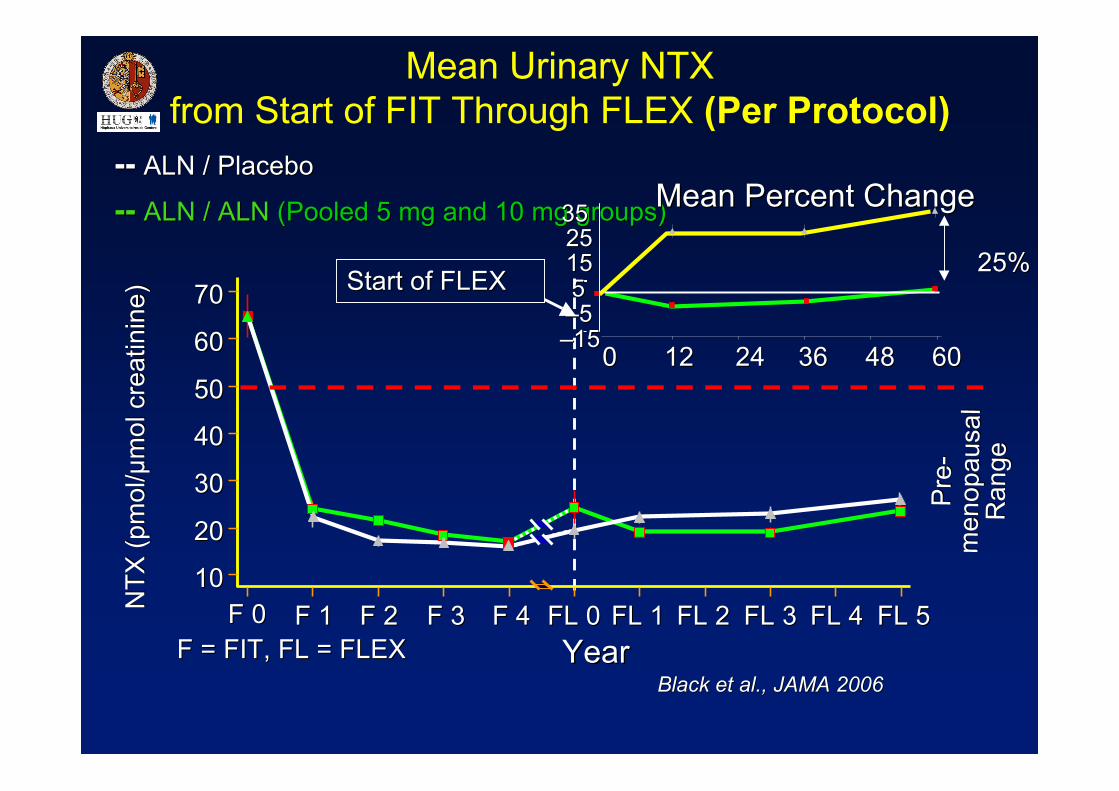
---- ALN / Placebo ALN / Placebo
---- ALN / ALNALN / ALN (Pooled 5 mg and 10 mg groups)(Pooled 5 mg and 10 mg groups)
7070
6060
5050
4040
3030
2020
1010F 0F 0 F 1F 1 F 2F 2 F 3F 3 F 4F 4 FL 0FL 0 FL 1FL 1 FL 2FL 2 FL 3FL 3 FL 4FL 4 FL 5FL 5
YearYear
NTX
(N
TX ( p
mol
/pm
ol/ µµ
mol
cre
atin
ine
mol
cre
atin
ine ))
Start of FLEXStart of FLEX
F = FIT, FL = FLEXF = FIT, FL = FLEX
Pre
-P
re-
men
opau
sal
men
opau
sal
Ran
geR
ange
Mean Percent ChangeMean Percent Change
––1515––5555151525253535
00 1212 2424 3636 4848 6060
25%25%
Black et al., Black et al., JAMA 2006JAMA 2006
Mean Urinary NTXfrom Start of FIT Through FLEX (Per Protocol)
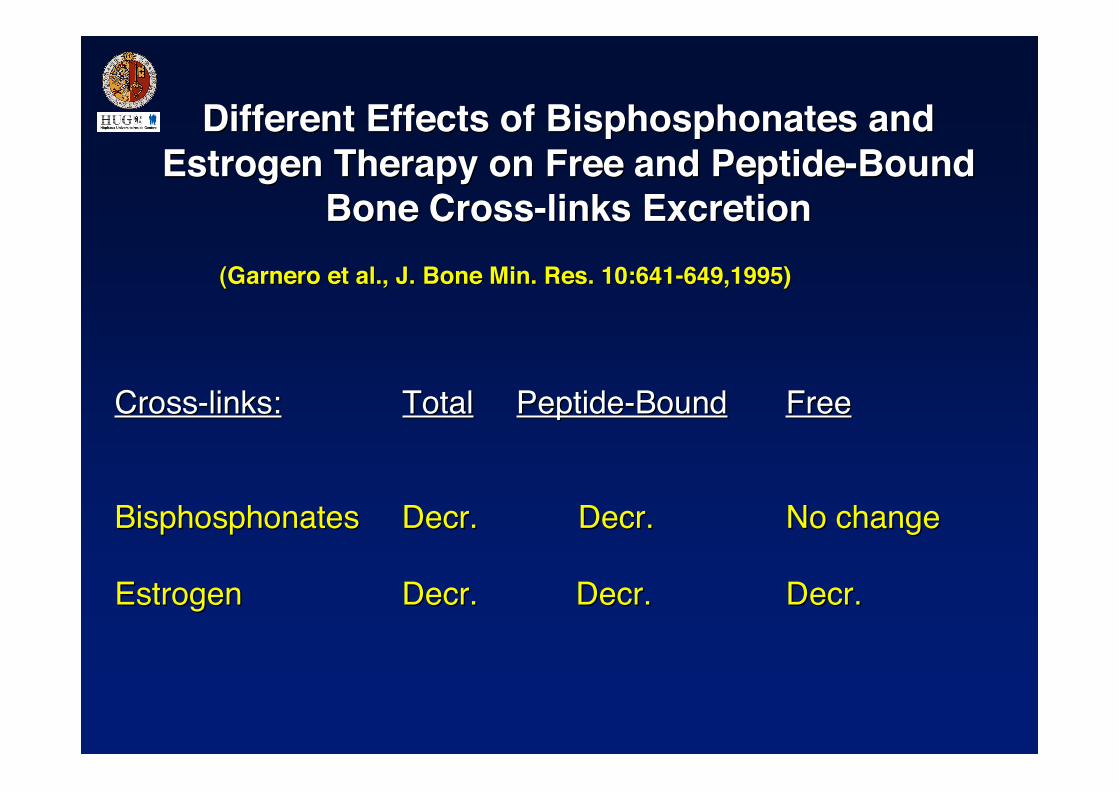
Different Effects Different Effects of of Bisphosphonates andBisphosphonates andEstrogen Therapy Estrogen Therapy onon Free Free and Peptide-Boundand Peptide-Bound
Bone Bone Cross-linksCross-links Excretion Excretion((Garnero Garnero etet al., J.al., J. Bone Bone Min. Res. 10:641-649,1995)Min. Res. 10:641-649,1995)
Cross-links:Cross-links: TotalTotal Peptide-BoundPeptide-Bound FreeFree
BisphosphonatesBisphosphonates DecrDecr.. Decr Decr.. No changeNo change
EstrogenEstrogen DecrDecr.. Decr Decr.. DecrDecr..
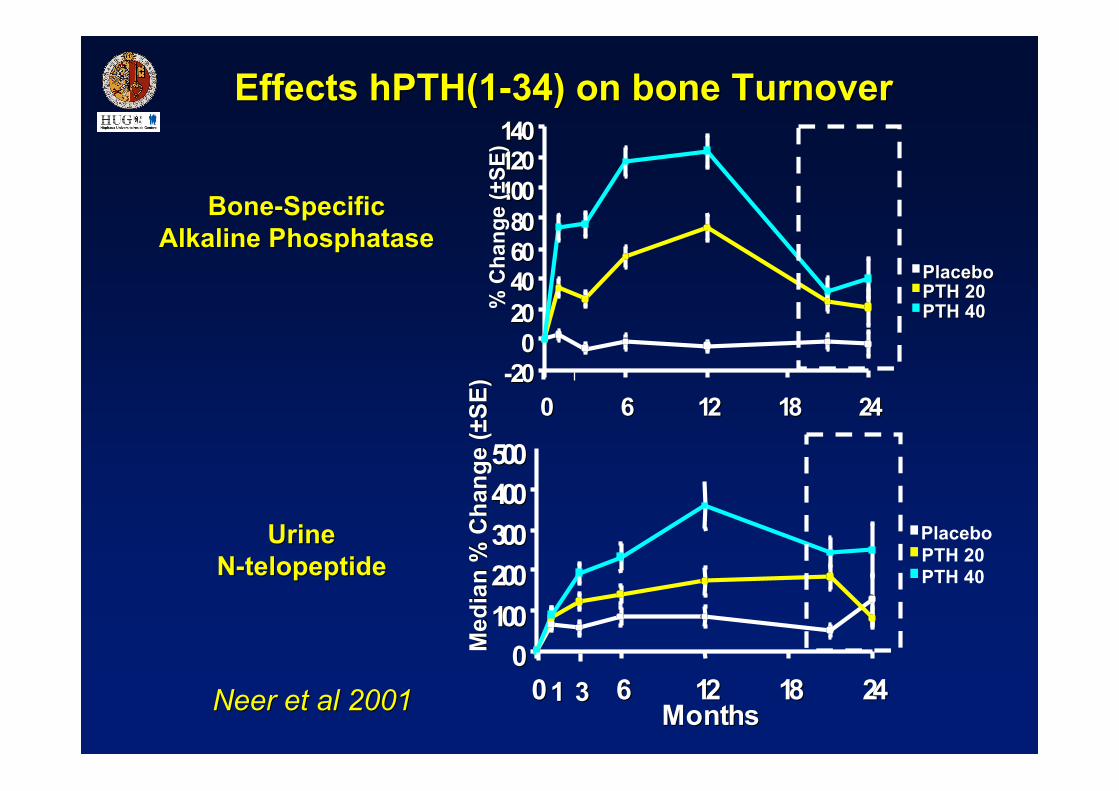
PlaceboPlaceboPTH 20PTH 20PTH 40PTH 40
Bone-SpecificBone-SpecificAlkaline Alkaline PhosphatasePhosphatase
UrineUrineN-telopeptideN-telopeptide
--220000
2200440066008800
110000112200114400
00 66 1122 1188 2244
% C
hang
e (
% C
hang
e ( ±±
SE)
SE)
PlaceboPTH 20PTH 40
00110000220000330000440000550000
00 66 1122 1188 2244MMoonntthhss
11 33
Med
ian
% C
hang
e (
Med
ian
% C
hang
e ( ±±
SE)
SE)
Neer Neer et al 2001et al 2001
Effects hPTHEffects hPTH(1-34) on (1-34) on bone bone TurnoverTurnover
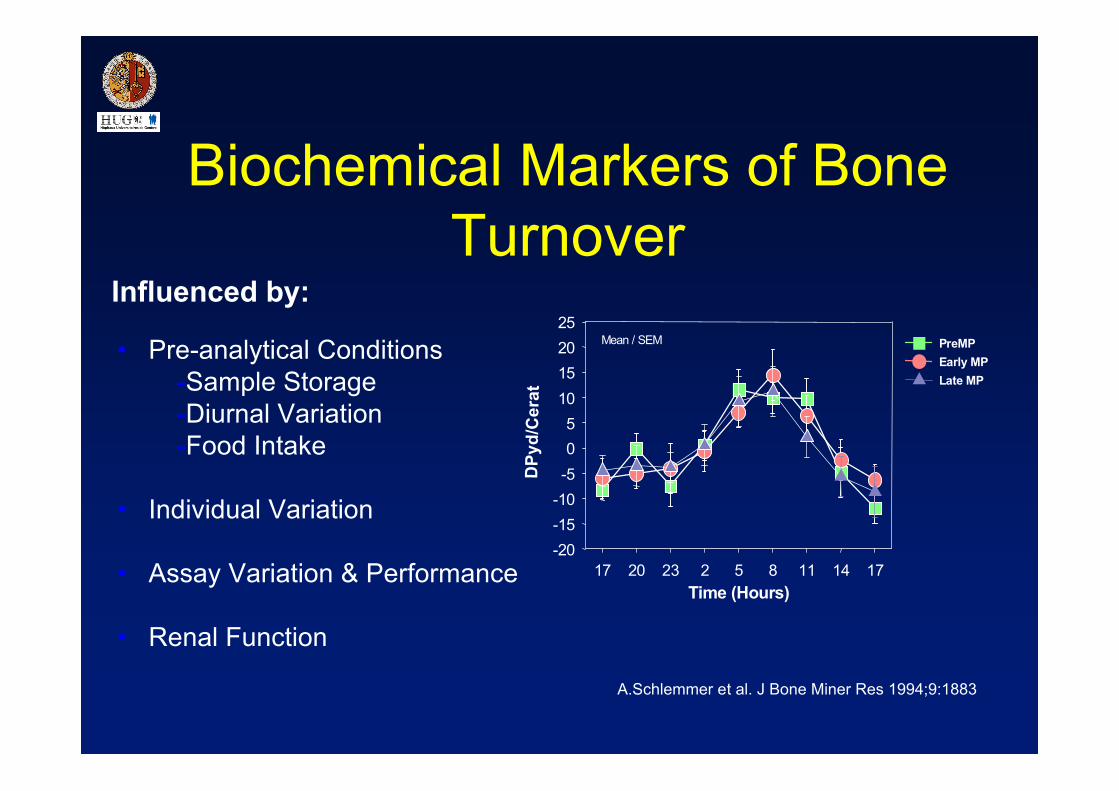
Biochemical Markers of BoneTurnover
• Pre-analytical Conditions-Sample Storage-Diurnal Variation-Food Intake
• Individual Variation
• Assay Variation & Performance
• Renal Function
Influenced by:
Time (Hours)17 20 23 2 5 8 11 14 17
DPy
d/C
erat
-20-15-10-505
10152025
PreMPEarly MPLate MP
Mean / SEM
A.Schlemmer et al. J Bone Miner Res 1994;9:1883
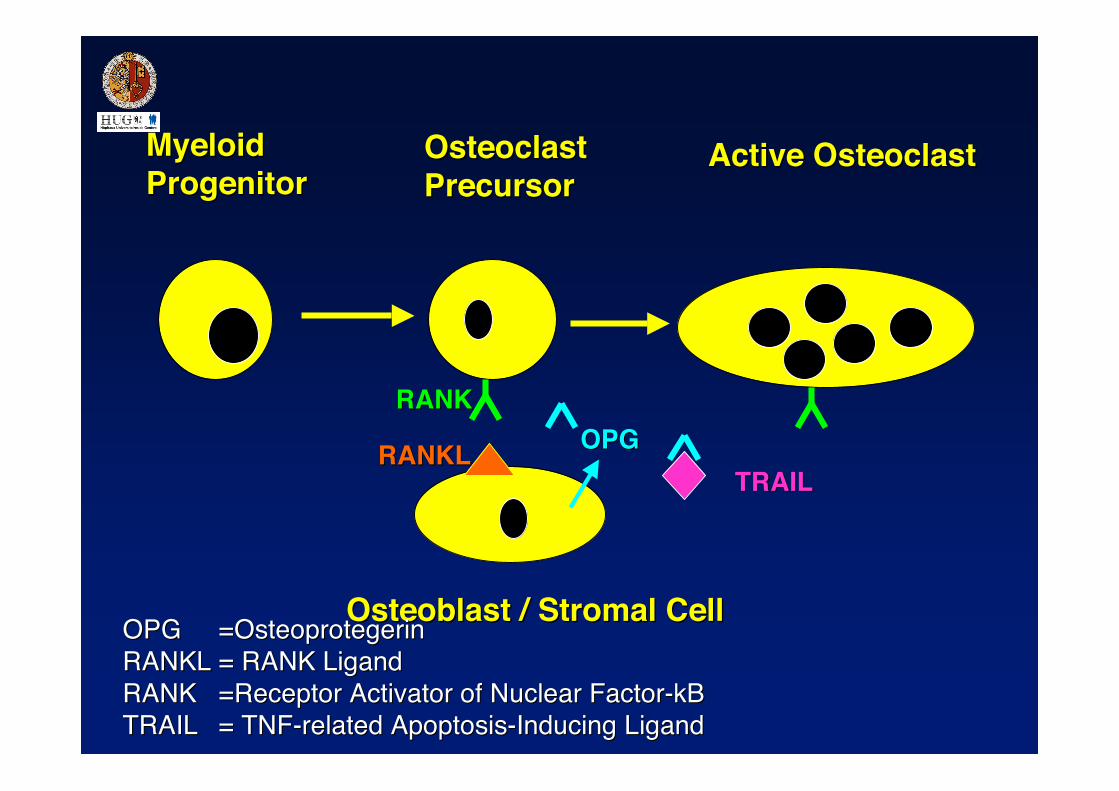
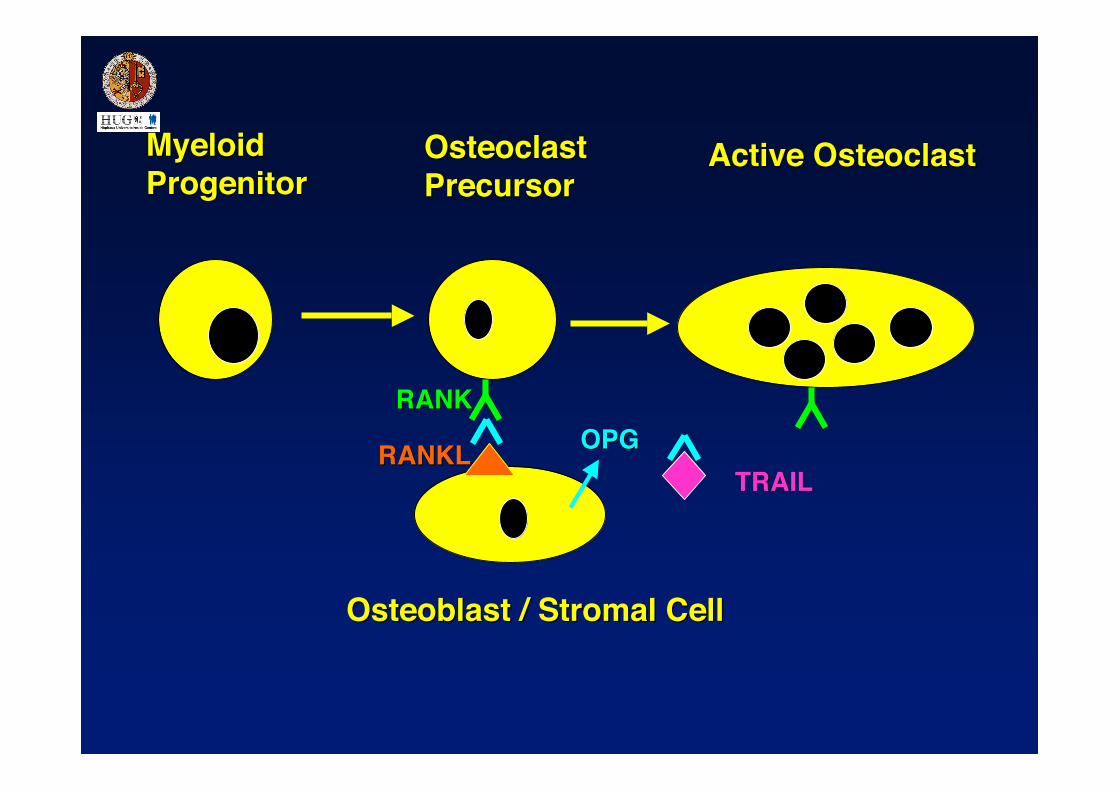
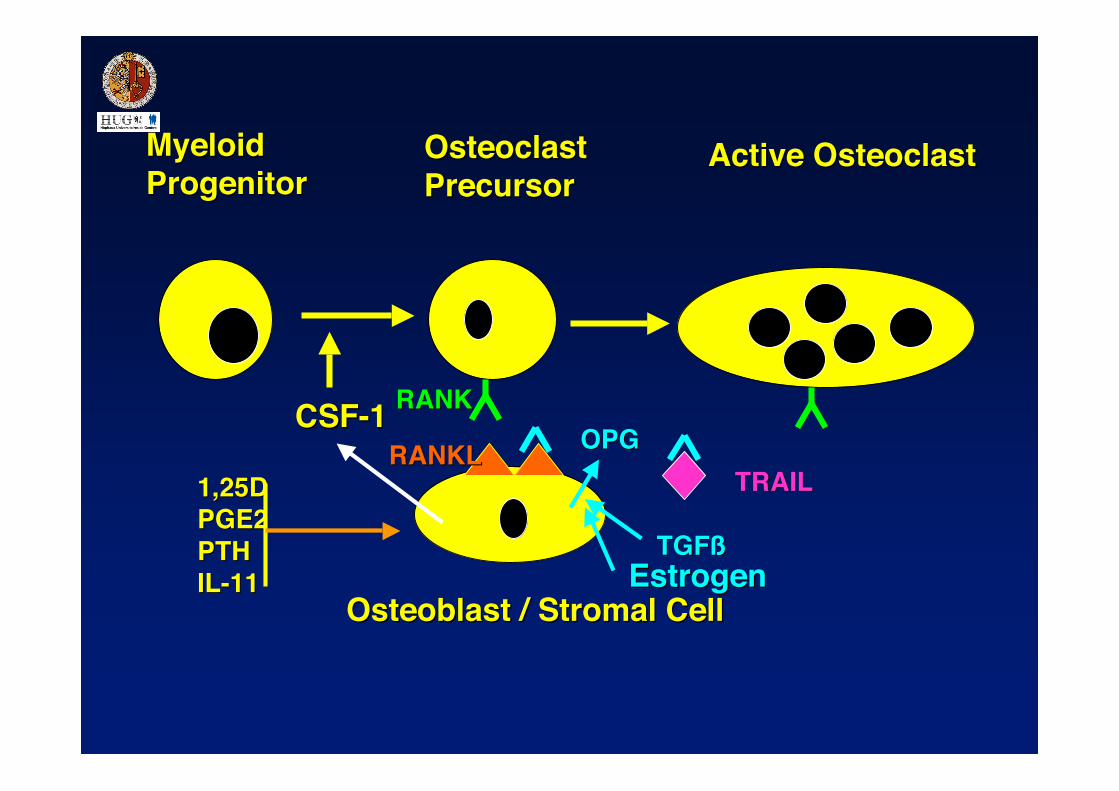
MyeloidMyeloidProgenitorProgenitor
OsteoclastOsteoclastPrecursorPrecursor
Active Active OsteoclastOsteoclast
OsteoblastOsteoblast / / Stromal CellStromal Cell
RANKLRANKL OPGOPGRANKRANK
TRAILTRAIL
OPGOPG =Osteoprotegerin=OsteoprotegerinRANKLRANKL = RANK Ligand= RANK LigandRANKRANK =Receptor Activator =Receptor Activator of of Nuclear Factor-kBNuclear Factor-kBTRAILTRAIL = = TNF-related Apoptosis-Inducing TNF-related Apoptosis-Inducing LigandLigand
MyeloidMyeloidProgenitorProgenitor
OsteoclastOsteoclastPrecursorPrecursor
Active Active OsteoclastOsteoclast
OsteoblastOsteoblast / / Stromal CellStromal Cell
RANKLRANKL OPGOPGRANKRANK
TRAILTRAIL
MyeloidMyeloidProgenitorProgenitor
OsteoclastOsteoclastPrecursorPrecursor
Active Active OsteoclastOsteoclast
OsteoblastOsteoblast / / Stromal CellStromal Cell
RANKLRANKL OPGOPGRANKRANK
TRAILTRAIL
CSF-1CSF-1
TGFßTGFßEstrogenEstrogen
1,25D1,25DPGE2PGE2PTHPTHIL-11IL-11
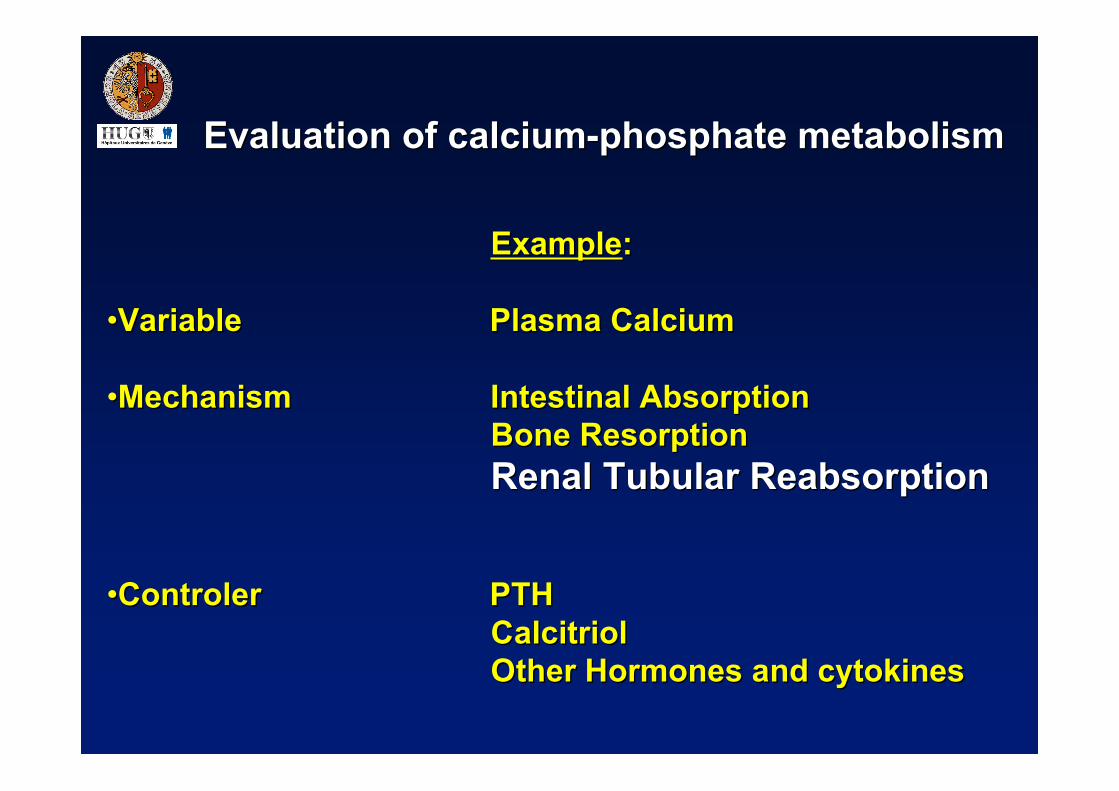
Evaluation of Evaluation of calcium-phosphate metabolismcalcium-phosphate metabolism
ExampleExample::
••VariableVariable Plasma CalciumPlasma Calcium
••MechanismMechanism Intestinal AbsorptionIntestinal AbsorptionBone ResorptionBone ResorptionRenal Tubular ReabsorptionRenal Tubular Reabsorption
••ControlerControler PTHPTHCalcitriolCalcitriolOther Other Hormones Hormones and and cytokinescytokines
Renal calcium handlingRenal calcium handling
200 mg
200 mg /day
8%8%
Loop diureticsLoop diuretics
Filtered 10000 mg/day
Filtered 10000 mg/day
65%65%
++ –––
25%25%
ECF: extracellular fluidECF: extracellular fluid
• Acidosis – • Pi depletion – • Acidosis – • Pi depletion –
•• PTH PTH ++ •• PTHrP PTHrP +
•• Alkalosis Alkalosis ++ •• Thiazides Thiazides ++
ECFcontraction/expansion
Plasma CalciumPlasma Calcium Plasma PhosphatePlasma Phosphate
U Ca U Ca ExcretionExcretion U Pi U Pi ExcretionExcretion
TmPi TmPi / GFR/ GFRTRCaITRCaI
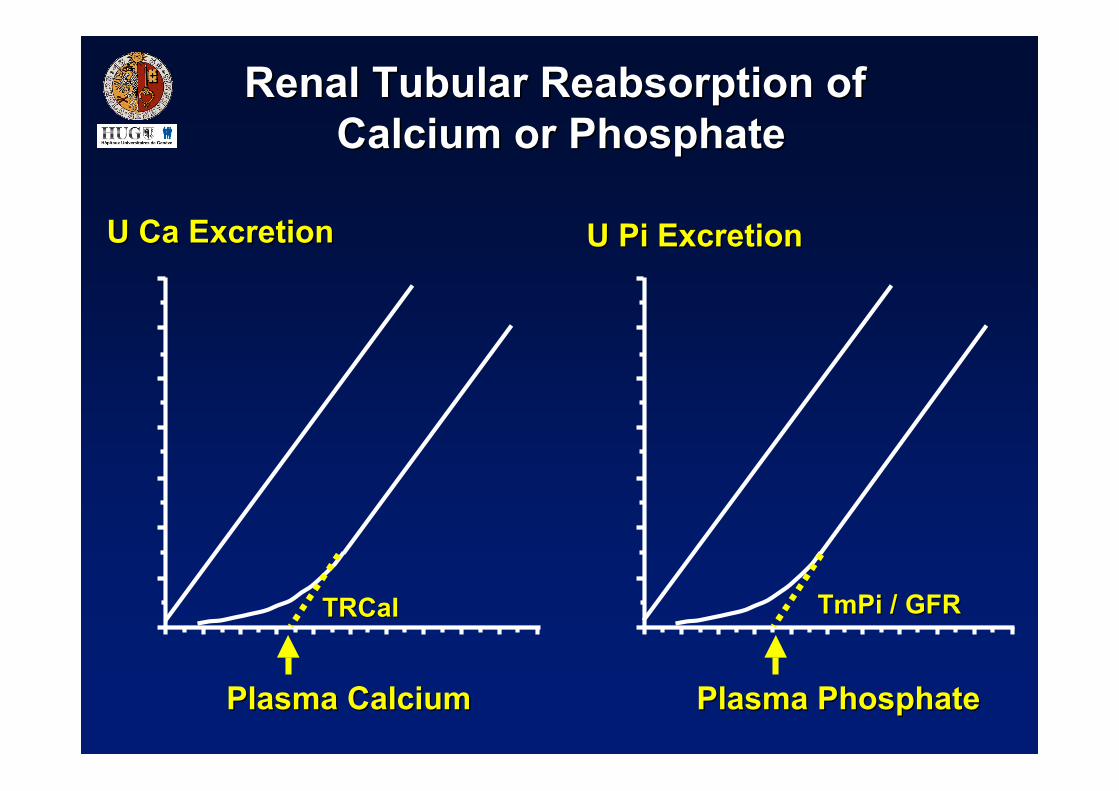
Renal Tubular Reabsorption of Renal Tubular Reabsorption of Calcium or PhosphateCalcium or Phosphate
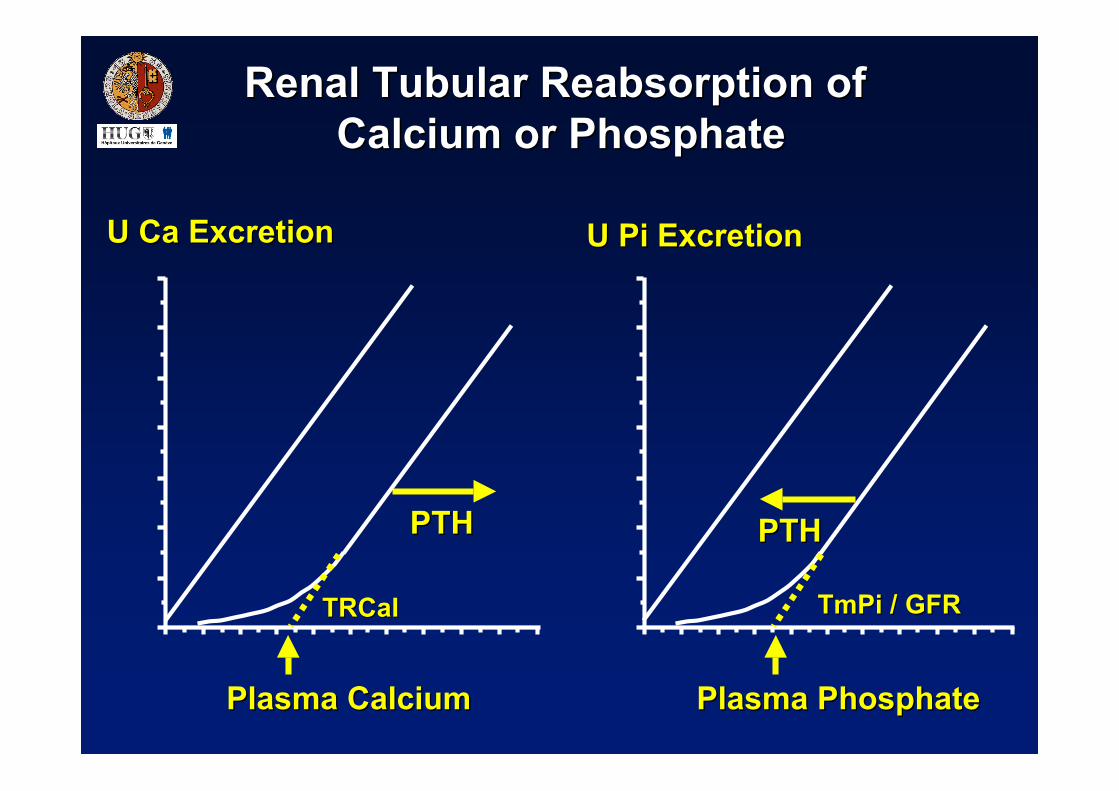
Plasma CalciumPlasma Calcium Plasma PhosphatePlasma Phosphate
U Ca U Ca ExcretionExcretion U Pi U Pi ExcretionExcretion
TmPi TmPi / GFR/ GFRTRCaITRCaI
Renal Tubular Reabsorption of Renal Tubular Reabsorption of Calcium or PhosphateCalcium or Phosphate
PTHPTH PTHPTH
0.350.35
0.300.30
0.250.25
0.200.20
0.150.15
0.050.05
0.000.00
0.100.10
1.41.4 1.31.3 1.21.2 1.11.1 1.01.0 0.90.9 0.80.8 0.70.7 0.60.6 0.50.5 0.40.4
U/P
Ca
/ U/P
U
/P C
a / U
/P c
reat
inin
ecr
eatin
ine
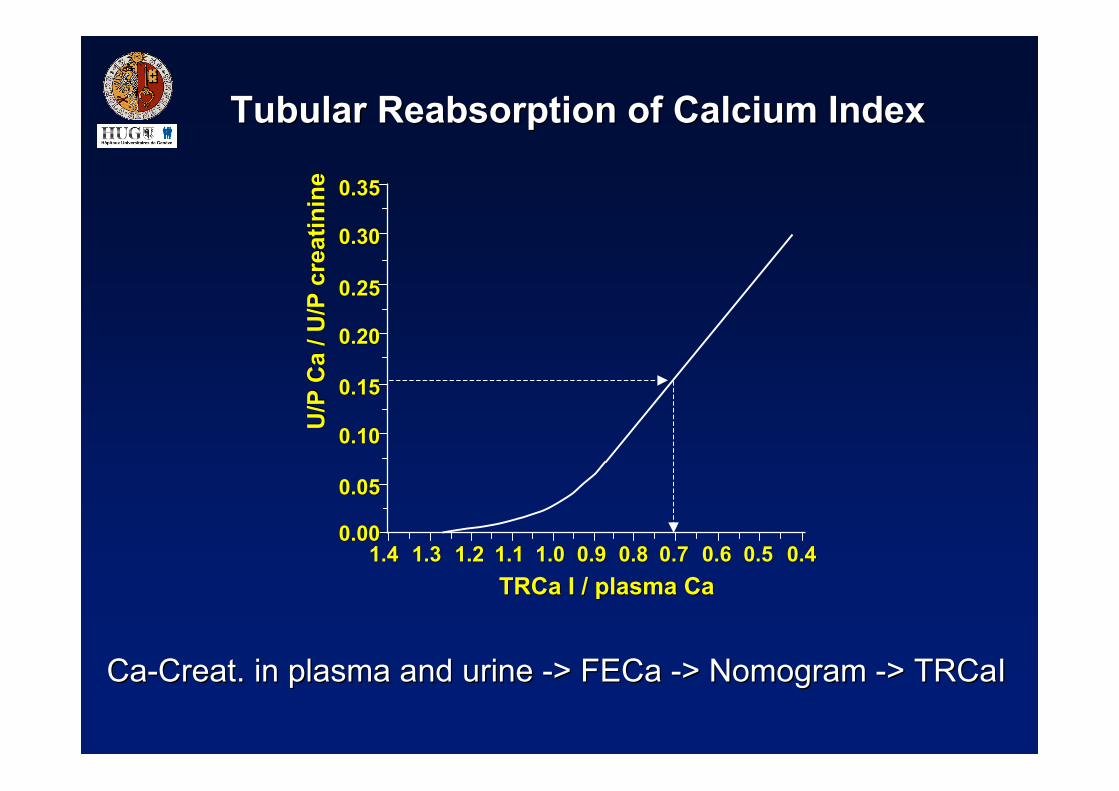
TRCa I / plasma CaTRCa I / plasma Ca
Tubular Reabsorption Tubular Reabsorption of Calcium Indexof Calcium Index
Ca-Ca-CreatCreat. in plasma . in plasma and and urine -> FECa -> urine -> FECa -> Nomogram Nomogram -> TRCaI-> TRCaI
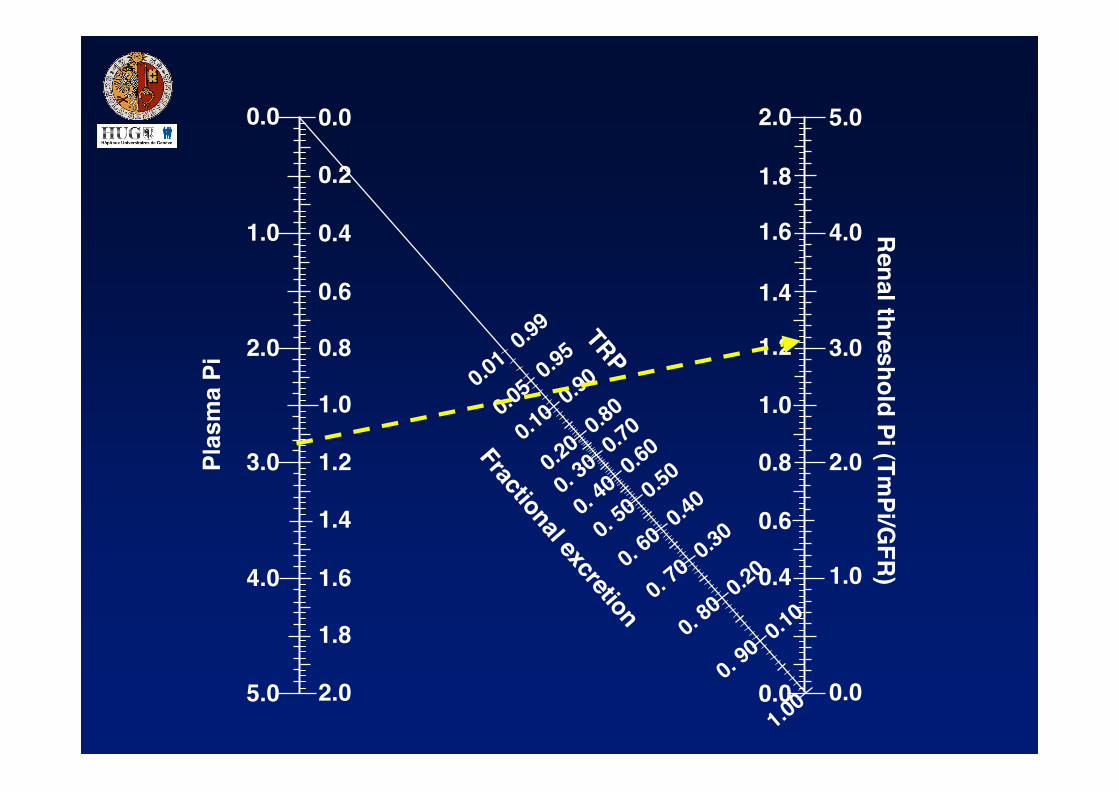
0.0
1.0
2.0
3.0
4.0
5.0 2.0
1.6
1.2
0.8
0.4
0.0
1.8
1.4
1.0
0.6
0.2
2.0
1.6
1.2
0.8
0.4
0.0
1.8
1.4
1.0
0.6
0.0
1.0
2.0
3.0
4.0
5.0
0.99
0.95
0.90
0.800.70
0.60
0.50
0.40
0.30
0.20
0.10
0.01
0.05
0.10
0.20
0. 30
0. 40
0. 50
0. 60
0. 70
0. 80
0. 90
1.00
TRP
Fractional excretion
Plas
ma
PiRenal threshold Pi (Tm
Pi/GFR)
Evaluation of Evaluation of calcium-phosphate metabolismcalcium-phosphate metabolism
ExampleExample::
••VariableVariable Plasma CalciumPlasma Calcium
••MechanismMechanism Intestinal AbsorptionIntestinal AbsorptionBone Bone TurnoverTurnoverRenal Tubular ReabsorptionRenal Tubular Reabsorption
••ControlerControler PTHPTHCalcitriolCalcitriolOther Other Hormones Hormones and and cytokinescytokines
Mme W. 74 ansMme W. 74 ans
Fatigue, Fatigue, Pouteau-CollesPouteau-Colles, pas d, pas d’’autre fractureautre fracture
Taille 163 (- 3 cm)Taille 163 (- 3 cm)
Pas dPas d’’autre plainte, sinon un épisode de coliqueautre plainte, sinon un épisode de coliquenéphrétique à lnéphrétique à l’’âge de 68 ansâge de 68 ans
FSC normaleFSC normaleCalcium Calcium 2.60 (2.20-2.60) (albumine 36 -> Ca 2.68)2.60 (2.20-2.60) (albumine 36 -> Ca 2.68)PhosphatePhosphate 0.82 (0.80-1-35)0.82 (0.80-1-35)CréatinineCréatinine 9090PTHPTH 9.5 (1.0-6.5)9.5 (1.0-6.5)
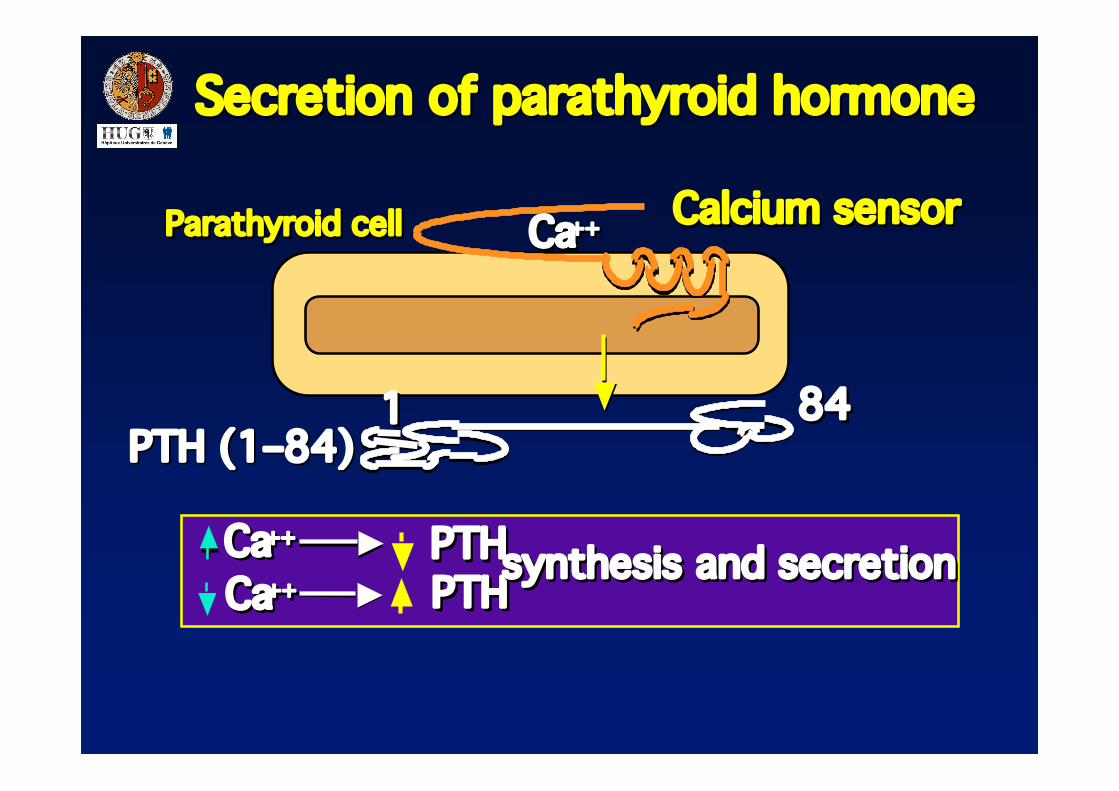
Secretion of parathyroid hormoneSecretion of parathyroid hormone
PTH PTH Ca++Ca++PTHPTH
Parathyroid cellParathyroid cell
Ca++Ca++
PTH (1PTH (1––84)84)
Calcium sensorCalcium sensor
848411
Ca++Ca++
synthesis and secretion synthesis and secretion
Human Parathyroid Hormone 1-34 and 1-84
1 10
20
30
Ser Val Ser Glu Ile Gln Leu Met His AsnLeuGly
LysHisLeuAsnSerMetGluArgValGluTrpLeu
Arg Lys Lys Leu Gln Asp Val His Asn Phe
50
40
6070
80
-COOH
H2N-
841
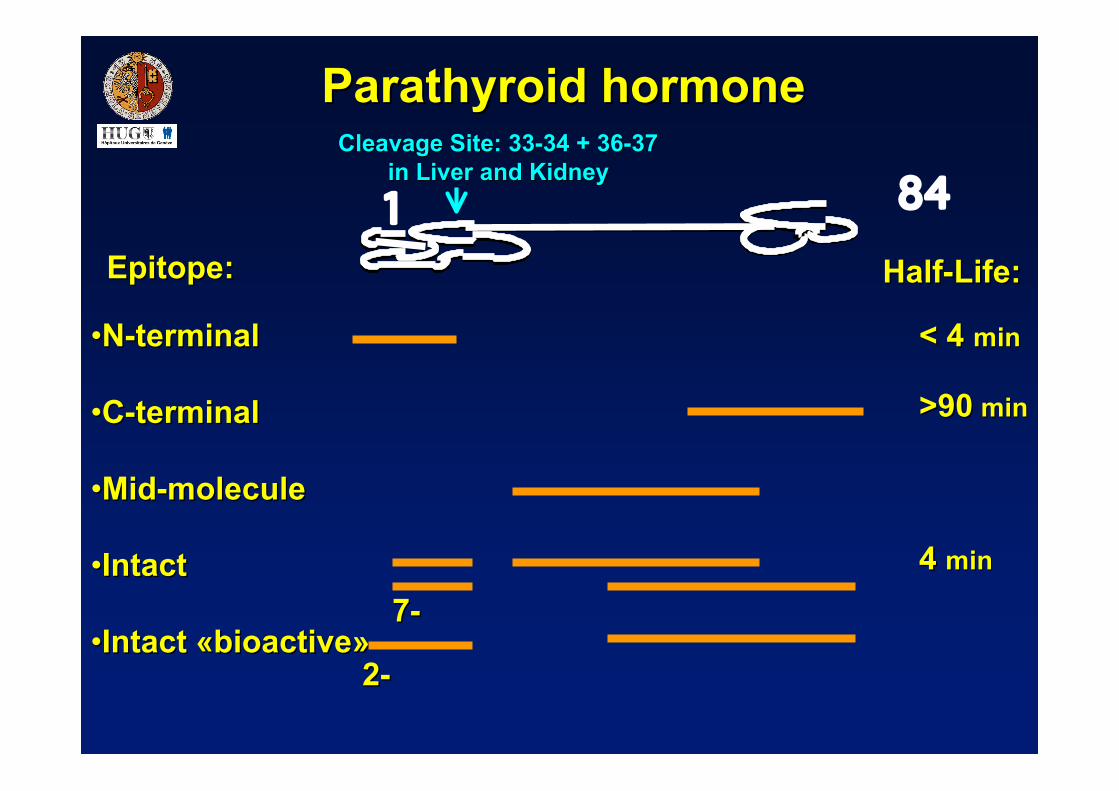
Parathyroid Parathyroid hormonehormone
EpitopeEpitope::
••N-terminalN-terminal
••C-terminalC-terminal
••Mid-Mid-moleculemolecule
••IntactIntact
••Intact «Intact «bioactivebioactive»»
HalfHalf--LifeLife::
Cleavage Cleavage Site: 33-34 + 36-37Site: 33-34 + 36-37in Liver in Liver and Kidneyand Kidney
< 4 < 4 minmin
>90>90 min min
4 4 minmin
7-7-
2-2-
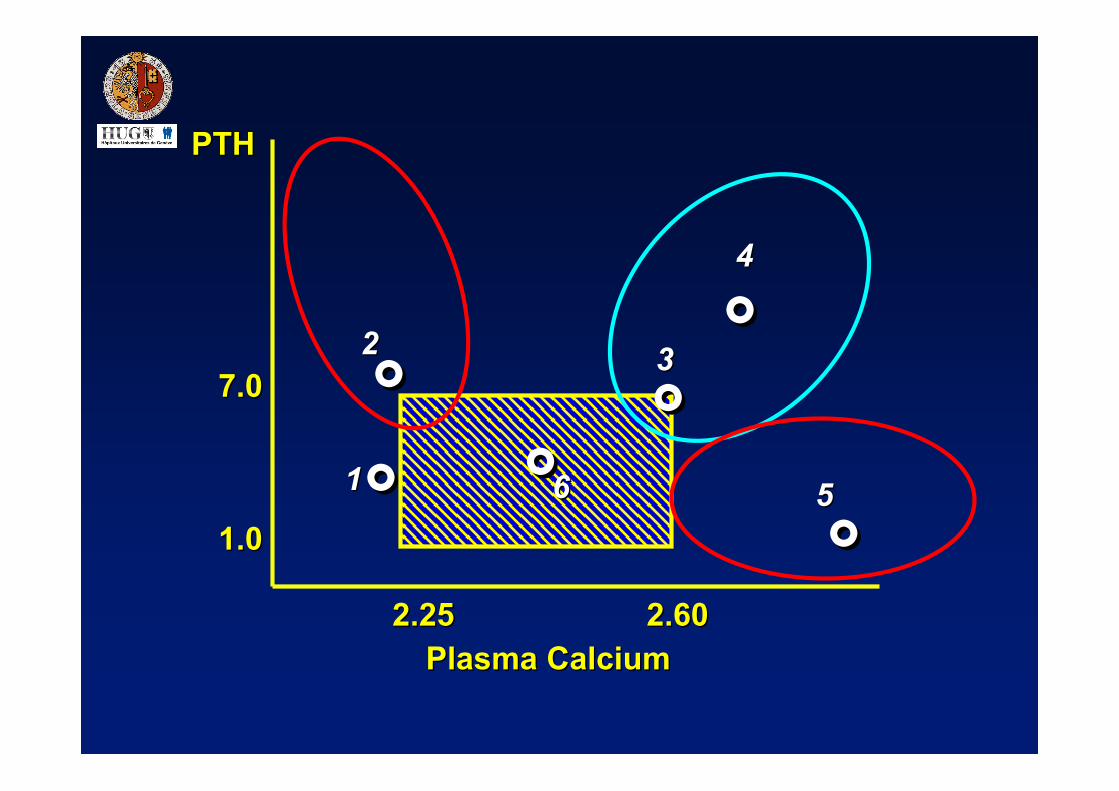
PTHPTH
Plasma CalciumPlasma Calcium
7.07.0
1.01.0
2.252.25 2.60 2.60
°°°° °°
°°°°
°°11
22 33
44
5566
BioactiveBioactive IntactIntact
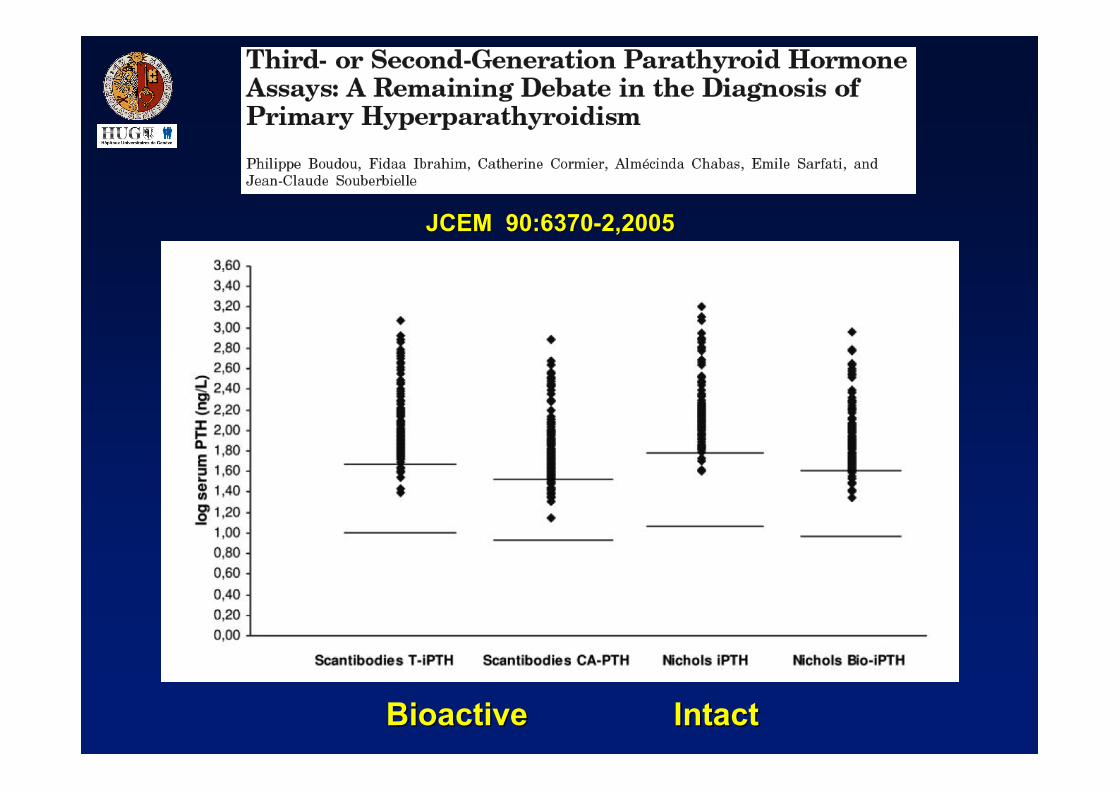
JCEMJCEM 90:6370-2,200590:6370-2,2005
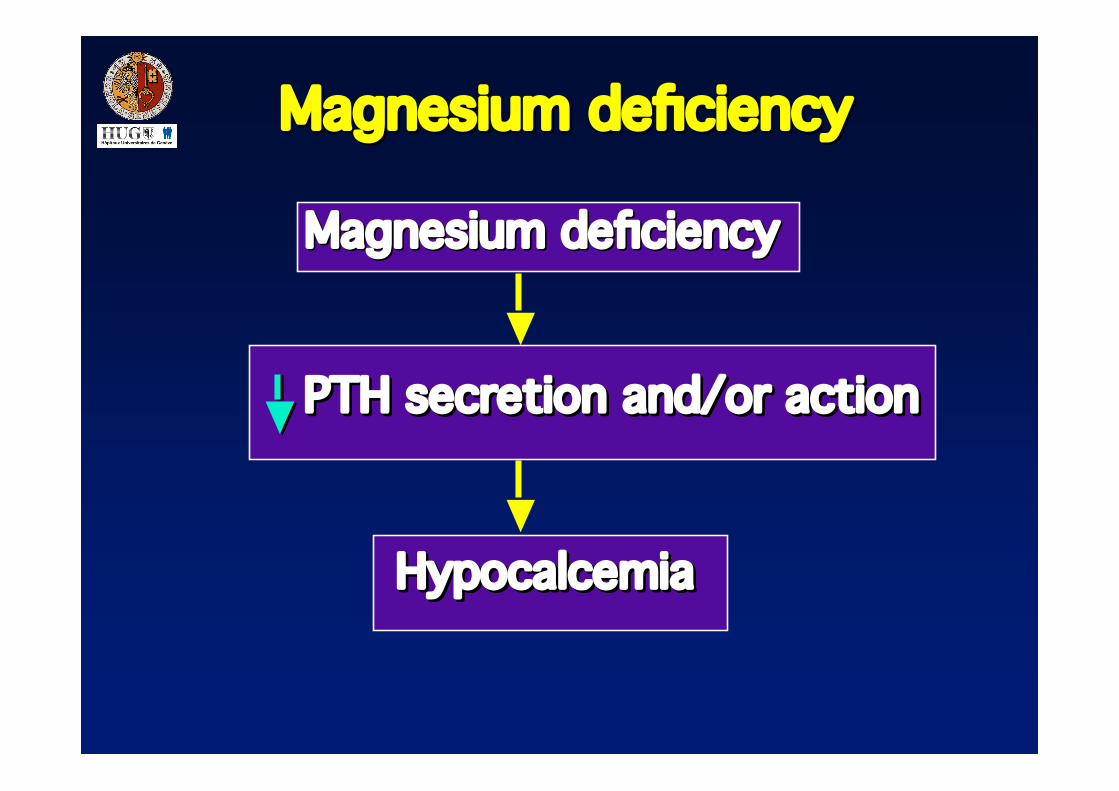
Magnesium deficiencyMagnesium deficiency
Magnesium deficiencyMagnesium deficiency
PTH secretion and/or actionPTH secretion and/or actionPTH secretion and/or action
HypocalcemiaHypocalcemiaHypocalcemia
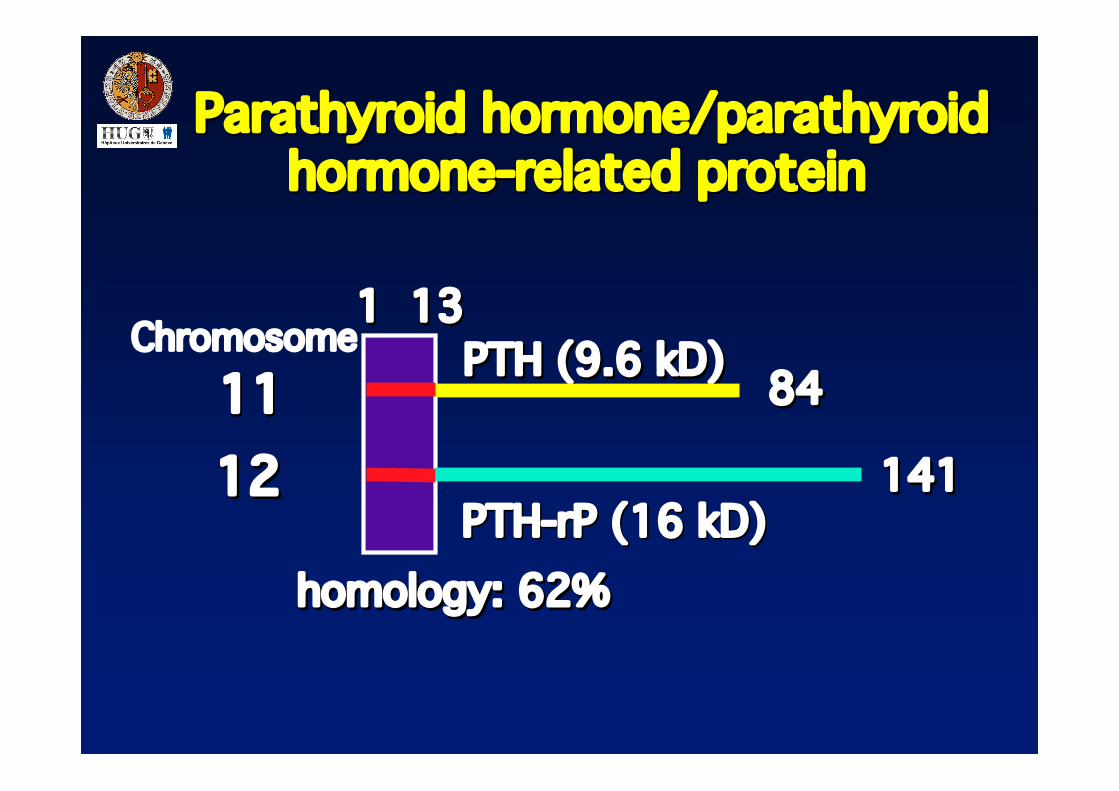
Parathyroid hormone/parathyroidParathyroid hormone/parathyroid hormone-related proteinhormone-related protein
11 11 8484
141141
PTH (9.6 kD)PTH (9.6 kD)
PTH-PTH-rPrP (16 (16 kDkD))homology: 62%homology: 62%
1212
11 1313Chromosome
PTHPTH
Tubular reabsorption
Tubular reabsorption
Pi Pi Absorption Absorption
FormationFormation
ResorptionResorption
1,25(OH)2 D31,25(OH)2 D3
Ca -Ca -
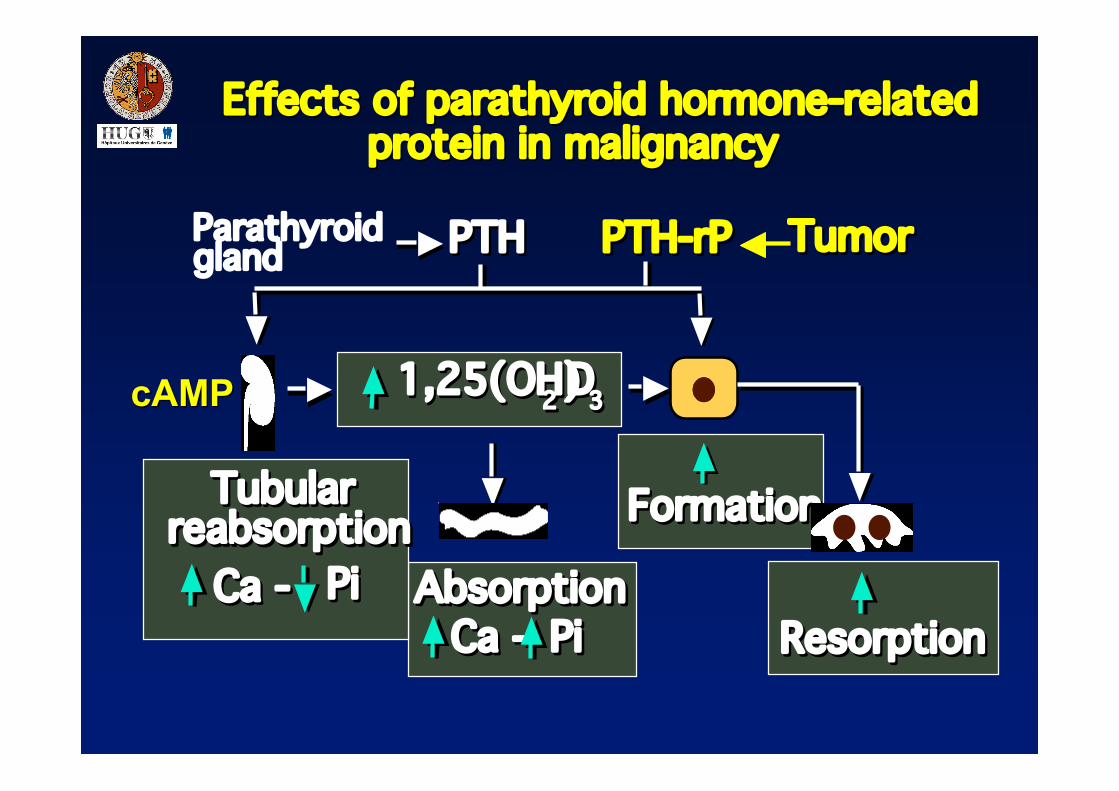
Parathyroid gland TumorTumorPTH-rPPTH-rP
Effects of parathyroid hormone-relatedEffects of parathyroid hormone-related protein in malignancyprotein in malignancy
Ca - Ca - PiPi
cAMPcAMP
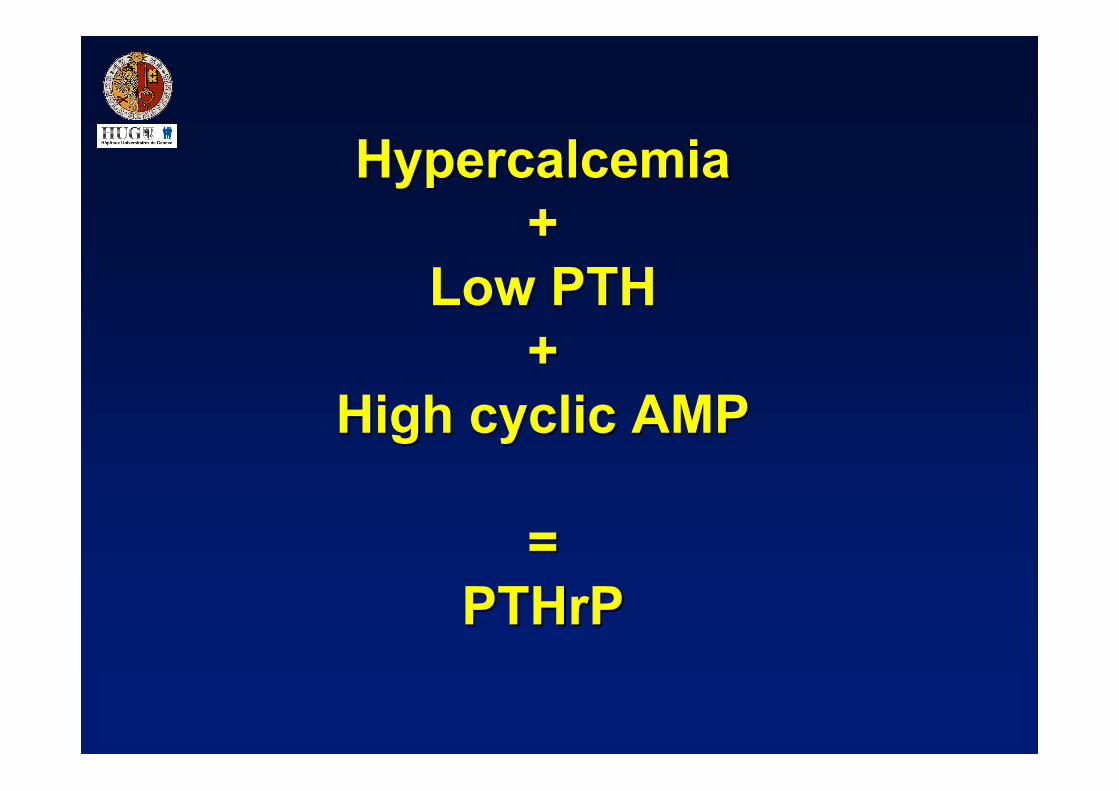
HypercalcemiaHypercalcemia++
Low Low PTHPTH++
High cyclic High cyclic AMPAMP
==PTHrPPTHrP
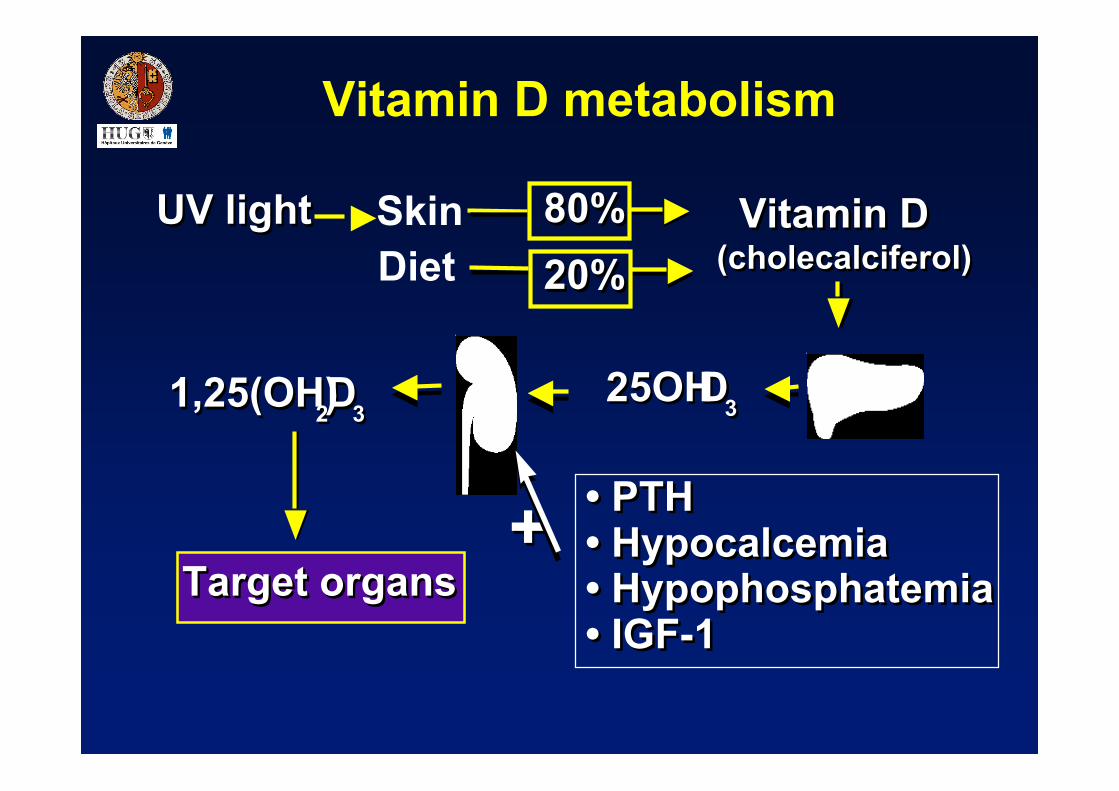
Vitamin D metabolism
UV lightUV light Vitamin D (cholecalciferol)Vitamin D
(cholecalciferol)Diet
• PTH • Hypocalcemia • Hypophosphatemia • IGF-1
• PTH • Hypocalcemia • Hypophosphatemia • IGF-1
25OHD3 25OHD3
Target organsTarget organsTarget organs
1,25(OH)2D3 1,25(OH)2D3
++
Skin 80%80%20%20%
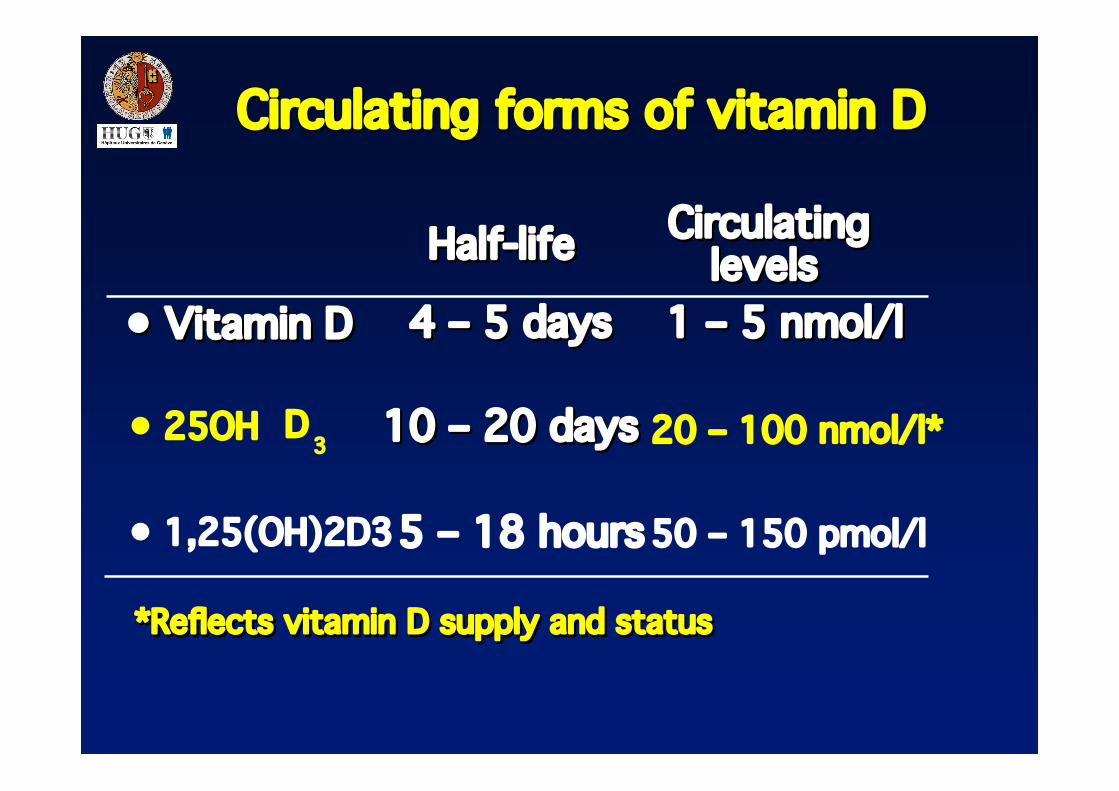
Circulating forms of vitamin DCirculating forms of vitamin D
Half-lifeHalf-life
1 – 5 nmol/l
1 – 5 nmol/l 20 – 100 nmol/l* 50 – 150 pmol/l
Circulating levels
Circulating levels
4 – 5 days 10 – 20 days 5 – 18 hours
4 – 5 days 10 – 20 days
• Vitamin D
• 1,25(OH)2D3
• Vitamin D • 25OH D
3
*Reflects vitamin D supply and status*Reflects vitamin D supply and status
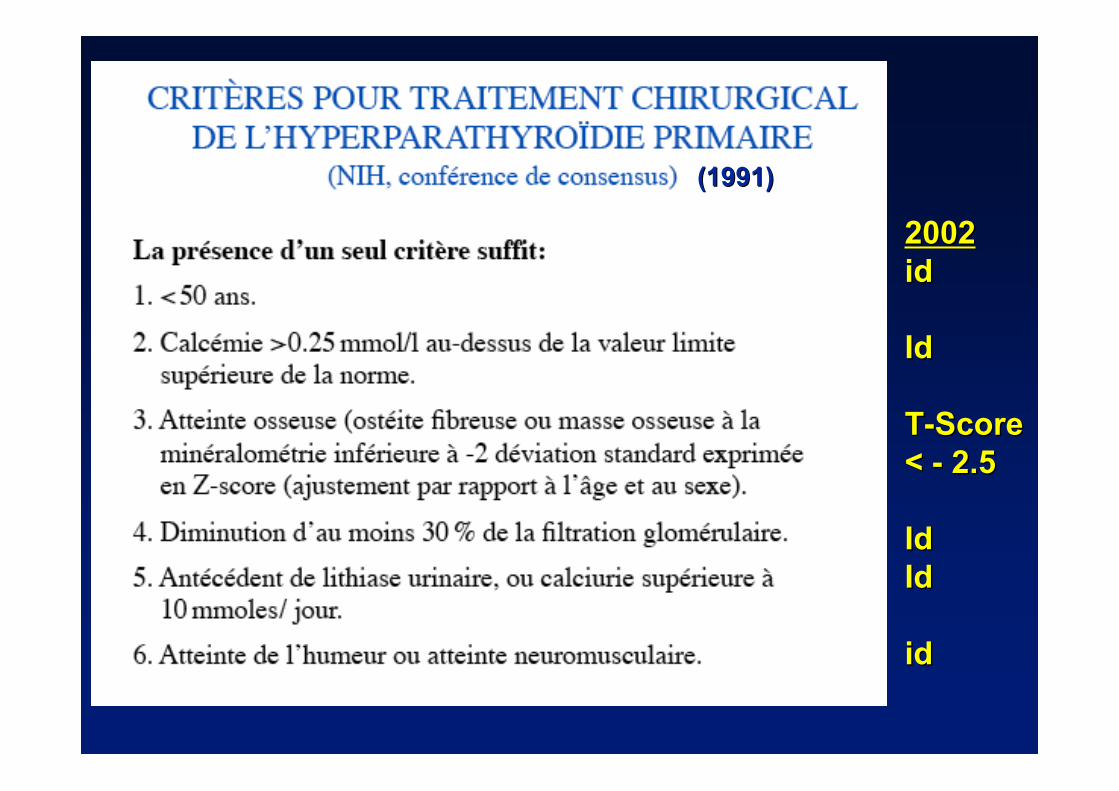
(1991)(1991)
20022002idid
IdId
T-ScoreT-Score< - 2.5< - 2.5
IdIdIdId
idid
![[Product Monograph Template - Standard]Page 1 of 30 MONOGRAPHIE DE PRODUIT PrCLASTEONMD clodronate disodique clodronate disodique en capsules, 400 mg Régulateur du métabolisme osseux](https://img.pdfslide.fr/doc/110x75/5f33c6ffcb60ec10d1704d9f/product-monograph-template-standard-page-1-of-30-monographie-de-produit-prclasteonmd.jpg)