Embed Size (px)
Citation preview
UNIVERSITÉ DU QUÉBEC EN ABITIBI-TÉMISCAMINGUE
FACTEURS ENVIRONNEMENTAUX INFLUENÇANT LA CROISSANCE ET
LA RÉGÉNÉRATION DU BOULEAU JAUNE (BETULA ALLEGHANJENSJS
BRITTON) PRÈS DE SA LIMITE NORDIQUE DE RÉPARTITION
MÉMOIRE
PRÉSENTÉ
COMME EXIGENCE PARTIELLE
DE LA MAITRISE EN BIOLOGIE
EXTENSIONNÉE DE
L'UNIVERSITÉ DU QUÉBEC À MONTRÉAL
PAR
MARC-ANTOINE GUITARD
MARS 2015
Mise en garde
La bibliothèque du Cégep de l’Abitibi-Témiscamingue et de l’Université du Québec en Abitibi-Témiscamingue a obtenu l’autorisation de l’auteur de ce document afin de diffuser, dans un but non lucratif, une copie de son œuvre dans Depositum, site d’archives numériques, gratuit et accessible à tous.
L’auteur conserve néanmoins ses droits de propriété intellectuelle, dont son droit d’auteur, sur cette œuvre. Il est donc interdit de reproduire ou de publier en totalité ou en partie ce document sans l’autorisation de l’auteur.
Warning
The library of the Cégep de l’Abitibi-Témiscamingue and the Université du Québec en Abitibi-Témiscamingue obtained the permission of the author to use a copy of this document for non-profit purposes in order to put it in the open archives Depositum, which is free and accessible to all.
The author retains ownership of the copyright on this document. Neither the whole document, nor substantial extracts from it, may be printed or otherwise reproduced without the author's permission.
AVANT-PROPOS
Conformément aux exigences du programme de maîtrise en biologie, ce mémoire
comprend un article rédigé en anglais, portant sur une étude visant à déterminer les
facteurs environnementaux qui contrôlent la répartition nordique du bouleau jaune
dans l'est du Canada, ainsi qu'une introduction et une conclusion générale. Cet article
a été soumis et approuvé à la revue scientifique « Canadian Journal of Forest
Research ».
Je tiens à remercier Yves Bergeron qui a su tenir le cap dans ces longues années qui
rn' ont été nécessaires à terminer la rédaction de ce mémoire. Yves, ta persévérance a
finalement porté fruit et j e t 'en suis très reconnaissant. Je souhaite dédier ce mémoire
à Bernhard Denneler, qui a été mon codirecteur de maitrise durant les premières
années de mes études de maitrise. Il était non seulement un bon professeur pour moi,
mais aussi un très bon ami. Je voudrais remercier également Igor Drobyshev, Hugo
Asselin et Aurélie Gemies qui, par leur travail, ont rendu possible la rédaction et
l' approbation de l'article scientifique. Et enfin, merci à la Chaire industrielle en
aménagement forestier durable CRSNG-UQAT-UQAM pour le soutien financier.
Je voudrais spécialement remercier mon épouse Jennifer pour ta patience et ton
soutien dans les derniers mois. Ce n 'était pas facile avec deux petits enfants à la
maison, mais nous avons réussi. Je l'ai enfin fini cette maîtrise-là!
TABLES DES MATIÈRES
AVANT-PROPOS ........................................................................................................ II
LISTE DES FIGURES .............. ... ..................... ... ..................... .. ..................... ... ......... V
LISTE DES TABLEAUX .......................................................................................... VII
RÉSUMÉ ................................................................................................................. VIII
CHAPITRE I INTRODUCTION GÉNÉRALE .................................................................................. 1
1.1. Problématique .................. ... ..................... ... .................... ... ..................... ... .......... 1
1.2. État des connaissances ......................................................................................... 2
1.2.1. Caractéristiques de reproduction .............................................................. 2
1.2.2. Sols et substrat de germination .... ... ..................... ... .................... ... .......... 3
1.2.3. Compétition .............................................................................................. 4
1.2.4. Précipitations ............................................................................................ 5
1.2.5. Température ......... ... .................... ... ..................... ... ..................... ... .......... 6
1.2.6. Perturbation ...................................................... ........................ ................ 9
1.3. Objectifs de l 'étude et hypothèses de travail... ................ ... ..................... ... ........ 10
CHAPITRE II ENVIRONMENTAL CONTROLS OF THE NOR THERN DISTRIBUTION LIMIT OF YELLOW BIRCH IN EASTERN CANADA .......................................... 12 2.1. Abstract .............................................................................................................. 14
2.2. Résumé ............................ ... ..................... ... .................... ... ..................... ... ........ 15
2.3. Introduction ...................... ... ..................... ... .................... ... ..................... ... ........ 16
2.4. Material and Methods ....... .. ...................... ....................... .. ...................... .. ........ 20
2.4.1. Study are a ..................................... ... ..................... ... .................... ... ........ 20
2.4.2. Site selection and field sampling ............................................................ 21
2.4.3. Soil analyses ........................................................................................... 23
2.4.4. Statistical analysis of yellow birch regeneration ......................... ... ........ 23
2.4.5. Dendrochronological analyses ofyellow birch growth ......................... 24
2.4.6. Climate data ......... ... .................... ... ..................... ... ..................... ... ........ 26
lV
2.5. Results ..... ... ..................... ... ..................... ... .................... ... ..................... ... ........ 29
2.6. Discussion .......................................................................................................... 44
2.6.1. Y ellow birch regeneration and growth along a latitudinal gradient ....... 45
2.6.2 Speculation on site- vs. domain-level effects on regeneration and growth .................................................................................................... 48
2. 7 Conclusion ......................................................................................................... 51
2.8 Acknowledgements ............................................................................................ 52
2.9 References .......................................................................................................... 53
CHAPITRE III CONCLUSION GÉNÉRALE ..................................................................................... 61
BIBLIOGRAPHIE POUR L'INTRODUCTION ET LA CONCLUSION GÉNÉRALE ..................................................................................................... ... ........ 69
LISTE DES FIGURES
Figure Page
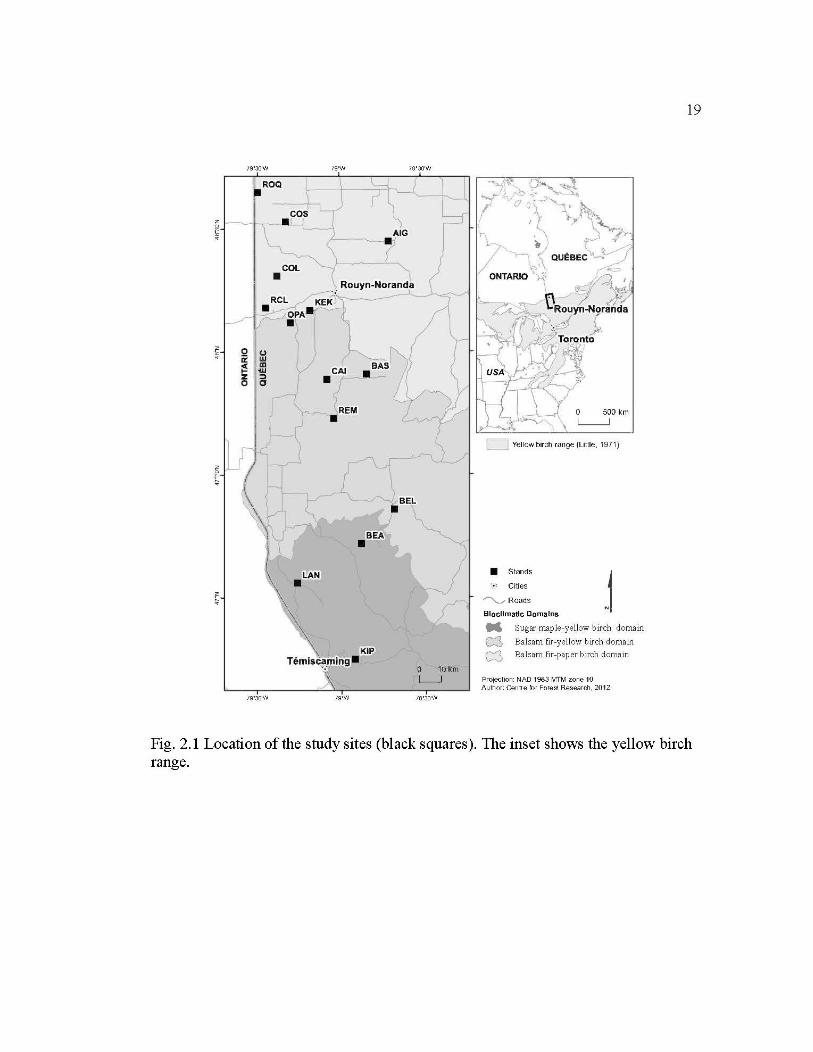
2.1 Location of the study sites (black squares). The inset shows the yellow birch range .. ... .. . ... .. . ... .. . ... .. . ... .. . ... .. . ... .. . ... .. . ... .. . ... .. . .. .. . ... .. . ... .. . ... .. . ... .. . ... 19
2.2. Distribution of seedling and sapling densities along a latitudinal gradient in western Quebec. Dashed lines represent limits of bioclimatic domains (SM = sugar maple, BF = balsam fir, PB = paper birch). Note that for the sake of presentation clarity, the X axis reflects the relative positions of sites and limits, and not the ir exact latitudes.... 36
2.3 Age structure of yellow birch seedling populations at three sites, each within a different bioclimatic domain (SM = sugar maple, BF = balsam fir, PB = paper birch). Solid and dashed lines represent fitted exponential and power functions, with respective R 2 values indicated below site names ..................................................................................... 37
2.4 Calculation of the site dryness index as the first principal component (PC1) ofselected soil properties (A), and its change along latitude (B). SOL = thickness of the soil organic layer............................................... 38
2.5 Relationship between site factors and yellow birch regeneration as revealed by principal component analysis. (A) Structure of principal components (PC) 1 and 2, explaining 65.2% ofthe total variance in the datas et. (B) Variation in site PC scores along latitude. Regression R 2
are given for each analysis. Solid and dashed lines represent regressions with PC 1 and PC2, respectively. (C) Relationship between regeneration density and PCs. Abbreviations: Lat = latidude; CEC = total cation exchange capacity; TotDensity = total density of canopy trees; MAge_ YB = mean age of yellow birch population; Deadwood = surface area of decomposing deadwood; SiteDindex = site dryness index (see Fig. 2.4 and Methods section); BAA_YB = total basal are a of yellow birch .. .. .. .. .. .. .. .. .. .. .. .. .. .. .. .. .. .. .. .. .. .. .. .. .. .. .. .. .. .. .. . 39
2.6 Age-related increase in yellow birch growth rate in three bioclimatic domains (northem-most domain divided into southem and northern parts ; SM = sugar maple, BF = balsam fir, PB = paper birch) for the first 50 years of growth. Data for each graph was obtained by aggregating all single-tree BAI chronologies for a zone and calculating average BAI increments along cambial age gradient. Bars represent +/-1 SD from respective average value. Data is fitted by linear regression (thick clark line ). Values of b coefficient (regression slope ), R2
, and total number of trees (n) are given for each zone. Only cores with the pith or sufficiently close to it (number of estimated rings between the
Vl
oldest measured ring and the pith < 15 years) were used for this analysis .. ... ... ... ... ... ... ... ... ... ... ... ... ... ... ... ... ... ... ... ... .. ... ... ... ... ... ... ... ... ... ... ... ... 41
2.7 Response function analysis of climate effects on yellow birch growth in three bioclimatic domains (northern-most domain divided into southern and northern parts; SM = sugar maple, BF = balsam fir, PB = paper birch). DC, DDays, and GSL are average summer Monthly Drought Index, degree-days above 5°C, and length of the growing season, respectively. Snow refers to the total amount of solid precipitation for the period March through May. The prefix p indicates variables for the previous calendar year. Bars represent values of response coefficients and vertical lines a 95% confidence envelop around each coefficient. Significant (p < 0.05) response coefficients are indicated by clark-grey color ............................................................. 42
2.8. Relationship between drought impact on yellow birch growth and drought intensity in the northern part of the bals am fir - paper birch domain. The drought impact is expressed as response function coefficient between summer drought code (DC) and residual subregional chronology in 10-year moving periods over 1955-2003. A complete set of bioclimatic variables (see Fig. 7) was included in each response function analysis. . ... . . . ... . . . ... . . . ... . . . ... . . . .. . . . ... . . . ... . . . ... . . . ... . . . ... . . . ... 43
2.9 Yellow birch growth response to drought along latitude. Response to drought is represented by the b coefficient of the linear regression between DC ( drought code) and growth index. Shown are regressions between latitude and (A) raw b coefficients (R2
= 62.0%) , and (B) b coefficients adjusted for the differences in both soil conditions and age of yellow birch population (R2
= 6.3%). Labels in (A) indicate site codes and respective R2
, in %, of the regression between DC and growth index. Black and white dots indicate non-significant and significant (p < 0.05) b coefficients, respectively. The vertical dashed line refers to the northern limit of yellow birch distribution in western Quebec. ................................................................................................... 44
2.10 Long-term geographical distribution of the August drought code (DC) values for an area in eastern Canada. Map was produced in BioSim software package (Regniere and Bolstad, 1994), using daily climate station data for the period 1950-2010. .................................................... 51
LISTE DES TABLEAUX
Tableau
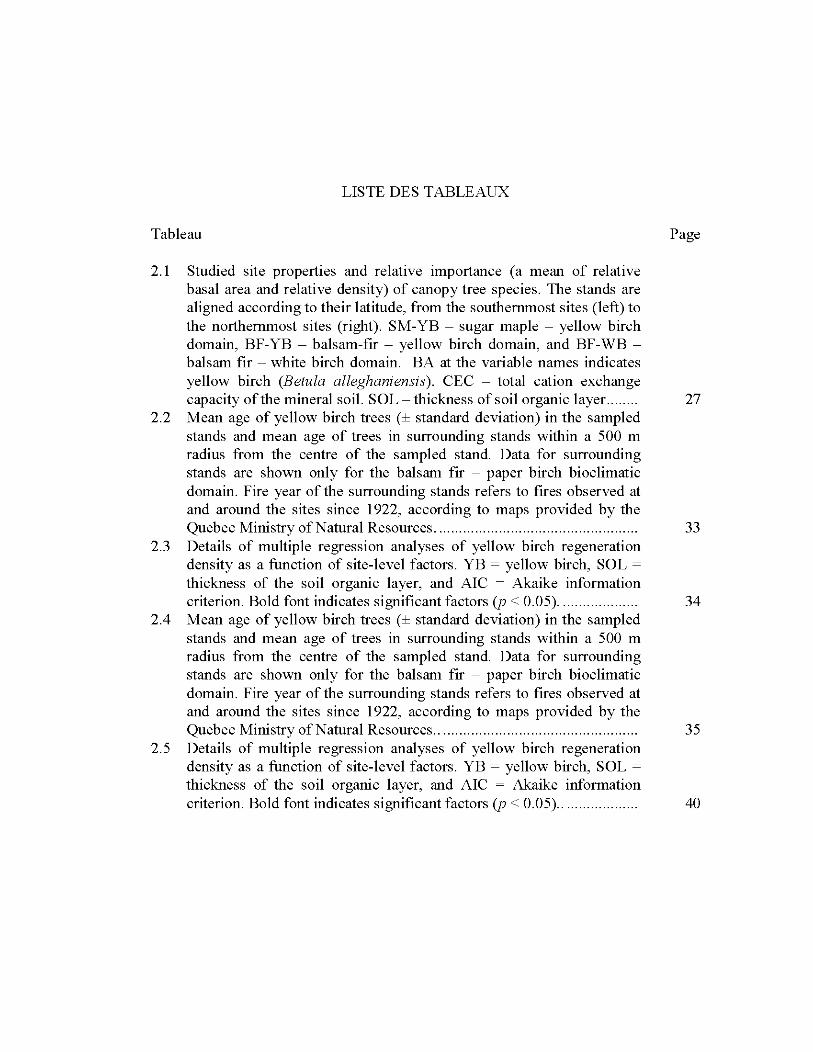
2.1 Studied site properties and relative importance (a mean of relative basal area and relative density) of canopy tree species. The stands are aligned according to their latitude, from the southemmost sites (left) to the northemmost sites (right). SM-YB - sugar maple - yellow birch domain, BF-YB- balsam-fir- yellow birch domain, and BF-WBbalsam fir - white birch domain. BA at the variable names indicates yellow birch (Betula alleghaniensis). CEC - total cation exchange
Page
capacity of the mineral soil. SOL- thickness of soil organic layer........ 27 2.2 Mean age of yellow birch trees (± standard deviation) in the sampled
stands and mean age of trees in surrounding stands within a 500 rn radius from the centre of the sampled stand. Data for surrounding stands are shown only for the balsam fir - paper birch bioclimatic domain. Fire year of the surrounding stands refers to fires observed at and around the sites since 1922, according to maps provided by the Quebec Ministry ofNatural Resources. .................................................. 33
2.3 Details of multiple regression analyses of yellow birch regeneration density as a function of site-level factors. YB = yellow birch, SOL = thickness of the soil organic layer, and AIC = Akaike information criterion. Bold font indicates significant factors (p < 0.05). ................... 34
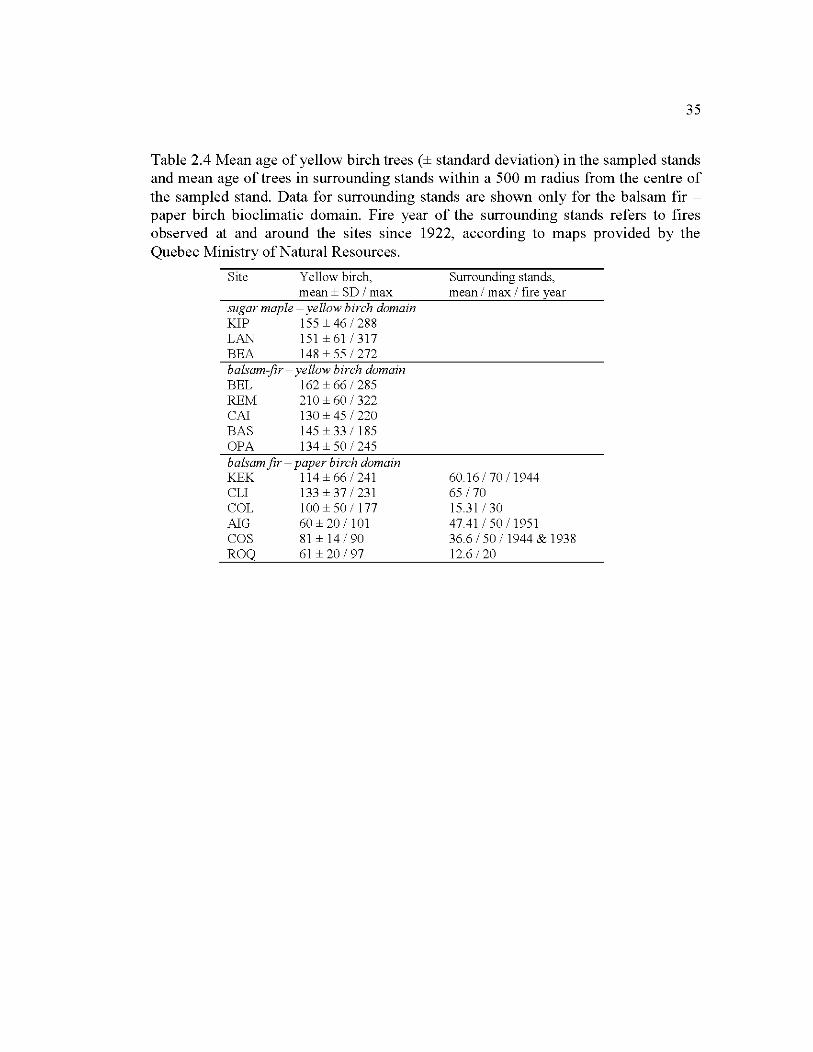
2.4 Mean age of yellow birch trees (± standard deviation) in the sampled stands and mean age of trees in surrounding stands within a 500 rn radius from the centre of the sampled stand. Data for surrounding stands are shown only for the balsam fir - paper birch bioclimatic domain. Fire year of the surrounding stands refers to fires observed at and around the sites since 1922, according to maps provided by the Quebec Ministry ofNatural Resources.. ................................................. 35
2.5 Details of multiple regression analyses of yellow birch regeneration density as a function of site-level factors. YB = yellow birch, SOL =
thickness of the soil organic layer, and AIC = Akaike information criterion. Bold font indicates significant factors (p < 0.05).. .................. 40
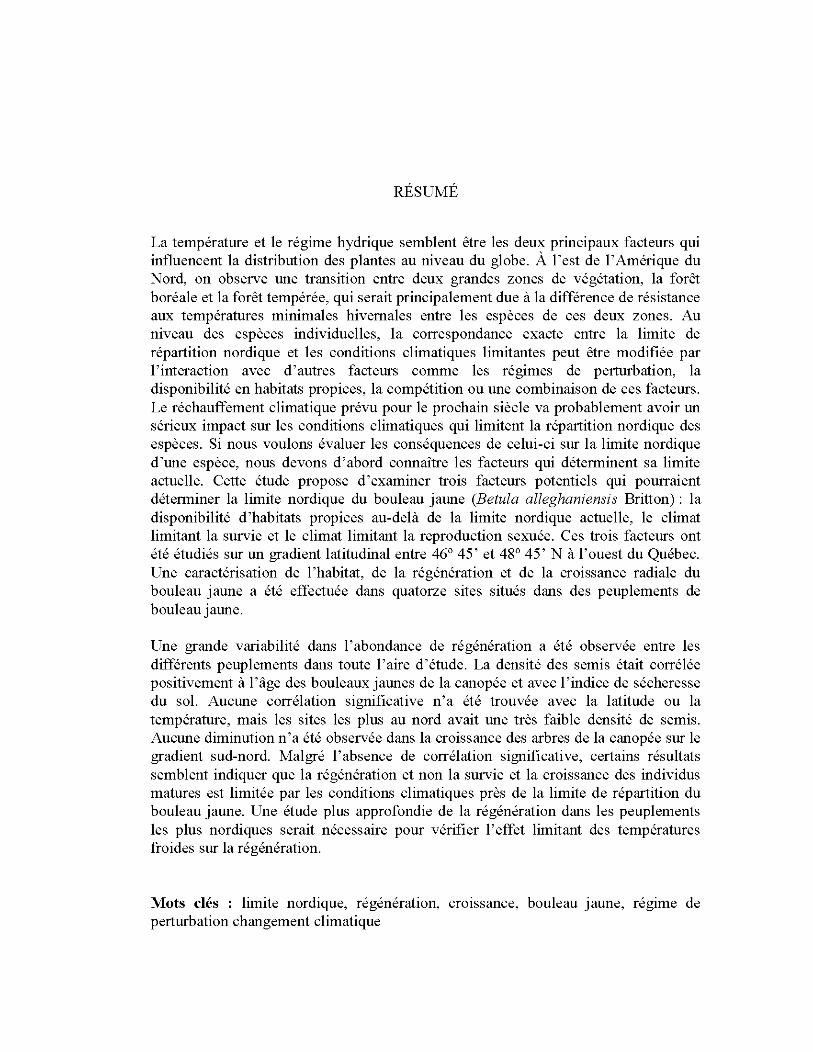
RÉSUMÉ
La température et le régime hydrique semblent être les deux principaux facteurs qui influencent la distribution des plantes au niveau du globe. À 1' est de 1' Amérique du Nord, on observe une transition entre deux grandes zones de végétation, la forêt boréale et la forêt tempérée, qui serait principalement due à la différence de résistance aux températures minimales hivernales entre les espèces de ces deux zones. Au niveau des espèces individuelles, la correspondance exacte entre la limite de répartition nordique et les conditions climatiques limitantes peut être modifiée par l'interaction avec d'autres facteurs comme les régimes de perturbation, la disponibilité en habitats propices, la compétition ou une combinaison de ces facteurs. Le réchauffement climatique prévu pour le prochain siècle va probablement avoir un sérieux impact sur les conditions climatiques qui limitent la répartition nordique des espèces. Si nous voulons évaluer les conséquences de celui-ci sur la limite nordique d'une espèce, nous devons d'abord connaître les facteurs qui déterminent sa limite actuelle. Cette étude propose d'examiner trois facteurs potentiels qui pourraient déterminer la limite nordique du bouleau jaune (Betula alleghaniensis Britton) : la disponibilité d'habitats propices au-delà de la limite nordique actuelle, le climat limitant la survie et le climat limitant la reproduction sexuée. Ces trois facteurs ont été étudiés sur un gradient latitudinal entre 46° 45' et 48° 45 ' N à l' ouest du Québec. Une caractérisation de l'habitat, de la régénération et de la croissance radiale du bouleau jaune a été effectuée dans quatorze sites situés dans des peuplements de bouleau jaune.
Une grande variabilité dans l' abondance de régénération a été observée entre les différents peuplements dans toute l'aire d'étude. La densité des semis était corrélée positivement à 1 ' âge des bouleaux jaunes de la canopée et avec 1 'indice de sécheresse du sol. Aucune corrélation significative n'a été trouvée avec la latitude ou la température, mais les sites les plus au nord avait une très faible densité de semis. Aucune diminut ion n 'a été observée dans la croissance des arbres de la canopée sur le gradient sud-nord. Malgré l'absence de corrélation significative, certains résultats semblent indiquer que la régénération et non la survie et la croissance des individus matures est limitée par les conditions climatiques près de la limite de répartition du bouleau jaune. Une étude plus approfondie de la régénération dans les peuplements les plus nordiques serait nécessaire pour vérifier l'effet limitant des températures froides sur la régénération.
Mots clés : limite nordique, régénération, cr01ssance, bouleau j aune, régime de perturbation changement climatique
CHAPITRE I
INTRODUCTION GÉNÉRALE
1.1. Problématique
Notre planète est présentement dans une période de réchauffement climatique. La
température moyenne dans l'hémisphère nord lors du 20e siècle a probablement
connu la plus grande augmentation pour un siècle durant le dernier millénaire
(Houghton et al. 2001). Si l'on maintient la tendance actuelle d'émission de gaz à
effet de serre, la température mondiale moyenne pourrait augmenter de 1.4 à 4. 8°C
entre 2005 et 2100 (Collins et al. 2013). Au Québec, les modèles climatiques
projettent une augmentation médiane des températures de 5 à 9°C en hiver et de 2 à
3.5°C en été pour la fin du siècle (Logan et al. 2011). Les facteurs climatiques, tels
que la température et le régime hydrique, contrôlent en grande partie la répartition et
la croissance des différentes espèces de plantes au niveau du globe (Woodward
1987). Le réchauffement climatique pourrait affecter particulièrement la limite
nordique des espèces, car les conditions limitantes liées aux températures froides vont
probablement être repoussées vers les pôles. Les études paléoécologiques donnent
plusieurs évidences de changement de répartition des espèces dans les régions
tempérées de 1 'hémisphère nord suite à des changements climatiques à grande échelle
durant l'Holocène et d'autres périodes plus anciennes (Larocque et al. 2000; Miller et
al. 2008; Bradshaw et al . 201 0).
Le bouleau jaune est une espèce dont la limite nordique correspond env1ron à
l'isotherme de températures annuelles moyennes de 2°C (Burns et Honkala 1990).
C'est l'une des espèces feuillues avec la plus grande valeur économique dans l'est de
l' Amérique du Nord (Burns et Honkala 1990). Le bouleau jaune est également une
des espèces feuillues qui a un impact important sur la structure des peuplements
2
forestiers à la limite entre les biomes tempéré et boréal (Little 1971). Le
réchauffement climatique actuel a le potentiel de faire migrer la limite de répartition
du bouleau jaune vers le nord. Chez plusieurs espèces d'arbres des forêts tempérées,
la résistance au froid hivernal semble être le facteur principal qui contrôle leur
répartition nordique (Sakai et Weiser 1973; Woodward 1987; 1990; Arris et Eagleson
1989; Flannigan et Woodward 1994). La correspondance exacte entre la limite de
répartition nordique et les conditions climatiques peut cependant être modifiée par
l'interaction avec d'autres facteurs comme les régimes de perturbation, la
disponibilité en habitats propices ou la compétition. (Sakai et Weiser 1973;
Woodward 1987; Desponts et Payette 1992; Meilleur et al. 1997; Flannigan et
Bergeron 1998; Tremblay et al, 2002; Graignic et al. 2014). Pour prédire l'impact
qu'auront les changements climatiques sur le bouleau jaune à sa limite nordique
actuelle, il est important de comprendre les facteurs climatiques et non climatiques
limitants ces différents stades de vie. Dans cette étude, les facteurs qui ont le potentiel
de modifier la limite nordique du bouleau jaune et les effets du climat sur la
croissance et la reproduction du bouleau jaune près de sa limite nordique seront
documentés.
1.2. État des connaissances
1.2.1. Caractéristiques de reproduction
Le bouleau jaune atteint sa maturité sexuelle à l'âge de 10 à 40 ans (Robitaille et
Roberge 1981) et l 'âge de 70 ans est considéré comme optimal pour la production de
graines (Erdmann 1990). Les bonnes années de graines ont lieu habituellement à des
intervalles de 2 à 3 ans, mais la fréquence des bonnes ou très bonnes années varie
dans le temps et selon les régions (Burton et al. 1969; Godman et Mattson 1976;
Solomon et Leak 2002). Le bouleau jaune peut produire entre 2. 5 et 12.4 millions de
graines par hectare dans les bonnes années de production et jusqu'à 89 millions par
3
hectare dans une année d'excellente production (Gilbert 1965; Gross et Hamden
1968). Au Canada, la majeure partie des graines tombent avec le temps froid du mois
d'octobre (Burton et al. 1969). Les graines sont dispersées par le vent et peuvent être
transportées jusqu'à 400m sur de la neige glacée (Burton et al. 1969). Les graines de
bouleau jaune qui atteignent le sol peuvent germer l'année suivant leur production ou
être incorporées dans la banque de graines (Houle 1992). Leur période de viabilité
d'environ 2 ans est relativement courte (Houle 1992). Les peuplements de bouleaux
jaunes semblent en grande partie dépendants de la production de graines viables pour
leur maintien à long terme, car la reproduction végétative n'est pas fréquente comme
chez d'autres espèces feuillues (Tremblay et al. 2002). Les semis et les gaules de
bouleau jaune se reproduisent par rejets de souche lorsqu'ils sont coupés, mais les
plus grosses tiges n'en produisent que très peu (Solomon et Blum 1967; Perala 1974).
1.2.2. Sols et substrat de germination
Le bouleau jaune croît sur une grande variété de sols. Au Michigan et au Wisconsin,
il est retrouvé sur des tills glaciaires, des sables délavés, des dépôts lacustres, des
dépôts de loess minces et des sols résiduels dérivés de grès, de calcaire, et de roches
métamorphiques et ignées (Post et al. 1969). La croissance du bouleau jaune est
affectée par la fertilité et la texture du sol, le drainage, la profondeur d'enracinement,
l'élévation et l'exposition de la pente (Erdmann 1990). Le bouleau jaune atteint sa
croissance optimale sur les loams fertiles bien drainés et les loams sableux avec un
drainage moyen dans les ordres podzolique et régosolique et sur des terrains plats ou
de pentes faibles (Gilbert 1965).
Les jeunes semis de bouleau jaune sont par contre très dépendants des conditions du
lit de germination pour leur survie (Winget et Kozlowski 1965). Le lit de germination
idéal semble être un sol possédant une bonne humidité où le sol minéral est mélangé
à la matière organique en décomposition (Goodmann et Krefting 1960; Tubbs 1969;
4
Perala et Alm 1990). Cependant dans les peuplements fermés, une grande majorité
des semis se développent sur les petits monticules et les troncs en décomposition
(Winget et Kozlowski 1965). Cette préférence serait due à la grande quantité
d'éléments nutritifs dans ces microsites et à la mince couche de litière (Ruel et al.
1988). Les jeunes semis meurent rapidement lorsqu'ils se développent sur une litière
épaisse comme celles des feuilles d'érable, car leurs radicules ne peuvent la traverser
(Burton et al. 1969).
1.2.3. Compétition
Pour survivre et croitre jusqu'à la canopée, les bouleaux jaunes juvéniles ont besoin
de suffisamment de lumière. L'intensité de lumière pour leur croissance optimale
s'élève à environ 45% du plein soleil (Logan 1965; Tubbs 1969; Houle et Payette
1990). Leur survie et leur croissance à long terme sont menacées à moins de 10% de
la lumière totale (Kobe et al. 1995). Kobe et al. (1995) ont observé que la mortalité
juvénile du bouleau j aune diminue très rapidement avec l 'augmentation de l ' intensité
lumineuse et que cette mortalité est minimale dès que 1' intensité lumineuse atteint 15
% de la lumière totale. Le bouleau jaune est généralement considéré comme
intermédiaire dans sa tolérance à l'ombre et son habileté compétitive (Baker 1949;
Forcier 1975; Kobe et al. 1995). Il est plus tolérant à l'ombre que les autres espèces
de bouleaux indigènes comme le bouleau blanc (Betula papyrifera Marsh), mais
moins que plusieurs espèces qui lui sont généralement associées comme l 'érable à
sucre (Acer saccharum Marsh. ), le hêtre à grandes feuilles (Fa gus grandifolia Ehrh.)
et la pruche (Tsuga canadensis (L.) Carr.) (Gilbert 1965). Dans les forêts mixtes
situées dans le sud du Québec, la présence d'espèce comme l 'érable à sucre et le hêtre
qui sont capables d'intercepter la lumière efficacement limite la régénération du
bouleau jaune aux sols perturbés et aux trouées (Winget et Kozlowski 1965).
Cependant, dans les forêts mixtes situées plus au nord, l'érable à sucre et le hêtre sont
5
moins abondants ou absents ce qui donne une canopée relativement plus ouverte et
une communauté de semis plus ubiquiste (Bouchard et al. 2005). Au Témiscamingue,
situé dans la partie sud de notre aire d'étude, Bouchard et al. (2005) ont observé dans
une forêt non perturbée que même si la densité de gaules de bouleau jaune est
relativement faible (59 tiges/ha), les arbres matures peuvent persister plus de 200 ans
dans la canopée et que 1 'accession occasionnelle de gaules à la canopée serait
suffisante pour maintenir la population.
1.2.4. Précipitations
Pendant les premières années, les semis de bouleau jaune sont très vulnérables à la
sécheresse (Linteau 1948). L'humidité du lit de germination pourrait être plus
importante pour la croissance et la survie des jeunes semis que la disponibilité de
lumière (Burton et al. 1969). Au niveau historique, Jackson et Booth (2002) ont
étudié le rôle de la variabilité climatique de la fin de l'Holocène dans l 'expansion du
bouleau jaune dans la région à l'ouest des Grands Lacs. Ils suggèrent que l'expansion
du bouleau jaune durant cette période pourrait être liée à une augmentation des
précipitations qui aurait amélioré le taux de survie des semis du bouleau jaune. Les
semis de bouleaux jaunes de deux à trois ans étant très sensibles à des périodes de
sécheresse (Goodman et Krefting 1960; Hatcher 1966; Houle 1994).
Il a été démontré que le manque de précipitations a un effet important sur la variation
de la croissance d'un arbre (Fritts 1976). Durant un été sec, l' eau peut être assez
déficiente pour limiter la division cellulaire et les processus d'élargissement des
cellules (Fritts 1976). Cependant, les précipitations sont habituellement plus
contraignantes à la survie d 'une espèce dans les régions arides qui correspondent
souvent dans 1 'hémisphère nord à la limite sud des espèces (Woodhouse et Meko
1997; Cremaschi et al. 2006).
6
Les quantités de précipitations brutes peuvent ne pas refléter adéquatement la quantité
d'eau qui est réellement accessible aux arbres. L'indice de sécheresse utilisé entre
autres pour la prédiction du risque des feux de forêt au Canada est un indice qui prend
en compte les températures, le temps de 1 'année, la latitude et 1 'accumulation des
précipitations sur une longue période. Il permet d'estimer le contenu en eau retenu
par la couche d'humus du sol forestier (Turner 1972). Cet indice peut donc être un
bon indicateur de la disponibilité en eau pour les arbres.
1.2.5. Température
Puisque cette étude porte sur la limite nordique du bouleau jaune, nous examinerons
en particulier les effets potentiels des températures froides sur le cycle de vie de du
bouleau jaune.
En premier lieu, les températures froides ont le potentiel de limiter la production de
graines viables. Ceci peut être expliqué en partie par la résistance au froid
relativement faible des bourgeons floraux par rapport aux bourgeons végétatifs chez
plusieurs espèces (Sakai et Weiser 1973). La viabilité des graines semble être affectée
par les conditions météorologiques durant la pollinisation, la fertilisation et le
développement des graines (Erdmann 1990). La distribution du tilleul à petites
feuilles (Tilia cordata Mill.), par exemple, est liée à la sensibilité au froid de son tube
pollinique (Pigott et Huntley 1980; 1981). Tremblay et al. (2002) ont également
démontré l'effet de la latitude et des conditions climatiques, notamment des gelées
printanières, sur la production de samares des populations nordiques d'érable rouge.
Les gelées sévères qui se produisant durant la floraison diminuent significativement
le nombre de samares viables (Tremblay et al. 2002). Chez le bouleau jaune, une
étude sur la production de graines sur un gradient d 'altitude dans le New Hampshire a
montré une diminution de la production de graines avec l 'augmentation de l'altitude
qui est probablement liée à la diminution des températures (O'Donoghue 2004).
7
Les températures froides peuvent aussi limiter la croissance des arbres de plusieurs
façons. Premièrement, la température du cambium qui est relié directement à celle de
l'air peut être directement un facteur limitant par son contrôle de la respiration et des
processus d'assimilation (Fritts 1976). Les effets directs de la température sur la
croissance radiale sont plus souvent observés au début de la saison de croissance
lorsque des températures anormalement froides peuvent causer un délai dans le lever
de la dormance (Fritts 1976). La saison de croissance écourtée qui en résulte
favorisera un cerne plus étroit. Une fois la période de croissance débutée, toute
période de températures très froides près de 0°C peut limiter la croissance, mais au
fur et à mesure que les températures augmentent d'autres facteurs comme les
précipitations deviennent normalement plus limitants (Fritts 1976). À de hautes
latitudes ou altitudes où la saison de croissance potentielle est courte et la température
des plantes peut-être basse alors que le cambium est encore actif, la croissance radiale
peut être grandement réduite à n'importe quel moment durant la saison de croissance
(Fritts 1976). À l 'exception de ces sites extrêmement froids, l'activité cambiale à la
fin de 1' été peut cesser à cause de conditions internes bien avant que les températures
soient assez froides pour limiter les processus d'assimilation et de division cellulaire
(Fritts 1976). Cet effet des températures froides sur l'activité cambiale semble être
une des principales causes de l'écotone entre la forêt boréale et la toundra (Grace et
al. 2002) mais n'est habituellement pas associé à la limite entre la forêt boréale et
tempérée.
La température peut aussi affecter indirectement la crmssance d 'un arbre en lui
causant des blessures par le gel. Le niveau de tolérance au gel est sujet à un cycle
périodique durant l 'année (Sakai 1970). Les arbres des forêts tempérées et boréales
ont une résistance maximum au gel pendant l'hiver et minimum pendant l 'été (Sakai
1970). Cette résistance est acquise par un processus graduel d'endurcissement au
froid à l'automne et est perdue par le processus inverse au printemps (Calmé et al.
1994). Ainsi, les blessures causées par le froid peuvent se produire sous des
8
conditions climatiques différentes selon le temps de l'année, comme les gelées
tardives au printemps et hâtives à l'automne ou des froids sévères à l'automne, à
l'hiver et au printemps (Sakai 1970; Sakai et Weiser 1973; Calmé et al. 1994). Si les
températures durant la saison de croissance descendent suffisamment pour geler le
tissu cambial, celui-ci peut-être endommagé, ce qui affectera grandement l'anatomie
et la croissance subséquente de l'anneau (Fritts 1976). Les températures hivernales
peuvent aussi avoir un impact sur la croissance des arbres. Certaines études montrent
une relation positive entre les températures hivernales et la croissance radiale de l ' été
suivant chez certaines espèces (Tardif et al. 2001; Pederson et al. 2004). Pederson et
al (2004) ont supposé que cette relation pouvait être contrôlée par une augmentation
des blessures aux racines avec une diminution de la température. Les températures
hivernales froides peuvent aussi causer une embolie dans les cellules du xylème lors
du dégel au printemps ce qui force l'arbre à produire de nouveaux tissus pour le
transport de l 'eau (Sperry et al. 1994; Pederson et al. 2004). Pour remplacer ces tissus
endommagés, l ' arbre utilise de l ' énergie qu'il aurait pu utiliser pour la
croissance.Plusieurs études ont démontré que la plupart des espèces qui composent
les forêts décidues tempérées du nord-est de l'Amérique du Nord affichent une
tolérance au gel dans les cellules de parenchymes du xylème de leurs tiges qui varient
entre -41 oc et -47 °C (George et al. 1974; Ishikawa et Sakai 1982; Gusta et al.
1983). Cette température est moins élevée que chez la plupart des espèces de feuillus
présentes en forêt boréale comme le bouleau blanc et le tremble. Plusieurs auteurs
suggèrent donc que c 'est la différence de résistance aux températures froides
hivernales entre les espèces tempérées et boréales qui pourrait expliquer la transition
entre ces deux types de végétations dans l'est de l'Amérique du Nord (George et al.
1974; Marchand 1987; Arris et Eagleson 1989). Pour le bouleau jaune, George et al.
(1974) ont déterminé expérimentalement cette tolérance au gel à environ -44 °C, mais
cette valeur peut varier légèrement selon les arbres de -41.2 oc à -46.2 °C.
9
À l'extrême les blessures aux tissus causées par le gel peuvent aller jusqu'à causer la
mort des individus (Sakai et Weiser 1973; Calmé et al. 1994). Il est généralement
reconnu que les semis ont une tolérance au froid moins grande que les arbres matures
(Sakai et Larcher 1987; Hoffman et al. 2014). Les semis de bouleau jaune semblent
toutefois avoir une relativement bonne tolérance au froid quand on les compare à
d'autres espèces d'arbres des forêts tempérées de l'est de l'Amérique du Nord comme
l'érable à sucre et le chêne rouge (Calmé et al. 1994). Calmé et al. 1994 ont
enregistré un taux de 100 % de survie des jeunes semis de bouleau jaune comparé à
50 % de survie pour les semis d'érable à sucre lors d'un hiver où les températures
minimales ont atteint -33°C. C'est la tolérance au froid des racines du bouleau jaune
qui semble plus limitante car l'on a enregistré une mortalité d'environ 2/3 de la masse
racinaire chez des semis à racine nue exposés à des températures de -33 oc pendant 1
heure (Calmé et al. 1994). Les arbres matures peuvent aussi être tués par le froid
(Hoffman et al. 2014). Par exemple, on a attribué le rétrécissement de l 'aire de
répartition du mélèze laricin (Larix laricina) dans le nord du Canada durant une
période de refroidissement climatique des années 60 et 70 à une mortalité sévère des
individus matures (Payette et Lajeunesse 1980)
1.2.6. Perturbation
Chez certaines espèces, la correspondance exacte entre la limite de répartition
nordique et les conditions climatiques peut être modifiée par l'interaction avec les
régimes de perturbation par le feu. Par exemple, la répartition nordique du pin rouge
(Pinus resinosa) ne semble pas être déterminée directement par le climat, mais plutôt
par le régime de feu (Flannigan et Bergeron 1998). À sa limite nordique, celui-ci est
restreint à certaines îles et aux rives des lacs à cause de la protection que ce type
d'habitat offre contre les grands feux intenses qui surviennent sur le reste du territoire
(Bergeron et Brisson 1990).
10
Les semis et gaules de bouleau jaune sont tués par les feux de faible intensité
(Erdmann 1990). Les arbres matures de bouleau jaune peuvent potentiellement
survivre à des feux de faible ou moyenne intensité (Martin 1959; Perala 1987), mais
sont probablement vulnérables à des feux de plus forte intensité en raison de la faible
épaisseur de l'écorce (Erdmann 1990)
1.3. Objectifs de l'étude et hypothèses de travail
L'objectif général de ce projet de recherche est de documenter les facteurs qm
pourraient limiter la répartition nordique du bouleau jaune. Cet objectif peut être
subdivisé en deux sous objectifs :
• Évaluer les relations entre les facteurs climatiques (température, précipitation,
indice de sécheresse, nombre de degrés-jours de croissance au-dessus de 5 °C)
et le taux d'accumulation de biomasse du bouleau jaune le long d'un gradient
latitudinal entre 46° 45' et 48° 45' N dans l'ouest du Québec.;
• Évaluer les changements dans la dynamique de reproduction du bouleau jaune
en relation avec la latitude sur un gradient latitudinal allant de 46° 45' et 48°
45' N dans l'ouest du Québec.
Nous proposons deux hypothèses concernant les facteurs potentiels du contrôle de la
distribution nordique du bouleau jaune. Notre première hypothèse est que la
croissance du bouleau jaune est de plus en plus contrôlée par les températures froides
vers le nord. Les températures hivernales froides peuvent causer des blessures par le
gel aux tissus de l'arbre et potentiellement affecter négativement l ' accumulation de
biomasse et ultimement la mort de celui-ci (Tardif et al. 2001; Pederson et al. 2004).
Notre deuxième hypothèse est que le succès reproducteur du bouleau jaune diminue
avec la latitude, car il est de plus en plus limité par les conditions climatiques près de
sa limite nord. La régénération pourrait être affectée par une faible production de

11
grames viables et un faible succès d'établissement des jeunes semis de première
année en raison des gelées tardives plus fréquentes au printemps et à l'été. Le succès
de la régénération du bouleau jaune pourrait aussi être affecté par les températures
froides hivernales causant une mortalité accrue des jeunes semis vers le nord en
raison de leur moins grande tolérance au froid comparé aux arbres plus âgés.

CHAPITRE II
ENVIRONMENT AL CONTROLS OF THE NORTHERN DISTRIBUTION LIMIT OF YELLOW BIRCH IN EASTERN CANADA
*Published in CanadianJournal ofForest Research. 2014. 44(7): 720-731.
Environmental con trois of the northern distribution limit of yellow birch in Eastern Canada
13
Igor Drobyshev1•2
*#, Marc-Antoine Guitard3#, Hugo Asselin1
, Aurélie Genries1 & Yves Bergeron1
L Chaire industrielle CRSNG-UQAT-UQAM en aménagement forestier durable, Université du Québec en Abitibi-Témiscamingue (UQAT), 445 bouL de l'Université, Rouyn-Noranda, Québec, J9X 5E4, Canada LD. [email protected] 1 H.A. [email protected] 1 A.G. [email protected] 1 Y.B. [email protected]
2. Southem Swedish Forest Research Centre, Swedish University of Agricultural Sciences, P.O. Box 49, 230 53 Alnarp Sweden, [email protected]
3. Ministry of Environment, Bathurst Regional Office, New Brunswick, Canada Marc-Antoine.Guitard@ gnb.ca
* Igor Drobyshev is the corresponding author: Chaire industrielle CRSNG-UQAT-UQAM en aménagement forestier durable Université du Québec en Abitibi-Témiscamingue (UQAT) 445 boul. de l'Université, Rouyn-Noranda, Québec J9X 5E4, Canada Igor. Drobyshev@ugat. ca 1 Igor. [email protected] phone + 1 819 762 0971 ext. 2057 Il fax + 1 (819) 948 2055 # contribution ofthe 2 first authors are equivalent Running head Yellow birch at its northem limit
14
2.1. Abstract
To evaluate environmental controls of yellow birch (Betula alleghaniensis Britton)
distribution at its northern distribution limit in eastern Canada, we analysed
abundance, age structure, biomass accumulation rate, and growth sensitivity to
climate of this species at 14 sites along a 200-km latitudinal gradient spanning three
bioclimatic domains and reaching frontier populations of this species in western
Quebec. We observed a large variability in seedling density across domains and
presence of sites with abundant yellow birch regeneration within all three bioclimatic
domains. Seedling density was positively correlated to the mean age and the
abundance of yellow birch trees in the canopy, while sapling density was positively
associated with dryer habitats. Growth patterns of canopy trees showed no effect of
declining temperatures along the south-north gradient. Environmental controls of
birch distribution at its northern limit were realized through factors affecting birch
regeneration and not growth of canopy trees. At the stand scale, regeneration density
was strongly controlled by local site conditions, and not by differences in climate
among sites. At the regional scale, climate variability could be an indirect driver of
yellow birch distribution, affecting disturbance rates and, subsequently, availability of
suitable sites for regeneration.
15
2.2. Résumé
Afin d'évaluer les facteurs environnementaux contrôlant la distribution du bouleau
jaune (Betula alleghaniensis Britton) à sa limite nord de distribution dans l'est du
Canada, nous avons analysé l'abondance, la structure d'âge, le taux d'accumulation
de biomasse et la sensibilité de la croissance au climat de cette espèce, dans 14 sites
répartis le long d'un gradient latitudinal de 200 km, ce dernier couvrant trois
domaines bioclimatiques et atteignant les populations les plus à l'ouest du Québec.
Nous avons observé une grande variabilité au niveau de la densité de plantules entre
les domaines, ainsi que la présence de sites avec une régénération abondante du
bouleau jaune dans chaque domaine bioclimatique. La densité de plantules était
corrélée positivement à l'âge moyen et à l'abondance des bouleaux jaunes mâtures
dans la canopée, alors que la densité de gaulis était positivement associée aux habitats
plus secs. Les patrons de croissance des arbres mâtures n' ont pas montré d'effet
négatif de la température le long du gradient sud-nord. Les facteurs contrôlant la
distribution du bouleau à sa limite nord comprenaient des facteurs affectant la
régénération du bouleau, mais pas la croissance des arbres mâtures. À l'échelle du
peuplement, la densité de régénération était fortement contrôlée par les conditions
locales de site, et non par les différences climatiques entre les sites. À l' échelle
régionale, la variabilité climatique pourrait indirectement contrôler la distribution du
bouleau jaune en affectant la fréquence des perturbations et, conséquemment, la
disponibilité de sites propices à la régénération.
16
2.3. Introduction
Future climatic variability will likely affect growth and distribution of tree species
along various environmental gradients. Paleoecological studies provide abundant
evidence of shifts in species distributions in temperate and boreal regions of the
northern hemisphere as a result of large-scale climate changes over the Holocene and
earlier periods (Larocque et al. 2000, Miller et al. 2008, Bradshaw et al. 201 0).
Climate change might affect the geographical position of biomes as well as single tree
spectes, especially at mid and high latitudes (Prentice et al. 1992, Harrison et al.
1995).
The effects of climatic conditions on tree growth vary across species' distribution
limits. For example, in the Northern Hemisphere, the role of temperature is often
considered to increase towards col der parts of species' ranges usually corresponding
to higher latitudes or elevations (Gedalof and Smith 2001, Wang et al. 2002,
Pederson et al. 2004), whereas precipitation constrains tree growth in arid regions,
corresponding to species' southern distribution limits (Woodhouse and Meko 1997,
Crernaschi et al. 2006). However, other patterns are also common, e.g., with
temperature control of growth being detected only at northern distribution limits
(Cook et al. 1998, Tardif et al., 2001 ), across who le distribution ranges (Cook and
Cole 1991, D'Arrigo et al. 2004), or being mediated by site conditions (Drobyshev et
al. 2010). Such large variability in the factors controlling geographical distributions
calls for species-specific analyses that will yield more accurate data to model
potential species' responses to future climate (Kirilenko et al. 2000, !verson et al.
2008, Prasad et al. 2013) ..
In eastern Canada, mean temperature and total precipitation are projected to increase
by the mid-21 st century (Elia and Côté 2010). Winters are expected to become
warmer and wetter, while summers are projected to become drier than today. We
17
might therefore expect that such changes will give room for northward expansion of
deciduous species and cause a retreat of coniferous species to higher latitudes. Much
ofthe recent research, both in North American and Eurasian biomes, has focused on
direct negative effect of climate change on coniferous species (Bergh et al. 1998,
Asselin and Payette 2005, Driscoll et al. 2005, Carnicer et al. 2011, Houle et al.
2012). Empirical studies quantifying the response of deciduous, and especially,
hardwood species are limited, although they are consistent in their prediction of
northward expansion of these species under expected climate change (Goldblum and
Rigg 2005, McKenney et al. 2011).
This study is an attempt to fill this knowledge gap by evaluating current and potential
effects of climatic variability on the growth and distribution of yellow birch (Betula
alleghaniensis Britton). Besicles its high economie value (Erdman 1990, Houle 1998),
this tree is an important component of three forest cover types common in Eastern
North America, namely the Hemlock-Yellow Birch, Sugar Maple-Beech-Yellow
Birch, and Red Spruce-Y ellow Birch cover types (Erdmann 1990). Y ellow birch
typically grows on well-drained soils up to 49.5° N and, from a biogeographical
perspective, represents one of the most northerly distributed hardwoods with
significant contribution to the forest structure at the border between temperate and
boreal biomes (Little 1971). In western Quebec, yellow birch is present in the canopy
of both temperate deciduous and mixed forests, extending its range to the north into
the boreal balsam fir (A bies balsamea (L.) Mill.) - paper birch (Betula papyrifera
Marsh.) bioclimatic domain. Its abundance has be en reported to decline at the
regionallevel due to an increase in the proportion of shade-tolerant species (primarily
Ac er spp.) during the 20th century (Woods 2000, N olet et al. 2001 ). Y ellow birch is
considered a semi-shade tolerant species (Baker 1949, Kobe et al. 1995), several
studies suggesting 45% light intensity as optimum conditions for growth of
undercanopy trees (Erdmann 1990, Houle and Payette 1990, Perala and Alm 1990,
Houle 1992).
18
In this study we aimed to provide baseline information on the possible effect of
climate on performance of yellow birch populations at the species' northern
distribution limit. Previous research indicated that wind (Lorimer 1977, Kneeshaw
and Prevost 2007, Gasser et al. 2010) and insect oubreaks (Bouchard et al. 2006) can
cause the formation of canopy gaps providing recruitment opportunities for yellow
birch. These studies focused on the central part of the species' range in Eastern North
America. In contrast to these works, we specifically focused on marginal populations
of yellow birch, whose dynamics could be driven by factors different from those
controlling the species' abundance in the centre of its range. We therefore elected to
analyze a reasonably wide range of factors possibly controlling yellow birch
abundance and evaluated regeneration and growth patterns along gradients of
environmental conditions. Particularly, we used field surveys to study the abundance
and age structure of birch regeneration, and a range of dendrochronological methods
to analyze biomass accumulation rate and growth sensitivity to climate along a 200
km latitudinal gradient in western Que bec, Canada (Fig. 2.1 ). We tested the following
hypotheses : (1) the northern distribution limit of yellow birch is controlled by
regeneration failure and prohibitively low biomass accumulation rates due to low
temperatures, and (2) growth sensitivity to temperature increases with latitude,
reflecting an increasingly colder climate towards the north. Finally, we discuss our
results in the context of direct and indirect climatic effects (e.g., changes in the forest
fire regime) on the future of yellow birch distribution in eastern North America.
79•30•w 78"'30'W
0 10~m
L....J
19•30•W / 6.30'W
• Stands
Cilies
~Roads
Blocllmadc Domalns
0 500 km L___j
M Sugar maple-yellow birch domain
c::J, Bal sam fir-yellow b1rch domain
C3 Balsam fir-paper b1rch domain
Projection: NAD 1983 MTM zone 10 Author: Centre fo r Forest Research, 20 12
19
Fig. 2.1 Location of the study sites (black squares). The inset shows the yellow birch range.
20
2.4. Material and Methods
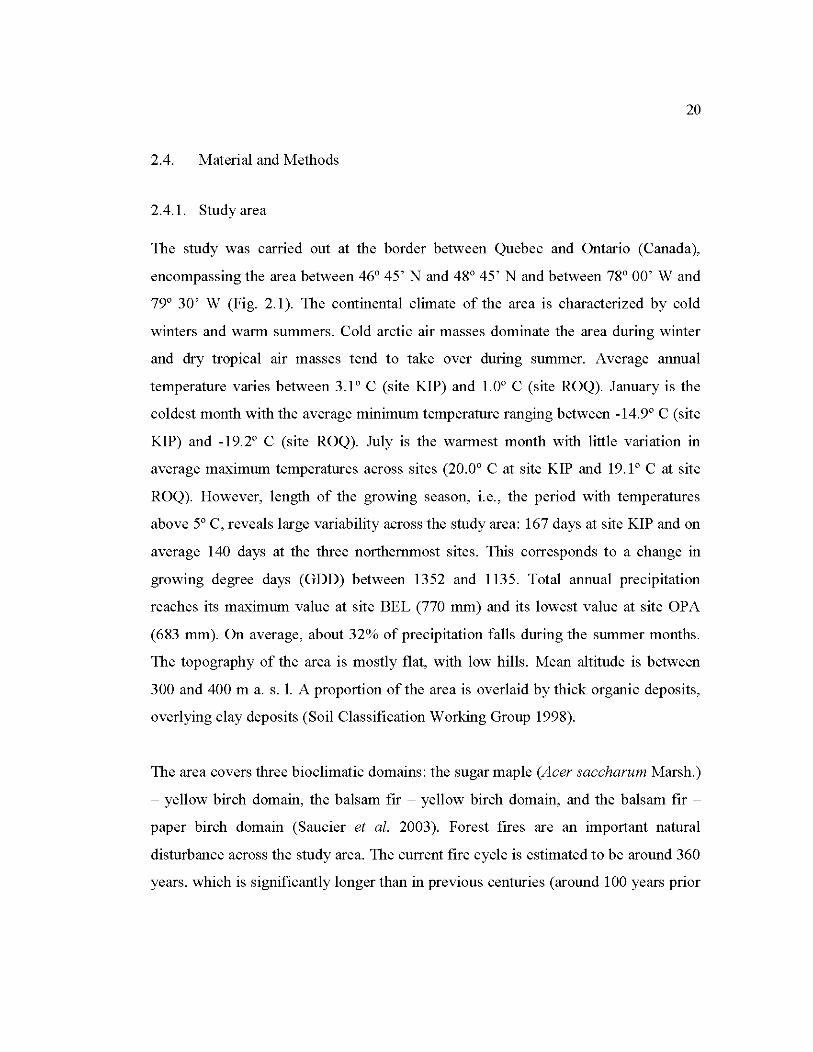
2.4.1. Study area
The study was carried out at the border between Quebec and Ontario (Canada),
encompassing the area between 46° 45' N and 48° 45' N and between 78° 00' W and
79° 30' W (Fig. 2.1 ). The continental climate of the are a is characterized by cold
winters and warm summers. Cold arctic air masses dominate the area during winter
and dry tropical air masses tend to take over during summer. Average annual
temperature varies between 3.1 o C (site KIP) and 1. 0° C (site ROQ). J anuary is the
coldest month with the average minimum temperature ranging between -14.9° C (site
KIP) and -19.2° C (site ROQ). July is the warmest month with little variation in
average maximum temperatures across sites (20.0° C at site KIP and 19.1 o C at site
ROQ). However, length of the growing season, i.e., the period with temperatures
above 5° C, reveals large variability across the study area: 167 days at site KIP and on
average 140 days at the three northemmost sites. This corresponds to a change in
growing degree days (GDD) between 1352 and 1135. Total annual precipitation
reaches its maximum value at site BEL (770 mm) and its lowest value at site OPA
(683 mm). On average, about 32% of precipitation falls during the summer months.
The topography of the area is mostly flat, with low hills. Mean altitude is between
300 and 400 rn a. s. 1. A proportion of the area is overlaid by thick organic deposits,
overlying clay deposits (Soil Classification Working Group 1998).
The area covers three bioclimatic domains: the sugar maple (Acer saccharum Marsh.)
- yellow birch domain, the balsam fir - yellow birch domain, and the balsam fir -
paper birch domain (Saucier et al. 2003). Forest fires are an important natural
disturbance across the study area. The current fire cycle is estimated to be around 360
years, which is significantly longer than in previous centuries ( around 100 years prior
21
to 1850). The most recent period of increased fire activity occurred at the beginning
ofthe 20th century (1910-1920, Bergeron et al. 2004).
2.4.2. Site selection and field sampling
Field surveys from the Quebec Ministry of Natural Resources (Ministère des
Ressources naturelles du Québec) and additional reconnaissance helped locate 14
forest stands (0.1 to 3 ha in size) at the northem limit of yellow birch distribution in
western Que bec (Fig. 2.1 ). To represent changes in climatic and forest conditions
along a gradient of decreasing yellow birch abundance, we sampled stands in three
bioclimatic domains: three sites within the sugar maple - yellow birch domain (sites
KIP, LAN, and BEA, Fig. 2.1), five sites within the balsam fir- yellow birch domain
(sites BEL, REM, CAl, BAS, and OP A) and six sites within the balsam fir - paper
birch domain (sites KEK, CLI, COL, COS, ROQ, and AIG). For the two southem
domains site selection was based on (1) identification of stands on ecoforestry maps
(Berger 2008) where yellow birch exceeded 20% of the total basal area, and (2) using
this set of stands to randomly select those within 2 km from the nearest forestry road.
We did not use natural disturbance (e.g., windthrow, insect outbreaks or forest fires)
as a selection criteria for sites to avoid any a priori assumptions conceming site
history. However, we excluded from sampling the sites which exhibited signs of
human disturbance. For the northem-most bioclimatic domain (balsam f ir - paper
birch domain), we sampled all yellow birch sites that were identified at the limit of
species' distribution, avoiding any filtering and pre-selection procedures.
Y ellow birch was present in the forest canopy of all selected stands, although its
contribution to overall canopy composition varied (Table 2.1). At each site, we
established three randomly-located 400m2 (20 rn x 20 rn) plots. We recorded density
of yellow birch seedlings ( < 2 cm DBH) and saplings (2 cm <::; DBH < 8 cm), and
density and DBH of all canopy trees (?: 8 cm) at each plot. Yellow birch seedlings
22
were recorded as soon as we could observe cotyledon leaves, which developed in one
year old plants. Smaller plots (100 m 2) were established at the three northemmost
stands (COS, AIG, and ROQ) due to their small size (~ 0.1 ha).
In one stand of each bioclimatic domain, we collected yellow birch seedlings within a
randomly selected 100 m2 plot and their age was estimated by counting terminal bud
scars and through crossdating of tree rings. We selected a subset of sites for
reconstruction of seedling age structure to evaluate temporal variability in birch
regeneration. To ensure sufficient replication in statistical analyses, we selected sites
with abundant and similar amounts of yellow birch regeneration within each of the
bioclimatic domains (sites KIP, BEL, CLI). None of these sites had signs of
significant herbivory, which has been shown to impact yellow birch recruitment (e.g.,
Kem et al. 2012). Sampling only one site per bioclimatic domain prevented us from
analysing within-domain variability in regeneration age structure. However, stands
with sufficient regeneration levels to warrant statistical analyses were rare in the
study area and it was thus impossible to have replicates inside each bioclimatic
domain.
W e estimated mean stand age by dating the pith of 20 canopy yellow birch trees,
which were randomly selected and cored at breast height in each stand. In the
northem sites the number of sampled trees was limited by the availability of yellow
birch trees, with a low of 17 trees. The number of rings missing at the pith was
estimated with the help of a pith locator (Applequist 1958). In addition, we used the
sampled yellow birch trees to obtain the mean and maximum ages of yellow birch
populations and as a source of data for dendrochronological analyses (see below). At
each plot, we estimated the ground area covered by large woody debris at advanced
decomposition stages (stages 3 and 4, after Saucier 1994), which present a favorable
substrate for yellow birch regeneration (Winget and Kozlowski 1965). We estimated
23
the percentage of canopy openness in the four corners of each plot following Saucier
(1994) and calculated an average percentage of canopy openness for each plot.
2.4.3. Soil analyses
We conducted particle size analysis to determine the texture ofthe mineral soil. Three
samples were taken from the upper 10 cm of mineral soil at each site. In the
laboratory the samples were mixed together, air dried, and sieved through a 2 mm
grid. We used the hydrometer method to quantify soil texture (Topp 1993). Other
portions of soil samples were mixed together and sieved through a 4 mm grid, and
oven-dried at 40°C for 60 hours. Cation concentration, total carbon (C, % ), total
nitrogen (N, %), total sulphur (S, %), total phosphorus (P, %) and pH in CaCh were
estimated following established protocols (Laganière et al. 2010). Soil analyses were
performed at the Laurentian Forestry Centre, Québec, Québec (Natural Resources
Canada, Canadian Forest Service).
2.4.4. Statistical analysis of yellow birch regeneration
The effect of various site factors on yellow birch regeneration density was analyzed
in two ways. First, based on our hypotheses and following a review of the relevant
literature, we selected a set of independent variables representing stand structure and
age, soil texture and nutrient content. We then ran multiple linear regression analyses
against log-normalized seedling and sapling densities as dependent variables. We
used a combination of backward and forward stepwise selection aimed at minimising
the Akaike Information Criterion (AIC) value, with the CRAN R function step
(Hastie and Pregibon 1992, Venables and Ripley 2002). As an alternative approach
taking into consideration possible autocorrelation in sorne factors and the low ratio
between number of observations (Nsites = 14) and factors (12) we ran principal
component analysis (PCA) on the original set of factors and then used PCs as
24
predictors in a multiple regression against normalized seedling and sapling densities.
We also calculated partial semi-correlations for each of the independent variables
used in the analysis to evaluate unique contribution of a variable to regeneration
variability.
Analysis of seedling age structure followed the approach proposed by Hett and
Loucks (1976) and assumed constant-over-time probability of mortality if the age
structure could be approximated by an exponential function, and decreasing-over
time mortality if a power function provided a better fit. We used the following linear
transformation to assess coefficients:
Loge ( y ) = Loge ( Yo ) - b x for the exponential model, and
Loge (y) = Loge ( Yo) - b Loge ( x ) for the power model, where
y is the number of seedlings in any age class x, y0 is init ial recruitment (i.e. , the
density of seedlings in the youngest age class), and b is the mortality rate.
To represent the soil water availability, we developed a site dryness index, by first
conducting a PCA on selected soil properties, and then using the loadings on the first
principal component as a factor (Site Dryness Index) in analyses. The selected soil
properties were thickness of the soil organic layer, percentages of sand, silt, and clay
in the mineral soil (B horizon), and percentage of stone in the mineral soil.
2.4.5. Dendrochronological analyses of yellow birch growth
Tree-ring samples were mounted on wooden supports, polished with 600-grid sand
paper and crossdated using the visual pointer year method (Stokes and Smiley 1968).
Crossdated samples were measured using scanned images and CooRecorder &
CDendro software package ver. 7.3 (Lars son 201 0). Dating was statistically validated
25
with the COFECHA program (Holmes 1999). Measurements from two radii were
averaged for each tree prior to analyses.
To evaluate differences in absolute growth among sites we developed cambial age
chronologies, representing the growth trend as a function of cambial age of sampled
trees. This method, used as part of the Regional Curve Standardization algorithm
(Briffa et al. 1992, Esper et al. 2002), is useful for extracting long-term growth
patterns while minimizing both the effects of climate conditions specifie to a
particular time period and the influence of site histories on growth patterns. Cambial
age chronologies were developed for each bioclimatic domain and fitted with a linear
function. We estimated statistical significance of differences in regression coefficient
(b) values using a bootstrap method (Efron and Tibshirani 1993). To better represent
biomass accumulation dynamics we converted tree-ring increments into basal area
increments (BAI) using tree diameter data. We limited this analysis to the first 50
years of the trees' lifespan to specifically focus on initial growth rates and to avoid
non-linearity associated with age-related decline in biomass production. Similar to the
analysis of cambial age chronologies, we tested for differences in BAI among
bioclimatic zones by comparing regression coefficients b (slope) in linear regressions
between annual BAis and time. For these analyses we separated the northern balsam
fir - paper birch domain into two sub-domains to reflect uneven distribution of sites
within this domain.
For the analyses of growth sensitivity to climate, we detrended the crossdated series
with the ARSTAN program (Cook and Krusic 2005). We used a smoothing spline
that preserved 50% of the variance at a wavelength of 32 years to detrend the time
series and to maximize high-frequency (annual) variability in the record. In cases
where the smoothing spline did not fit the empirical data, a negative exponential
function was used. We computed chronology index by dividing the original
chronology values by the values supplied by the spline. To remove natural
26
persistence (temporal autocorrelation) in growth patterns, we modeled each tree-ring
curve as an autoregressive process with the order selected by the first-minimum
Akaike Information Criterion (AIC, Akaike 1974). We used ARSTAN residual
chronologies to analyze climate-growth relationships at each site. We used the CRAN
R package bootRes (Biondi and Waikul 2004, Zang and Biondi 2012) torun response
function analyses of the site residual chronologies (dependent variables) and climate
variables (independent variables, see next sub-section) and provided bootstrap
derived confidence intervals.
2.4.6. Climate data
For dendroclimatic analyses we used climate data generated in BioSIM 10.2.2.3, a set
of spatially-explicit bioclimatic models (Régnière and Bolstad 1994, Régnière 1996).
For each sampling site we used BioSim to interpolate data from the five closest
weather stations and adjusted for differences in latitude, longitude, and elevation
between weather stations and site location. The climate variables included monthly
mean temperature (°C), monthly total precipitation (mm), monthly total snowfall
(mm), and total growing degree-days (> 5°C). Additionally, we used seasonal
Drought Code (DC) estimates, calculated from monthly DCs (MDC) from May to
August. The MDC was developed to capture moisture content of deep and compact
organic layers of the forest floor (Turner 1972). The density of meteorological
stations was low during the first half of the 20th century. The mean distance between
the stations and the sampling sites decreased since that time (from 400 km to less
than 100 km). We therefore limited analyses to the period 1950-2009.
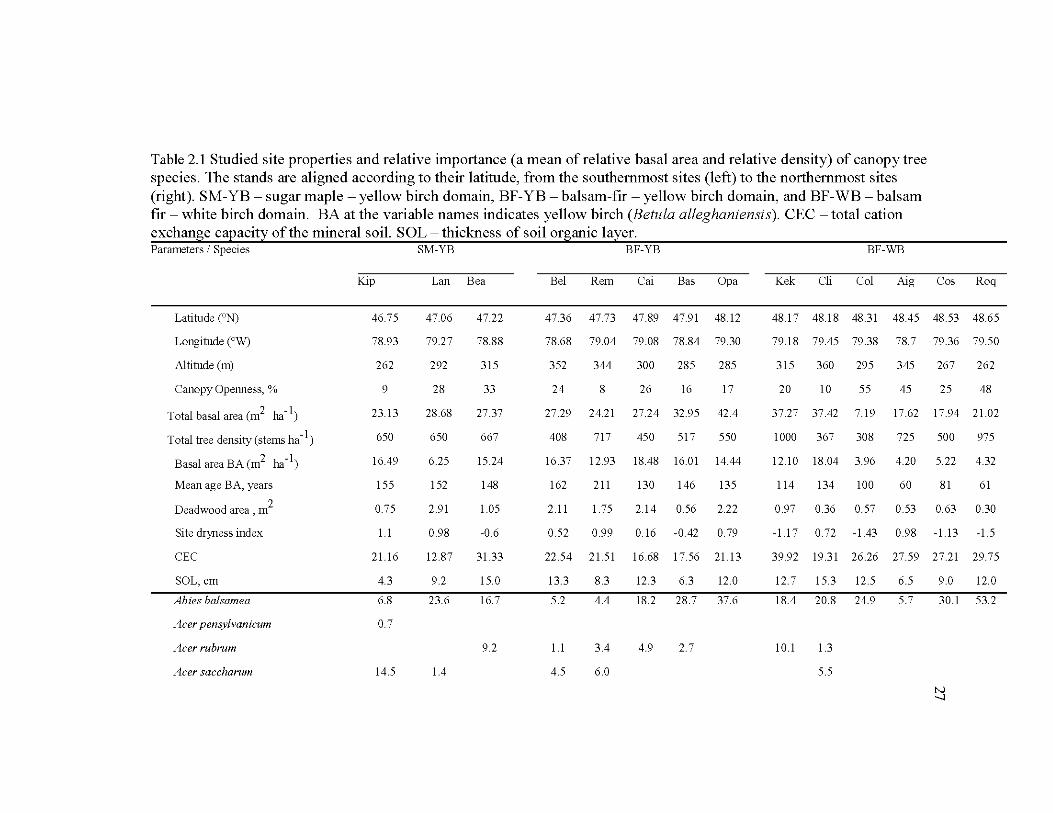
Table 2.1 Studied site properties and relative importance (a mean of relative basal are a and relative density) of canopy tree species. The stands are aligned according to their latitude, from the southemmost sites (left) to the northemmost sites (right). SM-YB- sugar maple- yellow birch domain, BF-YB- balsam-fir- yellow birch domain, and BF-WB- bals am fir - white birch domain. BA at the variable names indicates yellow birch (Betula alleghaniensis). CEC - total cation exchange capacity of the mineral soil. SOL- thickness of soil organic layer. Parameters 1 Species SM-YB BF-YB BF-WB
Kip Lan Bea Bel Rem Cai Bas Op a Kek Cli Col Aig Cos Roq
Latitude (0 N) 46.75 47.06 47.22 47.36 47.73 47.89 47.91 48.12 48.1 7 48.18 48.31 48.45 48.53 48.65
Longitude (0 W) 78.93 79.27 78.88 78.68 79.04 79 .08 78.84 79.30 79.18 79.45 79.38 78.7 79.36 79.50
Altitude (rn) 262 292 315 352 344 300 285 285 315 360 295 345 267 262
Canopy Openness, % 9 28 33 24 8 26 16 17 20 10 55 45 25 48
Total basal area(m2 ha- 1) 23.13 28.68 27.37 27.29 24.21 27.24 32.95 42.4 37.27 37.42 7.19 17.62 17.94 21.02
Total tree density (stems ha-l) 650 650 667 408 717 450 51 7 550 1000 367 308 725 500 975
Basal areaBA(m2 ha- 1) 16.49 6.25 15.24 16.37 12.93 18.48 16.01 14.44 12.10 18.04 3.96 4.20 5.22 4.32
Mean age BA, years 155 152 148 162 211 130 146 135 114 134 100 60 81 61
Deadwood area , rn 2 0.75 2.91 1.05 2.11 1.75 2.1 4 0.56 2.22 0.97 0.36 0.57 0.53 0.63 0.30
Site dryness index 1.1 0.98 -0.6 0.52 0.99 0.16 -0.42 0. 79 -1.1 7 0.72 -1.43 0.98 -1.1 3 -1.5
CEC 21.16 12.87 31 .33 22.54 2 1.51 16.68 17.56 21.13 39.92 19.31 26 .26 27.59 27.21 29.75
SOL, cm 4.3 9.2 15.0 13.3 8 .3 12.3 6.3 12.0 12.7 15.3 12.5 6.5 9.0 12.0
Abies balsamea 6.8 23.6 16.7 5.2 4.4 18.2 28.7 37.6 18.4 20.8 24.9 5.7 30.1 53.2
Acer p ensylvanicum 0.7
Acerrubrum 9.2 1.1 3.4 4.9 2.7 10.1 1.3
Acer saccharum 14.5 1.4 4.5 6.0 5.5
N -.l
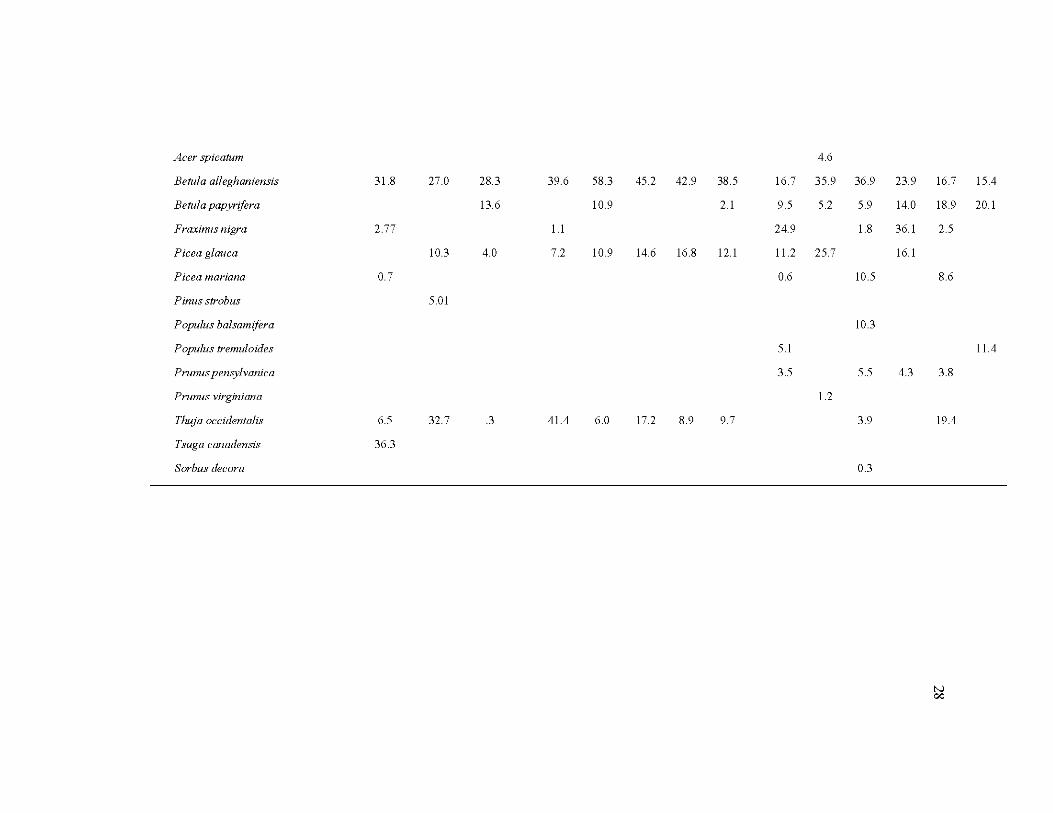
Acer spicatum
Betula alleghaniensis 31.8 27.0 28.3 39.6 58.3 45.2
Be tula papyrifera 13.6 10.9
Fraxinus nigra 2.77 1.1
Picea glauca 10.3 4.0 7.2 10.9 14.6
Picea mariana 0.7
Pinus strobus 5.01
P opulus balsamifera
Populus tremuloides
Prunus pensylvanica
Prunus virginiana
Thuja occidentalis 6.5 32. 7 .3 41.4 6.0 17.2
Tsuga canadensis 36.3
Sorbus decora
4.6
42.9 38.5 16.7 35.9
2.1 9.5 5.2
24.9
16.8 12.1 11.2 25.7
0.6
5.1
3.5
1.2
8.9 9.7
36.9 23.9
5.9 14.0
1.8 36.1
16.1
10.5
10.3
5.5 4.3
3.9
0.3
16.7
18.9
2.5
8.6
3.8
19.4
N 00
15.4
20.1
11.4
29
2.5. Results
At the northern limit of its range in western Quebec yellow birch grows in mixed
stands (Table 2.1) on relatively well drained (Table 2. 2) and moderately rich soils
(Table 2.3). Balsam fir, white spruce (Picea glauca Moench.), and eastern white
cedar (Thuja occidentalis L.) were common canopy trees in the studied sites (Table
2.1 ). Relative importance of yellow birch in the canopy was at least 25% in the two
southern temperate domains, and at least 15 % in the northemmost boreal domain.
Canopy composition of the sampled stands represented the zonal differences in
vegetation cover with hardwoods (predominantly Acer spp.) being typical in the
canopies of the southern part of the transect, while paper birch and black spruce
(Picea mariana [Mill.] B.S.P.) increased in abundance northward. Latitude was
significantly negatively correlated with yellow birch basal area (r = -0.68), total stand
basal area ( -0. 70), and mean age of canopy yellow birch trees ( -0.68).
In ten out of 14 sites (71%) the maximum age of yellow birch trees exceeded 200
years and in five cases (36%) it was very close or ab ove 300 years (Table 2.4). Our
field surveys and data from ecoforestry maps (Berger 2008) revealed large impact of
forestry operations in the surrounding stands in the two southerly located bioclimatic
domains, which precluded estimation of natural maximum and average age of
surrounding stands. However, such estimates were possible for stands in the paper
birch - balsam fir domain, where both average and maximum ages of yellow birch
stands were higher than tho se of the surrounding stands.
Y ellow birch regeneration abundance varied considerably across sites within each of
the bioclimatic domains, but did not show a clear latitudinal pattern (Fig. 2.2). The
highest densities of yellow birch seedlings and saplings, recorded within a site, were
observed in the northernmost balsam fir- paper birch bioclimatic domain. It was also
the only domain where sorne sites were devoid of yellow birch seedlings (the three
northernmost sites of the transect: AIG, COS, and ROQ). This pattern was not
30
mirrored by sapling densities, as each domain included sites devoid of yellow birch
saplings.
The age structure of birch regeneration revealed dominance of seedlings ranging in
age from 1 to 4 years in all bioclimatic domains (Fig. 2.3). In all bioclimatic domains,
each represented by one site, age distribution showed a variation in cohort densities,
suggesting uneven establishment rates. The most pronounced peak was observed at
site BEL seven years prior to sampling (corresponding to calendar years 1998-1997).
In the balsam fir - paper birch and sugar maple - yellow birch bioclimatic domains
the power function better fit the seedling age distribution than the negative
exponential function, although in the first case the difference in R 2 values was
marginal (0.42 vs. 0.36). The pattern was inverse in the balsam fir - yellow birch
domain. For both functions , R2 values declined with increasing latitude. Seedling
mortality rate over the first five years of growth did not differ significantly among
bioclimatic domains (p > 0.30). Mortality rates, expressed as the slope (b) of the
linear regression between age class density (y) and age (x), were -1.27, -0.41, and -
1.83 for the sugar maple - yellow birch, balsam fir - yellow birch, and balsam fir -
paper birch bioclimatic domains, respectively.
As we were interested in understanding changes in water availability across sites, we
developed a simple site dryness index, taking into consideration soil gravimetrie
composition, thickness of the soil organic layer, and percentage of stones in the
mineral soil (Fig. 2.4A). PC1 accounted for 57.1% of total variability and was used as
a site dryness index. Site soil conditions became increasingly humid towards the
north (Fig. 2.4B).
PCA using site variables revealed that PC 1 ( accounting for 51.0 % of the total
variability) reflected increased canopy openness and soil cation exchange capacity
with latitude, both being inversely related to basal area and age of yellow birch, total
31
stand basal area, amount of deadwood, and site dryness index (Fig. 2.5A). PC2,
explaining a lesser portion of the variability (14.2 %), predominantly differentiated
xeric and humid sites. Only PCl showed a clear linear relationship with latitude (Fig.
2.5B).
Regressing PCs against yellow birch regeneration density showed that seedling
density was mainly related to PCl, while sapling density was related to PC2 (Fig.
2.5C). More mature stands with higher amounts of yellow birch in the canopy and
deadwood favored seedling establishment, while younger northem sites on more open
and nutrient rich sites tended to have lower seedling densities. Dryer sites exhibited
higher sap ling density than more nutrient rich and moist sites.
Multiple regression analyses showed a strong correlation between seedling density
and mean age of a yellow birch population (Table 2.5). It was the only factor retained
by the AIC maximizing algorithm with R2 and AIC being 43% and 61.3, respectively.
In the multiple regression analysis of sap ling density, six factors were selected, while
only the positive effect of the site dryness index was statistically significant (p <
0.05). Two of the factors were marginally significant (p < 0.10): sapling density
showing a tendency to decline with increased yellow birch basal area and to increase
with increased age of yellow birch canopy trees. The R2 for saplings was higher
(73. 8%) than for seedlings ( 42.5%) indicating that the overall variability in sap ling
density was better predicted by the studied factors.
Analysis of yellow birch cambial chronologies showed no difference among
bioclimatic domains with respect to BAI during the first 50 years oftree growth (Fig.
2.6). We observed the highest absolute values of the b coefficient, indicating the
highest rate of growth increase with cambial age in the northemmost bioclimatic
domain, although it did not significantly differ from values obtained from the other
domains. In all four geographical zones, linear regressions of BAI against time well
fitted the growth patterns (R2 between 82 and 95%).
32
Response function analysis of residual chronologies showed a general lack of
significant associations between yellow birch growth and climate (Fig. 2. 7). The only
significant coefficient was obtained for summer drought code (DC) of the current
year in the northem part of the balsam fir- paper birch bioclimatic domain. To check
for a possible spurious nature of this pattern, we calculated response function
coefficients between DC and yellow birch chronology for this domain using 10-year
moving segments over the same time period. Response function coefficients obtained
in this way were then regressed against average values of DC for respective decades.
By doing so we hypothesized that if summer drought limited yellow birch growth,
decades with more pronounced drought conditions on average would exhibit more
negative values of response coefficient between DC and growth. In line with this
assumption, DC decadal average was negatively correlated with the value of response
function coefficients, accounting for 23 % of the variability in response coefficients
(Fig. 2.8).
To further explore growth sensitivity to summer drought, we regressed DC against
site yellow birch chronologies and evaluated dynamics of the resulting b coefficients
along latitude (Fig. 2.9). DC and growth showed increasingly negative relationship
with latitude (Fig. 2.9A), the effect being largely observed north of the limit of
continuous yellow birch distribution (after Little 1971). After controlling for site
dryness and age of the yellow birch populations, the effect largely disappeared with
only 6.3% of the variability being accounted for (Fig. 2.9B).
33
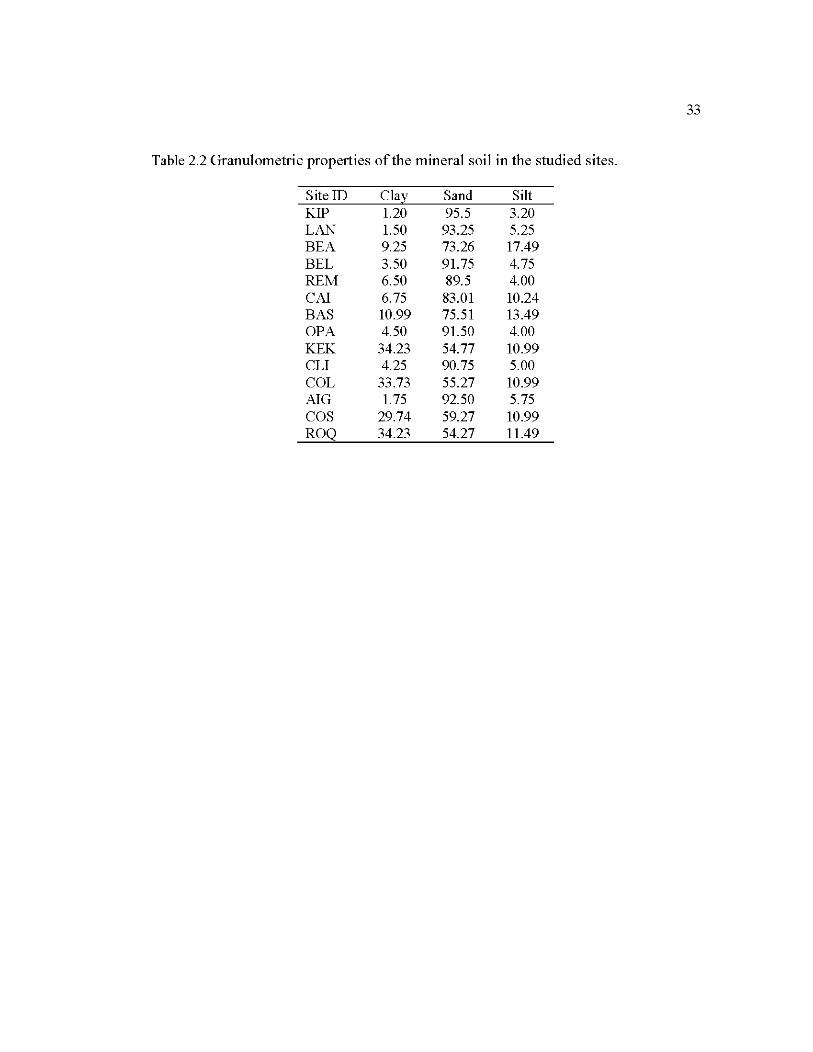
Table 2.2 Granulometrie properties ofthe mineral soil in the studied sites.
Site ID Clay Sand Silt KIP 1.20 95.5 3.20 LAN 1.50 93.25 5.25 BEA 9.25 73.26 17.49 BEL 3.50 91.75 4.75 REM 6.50 89.5 4.00 CAl 6.75 83.01 10.24 BAS 10.99 75.51 13.49 OPA 4.50 91.50 4.00 KEK 34.23 54.77 10.99 CLI 4.25 90.75 5.00 COL 33.73 55.27 10.99 AlG 1.75 92.50 5.75 cos 29.74 59.27 10.99 ROQ 34.23 54.27 11.49
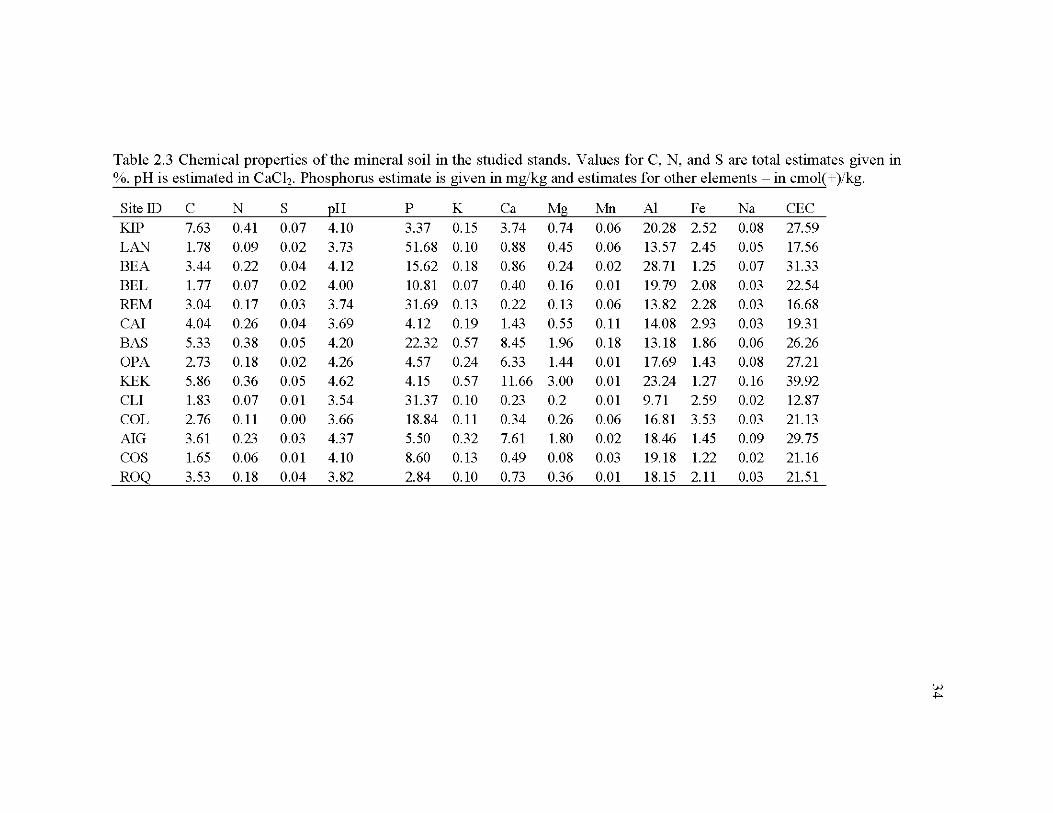
Table 2.3 Chemical properties ofthe mineral soil in the studied stands. Values for C, N, and S are total estimates given in %. pH is estimated in CaClz, Phosphorus estimate is given in mglkg and estimates for other elements -in cmol( +)/kg.
Site ID c N s EH p K Ca Mg l\.1n Al Fe Na CEC
KIP 7.63 0.41 0.07 4.10 3.37 0.15 3.74 0.74 0.06 20.28 2.52 0.08 27.59
LAN 1.78 0.09 0.02 3.73 51.68 0.10 0.88 0.45 0.06 13.57 2.45 0.05 17.56
BEA 3.44 0.22 0.04 4.12 15.62 0.18 0.86 0.24 0.02 28.71 1.25 0.07 31.33
BEL 1.77 0.07 0.02 4.00 10.81 0.07 0.40 0.16 0.01 19.79 2.08 0.03 22.54
REM 3.04 0.17 0.03 3.74 31.69 0.13 0.22 0.13 0.06 13.82 2.28 0.03 16.68
CAl 4.04 0.26 0.04 3.69 4.12 0.19 1.43 0.55 0.11 14.08 2.93 0.03 19.31
BAS 5.33 0.38 0.05 4.20 22.32 0.57 8.45 1.96 0.18 13.18 1.86 0.06 26.26
OPA 2.73 0.18 0.02 4.26 4.57 0.24 6.33 1.44 0.01 17.69 1.43 0.08 27.21
KEK 5.86 0.36 0.05 4.62 4.15 0.57 11.66 3.00 0.01 23.24 1.27 0.16 39.92
CLI 1.83 0.07 0.01 3.54 31.37 0.10 0.23 0.2 0.01 9.71 2.59 0.02 12.87
COL 2.76 0.11 0.00 3.66 18.84 0.11 0.34 0.26 0.06 16.81 3.53 0.03 21.13
AlG 3.61 0.23 0.03 4.37 5.50 0.32 7.61 1.80 0.02 18.46 1.45 0.09 29.75
cos 1.65 0.06 0.01 4.10 8.60 0.13 0.49 0.08 0.03 19.18 1.22 0.02 21.16
ROQ 3.53 0.18 0.04 3.82 2.84 0.10 0.73 0.36 0.01 18.15 2.11 0.03 21.51
35
Table 2.4 Mean age ofyellow birch trees (± standard deviation) in the sampled stands and mean age oftrees in surrounding stands within a 500 rn radius from the centre of the sampled stand. Data for surrounding stands are shown only for the balsam fir -paper birch bioclimatic domain. Fire year of the surrounding stands refers to fires observed at and around the sites since 1922, according to maps provided by the Quebec Ministry ofNatural Resources.
Site Y ellow bir ch, mean± SD 1 max
sugar maple- yellow birch domain KIP 155 ± 46 1288 LAN 151 ± 61 1 317 BEA 148 ±55 1272 balsam-fir- yellow birch domain BEL 162 ± 66 1285 REM 210 ± 60 1322 CAl 130 ± 45 1 220 BAS 145 ± 33 1 185 OPA 134 ±50 1245 bals am fir- paper birch domain KEK 114 ± 66 1 241 CLI 133 ± 37 1231 COL 100±50 / 177 AIG 60 ± 20 1 101 cos 81 ± 14 / 90 ROQ 61 ± 20 197
Surrounding stands, mean 1 max 1 fire year
60.16 1 70 1 1944 651 70 15.31 / 30 47.41 150 1 195 1 36.6 150 1 1944 & 1938 12.6 120
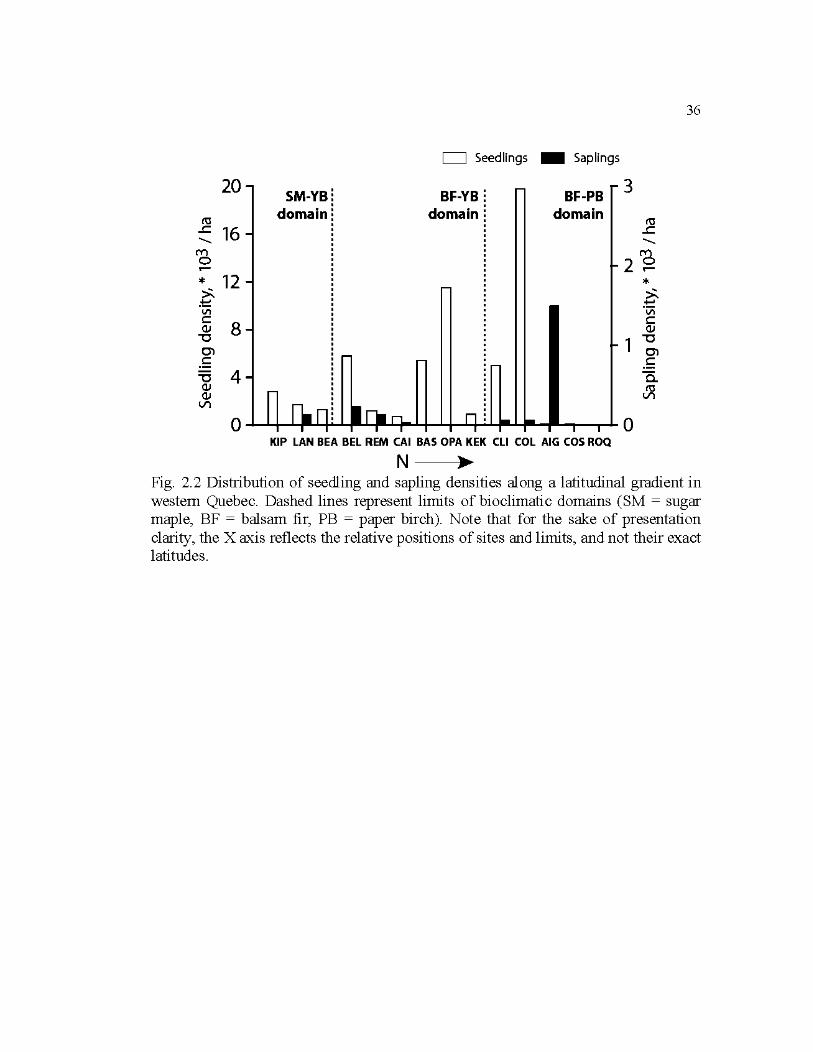
20
1'0 ..c 16 -M 0 ..... * 12 ~
:!:: Vl
~ 8 -c 0) c: -c 4 Q) Q) Vl
SM-YB domain
D Seedlings - Saplings
BF-YB domain
BF-PB domain
KIP LAN BEA BEL REM CAl BAS OPA KEK CU COL AIG COS ROQ
N ,..
3
1'0 ..c -M
2~ *
36
Fig. 2.2 Distribution of seeclling and sapling densities along a latitudinal gradient in western Quebec. Dashed lines represent lirnits of bioclimatic domains (SM = sugar maple, BF = balsam fir, PB = paper birch). Note that for the sake of presentation clarity, the X axis reflects the relative positions of sites and lirnits, and not their exact latitudes.
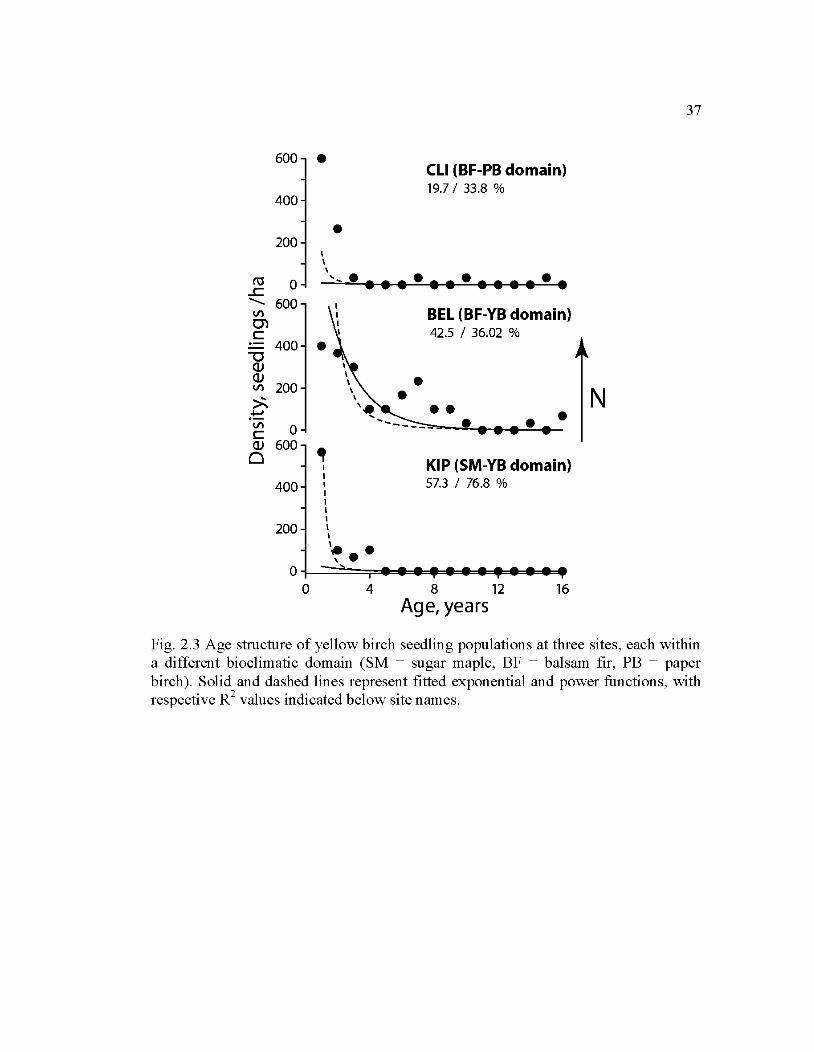
37
600 • CLI (BF-PB domain) 19.7 1 33.8 %
400
• 200 1 1
' ro 0 ', .............. ...c ........... 600 VI BEL (BF-YB domain) rn c 42.5 1 36.02 %
400 • "'0 Q) 1
Q) 1
' VI 200 ' N >:- ' '• -~ .... ,,_ • VI 0 c Q) 600 tp 0 KIP (SM-YB domain) 1
1 57.3 1 76.8 % 400 1
1 1 1 1
200 1 1
\• . ' .
0 ....
0 4 8 12 16 Age, years
Fig. 2.3 Age structure of yellow birch seedling populations at three sites, each within a different bioclimatic domain (SM = sugar maple, BF = balsam fir, PB = paper birch). Solid and dashed lines represent fitted exponential and power functions, with respective R2 values indicated below site names.
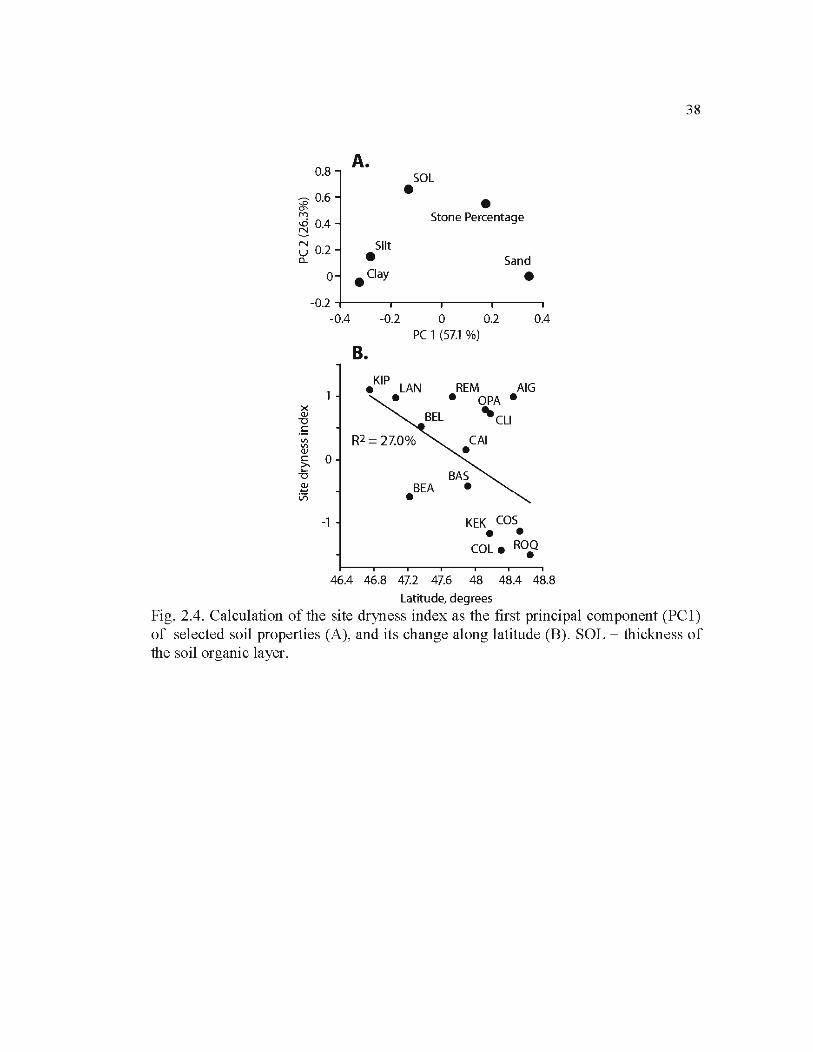
0.8
'§. 0.6 M
iEÎ 0.4
N u 0.2 a..
0
-0.2 -0.4
x Cl! \J .!: "' "' Cl! c 0 >. -o 2 Vi
-1
A. SOL • • Stone Percentage
Silt • Sand • Clay •
-0.2 0 0.2 0.4 PC 1 (57.1 %)
B. e KIP REM AIG
BEA •
• OPA •
.. CLI
KEK COS • • COLe ROQ •
46.4 46.8 47.2 47.6 48 48.4 48.8
Latitude, degrees
38
Fig. 2.4. Calculation of the site dryness index as the first principal component (PCl) of selected soil properties (A), and its change along latitude (B). SOL= thickness of the soil organic layer.
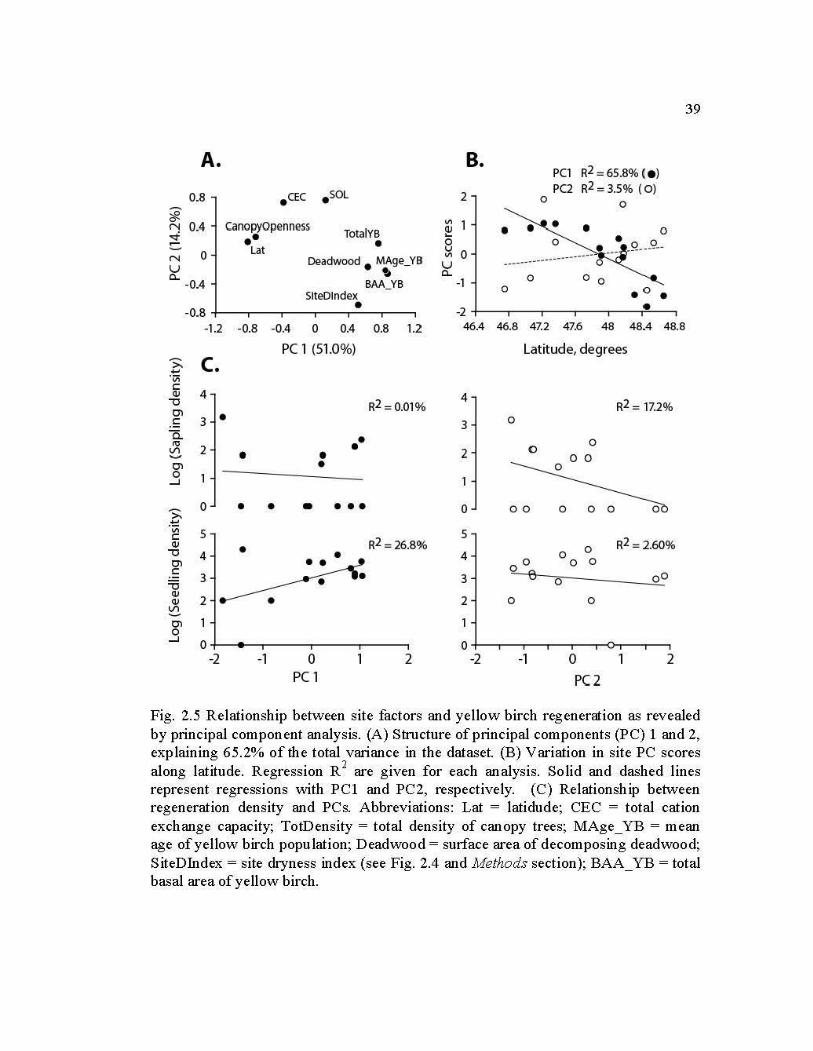
39
A. B. R2 = 65.8% ( e ) PC1
0.8 . ac . soL 2 PC2 R2 = 3.5% (O)
0
~ VI ("j 0.4 canopyOpenness
TotaiYB Q)
; •• ... • 0
Lat u 0 N 0 Deadwood • MAge_YB
VI
u u c.. -0.4
,. c.. BAA_YB -1
. o • -0.8 -2
-1.2 -0.8 -0.4 0 0.4 0.8 1.2 46.4 46.8 47.2 47.6 48 48.4 48.8
PC 1 (51.0%) Latitude, degrees >- c. ~ ·v; c:
4 Q) 4 -o R2 = 0.01% R2 = 17.2% Ol .5 3 3 0
o. • 0 "' 2 • 0 \.11 2 ....,. • • 00 Ol • 0
....J
>- 0 • • • ••• 0 00 0 0 0 ~ ·v;
5 5 c: R2 = 26.8% R2 = 2.60% Q) • 0 -o 4 4 0
Ol 00 0 0 c:
3 3 e oo '6 0 <Il
2 2 <Il 0 0 ~ Ol 0
....J 0 0
-2 -1 0 2 -2 -1 0 2 PC 1 PC2
Fig. 2.5 Relationship between site factors and yellow birch regeneration as revealed by principal component analysis. (A) Stmcture of principal components (PC) 1 and 2, explaining 65.2% of the total variance in the dataset. (B) Variation in site PC scores along latitude. Regression R 2 are given for each analysis. Solid and dashed lin es represent regressions with PCl and PC2, respectively. (C) Relationship between regeneration density and PCs. Abbreviations: Lat = latidude; CEC = total cation exchange capacity; TotDensity =total density of canopy trees; MAge_YB =mean age of yellow birch population; Deadwood = surface area of decomposing deadwood; SiteDindex =site dryness index (see Fig. 2.4 and Methods section); BAA_YB =total basal area of yellow birch.
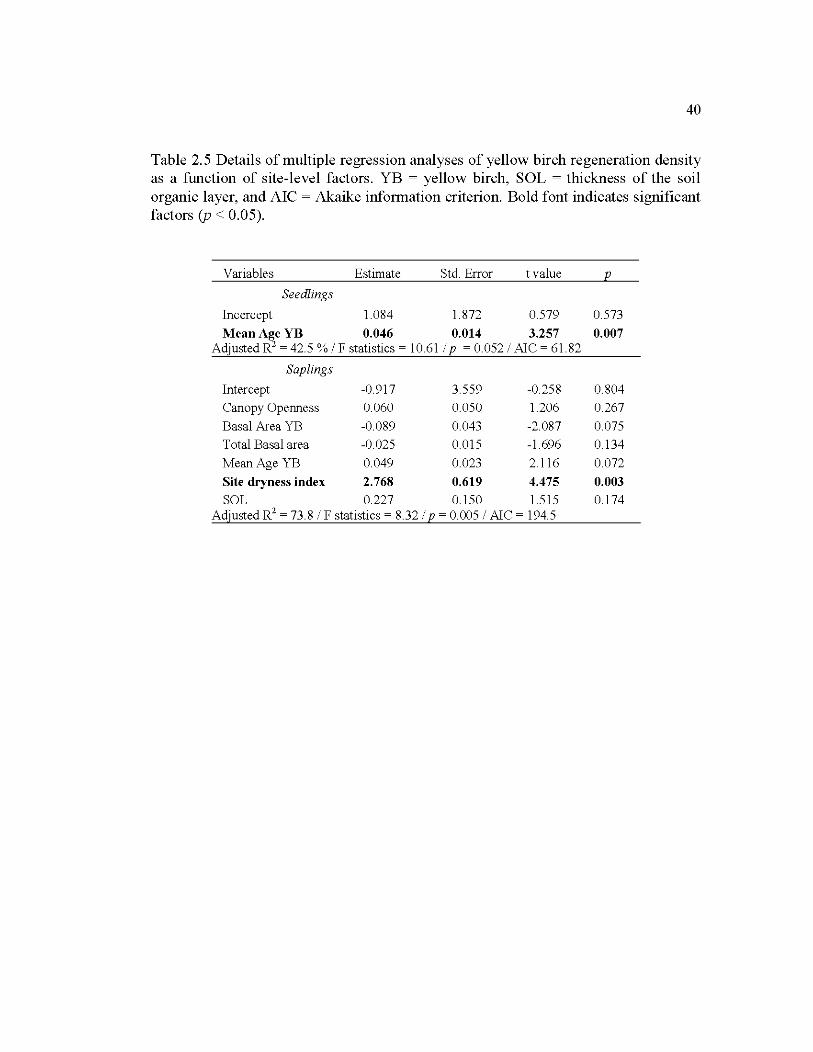
40
Table 2. 5 Details of multiple regression analyses of yellow birch regeneration density as a function of site-level factors. YB = yellow birch, SOL = thickness of the soil organic layer, and AIC = Akaike information criterion. Bold font indicates significant factors (p < 0.05).
Variables Estimate Std. Error t value p
Seedlings
Incercept 1.084 1. 872 0.579 0.573
Mean Age YB 0.046 0.014 3.257 0.007 Adjusted R2
= 42.5 % 1 F statistics = 10.61 1 p = 0.052 1 AlC = 61.82
Saplings
Intercept -0.917 3.559 -0.258 0.804
Canopy Openness 0.060 0.050 1.206 0.267
Basal Area YB -0.089 0.043 -2.087 0.075
Total Basal are a -0.025 0.015 -1.696 0.134 Mean Age YB 0.049 0.023 2.116 0.072
Site dryness index 2.768 0.619 4.475 0.003 SOL 0.227 0.1 50 1.515 0.1 74
Adjusted R2 = 73.8 1 F statistics = 8.32 1 p = 0.005 1 AIC = 194.5
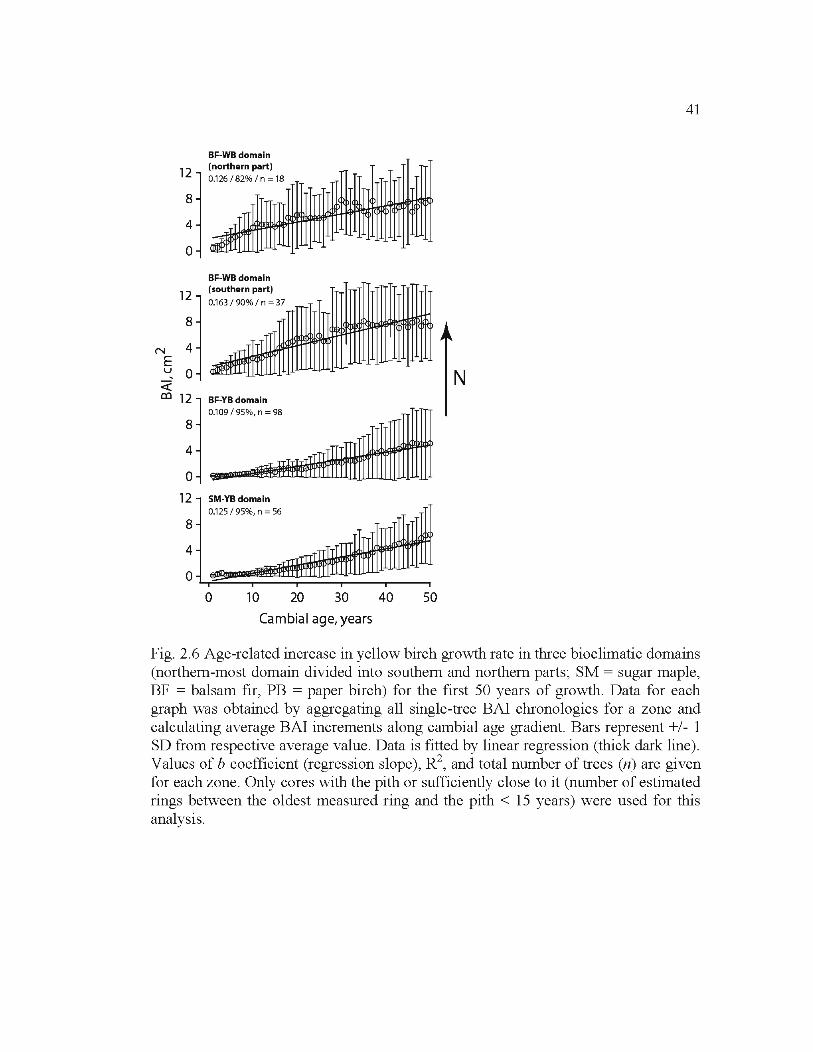
41
BF-WB domain
12 (northern part)
0.126 / 82%/ n = 18
8
4
0
BF-WB domain
12 (southern part)
0.163 / 90o/o/ n=37
8
_rlllllll N 4 E
ariDl!JI l.--u 0 N <C
co 12 BF-YB domain 0.109 / 95%, n = 98
8
4
0
12 SM-YB domain 0.125 / 95%, n =56
8
4
0
0 10 20 30 40 50
Cambial age, years
Fig. 2.6 Age-related increase in yellow birch growth rate in three bioclimatic domains (northem-most domain divided into southem and northem parts; SM = sugar maple, BF = balsam fir, PB = paper birch) for the first 50 years of growth. Data for each graph was obtained by aggregating all single-tree BAI chronologies for a zone and calculating average BAI increments along cambial age gradient. Bars represent +/- 1 SD from respective average value. Data is fitted by linear regression (thick clark line ). Values of b coefficient (regression slope), R2
, and total number oftrees (n) are given for each zone. Only cores with the pith or sufficiently close to it (number of estimated rings between the oldest measured ring and the pi th < 15 years) were used for this analysis.
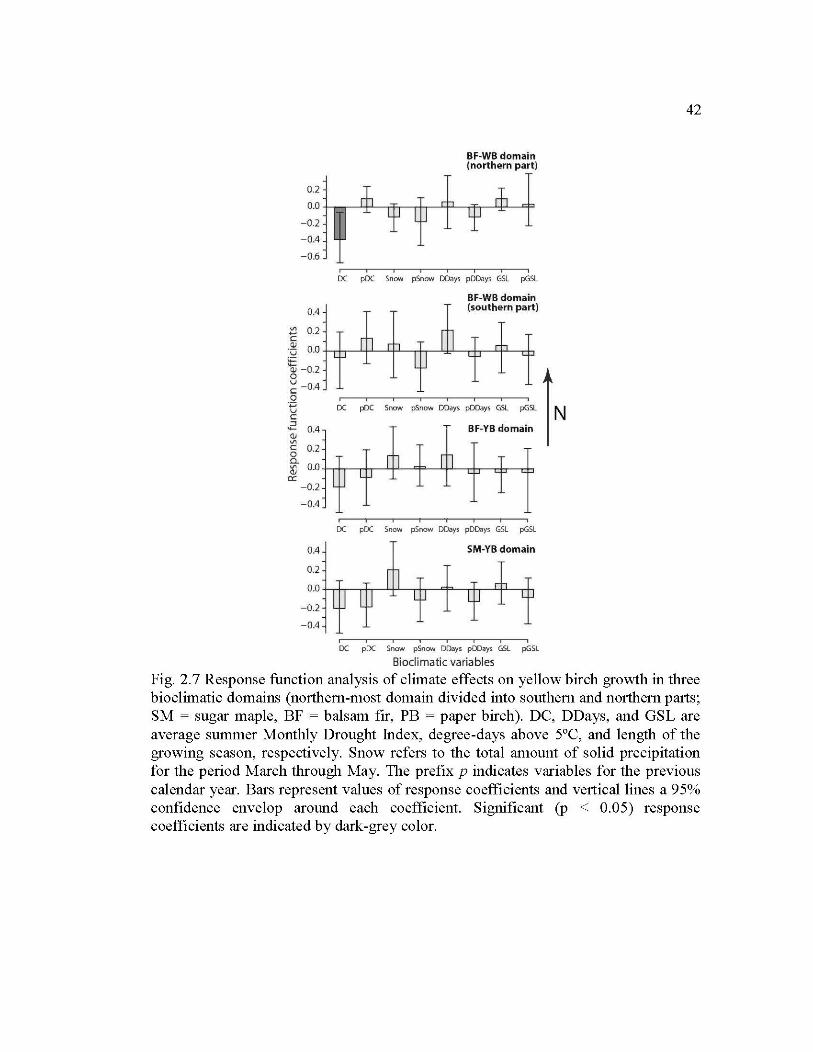
0.2
0.0
-0.2
-0.4
-0.6
0.4
~ 0.2 c
BF-WB domain (northern part)
DC pDC Snow pSnow DOays pDOays GSL pGSL
BF-WB domain (southern part)
·~ 0.0 4-T+-r--4..J._-4-L--rf-r---l:!:l-~h--4-L--r+, tt: <11-0.2 0
~ -0.4 0
·p u c .2 0.4 <li
"' § 0.2
DC pDC Snow pSnow DDays pDDays GSL pGSL 1 N BF-YB domain
c. ~ 0.0 +-r-+-r--r+-.--..J...TJ'--r:::p----'-+-'--r+-r-.....-±r--.-h 0:
- 0.2
-0.4
0.4
0.2
DC pDC Snow pSnow DDays pDDays GSL pGSL
SM-YB domain
0.0 +-r+-r--rt.---4-'--r+r---"T>---rt.---4-L...-r+,
-0.2
- 0.4
DC pDC Snow pSnow DDays pDOays GSL pGSL
Bioclimatic variables
42
Fig. 2. 7 Response function analysis of climate effects on yellow birch growth in three bioclimatic domains (northem-most domain divided into southem and northem parts; SM = sugar maple, BF = balsam fir, PB = paper birch). DC, DDays, and GSL are average summer Monthly Drought Index, degree-days ab ove 5°C, and length of the growing season, respectively. Snow refers to the total amount of solid precipitation for the period March through May. The prefix p indicates variables for the previous cal en dar year. Bars represent values of response coefficients and verticallines a 9 5% confidence envelop around each coefficient. Significant (p < 0.05) response coefficients are indicated by dark-grey color.
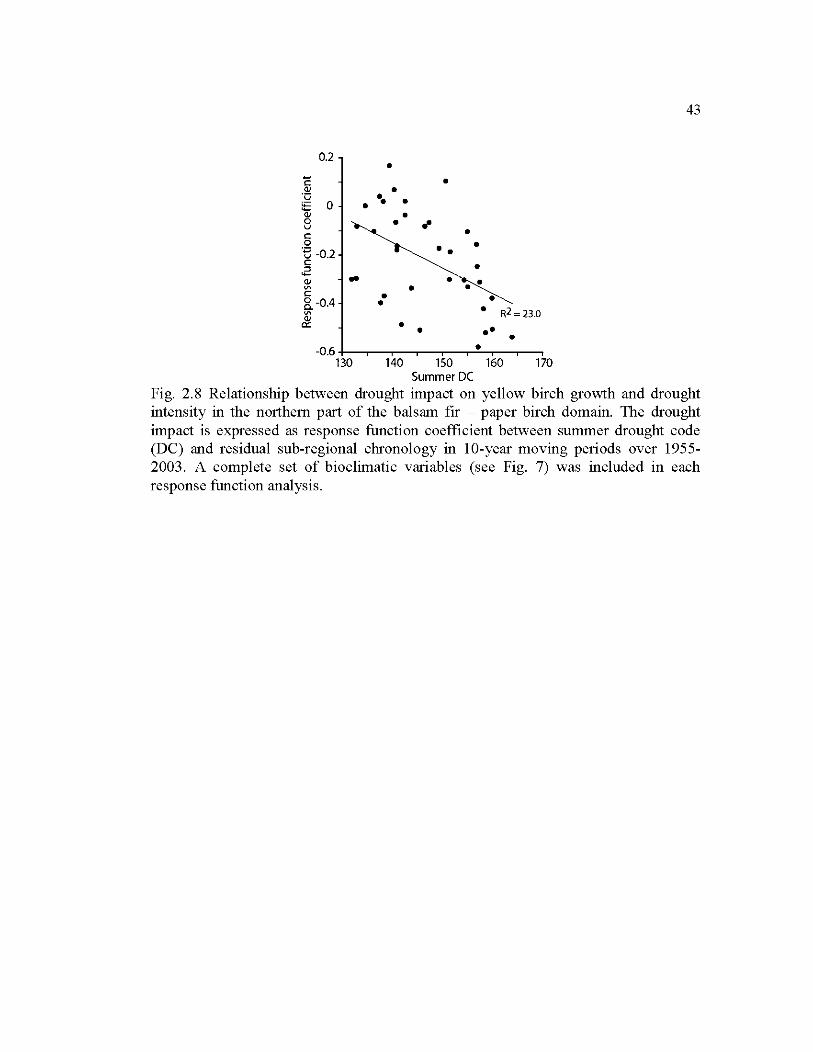
43
0.2 • - • c
<IJ • ïJ • • ;;::: 0 • • ...... <IJ 0 u • c 0 '5 -0.2 • • • c • ~ ...... .. <IJ • • • \Il • c • • 8. -0.4 • \Il • R2 =23.0 <IJ a:: • •• • •
-0.6 • 130 140 150 160 170
Summer DC Fig. 2.8 Relationship between drought impact on yellow birch growth and drought intensity in the northem part of the balsam fir - paper birch domain. The drought impact is expressed as response function coefficient between summer drought code (DC) and residual sub-regional chronology in 10-year moving periods over 1955-2003. A complete set of bioclimatic variables (see Fig. 7) was included in each response function analysis.
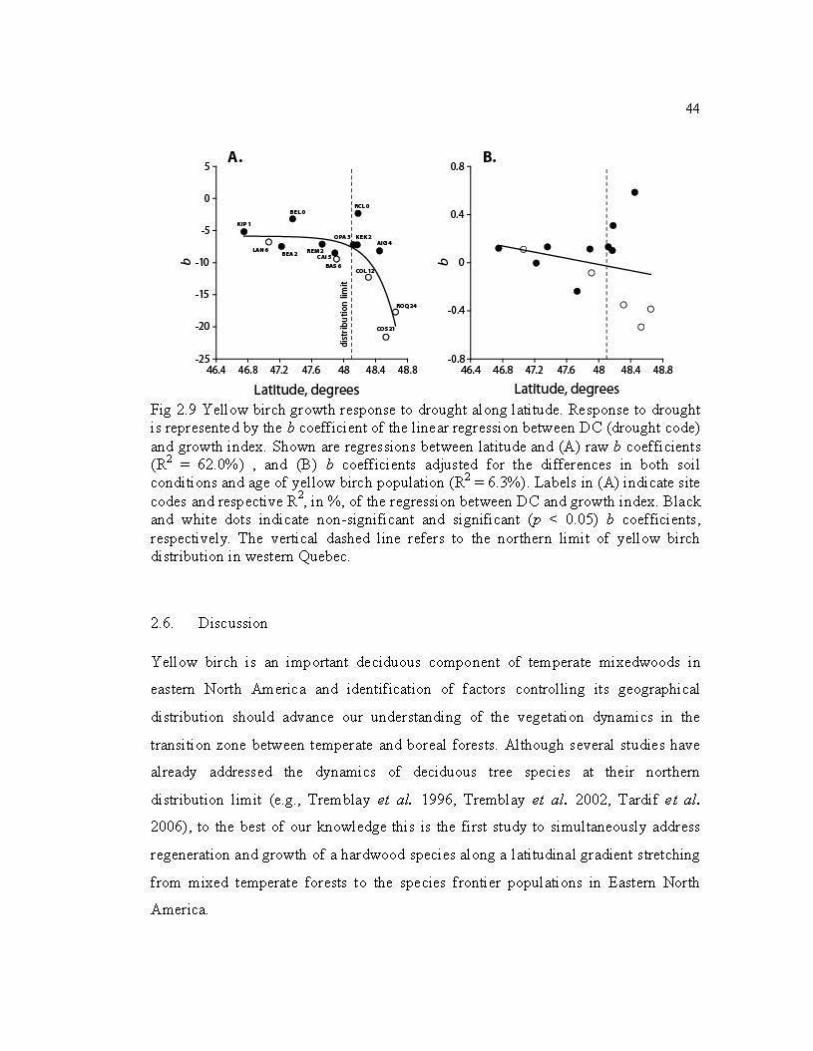
44
5 A.
' 0.8
B. ' ' ' 0 ' 1
IICLO ftLO :.
I(IPI • ' .s ' o . OAAJ1 IICU • • •• "'"* tu.a -~l ~ • ., -10 '"' -·
• 0.4 ' :•
' ~·~ • ---o--t-., 0
.~
-15 ~ c .g
-20 , "' œ•• ~ 0
0 . : ' 0 0
0
-OA
-25 -0.8-1---~~~~-~ ..... ~-~ 46.4 46.8 47.2 47.6 48 48.4 48.8 46.4 46.8 47.2 47.6 48 48.4 48.8
Latitude, degrees Latitude, degrees Fig 2.9 Yellow birch growth response to drought along latitude. Response to drought is represented by the b coefficient of the linear regression between DC (drought code) and growth index. Shown are regressions between latitude and (A) raw b coefficients (R2 = 62.0%) , and (B) b coefficients adjusted for the differences in both soi! conditions and age of yellow birch population (R2 = 6.3%). Labels in (A) indicate site codes and respective R2
, in%, of the regression between DC and growth index. Black and white dots indicate non-significant and significant (p < 0.05) b coefficients, respectively. The vertical dashed line refers to the northern limit of yellow birch distribution in western Quebec.
2.6. Discussion
Yellow birch is an important deciduous component of temperate mixedwoods in
eastern North America and identification of factors controlling its geographical
distribution should advance our understanding of the vegetation dynamics in the
transition zone between temperate and boreal forests. Although severa! studies have
already addressed the dynamics of deciduous tree species at their northern
distribution limit (e.g., Tremblay et al. 1996, Tremblay et al. 2002, Tardif et al.
2006), to the best of our knowledge this is the first study to simultaneously address
regeneration and growth of a hardwood species along a latitudinal gradient stretching
from mixed temperate forests to the species frontier populations in Eastern North
America.
45
2.6.1. Y ellow birch regeneration and growth along a latitudinal gradient
A vailability of sites with conditions suitable for yellow birch establishment within a
bioclimatic domain appears more important than a direct effect of climate in
controlling the abundance of yellow birch across the study area. Support for this view
cornes from large variability in seedling densities within bioclimatic domains, no
significant difference in seedling mortality rates between domains, and presence of
sites with abundant regeneration in each domain.
Seedling density increased with increased total basal area, age and basal area of
canopy yellow birch, and amount of deadwood at late decomposition stages. Due to
pronounced autocorrelation among site properties and similarity in their variability
along the latitudinal gradient (Fig. 2.5A), it was difficult to assess the contribution of
single factors in controlling seedling density. However, step-wise regression analyses
indicated that mean age of yellow birch trees was the most important variable,
suggesting that low seedling density may be related to insufficient seed rain. Y ellow
birch seeding starts at the age of 10 to 40 years (Robitaille and Roberge 1981), but
seeding does not reach its regular level until approximately 70 years in the central
part of the species' range (Erdmann 1990). Although mean age ofbirch population in
the canopy exceeded 40 years at all studied sites (Table 2.1 ), the three sites with the
lowest seedling densities also had the lowest age of yellow birch trees ( < 100 years ),
pointing to insufficient seed rain as a causal factor. However, seedling density should
not probably be considered as a temporally stable measure of regeneration success. A
previous study of yellow birch recruitment in the sugar maple - yellow birch
bioclimatic domain suggested that seedling establishment varies considerably among
years (Houle 1998). Y ellow birch populations are maintained almost exclusively by
sexual reproduction and do not rely on sprouting as do other hardwood species in the
region (Tremblay et al. 2002). Seed availability and seedling survival are therefore
crucial for yellow birch recruitment. Although no seeding data were available over
46
the study area, a study along an elevational gradient in New Hampshire has
demonstrated a decline in seed productivity with increasing altitude (O'Donoghue
2004), painting to a potential role of temperature that would likely also be found
along a latitudinal gradient.
Experimental studies have demonstrated the importance of deadwood for yellow
birch regeneration (Ruel et al. 1988, Houle 1992), a pattern also shown for other
deciduous species in mixed forests (e.g., Houle 1992, Mcgee and Birmingham 1997).
The amount of deadwood at late decomposition stages might be another factor
facilitating establishment of yellow birch seedlings due to improved nutrient
conditions and lower seedling mortality on such microsites. However, in our study,
strong autocorrelation in the properties of the studied sites, namely strong and
positive correlation between deadwood abundance and the age of yellow birch,
complicated evaluation of the role of deadwood in seedling abundance variability
across sites. Both regression analyses and semi-partial correlation analyses suggested
that the effect of deadwood abundance was clearly less important than the age effect
in controlling seedling density (semi-partial correlations of 0.046 and 0.310,
respectively).
Presence of mature yellow birch trees appeared crucial to exp lain seedling abundance
(Fig. 2.5A), reflecting a pattern reported earlier (Houle 1998). PC1, representing the
main mode ofvariability in site-level factors and being strongly dependent on latitude
(Fig. 2.5B), was largely a product of the abundance of mature yellow birch trees
associated with more open habitats. Soil conditions and site dryness index had a
lesser effect on seedling abundance.
Similar to variability in seedling density, sapling density did not reveal a clear
latitudinal pattern (Fig. 2.2). Saplings were more abundant at the dryer sites (Fig.
2.4b, Table 2.3), indicating that the rich and moist clayey soils of western Quebec
47
might limit the northward expansion of yellow birch. Research clone in more central
parts of the yellow birch distribution have documented the importance of canopy gaps
and, generally, moderate light levels for successful recruitment into the canopy
(White et al. 1985, Payette et al. 1990, Catovsky and Bazzaz 2000). In our study,
however, canopy openness was poorly linked to sapling abundance, probably because
it was low at a majority of sites (71% of sites with openness below 30% ).
Growth patterns of canopy trees showed no effect of declining temperatures along the
south-north gradient. Considering trees at the earl y stage of their lifespan (up to 50
years old), we observed no decline in growth rates towards the north (Fig. 2.6). This
result was obtained by combining site-level data within each of the bioclimatic
domains, which minimized possible effects of individual site histories. Change in
degree-days across the bioclimatic domains had, therefore, no effect on the initial
rates of biomass accumulation. We observed the same pattern in the response
function analysis of growth sensitivity to annual climate (Fig. 2.7): none of the
seasonal variables representing the temperature regime was significantly related to
inter-annual growth variability. Instead, a trend towards increased sensitivity to
summer drought was observed within the paper birch - balsam fir domain. This was,
however, likely an age-related effect, as the pattern disappeared when accounting for
differences in age between sites. In addition, the summer aridity gradient in this part
of the temperate zone is not south-north, but rather east-west oriented and reflects a
decline in summer precipitation with increasing distance from the Atlantic Ocean
(Fig. 2.1 0). A large decline in the R2 of the linear regression between latitude and
effect of summer aridity on growth, observed when accounting for age differences,
implied a lower capacity of the root system of younger trees to supply water during
the growing season.
Amount of summer warmth may not be a limiting factor for the growth of yellow
birch and other deciduous species at their northern distribution limits in Eastern
48
Canada. Sugar maple (Acer saccharum Marsh.), American beech (Fagus grandifolia
Ehrh.), and white and northem red oak (Quercus alba L. and Q. rubra L.) showed
decreased growth with increasing summer temperatures, apparently reflecting a
negative effect of drought on biomass production (Tardif et al. 2006, 2011). In the
case of yellow birch, we only obtained a negative correlation at the very limit of the
studied gradient, likely due to a dryer summer climate in the north. It should be noted
that this effect was observed despite a northward trend for site conditions to become
increasingly humid (Fig. 2.4B).
2.6.2. Speculation on site- vs. domain-level effects on regeneration and growth
Our results suggest that environmental controls of birch distribution at its northem
limit are realized through factors affecting birch regeneration and not growth of
canopy trees. Results further suggested that at sites where yellow birch was present,
regeneration density was strongly controlled by local conditions and not by among
site differences in climate. Frequency of sites with favorable substrates and available
seed sources appear to be crucial in defining yellow birch abundance at the border of
the two northem bioclimatic domains (balsam fir - yellow birch and balsam fir -
paper birch domains ). Main lines of evidence for this conclusion were similarity in
regeneration density and age structure (on sites with similar canopy composition),
and lack of difference in growth rate of young ( < 50 years) canopy trees between the
two domains.
It follows that regional abundance of yellow birch at its northem limit is likely not
directly related to the species' climatic tolerance, but to factors controlling habitat
availability at the landscape scale. In this context, history of the studied landscape and
its disturbance regime could be an important driver of yellow birch distribution,
directly affecting the availability of favorable habitats. Fire is the primary natural
disturbance agent in the northem part of the studied region (Bergeron et al. 2004).
49
We therefore propose that, at the regional scale, the yellow birch distribution limit
may be closely linked to regional fire regimes, affecting seed and habitat availability.
In the southem domains (balsam fir - yellow birch and sugar maple - yellow birch
domains ), yellow birch was likely maintained by a disturbance regime characterized
by canopy gaps and infrequent fires of moderate size and intensity (Grenier et al.
2005). Such fires frequently left untouched habitats, where yellow birch regenerated
in canopy gaps, providing seed source to the surrounding landscape. This was
supported by the observation that in the vast majority (88%) of yellow birch stands in
the two southem bioclimatic domains the maximum age of sampled trees exceeded
200 years (Table 2.2), implying that at least sorne of the yellow birch trees were
located in local fire refugia. In the northem-most domain (balsam fir - paper birch)
yellow birch stands were younger, reflecting a higher rate of forest disturbance
(Boulanger et al. 2013). However, in line with our assumption of yellow birch
benefiting from fire refugia, maximum ages of birch trees were older than fire dates
in all stands where fire data were available (Table 2.2).
In the northem mixedwoods, the current paucity of yellow birch in the canopy of the
balsam fir - paper birch bioclimatic domain might be related to larger and more
severe fires in the past (Bergeron et al. 2004), which would likely have reduced
yellow birch regeneration possibilities. In particular, more severe and larger fires
benefit conifer species with serotinous cones such as black spruce and jack pine
(Pinus banksiana Lamb.), rather than species depending on post-disturbance
"survivors" such as red pine (P. resinosa) and deciduous trees (Betula spp., Populus
spp. , Acer spp.). Especially important in this context is a trend towards an increase in
average fire size to the north, which may not be matched by the seed dispersal
capacity of yellow birch (Perala and Alm 1990). In addition, although being
morphologically monoecious, yellow birch may be a functionally dioecious species
(Patterson and Bunce 193 1 ). Th us, the isolation of yellow birch in relation to other
individuals of the same species might affect the production of viable seeds. The
50
observation that the three northemmost sites of the transect were devoid of seedlings
suggests that climatic conditions at the northem fringe ofthe gradient may limit seed
productivity, effectively preventing yellow birch from expanding outside of frontier
stands.
The current fire cycle in the studied transitional zone is estimated between 360
(Bergeron et al. 2004) and 750 years (Boulanger et al. 2013), which is longer than the
cycle prior to 1850 (about 100 years, Bergeron and Archambault 1993). However,
recent climate models indicate that fire activity will increase in the future (Flannigan
et al. 2005, Bergeron et al. 2006), which in the long run might limit yellow birch
occupation and cause a southward retreat of the current limit between the two
northem bioclimatic domains. Remaining yellow birch stands will then increasingly
reflect a legacy of past longer fire cycles rather than the current climate settings.
Altematively, a decline in fire activity and an increase in the relative importance of
canopy gap disturbances would likely provide better regeneration opportunities for
yellow birch. Such a change in disturbance regime, coupled with general warming of
the climate (DesJarlais et al. 2010), could trigger a northward movement of the
northem limit of the balsam fir - yellow birch domain. However, considerable
northward expansion of yellow birch appears unlikely due to the scarcity of sites with
coarse till, a preferred substrate for yellow birch establishment, in the Clay Belt and
Hudson Bay lowlands.
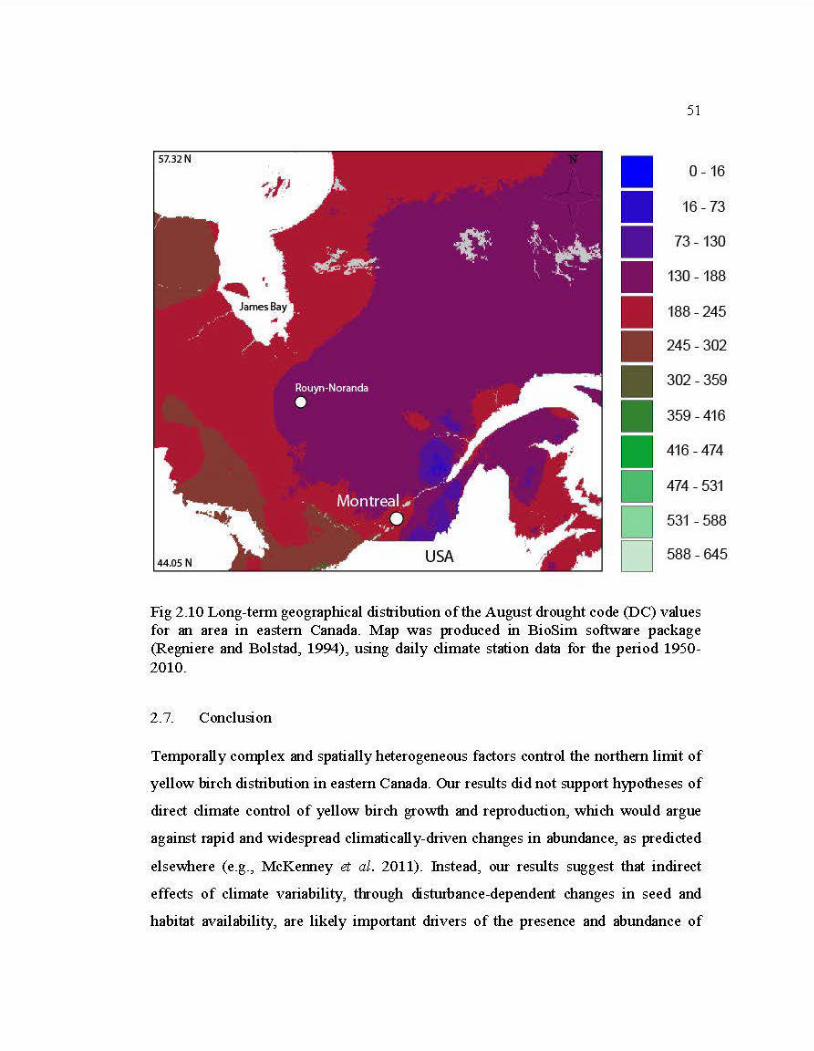
51
0- 16
16-73
73- 130
130-188
188-245
245 - 302
302-359
359-416
416-474
474-531
D 531 -588
D 588-645
Fig 2.10 Long-tenn geogrnphical distribution of the August drought code (DC) values for an area in eastern Canada. Map was produced in BioSim software package (Regniere and Bolstad, 1994), using daily climate station data for dte period 1950-2010.
2.7. Conclusion
Temporally complex and spatially heterogeneous factors control the northem limit of
yellow birch distribution in eastern Canada. Our results did not support hypodteses of
direct climate control of yellow birch growdt and reproduction, which would argue
against rnpid and widespread climatically-driven changes in abundance, as predicted
elsewhere (e.g., McKenney et al. 2011). Jnstead, our results suggest that indirect
effects of climate variability, through distwbance-dependent changes in seed and
habitat availability, are likely important drivers of the presence and abundance of
52
yellow birch at the geographical scale of bioclimatic domains, whereas site
characteristics appear fundamental in controlling variability of yellow birch
abundance within a domain.
Our data, together with reconstructions of historical disturbance histories in boreal
mixedwoods (Bergeron et al. 2004), point to the important role of regional vegetation
history and, specifically, wildfire activity in shaping the current pattern of yellow
birch distribution across the landscape. In this respect, the natural history of yellow
birch might be similar to that of other tree species for which a strong link between
natural disturbances and distribution dynamics has been suggested: balsam fir (Ali et
al. 2008), jack pine (Asselin et al. 2003), red pine (Bergeron and Brisson, 1990) and
oaks (Quercus alba and Q. rubra, Tardif et al. 2006) in eastern Canada, and
European beech (Fagus sylvatica L.) in Scandinavia (Bradshaw et al. 2010).
Adopting a long temporal perspective therefore appears an important prerequisite for
the analysis of species' distribution limits. Finally, our results call for careful
examination ofthe advantages and disadvantages ofthe methods used to decipher and
model such dynamics, and also highlight the value of using multiple proxies of
species performance (such as regeneration data and long growth chronologies).
2.8. Acknowledgements
Financial support for the study was provided by the NSERC-UQAT-UQAM
Industrial Chair in Sustainable Forest Management (Y.B.). The study was realized
within the frameworks of the N ordic-Canadian network on forest growth research,
supported by the Nordic Council of Ministers (grant # 12262 to I.D.), and of the
Swedish-Canadian network for cooperation in forestry research, supported by the
Swedish Foundation for International Cooperation in Research and Higher Education
STINT (grant # IB2013-5420 to I.D.).
53
2.9. References
Akaike, H. 1974. A new look at the statistical model identification. IEEE Transactions on Automatic Control16:716-723.
Ali, A.A., Asselin, H., Larouche, A., Bergeron, Y., Carcaillet, C., and Richard, P.J.H. 2008. Changes in fire regime explain the Holocene rise and fall of Abies balsamea in the coniferous forests of western Québec, Canada. Holocene 18:693-703.
Applequist, M. B. 1958. A simple pith locator for use with off-centre increment cores. Journal ofForestry 56: 141.
Asselin, H. and Payette, S. 2005. Late Holocene opening of the forest tundra landscape in northern Quebec, Canada. Global Ecology and Biogeography 14:307-313.
Asselin, H., Payette, S., Fortin, M.-J., and Vallée, S. 2003. The northern limit of Pinus banksiana Lamb. in Canada: explaining the difference between the eastern and western distributions. Journal ofBiogeography 30:1709-1718.
Baker, F. S. 1949. A revised tolerance table. Journal ofForestry 47:179-181.
Berger, J.-P. (coordinator) 2008. Norme de stratification écoforestière. Quatrième inventaire écoforestier. 62 pp. Ministère des Ressources naturelles et de la Faune du Québec.
Bergeron, Y. and Archambault, L. 1993. Decreasing frequency of forest fires in the southern boreal zone of Quebec and its relation to global warming since the end ofthe "Little lee Age". Holocene 3:255-259.
Bergeron, Y. and Brisson, J. 1990. Fire regime in red pine stands at the northern limit of the species range. Ecology 71:1352-1364.
Bergeron, Y., Gauthier, S., Flannigan, M., and Kafka, V. 2004b. Fire regimes at the transition between mixedwood and coniferous boreal forest in Northwestern Quebec. Ecology 85:1916-1932.
Bergeron, Y., Cyr, D., Drever, C.R., Flannigan, M., Gauthier, S., Kneeshaw, D., Lauzon, È., Leduc, A., Le Goff, H., Lesieur, D., and Logan, K. 2006. Past, current, and future fire frequencies in Quebec's commercial forests: implications for the cumulative effects of harvesting and fire on age-class
54
structure and natural disturbance-based management. Canadian Journal of Forest Research 36:2737-2744.
Bergh, J., McMurtrie, R. E., and Linder, S. 1998. Climatic factors controlling the productivity of Norway spruce: A model-based analysis. Forest Ecology and Management 110:127-139.
Biondi, F. and Waikul, K. 2004. DENDROCLIM2002: AC++ program for statistical calibration of climate signais in tree-ring chronologies. Computers and Geosciences 30:303-311.
Bouchard, M., Kneeshaw, D., and Bergeron, Y. 2006. Tree recruitment pulses and long-term species coexistence in mixed forests of western Que bec. Ecoscience 13:82-88.
Boulanger, Y., Gauthier, S., Gray, D.R., Le Goff, H., Lefort, P., and Morissette, J. 2013. Fire regime zonation under current and future climate over eastern Canada. Ecological Applications 23:904-923.
Bradshaw, R., Kito, N., and Giesecke, T. 2010. Factors influencing the Holocene history ofFagus. Forest Ecology and Management 259:2204-2212.
Briffa, K.R., Jones, P.D., Bartholin, T.S., Eckstein, D., Schweingruber, F.H., Karlen, W., Zetterberg, P., and Eronen, M. 1992. Fennoscandian summers from AD 500: Temperature changes on short and long timescales. Climate Dynamics 7:111-119.
Carnicer, J. , Coll, M., Ninyerola, M., Pons, X., Sanchez, G., and Penuelas, J. 2011. W ides pre ad crown condition decline, food web disruption, and amplified tree mortality with increased climate change-type drought. Proceedings of the National Academy of Sciences of the United States of America 108:1474-1478.
Catovsky, S. and Bazzaz, F.A. 2000. The role of resource interactions and seedling regeneration in maintaining a positive feedback in hemlock stands. Journal of Ecology 88:100-112.
Cook, E.R. , Nance, W.L. , Krusnic, P.J. , and Grissom, J. 1998. Modelling the differentiai sensitivity of loblolly pine to climate change using tree rings. The productivity and sustainability of southern forest ecosystems in a changing environment. Ed. by S. Fox and R. Mickler, Springer, New York.
55
Cook, E.R. and Cole, J. 1991. On predicting the response offorests in Eastern NorthAmerica to future climatic change. Climatic Change 19:271-282.
Cook, E.R. and Krusic, P.J. 2005. Program ARSTAN. A tree-ring standardization program based on detrending and autoregressive time series modeling, with interactive graphies. Tree-Ring Laboratory, Lamont Doherty Earth Observatory of Columbia University, Palisades, NY.
Crernaschi, M., Pelfini, M., and Santilli, M. 2006. Cupressus dupreziana: a dendroclimatic record for the middle-late Holocene in the central Sahara. Holocene 16:293-303.
D'Arrigo, R.D., Kaufmann, R.K., Davi, N., Jacoby, G.C., Laskowski, C., Myneni, R.B., and Cherubini, P. 2004. Thresholds for warming-induced growth decline at elevational tree line in the Yukon Territory, Canada. Global Biogeochemical Cycles 18:1-7.
DesJarlais, C., Allard, M., Bélanger, D., Blondlot, A., Bouffard, A., Bourque, A., Chaumont, D., Gosselin, P., Houle, D., Larrivée, C., Lease, N., Pham, A.T., Roy, R., Savard, J.P., Turcotte, R., and Villeneuve. 2010. Learning to adapt to climate change. Ouranos, Consortium on Regional Climatology and Adaptation to Climate Change, Montreal, QC.
Driscoll, W.W., Wiles, G.C., D'Arrigo, R.D., and Wilmking, M. 2005. Divergent tree growth response to recent climatic warming, Lake Clark National Park and Preserve, Alaska. Geophysical Research Letters, 32.
Drobyshev, 1., Simard, M., Bergeron, Y. , and Hofgaard, A. 2010. Does soil organic layer thickness affect climate-growth relationships in the black spruce boreal ecosystem? Ecosystems 13:556-574.
Efron, B. and Tibshirani, R.J. 1993. An introduction to the bootstrap. Chapman and Hall 1 CRC, New York.
Elia, R. and Côté, H. 201 O. Climate and climate change senslttvlty to mo del configuration in the Canadian RCM over North America. Meteorologische Zeitschrift 19:325-339.
Erdmann, G. G. 1990. Betula alleghaniensis Britton. Yellow birch. Silvics of North America. Volume 2. Hardwoods. Ed. by R.M. Burns and B.H. Honkala, pp. 133-147. USDA Forest Service Agricultural Handbook. Washington, DC.
Esper, J., Schweingruber, F.H., and Winiger, M. 2002.1300 years of climatic history for Western Central Asia inferred from tree-rings. Holocene 12:267-277.
56
Flannigan, M.D., Logan, K.A., Amiro, B.D., Skinner, W.R. and Stocks, B.D. 2005. Future area burned in Canada. Climatic Change 72:1-16.
Gasser, D., Messier, C., Beaudet, M., and Lechowicz, M.J. 2010. Sugar maple and yellow birch regeneration in response to canopy opening, liming and vegetation control in a temperate deciduous forest of Quebec. Forest Ecology and Management 259:2006-2014.
Gedalof, Z. and Smith, D.J. 2001. Dendroclimatic response of mountain hemlock Tsuga mertensiana in Pacifie North America. Canadian Journal of Forest Research 31:322-332.
Goldblum, D. and Rigg, L.S. 2005. Tree growth response to climate change at the deciduous-boreal forest ecotone, Ontario, Canada. Canadian Journal of Forest Research 35: 2709-2718.
Grenier, D.J., Bergeron, Y., Kneeshaw, D. , and Gauthier, S. 2005. Fire frequency for the transitional mixedwood forest of Timiskaming, Quebec, Canada. Canadian Journal of Forest Research 35:656-666.
Harrison, S.P., Kutzbach, J.E. , Prentice, I.C. , Behling, P.J., and Sykes, M.T. 1995. The response of Northern Hemisphere extratropical climate and vegetation to orbitally induced changes in insolation during the last interglaciation. Quaternary Research 43:174-184.
Hastie, T.J. and Pregibon, D. 1992. Chapter 6. Statistical models in S. Generalized linear models. Ed. by J.M. Chambers and T.J. Hastie, Wadsworth and Brooks/Cole.
Hett, J.M. and Loucks, O.L. 1976. Age structure models of balsam fir and eastern hemlock. Journal of Ecolo gy 64: 1029-1044.
Holmes, R. L. 1999. Dendrochronological Program Library DPL. Users Manual. Laboratory of Tree-Ring Research, University of Arizona, Tucson, Arizona, USA, http://www.ltrr.arizona.edu/pub/dpll.
Houle, G. 1992. The reproductive ecology of Abies balsamea, Acer saccharum and Betula alleghaniensis in the Tantaré Ecological Reserve, Quebec. Journal of Ecology 80:611-623.
Houle, G. 1998. Seed dispersal and seedling recruitment of Betula alleghaniensis: Spatial inconsistency intime. Ecology 79:807-81 8.
57
Houle, G. and Payette, S. 1990. Seed dynamics of Betula alleghaniensis in a deciduous forest of north-eastern North-America. Journal of Ecology 78:677-690.
Houle, D., Richard, P.J., Ndzangou, S.O., and Richer-Laflèche, M. 2012. Compositional vegetation changes and increased red spruce abundance during the Little lee Age in a sugar maple forest of north-eastern North America. Plant Ecology 213: 1027-1035.
!verson, L., Prasad, A., and Matthews, S. 2008. Modeling potential climate change impacts on the trees of the northeastern United States. Mitigation and Adaptation Strategies for Global Change 13:487-516.
Kern, C.C., Reich, P.B., Montgomery, R.A., and Strong, T.F. 2012. Do deer and shrubs override canopy gap size effects on growth and survival of yellow birch, northern red oak, eastern white pine, and eastern hemlock seedlings? Forest Ecology and Management 267:134-143.
Kirilenko, A.P., Belotelov, N.V. and Bogatyrev, B.G. 2000. Global model of vegetation migration: incorporation of climatic variability. Ecological Modelling 132:125-133.
Kneeshaw, D.D. and Prevost, M. 2007. Natural canopy gap disturbances and their role in maintaining mixed-species forests of central Quebec, Canada. Canadian Journal of Forest Research 37:1534-1544.
Kobe, R.K., Pacala, S.W., Silander, J.A., and Canham, C.D. 1995. Juvenile tree survivorship as a component of shade tolerance. Ecological Applications 5:517-532.
Larocque, 1., Bergeron, Y., Campbell, I.D., and Bradshaw, R.H.W. 2000. Vegetation changes through time on islands of Lake Duparquet, Abitibi, Canada. Canadian Journal of Forest Research 30:179-190.
Larsson, L.-A. 2010. Cybis dendro dating program v. 7.3. Cybis Elektronik and Data AB.
Little, E.L. 1971. Atlas of United States trees, volume 4, minor Eastern hardwoods. Rep. Miscellaneous Publication 1342. U.S. Department of Agriculture. 17 p., 230 maps.
58
Lorimer, C.G. 1997. The presettlement forest and natural disturbance cycle of Northeastern Maine. Ecology 58:139-148.
Mcgee, G. and Birmingham, J. 1997. Decaying logs as germination sites in northern hardwood forests. Northern Journal of Applied Forestry 14:178-182.
McKenney, D.W., Pedlar, J.H., Rood, R.B., and Priee, D. 2011. Revisiting projected shifts in the climate envelopes of North American trees using updated general circulation models. Global Change Biology 17:2720-2730.
Miller, P.A., Giesecke, T., Hickler, T., Bradshaw, R.H.W., Smith, B., Seppa, H., Valdes, P.J., and Sykes, M. T. 2008. Exploring climatic and biotic controls on Holocene vegetation change in Fennoscandia. Journal ofEcology 96:247-259.
Nolet, E., Forget, E., Bouffard, D., and Doyon, F. 2001. Reconstitution historique du dynamisme du paysage forestier du bassin de La Lièvre au cours du 20ième siècle. 114 pp. Institut québécois d'aménagement de la forêt feuillue, Ripon, QC, Canada.
O'Donoghue, B. 2004. Seed germination and seedling survival of balsam fir, heartleafed paper birch, yellow birch, and red spruce along an elevational gradient on Mt. Moosilauke, NH. Master's Thesis . Antioch New England Graduate School.
Patterson, C.F. and Bunce, A.C. 1931. Rapid methods of determining the percentages of fertility and sterility in seeds of the genus Betula. Science Agriculture 11:704-708.
Payette, S., Filion, L., and Delwaide, A. 1990. Disturbance regime of a cold temperate forest as deduced from tree-ring patterns - the Tantaré Ecological Reserve, Quebec. Canadian Journal of Forest Research 20:1228-1241.
Pederson, N., Cook, E.R., Jacoby, G.C. , Peteet, D.M., and Griffin, K.L. 2004. The influence of winter temperatures on the annual radial growth of six northern range margin tree species. Dendrochronologia 22:7-29.
Perala, D.A. and Alm, A. A. 1990. Reproductive ecology of birch - a review. Forest Ecology and Management 32:1-38.
Prasad, A.M., Gardiner, J.D. , !verson, L.R. , Matthews, S.N., and Peters, M. 2013. Exploring tree species colonization potentials using a spatially explicit simulation model: implications for four oaks under climate change. Global Change Biology 19:2196-2208.
59
Prentice, I.C., Cramer, W., Harrison, S.P., Leemans, R., Monserud, RA., and Solomon, A.M. 1992. A global biome model based on plant physiology and dominance, soil properties and climate. Journal of Biogeography 19: 117-134.
Régnière, J. 1996. Generalized approach to landscape-wide seasonal forecasting with temperature-driven simulation models. Environmental Entomology 25:869-881.
Régnière, J. and Bolstad, P. 1994. Statistical simulation of daily air temperature patterns in eastern North America to forecast seasonal events in insect pest management. Environmental Entomology 23:1368-1380.
Robitaille, L. and Roberge, M. 1981. La sylviculture du bouleau jaune au Québec. Revue Forestière Française 33:105-112.
Ruel, J.-C., Loustau, D., and Pineau, M. 1988. Relationship between microtopography, forest floor characteristics and tree species distribution in a yellow birch stand. Canadian Journal of Forest Research 18:1196-1202.
Saucier, J.-P. 1994. Le point d'observation écologique. Ministère des Ressources naturelles du Québec. 116 pp.
Saucier, J.-P., Grondin P., Robitaille, A., and Bergeron J.-F. 2003. Zones de végétation et domaines bioclimatiques du Québec. Gouvernement du Québec, Ministère des Ressources naturelles, de la Faune et des Parcs.
Soil Classification Working Group 1998. The Canadian system of soil classification. Third edition. Agriculture and Agri-Food Canada, Ottawa, Ontario, Canada.
Stokes, M.A. and Smiley, T.L. 1968. An introduction to tree-ring dating. University of Chicago Press, Chicago, Illinois, USA.
Tardif, J., Brisson, J., and Bergeron, Y. 2001. Dendroclimatic analysis of Acer saccharum, Fagus grandifolia, and Tsuga canadensis from an old-growth forest, southwestern Quebec. Canadian Journal of Forest Research 31:1491-1501.
Tardif, J.C., Conciatori, F., Nantel, P., and Gagnon, D. 2006. Radial growth and climate responses of white oak Quercus alba and northern red oak Quercus rubra at the northern distribution limit of white oak in Quebec, Canada. Journal ofBiogeography 33:1657-1669.
60
Topp, G.C. 1993. Soil water content. Soil sampling and methods of analysis. Ed. by M.R. Carter, pp. 541-557. Canadian Society of Soil Science, Lewis Publishers, Boca Raton, FL.
Tremblay, M.F., Mauffette, Y., and Bergeron, Y. 1996. Germination responses of northem red maple Acer rubrum populations. Forest Science 42:154-159.
Tremblay, M.F., Bergeron, Y., Lalonde, D., and Mauffette, Y. 2002. The potential effects of sexual reproduction and seedling recruitment on the maintenance of red maple Acer rubrum L. populations at the northem limit of the species range. Journal ofBiogeography 29:365-373.
Turner, J.A. 1972. The drought code component of the Canadian Forest Fire Behaviour System. Environment Canada, Ottawa, Ontario, Canada.
Venables, W.N. and Ripley, B.D. 2002. Modem applied statistics with S, 4th edition. Springer, New York.
Wang, L., Payette, S., and Bégin, Y. 2002. Relationships between anatomical and densitometric characteristics of black spruce and summer temperature at tree line in northem Quebec. Canadian Journal of Forest Research 32:477-486.
White, P.S., MacKenzie, M.D., and Busing, R.T. 1985. Natural disturbance and gap phase dynamics in southem Appalachian forests. Grand Forks, ND USA.
Winget, C. and Kozlowski, T. 1965. Yellow birch germination and seedling growth. Forest Science 11:386-392.
Woodhouse, C.A. and Meko, D. 1997. Number of winter prectpltation days reconstructed from southwestem tree rings. Journal ofClimate 10: 2663-2669.
Woods, K.D. 2000. Dynamics in late-successional hemlock-hardwood forests over three decades. Ecology 81:110-126.
Zang, C. and Biondi, F. 2012. Dendroclimatic calibration in R: The bootRes package for response and correlation function analysis. Dendrochronologia 31 :68-7 4.
CHAPITRE III
CONCLUSION GÉNÉRALE
Notre première hypothèse sur les facteurs limitants de la répartition nordique du
bouleau jaune est que la croissance du bouleau jaune est de plus en plus contrôlée par
les températures froides vers le nord. Les températures hivernales froides causent des
blessures par le gel aux tissus de 1 'arbre. Ces blessures pourraient affecter la
croissance de l'arbre et causer sa mort si les blessures sont trop importantes.
Lorsqu'on prend en compte 1 'âge cambial de 1' arbre, nous n'avons trouvé aucune
diminution de la croissance du bouleau jaune vers le nord de notre aire d'étude (Fig
2.6). L'analyse de fonction réponse entre les chronologies résiduelles de croissance
du bouleau jaune et les variables climatiques (Fig 2. 7) montrent seulement un effet
significatif avec l'indice de sécheresse. Aucun effet ne semble présent pour les
variables de températures. Ceci suppose que la diminution des températures vers le
nord n'a pas d'impact important sur la croissance des bouleaux jaunes matures.
Georges et al. (1974) ont calculé expérimentalement le niveau de résistance au gel
des cellules de parenchymes du xylème du bouleau jaune entre -41.2°C et -46.2°C
selon les arbres. Des températures aussi basses sont possibles dans une bonne partie
de l 'aire d 'étude puisque les stations météorologiques de Belleterre et de Ville-Marie
qui sont situées à environ 150 km au sud des peuplements les plus nordiques de
bouleau jaune ont déjà enregistré des températures de -50°C (Environnement Canada
2008). Les températures inférieures à -46.2°C sont toutefois très peu fréquentes et de
courte durée dans toutes les stations météorologiques de l'aire d'étude
(Environnement Cananda 2008). Il est donc possible que ces températures ne soient
pas présentes suffisamment longtemps pour causer des blessures assez importantes
aux bouleaux jaunes pour affecter leur croissance ou causer la mort des arbres. En
62
résumé, les températures ne semblent donc pas être assez froides même à la limite
nordique du bouleau jaune pour limiter la croissance et la survie des arbres matures.
Notre deuxième hypothèse portait sur la diminution du succès reproducteur du
bouleau jaune vers le nord. Le succès de régénération pourrait premièrement être
affecté par une diminution de la production de graines viables et une diminution du
taux de survie des jeunes semis lors du premier printemps et été suivant la
germination. Nous n'avons pas documenté pour cette étude la quantité de graines
viables produites, mais seulement le nombre de jeunes bouleaux jaunes présents dans
chaque site. Dans des conditions optimales, les semis de bouleau jaunes peuvent
croitre jusqu'à 50 cm en 3 mois ce qui correspond environ à la durée de la saison de
croissance dans notre territoire d'étude (Clausen 1973). On peut donc supposer
qu'une importance proportion des bouleaux jaune de moins de 50 centimètres sont
des semis de première année. Ce nombre de semis de première année reflète
indirectement la production de graines viables. L' abondance de régénération de
bouleau jaune varie considérablement entre les sites dans toute l'aire d'étude et ne
montre pas une tendance claire avec la latitude (Fig 2.2). Ceci pourrait être en partie
expliqué par la grande importance des caractéristiques non climatiques de chaque site
sur le succès d'établissement des jeunes bouleaux jaunes. Selon nos données, la
densité de semis dans un site augmente avec une augmentation de la surface terrière
totale, de l'âge, de la surface terrière des bouleaux jaunes et de la quantité de débris
ligneux avec un niveau de décomposition avancée (Fig 2.5A). Toutefois, l'âge moyen
des bouleaux jaunes est le seul facteur pour lequel nous avons pu démontrer que cette
relation est significative. Le bouleau jaune atteint une production régulière de graines
seulement à partir de l'âge d' environ 70 ans (Erdmann 1990) et dans une forêt non
aménagée il atteint sa maturité, selon sa hauteur maximale, vers l'âge de 120 à 150
ans. Plusieurs des peuplements inventoriés n'ont pas encore atteint 1 'âge de maturité
et de production régulière de graines ce qui a pu contribuer à renforcer le lien entre
l' âge des bouleaux jaunes et la densité de semis. Les peuplements âgés ont aussi
63
habituellement une plus grande quantité de débris ligneux avec un niveau élevé de
décomposition. Même si nous n'avons pas trouvé de lien significatif avec les débris
ligneux dans notre étude, Winget et Kozlowski (1965) ont déjà démontré que dans les
peuplements fermés la majorité des semis de bouleau jaune se développent sur les
petits monticules et les troncs en décomposition. Malgré 1' absence de lien significatif
entre la régénération et la latitude, la quasi-absence de jeunes semis de moins de 50
cm dans les trois peuplements les plus nordiques de l'étude semble suggérer un effet
limitant des températures à ces sites. Dans les peuplements AIG, COS et ROQ, nous
avons répertorié seulement un semis de moins de 50 cm dans chacun des
peuplements. Cette très faible abondance de jeunes semis semble démontrer un échec
de la production de graines viables et/ou une mortalité hâtive des semis de première
année. Un échec dans la production de graines de bouleau jaune peut être causé par
des gelées tardives au printemps qui surviennent lorsque les fleurs de bouleaux jaunes
sont ouvertes (Erdmann 1990). Les gelées tardives peuvent aussi causer la mortalité
des jeunes semis de bouleau jaune (Linteau 1948). Les 2 stations météorologiques
situées le plus près des sites de ROQ, COS et AIG ont au moins une journée de gel en
juin dans 78% et 85% des années entre 1971 et 2000 (Environnement Canada 2008).
La faible abondance des jeunes semis pourrait être en partie causée par le jeune âge
des bouleaux jaunes dans les peuplements en questions, mais tous les peuplements
ont des arbres assez âgés pour produire des graines (Robitaille et Roberge 1981). Le
site de COL qui est situé légèrement au sud des trois sites précédents a quant à lui une
grande quantité de jeunes semis de moins de 50 cm de hauteur. Ceci démontre que
dans les peuplements près de la limite nordique du bouleau jaune la production de
graines viables est possible certaines années. Toutefois même s'il a une quantité
importante de jeunes semis de moins de 50 cm, le site de COL ne compte aucun
semis de plus de 50 cm. Ceci pourrait indiquer une grande variabilité dans la
production de graines viables d'une année à l'autre selon les conditions climatiques
présentes durant la formation des graines. O'Donoghue (2004) a déjà démontré une
diminution de la production de graines de bouleau jaune avec l'augmentation de
64
l'altitude dans le New Hampshire ce qui pourrait indiquer une diminution de la
production de graines avec une diminution des températures. Un suivi sur quelques
années sur chaque site serait nécessaire pour voir si les données sur la production de
jeunes semis se maintiennent dans le temps ou est variable d'une année à l'autre. Il se
peut que la production de graines viables et l'établissement des jeunes semis soit
possibles aux moins certaines années mêmes jusqu'à la limite extrême nord de
distribution du bouleau jaune, mais que la fréquence des années d'échec de la
production de graines augmente vers le nord. Cette augmentation de la fréquence des
années d'échec de la production de graines a été observée chez 1 'érable à sucre et
l'érable rouge près de leur limite nordique (Tremblay et al. 2002; Graignic et al.
2013). Puisque le bouleau jaune est une espèce qui dépend d'une grande production
de graines pour profiter des petites perturbations ponctuelles dans le paysage, une
production moins stable et fréquente de graines le rend moins capable de profiter de
ces troués aléatoires avant que les autres espèces prennent le dessus.
Le succès reproducteur du bouleau jaune pourrait aussi être diminué par la sensibilité
des jeunes semis de bouleaux jaunes aux températures hivernales froides en raison de
leur moins grande tolérance au froid que les individus plus âgés. Nous n'avons pas
trouvé de relation significative entre l'abondance de semis et la latitude, mais les
quatre sites les plus au nord on seulement des jeunes semis de moins de 50 cm qui
sont probablement des semis de moins d'un an qui n 'ont pas encore passé un hiver.
On a peut-être atteint un point critique où les températures minimales extrêmes
causent une mortalité importante des semis. Calmé et al. (1994) a étudié la résistance
des semis de bouleau jaune aux températures hivernales froides. Les semis de
bouleaux jaunes ont eu un taux de survie de 100 % lors d'un hiver où les
températures ont atteint -33°C. Il faudrait faire une étude avec des températures allant
jusqu'à -50°C qui peuvent être présentes dans ce secteur (Environnement Canada
2008). On suggère que les semis ont une moins grande tolérance au froid que les
arbres matures (Sakai et Larcher 1987; Hoffman et al. 2014), mais les études sont
65
pour la plupart faites sur des semis de moins d'un an et il serait intéressant de savoir à
quel âge les semis atteignent une tolérance au froid similaire aux arbres matures.
Cette étude n'a pas permis de confirmer qu'un facteur climatique en particulier cause
la limite nordique du bouleau jaune, mais permet de cibler les facteurs qui ont le plus
de potentiel d'influencer cette limite. La limite extrême nord du bouleau jaune semble
causée par le faible succès reproducteur et non par les effets des températures froides
sur la croissance et la mortalité des arbres matures. Il faudrait cependant faire un suivi
à plus long terme de la production de graines et de survie des semis dans les
peuplements près de la limite nordique pour confirmer cette hypothèse.
L'abondance des peuplements de bouleaux jaunes dans le paysage diminue bien au
sud de sa limite nordique. Le changement dans cette abondance est reflété par la
transition entre le domaine de la sapinière à bouleau jaune et de la sapinière à bouleau
blanc qui est située plus de 50 km au sud du peuplement de bouleau jaune le plus
nordique connu. Il semble donc exister des facteurs qui limitent la prolifération des
peuplements de bouleau jaune dans le paysage avant d'atteindre sa limite nordique.
Nos résultats démontrent que les facteurs non climatiques, tel que l'âge moyen des
bouleaux jaunes (Mage_ BA), la quantité de débris ligneux (Deadwood et 1 'indice de
sécheresse du sol (SiteDindex), sont plus significatifs pour le succès reproducteur du
bouleau jaune que le climat. L'indice de sécheresse du sol qui a été développé pour
cette recherche prend en compte plusieurs caractéristiques du sol tel que l'épaisseur
de la couche organique, le pourcentage de sable, limon et argile dans 1 'horizon B et le
pourcentage de roches dans le sol minéral. En premier lieu, le lien positif trouvé entre
l' abondance de gaulis et l'indice de sécheresse du sol pourrait expliquer en partie
cette diminution de l'abondance des peuplements de bouleau jaune. La limite entre le
domaine de la sapinière à bouleau jaune et la sapinière à bouleau blanc correspond
environ à la limite sud de la grande ceinture d' argile créée par les lacs proglaciaires
Barlow et Ojibway. La dominance de dépôt argileux avec un faible indice de
66
sécheresse du sol (Fig 2.4) dans le domaine de la sapinière à bouleau blanc pourrait
donc être un facteur limitant pour la régénération du bouleau jaune dans ce secteur.
Le régime de perturbation change également entre le domaine de la sapinière à
bouleau jaune et celui de la sapinière à bouleau blanc. Les peuplements de bouleau
jaune semblent se limiter dans la majorité du territoire d'étude à des habitats refuges
qui n'ont pas été touchés par les plus récents feux sur le territoire. Cette déduction est
supportée par 1' âge moyen des bouleaux jaunes qui est plus élevé que 1 'âge du dernier
feu dans tous les peuplements répertoriés où les données de feu sont disponibles
(Table 2.4). Les recherches ont démontré que le bouleau jaune dépend beaucoup des
troués dans la canopée avec un niveau de lumière modérée pour un recrutement réussi
jusqu'à la canopée (White et al. 1985; Payette et al. 1990). Dans le domaine de la
sapinière a bouleau jaune, le régime de perturbation est caractérisé par des troués et
des feux peu fréquents d'intensité et de grandeur modérée (Grenier et al. 2005). Ce
type de régime de feu laisse une bonne quantité d'habitats non touchés ou les
bouleaux jaunes peuvent se régénérer et fournir une bonne source de graines au
paysage environnant. Dans le domaine de la sapinière à bouleau blanc, le régime de
perturbations est plutôt caractérisé par des feux plus grands et plus fréquents
(Boulanger et al. 2003 ). Ce type de régime de feu laisse moins de refuges non touchés
par le feu qui permettent la régénération du bouleau jaune dans les trouées. La
diminution de la quantité de sites propices à la régénération du bouleau relié à la
prédominance des sols argileux et au régime de feu présent dans le domaine de la
sapinière à bouleau blanc semble donc être un facteur important dans la diminution de
l'abondance des peuplements de bouleau jaune vers le nord.
D'un point de vue d'aménagement forestier, le bouleau jaune a donc le potentiel de
croitre efficacement à sa limite nordique. Il y a aurait donc un potentiel d'établir des
peuplements de bouleau jaune en plantant des semis qui sont déjà assez âgés pour
résister aux températures hivernales froides. Un facteur potentiellement limitant à la
67
régénération du bouleau jaune dans le nord de l'aire d'étude est le type de coupe
forestière effectué sur le territoire. Un effort pourrait être fait pour répertorier les
peuplements de bouleau jaune près de sa limite nordique et exiger des coupes
sélectives propices au bouleau jaune dans les secteurs avoisinants.
Même si nous n'avons pas trouvé d'effet significatif des températures sur la
croissance et le succès reproducteur du bouleau jaune, nos résultats semblent tout de
même porter certains indices d'un effet des températures sur la régénération dans les
sites les plus nordiques. Une étude plus exhaustive de la reproduction dans ces sites
pourrait avoir des résultats dans ce sens. Si un effet significatif des températures sur
la reproduction est trouvé dans les sites plus nordiques, le réchauffement climatique
actuel a le potentiel d'améliorer la régénération du bouleau en diminuant la fréquence
des gelés au printemps et à l'été et en diminuant la fréquence des températures froides
hivernales extrêmes qui semblent causer la mort des jeunes semis. Le réchauffement
climatique pourrait aussi occasionner une diminution de la fréquence des années avec
un échec dans la production de graines viables et d' établissement des jeunes semis.
Cette amélioration de la régénération pourrait augmenter la distribution du bouleau
jaune dans le paysage et permettre son établissement plus au nord. L'effet bénéfique
de l'augmentation de la température sur la régénération pourrait cependant être
diminué si l' augmentation des températures est accompagnée d'une augmentation de
l'indice de sécheresse en été. Certains modèles climatiques prévoient une
augmentation de 10 à 22 unités de l'indice de sécheresse dans le sud du Québec d'ici
la fin du siècle (Logan et al. 2011). Notre étude n'a pas trouvé d'effet significatif des
précipitations et de l' indice de sécheresse, mais ceci est probablement dû au fait que
toute notre aire d' étude était située dans une zone avec des précipitations relativement
abondantes. Les précipitations annuelles dans l'aire de répartition du bouleau jaune
varient de 1270 mm dans l'est et 640mm dans l'ouest (Erdmann 1990) alors que les
précipitations annuelles moyennes dans notre aire d' étude varient seulement entre
683 mm et 770 mm. L' augmentation de l' indice de sécheresse en été pourrait tout de
68
même augmenter le taux de mortalité des jeunes semis de bouleau jaune en raison de
leur faible tolérance à la sécheresse (Linteau 1948). La réponse du bouleau jaune au
réchauffement climatique pourrait également être affectée par son interaction avec le
régime de feu. Certaines études prédisent une augmentation de l'activité de feu dans
le futur (Flannigan et al. 2005; Bergeron et al. 2006) ce qui pourrait limiter la
présence du bouleau jaune dans le paysage et possiblement causer son retrait vers le
sud. Par contre si le réchauffement climatique cause une diminution de l 'activité de
feu par des précipitations plus abondantes, cela pourrait augmenter le succès
reproducteur du bouleau jaune et possiblement permettre son expansion vers le nord.
BIBLIOGRAPHIE POUR L'INTRODUCTION ET LA CONCLUSION GÉNÉRALE
Arris, L.L. et Eagleson, P.S. 1989. Evidence of a physiological basis for the borealdecidous forest ecotone in North America. Vegetatio 82: 55-58.
Baker, F.S. 1949. A revised tolerance table. Journal ofForestry 47: 179-181.
Bergeron, Y. et Brisson, J. 1990. Fire regime in red pine stands at the northern limit of the species range. Ecology 71: 1352-1364.
Bergeron, Y., Cyr, D., Drever, C.R., Flannigan, M., Gauthier, S., Kneeshaw, D., Lauzon, È., Leduc, A., Le Goff, H., Lesieur, D. , et Logan, K. 2006. Past, current, and future fire frequencies in Quebec's commercial forests: implications for the cumulative effects of harvesting and fire on age-class structure and natural disturbance-based management. Canadian Journal of Forest Research 36:2737-2744.
Bouchard, M., Kneeshaw, D., et Bergeron, Y. 2005. Mortality and stand renewal patterns following the last spruce budworm outbreak in mixed forests of western Quebec. Forest Ecology and Management 204: 297-313.
Boulanger, Y. , Gauthier, S., Gray, D.R., Le Goff, H., Lefort, P., et Morisette, J. 2013. Fire regime zonation under current and future climate over eastern Canada. Ecological Applications 23: 904-923.
Bradshaw, R., Kito, N., et Giesecke, T. 2010. Factors influencing the Holocene history ofFagus. Forest Ecology and Management 259:2204-2212.
Burns, R.N, et Honkala, B.H. 1990. Sylvics ofNorth America, Vols. 1 and 2. USDA Forest Agricultural Handbook. 654p.
Burton, D.H., Anderson, H.W., et Riley, L.F. 1969. Natural regeneration of yellow birch in Canada. Dans Proceedings, Birch Symposium. Northeastern Forest Experiment Station, Upper Darby, PA. pp. 55-73.
Calmé, S., Bigras, F.J., Margolis, H.A. , et Hébert, C. 1994. Frost tolerance and bud dormancy of container-grown yellow birch, red oak and sugar maple seedlings. Tree Physiology 14: 1313-1325.
70
Clausen, K.E., 1973. Genetics ofyellow birch. USDA Forest Service, Research Paper W0-18. Washington, DC. 28 p.
Collins, M., R. Knutti, J. Arblaster, J.-L. Dufresne, T. Fichefet, P. Friedlingstein, X. Gao, W.J. Gutowski, T. Johns, G. Krinner, M. Shongwe, C. Tebaldi, A.J. Weaver and M. Wehner. 2013. Long-term Climate Change: Projections, Commitments and Irreversibility. In: Climate Change 2013: The Physical Science Basis. Contribution of Working Group I to the Fifth Assessment Report of the Intergovernmental Panel on Climate Change [Stocker, T.F., D. Qin, G.-K. Platiner, M. Tignor, S.K. Allen, J. Boschung, A. Nauels, Y. Xia, V. Bex and P.M. Midgley (eds.)]. Cambridge University Press, Cambridge, United Kingdom and New York, NY, USA.
Crernaschi, M., Pelfini, M., et Santilli, M. 2006. Cupressus dupreziana : a dendroclimatic record for the middle-late Holocene in the Sahara. Holocene 16: 293-303.
Desponts, M. et Payette, S. 1992. Recent dynamics of jack pine at its northern distribution limit in northern Quebec. Canadian Journal of Botany 70: 1157-1167.
Environnement Canada. 2008. Normales climatiques au Canada 1971-2000. http:/ /climate.weather.gc.ca/climate ~ normals/normals ~documentation~ e.html? dociD=1971.
Erdmann, G.G. 1990. Yellow birch (Betula alleghaniensis Britton). Dans Sylvics of North America Vo1.2: Hardwoods. Agriculture Handbook 654. U.S. Department of Agriculture, Forest Service, Washington, DC. pp. 290-322.
Flannigan, M.D. et Bergeron, Y. 1998. Possible role of disturbance in shaping the northern distribution of Pi nus resinosa. Journal of Vegetation Science 9: 477-482.
Flannigan, M.D., Logan, K.A., Amiro, B.D., Skinner, W.R. et Stocks, B.D. 2005. Future area burned in Canada. Climatic Change 72: 1-16.
Flannigan, M.D. et Woodward, F.I. 1994. Red pine abundance: current climatic control and responses to future warming. Canadian Journal of Forest Research 24: 1166-1175.
Forcier, L.K. 1975. Reproductive strategies and the co-occurence of climax tree species. Science 189: 808-809.
Fritts, H.C. 1976. Tree rings and climate. Academie Press, New Y or k.
71
George, M.F., Burke, M.J., Pellet, H.M. , et Johnson, A.G. 1974. Low temperature exotherms and woody plant distribution. Hortscience 9: 519-522.
Gilbert, A.M. 1965. Yellow birch (Betula alleghaniensis Britton). Dans Sylvics of forest trees of the United States. U. S. Departement of Agriculture, Washington, DC. pp. 104-109.
Goodman, R.M. et Krefting, L. W. 1960. Factors important to yellow birch establishment in Upper Michigan. Ecology 41: 18-28.
Godmann, R.M. et Mattson, G.A. 1976. Seed crops and regeneration problems of 19 species in northeastem Wisconsin. Research Paper NC-123. USDA Forest Service, North Central Forest Experiment Station, St. Paul, MN.
Grace, J., Beminger, F., et Nagy, L. 2002. Impacts of climate change on the tree line. Annals ofBotany 90: 537-544.
Graignic, N., Tremblay, F et Bergeron, Y. 2014. Geographical vanatwn in reproductive capacity of sugar maple (Acer saccharum Marshall) northem peripheral populations. Journal of Biogeography. 41: 145-157.
Grenier, D.J. , Bergeron, Y., Kneeshaw, D., et Gauthier, S. Fire frequency for the transitional mixedwood forest of Temiskaming, Quebec, Canada. Can. J. For. Res. 35 : 656-666.
Gross, H.L. et Hamden, A.A. 1968. Dieback and abnormal growth of yellow birch induced by heavy fruiting. Information Report 0-X-79. Canadian Departement of Forestry, Forest Research Laboratory, Ontario Region, Sault Ste. Marie, ON.
Gusta, L.V., Tyler, N.J., et Chen, T.H.H. 1983 . Deep undercooling in woody plants growing north ofthe -40°C isotherm. Plant Physiology 72: 122-128.
Hatcher, R.J. 1966. Y ellow birch regeneration on scarified seedbeds under small canopy openings. Forestry Chronicle 42,350-358.
Hoffman, M., Jager, M., et Bruelheide, H. 2014. Relationship between frost hardiness of adults and seedling of different tree species. iForest 7: 282-288.
Houghton, J.T., Ding, Y., Griggs, D.J., Noguer, M., van der Linden, P.J., Xiaosu, D., Maskell, K., et Johnson, C.A. 2001. Climate change 2001: the scientific basis. Contribution of W orking Group I to the third assessment report of the
72
Intergovernmental Panel on Climate Change (IPCC). Cambridge University Press. Cambridge, UK.
Houle, G. et Payette, S. 1990. Seed dynamics of Betula alleghaniensis in a deciduous forest ofnorth-eastern North America. Journal ofEcology 78: 677-690.
Houle, G. 1992. The reproductive ecology of Abies balsamea, Acer saccharum et Betula alleghaniensis in the Tantaré Ecological Reserve, Québec. Journal of Ecology 80: 611-623.
Houle, G. 1994. Spatiotemporal patterns in the components of regeneration of four sympatric tree species-Acer rubrum, Acer saccharum, Betula alleghaniensis and Fagus grandifolia. Journal of Ecolo gy 82, 39-53.
Ishikawa, M. et Sakai, A. 1982. Characteristics of freezing avoidance in comparison with freezing tolerance: a demonstration of extraorgan freezing. In Plant Cold Hardiness and Freezing Stress: Mechanisms and crop implications, Vol. 2. Academie Press, New York. pp. 325-340.
Jackson, S.T. et Booth, R.K. 2002. The role of Late Holocene climate variability in the expansion of yellow birch in western Great Lakes. Diversity and Distributions 8, 275-284.
Kobe, R.K., Pacala, S.W., Silander, J.A.Jr., et Canham, C.D. 1995. Juvenile tree survivorship as a component of shade tolerance. Ecological Applications 5: 517-532.
Larocque, 1., Bergeron, Y., Campbell, I.D., and Bradshaw, R.H.W. 2000. Vegetation changes through time on islands of Lake Duparquet, Abitibi, Canada. Canadian Journal ofForest Research 30:179-190.
Linteau, A. 1948. Factors affecting germination and early survival of yellow birch (Betula lutea Michx.) in Québec. Forestry chronicle 24: 27-86.
Little, E.L. 1971. Atlas of United States trees, volume 4, minor Eastern hardwoods. Rep. Miscellaneous Publication 1342. U.S. Department of Agriculture. 17p. , 230 maps.
Logan, K. T. 1965. Growth of tree seedlings as affected by light intensity 1. White birch, yellow birch, suger maple and silver maple. Publication 1121. Departement ofForestry of Canada, Ottawa, Canada.
73
Logan, T., Charron, 1., Chaumont, D., et Houle, D. 2011. Atlas des scénarios climatiques pour la forêt québecoise. Ouranos et MRNF. 55p +annexes.
Marchand, D. 1987. Life in the cold: an introduction to winter ecology. Univ. Press ofNew England, Hanover, N.H.
Martin, N. D. 1959. An anaylsis of forest succession in Algonquin Park, Ontario. Ecological Monographs. 29(3): 187-218.
Meilleur, A., Brisson, J., et Bouchard, A. 1997. Ecological analyses of the northernmost population of pitch pine (Pinus rigida). Canadian Journal of Forest Research 27: 1342-1350.
Miller, P.A., Giesecke, T. , Hickler, T., Bradshaw, R.H.W., Smith, B. , Seppa, H. , Valdes, P.J., et Sykes, M.T. 2008. Exploring climatic and biotic controls on Holocene vegetation change in Fennoscandia. Journal of Ecolo gy 96:247-259.
O'Donoghue, B. 2004. Seed germination and seedling survival of balsam fir, hearthleafed paper birch, yellow birch, and red spruce along an elevation gradient on Mt. Moosilauke, NH. Master's Thesis. Antioch New England Graduate School.
Payette, S., Fillion, L., et Delwaide, A. 1990. Disturbance regime of cold temperate forest as deduced from tree-ring patterns - the Tantare ecological reserve, Quebec, Canadian Journal of Forest Research 20: 1228-1241.
Payette, S. et Lajeunesse, R. 1980. Les combes a neiges de la rivière aux Feuilles (Nouveau-Québec): indicateurs paléoclimatiques holocène. Géographie physique et Quaternaire 34: 209-220.
Pederson, N., Cook, E.R., Jacoby, G.C., Peteet, D.M., et Griffin, K.L. 2004. The influence of winter temperatures on the annual radial growth of six northern range margin tree species. Dendrochronologia 22: 7-29.
Perala, D.A. 1974. Growth and survival of northern hardwood sprouts after burning. Research Note NC-176. USDA Forest Service, North Central Forest Experiment Station, St. Paul, MN.
Perala, D. A. 1987. Regenerating the birches: ecology and cultural requirements. St. Paul, MI: University of Minnesota. 215 p. Thesis.
Perala, D.A. et Alm, A.A. 1990. Reproduction Ecology of Birch: A Review. Forest Ecology and Management 32: 1-38.
74
Pigott, C.D. et Huntley, J.P. 1980. Factors controlling the distribution of Tilia cordata at the northern limits of its geographical range. II. History in north-west England. New Phytologist 84: 145-164.
Post, B.W., Carmean, W.H., et Curtis, R.O. 1969. Birch soil-site requirements. Dans Proceedings, Birch Symposium. USDA Forest Service. Northeastern Forest Experiment Station, Upper Darby, PA. pp. 95-101.
Robitaille, L. et Roberge, M. 1981. La sylviculture du bouleau jaune au Québec. Revue forestière française 33: 105-112.
Ruel, J.-C., Lousteau, D., et Pineau, M. 1988. Relations entre la microtopographie, les caractéristiques de la couverture morte et la répartition des essences dans un érablière a bouleau jaune. Canadian Journal of Forest Research 18: 1196-1202.
Sakai, A. 1970. Freezing resistance in willows from different climates. Ecolo gy 51: 485-491.
Sakai, A. et Larcher, W. 1987. Frost survival of plants. Springer Verlag, Berlin.
Sakai, A. et Weiser, C.J. 1973. Freezing resistance of trees in North America with reference to tree regions. Ecology 54: 118-126.
Sperry, J.S., Nichols, K.L., Sullivan, J.E.M. , Eaststalk, S.E.l994. Xylem embolism in ring-porous, diffuse-porous, and coniferous trees of northern Utah and interior Alaska. Ecology 75: 1736-1752.
Solomon, D. S. et Blum, B. M. 1967. Stump sprouting of four northern hardwoods. Research Paper NE-79. U.S Departement of Agriculture, Forest Service, Northeastern Forest Experiment Station, Upper Darby, PA.
Solomon, D.S. et Leak, W.B. 2002. Modeling the regeneration ofnorthern hardwoods with FOREGEN. Research paper NE-719. U.S. Departement of Agriculture. Forest Service. Northern Forest Experiment Station, Newton Square, PA.
Tardif, J. , Brisson, J., et Bergeron, Y. 2001. Dendroclimatic analysis of Acer saccharum, Fagus grandifolia, and Tsuga canadensis from an old-growth forest, southwestern Québec. Canadian Journal of Forest Research 31: 1491-1501.
75
Tremblay, F., Bergeron, Y., Lalonde, D., et Maufette, Y. 2002. The potential effects of sexual reproduction and seedling recruitment on the maintenance of red maple (Acer rubrum L.) populations at the northern limit of the species range. Journal of Biogeography 29: 363-373.
Tubbs, C.H. 1969. The influence of light, moisture, and seedbed on yellow birch regeneration. Research paper NC-27. USDA Forest Service, North Central Forest Experiment Station, St. Paul, MN.
White, P.S., MacKenzie, M.D., et Busing, R.T. 1985. Natural disturbance and gap phase dynamics in southern Appalachian forests. Grand Forks, ND USA.
Winget, C.H. et Kozlowski, T.T. 1965. Yellow birch germination and seedling growth. Forest Science 11: 386-392.
Woodhouse, C.A. et Meko, D. 1997. Number of winter prec1p1tation days reconstructed from southwestern tree rings. Journal ofClimate 10: 2663-2669.
Woodward, F.I. 1987. Climate and plant distribution. Cambridge University Press, Cambridge, UK.
Woodward, F.I. 1990. The impact oflowtemperatures in controllingthe geographical distribution of plants. Philosophical Transactions of the Royal Society of London B : Biological Sciences 326: 585-593.