Embed Size (px)
Citation preview
Fast structural responses of gap junction membranedomains to AB5 toxinsIrina V. Majoula,1, Liang Gaob, Eric Betzigb, Daria Onichtchoukc, Eugenia Butkevichd, Yuri Kozlove, Feliksas Bukauskasf,Michael V. L. Bennettf, Jennifer Lippincott-Schwartzg,1, and Rainer Dudena,1
aInstitute of Biology, Center for Structural and Cell Biology in Medicine, University of Lübeck, 23562 Lübeck, Germany; bJanelia Farm Research Campus,Howard Hughes Medical Institute, Ashburn, VA 20147; cCenter for Biological Signaling Studies, Albert Ludwigs University, 79104 Freiburg, Germany;dDrittes Physikalisches Institut, Biophysik, Georg-August-Universität, 37077 Göttingen, Germany; eV.A. Engelhardt Institute for Molecular Biology, RussianAcademy of Sciences, Moscow 119991, Russia; fDominick P. Purpura Department of Neuroscience, Albert Einstein College of Medicine, Bronx, NY 10461;and gEunice Kennedy Shriver National Institute of Child Health and Human Development, National Institutes of Health, Bethesda, MD 20892
Contributed by Jennifer Lippincott-Schwartz, September 9, 2013 (sent for review June 20, 2013)
Gap junctions (GJs) represent connexin-rich membrane domainsthat connect interiors of adjoining cells in mammalian tissues. Howfast GJs can respond to bacterial pathogens has not been knownpreviously. Using Bessel beam plane illumination and confocalspinning disk microscopy, we found fast (∼500 ms) formation ofconnexin-depleted regions (CDRs) inside GJ plaques between cellsexposed to AB5 toxins. CDR formation appears as a fast redistri-bution of connexin channels within GJ plaques with minor changesin outline or geometry. CDR formation does not depend on mem-brane trafficking or submembrane cytoskeleton and has no effecton GJ conductance. However, CDR responses depend on membranelipids, can be modified by cholesterol-clustering agents and extra-cellular K+ ion concentration, and influence cAMP signaling. TheCDR response of GJ plaques to bacterial toxins is a phenomenonobserved for all tested connexin isoforms. Through signaling, theCDR response may enable cells to sense exposure to AB5 toxins.CDR formation may reflect lipid-phase separation events in thebiological membrane of the GJ plaque, leading to increased con-nexin packing and lipid reorganization. Our data demonstrate veryfast dynamics (in the millisecond-to-second range) within GJ pla-ques, which previously were considered to be relatively stable,long-lived structures.
membrane traffic | connexin actin | cell–cell junctions | cholesterol
Highly permeable biological membrane domains composed ofassemblies of connexin channels form gap junction (GJ)
plaques at cell–cell interfaces (1–3). The cell–cell connectivityprovided by GJs helps individual cells integrate functionally intotissues via electrical coupling (4, 5) and diffusion of signalingmolecules and metabolites (6, 7). GJs critically determine per-meability to Ca2+, cAMP, cGMP, IP3, glutathione, and othermetabolites smaller than 1.5 kDa (6, 8, 9). Formation of GJsrequires vesicular transport and in some cases Golgi-dependentposttranslational modifications of connexins (10). GJ turnoverinvolves endocytosis and proteasomal/lysosomal degradation(11–14). During infection and under stress conditions the level ofsignaling molecules is elevated dramatically, and how signalingvia GJs is modulated between affected cells remains unclear.High-speed live-cell microscopy revealed early responses of
GJ plaques to purified AB5 toxins normally released by thehuman pathogens Vibrio cholerae, Shigella dysenteriae, and entero-hemorrhagic Escherichia coli (EHEC). In this study we usedboth Bessel beam plane illumination microscopy (15) and spin-ning disk confocal microscopy. Because GJ responses are rapid,and because GJ plaques often are curved, the high-speed andnear-isotropic 3D resolution (∼300 nm) of Bessel beam plane illu-mination microscopy was beneficial in revealing the responses in4D spatiotemporal detail. (The experimental setup is shown inFig. 1 A and B; also see SI Appendix, Fig. S1. For further details,see ref. 15.)To study GJ responses, we applied purified fluorescently la-
beled AB5 toxins, namely cholera toxin (CTX), Shiga toxin type
1 (STx1), or Shiga toxin type 2 (STx2, also known as Vero-toxinand released by EHEC bacteria), according to protocols we havedescribed previously (16–18). CTX and STx1 both consist ofa homopentameric B-subunit and a catalytic A-subunit (fora schematic structure see Fig. 1C). The five identical B-subunitsare responsible for binding to the plasma membrane via specificglycosphingolipids [CTX binds to monosialotetrahexosylganglio-side (GM1), and STx1 to globotriaosylceramide (Gb3)]. For eachmolecule of CTX or STx1, several glycosphingolipid moleculescan be bound at the same time (up to 15 molecules of Gb3 forSTx1), and thus these toxins have the potential to induce lipidreorganization (19). As a model system, we used Vero cells(African green monkey kidney fibroblasts) and HeLa cells (a hu-man cervical carcinoma cell line) transfected with different fluo-rescently tagged connexin isoforms, as described earlier (20, 21).Optical sectioning using Bessel beam plane illumination mi-
croscopy operating in structured illumination mode (BesselOS-SIM) (15) at an acquisition speed of approximately one 3Dvolume stack/20 s revealed dramatic responses of GJ plaques toAB5 toxins. Strikingly, application of CTX to Vero cells coupledby fluorescently labeled connexin isoform 30 (Cx30-EGFP) GJsrapidly induced regions within the GJ plaque that were depletedof Cx30-EGFP fluorescence (hereafter referred to as transientconnexin-depleted regions, tCDRs) (Fig. 1 D–I, SI Appendix, Fig.
Significance
We used 3D Bessel beam plane illumination and spinning diskmicroscopy to reveal fast structural changes in the architectureof gap junctions (GJs). Previously, GJ plaques were consideredrelatively stable structures. We demonstrate extremely rapidremodeling of proteins and lipids within GJ plaques in responseto bacterial toxin exposure. Connexin channels within GJ pla-ques undergo dramatic rearrangements that lead to increasedconnexin packing and lipid reorganization. These changeslikely reflect lipid-phase separation events in the biologicalmembrane. Toxin-induced connexin reorganization depends onlipids and is little modified by membrane–cytoskeletal inter-actions. We suggest that fast GJ changes upon toxin exposurereveal an early-response system of cells and that GJ plaques aremuch more dynamic structures than previously recognized.
Author contributions: I.V.M., F.B., and R.D. designed research; I.V.M., L.G., F.B., and R.D.performed research; I.V.M., L.G., E. Betzig, D.O., E. Butkevich, Y.K., F.B., and J.L.-S. con-tributed new reagents/analytic tools; I.V.M., L.G., E. Betzig, D.O., E. Butkevich, Y.K., F.B.,M.V.L.B., J.L.-S., and R.D. analyzed data; and I.V.M., D.O., F.B., M.V.L.B., J.L.-S., and R.D.wrote the paper.
The authors declare no conflict of interest.
Freely available online through the PNAS open access option.1To whom correspondence may be addressed. E-mail: [email protected],[email protected], or [email protected].
This article contains supporting information online at www.pnas.org/lookup/suppl/doi:10.1073/pnas.1315850110/-/DCSupplemental.
www.pnas.org/cgi/doi/10.1073/pnas.1315850110 PNAS Early Edition | 1 of 9
CELL
BIOLO
GY
PNASPL
US
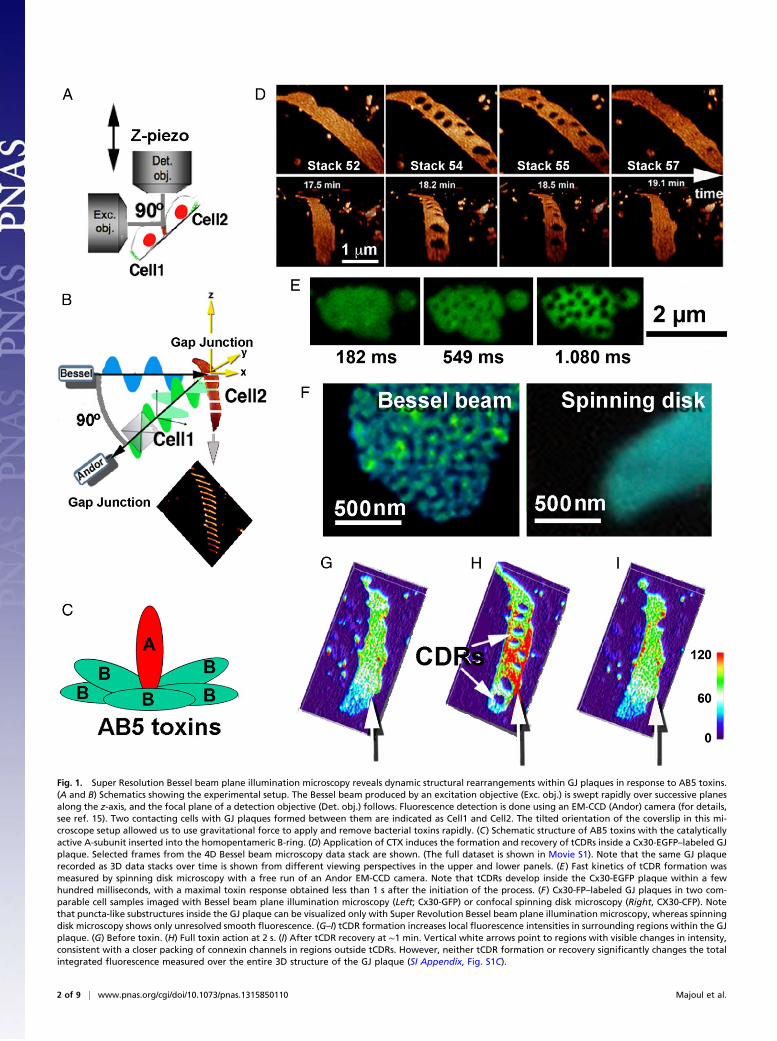
Fig. 1. Super Resolution Bessel beam plane illumination microscopy reveals dynamic structural rearrangements within GJ plaques in response to AB5 toxins.(A and B) Schematics showing the experimental setup. The Bessel beam produced by an excitation objective (Exc. obj.) is swept rapidly over successive planesalong the z-axis, and the focal plane of a detection objective (Det. obj.) follows. Fluorescence detection is done using an EM-CCD (Andor) camera (for details,see ref. 15). Two contacting cells with GJ plaques formed between them are indicated as Cell1 and Cell2. The tilted orientation of the coverslip in this mi-croscope setup allowed us to use gravitational force to apply and remove bacterial toxins rapidly. (C) Schematic structure of AB5 toxins with the catalyticallyactive A-subunit inserted into the homopentameric B-ring. (D) Application of CTX induces the formation and recovery of tCDRs inside a Cx30-EGFP–labeled GJplaque. Selected frames from the 4D Bessel beam microscopy data stack are shown. (The full dataset is shown in Movie S1). Note that the same GJ plaquerecorded as 3D data stacks over time is shown from different viewing perspectives in the upper and lower panels. (E) Fast kinetics of tCDR formation wasmeasured by spinning disk microscopy with a free run of an Andor EM-CCD camera. Note that tCDRs develop inside the Cx30-EGFP plaque within a fewhundred milliseconds, with a maximal toxin response obtained less than 1 s after the initiation of the process. (F) Cx30-FP–labeled GJ plaques in two com-parable cell samples imaged with Bessel beam plane illumination microscopy (Left; Cx30-GFP) or confocal spinning disk microscopy (Right, CX30-CFP). Notethat puncta-like substructures inside the GJ plaque can be visualized only with Super Revolution Bessel beam plane illumination microscopy, whereas spinningdisk microscopy shows only unresolved smooth fluorescence. (G–I) tCDR formation increases local fluorescence intensities in surrounding regions within the GJplaque. (G) Before toxin. (H) Full toxin action at 2 s. (I) After tCDR recovery at ∼1 min. Vertical white arrows point to regions with visible changes in intensity,consistent with a closer packing of connexin channels in regions outside tCDRs. However, neither tCDR formation or recovery significantly changes the totalintegrated fluorescence measured over the entire 3D structure of the GJ plaque (SI Appendix, Fig. S1C).
2 of 9 | www.pnas.org/cgi/doi/10.1073/pnas.1315850110 Majoul et al.
S2, and Movies S1–S3). tCDRs were approximately circular andreached maximum size within a few hundred milliseconds afterthe beginning of the process, as recorded with fast spinning diskmicroscopy (Fig. 1E, SI Appendix, Fig. S2, and Movie S5). Incontrast to the smooth fluorescence of GJ plaques observed withspinning disk microscopy (Fig. 1F, Right; also see Fig. 3), the
superior resolution of Bessel beam microscopy in structured il-lumination mode clearly demonstrated dynamic substructures(i.e., puncta) that may represent clusters of connexin channelsthat move within the plane of the GJ plaque (Fig. 1F, Left, Fig. 2,and Movie S2). Local fluctuations in fluorescence intensityappeared in accord with newly formed tCDRs. Fluorescence
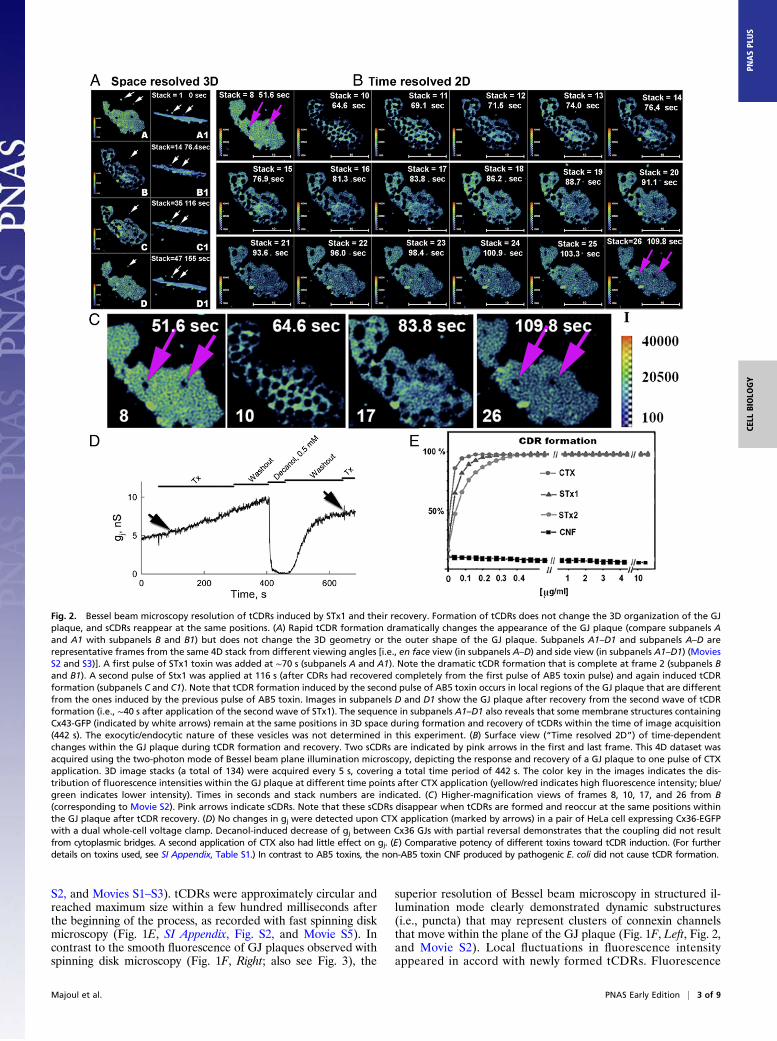
Fig. 2. Bessel beam microscopy resolution of tCDRs induced by STx1 and their recovery. Formation of tCDRs does not change the 3D organization of the GJplaque, and sCDRs reappear at the same positions. (A) Rapid tCDR formation dramatically changes the appearance of the GJ plaque (compare subpanels Aand A1 with subpanels B and B1) but does not change the 3D geometry or the outer shape of the GJ plaque. Subpanels A1–D1 and subpanels A–D arerepresentative frames from the same 4D stack from different viewing angles [i.e., en face view (in subpanels A–D) and side view (in subpanels A1–D1) (MoviesS2 and S3)]. A first pulse of STx1 toxin was added at ∼70 s (subpanels A and A1). Note the dramatic tCDR formation that is complete at frame 2 (subpanels Band B1). A second pulse of Stx1 was applied at 116 s (after CDRs had recovered completely from the first pulse of AB5 toxin pulse) and again induced tCDRformation (subpanels C and C1). Note that tCDR formation induced by the second pulse of AB5 toxin occurs in local regions of the GJ plaque that are differentfrom the ones induced by the previous pulse of AB5 toxin. Images in subpanels D and D1 show the GJ plaque after recovery from the second wave of tCDRformation (i.e., ∼40 s after application of the second wave of STx1). The sequence in subpanels A1–D1 also reveals that some membrane structures containingCx43-GFP (indicated by white arrows) remain at the same positions in 3D space during formation and recovery of tCDRs within the time of image acquisition(442 s). The exocytic/endocytic nature of these vesicles was not determined in this experiment. (B) Surface view (“Time resolved 2D”) of time-dependentchanges within the GJ plaque during tCDR formation and recovery. Two sCDRs are indicated by pink arrows in the first and last frame. This 4D dataset wasacquired using the two-photon mode of Bessel beam plane illumination microscopy, depicting the response and recovery of a GJ plaque to one pulse of CTXapplication. 3D image stacks (a total of 134) were acquired every 5 s, covering a total time period of 442 s. The color key in the images indicates the dis-tribution of fluorescence intensities within the GJ plaque at different time points after CTX application (yellow/red indicates high fluorescence intensity; blue/green indicates lower intensity). Times in seconds and stack numbers are indicated. (C) Higher-magnification views of frames 8, 10, 17, and 26 from B(corresponding to Movie S2). Pink arrows indicate sCDRs. Note that these sCDRs disappear when tCDRs are formed and reoccur at the same positions withinthe GJ plaque after tCDR recovery. (D) No changes in gj were detected upon CTX application (marked by arrows) in a pair of HeLa cell expressing Cx36-EGFPwith a dual whole-cell voltage clamp. Decanol-induced decrease of gj between Cx36 GJs with partial reversal demonstrates that the coupling did not resultfrom cytoplasmic bridges. A second application of CTX also had little effect on gj. (E) Comparative potency of different toxins toward tCDR induction. (For furtherdetails on toxins used, see SI Appendix, Table S1.) In contrast to AB5 toxins, the non-AB5 toxin CNF produced by pathogenic E. coli did not cause tCDR formation.
Majoul et al. PNAS Early Edition | 3 of 9
CELL
BIOLO
GY
PNASPL
US
intensity was increased locally in the regions surrounding tCDRs(compare Fig. 1 G and H; see white vertical arrows). Washout of
the toxin induced recovery of tCDRs within seconds to minutes,and the distribution of fluorescence intensity became homoge-
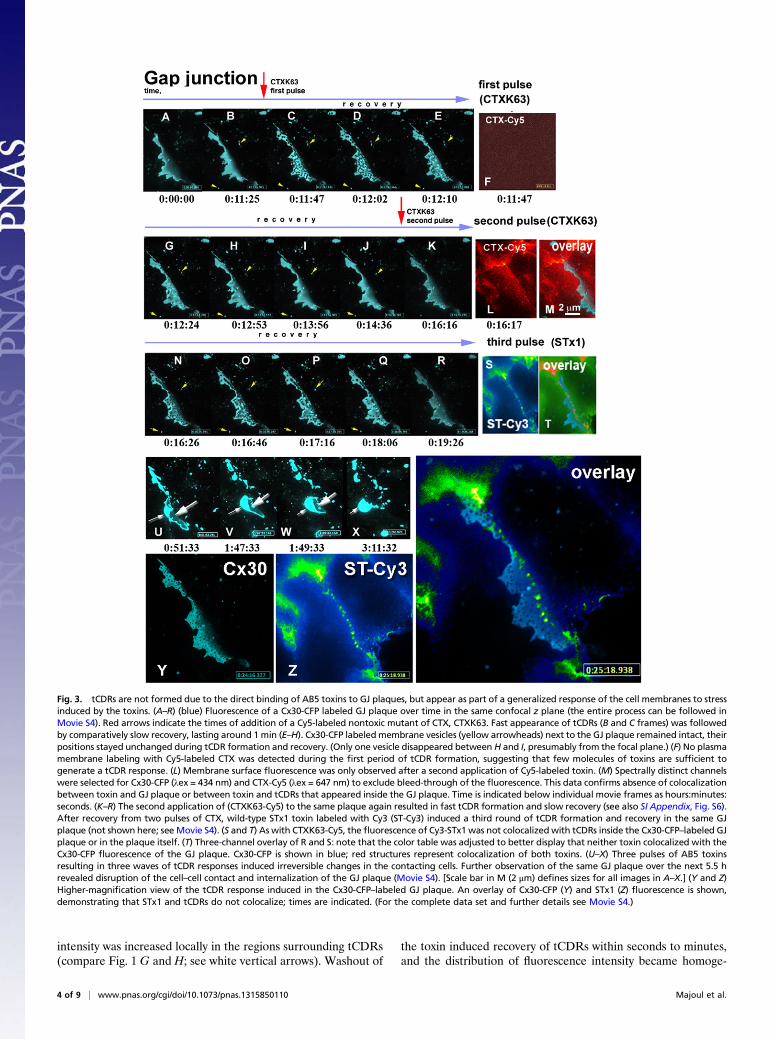
Fig. 3. tCDRs are not formed due to the direct binding of AB5 toxins to GJ plaques, but appear as part of a generalized response of the cell membranes to stressinduced by the toxins. (A–R) (blue) Fluorescence of a Cx30-CFP labeled GJ plaque over time in the same confocal z plane (the entire process can be followed inMovie S4). Red arrows indicate the times of addition of a Cy5-labeled nontoxic mutant of CTX, CTXK63. Fast appearance of tCDRs (B and C frames) was followedby comparatively slow recovery, lasting around 1 min (E–H). Cx30-CFP labeledmembrane vesicles (yellow arrowheads) next to the GJ plaque remained intact, theirpositions stayed unchanged during tCDR formation and recovery. (Only one vesicle disappeared between H and I, presumably from the focal plane.) (F) No plasmamembrane labeling with Cy5-labeled CTX was detected during the first period of tCDR formation, suggesting that few molecules of toxins are sufficient togenerate a tCDR response. (L) Membrane surface fluorescence was only observed after a second application of Cy5-labeled toxin. (M) Spectrally distinct channelswere selected for Cx30-CFP (λex = 434 nm) and CTX-Cy5 (λex = 647 nm) to exclude bleed-through of the fluorescence. This data confirms absence of colocalizationbetween toxin and GJ plaque or between toxin and tCDRs that appeared inside the GJ plaque. Time is indicated below individual movie frames as hours:minutes:seconds. (K–R) The second application of (CTXK63-Cy5) to the same plaque again resulted in fast tCDR formation and slow recovery (see also SI Appendix, Fig. S6).After recovery from two pulses of CTX, wild-type STx1 toxin labeled with Cy3 (ST-Cy3) induced a third round of tCDR formation and recovery in the same GJplaque (not shown here; see Movie S4). (S and T) As with CTXK63-Cy5, the fluorescence of Cy3-STx1 was not colocalizedwith tCDRs inside the Cx30-CFP–labeled GJplaque or in the plaque itself. (T) Three-channel overlay of R and S: note that the color table was adjusted to better display that neither toxin colocalized with theCx30-CFP fluorescence of the GJ plaque. Cx30-CFP is shown in blue; red structures represent colocalization of both toxins. (U–X) Three pulses of AB5 toxinsresulting in three waves of tCDR responses induced irreversible changes in the contacting cells. Further observation of the same GJ plaque over the next 5.5 hrevealed disruption of the cell–cell contact and internalization of the GJ plaque (Movie S4). [Scale bar in M (2 μm) defines sizes for all images in A–X.] (Y and Z)Higher-magnification view of the tCDR response induced in the Cx30-CFP–labeled GJ plaque. An overlay of Cx30-CFP (Y) and STx1 (Z) fluorescence is shown,demonstrating that STx1 and tCDRs do not colocalize; times are indicated. (For the complete data set and further details see Movie S4.)
4 of 9 | www.pnas.org/cgi/doi/10.1073/pnas.1315850110 Majoul et al.
nous again (compare Fig. 1 H and I). During these processes thesize and outline of the GJ plaque remained very much the same,and the overall fluorescence, as recorded with 3D image stacks,did not change significantly (SI Appendix, Fig. S1C).We tested whether tCDR formation and/or recovery induces
changes in the 3D organization of the GJ plaque and whethereither event is accompanied by the delivery of new membranematerial from the interior of the contacting cells. To do so, wemonitored Cx36-EGFP–labeled GJ plaques upon application ofSTx1 in 4D using the two-photon mode of Bessel beam planeillumination microscopy (Fig. 2 A and B and Movies S2 and S3).We observed that the 3D organization of the GJ plaque changedvery little during the dramatic tCDR formation and recovery,even after two pulses of AB5 toxin treatment (Fig. 2A: compareen face views in subpanels A–D with side views in subpanels A1–D1). During the formation or recovery of tCDRs, membranevesicles labeled with Cx36-EFGP (some are indicated by whitearrows) did not change positions relative to the GJ plaque, in-dicating that they did not contribute to either event. However,whether vesicle-trafficking events/machineries have a role in thefast dynamics of GJ plaques induced by AB5 toxin will requirefurther study in future experiments.Given that local fluorescence increases in the regions sur-
rounding tCDRs during tCDR formation and decreases upontCDR recovery (Fig. 1 G–I), we hypothesize that tCDRs areformed by the migration of channels out of the forming tCDRsinto neighboring regions within the GJ plaque, resulting in denserclustering of connexins in these regions. Remarkably, the size andshape of theGJ plaque did not change during tCDR formation andrecovery (Fig. 2 A and B). When GJ plaques harbored preexistingstationary CDRs (sCDRs), they reappeared at the same positionsin the plaque upon recovery of toxin-induced tCDRs (Fig. 2 B andC, pink arrows on the first and the last image of the sequence,respectively). sCDRs have been observed previously by Falk et al.(22) and referred to as “circular nonfluorescent domains,” whichcan persist for hours and finally may be expelled at GJ plaqueedges. In this study, we observed that formation of long-livedsCDRs can be induced in response to lipid-acting chemical agentssuch as octanol and dimethylformamide (SI Appendix, Fig. S3).Thus, at least two different types of CDRs are found in GJ pla-ques: toxin-induced tCDRs and sCDRs, showing that GJ plaquesare much more pliable membrane domains than previously as-sumed, even on very fast time scales as we present here.Application of two different members of the AB5 toxin family,
namely CTX (Figs. 1 and 2), and STx1 (Fig. 3), each inducedvery fast tCDR formation in GJ plaques in cells expressingconnexins labeled with fluorescent proteins. However, applica-tion of a non-AB5 family toxin produced by Escherichia coli,namely cytotoxic necrotizing factor 1 (CNF), did not inducea CDR response (Fig. 2E, and SI Appendix, Table S1). Thus,toxin-induced tCDRs represent a unique way in which GJ pla-ques respond to AB5 toxins. The generalized response of theentire GJ plaque to AB5 toxins is likely to involve the rear-rangement of membrane lipids and phase separation eventswithin the membrane (for discussion, see ref. 23). Further, tCDRformation appears to be accompanied by a change in the packingdensity of connexin channels within the GJ plaque.We wished to determine whether tCDR responses induced by
AB5 toxins in GJ plaques affect junctional conductance (gj). Wecombined dual patch-clamp recording to measure gj in cellsexpressing Cx36-EGFP (24) with fluorescence imaging duringtoxin application (Fig. 2D and SI Appendix, Fig. S5). Contrary toour expectation, gj did not change during formation of tCDRsand their recovery (Fig. 2D and SI Appendix, Fig. S5). Largelyreversible GJ uncoupling induced by decanol (0.5 mM) confirmedthat, for the same pair of cells, the measured gj indeed derivedfrom GJs and not from cytoplasmic bridges. An absence of changesin GJ electrical conductance upon application of AB5 toxins also
was observed in cells expressing the fluorescently labeled connexinisoforms Cx43-EGFP or Cx47-EGFP (SI Appendix, Fig. S5). Elec-trophysiological data were replicated with different connexin iso-forms (SI Appendix, Table S1) and confirmed the stability ofintercellular coupling during the initial phases of AB5 toxin appli-cation and tCDR formation.We further tested whether application of AB5 toxins induced
changes in intracellular calcium, using fluorescent imaging with theindicator dye Fluo-4. We did not observe any immediate responses(i.e., on the fast time scale equal to tCDR formation); instead, werecorded relatively slow increases in intracellular calcium over time(within 20–30 s) upon repeated AB5 toxin treatments (SI Appen-dix, Fig. S7).To analyze with higher time resolution the kinetics of fast
responses of GJ plaques to repeated application of AB5 toxins,we used fast switching of three laser lines combined in a spinningdisk confocal microscopy setup (Fig. 3 and Movie S4). To ex-plore whether AB5 toxins are localized physically within newlyformed tCDRs. we sequentially applied toxins labeled with dif-ferent dyes, with colors complementary to CFP-tagged con-nexins. STx1-Cy3 or CTX-Cy5 (with both the A- and B-subunitslabeled) were applied to cells coupled by Cx30-CFP GJ plaques(Fig. 3). The first application of a nontoxic point mutant variantof CTX, CTXK63 (described by us in refs. 16 and 17), resulted inrapid and dramatic formation of tCDRs (Fig. 3 A–E). We useda laser switch to correlate CDR formation with the speed ofimmobilization of labeled toxin on the plasma membrane. Toour surprise the first tCDRs appeared much faster than we wereable to detect any fluorescence of immobilized toxin anywhereon the cell membrane (compare Fig. 3 C and F). After tCDRrecovery (Fig. 3 G–J) a second pulse of CTXK63 again causedtCDR formation (Fig. 3K). At this time point we could see toxinimmobilized on the plasma membrane (Fig. 3L). However, toxinfluorescence did not colocalize with the tCDRs formed in the GJplaque at any time (Fig. 3 K andM, overlay and SI Appendix, Fig.S6). For the third pulse of toxin we used another member of theAB5 family, STx1 (Fig. 3 N–S and overlay in T). Again, nocolocalization between tCDRs and toxin was detected. Theseresults are clearly visible at high magnification (Fig. 3 Y and Zand the accompanying two-channel overlay).To test possible cellular factors involved in the tCDR re-
sponse, we destroyed the submembrane cytoskeleton by depo-lymerizing actin with the drug latrunculin A. Disassembly of theactin-containing submembrane cytoskeleton did not prevent theAB5 toxin-induced formation of tCDRs (data for STx1 areshown in SI Appendix, Fig. S4), which occurred with kinetics verysimilar to those in untreated cells. However, unlike GJ plaques inuntreated cells, the geometry of the GJ plaques in cells treatedwith latrunculin A changed dramatically upon the applicationof AB5 toxin (SI Appendix, Fig. S4 D–J). Additionally, the re-markable reappearance of sCDRs at the same positions in GJplaques after tCDR recovery reported here (Figs. 2 and 3) alsodemonstrates that GJ plaque geometry in cells is stable againstperturbations occurring within the plaque membrane. Actin is aprominent component in near proximity to GJ plaques, as hasbeen shown by EM studies in eye lens cells (25). We previouslydemonstrated a stabilizing role of the actin-binding protein dre-brin for GJ plaques (20). We suggest here that GJ plaque size andshape are stabilized and changed in an actin/drebrin-dependentmanner by the underlying submembrane cytoskeleton.To test further whether tCDR formation somehow may affect
GJ-mediated cell–cell signaling, we transfected cells with theFRET-based cAMP Epac sensor system first introduced byPonsioen et al. (26). For a fast CFP-YFP–based FRET readoutin living cells forming GJ contacts, we used an Optosplit system(SI Appendix, Figs. S8–S12). We observed that, in contrast tononcoupled cells, two cells coupled by GJ contacts displayedsynchronous changes in cAMP fluctuations over time (SI Ap-
Majoul et al. PNAS Early Edition | 5 of 9
CELL
BIOLO
GY
PNASPL
US
pendix, Fig. S12). We found that with two or three applications ofAB5 toxin, each resulting in tCDR formation (Fig. 3 A–R, MovieS1 acquired with Bessel beam microscopy, and Movie S4 ac-quired with spinning disk confocal microcopy), cells that ini-tially were coupled by GJs lost synchrony in cAMP oscillations.Temporally resolved live-cell imaging of cells that initially werecoupled by GJs revealed that repeated exposure to AB5 toxinsresulted in the loss of synchronicity in cAMP oscillations (SIAppendix, Fig. S12). This loss of synchronicity (which may bepreceeded by decrease in junctional conductance) often wasfollowed by physical removal (i.e., internalization) of parts of orthe entire GJ plaque from the cell–cell interface (Fig. 3 U–X andthe corresponding frames in Movie S4). Internalization occurredthrough the invagination of the plasma membrane, presumably byclathrin-mediated endocytosis as described by the Falk group(27). After several rounds of tCDR formation induced by AB5toxins, the irreversible changes resulted in cell death. Cell deathinduced by the disruption of lipid raft and microdomain signaling atthe plasma membrane recently has been recognized and docu-mented by other groups (23, 28, 29).Slow changes in connexin density inside the GJ plaques have
been documented in freeze-fracture EM studies during chick lenscell differentiation (30). Developmental changes in GJ plaques areattributed to changes in the relative abundance of cholesterol, themain component of lipid rafts, and similar changes were inducedin GJs upon experimental depletion of cholesterol (30). Becauseof the absence of colocalization between AB5 toxins at the plasma
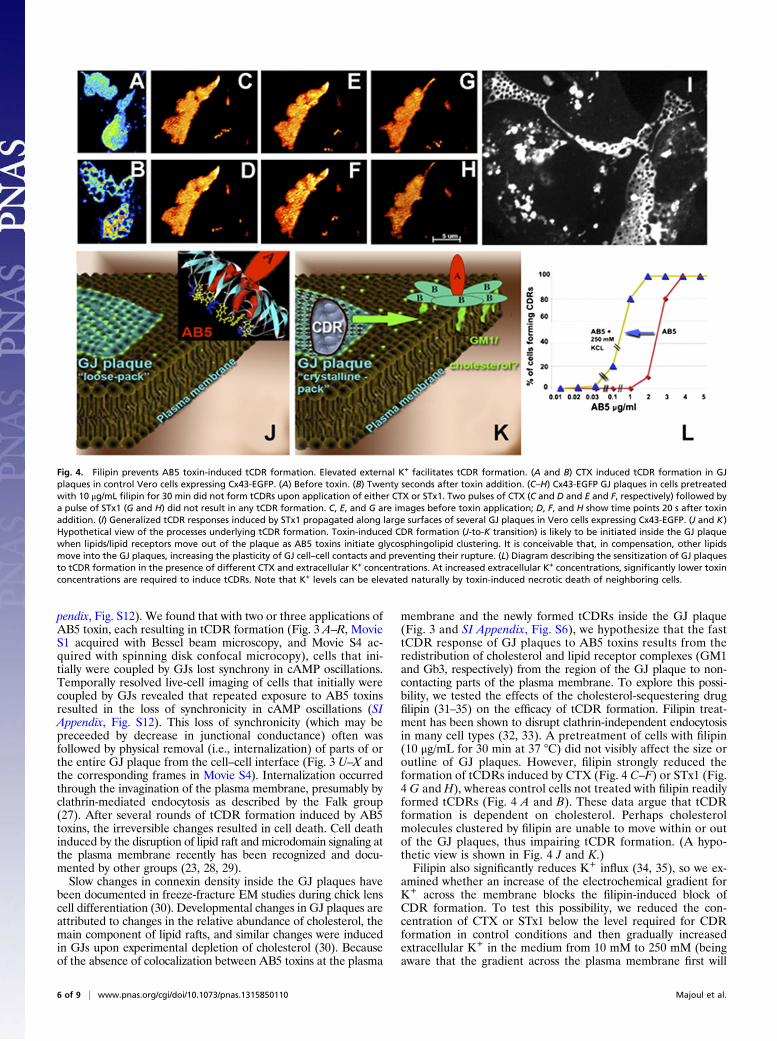
membrane and the newly formed tCDRs inside the GJ plaque(Fig. 3 and SI Appendix, Fig. S6), we hypothesize that the fasttCDR response of GJ plaques to AB5 toxins results from theredistribution of cholesterol and lipid receptor complexes (GM1and Gb3, respectively) from the region of the GJ plaque to non-contacting parts of the plasma membrane. To explore this possi-bility, we tested the effects of the cholesterol-sequestering drugfilipin (31–35) on the efficacy of tCDR formation. Filipin treat-ment has been shown to disrupt clathrin-independent endocytosisin many cell types (32, 33). A pretreatment of cells with filipin(10 μg/mL for 30 min at 37 °C) did not visibly affect the size oroutline of GJ plaques. However, filipin strongly reduced theformation of tCDRs induced by CTX (Fig. 4 C–F) or STx1 (Fig.4 G and H), whereas control cells not treated with filipin readilyformed tCDRs (Fig. 4 A and B). These data argue that tCDRformation is dependent on cholesterol. Perhaps cholesterolmolecules clustered by filipin are unable to move within or outof the GJ plaques, thus impairing tCDR formation. (A hypo-thetic view is shown in Fig. 4 J and K.)Filipin also significantly reduces K+ influx (34, 35), so we ex-
amined whether an increase of the electrochemical gradient forK+ across the membrane blocks the filipin-induced block ofCDR formation. To test this possibility, we reduced the con-centration of CTX or STx1 below the level required for CDRformation in control conditions and then gradually increasedextracellular K+ in the medium from 10 mM to 250 mM (beingaware that the gradient across the plasma membrane first will
Fig. 4. Filipin prevents AB5 toxin-induced tCDR formation. Elevated external K+ facilitates tCDR formation. (A and B) CTX induced tCDR formation in GJplaques in control Vero cells expressing Cx43-EGFP. (A) Before toxin. (B) Twenty seconds after toxin addition. (C–H) Cx43-EGFP GJ plaques in cells pretreatedwith 10 μg/mL filipin for 30 min did not form tCDRs upon application of either CTX or STx1. Two pulses of CTX (C and D and E and F, respectively) followed bya pulse of STx1 (G and H) did not result in any tCDR formation. C, E, and G are images before toxin application; D, F, and H show time points 20 s after toxinaddition. (I) Generalized tCDR responses induced by STx1 propagated along large surfaces of several GJ plaques in Vero cells expressing Cx43-EGFP. (J and K)Hypothetical view of the processes underlying tCDR formation. Toxin-induced CDR formation (J-to-K transition) is likely to be initiated inside the GJ plaquewhen lipids/lipid receptors move out of the plaque as AB5 toxins initiate glycosphingolipid clustering. It is conceivable that, in compensation, other lipidsmove into the GJ plaques, increasing the plasticity of GJ cell–cell contacts and preventing their rupture. (L) Diagram describing the sensitization of GJ plaquesto tCDR formation in the presence of different CTX and extracellular K+ concentrations. At increased extracellular K+ concentrations, significantly lower toxinconcentrations are required to induce tCDRs. Note that K+ levels can be elevated naturally by toxin-induced necrotic death of neighboring cells.
6 of 9 | www.pnas.org/cgi/doi/10.1073/pnas.1315850110 Majoul et al.
decrease, then will change in sign, and then will increase again).Remarkably, the externally added K+ facilitated tCDR forma-tion even when the concentration of CTX was reduced almost by10-fold (Fig. 4L). Formation of tCDRs in the presence of a lowAB5 toxin concentration/high K+ gradient (Fig. 4L) supports theidea that tCDR formation results from the rapid movement outof the GJ plaque of cholesterol/glycosphingolipid complexes thatare still mounted in the plasma membrane and are not yet in-ternalized. However, experimental tools to test this idea cur-rently are lacking. Deeper understanding of toxin-induced tCDReffects at the cellular level will allow prediction of how AB5toxins may facilitate cellular loss of K+ during bacterial infection.It remains unclear how GJ plaques release or absorb cholesterolor complexes of cholesterol/glycosphingolipids (such as GM1 orGb3) during tCDR formation and recovery and how cholesterolmovement may affect intracellular GJ signaling between infectedcells. Interestingly, preventing tCDR formation by treating cellswith the cholesterol-sequestering drug filipin decreased the cel-lular processing of inactive A-subunits of AB5 toxins into theirreduced and enzymatically active forms (SI Appendix, Fig. S13).In future experiments we aim to look at tCDRs with EM-basedmethods, such as cryoelectron tomography (36) and freeze-fracture EM (30), to assess the changes to GJ plaques upon AB5toxin action with higher spatial resolution.In summary, using Bessel beam plane illumination microscopy,
we demonstrate dynamic substructures within GJ plaques thatare not observable with conventional diffraction-limited fluo-rescence microscopy. Using multiple laser lines in spinning diskconfocal microscopy, we measured the kinetics of tCDR for-mation and cAMP fluctuations in GJ-coupled cells upon theapplication of different fluorescently labeled AB5 toxins. Thedata suggest that fast formation of tCDRs (i.e., connexin-depletedregions within GJ plaques) proceeds via the rearrangement anddenser clustering of connexin channels within the GJ plaque inresponse to AB5 toxins. The identification of tCDR effects in-duced by AB5 toxins allows us to predict how cellular loss of K+
may facilitate a cascade of signaling events during bacterial in-fection. Although speculative, it is tempting to suggest that tCDRformation, perhaps through a lipid-mediated signaling mechanism,may provide cells with an early sensing of their exposure to bac-terial AB5 toxins. Finally, our data provide strong evidence thatGJ plaques are much more dynamic cellular membrane domainsthan considered previously.
Materials and MethodsMaterials. 8-Bromoadenosine 3′,5′-cyclic monophosphate, forskolin, andprostaglandin E1 were purchased from Sigma Chemical Co., 3-isobutyl-1-methylxanthine (IBMX) was purchased from Merck, and adenosine-3′,-5′-cyclic-monophosphate (NPE-caged cAMP) was purchased from MolecularProbes/Invitrogen. Unless indicated otherwise, AB5 toxins, connexins taggedwith fluorescent proteins (FP), and other constructs, antibodies, and chem-icals used in this study were characterized previously and described in refs.16, 17, 20, 21, and 37. The following AB5 toxins were used (SI Appendix,Table S1): CTX; a nontoxic CTX mutant, CTX-K63 (16); STx1 (38); Stx2 (39);and a heat-labile enterotoxin, WT LT-1 (40). AB5 Shiga toxins were producedand purified in the Y.K. laboratory as described earlier (38). CTX AB5 formsand mutants have been characterized earlier (16, 17, 37). In addition, weused only the B-subunits of CTX and Stx1 (i.e., CTX-B and STx1-B). As a non-AB5 toxin, CNF was used (a generous gift from K. Aktories, University ofFreiburg, Freiburg, Germany).
Cell Culture, Transfections, Microscope Setup for Live-Cell Imaging, and Ab5Toxin Treatments. Vero cells (an African green monkey kidney fibroblast line)were grown and maintained in DMEM supplemented with 10% FCS (Sigma),100 U/mL streptomycin, 100 U/mL penicillin, and 1% nonessential aminoacids at 37 °C under 9% CO2. Transient transfection of cells with expressionconstructs encoding fluorescent chimeric proteins, DNA cloning, and plasmidpurification were done essentially as described (37). Transiently transfectedVero cells were plated on glass coverslips and imaged using a laser confocalspinning disk microscope system based on a Nikon Ti Eclipse microscope
(www.nikoninstruments.com/en_DE/Products/Microscope-Systems/Inverted-Microscopes/Eclipse-Ti) equipped with a Yokogawa CSU-X1 unit (www.yokogawa.com/scanner/products/csuX1e.htm) and an Andor iXon+ EM-CCD camera. The microscope was fitted with 40×, 1.30 NA and 100×, 1.49 NAobjectives. Image acquisition was controlled with Andor Bioimaging soft-ware (Andor IQ2.1). Basic control experiments and Ca2+ measurements weredone using an Optosplit system (AcalBfi, www.acalbfi.com/uk) combined withthe CSU-X1, the fastest currently available spinning disk unit with a scan-ning speed close to 2- to 3-ms full-frame spinning. The Bessel beam planeillumination microscope setup has been described in detail in ref. 15. Pro-cedures for fluorescent labeling of AB5 toxins and treatment of cells withsuch AB5 toxins were described earlier (16, 17). For application of STx1, STx2,and CTX toxins, 10 μL of a stock solution of 3 μg/mL of labeled toxin (i.e., about30 ng of toxin) was applied to 70% confluent cell monolayers so that afterfinal dilution in the culture medium (∼2 mL) a concentration of ∼15 ng/mL wasachieved. After the tCDR effect was triggered, applied toxin was washedaway with freshly added medium.
Purification and Labeling of AB5 Toxins: Purification of Shiga Toxins STx1 andSTx2. Crude toxin extracts were transferred on blue Sepharose for chroma-tography. Crude extract was prepared from exponentially growing cells ofE. coli strains containing WT expression plasmids spSHT1 and pST23 or B-subunits or the mutated form of A-subunit expression plasmids. Cells weregrown in lysogeny broth supplemented with 50 μg ampicillin/mL, harvestedby centrifugation, washed with 20 mL buffer [10 mM Tris·HCl (pH 8), 10 mMNaCl, 1 mM EDTA] and resuspended in 20 mM Tris·HCl (pH 10.5), 1 mMEDTA, followed by incubation at 50 °C for 10 min. Cellular debris was re-moved by centrifugation at 14,000 × g for 30 min. The pH of the clarifiedsupernatant was adjusted, and 0.01 volumes of 1 mg/mL PMSF in DMSOwere added. This crude extract contained about 90% of the total cyto-toxic material.
The crude extract was diluted twofold with 10 mM Tris·HCl (pH 7.4), 1 mMEDTA and applied to a column of AffiGel Blue (Pharmacia) equilibrated inthe same buffer. After the column was washed, toxin was eluted with a 100–800 mM NaCl gradient in the same buffer. The pooled fractions containingcytotoxic material were concentrated in an Amicon ultrafiltration cell withPM30 membrane and dialyzed against 25 mM Tris acetate (pH 8.3). Dialyzedmaterial was applied to a column of poly buffer exchanger, PBE 94 (Phar-macia Fine Chemicals), that had been equilibrated with 25 mM Tris acetate(pH 8.3). After the column was washed with two column volumes of thesame buffer, material was eluted with poly buffer 96 (pH 6.0). Fractionscontaining toxin were collected, and the protein was precipitated by addingsolid ammonium sulfate (0.561 g/mL) at 4 °C. For specific, preferentialfluorescence labeling of A-subunits, the precipitates were dissolved and di-alyzed against 50 mM Bicine buffer with different gradients (pH 7.0–9.4)created by the addition of NaOH. Preferential labeling of B-subunits or theA-subunit of native holotoxin can be obtained under different pH profilesduring the labeling (SI Appendix, Fig. S13G) (16).
DNA Constructs. The connexin isoforms used in this work, Cx30, Cx36, Cx43,and Cx45, were tagged at the C terminus with fluorescent proteins. MouseCx30 (NM_001010937), Cx36 (NM_010290), and Cx45 (NM_001159383.1)coding sequences were PCR-amplified from amouse brain cDNA library usingthe following gene-specific primers (5′→3′): Cx30 forward: ATGGACTGGG-GGACCCTGC, Cx30 reverse: ACTTGGGAAACTTGTGATTGC; Cx36 forward:ATGGGGGAATGGACCATCTTG, Cx36 reverse: ACATAGGCAGAGTCACTGGAC;Cx45 forward: ATGAGTTGGAGCTTCCTGACTC, Cx45 reverse: AATCCAGACGG-AGGTCTTCCC.
C-terminal in-frame ORF fusions were constructed using the pEGFP-N1,pEYFP-N1, or pECFP-N1 vectors (Clontech). C-terminally tagged Cx43 fluo-rescent proteins were described earlier (20). Actin-mRFP was a gift fromDr. Anna Akhmanova (Utrecht University, Utrecht, The Netherlands).
Measurement of cAMP Levels in Vero Cells Forming GJ Plaques During theApplication of AB5 Toxins. Vero cells were transfected with a cAMP FRET-basedsensor construct, CFP-Epac-YFP (26). Monolayer-grown Vero cells expressingthe construct were washed with PBS, harvested, and homogenized in high-potassium/low-sodium Internal Medium (39, 41). Cell membranes were dis-rupted using G18, G22, and G27 injection needles, respectively. Fluorescencein drops of cellular homogenate (5 μL each) was imaged upon the additionof 1 μL of different concentrations (0.1 μM; 1 μM; 10 μM; 50 μM; 100 μM;1 mM) of the cAMP analog 8-Bromo-cAMP, the mixed Epac/PKA agonistSp-8-CPT-cAMPS, or the Epac agonist Sp-8-CPT-2’-O-MecAMPS (Sigma) but notPKA-specific agonist 6-Bnz-cAMP. Intensity images obtained with Optosplit
Majoul et al. PNAS Early Edition | 7 of 9
CELL
BIOLO
GY
PNASPL
US
were used to calibrate cellular levels of cAMP under the same illumination/laser power and filter set based on Epac CFP/YFP FRET data.
Because cAMP is a short-lived molecule cleaved by cellular phosphodies-terases, in some experiments we used a cell-permeable, nonspecific inhibitorof cAMP and cGMP phosphodiesterases, IBMX. Forskolin (a cell-permeablediterpene from Coleus forskohlii) was used to raise the cellular level ofadenylate cyclase in control experiments to image FRET dynamics and torecover possible increases in the cAMP level in Vero cells transfected withEpac sensor. Fluctuations of cAMP concentrations in Vero cells treated withforskolin (20 μM) and IBMX (500 μM) were measured over 10 h. First, tocontrol for bleed-through between CFP and YFP channels, reference cellsexpressing only CFP or YFP were plated together with cells expressing theCFP-Epac-YFP construct. Then cells expressing only the CFP-Epac-YFP con-struct were plated together with cells expressing both the CFP-Epac-YFPconstruct and connexin-FP. These cells were imaged simultaneously in thesame field of view using Optosplit (SI Appendix, Figs. S9 and S10), andfluorescence signals were compared. Three groups of images were collected:a donor image (CFP, excited at 440 nm and detected using a bandpass filterof 485/17 nm), a sensitized emission image (excited at 440 nm and detectedusing a bandpass filter of 525–560 nm), and the acceptor image (YFP, excitedat 514 nm and detected using a bandpass filter of 525–560 nm). All imageswere corrected for donor leak-through into the sensitized emission channel(i.e., false acceptor excitation that may occur at 440 nm using correction factorsderived from reference cell types). In some cases we decreased the excitationpower of lasers or used narrow bandpass filters or a combination of both. Tocalculate FRET, we divided the sensitized emission image by the donor imageusing the MetaMorph 7.6 program with home-made macro routines.
Within 30–45 min after the addition of WT CTX, we observed a massivecAMP increase that was used as the maximal positive control for Vero cells.In some cells similar FRET levels also were obtained with forskolin, causinga significant decrease in FRET from E = 0.4–0.1. Interestingly, when twoGJ-connected cells expressed CFP-Epac-YFP but only one of the two cellsimmobilized CTX, we observed similar FRET fluctuations in both cells. Thiseffect likely is caused by the rapid diffusion of cAMP through GJs into thecytosol of the contacting cell.
Electrophysiology Recordings. Electrical coupling between cells expressingCx36-EGFPwasmeasured using a dualwhole-cell voltage clamp (24, 42) before,during, and after the application of CTX. A pair of HeLa cells expressing Cx36-EGFP (cells 1 and 2) was voltage clamped at 0 mV. Junctional current (Ij) wasmeasured in cell 1 in response to transjunctional voltage (Vj) applied to cell 2in the form of repeated ramps changing from −30 to +30 mV over 1.3 s withthe interval between ramps being 200 ms. Junctional conductance, gj, wasobtained from the ratio gj = −Ij/Vj.
Inhibition of Synchronous cAMP Waves by the GJ Inhibitor Octanol. To confirmthat synchronous waves of cAMP oscillations between coupled Cx30 cells in-deed require GJ contacts (which are highly permeable to cAMP), wemonitoredcAMP signaling between coupled cells in control medium and in the presenceof the GJ-uncoupling chemical octanol (10 mM). Cells transfected with bothcAMP Epac FRET-sensor and Cx30-FP constructs were selected. In controlcoupled Cx30-FP cells, cAMP fluctuations maintained a similar maximum ofintensity during the time intervals measured, whereas synchronous activity forcAMP disappeared in cells treated with octanol. Thus, GJ-coupled cells dis-played similar coordinated oscillations because of the presence of GJ contacts.Synchronicity disappeared when GJ permeability was blocked. Similarly,electrical coupling disappeared quickly after the addition of decanol (Fig. 2D).
Treatment of Cells with Filipin and Latrunculin. Filipin (molecular formula:C35H58O11; molecular weight, 654.83) purified from Streptomyces filipinensiswas obtained from Sigma. Filipin was applied to cells expressing connexinslabeled with fluorescent proteins at a concentration of 10 μg/mL for 20 minat 37 °C (43, 44). Binding of filipin to cholesterol (mostly dispersed in gly-colipid microdomains) resulted in increased membrane fluorescence. We didnot observe binding of AB5 toxins to GJ plaques, perhaps indicating thatGB3 or GM1 that may be present in GJ plaques remained sterically protectedfrom AB5 toxins, e.g., by the extracellular loops of connexins. Treatmentwith filipin generally increased the fluorescence of GJ plaques labeled withdifferent FP-tagged connexin isoforms. Filipin thus is likely to enter the GJplaques and possibly prevented the interaction of cholesterol with sphin-golipids or lipid receptors. Treatment of Vero cells with 5–10 μg/mL filipin
reduced or prevented the formation of tCDRs (mean ± SEM, data from fourindependent experiments, **P < 0.05 vs. control, ANOVA). Latrunculin wasused at a final concentration of 10 μM for 10 min at 37 °C to disassembleactin filaments (45).
Calibration of [Ca2+] Level in Living Vero Cells with Fluo-4 AM. To estimatecellular levels of [Ca2+], we used Fluo-4 AM (Invitrogen). Drops of a referencesolution were recorded on the same coverslip and with the optical settings(laser power and bandpass of emission filters) later used for cell recordings.To calibrate the microscope setup, we used a reference solution prepared asa Ca2+ buffer [100 mM KCl, 30 mM 3-(N-morpholino)propanesulfonic acid(Mops), 10 mM K2
-EGTA, and 2 mM Ca2+-EGTA (pH 7.2)], which is expected tohave a free [Ca2+] level below 50 nM. To this solution 5 μM Fluo-4 AM (finalconcentration) was added, and a drop (2–5 μL) of this solution was recordedunder settings [i.e., laser excitation/emission (λ ex/em), filter set, and cov-erslips] identical to those used for imaging cells.
To measure toxin-induced intracellular Ca2+, Vero cells were preloadedwith Fluo-4 AM. Culture medium was removed from cells grown on cover-slips in six-well plates and was replaced by DMEM with 100 μL of 4 μM Fluo-4AM per coverslip, and cells were incubated for 1 h at 37 °C. After non-fluorescent ester was incorporated into Vero cells, the incubation mediumwas removed, and coverslips were transferred into experimental chamberswith fresh medium. Images were taken with an Andor CCD camera (4 s)using a narrow bandpass (510/10 nm) while cells were treated with Cy5-labeled fluorescent toxins (100 ng/mL) as indicated. Finally extracellularcalcium (5 mM), or ATP (5 mM) was used as a control to reveal the highestamount of intracellular calcium. To estimate concentrations of intracellularcalcium in Vero cells, we used the calculation [Ca2+] = Kd × (Iexp − Imin)/(Imax − Iexp), where Kd is the affinity of the Fluo-4 AM for calcium [accordingto the manufacturer (Life Technologies), Kd = 0.345 pmol−1], Iexp is the fluo-rescence measured using a bandpass of 510/10 nm, Imin is the cell fluorescencein the absence of calcium, and Imax is the fluorescence when calcium wassaturated with 5 mM of extracellular calcium. To determine Imax, cells werelysed on the coverslip with 2% of Triton-X100 to demonstrate calcium sat-uration. Finally, 10 mM EGTA was used to quench the signal to base level.
Because the intracellular esterases may cleave Fluo-4 AM into Fluo-4, wecontrolled the level of intracellular calcium by incubating a control set of cellswith a solution containing the calcium ionophore A23187 and known con-centrations of [Ca2+]. We were aware that Fluo4 potentially binds Ca2+ ex-tensively during the application of AB5 toxins and can act as a local buffer thatcould secondarily alter the local Ca2+ concentration to modulate the originalFluo-4 AM–based Ca2+-dependent fluorescence signal (SI Appendix, Fig. S7).
Image Analysis. Fluorescence images were analyzed using MetaMorph 7.6(www.moleculardevices.com/) as described (21, 37). For the line scan or re-gion of interest fluorescence measurements, the average value projectionswere created from individual z-stacks in Tiff or AVI format, and the back-ground was subtracted for each image. To calculate the number of tCDRsformed during experiments, we used the Maple 14 program (Maplesoft).
Statistical Analyses. Data presented were replicated in five or more inde-pendent experiments. Statistical analyses were performed using a two-tailed Student t test assuming equal variances. Multiple group comparisonat the same time was done using single-factor ANOVA. Generally, P < 0.05was considered significant, and the obtained P values were estimated ifstatistically significant differences were required. The estimated amountand diameter of the tCDR profiles was approximated on the basis of mag-nification scales used. The scaling ratio was obtained from linear fits tothe data.
ACKNOWLEDGMENTS. We thank Dr. Christian Hübner for help with fluores-cence spectroscopy measurements; Dr. Klaus Aktories for providing CNFtoxin; Dr. Anna Akhmanova for the actin- and EB3-mCherry constructs;Dr. Manuela Zaccolo for cytosolic and membrane-attached Epac-based cAMPsensors; Drs. James Pawley, Michael Berridge, Richard Blumberg, Werner W.Franke, and Rolf Hilgenfeld for discussions; and Robert Schönherr and Dr.Enno Hartmann for comments on versions of the manuscript. This study wassupported by a Deutsche Forschungsgemeinschaft Excellence Cluster ‘‘In-flammation at Interfaces’’ grant (to R.D.) and by National Institutes of HealthGrants NS55363 (to M.V.L.B.) and NS72238 and HL84464 (to F.B.). M.V.L.B. isthe Sylvia and Robert S. Olnick Professor of Neuroscience and Distin-guished Professor of the Albert Einstein College of Medicine.
1. Gilula NB, Reeves OR, Steinbach A (1972) Metabolic coupling, ionic coupling and cell
contacts. Nature 235(5336):262–265.
2. Goodenough DA, Goliger JA, Paul DL (1996) Connexins, connexons, and intercellular
communication. Annu Rev Biochem 65:475–502.
8 of 9 | www.pnas.org/cgi/doi/10.1073/pnas.1315850110 Majoul et al.
3. Yeager M, Nicholson BJ (1996) Structure of gap junction intercellular channels. CurrOpin Struct Biol 6(2):183–192.
4. Bennett MV, Zukin RS (2004) Electrical coupling and neuronal synchronization in theMammalian brain. Neuron 41(4):495–511.
5. Connors BW, Long MA (2004) Electrical synapses in the mammalian brain. Annu RevNeurosci 27:393–418.
6. Goldberg GS, Lampe PD, Nicholson BJ (1999) Selective transfer of endogenous me-tabolites through gap junctions composed of different connexins. Nat Cell Biol 1(7):457–459.
7. Goldberg GS, Valiunas V, Brink PR (2004) Selective permeability of gap junctionchannels. Biochim Biophys Acta 1662(1-2):96–101.
8. Yeager M, Harris AL (2007) Gap junction channel structure in the early 21st century:Facts and fantasies. Curr Opin Cell Biol 19(5):521–528.
9. Harris AL (2007) Connexin channel permeability to cytoplasmic molecules. Prog Bio-phys Mol Biol 94(1-2):120–143.
10. Alev C, et al. (2008) The neuronal connexin36 interacts with and is phosphorylated byCaMKII in a way similar to CaMKII interaction with glutamate receptors. Proc NatlAcad Sci USA 105(52):20964–20969.
11. Segretain D, Falk MM (2004) Regulation of connexin biosynthesis, assembly, gapjunction formation, and removal. Biochim Biophys Acta 1662(1-2):3–21.
12. Gaietta G, et al. (2002) Multicolor and electron microscopic imaging of connexintrafficking. Science 296(5567):503–507.
13. Jordan K, Chodock R, Hand AR, Laird DW (2001) The origin of annular junctions: Amechanism of gap junction internalization. J Cell Sci 114(Pt 4):763–773.
14. Nickel B, et al. (2013) Visualizing the effect of dynamin inhibition on annular gapvesicle formation and fission. J Cell Sci 126(Pt 12):2607–2616.
15. Planchon TA, et al. (2011) Rapid three-dimensional isotropic imaging of living cellsusing Bessel beam plane illumination. Nat Methods 8(5):417–423.
16. Majoul IV, Bastiaens PI, Söling HD (1996) Transport of an external Lys-Asp-Glu-Leu(KDEL) protein from the plasma membrane to the endoplasmic reticulum: Studieswith cholera toxin in Vero cells. J Cell Biol 133(4):777–789.
17. Majoul I, et al. (1998) KDEL receptor (Erd2p)-mediated retrograde transport of thecholera toxin A subunit from the Golgi involves COPI, p23, and the COOH terminus ofErd2p. J Cell Biol 143(3):601–612.
18. Majoul I, et al. (2002) Differential expression of receptors for Shiga and Cholera toxinis regulated by the cell cycle. J Cell Sci 115(Pt 4):817–826.
19. Windschiegl B, et al. (2009) Lipid reorganization induced by Shiga toxin clustering onplanar membranes. PLoS ONE 4(7):e6238.
20. Butkevich E, et al. (2004) Drebrin is a novel connexin-43 binding partner that links gapjunctions to the submembrane cytoskeleton. Curr Biol 14(8):650–658.
21. Majoul IV, et al. (2009) Limiting transport steps and novel interactions of Connexin-43along the secretory pathway. Histochem Cell Biol 132(3):263–280.
22. Falk MM, Baker SM, Gumpert AM, Segretain D, Buckheit RW, 3rd (2009) Gap junctionturnover is achieved by the internalization of small endocytic double-membranevesicles. Mol Biol Cell 20(14):3342–3352.
23. Lingwood D, Simons K (2010) Lipid rafts as a membrane-organizing principle. Science327(5961):46–50.
24. Bukauskas FF, Bukauskiene A, Bennett MV, Verselis VK (2001) Gating properties ofgap junction channels assembled from connexin43 and connexin43 fused with greenfluorescent protein. Biophys J 81(1):137–152.
25. Lo WK, Mills A, Kuck JF (1994) Actin filament bundles are associated with fiber gapjunctions in the primate lens. Exp Eye Res 58(2):189–196.
26. Ponsioen B, et al. (2004) Detecting cAMP-induced Epac activation by fluorescenceresonance energy transfer: Epac as a novel cAMP indicator. EMBO Rep 5(12):1176–1180.
27. Piehl M, et al. (2007) Internalization of large double-membrane intercellular vesiclesby a clathrin-dependent endocytic process. Mol Biol Cell 18(2):337–347.
28. Bang B, Gniadecki R, Gajkowska B (2005) Disruption of lipid rafts causes apoptotic celldeath in HaCaT keratinocytes. Exp Dermatol 14(4):266–272.
29. George KS, Wu S (2012) Lipid raft: A floating island of death or survival. Toxicol ApplPharmacol 259(3):311–319.
30. Biswas SK, Jiang JX, Lo WK (2009) Gap junction remodeling associated with choles-terol redistribution during fiber cell maturation in the adult chicken lens. Mol Vis15:1492–1508.
31. Mukherjee S, Zha X, Tabas I, Maxfield FR (1998) Cholesterol distribution in living cells:Fluorescence imaging using dehydroergosterol as a fluorescent cholesterol analog.Biophys J 75(4):1915–1925.
32. McGookey DJ, Fagerberg K, Anderson RG (1983) Filipin-cholesterol complexes form inuncoated vesicle membrane derived from coated vesicles during receptor-mediatedendocytosis of low density lipoprotein. J Cell Biol 96(5):1273–1278.
33. Damm EM, et al. (2005) Clathrin- and caveolin-1-independent endocytosis: Entry ofsimian virus 40 into cells devoid of caveolae. J Cell Biol 168(3):477–488.
34. Kinsky SC (1970) Antibiotic interaction with model membranes. Annu Rev Pharmacol10:119–142.
35. Hendrix DL, Higinbotham N (1973) Effects of filipin and cholesterol on K movement inetiolated stem cells of Pisum sativum L. Plant Physiol 52(2):93–97.
36. Maurer UE, Sodeik B, Grünewald K (2008) Native 3D intermediates of membranefusion in herpes simplex virus 1 entry. Proc Natl Acad Sci USA 105(30):10559–10564.
37. Majoul I, Straub M, Hell SW, Duden R, Söling HD (2001) KDEL-cargo regulates inter-actions between proteins involved in COPI vesicle traffic: Measurements in living cellsusing FRET. Dev Cell 1(1):139–153.
38. Kozlov YV, Chernaia MM, Fraser ME, James MN (1993) Purification and crystallizationof Shiga toxin from Shigella dysenteriae. J Mol Biol 232(2):704–706.
39. Melton-Celsa A, Mohawk K, Teel L, O’Brien A (2012) Pathogenesis of Shiga-toxinproducing escherichia coli. Curr Top Microbiol Immunol 357:67–103.
40. van den Akker F, Pizza M, Rappuoli R, Hol WG (1997) Crystal structure of a non-toxicmutant of heat-labile enterotoxin, which is a potent mucosal adjuvant. Protein Sci6(12):2650–2654.
41. Majoul I, Jia Y, Duden R (2006) Handbook of Biological Confocal Microscopy, edPawley JB (Springer, New York), 3rd Ed, pp 788–808.
42. Skeberdis VA, Rimkute L, Skeberdyte A, Paulauskas N, Bukauskas FF (2011) pH-dependent modulation of connexin-based gap junctional uncouplers. J Physiol 589(Pt 14):3495–3506.
43. Bergy ME, Eble TE (1968) The filipin complex. Biochemistry 7(2):653–659.44. Orlandi PA, Fishman PH (1998) Filipin-dependent inhibition of cholera toxin: Evidence
for toxin internalization and activation through caveolae-like domains. J Cell Biol141(4):905–915.
45. Coué M, Brenner SL, Spector I, Korn ED (1987) Inhibition of actin polymerization bylatrunculin A. FEBS Lett 213(2):316–318.
Majoul et al. PNAS Early Edition | 9 of 9
CELL
BIOLO
GY
PNASPL
US


![Chapter 9 Responses to Ecosystem Change and to Their Impacts … services_4[1].09.pdf · 9.1.1 Response Features, Complexity, and Choices 9.1.2 Institutions and Responses 9.1.3 Resilience](https://img.pdfslide.fr/doc/110x75/5f248063751de03e8a47dec2/chapter-9-responses-to-ecosystem-change-and-to-their-impacts-services4109pdf.jpg)


![Reciprocal Responses in the Interaction between ... · Reciprocal Responses in the Interaction between Arabidopsis and the Cell-Content-Feeding Chelicerate Herbivore Spider Mite1[W][OPEN]](https://img.pdfslide.fr/doc/110x75/5f07b53e7e708231d41e56c6/reciprocal-responses-in-the-interaction-between-reciprocal-responses-in-the.jpg)