Embed Size (px)
Citation preview
Volume 7 Issue 1ISSN 2694-7161
www.ejobsat.com
FLIGHT DELAY CAUSESAT SELECTED VISEGRAD GROUPINTERNATIONAL AIRPORTSMartina Zámková1, Luboš Střelec2, Martin Prokop1, Radek Stolín1
1College of Polytechnics Jihlava, Czech Republic2Mendel University in Brno, Czech Republic
ZÁMKOVÁ, Martina, STŘELEC, Luboš, PROKOP, Martin, and STOLÍN, Radek. 2021. Flight Delay Causesat Selected Visegrad Group International Airports. European Journal of Business Science and Technology, 7 (1):91–108. ISSN 2694-7161, DOI 10.11118/ejobsat.2021.003.
ABSTRACT
The aim of this article is to analyse the flight delay causes at base airports (Prague, Brno,Ostrava, Budapest, Bratislava, Katowice, and Warsaw), with a special focus on a selected airlinecompany operating in the central European region. To process the data, methods of multivariablestatistics, namely tests of independence in contingency tables, the Kruskal-Wallis testing, clusteranalysis, and correspondence analysis were used. Apparently, both charter and scheduled flightshave the same percentage of delayed flights, delays occur most frequently in June, and Boeing737-800 reported delays more frequently than Airbus A320. The research has shown that thehighest number of delayed flights occurs in Budapest, the lowest number in Katowice. During thenight, short delays occur most often, long delays most frequently arise in the evening. The mostcommon cause for longer delays is technical maintenance or an aircraft defect and previouslydelayed flights. The flight dispatch by supplier companies is the source accounting only for rathershort delays. Overall, the delayed flights frequency increases with the size of the city and theairport.
KEY WORDS
correspondence analysis, delay causes, international airports, Pearson’s chi-squared test, dendro-gram, Kruskal-Wallis test
JEL CODES
C30, R40
1 INTRODUCTION
The passengers are sometimes, in cases of verysignificant flight delays, entitled to financialcompensation under certain conditions. This
concerns rather high amounts of money whichmay represent a considerable expense for airlinecompanies. It is therefore necessary to try and
92 Martina Zámková, Luboš Střelec and Martin Prokop …
eliminate the delays, especially the long ones,so that airlines would not be obliged to payfinancial compensations to passengers. At thesame time, elimination of delays would improvecustomer experience, as nobody enjoys longwaiting times at airports. Rights of passengersin the air transport are stipulated in Regulation(EC) No. 261/2004 of the European Parliamentand of the Council; for more details see Euro-pean Consumer Centre Czech Republic (2020).
The principal objective of this work is toevaluate and assess the delay-caused problemsat selected airports in the countries of theVisegrad Group. Airports have been selectedbased on the results of cluster analysis andinternal information of the airline. These arethe so-called Base Airports – airports that serveas an airline’s home base with full facilities andpersonnel. In the first step, all flights at selectedairports were analysed: this included differencesbetween charter and scheduled flights, delaysat specific airports, delays of different aircraft,and times of delays. Statistical hypothesis test-ing and the Kruskal-Wallis test proved usefulin the identification of statistically significantdifferences. In the second step, the focus wason selected airports and delayed flights. Thisentailed a detailed (correspondence) analysisof delays – considering their length, time ofoccurrence, reasons and so on.
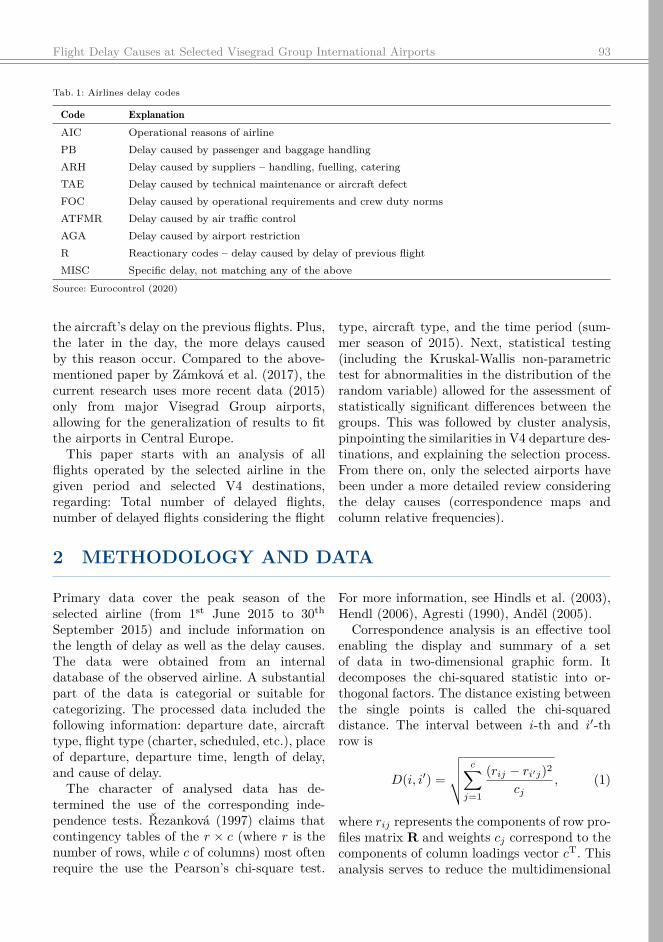
This study evaluates the causes of flightdelays at base international airports (Prague,Brno, Ostrava, Budapest, Bratislava, Katowice,and Warsaw) used by a selected airline companyoperating in the Czech Republic. The causesof delays were classified based on the codesof IATA (The International Air TransportAssociation), adapted for the specific needs ofthis company; see Tab. 1. The dependences ofdelay causes on other factors were examinedby means of independence test in contingencytables. Correspondence analysis was employedin order to display the results graphically.
According to the authors Wang et al. (2019),delays in air travel cause economic losses forairlines and reduce the quality of travel. Theanalysis of the causes of delays is performedhere by the methods of statistical physics. Adelay represents an issue that affects both
passengers and the airport staff, this issuebeing addressed, for example, by Wu andTruong (2014), Zámková et al. (2018). Theycame up with a comparison of the IATA delaydata system with the coding system developedby the authors themselves. The article bySkorupski and Wierzbińska (2015) deals withthe difficulties encountered due to late check-ins and looks for an optimal time limit afterwhich it is appropriate to stop waiting for thelatecomers. The authors Jiang and Ren (2018)propose a model that can effectively describethe behaviour of passengers at various delays.The author Stone (2018) found that flightdelays or cancellations have a negative impact,especially on passengers at small airports (localsand tourists), who then have to travel tothe transfer airport instead of departing fromthese small airports. This further increases theimpact of these passengers on the entire travelitinerary. According to Forbes et al. (2015),it would be advisable for airlines to releaseinformation on delayed flights with a delay ofmore than 15 minutes. Further research focusedon the modelling of the course and propagationof delays during subsequent flights, see, forexample, Campanelli et al. (2014), Rebollo andBalakrishnan (2014). Optimization of delays isseen as a solution in articles by AhmadBeygiet al. (2008), Wang et al. (2020), Wu et al.(2016) and Belkoura et al. (2016). The authorsof the article Wu and Law (2019) developed amodel describing the propagation of delays tosubsequent flights using the Bayesian network.The authors Pamplona et al. (2018) proposeprocedures for optimal air traffic control topredict delays. In doing so, they use neuralnetwork methods. Research of authors Serhanet al. (2018) studies the effectiveness of incor-porating airline and passenger delay cost into anintegrated airport surface and terminal airspacetraffic management system. Problems with lostluggage are discussed in the article by Alsyoufet al. (2015).
The research by Zámková et al. (2017) lookedinto different delay-causing factors at Europeanairports during the summer season in 2008–2014. The conclusion? Delays occur in approx.50% of all flights and are most often caused by
Flight Delay Causes at Selected Visegrad Group International Airports 93
Tab. 1: Airlines delay codes
Code ExplanationAIC Operational reasons of airlinePB Delay caused by passenger and baggage handlingARH Delay caused by suppliers – handling, fuelling, cateringTAE Delay caused by technical maintenance or aircraft defectFOC Delay caused by operational requirements and crew duty normsATFMR Delay caused by air traffic controlAGA Delay caused by airport restrictionR Reactionary codes – delay caused by delay of previous flightMISC Specific delay, not matching any of the above
Source: Eurocontrol (2020)
the aircraft’s delay on the previous flights. Plus,the later in the day, the more delays causedby this reason occur. Compared to the above-mentioned paper by Zámková et al. (2017), thecurrent research uses more recent data (2015)only from major Visegrad Group airports,allowing for the generalization of results to fitthe airports in Central Europe.
This paper starts with an analysis of allflights operated by the selected airline in thegiven period and selected V4 destinations,regarding: Total number of delayed flights,number of delayed flights considering the flight
type, aircraft type, and the time period (sum-mer season of 2015). Next, statistical testing(including the Kruskal-Wallis non-parametrictest for abnormalities in the distribution of therandom variable) allowed for the assessment ofstatistically significant differences between thegroups. This was followed by cluster analysis,pinpointing the similarities in V4 departure des-tinations, and explaining the selection process.From there on, only the selected airports havebeen under a more detailed review consideringthe delay causes (correspondence maps andcolumn relative frequencies).
2 METHODOLOGY AND DATA
Primary data cover the peak season of theselected airline (from 1st June 2015 to 30thSeptember 2015) and include information onthe length of delay as well as the delay causes.The data were obtained from an internaldatabase of the observed airline. A substantialpart of the data is categorial or suitable forcategorizing. The processed data included thefollowing information: departure date, aircrafttype, flight type (charter, scheduled, etc.), placeof departure, departure time, length of delay,and cause of delay.
The character of analysed data has de-termined the use of the corresponding inde-pendence tests. Řezanková (1997) claims thatcontingency tables of the r × c (where r is thenumber of rows, while c of columns) most oftenrequire the use the Pearson’s chi-square test.
For more information, see Hindls et al. (2003),Hendl (2006), Agresti (1990), Anděl (2005).
Correspondence analysis is an effective toolenabling the display and summary of a setof data in two-dimensional graphic form. Itdecomposes the chi-squared statistic into or-thogonal factors. The distance existing betweenthe single points is called the chi-squareddistance. The interval between i-th and i′-throw is
D(i, i′) =
√√√√ c∑j=1
(rij − ri′j)2
cj, (1)
where rij represents the components of row pro-files matrix R and weights cj correspond to thecomponents of column loadings vector cT. Thisanalysis serves to reduce the multidimensional
94 Martina Zámková, Luboš Střelec and Martin Prokop …
space of row and column profiles and to save theoriginal data information to the highest extentpossible, see Hebák et al. (2007). The totalvariance of the data matrix may be measuredby the inertia, see e.g. Greenacre (1984). Theprocessing of the data was carried out in theUnistat and Statistica software.
The cluster analysis allows the input datamatrix set of object to be distributed intoseveral clusters, for more details see Hendl(2006). The aim is to achieve a situation wherethe objects within a cluster are similar to eachother as much as possible and objects fromdifferent clusters are similar to each other aslittle as possible. We are using the distancemeasure to evaluate the degree of the objects’similarity. Euclidean distance can be used forquantitative variables
DE (xi, xi′) =
√√√√ p∑i=1
(xij − xi′j)2. (2)
The most common procedure of the clusteranalysis is a hierarchical clustering, i.e. creatinga hierarchical sequence of decompositions, formore details see Hebák (2007). Hierarchicalclustering result is best viewed as a tree dia-gram, dendrogram. Distances between clustersare derived from the distances between objects.There are several agglomerative procedures,e.g. Ward method based on Ward’s criterionof decomposition quality, in detail see Hebák(2007).
The Kruskal-Wallis test by ranks is a non-parametric method for testing whether samplesoriginate from the same distribution. It is usedfor comparing two or more independent samplesof equal or different sample sizes. It extends theMann-Whitney U test when there are only twogroups. Null hypothesis assumes that the meanranks of the groups are the same. It can beused as an alternative to the parametric one-way analysis of variance (ANOVA) when thepopulation cannot be assumed to be normallydistributed. For more details see Anděl (2005),Hendl (2006).
3 RESULTS
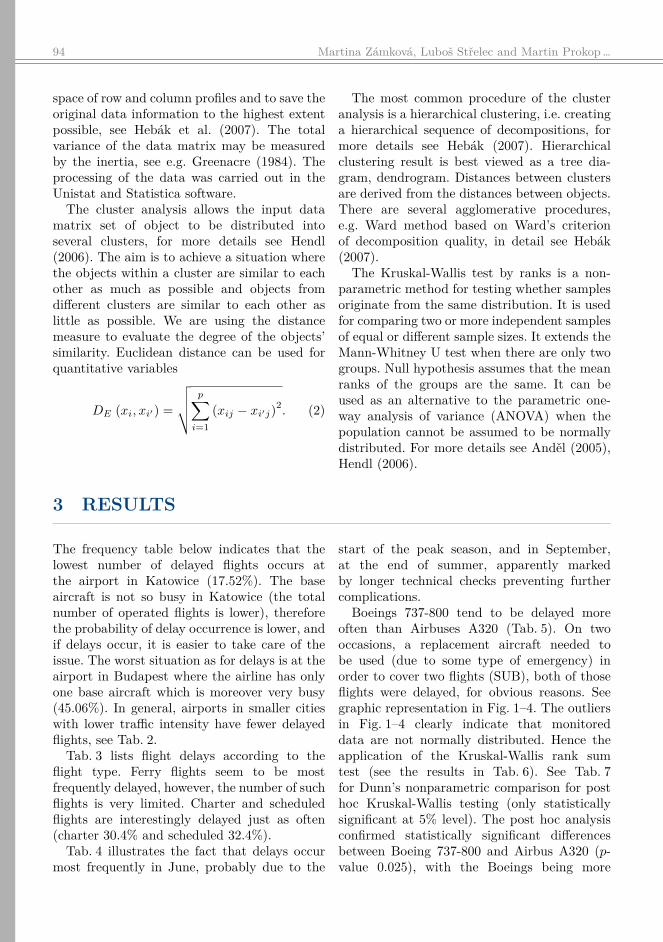
The frequency table below indicates that thelowest number of delayed flights occurs atthe airport in Katowice (17.52%). The baseaircraft is not so busy in Katowice (the totalnumber of operated flights is lower), thereforethe probability of delay occurrence is lower, andif delays occur, it is easier to take care of theissue. The worst situation as for delays is at theairport in Budapest where the airline has onlyone base aircraft which is moreover very busy(45.06%). In general, airports in smaller citieswith lower traffic intensity have fewer delayedflights, see Tab. 2.
Tab. 3 lists flight delays according to theflight type. Ferry flights seem to be mostfrequently delayed, however, the number of suchflights is very limited. Charter and scheduledflights are interestingly delayed just as often(charter 30.4% and scheduled 32.4%).
Tab. 4 illustrates the fact that delays occurmost frequently in June, probably due to the
start of the peak season, and in September,at the end of summer, apparently markedby longer technical checks preventing furthercomplications.
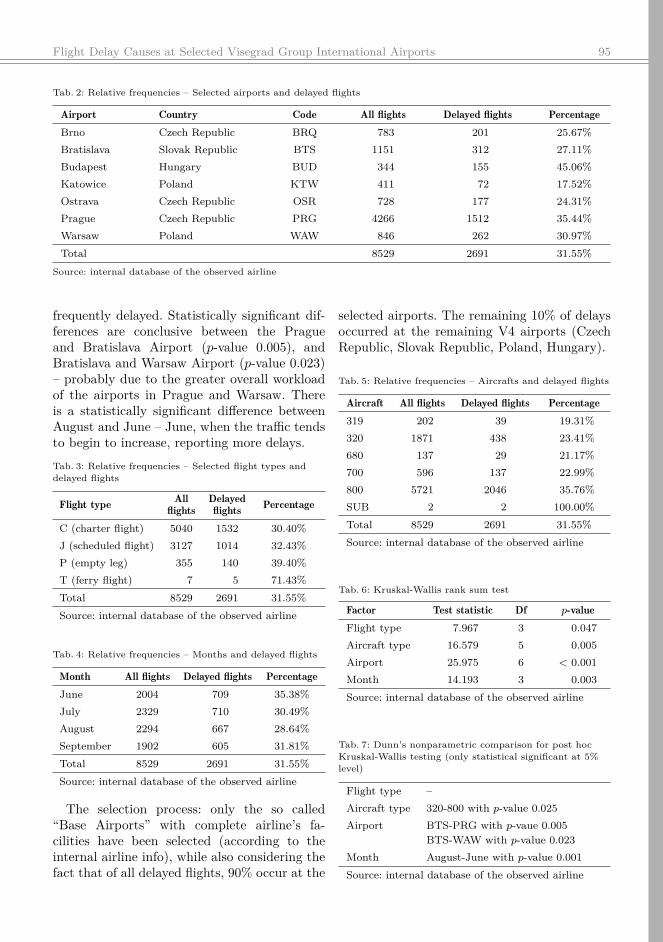
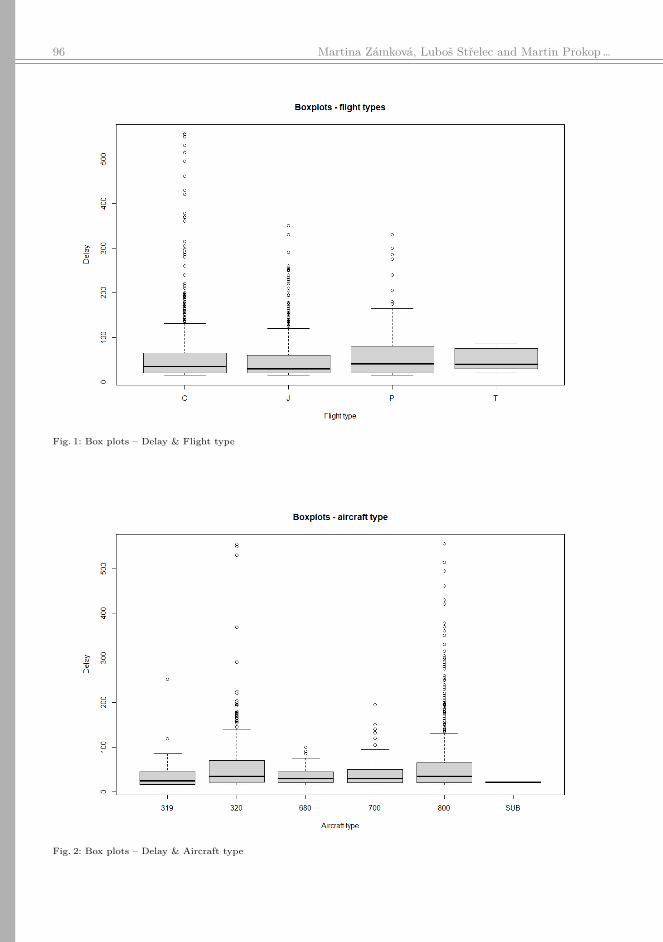
Boeings 737-800 tend to be delayed moreoften than Airbuses A320 (Tab. 5). On twooccasions, a replacement aircraft needed tobe used (due to some type of emergency) inorder to cover two flights (SUB), both of thoseflights were delayed, for obvious reasons. Seegraphic representation in Fig. 1–4. The outliersin Fig. 1–4 clearly indicate that monitoreddata are not normally distributed. Hence theapplication of the Kruskal-Wallis rank sumtest (see the results in Tab. 6). See Tab. 7for Dunn’s nonparametric comparison for posthoc Kruskal-Wallis testing (only statisticallysignificant at 5% level). The post hoc analysisconfirmed statistically significant differencesbetween Boeing 737-800 and Airbus A320 (p-value 0.025), with the Boeings being more
Flight Delay Causes at Selected Visegrad Group International Airports 95
Tab. 2: Relative frequencies – Selected airports and delayed flights
Airport Country Code All flights Delayed flights PercentageBrno Czech Republic BRQ 783 201 25.67%Bratislava Slovak Republic BTS 1151 312 27.11%Budapest Hungary BUD 344 155 45.06%Katowice Poland KTW 411 72 17.52%Ostrava Czech Republic OSR 728 177 24.31%Prague Czech Republic PRG 4266 1512 35.44%Warsaw Poland WAW 846 262 30.97%Total 8529 2691 31.55%
Source: internal database of the observed airline
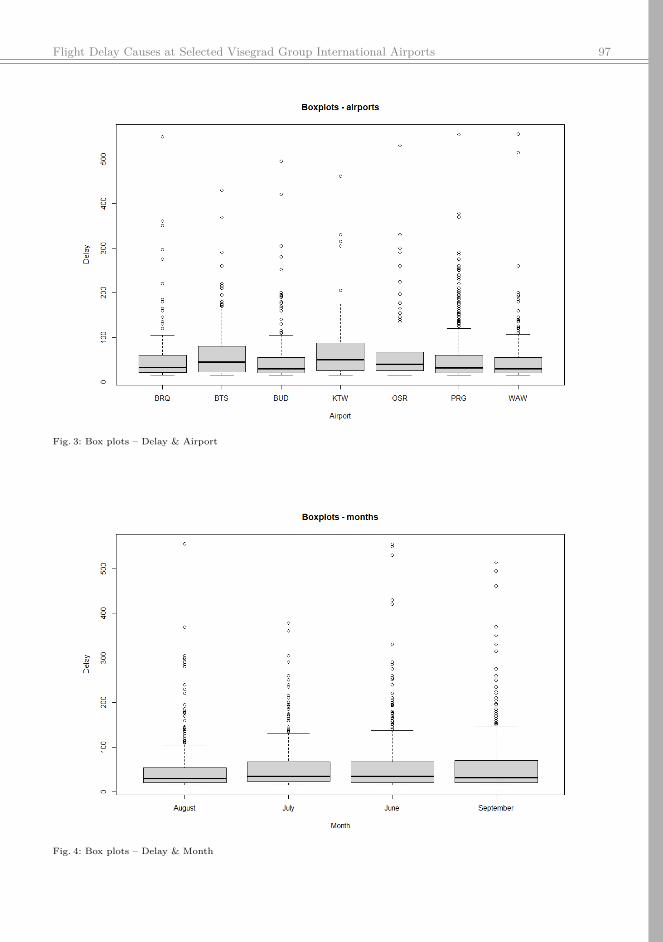
frequently delayed. Statistically significant dif-ferences are conclusive between the Pragueand Bratislava Airport (p-value 0.005), andBratislava and Warsaw Airport (p-value 0.023)– probably due to the greater overall workloadof the airports in Prague and Warsaw. Thereis a statistically significant difference betweenAugust and June – June, when the traffic tendsto begin to increase, reporting more delays.Tab. 3: Relative frequencies – Selected flight types anddelayed flights
Flight type Allflights
Delayedflights Percentage
C (charter flight) 5040 1532 30.40%J (scheduled flight) 3127 1014 32.43%P (empty leg) 355 140 39.40%T (ferry flight) 7 5 71.43%Total 8529 2691 31.55%Source: internal database of the observed airline
Tab. 4: Relative frequencies – Months and delayed flights
Month All flights Delayed flights PercentageJune 2004 709 35.38%July 2329 710 30.49%August 2294 667 28.64%September 1902 605 31.81%Total 8529 2691 31.55%Source: internal database of the observed airline
The selection process: only the so called“Base Airports” with complete airline’s fa-cilities have been selected (according to theinternal airline info), while also considering thefact that of all delayed flights, 90% occur at the
selected airports. The remaining 10% of delaysoccurred at the remaining V4 airports (CzechRepublic, Slovak Republic, Poland, Hungary).
Tab. 5: Relative frequencies – Aircrafts and delayed flights
Aircraft All flights Delayed flights Percentage319 202 39 19.31%320 1871 438 23.41%680 137 29 21.17%700 596 137 22.99%800 5721 2046 35.76%SUB 2 2 100.00%Total 8529 2691 31.55%Source: internal database of the observed airline
Tab. 6: Kruskal-Wallis rank sum test
Factor Test statistic Df p-valueFlight type 7.967 3 0.047Aircraft type 16.579 5 0.005Airport 25.975 6 < 0.001Month 14.193 3 0.003Source: internal database of the observed airline
Tab. 7: Dunn’s nonparametric comparison for post hocKruskal-Wallis testing (only statistical significant at 5%level)
Flight type –Aircraft type 320-800 with p-value 0.025Airport BTS-PRG with p-vaue 0.005
BTS-WAW with p-value 0.023Month August-June with p-value 0.001Source: internal database of the observed airline
96 Martina Zámková, Luboš Střelec and Martin Prokop …
Fig. 1: Box plots – Delay & Flight type
Fig. 2: Box plots – Delay & Aircraft type
Flight Delay Causes at Selected Visegrad Group International Airports 97
Fig. 3: Box plots – Delay & Airport
Fig. 4: Box plots – Delay & Month
98 Martina Zámková, Luboš Střelec and Martin Prokop …
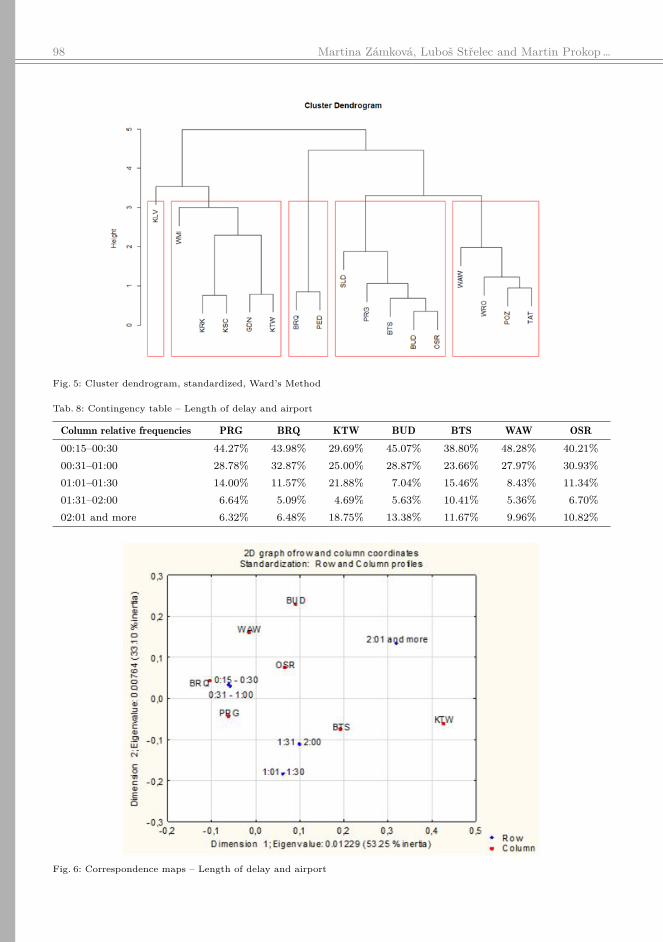
Fig. 5: Cluster dendrogram, standardized, Ward’s Method
Tab. 8: Contingency table – Length of delay and airport
Column relative frequencies PRG BRQ KTW BUD BTS WAW OSR00:15–00:30 44.27% 43.98% 29.69% 45.07% 38.80% 48.28% 40.21%00:31–01:00 28.78% 32.87% 25.00% 28.87% 23.66% 27.97% 30.93%01:01–01:30 14.00% 11.57% 21.88% 7.04% 15.46% 8.43% 11.34%01:31–02:00 6.64% 5.09% 4.69% 5.63% 10.41% 5.36% 6.70%02:01 and more 6.32% 6.48% 18.75% 13.38% 11.67% 9.96% 10.82%
Fig. 6: Correspondence maps – Length of delay and airport
Flight Delay Causes at Selected Visegrad Group International Airports 99
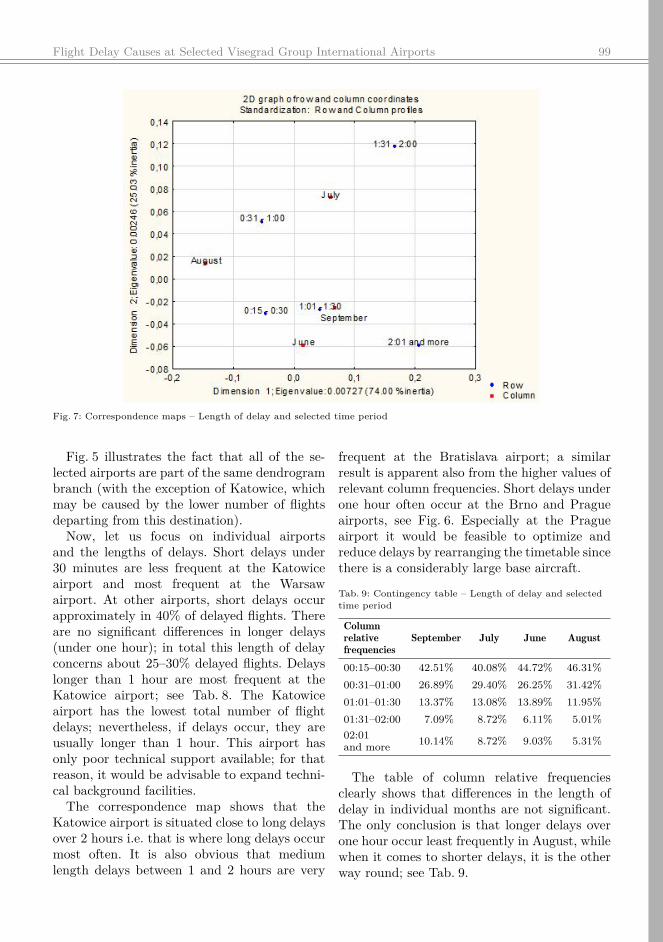
Fig. 7: Correspondence maps – Length of delay and selected time period
Fig. 5 illustrates the fact that all of the se-lected airports are part of the same dendrogrambranch (with the exception of Katowice, whichmay be caused by the lower number of flightsdeparting from this destination).
Now, let us focus on individual airportsand the lengths of delays. Short delays under30 minutes are less frequent at the Katowiceairport and most frequent at the Warsawairport. At other airports, short delays occurapproximately in 40% of delayed flights. Thereare no significant differences in longer delays(under one hour); in total this length of delayconcerns about 25–30% delayed flights. Delayslonger than 1 hour are most frequent at theKatowice airport; see Tab. 8. The Katowiceairport has the lowest total number of flightdelays; nevertheless, if delays occur, they areusually longer than 1 hour. This airport hasonly poor technical support available; for thatreason, it would be advisable to expand techni-cal background facilities.
The correspondence map shows that theKatowice airport is situated close to long delaysover 2 hours i.e. that is where long delays occurmost often. It is also obvious that mediumlength delays between 1 and 2 hours are very
frequent at the Bratislava airport; a similarresult is apparent also from the higher values ofrelevant column frequencies. Short delays underone hour often occur at the Brno and Pragueairports, see Fig. 6. Especially at the Pragueairport it would be feasible to optimize andreduce delays by rearranging the timetable sincethere is a considerably large base aircraft.
Tab. 9: Contingency table – Length of delay and selectedtime period
Columnrelativefrequencies
September July June August
00:15–00:30 42.51% 40.08% 44.72% 46.31%00:31–01:00 26.89% 29.40% 26.25% 31.42%01:01–01:30 13.37% 13.08% 13.89% 11.95%01:31–02:00 7.09% 8.72% 6.11% 5.01%02:01and more 10.14% 8.72% 9.03% 5.31%
The table of column relative frequenciesclearly shows that differences in the length ofdelay in individual months are not significant.The only conclusion is that longer delays overone hour occur least frequently in August, whilewhen it comes to shorter delays, it is the otherway round; see Tab. 9.
100 Martina Zámková, Luboš Střelec and Martin Prokop …
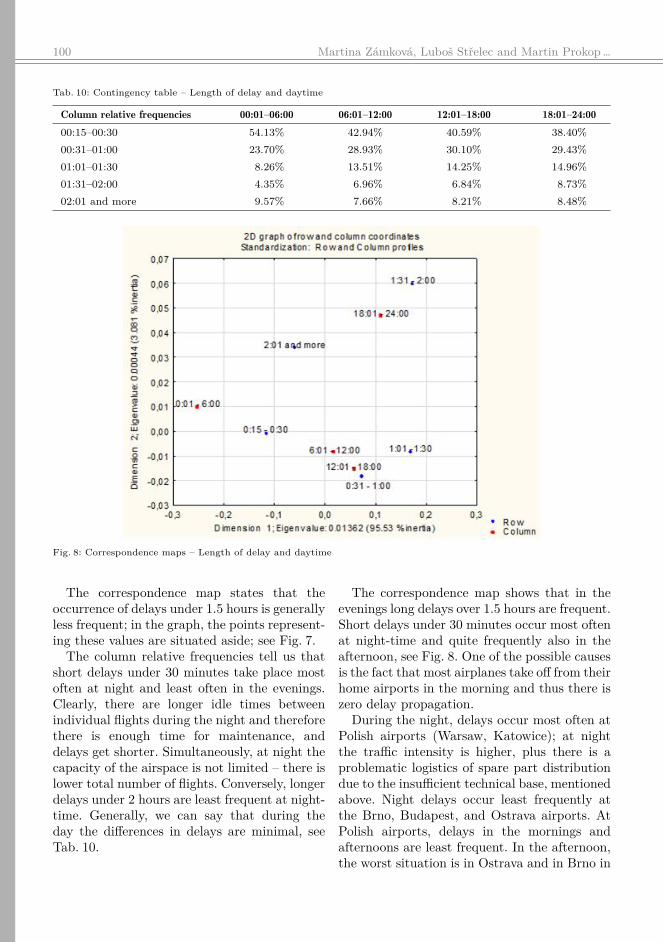
Tab. 10: Contingency table – Length of delay and daytime
Column relative frequencies 00:01–06:00 06:01–12:00 12:01–18:00 18:01–24:0000:15–00:30 54.13% 42.94% 40.59% 38.40%00:31–01:00 23.70% 28.93% 30.10% 29.43%01:01–01:30 8.26% 13.51% 14.25% 14.96%01:31–02:00 4.35% 6.96% 6.84% 8.73%02:01 and more 9.57% 7.66% 8.21% 8.48%
Fig. 8: Correspondence maps – Length of delay and daytime
The correspondence map states that theoccurrence of delays under 1.5 hours is generallyless frequent; in the graph, the points represent-ing these values are situated aside; see Fig. 7.
The column relative frequencies tell us thatshort delays under 30 minutes take place mostoften at night and least often in the evenings.Clearly, there are longer idle times betweenindividual flights during the night and thereforethere is enough time for maintenance, anddelays get shorter. Simultaneously, at night thecapacity of the airspace is not limited – there islower total number of flights. Conversely, longerdelays under 2 hours are least frequent at night-time. Generally, we can say that during theday the differences in delays are minimal, seeTab. 10.
The correspondence map shows that in theevenings long delays over 1.5 hours are frequent.Short delays under 30 minutes occur most oftenat night-time and quite frequently also in theafternoon, see Fig. 8. One of the possible causesis the fact that most airplanes take off from theirhome airports in the morning and thus there iszero delay propagation.
During the night, delays occur most often atPolish airports (Warsaw, Katowice); at nightthe traffic intensity is higher, plus there is aproblematic logistics of spare part distributiondue to the insufficient technical base, mentionedabove. Night delays occur least frequently atthe Brno, Budapest, and Ostrava airports. AtPolish airports, delays in the mornings andafternoons are least frequent. In the afternoon,the worst situation is in Ostrava and in Brno in
Flight Delay Causes at Selected Visegrad Group International Airports 101
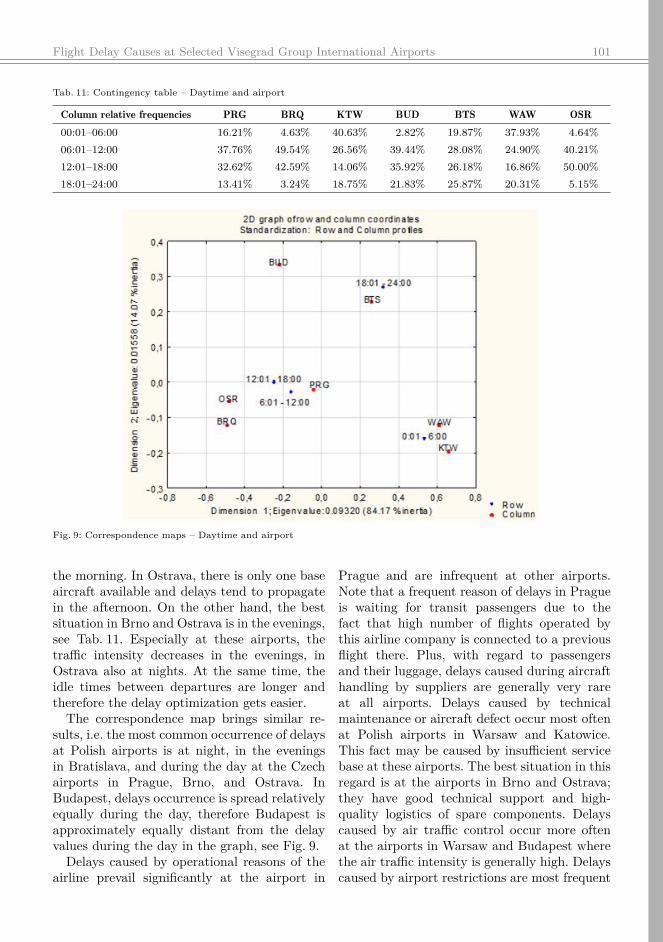
Tab. 11: Contingency table – Daytime and airport
Column relative frequencies PRG BRQ KTW BUD BTS WAW OSR00:01–06:00 16.21% 4.63% 40.63% 2.82% 19.87% 37.93% 4.64%06:01–12:00 37.76% 49.54% 26.56% 39.44% 28.08% 24.90% 40.21%12:01–18:00 32.62% 42.59% 14.06% 35.92% 26.18% 16.86% 50.00%18:01–24:00 13.41% 3.24% 18.75% 21.83% 25.87% 20.31% 5.15%
Fig. 9: Correspondence maps – Daytime and airport
the morning. In Ostrava, there is only one baseaircraft available and delays tend to propagatein the afternoon. On the other hand, the bestsituation in Brno and Ostrava is in the evenings,see Tab. 11. Especially at these airports, thetraffic intensity decreases in the evenings, inOstrava also at nights. At the same time, theidle times between departures are longer andtherefore the delay optimization gets easier.
The correspondence map brings similar re-sults, i.e. the most common occurrence of delaysat Polish airports is at night, in the eveningsin Bratislava, and during the day at the Czechairports in Prague, Brno, and Ostrava. InBudapest, delays occurrence is spread relativelyequally during the day, therefore Budapest isapproximately equally distant from the delayvalues during the day in the graph, see Fig. 9.
Delays caused by operational reasons of theairline prevail significantly at the airport in
Prague and are infrequent at other airports.Note that a frequent reason of delays in Pragueis waiting for transit passengers due to thefact that high number of flights operated bythis airline company is connected to a previousflight there. Plus, with regard to passengersand their luggage, delays caused during aircrafthandling by suppliers are generally very rareat all airports. Delays caused by technicalmaintenance or aircraft defect occur most oftenat Polish airports in Warsaw and Katowice.This fact may be caused by insufficient servicebase at these airports. The best situation in thisregard is at the airports in Brno and Ostrava;they have good technical support and high-quality logistics of spare components. Delayscaused by air traffic control occur more oftenat the airports in Warsaw and Budapest wherethe air traffic intensity is generally high. Delayscaused by airport restrictions are most frequent
102 Martina Zámková, Luboš Střelec and Martin Prokop …
Tab. 12: Contingency table – Causes of delay and airport
Column relative frequencies PRG BRQ KTW BUD BTS WAW OSRAIC 19.79% 2.78% 1.56% 1.41% 4.10% 0.77% 0.52%PB 2.41% 0.00% 3.13% 1.41% 0.95% 1.15% 1.55%ARH 1.63% 0.00% 0.00% 1.41% 4.42% 2.30% 0.00%TAE 10.03% 3.24% 29.69% 13.38% 16.09% 21.84% 4.64%FOC 7.36% 4.63% 9.38% 5.63% 10.73% 9.58% 2.58%ATFMR 8.92% 8.33% 7.81% 14.79% 5.68% 13.03% 8.25%AGA 5.99% 0.46% 1.56% 4.23% 0.32% 7.66% 1.03%R 41.47% 76.39% 43.75% 54.23% 55.21% 36.78% 80.93%MISC 2.41% 4.17% 3.13% 3.52% 2.52% 6.90% 0.52%
in Warsaw, Prague, and Budapest. The delaysare probably caused due to the full utilisation ofthe capacity of these airports. Problems causedby delayed previous flights occur generally themost often, most of all at the airports in Brnoand Ostrava, quite often also at the airportsin Budapest and Bratislava; see Tab. 12. Theseairports do not have other airplanes available toenable delay optimization. Due to low frequencyvalues in the contingency table, it was notpossible to carry out Pearson’s chi-squared testor correspondence analysis.
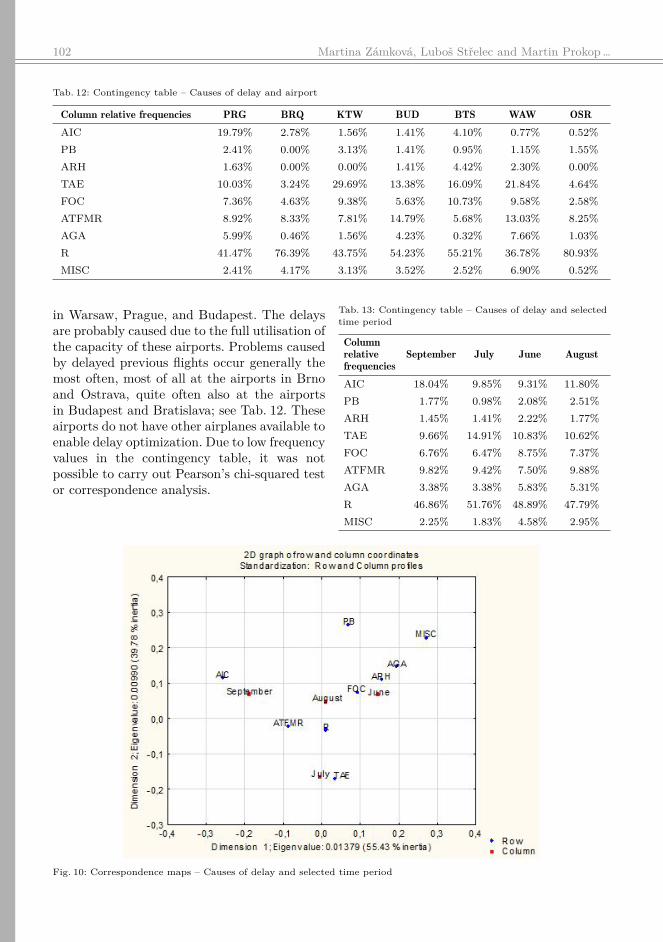
Tab. 13: Contingency table – Causes of delay and selectedtime period
Columnrelativefrequencies
September July June August
AIC 18.04% 9.85% 9.31% 11.80%PB 1.77% 0.98% 2.08% 2.51%ARH 1.45% 1.41% 2.22% 1.77%TAE 9.66% 14.91% 10.83% 10.62%FOC 6.76% 6.47% 8.75% 7.37%ATFMR 9.82% 9.42% 7.50% 9.88%AGA 3.38% 3.38% 5.83% 5.31%R 46.86% 51.76% 48.89% 47.79%MISC 2.25% 1.83% 4.58% 2.95%
Fig. 10: Correspondence maps – Causes of delay and selected time period
Flight Delay Causes at Selected Visegrad Group International Airports 103
The table of column relative frequenciesshows that delays caused by operational rea-sons of the airline prevail in the month ofSeptember. Plus, it shows that delays associatedwith passengers and their baggage and delayscaused by supplier companies during aircrafthandling are very rare during the referenceperiod. Delays caused by technical maintenanceor aircraft defect are most frequent in July.As July is usually considered to be the peakseason, more problems occur, and more frequentmaintenance is necessary. Delays caused byoperational control and crew duty norms donot differ significantly during the period underreview and fluctuate around 7%. Delays causedby air traffic control do not change significantlyeither and they reach approx. 9%. Problemscaused by propagation of delays occur mostoften in July; see Tab. 13. In July, there isslightly higher delay probability due to over-loaded airports.
The correspondence map shows that propa-gation of delays is situated in the middle of thegraph and is approximately equally distant fromall time periods. This is the most frequent delayreason, and it does not change significantlyduring the period under review. The results
are similar to those in the contingency table;it is therefore evident that the delay caused byoperational reasons of the airline prevails in themonth of September. Delays caused by technicalmaintenance or aircraft defect are most frequentin July; see Fig. 10.
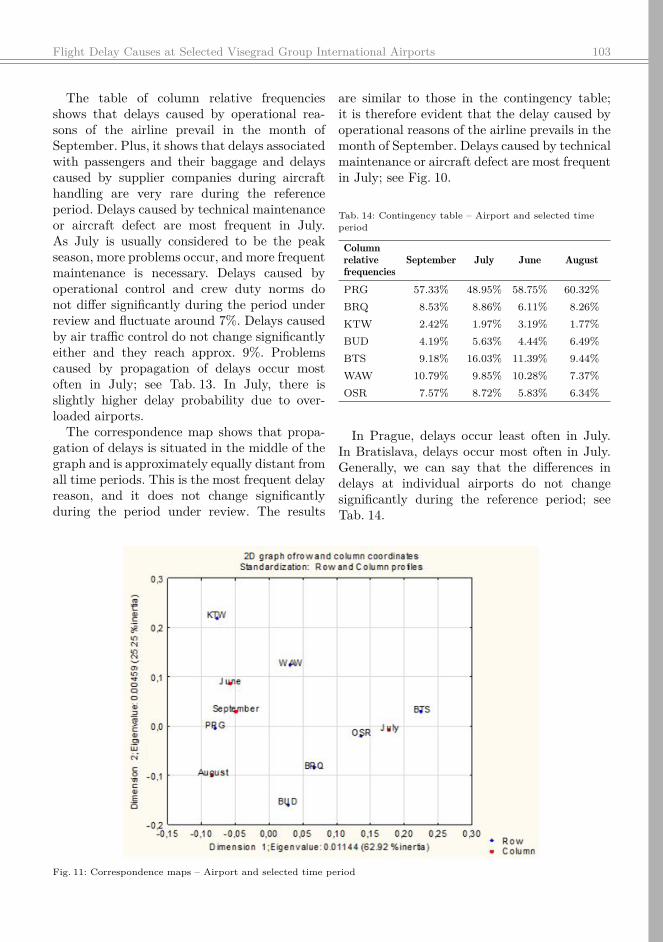
Tab. 14: Contingency table – Airport and selected timeperiod
Columnrelativefrequencies
September July June August
PRG 57.33% 48.95% 58.75% 60.32%BRQ 8.53% 8.86% 6.11% 8.26%KTW 2.42% 1.97% 3.19% 1.77%BUD 4.19% 5.63% 4.44% 6.49%BTS 9.18% 16.03% 11.39% 9.44%WAW 10.79% 9.85% 10.28% 7.37%OSR 7.57% 8.72% 5.83% 6.34%
In Prague, delays occur least often in July.In Bratislava, delays occur most often in July.Generally, we can say that the differences indelays at individual airports do not changesignificantly during the reference period; seeTab. 14.
Fig. 11: Correspondence maps – Airport and selected time period
104 Martina Zámková, Luboš Střelec and Martin Prokop …
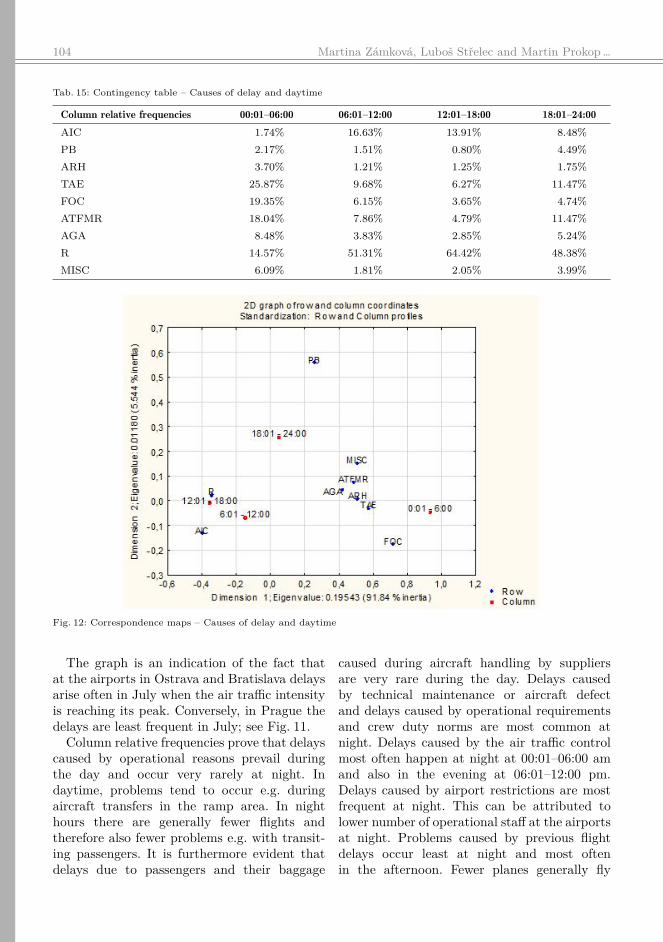
Tab. 15: Contingency table – Causes of delay and daytime
Column relative frequencies 00:01–06:00 06:01–12:00 12:01–18:00 18:01–24:00AIC 1.74% 16.63% 13.91% 8.48%PB 2.17% 1.51% 0.80% 4.49%ARH 3.70% 1.21% 1.25% 1.75%TAE 25.87% 9.68% 6.27% 11.47%FOC 19.35% 6.15% 3.65% 4.74%ATFMR 18.04% 7.86% 4.79% 11.47%AGA 8.48% 3.83% 2.85% 5.24%R 14.57% 51.31% 64.42% 48.38%MISC 6.09% 1.81% 2.05% 3.99%
Fig. 12: Correspondence maps – Causes of delay and daytime
The graph is an indication of the fact thatat the airports in Ostrava and Bratislava delaysarise often in July when the air traffic intensityis reaching its peak. Conversely, in Prague thedelays are least frequent in July; see Fig. 11.
Column relative frequencies prove that delayscaused by operational reasons prevail duringthe day and occur very rarely at night. Indaytime, problems tend to occur e.g. duringaircraft transfers in the ramp area. In nighthours there are generally fewer flights andtherefore also fewer problems e.g. with transit-ing passengers. It is furthermore evident thatdelays due to passengers and their baggage
caused during aircraft handling by suppliersare very rare during the day. Delays causedby technical maintenance or aircraft defectand delays caused by operational requirementsand crew duty norms are most common atnight. Delays caused by the air traffic controlmost often happen at night at 00:01–06:00 amand also in the evening at 06:01–12:00 pm.Delays caused by airport restrictions are mostfrequent at night. This can be attributed tolower number of operational staff at the airportsat night. Problems caused by previous flightdelays occur least at night and most oftenin the afternoon. Fewer planes generally fly
Flight Delay Causes at Selected Visegrad Group International Airports 105
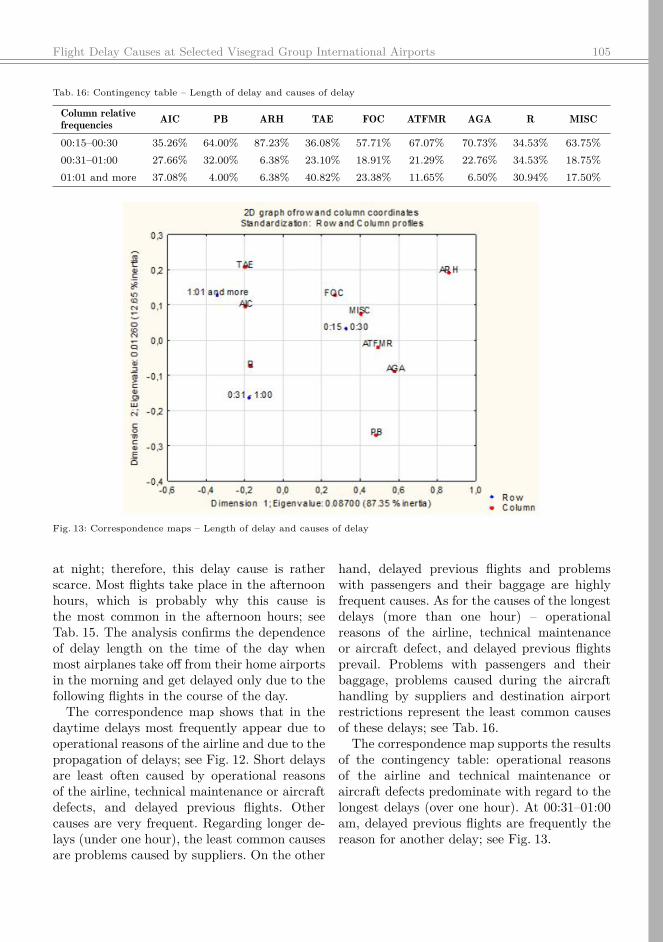
Tab. 16: Contingency table – Length of delay and causes of delay
Column relativefrequencies AIC PB ARH TAE FOC ATFMR AGA R MISC
00:15–00:30 35.26% 64.00% 87.23% 36.08% 57.71% 67.07% 70.73% 34.53% 63.75%00:31–01:00 27.66% 32.00% 6.38% 23.10% 18.91% 21.29% 22.76% 34.53% 18.75%01:01 and more 37.08% 4.00% 6.38% 40.82% 23.38% 11.65% 6.50% 30.94% 17.50%
Fig. 13: Correspondence maps – Length of delay and causes of delay
at night; therefore, this delay cause is ratherscarce. Most flights take place in the afternoonhours, which is probably why this cause isthe most common in the afternoon hours; seeTab. 15. The analysis confirms the dependenceof delay length on the time of the day whenmost airplanes take off from their home airportsin the morning and get delayed only due to thefollowing flights in the course of the day.
The correspondence map shows that in thedaytime delays most frequently appear due tooperational reasons of the airline and due to thepropagation of delays; see Fig. 12. Short delaysare least often caused by operational reasonsof the airline, technical maintenance or aircraftdefects, and delayed previous flights. Othercauses are very frequent. Regarding longer de-lays (under one hour), the least common causesare problems caused by suppliers. On the other
hand, delayed previous flights and problemswith passengers and their baggage are highlyfrequent causes. As for the causes of the longestdelays (more than one hour) – operationalreasons of the airline, technical maintenanceor aircraft defect, and delayed previous flightsprevail. Problems with passengers and theirbaggage, problems caused during the aircrafthandling by suppliers and destination airportrestrictions represent the least common causesof these delays; see Tab. 16.
The correspondence map supports the resultsof the contingency table: operational reasonsof the airline and technical maintenance oraircraft defects predominate with regard to thelongest delays (over one hour). At 00:31–01:00am, delayed previous flights are frequently thereason for another delay; see Fig. 13.
106 Martina Zámková, Luboš Střelec and Martin Prokop …
4 DISCUSSION AND CONCLUSIONS
The principal objective of this paper was toevaluate and assess the delay-caused problemsat selected airports in the V4 countries. Thecluster analysis paired with internal informa-tion from the airline allowed for the selection ofthe “Base Airports”. At first, all flights at theselected airports were taken into consideration,which led to the conclusion that: scheduledflights are delayed (approx.) just as much aschartered flights; delays occur most frequentlyin June; and Boeing 737-800 reported de-lays more frequently than Airbus A320. TheKruskal-Walis test allowed for the identificationof statistically significant differences betweenindividual categories. Further analysis of se-lected airports revealed additional interestingfacts.
As for the frequency of delays, the airportin Katowice reports the best results, while thehighest number of delayed flights occurs at theairport in Budapest. A possible solution of thesituation in Budapest could be adding anotheraircraft to the base. In general, we may concludethat the frequency of delayed flights increaseswith the size of the city and the airport.Although there are generally fewer delayedflights in Katowice, the delays are often longerthan one hour. Our recommendation would beto work on the technical support in Katowice,since long delays arising at this airport are usu-ally caused by technical maintenance or aircraftdefects (as demonstrated by the follow-up anal-ysis of individual delay causes). The analysisfurther revealed advantages at the Brno andOstrava airports where the technical supportruns smoothly. In Prague and Brno, shortdelays under one hour occur often. Especially inPrague, the situation is satisfactory thanks tothe higher number of available aircraft. Shortdelays under 30 minutes occur most often atnight and least often in the evenings. Fewerflights are operated at night and thus thereis more time for aircraft maintenance betweenindividual flights. Conversely, long delays over1.5 hours are frequent in the evenings due tohigh intensity of air traffic. Most aircrafts takeoff from their home airports in the morningstherefore only short delays under 30 minutes
often occur at night and in the afternoon.During the day delays tend to propagate,as shown in the analysis of delay causes bydaytime, while apparently problems caused bydelayed previous flights occur least frequentlyat night and most frequently in the afternoon.An analysis of the propagation of delays tosubsequent flights is provided in the article byCampanelli et al. (2014) which focuses on theairline systems behaving in a nonlinear waythat is difficult to predict. Models for delayprediction in air transport are introduced aswell in an article by Rebollo and Balakrishnan(2014).
Delays caused due to operational reasons ofthe airline dominate significantly at the Pragueairport, as they are rare elsewhere. In Praguethere are many connecting flights operated bythe airline under review and it is often necessaryto wait for transiting passengers. Delays causedby air traffic control and airport restrictions aremore often reported from the airports in War-saw, Prague, and Budapest due to significanttraffic intensity. Problems caused by delayedprevious flights generally occur more often atthe airports in Brno, Ostrava, Budapest, andBratislava, where there is no aircraft availableto optimize possible delays.
Delays caused by technical maintenance oraircraft defects are most frequent in July, asthere are generally most flights in July, andthat is when technical problems are encounteredmore often, and more frequent maintenance isnecessary. Propagation of delays occurs mostfrequently again in July. Delays caused by oper-ational reasons of the airline are frequent duringthe day. There is generally a high number offlights during the day and there are problemse.g. with transiting passengers and aircrafttransfers in the ramp area. Delays caused bytechnical maintenance or aircraft defects anddelays caused by operational requirement andcrew duty norms are most common at night.Service inspections are usually done at nightas there is lower flight demand which allowstime and space for more demanding serviceoperations. If there is a crew member absence,it is difficult to find a replacement at night.
Flight Delay Causes at Selected Visegrad Group International Airports 107
Optimization of delays emerging due to aircraftand crew scheduling has been addressed byAhmadBeygi et al. (2008). Delays caused by airtraffic control occur most often at night andalso in the evening. The reason behind this maybe the fact that the times 04:00–06:00 am and06:00–09:00 pm are the busiest for the airportairspace capacities. Flight optimization optionsof the air traffic control have been covered inthe works of Wu et al. (2016) and Belkoura etal. (2016). Delays caused by airport restrictionsappear most frequently at night when airportstaff is limited.
Our analysis has proven that delays triggeredin association with passengers and their bag-gage are not a common problem at the airportsunder review; the articles by Huang et al. (2016)and Abdelghany et al. (2006) deal with thequestion of how to solve the possible problemsin this area.
Zámková et al. (2017) proved that the mostfrequent cause of delay is the propagation ofdelays, which tends to increase during the day.According to our analysis of home base V4airports, the longest delays (two hours or more)occur at night and again, the delay propagation
is to blame. Furthermore, both charter andscheduled flights apparently have the samepercentage of delayed flights, delays occur mostfrequently in June, and Boeing 737-800 reportsdelays more frequently than Airbus A320. Thelongest delays (over 2 hours) were reported fromKatowice and Budapest.
All tested dependences have appeared to bestatistically dependent (p-value under 0.001).The findings of this research have been con-sulted with an expert working in the aircraftcompany.
The majority of our findings may be gener-alised and applied to smaller airlines operatingat the airports of the Visegrad Group. How-ever, airlines today have completely differentconcerns, considering the consequences of theongoing Covid-19 pandemic. Still, it is ourbelief, that everything will be back to normalsoon before long and the travel industry will re-turn to its pre-covid state. When this happens,airlines will once again strive to eliminate flightdelays, and this study may provide some usefulinsights, helping with the adoption of strategicmeasures to curb the number and length of theirdelays.
5 REFERENCES
Abdelghany, A., Abdelghany, K. andNarasimhan, R. 2006. Scheduling Baggage-Handling Facilities in Congested Airports. Journalof Air Transport Management, 12 (2), 76–81.DOI: 10.1016/j.jairtraman.2005.10.001.
Agresti, A. 1990. Categorical Data Analysis. NewYork: John Wiley & Sons.
AhmadBeygi, S., Cohn, A., Guan, Y. andBelobaba, P. 2008. Analysis of the Potential forDelay Propagation in Passenger Airline Networks.Journal of Air Transport Management. 14 (5),221–236. DOI: 10.1016/j.jairtraman.2008.04.010.
Alsyouf, I., Humaid, F. and Al Kamali, S.2015. Mishandled Baggage Problem: Causesand Improvement Suggestions. In 2014 IEEEInternational Conference on Industrial Engineeringand Engineering Management, Selangor, Malaysia,pp. 154–158. DOI: 10.1109/IEEM.2014.7058619.
Anděl, J. 2005. Základy matematické statistiky. Praha:Matfyzpress. ISBN 80-86732-40-1.
Belkoura, S., Peña, J. M. and Zanin, M. 2016.Generation and Recovery of Airborne Delaysin Air Transport. Transportation Research
Part C: Emerging Technologies, 69, 436–450.DOI: 10.1016/j.trc.2016.06.018.
Campanelli, B., Fleurquin, P., Eguíluz, V. M.,Ramasco, J. J., Arranz, A., Extebarria, I. andCiruelos, C. 2014. Modeling Reactionary Delaysin the European Air Transport Network. In 4thSESAR Innovation Days, Madrid, Spain.
Eurocontrol. 2020. Central Office forDelay Analysis [online]. Available at:http://www.eurocontrol.int/articles/central-office-delay-analysis-coda.[Accessed 2020, September 25].
European Consumer Centre Czech Republic. 2020. Lawson Air Transport [online]. Available at: http://www.evropskyspotrebitel.cz/eng/letecka-doprava/letecka-doprava-predpisy-27143.[Accessed 2020, December 19].
Forbes, S. J., Lederman, M. and Tombe, T.2015. Quality Disclosure Programs andInternal Organizational Practices: Evidencefrom Airline Flight Delays. AmericanEconomic Journal: Microeconomics, 7 (2),1–26. DOI: 10.1257/mic.20130164.
108 Martina Zámková, Luboš Střelec and Martin Prokop …
Greenacre, M. J. 1984. Theory and Applicationsof Correspondence Analysis. London: AcademicPress.
Hebák, P., Hustopecký, J., Pecáková, I., Průša, M.,Řezanková, H., Svobodová, A. and Vlach, P.2007. Vícerozměrné statistické metody 3. Praha:Informatorium.
Hendl, J. 2006. Přehled statistických metod: analýzaa metaanalýza dat. Praha: Portál.
Hindls, R., Hronová, S. and Seger, J. 2003. Statistikapro ekonomy. Praha: Professional Publishing.
Huang, E., Mital, P., Goetschalckx, M. andWu, K. 2016. Optimal Assignment of AirportBaggage Unloading Zones to Outgoing Flights.Transportation Research Part E: Logisticsand Transportation Review, 94, 110–122.DOI: 10.1016/j.tre.2016.07.012.
Jiang, H. and Ren, X.-H. 2018. Passenger ChoiceBehavior Model and Empirical Study under FlightDelay Information. Journal of TransportationSystems Engineering and Information Technology,18 (4), 188–193. DOI: 10.16097/j.cnki.1009-6744.2018.04.028.
Pamplona, D. A., Weigang, L., de Barros, A. G.,Shiguemori, E. H. and Alves, C. J. P. 2018.Supervised Neural Network with Multilevel InputLayers for Predicting of Air Traffic Delays. In2018 International Joint Conference on NeuralNetworks (IJCNN), Rio de Janeiro, Brazil.DOI: 10.1109/IJCNN.2018.8489511.
Rebollo, J. J. and Balakrishnan, H. 2014.Characterization and Prediction of AirTraffic Delays. Transportation Research PartC: Emerging Technologies, 44, 231–241.DOI: 10.1016/j.trc.2014.04.007.
Řezanková, H. 1997. Analýza kategoriálních datpomocí SPSS. Praha: VŠE.
Serhan, D., Lee, H. and Yoon, S. W. 2018.Minimizing Airline and Passenger Delay Cost inAirport Surface and Terminal Airspace Operations.Journal of Air Transport Management, 73,120–133. DOI: 10.1016/j.jairtraman.2018.07.001.
Skorupski, J. and Wierzbińska, M. 2015. A Methodto Evaluate the Time of Waiting for a LatePassenger. Journal of Air Transport Management,47, 79–89. DOI: 10.1016/j.jairtraman.2015.05.001.
Stone, M. J. 2018. Impact of Delays and Cancellationson Travel from Small Community Airports.Tourism and Hospitality Research, 18 (2), 214–228.DOI: 10.1177/1467358416637252.
Wang, Y., Cao, Y., Zhu, C., Wu, F., Hu, M.,Duong, V., Watkins, M., Barzel, B. andStanley, H. E. 2020. Universal Patterns inPassenger Flight Departure Delays. ScientificReports, 10 (1), Article number 6890.
Wang, Y.-J., Zhu, Y.-F., Zhu, C.-P., Wu, F., Yang,H.-J., Yan, Y.-J. and Hu, C.-K. 2019. Indicatorof Serious Flight Delays with the Approach ofTime-Delay Stability. Physica A: StatisticalMechanics and its Applications, 518, 363–373.DOI: 10.1016/j.physa.2018.11.038.
Wu, C.-L. and Law, K. 2019. Modelling theDelay Propagation Effects of Multiple ResourceConnections in an Airline Network Using aBayesian Network Model. Transportation ResearchPart E: Logistics and Transportation Review, 122,62–77. DOI. 10.1016/j.tre.2018.11.004.
Wu, C.-L. and Truong, T. 2014. Improving the IATADelay Data Coding System for Enhanced DataAnalytics. Journal of Air Transport Management40, 78–85. DOI: 10.1016/j.jairtraman.2014.06.001.
Wu, X.-P., Yang, H.-Y. and Han, S.-C. 2016. Analysison Network Properties of Multivariate Mixed AirTraffic Management Technical Support SystemBased on Complex Network Theory. Acta PhysicaSinica, 65 (14). DOI. 10.7498/aps.65.140203.
Zámková, M., Blašková, V. and IsseverGrochová, L. 2018. Identification of FactorsAffecting the Aircraft Delay in Popular GreekDestinations. In AIP Conference Proceedings,1978 (1). DOI: 10.1063/1.5043744.
Zámková, M., Prokop, M. and Stolín, R. 2017.Factors Influencing Flight Delays of a EuropeanAirline. Acta Universitatis Agriculturae etSilviculturae Mendelianae Brunensis, 65 (5),1799–1807. DOI: 10.11118/actaun201765051799.
AUTHOR’S ADDRESSMartina Zámková, Department of Mathematics, College of Polytechnics Jihlava, Tolstého 16,586 01 Jihlava, Czech Republic, e-mail: [email protected]
Luboš Střelec, Department of Statistics and Operation Analysis, Faculty of Business andEconomics, Zemědělská 1, 613 00 Brno, Czech Republic, e-mail: [email protected]
Martin Prokop, Department of Mathematics, College of Polytechnics Jihlava, Tolstého 16,586 01 Jihlava, Czech Republic, e-mail: [email protected]
Radek Stolín, Department of Mathematics, College of Polytechnics Jihlava, Tolstého 16, 586 01Jihlava, Czech Republic, e-mail: [email protected]