Embed Size (px)
Citation preview
Glass forming region, ionic conductivity and infraredspectroscopy of vitreous sodium lead mixed phosphates
M. Abida, M. Et-tabiroua,*, M. Hafidb
aLaboratoire de Physico-Chimie du Solide (LPCS), Universite´ Ibn Tofaıl, Faculte des Sciences, B. P., 133,14000 Kenitra, Morocco
bLaboratoire de Physique des Verres et Ce´ramiques (LPVC), Universite´ Ibn Tofaıl, Faculte des Sciences,B. P., 133, 14000 Ke´nitra, Morocco
(Refereed)Received 3 November 1999; accepted 28 August 2000
Abstract
Conditions of glass formation in the Na2O-PbO-P2O5 system are reported. The glasses have beenstudied over a wide range of compositions. Their physical, thermal and spectroscopic properties suchas density, molar volume, ionic conductivity, glass transition temperature and IR spectrous have beeninvestigated. The correlation between the physical, thermal, spectroscopic and structural propertieshas been shown to be coherent with the experimental results. The structural role of PbO is discussedin the light of these experimental results. An incorporation model of PbO into the network is proposed.© 2001 Elsevier Science Ltd. All rights reserved.
Keywords:A. Glasses; A. Oxides; C. DSC; C. Infrared spectroscopy; D. Ionic conductivity
1. Introduction
The oxides of elements with intermediate electronegativity, such as SiO2, B2O3, P2O5
etc., can form glasses either alone or when mixed with considerable quantities ofnon-glass-forming oxides [1]. For example lead oxide does not form glass alone, but itcan be incorporated [2] in substantial quantities into other glass-forming oxide systemssuch as silicates, borates and phosphates. PbO is known to play a dual structural role both
* Corresponding author. Fax:1212-7-37-27-70.E-mail address:[email protected] (M. Et-tabirou).
Pergamon Materials Research Bulletin 36 (2001) 407–421
0025-5408/01/$ – see front matter © 2001 Elsevier Science Ltd. All rights reserved.PII: S0025-5408(01)00521-9
as a network modifier [3] and as a network former [4 –7] in many oxide glasses. The aimof this work is to report the glass formation range, the physical, thermal and spectro-scopic properties of vitreous sodium and lead mixed phosphates to investigate thestructural role of lead.
2. Experimental
Glasses of the desired composition were prepared by mixing the appropriate amounts ofsodium carbonate, lead oxide, and diammonium hydrogen phosphate according to thereaction scheme
xNa2CO3 1 yPbO1 2z~NH4!2HPO43 @ xNa2O,yPbO,zP2O5#
1 4zNH3m1 3zH2O
m1 xCO2m (1)
Mixtures of the starting materials were first ground in an agate mortar and preheated inalumina crucible at 120°C overnight. They were then fired at temperatures varying between300 and 400°C for 12 hours in order to expel NH3, H2O and CO2. The temperature was thenprogressively increased to 1000°C and held constant at this value for 15 min. The batch wasfinally quenched to room temperature under air atmosphere in order to produce vitreoussamples.
X-ray diffraction patterns was recorded at room temperature with a Siemens D5000diffractometer using CuKa radiation.
Glass density measurements were made using standard Archimedes method with diethylorthophtalate as the immersion fluid. The molar volume, V was calculated from the molec-ular weight, M and densityr (V 5 M/r). The molecular weight, M was calculated using therelation:
M 5 xMNa2O1 yMPbO1 zMP205 (2)
where MNa2O, MPbO and MP2O5 are the molecular weights of Na2O, PbO and P2O5
respectively.The glass transition temperatures were measured on 30–50 mg samples using a SET-
ARAM DSC-141 differential scanning calorimeter with a heating rate at 10°C/min. The Tg
was obtained using the slope intercept method.Electrical conductivity measurements were carried out on samples shaped as disks
with two parallel faces. Before carrying out these measurements, the disks were fired at100°C for one hour, and the surfaces were painted with silver paste. Each disk wasplaced between silver electrodes; slight pressure was applied to make good electricalcontact.
The electrical conductivity was deduced from the conductance (G) at 16 kHz in thetemperature range 80 to 430°C using an automatic Phillips PM 6302 LCR bridge.
Infrared spectra were recorded on Mattson Cygnus 100 FTIR spectrometer on glasspowder dispersed in KBr pellets at room temperature in the range 400-1400 cm-1.
408 M. Abid et al. / Materials Research Bulletin 36 (2001) 407–421
3. Results and discussion
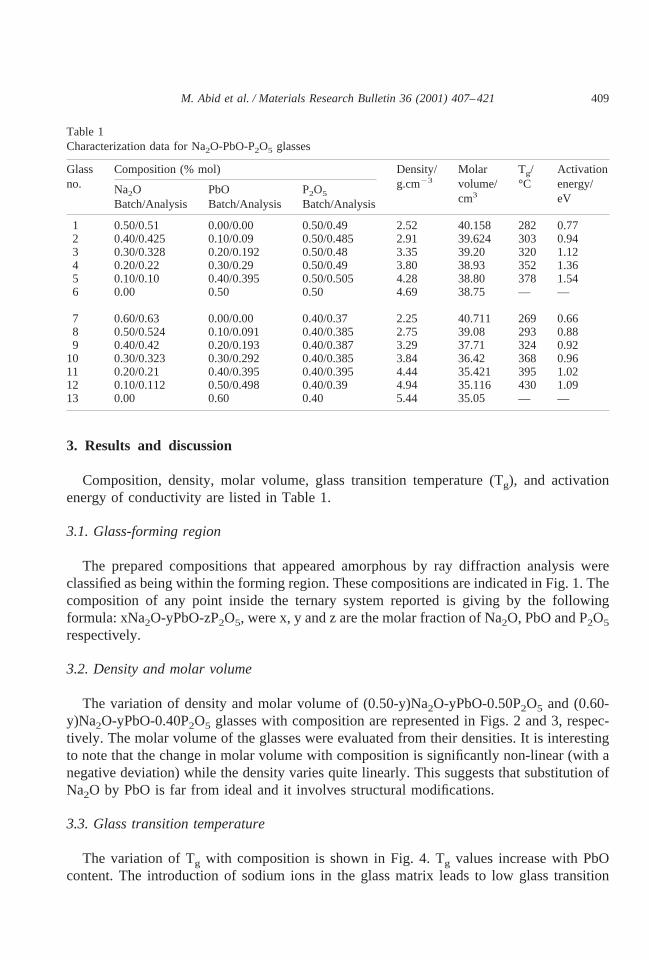
Composition, density, molar volume, glass transition temperature (Tg), and activationenergy of conductivity are listed in Table 1.
3.1. Glass-forming region
The prepared compositions that appeared amorphous by ray diffraction analysis wereclassified as being within the forming region. These compositions are indicated in Fig. 1. Thecomposition of any point inside the ternary system reported is giving by the followingformula: xNa2O-yPbO-zP2O5, were x, y and z are the molar fraction of Na2O, PbO and P2O5
respectively.
3.2. Density and molar volume
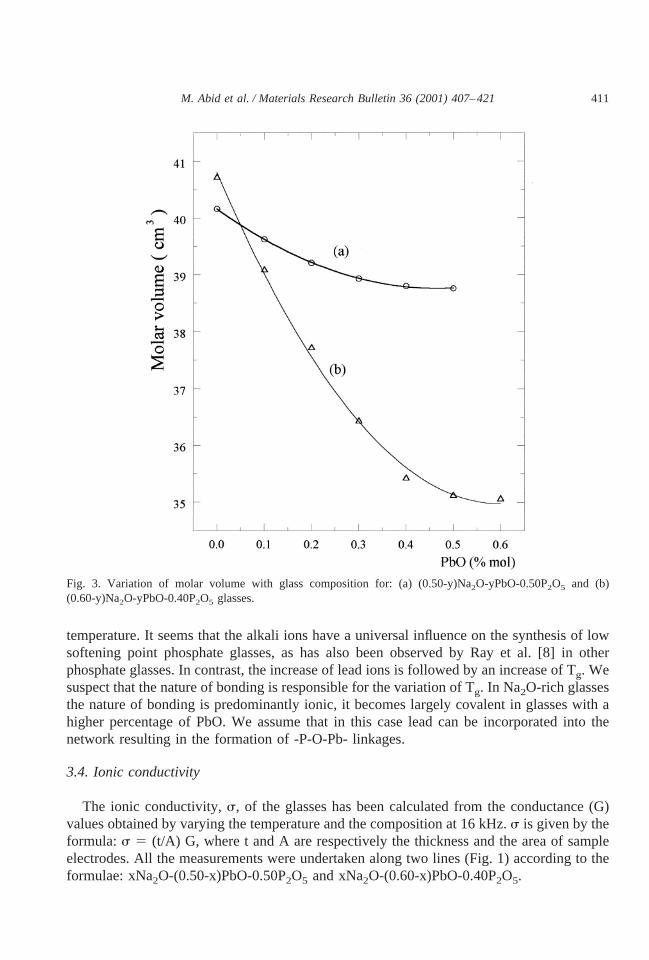
The variation of density and molar volume of (0.50-y)Na2O-yPbO-0.50P2O5 and (0.60-y)Na2O-yPbO-0.40P2O5 glasses with composition are represented in Figs. 2 and 3, respec-tively. The molar volume of the glasses were evaluated from their densities. It is interestingto note that the change in molar volume with composition is significantly non-linear (with anegative deviation) while the density varies quite linearly. This suggests that substitution ofNa2O by PbO is far from ideal and it involves structural modifications.
3.3. Glass transition temperature
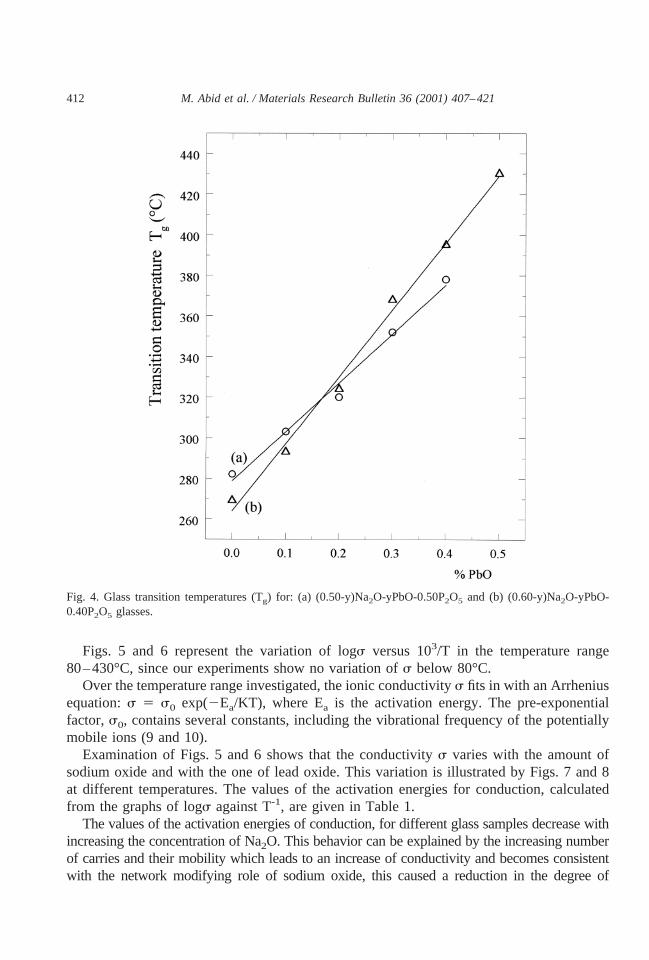
The variation of Tg with composition is shown in Fig. 4. Tg values increase with PbOcontent. The introduction of sodium ions in the glass matrix leads to low glass transition
Table 1Characterization data for Na2O-PbO-P2O5 glasses
Glassno.
Composition (% mol) Density/g.cm23
Molarvolume/cm3
Tg/°C
Activationenergy/eV
Na2OBatch/Analysis
PbOBatch/Analysis
P2O5
Batch/Analysis
1 0.50/0.51 0.00/0.00 0.50/0.49 2.52 40.158 282 0.772 0.40/0.425 0.10/0.09 0.50/0.485 2.91 39.624 303 0.943 0.30/0.328 0.20/0.192 0.50/0.48 3.35 39.20 320 1.124 0.20/0.22 0.30/0.29 0.50/0.49 3.80 38.93 352 1.365 0.10/0.10 0.40/0.395 0.50/0.505 4.28 38.80 378 1.546 0.00 0.50 0.50 4.69 38.75 — —
7 0.60/0.63 0.00/0.00 0.40/0.37 2.25 40.711 269 0.668 0.50/0.524 0.10/0.091 0.40/0.385 2.75 39.08 293 0.889 0.40/0.42 0.20/0.193 0.40/0.387 3.29 37.71 324 0.92
10 0.30/0.323 0.30/0.292 0.40/0.385 3.84 36.42 368 0.9611 0.20/0.21 0.40/0.395 0.40/0.395 4.44 35.421 395 1.0212 0.10/0.112 0.50/0.498 0.40/0.39 4.94 35.116 430 1.0913 0.00 0.60 0.40 5.44 35.05 — —
409M. Abid et al. / Materials Research Bulletin 36 (2001) 407–421
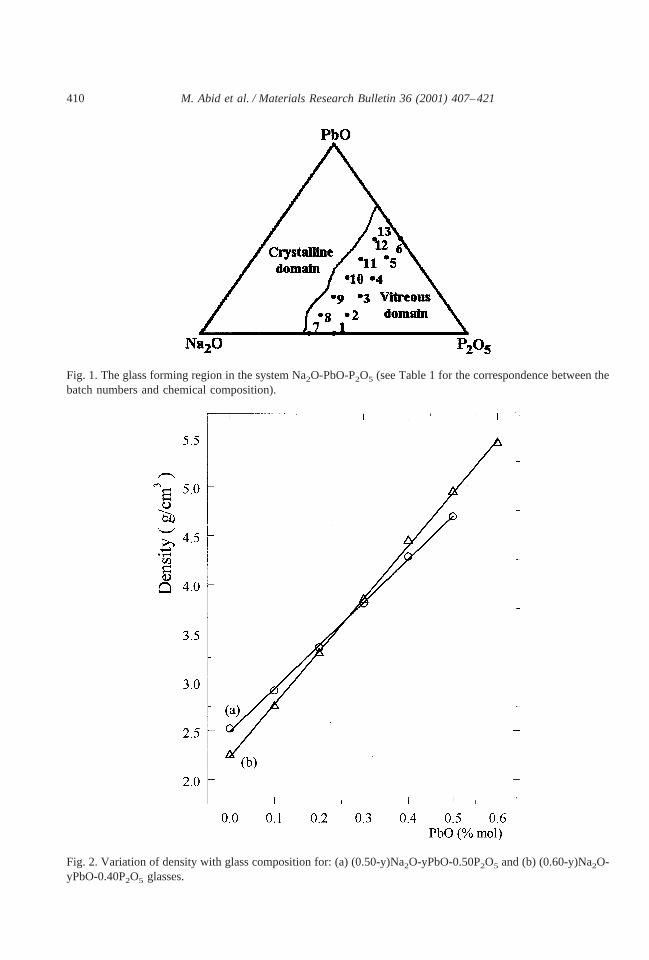
Fig. 1. The glass forming region in the system Na2O-PbO-P2O5 (see Table 1 for the correspondence between thebatch numbers and chemical composition).
Fig. 2. Variation of density with glass composition for: (a) (0.50-y)Na2O-yPbO-0.50P2O5 and (b) (0.60-y)Na2O-yPbO-0.40P2O5 glasses.
410 M. Abid et al. / Materials Research Bulletin 36 (2001) 407–421
temperature. It seems that the alkali ions have a universal influence on the synthesis of lowsoftening point phosphate glasses, as has also been observed by Ray et al. [8] in otherphosphate glasses. In contrast, the increase of lead ions is followed by an increase of Tg. Wesuspect that the nature of bonding is responsible for the variation of Tg. In Na2O-rich glassesthe nature of bonding is predominantly ionic, it becomes largely covalent in glasses with ahigher percentage of PbO. We assume that in this case lead can be incorporated into thenetwork resulting in the formation of -P-O-Pb- linkages.
3.4. Ionic conductivity
The ionic conductivity,s, of the glasses has been calculated from the conductance (G)values obtained by varying the temperature and the composition at 16 kHz.s is given by theformula: s 5 (t/A) G, where t and A are respectively the thickness and the area of sampleelectrodes. All the measurements were undertaken along two lines (Fig. 1) according to theformulae: xNa2O-(0.50-x)PbO-0.50P2O5 and xNa2O-(0.60-x)PbO-0.40P2O5.
Fig. 3. Variation of molar volume with glass composition for: (a) (0.50-y)Na2O-yPbO-0.50P2O5 and (b)(0.60-y)Na2O-yPbO-0.40P2O5 glasses.
411M. Abid et al. / Materials Research Bulletin 36 (2001) 407–421
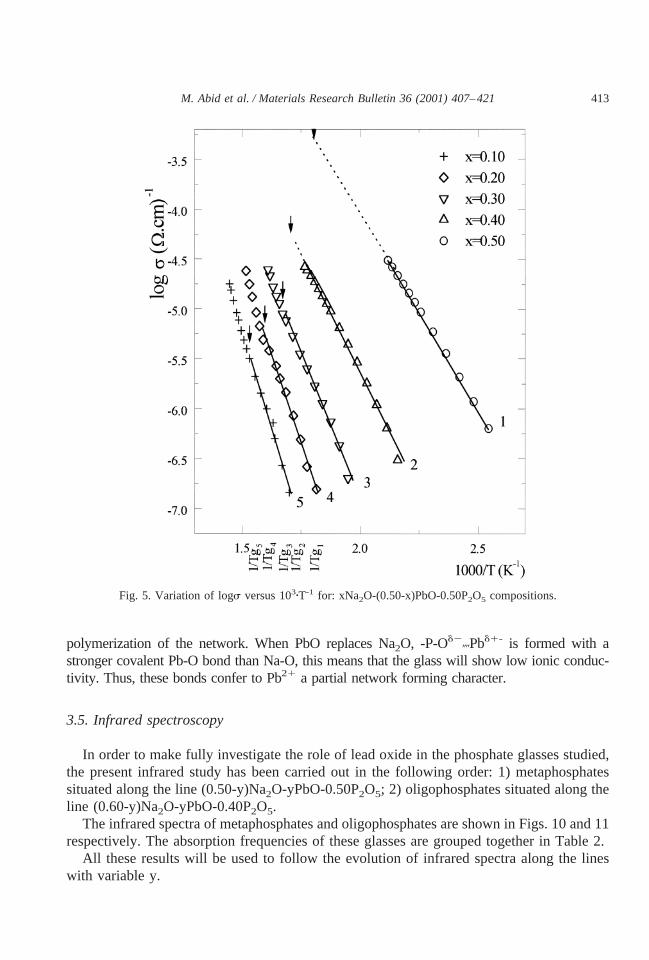
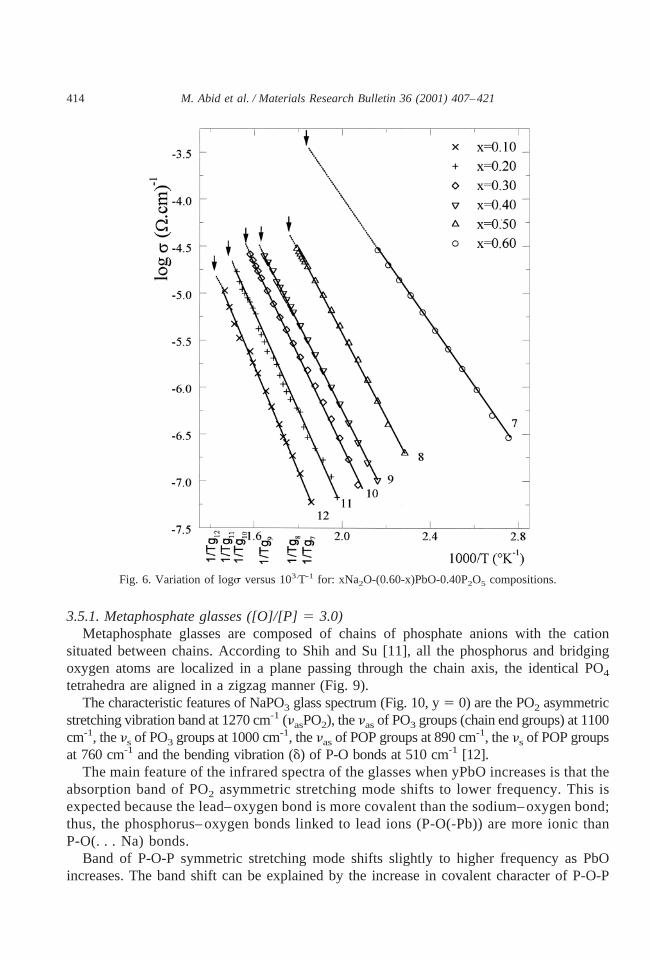
Figs. 5 and 6 represent the variation of logs versus 103/T in the temperature range80–430°C, since our experiments show no variation ofs below 80°C.
Over the temperature range investigated, the ionic conductivitys fits in with an Arrheniusequation:s 5 s0 exp(2Ea/KT), where Ea is the activation energy. The pre-exponentialfactor,s0, contains several constants, including the vibrational frequency of the potentiallymobile ions (9 and 10).
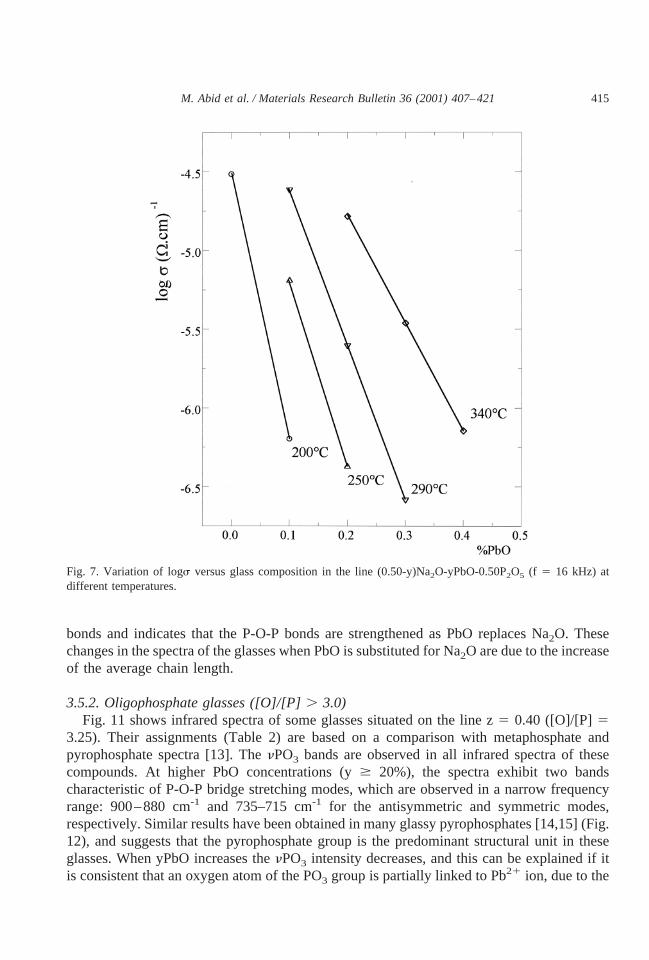
Examination of Figs. 5 and 6 shows that the conductivitys varies with the amount ofsodium oxide and with the one of lead oxide. This variation is illustrated by Figs. 7 and 8at different temperatures. The values of the activation energies for conduction, calculatedfrom the graphs of logs against T-1, are given in Table 1.
The values of the activation energies of conduction, for different glass samples decrease withincreasing the concentration of Na2O. This behavior can be explained by the increasing numberof carries and their mobility which leads to an increase of conductivity and becomes consistentwith the network modifying role of sodium oxide, this caused a reduction in the degree of
Fig. 4. Glass transition temperatures (Tg) for: (a) (0.50-y)Na2O-yPbO-0.50P2O5 and (b) (0.60-y)Na2O-yPbO-0.40P2O5 glasses.
412 M. Abid et al. / Materials Research Bulletin 36 (2001) 407–421
polymerization of the network. When PbO replaces Na2O, -P-Od200Pbd1- is formed with a
stronger covalent Pb-O bond than Na-O, this means that the glass will show low ionic conduc-tivity. Thus, these bonds confer to Pb21 a partial network forming character.
3.5. Infrared spectroscopy
In order to make fully investigate the role of lead oxide in the phosphate glasses studied,the present infrared study has been carried out in the following order: 1) metaphosphatessituated along the line (0.50-y)Na2O-yPbO-0.50P2O5; 2) oligophosphates situated along theline (0.60-y)Na2O-yPbO-0.40P2O5.
The infrared spectra of metaphosphates and oligophosphates are shown in Figs. 10 and 11respectively. The absorption frequencies of these glasses are grouped together in Table 2.
All these results will be used to follow the evolution of infrared spectra along the lineswith variable y.
Fig. 5. Variation of logs versus 103zT-1 for: xNa2O-(0.50-x)PbO-0.50P2O5 compositions.
413M. Abid et al. / Materials Research Bulletin 36 (2001) 407–421
3.5.1. Metaphosphate glasses ([O]/[P]5 3.0)Metaphosphate glasses are composed of chains of phosphate anions with the cation
situated between chains. According to Shih and Su [11], all the phosphorus and bridgingoxygen atoms are localized in a plane passing through the chain axis, the identical PO4
tetrahedra are aligned in a zigzag manner (Fig. 9).The characteristic features of NaPO3 glass spectrum (Fig. 10, y5 0) are the PO2 asymmetric
stretching vibration band at 1270 cm-1 (nasPO2), thenasof PO3 groups (chain end groups) at 1100cm-1, thens of PO3 groups at 1000 cm-1, thenasof POP groups at 890 cm-1, thens of POP groupsat 760 cm-1 and the bending vibration (d) of P-O bonds at 510 cm-1 [12].
The main feature of the infrared spectra of the glasses when yPbO increases is that theabsorption band of PO2 asymmetric stretching mode shifts to lower frequency. This isexpected because the lead– oxygen bond is more covalent than the sodium– oxygen bond;thus, the phosphorus– oxygen bonds linked to lead ions (P-O(-Pb)) are more ionic thanP-O(. . . Na) bonds.
Band of P-O-P symmetric stretching mode shifts slightly to higher frequency as PbOincreases. The band shift can be explained by the increase in covalent character of P-O-P
Fig. 6. Variation of logs versus 103.T-1 for: xNa2O-(0.60-x)PbO-0.40P2O5 compositions.
414 M. Abid et al. / Materials Research Bulletin 36 (2001) 407–421
bonds and indicates that the P-O-P bonds are strengthened as PbO replaces Na2O. Thesechanges in the spectra of the glasses when PbO is substituted for Na2O are due to the increaseof the average chain length.
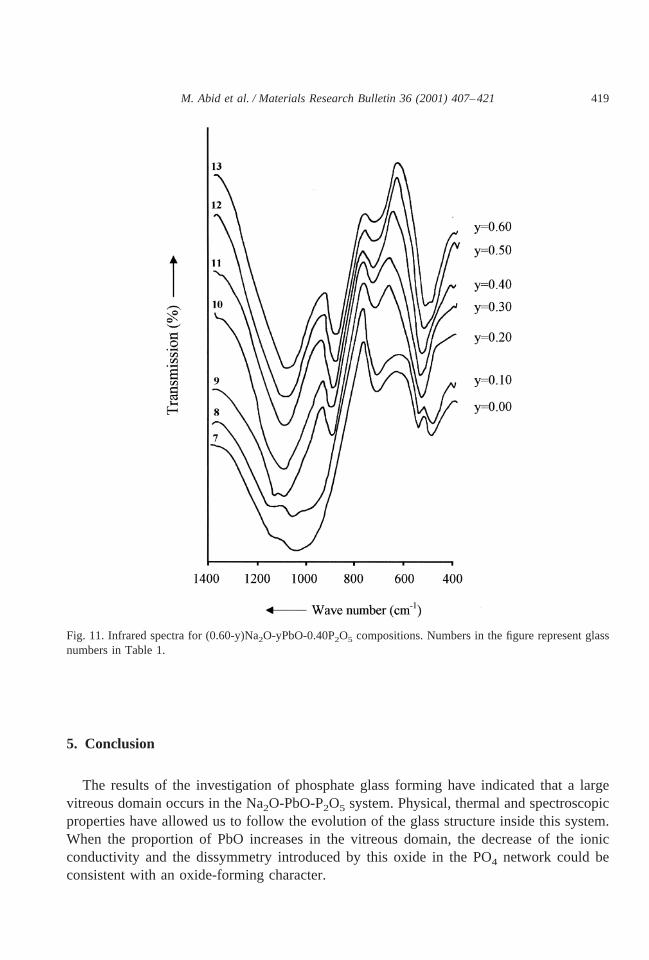
3.5.2. Oligophosphate glasses ([O]/[P]. 3.0)Fig. 11 shows infrared spectra of some glasses situated on the line z5 0.40 ([O]/[P] 5
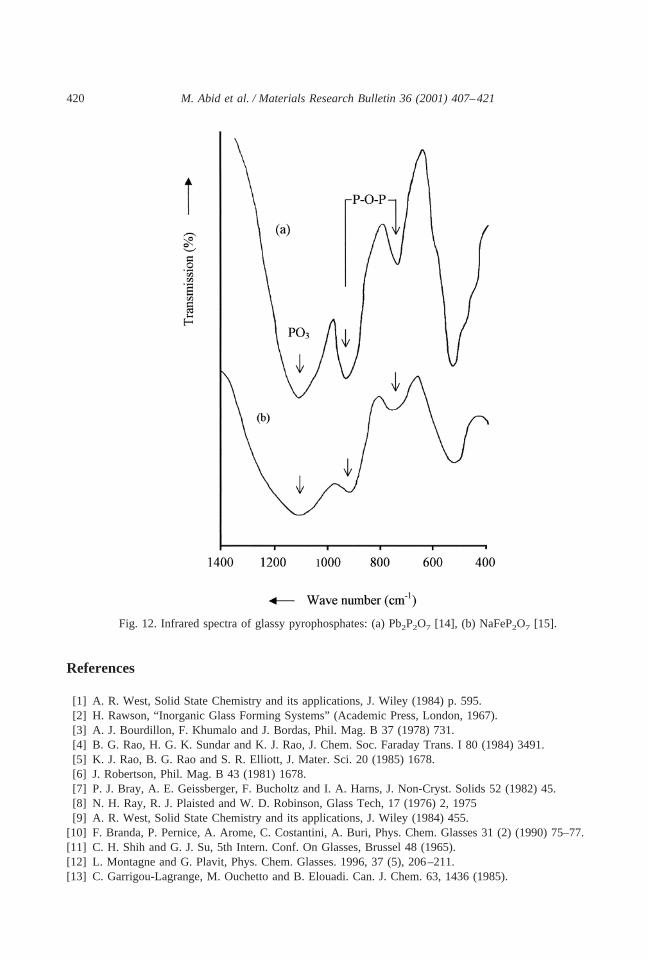
3.25). Their assignments (Table 2) are based on a comparison with metaphosphate andpyrophosphate spectra [13]. ThenPO3 bands are observed in all infrared spectra of thesecompounds. At higher PbO concentrations (y$ 20%), the spectra exhibit two bandscharacteristic of P-O-P bridge stretching modes, which are observed in a narrow frequencyrange: 900–880 cm-1 and 735–715 cm-1 for the antisymmetric and symmetric modes,respectively. Similar results have been obtained in many glassy pyrophosphates [14,15] (Fig.12), and suggests that the pyrophosphate group is the predominant structural unit in theseglasses. When yPbO increases thenPO3 intensity decreases, and this can be explained if itis consistent that an oxygen atom of the PO3 group is partially linked to Pb21 ion, due to the
Fig. 7. Variation of logs versus glass composition in the line (0.50-y)Na2O-yPbO-0.50P2O5 (f 5 16 kHz) atdifferent temperatures.
415M. Abid et al. / Materials Research Bulletin 36 (2001) 407–421
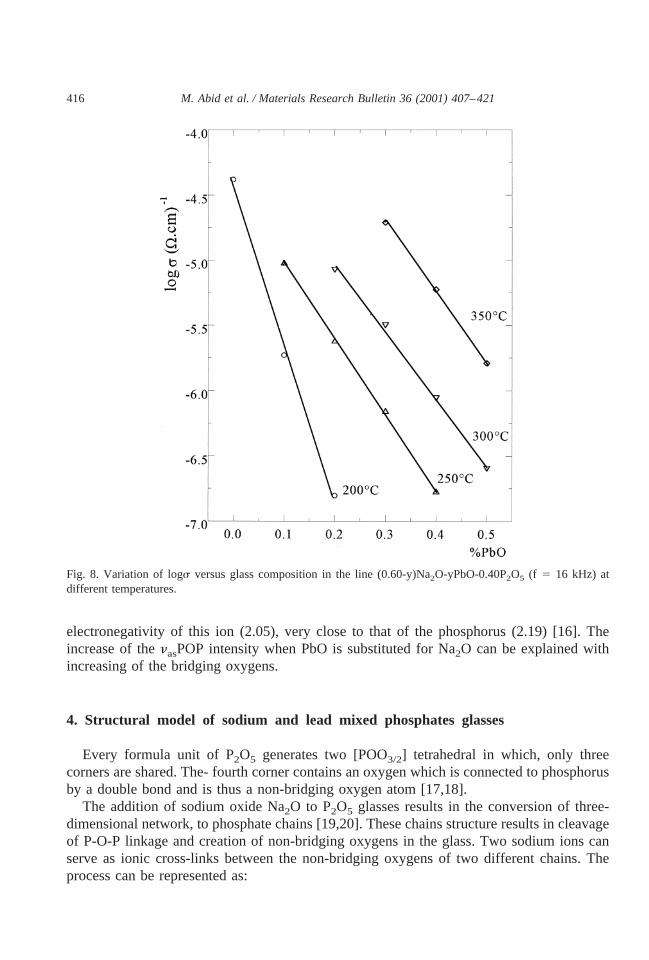
electronegativity of this ion (2.05), very close to that of the phosphorus (2.19) [16]. Theincrease of thenasPOP intensity when PbO is substituted for Na2O can be explained withincreasing of the bridging oxygens.
4. Structural model of sodium and lead mixed phosphates glasses
Every formula unit of P2O5 generates two [POO3/2] tetrahedral in which, only threecorners are shared. The- fourth corner contains an oxygen which is connected to phosphorusby a double bond and is thus a non-bridging oxygen atom [17,18].
The addition of sodium oxide Na2O to P2O5 glasses results in the conversion of three-dimensional network, to phosphate chains [19,20]. These chains structure results in cleavageof P-O-P linkage and creation of non-bridging oxygens in the glass. Two sodium ions canserve as ionic cross-links between the non-bridging oxygens of two different chains. Theprocess can be represented as:
Fig. 8. Variation of logs versus glass composition in the line (0.60-y)Na2O-yPbO-0.40P2O5 (f 5 16 kHz) atdifferent temperatures.
416 M. Abid et al. / Materials Research Bulletin 36 (2001) 407–421
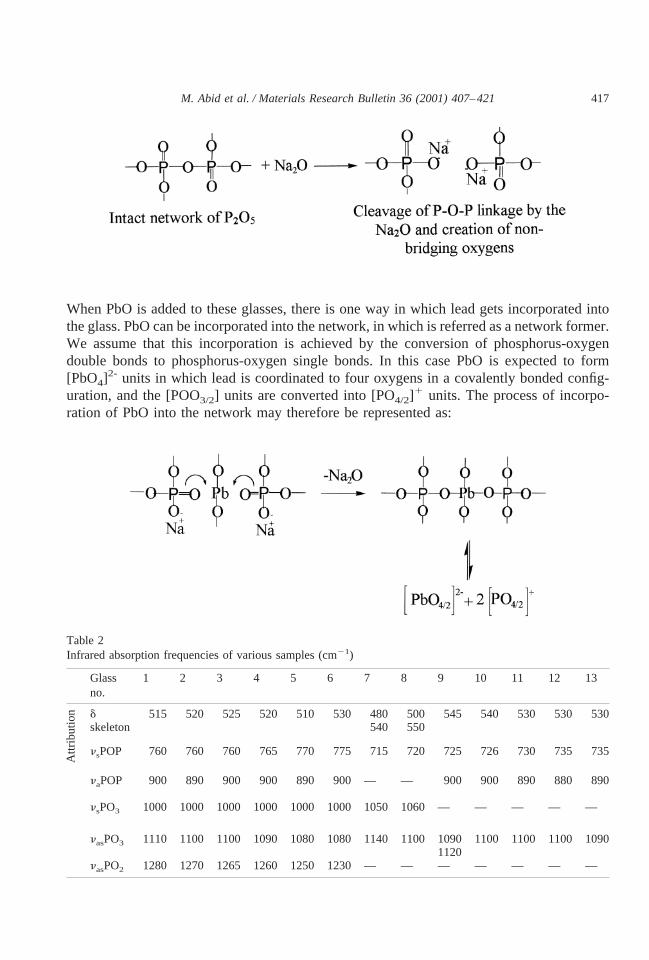
When PbO is added to these glasses, there is one way in which lead gets incorporated intothe glass. PbO can be incorporated into the network, in which is referred as a network former.We assume that this incorporation is achieved by the conversion of phosphorus-oxygendouble bonds to phosphorus-oxygen single bonds. In this case PbO is expected to form[PbO4]
2- units in which lead is coordinated to four oxygens in a covalently bonded config-uration, and the [POO3/2] units are converted into [PO4/2]
1 units. The process of incorpo-ration of PbO into the network may therefore be represented as:
Table 2Infrared absorption frequencies of various samples (cm21)
Glassno.
1 2 3 4 5 6 7 8 9 10 11 12 13
Attr
ibut
ion d 515 520 525 520 510 530 480 500 545 540 530 530 530
skeleton 540 550
nsPOP 760 760 760 765 770 775 715 720 725 726 730 735 735
naPOP 900 890 900 900 890 900 — — 900 900 890 880 890
nsPO3 1000 1000 1000 1000 1000 1000 1050 1060— — — — —
nasPO3 1110 1100 1100 1090 1080 1080 1140 1100 1090 1100 1100 1100 10901120
nasPO2 1280 1270 1265 1260 1250 1230— — — — — — —
417M. Abid et al. / Materials Research Bulletin 36 (2001) 407–421
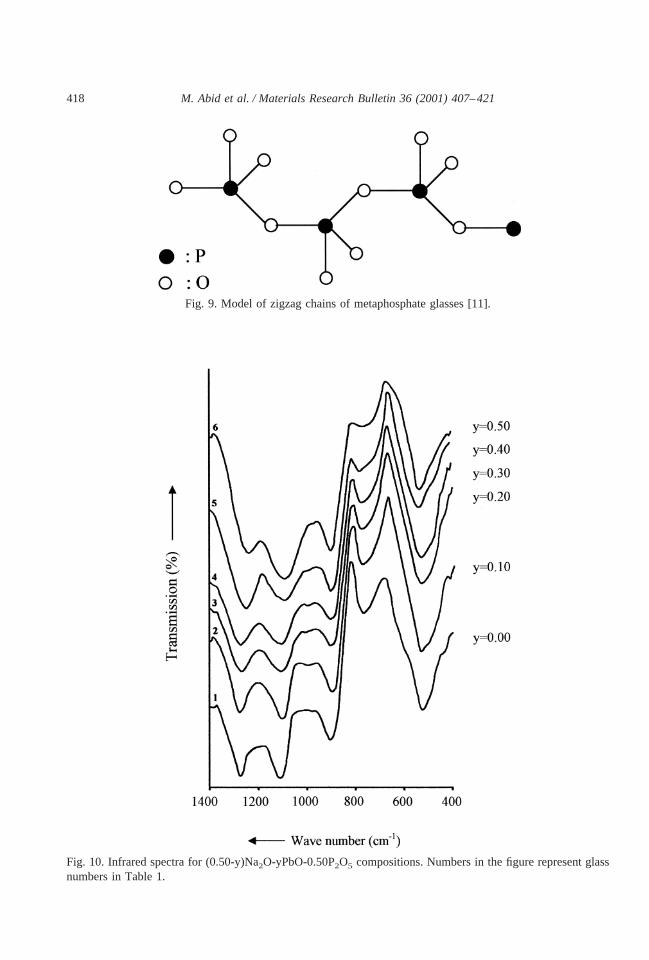
Fig. 9. Model of zigzag chains of metaphosphate glasses [11].
Fig. 10. Infrared spectra for (0.50-y)Na2O-yPbO-0.50P2O5 compositions. Numbers in the figure represent glassnumbers in Table 1.
418 M. Abid et al. / Materials Research Bulletin 36 (2001) 407–421
5. Conclusion
The results of the investigation of phosphate glass forming have indicated that a largevitreous domain occurs in the Na2O-PbO-P2O5 system. Physical, thermal and spectroscopicproperties have allowed us to follow the evolution of the glass structure inside this system.When the proportion of PbO increases in the vitreous domain, the decrease of the ionicconductivity and the dissymmetry introduced by this oxide in the PO4 network could beconsistent with an oxide-forming character.
Fig. 11. Infrared spectra for (0.60-y)Na2O-yPbO-0.40P2O5 compositions. Numbers in the figure represent glassnumbers in Table 1.
419M. Abid et al. / Materials Research Bulletin 36 (2001) 407–421
References
[1] A. R. West, Solid State Chemistry and its applications, J. Wiley (1984) p. 595.[2] H. Rawson, “Inorganic Glass Forming Systems” (Academic Press, London, 1967).[3] A. J. Bourdillon, F. Khumalo and J. Bordas, Phil. Mag. B 37 (1978) 731.[4] B. G. Rao, H. G. K. Sundar and K. J. Rao, J. Chem. Soc. Faraday Trans. I 80 (1984) 3491.[5] K. J. Rao, B. G. Rao and S. R. Elliott, J. Mater. Sci. 20 (1985) 1678.[6] J. Robertson, Phil. Mag. B 43 (1981) 1678.[7] P. J. Bray, A. E. Geissberger, F. Bucholtz and I. A. Harns, J. Non-Cryst. Solids 52 (1982) 45.[8] N. H. Ray, R. J. Plaisted and W. D. Robinson, Glass Tech, 17 (1976) 2, 1975[9] A. R. West, Solid State Chemistry and its applications, J. Wiley (1984) 455.
[10] F. Branda, P. Pernice, A. Arome, C. Costantini, A. Buri, Phys. Chem. Glasses 31 (2) (1990) 75–77.[11] C. H. Shih and G. J. Su, 5th Intern. Conf. On Glasses, Brussel 48 (1965).[12] L. Montagne and G. Plavit, Phys. Chem. Glasses. 1996, 37 (5), 206–211.[13] C. Garrigou-Lagrange, M. Ouchetto and B. Elouadi. Can. J. Chem. 63, 1436 (1985).
Fig. 12. Infrared spectra of glassy pyrophosphates: (a) Pb2P2O7 [14], (b) NaFeP2O7 [15].
420 M. Abid et al. / Materials Research Bulletin 36 (2001) 407–421

[14] M. Gabelica-Robert, P. Tarte, J. Molecular Structure, 79 (1982) 251–254.[15] A. Rulmont, P. Tarte and J. M. Winand, Eur. J. Solid State Inorg. Chem. t. 28. 1991. p. 1021–1034.[16] F. R. Cotton and G. Wilkinson, Advanced inorganic chemistry. 3rd ed. Interscience, New York 1972. p115.[17] E. Kordes, Z. Anorg. Allgerm. 241 (1939) 1.[18] E. Kordes, W. Vogel, R. Feterowsky, Z. Electrochem. 57 (4) (1953) 282.[19] B. C. Bunker, G. W. Arnold, J. A. Wilder, J. Non-Cryst. Solids 64 (1984) 291.[20] Y. B. Peng, D. E. Day, Glass Technol. 5 (1991) 166.
421M. Abid et al. / Materials Research Bulletin 36 (2001) 407–421


![Improved conductivity and capacitance of interdigital ...mai.group.whut.edu.cn/chs/lw/2016/201702/P... · polymer fabrication techniques with pyrolysis or thermal degradation [21–27]](https://img.pdfslide.fr/doc/110x75/5ff7dcadced30417a4176688/improved-conductivity-and-capacitance-of-interdigital-maigroupwhuteducnchslw2016201702p.jpg)