Embed Size (px)
Citation preview
1
3
4
5
6
7 Q1
89
10
1112
1 41516171819
20
2 2
2324252627
2829 Q3303132333435
3 6
5253
54
55
56
57
58
59
60
61
62
63
64
65
Q2
Fuel xxx (2014) xxx–xxx
JFUE 7980 No. of Pages 11, Model 5G
7 April 2014
Contents lists available at ScienceDirect
Fuel
journal homepage: www.elsevier .com/locate / fuel
Hydrodesulfurization and hydrodemetallization of different originvacuum residues: New modeling approach
http://dx.doi.org/10.1016/j.fuel.2014.03.0560016-2361/� 2014 Published by Elsevier Ltd.
⇑ Corresponding author. Tel.: +33 472445426.E-mail address: [email protected] (M. Tayakout-Fayolle).
Please cite this article in press as: Ferreira C et al. Hydrodesulfurization and hydrodemetallization of different origin vacuum residues: New modelproach. Fuel (2014), http://dx.doi.org/10.1016/j.fuel.2014.03.056
C. Ferreira a,b, M. Tayakout-Fayolle c,⇑, I. Guibard a, F. Lemos b
a IFP Energies Nouvelles, Rond Point de l’échangeur de Solaize, BP 3, 69360 Solaize, Franceb IBB – Centro de Engenharia Biológica e Química, Instituto Superior Técnico, Universidade de Lisboa, Av. Rovisco Pais, 1049-001 Lisboa, Portugalc Université Lyon 1, CNRS, UMR 5256, IRCELYON, Institut de recherches sur la catalyse et l’environnement de Lyon, 2 Av. Albert Einstein, F-69626 Villeurbanne, France
h i g h l i g h t s
� The residue description gives a better differentiation of different origin residues.� The chemical kinetic and Maxwell–Stefan equations are coupled in the catalyst.� The diffusion limitation due to the molecule sizes improves the HDM prediction.� The vanadium HDM seems to be controlled by the diffusion.
37383940414243444546474849
a r t i c l e i n f o
Article history:Received 3 December 2013Received in revised form 26 February 2014Accepted 25 March 2014Available online xxxx
Keywords:Vacuum residueDiffusionKinetic modelHydrodesulfurizationHydrodemetallizationReactor modeling
50
a b s t r a c t
In order to be able to upgrade the heaviest part of the crude oil one needs to remove several impurities,such as sulfur or metals. Residue hydrotreatment in fixed beds, under high hydrogen pressure canachieve high removal performances, with an industrial catalysts optimized staging. Despite the recentimprovements, petroleum residues remain very difficult to describe and characterize in detail. Severalkinetic models have been developed, but mostly they are feed dependant and their predictions are notsatisfying for residues of different origins. Based on a recent study comparing residue properties andthe differentiating physical–chemical properties responsible for reactivity (Ferreira et al., 2012), the pres-ent work develops a hydrotreatment kinetic model coupled with mass transfer in the catalyst whichattempts to simulate the different residue performances. After estimation of kinetic parameters for a Iraqiresidue (Buzurgan) with API gravity of 5, the model taking into account differences in residue character-istics, was validated for residues with API gravity close to Buzurgan one but shows increasing discrepan-cies with increasing API gravity.
� 2014 Published by Elsevier Ltd.
51
66
1. Introduction (HDM – hydrodemetallization) is intended to remove most of the 6768
69
70
71
72
73
74
75
76
77
78
79
Upgrading petroleum residue into lighter fractions is crucial tosatisfy the increasing energetic demand. In addition, the availablecrude oils are becoming heavier and therefore the removal ofimpurities, as sulfur or metals is more necessary before converting.Residue upgrading processes produce either more distillates (lowsulfur fuel oil) or residues suitable for the residue cracking units(RFCC). Among all residue upgrading processes, fixed bed hydro-treatment units are the most frequently used.
The residue fixed bed hydrotreatment process, Hyvahl™developed by IFPEN in 1982 [2,3], consists of several trickle bedreactors in series, subdivided into two different reaction sectionswith specific catalysts. In each one of them. The first section
80
81
82
metals and to slightly hydrocrack the asphaltenes. The second sec-tion (HDS – hydrodesulfurization) allows, with a deeper desulfur-ization function, the required sulfur levels to be achieved. Bothsections operate at high hydrogen pressure and high temperatures.The understanding of chemical and physical phenomena in thesereactors is a major challenge.
The heaviest fraction of oil contains a large polydispersity ofmolecular structures, which is very difficult to characterize pre-cisely. A typical way to start residue characterization is by fraction-ation. The heaviest fraction, called asphaltenes, is obtained byprecipitation using a paraffin [4]. The nature of asphaltenes is stilla subject of much controversy [5–8]. It is nonetheless accepted thatthey are constituted of large size molecules and this phase possiblyhas a colloidal structure with an high concentration of impurities.Their hydrotreatment is then much more difficult than for lighterstructures.
ing ap-
83
84
85
86
87
88
89
90
91
92
93
94
95
96
97
98
99
100
101
102
103
104
105
106
107
108
109
110
111
112
113
114
115
116
117
Nomenclature
as specific surface area of catalyst pellet (m2 m�3)As coefficient of the Scheibel correlation (–)bi thermodynamic Langmuir coefficient of the
lump i (m3 mol�1)Cp
i concentration of the lump i in the fluid insidethe pellet at equilibrium with the adsorbedphase (mol m�3)
Cfi concentration of the lump i in the extra granu-
lar fluid phase (mol m�3)CT total concentration (mol m�3)Deff
ij effective diffusion coefficient (m2 s�1)Dij Stephan-Maxwell binary lumps (i,j) diffusion
coefficient (m2 s�1)D0
ij Stephan-Maxwell binary segment (i,j) diffusioncoefficient (m2 s�1)
D1 bulk phase diffusion coefficient or translationaldiffusion coefficient (m2 s�1)
k Bolztmann constant (J K�1)kj kinetic constant of reaction j (m�2 s�1 ou m3 -
mol�1 m�2 s�1)k0j apparent kinetic constant of reaction j (m�2 -
s�1)
kmi mass transfer coefficient of the lump i corre-
sponding to the fluid phase (m s�1)Kr viscous drag coefficient of the considered lump
(–)Kp solute partition coefficient (–)Lc length of the cylindrical pellet (m)Mi molecular weight of the lump i (kg mol�1)Mi;GPC molecular weight of the lump i obtained by GPC
(kg mol�1)MiðBuzurganÞ;GPC molecular weight of the lump i obtained by
GPC for Buzurgan (kg mol�1)MiðBuzurganÞ molecular weight of the lump i from Akbar-
zadeh works [26] for Buzurgan (kg mol�1)nc number of lumps (–)nd number of deposits (adsorbed lumps) (–)Ni molar flux of the lump i (mol m�2 s�1)N0
i molar flux of the segment i (mol m�2 s�1)Ncoke number of coke molecules (–)nsi number of segments of the lump i, comparing
to the elementary volume (–)NR number of reactions (–)
qmax active site saturation concentration (mol m�3 ofsolid)
qsite active site concentration (mol m�3 of solid)qi concentration of the lump i in adsorbed phase
(sites) (mol m�3 of solid)QL volumetric liquid flow rate (m�3 s)
rji volumetric production reaction rate j of lump i
(mol m�3 m�2 s�1)ri global volumetric surface production rate of
lump i (mol m�3 m�2 s�1)rp pore radius (m)R gas constant (J mol�1 K�1)Rc catalyst pellet radius (m)Rcoke coke molecules radius (m)Rh molecule hydrodynamic radius (m)Sc section of the catalyst pellet (m2)Scatalyst catalyst surface (m2)Scinitially available initially available surface of catalyst (m2)Scoccupied;coke occupied surface of catalyst (m2)T temperature (K)Vc catalyst volume (m3)Vp;intragranularphase intra granular volume (m3)mj
i stoichiometric coefficient of the lump i of reac-tion j (–)
v fo fluid velocity inside the reactor (m s�1)
#i molecular volume of the lump i (m3 mol�1)#0 molar volume of the elementary segment (m3 -
mol�1)ei extra granular porosity (–)ep intra granular porosity (–)/p
i volume fraction of the lump i in the intra gran-ular solid phase (–)
/fi volume fraction of the lump i in the extra gran-
ular fluid phase (–)/S
i volume fraction of the coke, Vanadium or Nick-el on the catalyst surface (–)
sR catalyst tortuosity (–)qi density (kg m3)g viscosity of the fluid phase (Pa s)k ratio between pore and molecule hydrody-
namic radius (–)
2 C. Ferreira et al. / Fuel xxx (2014) xxx–xxx
JFUE 7980 No. of Pages 11, Model 5G
7 April 2014
In parallel to the development of the process and understandingof the residue physical and chemical properties and reactivities, IF-PEN has been working on the development of kinetic and catalystdeactivation models for both sections of the process [9–11]. Thesemodels give quite satisfying results, but were developed for spe-cific Middle East residues and lack accuracy when tested to simu-late residues of different origins. Alternative hydrotreatmentmodels reported in the literature are based on heavy residues orig-inating from other areas but are only tested for the specific resi-dues for which they are developed and no general model issuggested [12–16].
The problem of such models is that their feed description isquite simple and that the model parameters such as kinetic con-stants, depend on the vacuum residue origin. To overcome suchconstraints, quite complex residue description models based onmolecular reconstruction have been developed and can be foundin the literature [17–19]. However, these models are so complexthat, due to their computing time, they are almost never integratedin a complete kinetic model of residue hydrocracking and are of
Please cite this article in press as: Ferreira C et al. Hydrodesulfurization and hyproach. Fuel (2014), http://dx.doi.org/10.1016/j.fuel.2014.03.056
very difficult practical application. Moreover, works of Ferreiraet al. have introduced the diffusion limitation in the catalyst in or-der to describe the impact of molecules sizes on the hydrotreat-ment performances [20].
In the present work, based on the experimental works of Ferre-ira et al. [1], we introduce a new heavy residue feed descriptionand consequent kinetic network. The aim is that model parametersshould be independent of vacuum residue origin whilst the modelitself remains as simple as possible. This description is then intro-duced into the reactor/kinetic model which includes the two sec-tions of the process. After parameter estimation with a Iraqiresidue, the model is validated with experimental results fromthree residues with different origins.
2. Experimental section
Vacuum residues with quite different characteristics, i.e. densi-ties, sulfur, metals and asphaltenes content were selected and
drodemetallization of different origin vacuum residues: New modeling ap-
118
119
120
121
122
123
124
125
126
127
128
129
130
131
132
133
134
135
136
137
138
139
140
141
142
143
144
145
146
147
148
149
150
151
152
153
154
155
156
157
158
159
160
161
162
163
164
165
166
167
168
169
170
171
172
173
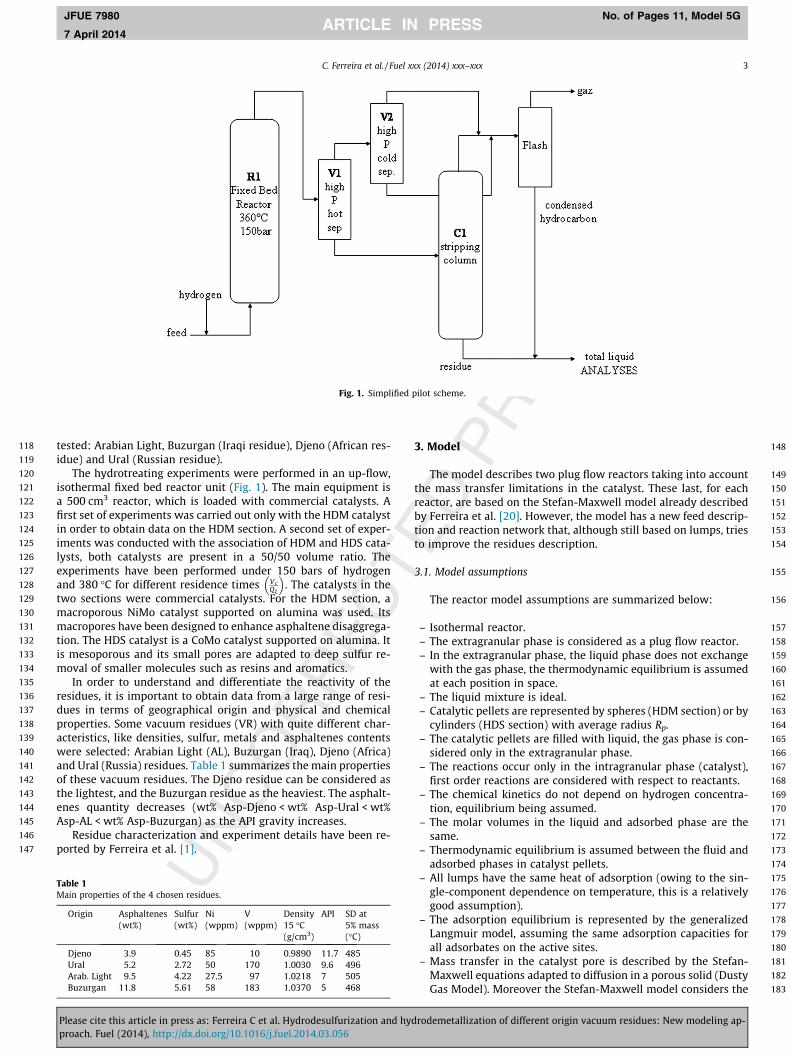
Fig. 1. Simplified pilot scheme.
C. Ferreira et al. / Fuel xxx (2014) xxx–xxx 3
JFUE 7980 No. of Pages 11, Model 5G
7 April 2014
tested: Arabian Light, Buzurgan (Iraqi residue), Djeno (African res-idue) and Ural (Russian residue).
The hydrotreating experiments were performed in an up-flow,isothermal fixed bed reactor unit (Fig. 1). The main equipment isa 500 cm3 reactor, which is loaded with commercial catalysts. Afirst set of experiments was carried out only with the HDM catalystin order to obtain data on the HDM section. A second set of exper-iments was conducted with the association of HDM and HDS cata-lysts, both catalysts are present in a 50/50 volume ratio. Theexperiments have been performed under 150 bars of hydrogenand 380 �C for different residence times Vc
QL
� �. The catalysts in the
two sections were commercial catalysts. For the HDM section, amacroporous NiMo catalyst supported on alumina was used. Itsmacropores have been designed to enhance asphaltene disaggrega-tion. The HDS catalyst is a CoMo catalyst supported on alumina. Itis mesoporous and its small pores are adapted to deep sulfur re-moval of smaller molecules such as resins and aromatics.
In order to understand and differentiate the reactivity of theresidues, it is important to obtain data from a large range of resi-dues in terms of geographical origin and physical and chemicalproperties. Some vacuum residues (VR) with quite different char-acteristics, like densities, sulfur, metals and asphaltenes contentswere selected: Arabian Light (AL), Buzurgan (Iraq), Djeno (Africa)and Ural (Russia) residues. Table 1 summarizes the main propertiesof these vacuum residues. The Djeno residue can be considered asthe lightest, and the Buzurgan residue as the heaviest. The asphalt-enes quantity decreases (wt% Asp-Djeno < wt% Asp-Ural < wt%Asp-AL < wt% Asp-Buzurgan) as the API gravity increases.
Residue characterization and experiment details have been re-ported by Ferreira et al. [1].
174
175
176
177
178
179
180
181
182
183
Table 1Main properties of the 4 chosen residues.
Origin Asphaltenes(wt%)
Sulfur(wt%)
Ni(wppm)
V(wppm)
Density15 �C(g/cm3)
API SD at5% mass(�C)
Djeno 3.9 0.45 85 10 0.9890 11.7 485Ural 5.2 2.72 50 170 1.0030 9.6 496Arab. Light 9.5 4.22 27.5 97 1.0218 7 505Buzurgan 11.8 5.61 58 183 1.0370 5 468
Please cite this article in press as: Ferreira C et al. Hydrodesulfurization and hyproach. Fuel (2014), http://dx.doi.org/10.1016/j.fuel.2014.03.056
3. Model
The model describes two plug flow reactors taking into accountthe mass transfer limitations in the catalyst. These last, for eachreactor, are based on the Stefan-Maxwell model already describedby Ferreira et al. [20]. However, the model has a new feed descrip-tion and reaction network that, although still based on lumps, triesto improve the residues description.
3.1. Model assumptions
The reactor model assumptions are summarized below:
– Isothermal reactor.– The extragranular phase is considered as a plug flow reactor.– In the extragranular phase, the liquid phase does not exchange
with the gas phase, the thermodynamic equilibrium is assumedat each position in space.
– The liquid mixture is ideal.– Catalytic pellets are represented by spheres (HDM section) or by
cylinders (HDS section) with average radius Rp.– The catalytic pellets are filled with liquid, the gas phase is con-
sidered only in the extragranular phase.– The reactions occur only in the intragranular phase (catalyst),
first order reactions are considered with respect to reactants.– The chemical kinetics do not depend on hydrogen concentra-
tion, equilibrium being assumed.– The molar volumes in the liquid and adsorbed phase are the
same.– Thermodynamic equilibrium is assumed between the fluid and
adsorbed phases in catalyst pellets.– All lumps have the same heat of adsorption (owing to the sin-
gle-component dependence on temperature, this is a relativelygood assumption).
– The adsorption equilibrium is represented by the generalizedLangmuir model, assuming the same adsorption capacities forall adsorbates on the active sites.
– Mass transfer in the catalyst pore is described by the Stefan-Maxwell equations adapted to diffusion in a porous solid (DustyGas Model). Moreover the Stefan-Maxwell model considers the
drodemetallization of different origin vacuum residues: New modeling ap-
184
185
186
187
188
189
190
191
192
193
194
195
196
197
198
199
200
201
202
203
204
205
206
207
208
209
210
211
212
213
214
215
216
217
218
219220
222222
223
224
225
226
227
228 Q4229
231231
232
233
234
235
236
237
238239
241241
242
243
244245
247247
248
249250252252
253
254
255
256
257
258259
261261
262263
265265
266
267
268
269
270
271
272
273
274
275
276277
279279
280
281
282
283
4 C. Ferreira et al. / Fuel xxx (2014) xxx–xxx
JFUE 7980 No. of Pages 11, Model 5G
7 April 2014
volume constraints by the Fornasiero formalism [21]. Consider-ing the difference between molecular volumes, Fornasiero hasadapted the Stefan-Maxwell equations supposing the moleculescollision occurs only between equivalent volumes. The numberof segments is defined as follows: nsi ¼ #i
#o with #i the molar vol-ume of component i and #o the molar volume of the referencecomponent, hydrogen (the smallest component, #o = 2.8410�5
m3 mol�1). Resistance to mass transfer between extragranularand intragranular phases is represented by a linear drivingforce.
3.2. Material balances
The geometrical characteristics of the two reactors correspond-ing to the HDM and HDS sections are the same but the catalysts inthe two sections are different. The main differences are the proper-ties of the catalyst, such as initial porosity, pore radius and shape.The shape of catalyst differs according to the section; the catalyst isspherical for the HDM section and cylindrical for the HDS section.The mass balances will also change slightly. For the balance in thebulk fluid, the specific surface area as ¼ Sc
Vcgives as ¼ 3
Rc(case of
spherical catalyst), and as ¼ 2ðRcþLcÞRcLc
(case of cylindrical catalyst). Inthe latter case, Lc� Rc, the specific surface area can be approxi-mated to as ¼ 2
Rc.
The previous hypotheses lead to the following set of equations/ designates the volume fractions, with subscripts correspondingto the lumps, and the superscript to the phase, fluid (extragranularphase), catalytic pellet (intragranular phase); nc designates thenumber of components. The relation between the concentrationsin extragranular and intragranular phases and the respective vol-ume fractions can be written as follows: /f
i ¼ Cfi nsi#
o for the extra-granular phase and /p
i ¼ Cpi nsi#
o for the intragranular phase. Thedynamical model is numerically solved and only the steady stateresults, corresponding to extragranular mass balances, are com-pared with experimental ones.
3.2.1. In the extragranular phase (HDM and HDS)
@/ fi
@t¼ �eim f
o
@/ fi
@z� ð1� eiÞepask
mi ð/
fi � /p
i Þ i ¼ 1;nc � 1 ð1Þ
The volume constraint associated with these equations is:Pncj¼1/
fj ¼ 1.
284285
287287
288
289
290
291292
294294
295
296
297
298
299
300Q5
301302
3.2.2. In the intragranular phase (catalyst pellet)Considering that, for the cylindrical catalyst, the radial diffusion
is more important that the axial diffusion (Lc� Rc) the same bal-ances inside the catalyst can be written for both catalysts:
ep@/p
i
@t¼ #0ep
1r2
@
@rðr2 � N0
i Þ þ ð1� epÞ#0nsiScatalystri i ¼ 1;nc
With ri ¼PNR
j¼1mj
i r ji is the global volumetric surface production
rate of lump i (mol m�3 m�2 s�1), it defined by solid volume andby catalyst surface. N0
i is the flux defined as following N0i ¼ nsiNi.
The volume constraint associated with these equations isPnci¼1/
pi ¼ 1.
The associated boundaries conditions of this equation systemfor the intragranular phase are written as follows:
8t at r ¼ Rp; N0i ¼
kmi#0 ð/ f
i � /pi Þ i ¼ 1; nc
8t at r ¼ 0; N0i ¼ 0
Please cite this article in press as: Ferreira C et al. Hydrodesulfurization and hyproach. Fuel (2014), http://dx.doi.org/10.1016/j.fuel.2014.03.056
3.2.3. On the catalyst surfaceThe accumulation of metals and coke on catalyst surface are gi-
ven by following mass balances:
d/Si
dt¼ #0nsiScatalyst ri with i ¼ Vanadium; Nickel or coke
The catalyst surface (Scatalyst) varies with the coke depositsaccording to the following expression:
Scatalyst ¼ Scinitially available� Scoccupied;coke
The initially available surface is experimentally measured bythe BET technique. A coke unit is assumed to be a sphere withdiameter (Rcoke) equivalent to average asphaltene diameter foundin the works of Tayakout et al. [22]. Its occupied surface(Scoccupied;coke
) is equivalent to the section surface of the sphere andcan be written as follows:
Scoccupied;coke¼ NcokepR2
coke with Ncoke ¼/S
cokeVp;intragranularphase
43 R3
coke
:
The catalyst surface (Scatalyst) becomes:
Scatalyst ¼ Scinitially available� 3/S
cokeVp;intragranular phase
4Rcoke
3.2.4. Flux expressionThe mass transfer is based on the Stefan-Maxwell equations and
considers the volume constraints according to the Fornasiero for-malism [21]. The mass transfer limitations need to be consideredin the two sections. For the HDM section, despite using a macropo-rous catalyst it appears that the large size of residue molecules(especially asphaltenes) leads to specific steric hindrance con-straints that must be added to the kinetic and thermodynamicmodels [23,24].
The flux expression taking into account the Fornasiero formal-ism is written as follows:
r/pi
nsi � #0 ¼1CT
Xnc
j¼1j–i
/pj N0
i � /pi N0
j
Deffij
i ¼ 1; nc � 1
The model also considers that the reaction only occurs at thecatalyst surface in the adsorbed phase, and the adsorption mecha-nism is described by a generalized Langmuir isotherm.
The effective diffusion coefficients of these residues have beendescribed as follows [25]:
Deffij ¼
ep
srKrKpDi; j
where Di,j is calculated by correlations present in the literature. Forthe present model, a correlation valid for liquids was chosen, theScheibel correlation. This last is based on molar volume and derivedfrom Wilke-Chang correlation [25]:
DijAsT
gj#1=3i
1þ 3#j
#i
� �2=3" #
Kr and Kp are coefficients taking account respectively of reduction ofthe molecule mobility due to pore wall and partitioning of the sol-
ute Kp ¼/p
asph
/ fasph
� �.
Two expressions for Kp and Kr have been proposed in the liter-ature [23,24], depending on the ratio k = Rh/ro where Rh is thehydrodynamic radius of asphaltenes considered as a sphere andr0 the average pore radius:
drodemetallization of different origin vacuum residues: New modeling ap-
304304
305307307
308 Q6
309
310
311
312313
315315
316
317
318
319
320
321
322
323
324
325
326
327
328
329
330
331
332
333
334
335
336
337
338
339
340
341
342
343
344
345
346
347
348
349
350
351
352
353
354
355
356
357
358
359
360
361
362
363
364
365
366
367
368
369
370
371
372
373
374
375Q7
376
377
378
379
380
381
382
383
384
385
386
387
388
389
390
391
392
393
394
395
396
397
398
399
400
401
402
403
404
405
406
407
408
409
410
C. Ferreira et al. / Fuel xxx (2014) xxx–xxx 5
JFUE 7980 No. of Pages 11, Model 5G
7 April 2014
Kp ¼ ð1� kÞ2 ð2Þ
Kr ¼ 1� 2:104kþ 2:089k3 � 0:948k5
These correlations are accurate when k 6 0:5. To calculate the ratiok, it is necessary to know the hydrodynamic radius of the molecules,and the pore radius variation with time.
The hydrodynamic radius Rh can be calculated through theStokes–Einstein equation:
D1 ¼kT
6pgRh
where D1 is considered to be approximately equal to Di,j. This is anapproximation often used in the literature to have an order of mag-nitude for molecular radius.
Finally, the pore radius is related to the porosity. The porositydecreases due to coke and metal deposits, but also due to the ad-sorbed lumps. Consequently, the pore radius also decreases. A rela-tionship is established by Tayakout et al. [22], between theporosity and the radius with the following assumptions:
� catalyst pores are supposed to be cylindrical,� the number of pores is constant with time,
The relation can then be written as follows: r0ðr; tÞ ¼ r0ðr;0Þ�ffiffiffiffiffiffiffiffiffiffiepðr;tÞepðr;0Þ
q.
To obtain the pore radius, the intragranular porosity at a giventime is calculated through a volume balance: epðr; tÞ ¼ epðr; t ¼ 0Þ�Pnd
k¼1/pkðr; tÞ �
P3k¼1ð1� epÞ/S
kðr; tÞGiven the variation of the pore radius and porosity with time
and radial position in the catalyst, the effective diffusion coeffi-cients will also vary with time and radial position in the catalyst.
3.3. Feed description (lumps)
Through the available analysis, the residue is considered as amixture composed of fractions (SARA fractions). The goal is to havea different quantitative description for each residue, through itsproperties, and not through the kinetics or adsorption parameters.The most complex fractions are asphaltenes and resins and previ-ous works have shown that their behavior is the hardest to de-scribe [9,10,13]. So the present model will focus on a moredetailed description of both these fractions.
Usually, the asphaltenes and resins are each described by a sin-gle lump two lumps describe the asphaltenes and the resins but inthis work, in order to take better account of their wide polydisper-sity, they have been divided into fractions depending on the type ofmetal present, their aliphacity and their aromaticity. But due tolack of robust data, only one heteroatom type by type of asphalteneor resin has been considered.
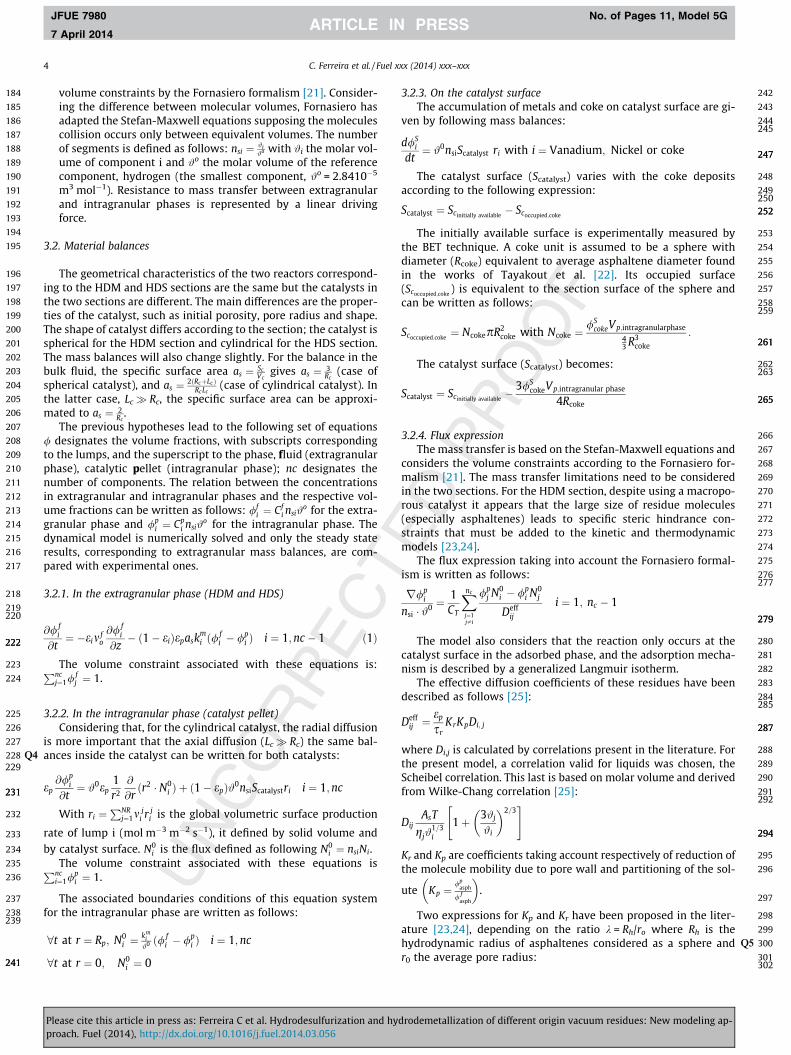
Firstly, three main types of asphaltenes have been considered:simple asphaltenes (Asp), nickel asphaltenes (AspNi) and vana-dium asphaltenes (AspV). Each of these three is divided into 4sub-groups according to their aliphacity and aromaticity levels.These sub-groups have been described as follows: the asphalteneis designated by Asp. ‘‘a’’ and ‘‘s’’ are have been added to designate
Fig. 2. Scheme of aspha
Please cite this article in press as: Ferreira C et al. Hydrodesulfurization and hyproach. Fuel (2014), http://dx.doi.org/10.1016/j.fuel.2014.03.056
aromatic part and saturated part of asphaltene respectively. Thesubscripts ‘‘1’’ or ‘‘2’’ of ‘‘a’’ or ‘‘s’’ correspond to aliphacity or aro-maticity level. Ni or V are added to give the type of asphatene (As-pa1s1 or AspVa1s1 or AspNia1s1, Aspa1s2 or AspVa1s2 orAspNia1s2 ...).
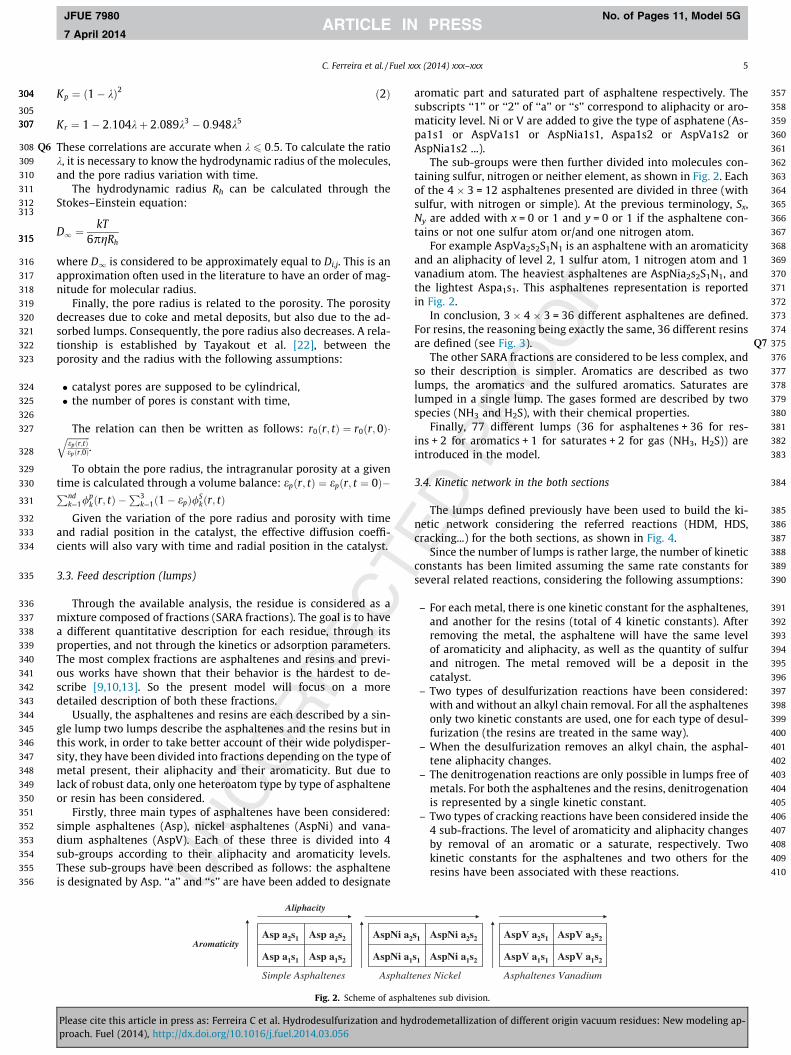
The sub-groups were then further divided into molecules con-taining sulfur, nitrogen or neither element, as shown in Fig. 2. Eachof the 4 � 3 = 12 asphaltenes presented are divided in three (withsulfur, with nitrogen or simple). At the previous terminology, Sx,Ny are added with x = 0 or 1 and y = 0 or 1 if the asphaltene con-tains or not one sulfur atom or/and one nitrogen atom.
For example AspVa2s2S1N1 is an asphaltene with an aromaticityand an aliphacity of level 2, 1 sulfur atom, 1 nitrogen atom and 1vanadium atom. The heaviest asphaltenes are AspNia2s2S1N1, andthe lightest Aspa1s1. This asphaltenes representation is reportedin Fig. 2.
In conclusion, 3 � 4 � 3 = 36 different asphaltenes are defined.For resins, the reasoning being exactly the same, 36 different resinsare defined (see Fig. 3).
The other SARA fractions are considered to be less complex, andso their description is simpler. Aromatics are described as twolumps, the aromatics and the sulfured aromatics. Saturates arelumped in a single lump. The gases formed are described by twospecies (NH3 and H2S), with their chemical properties.
Finally, 77 different lumps (36 for asphaltenes + 36 for res-ins + 2 for aromatics + 1 for saturates + 2 for gas (NH3, H2S)) areintroduced in the model.
3.4. Kinetic network in the both sections
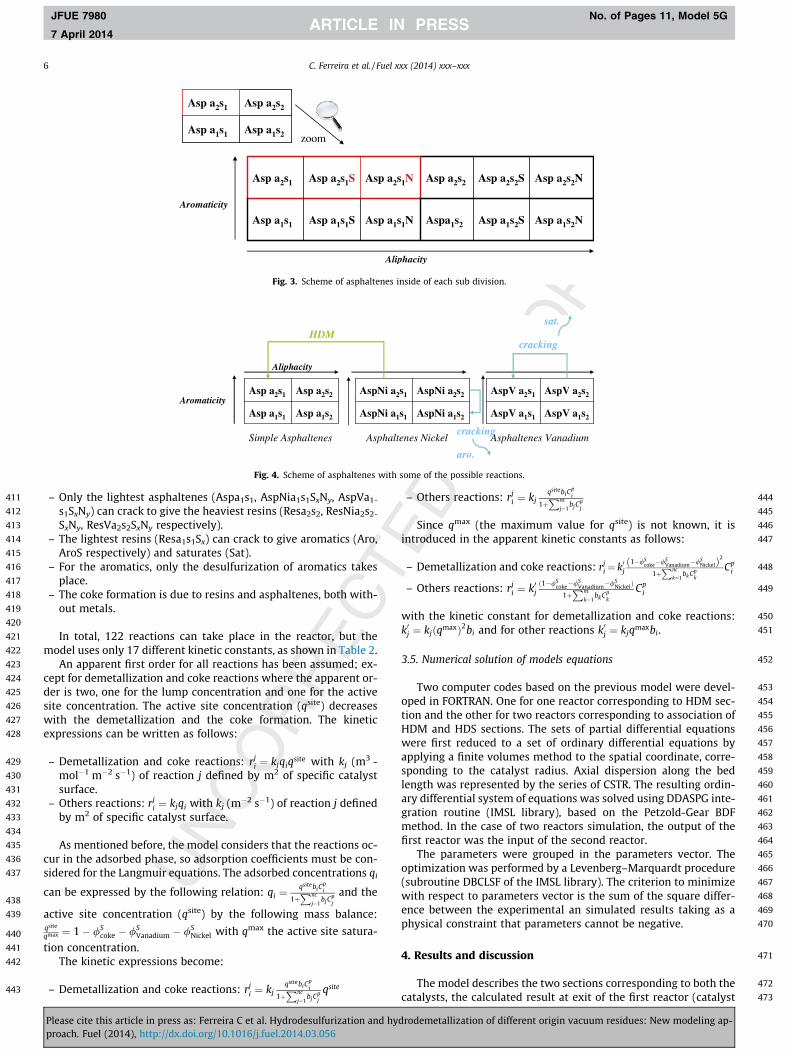
The lumps defined previously have been used to build the ki-netic network considering the referred reactions (HDM, HDS,cracking...) for the both sections, as shown in Fig. 4.
Since the number of lumps is rather large, the number of kineticconstants has been limited assuming the same rate constants forseveral related reactions, considering the following assumptions:
– For each metal, there is one kinetic constant for the asphaltenes,and another for the resins (total of 4 kinetic constants). Afterremoving the metal, the asphaltene will have the same levelof aromaticity and aliphacity, as well as the quantity of sulfurand nitrogen. The metal removed will be a deposit in thecatalyst.
– Two types of desulfurization reactions have been considered:with and without an alkyl chain removal. For all the asphaltenesonly two kinetic constants are used, one for each type of desul-furization (the resins are treated in the same way).
– When the desulfurization removes an alkyl chain, the asphal-tene aliphacity changes.
– The denitrogenation reactions are only possible in lumps free ofmetals. For both the asphaltenes and the resins, denitrogenationis represented by a single kinetic constant.
– Two types of cracking reactions have been considered inside the4 sub-fractions. The level of aromaticity and aliphacity changesby removal of an aromatic or a saturate, respectively. Twokinetic constants for the asphaltenes and two others for theresins have been associated with these reactions.
ltenes sub division.
drodemetallization of different origin vacuum residues: New modeling ap-
411
412
413
414
415
416
417
418
419
420
421
422
423
424
425
426
427
428
429
430
431
432
433
434
435
436
437
438
439
440
441
442
443
444
445
446
447
448
449
450
451
452
453
454
455
456
457
458
459
460
461
462
463
464
465
466
467
468
469
470
471
472
473
Fig. 3. Scheme of asphaltenes inside of each sub division.
Fig. 4. Scheme of asphaltenes with some of the possible reactions.
6 C. Ferreira et al. / Fuel xxx (2014) xxx–xxx
JFUE 7980 No. of Pages 11, Model 5G
7 April 2014
– Only the lightest asphaltenes (Aspa1s1, AspNia1s1SxNy, AspVa1-
s1SxNy) can crack to give the heaviest resins (Resa2s2, ResNia2s2-
SxNy, ResVa2s2SxNy respectively).– The lightest resins (Resa1s1Sx) can crack to give aromatics (Aro,
AroS respectively) and saturates (Sat).– For the aromatics, only the desulfurization of aromatics takes
place.– The coke formation is due to resins and asphaltenes, both with-
out metals.
In total, 122 reactions can take place in the reactor, but themodel uses only 17 different kinetic constants, as shown in Table 2.
An apparent first order for all reactions has been assumed; ex-cept for demetallization and coke reactions where the apparent or-der is two, one for the lump concentration and one for the activesite concentration. The active site concentration (qsite) decreaseswith the demetallization and the coke formation. The kineticexpressions can be written as follows:
– Demetallization and coke reactions: rji ¼ kjqiq
site with kj (m3 -mol�1 m�2 s�1) of reaction j defined by m2 of specific catalystsurface.
– Others reactions: rji ¼ kjqi with kj (m�2 s�1) of reaction j defined
by m2 of specific catalyst surface.
As mentioned before, the model considers that the reactions oc-cur in the adsorbed phase, so adsorption coefficients must be con-sidered for the Langmuir equations. The adsorbed concentrations qi
can be expressed by the following relation: qi ¼qsitebiC
pi
1þPnc
j¼1bjC
pj
and the
active site concentration (qsite) by the following mass balance:qsite
qmax ¼ 1� /Scoke � /S
Vanadium � /SNickel with qmax the active site satura-
tion concentration.The kinetic expressions become:
– Demetallization and coke reactions: rji ¼ kj
qsitebiCpi
1þPnc
j¼1bjC
pj
qsite
Please cite this article in press as: Ferreira C et al. Hydrodesulfurization and hyproach. Fuel (2014), http://dx.doi.org/10.1016/j.fuel.2014.03.056
– Others reactions: rji ¼ kj
qsitebiCpi
1þPnc
j¼1bjC
pj
Since qmax (the maximum value for qsite) is not known, it isintroduced in the apparent kinetic constants as follows:
– Demetallization and coke reactions: rji ¼ k0j
1�/Scoke�/S
Vanadium�/SNickelð Þ2
1þPnc
k¼1bkCp
k
Cpi
– Others reactions: rji ¼ k0j
ð1�/Scoke�/S
Vanadium�/SNickelÞ
1þPnc
k¼1bkCp
k
Cpi
with the kinetic constant for demetallization and coke reactions:k0j ¼ kjðqmaxÞ2bi and for other reactions k0j ¼ kjqmaxbi.
3.5. Numerical solution of models equations
Two computer codes based on the previous model were devel-oped in FORTRAN. One for one reactor corresponding to HDM sec-tion and the other for two reactors corresponding to association ofHDM and HDS sections. The sets of partial differential equationswere first reduced to a set of ordinary differential equations byapplying a finite volumes method to the spatial coordinate, corre-sponding to the catalyst radius. Axial dispersion along the bedlength was represented by the series of CSTR. The resulting ordin-ary differential system of equations was solved using DDASPG inte-gration routine (IMSL library), based on the Petzold-Gear BDFmethod. In the case of two reactors simulation, the output of thefirst reactor was the input of the second reactor.
The parameters were grouped in the parameters vector. Theoptimization was performed by a Levenberg–Marquardt procedure(subroutine DBCLSF of the IMSL library). The criterion to minimizewith respect to parameters vector is the sum of the square differ-ence between the experimental an simulated results taking as aphysical constraint that parameters cannot be negative.
4. Results and discussion
The model describes the two sections corresponding to both thecatalysts, the calculated result at exit of the first reactor (catalyst
drodemetallization of different origin vacuum residues: New modeling ap-
474
475
476
477
478
479
480
481
482
483
484
485
486
487
488
489
490
491
492
493
494
495
496
497
498
499
500
501
502
503
504
505
506
507
508
509
510
511
512
513
514
515
516
517
518
519
520
521
522
523
524
525
526
527
528
529
530
531
532
533
534
535
536
537
538
539
540
541
542
543
544
545
546
Table 2Reactions considered for the kinetic network.
Reactions network (x = 0 or 1 and y = 0 or 1)ð1Þ AspansmSxNy ! Aspan�1smSxNy þ Aro where n ¼ 2; m ¼ 1;2or Aspa1s1SxNy ! Resa2s2SxNy þ Aroð2Þ Aspans2SxNy ! Aspans1SxNy þ Sat where n ¼ 1;2ð3Þ Aspans2NyS! AspanNys1 þ H2Sþ Sat where n ¼ 1;2ð4Þ AspansmNyS! AspansmNy þ H2S where n ¼ 1;2 and m ¼ 1;2(5) AspansmN ? Aspansm + NH3 where n = 1, 2ð6Þ Resa2smSxNy ! Resa1smSxNy þ Aro where m ¼ 1;2ð7Þ Resa1s1 ! Aroþ Satð8Þ Resans2SxNy ! Resans1SxNy þ Sat where n ¼ 1;2ð9Þ Resans2S1 ! Resans1 þ H2Sþ Sat where n ¼ 1;2ð10Þ ResansmS1 ! Resansm þ H2S where n ¼ 1;2 and m ¼ 1;2ð11Þ ResansmN1 ! Resansn þ NH3 where n ¼ 1;2 and m ¼ 1;2ð12Þ AroS! AroþH2S
Reactions of catalyst deactivation and hydrodemetallization (x = 0 or 1 and y = 0or 1)
ð13Þ AspSxNyNiþ site! AspSxNy þ Ni� siteð14Þ AspSxNyVþ site! AspSxNy þ V� siteð15Þ ResSxNyNiþ site! ResSxNy þ Ni� siteð16Þ ResSxNyVþ site! ResSxNy þ V� siteð17Þ AspSxNy=ResSxNy þ site! Coke� site
Q9
Table 4Calculated nsi for aromatics and saturates of the different residues.
Buzurgan Arabian Light Ural Djeno
nsi (�)Aromatics 20 20 18 27Saturates 19 21 21 24
qi (kg m�3)Saturates 880Aromatics 990Resins 1040Asphaltenes 1180
C. Ferreira et al. / Fuel xxx (2014) xxx–xxx 7
JFUE 7980 No. of Pages 11, Model 5G
7 April 2014
for HDM) has been used as the input to the second reactor (catalystfor HDS). In order to obtain the input of the first section, someparameters have to be calculated.
The fixed parameters are the catalysts properties. The catalystsand their properties are summarized in Table 3.
4.1. Calculated parameters
4.1.1. Attribution of number of segments – nsi
To attribute the segment number (nsi) described in the Fornasi-ero formalism [20], the molar volume of each lump has to beknown. This was calculated from the molecular weight and thedensity of each lump (Mi = qi�nsi�#0). To have the order of magni-tude of the molecular weight of each fraction, the average valueswere chosen from an article [26] where the molecular weights pre-sented were obtained experimentally using a vapor pressureosmometer for different residues. The values for densities were ta-ken from the same article and reported in Table 4. It is also impor-tant to notice, that the only Mi attributed are for saturates andaromatics (MAro = 522 g/mol, MSat = 460 g/mol). The others are cal-culated through the kinetic network, in order to respect the massbalance. For example: MResa1s1 ¼ MAro þMSat and MAspa1s1 ¼ MAroþMResa2s2 , etc.
For each residue GPC (Gas Permeation Chromatography) analy-sis was used to determine a ratio of molecular weights of saturatesand aromatics compared to the Buzurgan residue. For the otherresidues (Arabian Light, Ural and Djeno), the molecular weights
were calculated from the following equation: Mi ¼ MiMi;GPC
Mi;GPCðbuzurganÞ
where i = Aro or Sat. These GPC results were only used for the com-parison between the residues (through a ratio) and not to imposethe molecular weights and the nsi. Indeed, the molecular weightscan not be used because the GPC calibration method (based onequivalent to the polystyrene structure) means they are not
Table 3Properties for both catalysts (HDM and HDS) used as model input.
Catalyst HDM HDSShape Sphere Cylinder
PorosityExtra granular (ei) 0.21 0.39Intra granular (ep) 0.57 0.40
Average catalyst radius (m) 1 � 10�3 5 � 10�4
Average pore radius (m) 5.7 � 10�8 8.3 � 10�9
Please cite this article in press as: Ferreira C et al. Hydrodesulfurization and hyproach. Fuel (2014), http://dx.doi.org/10.1016/j.fuel.2014.03.056
measured absolutely used to calibrate the masses and not an abso-lute measure. The other molecular weights of Arabian, Ural andDjeno were calculated in the same way that for the Buzurgan res-idue, through the kinetic network, in order to respect the mass bal-ance. The segment numbers nsi for aromatics and saturates arereported in Table 4.
4.1.2. Repartition of asphaltenes, resins and heteroatoms in each sub-fraction
The asphaltenes and resins have been sub-divided into 4 frac-tions and each of these sub-fractions contains heteroatoms. Fromnormalized GPC distributions [1], four mass intervals have been as-sumed. The GPC distribution of the lightest residue containing thesmallest molecules (in the present case Ural) was taken as refer-ence. The proportions of each sub-fraction relative to the entirefraction are given by the area of each interval for asphaltenesand resins of different vacuum residues respectively in Tables 5and 6. The molecular weights reported in these tables correspondto molecular weights calculated through the kinetic network, forthe buzurgan residue, and not those given by the GPC.
The GPC signal shows the weight molecular distribution ofasphaltenes and resins to be not directly proportional to theamount of asphaltenes or resins. In fact, the signal is the result ofthe coupling between aromaticity and quantity. In Tables 5 and6, it can be observed that for both resins and asphaltenes, thesub-fractions 2 and 3 are present in largest quantity. In particular,for asphaltenes sub-fraction 2 is the greatest, and for the resins thegreatest quantity is in the sub-fraction 3.
Regarding the heteroatoms, little information is available rela-tive to their distribution within the SARA fractions. Nonetheless,some work has been done recently, mainly relating to asphaltenes.The authors have considered each SARA fractions as an entire frac-tion, and not as 4 different distributions [27,28]. Specifically for theevolution of asphaltenes in hydroprocessing [28], the sulfur con-version seemed to be quite similar in terms of aromaticity andpolycondensation. Another work by Marques et al. [29] fractionedthe asphaltenes of Safaniya (Middle-East heavy) vacuum residueinto two fractions, and analyzed both these sub-fractions. Theauthors observed that the smaller asphaltenes had a lower Ni/V ra-tio than the bigger asphaltenes. In terms of reactivity, the smallerasphaltenes seemed to react faster, but this result could be due re-duced mass transfer limitations for the smaller ones. Despite theserecent improvements, we do not have enough information to
Table 5Distribution of 4 sub fractions of the asphaltenes for the 4 different vacuum residues.
Asphaltenes Mass intervals (g/mol)
Buzurgan ArabianLight
Ural Djeno
Aspa2s2 3468–3573 0.0428 0.0263 0.0176 0.0679Aspa2s1 3008–3113 0.5017 0.4635 0.4497 0.5469Aspa1s2 2946–3051 0.2495 0.2820 0.2936 0.2151Aspa1s1 2486–2591 0.2060 0.2282 0.2391 0.1701
drodemetallization of different origin vacuum residues: New modeling ap-
547
548
549
550
551
552
553
554
555
556
557
558
559
560
561
562
563
564
565
566
567
568
Table 6Distribution of 4 sub fractions of the resins for the 4 different vacuum residues.
Resins Mass intervals (g/mol)
Buzurgan ArabianLight
Ural Djeno
Resa2s2 1964–2069 0.0708 0.0686 0.0403 0.1644Resa2s1 1504–1609 0.2399 0.2431 0.1922 0.2902Resa1s2 1142–1547 0.5626 0.5507 0.6175 0.4766Resa1s1 982–1087 0.1267 0.1366 0.1500 0.0688
1.E-05
1.E-04
1.E-03
1.E-02
1.E-01
1.E+001.E-05 1.E-04 1.E-03 1.E-02 1.E-01 1.E+00
sim
ulat
ion
experiment
SNNiVsaturatesaromaticsresinsasphaltenes
8 C. Ferreira et al. / Fuel xxx (2014) xxx–xxx
JFUE 7980 No. of Pages 11, Model 5G
7 April 2014
differentiate the residues. So, in a first approach, it is consideredthat the heteroatoms are distributed evenly in the different sub-fractions.
569
570
571
572
573Q8
574
575
576
577
578
579
580
581
582
583
584
585
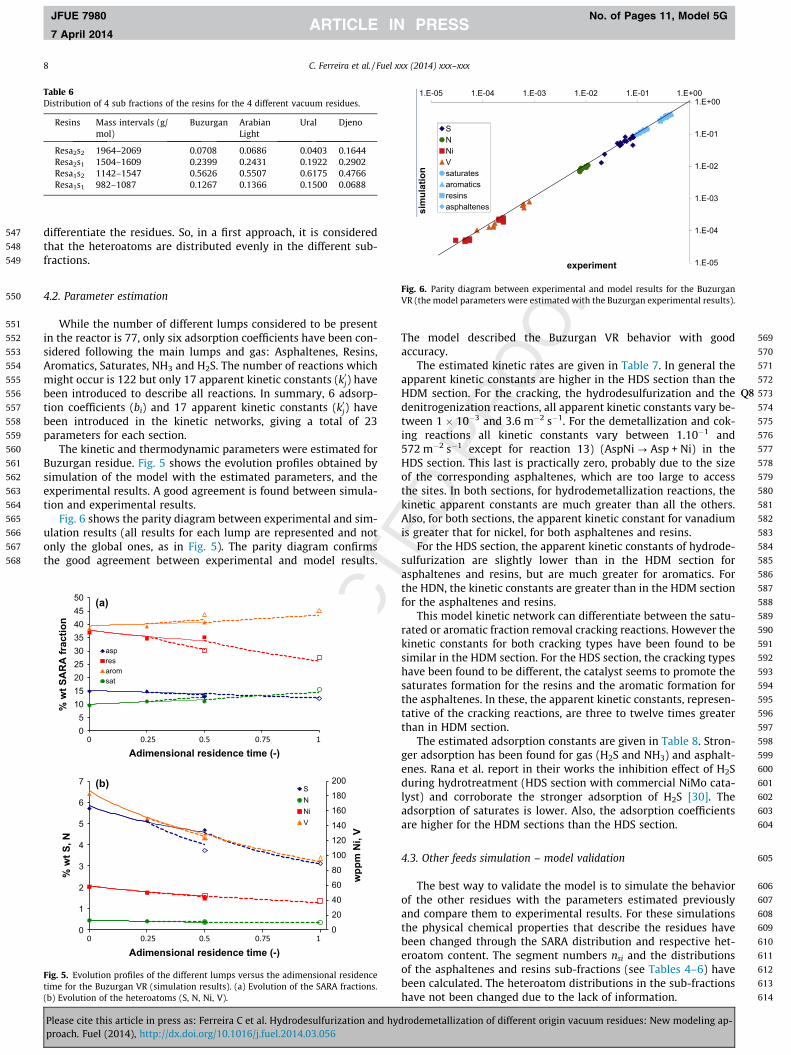
Fig. 6. Parity diagram between experimental and model results for the BuzurganVR (the model parameters were estimated with the Buzurgan experimental results).
4.2. Parameter estimationWhile the number of different lumps considered to be presentin the reactor is 77, only six adsorption coefficients have been con-sidered following the main lumps and gas: Asphaltenes, Resins,Aromatics, Saturates, NH3 and H2S. The number of reactions whichmight occur is 122 but only 17 apparent kinetic constants (k0j) havebeen introduced to describe all reactions. In summary, 6 adsorp-tion coefficients (bi) and 17 apparent kinetic constants (k0j) havebeen introduced in the kinetic networks, giving a total of 23parameters for each section.
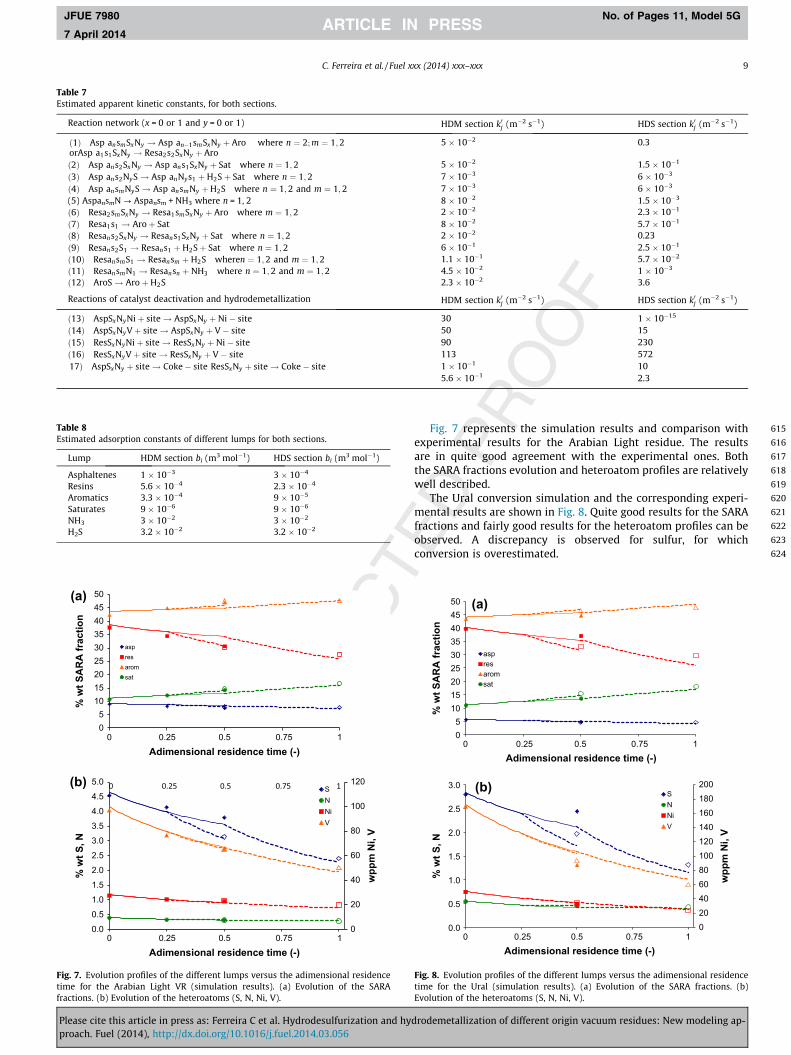
The kinetic and thermodynamic parameters were estimated forBuzurgan residue. Fig. 5 shows the evolution profiles obtained bysimulation of the model with the estimated parameters, and theexperimental results. A good agreement is found between simula-tion and experimental results.
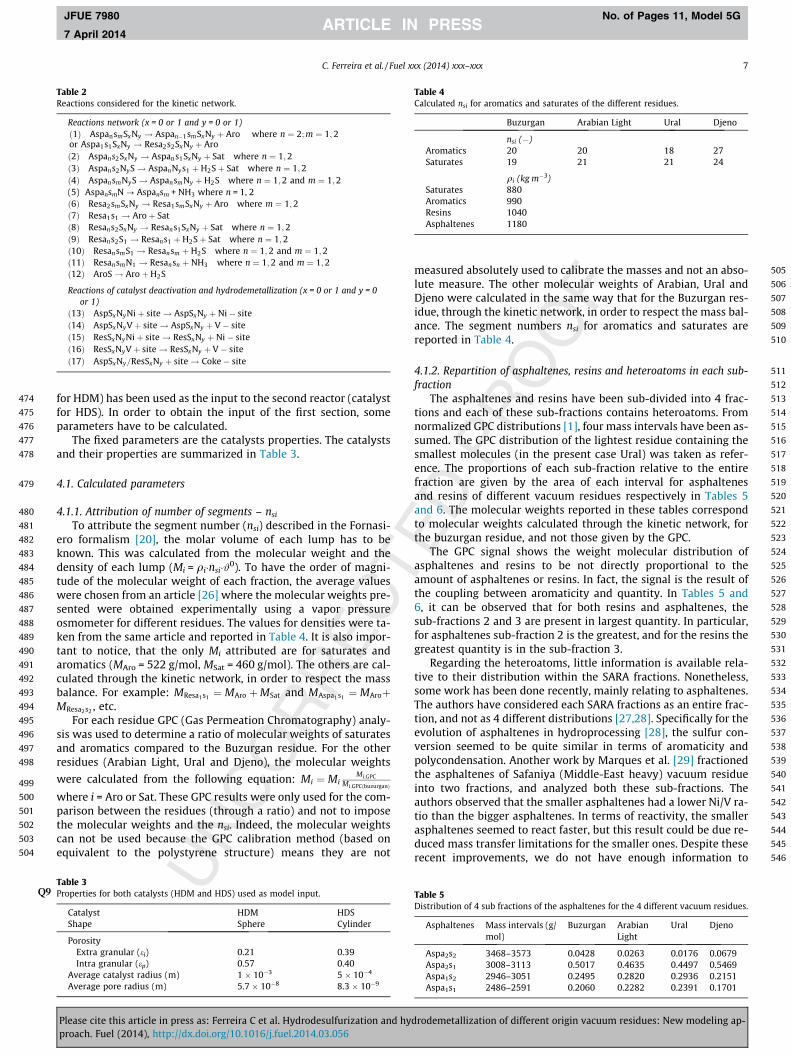
Fig. 6 shows the parity diagram between experimental and sim-ulation results (all results for each lump are represented and notonly the global ones, as in Fig. 5). The parity diagram confirmsthe good agreement between experimental and model results.
586
587
588
589
590
591
592
593
594
595
596
597
598
599
600
601
602
603
604
Fig. 5. Evolution profiles of the different lumps versus the adimensional residencetime for the Buzurgan VR (simulation results). (a) Evolution of the SARA fractions.(b) Evolution of the heteroatoms (S, N, Ni, V).
Please cite this article in press as: Ferreira C et al. Hydrodesulfurization and hyproach. Fuel (2014), http://dx.doi.org/10.1016/j.fuel.2014.03.056
The model described the Buzurgan VR behavior with goodaccuracy.
The estimated kinetic rates are given in Table 7. In general theapparent kinetic constants are higher in the HDS section than theHDM section. For the cracking, the hydrodesulfurization and thedenitrogenization reactions, all apparent kinetic constants vary be-tween 1 � 10�3 and 3.6 m�2 s�1. For the demetallization and cok-ing reactions all kinetic constants vary between 1.10�1 and572 m�2 s�1 except for reaction 13) (AspNi ? Asp + Ni) in theHDS section. This last is practically zero, probably due to the sizeof the corresponding asphaltenes, which are too large to accessthe sites. In both sections, for hydrodemetallization reactions, thekinetic apparent constants are much greater than all the others.Also, for both sections, the apparent kinetic constant for vanadiumis greater that for nickel, for both asphaltenes and resins.
For the HDS section, the apparent kinetic constants of hydrode-sulfurization are slightly lower than in the HDM section forasphaltenes and resins, but are much greater for aromatics. Forthe HDN, the kinetic constants are greater than in the HDM sectionfor the asphaltenes and resins.
This model kinetic network can differentiate between the satu-rated or aromatic fraction removal cracking reactions. However thekinetic constants for both cracking types have been found to besimilar in the HDM section. For the HDS section, the cracking typeshave been found to be different, the catalyst seems to promote thesaturates formation for the resins and the aromatic formation forthe asphaltenes. In these, the apparent kinetic constants, represen-tative of the cracking reactions, are three to twelve times greaterthan in HDM section.
The estimated adsorption constants are given in Table 8. Stron-ger adsorption has been found for gas (H2S and NH3) and asphalt-enes. Rana et al. report in their works the inhibition effect of H2Sduring hydrotreatment (HDS section with commercial NiMo cata-lyst) and corroborate the stronger adsorption of H2S [30]. Theadsorption of saturates is lower. Also, the adsorption coefficientsare higher for the HDM sections than the HDS section.
605
606
607
608
609
610
611
612
613
614
4.3. Other feeds simulation – model validation
The best way to validate the model is to simulate the behaviorof the other residues with the parameters estimated previouslyand compare them to experimental results. For these simulationsthe physical chemical properties that describe the residues havebeen changed through the SARA distribution and respective het-eroatom content. The segment numbers nsi and the distributionsof the asphaltenes and resins sub-fractions (see Tables 4–6) havebeen calculated. The heteroatom distributions in the sub-fractionshave not been changed due to the lack of information.
drodemetallization of different origin vacuum residues: New modeling ap-
615
616
617
618
619
620
621
622
623
624
Table 7Estimated apparent kinetic constants, for both sections.
Reaction network (x = 0 or 1 and y = 0 or 1) HDM section k0j (m�2 s�1) HDS section k0j (m�2 s�1)
ð1Þ Asp ansmSxNy ! Asp an�1smSxNy þ Aro where n ¼ 2; m ¼ 1;2orAsp a1s1SxNy ! Resa2s2SxNy þ Aro
5 � 10�2 0.3
ð2Þ Asp ans2SxNy ! Asp ans1SxNy þ Sat where n ¼ 1;2 5 � 10�2 1.5 � 10�1
ð3Þ Asp ans2NyS! Asp anNys1 þ H2Sþ Sat where n ¼ 1;2 7 � 10�3 6 � 10�3
ð4Þ Asp ansmNyS! Asp ansmNy þH2S where n ¼ 1;2 and m ¼ 1;2 7 � 10�3 6 � 10�3
(5) AspansmN ? Aspansm + NH3 where n = 1, 2 8 � 10�2 1.5 � 10�3
ð6Þ Resa2smSxNy ! Resa1smSxNy þ Aro where m ¼ 1;2 2 � 10�2 2.3 � 10�1
ð7Þ Resa1s1 ! Aroþ Sat 8 � 10�2 5.7 � 10�1
ð8Þ Resans2SxNy ! Resans1SxNy þ Sat where n ¼ 1;2 2 � 10�2 0.23ð9Þ Resans2S1 ! Resans1 þ H2Sþ Sat where n ¼ 1;2 6 � 10�1 2.5 � 10�1
ð10Þ ResansmS1 ! Resansm þ H2S wheren ¼ 1;2 and m ¼ 1;2 1.1 � 10�1 5.7 � 10�2
ð11Þ ResansmN1 ! Resansn þ NH3 where n ¼ 1;2 and m ¼ 1;2 4.5 � 10�2 1 � 10�3
ð12Þ AroS! AroþH2S 2.3 � 10�2 3.6
Reactions of catalyst deactivation and hydrodemetallization HDM section k0j (m�2 s�1) HDS section k0j (m�2 s�1)
ð13Þ AspSxNyNiþ site! AspSxNy þ Ni� site 30 1 � 10�15
ð14Þ AspSxNyVþ site! AspSxNy þ V� site 50 15ð15Þ ResSxNyNiþ site! ResSxNy þ Ni� site 90 230ð16Þ ResSxNyVþ site! ResSxNy þ V� site 113 57217Þ AspSxNy þ site! Coke� site ResSxNy þ site! Coke� site 1 � 10�1 10
5.6 � 10�1 2.3
Table 8Estimated adsorption constants of different lumps for both sections.
Lump HDM section bi (m3 mol�1) HDS section bi (m3 mol�1)
Asphaltenes 1 � 10�3 3 � 10�4
Resins 5.6 � 10�4 2.3 � 10�4
Aromatics 3.3 � 10�4 9 � 10�5
Saturates 9 � 10�6 9 � 10�6
NH3 3 � 10�2 3 � 10�2
H2S 3.2 � 10�2 3.2 � 10�2
Fig. 7. Evolution profiles of the different lumps versus the adimensional residencetime for the Arabian Light VR (simulation results). (a) Evolution of the SARAfractions. (b) Evolution of the heteroatoms (S, N, Ni, V).
C. Ferreira et al. / Fuel xxx (2014) xxx–xxx 9
JFUE 7980 No. of Pages 11, Model 5G
7 April 2014
Please cite this article in press as: Ferreira C et al. Hydrodesulfurization and hyproach. Fuel (2014), http://dx.doi.org/10.1016/j.fuel.2014.03.056
Fig. 7 represents the simulation results and comparison withexperimental results for the Arabian Light residue. The resultsare in quite good agreement with the experimental ones. Boththe SARA fractions evolution and heteroatom profiles are relativelywell described.
The Ural conversion simulation and the corresponding experi-mental results are shown in Fig. 8. Quite good results for the SARAfractions and fairly good results for the heteroatom profiles can beobserved. A discrepancy is observed for sulfur, for whichconversion is overestimated.
05
101520253035404550
% w
t SA
RA
frac
tion
aspresaromsat
020406080100120140160180200
0.0
0.5
1.0
1.5
2.0
2.5
3.0
% w
t S, N
SNNiV
(b)
(a)
wpp
m N
i, V
Adimensional residence time (-)0 0.25 0.5 0.75 1
Adimensional residence time (-)0 0.25 0.5 0.75 1
Fig. 8. Evolution profiles of the different lumps versus the adimensional residencetime for the Ural (simulation results). (a) Evolution of the SARA fractions. (b)Evolution of the heteroatoms (S, N, Ni, V).
drodemetallization of different origin vacuum residues: New modeling ap-

625
626
627
628
629
630
631
632
633
634
635
636
637
638
639
640
641
642
643
644
645
646
647
648
649
650
651
652
653
654
655
656
657
658
659
660
661
662
663
664
665
666
667
668
669
670
671
672
673
674
675
676
677
678
679
680
681
682
683
684
685
686
687
688
689
690
691
692
693
694
695
696
697
698
699
700
701
702
703
704705706707708709710711712713714715716717718719720721
05
101520253035404550
% w
t SA
RA
frac
tion
aspresaromsat
0102030405060708090100
0.0
0.1
0.2
0.3
0.4
0.5
0.6
0.7
0.8
wpp
m N
i, V
% w
t S, N
Adimensional residence time (-)
SNNiV
0 0.25 0.5 0.75 1
Adimensional residence time (-)0 0.25 0.5 0.75 1
(a)
(b)
Fig. 9. Evolution profiles of the different lumps versus the adimensional residencetime for the Djeno (simulation results). (a) Evolution of the SARA fractions. (b)Evolution of the heteroatoms (S, N, Ni, V).
10 C. Ferreira et al. / Fuel xxx (2014) xxx–xxx
JFUE 7980 No. of Pages 11, Model 5G
7 April 2014
Finally Djeno residue behavior was also simulated and the re-sults are presented in Fig. 9. The simulation is less satisfactory thanfor the Arabian Light and the Ural. These results were expected be-cause the Djeno residue is unusual and rarely conforms to thebehavior of other residues. In the HDS section, the resin conversionand the saturates and aromatics contents are overestimated. Forheteroatoms some discrepancies can also be observed mainly fornickel and sulfur. The removal of nickel is always overestimated.However the removal of sulfur is underestimated in the HDM sec-tion and overestimated in the HDS section.
The simulation predictions seems less satisfactory with increas-ing API gravity. The asphaltene quantity decreases while the resinquantity increases with increasing API gravity. The kinetic param-eters have been estimated for the heaviest of residue and do notseem to correspond well to the reactivity of lighter residue. In fact,except for the Djeno sulfur, a decrease in reactivity is observed forthe lighter residues.
In this work, the SARA sub-fractions repartition parameterswere changed but not those corresponding to heteroatoms. Sinceall sub-fractions have the same kinetic constants and adsorptioncoefficients most of the differences observed will be linked to masstransfer resistance in catalyst. So, in the case of Djeno (the lightest)a better fit may be gained by distributing most of the sulfur intothe smallest sub-fractions (to better adjust the HDM section) orwith the refractory sulfur lump introduction, and most metals(above for Ni) in the largest sub-fractions. Concerning the sulfur,most studies give an partial order higher than 1 for HDS showinga reactivity range in the sulfur compounds of the given fraction[31,32]. But the lack of data concerning the heteroatom repartitionin the sub-fractions does not allow a conclusion to be reachedregarding diffusion limitation or different reactivity of sub-frac-tions. Probably the both have an impact on the performances ofthe HDM and HDS catalysts. The heteroatom repartition could begiven by the analytical technique development and will allow abetter prediction of hydrotreatment process. The model has been
Please cite this article in press as: Ferreira C et al. Hydrodesulfurization and hyproach. Fuel (2014), http://dx.doi.org/10.1016/j.fuel.2014.03.056
developed in order to predict the HDM and HDS performancesfor different residues of different origins. In this way the modeltakes into account the quantitative description for each residue,through its properties, and the diffusion limitations in the catalyst.The better description of residue leads to describe 77 lumps and122 reactions. The number of kinetic parameters has been reducedto 17 per section but this number remains high for the availablenumber of experiments concerning the Buzurgan. Moreover, dueto the non-availability of relevant analyses, the quantification ofdifferent lumps is not possible and so, many assumptions havebeen made for example: one heteroatom type per lump. Despiteall the assumptions and the few experiments for estimation, amodel has been developed and first results have been given anddiscussed. Further improvements will be possible with recentdevelopments of analysis techniques.
5. Conclusions
In this work a preliminary model was developed in order to pre-dict the hydrotreating performance for residues of different geo-graphical origins. The simulation of the performance of twocatalysts in sequence was achieved and the validation of the modelis acceptable for residues with similar API gravity. The discrepancyof the model prediction increases with the residue API gravity,which corresponds to increasingly light residues.
The differentiation of performance due to the change in crudewas obtained through the introduction of some crucial aspects inthe model description, i.e.: (i) introducing the diffusion and sizeof the molecules into the model for both sections; (ii) subdividingasphaltenes and resins which allowed an improvement in the pre-diction of evolution of SARA fractions; (iii) creating a kineticdependency on the feed properties seems to give better simulationresults.
To further improve the prediction obtained from the simulation,advanced characterizations of the residue feeds are needed. For in-stance, our model takes into account the diffusion limitation in thecatalyst and a better description by introducing sub-fractions suchas aromaticity and aliphaticity levels in the resins and asphaltenes.But the lack of more relevant data for increasingly light residues(concerning the repartition and heteroatom distributions in thesub-fraction), increases the discrepancy between model andexperimental results.
Acknowledgment
The first author thanks FCT – Portugal, for the scholarshipattributed to accomplish this project work.
References
[1] Ferreira C, Tayakout M, Guibard I, Lemos F, Toulhoat H, Ramôa Ribeiro F.Hydrodesulfuration and hydrodemetallization of different origin vacuumresidues: characterization and reactivity. Fuel 2012;98:218–28.
[2] Kressman S, Morel F, Kasztelan S. Recent developments in fixed-bed catalyticresidue upgrading. Catal Today 1998;43:203–15.
[3] Rana MS, Samano V, Ancheyta J, Diaz JAI. A review of recent advances onprocess technologies for upgrading of heavy oils and residua. Fuel2007;86:1216–31.
[4] Speight JG. The chemistry and technology of petroleum. New York; 1999.[5] Murgich J. Molecular simulation and the aggregation of the heavy fractions in
crude oils. Mol Simul 2003;29:451–61.[6] Groezin H, Mullins OC. Molecular size and structure of asphaltenes from
various sources. Energy Fuels 2000;14:677–84.[7] Sheu EY. Petroleum asphaltene-properties, characterization and issues. Energy
Fuels 2002;16:74–82.[8] Fenistein D, Barré L, Broseta D, Espinat D, Livet A, Roux JN, et al. Viscosietric
and neutron scattering study of asphaltene aggregates in mixed toluene/heptane solvents. Langmuir 1998;14:1013–20.
drodemetallization of different origin vacuum residues: New modeling ap-
722723724725726727728729730731732733734735736737738739740741742743744745746747748749750751752753754
755756757758759760761762763764765766767768769770771772773774775776777778779780781782783784785786
787
C. Ferreira et al. / Fuel xxx (2014) xxx–xxx 11
JFUE 7980 No. of Pages 11, Model 5G
7 April 2014
[9] Haulle FX, Kressmann S. Kinetic modeling of residue desulfurization: lumpingapproach on sulfur compounds in heavy oil fractions. In: AIChE Spring Meeting2002. New Orleans; 2002.
[10] Verstraete JJ, Leannic K, Guibard I. Modeling fixed-bed residue hydrotreatingprocesses. Chem Eng Sci 2007;62:5402–8.
[11] Toulhoat H, Hudebinec D, Raybaud P, Guillaume D, Kressmann S. THERMIDOR:a new model combined simulation of operations and optimization of catalystsin residues hydroprocessing units. Catal Today 2005;109:135–53.
[12] Sanchez S, Rodriguez MA, Acheyta J. Kinetic model for moderate hydrocrackingof heavy oils. Ind Eng Chem Res 2005;44:9409–13.
[13] Alvarez A, Ancheyta J. Modeling residue hydroprocessing in multi-fixed-bedreactor system. Appl Catal A – Gen 2008;351:148–58.
[14] Bellos GD, Kallinikos LE, Gounaris CE, Papayannakos NG. Modeling ofperformance of industrial HDS reactors using a hybrid neural networkapproach. Chem Eng Process 2005;44:505–15.
[15] Jarullah AT, Mujtaba IM, Wood AS. Kinetic model development and simulationof simultaneous hydrodenitrogenation and hydrodemetallization of crude oilin trickle bed reactor. Fuel 2011;90:2165–81.
[16] Jarullah AT, Mujtaba IM, Wood AS. Improving fuel quality by whole crude oilhydrotreating: a kinetic model for hydrodeasphaltenization in a trickle bedreactor. Appl Energy 2012;94:182–91.
[17] Neurock M, Libanati C, Klein MT. Modeling asphaltenes reaction pathways:intrinsic chemistry. In: AIChE symposium series, fundamentals of residueupgrading; 1989. p. 85–273.
[18] Jaffe SB, Freund H, Olmstead N. Extension of structure-oriented lumping tovacuum residue. Ind Eng Chem Res 2005;44:9840–52.
[19] Verstraete JJ. Molecular reconstruction of heavy petroleum residue fraction.Chem Eng Sci 2008;62:5402–8.
[20] Ferreira C, Marques J, Tayakout M, Guibard I, Lemos F, Toulhoat H, et al.Modeling residue hydrotreating. Chem Eng Sci 2009;65:322–9.
[21] Fornasiero F, Prausnitz JM, Radke CJ. Multicomponent diffusion in highlyasymmetric systems. An extended Maxwell–Stefan model for starkly differentsized, segment accessible chain molecules. Macromolecules 2005;38:1364–70.
Please cite this article in press as: Ferreira C et al. Hydrodesulfurization and hyproach. Fuel (2014), http://dx.doi.org/10.1016/j.fuel.2014.03.056
[22] Tayakout M, Ferreira C, Espinat D, Marques J, Picon SA, Sorbier L, et al.Diffusion of asphaltene molecules through the pore structure ofhydroconversion catalysts. Chem Eng Sci 2010;65(5):1571–83.
[23] Jost K, Steuer W, Halasz I. Measurement of diffusion coefficients of oil residualfractions using porous membranes. Chromatographia 1985;20:700.
[24] Deen WM. Hindered transport of large molecules in liquid-filled pores. AIChE1987;33(9):1409–25.
[25] Li J, Carr PW. Accuracy of empirical correlations for estimating diffusioncoefficients in aqueous organic mixtures. Anal Chem 1997;69:2530–6.
[26] Akbarzadeh K, Alboudwarej H, Svrcek WY, Yarraton HW. A generalized regularsolution model for asphaltene precipitation from n-alkane diluted heavy oilsand bitumens. Fluid Phase Equilibria 2005;232:159–70.
[27] Hughey CA, Rodgers RP, Marshall AG, Qian K, Robbins WK. Identification ofacidic NSO compounds in crude oils of different geochemical origins bynegative ion electrospray Fourier transform ion cyclotron ressonance massspectrometry. Org Geochem 2002;33:743–59.
[28] Klein GC, Kim S, Rodgers RP, Marshall AG. Mass spectral analysis ofasphaltenes, II Detailed compositional comparison of asphaltenes deposit toits crude oil counterpart for two geographically different crude oils by ESI FT-ICR MS. Energy Fuels 2006;20:1973–9.
[29] Marques J, Merdrignac I, Baudot A, Barré L, Guillaume D, Espinat D, et al.Asphaltenes size polydispersity reduction by nano- and ultrafiltrationseparation methods – comparison with floculation method. Oil Gas SciTechnol – Rev l’Institut Français du Petrole 2008;63:139–49.
[30] Rana MS, Ancheyta J, Rayo P, Maity SK. Heavy oil hydroprocessing oversupported NiMo sulfided catalyst: an inhibition effect by added H2S. Fuel2007;86:1263–9.
[31] Deng Z, Wang T, Wang Z. Hydrodesulfurization of diesel in a slurry reactor.Chem Eng Sci 2010;65(1):480–6.
[32] Rodriguez MA, Elizalde I, Ancheyta J. Comparison of kinetic and reactor modelsto simulate a trickle-bed bench-scale reactor for hydrodesulfurization of VGO.Fuel 2012;100:91–9.
drodemetallization of different origin vacuum residues: New modeling ap-