Embed Size (px)
Citation preview
Accepted Manuscript
Effects of Albumin Treatment on Systemic and Portal Hemodynamics and SystemicInflammation in Patients With Decompensated Cirrhosis
Javier Fernández, Joan Clària, Alex Amorós, Ferrán Aguilar, Miriam Castro,Mireia Casulleras, Juan Acevedo, Marta Duran-Güell, Laura Nuñez, MontserratCosta, Mireia Torres, Raquel Horrillo, Luis Ruiz-del-Árbol, Cándido Villanueva,Verónica Prado, Mireya Arteaga, Jonel Trebicka, Paolo Angeli, Manuela Merli,Carlo Alessandria, Niels Kristian Aagaard, German Soriano, François Durand,Alexander Gerbes, Thierry Gustot, Tania M. Welzel, Francesco Salerno, RafaelBañares, Victor Vargas, Agustin Albillos, Aníbal Silva, Manuel Morales-Ruiz, MarcoPavesi, Rajiv Jalan, Mauro Bernardi, Richard Moreau, Antonio Páez, VicenteArroyo
PII: S0016-5085(19)33576-0DOI: https://doi.org/10.1053/j.gastro.2019.03.021Reference: YGAST 62534
To appear in: GastroenterologyAccepted Date: 14 March 2019
Please cite this article as: Fernández J, Clària J, Amorós A, Aguilar F, Castro M, Casulleras M, AcevedoJ, Duran-Güell M, Nuñez L, Costa M, Torres M, Horrillo R, Ruiz-del-Árbol L, Villanueva C, Prado V,Arteaga M, Trebicka J, Angeli P, Merli M, Alessandria C, Aagaard NK, Soriano G, Durand F, GerbesA, Gustot T, Welzel TM, Salerno F, Bañares R, Vargas V, Albillos A, Silva A, Morales-Ruiz M, PavesiM, Jalan R, Bernardi M, Moreau R, Páez A, Arroyo V, Effects of Albumin Treatment on Systemicand Portal Hemodynamics and Systemic Inflammation in Patients With Decompensated Cirrhosis,Gastroenterology (2019), doi: https://doi.org/10.1053/j.gastro.2019.03.021.
This is a PDF file of an unedited manuscript that has been accepted for publication. As a service toour customers we are providing this early version of the manuscript. The manuscript will undergocopyediting, typesetting, and review of the resulting proof before it is published in its final form. Pleasenote that during the production process errors may be discovered which could affect the content, and alllegal disclaimers that apply to the journal pertain.
MANUSCRIP
T
ACCEPTED
ACCEPTED MANUSCRIPT
This image cannot currently be displayed.
LAlbD HAlbD
-100
0
100
200
300
chan
ge a
t the
6th
wee
k
-100
0
100
200
300
chan
ge a
t the
6th
wee
k
P=.01 P=.01
IL‐6 VEGF
LAlbD HAlbD LAlbD HAlbD
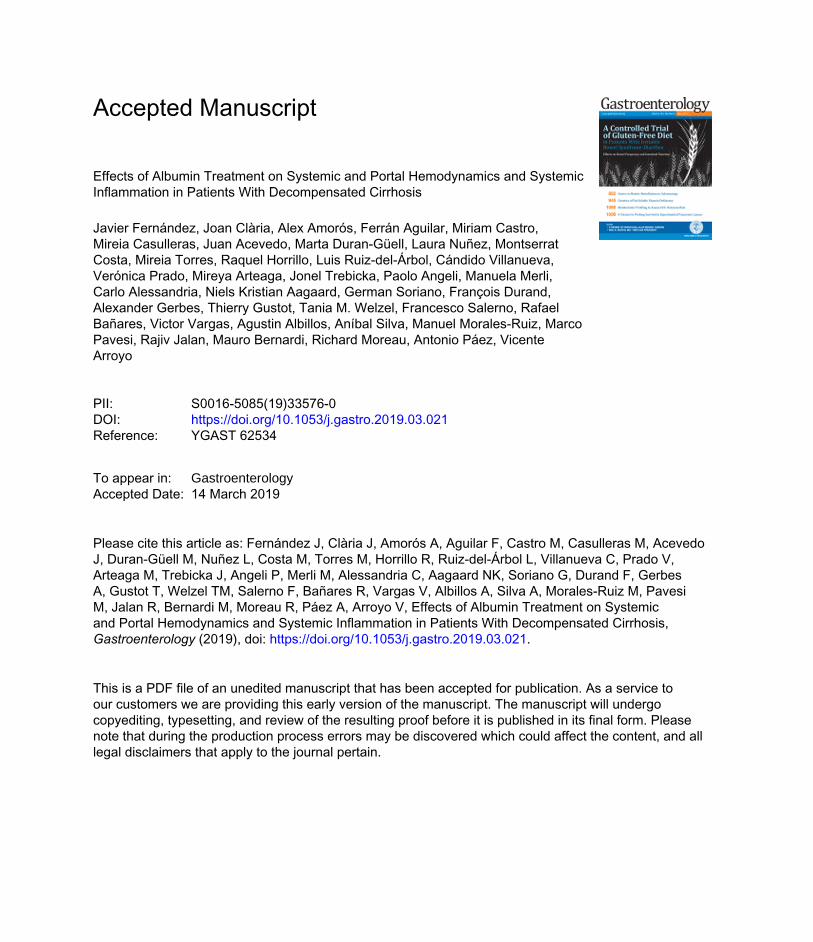
Effects of long‐term albumin treatment on serum albumin levels and inflammatory cytokines
High albumin dose (HAlbD: 1.5 g/kg every week, blue figures) but not low albumin dose (LAlbD: 1 g/kg every 2 weeks: red figures)
normalized serum albumin levels and decreased inflammatory cytokines
MANUSCRIP
T
ACCEPTED
ACCEPTED MANUSCRIPT
Effects of Albumin Treatment on Systemic and Portal Hemodynamics and Systemic
Inflammation in Patients With Decompensated Cirrhosis
Short title: Pleiotropic Effects of Albumin Therapy
Javier Fernández1,2*, Joan Clària1,2*, Alex Amorós1, Ferrán Aguilar1, Miriam Castro2, Mireia
Casulleras2, Juan Acevedo3, Marta Duran-Güell2, Laura Nuñez4, Montserrat Costa4, Mireia
Torres4, Raquel Horrillo4, Luis Ruiz-del-Árbol5, Cándido Villanueva6, Verónica Prado2, Mireya
Arteaga2, Jonel Trebicka1,7, Paolo Angeli1,8, Manuela Merli9, Carlo Alessandria10, Niels Kristian
Aagaard11, German Soriano12, François Durand13, Alexander Gerbes14,Thierry Gustot15, Tania M.
Welzel16, Francesco Salerno17, Rafael Bañares18, Victor Vargas19, Agustin Albillos5, Aníbal Silva2,
Manuel Morales-Ruiz2, Marco Pavesi1, Rajiv Jalan20, Mauro Bernardi21, Richard Moreau1,13,22,
Antonio Páez4, Vicente Arroyo1
*Both authors contributed equally to this work
1EF Clif, EASL-CLIF Consortium and Grifols Chair, Barcelona, Spain
2Hospital Clínic, IDIBAPS and CIBERehd, Barcelona, Spain
3South West Liver Unit, Derriford Hospital, UK
4Bioscience Research Group, Grifols, Barcelona, Spain
5Department of Gastroenterology, Hospital Ramón y Cajal and CIBERehd, Madrid, Spain
6Department of Gastroenterology, Hospital de Sant Pau and CIBERehd, Barcelona, Spain
7Department of Internal Medicine, University Hospital of Bonn, Germany
8Unit of Internal Medicine and Hepatology, Dept. of Medicine, DIMED, University of Padova, Italy.
9 Department of Clinical Medicine, Sapienza University of Rome, Italy
10 Division of Gastroenterology and Hepatology, San Giovanni Battista Hospital, Torino, Italy
11Department of Hepatology & Gastroenterology, Aarhus University Hospital, Denmark
MANUSCRIP
T
ACCEPTED
ACCEPTED MANUSCRIPT12 Department of Gastroenterology and Hepatology, Hospital of Santa Creu i Sant Pau and
CIBERehd, Barcelona, Spain
13 Service d’Hépatologie, Hôpital Beaujon, Assistance Publique-Hôpitaux de Paris, Clichy, France
14 Department of Medicine II, Liver Centre Munich, University Hospital, LMU Munich, Germany
15 Liver Transplant Unit, Erasme Hospital (ULB), Brussels, Belgium
16 Medical Department I, Goethe University, Frankfurt, Germany
17 Department of Internal Medicine, Policlinico IRCCS San Donato, Milano, Italy
18 Department of Gastroenterology, Hospital Gregorio Marañon, and CIBERehd, Madrid, Spain
19 Department of Internal Medicine, Hospital Vall d'Hebron and CIBERehd, Barcelona, Spain
20 Liver Failure Group, Institute for Liver Disease Health, University College London, Royal Free
Hospital, London, UK
21 Department of Medical and Surgical Sciences, University of Bologna, Bologna, Italy
22 Inserm; Université Paris Diderot-Paris 7; Centre de Recherche sur l’Inflammation (CRI), Paris,
France
Address for correspondence J. Fernández, MD, PhD. Liver Unit, Hospital Clínic, Villarroel 170,
08036, Barcelona. Spain. Phone: 34-93-2275400 3329; Fax: 34-93-4515522; E-mail:
Conflict of interest (all authors): Javier Fernandez has received research support from Grifols.
Laura Nuñez, Montserrat Costa, Mireia Torres, Raquel Horrillo and Antonio Páez are full-time
employees of Grifols and have no other competing interests to declare. All other authors
declare that they have no conflict of interest.
MANUSCRIP
T
ACCEPTED
ACCEPTED MANUSCRIPTAuthor’s contributions: JF, MC, JA, MRA, CV, AS, MRM and VA participated in the design and
execution of the pilot PRECIOSA study (IG0802); JF, VP, MA, JT, PA, MM, CA, NKA, GS, FD,
AG, TG, TW, FS, RB, VV, AA and VA participated in the INFECIR-2 study; JF, JC, AA, FA, MP
and VA participated in data analysis and interpretation. JF, JC, AA, FA, JA, LRA, CV, VP, JT, PA,
MM, CA, NKA, GS, FD, AG, TG, TW, FS, RB, VV, AA, RJ, MB, RM, and VA participated in the
writing group. LN, MC, MT, RH and AP from Grifols participated in the design of the pilot
PRECIOSA study (IG0802).
Word count: 6571
Financial support:
The study was supported by European Foundation for the Study of Chronic Liver Failure (EF-
Clif), a non-profit private organization aimed to stimulate research in cirrhosis. EF-Cliff has two
main activities: the European Association for the Study of the Liver (EASL) Chair, which is mainly
devoted to clinical research through the CLIF-Consortium, and the Grifols Chair which has
recently been developed to promote translational research. EF-Clif receives unrestricted
donations from Cellex Foundation, Grifols, and the European Union (coordinator center, partner
and contributor in several projects of the European Union Horizon 2020 research program). The
funders had no influence data analysis, decision to publish or preparation of the manuscript.
Jonel Trebicka is an EF-Clif-Cellex Visiting Professor
List of abbreviations:
ACLF: acute-on-chronic liver failure; ANP: Atrial Natriuretic Peptide; BNP: Brain Natriuretic
Peptide; BUN: Blood urea nitrogen; EASL-CLIF Consortium: European Association for the Study
of the Liver-Chronic Liver Failure Consortium; HAlbD: high albumin dose; HCV: hepatitis C virus;
MANUSCRIP
T
ACCEPTED
ACCEPTED MANUSCRIPTHCC: hepatocellular carcinoma; HRS: hepatorenal syndrome; HVPG: Hepatic venous pressure
gradient; IL: interleukin; INR: international normalized ratio; IQR: interquartile range; LAlbD: low
albumin dose; LV: Left ventricle; MAP: Mean arterial pressure; MELD: model for end stage liver
disease; PAMPs: pathogen associated molecular patterns; PRA: plasma renin activity; PRC:
plasma renin concentration; RCT: randomized controlled trial; SBP: spontaneous bacterial
peritonitis; SVRI: Systemic vascular resistive index; TIPS: transjugular intrahepatic portosystemic
shunt; TNFα: tumor necrosis factor alpha; VEGF: vascular endothelial growth factor.
MANUSCRIP
T
ACCEPTED
ACCEPTED MANUSCRIPTABSTRACT
Background & Aims: We investigated the effect of albumin treatment (20% solution) on
hypoalbuminemia, cardiocirculatory dysfunction, portal hypertension, and systemic inflammation
in patients with decompensated cirrhosis with and without bacterial infections.
Methods: We performed a prospective study to assess the effects of long-term (12 weeks)
treatment with low doses of albumin (1 g/kg body weight every 2 weeks), and high doses (1.5
g/kg every week), on serum albumin, plasma renin, cardiocirculatory function, portal pressure,
and plasma levels of cytokines, collecting data from 18 patients without bacterial infections (the
Pilot-PRECIOSA study). We also assessed the effect of short-term (1 week) treatment with
antibiotics alone vs. the combination of albumin plus antibiotics (1.5 g/kg on day 1 and 1 g/kg at
day 3) on plasma levels of cytokines in biobanked samples from 78 patients with bacterial
infections included in a randomized controlled trial (INFECIR-2 study).
Results: Circulatory dysfunction and systemic inflammation were extremely unstable in many
patients included in the pilot-PRECIOSA study; these patients had intense and reversible peaks
in plasma levels of renin and interleukin 6 (IL6). Long-term high-dose albumin but not low-dose
albumin was associated with normalization of serum level of albumin, improved stability of the
circulation and left ventricular function, and reduced plasma levels of cytokines (IL6, GCSF,
IL1RN, and VEGF) without significant changes in portal pressure. The immune-modulatory
effects of albumin observed in the Pilot-PRECIOSA study were confirmed in the INFECIR-2
study. In this study, patients given albumin had significant reductions in plasma levels of
cytokines.
MANUSCRIP
T
ACCEPTED
ACCEPTED MANUSCRIPTConclusions: In an analysis of data from 2 trials (pilot-PRECIOSA study and INFECIR-2 study)
we found that albumin treatment reduces systemic inflammation and cardiocirculatory dysfunction
in patients with decompensated cirrhosis. These effects might be responsible for the beneficial
effects of albumin therapy on outcomes of patients with decompensated cirrhosis.
ClinicalTrials.gov no: NCT00968695 and NCT03451292
KEY WORDS: Liver-related complications; immune response; splanchnic hemodynamics;
interventional trials
MANUSCRIP
T
ACCEPTED
ACCEPTED MANUSCRIPTThe first studies supporting the use of albumin treatment in cirrhosis were performed in
the 1980´s and consisted of several randomized clinical trials (RCTs) demonstrating that
paracentesis was a rapid, effective and safe therapy of ascites if performed with intravenous (IV)
albumin administration (8 g per liter of ascitic fluid removed).1 Sort et al. subsequently showed
that treatment of spontaneous bacterial peritonitis (SBP) with antibiotics plus albumin (1.5 g/kg
body weight at infection diagnosis and 1 g/kg on day 3) was associated with 60% reduction in the
prevalence of type-1 hepatorenal syndrome (HRS), a special form of acute-on-chronic liver failure
(ACLF), and in hospital mortality.2 Ortega et al.3 later on showed that the simultaneous
administration of terlipressin and albumin (20-40 g/day for 7-14 days) normalized serum
creatinine concentration in approximately 50% of patients with hepatorenal syndrome (HRS).
Finally, the ANSWER study has recently shown that long-term (18 months) prophylactic
administration of albumin (40 g every week) to patients with prior history of ascites is highly
effective in preventing follow-up development of new episodes of ascites, refractory ascites, HRS,
hepatic encephalopathy and bacterial infections, reducing hospital admissions and improving
survival.4 This successful research activity on the therapeutic use of albumin in cirrhosis contrasts
sharply with the low number of investigations performed on its mechanisms of action.1
This article reports the results of the Pilot-PRECIOSA study, which was aimed to identify
an albumin dosage that normalizes serum albumin concentration and to investigate the effects of
the administration of this albumin dosage during 12 weeks on hypoalbuminemia, cardiocirculatory
hemodynamics, effective blood volume, portal pressure and systemic inflammation (as estimated
by the plasma levels of IL-6) in 18 patients with decompensated cirrhosis.
Recent investigations suggest that systemic inflammation plays a major role in the
pathogenesis of acute decompensation and ACLF in cirrhosis.5 The observation of a marked
suppression of the plasma levels of IL-6 during albumin treatment in the Pilot-PRECIOSA
STUDY, which suggests an immunomodulatory effect of albumin treatment, prompted us to
MANUSCRIP
T
ACCEPTED
ACCEPTED MANUSCRIPTperform additional investigations to confirm this feature. These investigations consisted of the
measurement of a large panel of inflammatory mediators in biobanking material from the Pilot-
PRECIOSA study and from the INFECIR-2 study, a RCT aimed to compare the efficacy of
antibiotics alone versus albumin-plus-antibiotics in patients with decompensated cirrhosis and
bacterial infection unrelated to SBP6.
MANUSCRIP
T
ACCEPTED
ACCEPTED MANUSCRIPTMethods
The Pilot-PRECIOSA study and the INFECIR-2 study were approved by the corresponding Ethic
Committees of each hospital involved. The informed consent forms of the two studies included
the potential use of biobanking material for measuring serum albumin levels and plasma renin
and cytokine concentrations.
The Pilot-PRECIOSA study
The Pilot-PRECIOSA study (IG0802, registered at ClinicalTrials.gov as: NCT00968695) is a proof
of concept, open-label, multicenter, nonrandomized (single-group), prospective, phase 4, safety
and dosage-exploratory investigation sponsored by Grifols with the aim to get preliminary
information to design a currently ongoing multicenter randomized controlled therapeutic trial
assessing the efficacy of long-term (1 year) albumin treatment in the prevention of ACLF and
mortality in decompensated cirrhosis (PRECIOSA study, ClinicalTrials.gov: NCT03451292).
Investigators of the EASL-CLIF Consortium from three hospitals (Hospital Clinic and Hospital de
Sant Pau from Barcelona and Hospital Ramón y Cajal from Madrid) participated in the design and
implementation of the study, which started in July 2009 and was completed in April 2014. These
hospitals use the same methodology for cardiocirculatory and hepatic hemodynamic studies and
have large experience in cooperative hemodynamic, pathophysiological and therapeutic studies.
Non-standard laboratory measurements (hormones and biomarkers estimating systemic
inflammation) were centralized at the Hospital Clinic. The results of the Pilot-PRECIOSA study
were submitted to embargo until the onset of the PRECIOSA study.
Inclusion and exclusion criteria and patients evaluated
The study enrolled non-infected patients with decompensated cirrhosis and severe circulatory
dysfunction as defined by the presence of ascites, renal dysfunction [serum creatinine≥ 1.2 mg/dl
MANUSCRIP
T
ACCEPTED
ACCEPTED MANUSCRIPTor blood urea nitrogen (BUN) ≥ 25 mg/dl or dilutional hyponatremia (serum sodium ≤ 130 mEq/l)],
high levels of plasma renin activity (PRA ≥ 2 ng/mlL.h) and need for diuretic treatment to prevent
ascites recurrence (at least 200 mg of spironolactone or 100 mg of spironolactone and 40 mg of
furosemide). PRA was used for assessing sequential changes in effective arterial blood volume.
The exclusion criteria are detailed in the Supplementary Appendix.
One-hundred-thirty-five patients were evaluated, 72 were eligible, and among them 39 showed
exclusion criteria. Of the 33 remaining patients, 12 were excluded for data analysis due to: 1.
Lack of abnormal plasma renin activity (PRA < 2 ng/ml.h) at enrolment (2 patients); 2.
Development of complications requiring treatment that interfere with the interpretations of the
results (intensive care, liver transplantation and insertion of a TIPS, 3 patients); 3. Discontinuation
of albumin treatment (7 patients). Three out of the remaining 21 patients died within the study
period and 3 did not give informed consent for cardiocirculatory and hepatic hemodynamic
assessment. The clinical characteristics at enrolment, and the main complications and causes of
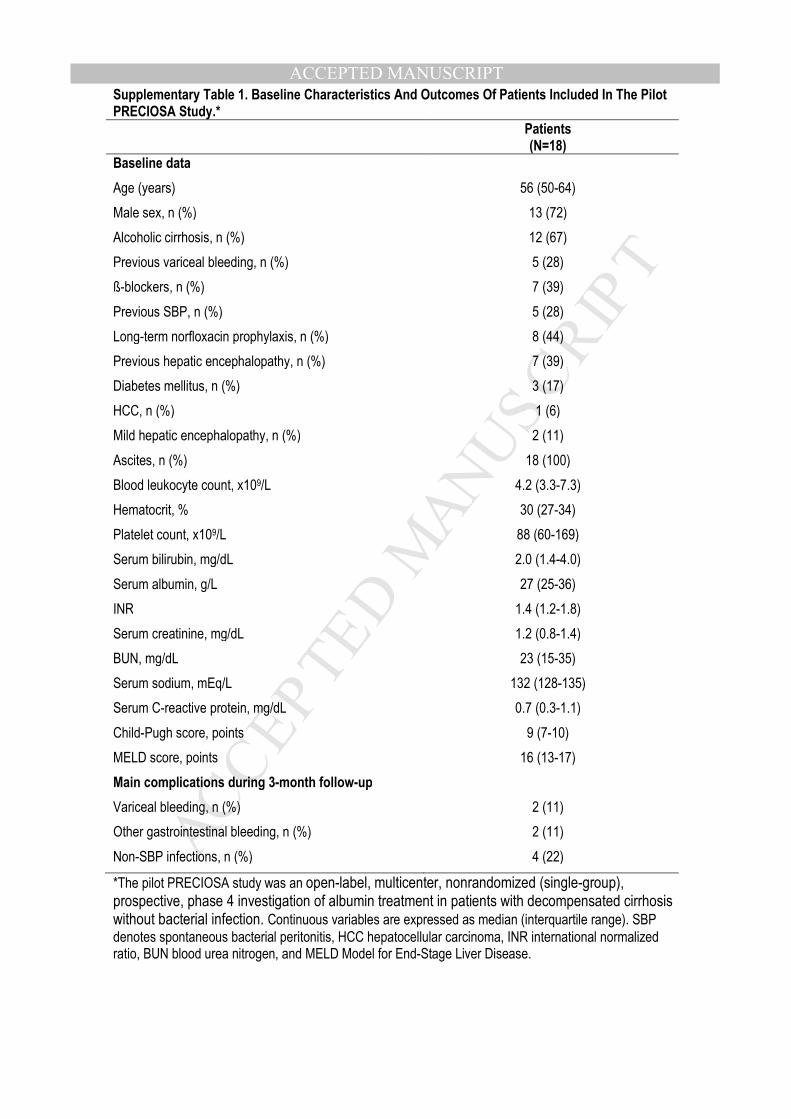
death during the study period are indicated in Supplementary Table 1.
Chronogram
Day 0
Samples were obtained for standard laboratory tests, serum albumin concentration, PRA
(as marker of effective blood volume), plasma concentrations of atrial natriuretic peptide (ANP)
and brain natriuretic peptide (BNP) (markers of central blood volume expansion) and IL-6,
followed by the hepatic and cardiocirculatory hemodynamic study. The methods for these studies
have been previously described.7 Immediately afterwards patients received the first albumin dose
and they were followed-up for 20 weeks.
Weeks 1 to 12
MANUSCRIP
T
ACCEPTED
ACCEPTED MANUSCRIPTThe first 10 patients received an albumin dose of 1g/kg body weight every 2 weeks for 12
weeks (a total of 7 albumin treatments). PRA was measured every 2 weeks prior to each albumin
dose in the first 5 patients and ad hoc weekly in the remaining 5. Plasma IL-6 and serum albumin
concentration were measured every two weeks. An interim analysis in these first 10 patients
showed that this dose of albumin was insufficient to normalize serum albumin concentration
throughout the last 10 weeks of the study period in most patients (normal serum albumin
concentration: 34-47 g/L). Accordingly, albumin dosage was increased to 1.5 g/kg body weight
every week in the remaining patients. Therefore, this second group of patients received a higher
albumin dosage per treatment and more albumin treatments (13) within the same time-period
(day 0 and then every week for 12 weeks). Samples for PRA were taken ad hoc weekly during
treatment. Samples for serum concentration of albumin and plasma levels of IL-6 were obtained
every two weeks. For the description of the results, the group of patients who received albumin at
a dose of 1g/kg every two weeks was defined as “Low Albumin Dosage” (LAlbD) group, and that
receiving albumin at a dose of 1.5 g/kg every week as “High Albumin Dosage” (HAlbD) group.
14th Week
Two weeks after the last albumin dosage, the cardiopulmonary and hepatic
hemodynamic study was repeated.
Post hoc measurements of cytokines, chemokines and other inflammatory markers
The post hoc assessment on the effects of albumin treatment on systemic inflammation was
performed assessing a large panel of inflammatory mediators and biomarkers, including 24
cytokines, 10 chemokines, 4 growth factors and 6 markers of endothelial dysfunction (2),
coagulation/platelet dysfunction (2) and monocyte activation (2), in biobanking material
(September 2018).
MANUSCRIP
T
ACCEPTED
ACCEPTED MANUSCRIPTThe INFECIR-2 Study
The INFECIR-2 study is an EASL-CLIF Consortium investigator-promoted, phase 4, randomized,
open-label, parallel, multicenter trial promoted by the Fundació Clínic (Hospital Clínic, University
of Barcelona, Spain). It started in September 2014 and was finished in December 2016
(ClinicalTrials.gov: NCT02034279). The inclusion and exclusion criteria are detailed in the
Supplementary Appendix. The study was aimed to assess the efficacy of short-term albumin
treatment in the prevention of ACLF and hospital mortality in 136 patients with decompensated
cirrhosis and acute bacterial infections unrelated to SBP. Eighteen patients were considered
inclusion errors. Therefore, 118 patients were randomized to receive either antibiotics alone
(antibiotics-alone group; n=57), or antibiotics plus two albumin doses, i.e., 1.5 g/kg at inclusion
(day 1) and 1g/kg on day 3 (albumin-plus-antibiotics group; n=61). Plasma samples for
biobanking were obtained at day 1, prior to the administration of the first albumin dose, at day 3,
prior to the second albumin dose, and/or at day 7 in 48 and 47 patients, from the albumin-plus-
antibiotics and antibiotics-alone groups, respectively. “On treatment” values of plasma cytokine
levels given in the article represent the average of those obtained at day 3 and 7 (in patients with
two measurements) or those obtained at day 3 or 7 in patients with only a single measurement.
Both groups were similar regarding patient characteristics (except for the combined prevalence of
ACLF and kidney dysfunction at baseline, higher in the albumin arm), type of infections and
antibiotic therapy. The results of the INFECIR-2 study have recently been reported 6.
The current study used biobanking aliquots from the INFECIR-2 study for measurement
of the serum concentration of albumin, the plasma concentration of renin (PRC) and the plasma
concentration of the same panel of cytokines, chemokines, growth factors, and other
inflammatory markers studied in the Pilot-PRECIOSA study. Measurements were performed at
baseline and during treatment among 40 patients from the antibiotics-alone group and 38 patients
from the albumin-plus-antibiotics group. The pre-specified criteria to select these 78 patients
MANUSCRIP
T
ACCEPTED
ACCEPTED MANUSCRIPTwere: 1. Availability of biobanking samples; 2. Infection receiving appropriate empirical antibiotic
treatment; 3. Absence of severe complications within the first week of treatment that could affect
the interpretation of the results; 4. Completion of one-week follow-up.
Laboratory methods,
Hormones and IL-6 were measured by radioimmunoassay (PRA), chemiluminescent
immunoassay (PRC), immunoassay (ANP and BNP) and ELISA (IL-6). Measurement of the panel
of cytokines, chemokines and other inflammatory mediators in patients from the Pilot-PRECIOSA
and INFECIR-2 studies were performed using two multiplex immunoassays based on Luminex
multi-analyte profiling technology. The plasma levels of sCD163 and sMR/sCD206 were
determined by enzyme-linked-immunosorbent-assay. Methods are detailed in the Supplementary
Appendix.
Statistical Methods
In the Pilot-PRECIOSA study, for a given patient on albumin treatment, there were
several available results for serum albumin, PRA, and plasma IL-6. We averaged all the available
values within the last 10 weeks of treatment to obtain a single “on-treatment” value for
comparison with the corresponding baseline value.
Results are presented as median and interquartile range (IQR). For univariate analysis
Mann-Whitney test and Wilcoxon signed rank test were used for not normally distributed
variables. In all statistical analyses, significance was set at P <0.05. Analysis were performed
with SAS (version 9.4; SAS Institute Inc.; Cary, NC) statistical packages. Graphs were performed
with GraphPad Prism (version 5.00, GraphPad Software, San Diego, CA).
MANUSCRIP
T
ACCEPTED
ACCEPTED MANUSCRIPTResults
Baseline Clinical Characteristics Of The Patients Included In The Pilot-PRECIOSA Study
All the 18 patients included were admitted to hospital for the treatment of ascites; 3 had diabetes
mellitus, 1 hepatocellular carcinoma and 2 minimal hepatic encephalopathy. Other characteristics
at enrollment are illustrated in Supplementary Table 1.
Effect Of Long-term Albumin Treatment And Its Dosage On Serum Albumin Concentration
(Pilot-PRECIOSA Study)
Thirteen out of the 18 patients included completing the sequential measurement of plasma
albumin concentration had baseline hypoalbuminemia (serum albumin concentration <34 g/L).
The effect of albumin treatment on serum albumin concentration was related to two factors. The
first factor was albumin dosage. Although patients of the LAlbD group with baseline
hypoalbuminemia (n=7) exhibited increases in serum levels of albumin during treatment, only one
normalized the serum albumin concentration, i.e. had an increase in albumin level to a value ≥34
g/L in all measurements. In contrast, all patients of the HAlbD group with baseline
hypoalbuminemia (n=6) normalized serum albumin concentration “on treatment” (P<0.001; Figure
1, Panel A). The median increase in serum albumin among patients receiving HAlbD or LAlbD,
are detailed in Table 1, for all patients, and in Figure 1, panel B, specifically for patients with
baseline hypoalbuminemia. Four out of the 5 patients with normal baseline serum albumin
concentration (3 from the LAlbG and 2 from the HAlbG) showed relatively stable serum albumin
concentration (always within the normal limits: 34-47 g/L) throughout the study (Figure 1, Panel
C). The fifth patient exhibited an “on-treatment” increase in serum albumin, but this was also
within normal limits.
The second factor influencing the effect of albumin treatment was the grade of
hypoalbuminemia at baseline. There was a significant inverse correlation between the baseline
MANUSCRIP
T
ACCEPTED
ACCEPTED MANUSCRIPTserum albumin concentration and the median change in serum albumin during treatment in both
the HAlbD and the LAlbD groups (Figure 1, Panel D), the lower the baseline albumin
concentration the higher the median increase in the serum albumin levels achieved during
treatment. The response to albumin treatment at each level of serum albumin concentration was
higher in patients receiving HAlbD.
Effect Of Long-term Albumin Treatment And Its Dosage On PRA (Pilot-PRECIOSA Study)
Long-term albumin treatment was surprisingly not associated with significant suppression in PRA
in patients receiving both HAlbD and LAlbD, suggesting a minor effect on the effective blood
volume (Table 1). Figure 1, panels E and F, show the individual time-course changes of PRA in
patients receiving LAlbD and HAlbD, respectively. An intriguing observation was the extreme
instability of effective blood volume, as indicated by the development of acute, high and transient
positive peaks of PRA (increase in PRA >100% to levels over 10 ng/ml.h) in a significant number
of patients. Peaks were observed more frequently in the LAlbD group (6 patients, 60%) than in
the HAlbD group (1 patient, 12.5%) (P=0.04), suggesting that although albumin treatment was not
effective in improving mean effective blood volume it was capable to stabilize circulatory function.
Effect Of Long-term Albumin Treatment And Its Dosage On Plasma IL-6 Levels (Pilot-
PRECIOSA Study)
To explore the possibility that albumin treatment can affect systemic inflammation, we
sequentially measured the plasma levels of IL-6 at day 0 and every two weeks after day 0 in the
Pilot-PRECIOSA study. IL-6 is a paradigmatic proinflammatory cytokine whose plasma levels are
increased in most patients with cirrhosis and systemic inflammation6. Nine patients from the
LAlbD group and 7 from the HAlbD group had measurable levels of IL-6 at baseline and during
treatment. The effect of albumin treatment on systemic inflammation in each patient could then be
MANUSCRIP
T
ACCEPTED
ACCEPTED MANUSCRIPTestimated as the absolute or percent change of IL-6 between baseline value and “on treatment
value” (Table 1). The median baseline value for plasma IL-6 levels in the 16 patients was well
above the normal range, consistent with the existence of systemic inflammation in this group of
patients. We arbitrarily defined that a patient developed significant immunomodulatory response
to albumin treatment when the “on treatment” IL-6 level decreased by more than 20% below the
baseline level. An outstanding finding of the current study was that the majority of patients
receiving HAlbD (6 out of 7 patients, 85.7%) but only 1 out of 9 patients receiving LAlbD (11%;
P=0.003 for between-group comparison) had a reduction of plasma IL-6 > 20%, suggesting that
long-term treatment with HAlbD but not with LAlbD induces significantly immunomodulatory effect
in patients with decompensated cirrhosis. Consistent with these findings, we found that the
median reduction from baseline for IL-6 was significantly greater among patients receiving HAlbD
than among those receiving LAlbD, whichever the way of expressing reduction, percentage or
absolute values (Table 1).
A second important finding was that systemic inflammation was unstable in a significant
number of patients (1 out of 7 receiving HAlbD and 4 out of 9 receiving LAlbD), with acute, high
and reversible peaks of the plasma IL-6 (i.e., increases by at least 100% to levels over 100
pg/mL) during albumin treatment (Figure 2, panel A). The remaining 11 patients showed small
changes (mainly patients receiving LAlbD) or marked reductions (mainly patients receiving
HAlbD) of “on treatment” IL-6 (Figure 2, panel B).
Effect of Long-term Albumin Treatment And Its Dosage On A Large Panel Of Plasma
Cytokines (Pilot-PRECIOSA Study)
The finding that elevated baseline plasma IL-6 levels as determined by ELISA can be reduced by
albumin therapy in a dose-dependent manner, prompted us to investigate the effects of this
treatment on the plasma levels of a large number of cytokines (24) in biobanking samples
MANUSCRIP
T
ACCEPTED
ACCEPTED MANUSCRIPTobtained at baseline and at week 6 of albumin treatment in 10 patients from the LAlbD group and
in 5 patients in the HAlbD group. In addition, we measured the plasma levels of the 24 cytokines
in 25 healthy donors recruited at the Hospital Clínic Blood Bank.
Among the 24 cytokines measured, 11 were not detectable in any patient/healthy subject.
Baseline values of all but two of the remaining 13 cytokines included in the panel were
significantly higher among patients with decompensated cirrhosis than among healthy subjects,
confirming the existence of full-blown systemic inflammation in decompensated cirrhosis (Table
2). In the next tables only changes in relevant cytokines are presented. Patients receiving LAlbD
experienced only a small reduction or moderate increase during treatment in the plasma levels of
these cytokines, a feature that contrasts sharply with the marked suppression of most cytokines
in patients receiving HAlbD (Table 3, Figure 2, panels C and D). These results strongly suggest
that long-term albumin treatment, if given at high dosage, has a significant immunomodulatory
effect in decompensated cirrhosis reducing the degree of systemic inflammation.
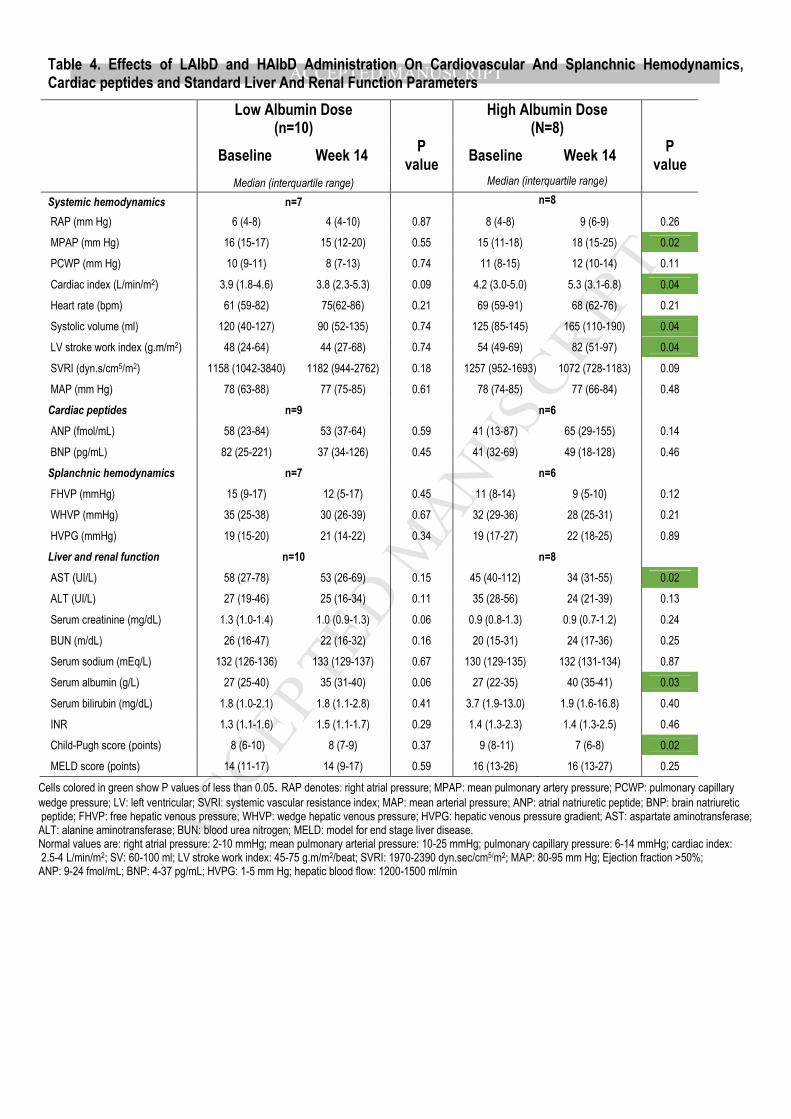
Effects of Long-term Albumin Treatment On Systemic And Splanchnic Hemodynamics,
Natriuretic Peptides, And Liver And Renal Function (Pilot-PRECIOSA study)
Treatment with HAlbD but not with LAlbD was associated with a significant increase in cardiac
index, systolic volume and left ventricular stroke work index indicating an increase in left
ventricular function (Table 4). There were no changes in most parameters estimating cardiac
preload, including atrial pressure, pulmonary capillary wedged pressure, and plasma
concentrations of ANP and BNP. There was, however a significant increase in mean pulmonary
artery pressure in patients receiving HAlbD, although it might be related to improvement in right
ventricular function. All patients had severe portal hypertension at enrollment. HAlbD and LAlbD
treatment, however, was not associated with significant changes in hepatic venous pressure
MANUSCRIP
T
ACCEPTED
ACCEPTED MANUSCRIPTgradient, a sensitive marker of portal pressure. There were also no major changes in other
relevant standard laboratory parameters in both groups.
Effect Of Short-Term Albumin Treatment On Serum Albumin And Plasma Levels Of Renin
And Of a Large Panel Of Inflammatory Cytokines in Patients With Infections (INFECIR-2
Study)
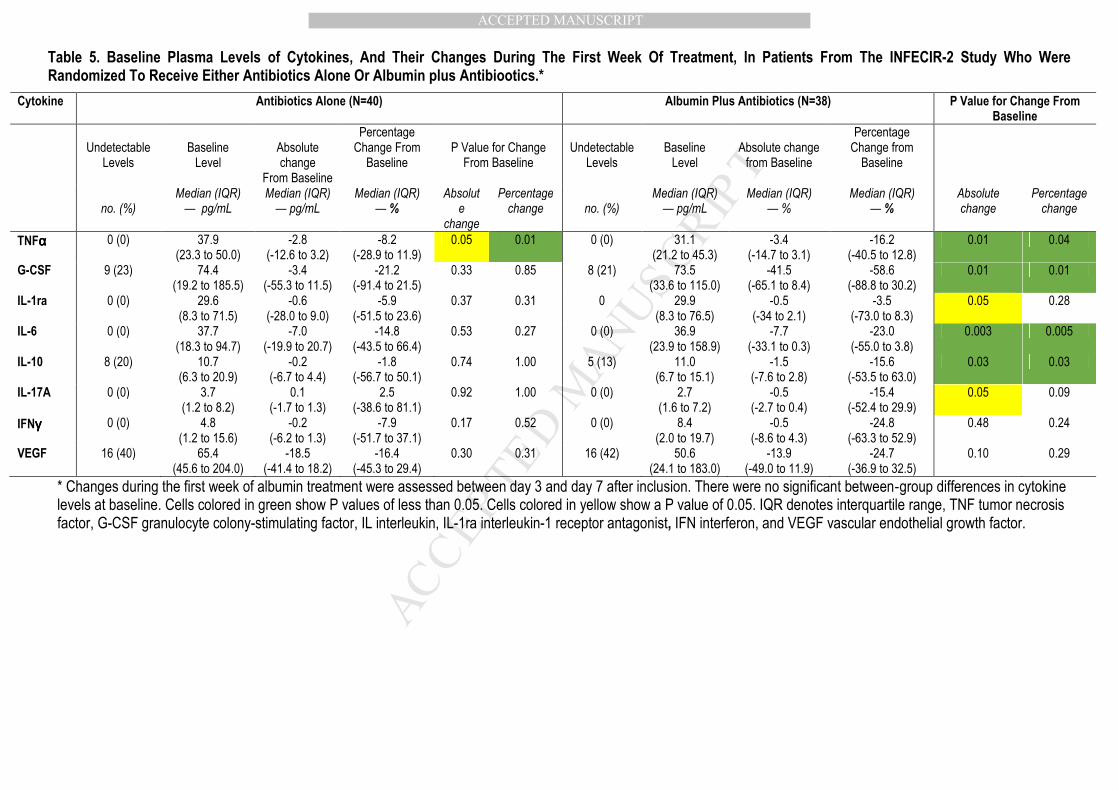
Next, we asked whether albumin therapy could have a reducing effect on plasma cytokine levels
in patients with bacterial infections included in the INFECIR-2 study. Bacterial infections are
known to result in an enhancement of the systemic inflammation already present in patients with
decompensated cirrhosis.7 This explains why baseline levels of TNF-α, IL-4, IL-6 and IL-10 were
significantly higher among patients included in the INFECIR-2 study than among those included
in the pilot PRECIOSA study (Table 2). As expected for a randomized trial, in the INFECIR-2
study, the baseline plasma cytokine levels were similar among patients assigned to receive
antibiotics alone and among those assigned to albumin-plus-antibiotics (Table 5).
Treatment with antibiotics alone was not associated with significant changes in most
cytokines. Only one showed a significant suppression (TNF-αααα) during treatment. In contrast,
patients treated with albumin-plus-antibiotics had, during treatment, a significant decrease or a
clear trend for a reduction in most cytokines (Table 5), suggesting that albumin associated with
antibiotics was more effective than antibiotics alone in attenuating baseline systemic inflammation
in patients with bacterial infections.
In the INFECIR-2 study, baseline values for serum albumin concentration were similar
between patients of the antibiotics-alone group (26 [20 to 30] g/L) and those of the albumin-plus-
antibiotics group (25 [19 to 30] g/L; P=0.91). The baseline activity of the renin-angiotensin
system, estimated by PRC, was greater among patients of the albumin-plus-antibiotics group
than among those of the antibiotics-alone group although difference was not statistically
MANUSCRIP
T
ACCEPTED
ACCEPTED MANUSCRIPTsignificant (241.6 [46.3 to 903.0] µIU/mL and 125.0 [34.0 to 398.6] µIU/mL, respectively; P=0.25).
Antibiotics alone were not associated with significant changes from baseline for serum albumin
concentration (0 [-20 to 1.0] g/L) or PRC (-1.2 [-26.5 to 129.6] µIU/mL). In contrast, albumin-plus-
antibiotics significantly increased serum albumin concentration (7.0 [4.0 to 10.0] g/L; P< 0.0001)
and suppressed PRC [-40. 5 [-272.9 to -4.5], µIU/ml; P=0.002].
Effect Of Short-Term And Long-Term Albumin Treatment On Chemokines, Growth Factors,
And Biomarkers Of Macrophage Activation, Endothelial Dysfunction And
Coagulation/Platelet Function (Pilot-PRECIOSA and INFECIR-2 studies)
To have a comprehensive view of the effects of albumin treatment in both, the Pilot-PRECIOSA
and the INFECIR-2 studies, we assessed a broad variety of soluble factors, including
chemokines, growth factors and markers of macrophage activation and endothelial and
coagulation/platelet dysfunction. As shown in Supplementary Tables 3 and 4, in both studies,
albumin treatment was associated with minor or no changes in most of these factors, suggesting
that it exerts its immunomodulatory effect mainly by influencing production and/or release of
specific cytokines.
MANUSCRIP
T
ACCEPTED
ACCEPTED MANUSCRIPTDiscussion
Current albumin dosage in cirrhosis is based on empirical assumptions and on the concept that
albumin mainly acts as a plasma volume expander.8 Of note, albumin therapy, can have many
other important biological effects since it is capable to bind and inactivate a wide range of
endogenous and exogenous ligands.1 The ability of albumin to bind pro-inflammatory molecules
such as pathogen associated molecular patterns (PAMPs, e.g., the Gram-negative bacteria
byproduct lipopolysaccharide),9 prostaglandins, 10 nitric oxide11 and reactive oxygen and nitrogen
species12 could be of greatest importance in the context of cirrhosis, because these molecules
are involved in the pathogenesis of the systemic inflammation and circulatory and organ
dysfunction/failure that characterizes decompensated cirrhosis and ACLF.13 As the occurrence of
these non-osmotic effects of albumin therapy in cirrhosis was elusive, there was an urgent need
to address this question which gave rise to the present study.
The current article describes five important unreported observations on the
pathophysiology and albumin treatment of decompensated cirrhosis. The first is that the long-
term albumin dosage required to normalize serum albumin concentration is much higher than that
used in all randomized controlled therapeutic trials so far performed.4,14 The second is that
circulatory dysfunction is not a steady state or a slowly progressive process, as it has been
traditionally considered, but rather an extremely unstable condition. The third observation is that
systemic inflammation in cirrhosis is also unstable with acute episodes of burst of circulating
cytokines in the absence of any identifiable precipitating event. The fourth is that HAlbD but not
LAlbD treatment is associated with significant improvement in left ventricular function in
decompensated cirrhosis, which is currently considered as an important mechanism of systemic
circulatory dysfunction.15 Finally, and most importantly, the sequential assessment of the plasma
levels of IL-6 during albumin treatment showed for the first time that long-term albumin treatment
at high dosage has immunomodulatory effects in decompensated cirrhosis. The transcendence of
MANUSCRIP
T
ACCEPTED
ACCEPTED MANUSCRIPTthis later finding was the reason to complete the study with two additional investigations. The first
was aimed to assess if the suppressive effect of albumin on IL-6 observed in the patients
included in the Pilot-PRECIOSA study also extended to other cytokines and inflammatory
molecules. The second was to investigate if the immunomodulatory effect observed during long-
term treatment with HAlbD in patients without bacterial infection also occurs following short-term
(one week) high albumin dosage treatment in patients with bacterial infections. For these
objectives, we leveraged the availability of biobanking material from the Pilot-PRECIOSA and
INFECIR-2 studies.
The initial albumin dose evaluated in the Pilot-PRECIOSA study (1 g/kg every two weeks
during 12 weeks) was based on that used in the pioneer RCT by Gentilini et al14 (25 g per week)
exploring the effect of long-term of albumin treatment on the response to diuretics in patients with
cirrhosis ascites, and in two RCTs exploring the long-term effect of albumin administration on the
natural course of decompensated cirrhosis (the ANSWER study: 40 g of albumin every week4,
and the MATCH study: 40 g every 2 weeks16). The results of the current study indicate that a
dose of 1g/kg, which is higher than the MATCH study dose and only slightly lower than the
ANSWER study dose, was clearly insufficient to normalize serum albumin concentration in seven
out of the eight patients with hypoalbuminemia included in the LALbD group. In contrast, our
second albumin dosage (1.5 g/kg per week) rapidly normalized serum albumin concentration in
all patients with hypoalbuminemia included in the HAlbD group.
The time-course changes of serum albumin concentration during albumin treatment
suggest that the homeostatic feedback mechanism by which hepatic albumin synthesis is
regulated by the serum albumin concentration17 is fully operative in patients with advanced
cirrhosis. Normalization of serum albumin concentration in patients with hypoalbuminemia
receiving HAlbD occurred very rapidly (within 2 weeks) following the onset of albumin treatment
but once normalized it remained within normal limits throughout the study despite the weekly
MANUSCRIP
T
ACCEPTED
ACCEPTED MANUSCRIPTadministration of albumin at a concentration of 20 g/dL (5 times higher than the normal serum
albumin concentration). This rapid and intense initial increase in serum albumin concentration
was probably the consequence of the combination of increased albumin synthesis by the liver
secondary to hypoalbuminemia and the effect of the exogenous albumin administrations. In
contrast, following normalization of serum albumin, the inhibitory effect of normo-albuminemia
upon albumin synthesis precluded any further increase in serum albumin concentration despite
continuous albumin treatment. The homeostatic feedback mechanism of serum albumin would
also explain why albumin treatment did not increase serum albumin concentration in patients
without hypoalbuminemia (for additional explanatory details see figure 1 legend).
The most relevant finding of our study was the observation that both long-term and short-
term albumin treatment, if given at high dosage, are associated with significant
immunomodulatory effects in decompensated cirrhosis. Three lines of evidence supported this
conclusion. The first derived from the sequential measurement of IL-6 during albumin treatment in
patients included in the pilot-PRECIOSA study. The median reduction from baseline of plasma IL-
6 levels was significantly greater among patients receiving HAlbD than among those receiving
LAlbD. This finding is important considering that IL-6 has broad effect on immune and non-
immune cells and often displays hormone-like characteristics that can affect homeostatic
processes.18 The second line of evidence derived from the analysis of the effect of albumin
treatment on cytokines other than IL-6 in biobanking material from the Pilot-PRECIOSA study.
This investigation, confirmed the observations of the first investigation. Treatment with HAlbD but
not that using LAlbD was associated with significant decrease in plasma IL-6 during treatment.
Moreover, it demonstrated that this effect also involved other keystone cytokines (e.g., G-CSF),
confirming that long-term therapy with HAlbD but not that using LAlbD induces a significant and
extensive immunomodulatory effect in decompensated cirrhosis. Finally, the third line of evidence
was obtained from the analysis of biobanking plasma samples from the INFECIR-2 study.
MANUSCRIP
T
ACCEPTED
ACCEPTED MANUSCRIPTTreatment with albumin-plus-antibiotics was associated with a rapid, significant and widespread
suppression of the circulating levels of cytokines, an effect not observed with antibiotics alone. It
was interesting to observe that the immunomodulatory effect of albumin in the Pilot-PRECIOSA
and INFECIR-2 studies was related mainly to the inhibitory effect of albumin on cytokine
production but not to an effect on other inflammatory molecules.
An intriguing finding of our study was the observation of one or two acute, intense and
spontaneously reversible peaks of PRA and plasma IL-6 during albumin treatment in many
patients included in the Pilot-PRECIOSA. There are reasons to suggest that the prevalence and
frequency of these peaks in the current study are not representative of their actual prevalence
and frequency in patients with decompensated cirrhosis. First, we monitored PRA and plasma IL-
6 only once every week or two weeks during the study period. On the other hand, according to
our data the duration of these peaks may range from less than one to two or more weeks.
Therefore, we could have lost a significant number of peaks in our patients. Interestingly, the
prevalence of PRA and IL-6 peaks was lower in patients receiving HAlbD than in those receiving
LAlbD suggesting that treatment with HAlbD may prevent the occurrence of these acute episodes
of aggravation of circulatory dysfunction and systemic inflammation in decompensated cirrhosis.
Although the current study is the first demonstrating these abnormalities, the existence of such
episodes of acute circulatory impairment and systemic inflammation had already been anticipated
by the “Systemic Inflammation Hypothesis” as an explanation for the 40% prevalence of ACLF in
patients without any identifiable exogenous precipitating event of the syndrome.14,19 The
proposed mechanism of such changes by the ”Systemic Inflammation Hypothesis” is the
existence of transient bursts of translocation of viable bacteria or bacterial products from the
intestinal lumen to the systemic circulation. Therefore, the potential futility of single
measurements of renin and cytokines as surrogate markers of effective blood volume and
MANUSCRIP
T
ACCEPTED
ACCEPTED MANUSCRIPTsystemic inflammation in patients with decompensated cirrhosis has to be considered in the
design of future studies.
Although circulatory dysfunction in cirrhosis has been traditionally attributed to splanchnic
arterial vasodilation, there is now evidence that impairment in left ventricular function plays also a
major role. In fact, cardiac index in cirrhosis falls progressively from compensated cirrhosis to
decompensated cirrhosis and HRS.15 Our data show that normalization of serum albumin
concentration with long-term HAlbD treatment in non-infected patients with decompensated
cirrhosis does not induce significant changes in central blood volume and portal pressure.
However, it was associated with a significant improvement in left ventricular (LV) function. These
observations are important for two reasons. The first is that they explain why treatment with
HAlbD is generally not associated with variceal bleeding or pulmonary edema in decompensated
cirrhosis without bacterial infections. Second, since systemic inflammation induces direct
deleterious effect on heart function, our study supports the concept that the beneficial effect of
albumin treatment in the management of organ dysfunction/failure in cirrhosis may be mediated,
at least in part, by its immunomodulatory effect. In fact, this has also been observed in rats with
carbon tetrachloride-induced cirrhosis, which develop evidences of systemic inflammation and
inflammation in the cardiac tissue associated with severe impairment of LV contractibility, which
reverses following albumin treatment.20
One of the strengths of our study is the use of multiple plasma samples whose
prospective collection was pre-specified in the context of two well-designed multicenter controlled
trials, of which one was randomized. A limitation of our study was the relative low number of
patients included in the Pilot-PRECIOSA study. However, the most important finding of this
investigation, the significant immunomodulatory effect of albumin treatment in patients with
advanced cirrhosis, was confirmed by assessing the effect of albumin treatment on a large panel
of inflammatory cytokines both in patients included in the Pilot-PRECIOSA study and in a
MANUSCRIP
T
ACCEPTED
ACCEPTED MANUSCRIPTrelatively large number of patients included in the INFECIR-2 study, thus offering solid additional
arguments supporting our conclusions.
In summary, the current study allowed us to uncover important new findings related to the
efficacy of albumin treatment in cirrhosis. The most outstanding were that high doses of albumin,
but not low doses of albumin in patients with decompensated cirrhosis, have significant
immunomodulatory effect, prevent a phenomenon revealed by the present study and which
consists of “bursts” of circulatory dysfunction, improve LV function and correct serum albumin
levels without inducing “albumin overdose”, probably because of the preservation of negative
feed-back mechanisms controlling albumin synthesis, even in advanced liver disease. Since
albumin is capable to bind and inactivate many inflammatory promoters such as PAMPs,
bioactive lipid metabolites, reactive oxygen species and nitric oxide, the immunomodulatory effect
of albumin could be related to this scavenging function. However, this explanation may be too
simplistic, and further investigators are clearly needed to understand the anti-inflammatory effect
of albumin treatment in cirrhosis.
MANUSCRIP
T
ACCEPTED
ACCEPTED MANUSCRIPT
References
1. Arroyo V, García-Martínez R, Salvatella X. Human serum albumin, systemic inflammation, and
cirrhosis. J Hepatol 2014;61:396-407.
2. Sort P, Navasa M, Arroyo V, et al. Effect of intravenous albumin on renal impairment and
mortality in patients with cirrhosis and spontaneous bacterial peritonitis. N Engl J Med
1999;341:403-409.
3. Ortega R, Ginès P, Uriz J, et al. Terlipressin therapy with and without albumin for patients with
hepatorenal syndrome; results of a prospective non-randomized study. Hepatology 2002;36:941-
948.
4. Caraceni P, Riggio O, Angeli P, et al. Long-term albumin administration in decompensated
cirrhosis (ANSWER): an open-label randomised trial. Lancet. 2018;391:2417-2429.
5. Clària J, Stauber RE, Coenraad MJ, et al. Systemic inflammation in decompensated cirrhosis:
characterization and role in acute-on-chronic liver failure. Hepatology 2016;64:1249-64.
6. Fernández J, Angeli P, Trebicka J, et al. Albumin treatment in patients with cirrhosis and
infections unrelated to SBP: The INFECIR-2 randomized trial. Gastroenterology 2019 (submitted)
7. Fernández J, Navasa M, Garcia-Pagan JC, et al. Effect of intravenous albumin on systemic and
hepatic hemodynamics and vasoactive neurohormonal systems in patients with cirrhosis and
spontaneous bacterial peritonitis. J Hepatol 2004;41:384-390
8. European Association for the Study of the Liver. EASL clinical practice guidelines for the
management of decompensated cirrhosis. J Hepatol 2018;69:406-460.
9. Gioannini TL, Zhang D, Teghanemt A, et al. An essential role for albumin in the interaction of
endotoxin with lipopolysaccharide-binding protein and sCD14 and resultant cell activation. J Biol
Chem 2002;277:47818-47825.
MANUSCRIP
T
ACCEPTED
ACCEPTED MANUSCRIPT10. O'Brien AJ, Fullerton JN, Massey KA, et al. Immunosuppression in acutely decompensated
cirrhosis is mediated by prostaglandin E2. Nat Med 2014;20:518-523
11. Stamler JS, Jaraki O, Osborne J, et al. Nitric oxide circulates in mammalian plasma primarily as a
S-nitroso adduct of serum albumin. Proc Natl Acad Sci USA 1992;89:7674-7677.
12. Anraku M, Chuang VT, Maruyama T, et al. Redox properties of serum albumin. Biochim Byophys
Acta 2013;1830:5465-5472.
13. Gentilini P, Casini-Raggi V, Di Fiore G, et al. Albumin improves the response to diuretics in
patients with cirrhosis and ascites: results of a randomized, controlled trial. J Hepatol
1999;30:639-645.
14. Bernardi M, Moreau R, Angeli P, et al. Mechanisms of decompensation and organ failure in
cirrhosis: From peripheral arterial vasodilation to systemic inflammation hypothesis. J Hepatol
2015;63:1272-84.
15. Ruiz-del-Arbol L, Monescillo A, Arocena C, et al. Circulatory function and hepatorenal syndrome
in cirrhosis. Hepatology 2005;42:439-47.
16. Solà E, Solé C, Simón-Talero M, et al. Midodrine and albumin for prevention of complications in
patients with cirrhosis awaiting liver transplantation. A randomized placebo-controlled trial. J
Hepatol 2018;69:1250-1259.
17. Pietrangelo A, Panduro A, Chowdhury JR, et al. Albumin gene expression is down-regulated by
albumin or macromolecule infusion in the rat. J Clin Invest 1992;89:1755-1760.
18. Hunter CA, Jones SA. IL-6 as a keystone cytokine in health and disease. Nat Immunol
2015;16:448-457.
19. Moreau R, Jalan R, Gines P, et al. Acute-on-chronic liver failure is a distinct syndrome that
develops in patients with acute decompensation of cirrhosis. Gastroenterology 2013;144:1426-
1437.
MANUSCRIP
T
ACCEPTED
ACCEPTED MANUSCRIPT20. Bortoluzzi A, Ceolotto G, Gola E, et al. Positive cardiac inotropic effect of albumin infusion in
rodents with cirrhosis and ascites: molecular mechanisms. Hepatology 2013;57:266-276.
Author names in bold designate shared co-first authorship.
MANUSCRIP
T
ACCEPTED
ACCEPTED MANUSCRIPT
Figure legends
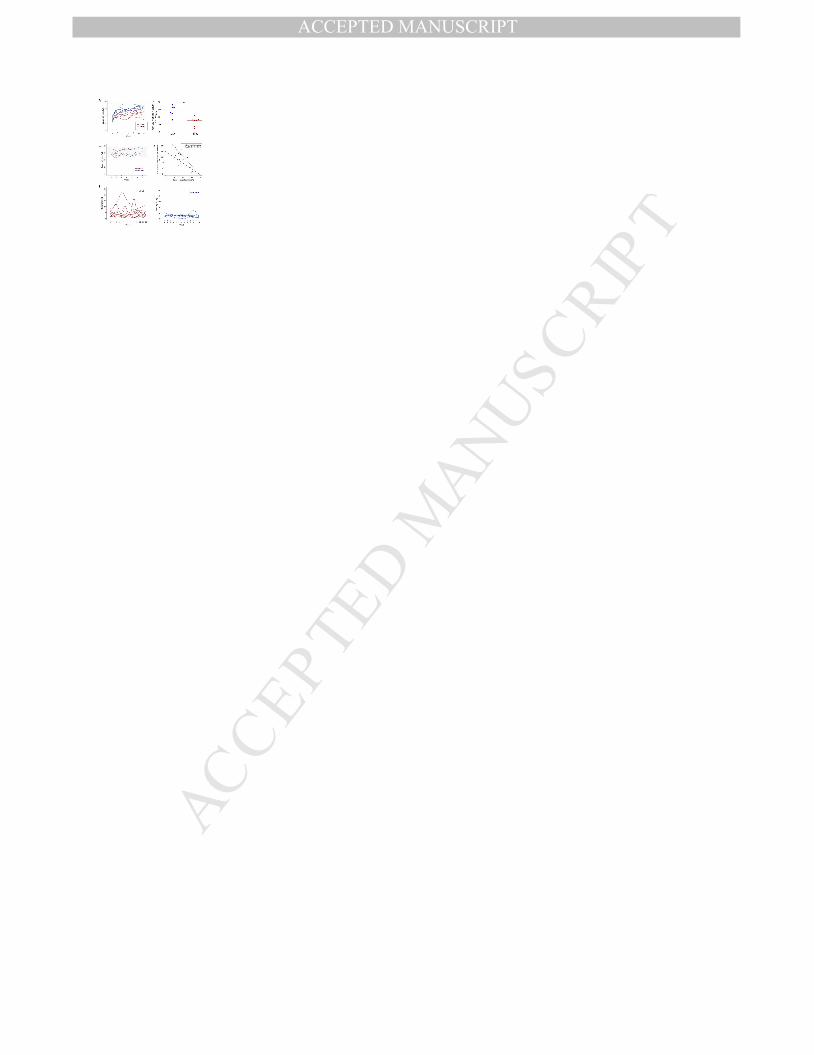
Figure 1
Changes in serum albumin concentration and plasma renin activity (PRA) induced by treatment
with high albumin dosage (HAlbD, blue color in all panels) and low albumin dosage (LAlbD, red
color) in the 18 patients included in the Pilot-PRECIOSA Study. Panel A: Individual changes in
serum albumin concentration among the 13 patients with baseline hypoalbuminemia (serum
albumin concentration <34 g/L). The horizontal lines indicate the upper and lower normal limits of
serum albumin. All the six patients with hypoalbuminemia treated with HAlbD developed a rapid
increase (within 2 weeks) in serum albumin concentration up to normal levels, remaining so
during the remaining 10 study-weeks. In contrast, although all the 7 patients with baseline
hypoalbuminemia treated with LAlbD increased the serum levels of albumin during treatment,
only one normalized the serum albumin concentration. Panels B to D: Two factors influenced the
response to albumin treatment. The first factor was the albumin dosage: Among the 13 patients
with baseline hypoalbuminemia, the individual absolute median increase in serum albumin was
almost double in patients receiving HAlbD than in those receiving LAlbD (Panel B); The second
factor was the feedback mechanism by which baseline serum albumin concentration influences
the hepatic synthesis of albumin. In most patients without hypoalbuminemia (Panel C), the
inhibition of hepatic synthesis of albumin prevented the increase in the serum concentration of
albumin to abnormal levels during albumin treatment. This feedback mechanism was also
reflected by the close inverse correlation between the baseline serum albumin concentration and
the mean increase in serum albumin during treatment (Panel D). The lower the baseline levels of
serum albumin, the higher the absolute mean increase in the serum concentration of albumin in
both the LAlbD and HAlbD groups. Panel E. Circulatory dysfunction was extremely instable
during albumin treatment in patients receiving LAlbD, with high peaks of PRA in six patients.
MANUSCRIP
T
ACCEPTED
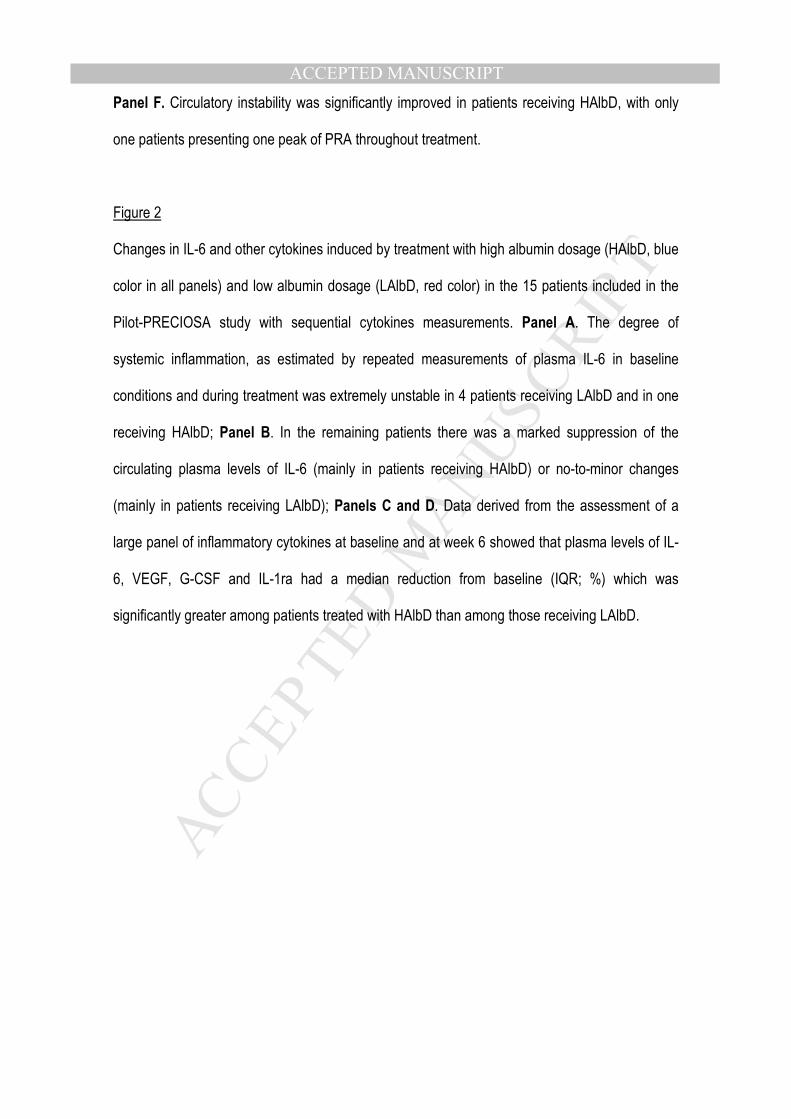
ACCEPTED MANUSCRIPTPanel F. Circulatory instability was significantly improved in patients receiving HAlbD, with only
one patients presenting one peak of PRA throughout treatment.
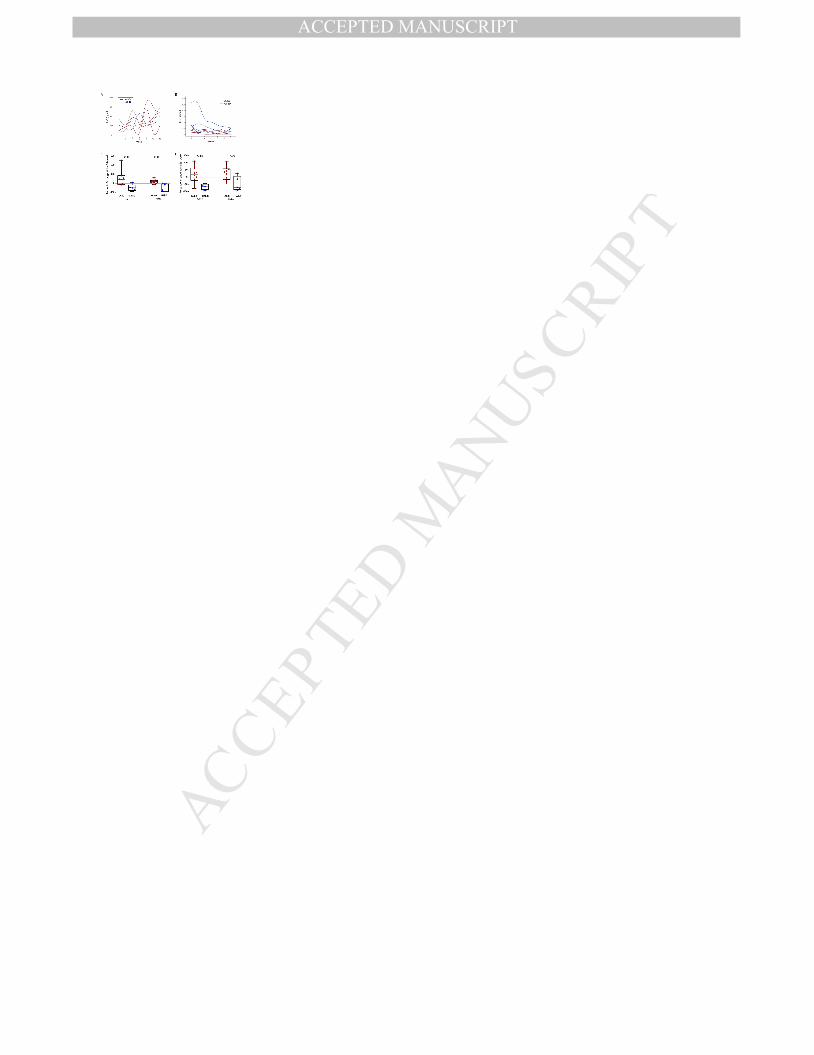
Figure 2
Changes in IL-6 and other cytokines induced by treatment with high albumin dosage (HAlbD, blue
color in all panels) and low albumin dosage (LAlbD, red color) in the 15 patients included in the
Pilot-PRECIOSA study with sequential cytokines measurements. Panel A. The degree of
systemic inflammation, as estimated by repeated measurements of plasma IL-6 in baseline
conditions and during treatment was extremely unstable in 4 patients receiving LAlbD and in one
receiving HAlbD; Panel B. In the remaining patients there was a marked suppression of the
circulating plasma levels of IL-6 (mainly in patients receiving HAlbD) or no-to-minor changes
(mainly in patients receiving LAlbD); Panels C and D. Data derived from the assessment of a
large panel of inflammatory cytokines at baseline and at week 6 showed that plasma levels of IL-
6, VEGF, G-CSF and IL-1ra had a median reduction from baseline (IQR; %) which was
significantly greater among patients treated with HAlbD than among those receiving LAlbD.
MANUSCRIP
T
ACCEPTED
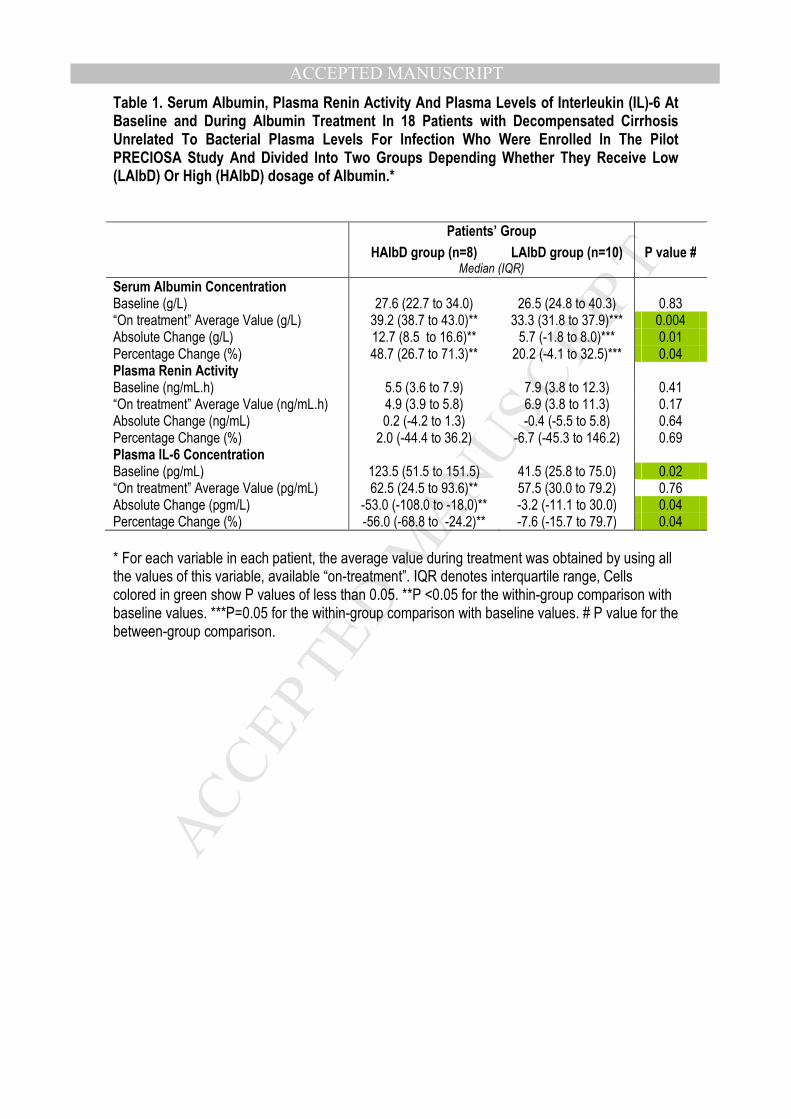
ACCEPTED MANUSCRIPTTable 1. Serum Albumin, Plasma Renin Activity And Plasma Levels of Interleukin (IL)-6 At Baseline and During Albumin Treatment In 18 Patients with Decompensated Cirrhosis Unrelated To Bacterial Plasma Levels For Infection Who Were Enrolled In The Pilot PRECIOSA Study And Divided Into Two Groups Depending Whether They Receive Low (LAlbD) Or High (HAlbD) dosage of Albumin.* Patients’ Group
HAlbD group (n=8) LAlbD group (n=10) P value # Median (IQR)
Serum Albumin Concentration Baseline (g/L) 27.6 (22.7 to 34.0) 26.5 (24.8 to 40.3) 0.83 “On treatment” Average Value (g/L) 39.2 (38.7 to 43.0)** 33.3 (31.8 to 37.9)*** 0.004 Absolute Change (g/L) 12.7 (8.5 to 16.6)** 5.7 (-1.8 to 8.0)*** 0.01 Percentage Change (%) 48.7 (26.7 to 71.3)** 20.2 (-4.1 to 32.5)*** 0.04 Plasma Renin Activity Baseline (ng/mL.h) 5.5 (3.6 to 7.9) 7.9 (3.8 to 12.3) 0.41 “On treatment” Average Value (ng/mL.h) 4.9 (3.9 to 5.8) 6.9 (3.8 to 11.3) 0.17 Absolute Change (ng/mL) 0.2 (-4.2 to 1.3) -0.4 (-5.5 to 5.8) 0.64 Percentage Change (%) 2.0 (-44.4 to 36.2) -6.7 (-45.3 to 146.2) 0.69 Plasma IL-6 Concentration Baseline (pg/mL) 123.5 (51.5 to 151.5) 41.5 (25.8 to 75.0) 0.02 “On treatment” Average Value (pg/mL) 62.5 (24.5 to 93.6)** 57.5 (30.0 to 79.2) 0.76 Absolute Change (pgm/L) -53.0 (-108.0 to -18.0)** -3.2 (-11.1 to 30.0) 0.04 Percentage Change (%) -56.0 (-68.8 to -24.2)** -7.6 (-15.7 to 79.7) 0.04
* For each variable in each patient, the average value during treatment was obtained by using all the values of this variable, available “on-treatment”. IQR denotes interquartile range, Cells colored in green show P values of less than 0.05. **P <0.05 for the within-group comparison with baseline values. ***P=0.05 for the within-group comparison with baseline values. # P value for the between-group comparison.
MANUSCRIP
T
ACCEPTED
ACCEPTED MANUSCRIPT
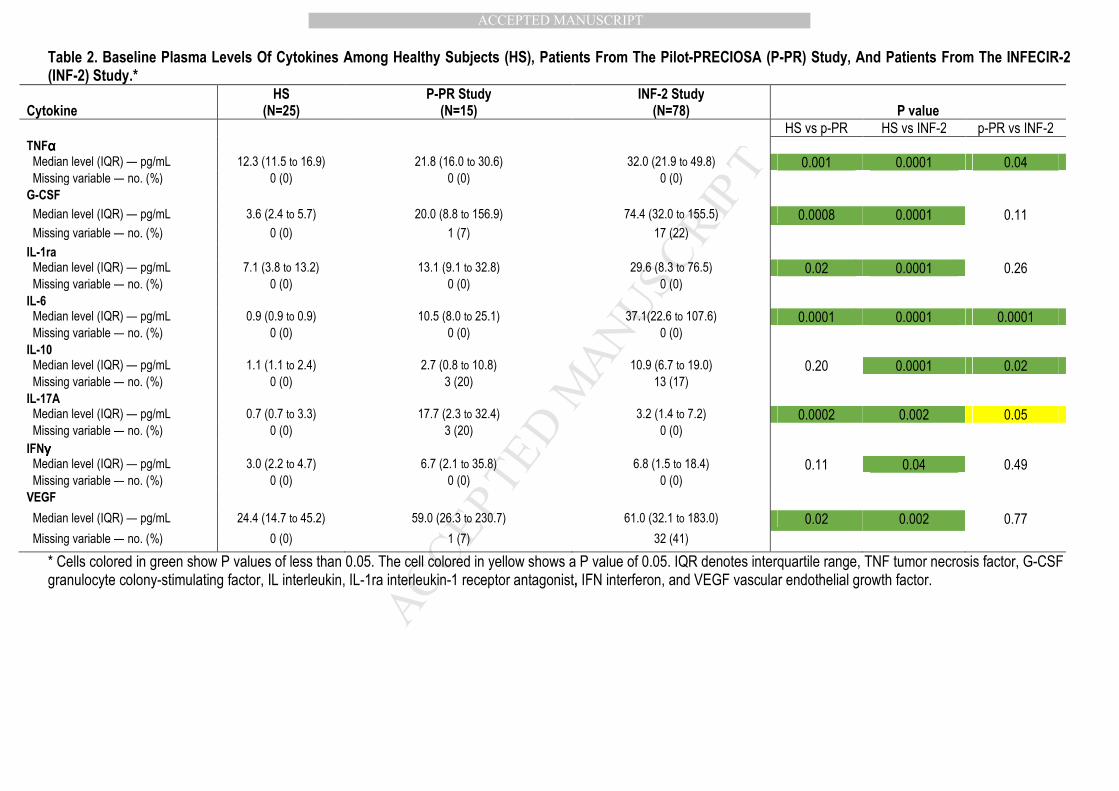
Table 2. Baseline Plasma Levels Of Cytokines Among Healthy Subjects (HS), Patients From The Pilot-PRECIOSA (P-PR) Study, And Patients From The INFECIR-2 (INF-2) Study.*
Cytokine
HS (N=25)
P-PR Study (N=15)
INF-2 Study (N=78)
P value
HS vs p-PR HS vs INF-2 p-PR vs INF-2
TNFαααα
Median level (IQR) — pg/mL 12.3 (11.5 to 16.9) 21.8 (16.0 to 30.6) 32.0 (21.9 to 49.8) 0.001 0.0001 0.04 Missing variable — no. (%) 0 (0) 0 (0) 0 (0) G-CSF
Median level (IQR) — pg/mL 3.6 (2.4 to 5.7) 20.0 (8.8 to 156.9) 74.4 (32.0 to 155.5) 0.0008 0.0001 0.11
Missing variable — no. (%) 0 (0) 1 (7) 17 (22)
IL-1ra Median level (IQR) — pg/mL 7.1 (3.8 to 13.2) 13.1 (9.1 to 32.8) 29.6 (8.3 to 76.5) 0.02 0.0001 0.26 Missing variable — no. (%) 0 (0) 0 (0) 0 (0) IL-6 Median level (IQR) — pg/mL 0.9 (0.9 to 0.9) 10.5 (8.0 to 25.1) 37.1(22.6 to 107.6) 0.0001 0.0001 0.0001 Missing variable — no. (%) 0 (0) 0 (0) 0 (0) IL-10 Median level (IQR) — pg/mL 1.1 (1.1 to 2.4) 2.7 (0.8 to 10.8) 10.9 (6.7 to 19.0) 0.20 0.0001 0.02 Missing variable — no. (%) 0 (0) 3 (20) 13 (17) IL-17A Median level (IQR) — pg/mL 0.7 (0.7 to 3.3) 17.7 (2.3 to 32.4) 3.2 (1.4 to 7.2) 0.0002 0.002 0.05 Missing variable — no. (%) 0 (0) 3 (20) 0 (0) IFNγγγγ
Median level (IQR) — pg/mL 3.0 (2.2 to 4.7) 6.7 (2.1 to 35.8) 6.8 (1.5 to 18.4) 0.11 0.04 0.49 Missing variable — no. (%) 0 (0) 0 (0) 0 (0) VEGF
Median level (IQR) — pg/mL 24.4 (14.7 to 45.2) 59.0 (26.3 to 230.7) 61.0 (32.1 to 183.0) 0.02 0.002 0.77
Missing variable — no. (%) 0 (0) 1 (7) 32 (41)
* Cells colored in green show P values of less than 0.05. The cell colored in yellow shows a P value of 0.05. IQR denotes interquartile range, TNF tumor necrosis factor, G-CSF granulocyte colony-stimulating factor, IL interleukin, IL-1ra interleukin-1 receptor antagonist, IFN interferon, and VEGF vascular endothelial growth factor.
MANUSCRIP
T
ACCEPTED
ACCEPTED MANUSCRIPT
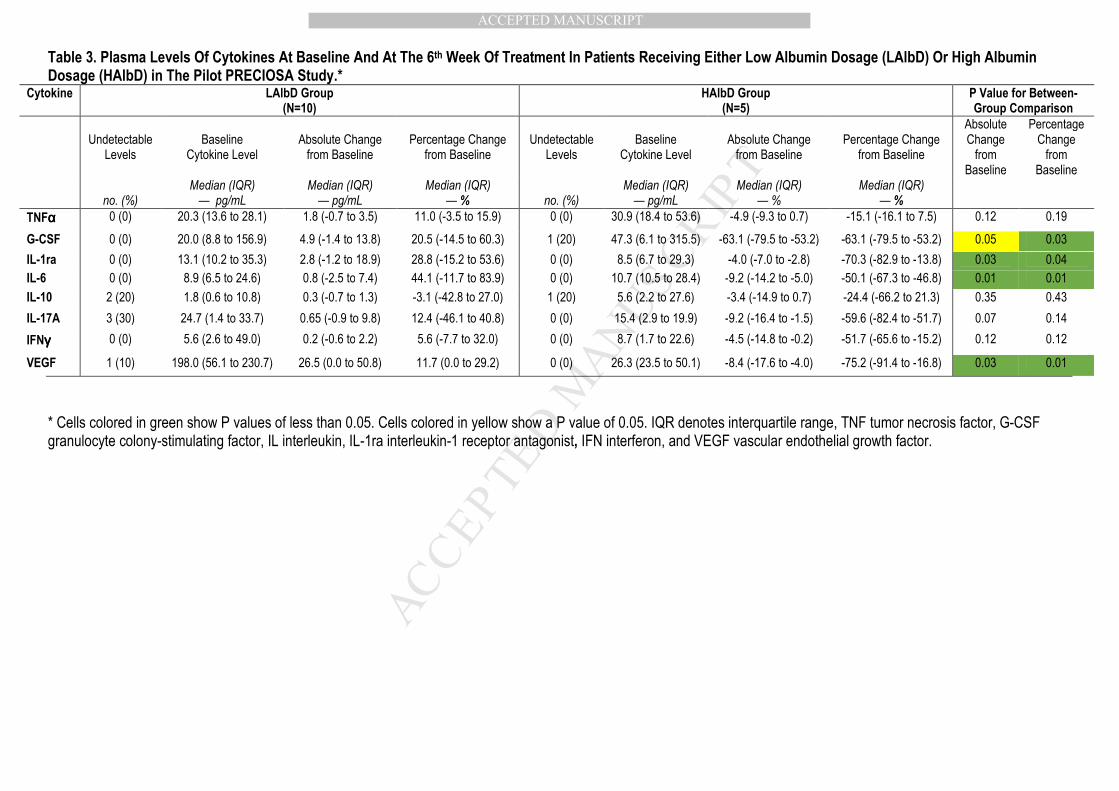
Table 3. Plasma Levels Of Cytokines At Baseline And At The 6th Week Of Treatment In Patients Receiving Either Low Albumin Dosage (LAlbD) Or High Albumin Dosage (HAlbD) in The Pilot PRECIOSA Study.*
Cytokine LAlbD Group (N=10)
HAlbD Group (N=5)
P Value for Between-Group Comparison
Undetectable
Levels
Baseline
Cytokine Level
Absolute Change from Baseline
Percentage Change
from Baseline
Undetectable
Levels
Baseline
Cytokine Level
Absolute Change from Baseline
Percentage Change
from Baseline
Absolute Change from
Baseline
Percentage Change from
Baseline
no. (%) Median (IQR) — pg/mL
Median (IQR) — pg/mL
Median (IQR) — %
no. (%)
Median (IQR) — pg/mL
Median (IQR) — %
Median (IQR) — %
TNFαααα 0 (0) 20.3 (13.6 to 28.1) 1.8 (-0.7 to 3.5) 11.0 (-3.5 to 15.9) 0 (0) 30.9 (18.4 to 53.6) -4.9 (-9.3 to 0.7) -15.1 (-16.1 to 7.5) 0.12 0.19
G-CSF 0 (0) 20.0 (8.8 to 156.9) 4.9 (-1.4 to 13.8) 20.5 (-14.5 to 60.3) 1 (20) 47.3 (6.1 to 315.5) -63.1 (-79.5 to -53.2) -63.1 (-79.5 to -53.2) 0.05 0.03
IL-1ra 0 (0) 13.1 (10.2 to 35.3) 2.8 (-1.2 to 18.9) 28.8 (-15.2 to 53.6) 0 (0) 8.5 (6.7 to 29.3) -4.0 (-7.0 to -2.8) -70.3 (-82.9 to -13.8) 0.03 0.04
IL-6 0 (0) 8.9 (6.5 to 24.6) 0.8 (-2.5 to 7.4) 44.1 (-11.7 to 83.9) 0 (0) 10.7 (10.5 to 28.4) -9.2 (-14.2 to -5.0) -50.1 (-67.3 to -46.8) 0.01 0.01
IL-10 2 (20) 1.8 (0.6 to 10.8) 0.3 (-0.7 to 1.3) -3.1 (-42.8 to 27.0) 1 (20) 5.6 (2.2 to 27.6) -3.4 (-14.9 to 0.7) -24.4 (-66.2 to 21.3) 0.35 0.43
IL-17A 3 (30) 24.7 (1.4 to 33.7) 0.65 (-0.9 to 9.8) 12.4 (-46.1 to 40.8) 0 (0) 15.4 (2.9 to 19.9) -9.2 (-16.4 to -1.5) -59.6 (-82.4 to -51.7) 0.07 0.14
IFNγγγγ 0 (0) 5.6 (2.6 to 49.0) 0.2 (-0.6 to 2.2) 5.6 (-7.7 to 32.0) 0 (0) 8.7 (1.7 to 22.6) -4.5 (-14.8 to -0.2) -51.7 (-65.6 to -15.2) 0.12 0.12
VEGF 1 (10) 198.0 (56.1 to 230.7) 26.5 (0.0 to 50.8) 11.7 (0.0 to 29.2) 0 (0) 26.3 (23.5 to 50.1) -8.4 (-17.6 to -4.0) -75.2 (-91.4 to -16.8) 0.03 0.01
* Cells colored in green show P values of less than 0.05. Cells colored in yellow show a P value of 0.05. IQR denotes interquartile range, TNF tumor necrosis factor, G-CSF granulocyte colony-stimulating factor, IL interleukin, IL-1ra interleukin-1 receptor antagonist, IFN interferon, and VEGF vascular endothelial growth factor.
MANUSCRIP
T
ACCEPTED
ACCEPTED MANUSCRIPTTable 4. Effects of LAlbD and HAlbD Administration On Cardiovascular And Splanchnic Hemodynamics, Cardiac peptides and Standard Liver And Renal Function Parameters
Low Albumin Dose
(n=10)
High Albumin Dose (N=8)
Baseline Week 14 P
value Baseline Week 14
P value
Median (interquartile range) Median (interquartile range) Systemic hemodynamics n=7 n=8 RAP (mm Hg) 6 (4-8) 4 (4-10) 0.87 8 (4-8) 9 (6-9) 0.26
MPAP (mm Hg) 16 (15-17) 15 (12-20) 0.55 15 (11-18) 18 (15-25) 0.02
PCWP (mm Hg) 10 (9-11) 8 (7-13) 0.74 11 (8-15) 12 (10-14) 0.11
Cardiac index (L/min/m2) 3.9 (1.8-4.6) 3.8 (2.3-5.3) 0.09 4.2 (3.0-5.0) 5.3 (3.1-6.8) 0.04
Heart rate (bpm) 61 (59-82) 75(62-86) 0.21 69 (59-91) 68 (62-76) 0.21
Systolic volume (ml) 120 (40-127) 90 (52-135) 0.74 125 (85-145) 165 (110-190) 0.04
LV stroke work index (g.m/m2) 48 (24-64) 44 (27-68) 0.74 54 (49-69) 82 (51-97) 0.04
SVRI (dyn.s/cm5/m2) 1158 (1042-3840) 1182 (944-2762) 0.18 1257 (952-1693) 1072 (728-1183) 0.09
MAP (mm Hg) 78 (63-88) 77 (75-85) 0.61 78 (74-85) 77 (66-84) 0.48
Cardiac peptides n=9 n=6
ANP (fmol/mL) 58 (23-84) 53 (37-64) 0.59 41 (13-87) 65 (29-155) 0.14
BNP (pg/mL) 82 (25-221) 37 (34-126) 0.45 41 (32-69) 49 (18-128) 0.46
Splanchnic hemodynamics n=7 n=6
FHVP (mmHg) 15 (9-17) 12 (5-17) 0.45 11 (8-14) 9 (5-10) 0.12
WHVP (mmHg) 35 (25-38) 30 (26-39) 0.67 32 (29-36) 28 (25-31) 0.21
HVPG (mmHg) 19 (15-20) 21 (14-22) 0.34 19 (17-27) 22 (18-25) 0.89
Liver and renal function n=10 n=8
AST (UI/L) 58 (27-78) 53 (26-69) 0.15 45 (40-112) 34 (31-55) 0.02
ALT (UI/L) 27 (19-46) 25 (16-34) 0.11 35 (28-56) 24 (21-39) 0.13
Serum creatinine (mg/dL) 1.3 (1.0-1.4) 1.0 (0.9-1.3) 0.06 0.9 (0.8-1.3) 0.9 (0.7-1.2) 0.24
BUN (m/dL) 26 (16-47) 22 (16-32) 0.16 20 (15-31) 24 (17-36) 0.25
Serum sodium (mEq/L) 132 (126-136) 133 (129-137) 0.67 130 (129-135) 132 (131-134) 0.87
Serum albumin (g/L) 27 (25-40) 35 (31-40) 0.06 27 (22-35) 40 (35-41) 0.03
Serum bilirubin (mg/dL) 1.8 (1.0-2.1) 1.8 (1.1-2.8) 0.41 3.7 (1.9-13.0) 1.9 (1.6-16.8) 0.40
INR 1.3 (1.1-1.6) 1.5 (1.1-1.7) 0.29 1.4 (1.3-2.3) 1.4 (1.3-2.5) 0.46
Child-Pugh score (points) 8 (6-10) 8 (7-9) 0.37 9 (8-11) 7 (6-8) 0.02
MELD score (points) 14 (11-17) 14 (9-17) 0.59 16 (13-26) 16 (13-27) 0.25
Cells colored in green show P values of less than 0.05. RAP denotes: right atrial pressure; MPAP: mean pulmonary artery pressure; PCWP: pulmonary capillary wedge pressure; LV: left ventricular; SVRI: systemic vascular resistance index; MAP: mean arterial pressure; ANP: atrial natriuretic peptide; BNP: brain natriuretic peptide; FHVP: free hepatic venous pressure; WHVP: wedge hepatic venous pressure; HVPG: hepatic venous pressure gradient; AST: aspartate aminotransferase; ALT: alanine aminotransferase; BUN: blood urea nitrogen; MELD: model for end stage liver disease. Normal values are: right atrial pressure: 2-10 mmHg; mean pulmonary arterial pressure: 10-25 mmHg; pulmonary capillary pressure: 6-14 mmHg; cardiac index: 2.5-4 L/min/m2; SV: 60-100 ml; LV stroke work index: 45-75 g.m/m2/beat; SVRI: 1970-2390 dyn.sec/cm5/m2; MAP: 80-95 mm Hg; Ejection fraction >50%; ANP: 9-24 fmol/mL; BNP: 4-37 pg/mL; HVPG: 1-5 mm Hg; hepatic blood flow: 1200-1500 ml/min
MANUSCRIP
T
ACCEPTED
ACCEPTED MANUSCRIPT
Table 5. Baseline Plasma Levels of Cytokines, And Their Changes During The First Week Of Treatment, In Patients From The INFECIR-2 Study Who Were Randomized To Receive Either Antibiotics Alone Or Albumin plus Antibiootics.*
Cytokine Antibiotics Alone (N=40) Albumin Plus Antibiotics (N=38) P Value for Change From Baseline
Undetectable
Levels
Baseline Level
Absolute change
From Baseline
Percentage Change From Baseline
P Value for Change From Baseline
Undetectable
Levels
Baseline Level
Absolute change from Baseline
Percentage Change from Baseline
no. (%)
Median (IQR) — pg/mL
Median (IQR) — pg/mL
Median (IQR) — %
Absolute
change
Percentage change
no. (%)
Median (IQR) — pg/mL
Median (IQR) — %
Median (IQR) — %
Absolute change
Percentage change
TNFαααα 0 (0) 37.9 (23.3 to 50.0)
-2.8 (-12.6 to 3.2)
-8.2 (-28.9 to 11.9)
0.05 0.01 0 (0) 31.1 (21.2 to 45.3)
-3.4 (-14.7 to 3.1)
-16.2 (-40.5 to 12.8)
0.01 0.04
G-CSF 9 (23) 74.4 (19.2 to 185.5)
-3.4 (-55.3 to 11.5)
-21.2 (-91.4 to 21.5)
0.33 0.85 8 (21) 73.5 (33.6 to 115.0)
-41.5 (-65.1 to 8.4)
-58.6 (-88.8 to 30.2)
0.01 0.01
IL-1ra 0 (0) 29.6 (8.3 to 71.5)
-0.6 (-28.0 to 9.0)
-5.9 (-51.5 to 23.6)
0.37 0.31 0 29.9 (8.3 to 76.5)
-0.5 (-34 to 2.1)
-3.5 (-73.0 to 8.3)
0.05 0.28
IL-6 0 (0) 37.7 (18.3 to 94.7)
-7.0 (-19.9 to 20.7)
-14.8 (-43.5 to 66.4)
0.53 0.27 0 (0) 36.9 (23.9 to 158.9)
-7.7 (-33.1 to 0.3)
-23.0 (-55.0 to 3.8)
0.003 0.005
IL-10 8 (20) 10.7 (6.3 to 20.9)
-0.2 (-6.7 to 4.4)
-1.8 (-56.7 to 50.1)
0.74 1.00 5 (13) 11.0 (6.7 to 15.1)
-1.5 (-7.6 to 2.8)
-15.6 (-53.5 to 63.0)
0.03 0.03
IL-17A 0 (0) 3.7 (1.2 to 8.2)
0.1 (-1.7 to 1.3)
2.5 (-38.6 to 81.1)
0.92 1.00 0 (0) 2.7 (1.6 to 7.2)
-0.5 (-2.7 to 0.4)
-15.4 (-52.4 to 29.9)
0.05 0.09
IFNγγγγ 0 (0) 4.8 (1.2 to 15.6)
-0.2 (-6.2 to 1.3)
-7.9 (-51.7 to 37.1)
0.17 0.52 0 (0) 8.4 (2.0 to 19.7)
-0.5 (-8.6 to 4.3)
-24.8 (-63.3 to 52.9)
0.48 0.24
VEGF 16 (40) 65.4 (45.6 to 204.0)
-18.5 (-41.4 to 18.2)
-16.4 (-45.3 to 29.4)
0.30 0.31 16 (42) 50.6 (24.1 to 183.0)
-13.9 (-49.0 to 11.9)
-24.7 (-36.9 to 32.5)
0.10 0.29
* Changes during the first week of albumin treatment were assessed between day 3 and day 7 after inclusion. There were no significant between-group differences in cytokine levels at baseline. Cells colored in green show P values of less than 0.05. Cells colored in yellow show a P value of 0.05. IQR denotes interquartile range, TNF tumor necrosis factor, G-CSF granulocyte colony-stimulating factor, IL interleukin, IL-1ra interleukin-1 receptor antagonist, IFN interferon, and VEGF vascular endothelial growth factor.
MANUSCRIP
T
ACCEPTED
ACCEPTED MANUSCRIPT
MANUSCRIP
T
ACCEPTED
ACCEPTED MANUSCRIPT
MANUSCRIP
T
ACCEPTED
ACCEPTED MANUSCRIPTSUPPLEMENTARY APPENDIX
This appendix has been provided by the authors to give readers additional information about their
work.
Supplement to: Fernández J, Clària J, Amorós A, et al. Albumin Treatment in Decompensated
Cirrhosis: Effects On Systemic And Portal Hemodynamics And On Systemic Inflammation
MANUSCRIP
T
ACCEPTED
ACCEPTED MANUSCRIPTSupplementary Appendix
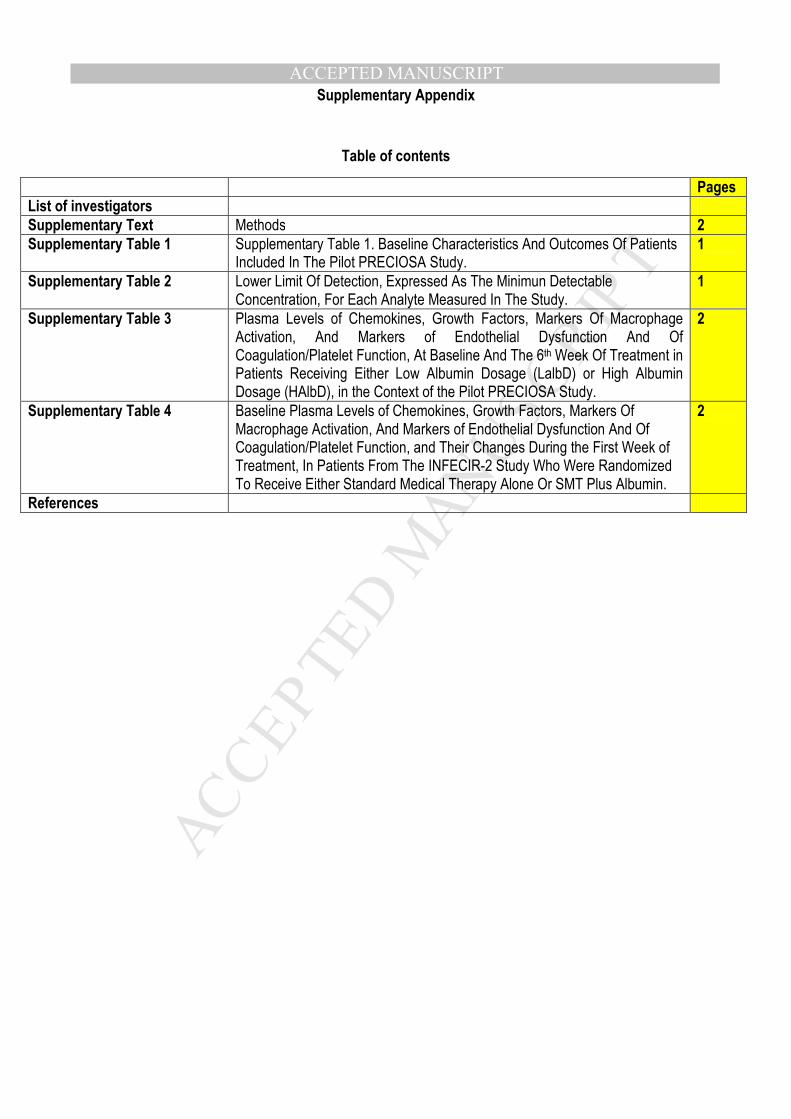
Table of contents
Pages
List of investigators
Supplementary Text Methods 2
Supplementary Table 1 Supplementary Table 1. Baseline Characteristics And Outcomes Of Patients Included In The Pilot PRECIOSA Study.
1
Supplementary Table 2 Lower Limit Of Detection, Expressed As The Minimun Detectable Concentration, For Each Analyte Measured In The Study.
1
Supplementary Table 3 Plasma Levels of Chemokines, Growth Factors, Markers Of Macrophage Activation, And Markers of Endothelial Dysfunction And Of Coagulation/Platelet Function, At Baseline And The 6th Week Of Treatment in Patients Receiving Either Low Albumin Dosage (LalbD) or High Albumin Dosage (HAlbD), in the Context of the Pilot PRECIOSA Study.
2
Supplementary Table 4 Baseline Plasma Levels of Chemokines, Growth Factors, Markers Of Macrophage Activation, And Markers of Endothelial Dysfunction And Of Coagulation/Platelet Function, and Their Changes During the First Week of Treatment, In Patients From The INFECIR-2 Study Who Were Randomized To Receive Either Standard Medical Therapy Alone Or SMT Plus Albumin.
2
References
MANUSCRIP
T
ACCEPTED
ACCEPTED MANUSCRIPT
Supplementary Methods
Inclusion and Exclusion Criteria In The Pilot PRECIOSA Study
Inclusion criteria: age between 18 and 80 years, presence of ascites, renal dysfunction [serum
creatinine≥ 1.2 mg/dl, blood urea nitrogen (BUN)≥ 25 mg/dl or dilutional hyponatremia (serum
sodium ≤ 130 mEq/l)] and need for diuretic treatment to prevent ascites recurrence (at least 200
mg of spironolactone or 100 mg of spironolactone and 40 mg of furosemide).
Exclusion criteria: hepatorenal syndrome, refractory ascites (> 1 paracentesis/month), neoplastic
disease including hepatocellular carcinoma over the Milan criteria, prior insertion of a transjugular
intrahepatic portosystemic shunt, bacterial infections or GI bleeding within the previous 15 days,
moderate to severe chronic heart (NYHA class II or IV) or pulmonary disease (GOLD III or IV),
previous transplantation, active drug consumption, organic nephropathy, HIV infection, pregnancy
and mental state that prevents the patient understand the nature, extent and consequences of the
study, except for hepatic encephalopathy.
Inclusion and Exclusion Criteria In The INFECIR-2 Study
Inclusion criteria: age ≥18 years; diagnosis of liver cirrhosis established by histology or by the
combination of clinical, analytical and ultrasonographic data; diagnosis of urinary infection,
pneumonia, spontaneous or secondary bacteremia, skin and soft tissue infection, acute
cholangitis or suspected bacterial infection; analytical data of renal and/or liver dysfunction
[serum creatinine ≥ 1.2 mg/dl, serum sodium ≤ 130 mEq/l, serum bilirubin ≥4 mg/dl; patients with
pneumonia or bacteremia required the presence of 1 or more of these criteria for inclusion, 2 or
more were required in the rest]. Additionally, patients with urinary or suspected infections required
the presence of at least 1 diagnostic criterion of systemic inflammatory response syndrome
(SIRS) and serum CRP levels ≥1 mg/dl to be included.
MANUSCRIP
T
ACCEPTED
ACCEPTED MANUSCRIPTExclusion criteria: > 72h after infection diagnosis; acute or sub-acute liver failure; septic shock;
endocarditis; fungal infection; severe acute respiratory distress syndrome (PaO2/Fi02 ≤100),
active or recent variceal bleeding (unless controlled for > 48h); type-1 HRS (IAC criteria); ACLF
grade-3 (3 or more organ failures defined according to the Canonic Study criteria); renal
replacement therapy; malignancy (except for hepatocellular carcinoma within Milan criteria or
non-melanocytic skin cancer); moderate or severe chronic heart failure (NYHA class II, III or IV);
severe chronic pulmonary disease (GOLD IV); previous liver transplantation; severe psychiatric
disorders that prevent the patient from giving informed consent and from making autonomous
decisions; HIV infection (except for patients under antiretroviral therapy with undetectable viral
load, CD4 levels > 200/mm3 and no previous history of opportunistic infections diagnostic of
AIDS); contraindications to albumin (allergy, signs of pulmonary edema); albumin administration
(≥ 80 g) in the last 2 days; spontaneous bacterial peritonitis co-infection; administration of any
investigational drug within 90 days prior to randomization; pre-menopausal women not practicing
an acceptable method of birth control; refusal to participate; patients who could not provide prior
informed consent and when there was documented evidence that the patient had no legal
surrogate decision maker and it appeared unlikely that the patient would regain consciousness or
sufficient ability to provide delayed informed consent; physician and team not committed to
intensive care if needed.
Laboratory methods
PRA was measured using radioimmunoassay (GammaCoat Plasma Renin Activity, DiaSorin,
Saluggia, Italy, normal values: 0.3-2.5 ng/mL.h); PRC was measured using a chemiluminescent
immunoassay Liaison Direct Renin on the LIAISON Analyzer (DiaSorin) (normal values 2.8-39.9
microUI/ml); ANP was measured by radioimmunoassay (Euro-Diagnostica, Arnhem, The
Netherlands); BNP was determined by chemiluminiscence immunoassay run in an Advia Centaur
XP (Siemens Health Care, Tarrytown, NY) (normal values: 9-24 f mol/l and 4-37 pmol/ml). The
plasma concentration of IL-6 was measured by ELISA (Diasource, Louvain-la-Neuve, Belgium)
MANUSCRIP
T
ACCEPTED
ACCEPTED MANUSCRIPT(normal values <5 pg/mL). Serum albumin measurement was performed using standard routine
methods. Plasma levels of a panel of 24 inflammatory cytokines, 10 chemokines, 4 growth
factors, 2 markers of endothelial dysfunction and 2 markers of coagulation/platelet function were
performed using two multiplex immunoassays based on Luminex multi-analyte profiling
technology (Human Cytokine/Chemokine Magnetic bead panel Premixed 38 Plex Kit and Human
Sepsis Magnetic bead panel 1, Merk Millipore, Billerica, MA). Among the 24 cytokines measured,
11 were not detectable in any patient/healthy subject and were not included in this analysis.
Signals were read in a Luminex 100 Bioanalyzer (Luminex Corp., Austin, TX). A five-parameter
logistic regression model was used to create standard curves and to calculate the concentration
of each sample with the standard version of the Milliplex Analyst software (Merck Millipore). The
lower limit of detection of each analyte is indicated in supplementary table 2. Normal values given
in table 2 were obtained from 24 healthy volunteers aged 18-65 years. The plasma levels of 2
soluble markers of macrophage activation (sCD163 and sMR/sCD206) were determined by
enzyme-linked immunosorbent assays (Antibodies on line, Aachen, Germany).
MANUSCRIP
T
ACCEPTED
ACCEPTED MANUSCRIPTSupplementary Table 1. Baseline Characteristics And Outcomes Of Patients Included In The Pilot PRECIOSA Study.*
Patients (N=18)
Baseline data
Age (years) 56 (50-64)
Male sex, n (%) 13 (72)
Alcoholic cirrhosis, n (%) 12 (67)
Previous variceal bleeding, n (%) 5 (28)
ß-blockers, n (%) 7 (39)
Previous SBP, n (%) 5 (28)
Long-term norfloxacin prophylaxis, n (%) 8 (44)
Previous hepatic encephalopathy, n (%) 7 (39)
Diabetes mellitus, n (%) 3 (17)
HCC, n (%) 1 (6)
Mild hepatic encephalopathy, n (%) 2 (11)
Ascites, n (%) 18 (100)
Blood leukocyte count, x109/L 4.2 (3.3-7.3)
Hematocrit, % 30 (27-34)
Platelet count, x109/L 88 (60-169)
Serum bilirubin, mg/dL 2.0 (1.4-4.0)
Serum albumin, g/L 27 (25-36)
INR 1.4 (1.2-1.8)
Serum creatinine, mg/dL 1.2 (0.8-1.4)
BUN, mg/dL 23 (15-35)
Serum sodium, mEq/L 132 (128-135)
Serum C-reactive protein, mg/dL 0.7 (0.3-1.1)
Child-Pugh score, points 9 (7-10)
MELD score, points 16 (13-17)
Main complications during 3-month follow-up
Variceal bleeding, n (%) 2 (11)
Other gastrointestinal bleeding, n (%) 2 (11)
Non-SBP infections, n (%) 4 (22)
*The pilot PRECIOSA study was an open-label, multicenter, nonrandomized (single-group), prospective, phase 4 investigation of albumin treatment in patients with decompensated cirrhosis without bacterial infection. Continuous variables are expressed as median (interquartile range). SBP
denotes spontaneous bacterial peritonitis, HCC hepatocellular carcinoma, INR international normalized ratio, BUN blood urea nitrogen, and MELD Model for End-Stage Liver Disease.
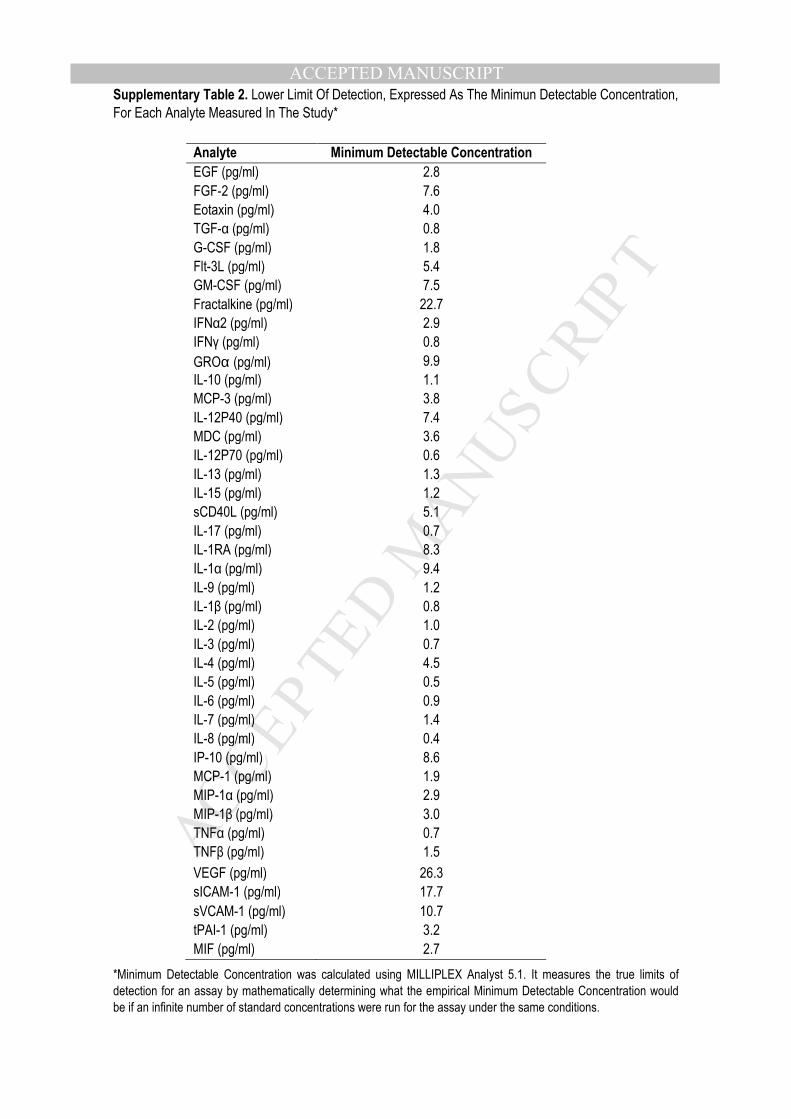
MANUSCRIP
T
ACCEPTED
ACCEPTED MANUSCRIPTSupplementary Table 2. Lower Limit Of Detection, Expressed As The Minimun Detectable Concentration,
For Each Analyte Measured In The Study*
*Minimum Detectable Concentration was calculated using MILLIPLEX Analyst 5.1. It measures the true limits of
detection for an assay by mathematically determining what the empirical Minimum Detectable Concentration would
be if an infinite number of standard concentrations were run for the assay under the same conditions.
Analyte Minimum Detectable Concentration
EGF (pg/ml) 2.8
FGF-2 (pg/ml) 7.6
Eotaxin (pg/ml) 4.0
TGF-α (pg/ml) 0.8
G-CSF (pg/ml) 1.8
Flt-3L (pg/ml) 5.4
GM-CSF (pg/ml) 7.5
Fractalkine (pg/ml) 22.7
IFNα2 (pg/ml) 2.9
IFNγ (pg/ml) 0.8
GROα (pg/ml) 9.9
IL-10 (pg/ml) 1.1
MCP-3 (pg/ml) 3.8
IL-12P40 (pg/ml) 7.4
MDC (pg/ml) 3.6
IL-12P70 (pg/ml) 0.6
IL-13 (pg/ml) 1.3
IL-15 (pg/ml) 1.2
sCD40L (pg/ml) 5.1
IL-17 (pg/ml) 0.7
IL-1RA (pg/ml) 8.3
IL-1α (pg/ml) 9.4
IL-9 (pg/ml) 1.2
IL-1β (pg/ml) 0.8
IL-2 (pg/ml) 1.0
IL-3 (pg/ml) 0.7
IL-4 (pg/ml) 4.5
IL-5 (pg/ml) 0.5
IL-6 (pg/ml) 0.9
IL-7 (pg/ml) 1.4
IL-8 (pg/ml) 0.4
IP-10 (pg/ml) 8.6
MCP-1 (pg/ml) 1.9
MIP-1α (pg/ml) 2.9
MIP-1β (pg/ml) 3.0
TNFα (pg/ml) 0.7
TNFβ (pg/ml) 1.5
VEGF (pg/ml) 26.3
sICAM-1 (pg/ml) 17.7
sVCAM-1 (pg/ml) 10.7
tPAI-1 (pg/ml) 3.2
MIF (pg/ml) 2.7
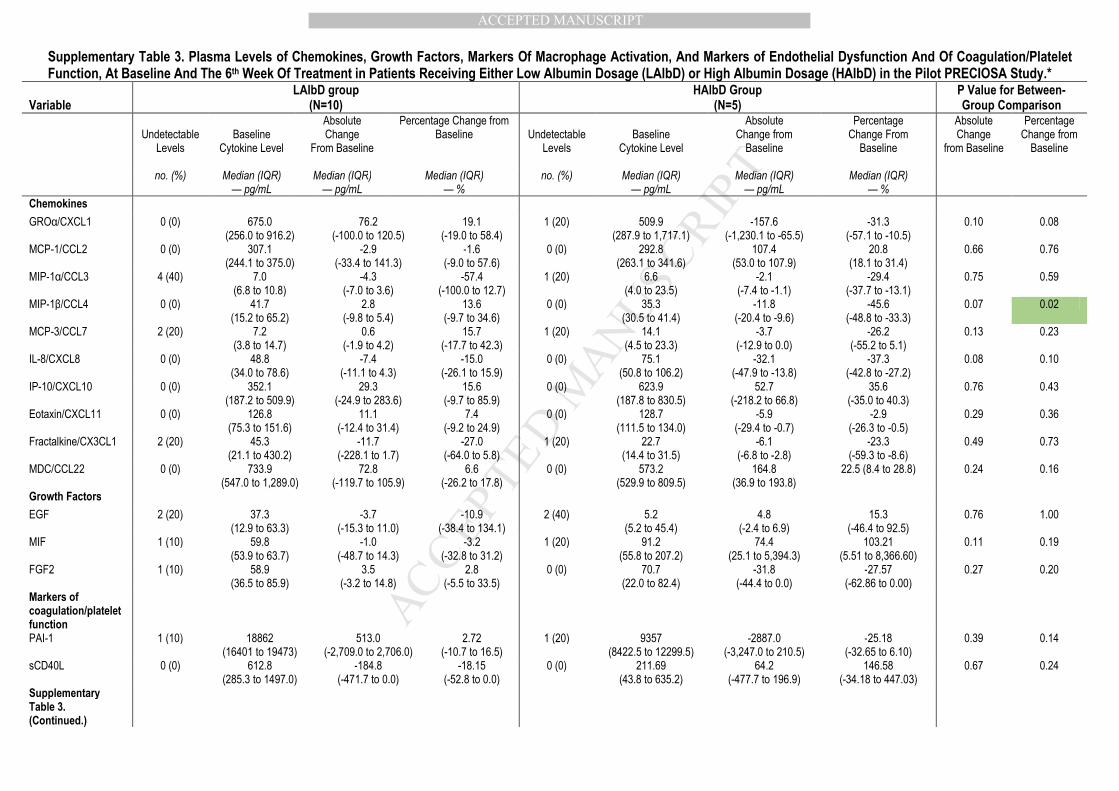
MANUSCRIP
T
ACCEPTED
ACCEPTED MANUSCRIPT
Supplementary Table 3. Plasma Levels of Chemokines, Growth Factors, Markers Of Macrophage Activation, And Markers of Endothelial Dysfunction And Of Coagulation/Platelet Function, At Baseline And The 6th Week Of Treatment in Patients Receiving Either Low Albumin Dosage (LAlbD) or High Albumin Dosage (HAlbD) in the Pilot PRECIOSA Study.*
Variable
LAlbD group (N=10)
HAlbD Group (N=5)
P Value for Between-Group Comparison
Undetectable
Levels
Baseline
Cytokine Level
Absolute Change
From Baseline
Percentage Change from Baseline
Undetectable
Levels
Baseline
Cytokine Level
Absolute Change from
Baseline
Percentage Change From
Baseline
Absolute Change
from Baseline
Percentage Change from
Baseline
no. (%) Median (IQR) — pg/mL
Median (IQR) — pg/mL
Median (IQR) — %
no. (%) Median (IQR) — pg/mL
Median (IQR) — pg/mL
Median (IQR) — %
Chemokines
GROα/CXCL1 0 (0) 675.0 (256.0 to 916.2)
76.2 (-100.0 to 120.5)
19.1 (-19.0 to 58.4)
1 (20) 509.9 (287.9 to 1,717.1)
-157.6 (-1,230.1 to -65.5)
-31.3 (-57.1 to -10.5)
0.10 0.08
MCP-1/CCL2 0 (0) 307.1 (244.1 to 375.0)
-2.9 (-33.4 to 141.3)
-1.6 (-9.0 to 57.6)
0 (0) 292.8 (263.1 to 341.6)
107.4 (53.0 to 107.9)
20.8 (18.1 to 31.4)
0.66 0.76
MIP-1α/CCL3 4 (40) 7.0 (6.8 to 10.8)
-4.3 (-7.0 to 3.6)
-57.4 (-100.0 to 12.7)
1 (20) 6.6 (4.0 to 23.5)
-2.1 (-7.4 to -1.1)
-29.4 (-37.7 to -13.1)
0.75 0.59
MIP-1β/CCL4 0 (0) 41.7 (15.2 to 65.2)
2.8 (-9.8 to 5.4)
13.6 (-9.7 to 34.6)
0 (0) 35.3 (30.5 to 41.4)
-11.8 (-20.4 to -9.6)
-45.6 (-48.8 to -33.3)
0.07 0.02
MCP-3/CCL7 2 (20) 7.2 (3.8 to 14.7)
0.6 (-1.9 to 4.2)
15.7 (-17.7 to 42.3)
1 (20) 14.1 (4.5 to 23.3)
-3.7 (-12.9 to 0.0)
-26.2 (-55.2 to 5.1)
0.13 0.23
IL-8/CXCL8 0 (0) 48.8 (34.0 to 78.6)
-7.4 (-11.1 to 4.3)
-15.0 (-26.1 to 15.9)
0 (0) 75.1 (50.8 to 106.2)
-32.1 (-47.9 to -13.8)
-37.3 (-42.8 to -27.2)
0.08 0.10
IP-10/CXCL10 0 (0) 352.1 (187.2 to 509.9)
29.3 (-24.9 to 283.6)
15.6 (-9.7 to 85.9)
0 (0) 623.9 (187.8 to 830.5)
52.7 (-218.2 to 66.8)
35.6 (-35.0 to 40.3)
0.76 0.43
Eotaxin/CXCL11 0 (0) 126.8 (75.3 to 151.6)
11.1 (-12.4 to 31.4)
7.4 (-9.2 to 24.9)
0 (0) 128.7 (111.5 to 134.0)
-5.9 (-29.4 to -0.7)
-2.9 (-26.3 to -0.5)
0.29 0.36
Fractalkine/CX3CL1 2 (20) 45.3 (21.1 to 430.2)
-11.7 (-228.1 to 1.7)
-27.0 (-64.0 to 5.8)
1 (20) 22.7 (14.4 to 31.5)
-6.1 (-6.8 to -2.8)
-23.3 (-59.3 to -8.6)
0.49 0.73
MDC/CCL22 0 (0) 733.9 (547.0 to 1,289.0)
72.8 (-119.7 to 105.9)
6.6 (-26.2 to 17.8)
0 (0) 573.2 (529.9 to 809.5)
164.8 (36.9 to 193.8)
22.5 (8.4 to 28.8) 0.24 0.16
Growth Factors
EGF 2 (20) 37.3 (12.9 to 63.3)
-3.7 (-15.3 to 11.0)
-10.9 (-38.4 to 134.1)
2 (40) 5.2 (5.2 to 45.4)
4.8 (-2.4 to 6.9)
15.3 (-46.4 to 92.5)
0.76 1.00
MIF 1 (10) 59.8 (53.9 to 63.7)
-1.0 (-48.7 to 14.3)
-3.2 (-32.8 to 31.2)
1 (20) 91.2 (55.8 to 207.2)
74.4 (25.1 to 5,394.3)
103.21 (5.51 to 8,366.60)
0.11 0.19
FGF2 1 (10) 58.9 (36.5 to 85.9)
3.5 (-3.2 to 14.8)
2.8 (-5.5 to 33.5)
0 (0) 70.7 (22.0 to 82.4)
-31.8 (-44.4 to 0.0)
-27.57 (-62.86 to 0.00)
0.27 0.20
Markers of coagulation/platelet function
PAI-1 1 (10) 18862 (16401 to 19473)
513.0 (-2,709.0 to 2,706.0)
2.72 (-10.7 to 16.5)
1 (20) 9357 (8422.5 to 12299.5)
-2887.0 (-3,247.0 to 210.5)
-25.18 (-32.65 to 6.10)
0.39 0.14
sCD40L 0 (0) 612.8 (285.3 to 1497.0)
-184.8 (-471.7 to 0.0)
-18.15 (-52.8 to 0.0)
0 (0) 211.69 (43.8 to 635.2)
64.2 (-477.7 to 196.9)
146.58 (-34.18 to 447.03)
0.67 0.24
Supplementary Table 3. (Continued.)
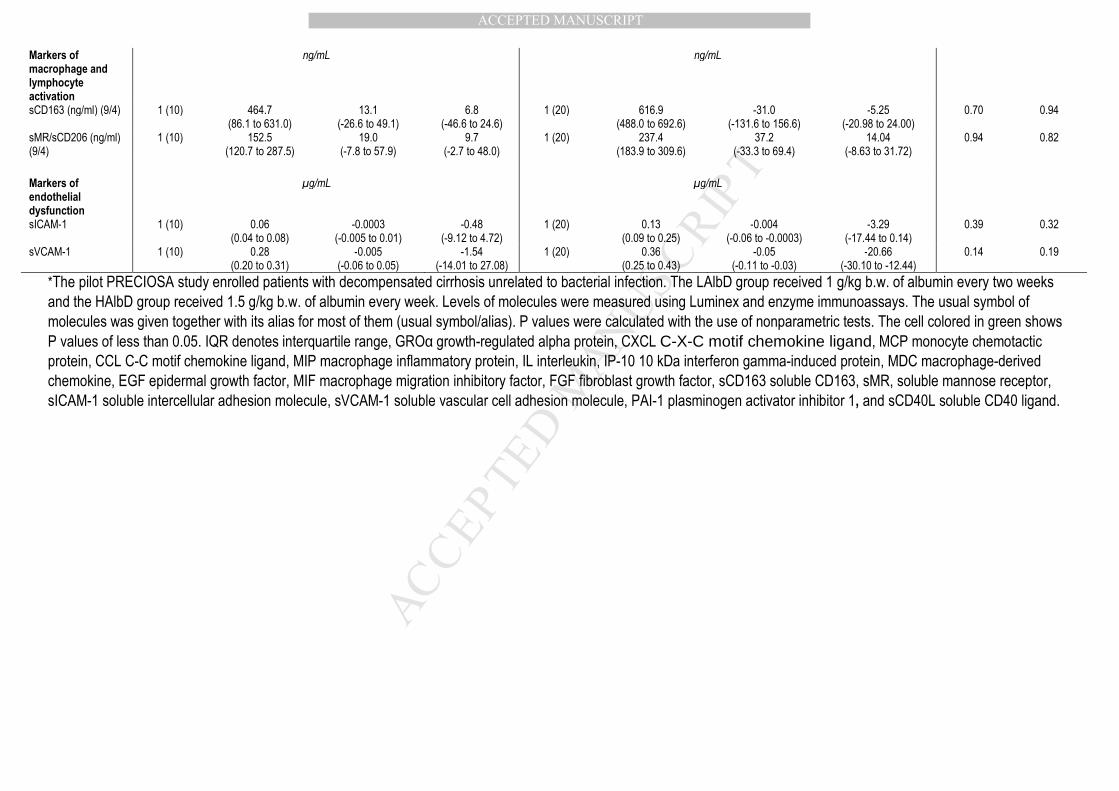
MANUSCRIP
T
ACCEPTED
ACCEPTED MANUSCRIPT
Markers of macrophage and lymphocyte activation
ng/mL ng/mL
sCD163 (ng/ml) (9/4) 1 (10) 464.7 (86.1 to 631.0)
13.1 (-26.6 to 49.1)
6.8 (-46.6 to 24.6)
1 (20) 616.9 (488.0 to 692.6)
-31.0 (-131.6 to 156.6)
-5.25 (-20.98 to 24.00)
0.70 0.94
sMR/sCD206 (ng/ml) (9/4)
1 (10) 152.5 (120.7 to 287.5)
19.0 (-7.8 to 57.9)
9.7 (-2.7 to 48.0)
1 (20) 237.4 (183.9 to 309.6)
37.2 (-33.3 to 69.4)
14.04 (-8.63 to 31.72)
0.94 0.82
Markers of endothelial dysfunction
µg/mL µg/mL
sICAM-1 1 (10) 0.06 (0.04 to 0.08)
-0.0003 (-0.005 to 0.01)
-0.48 (-9.12 to 4.72)
1 (20) 0.13 (0.09 to 0.25)
-0.004 (-0.06 to -0.0003)
-3.29 (-17.44 to 0.14)
0.39 0.32
sVCAM-1 1 (10) 0.28 (0.20 to 0.31)
-0.005 (-0.06 to 0.05)
-1.54 (-14.01 to 27.08)
1 (20) 0.36 (0.25 to 0.43)
-0.05 (-0.11 to -0.03)
-20.66 (-30.10 to -12.44)
0.14 0.19
*The pilot PRECIOSA study enrolled patients with decompensated cirrhosis unrelated to bacterial infection. The LAlbD group received 1 g/kg b.w. of albumin every two weeks
and the HAlbD group received 1.5 g/kg b.w. of albumin every week. Levels of molecules were measured using Luminex and enzyme immunoassays. The usual symbol of
molecules was given together with its alias for most of them (usual symbol/alias). P values were calculated with the use of nonparametric tests. The cell colored in green shows
P values of less than 0.05. IQR denotes interquartile range, GROα growth-regulated alpha protein, CXCL C-X-C motif chemokine ligand, MCP monocyte chemotactic
protein, CCL C-C motif chemokine ligand, MIP macrophage inflammatory protein, IL interleukin, IP-10 10 kDa interferon gamma-induced protein, MDC macrophage-derived
chemokine, EGF epidermal growth factor, MIF macrophage migration inhibitory factor, FGF fibroblast growth factor, sCD163 soluble CD163, sMR, soluble mannose receptor,
sICAM-1 soluble intercellular adhesion molecule, sVCAM-1 soluble vascular cell adhesion molecule, PAI-1 plasminogen activator inhibitor 1, and sCD40L soluble CD40 ligand.
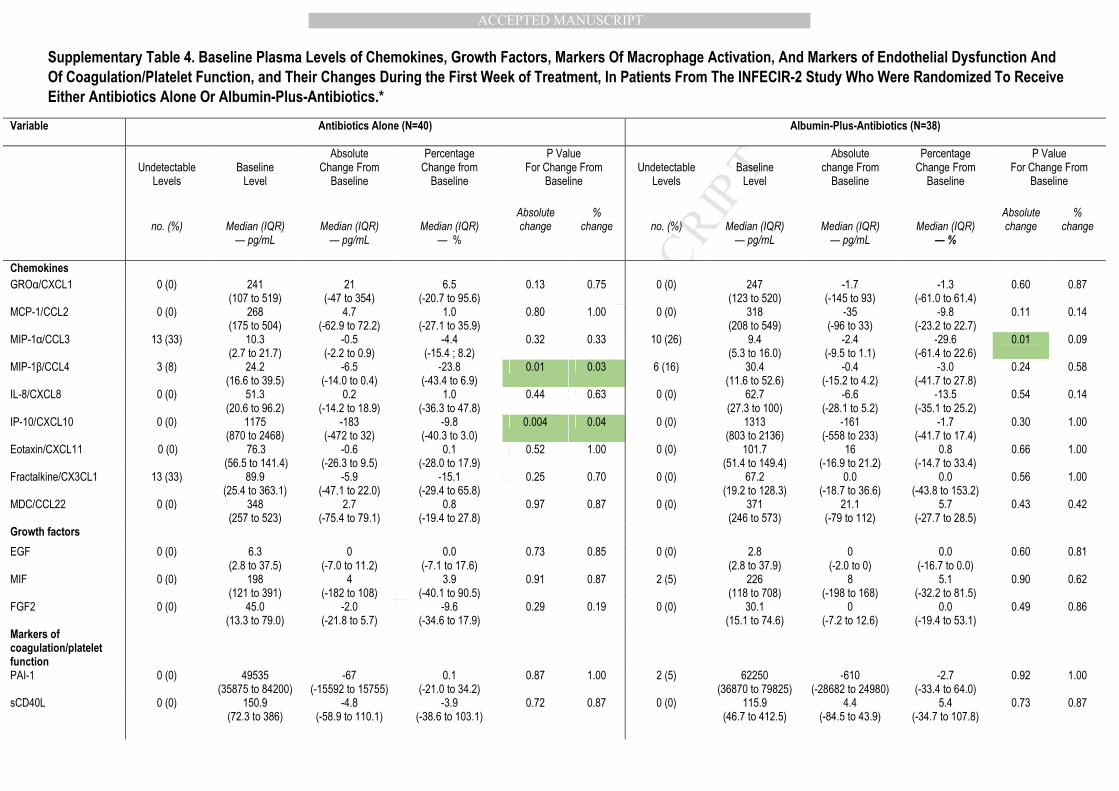
MANUSCRIP
T
ACCEPTED
ACCEPTED MANUSCRIPT
Supplementary Table 4. Baseline Plasma Levels of Chemokines, Growth Factors, Markers Of Macrophage Activation, And Markers of Endothelial Dysfunction And
Of Coagulation/Platelet Function, and Their Changes During the First Week of Treatment, In Patients From The INFECIR-2 Study Who Were Randomized To Receive
Either Antibiotics Alone Or Albumin-Plus-Antibiotics.*
Variable Antibiotics Alone (N=40) Albumin-Plus-Antibiotics (N=38)
Undetectable
Levels
Baseline
Level
Absolute Change From
Baseline
Percentage Change from
Baseline
P Value For Change From
Baseline
Undetectable
Levels
Baseline
Level
Absolute change From
Baseline
Percentage Change From
Baseline
P Value For Change From
Baseline
no. (%)
Median (IQR)
— pg/mL
Median (IQR)
— pg/mL
Median (IQR)
— %
Absolute change
% change
no. (%)
Median (IQR)
— pg/mL
Median (IQR)
— pg/mL
Median (IQR)
— %
Absolute change
% change
Chemokines
GROα/CXCL1 0 (0) 241 (107 to 519)
21 (-47 to 354)
6.5 (-20.7 to 95.6)
0.13 0.75 0 (0) 247 (123 to 520)
-1.7 (-145 to 93)
-1.3 (-61.0 to 61.4)
0.60 0.87
MCP-1/CCL2 0 (0) 268 (175 to 504)
4.7 (-62.9 to 72.2)
1.0 (-27.1 to 35.9)
0.80 1.00 0 (0) 318 (208 to 549)
-35 (-96 to 33)
-9.8 (-23.2 to 22.7)
0.11 0.14
MIP-1α/CCL3 13 (33) 10.3 (2.7 to 21.7)
-0.5 (-2.2 to 0.9)
-4.4 (-15.4 ; 8.2)
0.32 0.33 10 (26) 9.4 (5.3 to 16.0)
-2.4 (-9.5 to 1.1)
-29.6 (-61.4 to 22.6)
0.01 0.09
MIP-1β/CCL4 3 (8) 24.2 (16.6 to 39.5)
-6.5 (-14.0 to 0.4)
-23.8 (-43.4 to 6.9)
0.01 0.03 6 (16) 30.4 (11.6 to 52.6)
-0.4 (-15.2 to 4.2)
-3.0 (-41.7 to 27.8)
0.24 0.58
IL-8/CXCL8 0 (0) 51.3 (20.6 to 96.2)
0.2 (-14.2 to 18.9)
1.0 (-36.3 to 47.8)
0.44 0.63 0 (0) 62.7 (27.3 to 100)
-6.6 (-28.1 to 5.2)
-13.5 (-35.1 to 25.2)
0.54 0.14
IP-10/CXCL10 0 (0) 1175 (870 to 2468)
-183 (-472 to 32)
-9.8 (-40.3 to 3.0)
0.004 0.04 0 (0) 1313 (803 to 2136)
-161 (-558 to 233)
-1.7 (-41.7 to 17.4)
0.30 1.00
Eotaxin/CXCL11 0 (0) 76.3 (56.5 to 141.4)
-0.6 (-26.3 to 9.5)
0.1 (-28.0 to 17.9)
0.52 1.00 0 (0) 101.7 (51.4 to 149.4)
16 (-16.9 to 21.2)
0.8 (-14.7 to 33.4)
0.66 1.00
Fractalkine/CX3CL1 13 (33) 89.9 (25.4 to 363.1)
-5.9 (-47.1 to 22.0)
-15.1 (-29.4 to 65.8)
0.25 0.70 0 (0) 67.2 (19.2 to 128.3)
0.0 (-18.7 to 36.6)
0.0 (-43.8 to 153.2)
0.56 1.00
MDC/CCL22 0 (0) 348 (257 to 523)
2.7 (-75.4 to 79.1)
0.8 (-19.4 to 27.8)
0.97 0.87 0 (0) 371 (246 to 573)
21.1 (-79 to 112)
5.7 (-27.7 to 28.5)
0.43 0.42
Growth factors
EGF 0 (0) 6.3 (2.8 to 37.5)
0 (-7.0 to 11.2)
0.0 (-7.1 to 17.6)
0.73 0.85 0 (0) 2.8 (2.8 to 37.9)
0 (-2.0 to 0)
0.0 (-16.7 to 0.0)
0.60 0.81
MIF 0 (0) 198 (121 to 391)
4 (-182 to 108)
3.9 (-40.1 to 90.5)
0.91 0.87 2 (5) 226 (118 to 708)
8 (-198 to 168)
5.1 (-32.2 to 81.5)
0.90 0.62
FGF2 0 (0) 45.0 (13.3 to 79.0)
-2.0 (-21.8 to 5.7)
-9.6 (-34.6 to 17.9)
0.29 0.19 0 (0) 30.1 (15.1 to 74.6)
0 (-7.2 to 12.6)
0.0 (-19.4 to 53.1)
0.49 0.86
Markers of coagulation/platelet function
PAI-1 0 (0) 49535 (35875 to 84200)
-67 (-15592 to 15755)
0.1 (-21.0 to 34.2)
0.87 1.00 2 (5) 62250 (36870 to 79825)
-610 (-28682 to 24980)
-2.7 (-33.4 to 64.0)
0.92 1.00
sCD40L 0 (0) 150.9 (72.3 to 386)
-4.8 (-58.9 to 110.1)
-3.9 (-38.6 to 103.1)
0.72 0.87 0 (0) 115.9 (46.7 to 412.5)
4.4 (-84.5 to 43.9)
5.4 (-34.7 to 107.8)
0.73 0.87
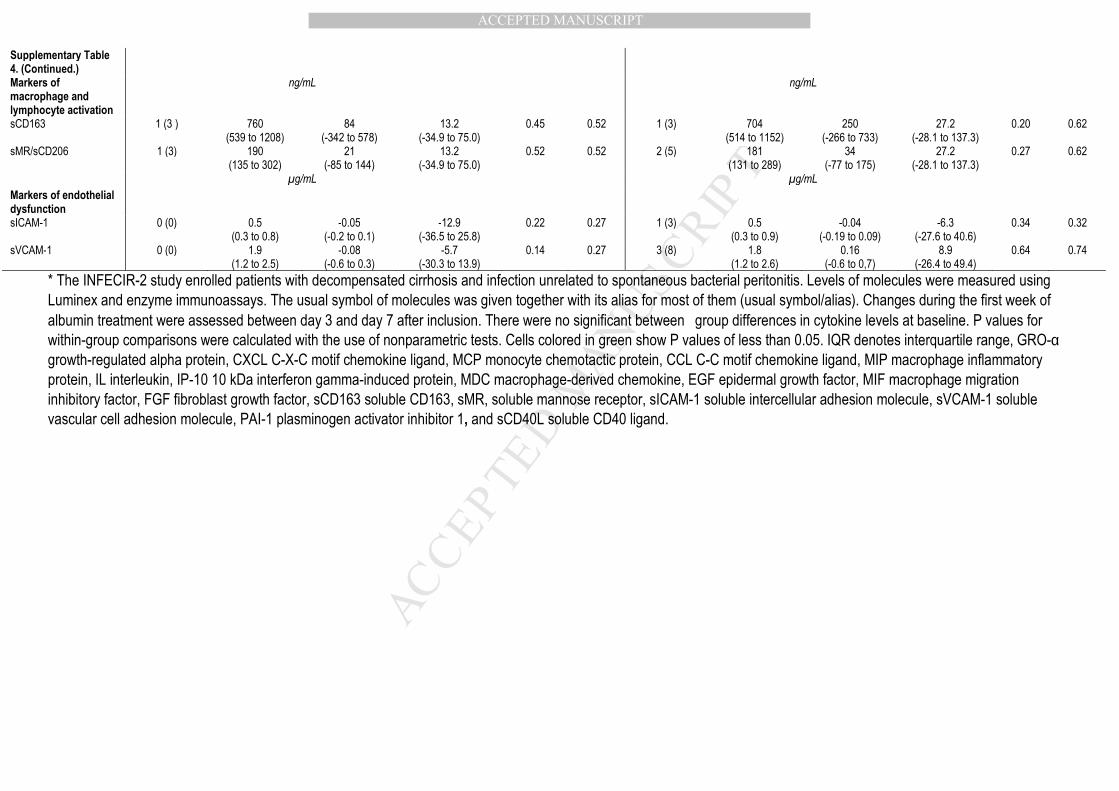
MANUSCRIP
T
ACCEPTED
ACCEPTED MANUSCRIPT
Supplementary Table 4. (Continued.)
Markers of macrophage and lymphocyte activation
ng/mL ng/mL
sCD163 1 (3 ) 760 (539 to 1208)
84 (-342 to 578)
13.2 (-34.9 to 75.0)
0.45 0.52 1 (3) 704 (514 to 1152)
250 (-266 to 733)
27.2 (-28.1 to 137.3)
0.20 0.62
sMR/sCD206 1 (3) 190 (135 to 302)
21 (-85 to 144)
13.2 (-34.9 to 75.0)
0.52 0.52 2 (5) 181 (131 to 289)
34 (-77 to 175)
27.2 (-28.1 to 137.3)
0.27 0.62
µg/mL µg/mL
Markers of endothelial dysfunction
sICAM-1 0 (0) 0.5 (0.3 to 0.8)
-0.05 (-0.2 to 0.1)
-12.9 (-36.5 to 25.8)
0.22 0.27 1 (3) 0.5 (0.3 to 0.9)
-0.04 (-0.19 to 0.09)
-6.3 (-27.6 to 40.6)
0.34 0.32
sVCAM-1 0 (0) 1.9 (1.2 to 2.5)
-0.08 (-0.6 to 0.3)
-5.7 (-30.3 to 13.9)
0.14 0.27 3 (8) 1.8 (1.2 to 2.6)
0.16 (-0.6 to 0,7)
8.9 (-26.4 to 49.4)
0.64 0.74
* The INFECIR-2 study enrolled patients with decompensated cirrhosis and infection unrelated to spontaneous bacterial peritonitis. Levels of molecules were measured using
Luminex and enzyme immunoassays. The usual symbol of molecules was given together with its alias for most of them (usual symbol/alias). Changes during the first week of
albumin treatment were assessed between day 3 and day 7 after inclusion. There were no significant between�group differences in cytokine levels at baseline. P values for
within-group comparisons were calculated with the use of nonparametric tests. Cells colored in green show P values of less than 0.05. IQR denotes interquartile range, GRO-α
growth-regulated alpha protein, CXCL C-X-C motif chemokine ligand, MCP monocyte chemotactic protein, CCL C-C motif chemokine ligand, MIP macrophage inflammatory
protein, IL interleukin, IP-10 10 kDa interferon gamma-induced protein, MDC macrophage-derived chemokine, EGF epidermal growth factor, MIF macrophage migration
inhibitory factor, FGF fibroblast growth factor, sCD163 soluble CD163, sMR, soluble mannose receptor, sICAM-1 soluble intercellular adhesion molecule, sVCAM-1 soluble
vascular cell adhesion molecule, PAI-1 plasminogen activator inhibitor 1, and sCD40L soluble CD40 ligand.


![3E1 - Année Complète...dra hist geo soriano foray [3dra hggr.1] s.112 dra francais heriaud [3dra frgr.1] s.204 orient.dec.pro. cocheret jourdan s.122s.216 arts plastiques](https://img.pdfslide.fr/doc/110x75/5f023c867e708231d4034134/3e1-anne-complte-dra-hist-geo-soriano-foray-3dra-hggr1-s112-dra-francais.jpg)