Embed Size (px)
Citation preview

COMMUNAUTE FRANCAISE DE BELGIQUE
UNIVERSITE DE LIEGE – GEMBLOUX AGRO-BIO TECH
Innovative algorithms to combine phenotypic,
genealogical and genomic information
originating from diverse sources
Jérémie VANDENPLAS
Essai présenté en vue de l'obtention du grade
de docteur en sciences agronomiques et ingénierie biologique
Promoteur: Nicolas Gengler
2014

Copyright. Aux termes de la loi belge du 30 juin 1994, sur le droit d'auteur et les droits
voisins, seul l'auteur a le droit de reproduire partiellement ou complètement cet ouvrage
de quelque façon et forme que ce soit ou d'en autoriser la reproduction partielle ou
complète de quelque manière et sous quelque forme que ce soit. Toute photocopie ou
reproduction sous autre forme est donc faite en violation de la dite loi et de des
modifications ultérieures.
Vandenplas Jérémie. (2014). Innovative algorithms to combine phenotypic, genealogical
and genomic information originating from diverse sources. (PhD Dissertation in English).
Gembloux, Belgium, Gembloux Agro-Bio Tech, University of Liege, 190p., 27 tabl., 3
fig.
Abstract
Along with technical developments, international exchanges of genetic material
(e.g., frozen semen, embryos) have increased since the 1970s. However, genetic
evaluations are traditionally based on phenotypic and genealogical data which are
internally recorded, i.e., within well defined borders. Because imported (i.e., external)
genetic material is usually strongly selected in their respective populations, internal
genetic evaluations for external animals could be biased and less accurate if external data
used for their selection is ignored. Moreover, comparison of internal and external animals
based on their internal and external estimates of genetic merit is needed to select and
potentially import the most suitable ones according to the internal breeding goal.
However, such comparison is usually not possible among internal and external genetic
evaluations due, e.g., to differences among units of measurement. Thereby, several
approaches and algorithms have been developed to render internal and external genetic
evaluations comparable, and to combine or blend phenotypic and genealogical data and
external information, i.e., estimates of genetic merit and associated reliabilities.
Furthermore, the recent development of genomic selection also increased needs for
combining phenotypic, genealogical and genomic data and information. Therefore, the
aim of this thesis was first to develop innovative algorithms to combine diverse sources of
phenotypic, genealogical and genomic data and information, and second to test them on
simulated and real data in order to check their correctness. Based on a Bayesian view of
the linear mixed models and addressing several issues highlighted by previous studies,
systems of equations combining simultaneously diverse sources of data and external
information were developed for (multivariate) genetic and single-step genomic
evaluations. Double counting of contributions due to relationships and due to records
were considered as well as computational burden. The performances of the developed
systems of equations were evaluated using simulated datasets and real datasets originating
from genetic (genomic) evaluations for Holstein cattle and for show jumping horses. The
different results showed that the developed equations integrated and blended several
sources of information in a proper way into a genetic or a single-step genomic evaluation.
It was also observed that double counting of contributions due to relationships and due to
records was (almost) avoided. Furthermore, more reliable estimates of genetic merit were
also obtained for external animals and for their relatives after integration of external
information. Also, the developed equations can be easily adapted to complex models,
such as multivariate mixed models. Indeed, it was shown that external information
correlated to the internal phenotypic traits was properly integrated using the developed
equations. Finally, research of this thesis led to the development of a genomic evaluation
system for Holstein cattle in the Walloon Region of Belgium for production traits, as well
as for other traits, like somatic cell score. Based on the research of this thesis, future
research topics, e.g., concerning integration of correlated external information and of
genomic information, were finally presented.
Vandenplas Jérémie. (2014). Algorithmes innovants pour combiner des informations
phénotypiques, généalogiques et génomiques provenant de différentes sources. (Thèse de
doctorat en anglais). Gembloux, Belgique, Gembloux Agro-Bio Tech, Université de
Liège, 190p., 27 tabl., 3 fig.
Résumé
Suite aux progrès techniques, les échanges internationaux de matériel génétique
(par exemple, la semence congelée ou les embryons), ont augmenté depuis les années
1970. Toutefois, les évaluations génétiques sont traditionnellement basées sur des données
phénotypiques et généalogiques qui sont enregistrées à un niveau interne, c'est-à-dire dans
des frontières bien définies. Parce que le matériel génétique importé (appelé ci-après
externe) est habituellement fortement sélectionné dans leurs populations respectives, les
évaluations génétiques internes pour les animaux externes pourraient être biaisées et
moins précises si les données externes utilisées pour leur sélection sont ignorées. En
outre, la comparaison des animaux internes et externes en fonction des estimations
internes et externes de leurs valeurs génétiques est nécessaire pour sélectionner et,
potentiellement, importer les plus appropriés en fonction de l'objectif de reproduction
interne. Cependant, une telle comparaison n'est généralement pas possible entre les
évaluations génétiques internes et externes en raison, par exemple, des différences entre
les unités de mesure utilisées pour mesurer les phénotypes. Ainsi, plusieurs approches et
algorithmes ont été développés pour rendre comparables des évaluations génétiques
internes et externes, ou pour combiner des données phénotypiques et généalogiques ainsi
que de l’information externe, c'est-à-dire les estimations de valeurs génétiques et les
fiabilités associées. De plus, l'évolution récente de la sélection génomique augmente
également les besoins de combinaisons de données phénotypiques et généalogiques et
d’informations génomiques. Par conséquent, l'objectif de cette thèse a été, premièrement,
de développer des algorithmes innovants pour combiner diverses sources de données et
d’informations phénotypiques, généalogiques et génomiques et, deuxièmement, de tester
ces algorithmes sur des données réelles et simulées afin de vérifier leur exactitude.
Fondée sur une vision bayésienne des modèles mixtes linéaires et reposant sur plusieurs
questions soulevées par des études précédentes, des systèmes d'équations combinant
simultanément diverses sources de données et d’informations externes ont été élaborés
pour des évaluations génétiques et génomiques de type « single-step », potentiellement
multi-caractères. Les doubles comptages de contributions dus aux liens de parenté entre
les animaux externes et dus aux données ainsi que la charge de calcul ont été examinés.
Les performances des systèmes d'équations développés ont été évaluées en utilisant des
jeux de données simulées et des données réelles provenant des évaluations génétiques
(génomiques) pour les bovins Holstein et pour les chevaux de saut d'obstacle. Les
différents résultats ont montré que les équations développées intègrent et combinent
plusieurs sources d'information d'une manière appropriée pour les évaluations génétiques
et génomiques de type « single-step ». Il a également été observé que les doubles
comptages des contributions dus aux liens de parenté entre animaux externes et dus aux
données étaient (presque) évités. En outre, des estimations plus fiables de valeurs
génétiques ont également été obtenues pour les animaux externes et pour les animaux qui
leur sont apparentés après l'intégration de l'information externe. De plus, les équations
développées peuvent être facilement adaptées à des modèles complexes, tels que les
modèles mixtes multi-caractères. En effet, il a été montré que l'information externe
corrélée avec les caractères phénotypiques internes est bien intégrée en utilisant les
équations développées. Enfin, la recherche de cette thèse a conduit à la mise en place d'un
système d'évaluation génomique pour bovins Holstein en Région Wallonne (Belgique)
pour, notamment, les caractères de production. Suite aux recherches menées lors de cette
thèse, des sujets de recherche futurs, par exemple, concernant l'intégration d’informations
externes corrélées et d'informations génomiques, ont finalement été présentés.
ACKNOWLEDGMENTS
While I was finishing my Master thesis in 2010, Prof. Nicolas Gengler (University
of Liege, Gembloux Agro-Bio Tech) proposed me to continue a research on the same
topic through a PhD. Accepting this opportunity was the right thing to do for me because,
during these last years, I travelled a lot, I met a lot of interesting people and, of course, I
learned a lot about animal breeding and genetics, statistics, maths and programming.
Therefore, I would like to acknowledge first my supervisor, Prof. Nicolas Gengler, for
having proposed me this opportunity.
All travels, knowledge and achievement of this PhD would not have been possible
without the help of many other people. Thereby, I also acknowledge all the thesis
committee members, Dr Steven Janssens (Katholieke Universiteit Leuven), Prof. Yves
Beckers, Prof. Yves Brostaux, Prof. Rodolphe Palm, Prof. André Théwis and Prof.
Nicolas Gengler (all from University of Liege, Gembloux Agro-Bio Tech) for their
advises and encouragement. I am also grateful to each member of the jury who read and
reviewed this PhD manuscript. The thesis jury included Prof. Frédéric Francis (Chair of
the jury, University of Liege, Gembloux Agro-Bio Tech), Dr Ole F. Christensen (Aarhus
University), Dr Steven Janssens, Prof. Ignacy Misztal (University of Georgia), Prof. Yves
Beckers, Prof. Yves Brostaux, and Prof. Nicolas Gengler. Special acknowledgments are
addressed to Prof. Yves Brostaux and Dr Ole F. Christensen for reviewing the first draft of
this manuscript and for their helpful comments. I would also like to address my deepest
gratitude to Dr Catherine Bastin (University of Liege, Gembloux Agro-Bio Tech), Dr
Steven Janssens and Marie-Laure Vanrobays for their revision of this manuscript. I also
address my acknowledgments to the following people who took time for revising some of
my manuscripts: Dr Catherine Bastin, Dr Bernd Buske, Dr Frédéric Colinet, Dr Pierre
Faux, Marie-Laure Vanrobays (all from University of Liege) and Ryan Ann Davis
(University of Georgia).
I would like to address special thanks to all people who minutely answered to my
questions regarding animal breeding and genetics. There are numerous scientists, and
among them, I would like to personally acknowledge Dr Ole F. Christensen, Dr Steven
Janssens, Dr Andres Legarra (French National Institute for Agricultural Research), Dr
Han Mulder (Wageningen UR) and Dr Paul VanRaden (United States Department of
Agriculture). Thank you for all the time you took to answer to my questions and for
sharing your knowledge. However, as said before, I also learned a lot about statistics,
maths and programming. All the accomplishments would not have been possible without
the help of numerous people. In addition to people previously mentioned, I would extend
my thanks to Dr Ignacio Aguilar (Instituto Nacional de Investigación Agropecuaria), Dr
Mark Bull (University of Edinburgh), Prof. Catherine Charles (University of Liege,
Gembloux Agro-Bio Tech), Dr David Colignon (University of Liege), Dr François
Damien (University catholique de Louvain), Dr Pierre Faux, Dr Klaus Gaertner
(Weierstrass Institute for Applied Analysis and Stochastics), Prof. George Karypis
(University of Minnesota), Prof. Ignacy Misztal and Dr Shogo Tsuruta (University of
Georgia). Also, most of research would not have been possible without the different
people who provided me datasets. I especially acknowledge Danielle Arts (Royal Dutch
Sporthorse Studbook), Dr Steven Janssens, and Dr Anne Ricard (French National Institute
for Agricultural Research), Dr Gregor Gorjanc and Marija Špehar (University of
Ljubljana), as well as Dr Catherine Bastin, Dr Frédéric Colinet, Marie Dufrasne, Dr Hedi
Hammami, Sylvie Vanderick and Marie-Laure Vanrobays (all from University of Liege,
Gembloux Agro-Bio Tech).
My gratitude also goes to Dr Gregor Gorjanc, Prof. Ignacy Misztal and Dr Han
Mulder for organizing my scientific stays at the University of Ljubljana, at the University
of Georgia and at Wageningen UR, respectively. These stays were very fruitful on several
levels. The success of these scientific stays was also made possible thanks to all the
members of the different research teams, and I am especially grateful to El Hamidi Abdel
Hay, Daniela Lourenco, Marija Špehar and Joy (H.) Wang.
For the achievement of this PhD, several financial supports were required. I would
like to acknowledge the financial support:
- of the National Fund for Scientific Research (FRS-FNRS, Brussels, Belgium) for
my position as a Research Fellow since October 2011,
- of the National Fund for Scientific Research, of the University of Liege and of
Wallonie-Bruxelles International through grants provided for scientific stays, and
- from the European Commission, Directorate-General for Agriculture and Rural
Development, under Grand Agreement 211708 and from the Commission of the
European Communities (FP7, KBBE-2007-1) through the RobustMilk project, and
of the Ministry of Agriculture of Walloon Region of Belgium (Service Public de
Wallonie, Direction générale opérationnelle “Agriculture, Ressources naturelles et
Environnement” – DGARNE) through different projects for research conducted

during this PhD.
I am grateful to all the members of the Animal Science Unit of Gembloux Agro-
Bio Tech (University of Liege) who helped, advised and encouraged me during these last
years. Thank you for your friendship and the friendly atmosphere.
The achievement of this PhD was also made possible thanks to all the after-work
activities. They were numerous and were held in many places, like Athens, Bratislava,
Copenhagen, Gembloux and Phoenix (to name a few). Because I am afraid to forget
someone, I will no longer mention names. However, thank you all of you for all these
great memories. The concerned people will recognize themselves.
Final and special thanks are addressed to all the people who were not concerned
by this PhD but who accompanied me during these last years. Especially, I would like to
acknowledge Eric and his family, Didier, François and Marc for their friendship. Working
and discussing with you about other things than matrices, maths or genetics is very
interesting. I would also like to acknowledge my parents, brothers and sister, and all the
other members of my family for their encouragements and advices. Finally, my greatest
thanks are addressed to Hilde who supports me all these years and to André who pointed
his finger at my computer when I was distracted during the writing of this manuscript.
To conclude, my first idea for the acknowledgments was to write something short
and simple and what I would really like to say to everybody. However, it is not the
traditional way to act like this. Therefore, I will finish the acknowledgments as I thought
first to write them: thank you everybody for your help, advices, encouragements, teaching
and friendship during all these years, related or not to this PhD. And I am sure this will
not take an end with the achievement of my PhD thesis.

CONTENTS
CHAPTER I. GENERAL INTRODUCTION ..............................................................................................1
CONTEXT ......................................................................................................................................................3
AIM OF THE THESIS........................................................................................................................................5
THESIS OUTLINE............................................................................................................................................5
THESIS FRAMEWORK.....................................................................................................................................6
REFERENCES.................................................................................................................................................7
CHAPTER II. STRATEGIES TO RENDER COMPARABLE AND TO COMBINE RESULTS
FROM DIFFERENT GENETIC AND GENOMIC EVALUATIONS: A R EVIEW .................................9
INTRODUCTION............................................................................................................................................11
POST EVALUATION APPROACHES..................................................................................................................11
Conversion equations ............................................................................................................................11
Weighted averages .................................................................................................................................13
Linear mixed models..............................................................................................................................15 Multiple across country evaluation ....................................................................................................................15 Blending algorithm ............................................................................................................................................17
Selection index.......................................................................................................................................18
SIMULTANEOUS COMBINATIONS ..................................................................................................................20
Absorption of equations.........................................................................................................................20
Pseudo-records ......................................................................................................................................21
Bayesian approaches .............................................................................................................................23
COMBINATIONS IN GENOMIC SELECTION.....................................................................................................27
DISCUSSION AND CONCLUSION....................................................................................................................29
REFERENCES...............................................................................................................................................31
CHAPTER III. COMPARISON AND IMPROVEMENT OF DIFFEREN T BAYESIAN
PROCEDURES TO INTEGRATE EXTERNAL INFORMATION INTO G ENETIC
EVALUATIONS ............................................................................................................................................37
ABSTRACT...................................................................................................................................................39
INTRODUCTION............................................................................................................................................40
MATERIALS AND METHODS.........................................................................................................................41
Theoretical background.........................................................................................................................41
Four different implementations .............................................................................................................43 LBE ...................................................................................................................................................................44 QBE...................................................................................................................................................................45 FBE....................................................................................................................................................................47 SBE....................................................................................................................................................................48
Simulated data .......................................................................................................................................49
Contents
RESULTS AND DISCUSSION..........................................................................................................................51
CONCLUSIONS.............................................................................................................................................55
ACKNOWLEDGMENTS..................................................................................................................................56
REFERENCES...............................................................................................................................................56
APPENDIX III-1 ...........................................................................................................................................58
Equivalence of mixed model equations considering the estimation of base differences........................58
Elimination of base difference equations in FBE and SBE....................................................................59
TSA ........................................................................................................................................................60
CHAPTER IV. AN INTEGRATION OF EXTERNAL INFORMATION FOR FOREIGN
STALLIONS INTO THE BELGIAN GENETIC EVALUATION FOR J UMPING HORSES ..............63
SUMMARY ...................................................................................................................................................65
INTRODUCTION ...........................................................................................................................................65
MATERIALS AND METHODS.........................................................................................................................66
RESULTS AND DISCUSSION..........................................................................................................................71
Descriptive statistics..............................................................................................................................71
Model adequacy ....................................................................................................................................74
Predictive ability ...................................................................................................................................75
Reliabilities............................................................................................................................................77
CONCLUSION...............................................................................................................................................79
ACKNOWLEDGEMENTS................................................................................................................................79
REFERENCES...............................................................................................................................................79
CHAPTER V. SHORT COMMUNICATION: ALTERATION OF PRIOR S FOR RANDOM
EFFECTS IN GAUSSIAN LINEAR MIXED MODELS ............ ..............................................................83
ABSTRACT...................................................................................................................................................85
SHORT COMMUNICATION ............................................................................................................................85
BAYESIAN VIEW OF LINEAR MIXED MODELS................................................................................................86
ALTERATION OF PRIORS FOR RANDOM EFFECTS..........................................................................................87
EXAMPLE 1: NUMERICAL EXAMPLE ............................................................................................................90
EXAMPLE 2: INTEGRATION OF EXTERNAL INFORMATION BASED ON A BAYESIAN APPROACH......................90
ACKNOWLEDGEMENTS................................................................................................................................92
REFERENCES...............................................................................................................................................93
CHAPTER VI. UNIFIED METHOD TO INTEGRATE AND BLEND S EVERAL, POTENTIALLY
RELATED, SOURCES OF INFORMATION FOR GENETIC EVALUAT ION ....................................95
ABSTRACT...................................................................................................................................................97
Background............................................................................................................................................97
Results ...................................................................................................................................................97
Conclusions ...........................................................................................................................................97
BACKGROUND.............................................................................................................................................98
Contents
METHODS..................................................................................................................................................100
Integration of several sources of external information........................................................................100
Integration of several sources of external information by avoiding double counting of contributions
due to records ......................................................................................................................................104
Blending several sources of external information by avoiding double counting of contributions due to
records .................................................................................................................................................105
Simulated example...............................................................................................................................105
Walloon example..................................................................................................................................108
RESULTS AND DISCUSSION.........................................................................................................................111
Simulated example............................................................................................................................... 111
Walloon example..................................................................................................................................113 Internally used sires .........................................................................................................................................114 Internally unused sires .....................................................................................................................................117 Internal animals ...............................................................................................................................................120 On the implementation.....................................................................................................................................123
CONCLUSIONS...........................................................................................................................................124
ADDITIONAL FILES ....................................................................................................................................124
COMPETING INTERESTS.............................................................................................................................125
AUTHORS’ CONTRIBUTIONS.......................................................................................................................125
ACKNOWLEDGMENTS................................................................................................................................125
REFERENCES.............................................................................................................................................125
ADDITIONAL FILE 1 ...................................................................................................................................128
ADDITIONAL FILE 2 ...................................................................................................................................135
CHAPTER VII. WALLOON SINGLE-STEP GENOMIC EVALUATION SYSTEM INTEGRATING
LOCAL AND MACE EBV.........................................................................................................................137
ABSTRACT.................................................................................................................................................139
INTRODUCTION..........................................................................................................................................139
MATERIALS AND METHODS........................................................................................................................141
RESULTS AND DISCUSSION.........................................................................................................................144
CONCLUSIONS...........................................................................................................................................149
ACKNOWLEDGEMENTS..............................................................................................................................149
REFERENCES.............................................................................................................................................150
CHAPTER VIII. GENERAL DISCUSSION ............................................................................................151
INTEGRATION OF CORRELATED EXTERNAL INFORMATION..........................................................................154
Material and methods..........................................................................................................................154
Results and discussion .........................................................................................................................157
Conclusions .........................................................................................................................................162
COMPARISON OF APPROACHES THAT COMBINE INTERNAL DATA AND EXTERNAL INFORMATION .................163
Absorption based approaches and pseudo-records based approaches................................................164
Contents
Absorption based approaches and Bayesian approaches....................................................................165
Pseudo-records based approaches and Bayesian approaches.............................................................166
Conclusions .........................................................................................................................................168
REFERENCES.............................................................................................................................................169
CHAPTER IX. IMPLICATIONS, FUTURE RESEARCH TOPICS AN D GENERAL
CONCLUSION ...........................................................................................................................................171
IMPLICATIONS ...........................................................................................................................................173
FUTURE RESEARCH TOPICS........................................................................................................................173
On the estimation of contributions due to relationships ......................................................................173
On the integration of correlated external information ........................................................................174
On the estimation of correlations between external information and internal data ............................175
On the integration of genomic information .........................................................................................175
GENERAL CONCLUSION.............................................................................................................................176
REFERENCES.............................................................................................................................................177
LIST OF ABBREVIATIONS .....................................................................................................................179
LIST OF TABLES.......................................................................................................................................181
LIST OF FIGURES ....................................................................................................................................185
LIST OF PUBLICATIONS, ORAL PRESENTATIONS, AND POSTE RS............................................187
PUBLICATIONS...........................................................................................................................................187
ORAL PRESENTATIONS...............................................................................................................................188
On invitation........................................................................................................................................188
On a personal proposal .......................................................................................................................188
POSTERS....................................................................................................................................................189

Chapter I. G ENERAL INTRODUCTION

General introduction
3
CONTEXT
One of the major objectives in animal breeding is to estimate the genetic merit of
animals for traits of interest in order to rank them. Based on these rankings, the best ones
can be selected and mated to finally generate an improved generation with optimal
performances regarding these traits of interest. Genetic merits can be estimated through
different statistical methods, such as selection index (SI; Hazel, 1943), mixed models
(Henderson, 1984) or Bayesian methods (Gianola and Fernando, 1986). Under some
assumptions, these statistical methods allow to animal breeders to obtain estimates of
genetic merit (EGM) either for animals (e.g., estimated breeding values; EBV) or for
what they transmit to their progeny (e.g., expected progeny differences, predicted
transmitting abilities). All these methods aim to achieve the highest reliability (REL) for
the EGM with regards to available data. Nevertheless, whatever method used, the aim is
the same, i.e., ranking animals to choose the best ones in order to generate improved
progeny.
Whereas SI, mixed models and Bayesian methods could give equivalent results
under some assumptions, the linear mixed models developed by Henderson (e.g.,
Henderson, 1984) are commonly used for genetic evaluations since the 1970s, replacing
the SI theory popularized by Hazel (Powell and Norman, 2006). Several properties of the
linear mixed models can explain their widespread use. A first property of linear mixed
models is to differentiate the effects between “fixed” and “random” effects, following the
frequentist school. These effects have “Best Linear Unbiased Estimate” (BLUE) and
“Best Linear Unbiased Prediction” (BLUP) properties, respectively. Other properties of
linear mixed models are their easy adaptation to non-normally distributed data, their
potential application in a Bayesian context, or their easy understanding (Robinson, 1991;
VanRaden, 2001; Powell and Norman, 2006).
Traditionally, phenotypic and genealogical data are recorded following official
recording schemes performed on populations within well defined borders (e.g., country
borders). Based on these data, genetic evaluations are performed for these populations.
Such genetic evaluations are hereafter called “internal” genetic evaluations because they
are only based on internal data, i.e., collected within established borders. Internal genetic
evaluations are characterized by their own scale, units of measurement and/or genetic
bases. However, since the 1970s, technical developments, like frozen semen or embryos,
increase exchanges of genetic material worldwide, leading to internationalization of
Chapter I
4
breeding schemes and breeds. Within well defined borders, the internal population might
have a large proportion of genes from external populations. Such situations are especially
observed in sport horse (Arnason, 2013) and dairy cattle breeding (Philipsson, 1987).
Hence, different issues may arise if genetic material is widespread outside borders while
genetic evaluations are performed within borders. Firstly, because imported (i.e., external)
genetic material is usually strongly selected, internal EGM for external animals could be
biased with an internal genetic evaluation if external data used for their selection in
external populations is ignored (VanRaden, 2012). Nevertheless, although one of the
major objectives in animal breeding is to internally predict genetic merits of animals with
the highest REL by using all available data, internal genetic evaluations are usually
performed using only data collected internally. Several reasons leading to internal genetic
evaluations that ignore external data are mentioned below. Secondly, selection and
importation of the most suitable external genetic material according to the internal
breeding needs and goals require the comparison of animals through their own EGM and
REL. However, such a comparison is usually not possible between internal and external
populations due to differences among scales, units of measurement and genetic bases of
genetic evaluations (Weigel and Rekaya, 2000).
One way to solve both issues is to use simultaneously all available phenotypic and
genealogic data, i.e., from all concerned populations, to get unbiased EGM through a joint
genetic evaluation. Some studies, for example in sport horse breeding (e.g., Furre et al.,
2013) and in dairy cattle breeding (e.g., Banos et al., 1992; Weigel and Rekaya, 2000),
showed results of joint genetic evaluations. However, usually, joint genetic evaluations
cannot be performed because data from the different populations are not available in the
same dataset for several reasons, like political roadblocks, or because data cannot be
merged due to inconsistencies. Moreover, even if data can be combined in the same
dataset, joint genetic evaluations could not be performed due to computing or logistical
problems (Powell and Sieber, 1992). Nevertheless, comparison of genetic material is still
needed. To make it feasible, instead of performing joint evaluations based on the
combination of raw data, that are mostly unavailable, genetic merits can be approximated
by converting or combining the available information, i.e., EGM and associated REL
obtained for each population. Therefore, different approaches and algorithms converting
or combining EGM and their associated REL across populations were developed over the
years to improve accuracies of internal genetic evaluations and to render genetic merits of
animals comparable across populations in order to select the most appropriate genetic
General introduction
5
material in a widespread pool of genes. These developed approaches and algorithms were
mainly derived from SI theory (e.g., VanRaden, 2001), mixed models methodology (e.g.,
Schaeffer, 1985) and Bayesian statistics (e.g., Gianola and Fernando, 1986).
For a few decades, molecular data at the deoxyribonucleic acid (DNA) level have
been considered in genetic evaluations as an additional source of data that permits to
improve genetic progress through both an increase of accuracy of selection and a decrease
of generation intervals. Selection based on molecular information was first based on
molecular genetic marker information (e.g., microsatellites) and was called marker-
assisted selection (Fernando and Grossman, 1989). In 2001, Meuwissen et al. (2001)
proposed to use genome-wide dense marker maps including several thousands of single
nucleotide polymorphisms (SNP) to estimate genetic merits of animals. This led to the
recent massive development of the so-called genomic selection in many species. The
increasing availability of bi-allelic SNP data and the subsequent increasing amount of
information derived from this data source (i.e., genomic EGM and associated REL)
highlighted the necessity to develop approaches and algorithms for combining sources of
phenotypic, genealogical and genomic data and information.
AIM OF THE THESIS
The aim of this thesis was to develop innovative algorithms to combine
phenotypic, genealogical as well as genomic data and information originating from
diverse sources and to test them on simulated and real data in order to check their
correctness.
THESIS OUTLINE
This thesis is a compilation of published scientific papers proposing algorithms
that combine different sources of data and information and investigating their use in
simulated and real contexts. Firstly, a literature review of the different approaches and
algorithms that render EGM and associated REL comparable or to combine them is
provided in Chapter II. Then, a detailed comparison of different Bayesian approaches
integrating external information into genetic evaluations is provided (Chapter III). Based
on this comparison, some improvements are proposed (Chapter III), mainly to limit
computational burden and to avoid double counting of contributions due to relationships.
In Chapter IV, the resulting improved Bayesian approach is implemented in the context of
the Belgian genetic evaluation for jumping horses. Bayesian approaches require
Chapter I
6
alterations of expectations and of (co)variances for random effects of linear mixed
models. However, most available software packages based on linear mixed models used
in animal breeding do not allow for such alterations. Therefore, a method is proposed to
allow for those alterations while using available software packages (Chapter V). This
method is based on the use of an extended data file and a user supplied (co)variance
matrix (Chapter V). In Chapter VI, a unified method integrating and blending several
sources of information into a genetic evaluation is developed and tested on simulated and
real data. In addition to integrate and blend several sources of information, the developed
method allows to take into account double counting of contributions due to records. An
implementation of this latter method is the Walloon single-step genomic evaluation
integrating Walloon and multiple across country evaluation (MACE) information, and is
presented in Chapter VII. Chapter III to Chapter VII show improvements and
implementations of Bayesian approaches that integrate several sources of external
information into an internal genetic or single-step genomic evaluation. These
investigations are performed in a context where internal and external information were
provided for the same trait, although these approaches were developed to integrate
correlated external information, i.e., to integrate external information from a certain trait
correlated to the internal phenotype traits. Therefore, the first part of Chapter VIII
presented the results of a study which integrates correlated external information into an
internal multivariate evaluation for a simulated case. A comparative study among the
different approaches that combine simultaneously external information and internal data
is then detailed in the second part of Chapter VIII. Finally, implications, future research
topics and a general conclusion are presented in Chapter IX.
THESIS FRAMEWORK
The research of this thesis was initiated in October 2010. The first academic year
2010-2011 was mainly dedicated to the NovaUdderHealth project financed by the
Ministry of Agriculture of Walloon Region of Belgium (Service Public de Wallonie,
Direction générale opérationnelle “Agriculture, Ressources naturelles et Environnement”
– DGARNE) and to the FP7 European project RobustMilk. Since October 2011, this
research has been supported by a fellowship (“Research Fellow”) funded by the National
Fund for Scientific Research (FRS-FNRS, Belgium).
General introduction
7
REFERENCES
Arnason, T. 2013. Bright future for research in horse breeding! J. Anim. Breed. Genet.
130:167–169.
Banos, G., G.R. Wiggans, and J.A.B. Robinson. 1992. Comparison of methods to rank
bulls across countries. J. Dairy Sci. 75:2560–2568.
Fernando, R.L., and M. Grossman. 1989. Marker assisted selection using best linear
unbiased prediction. Genet. Sel. Evol. 21:467–477.
Furre, S., A. Viklund, J. Philipsson, B. Heringstad, and O. Robison. 2013. Joint genetic
evaluation of Nordic sporthorses. Page 358 in Book of abstracts of the 64th annual
meeting of the European Association for Animal Production, Nantes, France.
Wageningen Academic Publishers, Wageningen, The Netherlands.
Gianola, D., and R.L. Fernando. 1986. Bayesian methods in animal breeding theory. J.
Anim. Sci. 63:217–244.
Hazel, L.N. 1943. The genetic basis for constructing selection indexes. Genetics 28:476–
490.
Henderson, C.R. 1984. Applications of linear models in animal breeding. 2nd ed.
University of Guelph, Guelph, ON, Canada.
Meuwissen, T.H.E., B.J. Hayes, and M.E. Goddard. 2001. Prediction of total genetic
value using genome-wide dense marker maps. Genetics 157:1819–1829.
Philipsson, J. 1987. Standards and procedures for international genetic evaluations of
dairy cattle. J. Dairy Sci. 70:418–424.
Powell, R.L., and H.D. Norman. 2006. Major advances in genetic evaluation techniques.
J. Dairy Sci. 89:1337–1348.
Powell, R.L., and M. Sieber. 1992. Direct and indirect conversion of bull evaluations for
yield traits between countries. J. Dairy Sci. 75:1138–1146.
Robinson, G.K. 1991. That BLUP is a good thing: The estimation of random effects. Stat.
Sci. 6:15–32.
Schaeffer, L.R. 1985. Model for international evaluation of dairy sires. Livest. Prod. Sci.
12:105–115.
VanRaden, P.M. 2001. Methods to combine estimated breeding values obtained from
separate sources. J. Dairy Sci. 84 (E. Suppl.):E47–E55.
VanRaden, P.M. 2012. Avoiding bias from genomic pre-selection in converting daughter
information across countries. Interbull Bull. 45:29–33.

Chapter I
8
Weigel, K.A., and R. Rekaya. 2000. A multiple-trait herd cluster model for international
dairy sire evaluation. J. Dairy Sci. 83:815–821.
Chapter II. S TRATEGIES TO RENDER COMPARABLE AND TO
COMBINE RESULTS FROM DIFFERENT GENETIC AND GENOMIC
EVALUATIONS : A REVIEW
Exchange of genetic materials among populations at an
(inter)national level rapidly increased with the development of
artificial insemination and frozen embryos, leading to an
increasing necessity to render comparable or to combine estimates
of genetic merit (e.g., estimated breeding values) and their
associated reliabilities provided for the various populations.
Combination of different sources of information became even
more crucial with the development of genomic evaluations.
Therefore, the objective of this Chapter was to review different
approaches and algorithms developed in order to solve issues
regarding comparison and combination of several genetic and
genomic evaluations.

Strategies to render comparable and to combine results from different genetic and genomic evaluations: A review
11
INTRODUCTION
The issue of comparing or combining estimates of genetic merit (EGM) and
associated reliabilities (REL) arose from the first exchanges of genetic material among
populations. Populations may be considered at a farm level (e.g., Henderson, 1975) or at a
country level (e.g., Schaeffer, 1985). Different approaches and algorithms were developed
to solve this issue and the objective of this Chapter is to review them. All reviewed
approaches and algorithms were sorted following two strategies. Firstly, EGM and
associated REL provided for external populations, hereafter called external information,
can be rendered comparable or combined with internal EGM and associated REL after
performing internal and external evaluations. These post evaluation approaches were
described hereafter in the subsection “Post evaluation approaches”. Secondly, external
information provided for external populations can be combined simultaneously with
internal phenotypic and genealogic data in internal genetic evaluations performed for
internal populations. These approaches were described hereafter in the subsection
“Simultaneous combinations”. Also, it was noted that most of the reviewed approaches
and algorithms were developed for (multi-breed) genetic evaluations in dairy and beef
cattle. With the advent of genomic selection, needs to combine genomic information with
phenotypic and genealogical data and information have appeared, and several previous
approaches were adapted. Therefore, a subsection is assigned to approaches adapted and
developed in the context of genomic selection.
POST EVALUATION APPROACHES
CONVERSION EQUATIONS
The oldest and simplest approach to render EGM and associated REL comparable
across two populations (e.g., from two countries) is the use of a regression-based
conversion equation which converts EGM from one exporting (i.e. external) population to
the scale, units of measurement and genetic base of an importing (i.e. internal) population.
In the context of dairy cattle, the first formula of conversion equations recommended by
the International Dairy Federation in 1981 (Gravert, 1983) was of the form:
x1y ba +=
where y is the vector of internal EGM, x is the vector of external EGM, a is the
intercept and b is the slope of the conversion equation.
Chapter II
12
The intercept a can be considered as the difference in genetic base between the two
populations. It is valid as long as the genetic bases of the two populations are fixed or are
moving at the same rate (Philipsson, 1987). If equal REL of EGM are observed in both
populations (i.e., the same number of observations and the same heritability) and if no
genotype x environment interaction exists (i.e., genetic correlations between the two
populations is equal to 1), the slope b is equal to the ratio of the standard deviations in
genetic merit as expressed in the two populations (Wilmink et al., 1986; Philipsson, 1987;
Powell and Sieber, 1992). The slope b can be considered as the relationships between
scales and definitions of EGM (e.g., estimated breeding values (EBV) or predicted
transmitting abilities (PTA)) of the two populations, i.e., as a scaling factor (Powell, 1988;
Powell and Sieber, 1992).
However, the previous conditions are usually not fulfilled in practice and several
approaches (e.g., Goddard, 1985; Philipsson et al., 1986; Wilmink et al., 1986; Powell,
1988) were proposed to estimate the intercept a and the slope b . These approaches also
take into account the REL associated with the EGM from each population. In this context,
the slope b also considers genetic correlations among populations that could be lower
than 1 due to different heritabilities and definitions of traits (Philipsson, 1987).
Approaches were also proposed to approximate REL associated with converted EGM
depending on REL associated with external EGM, on genetic correlations among
populations and on accuracy of conversion equations (Goddard, 1985; Powell et al.,
1994). It is noted that genetic correlations lower than 1 as well as preferential treatments
are mainly responsible for the non-reciprocity of the conversion equations (Powell et al.,
1994).
To compare different conversion equations, Philipsson et al. (1986) defined
desirable properties. Thus, methods should 1) give unbiased estimates of both the
intercept a and the slope b , 2) consider the difference in REL from each population, 3)
allow for the possibility for a genetic correlation less than 1 between the true genetic
merits in each population, and 4) minimize the variance of differences between converted
EGM and true values in the external population. Because accuracy of the conversion
equations is influenced by preferential matings of external animals, by preferential
treatments for some animals, and by suitability of animals selected for the estimation of a
and b (Powell et al., 1994), Wickham and Philipsson (1990a) proposed recommendations
for the estimation of both the intercept a and the slope b in the context of dairy cattle.
Strategies to render comparable and to combine results from different genetic and genomic evaluations: A review
13
Following these recommendations, bulls with data selected for the estimation should 1) be
born within a period of 10 year before the birth year of the youngest selected bull, 2) have
daughters in at least 20 herds in each population, and 3) be associated with EGM having
REL equal or higher than 75% in both populations. Furthermore, most recent data should
be used and, if sufficient number of bulls is available, bulls initially sampled in the
exporting populations (i.e., according to the gene flow) should be selected for the
estimation of a and b . Recommendations for cases with a non-random use of bulls, or a
correlation between EGM lower than 0.75, or a number of selected bulls lower than 20 or
a number of common used bulls very low, were also proposed (Wickham and Philipsson,
1990a). All these recommendations lead to the fact that some internal populations did not
have enough animals from the external population proven in their own internal
population. Therefore, conversions of EGM were performed through a third population
having enough common proven animals with the external and internal populations
(Wickham and Philipsson, 1990b).
To summarize, conversion equations are simple, easy to apply and provide results
for use in internal populations. However, estimations of a and b are mostly based on a
small number of animals being evaluated in the two populations. Also, conversion
equations can only be applied to render genetic evaluations of two populations
comparable at a time, mostly for only one direction, and may not be accurate for animals
with extremely high merit (Banos and Sigurdsson, 1996). Furthermore, relationships
among animals are not taken into account by the conversion equations and external
information is not propagated to relatives. Finally, conversion equations do not remove
the issue of animals associated with more than one EGM within a population.
WEIGHTED AVERAGES
Conversion equations do not allow for the consideration of external information
associated with an animal into its internal evaluation nor for the propagation of this
external information to its progeny, leading overall to a loss of REL. Hence, other
approaches and algorithms were developed to combine external and internal information.
Thereby, in the context of Holstein dairy cattle, Wiggans et al. (1992) proposed an
approach to combine US and Canadian bull evaluations based on the decomposition of a
bull’s evaluation between parent averages (PA) and progeny contributions (PC). After
conversion of Canadian evaluations and PC from the Canadian trait to the US trait by
using conversion equations, US and Canadian evaluations were combined as a weighted
Chapter II
14
average of either a combined PA or a PA from the US or the Canadian evaluations,
depending on the availability, and US and Canadian PC adjusted for the bull’s
contribution. The adjustment of PC for the bull’s contribution was due to the fact that the
bull’s contribution to PC through PA in the progeny EGM could be important. Because
combination of PC across countries could change the bull’s evaluation, it should be
removed before combination. Also, the process was done from the oldest bull to the
youngest one in order to propagate additional information from the oldest bulls to the
youngest ones. Estimated REL associated with combined evaluations were a function of
the sum of daughter equivalents (DE) from parents’ contributions from the combined
evaluations, and DE from PC for both US and Canadian evaluations. However, because
the approach considered only bulls, cows’ evaluations provided from the national
evaluations could disagree with the combined evaluation of their sire. Moreover, the
approach did not adjust progeny’s evaluations for changes in bulls’ EGM and foreign
cows were also not considered.
Derived from the equations of the random genetic effects, Mrode et al. (1996)
proposed a similar procedure, solving some disadvantages of the Wiggans’ method, to
combine United Kingdom and converted foreign evaluations. Combinations of
evaluations for bulls and also for cows were performed as a weighted average of PA, yield
deviations and PC. Evaluations of progeny were adjusted for changes in evaluations of
their parents. Because changes in parents’ evaluations affect only PA, only a weighted
difference between PA from combined evaluations and PA from internal evaluations was
added to the progeny’s evaluations. Specific rules were defined for progeny with
unknown parents. Combined REL for bulls, cows and progeny were estimated from the
decomposition in different contributions of the national and foreign information,
expressed in DE, similarly to Wiggans et al. (1992).
To summarize, both methods approximate animal model estimates. In order words,
both methods took all relationships among animals into account, and this led to an
increase of REL and eliminated the problem of animals associated with more than one
EGM within a country. However, both methods did not convert external information and
conversion equations were still needed.
Strategies to render comparable and to combine results from different genetic and genomic evaluations: A review
15
LINEAR MIXED MODELS
MULTIPLE ACROSS COUNTRY EVALUATION
In the context of dairy cattle breeding, the first method based on linear mixed
models to analyze jointly national evaluations from several countries was called multiple-
country evaluation (MCE) and proposed by Schaeffer (1985). This method provided
international estimates for all bulls in all participating countries. The MCE was based on a
single-trait model assuming equal heritability across countries, several interactions as
unimportant (e.g., genotype by environment interactions), a diagonal (co)variance matrix
for the residual effect and unbiased internal (national) evaluations. The MCE had the
advantage to use a pedigree relationship matrix across countries increasing connectedness
among countries resulting in better estimates of international EGM. Furthermore, MCE
allowed for the simultaneous comparison among a large number of countries (unlike
conversion equations), based on a large number of daughters per bull in multiple
countries. MCE also allowed for the prediction of genetic merits on the scale of each
country (Schaeffer, 1985). Furthermore, compared to conversion equations, all
information can be used instead of only information related to animals evaluated at least
in two countries.
Since some assumptions of MCE were unrealistic (Schaeffer, 1994), Schaeffer
(1994) proposed the multiple across country evaluation (MACE), which is a multiple-trait
model for which similar traits in different countries are considered as different traits. In
addition to the advantages of MCE, MACE overcomes the disadvantages. Indeed, MACE
allows for different scales, for different units of measurement, for different heritabilities
and genetic parameters for each country, and for genetic correlations between countries
lower than one. Genetic correlations less than one account for 1) differences between
statistical models used for genetic evaluations in several countries and 2) genotype by
environment interactions. Different rankings of animals in the participating countries can
be therefore observed (especially due to the consideration of genotype by environment
interactions) and the degree of difference among the rankings is dependent on the genetic
correlations among countries (Banos and Sigurdsson, 1996).
The model proposed by Schaeffer (1994) is a sire-maternal grandsire model and is
described for a country i as follows:
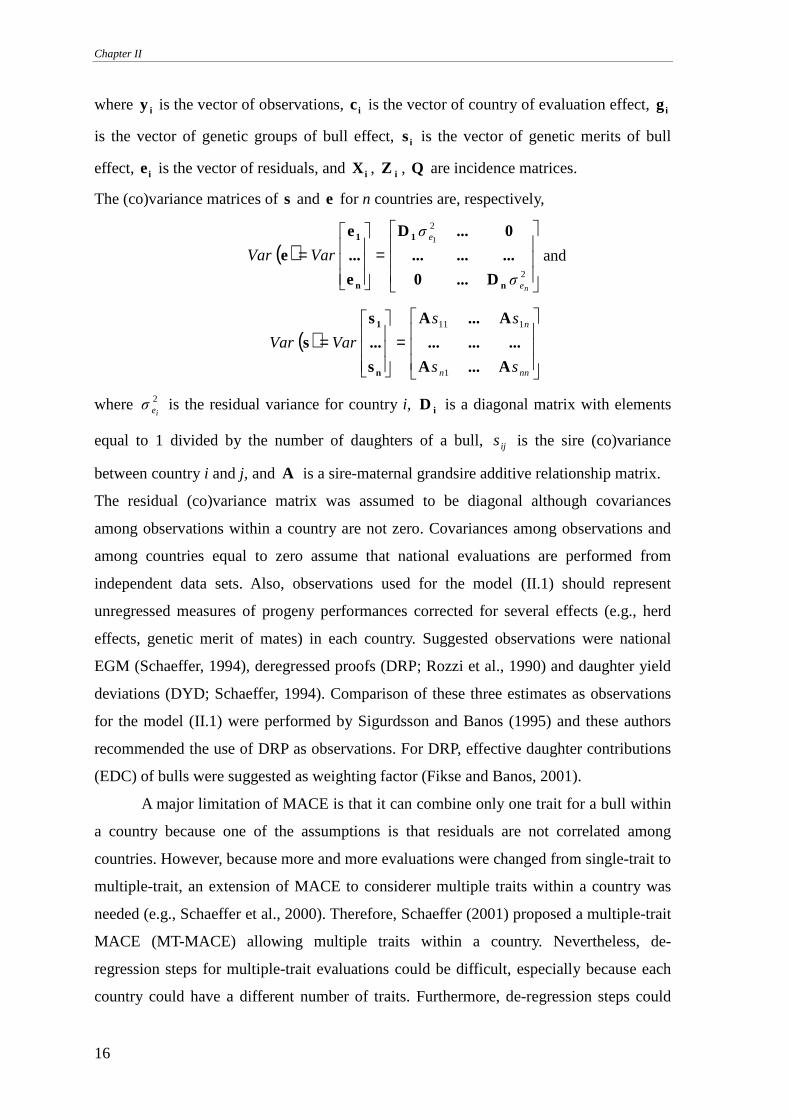
iiiiiiii esZQgZcXy +++= (II.1)
Chapter II
16
where iy is the vector of observations, ic is the vector of country of evaluation effect, ig
is the vector of genetic groups of bull effect, is is the vector of genetic merits of bull
effect, ie is the vector of residuals, and iX , iZ , Q are incidence matrices.
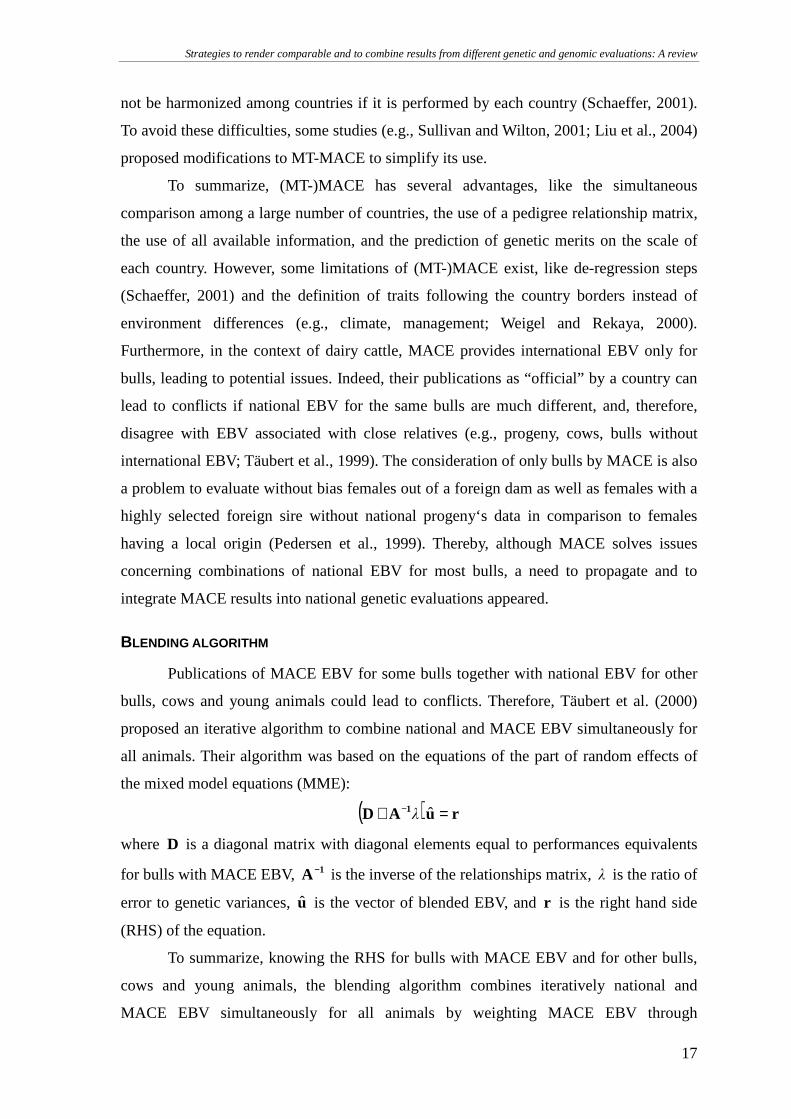
The (co)variance matrices of s and e for n countries are, respectively,
( )
=
=2
2
1
ne
e
σ
σ
VarVar
n
1
n
1
D...0
.........
0...D
e
...
e
e and
( )
=
=
nnn
n
ss
ss
VarVar
A...A
.........
A...A
s
...
s
s
n
1
1
111
where 2
ieσ is the residual variance for country i, iD is a diagonal matrix with elements
equal to 1 divided by the number of daughters of a bull, ijs is the sire (co)variance
between country i and j, and A is a sire-maternal grandsire additive relationship matrix.
The residual (co)variance matrix was assumed to be diagonal although covariances
among observations within a country are not zero. Covariances among observations and
among countries equal to zero assume that national evaluations are performed from
independent data sets. Also, observations used for the model (II.1) should represent
unregressed measures of progeny performances corrected for several effects (e.g., herd
effects, genetic merit of mates) in each country. Suggested observations were national
EGM (Schaeffer, 1994), deregressed proofs (DRP; Rozzi et al., 1990) and daughter yield
deviations (DYD; Schaeffer, 1994). Comparison of these three estimates as observations
for the model (II.1) were performed by Sigurdsson and Banos (1995) and these authors
recommended the use of DRP as observations. For DRP, effective daughter contributions
(EDC) of bulls were suggested as weighting factor (Fikse and Banos, 2001).
A major limitation of MACE is that it can combine only one trait for a bull within
a country because one of the assumptions is that residuals are not correlated among
countries. However, because more and more evaluations were changed from single-trait to
multiple-trait, an extension of MACE to considerer multiple traits within a country was
needed (e.g., Schaeffer et al., 2000). Therefore, Schaeffer (2001) proposed a multiple-trait
MACE (MT-MACE) allowing multiple traits within a country. Nevertheless, de-
regression steps for multiple-trait evaluations could be difficult, especially because each
country could have a different number of traits. Furthermore, de-regression steps could
Strategies to render comparable and to combine results from different genetic and genomic evaluations: A review
17
not be harmonized among countries if it is performed by each country (Schaeffer, 2001).
To avoid these difficulties, some studies (e.g., Sullivan and Wilton, 2001; Liu et al., 2004)
proposed modifications to MT-MACE to simplify its use.
To summarize, (MT-)MACE has several advantages, like the simultaneous
comparison among a large number of countries, the use of a pedigree relationship matrix,
the use of all available information, and the prediction of genetic merits on the scale of
each country. However, some limitations of (MT-)MACE exist, like de-regression steps
(Schaeffer, 2001) and the definition of traits following the country borders instead of
environment differences (e.g., climate, management; Weigel and Rekaya, 2000).
Furthermore, in the context of dairy cattle, MACE provides international EBV only for
bulls, leading to potential issues. Indeed, their publications as “official” by a country can
lead to conflicts if national EBV for the same bulls are much different, and, therefore,
disagree with EBV associated with close relatives (e.g., progeny, cows, bulls without
international EBV; Täubert et al., 1999). The consideration of only bulls by MACE is also
a problem to evaluate without bias females out of a foreign dam as well as females with a
highly selected foreign sire without national progeny‘s data in comparison to females
having a local origin (Pedersen et al., 1999). Thereby, although MACE solves issues
concerning combinations of national EBV for most bulls, a need to propagate and to
integrate MACE results into national genetic evaluations appeared.
BLENDING ALGORITHM
Publications of MACE EBV for some bulls together with national EBV for other
bulls, cows and young animals could lead to conflicts. Therefore, Täubert et al. (2000)
proposed an iterative algorithm to combine national and MACE EBV simultaneously for
all animals. Their algorithm was based on the equations of the part of random effects of
the mixed model equations (MME):
( ) ruAD 1 =+ − ˆ λ
where D is a diagonal matrix with diagonal elements equal to performances equivalents
for bulls with MACE EBV, 1A − is the inverse of the relationships matrix, λ is the ratio of
error to genetic variances, u is the vector of blended EBV, and r is the right hand side
(RHS) of the equation.
To summarize, knowing the RHS for bulls with MACE EBV and for other bulls,
cows and young animals, the blending algorithm combines iteratively national and
MACE EBV simultaneously for all animals by weighting MACE EBV through
Chapter II
18
performances equivalents. Täubert et al. (2000) observed that blended EBV of progeny of
bulls were influenced in the same way as those of their sires and that conflicts were
solved.
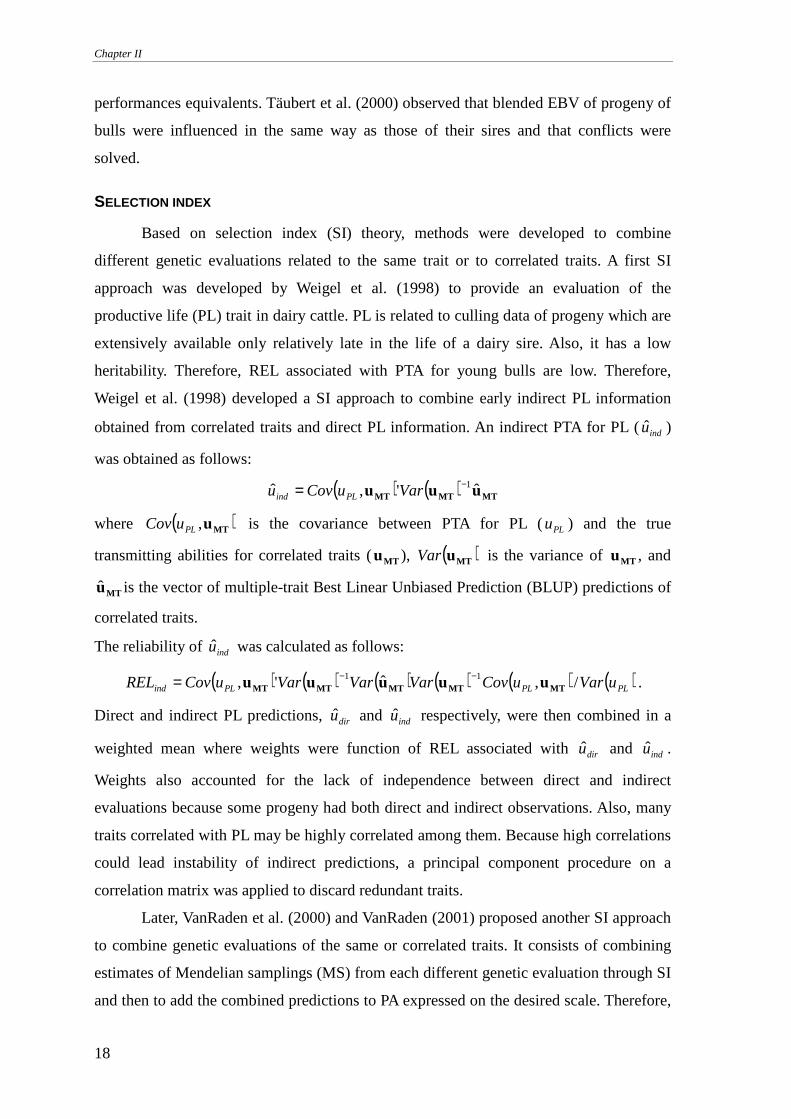
SELECTION INDEX
Based on selection index (SI) theory, methods were developed to combine
different genetic evaluations related to the same trait or to correlated traits. A first SI
approach was developed by Weigel et al. (1998) to provide an evaluation of the
productive life (PL) trait in dairy cattle. PL is related to culling data of progeny which are
extensively available only relatively late in the life of a dairy sire. Also, it has a low
heritability. Therefore, REL associated with PTA for young bulls are low. Therefore,
Weigel et al. (1998) developed a SI approach to combine early indirect PL information
obtained from correlated traits and direct PL information. An indirect PTA for PL (indu )
was obtained as follows:
( ) ( ) MTMTMT uuu ˆ',ˆ 1−= VaruCovu PLind
where ( )MTu,PLuCov is the covariance between PTA for PL (PLu ) and the true
transmitting abilities for correlated traits (MTu ), ( )MTuVar is the variance of MTu , and
MTu is the vector of multiple-trait Best Linear Unbiased Prediction (BLUP) predictions of
correlated traits.
The reliability of indu was calculated as follows:
( ) ( ) ( ) ( ) ( ) ( )PLPLPLind uVaruCovVarVarVaruCovREL /,ˆ', 11MTMTMTMTMT uuuuu −−= .
Direct and indirect PL predictions, diru and indu respectively, were then combined in a
weighted mean where weights were function of REL associated with diru and indu .
Weights also accounted for the lack of independence between direct and indirect
evaluations because some progeny had both direct and indirect observations. Also, many
traits correlated with PL may be highly correlated among them. Because high correlations
could lead instability of indirect predictions, a principal component procedure on a
correlation matrix was applied to discard redundant traits.
Later, VanRaden et al. (2000) and VanRaden (2001) proposed another SI approach
to combine genetic evaluations of the same or correlated traits. It consists of combining
estimates of Mendelian samplings (MS) from each different genetic evaluation through SI
and then to add the combined predictions to PA expressed on the desired scale. Therefore,
Strategies to render comparable and to combine results from different genetic and genomic evaluations: A review
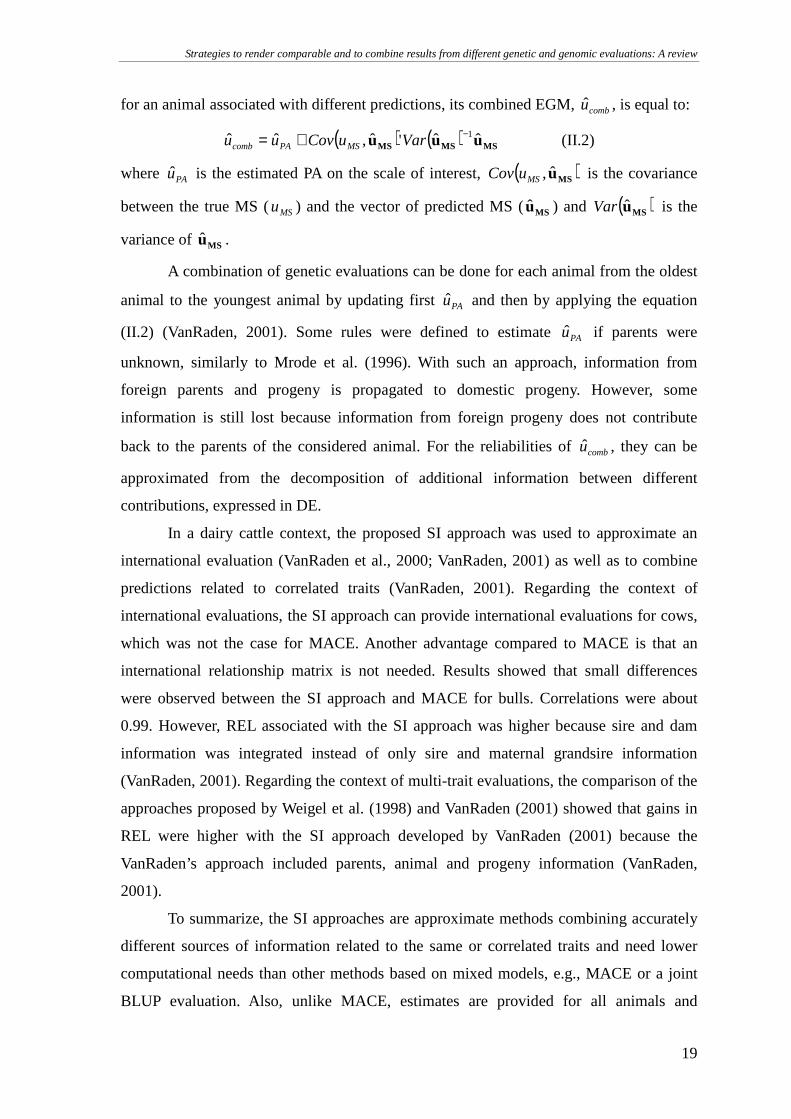
19
for an animal associated with different predictions, its combined EGM, combu , is equal to:
( ) ( ) MSMSMS uuu ˆˆ'ˆ,ˆˆ 1−+= VaruCovuu MSPAcomb (II.2)
where PAu is the estimated PA on the scale of interest, ( )MSu,MSuCov is the covariance
between the true MS (MSu ) and the vector of predicted MS (MSu ) and ( )MSuVar is the
variance of MSu .
A combination of genetic evaluations can be done for each animal from the oldest
animal to the youngest animal by updating first PAu and then by applying the equation
(II.2) (VanRaden, 2001). Some rules were defined to estimate PAu if parents were
unknown, similarly to Mrode et al. (1996). With such an approach, information from
foreign parents and progeny is propagated to domestic progeny. However, some
information is still lost because information from foreign progeny does not contribute
back to the parents of the considered animal. For the reliabilities of combu , they can be
approximated from the decomposition of additional information between different
contributions, expressed in DE.
In a dairy cattle context, the proposed SI approach was used to approximate an
international evaluation (VanRaden et al., 2000; VanRaden, 2001) as well as to combine
predictions related to correlated traits (VanRaden, 2001). Regarding the context of
international evaluations, the SI approach can provide international evaluations for cows,
which was not the case for MACE. Another advantage compared to MACE is that an
international relationship matrix is not needed. Results showed that small differences
were observed between the SI approach and MACE for bulls. Correlations were about
0.99. However, REL associated with the SI approach was higher because sire and dam
information was integrated instead of only sire and maternal grandsire information
(VanRaden, 2001). Regarding the context of multi-trait evaluations, the comparison of the
approaches proposed by Weigel et al. (1998) and VanRaden (2001) showed that gains in
REL were higher with the SI approach developed by VanRaden (2001) because the
VanRaden’s approach included parents, animal and progeny information (VanRaden,
2001).
To summarize, the SI approaches are approximate methods combining accurately
different sources of information related to the same or correlated traits and need lower
computational needs than other methods based on mixed models, e.g., MACE or a joint
BLUP evaluation. Also, unlike MACE, estimates are provided for all animals and
Chapter II
20
information provided by cows is considered. However, the SI approaches may not take
the different effects of selection into account as correctly as a joint evaluation (VanRaden,
2001).
SIMULTANEOUS COMBINATIONS
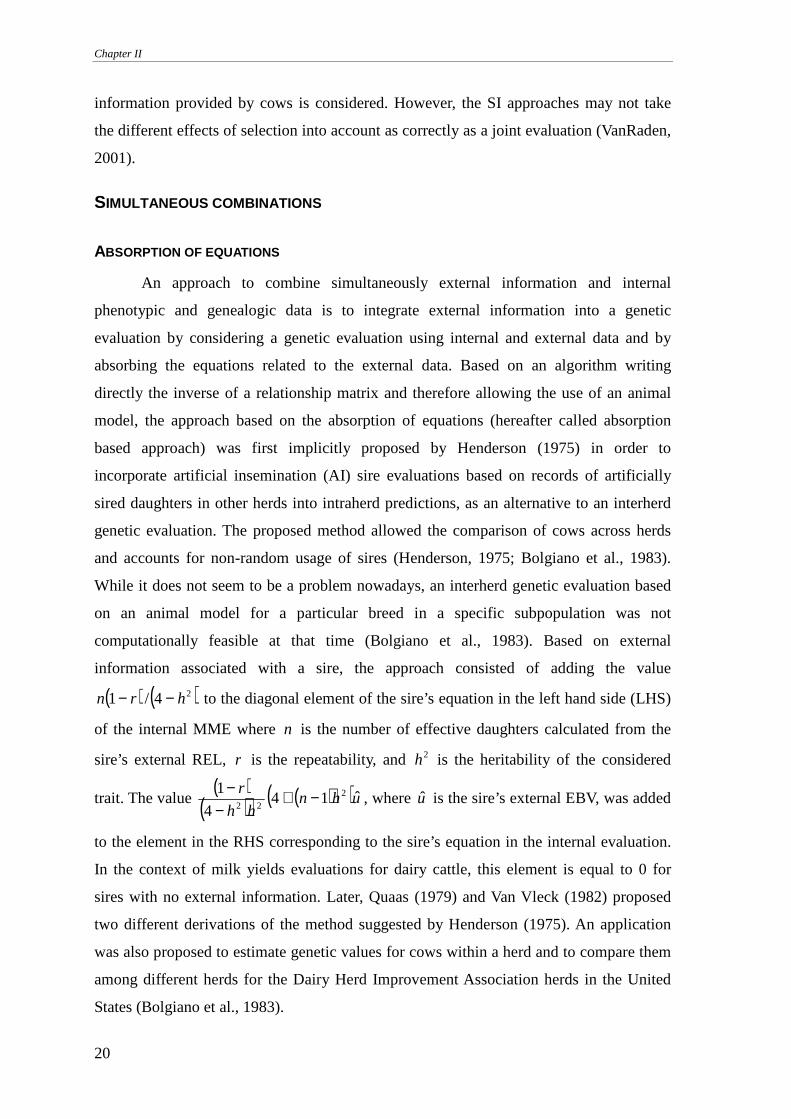
ABSORPTION OF EQUATIONS
An approach to combine simultaneously external information and internal
phenotypic and genealogic data is to integrate external information into a genetic
evaluation by considering a genetic evaluation using internal and external data and by
absorbing the equations related to the external data. Based on an algorithm writing
directly the inverse of a relationship matrix and therefore allowing the use of an animal
model, the approach based on the absorption of equations (hereafter called absorption
based approach) was first implicitly proposed by Henderson (1975) in order to
incorporate artificial insemination (AI) sire evaluations based on records of artificially
sired daughters in other herds into intraherd predictions, as an alternative to an interherd
genetic evaluation. The proposed method allowed the comparison of cows across herds
and accounts for non-random usage of sires (Henderson, 1975; Bolgiano et al., 1983).
While it does not seem to be a problem nowadays, an interherd genetic evaluation based
on an animal model for a particular breed in a specific subpopulation was not
computationally feasible at that time (Bolgiano et al., 1983). Based on external
information associated with a sire, the approach consisted of adding the value
( ) ( )24/1 hrn −− to the diagonal element of the sire’s equation in the left hand side (LHS)
of the internal MME where n is the number of effective daughters calculated from the
sire’s external REL, r is the repeatability, and 2h is the heritability of the considered
trait. The value ( )
( ) ( )( )uhnhh
rˆ14
4
1 222
−+−
−, where u is the sire’s external EBV, was added
to the element in the RHS corresponding to the sire’s equation in the internal evaluation.
In the context of milk yields evaluations for dairy cattle, this element is equal to 0 for
sires with no external information. Later, Quaas (1979) and Van Vleck (1982) proposed
two different derivations of the method suggested by Henderson (1975). An application
was also proposed to estimate genetic values for cows within a herd and to compare them
among different herds for the Dairy Herd Improvement Association herds in the United
States (Bolgiano et al., 1983).
Strategies to render comparable and to combine results from different genetic and genomic evaluations: A review
21
To summarize, the absorption based approach is straightforward to incorporate
external information of sires into an intraherd genetic evaluation and to propagate this
information to sires’ progeny in the considered herd. However, although approximations
were proposed for more complicated cases (Henderson, 1975; Van Vleck, 1982), this
method is difficult to generalize (Quaas and Zhang, 2006). Furthermore, the approach
assumes that external information is expressed as deviation from the genetic merit of the
base population, which could not be a trivial problem (Henderson, 1975).
PSEUDO-RECORDS
Bonaiti and Boichard (1995) proposed a method that includes external information
into an internal genetic evaluation for dairy cattle using a single-trait animal model. This
method consists of adding a number of virtual daughters for each bull associated with
external information to the internal phenotypic and pedigree datasets. The second parents
of the virtual daughters are assumed to be unknown and belonged to a genetic group
which is related to the a-factor of the conversion equation. Each additional virtual
daughter is associated with a pseudo-record representing the genetic merit of the bull.
Pseudo-records could be DYD or DRP derived from external EBV of the bulls (Bonaiti
and Boichard, 1995). Because external information of related bulls could be included in
the internal evaluation, double counting of contributions due to relationships could
appear. Therefore, the number of additional virtual daughters for the ith external animal is
equivalent to the number of DE computed from external REL of the ith animal subtracted
by the number of DE associated with its external pedigree index. The subtraction is
needed to avoid double counting of contributions due relationships. One limitation of this
method is that pseudo-records are assumed to belong to the same trait as the internal
phenotypes. Thereby, DYD or EBV must be first converted to the internal unit and scale,
e.g., with conversion equations, before their inclusion in the internal genetic evaluation. It
is noted that Bonaiti and Boichard (1995) showed the similarities of their proposed
pseudo-records based approach with the absorption based approach (Henderson, 1975). It
is also noted that the effect of external information will never be zero, although the weight
for external information of an animal decreases when more and more internal data is
collected (Pedersen et al., 1999).
Pedersen et al. (1999) applied the pseudo-records based approach proposed by
Bonaiti and Boichard (1995) in the context of the Danish genetic evaluation for Holsteins,
Jerseys and Red Danish cattle. External information included MACE EBV and REL,
Chapter II
22
provided by International Bull Service (Interbull, Uppsala, Sweden), for sires and, for
cows, external EBV and REL provided by the country of origin. Before the inclusion,
external EBV for cows were converted to the Danish scale. Also, REL were restricted to a
maximum of 80% for MACE EBV for sires and were assumed to be equal to 30% for
converted external EBV for external cows. Such restrictions could limit double counting
of Danish information. The authors concluded that including external information in the
Danish evaluation led to avoid differences between national and MACE EBV and to the
possible comparison of females with local or external origins.
Based on a pseudo-records based approach, VanRaden (2012), VanRaden and
Tooker (2012) and VanRaden et al. (2014) proposed to include MACE information in an
internal genetic evaluation by using one pseudo-record for each bull weighted by DE,
instead of one pseudo-record for each virtual daughter. The pseudo-records were
expressed as DRP and were estimated using a one-animal-at-a-time deregression method,
similarly to Bonaiti and Boichard (1995). Because MACE information associated with
bulls that have internal and external daughters include contributions from both internal
and external information, VanRaden et al. (2014) proposed to use internal EBV instead of
PA to compute DRP for those bulls and to subtract internal DE from the total amount of
DE associated with MACE EBV in order to estimate the amount of external DE. Double
counting of internal information was therefore avoided. For multiple-trait models,
VanRaden et al. (2014) proposed to adapt their approach by adding, for each ith external
animal, the product 0.5VRi
10
0.5VRi ∆G∆
− to the ith external animal’s elements of the LHS where
VRi∆ is a diagonal matrix associated to the ith external animal with a diagonal element for
the jth trait equal to ( )ijij RELREL −1 , ijREL is the reliability of ith external animal for
the jth trait, and 0G is the genetic (co)variance matrix among traits. The product
di0.5VRi
10
0.5VRi )y∆G(∆ − is also added to the ith external animal’s elements of the RHS where
diy is the vector that includes DRP for each trait for the ith external animal. VanRaden
and Tooker (2012) tested their approach on US Holstein data and concluded that their
approach was simple and enough accurate to include external information into national
evaluations. While this approach showed similarities with the absorption based method
proposed by Henderson (1975) for univariate analyses, results from these two approaches
could differ in practice because the computation of DRP and their consideration into the
MME are different between the two approaches.
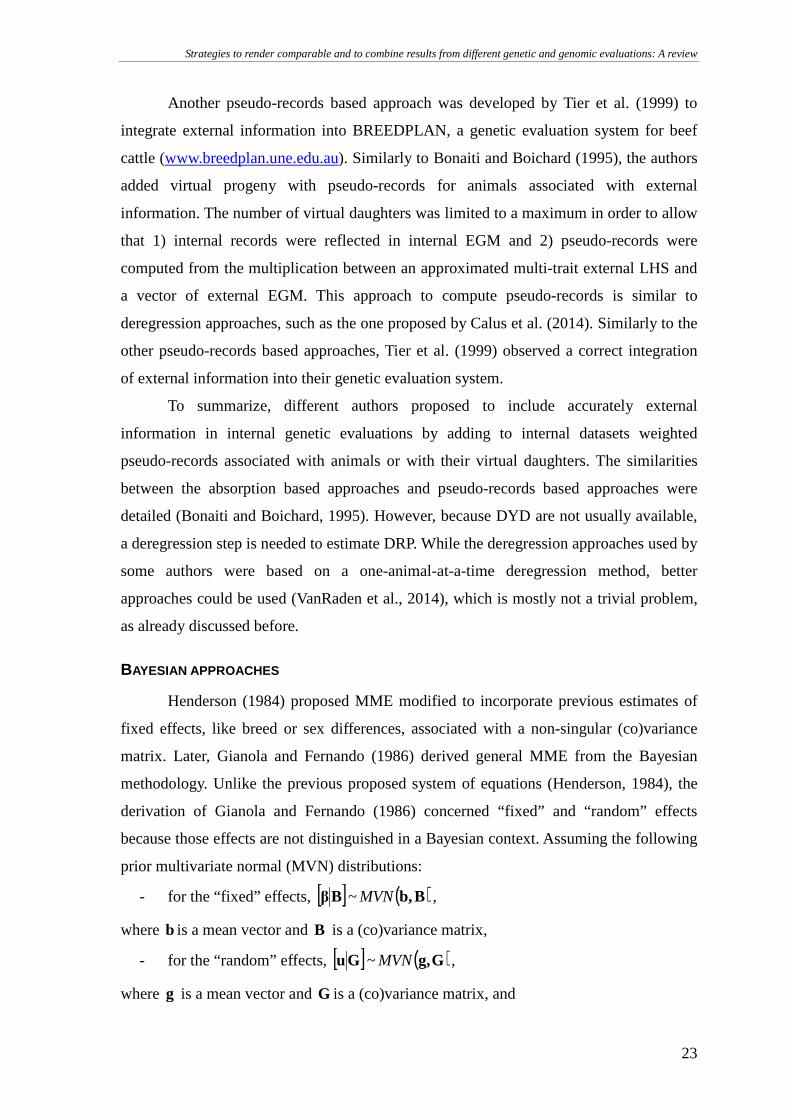
Strategies to render comparable and to combine results from different genetic and genomic evaluations: A review
23
Another pseudo-records based approach was developed by Tier et al. (1999) to
integrate external information into BREEDPLAN, a genetic evaluation system for beef
cattle (www.breedplan.une.edu.au). Similarly to Bonaiti and Boichard (1995), the authors
added virtual progeny with pseudo-records for animals associated with external
information. The number of virtual daughters was limited to a maximum in order to allow
that 1) internal records were reflected in internal EGM and 2) pseudo-records were
computed from the multiplication between an approximated multi-trait external LHS and
a vector of external EGM. This approach to compute pseudo-records is similar to
deregression approaches, such as the one proposed by Calus et al. (2014). Similarly to the
other pseudo-records based approaches, Tier et al. (1999) observed a correct integration
of external information into their genetic evaluation system.
To summarize, different authors proposed to include accurately external
information in internal genetic evaluations by adding to internal datasets weighted
pseudo-records associated with animals or with their virtual daughters. The similarities
between the absorption based approaches and pseudo-records based approaches were
detailed (Bonaiti and Boichard, 1995). However, because DYD are not usually available,
a deregression step is needed to estimate DRP. While the deregression approaches used by
some authors were based on a one-animal-at-a-time deregression method, better
approaches could be used (VanRaden et al., 2014), which is mostly not a trivial problem,
as already discussed before.
BAYESIAN APPROACHES
Henderson (1984) proposed MME modified to incorporate previous estimates of
fixed effects, like breed or sex differences, associated with a non-singular (co)variance
matrix. Later, Gianola and Fernando (1986) derived general MME from the Bayesian
methodology. Unlike the previous proposed system of equations (Henderson, 1984), the
derivation of Gianola and Fernando (1986) concerned “fixed” and “random” effects
because those effects are not distinguished in a Bayesian context. Assuming the following
prior multivariate normal (MVN) distributions:
- for the “fixed” effects, [ ]Bβ ~ ( )Bb,MVN ,
where b is a mean vector and B is a (co)variance matrix,
- for the “random” effects, [ ]Gu ~ ( )Gg,MVN ,
where g is a mean vector and G is a (co)variance matrix, and
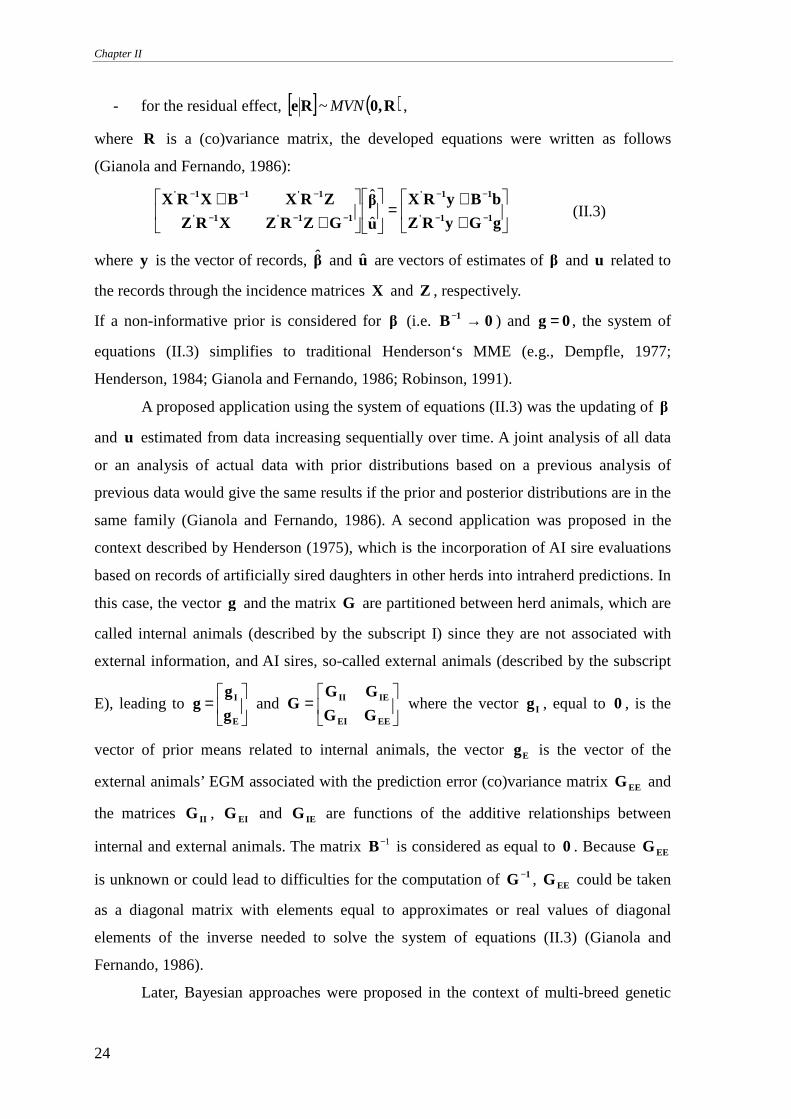
Chapter II
24
- for the residual effect, [ ]Re ~ ( )R0,MVN ,
where R is a (co)variance matrix, the developed equations were written as follows
(Gianola and Fernando, 1986):
++
=
++
−−
−−
−−−
−−−
gGyRZ
bByRX
u
β
GZRZXRZ
ZRXBXRX11'
11'
11'1'
1'11'
ˆ
ˆ (II.3)
where y is the vector of records, β and u are vectors of estimates of β and u related to
the records through the incidence matrices X and Z , respectively.
If a non-informative prior is considered for β (i.e. 0B 1 →− ) and 0g = , the system of
equations (II.3) simplifies to traditional Henderson‘s MME (e.g., Dempfle, 1977;
Henderson, 1984; Gianola and Fernando, 1986; Robinson, 1991).
A proposed application using the system of equations (II.3) was the updating of β
and u estimated from data increasing sequentially over time. A joint analysis of all data
or an analysis of actual data with prior distributions based on a previous analysis of
previous data would give the same results if the prior and posterior distributions are in the
same family (Gianola and Fernando, 1986). A second application was proposed in the
context described by Henderson (1975), which is the incorporation of AI sire evaluations
based on records of artificially sired daughters in other herds into intraherd predictions. In
this case, the vector g and the matrix G are partitioned between herd animals, which are
called internal animals (described by the subscript I) since they are not associated with
external information, and AI sires, so-called external animals (described by the subscript
E), leading to
=
E
I
g
gg and
=
EEEI
IEII
GG
GGG where the vector Ig , equal to 0 , is the
vector of prior means related to internal animals, the vector Eg is the vector of the
external animals’ EGM associated with the prediction error (co)variance matrix EEG and
the matrices IIG , EIG and IEG are functions of the additive relationships between
internal and external animals. The matrix 1−B is considered as equal to 0 . Because EEG
is unknown or could lead to difficulties for the computation of 1G − , EEG could be taken
as a diagonal matrix with elements equal to approximates or real values of diagonal
elements of the inverse needed to solve the system of equations (II.3) (Gianola and
Fernando, 1986).
Later, Bayesian approaches were proposed in the context of multi-breed genetic
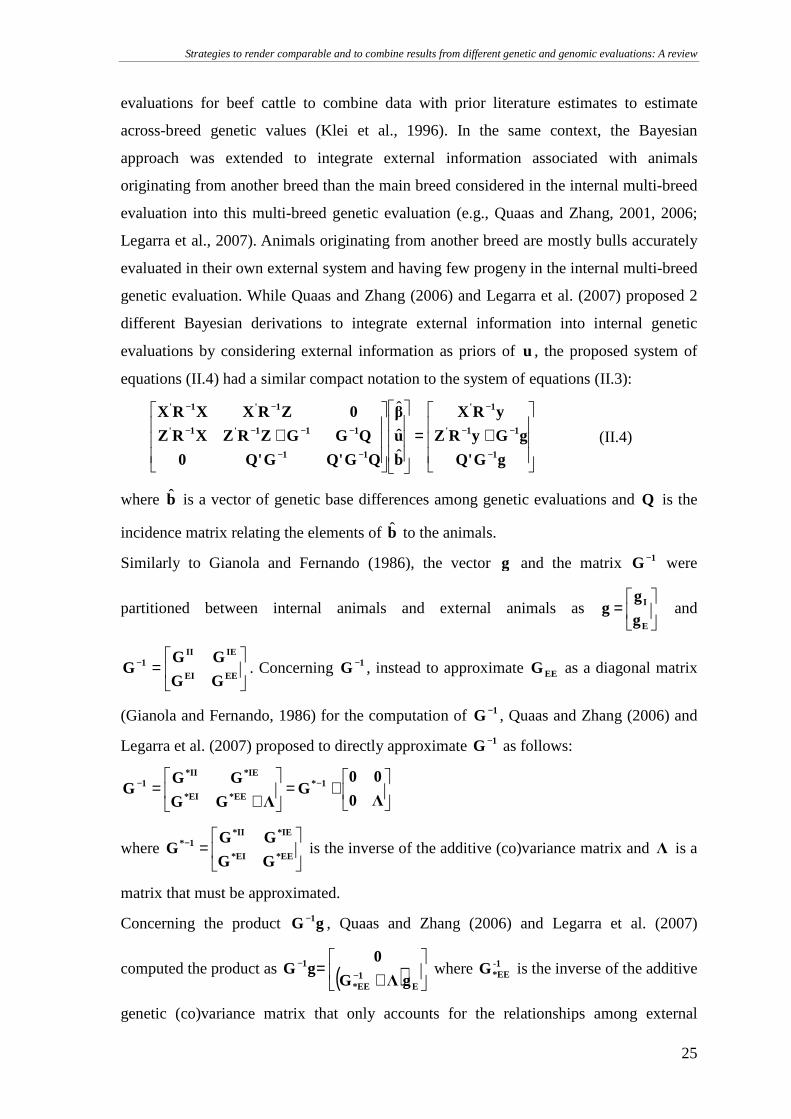
Strategies to render comparable and to combine results from different genetic and genomic evaluations: A review
25
evaluations for beef cattle to combine data with prior literature estimates to estimate
across-breed genetic values (Klei et al., 1996). In the same context, the Bayesian
approach was extended to integrate external information associated with animals
originating from another breed than the main breed considered in the internal multi-breed
evaluation into this multi-breed genetic evaluation (e.g., Quaas and Zhang, 2001, 2006;
Legarra et al., 2007). Animals originating from another breed are mostly bulls accurately
evaluated in their own external system and having few progeny in the internal multi-breed
genetic evaluation. While Quaas and Zhang (2006) and Legarra et al. (2007) proposed 2
different Bayesian derivations to integrate external information into internal genetic
evaluations by considering external information as priors of u , the proposed system of
equations (II.4) had a similar compact notation to the system of equations (II.3):
+=
+−
−−
−
−−
−−−−
−−
gGQ'
gGyRZ
yRX
b
u
β
QGQ'GQ'0
QGGZRZXRZ
0ZRXXRX
1
11'
1'
11
111'1'
1'1'
ˆˆ
ˆ
(II.4)
where b is a vector of genetic base differences among genetic evaluations and Q is the
incidence matrix relating the elements of b to the animals.
Similarly to Gianola and Fernando (1986), the vector g and the matrix 1G − were
partitioned between internal animals and external animals as
=
E
I
g
gg and
=−
EEEI
IEII1
GG
GGG . Concerning 1G − , instead to approximate EEG as a diagonal matrix
(Gianola and Fernando, 1986) for the computation of 1G − , Quaas and Zhang (2006) and
Legarra et al. (2007) proposed to directly approximate 1G − as follows:
+=
+= −−
Λ0
00G
ΛGG
GGG 1*
EE*EI*
*IE*II1
where
=−
*EE*EI
*IE*II1*
GG
GGG is the inverse of the additive (co)variance matrix and Λ is a
matrix that must be approximated.
Concerning the product gG 1− , Quaas and Zhang (2006) and Legarra et al. (2007)
computed the product as ( )
+= −
−
E1EE*
1
gΛG
0gG where -1
EE*G is the inverse of the additive
genetic (co)variance matrix that only accounts for the relationships among external
Chapter II
26
animals. The differences between the two Bayesian approaches (Quaas and Zhang, 2006;
Legarra et al., 2007) concern mainly the calculations of the matrix Λ . Legarra et al.
(2007) considered the matrix Λ as a diagonal variance matrix and computed the diagonal
elements of Λ as the difference between the diagonal elements of the prediction error
(co)variance matrix and the diagonal elements of 1EE*G − . Quaas and Zhang (2006)
considered Λ as a block diagonal variance matrix with one block per external animal.
Block diagonals for the ith animal were equal to Qi1
0Qi ∆G∆− where the matrix 0G is a
matrix of genetic (co)variances among traits. The matrix Qi∆ is a diagonal matrix with
elements ijδ equal to )REL(REL ijij −1 , where ijREL is the reliability for the jth trait of
ith external animal. It is noted that the block elements of the matrix Λ computed by
Quaas and Zhang (2006) are equivalent to the elements computed by VanRaden et al.
(2014) and added to the external animal’s elements of the LHS ( i.e., 0.5VRi
10
0.5VRi ∆G∆
− ).
Based on Legarra et al. (2007), an application to integrate MACE information for
Holstein bulls into an internal dairy cattle genetic evaluation was proposed (Gengler and
Vanderick, 2008). However, some limitations concern the proposed Bayesian approaches.
Firstly, the proposed approaches did not take into account several double counting of
contributions, e.g., due to relationships among external animals and due to records.
Indeed, an EBV of an animal combines information from its own records (i.e.,
contributions due to own records) and from records of all relatives through its parents and
its progeny (i.e., contributions due to relationships; VanRaden, 2001; Misztal and
Wiggans, 1988). Therefore, integration of EBV for relatives can lead to counting several
times the same contributions due to relationships and biases the internal genetic
evaluation. Double counting of contributions due to records could appear if external
information resulted from an external evaluation that combined both external and internal
records. In this case, some contributions due to records would be considered several times
if external information was combined with internal records. To our knowledge, in the
context of Bayesian approaches, double counting of contributions due to relationships
received very little consideration (e.g., Jones and Goddard, 1990). Only Gengler and
Vanderick (2008) proposed an additional pre-processing step to avoid double counting of
contributions due to records, despite the fact that this issue could be a major issue for
common sources of external information (e.g., MACE information). Secondly, the
proposed Bayesian approaches were developed to take differences among genetic bases
Strategies to render comparable and to combine results from different genetic and genomic evaluations: A review
27
into account. However, Legarra et al. (2007) assumed that differences among genetic
bases were equal to zero to improve software’s performances. Furthermore, in addition to
be expressed on a different genetic base, external information may be also expressed in
other scales or units of measurement than the internal ones. For example, in the context of
dairy cattle, it was noted that EBV are mostly reported as the average of lactation yields
for three lactations while genetic evaluations are mostly based on test-day models
(Gengler and Vanderick, 2008). Thereby, approaches must be developed to avoid these
issues, similarly to other approaches detailed previously. Thirdly, in many situations,
integration of several sources of external information into an internal genetic evaluation
may be needed, although, to our knowledge, it has not been studied yet. Fourthly, the
derivations of Legarra et al. (2007) and Quaas and Zhang (2006) assumed that external
information came from a similar theoretical genetic evaluation, which is not necessarily
the case.
To summarize, Bayesian approaches based on MME were one of the first
approaches proposed to combine simultaneously external information and internal data.
Different advantages may be observed as the avoidance of an explicit deregression step or
the possibility to avoid high computational needs to estimate breeding values from data
accumulating over time. However, Bayesian approaches integrating external information
are not commonly used in animal breeding and several issues must be studied.
Furthermore, most of current software packages available in animal breeding do not
permit the application of, for example, the system of equations (II.3).
COMBINATIONS IN GENOMIC SELECTION
Currently, genomic information provided by panels of several thousands of single
nucleotide polymorphisms (SNP) can be used following multi-step or single-step
approaches. The multi-step approaches (e.g., VanRaden et al., 2009) consist of 1)
estimating SNP effects based on (pseudo-)phenotypic data related to non-candidate
genotyped animals, 2) calculating estimates of genetic merit (mostly called direct
genomic values (DGV)) for candidate genotyped animals based on estimates of SNP
effects and 3) combining genomic information, expressed as DGV, with traditional EBV
(i.e., EBV estimated only from phenotypic and genealogic data) or with phenotypic and
genealogical data. Following the traits and their availability, (pseudo-)phenotypic data
may include traditional phenotypic records, DYD or DRP. The third step is necessary to
avoid the publication of several EGM per animal and shows the need of approaches and
Chapter II
28
algorithms to combine EGM originating from diverse sources. The single-step approaches
consist of replacing the traditional pedigree-based relationship matrix used in MME by a
relationship matrix combining pedigree-based relationships and genomic relationships
(Aguilar et al., 2010; Christensen and Lund, 2010). However, unlike the multi-step
approaches allowing for the combination of genomic information with external
information, single-step approaches do not allow for the integration of external
information, like traditional MME. Therefore, for both approaches, methods and
algorithms were developed to combine internal, external and genomic information. Most
approaches and algorithms were derived from approaches already detailed previously and,
therefore, will not be detailed extensively.
For the multi-step approaches, proposed methods concerned the combination of
DGV with traditional EBV or phenotypic and genealogical data. Regarding the
combination of DGV and EBV, a first class of approaches is based on SI theory (e.g.,
VanRaden et al., 2009; Harris and Johnson, 2010). The SI approaches are mostly used in a
dairy cattle context. A second class of approaches combining DGV and EBV is based on
bivariate (random) models (Mäntysaari and Strandén, 2010). Phenotypic data included
DYD for conventional phenotypic and genealogic information and DGV as pseudo-
records for genomic information. Heritability associated with DGV was assumed to be
(close to) 1 and genetic correlation between DYD and DGV was assumed to be equal to
the square root of the predictive ability of DGV. Regarding the combination of DGV and
conventional phenotypic and genealogic data, different approaches were proposed.
Similarly to Bonaiti and Boichard (1995), the first ones consisted of calculating pseudo-
records and associated weights from DGV and associated REL and to include them in the
conventional dataset considering pseudo-records as own records and from the same trait
(Ducrocq and Liu, 2009; Liu et al., 2009; Ducrocq and Patry, 2010). Therefore, it was
assumed that genomic and conventional information had the same genetic variance. A
second class of approaches consisted of calculating pseudo-records and associated
weights from DGV and including them in conventional genetic evaluation as a correlated
trait. Similarly to Mäntysaari and Strandén (2010), DGV were considered as pseudo-
records with a heritability equal or close to 1 by some authors (e.g., Kachman, 2008;
Johnston et al., 2009; Špehar et al., 2013; Stoop et al., 2013). Contrarily to these authors,
Stoop et al. (2011) proposed to include pseudo-records derived from DGV with an
heritability equal to the predictive reliability of the prediction equation and with a genetic
correlation with the trait of interest equal to 1. A mass-selection model was considered for
Strategies to render comparable and to combine results from different genetic and genomic evaluations: A review
29
the pseudo-records. Finally, Bayesian approaches were also proposed to integrate DGV
into conventional evaluations. In the context of dairy cattle, Gengler and Verkenne (2007)
proposed to consider DGV as prior information for polynomials of order 0 associated
with random polygenic additive effects (0u ) of a multi-trait multi-lactation test-day
model. It was assumed that ( ) DGV0 uu =E and ( ) 000 Gu =Var where ( ) DGV0 uu =E is the
vector of DGV and 00G is the additive genetic (co)variance matrix associated with 0u .
Reliabilities associated with DGV were not considered. In the context of beef cattle, DGV
and associated REL were integrated into a multibreed genetic evaluation following the
approach proposed by Quaas and Zhang (2006; Hyde et al., 2013). Their results showed
that this approach can lead to inappropriate scaling of DGV or double counting of
contributions between DGV and conventional data.
For the single-step evaluations, approaches concern integration of external
polygenic information into single-step genomic evaluations, instead of combination or
integration of genomic information into conventional genetic evaluations. To our
knowledge, proposed approaches integrating external information into single-step
genomic evaluations were only pseudo-records based approaches (VanRaden, 2012;
Přibyl et al., 2013). These approaches were developed to integrate MACE EBV in a dairy
cattle context by taking into account possible double counting of contributions among
different sources. Only one pseudo-record and associated weight per animal was derived
from external information and added to the conventional data.
At an international level, in the dairy cattle context, possible exchange of
genotypes and predicted maker/SNP effects could lead to internal genomic evaluations
dependent from each other while an assumption for MACE is that internal information
originates from independent datasets. Therefore, a modified MACE, so called genomic
MACE (GMACE), was developed to avoid this assumption, i.e., to account for non-zero
residual correlations among genomic predictions across countries. GMACE was also
extended to an animal model because genomic information associated with cows is
increasing. GMACE is still under development (Sullivan and VanRaden, 2009; Sullivan
and Jakobsen, 2014).
DISCUSSION AND CONCLUSION
This review highlights different approaches and algorithms that render genetic
evaluations originating from different sources comparable or that combine these
Chapter II
30
evaluations to a single one. Each approach or algorithm was developed in a particular
context (e.g., in a dairy cattle context) to solve the same common issue, that is the
impossibility to run a joint genetic evaluation due to political roadblocks, inconsistencies
among datasets, computing or logistic problems. It was also worth noting that some
approaches, like MACE, SI and Bayesian approaches or pseudo-records based
approaches, were extended to other contexts (e.g., the genomic context). All approaches
and algorithms were sorted following the way external information was combined.
Firstly, external information can be combined with internal EGM and REL after
performing internal evaluations. Advantages of post evaluation combinations are that 1)
internal evaluations can be performed without being dependent on the publication of
external information and 2) internal EGM and REL may be used to develop conversion
equations without running additional evaluations free of external evaluations. In an
international context, internal information free of external information is also a condition
to perform unbiased MACE. However, these advantages could also be a disadvantage
because external information does not contribute to the estimation of fixed and other
random effects in the internal evaluation, which could create potential biases.
Secondly, external information can be simultaneously combined with internal
genealogical and phenotypic data into an internal genetic evaluation. Under some
assumptions, it was previously shown that the absorption based approaches and the
pseudo-records based approaches are equivalent. A similar other type of approaches that
simultaneously combine external information and internal data are the Bayesian
approaches, also previously described. Differences observed among results are due to
approximations applied according to the considered approach. Differences are also
observed regarding their implementations. Bayesian and pseudo-records based
approaches could be generalized more easily than absorption based approaches. Also,
absorption based approaches and Bayesian approaches are not dependent of an explicit
deregression step. However, an advantage of all the simultaneous combinations
approaches is that external information contributes to the estimation of all effects included
in the internal evaluation. Therefore, contributions due to external information are
propagated to all animals included in the internal evaluation and related to animals
associated with external information. Another advantage is that only one process is
needed to combine all available information. A disadvantage is that internal evaluations
must be performed after the publications of external information. Another disadvantage is
that additional internal evaluations which do not integrate external evaluations must be
Strategies to render comparable and to combine results from different genetic and genomic evaluations: A review
31
performed if, for example, conversion equations must be developed.
Finally, for both kinds of approaches and methods, external information must be
studied carefully to avoid mainly bias of internal information and double counting of
contributions due to relationships among external animals and due to same records.
Furthermore, conversion equations seem to be still needed for most approaches to convert
external information on the scale, units of measurement and genetic base of the internal
populations. Approaches based on conversion equations are thus dependent on them. Few
approaches, like MACE, proposed solutions to this issue through the use of genetic
correlations between external and internal information. To our knowledge, most
approaches, like Bayesian or pseudo-records based approaches, could use similar
solutions to avoid the use of conversion equations and to be independent on them.
To conclude, a joint genetic evaluation would be preferred in comparison to
approximated combinations of external information and internal information or datasets.
However, although high performance computing facilities are more and more available,
joint evaluations cannot be performed mostly due to political issues. Therefore,
development of approaches and algorithms combining several sources of information are
still needed and must be still studied given all assumptions and issues described
previously.
REFERENCES
Aguilar, I., I. Misztal, D.L. Johnson, A. Legarra, S. Tsuruta, and T.J. Lawlor. 2010. Hot
topic: A unified approach to utilize phenotypic, full pedigree, and genomic
information for genetic evaluation of Holstein final score. J. Dairy Sci. 93:743–
752.
Banos, G., and A. Sigurdsson. 1996. Application of contemporary methods for the use of
international data in national genetic evaluations. J. Dairy Sci. 79:1117–1125.
Bolgiano, D.C., R.L. Quaas, and L.D. Van Vleck. 1983. Variances of prediction errors for
differences of estimated genetic values of cows in the same and in different herds.
J. Dairy Sci. 66:1370–1376.
Bonaiti, B., and D. Boichard. 1995. Accounting for foreign information in genetic
evaluation. Interbull Bull. 11:4pp.
Calus, M., G. Schopen, and R. Veerkamp. 2014. Simultaneous deregression of cow and
bull breeding values. Interbull Bull. 48:63–67.
Christensen, O.F., and M.S. Lund. 2010. Genomic prediction when some animals are not
Chapter II
32
genotyped. Genet. Sel. Evol. 42:2.
Dempfle, L. 1977. Relation entre BLUP (Best Linear Unbiased Prediction) et estimateurs
bayésiens. Genet. Sel. Evol. 9:27–32.
Ducrocq, V., and Z. Liu. 2009. Combining genomic and classical information in national
BLUP evaluations. Interbull Bull. 40:172–177.
Ducrocq, V., and C. Patry. 2010. Combining genomic and classical information in
national BLUP evaluation to reduce bias due to genomic pre-selection. Interbull
Bull. 41:33–36.
Fikse, W.F., and G. Banos. 2001. Weighting factors of sire daughter information in
international genetic evaluations. J. Dairy Sci. 84:1759–1767.
Gengler, N., and S. Vanderick. 2008. Bayesian inclusion of external evaluations into a
national evaluation system: Application to milk production traits. Interbull Bull.
38:70–74.
Gengler, N., and C. Verkenne. 2007. Bayesian approach to integrate molecular data into
genetic evaluations. Interbull Bull. 37:37–41.
Gianola, D., and R.L. Fernando. 1986. Bayesian methods in animal breeding theory. J.
Anim. Sci. 63:217–244.
Goddard, M. 1985. A method of comparing sires evaluated in different countries. Livest.
Prod. Sci. 13:321–331.
Gravert, H.O. 1983. IDF recommended procedure for international comparison of the
merit of dairy cattle. Int. Dairy Fed. Bull. 165:3–6.
Harris, B.L., and D.L. Johnson. 2010. Genomic predictions for New Zealand dairy bulls
and integration with national genetic evaluation. J. Dairy Sci. 93:1243–1252.
Henderson, C.R. 1975. Use of all relatives in intraherd prediction of breeding values and
producing abilities. J. Dairy Sci. 58:1910–1916.
Henderson, C.R. 1984. Applications of linear models in animal breeding. 2nd ed.
University of Guelph, Guelph, ON, Canada.
Hyde, L.R., W.R. Shafer, S.C. McGuire, M. Saatchi, and D.J. Garrick. 2013. ASA
experience with incorporating genomics into genetic evaluation. Pages 10–14 in
Proceedings of the 10th Genetic Prediction Workshop. Beef Improvement
Federation, Kansas City, MO.
Johnston, D.J., B. Tier, and H.-U. Graser. 2009. Integration of DNA markers into
BREEDPLAN EBVS. Pages 30–33 in Proceedings of the 18th Conference of the
Association for the Advancement of Animal Breeding and Genetics, Barossa
Strategies to render comparable and to combine results from different genetic and genomic evaluations: A review
33
Valley, Australia. Association for the Advancement of Animal Breeding and
Genetics.
Jones, L.P., and M.E. Goddard. 1990. Incorporating overseas information in proofs for
bulls. Pages 345–348 in Proceedings of the 8th Conference of the Australian
Association of Animal Breeding and Genetics. Association for the Advancement
of Animal Breeding and Genetics.
Kachman, S.D. 2008. Incorporation of marker scores into national genetic evaluations.
Pages 92–98 in Proceedings of the 9th Genetic Prediction Workshop. Beef
Improvement Federation, Kansas City, MO.
Klei, L., R.L. Quaas, E.J. Pollak, and B.E. Cunningham. 1996. Multiple-breed evaluation.
Pages 106–113 in Proceedings of the 28th Research Symposium and Annual
Meeting. Beef Improvement Federation.
Legarra, A., J.K. Bertrand, T. Strabel, R.L. Sapp, J.P. Sanchez, and I. Misztal. 2007.
Multi-breed genetic evaluation in a Gelbvieh population. J. Anim. Breed. Genet.
124:286–295.
Liu, Z., F. Reinhardt, and R. Reents. 2004. A multi-trait MACE model for international
bull comparison based on daughter yield deviations. Interbull Bull. 32:46–52.
Liu, Z., F. Seefried, F. Reinhardt, and R. Reents. 2009. A simple method for correcting the
bias caused by genomic pre-selection in conventional genetic evaluation. Interbull
Bull. 40:184–188.
Mäntysaari, E.A., and I. Strandén. 2010. Use of bivariate EBV-DGV model to combine
genomic and conventional breeding value evaluations. CD–ROM Comm. 353 in
Proceedings of the 9th World Congress on Genetics Applied to Livestock
Production, Leipzig, Germany.
Misztal, I., and G.R. Wiggans. 1988. Approximation of prediction error variance in large-
scale animal models. J. Dairy Sci. 71(Suppl. 2):27–32.
Mrode, R.A., G.J.T. Swanson, and M.S. Winters. 1996. Method and effects of
incorporating foreign information into United Kingdom production evaluations.
Anim. Sci. 63:373–379.
Pedersen, G.A., J. Pedersen, U.S. Nielsen, and P. Madsen. 1999. Experiences of blending
foreign information in the national genetic evaluation. Interbull Bull. 22:61–66.
Philipsson, J. 1987. Standards and procedures for international genetic evaluations of
dairy cattle. J. Dairy Sci. 70:418–424.
Philipsson, J., B. Danell, L.R. Schaeffer, M. Schneeberger, H. Schulte-Coerne, and J.B.M.
Chapter II
34
Wilmink. 1986. Methods of transforming proofs. Interbull Bull. 1:12–22.
Powell, R.L. 1988. Comparison of procedures to convert sire evaluations between
countries. J. Dairy Sci. 71:1609–1615.
Powell, R.L., and M. Sieber. 1992. Direct and indirect conversion of bull evaluations for
yield traits between countries. J. Dairy Sci. 75:1138–1146.
Powell, R.L., G.R. Wiggans, and P.M. VanRaden. 1994. Factors affecting calculation and
use of conversion equations for genetic merit of dairy bulls. J. Dairy Sci. 77:2679–
2686.
Přibyl, J., P. Madsen, J. Bauer, J. Přibylová, M. Šimečková, L. Vostrý, and L. Zavadilová.
2013. Contribution of domestic production records, Interbull estimated breeding
values, and single nucleotide polymorphism genetic markers to the single-step
genomic evaluation of milk production. J. Dairy Sci. 96:1865–1873.
Quaas, R.L. 1979. Incorporating AI sire proofs into intraherd BLUP of breeding values.
Mimeo. Dept. Anim. Sci., Cornell Univ., Ithaca, NY.
Quaas, R.L., and Z. Zhang. 2006. Multiple-breed genetic evaluation in the US beef cattle
context: Methodology. CD–ROM Comm. 24–12 in Proceedings of the 8th World
Congress on Genetics Applied to Livestock Production, Belo Horizonte, Brazil.
Quaas, R.L., and Z.W. Zhang. 2001. Incorporating external information in multibreed
genetic evaluation. J. Anim. Sci. 79(Suppl. 1):342. (Abstr.).
Robinson, G.K. 1991. That BLUP is a good thing: The estimation of random effects. Stat.
Sci. 6:15–32.
Rozzi, P., L.R. Schaeffer, E.B. Burnside, and W. Schlote. 1990. International evaluation of
Holstein-Friesian dairy sires from three countries. Livest. Prod. Sci. 24:15–28.
Schaeffer, L.R. 1985. Model for international evaluation of dairy sires. Livest. Prod. Sci.
12:105–115.
Schaeffer, L.R. 1994. Multiple-country comparison of dairy sires. J. Dairy Sci. 77:2671–
2678.
Schaeffer, L.R. 2001. Multiple trait international bull comparisons. Livest. Prod. Sci.
69:145–153.
Schaeffer, L.R., J. Jamrozik, G.J. Kistemaker, and J. Van Doormaal. 2000. Experience
with a test-day model. J. Dairy Sci. 83:1135–1144.
Sigurdsson, A., and G. Banos. 1995. Dependent variables in international sire evaluations.
Acta Agric. Scand. Sect. - Anim. Sci. 45:209–217.
Špehar, M., K. Potočnik, and G. Gorjanc. 2013. Accuracy of genomic prediction for milk
Strategies to render comparable and to combine results from different genetic and genomic evaluations: A review
35
production traits with different approaches in a small population of Slovenian
Brown bulls. Livest. Sci. 157:421–426.
Stoop, M., H. Eding, M.L. van Pelt, L.C. de Haer, and G. de Jong. 2013. Using Pseudo-
observations to combine Genomic and Conventional Data in the Dutch-Flemish
National Evaluation. Interbull Bull. 47:106–110.
Stoop, W.M., H. Eding, M.L. van Pelt, and G. de Jong. 2011. Combining genomic and
conventional data in the Dutch national evaluation. Interbull Bull. 44:169–172.
Sullivan, P.G., and J.H. Jakobsen. 2014. GMACE without variance estimation. Interbull
Bull. 48:46–49.
Sullivan, P.G., and P.M. VanRaden. 2009. Development of genomic GMACE. Interbull
Bull. 40:157–161.
Sullivan, P.G., and J.W. Wilton. 2001. Multiple-trait MACE with a number of traits per
country. Interbull Bull. 27:68–72.
Täubert, H., H. Simianer, and K. Karras. 1999. Problems including Interbull breeding
values in national evaluations. Interbull Bull. 22:57–60.
Täubert, H., H. Simianer, and K. Karras. 2000. Blending Interbull breeding values into
national evaluations A new approach. Interbull Bull. 25:53–56.
Tier, B., D.J. Johnston, H.U. Graser, and M.E. Goddard. 1999. Incorporating foreign
estimated breeding values into BREEDPLAN. Pages 199–202 in Proceedings of
the 13th Conference of the Association for the Advancement of Animal Breeding
and Genetics, Mandurah, Australia. Association for the Advancement of Animal
Breeding and Genetics.
VanRaden, P.M. 2001. Methods to combine estimated breeding values obtained from
separate sources. J. Dairy Sci. 84 (E. Suppl.):E47–E55.
VanRaden, P.M. 2012. Avoiding bias from genomic pre-selection in converting daughter
information across countries. Interbull Bull. 45:29–33.
VanRaden, P.M., R.L. Powell, and U. Emanuelson. 2000. Investigation of an alternative
approach to international evaluations. Interbull Bull. 25:18–21.
VanRaden, P.M., C.P. Van Tassell, G.R. Wiggans, T.S. Sonstegard, R.D. Schnabel, J.F.
Taylor, and F.S. Schenkel. 2009. Invited Review: Reliability of genomic
predictions for North American Holstein bulls. J. Dairy Sci. 92:16–24.
VanRaden, P.M., and M.E. Tooker. 2012. Methods to include foreign information in
national evaluations. J. Dairy Sci. 95:446.
VanRaden, P.M., M.E. Tooker, J.R. Wright, C. Sun, and J.L. Hutchison. 2014.
Chapter II
36
Comparison of single-trait to multi-trait national evaluations for yield, health, and
fertility. J. Dairy Sci. 97:7952-7962.
Van Vleck, L.D. 1982. Derivation of Henderson’s method of incorporating artificial
insemination sire evaluations into intraherd prediction of breeding values. J. Dairy
Sci. 65:284–286.
Weigel, K.A., T.J. Lawlor Jr, P.M. Vanraden, and G.R. Wiggans. 1998. Use of linear type
and production data to supplement early predicted transmitting abilities for
productive life. J. Dairy Sci. 81:2040–2044.
Weigel, K.A., and R. Rekaya. 2000. A multiple-trait herd cluster model for international
dairy sire evaluation. J. Dairy Sci. 83:815–821.
Wickham, B.W., and J. Philipsson. 1990a. Background Interbull Bull. 4:3–4.
Wickham, B.W., and J. Philipsson. 1990b. Interbull recommendations. Interbull Bull. 4:4–
11.
Wiggans, G.R., P.M. VanRaden, and R.L. Powell. 1992. A method for combining United
States and Canadian bull evaluations. J. Dairy Sci. 75:2834–2839.
Wilmink, J.B.M., A. Meijering, and B. Engel. 1986. Conversion of breeding values for
milk from foreign populations. Livest. Prod. Sci. 14:223–229.
Chapter III. C OMPARISON AND IMPROVEMENT OF DIFFERENT
BAYESIAN PROCEDURES TO INTEGRATE EXTERNAL INFORMATIO N
INTO GENETIC EVALUATIONS
The previous Chapter reviewed various approaches and
algorithms comparing or combining different genetic evaluations.
One promising approach is the Bayesian approach that combines
simultaneously external information (i.e., estimated breeding
values and associated reliabilities provided by an external genetic
evaluation) with internal phenotypic and genealogic data.
Advantages of Bayesian approaches that were highlighted were
the possible generalization to complex models, the avoidance of
explicit deregression steps or the propagation of external
information to all animals. However, while Bayesian approaches
seem to be promising, Chapter II also highlighted some
limitations, such as, e.g., double counting of contributions due to
relationships. Therefore, the aim of this Chapter was first to
review two Bayesian approaches that were recently proposed and,
second, to enhance the proposed Bayesian approaches, mainly
regarding computational burden and double counting of
contributions due to relationships.
From: Vandenplas, J., and N. Gengler. 2012. Comparison and improvements of
different Bayesian procedures to integrate external information into genetic
evaluations. J. Dairy Sci. 95:1513–1526.

Comparison and improvement of different Bayesian procedures to integrate external information into genetic evaluations
39
ABSTRACT
The aim of this research was to compare different Bayesian procedures to
integrate information from outside a given evaluation system, hereafter called external
information, and in this context estimated breeding values (EBV), into this genetic
evaluation, hereafter called internal evaluation, and to improve the Bayesian procedures
to assess their potential to combine information from diverse sources. The 2
improvements were based on approximations of prior mean and variance. The first
version of modified Bayesian evaluation considers all animals as animals associated with
external information. For animals that have no external information (i.e., internal
animals), external information is predicted from available external information. Thereby,
propagation of this external information through the whole pedigree is allowed.
Furthermore, the prediction of external information for internal animals allows large
simplifications of the computational burden during setup and solving of mixed model
equations. However, double counting among external animals (i.e., animals associated
with available external information) is not avoided. Double counting concerns multiple
considerations of contributions due to relationships by integration of external EBV for
related external animals and is taken into account by the second version of modified
Bayesian evaluation. This version includes the estimation of double counting before
integration of external information. To test the improvements, 2 dairy cattle populations
were simulated across 5 generations. Milk production for the first lactation for each
female was simulated in both populations. Internal females were randomly mated with
internal males and 50 external males. Results for 100 replicates showed that rank
correlations among Bayesian EBV and EBV based on the joint use of external and
internal data were very close to 1 for both external and internal animals if all internal and
external animals were associated with external information. The respective correlations
for the internal evaluation were equal to 0.54 and 0.95 if no external information was
integrated. If double counting was avoided, mean squared error, expressed as a percentage
of the internal mean squared error, was close to zero for both external and internal
animals. However, computational demands increased when double counting was avoided.
Finally, the improved Bayesian procedures have the potential to be applied for integrating
external EBV, or even genomic breeding values following some additional assumptions,
into routine genetic evaluations to evaluate animals more reliably.
Key words: Bayesian approach, dairy cow, integration, external information
Chapter III
40
INTRODUCTION
Theoretical properties of currently used methods to assess the genetic value of
domestic animals depend on certain conditions. One of the most important is that all
available information has to be used simultaneously to obtain unbiased estimates (e.g.,
Henderson, 1984). However, this is often not the case in practice, for many potential
reasons. The most important issue is the unavailability of raw data (e.g., recorded and
evaluated in another country) or the complexity of computations that require the use of
multi-step, sequential, or distributed computing. Both issues are frequent in modern
breeding, especially in dairy cattle breeding, because international exchange of genetic
material (e.g., frozen semen and embryos) is extremely widespread. Until now, basic
genetic evaluations are mostly based on local data, potentially followed by an
international second step, as performed by the International Bull Service (Interbull,
Uppsala, Sweden) for dairy breed sires. However, the accuracy of local evaluations may
be limited for animals with few local data. Furthermore, the current massive development
of genomic selection exacerbates this issue, because potentially more different genetic
evaluations may exist, and the need to combine those sources of information increases.
Current methods used in the context of dairy cattle are mostly selection index based on
VanRaden (2001) to combine different sources of information (e.g., Gengler and
VanRaden, 2008).
Another promising class of methods is based on Bayesian methods originating
from the work from Klei et al. (1996) in the context of multibreed genetic evaluations for
beef cattle. In this context, Bayesian means that the prior distribution of breeding values
is changed according to what is known from an external source. Later, Quaas and Zhang
(2001) and Legarra et al. (2007) proposed 2 different Bayesian derivations to incorporate
external information, including external genetic breeding evaluations and their associated
accuracies, into the internal evaluation. The integration of external information leads to an
improved ranking of animals with external information (so-called external animals) in the
internal evaluation, which is more similar to the ranking of a hypothetical joint evaluation
of internal and external animals. Another advantage of this integration is that accuracies
of estimated breeding values (EBV) for external animals are more reliable compared with
those of the internal evaluation. Furthermore, this improvement of accuracies and rank
correlations of external animals between the internal and joint evaluations depends on the
external accuracy of prior information (Quaas and Zhang, 2001, 2006; Zhang et al., 2002;
Comparison and improvement of different Bayesian procedures to integrate external information into genetic evaluations
41
Legarra et al., 2007) but also on several hypotheses used in the implementation. For
example, current implementations do not take into account the double counting among
external animals. However, an EBV of an animal combines information from its own
records and from records of all relatives through its parents and its offspring (Misztal and
Wiggans, 1988; VanRaden, 2001). Integrated external information of this animal and a
close relative into the same genetic evaluation may be counted double if this external
information contains both contributions due to relationships. Furthermore, until now, only
few proposals exist to put these methods in the context of dairy cattle breeding, whereas
they can be used in many situations and as a way to integrate genomic prediction (e.g.,
Gengler and Verkenne, 2007).
The first aim of this research was to compare different Bayesian approaches for
their potential to combine information from diverse sources and the second aim was to
improve existing Bayesian approaches to integrate external information into genetic
evaluations. Focus was thereby given to the simplification of the computational burden
and the avoidance of double counting among external animals.
MATERIALS AND METHODS
THEORETICAL BACKGROUND
Different concepts that will be used in this study are defined as follows:
(1) Internal data was defined as data used only for internal evaluations (e.g., milk
records in a given country A).
(2) External data was defined as additional data not directly used in internal
evaluations (e.g., milk records in another given country B).
(3) Internal information was related to information obtained from an evaluation based
only on internal data (e.g., local EBV in country A).
(4) External information was related to information obtained from an evaluation based
only on external data and free of internal information (e.g., foreign EBV or
genomic EBV obtained in country B). Finally, all animals were distinguished
between internal and external animals.
(5) An internal animal was an animal associated with only internal data and internal
information (e.g., locally used sires in country A).
(6) An external animal was an animal associated with external data and information
and also having internal data and information or being relative to the evaluation of
Chapter III
42
internal animals (e.g., foreign sires also used in country A in addition to country B
or genotyped animals from country B relevant to country A).
The main reason for the application of Bayesian procedures is to obtain solutions
as close as possible to those of a hypothetical joint evaluation of all external and internal
animals including their data. This is performed by integrating external information into
the internal genetic evaluation instead of using only internal data. The considered external
information in this context was available external EBV and their associated accuracies
obtained from only external data (Ey ). Both will be used to define the prior distribution
of the internal EBV of the external animals (Eu ). This prior distribution can be defined in
a generic way as )()p( *0EE GUb,µyu −= MVN where MVN means multivariate
normal, 0µ is the vector of external EBV of a joint genetic evaluation of all internal and
external animals based only on external data Ey , *G is the matrix of prediction error
(co)variances of these EBV, b is a vector of base differences between external and
internal EBV, and U is an incidence matrix relating base differences to animals.
If E and I refer to external and internal evaluations, respectively, and based on
Legarra et al. (2007), a generic model can be written leading to these mixed model
equations (III.1), representing this multi-trait modified mixed model:
+=
+−
−−
−
−−
−−−−
−−
01*
01*
I1
II
I1
III
1*1*
1*1*I
1III
1II
I1
III1
II
µGU'
µGyRZ'
yRX'
b
u
β
UGU'GU'0
UGGZRZ'XRZ'
0ZRX'XRX'
ˆˆ
ˆ
(III.1)
where Iy is the vector of internal observations, Iβ is the vector of fixed effects, u is the
vector of random genetic effects of the external and internal random genetic effects, IX
and IZ are the incidence matrices for internal fixed effects and animals, respectively, and
IR is the (co)variances matrix for the internal residual effects.
Legarra et al. (2007) showed that
+=−
IIIE
EIEE1*
GG
GΛGG where Λ is equal to
1EE
1 GDΛ −− −= (III.2)
where the matrix D is the matrix of prediction error (co)variances of the external
information estimated from a genetic evaluation of all external animals based only on
external data which did not include relationships between the internal animals, and -1EEG
is the inverse of the additive genetic (co)variance matrix that only accounts for the
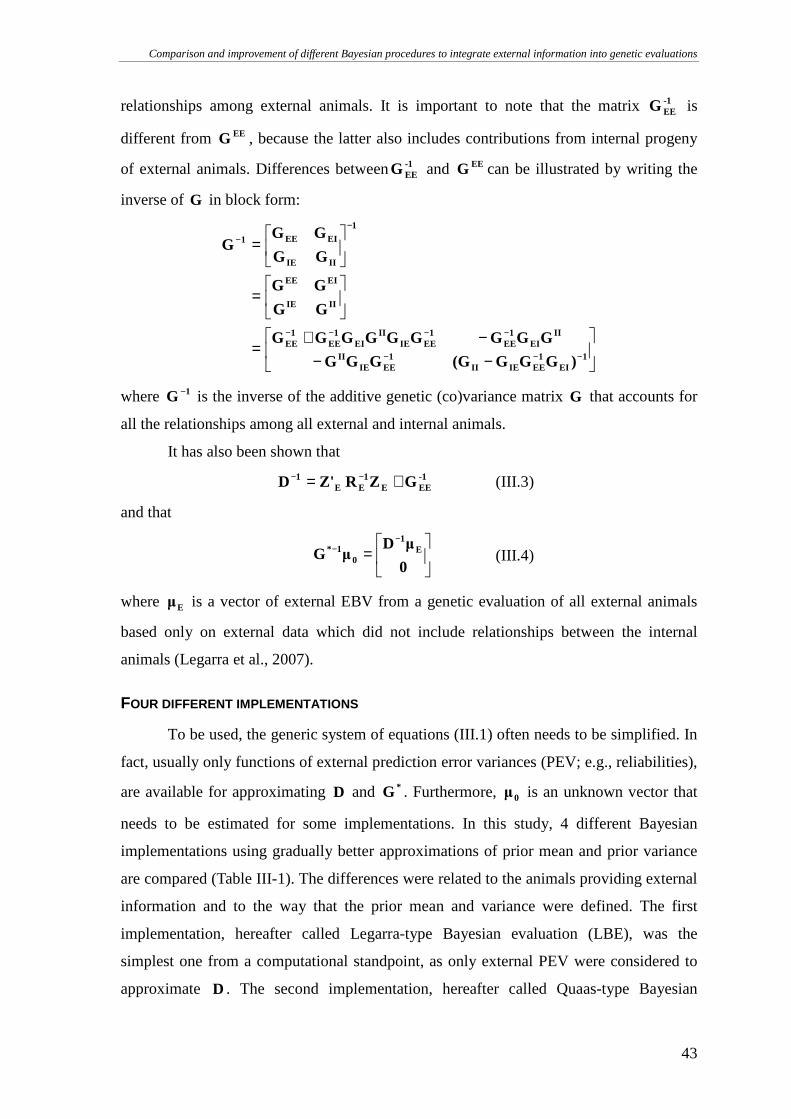
Comparison and improvement of different Bayesian procedures to integrate external information into genetic evaluations
43
relationships among external animals. It is important to note that the matrix -1EEG is
different from EEG , because the latter also includes contributions from internal progeny
of external animals. Differences between-1EEG and EEG can be illustrated by writing the
inverse of G in block form:
−−−+
=
=
=
−−−
−−−−
−−
1EI
1EEIEII
1EEIE
II
IIEI
1EE
1EEIE
IIEI
1EE
1EE
IIIE
EIEE
1
IIIE
EIEE1
)GGG(GGGG
GGGGGGGGG
GG
GG
GG
GGG
where 1G − is the inverse of the additive genetic (co)variance matrix G that accounts for
all the relationships among all external and internal animals.
It has also been shown that
-1EEE
1EE
1 GZRZ'D += −− (III.3)
and that
=
−−
0
µDµG E
1
01* (III.4)
where Eµ is a vector of external EBV from a genetic evaluation of all external animals
based only on external data which did not include relationships between the internal
animals (Legarra et al., 2007).
FOUR DIFFERENT IMPLEMENTATIONS
To be used, the generic system of equations (III.1) often needs to be simplified. In
fact, usually only functions of external prediction error variances (PEV; e.g., reliabilities),
are available for approximating D and *G . Furthermore, 0µ is an unknown vector that
needs to be estimated for some implementations. In this study, 4 different Bayesian
implementations using gradually better approximations of prior mean and prior variance
are compared (Table III-1). The differences were related to the animals providing external
information and to the way that the prior mean and variance were defined. The first
implementation, hereafter called Legarra-type Bayesian evaluation (LBE), was the
simplest one from a computational standpoint, as only external PEV were considered to
approximate D . The second implementation, hereafter called Quaas-type Bayesian
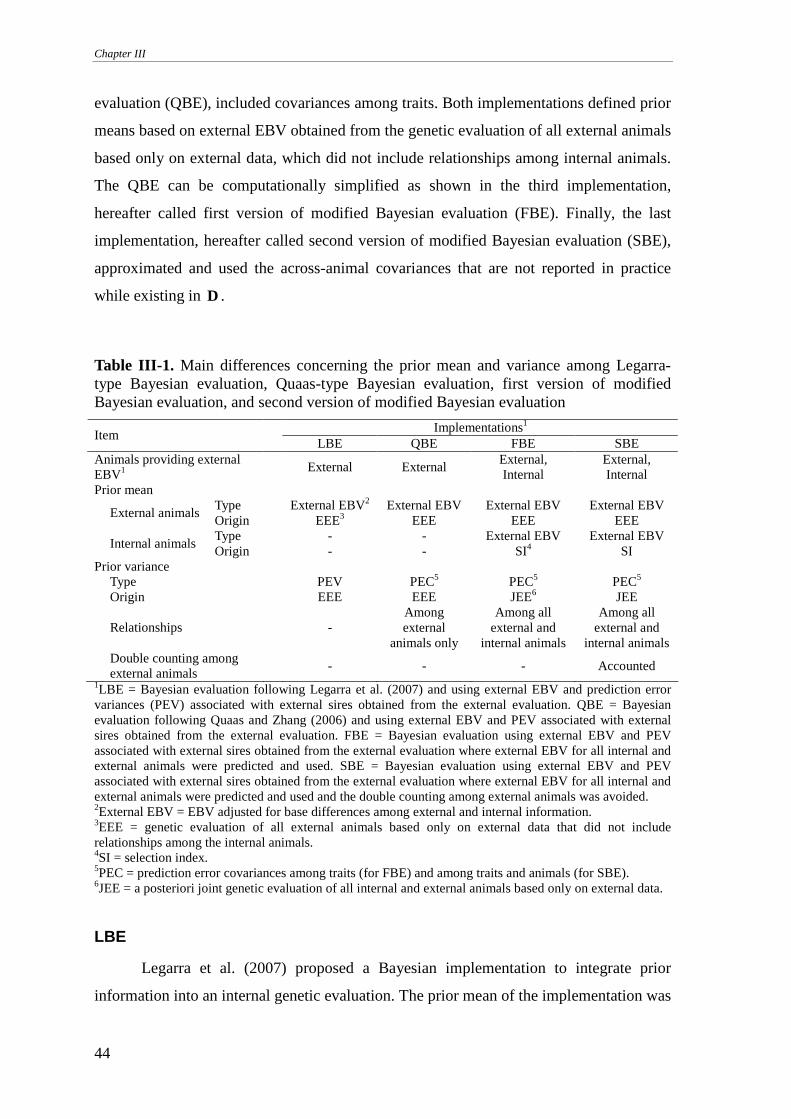
Chapter III
44
evaluation (QBE), included covariances among traits. Both implementations defined prior
means based on external EBV obtained from the genetic evaluation of all external animals
based only on external data, which did not include relationships among internal animals.
The QBE can be computationally simplified as shown in the third implementation,
hereafter called first version of modified Bayesian evaluation (FBE). Finally, the last
implementation, hereafter called second version of modified Bayesian evaluation (SBE),
approximated and used the across-animal covariances that are not reported in practice
while existing in D .
Table III-1. Main differences concerning the prior mean and variance among Legarra-type Bayesian evaluation, Quaas-type Bayesian evaluation, first version of modified Bayesian evaluation, and second version of modified Bayesian evaluation
Implementations1 Item
LBE QBE FBE SBE Animals providing external EBV1
External External External, Internal
External, Internal
Prior mean Type External EBV2 External EBV External EBV External EBV
External animals Origin EEE3 EEE EEE EEE Type - - External EBV External EBV
Internal animals Origin - - SI4 SI
Prior variance Type PEV PEC5 PEC5 PEC5 Origin EEE EEE JEE6 JEE
Relationships - Among external
animals only
Among all external and
internal animals
Among all external and
internal animals Double counting among external animals
- - - Accounted 1LBE = Bayesian evaluation following Legarra et al. (2007) and using external EBV and prediction error variances (PEV) associated with external sires obtained from the external evaluation. QBE = Bayesian evaluation following Quaas and Zhang (2006) and using external EBV and PEV associated with external sires obtained from the external evaluation. FBE = Bayesian evaluation using external EBV and PEV associated with external sires obtained from the external evaluation where external EBV for all internal and external animals were predicted and used. SBE = Bayesian evaluation using external EBV and PEV associated with external sires obtained from the external evaluation where external EBV for all internal and external animals were predicted and used and the double counting among external animals was avoided. 2External EBV = EBV adjusted for base differences among external and internal information. 3EEE = genetic evaluation of all external animals based only on external data that did not include relationships among the internal animals. 4SI = selection index. 5PEC = prediction error covariances among traits (for FBE) and among traits and animals (for SBE). 6JEE = a posteriori joint genetic evaluation of all internal and external animals based only on external data.
LBE
Legarra et al. (2007) proposed a Bayesian implementation to integrate prior
information into an internal genetic evaluation. The prior mean of the implementation was
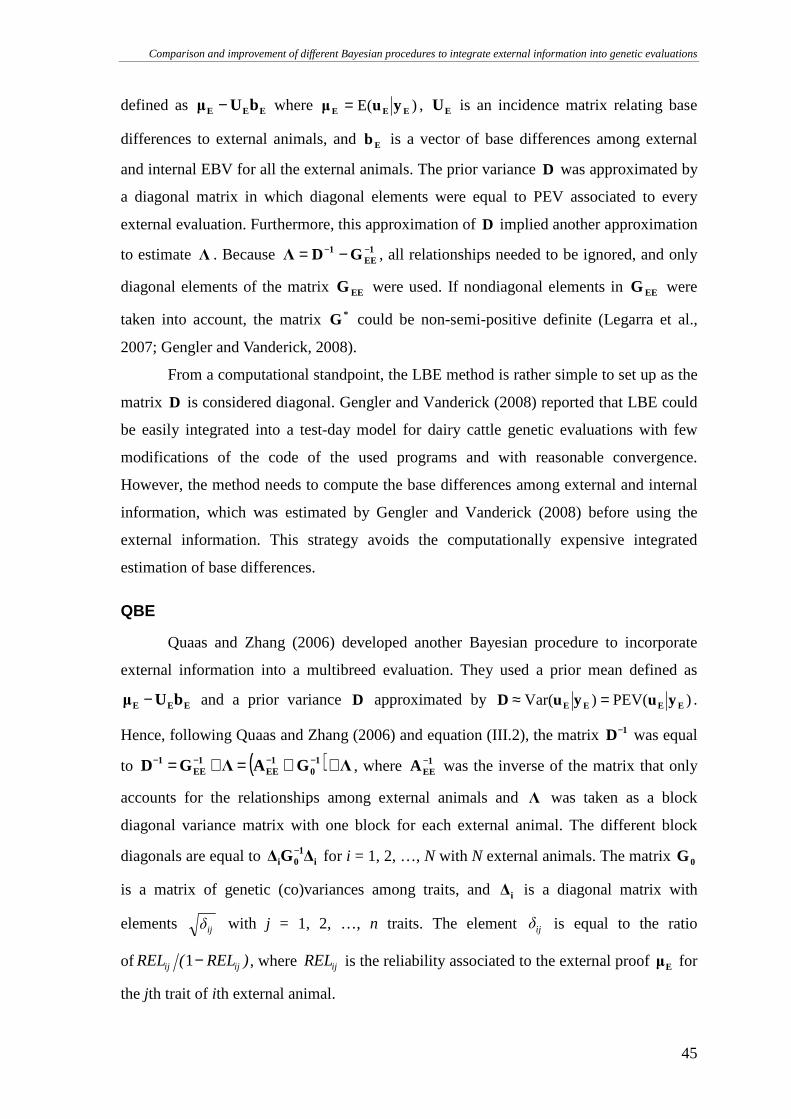
Comparison and improvement of different Bayesian procedures to integrate external information into genetic evaluations
45
defined as EEE bUµ − where )E( EEE yuµ = , EU is an incidence matrix relating base
differences to external animals, and Eb is a vector of base differences among external
and internal EBV for all the external animals. The prior variance D was approximated by
a diagonal matrix in which diagonal elements were equal to PEV associated to every
external evaluation. Furthermore, this approximation of D implied another approximation
to estimate Λ . Because 1EE
1 GDΛ −− −= , all relationships needed to be ignored, and only
diagonal elements of the matrix EEG were used. If nondiagonal elements in EEG were
taken into account, the matrix *G could be non-semi-positive definite (Legarra et al.,
2007; Gengler and Vanderick, 2008).
From a computational standpoint, the LBE method is rather simple to set up as the
matrix D is considered diagonal. Gengler and Vanderick (2008) reported that LBE could
be easily integrated into a test-day model for dairy cattle genetic evaluations with few
modifications of the code of the used programs and with reasonable convergence.
However, the method needs to compute the base differences among external and internal
information, which was estimated by Gengler and Vanderick (2008) before using the
external information. This strategy avoids the computationally expensive integrated
estimation of base differences.
QBE
Quaas and Zhang (2006) developed another Bayesian procedure to incorporate
external information into a multibreed evaluation. They used a prior mean defined as
EEE bUµ − and a prior variance D approximated by )PEV()Var( EEEE yuyuD =≈ .
Hence, following Quaas and Zhang (2006) and equation (III.2), the matrix 1D− was equal
to ( ) ΛGAΛGD 10
1EE
1EE
1 +⊗=+= −−−− , where 1EEA − was the inverse of the matrix that only
accounts for the relationships among external animals and Λ was taken as a block
diagonal variance matrix with one block for each external animal. The different block
diagonals are equal to i1
0i ∆G∆ − for i = 1, 2, …, N with N external animals. The matrix 0G
is a matrix of genetic (co)variances among traits, and i∆ is a diagonal matrix with
elements ijδ with j = 1, 2, …, n traits. The element ijδ is equal to the ratio
of )REL(REL ijij −1 , where ijREL is the reliability associated to the external proof Eµ for
the jth trait of ith external animal.
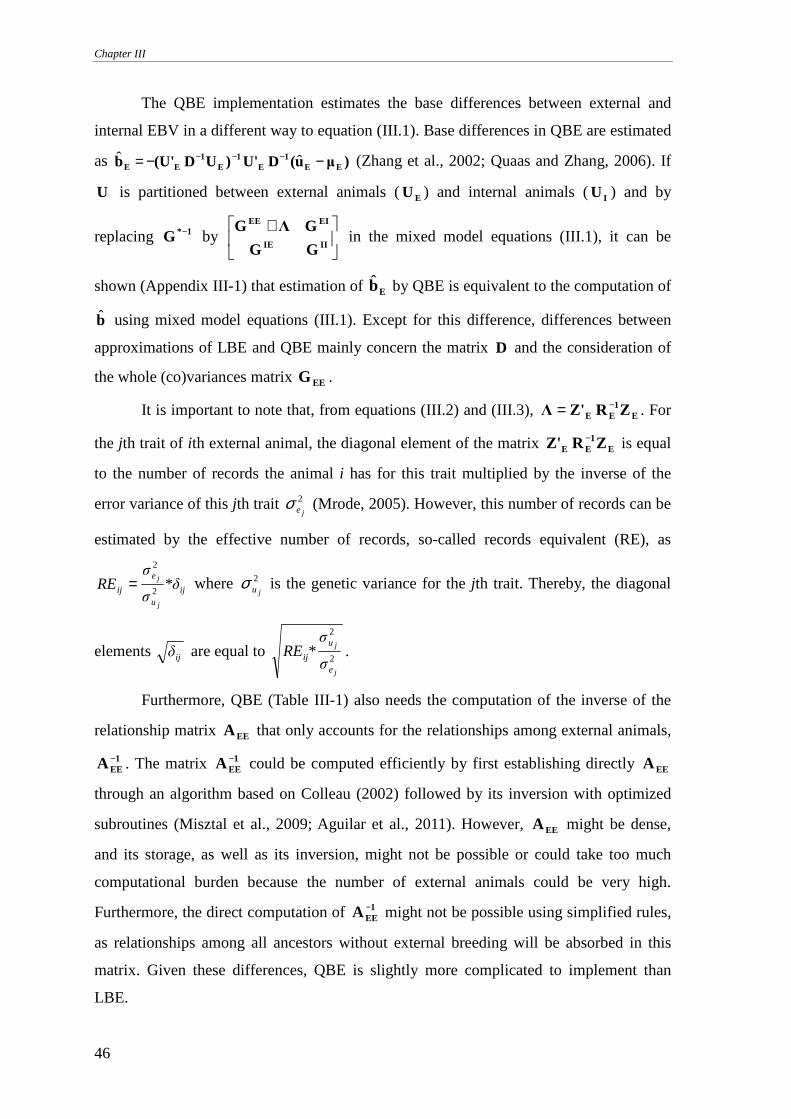
Chapter III
46
The QBE implementation estimates the base differences between external and
internal EBV in a different way to equation (III.1). Base differences in QBE are estimated
as )µu(DU')UD(U'b EE1
E1
E1
EE −−= −−− ˆˆ (Zhang et al., 2002; Quaas and Zhang, 2006). If
U is partitioned between external animals (EU ) and internal animals ( IU ) and by
replacing 1*G − by
+IIIE
EIEE
GG
GΛG in the mixed model equations (III.1), it can be
shown (Appendix III-1) that estimation of Eb by QBE is equivalent to the computation of
b using mixed model equations (III.1). Except for this difference, differences between
approximations of LBE and QBE mainly concern the matrix D and the consideration of
the whole (co)variances matrix EEG .
It is important to note that, from equations (III.2) and (III.3), E1
EE ZRZ'Λ −= . For
the jth trait of ith external animal, the diagonal element of the matrix E1
EE ZRZ' − is equal
to the number of records the animal i has for this trait multiplied by the inverse of the
error variance of this jth trait 2
jeσ (Mrode, 2005). However, this number of records can be
estimated by the effective number of records, so-called records equivalent (RE), as
iju
e
ij *δσ
σ
REj
j
2
2
= where 2
juσ is the genetic variance for the jth trait. Thereby, the diagonal
elements ijδ are equal to 2
2
j
j
e
u
ijσ
σ
*RE .
Furthermore, QBE (Table III-1) also needs the computation of the inverse of the
relationship matrix EEA that only accounts for the relationships among external animals,
1EEA − . The matrix 1
EEA − could be computed efficiently by first establishing directly EEA
through an algorithm based on Colleau (2002) followed by its inversion with optimized
subroutines (Misztal et al., 2009; Aguilar et al., 2011). However, EEA might be dense,
and its storage, as well as its inversion, might not be possible or could take too much
computational burden because the number of external animals could be very high.
Furthermore, the direct computation of 1EEA − might not be possible using simplified rules,
as relationships among all ancestors without external breeding will be absorbed in this
matrix. Given these differences, QBE is slightly more complicated to implement than
LBE.
Comparison and improvement of different Bayesian procedures to integrate external information into genetic evaluations
47
FBE
The definition of prior mean and variance in QBE has the shortcoming that, as
noted above, the computation of 1EEA − is more difficult than the establishment of the
inverse of the relationship matrix among all external and internal animals. The
consideration of all animals has also the effect that the definition of prior mean needs to
include external EBV for all animals. To consider these issues, FBE was developed. The
approximation concerns the terms of the left hand side of the equation (III.4) instead of
the terms of the right hand side, as is done in LBE and QBE. The unknown vector 0µ can
be approximated as follows. Let Iµ be an unknown vector of external EBV of all the
internal animals of a joint genetic evaluation of all internal and external animals based
only on external data. Because this evaluation is only based on external data, and because
[ ]''I
'E0 µµµ = and ( )1II
E1
EEIEEI )(G,µGGµµ −−= MVN)p( , Iµ can be approximated as
well as 0µ . Therefore, all internal and external animals are considered as having external
information. As detailed in Table III-1, this feature distinguishes the 2 implementations
found in the literature (LBE and QBE) and the new implementations FBE and SBE. In
these 2 implementations, FBE and SBE, the RE associated with the predicted breeding
values are set to 0, because the predicted breeding values are only based on relationships
and do not bring any additional information. Hence, because all internal and external
animals are considered as external animals,
+=−
IIIE
EIEE1*
GG
GΛGG and
E1
EE ZRZ'Λ −= , 1*G − can be simplified as ΛGG 11* += −− , where the diagonal blocks
for the internal animals of the matrix Λ of FBE are equal to zero and the diagonal blocks
for the external animals of the matrix Λ of FBE are equal to the corresponding diagonal
blocks of Λ used by QBE.
From a computational standpoint, FBE has different advantages. First, because all
the animals are considered to have external information, the inverse of the whole
relationship matrix A is also used in the right hand side of FBE instead of the
relationship matrix 1EEA − used by QBE to estimate 1D− . This extension of the relationship
matrix requires an estimation of external breeding values for the internal animals (e.g.,
using selection index theory). However, this estimation is computationally feasible. The
extension of the external breeding values leads to the setup of only a single inverted
relationships matrix. Second, the integration of prior information for all animals in FBE
Chapter III
48
leads to a hidden advantage for this implementation. Because all internal animals are
associated with prior information, the prediction of their breeding values through FBE is
influenced by the same constant difference that may exist between external information
and breeding values that have to be estimated. Therefore, the equation to estimate genetic
base differences among the different evaluations can be eliminated from the system of
equations, because this effect becomes confounded with the general mean. A proof of this
is given in the Appendix III-1. Both advantages and differences of FBE in comparison to
LBE and QBE allow large simplifications of the computational burden during setup and
solving of mixed model equations, making their use again easier with complicated models
and large data sets.
SBE
The knowledge of only the external PEV, or functions of these, means that the
across-animal covariances are not correctly considered by LBE, QBE, and FBE, which
leads to double counting among external animals. In this context, double counting means
multiple considerations of parts of integrated external EBV for related external animals.
In SBE, double counting is taken into account through an additional two-step algorithm
(TSA), for which the aim is to estimate corrected RE for the external animals independent
from contributions due to relationships. Hence, only the approximation of Λ for the
external animals changes in SBE compared with FBE. So, the block diagonal of Λ for
each internal animal i is equal to zero as those of the third implementation FBE, while the
block diagonal of Λ for each external animal i is equal to i1
0i ∆G∆ − , where i∆ is a
diagonal matrix with elements 2
2
*j
j
iie
u
σσ
*jRE , where j = 1, 2, …, n traits, and *
jRE is a
diagonal matrix with diagonal elements equal to RE only due to own records for the jth
trait.
Double counting among external animals can appear if external information - in
this context, external EBV - of an animal and a close relative are integrated into the same
genetic evaluation. This double counting is due to the fact that external information of
those animals combines contributions due to own records and due to relationships
(Misztal and Wiggans, 1988; VanRaden, 2001). To avoid this double counting, it is
necessary to separate the contributions due to records from the contributions due to
relationships in the external information for each external animal using TSA, in which the
Comparison and improvement of different Bayesian procedures to integrate external information into genetic evaluations
49
2 steps are based on the algorithm A1 of Misztal and Wiggans (1988). However, the aim
of the current study was different from that of Misztal and Wiggans (1988), and some
modifications were necessary. The first modification concerns the fact that the 2 steps of
the TSA include all relationships between external animals and their ancestors instead of
only the relationships between an animal and its parents. Second, the estimated RE due to
records by the algorithm A1 is obtained from a model in which all effects are absorbed
into animals’ effects. This leads to lower RE than the corresponding diagonal elements of
the matrix E1
EE ZRZ' − . To resolve this problem, an absorption matrix M is created from
the RE due to records estimated by the first step of the TSA. Therefore, for the jth trait,
the first step of the TSA separates contributions due to records and contributions due to
relationships following the algorithm A1 of Misztal and Wiggans (1988). Based on the
contributions due to records, an absorption matrix M has to be developed that is taken
into account by the second step of the TSA to estimate RE for the external animals
independently from contributions due to relationships or correlated traits. The TSA must
be repeated for each trait and is detailed in the Appendix III-1.
The SBE shares the advantages with FBE explained above. However, as already
explained, an additional advantage is that theoretically all double counting among
external animals is avoided. The disadvantage is that the TSA needs to be implemented,
which may be computationally challenging.
SIMULATED DATA
The 4 different Bayesian methodologies described above were tested using
simulated data. For this purpose, an external and an internal population were each
simulated from 30 male founders and 120 female founders. Each population included
about 1000 animals distributed over 5 generations. For each population, the sires were
randomly selected from available males for each generation. The maximum number of
males mated in each generation was 25. All females existing in the pedigree were
randomly mated with the selected males to simulate each new generation. However, these
matings could not be realized if the coefficient of relationship between 2 animals was 0.5
or higher, as well as if the female had already 3 descendants. Furthermore, a male could
be mated during at most 2 years.
In regard to the external population, external females were randomly mated only
with external males. In each generation, 60% of external male offspring were randomly
culled. In regard to the internal population, internal females were randomly mated with
Chapter III
50
internal males and a subset of external males. This subset included the first 50 sires that
had the most offspring in the external population. In each generation, 99% of internal
male offspring were randomly culled.
As the phenotypic trait, milk production for the first lactation was simulated for
each female in both populations following Van Vleck (1994). A nested herd effect within
population was randomly assigned to each record under the condition that each herd
included about 40 females. Phenotypic variance and heritability were assumed to be 3.24
* 106 kg2 and 0.25, respectively.
Using the simulated data, the following 7 genetic evaluations were performed:
(1) The joint evaluation was a regular BLUP evaluation based on external and internal
pedigree and data. This evaluation was assumed the reference.
(2) The external evaluation was a regular BLUP evaluation based on external pedigree
and data.
(3) The internal evaluation was a regular BLUP evaluation based on internal pedigree
and data.
Concerning the 4 Bayesian evaluations,
(4) the Legarra-type Bayesian evaluation was a LBE using external EBV and PEV
associated with external sires, obtained from external evaluation (2) inside the
internal evaluation, and
(5) the Quaas-type Bayesian evaluation was a QBE using external EBV and PEV
associated with external sires, obtained from external evaluation (2) inside the
internal evaluation.
(6) The first version of modified Bayesian evaluation was an FBE using external EBV
and PEV associated with external sires inside the internal evaluation where
external EBV for all animals (internal and external) were predicted and used, and
(7) the second version of modified Bayesian evaluation was an SBE using external
EBV and PEV associated with external sires inside the internal evaluation, where
external EBV and PEV for all animals (internal and external) were predicted and
used but applying the TSA algorithm to avoid double counting.
The simulation was replicated 100 times. For external and internal animals,
comparisons between the joint evaluation and the 6 others were based on (1) Spearman
rank correlation coefficients (r), (2) mean squared errors (MSE) expressed as a percentage
of internal MSE, (3) regression coefficients (a), and on (4) coefficients of determination
(R2). All parameters were the average of 100 replicates.
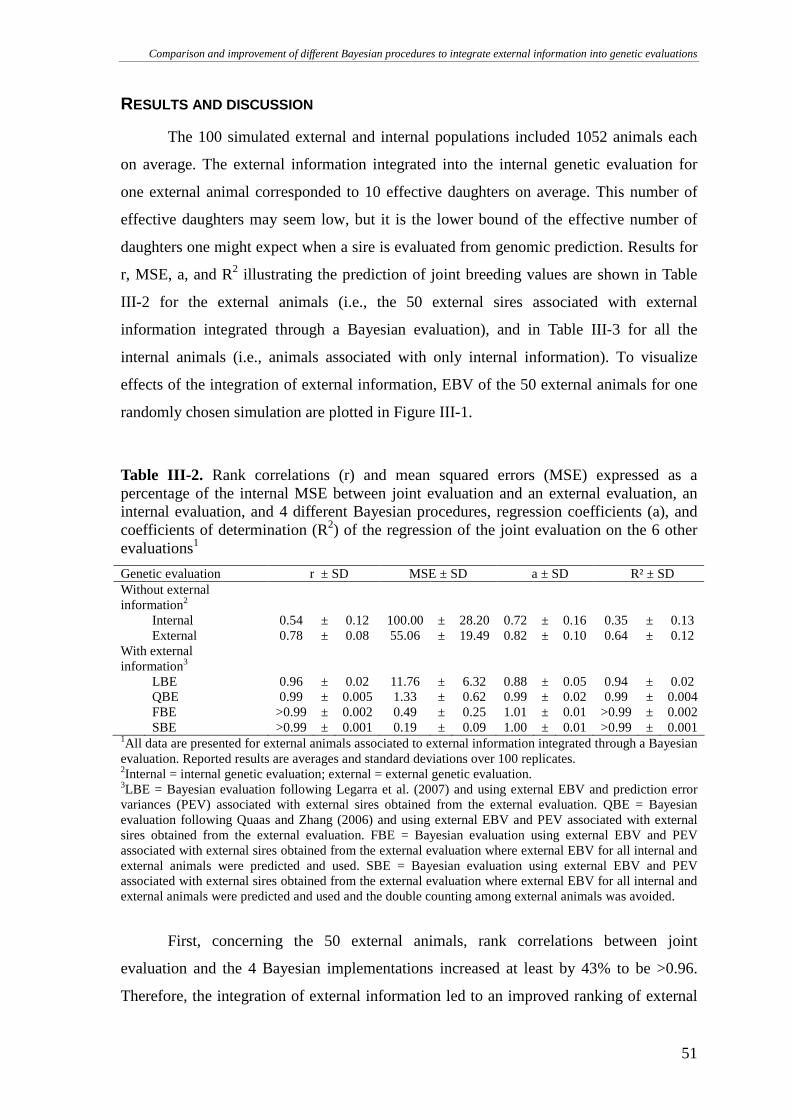
Comparison and improvement of different Bayesian procedures to integrate external information into genetic evaluations
51
RESULTS AND DISCUSSION
The 100 simulated external and internal populations included 1052 animals each
on average. The external information integrated into the internal genetic evaluation for
one external animal corresponded to 10 effective daughters on average. This number of
effective daughters may seem low, but it is the lower bound of the effective number of
daughters one might expect when a sire is evaluated from genomic prediction. Results for
r, MSE, a, and R2 illustrating the prediction of joint breeding values are shown in Table
III-2 for the external animals (i.e., the 50 external sires associated with external
information integrated through a Bayesian evaluation), and in Table III-3 for all the
internal animals (i.e., animals associated with only internal information). To visualize
effects of the integration of external information, EBV of the 50 external animals for one
randomly chosen simulation are plotted in Figure III-1.
Table III-2. Rank correlations (r) and mean squared errors (MSE) expressed as a percentage of the internal MSE between joint evaluation and an external evaluation, an internal evaluation, and 4 different Bayesian procedures, regression coefficients (a), and coefficients of determination (R2) of the regression of the joint evaluation on the 6 other evaluations1
Genetic evaluation r ± SD MSE ± SD a ± SD R² ± SD Without external information2
Internal 0.54 ± 0.12 100.00 ± 28.20 0.72 ± 0.16 0.35 ± 0.13 External 0.78 ± 0.08 55.06 ± 19.49 0.82 ± 0.10 0.64 ± 0.12
With external information3
LBE 0.96 ± 0.02 11.76 ± 6.32 0.88 ± 0.05 0.94 ± 0.02 QBE 0.99 ± 0.005 1.33 ± 0.62 0.99 ± 0.02 0.99 ± 0.004 FBE >0.99 ± 0.002 0.49 ± 0.25 1.01 ± 0.01 >0.99 ± 0.002 SBE >0.99 ± 0.001 0.19 ± 0.09 1.00 ± 0.01 >0.99 ± 0.001
1All data are presented for external animals associated to external information integrated through a Bayesian evaluation. Reported results are averages and standard deviations over 100 replicates. 2Internal = internal genetic evaluation; external = external genetic evaluation. 3LBE = Bayesian evaluation following Legarra et al. (2007) and using external EBV and prediction error variances (PEV) associated with external sires obtained from the external evaluation. QBE = Bayesian evaluation following Quaas and Zhang (2006) and using external EBV and PEV associated with external sires obtained from the external evaluation. FBE = Bayesian evaluation using external EBV and PEV associated with external sires obtained from the external evaluation where external EBV for all internal and external animals were predicted and used. SBE = Bayesian evaluation using external EBV and PEV associated with external sires obtained from the external evaluation where external EBV for all internal and external animals were predicted and used and the double counting among external animals was avoided.
First, concerning the 50 external animals, rank correlations between joint
evaluation and the 4 Bayesian implementations increased at least by 43% to be >0.96.
Therefore, the integration of external information led to an improved ranking of external
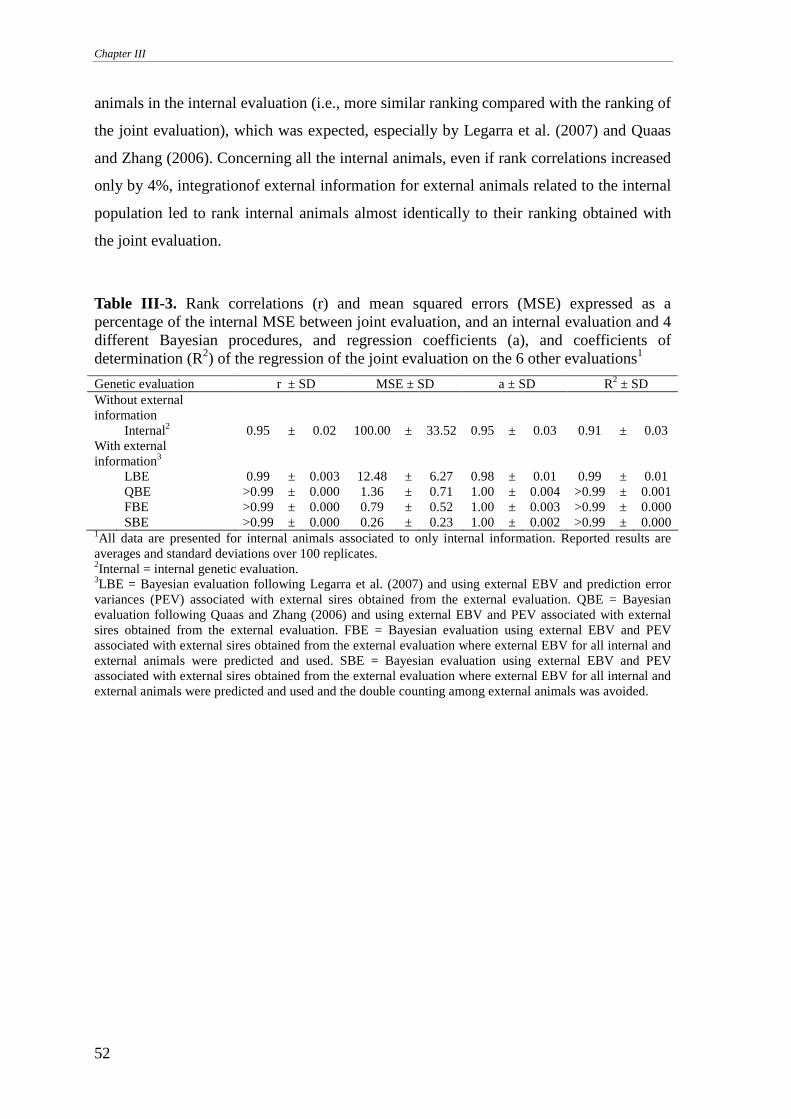
Chapter III
52
animals in the internal evaluation (i.e., more similar ranking compared with the ranking of
the joint evaluation), which was expected, especially by Legarra et al. (2007) and Quaas
and Zhang (2006). Concerning all the internal animals, even if rank correlations increased
only by 4%, integrationof external information for external animals related to the internal
population led to rank internal animals almost identically to their ranking obtained with
the joint evaluation.
Table III-3. Rank correlations (r) and mean squared errors (MSE) expressed as a percentage of the internal MSE between joint evaluation, and an internal evaluation and 4 different Bayesian procedures, and regression coefficients (a), and coefficients of determination (R2) of the regression of the joint evaluation on the 6 other evaluations1
Genetic evaluation r ± SD MSE ± SD a ± SD R2 ± SD Without external information
Internal2 0.95 ± 0.02 100.00 ± 33.52 0.95 ± 0.03 0.91 ± 0.03 With external information3
LBE 0.99 ± 0.003 12.48 ± 6.27 0.98 ± 0.01 0.99 ± 0.01 QBE >0.99 ± 0.000 1.36 ± 0.71 1.00 ± 0.004 >0.99 ± 0.001 FBE >0.99 ± 0.000 0.79 ± 0.52 1.00 ± 0.003 >0.99 ± 0.000 SBE >0.99 ± 0.000 0.26 ± 0.23 1.00 ± 0.002 >0.99 ± 0.000
1All data are presented for internal animals associated to only internal information. Reported results are averages and standard deviations over 100 replicates. 2Internal = internal genetic evaluation. 3LBE = Bayesian evaluation following Legarra et al. (2007) and using external EBV and prediction error variances (PEV) associated with external sires obtained from the external evaluation. QBE = Bayesian evaluation following Quaas and Zhang (2006) and using external EBV and PEV associated with external sires obtained from the external evaluation. FBE = Bayesian evaluation using external EBV and PEV associated with external sires obtained from the external evaluation where external EBV for all internal and external animals were predicted and used. SBE = Bayesian evaluation using external EBV and PEV associated with external sires obtained from the external evaluation where external EBV for all internal and external animals were predicted and used and the double counting among external animals was avoided.
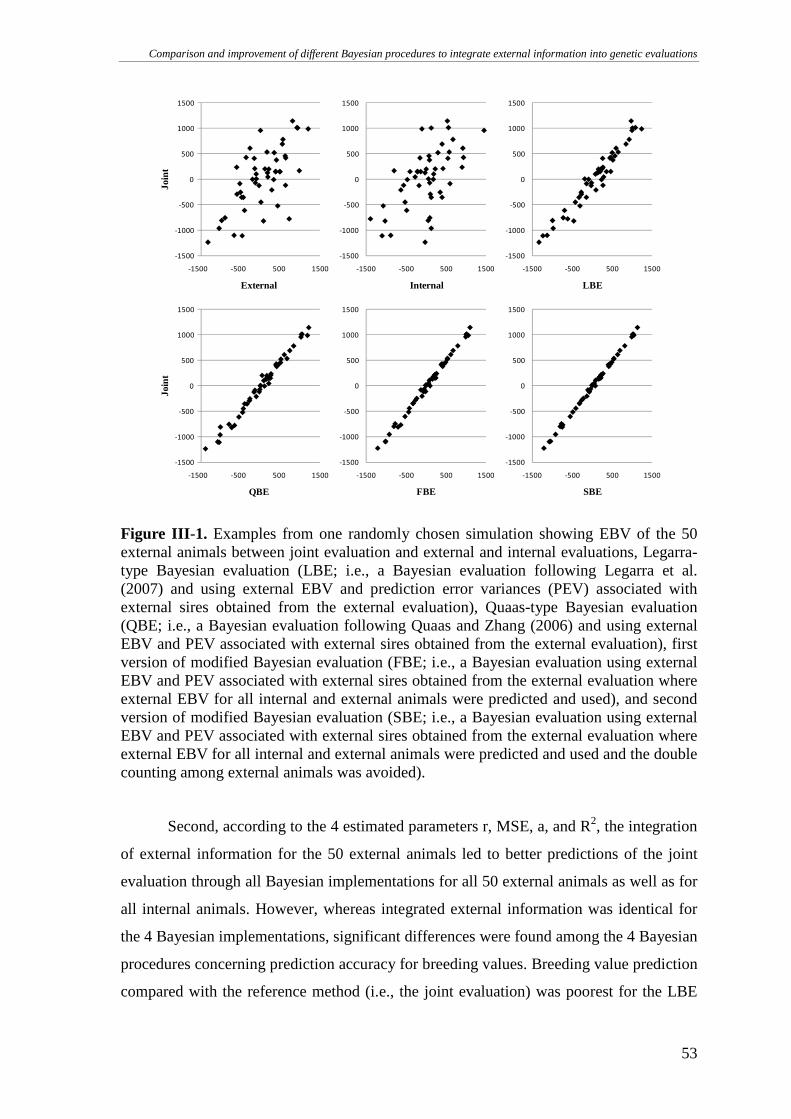
Comparison and improvement of different Bayesian procedures to integrate external information into genetic evaluations
53
-1500
-1000
-500
0
500
1000
1500
-1500 -500 500 1500
Join
t
External
-1500
-1000
-500
0
500
1000
1500
-1500 -500 500 1500
Join
t
QBE
-1500
-1000
-500
0
500
1000
1500
-1500 -500 500 1500
Internal
-1500
-1000
-500
0
500
1000
1500
-1500 -500 500 1500
FBE
-1500
-1000
-500
0
500
1000
1500
-1500 -500 500 1500
LBE
-1500
-1000
-500
0
500
1000
1500
-1500 -500 500 1500
SBE
Figure III-1. Examples from one randomly chosen simulation showing EBV of the 50 external animals between joint evaluation and external and internal evaluations, Legarra-type Bayesian evaluation (LBE; i.e., a Bayesian evaluation following Legarra et al. (2007) and using external EBV and prediction error variances (PEV) associated with external sires obtained from the external evaluation), Quaas-type Bayesian evaluation (QBE; i.e., a Bayesian evaluation following Quaas and Zhang (2006) and using external EBV and PEV associated with external sires obtained from the external evaluation), first version of modified Bayesian evaluation (FBE; i.e., a Bayesian evaluation using external EBV and PEV associated with external sires obtained from the external evaluation where external EBV for all internal and external animals were predicted and used), and second version of modified Bayesian evaluation (SBE; i.e., a Bayesian evaluation using external EBV and PEV associated with external sires obtained from the external evaluation where external EBV for all internal and external animals were predicted and used and the double counting among external animals was avoided).
Second, according to the 4 estimated parameters r, MSE, a, and R2, the integration
of external information for the 50 external animals led to better predictions of the joint
evaluation through all Bayesian implementations for all 50 external animals as well as for
all internal animals. However, whereas integrated external information was identical for
the 4 Bayesian implementations, significant differences were found among the 4 Bayesian
procedures concerning prediction accuracy for breeding values. Breeding value prediction
compared with the reference method (i.e., the joint evaluation) was poorest for the LBE
Chapter III
54
method for the 50 external animals as well as for the internal animals. This can be
explained by the approximation of the matrix D by LBE. It approximates the latter matrix
by a diagonal matrix in which diagonal elements are equal to PEV, ignoring prediction
error covariances associated with every external evaluation. In contrast, the 4 parameters
associated with FBE and SBE showed that integration of all relationships between the 50
external animals and all the internal animals for the approximation of D allowed the
propagation of external information through the whole pedigree. Consequently, internal
animals related to their external relatives were predicted better, too. This propagation is
not possible in current methods based on selection index theory (VanRaden, 2001;
Gengler and VanRaden, 2008), where information is combined on an animal-by-animal
basis. Therefore, FBE and SBE have here a clear advantage compared with current
methods. Furthermore, integration of all relationships allowed us to compute only one
relationship matrix 1A − that takes into account all relationships among internal and
external animals, whereas QBE needs the computation of the matrix 1EEA − as well as the
matrix 1A − . One can assume that numerically the setting up of 1A − using the usual rules
is easier and numerically more stable than computing 1EEA − for potentially several
thousands of animals.
Third, the 4 parameters showed that the SBE led to breeding values most similar
to those estimated by the joint evaluation for the external animals. Values of R2, a, and r
were close to 1 with only few variation among replicates (SD <0.001). Mean squared
error was the lowest of the 4 Bayesian implementations and showed that the application
of TSA avoided double counting among external animals. Outliers of breeding values for
external animals were limited. For the internal animals, QBE, FBE, and SBE were similar
following the 4 parameters. Nevertheless, MSE was the lowest for SBE and showed the
importance of the double counting among external animals on internal animals. However,
with regards to r, a, and R2 for the external and the internal animals estimated by FBE,
double counting could be ignored if contributions due to relationships are low compared
with contributions due to own records. If this is not the case, as for genomic information,
TSA should be applied.
Fourth, no assumption was made about the difference of the amount of
information between external and internal information. An external animal could get
more information from the internal than from the external data. Integration of external
information led to better predictions for breeding values obtained by the joint evaluation.
Comparison and improvement of different Bayesian procedures to integrate external information into genetic evaluations
55
Therefore, integration of external information seems to be important even if the amount is
low.
Finally, the developed methods could be used in different settings. Many
situations exist where local (internal) evaluations would benefit from the integration of
external information (e.g., Gengler and Vanderick, 2008). Because the developed
methods can be used for multi-trait and other complex models, they allow the use of
external information to improve the accuracy of evaluations for correlated, but only
locally available traits as fine milk composition traits, such as free fatty acids, milk
proteins, and other minor constituants (e.g., Gengler et al., 2010). In the context of
genomic selection, integration of external genomic information into routine genetic
evaluations could be done using the proposed methods after some adaptations (e.g.,
Gengler and Verkenne, 2007). Furthermore, as an anonymous reviewer reported, the
matrix 1*G − is very similar to the inverse of the matrix H used in the single-step genomic
evaluations and included both pedigree-based relationships and differences between
pedigree-based and genomic-based relationships (Aguilar et al., 2010; Christensen and
Lund, 2010). In a different setting and after taking precautions to avoid double counting
because of the use of the same data, regular genetic evaluation results from a larger
population could also be used as external priors in gene effect discovery studies (e.g.,
Buske et al, 2010) or any other studies requiring accurate estimation of a polygenic effect
jointly with marker, single nucleotide polymorphisms, or gene effects.
CONCLUSIONS
According to these results, rankings of animals were most similar to those of a
joint evaluation after the integration of all relationships and the application of the TSA to
avoid double counting among external animals through SBE. It proved that the TSA
worked well, although the creation of the absorption matrix M did not take into account
the fixed effects considered in the external evaluation, which were unknown, but only one
hypothetical unobserved fixed effect. The results based on our simulation showed that the
Bayesian procedures FBE and QBE also worked well, with FBE having some
computational advantages. Finally, with some adaptations and adjustments, FBE and SBE
could be applied to integrate external information into routine genetic evaluations, SBE
having additional advantages but being computationally more demanding.
Chapter III
56
ACKNOWLEDGMENTS
This research received financial support from the European Commission,
Directorate-General for Agriculture and Rural Development, under Grand Agreement
211708 and form the Commission of the European Communities, FP7, KBBE-2007-1.
This paper does not necessarily reflect the view of these institutions and in no way
anticipates the Commission’s future policy in this area. Jeremie Vandenplas, research
fellow, and Nicolas Gengler, senior research associate, acknowledge the support of the
National Fund for Scientific Research (Brussels, Belgium) for these positions and for the
additional grants 2.4507.02F, F4552.05, and 2.4.623.08.F. Additional financial support
was provided by the Ministry of Agriculture of Walloon Region of Belgium (Service
Public de Wallonie, Direction générale opérationnelle “Agriculture, Ressources naturelles
et Environnement” – DGARNE) through research projects D31-1207, D31-1224/S1, and
D31-1233/S1. The authors are grateful to the University of Liege (SEGI facility) for the
use of the NIC3 supercomputer facilities. The authors thank the members of the Animal
Breeding and Genetics Group (Animal Science Unit, Gembloux Agro-Bio Tech,
University of Liege), and in particular Bernd Buske and Ryan Ann Davis (University of
Georgia, Athens) for reviewing the manuscript. Useful comments from three anonymous
reviewers are also acknowledged.
REFERENCES
Aguilar, I., I. Misztal, D.L. Johnson, A. Legarra, S. Tsuruta, and T.J. Lawlor. 2010. Hot
topic: A unified approach to utilize phenotypic, full pedigree, and genomic
information for genetic evaluation of Holstein final score. J. Dairy Sci. 93:743–
752.
Aguilar, I., I. Misztal, A. Legarra, and S. Tsuruta. 2011. Efficient computation of the
genomic relationship matrix and other matrices used in single-step evaluation. J.
Anim. Breed. Genet. 128:422–428.
Buske, B., M. Szydlowski, and N. Gengler. 2010. A robust method for simultaneous
estimation of single gene and polygenic effects in dairy cows using externally
estimated breeding values as prior information. J. Anim. Breed. Genet. 127:272–
279.
Christensen, O.F., and M.S. Lund. 2010. Genomic prediction when some animals are not
genotyped. Genet. Sel. Evol. 42:2.
Comparison and improvement of different Bayesian procedures to integrate external information into genetic evaluations
57
Colleau, J.-J. 2002. An indirect approach to the extensive calculation of relationship
coefficients. Genet. Sel. Evol. 34:409–421.
Gengler, N., and S. Vanderick. 2008. Bayesian inclusion of external evaluations into a
national evaluation system: Application to milk production traits. Interbull Bull.
38:70–74.
Gengler, N., S. Vanderick, V. Arnould, and H. Soyeurt. 2010. Genetic evaluation for milk
fat composition in the Walloon Region of Belgium. Interbull Bull. 42:81–84.
Gengler, N., and P.M. VanRaden. 2008. Strategies to incorporate genomic prediction into
populationwide genetic evaluations. J. Dairy Sci. 91(E-Suppl. 1):506. (Abstr.).
Gengler, N., and C. Verkenne. 2007. Bayesian approach to integrate molecular data into
genetic evaluations. Interbull Bull. 37:37–41.
Henderson, C.R. 1984. Applications of linear models in animal breeding. 2nd ed.
University of Guelph, Guelph, ON, Canada.
Klei, L., R.L. Quaas, E.J. Pollak, and B.E. Cunningham. 1996. Multiple-breed evaluation.
Pages 106–113 in Proceedings of the 28th Research Symposium and Annual
Meeting. Beef Improvement Federation.
Legarra, A., J.K. Bertrand, T. Strabel, R.L. Sapp, J.P. Sanchez, and I. Misztal. 2007.
Multi-breed genetic evaluation in a Gelbvieh population. J. Anim. Breed. Genet.
124:286–295.
Misztal, I., A. Legarra, and I. Aguilar. 2009. Computing procedures for genetic evaluation
including phenotypic, full pedigree, and genomic information. J. Dairy Sci.
92:4648–4655.
Misztal, I., and G.R. Wiggans. 1988. Approximation of prediction error variance in large-
scale animal models. J. Dairy Sci. 71(Suppl. 2):27–32.
Mrode, R.A. 2005. Linear models for the prediction of animal breeding values. 2nd ed.
CABI Publishing, Wallingford, UK.
Quaas, R.L., and Z. Zhang. 2006. Multiple-breed genetic evaluation in the US beef cattle
context: Methodology. CD–ROM Comm. 24–12 in Proceedings of the 8th World
Congress on Genetics Applied to Livestock Production, Belo Horizonte, Brazil.
Quaas, R.L., and Z.W. Zhang. 2001. Incorporating external information in multibreed
genetic evaluation. J. Anim. Sci. 79(Suppl. 1):342. (Abstr.).
VanRaden, P.M. 2001. Methods to combine estimated breeding values obtained from
separate sources. J. Dairy Sci. 84 (E. Suppl.):E47–E55.
Van Vleck, L.D. 1994. Algorithms for simulation of animal models with multiple traits
Chapter III
58
and with maternal and non-additive genetic effects. Braz. J. Genet. 17:53–57.
Zhang, Z.W., R.L. Quaas, and E.J. Pollak. 2002. Simulation study on the effects of
incorporating external genetic evaluation results. CD–ROM Comm. 20–14 in
Proceedings of the 7th World Congress on Genetics Applied to Livestock
Production, Montpellier, France.
APPENDIX III-1
EQUIVALENCE OF MIXED MODEL EQUATIONS CONSIDERING THE ESTIMATION OF BASE
DIFFERENCES
Assume that external information is available for both internal and external
animals from a joint genetic evaluation of all internal and external animals based only on
external data and that the vectors of the base differences between the internal genetic
evaluation and the joint genetic evaluation are Eb for the external animals and Ib for the
internal animals. Therefore, the Bayesian mixed model equations (III.1) can be written as
+++
+++++
=
+++
+++
−
−
−
−−
−−
−−−
III
IEIE
I
IEI
EEEE
E
III
EIE
I1
III
IEI
EEE
I1
IIE
I1
II
I
E
I
E
I
III
IEIE
III
IIE
I
IEI
EEEE
EEI
EEE
E
III
EIEII
II1
IIIIE
I1
III
IEI
EEEEIEE
IE1
IIEI1
IIE
II1
IIIE1
III1
II
µGU'µGU'
µGU'Λ)µ(GU'
µGµGyRZ'
µGΛ)µ(GyRZ'
yRX'
b
b
u
u
β
UGU'UGU'GU'GU'0
UGU'Λ)U(GU'GU'Λ)(GU'0
UGUGGZRZ'GXRZ'
UGΛ)U(GGΛGZRZ'XRZ'
00ZRX'ZRX'XRX'
ˆ
ˆˆ
ˆ
ˆ
where IEZ and IIZ are the incidence matrices for the external and internal animals,
respectively.
Because 1EE
1 GDΛ −− −= , 0G)(GGG IE1IIIIIE =− − , 1EE
IE1IIEIEE GG)(GGG −− =−
and EIE1II
I uG)(Gu ˆˆ −−= , the development of the fourth equation leads
to 0bUGUbΛ)U(GU)µu(DU' IIEI
EEEEE
EEE1
E =+++−− ˆˆ'ˆ , and the development of the
fifth equation leads to EEIE1II
II bUG)(GbU ˆˆ −−= .
After absorption of the fifth equation, the vector Eb is estimated as
)u(µDU')UD(U'b EE1
E1
E1
EE ˆˆ −= −−− . Furthermore, it can be shown that 0µGµG III
EIE =+
and E1
IEI
EEE µDµGΛ)µ(G −=++ . The equivalent mixed model equations can be written
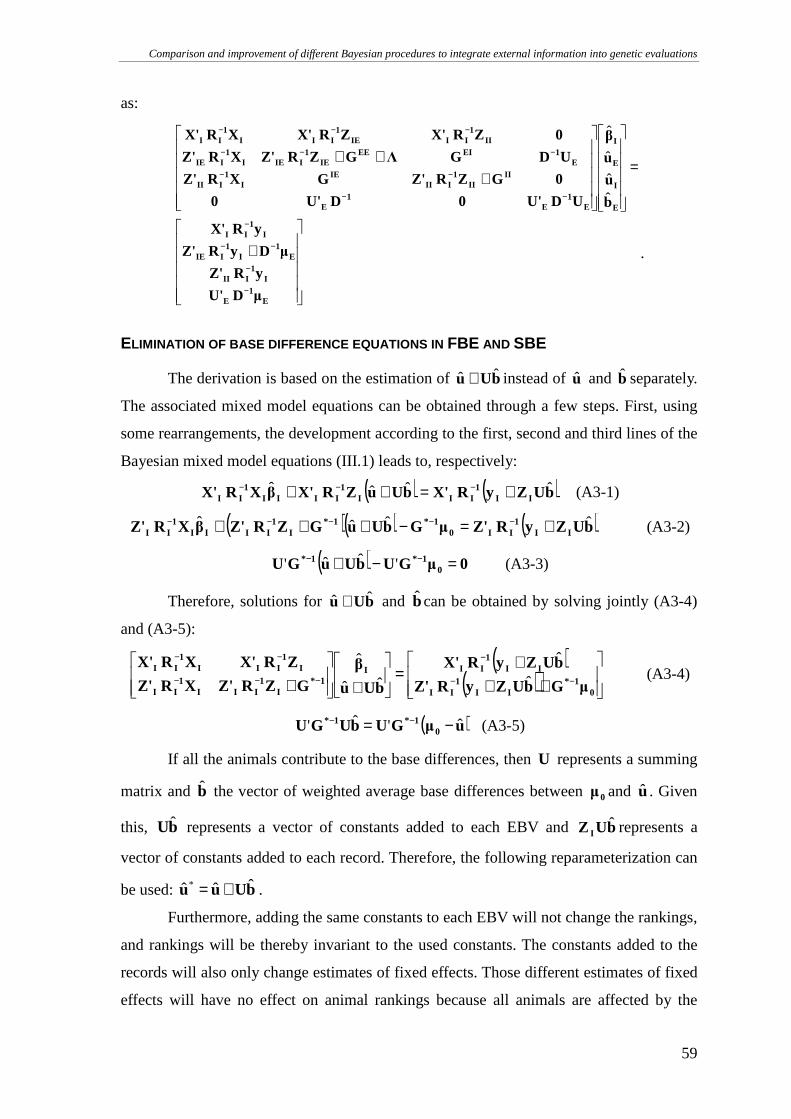
Comparison and improvement of different Bayesian procedures to integrate external information into genetic evaluations
59
as:
+
=
+++
−
−
−−
−
−−
−−
−−−
−−−
E1
E
I1
III
E1
I1
IIE
I1
II
E
I
E
I
E1
E1
E
IIII
1III
IEI
1III
E1EIEE
IE1
IIEI1
IIE
II1
IIIE1
III1
II
µDU'
yRZ'
µDyRZ'
yRX'
b
u
u
β
UDU'0DU'0
0GZRZ'GXRZ'
UDGΛGZRZ'XRZ'
0ZRX'ZRX'XRX'
ˆˆ
ˆ
ˆ
.
ELIMINATION OF BASE DIFFERENCE EQUATIONS IN FBE AND SBE
The derivation is based on the estimation of bUu ˆˆ + instead of u and b separately.
The associated mixed model equations can be obtained through a few steps. First, using
some rearrangements, the development according to the first, second and third lines of the
Bayesian mixed model equations (III.1) leads to, respectively:
( ) ( )bUZyRX'bUuZRX'βXRX' II1
III1
IIII1
IIˆˆˆˆ +=++ −−− (A3-1)
( )( ) ( )bUZyRZ'µGbUuGZRZ'βXRZ' II1
II01*1*
I1
IIII1
IIˆˆˆˆ +=−+++ −−−−− (A3-2)
( ) 0µGUbUuGU 01*1* =−+ −− 'ˆˆ' (A3-3)
Therefore, solutions for bUu ˆˆ + and bcan be obtained by solving jointly (A3-4)
and (A3-5):
( )( )
+++
=
+
+ −−
−
−−−
−−
01*
II1
II
II1
III1*
I1
III1
II
I1
III1
II
µGbUZyRZ'
bUZyRX'
bUu
β
GZRZ'XRZ'
ZRX'XRX'ˆ
ˆ
ˆˆ
ˆ (A3-4)
( )uµGUbUGU 01*1* ˆ'ˆ' −= −− (A3-5)
If all the animals contribute to the base differences, then U represents a summing
matrix and b the vector of weighted average base differences between 0µ and u . Given
this, bUˆ represents a vector of constants added to each EBV and bUZ Iˆ represents a
vector of constants added to each record. Therefore, the following reparameterization can
be used: bUuu ˆˆˆ * += .
Furthermore, adding the same constants to each EBV will not change the rankings,
and rankings will be thereby invariant to the used constants. The constants added to the
records will also only change estimates of fixed effects. Those different estimates of fixed
effects will have no effect on animal rankings because all animals are affected by the
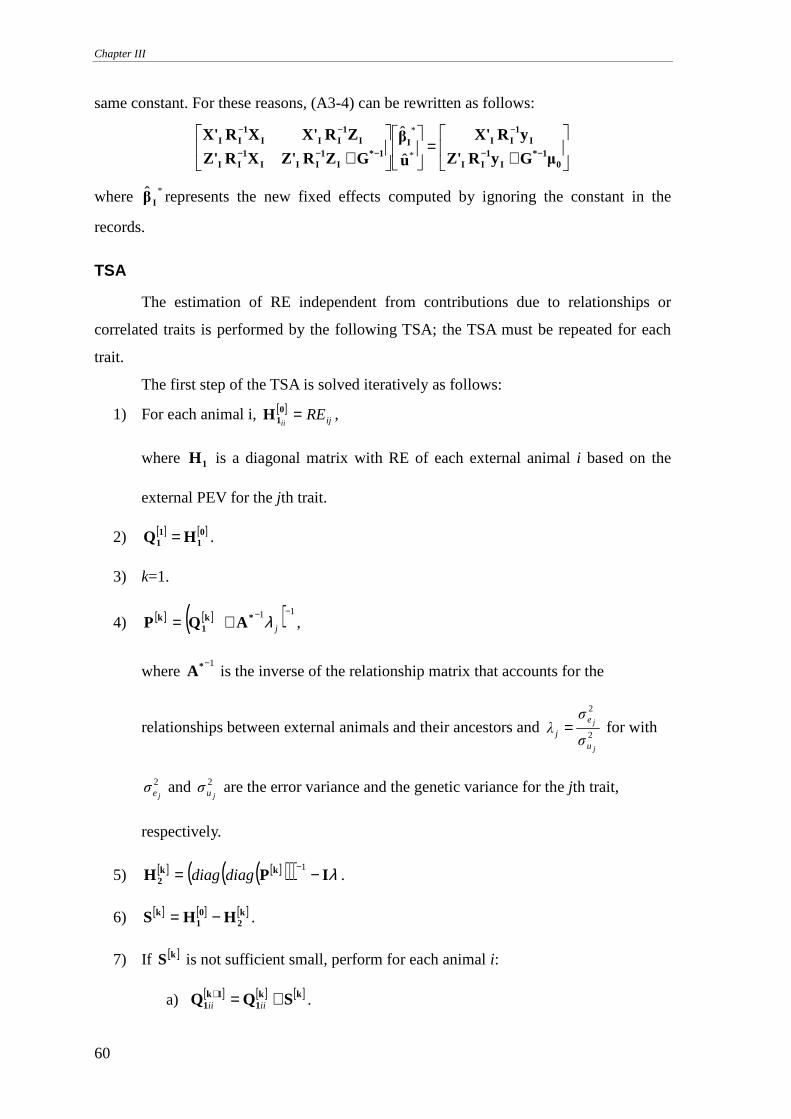
Chapter III
60
same constant. For these reasons, (A3-4) can be rewritten as follows:
+=
+ −−
−
−−−
−−
01*
I1
II
I1
III1*
I1
III1
II
I1
III1
II
µGyRZ'
yRX'
u
β
GZRZ'XRZ'
ZRX'XRX'*
*
ˆ
ˆ
where *ˆIβ represents the new fixed effects computed by ignoring the constant in the
records.
TSA
The estimation of RE independent from contributions due to relationships or
correlated traits is performed by the following TSA; the TSA must be repeated for each
trait.
The first step of the TSA is solved iteratively as follows:
1) For each animal i, [ ]ijRE
ii=0
1H ,
where 1H is a diagonal matrix with RE of each external animal i based on the
external PEV for the jth trait.
2) [ ] [ ]01
11 HQ = .
3) k=1.
4) [ ] [ ]( ) 11 −−+= jλ*k1
k AQP ,
where 1−*A is the inverse of the relationship matrix that accounts for the
relationships between external animals and their ancestors and 2
2
j
j
u
e
jσ
σ
λ = for with
2
jeσ and 2
juσ are the error variance and the genetic variance for the jth trait,
respectively.
5) [ ] [ ]( )( )( ) λIPH kk2 −= −1
diagdiag .
6) [ ] [ ] [ ]k2
01
k HHS −= .
7) If [ ]kS is not sufficient small, perform for each animal i:
a) [ ] [ ] [ ]kk1
1k1 SQQ +=+
iiii .
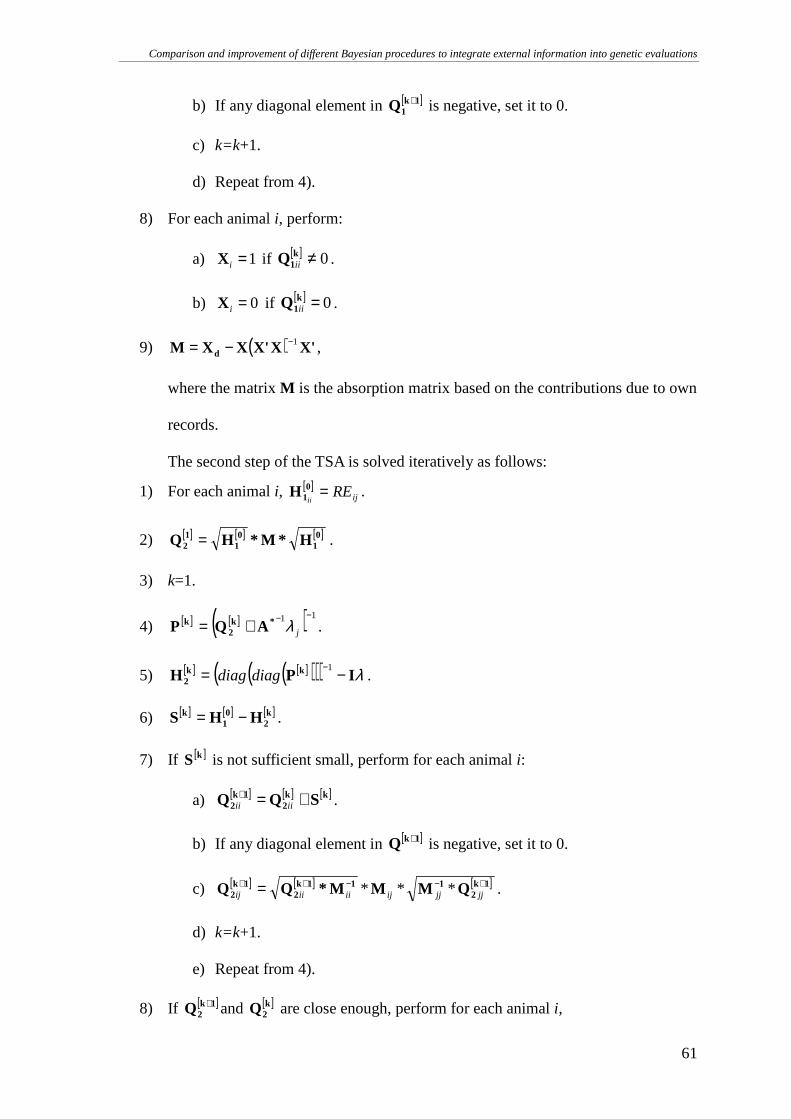
Comparison and improvement of different Bayesian procedures to integrate external information into genetic evaluations
61
b) If any diagonal element in [ ]1k1Q + is negative, set it to 0.
c) k=k+1.
d) Repeat from 4).
8) For each animal i, perform:
a) 1=iX if [ ] 0≠k1Q ii .
b) 0=iX if [ ] 0=k1Q ii .
9) ( ) X'XX'XXM d1−−= ,
where the matrix M is the absorption matrix based on the contributions due to own
records.
The second step of the TSA is solved iteratively as follows:
1) For each animal i, [ ]ijRE
ii=0
1H .
2) [ ] [ ] [ ]01
01
12 H*M*HQ = .
3) k=1.
4) [ ] [ ]( ) 11 −−+= jλ*k2
k AQP .
5) [ ] [ ]( )( )( ) λIPH kk2 −= −1
diagdiag .
6) [ ] [ ] [ ]k2
01
k HHS −= .
7) If [ ]kS is not sufficient small, perform for each animal i:
a) [ ] [ ] [ ]kk2
1k2 SQQ +=+
iiii .
b) If any diagonal element in [ ]1kQ + is negative, set it to 0.
c) [ ] [ ] [ ]1k2
111k2
1k2 QMMM*QQ +−−++ = jjjjijiiiiij *** .
d) k=k+1.
e) Repeat from 4).
8) If [ ]1k2Q + and [ ]k
2Q are close enough, perform for each animal i,

Chapter III
62
[ ] 11k2
*j M*QRE −+= iiiiii
,
where *jRE is a diagonal matrix with diagonal elements equal to RE only due
to own records for the jth trait.
Chapter IV. A N INTEGRATION OF EXTERNAL INFORMATION FOR
FOREIGN STALLIONS INTO THE BELGIAN GENETIC EVALUATION
FOR JUMPING HORSES
The previous Chapter proposed a Bayesian procedure to integrate
external information into a genetic evaluation considering
computational burden and double counting of contributions due to
relationships among external animals. However, this procedure
was tested only on simulated data. Therefore, the objective of this
Chapter was to apply the proposed Bayesian procedure to
integrate external information provided by France and the
Netherlands for foreign stallions into the Belgian genetic
evaluation for show jumping horses.
From: Vandenplas, J., S. Janssens, N. Buys, and N. Gengler. 2013. An integration of
external information for foreign stallions into the Belgian genetic evaluation for
jumping horses. J. Anim. Breed. Genet. 130:209–217. (Used by permission of the
Journal of Animal Breeding and Genetics)

An integration of external information for foreign stallions into the Belgian genetic evaluation for jumping horses
65
SUMMARY
The aim of this study was to test the integration of external information, i.e.
foreign estimated breeding values (EBV) and the associated reliabilities (REL), for
stallions into the Belgian genetic evaluation for jumping horses. The Belgian model is a
bivariate repeatability Best Linear Unbiased Prediction animal model only based on
Belgian performances, while Belgian breeders import horses from neighbouring
countries. Hence, use of external information is needed as prior to achieve more accurate
EBV. Pedigree and performance data contained 101 382 horses and 712 212
performances, respectively. After conversion to the Belgian trait, external information of
98 French and 67 Dutch stallions was integrated into the Belgian evaluation. Resulting
Belgian rankings of the foreign stallions were more similar to foreign rankings according
to the increase of the rank correlations of at least 12%. REL of their EBV were improved
of at least 2% on average. External information was partially to totally equivalent to 4
years of contemporary horses’ performances or to all the stallions’ own performances. All
these results showed the interest to integrate external information into the Belgian
evaluation.
Key words: Bayesian approach, external information, integration, jumping horses
INTRODUCTION
The Belgian sport horse population is situated at the crossroads of different sport
horse populations, which leads to a mix of the European genes. Artificial insemination
facilitates the use of foreign stallions since the 1980s. For these reasons, Belgium seems
to be one of the centres for European sport horse breeding (Ruhlmann et al., 2009a).
Three Belgian studbooks of warmblood horses are involved, that is the Belgian
Warmblood Horse Studbook (BWP), the Royal Belgian Sports Horse Society (sBs) and
the Studbook Zangersheide. For all three, the improvement in the performances in show
jumping is an important breeding objective (Koenen et al., 2004).
Since 1998, a genetic evaluation for show jumping horses is implemented in
Belgium, and as in most other European countries, the estimated breeding values (EBV)
are based on national information only (Koenen and Aldridge, 2002; Janssens et al.,
2007), whereas the Belgian sport horse population is clearly linked with other foreign
studbooks. This may lead to a limited reliability (REL) of EBV for horses with few
Belgian records and to inappropriate breeders’ choices of a stallion on the international
Chapter IV
66
scene. Similar issues exist in other countries as sport horse breeding is very international.
Based on experiences in dairy cattle breeding, for which ‘Interbull’ (Uppsala, Sweden)
provides sire EBV for dairy cattle from different countries, an international group of
scientists and breeding organizations, called ‘Interstallion’, was created in 1998 to
achieve reliable breeding values across countries for sport horse stallions. Within the
framework of this group, Ruhlmann et al. (2009b) concluded that an international
evaluation of jumping horses is feasible. However, such an international genetic
evaluation combining all information sources is not yet available, and one option is to
integrate external information into the local genetic evaluation. Different theoretical
approaches exist to do this. In the case of multibreed genetic evaluations for beef cattle,
Klei et al. (1996) proposed a Bayesian approach where external information is considered
as prior information for the local evaluation. Two different Bayesian derivations were
proposed by Quaas and Zhang (2006) and Legarra et al. (2007). Recently, Vandenplas
and Gengler (2012) proposed some improvements to these methods, especially to take
into account the double counting among related external animals. However, some issues
arise before the implementation of a Bayesian procedure, like the independence of the
external evaluations from the internal one or the similarities between the external and
internal evaluated traits (Gengler and Vanderick, 2008).
The first aim of this study was to apply a Bayesian approach to integrate external
information, i.e., foreign EBV and their associated REL, for stallions into the Belgian
genetic evaluation of show jumping horses, and the second aim was to test the model
adequacy and the predictive ability of the applied method.
MATERIALS AND METHODS
Performance data on show jumping were provided by the horse riding
organization for national level competitions, the Royal Belgian Federation for Equestrian
Sports (KBRSF), and by the horse riding organization for recreational level competitions,
the Rural Riding Association (LRV). The available performance data (data I) included
710 212 performances from 44 755 competitive horses during the period 1991–2009.
Performances in show jumping consisted of ranking of horses participating in show
jumping competitions converted into normalized score by a Blom’s approximation
(Janssens et al., 2007). These performances were also considered as two traits in terms of
competition levels, that is the KBRSF level and the LRV level. The KBRSF level was
considered as the Belgian breeding goal trait (hereafter called Belgian trait). The pedigree
An integration of external information for foreign stallions into the Belgian genetic evaluation for jumping horses
67
file, a combination of pedigree records provided by sBs and BWP, included 101 382
registered horses. The following bivariate repeatability Best Linear Unbiased Prediction
(BLUP) animal model was applied to perform the Belgian genetic evaluation (evaluation
A; Janssens et al. 1997, 2007):
eZpZuXβy +++= (IV.1)
where y was the vector of performances, β was the vector of fixed effects, u was the
vector of random additive genetic effects, p was the vector of random permanent
environmental effects and e was the vector of residuals. X and Z were incidence
matrices relating performances to fixed effects and to random effects, respectively.
Fixed effects were the age of the participating horse, its sex and the show jumping
event organized by the KBRSF or by the LRV in which it participated. Variance
components for the random permanent environmental and genetic effects used for this
study were those estimated by Janssens et al. (1997). Heritability was equal to 0.10 for
performances at the KBRSF level (i.e. the Belgian trait) and to 0.11 for performances at
the LRV level. Genetic correlation between these two traits was equal to 0.63.
Despite the fact that two traits are evaluated, only breeding values for
performances in KBRSF level estimated using both performances in KBRSF level and
LRV level (i.e. EBV estimated by the evaluation A for the Belgian trait; EBVA) of
stallions approved by BWP and/or sBs are published on a standardized scale following
the recommendations of ‘Interstallion’ (Interstallion, 2005; Janssens and Buys, 2008).
Reliabilities of EBVA based on data I (EBVAI; RELAI; Table IV-1) were computed
using the equation:
21 gPEV/σREL −= (IV.2)
where 2gσ is the genetic variance for the Belgian trait and PEV is the prediction error
variance obtained from the diagonal element of the inverted left hand side of the mixed
model equations (IV.1).
Available external information consisted of external EBV (EBVE) and their
associated external REL (RELE) for stallions approved by BWP having a published
Belgian index, born after 1978 and originally registered in a Dutch or a French studbook.
External information on 98 French stallions and 67 Dutch stallions was provided by the
Station de Génétique Quantitative et Appliquée, Institut National de la Recherche
Agronomique (France) and the Royal Dutch Sport Horse (the Netherlands), respectively.
However, because EBVE were not the same trait and not expressed on the same scale as
Chapter IV
68
the Belgian trait, precorrections were needed before its integration into the Belgian
genetic evaluation.
Table IV-1. Performed genetic evaluations, estimated breeding values (EBV) and reliabilities (REL)
Datasets2 Genetic evaluation1 I II III
A Evaluation AI, EBVAI,
RELAI Evaluation AII, EBVAII ,
RELAII Evaluation AIII, EBVAIII ,
RELAIII
B Evaluation BI, EBVBI,
RELBI Evaluation BII, EBVBII,
RELBII Evaluation BIII, EBVBIII ,
RELBIII 1A = Belgian genetic evaluation; B = Bayesian evaluation. 2I = complete data; II = data for which all performances after 31 December 2005 were assumed to be missing; III = data for which all the French and Dutch stallions’ own performances were assumed to be missing.
First, EBVE were converted to the Belgian trait and scale of the year 2009 for both
countries. This conversion was performed separately for Dutch and French stallions
following the method detailed by Goddard (1985) that regressed previously deregressed
internal EBV on external EBV. The 2 samples to estimate conversion equations for the
Dutch and French stallions included all Dutch stallions (i.e., 47) and French stallions (i.e.,
93) having both an EBVAI and an EBVE, respectively. REL of the converted EBV (RELc)
were estimated from all the RELE provided by France and by the Netherlands following
the method detailed by Goddard (1985) that took into account the error in estimating the
true regression equation and the variance of the converted EBV (EBVc) about the true
regression equation. External information with a RELc lower than 0.01 was set to missing.
It is noted that genetic correlation coefficients for traits between Belgium and the
exporting countries were needed for the conversion following Goddard (1985). Because
no genetic correlation coefficient was available for the pair Belgium/the Netherlands
(Ruhlmann et al., 2009b), the genetic correlation coefficients for traits were approximated
by the Pearson correlation coefficient between Dutch EBVE and EBVAI estimated for the
Dutch stallions for the pair Belgium/the Netherlands and by the Pearson correlation
coefficient between French EBVE and EBVAI estimated for the French stallions for the
pair Belgium/France. Second, EBVE had to be free from internal information to avoid
double counting between external and internal information (Gengler and Vanderick,
2008). The literature review of Koenen (2002) and van Veldhuizen (1997) for the Dutch
genetic evaluation and of Tavernier (1991) and Ricard (1997) for the French genetic
evaluation showed that France and the Netherlands never use the same phenotypic
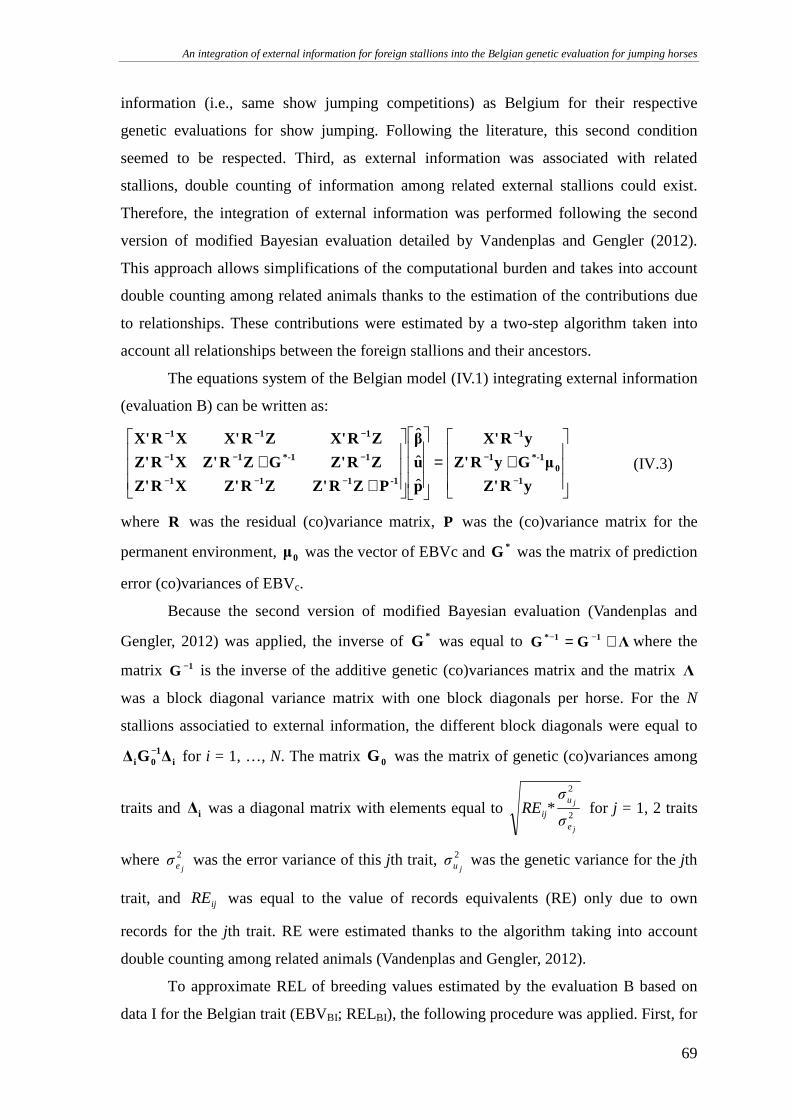
An integration of external information for foreign stallions into the Belgian genetic evaluation for jumping horses
69
information (i.e., same show jumping competitions) as Belgium for their respective
genetic evaluations for show jumping. Following the literature, this second condition
seemed to be respected. Third, as external information was associated with related
stallions, double counting of information among related external stallions could exist.
Therefore, the integration of external information was performed following the second
version of modified Bayesian evaluation detailed by Vandenplas and Gengler (2012).
This approach allows simplifications of the computational burden and takes into account
double counting among related animals thanks to the estimation of the contributions due
to relationships. These contributions were estimated by a two-step algorithm taken into
account all relationships between the foreign stallions and their ancestors.
The equations system of the Belgian model (IV.1) integrating external information
(evaluation B) can be written as:
+=
++
−
−
−
−−−
−−−
−−−
yRZ'
µGyRZ'
yRX'
p
u
β
PZRZ'ZRZ'XRZ'
ZRZ'GZRZ'XRZ'
ZRX'ZRX'XRX'
10
-1*1
1
-1111
1-1*11
111
ˆ
ˆ
ˆ
(IV.3)
where R was the residual (co)variance matrix, P was the (co)variance matrix for the
permanent environment, 0µ was the vector of EBVc and *G was the matrix of prediction
error (co)variances of EBVc.
Because the second version of modified Bayesian evaluation (Vandenplas and
Gengler, 2012) was applied, the inverse of *G was equal to ΛGG 11* += −− where the
matrix 1G − is the inverse of the additive genetic (co)variances matrix and the matrix Λ
was a block diagonal variance matrix with one block diagonals per horse. For the N
stallions associatied to external information, the different block diagonals were equal to
i1
0i ∆G∆ − for i = 1, …, N. The matrix 0G was the matrix of genetic (co)variances among
traits and i∆ was a diagonal matrix with elements equal to 2
2
j
j
e
u
ijσ
σ
*RE for j = 1, 2 traits
where 2
jeσ was the error variance of this jth trait, 2
juσ was the genetic variance for the jth
trait, and ijRE was equal to the value of records equivalents (RE) only due to own
records for the jth trait. RE were estimated thanks to the algorithm taking into account
double counting among related animals (Vandenplas and Gengler, 2012).
To approximate REL of breeding values estimated by the evaluation B based on
data I for the Belgian trait (EBVBI; RELBI), the following procedure was applied. First, for
Chapter IV
70
each stallion that had external information, one virtual performance was added to the
performance data and weighted by the value of RE independent from contributions due to
relationships. The weight for the real performances in the performance data was equal to
1. An additional level for each fixed effect of the Belgian genetic evaluation was created
and assigned to the virtual performances to ensure that they had no influence on the
genetic evaluation. PEV were estimated by the inversion of the left hand side of the
mixed model equations, and RELBI were calculated using the equation (IV.2). All the
genetic evaluations and computations of PEV were performed using the BLUPF90
program family (Misztal, 2012) modified to integrate external information by taking into
account double counting among related animals.
Descriptive statistics were computed to characterize integrated external
information and its influence on the ranking of the horses. With regard to RELE, RELc
and RE, mean and standard deviations (SD) as well as the number of foreign stallions
associated with a non-zero RELE, a non-zero RELc and non-zero RE were described.
Pearson correlation coefficients between EBVAI and EBVE and the coefficients of
determination of the conversion equations for the Dutch and French stallions were also
computed, as well as Spearman rank correlation coefficients among EBVAI, EBVBI and
EBVE, for all the horses, for the French stallions, for the Dutch stallions and for the 100
best stallions. This latter group included the 100 best-ranked stallions following the
evaluation AI, born after 1979 and associated with a RELAI equal or higher than 0.75. The
model adequacy was tested by the comparison of accuracy and precision of the
evaluations AI and BI through comparisons of mean bias (MB), mean squared error of
prediction (MSEP) and Pearson correlation coefficients between observed and estimated
performances associated with the Belgian trait (yy:r ; Tedeschi, 2006). Considering all the
horses, MB and MSEP were expressed as a percentage of the average performance of all
the performances. Considering the 100 best stallions, the Dutch and French stallions, MB
and MSEP were expressed as a percentage of the average performance of their
performances, respectively.
To test the predictive ability of the applied method, subsets II and III were created
and evaluations A and B were performed based on these two subsets (i.e., evaluations
AII, AIII, BII and BIII). Resulting EBV for the Belgian trait are called EBVAI, EBVAII ,
EBVAIII , EBVBI, EBVBII and EBVBIII (Table IV-1). Subset II consisted of all performances
before 31 December 2005 included. All other performances were assumed to be missing
An integration of external information for foreign stallions into the Belgian genetic evaluation for jumping horses
71
(i.e., 34.5% of all the performances). It simulated the predictive ability of the method
routinely applied. Subset III consisted of the complete data except for all French and
Dutch stallions’ own performances assumed to be missing (i.e., 0.27% of all the
performances). It simulated the predictive ability of the method applied for stallions with
no own Belgian performances. REL of EBVAII , EBVAIII , EBVBII and EBVBIII (RELAII ,
RELAIII , RELBII and RELBIII , respectively) were approximated as described previously for
evaluations A and B. Pearson correlation coefficients (rII) between EBVAI and EBVAII ,
and EBVBI and EBVBII, as well as Pearson correlation coefficients (rIII) between EBVAI
and EBVAIII , and EBVBI and EBVBIII , were estimated. Furthermore, variances of the
differences (VARII) between EBVAI and EBVAII , and EBVBI and EBVBII, as well as
variances of the differences (VARIII) between EBVAI and EBVAIII , and EBVBI and
EBVBIII , were also estimated. rII, rIII , VARII and VARIII were estimated for all the horses
included in the genetic evaluations, for the 100 best stallions and for the French and
Dutch stallions.
Means and SD of RELAI, RELAII , RELAIII , RELBI, RELBII and RELBIII were
computed for all horses, for the French stallions and for the Dutch stallions.
RESULTS AND DISCUSSION
DESCRIPTIVE STATISTICS
Among the 98 French and 67 Dutch stallions associated with external information,
only 97 French and 54 Dutch stallions had a non-zero RELc. Furthermore, RELc
decreased at least by 57% compared with RELE (Table IV-2). This decrease was expected
because, first, the coefficients of determination of the conversion equations and, second,
the Pearson correlation coefficients between EBVAI and EBVE in the conversion
equations were low to moderate (Table IV-2). Powell et al. (1994) surveyed different
countries to determine expressions of RELc associated with EBVc in the context of dairy
cattle. Several countries considered that RELc were equal to RELE. However, because
RELc must be integrated into a genetic evaluation, the variances of the sample regression
equations must be taken into account as it was detailed by Goddard (1985). Therefore,
lower variances of the sample regression equations and higher coefficients of
determination, that is more accurate conversion equations, would be desirable to estimate
reliable EBVc (i.e., to obtain higher RELc). Restrictions on data used for the comparisons
of genetic evaluations between countries were formulated to improve the accuracy of
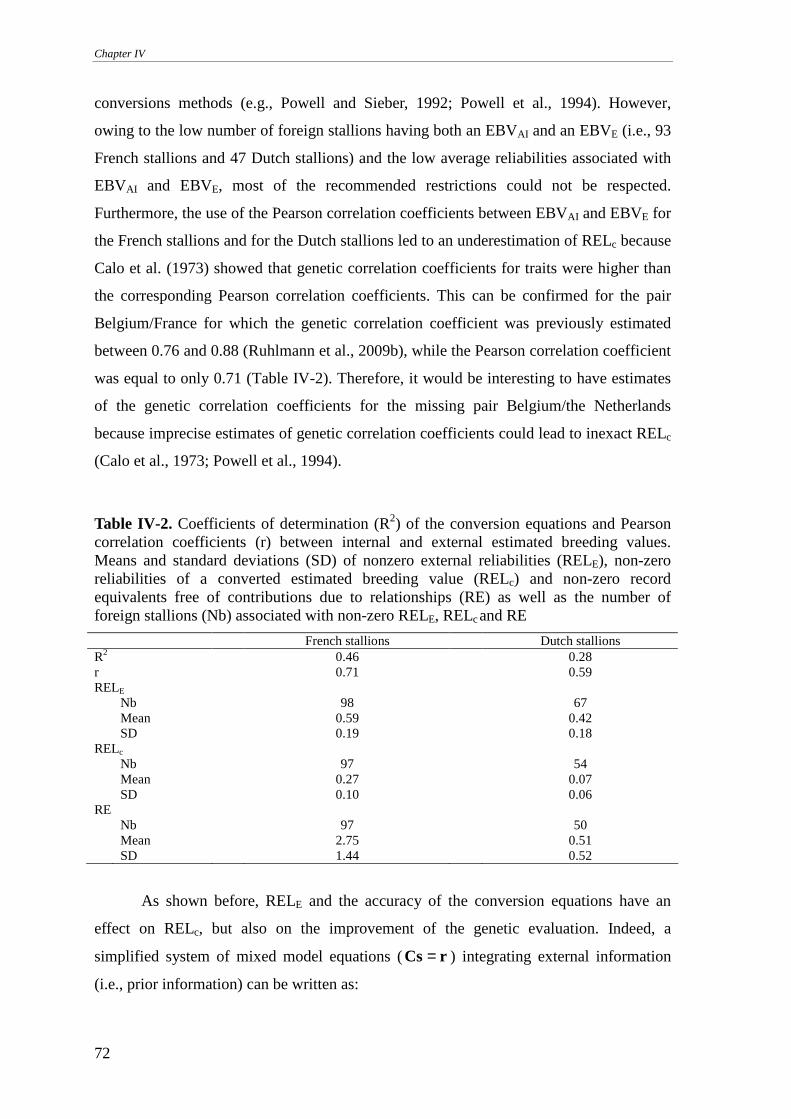
Chapter IV
72
conversions methods (e.g., Powell and Sieber, 1992; Powell et al., 1994). However,
owing to the low number of foreign stallions having both an EBVAI and an EBVE (i.e., 93
French stallions and 47 Dutch stallions) and the low average reliabilities associated with
EBVAI and EBVE, most of the recommended restrictions could not be respected.
Furthermore, the use of the Pearson correlation coefficients between EBVAI and EBVE for
the French stallions and for the Dutch stallions led to an underestimation of RELc because
Calo et al. (1973) showed that genetic correlation coefficients for traits were higher than
the corresponding Pearson correlation coefficients. This can be confirmed for the pair
Belgium/France for which the genetic correlation coefficient was previously estimated
between 0.76 and 0.88 (Ruhlmann et al., 2009b), while the Pearson correlation coefficient
was equal to only 0.71 (Table IV-2). Therefore, it would be interesting to have estimates
of the genetic correlation coefficients for the missing pair Belgium/the Netherlands
because imprecise estimates of genetic correlation coefficients could lead to inexact RELc
(Calo et al., 1973; Powell et al., 1994).
Table IV-2. Coefficients of determination (R2) of the conversion equations and Pearson correlation coefficients (r) between internal and external estimated breeding values. Means and standard deviations (SD) of nonzero external reliabilities (RELE), non-zero reliabilities of a converted estimated breeding value (RELc) and non-zero record equivalents free of contributions due to relationships (RE) as well as the number of foreign stallions (Nb) associated with non-zero RELE, RELc and RE
French stallions Dutch stallions R2 0.46 0.28 r 0.71 0.59 RELE Nb 98 67
Mean 0.59 0.42 SD 0.19 0.18
RELc Nb 97 54
Mean 0.27 0.07 SD 0.10 0.06
RE Nb 97 50 Mean 2.75 0.51 SD 1.44 0.52
As shown before, RELE and the accuracy of the conversion equations have an
effect on RELc, but also on the improvement of the genetic evaluation. Indeed, a
simplified system of mixed model equations ( rCs = ) integrating external information
(i.e., prior information) can be written as:
An integration of external information for foreign stallions into the Belgian genetic evaluation for jumping horses
73
( ) µVrsVC 11 −− +=+ (IV.4)
where C , r and s are the left hand side, the right hand side and the vector of solutions of
the mixed model equations, respectively, µ is the vector of mean prior information and
V is the prior variance matrix.
On the one hand, in the case of highly accurate prior information (i.e., in this case,
high RELc needed high RELE and accurate conversion equations), the value of V will be
close to zero, 1V − will be large and, therefore, the equations system (IV.4) will tend to
µVsV 11 −− = and the estimate of s to µs ≈ˆ . On the other hand, in the case of low
accurate prior information, (i.e., in this case, low RELc estimated from low RELE and/or
poorly accurate conversion equations), the prior information is non informative, the value
of V will be large, 1V − will tend to zero and, therefore, the equations system (IV.4) will
tend to rCs = and the estimate of s to rCs 1−≈ˆ , similarly to a system which do not
integrate prior information. Between these two extreme cases, s can be considered as a
weighted average of the combination of data and prior information (Klei et al., 1996).
With regard to RE (Table IV-2), the number for each stallion was a function of
RELc and of the relationships with other stallions. The low number of RE can be
explained by the low-to-moderate RELc but also by the low-to-moderate coefficients of
determination of the conversion equations and Pearson correlation coefficients between
EBVAI and EBVE. Furthermore, 4 Dutch stallions that were highly related to other ones
were associated with RE equal to 0 after estimation of contributions due to relationships,
while this was not the case for the French stallions. Hence, considering contributions due
to relationships seems necessary to avoid double counting of external information.
Concerning the rankings of the horses, the rank correlation between EBVAI and
EBVBI for all horses (Table IV-3) showed that the integration of external information for
foreign stallions into the Belgian genetic evaluation influenced very slightly the ranking
of the whole population. These modifications can be explained by the animal model: all
the relationships between the foreign stallions and other horses were taken into account.
These relationships caused an effect of foreign information on related horses through the
foreign stallions. However, these modifications were small because external information
was integrated only for about 0.2% of the horses. Concerning the foreign stallions, the
integration of external information led to a change of their rankings according to the rank
correlations between EBVE and EBVAI or EBVBI (Table IV-3). The Belgian ranking of
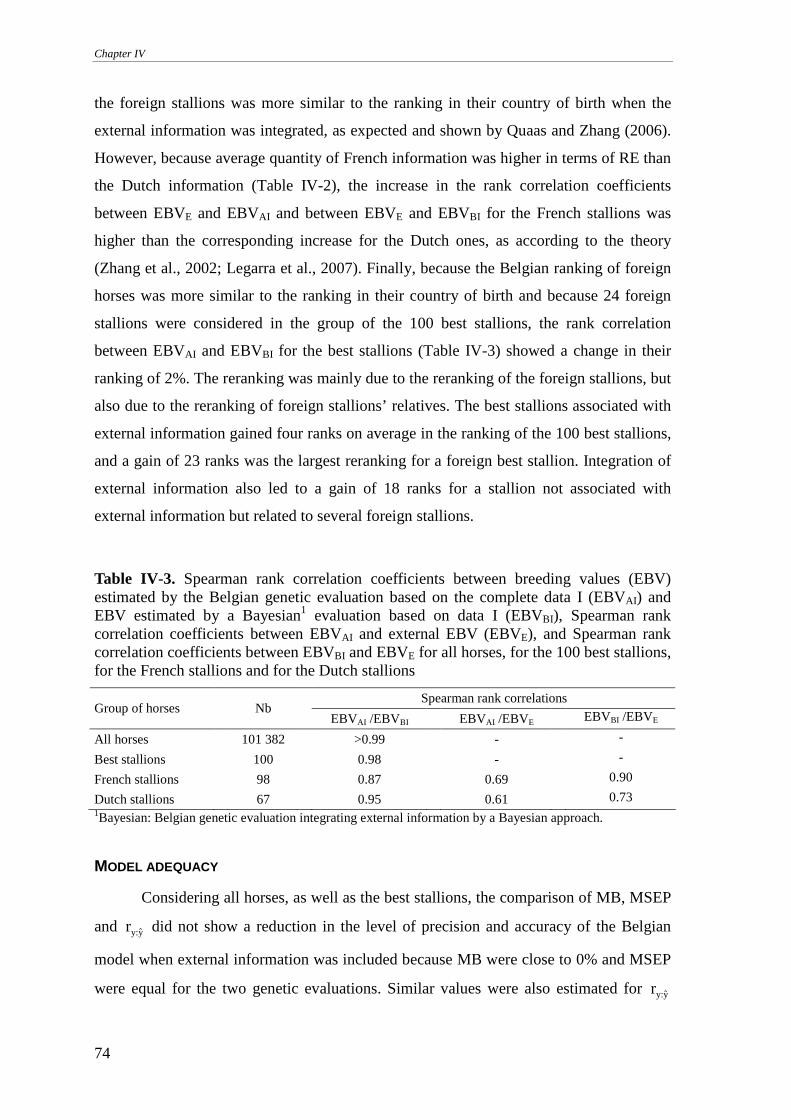
Chapter IV
74
the foreign stallions was more similar to the ranking in their country of birth when the
external information was integrated, as expected and shown by Quaas and Zhang (2006).
However, because average quantity of French information was higher in terms of RE than
the Dutch information (Table IV-2), the increase in the rank correlation coefficients
between EBVE and EBVAI and between EBVE and EBVBI for the French stallions was
higher than the corresponding increase for the Dutch ones, as according to the theory
(Zhang et al., 2002; Legarra et al., 2007). Finally, because the Belgian ranking of foreign
horses was more similar to the ranking in their country of birth and because 24 foreign
stallions were considered in the group of the 100 best stallions, the rank correlation
between EBVAI and EBVBI for the best stallions (Table IV-3) showed a change in their
ranking of 2%. The reranking was mainly due to the reranking of the foreign stallions, but
also due to the reranking of foreign stallions’ relatives. The best stallions associated with
external information gained four ranks on average in the ranking of the 100 best stallions,
and a gain of 23 ranks was the largest reranking for a foreign best stallion. Integration of
external information also led to a gain of 18 ranks for a stallion not associated with
external information but related to several foreign stallions.
Table IV-3. Spearman rank correlation coefficients between breeding values (EBV) estimated by the Belgian genetic evaluation based on the complete data I (EBVAI) and EBV estimated by a Bayesian1 evaluation based on data I (EBVBI), Spearman rank correlation coefficients between EBVAI and external EBV (EBVE), and Spearman rank correlation coefficients between EBVBI and EBVE for all horses, for the 100 best stallions, for the French stallions and for the Dutch stallions
Spearman rank correlations Group of horses Nb
EBVAI /EBVBI EBVAI /EBVE EBVBI /EBVE
All horses 101 382 >0.99 - -
Best stallions 100 0.98 - - French stallions 98 0.87 0.69 0.90 Dutch stallions 67 0.95 0.61 0.73 1Bayesian: Belgian genetic evaluation integrating external information by a Bayesian approach.
MODEL ADEQUACY
Considering all horses, as well as the best stallions, the comparison of MB, MSEP
and y:yr did not show a reduction in the level of precision and accuracy of the Belgian
model when external information was included because MB were close to 0% and MSEP
were equal for the two genetic evaluations. Similar values were also estimated for y:yr
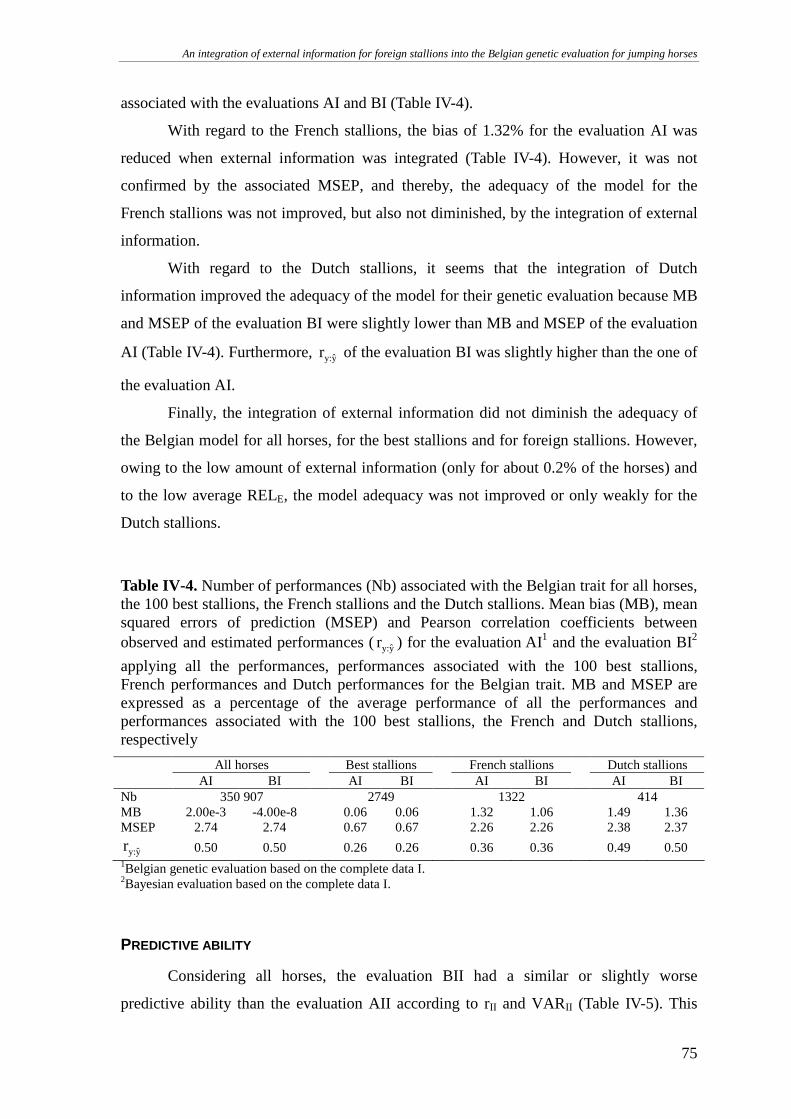
An integration of external information for foreign stallions into the Belgian genetic evaluation for jumping horses
75
associated with the evaluations AI and BI (Table IV-4).
With regard to the French stallions, the bias of 1.32% for the evaluation AI was
reduced when external information was integrated (Table IV-4). However, it was not
confirmed by the associated MSEP, and thereby, the adequacy of the model for the
French stallions was not improved, but also not diminished, by the integration of external
information.
With regard to the Dutch stallions, it seems that the integration of Dutch
information improved the adequacy of the model for their genetic evaluation because MB
and MSEP of the evaluation BI were slightly lower than MB and MSEP of the evaluation
AI (Table IV-4). Furthermore, y:yr of the evaluation BI was slightly higher than the one of
the evaluation AI.
Finally, the integration of external information did not diminish the adequacy of
the Belgian model for all horses, for the best stallions and for foreign stallions. However,
owing to the low amount of external information (only for about 0.2% of the horses) and
to the low average RELE, the model adequacy was not improved or only weakly for the
Dutch stallions.
Table IV-4. Number of performances (Nb) associated with the Belgian trait for all horses, the 100 best stallions, the French stallions and the Dutch stallions. Mean bias (MB), mean squared errors of prediction (MSEP) and Pearson correlation coefficients between observed and estimated performances (y:yr ) for the evaluation AI1 and the evaluation BI2
applying all the performances, performances associated with the 100 best stallions, French performances and Dutch performances for the Belgian trait. MB and MSEP are expressed as a percentage of the average performance of all the performances and performances associated with the 100 best stallions, the French and Dutch stallions, respectively
All horses Best stallions French stallions Dutch stallions AI BI AI BI AI BI AI BI Nb 350 907 2749 1322 414 MB 2.00e-3 -4.00e-8 0.06 0.06 1.32 1.06 1.49 1.36 MSEP 2.74 2.74 0.67 0.67 2.26 2.26 2.38 2.37
y:yr 0.50 0.50 0.26 0.26 0.36 0.36 0.49 0.50 1Belgian genetic evaluation based on the complete data I. 2Bayesian evaluation based on the complete data I.
PREDICTIVE ABILITY
Considering all horses, the evaluation BII had a similar or slightly worse
predictive ability than the evaluation AII according to rII and VARII (Table IV-5). This
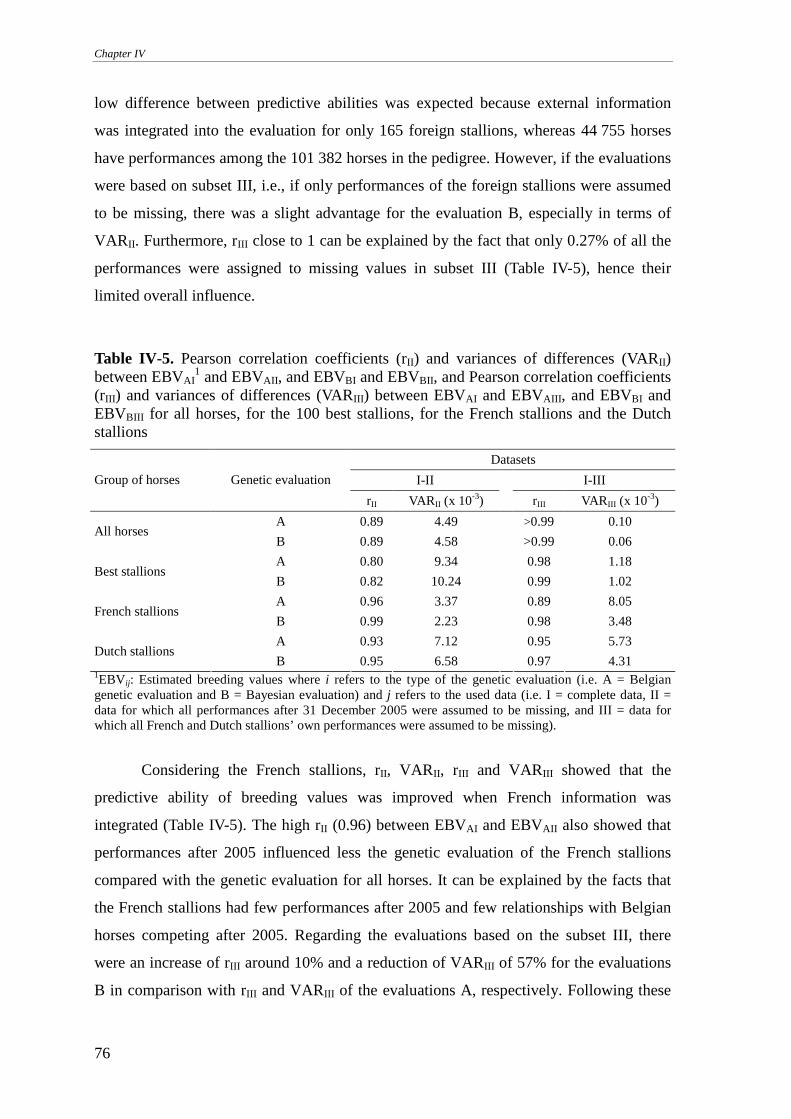
Chapter IV
76
low difference between predictive abilities was expected because external information
was integrated into the evaluation for only 165 foreign stallions, whereas 44 755 horses
have performances among the 101 382 horses in the pedigree. However, if the evaluations
were based on subset III, i.e., if only performances of the foreign stallions were assumed
to be missing, there was a slight advantage for the evaluation B, especially in terms of
VAR II. Furthermore, rIII close to 1 can be explained by the fact that only 0.27% of all the
performances were assigned to missing values in subset III (Table IV-5), hence their
limited overall influence.
Table IV-5. Pearson correlation coefficients (rII) and variances of differences (VARII) between EBVAI
1 and EBVAII , and EBVBI and EBVBII, and Pearson correlation coefficients (rIII) and variances of differences (VARIII) between EBVAI and EBVAIII , and EBVBI and EBVBIII for all horses, for the 100 best stallions, for the French stallions and the Dutch stallions
Datasets I-II I-III Group of horses Genetic evaluation
rII VARII (x 10-3) rIII VARIII (x 10-3) A 0.89 4.49 >0.99 0.10
All horses B 0.89 4.58 >0.99 0.06 A 0.80 9.34 0.98 1.18
Best stallions B 0.82 10.24 0.99 1.02 A 0.96 3.37 0.89 8.05
French stallions B 0.99 2.23 0.98 3.48 A 0.93 7.12 0.95 5.73
Dutch stallions B 0.95 6.58 0.97 4.31
1EBVij: Estimated breeding values where i refers to the type of the genetic evaluation (i.e. A = Belgian genetic evaluation and B = Bayesian evaluation) and j refers to the used data (i.e. I = complete data, II = data for which all performances after 31 December 2005 were assumed to be missing, and III = data for which all French and Dutch stallions’ own performances were assumed to be missing).
Considering the French stallions, rII, VARII, rIII and VARIII showed that the
predictive ability of breeding values was improved when French information was
integrated (Table IV-5). The high rII (0.96) between EBVAI and EBVAII also showed that
performances after 2005 influenced less the genetic evaluation of the French stallions
compared with the genetic evaluation for all horses. It can be explained by the facts that
the French stallions had few performances after 2005 and few relationships with Belgian
horses competing after 2005. Regarding the evaluations based on the subset III, there
were an increase of rIII around 10% and a reduction of VARIII of 57% for the evaluations
B in comparison with rIII and VARIII of the evaluations A, respectively. Following these
An integration of external information for foreign stallions into the Belgian genetic evaluation for jumping horses
77
results, integrated external information was almost equivalent to the French stallions’ own
performances. These results suggest that the integration of external information could be
very interesting in the case of imported stallions having no or few own Belgian
performances (e.g., young imported stallions or confirmed foreign stallions imported
through their semen).
Considering the Dutch stallions, the lower rII and higher VARII compared with the
rIII and VARIII , respectively, for the evaluations A led to higher influence of performances
recorded after 2005 for their genetic evaluation compared with their own records (Table
IV-5). The low number of Dutch stallions with performances, that is <60% of the Dutch
stallions, can explain this observation. This is also explained by the high rIII between
EBVAI and EBVAIII (0.95). However, following rIII and VARIII (Table IV-5), the predictive
ability was improved when external information was integrated into the evaluation based
on the subset III. Regarding the evaluations based on the subset II, the increase in rII and
the slight improvement in VARII also confirmed the improvement in the predictive ability
when Dutch information was integrated into the Belgian genetic evaluation.
RELIABILITIES
Means and SD of REL were calculated for all the genetic evaluations (Table IV-6).
All the genetic evaluations had a minimum and a maximum REL equal to 0.00 and 0.99,
respectively. As expected since external information was only integrated for 165 stallions,
the integration of external information did not influence on average the genetic evaluation
for all the horses.
It is noted that the accuracy of the procedure applied to estimate RELBI, RELBII
and RELBIII depended on the accuracy of RELc and therefore on accuracies of the
conversion equations and of the genetic correlation coefficients for traits between
Belgium and the exporting countries. Because the genetic correlation coefficient was
unknown for the pair Belgium/the Netherlands, they were estimated from EBVAI and
EBVE of the foreign stallions and errors linked with the estimation of RELc were also
introduced into the estimation of REL associated with EBVB. Again, these errors show
the need to estimate genetic correlation coefficients for traits between countries to
perform an unbiased genetic evaluation.
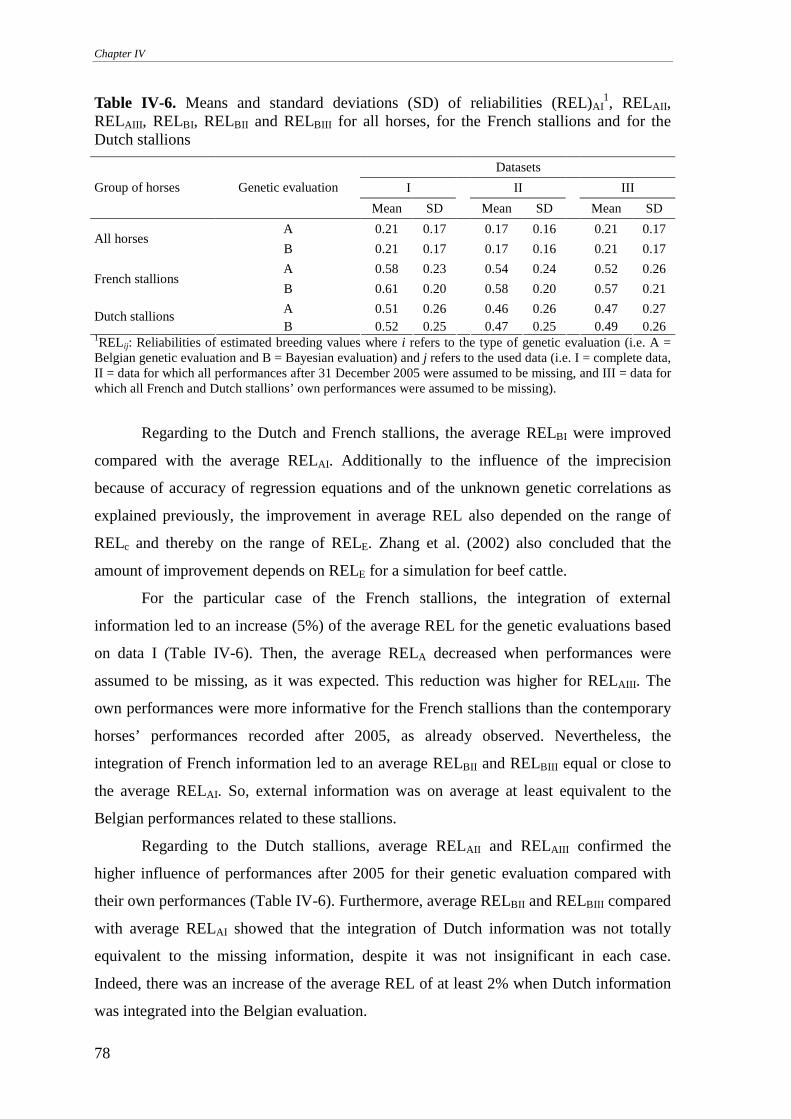
Chapter IV
78
Table IV-6. Means and standard deviations (SD) of reliabilities (REL)AI1, RELAII ,
RELAIII , RELBI, RELBII and RELBIII for all horses, for the French stallions and for the Dutch stallions
Datasets
I II III Group of horses Genetic evaluation
Mean SD Mean SD Mean SD A 0.21 0.17 0.17 0.16 0.21 0.17
All horses B 0.21 0.17 0.17 0.16 0.21 0.17 A 0.58 0.23 0.54 0.24 0.52 0.26
French stallions B 0.61 0.20 0.58 0.20 0.57 0.21 A 0.51 0.26 0.46 0.26 0.47 0.27
Dutch stallions B 0.52 0.25 0.47 0.25 0.49 0.26
1RELij: Reliabilities of estimated breeding values where i refers to the type of genetic evaluation (i.e. A = Belgian genetic evaluation and B = Bayesian evaluation) and j refers to the used data (i.e. I = complete data, II = data for which all performances after 31 December 2005 were assumed to be missing, and III = data for which all French and Dutch stallions’ own performances were assumed to be missing).
Regarding to the Dutch and French stallions, the average RELBI were improved
compared with the average RELAI. Additionally to the influence of the imprecision
because of accuracy of regression equations and of the unknown genetic correlations as
explained previously, the improvement in average REL also depended on the range of
RELc and thereby on the range of RELE. Zhang et al. (2002) also concluded that the
amount of improvement depends on RELE for a simulation for beef cattle.
For the particular case of the French stallions, the integration of external
information led to an increase (5%) of the average REL for the genetic evaluations based
on data I (Table IV-6). Then, the average RELA decreased when performances were
assumed to be missing, as it was expected. This reduction was higher for RELAIII . The
own performances were more informative for the French stallions than the contemporary
horses’ performances recorded after 2005, as already observed. Nevertheless, the
integration of French information led to an average RELBII and RELBIII equal or close to
the average RELAI. So, external information was on average at least equivalent to the
Belgian performances related to these stallions.
Regarding to the Dutch stallions, average RELAII and RELAIII confirmed the
higher influence of performances after 2005 for their genetic evaluation compared with
their own performances (Table IV-6). Furthermore, average RELBII and RELBIII compared
with average RELAI showed that the integration of Dutch information was not totally
equivalent to the missing information, despite it was not insignificant in each case.
Indeed, there was an increase of the average REL of at least 2% when Dutch information
was integrated into the Belgian evaluation.
An integration of external information for foreign stallions into the Belgian genetic evaluation for jumping horses
79
CONCLUSION
According to these results, external information, that is foreign EBV and their
associated REL, for French and Dutch stallions was partially to totally equivalent to 4
years of contemporary horses’ performances or to their own performances in show
jumping. Its integration did not diminish the adequacy of the Belgian model for all horses,
as well as for foreign stallions. It also improved the predictive ability and the accuracy of
EBV for the foreign stallions. The resulting Belgian ranking of the foreign stallions was
more similar to their foreign ranking according to their country of birth, according to the
Spearman rank correlations. All these results showed the interest to integrate external
information into the Belgian genetic evaluation for show jumping, especially for imported
stallions having no or few Belgian performances (e.g., young imported stallions or
confirmed foreign stallions imported through their semen). However, estimates of genetic
correlations for traits among countries, as well as accurate conversion equations, are
needed for a more accurate Belgian Bayesian evaluation.
ACKNOWLEDGEMENTS
Jérémie Vandenplas, as a Research Fellow, acknowledges the support of the
National Fund for Scientific Research (Brussels, Belgium) for this position and for the
additional grants 2.4507.02F(2) and F4552.05 (2.4.623.08.F). The authors acknowledge
Anne Ricard (Station de Génétique Quantitative et Appliquée, Institut National de la
Recherche Agronomique, France) and Danielle Arts (Royal Dutch Sport Horse, the
Netherlands) to provide the external information to realize this research. The authors are
also grateful to University of Liege (SEGI facility) for the use of NIC3 supercomputer
facilities. The authors thank the anonymous reviewers for the useful comments.
REFERENCES
Calo, L.L., R.E. McDowell, L.D. VanVleck, and P.D. Miller. 1973. Genetic aspects of
beef production among Holstein-Friesians pedigree selected for milk production.
J. Anim. Sci. 37:676–682.
Gengler, N., and S. Vanderick. 2008. Bayesian inclusion of external evaluations into a
national evaluation system: Application to milk production traits. Interbull Bull.
38:70–74.
Goddard, M. 1985. A method of comparing sires evaluated in different countries. Livest.
Prod. Sci. 13:321–331.
Chapter IV
80
Interstallion. 2005. Recommendations on choice of scale and reference population for
publication of breeding values in sport horse breeding. Accessed Mar. 19, 2012.
http://www.biw.kuleuven.be/genlog/livgen/docs/publicationscale.pdf.
Janssens, S., and N. Buys. 2008. Genetische index voor springen - GSIn2008. Accessed
Mar. 19, 2012. http://www.biw.kuleuven.be/genlog/livgen/chgs_ebv/
GenetischeSpringindex_2008.pdf.
Janssens, S., N. Buys, and W. Vandepitte. 2007. Sport status and the genetic evaluation
for show jumping in Belgian sport horses. Page 151 in Book of Abstracts of the
58th Annual Meeting of the European Association for Animal Production, Dublin,
Ireland. Wageningen Academic Publishers, Wageningen, The Netherlands.
Janssens, S., D. Geysen, and W. Vandepitte. 1997. Genetic parameters for show jumping
in Belgian sporthorses. 5pp. in Book of Abstracts of the 48th Annual Meeting of
the European Association for animal production, Vienna, Austria. Wageningen
Academic Publishers, Wageningen, The Netherlands.
Klei, L., R.L. Quaas, E.J. Pollak, and B.E. Cunningham. 1996. Multiple-breed evaluation.
Pages 106–113 in Proceedings of the 28th Research Symposium and Annual
Meeting. Beef Improvement Federation.
Koenen, E.P.C. 2002. Genetic evaluations for competition traits of warmblood sport
horses. Note presented at World Breeding Federation for Sport Horses seminar,
Budapest, Hungary. Accessed Mar. 21, 2012. http://www.biw.kuleuven.be/
genlog/livgen/docs/genetic-evaluation.pdf.
Koenen, E.P.C., and L.I. Aldridge. 2002. Testing and genetic evaluation of sport horses in
an international perspective. Page 23 in Proceedings of the 7th World Congress on
Genetics Applied to Livestock Production, Montpellier, France.
Koenen, E.P.C., L.I. Aldridge, and J. Philipsson. 2004. An overview of breeding
objectives for warmblood sport horses. Livest. Prod. Sci. 88:77–84.
Legarra, A., J.K. Bertrand, T. Strabel, R.L. Sapp, J.P. Sanchez, and I. Misztal. 2007.
Multi-breed genetic evaluation in a Gelbvieh population. J. Anim. Breed. Genet.
124:286–295.
Misztal, I. 2012. BLUPF90 family of programs. Accessed Mar. 21, 2012.
http://nce.ads.uga.edu/~ignacy/newprograms.html.
Powell, R.L., and M. Sieber. 1992. Direct and indirect conversion of bull evaluations for
yield traits between countries. J. Dairy Sci. 75:1138–1146.
Powell, R.L., G.R. Wiggans, and P.M. VanRaden. 1994. Factors affecting calculation and
An integration of external information for foreign stallions into the Belgian genetic evaluation for jumping horses
81
use of conversion equations for genetic merit of dairy bulls. J. Dairy Sci. 77:2679–
2686.
Quaas, R.L., and Z. Zhang. 2006. Multiple-breed genetic evaluation in the US beef cattle
context: Methodology. CD–ROM Comm. 24–12 in Proceedings of the 8th World
Congress on Genetics Applied to Livestock Production, Belo Horizonte, Brazil.
Ricard, A. 1997. Breeding evaluations and breeding programs in France. 9 pp. in Book of
Abstracts of the 48th Annual Meeting of the European Association for animal
production, Vienna, Austria. Wageningen Academic Publishers, Wageningen, The
Netherlands.
Ruhlmann, C., E. Bruns, E. Fraehr, J. Philipsson, S. Janssens, K. Quinn, E.T. Hellsten,
and A. Ricard. 2009a. Genetic connectedness between seven European countries
for performance in jumping competitions of warmblood riding horses. Livest. Sci.
120:75–86.
Ruhlmann, C., S. Janssens, J. Philipsson, E. Thorén-Hellsten, H. Crolly, K. Quinn, E.
Manfredi, and A. Ricard. 2009b. Genetic correlations between horse show
jumping competition traits in five European countries. Livest. Sci. 122:234–240.
Tavernier, A. 1991. Genetic evaluation of horses based on ranks in competitions. Genet
Sel. Evol 23:159–173.
Tedeschi, L.O. 2006. Assessment of the adequacy of mathematical models. Agric. Syst.
89:225–247.
Vandenplas, J., and N. Gengler. 2012. Comparison and improvements of different
Bayesian procedures to integrate external information into genetic evaluations. J.
Dairy Sci. 95:1513–1526.
van Veldhuizen, A.E. 1997. Breeding value estimation for riding horses in Netherlands.
8pp. in Book of Abstracts of the 48th Annual Meeting of the European Association
for Animal Production, Vienna, Austria. Wageningen Academic Publishers,
Wageningen, The Netherlands.
Zhang, Z.W., R.L. Quaas, and E.J. Pollak. 2002. Simulation study on the effects of
incorporating external genetic evaluation results. CD–ROM Comm. 20–14 in
Proceedings of the 7th World Congress on Genetics Applied to Livestock
Production, Montpellier, France.

Chapter V. S HORT COMMUNICATION: ALTERATION OF PRIORS
FOR RANDOM EFFECTS IN GAUSSIAN LINEAR MIXED MODELS
Bayesian approaches integrating external information (i.e.,
estimated breeding values and associated reliabilities provided by
an external genetic evaluation) into an internal genetic evaluation
were proposed in the previous Chapters and were based on the
alteration of both the mean and the (co)variance of the prior
multivariate normal distributions of random effects of linear
mixed models. However, most software packages available in
animal breeding community do not permit such alterations, and,
thereby, they do not permit the implementation of the proposed
Bayesian approaches that integrate external information.
Furthermore, source codes of most software are usually
unavailable, making the implementation of the Bayesian
approaches proposed in the previous Chapters impossible.
Therefore, the aim of this Chapter was to propose a method to
alter both the mean and the (co)variance of the prior distributions
of random effects of linear mixed models in the framework of
currently available software packages. Based on two datasets, the
method was tested with three software packages.
From: Vandenplas, J., O.F. Christensen, and N. Gengler. 2014. Short
communication: Alteration of priors for random effects in Gaussian linear mixed
models. J. Dairy Sci. 97:5880-5884.

Short communication: Alteration of priors for random effects in Gaussian linear mixed models
85
ABSTRACT
Linear mixed models, for which the prior multivariate normal distributions of
random effects are assumed to have a mean equal to 0, are commonly used in animal
breeding. However, some statistical analyses (e.g., the consideration of a population
under selection in a genomic breeding scheme, multiple-trait predictions of lactation
yields, and Bayesian approaches integrating external information into genetic evaluations)
need to alter both the mean and (co)variance of the prior distributions and, to our
knowledge, most software packages available in the animal breeding community do not
permit such alterations. Therefore, the aim of this study was to propose a method to alter
both the mean and (co)variance of the prior multivariate normal distributions of random
effects of linear mixed models while using currently available software packages. The
proposed method was tested on simulated examples with 3 different software packages
available in animal breeding. The examples showed the possibility of the proposed
method to alter both the mean and (co)variance of the prior distributions with currently
available software packages through the use of an extended data file and a user-supplied
(co)variance matrix.
Key words: Prior distribution, Bayesian, linear mixed model
SHORT COMMUNICATION
Currently, Henderson’s mixed models methods and Best Linear Unbiased
Prediction (BLUP; Henderson, 1975) are commonly used in animal breeding. The typical
linear mixed model is written as follows:
eZuXβy ++= (V.1)
where y is the vector of records, β and u are vectors of fixed and random effects related
to the records through the incidence matrices X and Z , respectively, and e is the vector
of residuals.
It is assumed that the expectations are
=
0
0
e
uE and the (co)variance matrices
are
=
R0
0G
e
uVar where G is the (co)variance matrix associated with u and R is
the (co)variance matrix associated with e. The estimates of β ; that is, β , and the
predictions of u ; that is, u , can be obtained solving the mixed-model equations written
Chapter V
86
as follows (Henderson, 1950):
=
+ −
−
−−−
−−
yRZ
yRX
u
β
GZRZXRZ
ZRXXRX1'
1'
11'1'
1'1'
ˆ
ˆ. (V.2)
In the case of BLUP, the (co)variance matrices G and R are assumed to be known.
Although u is assumed to have an expectation equal to 0, a need exists to alter
this expectation in some statistical analyses. For example, Bayesian approaches
integrating external information (i.e., estimated breeding values (EBV) and associated
reliabilities obtained from a foreign genetic evaluation) into a local genetic evaluation
alter both [ ]uE and [ ]uVar (e.g., Gianola and Fernando, 1986; Quaas and Zhang, 2006;
Legarra et al., 2007). For such approaches, [ ]uE is equal to the foreign EBV and [ ]uVar
represents the associated matrix of prediction error (co)variances. Another example is the
consideration of a population under selection in a genomic breeding scheme by assuming
[ ] 0u ≠E for the genotyped animals. Indeed, they may have an expectation different from
0 if selection occurred (Vitezica et al., 2011). Also, Schaeffer and Jamrozik (1996)
proposed a multiple-trait procedure for predicting lactation yields for dairy cows based on
an alteration of [ ]uE with information from groups of cows sharing the same production
characteristics. However, to our knowledge, most software packages currently available
in animal breeding do not permit alterations of expectations of random effects, whereas
they may allow the use of a user supplied covariance matrix. Therefore, the aim of this
study was to propose a method to alter both the expectations and (co)variances of random
effects while using software packages currently available in animal breeding. The
development of the proposed method was based on a Bayesian view of linear mixed
models.
BAYESIAN VIEW OF LINEAR MIXED MODELS
Bayes estimators for linear (mixed) models and their relations with BLUP were
discussed by several authors (e.g., Lindley and Smith, 1972; Dempfle, 1977; Gianola and
Fernando, 1986; Sorensen and Gianola, 2002). From a Bayesian view, all fixed and
random effects are considered as random. However, the terms “fixed” and “random” will
still be used below to differentiate β from u , respectively.
For the linear model (V.1), the following prior multivariate normal (MVN)
distributions are assumed:
[ ]Bβ ~ ( )Bb,MVN ,
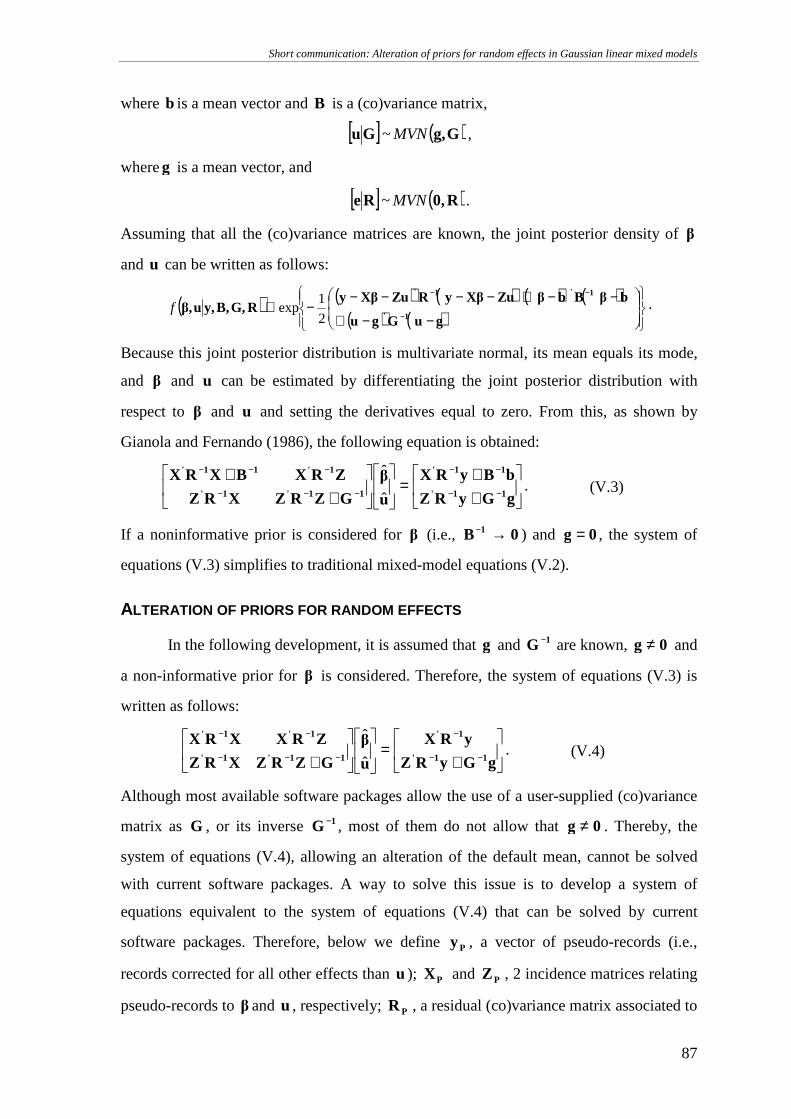
Short communication: Alteration of priors for random effects in Gaussian linear mixed models
87
where b is a mean vector and B is a (co)variance matrix,
[ ]Gu ~ ( )Gg,MVN ,
whereg is a mean vector, and
[ ]Re ~ ( )R0,MVN .
Assuming that all the (co)variance matrices are known, the joint posterior density of β
and u can be written as follows:
( ) ( ) ( ) ( ) ( )( ) ( )
−−+
−−+−−−−−∝
−
−−
guGgu
bβBbβZuXβyRZuXβyRG,B,y,uβ,
1'
1'1'
2
1expf .
Because this joint posterior distribution is multivariate normal, its mean equals its mode,
and β and u can be estimated by differentiating the joint posterior distribution with
respect to β and u and setting the derivatives equal to zero. From this, as shown by
Gianola and Fernando (1986), the following equation is obtained:
++
=
++
−−
−−
−−−
−−−
gGyRZ
bByRX
u
β
GZRZXRZ
ZRXBXRX11'
11'
11'1'
1'11'
ˆ
ˆ. (V.3)
If a noninformative prior is considered for β (i.e., 0B 1 →− ) and 0g = , the system of
equations (V.3) simplifies to traditional mixed-model equations (V.2).
ALTERATION OF PRIORS FOR RANDOM EFFECTS
In the following development, it is assumed that g and 1G − are known, 0g ≠ and
a non-informative prior for β is considered. Therefore, the system of equations (V.3) is
written as follows:
+=
+ −−
−
−−−
−−
gGyRZ
yRX
u
β
GZRZXRZ
ZRXXRX11'
1'
11'1'
1'1'
ˆ
ˆ. (V.4)
Although most available software packages allow the use of a user-supplied (co)variance
matrix as G , or its inverse 1G − , most of them do not allow that 0g ≠ . Thereby, the
system of equations (V.4), allowing an alteration of the default mean, cannot be solved
with current software packages. A way to solve this issue is to develop a system of
equations equivalent to the system of equations (V.4) that can be solved by current
software packages. Therefore, below we define Py , a vector of pseudo-records (i.e.,
records corrected for all other effects than u ); PX and PZ , 2 incidence matrices relating
pseudo-records to β and u , respectively; PR , a residual (co)variance matrix associated to
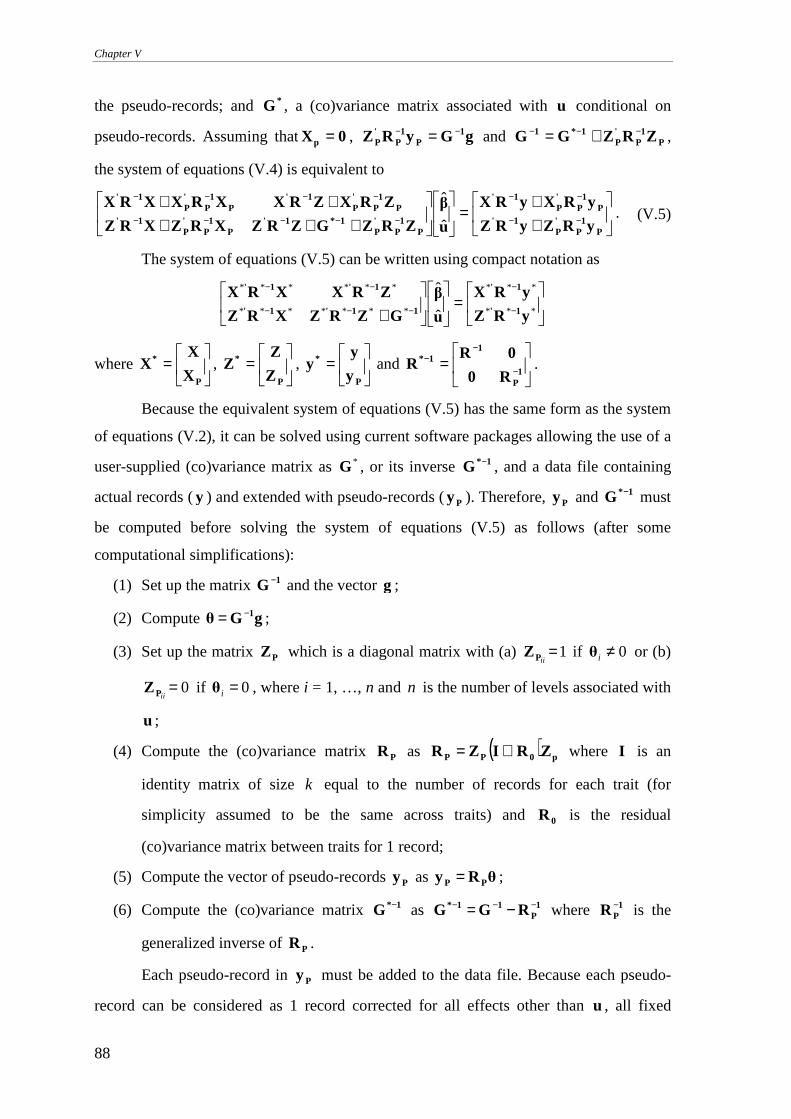
Chapter V
88
the pseudo-records; and *G , a (co)variance matrix associated with u conditional on
pseudo-records. Assuming that 0X p = , gGyRZ 1P
1P
'P
−− = and P1
P'P
1*1 ZRZGG −−− += ,
the system of equations (V.4) is equivalent to
++
=
+++++
−−
−−
−−−−−
−−−−
P1
P'P
1'P
1P
'P
1'
P1
P'P
1*1'P
1P
'P
1'P
1P
'P
1'P
1P
'P
1'
yRZyRZ
yRXyRX
u
β
ZRZGZRZXRZXRZ
ZRXZRXXRXXRX
ˆ
ˆ. (V.5)
The system of equations (V.5) can be written using compact notation as
=
+ −
−
−−−
−−
***
***
*******
******
ˆ
ˆ
yRZ
yRX
u
β
GZRZXRZ
ZRXXRX1'
1'
11'1'
1'1'
where
=
P
*
X
XX ,
=
P
*
Z
ZZ ,
=
P
*
y
yy and
= −
−−
1P
11*
R0
0RR .
Because the equivalent system of equations (V.5) has the same form as the system
of equations (V.2), it can be solved using current software packages allowing the use of a
user-supplied (co)variance matrix as *G , or its inverse 1*G − , and a data file containing
actual records (y ) and extended with pseudo-records (Py ). Therefore, Py and 1*G − must
be computed before solving the system of equations (V.5) as follows (after some
computational simplifications):
(1) Set up the matrix 1G − and the vector g ;
(2) Compute gGθ 1−= ;
(3) Set up the matrix PZ which is a diagonal matrix with (a) 1=iiPZ if 0≠iθ or (b)
0=iiPZ if 0=iθ , where i = 1, …, n and n is the number of levels associated with
u ;
(4) Compute the (co)variance matrix PR as ( ) p0PP ZRIZR ⊗= where I is an
identity matrix of size k equal to the number of records for each trait (for
simplicity assumed to be the same across traits) and 0R is the residual
(co)variance matrix between traits for 1 record;
(5) Compute the vector of pseudo-records Py as θRy PP = ;
(6) Compute the (co)variance matrix 1*G − as 1P
11* RGG −−− −= where 1PR − is the
generalized inverse of PR .
Each pseudo-record in Py must be added to the data file. Because each pseudo-
record can be considered as 1 record corrected for all effects other than u , all fixed
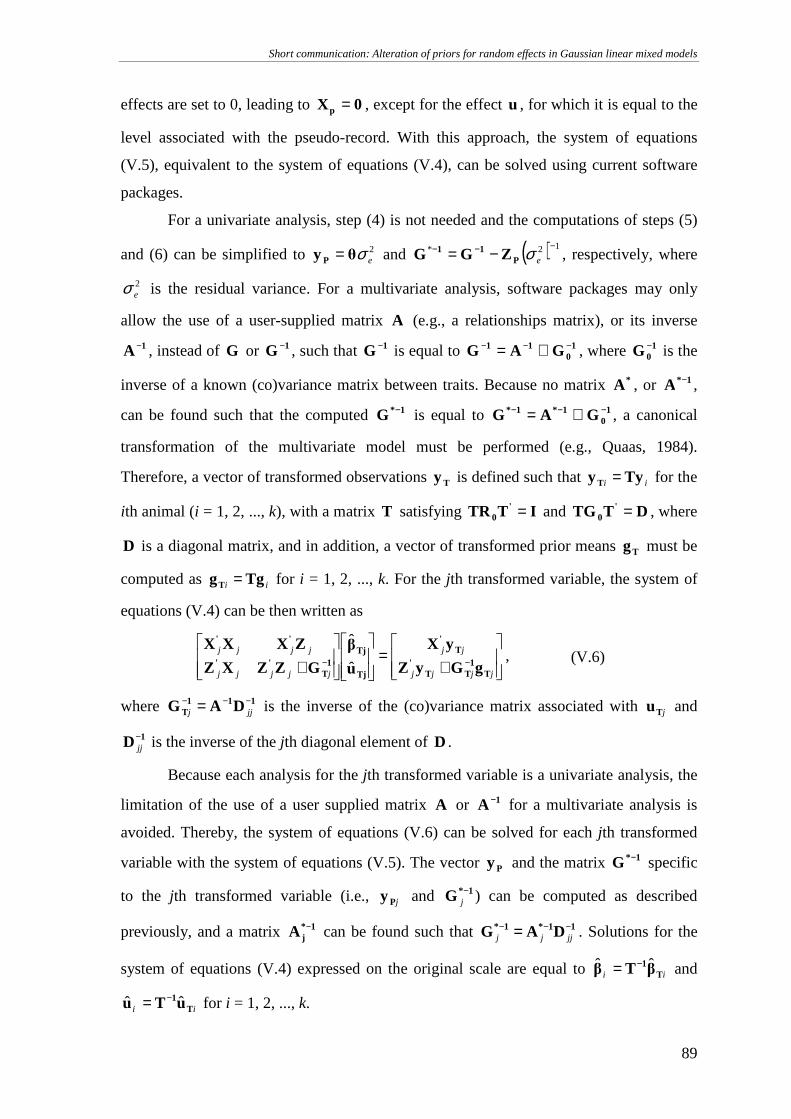
Short communication: Alteration of priors for random effects in Gaussian linear mixed models
89
effects are set to 0, leading to 0X p = , except for the effect u , for which it is equal to the
level associated with the pseudo-record. With this approach, the system of equations
(V.5), equivalent to the system of equations (V.4), can be solved using current software
packages.
For a univariate analysis, step (4) is not needed and the computations of steps (5)
and (6) can be simplified to 2eσθy P = and ( ) 12* −−− −= eσP
11 ZGG , respectively, where
2eσ is the residual variance. For a multivariate analysis, software packages may only
allow the use of a user-supplied matrix A (e.g., a relationships matrix), or its inverse
1A − , instead of G or 1G − , such that 1G − is equal to 10
11 GAG −−− ⊗= , where 10G − is the
inverse of a known (co)variance matrix between traits. Because no matrix *A , or 1*A − ,
can be found such that the computed 1*G − is equal to 10
1*1* GAG −−− ⊗= , a canonical
transformation of the multivariate model must be performed (e.g., Quaas, 1984).
Therefore, a vector of transformed observations Ty is defined such that ii TyyT = for the
ith animal (i = 1, 2, ..., k), with a matrix T satisfying ITTR '0 = and DTTG '
0 = , where
D is a diagonal matrix, and in addition, a vector of transformed prior means Tg must be
computed as ii TggT = for i = 1, 2, ..., k. For the jth transformed variable, the system of
equations (V.4) can be then written as
+=
+ −−jjjj
jj
jjjjj
jjjj
T1
TT'
T'
Tj
Tj1
T''
''
gGyZ
yX
u
β
GZZXZ
ZXXX
ˆ
ˆ, (V.6)
where 111T DAG −−− = jjj is the inverse of the (co)variance matrix associated with jTu and
1D−jj is the inverse of the jth diagonal element of D .
Because each analysis for the jth transformed variable is a univariate analysis, the
limitation of the use of a user supplied matrix A or 1A − for a multivariate analysis is
avoided. Thereby, the system of equations (V.6) can be solved for each jth transformed
variable with the system of equations (V.5). The vector Py and the matrix 1*G − specific
to the jth transformed variable (i.e., jPy and 1*G −j ) can be computed as described
previously, and a matrix 1*jA − can be found such that 11*1* DAG −−− = jjjj . Solutions for the
system of equations (V.4) expressed on the original scale are equal to ii T1βTβ ˆˆ −= and
ii T1uTu ˆˆ −= for i = 1, 2, ..., k.
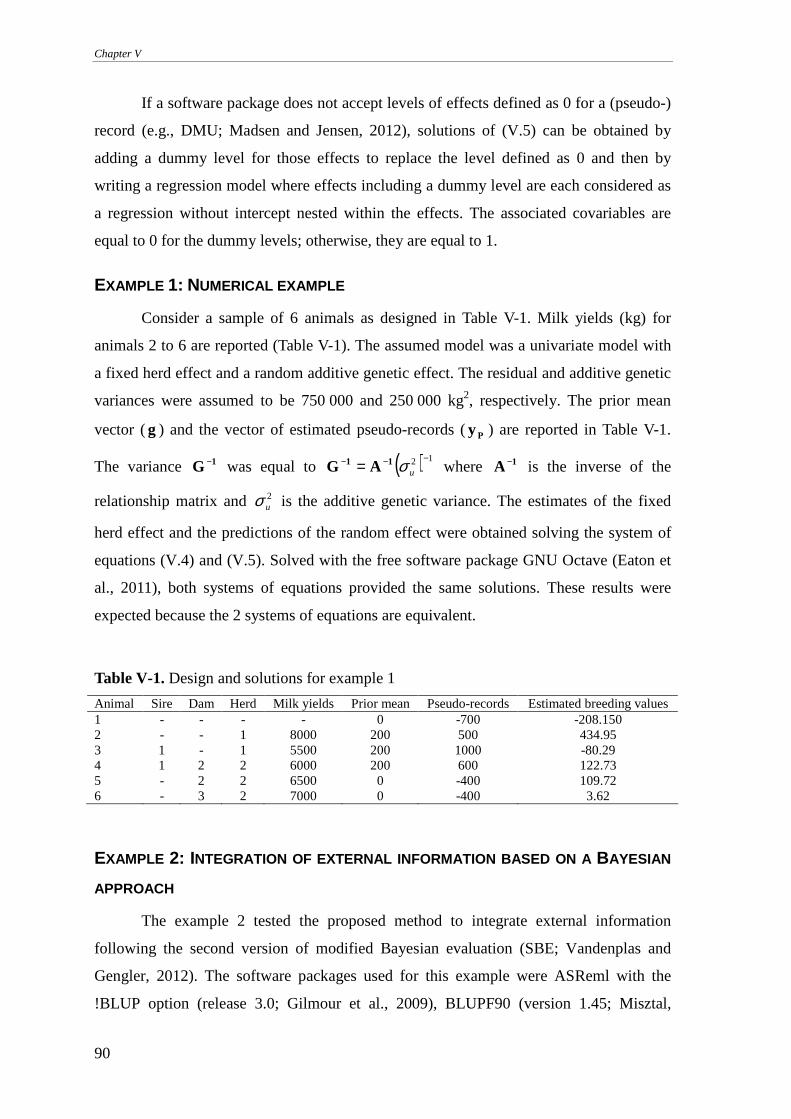
Chapter V
90
If a software package does not accept levels of effects defined as 0 for a (pseudo-)
record (e.g., DMU; Madsen and Jensen, 2012), solutions of (V.5) can be obtained by
adding a dummy level for those effects to replace the level defined as 0 and then by
writing a regression model where effects including a dummy level are each considered as
a regression without intercept nested within the effects. The associated covariables are
equal to 0 for the dummy levels; otherwise, they are equal to 1.
EXAMPLE 1: NUMERICAL EXAMPLE
Consider a sample of 6 animals as designed in Table V-1. Milk yields (kg) for
animals 2 to 6 are reported (Table V-1). The assumed model was a univariate model with
a fixed herd effect and a random additive genetic effect. The residual and additive genetic
variances were assumed to be 750 000 and 250 000 kg2, respectively. The prior mean
vector (g ) and the vector of estimated pseudo-records (Py ) are reported in Table V-1.
The variance 1G − was equal to ( ) 12 −−− = uσ11 AG where 1A − is the inverse of the
relationship matrix and 2uσ is the additive genetic variance. The estimates of the fixed
herd effect and the predictions of the random effect were obtained solving the system of
equations (V.4) and (V.5). Solved with the free software package GNU Octave (Eaton et
al., 2011), both systems of equations provided the same solutions. These results were
expected because the 2 systems of equations are equivalent.
Table V-1. Design and solutions for example 1
Animal Sire Dam Herd Milk yields Prior mean Pseudo-records Estimated breeding values 1 - - - - 0 -700 -208.150 2 - - 1 8000 200 500 434.95 3 1 - 1 5500 200 1000 -80.29 4 1 2 2 6000 200 600 122.73 5 - 2 2 6500 0 -400 109.72 6 - 3 2 7000 0 -400 3.62
EXAMPLE 2: INTEGRATION OF EXTERNAL INFORMATION BASED ON A BAYESIAN
APPROACH
The example 2 tested the proposed method to integrate external information
following the second version of modified Bayesian evaluation (SBE; Vandenplas and
Gengler, 2012). The software packages used for this example were ASReml with the
!BLUP option (release 3.0; Gilmour et al., 2009), BLUPF90 (version 1.45; Misztal,
Short communication: Alteration of priors for random effects in Gaussian linear mixed models
91
2013), and DMU4 from the DMU package (version 6, release 5.1; Madsen and Jensen,
2012).
A local sample of animals and a foreign one, both including about 2400 animals
distributed over 6 generations, were simulated each from 50 male founders and 200
female founders. For both samples, all females were randomly mated with males
randomly selected from available males to simulate the next generation. The maximum
number of males mated in each generation was 40 and a male could be mated during a
maximum of 2 generations. Furthermore, these matings could not be realized if the
coefficient of relationship between 2 animals was higher or equal to 0.5, and if the female
had already 3 progeny. Concerning the foreign sample, foreign females were only mated
with foreign males. In each generation, 60% of foreign male offspring were randomly
culled. Concerning the local sample of animals, local females were mated with local
males and a subset of foreign males, including the first 150 sires that had most offspring
in the foreign population. In each generation, 99% of local male offspring were randomly
culled. Records for milk yield (kg) for the first lactation were simulated for each female
in both samples (Van Vleck, 1994). A herd effect nested within sample was randomly
assigned to each female under the condition that each herd included about 40 females.
Residual and additive genetic variances were assumed to be 6 * 104 and 2 * 104 kg2,
respectively.
Simulation of data and a foreign genetic evaluation (i.e., a BLUP evaluation (V.2)
based on foreign pedigree and data) were performed with GNU Octave software.
Integration of external information into the local genetic evaluation (i.e., an evaluation
based on local pedigree and data) was performed following the SBE. In the context of
SBE, external information included foreign EBV for the 150 sires and EBV predicted
from the foreign ones for local animals (summarized in g ) and associated record
equivalents only due to own records (RE; i.e., effective numbers of records free of
contributions due to relationships estimated by a 2-step algorithm; Vandenplas and
Gengler, 2012). Because RE are only due to own records, RE for local animals were
equal to zero. The matrix 1G − associated with g is the matrix of prediction error
(co)variances and was approximated as ( ) ΛAG 11 += −−− 12uσ where Λ is a diagonal
matrix with diagonal elements equal to ( ) 12 −= eiii σREΛ for the ith animal (Vandenplas
and Gengler, 2012). The SBE was also performed with GNU Octave software and
obtained solutions were considered as reference.
Chapter V
92
To test the proposed approach with ASReml, BLUPF90, and DMU4, local
pedigree and data files as well as foreign EBV for the 150 sires and predicted EBV for
local animals and associated RE were created. Setting up of 1G − , g , PZ and PR , and
computations of θ , Py and 1G −* were performed with GNU Octave software. Files
containing the user-supplied (co)variance matrix were written following specific rules for
each software package and the pseudo-records in Py were added to the data file with
appropriate levels for the different effects.
The system of equations (V.5), based on the extended data and user-supplied
(co)variance matrix, was solved with ASReml, BLUPF90, and DMU4. For DMU4,
solutions were obtained with the equivalent nested regression model. The system of
equations was solved by direct computation proposed by the 3 software packages used.
Solutions were compared with those estimated with GNU Octave software, measuring the
relative errors Oj
Ojij
sol
solsol −=∆ where Ojsol was the estimate for the jth level of the
effects estimated with GNU Octave and ijsol was the estimate for the jth level of the
effects estimated with 1 of the 3 software packages used (i.e., i = ASReml, BLUPF90, or
DMU4). The ∆ values ranged from 0.00 to 4.96 * 10−6 for ASReml, from 0.00 to 9.78 *
10−8 for BLUPF90, and from 0.00 to 3.83 * 10−4 for DMU4. Average ∆ were 9.11 * 10−7
for ASReml, 2.54 * 10−10 for BLUPF90, and 2.52 * 10−6 for DMU4. Differences between
∆ can be explained by the precision considered by the software packages for integer and
real variables and by the writing format specifications of the software packages for the
solutions.
In conclusion, these 2 examples showed the possibility to alter both mean and
(co)variance of the prior distribution associated with random effects for linear mixed
models equations with current software packages commonly available in the animal
breeding community through the use of an extended data file and a user-supplied
(co)variance matrix.
ACKNOWLEDGEMENTS
J. Vandenplas, as a research fellow, and N. Gengler, as a former senior research
associate, acknowledge the support of the National Fund for Scientific Research
(Brussels, Belgium) for these positions. Additional financial support was provided by the
Short communication: Alteration of priors for random effects in Gaussian linear mixed models
93
Ministry of Agriculture of Walloon Region of Belgium (Service Public de Wallonie,
Direction générale opérationnelle “Agriculture, Ressources naturelles et Environnement”
– DGARNE) through research projects D31-1207, D31-1224, and D31-1274. Useful
comments from the 2 reviewers are also acknowledged.
REFERENCES
Dempfle, L. 1977. Relation entre BLUP (Best Linear Unbiased Prediction) et estimateurs
bayésiens. Genet. Sel. Evol. 9:27–32.
Eaton, J.W., D. Bateman, S. Hauberg, and R. Wehbring. 2011. GNU Octave. A high-level
interactive language for numerical computations. 3rd ed. Free Software
Foundation, Inc., Boston, MA.
Gianola, D., and R.L. Fernando. 1986. Bayesian methods in animal breeding theory. J.
Anim. Sci. 63:217–244.
Gilmour, A.R., B.J. Gogel, B.R. Cullis, and R. Thompson. 2009. ASReml user guide
release 3.0. VSN International Ltd, Hemel Hempstead, UK.
Henderson, C.R. 1950. Estimation of genetic parameters. Ann. Math. Stat. 21:309–310.
(Abstr.).
Henderson, C.R. 1975. Best linear unbiased estimation and prediction under a selection
model. Biometrics 31:423–447.
Legarra, A., J.K. Bertrand, T. Strabel, R.L. Sapp, J.P. Sanchez, and I. Misztal. 2007.
Multi-breed genetic evaluation in a Gelbvieh population. J. Anim. Breed. Genet.
124:286–295.
Lindley, D.V., and A.F.M. Smith. 1972. Bayes estimates for the linear model. J. R. Stat.
Soc. Ser. B Methodol. 34:1–41.
Madsen, P., and J. Jensen. 2012. A user’s guide to DMU. A package for analysing
multivariate mixed models. Version 6, release 5.1. University of Aarhus, Faculty
Agricultural Sciences (DJF), Dept of Genetics and Biotechnology, Research
Centre Foulum, Tjele, Denmark.
Misztal, I. 2013. BLUPF90 family of programs. Accessed Jul. 3, 2012.
http://nce.ads.uga.edu/wiki/doku.php.
Quaas, R.L. 1984. Linear prediction. Pages 1–76 in BLUP school handbook. Use of
mixed models for prediction and for estimation of (co)variance components.
Animal Genetics and Breeding Unit, University of New England, New South
Wales, Australia.
Chapter V
94
Quaas, R.L., and Z. Zhang. 2006. Multiple-breed genetic evaluation in the US beef cattle
context: Methodology. CD–ROM Comm. 24–12 in Proceedings of the 8th World
Congress on Genetics Applied to Livestock Production, Belo Horizonte, Brazil.
Schaeffer, L.R., and J. Jamrozik. 1996. Multiple-trait prediction of lactation yields for
dairy cows. J. Dairy Sci. 79:2044–2055.
Sorensen, D., and D. Gianola. 2002. Likelihood, Bayesian and MCMC methods in
quantitative genetics. Springer-Verlag, New York, NY.
Vandenplas, J., and N. Gengler. 2012. Comparison and improvements of different
Bayesian procedures to integrate external information into genetic evaluations. J.
Dairy Sci. 95:1513–1526.
Van Vleck, L.D. 1994. Algorithms for simulation of animal models with multiple traits
and with maternal and non-additive genetic effects. Braz. J. Genet. 17:53–57.
Vitezica, Z.G., I. Aguilar, I. Misztal, and A. Legarra. 2011. Bias in genomic predictions
for populations under selection. Genet. Res. 93:357–366.
Chapter VI. UNIFIED METHOD TO INTEGRATE AND BLEND
SEVERAL , POTENTIALLY RELATED , SOURCES OF INFORMATION
FOR GENETIC EVALUATION
Chapter III proposed an algorithm that considers double counting
of contributions due to relationships among external animals when
their associated external information was integrated into an
internal genetic evaluation. However, as highlighted in Chapter II,
external information may be based on data shared by the external
and internal evaluations and double counting of contributions due
to records may thus appear. Furthermore, Chapter II also
highlighted that all proposed Bayesian approaches, including
those proposed in Chapter III, do not allow the integration of more
than one source of external information. Therefore, based on a
Bayesian approach, a method integrating and blending
simultaneously several sources of information into an internal
genetic evaluation while avoiding double counting of
contributions due to relationships and due to records was proposed
and tested on both simulated and real data in this Chapter.
From: Vandenplas, J., F.G. Colinet and N. Gengler. 2014. Unified method to
integrate and blend several, potentially related, sources of information for genetic
evaluation. Genet. Sel. Evol. 46:59.

Unified method to integrate and blend several, potentially related, sources of information for genetic evaluation
97
ABSTRACT
BACKGROUND
A condition to predict unbiased estimated breeding values by best linear unbiased
prediction is to use simultaneously all available data. However, this condition is not often
fully met. For example, in dairy cattle, internal (i.e. local) populations lead to evaluations
based only on internal records while widely used foreign sires have been selected using
internally unavailable external records. In such cases, internal genetic evaluations may be
less accurate and biased. Because external records are unavailable, methods were
developed to combine external information that summarizes these records, i.e. external
estimated breeding values and associated reliabilities, with internal records to improve
accuracy of internal genetic evaluations. Two issues of these methods concern double
counting of contributions due to relationships and due to records. These issues could be
worse if external information came from several evaluations, at least partially based on
the same records, and combined into a single internal evaluation. Based on a Bayesian
approach, the aim of this research was to develop a unified method to integrate and blend
simultaneously several sources of information into an internal genetic evaluation by
avoiding double counting of contributions due to relationships and due to records.
RESULTS
This research resulted in equations that integrate and blend simultaneously several
sources of information and avoid double counting of contributions due to relationships
and due to records. The performance of the developed equations was evaluated using
simulated and real datasets. The results showed that the developed equations integrated
and blended several sources of information well into a genetic evaluation. The developed
equations also avoided double counting of contributions due to relationships and due to
records. Furthermore, because all available external sources of information were correctly
propagated, relatives of external animals benefited from the integrated information and,
therefore, more reliable estimated breeding values were obtained.
CONCLUSIONS
The proposed unified method integrated and blended several sources of
information well into a genetic evaluation by avoiding double counting of contributions
due to relationships and due to records. The unified method can also be extended to other
Chapter VI
98
types of situations such as single-step genomic or multi-trait evaluations, combining
information across different traits.
BACKGROUND
Simultaneous use of all available data by Best Linear Unbiased Prediction (BLUP)
is a condition to predict unbiased estimated breeding values (EBV; Henderson, 1984).
However, this condition is not often fully met. For example, in dairy cattle, while foreign
bulls are often widely used, e.g., through artificial insemination, evaluating populations
based only on internal phenotypic data (i.e., internal records) will lead to potentially
biased and less accurate evaluations (Bonaiti and Boichard, 1995). The reason is that
external phenotypic data used to select these foreign bulls are not available at the internal
level. Multiple across country evaluation (MACE), performed at an international level by
International Bull Service (Interbull, Uppsala, Sweden), allows EBV, for each population
scale, to be aggregated into a single ranking for international dairy sires. However, this
has no influence on internal evaluations. These issues are also relevant in the setting of
current developments of genomic multi-step or single-step prediction methods (e.g.,
Aguilar et al., 2010; Christensen and Lund, 2010; VanRaden, 2012).
Because external phenotypic data are not available at the internal level, methods
were developed to combine external information, i.e. external EBV and associated
reliabilities (REL), with internal data to improve accuracy of internal genetic evaluations.
A first type of approaches is based on performing, a posteriori, an additional step after the
genetic evaluation at the internal level. These approaches combine external and internal
EBV based on selection index theory (e.g., VanRaden, 2001), based on mixed model
theory (e.g., Täubert et al., 2000) or based on bivariate evaluations (e.g., Mäntysaari and
Strandén, 2010). One of the problems of a posteriori approaches is that external
information used for selection will not contribute to the estimation of fixed effects at the
internal level, which can create potential biases. A second type of approaches combines
external information simultaneously with internal phenotypic data in genetic evaluations
at the internal level. Simultaneous combination of external information and internal
phenotypic data can be carried out using different methods. However, to our knowledge,
the following two approaches are the most used. First, external information can be
directly included by converting this information into pseudo-records for fictive daughters
of external animals (e.g., Bonaiti and Boichard, 1995). Similar approaches were proposed
to include external information into internal single-step genomic evaluations (e.g.,
Unified method to integrate and blend several, potentially related, sources of information for genetic evaluation
99
VanRaden, 2012; Přibyl et al., 2013). Second, external information can be directly
included by changing both the mean and (co)variance of the prior distributions of genetic
effects in a Bayesian approach, as mentioned, for example, by Gianola and Fernando
(1986). Quaas and Zhang (2001, 2006) and Legarra et al. (2007) proposed two Bayesian
derivations to integrate external information into internal genetic evaluations in the
context of multi-breed genetic evaluations for beef cattle. These two derivations consider
external information as priors of internal genetic effects. Vandenplas and Gengler (2012)
compared these two derivations and proposed some improvements that concerned mainly
double counting of contributions due to relationships among external animals. Indeed, an
EBV of an animal combines information from its own records (i.e., contributions due to
own records) and from records of all relatives through its parents and its progeny (i.e.,
contributions due to relationships; VanRaden, 2001; Misztal and Wiggans, 1988).
Therefore, integration of EBV for relatives can cause the same contributions that are due
to relationships to be counted several times, which can bias genetic evaluations at the
internal level.
Both types of approaches, i.e., that combine available information a posteriori or
simultaneously, raise another issue if the external information results from an evaluation
that combines external and internal records, which is that some contributions due to
records will be considered several times when external information is combined with
internal records. Although this is a major issue for common sources of external
information (e.g., MACE information), to our knowledge, only a few studies have
proposed solutions to the double counting of contributions due to records (e.g.,
VanRaden, 2012; Gengler and Vanderick, 2008; VanRaden and Tooker, 2012). The
proposed solutions were developed as an additional pre-processing step before integration
of external information. Furthermore, in many situations, integration of several sources of
external information into genetic evaluations at the internal level may be needed but this
has not been studied to our knowledge. In such cases, double counting of contributions
due to records could be worse if external information from several evaluations were, at
least partially, based on the same internal records, and/or on the same external records,
and integrated into the same genetic evaluation.
Thus, the aim of this research was to develop a unified method to integrate and
blend simultaneously several, potentially related, external sources of information into an
internal genetic evaluation based on a Bayesian approach. In order to achieve this aim,
methods were developed to avoid double counting of contributions due to relationships
Chapter VI
100
and due to records generated by the integration of several sources of information. This
resulted in modified mixed model equations (MME) that integrate and blend
simultaneously several sources of information and avoid double counting of contributions
due to relationships and due to records. The performance of the developed equations was
evaluated using simulated and real datasets.
METHODS
INTEGRATION OF SEVERAL SOURCES OF EXTERNAL INFORMATION
Assume an internal genetic evaluation (referred to with the subscript E0) based on
internal data (i.e., a set of phenotypic records: 0Ey ) that provides internal information
(i.e., EBV and associated REL obtained from the evaluation E0). Also, assume an ith
external genetic evaluation (i = 1, 2, ..., N, referred to with the subscript Ei) that is based
on the ith source of external data (i.e., the ith set of phenotypic records not used by
evaluation E0 and free of internal data: iEy ) and that provides the ith source of external
information, i.e., all available external EBV (EBVEi) and associated REL (e.g., EBV and
associated REL obtained from evaluation E1 based only on external data E1, and EBV and
associated REL obtained from evaluation E2 based only on external data E2). In addition
to be free of internal data, it is also assumed that each ith source of external data was free
of the other N-1 sources of external data. These assumptions lead to each ith source of
external information to be free of internal data and information, as well as of the N-1
other external data and information.
Two groups of animals, hereafter called external and internal animals, are defined
according to the ith source of external information. Therefore, for each ith source of
external information, external animals (subscript iA with i = 1, 2,…, N ) are defined as
animals that are associated with this ith source of external information and for which
internal data and/or information is available or that have relationships with animals
involved in the internal evaluation E0. All animals that are not defined as external animals
for the ith source of external information are defined as internal animals (subscript 0iA ).
Internal animals are then defined as animals associated with only internal information
when considering the ith source of external information. It is noted that external animals
may be associated with different sources of external information and that an animal may
be considered as external for the ith source of external information and internal for the N-
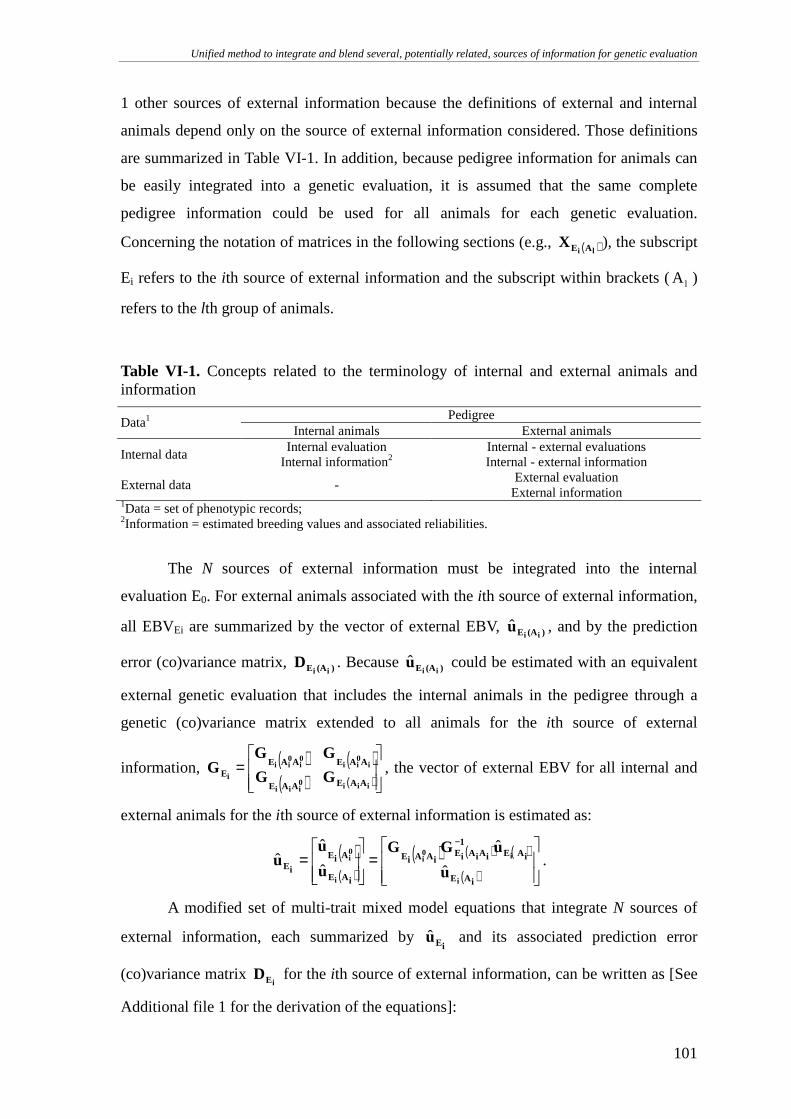
Unified method to integrate and blend several, potentially related, sources of information for genetic evaluation
101
1 other sources of external information because the definitions of external and internal
animals depend only on the source of external information considered. Those definitions
are summarized in Table VI-1. In addition, because pedigree information for animals can
be easily integrated into a genetic evaluation, it is assumed that the same complete
pedigree information could be used for all animals for each genetic evaluation.
Concerning the notation of matrices in the following sections (e.g., ( )li AEX ), the subscript
Ei refers to the ith source of external information and the subscript within brackets ( lA )
refers to the lth group of animals.
Table VI-1. Concepts related to the terminology of internal and external animals and information
Pedigree Data1
Internal animals External animals
Internal data Internal evaluation
Internal information2 Internal - external evaluations Internal - external information
External data - External evaluation External information
1Data = set of phenotypic records; 2Information = estimated breeding values and associated reliabilities.
The N sources of external information must be integrated into the internal
evaluation E0. For external animals associated with the ith source of external information,
all EBVEi are summarized by the vector of external EBV, )(AE iiu , and by the prediction
error (co)variance matrix, )(AE iiD . Because )(AE ii
u could be estimated with an equivalent
external genetic evaluation that includes the internal animals in the pedigree through a
genetic (co)variance matrix extended to all animals for the ith source of external
information, ( ) ( )( ) ( )
=
iii0iii
i0ii
0i
0ii
iAAEAAE
AAEAAEE GG
GGG , the vector of external EBV for all internal and
external animals for the ith source of external information is estimated as:
( )( )
( ) ( ) ( )
( )
=
=
−
iAE
iAE1
iAiAiEiAAiE
iAE
AiE
iE
i
i0i
i
0i
u
uGG
u
uu
ˆ
ˆ
ˆ
ˆˆ .
A modified set of multi-trait mixed model equations that integrate N sources of
external information, each summarized by iEu and its associated prediction error
(co)variance matrix iED for the ith source of external information, can be written as [See
Additional file 1 for the derivation of the equations]:
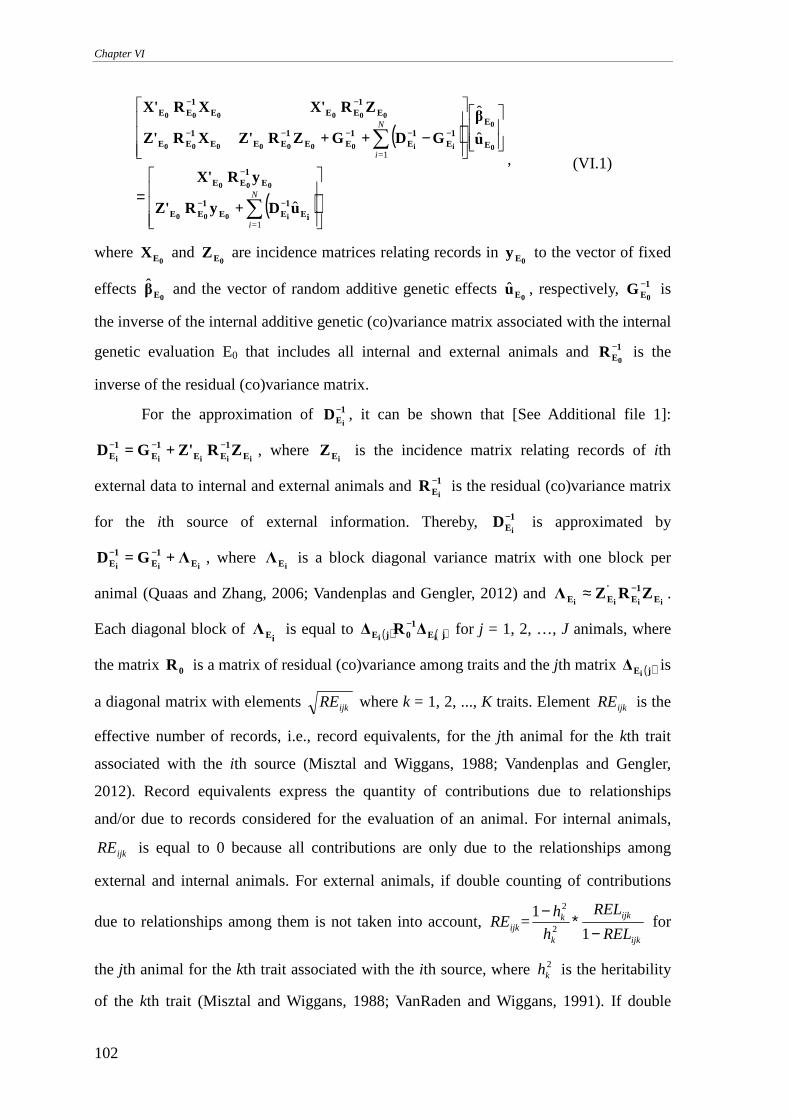
Chapter VI
102
( )
( )
=
−
∑
∑
−−
−
−−−−−
−−
N
i=
N
i=
1
1
ˆ
ˆ
ˆ
iE1
EE1
EE
E1
EE
E
E1
E1
E1
EE1
EEE1
EE
E1
EEE1
EE
uD+yRZ'
yRX'
u
β
GD+G+ZRZ'XRZ'
ZRX'XRX'
i000
000
0
0
ii0000000
000000
, (VI.1)
where 0EX and
0EZ are incidence matrices relating records in 0Ey to the vector of fixed
effects 0Eβ and the vector of random additive genetic effects
0Eu , respectively, 1E0
G − is
the inverse of the internal additive genetic (co)variance matrix associated with the internal
genetic evaluation E0 that includes all internal and external animals and 1E0
R − is the
inverse of the residual (co)variance matrix.
For the approximation of 1Ei
D− , it can be shown that [See Additional file 1]:
iiiii E1
EE1
E1
E ZRZ'+G=D −−− , where iEZ is the incidence matrix relating records of ith
external data to internal and external animals and 1Ei
R − is the residual (co)variance matrix
for the ith source of external information. Thereby, 1Ei
D− is approximated by
iii E1
E1
E Λ+G=D −− , where iEΛ is a block diagonal variance matrix with one block per
animal (Quaas and Zhang, 2006; Vandenplas and Gengler, 2012) and iiii E
1E
'EE ZRZΛ
−≈ .
Each diagonal block of iEΛ is equal to ( ) ( )jE
10jE ii∆R∆
− for j = 1, 2, …, J animals, where
the matrix 0R is a matrix of residual (co)variance among traits and the jth matrix ( )jE i∆ is
a diagonal matrix with elements ijkRE where k = 1, 2, ..., K traits. Element ijkRE is the
effective number of records, i.e., record equivalents, for the jth animal for the kth trait
associated with the ith source (Misztal and Wiggans, 1988; Vandenplas and Gengler,
2012). Record equivalents express the quantity of contributions due to relationships
and/or due to records considered for the evaluation of an animal. For internal animals,
ijkRE is equal to 0 because all contributions are only due to the relationships among
external and internal animals. For external animals, if double counting of contributions
due to relationships among them is not taken into account, ijk
ijk
k
kijk REL
REL
h
h=RE
−∗−
1
12
2
for
the jth animal for the kth trait associated with the ith source, where 2kh is the heritability
of the kth trait (Misztal and Wiggans, 1988; VanRaden and Wiggans, 1991). If double
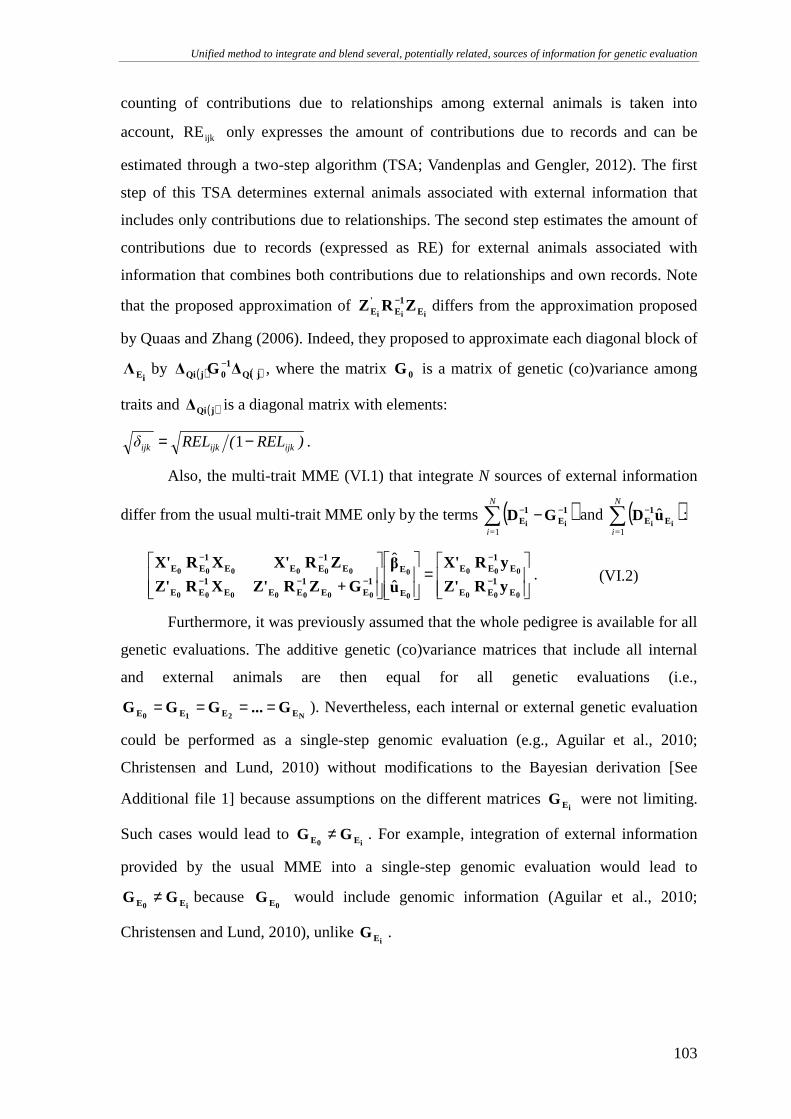
Unified method to integrate and blend several, potentially related, sources of information for genetic evaluation
103
counting of contributions due to relationships among external animals is taken into
account, ijkRE only expresses the amount of contributions due to records and can be
estimated through a two-step algorithm (TSA; Vandenplas and Gengler, 2012). The first
step of this TSA determines external animals associated with external information that
includes only contributions due to relationships. The second step estimates the amount of
contributions due to records (expressed as RE) for external animals associated with
information that combines both contributions due to relationships and own records. Note
that the proposed approximation of iii E
1E
'E ZRZ − differs from the approximation proposed
by Quaas and Zhang (2006). Indeed, they proposed to approximate each diagonal block of
iEΛ by ( ) ( )jQi1
0jQi ∆G∆− , where the matrix 0G is a matrix of genetic (co)variance among
traits and ( )jQi∆ is a diagonal matrix with elements:
)REL(RELδ ijkijkijk −= 1 .
Also, the multi-trait MME (VI.1) that integrate N sources of external information
differ from the usual multi-trait MME only by the terms ( )∑ −− −N
i=1
1E
1E ii
GD and ( )∑ −N
i=1
ˆii E
1E uD :
=
−
−
−−−
−−
000
000
0
0
0000000
000000
E1
EE
E1
EE
E
E1
EE1
EEE1
EE
E1
EEE1
EE
yRZ'
yRX'
u
β
G+ZRZ'XRZ'
ZRX'XRX'
ˆ
ˆ. (VI.2)
Furthermore, it was previously assumed that the whole pedigree is available for all
genetic evaluations. The additive genetic (co)variance matrices that include all internal
and external animals are then equal for all genetic evaluations (i.e.,
N210 EEEE G...GGG ==== ). Nevertheless, each internal or external genetic evaluation
could be performed as a single-step genomic evaluation (e.g., Aguilar et al., 2010;
Christensen and Lund, 2010) without modifications to the Bayesian derivation [See
Additional file 1] because assumptions on the different matrices iEG were not limiting.
Such cases would lead to i0 EE GG ≠ . For example, integration of external information
provided by the usual MME into a single-step genomic evaluation would lead to
i0 EE GG ≠ because 0EG would include genomic information (Aguilar et al., 2010;
Christensen and Lund, 2010), unlike iEG .
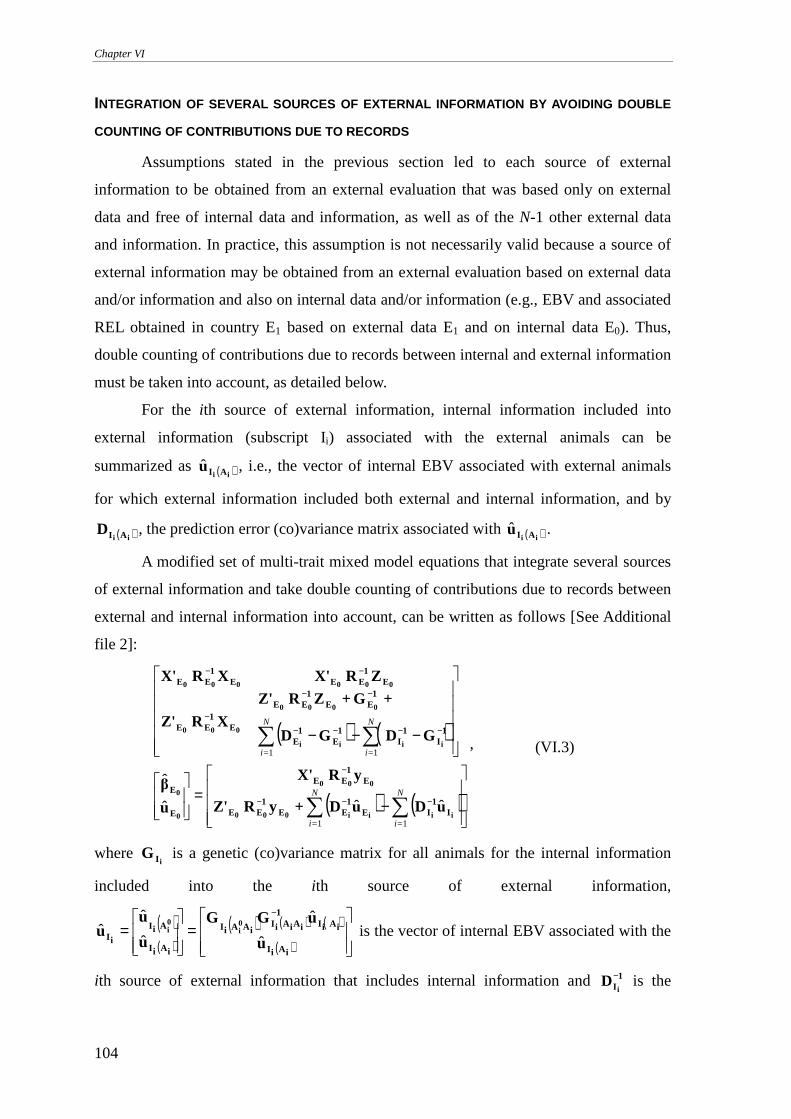
Chapter VI
104
INTEGRATION OF SEVERAL SOURCES OF EXTERNAL INFORMATION BY AVOIDI NG DOUBLE
COUNTING OF CONTRIBUTIONS DUE TO RECORDS
Assumptions stated in the previous section led to each source of external
information to be obtained from an external evaluation that was based only on external
data and free of internal data and information, as well as of the N-1 other external data
and information. In practice, this assumption is not necessarily valid because a source of
external information may be obtained from an external evaluation based on external data
and/or information and also on internal data and/or information (e.g., EBV and associated
REL obtained in country E1 based on external data E1 and on internal data E0). Thus,
double counting of contributions due to records between internal and external information
must be taken into account, as detailed below.
For the ith source of external information, internal information included into
external information (subscript Ii) associated with the external animals can be
summarized as ( )ii AIu , i.e., the vector of internal EBV associated with external animals
for which external information included both external and internal information, and by
( )ii AID , the prediction error (co)variance matrix associated with ( )ii AIu .
A modified set of multi-trait mixed model equations that integrate several sources
of external information and take double counting of contributions due to records between
external and internal information into account, can be written as follows [See Additional
file 2]:
( ) ( )
( ) ( )
−=
−−−
∑∑
∑∑
−−−
−
−−−−
−−
−
−−
N
i=
N
i=
N
i=
N
i=
11
11
ˆˆˆ
ˆ
iiii000
000
0
0
iiii
0000
000
000000
I1
IE1
EE1
EE
E1
EE
E
E
1I
1I
1E
1E
1EE
1EE
E1
EE
E1
EEE1
EE
uDuD+yRZ'
yRX'
u
β
GDGD
+G+ZRZ'
XRZ'
ZRX'XRX'
, (VI.3)
where iIG is a genetic (co)variance matrix for all animals for the internal information
included into the ith source of external information,
( )( )
( ) ( ) ( )
( )
=
=
−
iAiI
iAiI1
iAiAiIiAAiI
iAiI
AiI
iI u
uGG
u
uu
0i
0i
ˆ
ˆ
ˆ
ˆˆ is the vector of internal EBV associated with the
ith source of external information that includes internal information and 1I i
D− is the
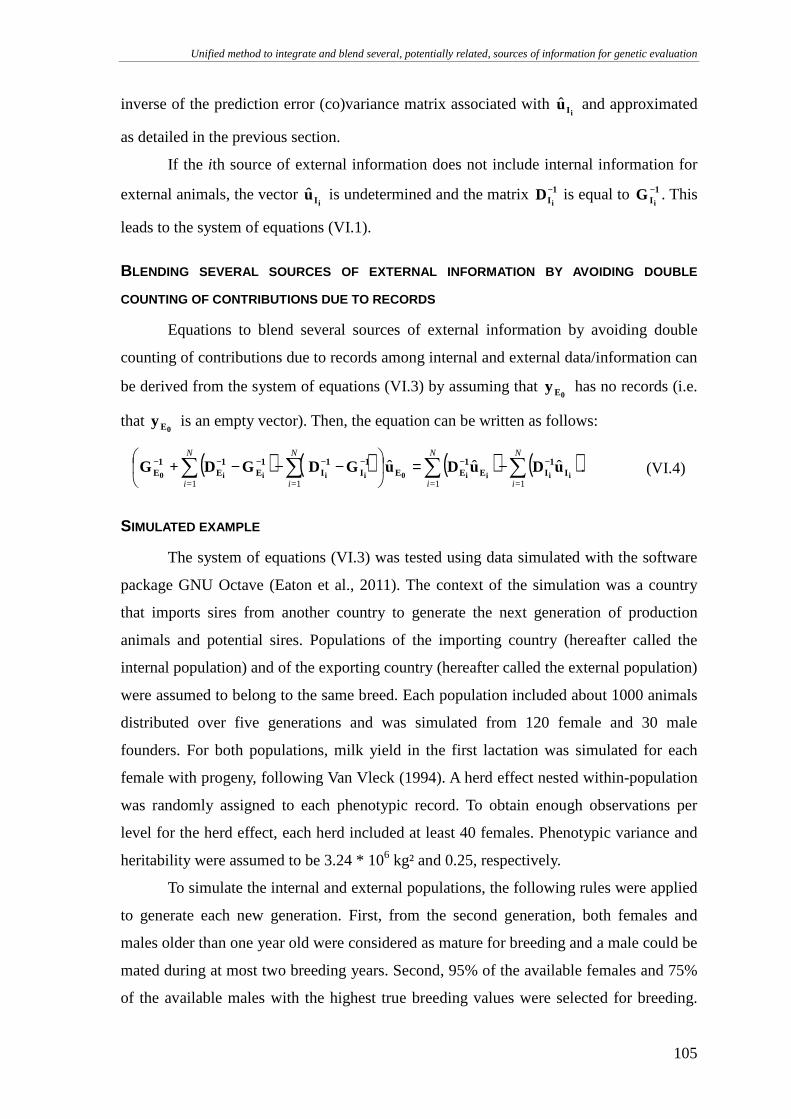
Unified method to integrate and blend several, potentially related, sources of information for genetic evaluation
105
inverse of the prediction error (co)variance matrix associated with iIu and approximated
as detailed in the previous section.
If the ith source of external information does not include internal information for
external animals, the vector iIu is undetermined and the matrix 1I i
D− is equal to 1I i
G − . This
leads to the system of equations (VI.1).
BLENDING SEVERAL SOURCES OF EXTERNAL INFORMATION BY AVOIDING DOU BLE
COUNTING OF CONTRIBUTIONS DUE TO RECORDS
Equations to blend several sources of external information by avoiding double
counting of contributions due to records among internal and external data/information can
be derived from the system of equations (VI.3) by assuming that 0Ey has no records (i.e.
that 0Ey is an empty vector). Then, the equation can be written as follows:
( ) ( ) ( ) ( )∑∑∑∑ −−−−−−− −=
−−−N
i=
N
i=
N
i=
N
i= 1111
ˆˆˆiiii0iiii0 I
1IE
1EE
1I
1I
1E
1E
1E uDuDu GDGD+G . (VI.4)
SIMULATED EXAMPLE
The system of equations (VI.3) was tested using data simulated with the software
package GNU Octave (Eaton et al., 2011). The context of the simulation was a country
that imports sires from another country to generate the next generation of production
animals and potential sires. Populations of the importing country (hereafter called the
internal population) and of the exporting country (hereafter called the external population)
were assumed to belong to the same breed. Each population included about 1000 animals
distributed over five generations and was simulated from 120 female and 30 male
founders. For both populations, milk yield in the first lactation was simulated for each
female with progeny, following Van Vleck (1994). A herd effect nested within-population
was randomly assigned to each phenotypic record. To obtain enough observations per
level for the herd effect, each herd included at least 40 females. Phenotypic variance and
heritability were assumed to be 3.24 * 106 kg² and 0.25, respectively.
To simulate the internal and external populations, the following rules were applied
to generate each new generation. First, from the second generation, both females and
males older than one year old were considered as mature for breeding and a male could be
mated during at most two breeding years. Second, 95% of the available females and 75%
of the available males with the highest true breeding values were selected for breeding.
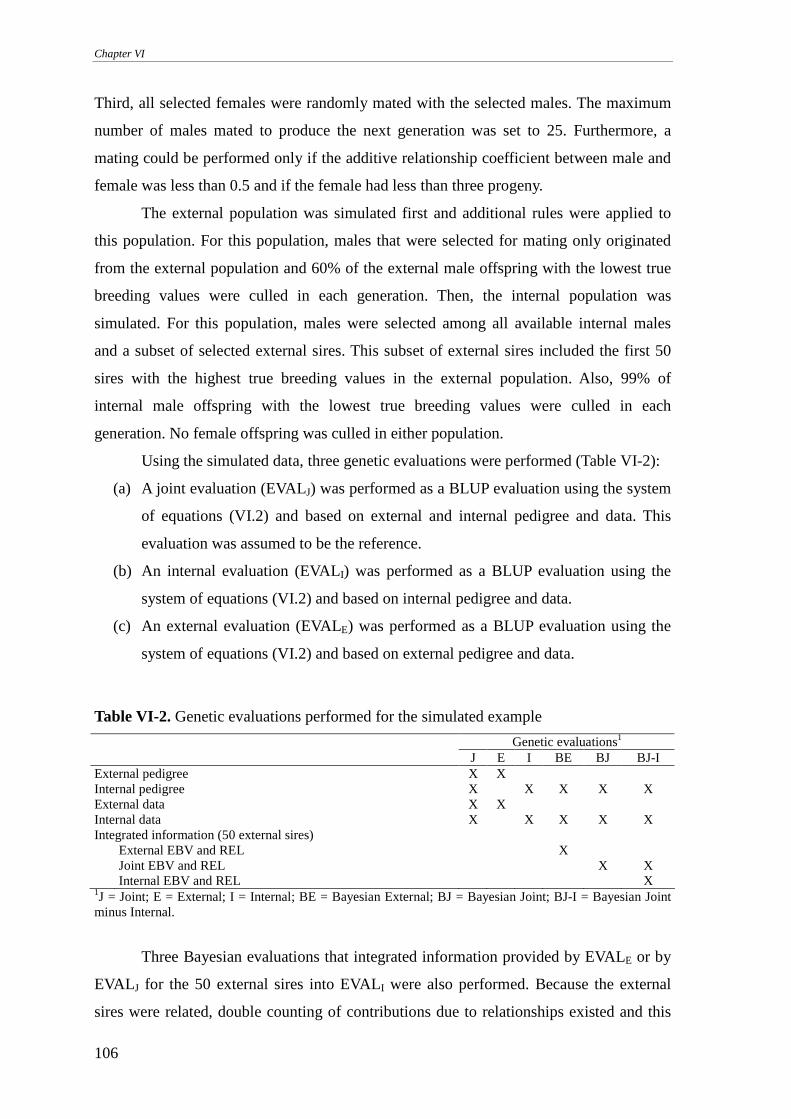
Chapter VI
106
Third, all selected females were randomly mated with the selected males. The maximum
number of males mated to produce the next generation was set to 25. Furthermore, a
mating could be performed only if the additive relationship coefficient between male and
female was less than 0.5 and if the female had less than three progeny.
The external population was simulated first and additional rules were applied to
this population. For this population, males that were selected for mating only originated
from the external population and 60% of the external male offspring with the lowest true
breeding values were culled in each generation. Then, the internal population was
simulated. For this population, males were selected among all available internal males
and a subset of selected external sires. This subset of external sires included the first 50
sires with the highest true breeding values in the external population. Also, 99% of
internal male offspring with the lowest true breeding values were culled in each
generation. No female offspring was culled in either population.
Using the simulated data, three genetic evaluations were performed (Table VI-2):
(a) A joint evaluation (EVALJ) was performed as a BLUP evaluation using the system
of equations (VI.2) and based on external and internal pedigree and data. This
evaluation was assumed to be the reference.
(b) An internal evaluation (EVALI) was performed as a BLUP evaluation using the
system of equations (VI.2) and based on internal pedigree and data.
(c) An external evaluation (EVALE) was performed as a BLUP evaluation using the
system of equations (VI.2) and based on external pedigree and data.
Table VI-2. Genetic evaluations performed for the simulated example
Genetic evaluations1 J E I BE BJ BJ-I External pedigree X X Internal pedigree X X X X X External data X X Internal data X X X X X Integrated information (50 external sires)
External EBV and REL X Joint EBV and REL X X Internal EBV and REL X
1J = Joint; E = External; I = Internal; BE = Bayesian External; BJ = Bayesian Joint; BJ-I = Bayesian Joint minus Internal.
Three Bayesian evaluations that integrated information provided by EVALE or by
EVALJ for the 50 external sires into EVALI were also performed. Because the external
sires were related, double counting of contributions due to relationships existed and this
Unified method to integrate and blend several, potentially related, sources of information for genetic evaluation
107
was taken into account for the three Bayesian evaluations through the TSA (Vandenplas
and Gengler, 2012). Double counting of contributions due to records could also exist with
the integration of information provided by EVALJ into EVALI because EVALJ and EVALI
were partially based on the same data (i.e., internal data). The following three Bayesian
evaluations were performed:
(d) A Bayesian evaluation using the system of equations (VI.1) and using EBV and
prediction error variances (PEV) obtained from EVALE associated with the 50
external sires that were used inside the internal population as external information
(EVALBE).
(e) A Bayesian evaluation using the system of equations (VI.1) and EBV and PEV
obtained from EVALJ associated with the 50 external sires as external information
(hereafter called joint information) (EVALBJ). Although EVALJ was based on
external and internal data, double counting of contributions due to records
between joint and internal information was not taken into account.
(f) A Bayesian evaluation integrating joint information by using the system of
equations (VI.3) and taking into account double counting of contributions due
records among internal and joint information (EVALBJ-I). Double counting of
contributions due to records among internal and joint information was taken into
account by using EBV and PEV obtained from EVALI associated with the 50
external sires.
The simulation was replicated 100 times. Comparisons between EVALJ and
EVAL I, EVALBE, EVALBJ, or EVALBJ-I were performed separately for the 50 external
sires and for the internal animals. Comparisons were based on:
(1) Spearman’s rank correlation coefficients (r) of EBV obtained from EVALJ (EBVJ)
with EBV obtained from EVALI (EBVI), EVALBE (EBVBE), EVALBJ (EBVBJ), and
EVALBJ-I (EBVBJ-I),
(2) regression coefficients (a) of EBVJ on EBVI, EBVBE, EBVBJ, and EBVBJ-I, and
(3) coefficients of determination (R²) associated with the regressions,
(4) the total amount of RE (REtot) associated with external information, joint
information and joint information corrected for the included internal information,
and
(5) mean squared errors (MSE) of EBVI, EBVBE, EBVBJ, and EBVBJ-I, expressed as a
percentage of MSE obtained for EBVI. For each replicate, the MSE obtained for
EBVI was reported to a relative value of 100 before the different computations of
Chapter VI
108
MSE.
Because the TSA was applied before all three Bayesian evaluations, REtot were
free of contributions due to relationships estimated by the Bayesian evaluations. For an
easier understanding of the results and discussion, RE can be transformed into daughter
equivalents (DE) through ijkk
kijk RE
h
h=DE ∗
−−
2
2
1
4 (VanRaden and Wiggans, 1991). All
results were the average of the 100 replicates.
WALLOON EXAMPLE
Even if MACE allows the aggregation of EBV for dairy sires, internal genetic
evaluations for animals not associated with MACE information (e.g., cows, calves, young
sires) are not influenced by external information considered by the MACE for dairy sires
and may be still biased. Therefore, integration of MACE information into internal
evaluations, as well as blending of MACE and internal information, could benefit those
animals. The performance of equation (VI.4) that blends MACE and internal information
was evaluated in the context of the official Walloon genetic evaluation for Holstein cattle.
The Walloon example used information for milk, fat and protein yields for
Holstein cattle provided by the official Walloon genetic evaluation (Auvray and Gengler,
2002; Croquet et al., 2006). The genetic variances were those used for the official
Walloon genetic evaluation (Auvray and Gengler, 2002) and were equal to 280 425 kg²
for milk yield, to 522.6 kg² for fat yield and to 261.5 kg² for protein yield. The respective
heritabilities were equal to 0.38, 0.43 and 0.41. The pedigree file was extracted from the
database used for the official Walloon genetic evaluation (EVALW) and covered up to six
known ancestral generations. The extraction was performed for a randomly selected group
of 1909 animals (potentially genotyped) born after 1998. The selected group included
sires, cows and calves that were used or were not at the internal level. After extraction, the
pedigree file contained 16 234 animals.
Internal information included EBV and associated REL estimated from data
provided by the Walloon Breeding Association (EBVW, RELW) for the EVALW for milk
production of April 2013 (Auvray and Gengler, 2002; Croquet et al., 2006). A total of
12 046 animals were associated with an available EBVW. External information included
EBV and REL for 1981 sires provided with the official release for the April 2013 MACE
performed by Interbull (EVALMACE, EBVMACE, RELMACE; Interbull, 2013). It should be
noted that the Walloon Region in Belgium participated in the April 2013 MACE. Internal
Unified method to integrate and blend several, potentially related, sources of information for genetic evaluation
109
and external information were harmonized between the Walloon and MACE evaluations
by adjusting scales and mean differences towards the original expression of the trait in the
Walloon genetic evaluations. External information was then considered to be the same
trait as the internal phenotype trait.
Unlike the simulated example, no joint evaluation based on Walloon and external
records was available for both external and internal animals. Because EVALMACE
aggregated EBV from several national genetic evaluations for sires, it was considered as
the reference for the evaluated sires. Walloon and MACE information were blended by
using equation (VI.4) for the following four cases: with or without consideration of
double counting of contributions due to relationships and with or without consideration of
double counting of contributions due to records (Table VI-3). Double counting of
contributions due to relationships was possible because all animals associated with
Walloon and/or MACE information were related. Double counting of contributions due to
records was also possible because MACE information associated with the 1981 sires
included contributions provided by EVALW. Thus, to test the importance of both double
counting issues, the following four cases were evaluated:
(a) Walloon and MACE information were blended without considering double
counting of contributions due to records and due to relationships (EVALBLNN,
EBVBLNN, RELBLNN).
(b) Walloon and MACE information were blended by considering only double
counting of contributions due to records (EVALBLRE, EBVBLRE, RELBLRE). To
achieve this goal, the contribution of Walloon information into MACE information
was determined based on the domestic effective daughter equivalents (EDC)
associated with EBVMACE and RELMACE and provided with the official release for
the 2013 April MACE by Interbull. MACE information free of Walloon
information was reported by a domestic EDC equal to 0. A total of 601 sires were
associated with an EDC greater than 0. For these 601 sires, EBV and associated
REL estimated from Walloon data and contributing to the April 2013 MACE
routine-run (EBVWc, RELWc) were considered by EVALBLRE to take double
counting of contributions due to records into account. Double counting of
contributions due to relationships was not taken into account for either Walloon or
MACE information.
(c) Walloon and MACE information were blended by only considering double
counting of contributions due to relationships among all animals (EVALBLR,
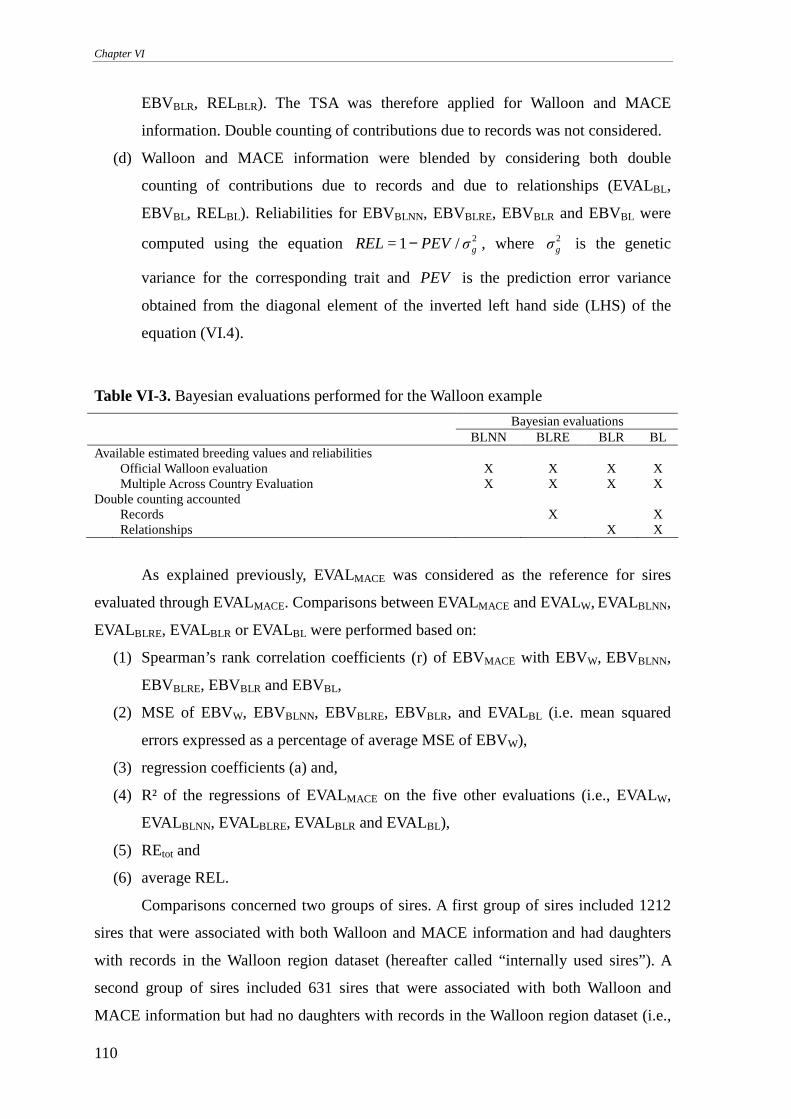
Chapter VI
110
EBVBLR, RELBLR). The TSA was therefore applied for Walloon and MACE
information. Double counting of contributions due to records was not considered.
(d) Walloon and MACE information were blended by considering both double
counting of contributions due to records and due to relationships (EVALBL,
EBVBL, RELBL). Reliabilities for EBVBLNN, EBVBLRE, EBVBLR and EBVBL were
computed using the equation 2/1 gσPEV=REL − , where 2gσ is the genetic
variance for the corresponding trait and PEV is the prediction error variance
obtained from the diagonal element of the inverted left hand side (LHS) of the
equation (VI.4).
Table VI-3. Bayesian evaluations performed for the Walloon example
Bayesian evaluations BLNN BLRE BLR BL Available estimated breeding values and reliabilities
Official Walloon evaluation X X X X Multiple Across Country Evaluation X X X X
Double counting accounted Records X X Relationships X X
As explained previously, EVALMACE was considered as the reference for sires
evaluated through EVALMACE. Comparisons between EVALMACE and EVALW, EVALBLNN,
EVALBLRE, EVALBLR or EVALBL were performed based on:
(1) Spearman’s rank correlation coefficients (r) of EBVMACE with EBVW, EBVBLNN,
EBVBLRE, EBVBLR and EBVBL,
(2) MSE of EBVW, EBVBLNN, EBVBLRE, EBVBLR, and EVALBL (i.e. mean squared
errors expressed as a percentage of average MSE of EBVW),
(3) regression coefficients (a) and,
(4) R² of the regressions of EVALMACE on the five other evaluations (i.e., EVALW,
EVALBLNN, EVALBLRE, EVALBLR and EVALBL),
(5) REtot and
(6) average REL.
Comparisons concerned two groups of sires. A first group of sires included 1212
sires that were associated with both Walloon and MACE information and had daughters
with records in the Walloon region dataset (hereafter called “internally used sires”). A
second group of sires included 631 sires that were associated with both Walloon and
MACE information but had no daughters with records in the Walloon region dataset (i.e.,
Unified method to integrate and blend several, potentially related, sources of information for genetic evaluation
111
they had only foreign, or external, daughters; hereafter called “internally unused sires”).
The REtot were free of contributions due to relationships that were estimated by the
Bayesian evaluations but could include contributions due to relationships that resulted
from the previous genetic evaluation if the TSA was not applied.
The effect of blending MACE and Walloon information was also studied for
internal animals that were not associated with MACE information and that were sired by
internally used sires by considering (1) r between EVALBL and EVALW, EVALBLNN,
EVALBLRE or EVALBLR, (2) REtot and (3) average REL. Three groups of internal animals
were defined depending on their RELW. The first group included internal animals that
were associated with a RELW lower than 0.50, the second group included internal animals
that were associated with a RELW between 0.50 and 0.75, and the third group included
internal animals with a RELW equal or higher than 0.75.
All blending evaluations were performed using a version of the BLUPF90
program (Misztal, 2013) modified to implement the equations (VI.1), (VI.3) and (VI.4).
RESULTS AND DISCUSSION
SIMULATED EXAMPLE
On average, each of the 100 simulated internal and external populations included
1048 animals. Results for r, MSE, a and R² for prediction of EBVJ are in Table VI-4 for
the 50 external sires and for the internal animals.
Compared to the rankings of EVALI, integration of external or joint information
for the 50 external sires led to rankings of EVALBE, EVALBJ or EVALBJ-I that were more
similar to those of EVALJ. Rank correlations r increased from 0.57 for EVALI to at least
0.95 for EVALBJ for the 50 external sires and from 0.93 for EVALI to at least 0.98 for
EVALBJ for internal animals (Table VI-4). Furthermore, MSE, a and R² also showed that
the integration of external or joint information for the 50 external animals with EVALBE,
EVALBJ or EVALBJ-I led to better predictions of EBVJ for both external and internal
animals (Table VI-4). Therefore, the observations that internals animals related to the 50
external sires were also better predicted by EVALBE, EVALBJ and EVALBJ-I, compared to
EVAL I, revealed that the external information propagated from the 50 external sires to
relatives.
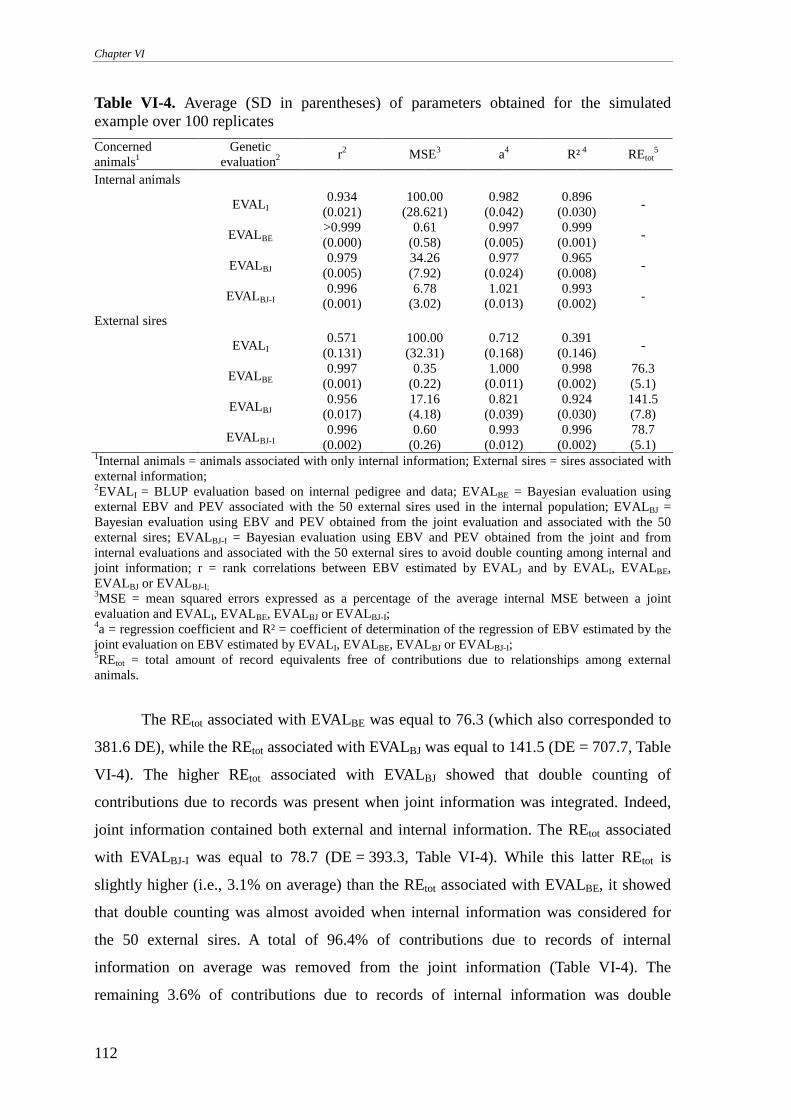
Chapter VI
112
Table VI-4. Average (SD in parentheses) of parameters obtained for the simulated example over 100 replicates
Concerned animals1
Genetic evaluation2
r2 MSE3 a4 R² 4 REtot5
Internal animals
EVAL I 0.934
(0.021) 100.00
(28.621) 0.982
(0.042) 0.896
(0.030) -
EVALBE >0.999 (0.000)
0.61 (0.58)
0.997 (0.005)
0.999 (0.001)
-
EVALBJ 0.979
(0.005) 34.26 (7.92)
0.977 (0.024)
0.965 (0.008)
-
EVALBJ-I 0.996
(0.001) 6.78
(3.02) 1.021
(0.013) 0.993
(0.002) -
External sires
EVAL I 0.571
(0.131) 100.00 (32.31)
0.712 (0.168)
0.391 (0.146)
-
EVALBE 0.997
(0.001) 0.35
(0.22) 1.000
(0.011) 0.998
(0.002) 76.3 (5.1)
EVALBJ 0.956
(0.017) 17.16 (4.18)
0.821 (0.039)
0.924 (0.030)
141.5 (7.8)
EVALBJ-I 0.996
(0.002) 0.60
(0.26) 0.993
(0.012) 0.996
(0.002) 78.7 (5.1)
1Internal animals = animals associated with only internal information; External sires = sires associated with external information; 2EVAL I = BLUP evaluation based on internal pedigree and data; EVALBE = Bayesian evaluation using external EBV and PEV associated with the 50 external sires used in the internal population; EVALBJ = Bayesian evaluation using EBV and PEV obtained from the joint evaluation and associated with the 50 external sires; EVALBJ-I = Bayesian evaluation using EBV and PEV obtained from the joint and from internal evaluations and associated with the 50 external sires to avoid double counting among internal and joint information; r = rank correlations between EBV estimated by EVALJ and by EVALI, EVALBE, EVALBJ or EVALBJ-I; 3MSE = mean squared errors expressed as a percentage of the average internal MSE between a joint evaluation and EVALI, EVALBE, EVALBJ or EVALBJ-I; 4a = regression coefficient and R² = coefficient of determination of the regression of EBV estimated by the joint evaluation on EBV estimated by EVALI, EVALBE, EVALBJ or EVALBJ-I; 5REtot = total amount of record equivalents free of contributions due to relationships among external animals.
The REtot associated with EVALBE was equal to 76.3 (which also corresponded to
381.6 DE), while the REtot associated with EVALBJ was equal to 141.5 (DE = 707.7, Table
VI-4). The higher REtot associated with EVALBJ showed that double counting of
contributions due to records was present when joint information was integrated. Indeed,
joint information contained both external and internal information. The REtot associated
with EVALBJ-I was equal to 78.7 (DE = 393.3, Table VI-4). While this latter REtot is
slightly higher (i.e., 3.1% on average) than the REtot associated with EVALBE, it showed
that double counting was almost avoided when internal information was considered for
the 50 external sires. A total of 96.4% of contributions due to records of internal
information on average was removed from the joint information (Table VI-4). The
remaining 3.6% of contributions due to records of internal information was double
Unified method to integrate and blend several, potentially related, sources of information for genetic evaluation
113
counted by the Bayesian evaluations and may result from the estimation of contributions
due to relationships and/or from the estimation of contributions due to records among
joint and internal information.
Because double counting of contributions due to records between joint and
internal information was almost avoided, breeding values that were estimated by
EVALBJ-I for all animals led to better predictions of EBVJ than EVALBJ, based on r, MSE,
a and R² (Table VI-4). Rank correlations of EBVJ with EBVBJ and EBVBJ-I increased from
0.979 for EVALBJ to 0.996 for EVALBJ-I for the internal animals and from 0.956 for
EVALBJ to 0.996 for EVALBJ-I for the 50 external animals. The MSE decreased on
average from 34.3% for EVALBJ to 6.8% for EVALBJ-I for the internal animals and from
17.2% for EVALBJ to 0.6% for EVALBJ-I for the external animals. These results again
showed that integration of external/joint information for the 50 external sires influenced
the prediction of internal relatives through the propagation of information from the
external sires to relatives. These results show that the double counting of contributions
due to records also affected predictions of internal animals. Furthermore, as expected,
EVALBE predicted EBVJ slightly better than EVALBJ-I for both external sires and internal
animals, based on the corresponding r, MSE, a and R² (Table VI-4). The low difference in
accuracy of prediction between EVALBE and EVALBJ-I could be attributed to the
estimation of contributions due to relationships and due to records.
Based on these results, double counting of contributions due to records was almost
avoided. Thus, the integration of information into a genetic evaluation by avoiding both
contributions due to relationships and due to records performed well for external animals.
Internal animals also benefited of the integration of information thanks to their
relationships with external animals.
WALLOON EXAMPLE
Of the 12 046 animals associated with available Walloon information for the three
traits, 6232 animals for milk yield, 6209 animals for fat yield, and 6212 animals for
protein yield were associated with information that was based only on contributions due
to relationships, as estimated by the TSA. In terms of RE, contributions due to
relationships represented from 14.9% for fat yield to 16.3% for milk yield of the
contributions associated with Walloon information (Figure VI-1). Among the 1981 sires
associated with MACE information, two sires were associated with information that
includes only contributions due to relationships for the three traits. Both these sires had
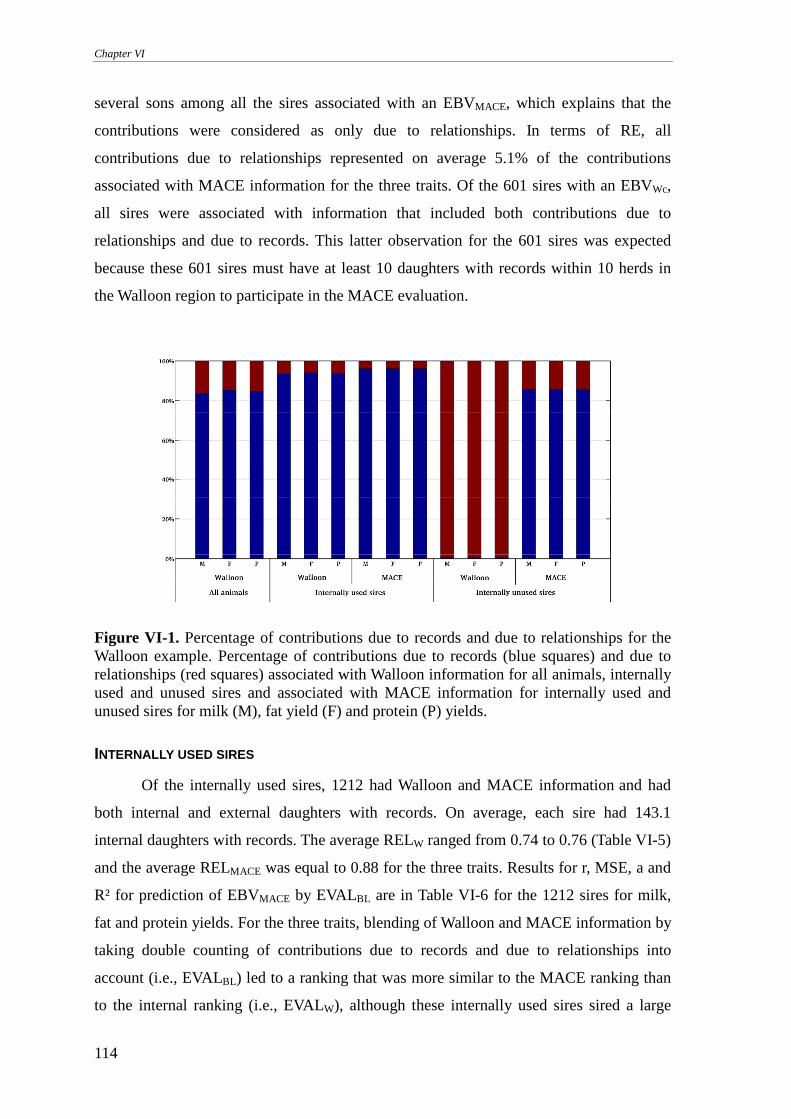
Chapter VI
114
several sons among all the sires associated with an EBVMACE, which explains that the
contributions were considered as only due to relationships. In terms of RE, all
contributions due to relationships represented on average 5.1% of the contributions
associated with MACE information for the three traits. Of the 601 sires with an EBVWc,
all sires were associated with information that included both contributions due to
relationships and due to records. This latter observation for the 601 sires was expected
because these 601 sires must have at least 10 daughters with records within 10 herds in
the Walloon region to participate in the MACE evaluation.
Figure VI-1. Percentage of contributions due to records and due to relationships for the Walloon example. Percentage of contributions due to records (blue squares) and due to relationships (red squares) associated with Walloon information for all animals, internally used and unused sires and associated with MACE information for internally used and unused sires for milk (M), fat yield (F) and protein (P) yields.
INTERNALLY USED SIRES
Of the internally used sires, 1212 had Walloon and MACE information and had
both internal and external daughters with records. On average, each sire had 143.1
internal daughters with records. The average RELW ranged from 0.74 to 0.76 (Table VI-5)
and the average RELMACE was equal to 0.88 for the three traits. Results for r, MSE, a and
R² for prediction of EBVMACE by EVALBL are in Table VI-6 for the 1212 sires for milk,
fat and protein yields. For the three traits, blending of Walloon and MACE information by
taking double counting of contributions due to records and due to relationships into
account (i.e., EVALBL) led to a ranking that was more similar to the MACE ranking than
to the internal ranking (i.e., EVALW), although these internally used sires sired a large
Unified method to integrate and blend several, potentially related, sources of information for genetic evaluation
115
number of cows with records in the Walloon region. Rank correlations increased by 0.104
points for milk yield to 0.125 points for fat yield to achieve a rank correlation between
EBVMACE and EBVBL that ranged from 0.987 to 0.990 (Table VI-6). The MSE, a and R²
showed that accuracy of predictions of EBVMACE by EBVW or by EBVBL increased when
external information was integrated. Integration of MACE information also increased the
average REL by 0.14 points for fat yield to 0.16 points for milk yield (Table VI-5). This
increase of average REL corresponded to an increase of 57.5, 51.4, and 50.9 DE per sire
on average for milk, fat and protein yields, respectively. Also, the average RELBL for the
1212 sires was 0.02 points higher than the average RELMACE (Table VI-6). This difference
in average REL, as well as the differences between EBVMACE and EBVBL based on MSE,
a and R² (Table VI-6), can be explained by the fact that MACE did not include all
information available for animals in the Walloon Region. Indeed, EBVW of a sire was
included into MACE if it had at least 10 daughters with records within 10 herds at the
internal level. Therefore, EBVW for sires that did not fulfill this requirement were not
considered by MACE, but were taken into account by the four Bayesian evaluations,
which provided additional information compared to MACE information. Approximations
based on estimation of contributions due to relationships and theoretical assumptions of
the model may also explain some of the differences between EBVMACE and EBVBL. For
example, MACE was considered as a national genetic evaluation. These results indicate
that EVALBL, i.e. a Bayesian evaluation that blended internal information and external
information and avoided most double counting of contributions due to records and due to
relationships, was successful in integrating MACE information for internally used sires.
Table VI-5. Average reliabilities (REL; SD in parentheses) associated with Walloon estimated breeding values for internally used and unused sires
Considered animals Milk yield Fat yield Protein yield Internally used sires 0.74 (0.22) 0.76 (0.21) 0.75 (0.22) Internally unused sires 0.22 (0.10) 0.23 (0.10) 0.22 (0.10)
Double counting of contributions due to records and due to relationships were also
not considered (i.e. EVALBLNN) or were considered separately (i.e. EVALBLRE and
EVALBLR) to study their influences on prediction of EVALMACE for internally used sires.
Parameters r, a and R² associated with EVALBLNN, EVALBLRE and EVALBLR for the 1212
sires were similar to the r, a and R² of EVALBL, although a slight advantage was observed
for EVALBL. Therefore, the four blending evaluations led to similar rankings as MACE
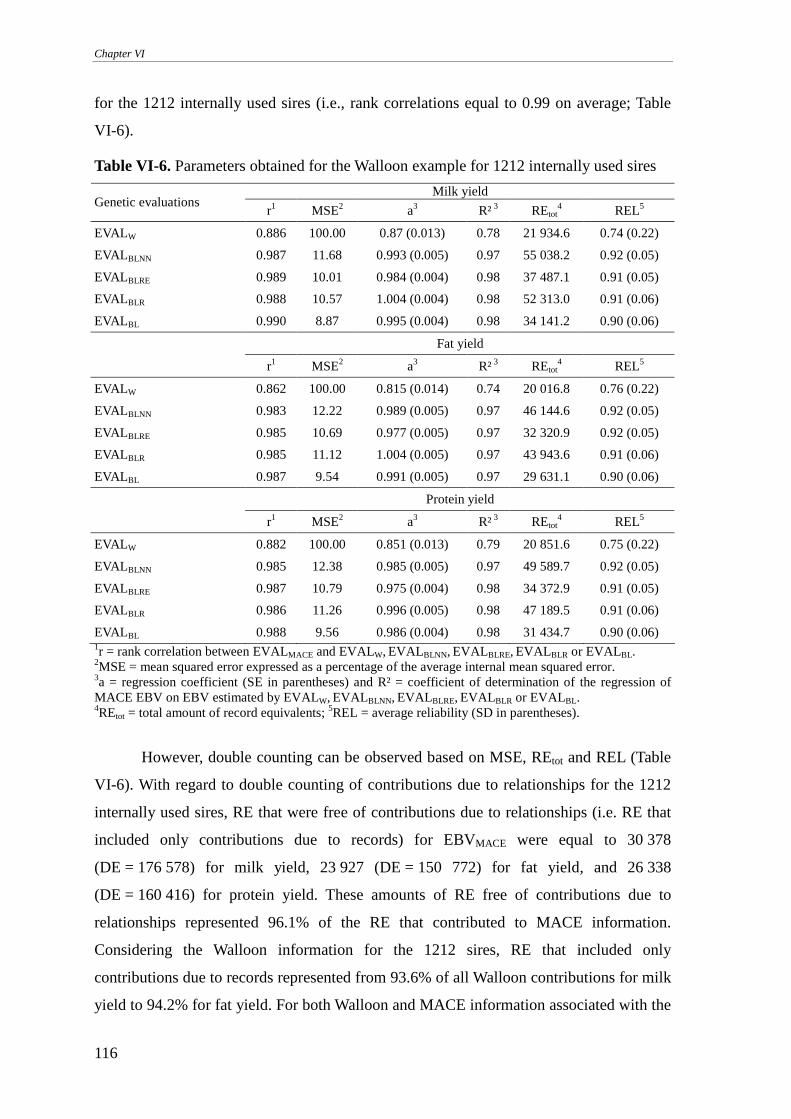
Chapter VI
116
for the 1212 internally used sires (i.e., rank correlations equal to 0.99 on average; Table
VI-6).
Table VI-6. Parameters obtained for the Walloon example for 1212 internally used sires
Milk yield Genetic evaluations
r1 MSE2 a3 R² 3 REtot4 REL5
EVALW 0.886 100.00 0.87 (0.013) 0.78 21 934.6 0.74 (0.22)
EVALBLNN 0.987 11.68 0.993 (0.005) 0.97 55 038.2 0.92 (0.05)
EVALBLRE 0.989 10.01 0.984 (0.004) 0.98 37 487.1 0.91 (0.05)
EVALBLR 0.988 10.57 1.004 (0.004) 0.98 52 313.0 0.91 (0.06)
EVALBL 0.990 8.87 0.995 (0.004) 0.98 34 141.2 0.90 (0.06)
Fat yield
r1 MSE2 a3 R² 3 REtot4 REL5
EVALW 0.862 100.00 0.815 (0.014) 0.74 20 016.8 0.76 (0.22)
EVALBLNN 0.983 12.22 0.989 (0.005) 0.97 46 144.6 0.92 (0.05)
EVALBLRE 0.985 10.69 0.977 (0.005) 0.97 32 320.9 0.92 (0.05)
EVALBLR 0.985 11.12 1.004 (0.005) 0.97 43 943.6 0.91 (0.06)
EVALBL 0.987 9.54 0.991 (0.005) 0.97 29 631.1 0.90 (0.06)
Protein yield
r1 MSE2 a3 R² 3 REtot4 REL5
EVALW 0.882 100.00 0.851 (0.013) 0.79 20 851.6 0.75 (0.22)
EVALBLNN 0.985 12.38 0.985 (0.005) 0.97 49 589.7 0.92 (0.05)
EVALBLRE 0.987 10.79 0.975 (0.004) 0.98 34 372.9 0.91 (0.05)
EVALBLR 0.986 11.26 0.996 (0.005) 0.98 47 189.5 0.91 (0.06)
EVALBL 0.988 9.56 0.986 (0.004) 0.98 31 434.7 0.90 (0.06)
1r = rank correlation between EVALMACE and EVALW, EVALBLNN, EVALBLRE, EVALBLR or EVALBL. 2MSE = mean squared error expressed as a percentage of the average internal mean squared error. 3a = regression coefficient (SE in parentheses) and R² = coefficient of determination of the regression of MACE EBV on EBV estimated by EVALW, EVALBLNN, EVALBLRE, EVALBLR or EVALBL. 4REtot = total amount of record equivalents; 5REL = average reliability (SD in parentheses).
However, double counting can be observed based on MSE, REtot and REL (Table
VI-6). With regard to double counting of contributions due to relationships for the 1212
internally used sires, RE that were free of contributions due to relationships (i.e. RE that
included only contributions due to records) for EBVMACE were equal to 30 378
(DE = 176 578) for milk yield, 23 927 (DE = 150 772) for fat yield, and 26 338
(DE = 160 416) for protein yield. These amounts of RE free of contributions due to
relationships represented 96.1% of the RE that contributed to MACE information.
Considering the Walloon information for the 1212 sires, RE that included only
contributions due to records represented from 93.6% of all Walloon contributions for milk
yield to 94.2% for fat yield. For both Walloon and MACE information associated with the
Unified method to integrate and blend several, potentially related, sources of information for genetic evaluation
117
internally used sires and for the three traits (i.e. for milk, fat and protein yields), less than
6.4% of all contributions were attributed to relationships (Figure VI-1). Such low
percentages of contributions due to relationships are in agreement with selection index
theory (Van Vleck, 1993). While double counting of contributions due to relationships
was present for EVALBLRE (i.e. the blending evaluation that considered only double
counting of contributions due to records), the contributions due to relationships were
small and their double counting had little effect on the prediction of EBVMACE for the
internally used sires, compared to EVALBL, based on parameters r and MSE. However, as
expected, an average increase of 1% in RELBLRE was observed, compared to RELBL.
Thus, the RELBLRE were, on average, slightly overestimated.
With regard to double counting of contributions due to records, based on RE,
Walloon information represented from 64.3% of the total information free of
contributions due to relationships associated with EVALBL for milk yield to 67.6% for fat
yield (Table VI-6). Thus, integrated information free of contributions due to relationships
and due to records (i.e. MACE information from which Walloon information was
subtracted) represented 32.5% of the total information associated with EVALBL for fat
yield to 35.8% for milk yield. If double counting of contributions due to relationships was
considered only, REtot associated with EVALBLR ranged from 43 944 RE for fat yield to
52 313 RE for milk yield, while REtot associated with EVALBL ranged from 29 631 RE for
fat yield to 34 141 RE for milk yield. Thus, between 14 313 and 18 172 RE were
considered twice by EVALBLR. However, double counting of contributions due to records
affected the prediction of EBVMACE for internally used sires only slightly according to all
parameters evaluated (Table VI-5). The RELBLR were overestimated by 1% on average for
the internally used sires, compared to RELBL. Furthermore, no preference was observed
between EVALBLRE and EVALBLR based on r, MSE, a and R² for the three traits. Indeed, r
and R² were similar for these two evaluations, while EVALBLRE was more reliable based
on MSE, but parameter a indicated that EVALBLR was more reliable. However, EVALBLRE
had the greatest under- and overestimation of true breeding values based on parameter a.
Based on these results, it can be stated that double counting of contributions due to
relationships and due to records had little effect on EBV for internally used sires.
INTERNALLY UNUSED SIRES
Of the internally unused sires (i.e. that had only external daughters with records),
631 sires were associated with Walloon and MACE information. Their average RELW
Chapter VI
118
ranged from 0.22 to 0.23 for the three traits (Table VI-7) and the average RELMACE was
equal to 0.77. Because they had only external daughters, Walloon contributions only
included contributions due to relationships and no contributions due to records. Based on
REtot (Table VI-7), Walloon contributions due to records for all 631 sires were in general
well estimated by the TSA, ranging from 0.79% of the Walloon total contributions for
milk yield to 0.80% for protein yield (Figure VI-1). The small non-zero percentage could
be attributed to approximations involved in estimating the contributions due to
relationships and due to records by the TSA, such as the consideration of an unknown
fixed effect (Vandenplas and Gengler, 2012). The nearly correct estimation of
contributions due to relationships led to similar average RELMACE and average RELBL for
the three traits (Table VI-7). Integration of MACE information also increased the average
RELW by at least 0.54 points, resulting in an average RELBL equal to 0.77 for the three
traits. These results for the 631 internally unused sires confirmed that MACE information
already contained the main contributions due to relationships that were expressed in the
Walloon information and that double counting of contributions due to relationships was
mostly avoided. Not considering contributions due to relationships (i.e., EVALBLNN and
EVALBLRE) led to overestimation of average REL by at least 3% (Table VI-7).
Results for r, MSE, a and R² for the prediction of EBVMACE by the four blending
evaluations are in Table VI-7 for the 631 internally unused sires for the three traits.
Blending of Walloon and MACE information led to similar rankings of the 631 sires for
the four blending evaluations. Rank correlations between EBVMACE and EBV for the four
blending evaluations increased from 0.73 to 0.99 for milk yield, from 0.57 to 0.99 for fat
yield and from 0.72 to 0.99 for protein yield. These rank correlations indicated that the
blending method was also successful for sires with only external information for all three
traits. These results were confirmed by a decrease of MSE by at least 96.9% and by
regression coefficients close to 1.0, with an R² equal to 0.99 for all three traits (Table
VI-7). Because double counting can be only attributed to contributions due to
relationships for the 631 internally unused sires, EVALBLNN and EVALBLRE led to similar
parameters. This was also observed for EVALBL and EVALBLR (Table VI-7). Differences
between these two groups of evaluations were only observed based on MSE and a (Table
VI-7). These two parameters showed that EBVMACE for the 631 sires were slightly better
predicted when contributions due to relationships were considered. However, all these
results showed that contributions due to relationships had little effect on the prediction of
EBVMACE.
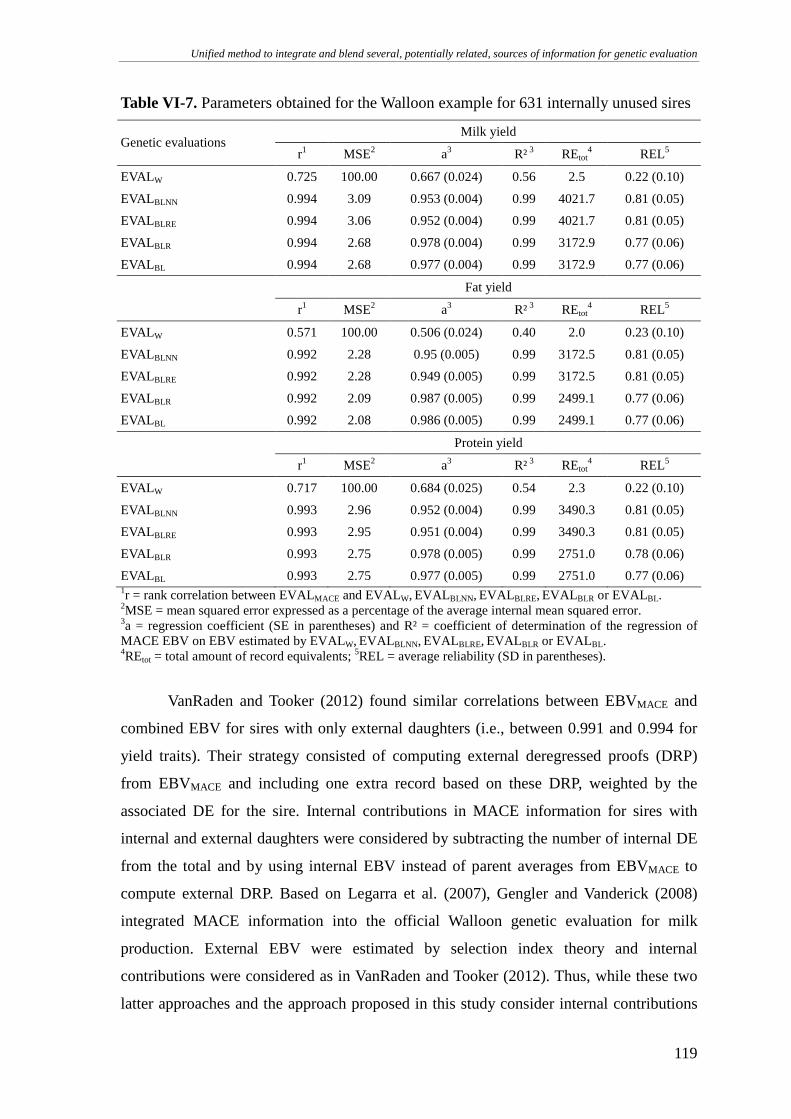
Unified method to integrate and blend several, potentially related, sources of information for genetic evaluation
119
Table VI-7. Parameters obtained for the Walloon example for 631 internally unused sires
Milk yield Genetic evaluations
r1 MSE2 a3 R² 3 REtot4 REL5
EVALW 0.725 100.00 0.667 (0.024) 0.56 2.5 0.22 (0.10)
EVALBLNN 0.994 3.09 0.953 (0.004) 0.99 4021.7 0.81 (0.05)
EVALBLRE 0.994 3.06 0.952 (0.004) 0.99 4021.7 0.81 (0.05)
EVALBLR 0.994 2.68 0.978 (0.004) 0.99 3172.9 0.77 (0.06)
EVALBL 0.994 2.68 0.977 (0.004) 0.99 3172.9 0.77 (0.06)
Fat yield
r1 MSE2 a3 R² 3 REtot4 REL5
EVALW 0.571 100.00 0.506 (0.024) 0.40 2.0 0.23 (0.10)
EVALBLNN 0.992 2.28 0.95 (0.005) 0.99 3172.5 0.81 (0.05)
EVALBLRE 0.992 2.28 0.949 (0.005) 0.99 3172.5 0.81 (0.05)
EVALBLR 0.992 2.09 0.987 (0.005) 0.99 2499.1 0.77 (0.06)
EVALBL 0.992 2.08 0.986 (0.005) 0.99 2499.1 0.77 (0.06)
Protein yield
r1 MSE2 a3 R² 3 REtot4 REL5
EVALW 0.717 100.00 0.684 (0.025) 0.54 2.3 0.22 (0.10)
EVALBLNN 0.993 2.96 0.952 (0.004) 0.99 3490.3 0.81 (0.05)
EVALBLRE 0.993 2.95 0.951 (0.004) 0.99 3490.3 0.81 (0.05)
EVALBLR 0.993 2.75 0.978 (0.005) 0.99 2751.0 0.78 (0.06)
EVALBL 0.993 2.75 0.977 (0.005) 0.99 2751.0 0.77 (0.06) 1r = rank correlation between EVALMACE and EVALW, EVALBLNN, EVALBLRE, EVALBLR or EVALBL. 2MSE = mean squared error expressed as a percentage of the average internal mean squared error. 3a = regression coefficient (SE in parentheses) and R² = coefficient of determination of the regression of MACE EBV on EBV estimated by EVALW, EVALBLNN, EVALBLRE, EVALBLR or EVALBL. 4REtot = total amount of record equivalents; 5REL = average reliability (SD in parentheses).
VanRaden and Tooker (2012) found similar correlations between EBVMACE and
combined EBV for sires with only external daughters (i.e., between 0.991 and 0.994 for
yield traits). Their strategy consisted of computing external deregressed proofs (DRP)
from EBVMACE and including one extra record based on these DRP, weighted by the
associated DE for the sire. Internal contributions in MACE information for sires with
internal and external daughters were considered by subtracting the number of internal DE
from the total and by using internal EBV instead of parent averages from EBVMACE to
compute external DRP. Based on Legarra et al. (2007), Gengler and Vanderick (2008)
integrated MACE information into the official Walloon genetic evaluation for milk
production. External EBV were estimated by selection index theory and internal
contributions were considered as in VanRaden and Tooker (2012). Thus, while these two
latter approaches and the approach proposed in this study consider internal contributions
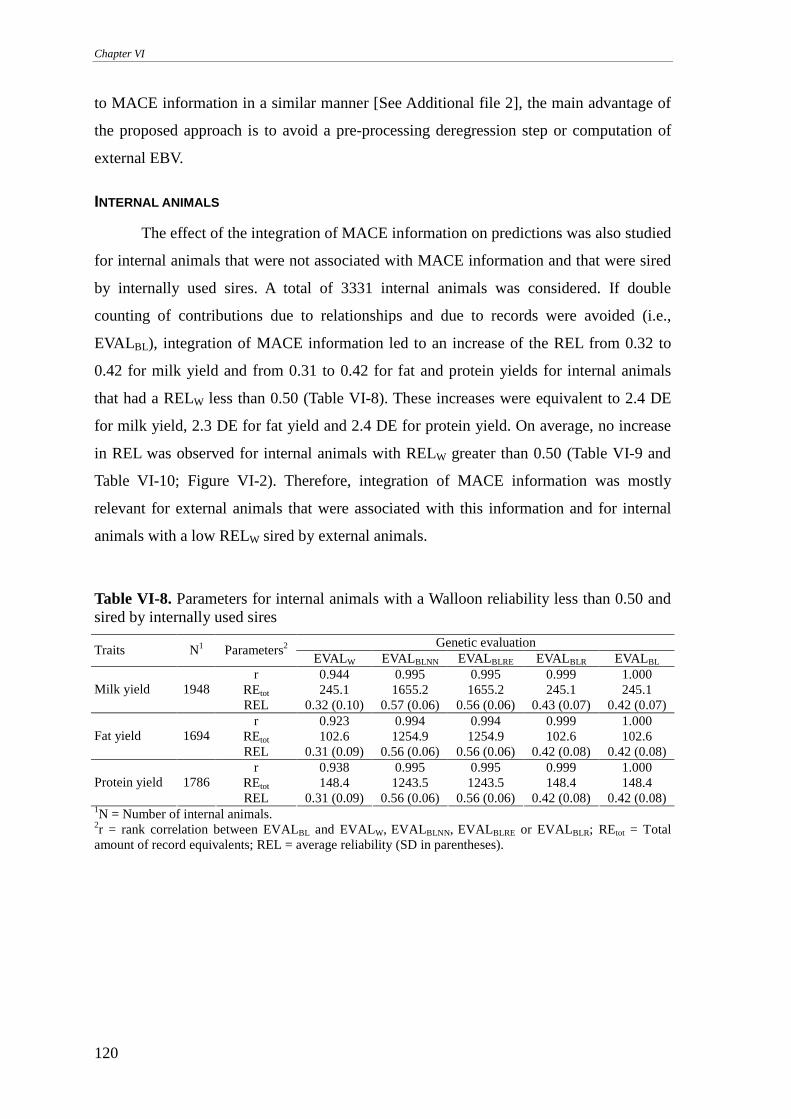
Chapter VI
120
to MACE information in a similar manner [See Additional file 2], the main advantage of
the proposed approach is to avoid a pre-processing deregression step or computation of
external EBV.
INTERNAL ANIMALS
The effect of the integration of MACE information on predictions was also studied
for internal animals that were not associated with MACE information and that were sired
by internally used sires. A total of 3331 internal animals was considered. If double
counting of contributions due to relationships and due to records were avoided (i.e.,
EVALBL), integration of MACE information led to an increase of the REL from 0.32 to
0.42 for milk yield and from 0.31 to 0.42 for fat and protein yields for internal animals
that had a RELW less than 0.50 (Table VI-8). These increases were equivalent to 2.4 DE
for milk yield, 2.3 DE for fat yield and 2.4 DE for protein yield. On average, no increase
in REL was observed for internal animals with RELW greater than 0.50 (Table VI-9 and
Table VI-10; Figure VI-2). Therefore, integration of MACE information was mostly
relevant for external animals that were associated with this information and for internal
animals with a low RELW sired by external animals.
Table VI-8. Parameters for internal animals with a Walloon reliability less than 0.50 and sired by internally used sires
Genetic evaluation Traits N1 Parameters2
EVALW EVALBLNN EVALBLRE EVALBLR EVALBL r 0.944 0.995 0.995 0.999 1.000
REtot 245.1 1655.2 1655.2 245.1 245.1 Milk yield 1948 REL 0.32 (0.10) 0.57 (0.06) 0.56 (0.06) 0.43 (0.07) 0.42 (0.07)
r 0.923 0.994 0.994 0.999 1.000 REtot 102.6 1254.9 1254.9 102.6 102.6 Fat yield 1694 REL 0.31 (0.09) 0.56 (0.06) 0.56 (0.06) 0.42 (0.08) 0.42 (0.08)
r 0.938 0.995 0.995 0.999 1.000 REtot 148.4 1243.5 1243.5 148.4 148.4 Protein yield 1786 REL 0.31 (0.09) 0.56 (0.06) 0.56 (0.06) 0.42 (0.08) 0.42 (0.08)
1N = Number of internal animals. 2r = rank correlation between EVALBL and EVALW, EVALBLNN, EVALBLRE or EVALBLR; REtot = Total amount of record equivalents; REL = average reliability (SD in parentheses).
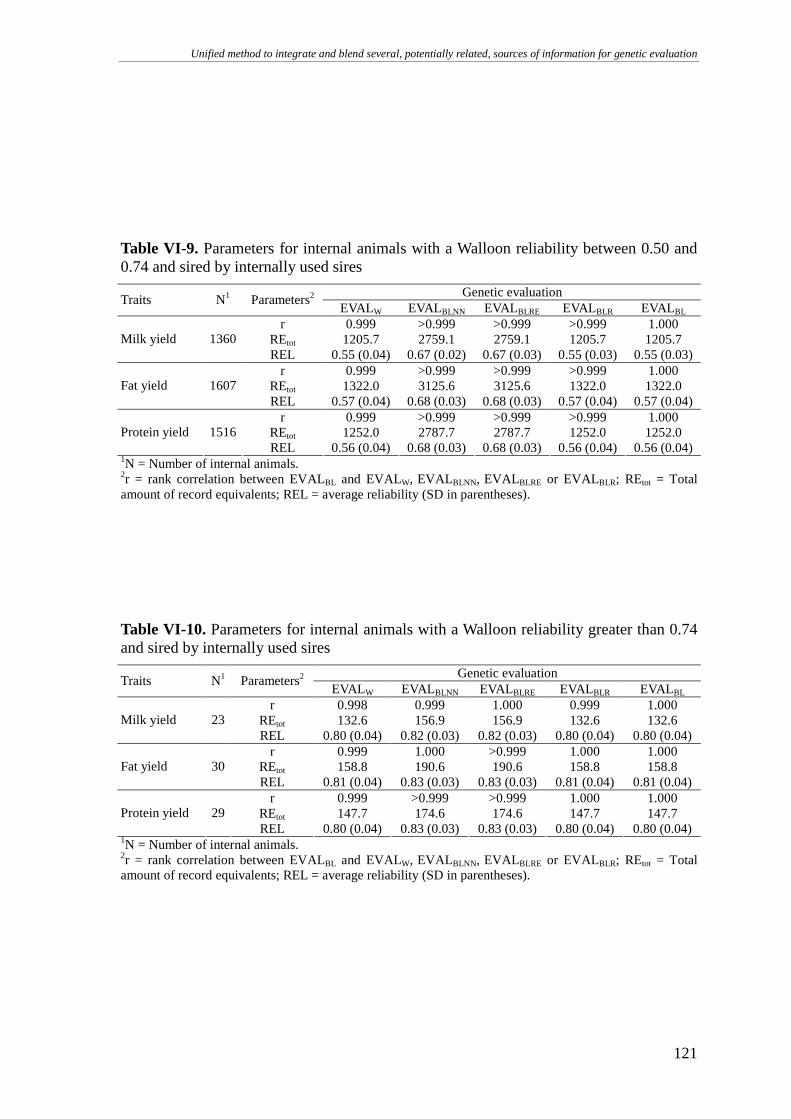
Unified method to integrate and blend several, potentially related, sources of information for genetic evaluation
121
Table VI-9. Parameters for internal animals with a Walloon reliability between 0.50 and 0.74 and sired by internally used sires
Genetic evaluation Traits N1 Parameters2
EVALW EVALBLNN EVALBLRE EVALBLR EVALBL r 0.999 >0.999 >0.999 >0.999 1.000
REtot 1205.7 2759.1 2759.1 1205.7 1205.7 Milk yield 1360 REL 0.55 (0.04) 0.67 (0.02) 0.67 (0.03) 0.55 (0.03) 0.55 (0.03)
r 0.999 >0.999 >0.999 >0.999 1.000 REtot 1322.0 3125.6 3125.6 1322.0 1322.0 Fat yield 1607 REL 0.57 (0.04) 0.68 (0.03) 0.68 (0.03) 0.57 (0.04) 0.57 (0.04)
r 0.999 >0.999 >0.999 >0.999 1.000 REtot 1252.0 2787.7 2787.7 1252.0 1252.0 Protein yield 1516 REL 0.56 (0.04) 0.68 (0.03) 0.68 (0.03) 0.56 (0.04) 0.56 (0.04)
1N = Number of internal animals. 2r = rank correlation between EVALBL and EVALW, EVALBLNN, EVALBLRE or EVALBLR; REtot = Total amount of record equivalents; REL = average reliability (SD in parentheses).
Table VI-10. Parameters for internal animals with a Walloon reliability greater than 0.74 and sired by internally used sires
Genetic evaluation Traits N1 Parameters2
EVALW EVALBLNN EVALBLRE EVALBLR EVALBL r 0.998 0.999 1.000 0.999 1.000
REtot 132.6 156.9 156.9 132.6 132.6 Milk yield 23 REL 0.80 (0.04) 0.82 (0.03) 0.82 (0.03) 0.80 (0.04) 0.80 (0.04)
r 0.999 1.000 >0.999 1.000 1.000 REtot 158.8 190.6 190.6 158.8 158.8 Fat yield 30 REL 0.81 (0.04) 0.83 (0.03) 0.83 (0.03) 0.81 (0.04) 0.81 (0.04)
r 0.999 >0.999 >0.999 1.000 1.000 REtot 147.7 174.6 174.6 147.7 147.7 Protein yield 29 REL 0.80 (0.04) 0.83 (0.03) 0.83 (0.03) 0.80 (0.04) 0.80 (0.04)
1N = Number of internal animals. 2r = rank correlation between EVALBL and EVALW, EVALBLNN, EVALBLRE or EVALBLR; REtot = Total amount of record equivalents; REL = average reliability (SD in parentheses).
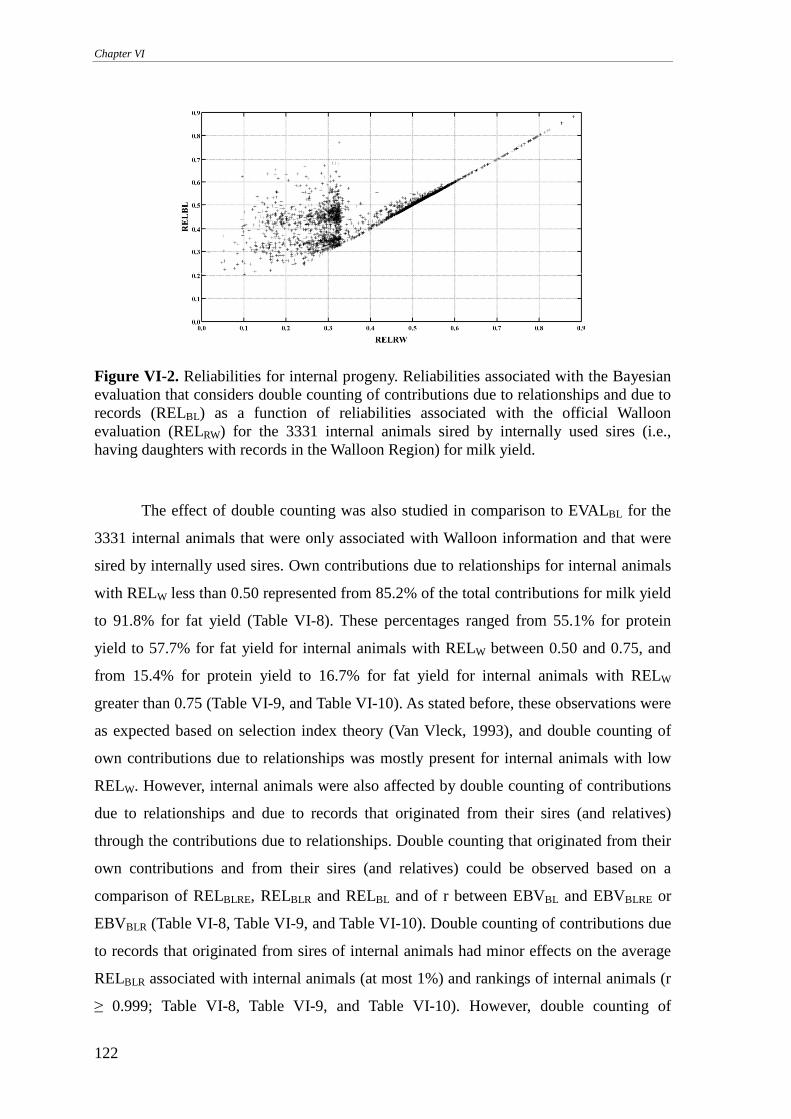
Chapter VI
122
Figure VI-2. Reliabilities for internal progeny. Reliabilities associated with the Bayesian evaluation that considers double counting of contributions due to relationships and due to records (RELBL) as a function of reliabilities associated with the official Walloon evaluation (RELRW) for the 3331 internal animals sired by internally used sires (i.e., having daughters with records in the Walloon Region) for milk yield.
The effect of double counting was also studied in comparison to EVALBL for the
3331 internal animals that were only associated with Walloon information and that were
sired by internally used sires. Own contributions due to relationships for internal animals
with RELW less than 0.50 represented from 85.2% of the total contributions for milk yield
to 91.8% for fat yield (Table VI-8). These percentages ranged from 55.1% for protein
yield to 57.7% for fat yield for internal animals with RELW between 0.50 and 0.75, and
from 15.4% for protein yield to 16.7% for fat yield for internal animals with RELW
greater than 0.75 (Table VI-9, and Table VI-10). As stated before, these observations were
as expected based on selection index theory (Van Vleck, 1993), and double counting of
own contributions due to relationships was mostly present for internal animals with low
RELW. However, internal animals were also affected by double counting of contributions
due to relationships and due to records that originated from their sires (and relatives)
through the contributions due to relationships. Double counting that originated from their
own contributions and from their sires (and relatives) could be observed based on a
comparison of RELBLRE, RELBLR and RELBL and of r between EBVBL and EBVBLRE or
EBVBLR (Table VI-8, Table VI-9, and Table VI-10). Double counting of contributions due
to records that originated from sires of internal animals had minor effects on the average
RELBLR associated with internal animals (at most 1%) and rankings of internal animals (r
≥ 0.999; Table VI-8, Table VI-9, and Table VI-10). However, double counting of
Unified method to integrate and blend several, potentially related, sources of information for genetic evaluation
123
contributions due to relationships led to an increase of average REL by at least 0.14 points
for internal animals with RELW less than 0.50 and by at least 0.11 points for internal
animals with RELW ranging from 0.50 to 0.74. The increase of average REL was lower
for internal animals with RELW greater than 0.75 (>0.02 points; Table VI-8, Table VI-9,
and Table VI-10). Although the average RELBLR and RELBLRE were (slightly)
overestimated for both evaluations, double counting of contributions due to records and
due to relationships had little effect on the ranking of internal animals compared to the
ranking of EVALBL, regardless of the group of internal animals or trait considered.
Indeed, rank correlations between EVALBL and EVALBLR or EVALBLRE were greater than
0.99 (Table VI-8, Table VI-9, and Table VI-10). All these results show that double
counting of contributions due to relationships and due to records can be ignored for the
prediction of EBV for internal animals that are sired by external animals. However, all
double counting must be taken into account to estimate REL accurately.
ON THE IMPLEMENTATION
Considering all groups of animals, i.e., internally used and unused sires, as well as
internal animals sired by internally used sires, our results for the Walloon example
suggest that contributions due to relationships can be ignored. Indeed, the different rank
correlations for EVALBLRE (i.e., the Bayesian evaluation that took only double counting of
contributions due to records into account) were similar to the rank correlations of
EVALBL. Furthermore, in practice, the TSA could be difficult to apply if a high number of
animals is associated with external information because it requires the inversion of a,
potentially, dense matrix for each iteration. However, effects of double counting of
contributions due to relationships should be tested before ignoring it. For example,
overestimation of REL could occur especially for traits for which contributions due to
relationships would be at least as significant as contributions due to records (e.g., if the
phenotypes are expensive to obtain). Furthermore, REL associated with the modified
MME were estimated based on the inverted LHS. Although this was feasible for the
simulated and Walloon data, this may not be feasible in most cases, and approaches that
estimate REL (e.g., Misztal and Wiggans, 1988; VanRaden and Wiggans, 1991) could be
modified to take into account RE (or DE) associated with external information.
The Walloon example was considered as an evaluation that blends MACE and
Walloon (internal) information in the context of official Walloon genetic evaluations for
Holstein cattle. However, the Walloon example can also be considered as a particular case
Chapter VI
124
of an internal evaluation that has no internal data and blends only sources of external
information, i.e., MACE and Walloon information, that are partially based on the same
information, i.e., the Walloon information. This case can be extended to more general
cases for which internal data may exist and external animals are associated with at least
two sources of information (e.g., E1 and E2) that are partially based on the same external
records or information. Double counting of external information that is shared by the
sources of external information, e.g., E1 and E2, can be avoided by the proposed approach
thanks to the knowledge and availability of EBV and associated REL that are based only
on external information that is shared by the sources of external information.
Nevertheless, although taking external information that is shared by different sources of
external information into consideration seems to be possible with the proposed approach,
this may be difficult in practice because it requires that EBV and associated REL based on
shared external information are known and available.
CONCLUSIONS
The proposed unified method integrated and blended several sources of
information into an internal genetic evaluation in an appropriate manner. The results also
showed that the proposed method was able to avoid double counting of contributions due
to records and due to relationships. Furthermore, because all available external sources of
information were correctly propagated, relatives of external animals benefited from
integrated information and, therefore, received more reliable EBV. The unified method
could also be used in the context of single-step genomic evaluations to integrate external
information to indirectly recover a large amount of external phenotypic information
(Colinet et al., 2013). While the simulated and Walloon examples were univariate, the
unified method was developed for multi-trait models that, e.g., allow evaluation of only
internally available traits (e.g., methane emissions, fine milk composition traits, such as
fatty acids, milk proteins and other minor components), using additional external
information from correlated traits (e.g., traits evaluated by Interbull).
ADDITIONAL FILES
Additional file 1: Integration of two sources of external information into a
genetic evaluation. This file describes a derivation that integrates two sources of external
information into a genetic evaluation, based on a Bayesian view of the mixed models
(Sorensen and Gianola, 2002) and similar to the Bayesian derivation of Legarra et al.
Unified method to integrate and blend several, potentially related, sources of information for genetic evaluation
125
(2007) that integrates one source of external information into a genetic evaluation.
Additional file 2: Double counting between internal and external information.
This file describes the development to avoid double counting of contributions due to
records between internal and external information.
COMPETING INTERESTS
The authors declare that they have no competing interests.
AUTHORS’ CONTRIBUTIONS
JV developed the algorithms and the equations, conceived the experimental
design, ran the tests and wrote the first draft. FC prepared data for the Walloon example.
NG initiated and directed the research. All authors participated in writing the manuscript.
All authors read and approved the final manuscript.
ACKNOWLEDGMENTS
J Vandenplas, as a research fellow, and N Gengler, as a former senior research
associate, acknowledge the support of the National Fund for Scientific Research
(Brussels, Belgium) for these positions. Additional financial support was provided by the
Ministry of Agriculture of the Walloon region of Belgium (Service Public de Wallonie,
Direction générale opérationnelle “Agriculture, Ressources Naturelles et Environnement”
– DGARNE) through research projects D31-1207, D31-1224/S1, and D31-1274, D31-
1304 and D31-1308. Financial support for scientific visits was also provided by Wallonie
Brussels International. J Vandenplas acknowledges I Misztal for hosting him at the
Animal and Dairy Sciences Department of University of Georgia, G Gorjanc for hosting
him at the Animal Science Department of University of Ljubljana, P Faux for helpful
discussions and editing help, S Tsuruta and I Aguilar for their help concerning the
BLUPF90 programs. Computational resources have been provided by the Consortium des
Équipements de Calcul Intensif (CÉCI), funded by the National Fund for Scientific
Research (Brussels, Belgium) under Grant No. 2.5020.11. The authors thank the two
anonymous reviewers for the useful comments.
REFERENCES
Aguilar, I., I. Misztal, D.L. Johnson, A. Legarra, S. Tsuruta, and T.J. Lawlor. 2010. Hot
topic: A unified approach to utilize phenotypic, full pedigree, and genomic
Chapter VI
126
information for genetic evaluation of Holstein final score. J. Dairy Sci. 93:743–
752.
Auvray, B., and N. Gengler. 2002. Feasibility of a Walloon test-day model and study of its
potential as tool for selection and management. Interbull Bull. 29:123–127.
Bonaiti, B., and D. Boichard. 1995. Accounting for foreign information in genetic
evaluation. Interbull Bull. 11:4pp.
Christensen, O.F., and M.S. Lund. 2010. Genomic prediction when some animals are not
genotyped. Genet. Sel. Evol. 42:2.
Colinet, F.G., J. Vandenplas, P. Faux, S. Vanderick, R. Renaville, C. Bertozzi, X. Hubin,
and N. Gengler. 2013. Walloon single-step genomic evaluation system integrating
local and MACE EBV. Interbull Bull. 47:203–210.
Croquet, C., P. Mayeres, A. Gillon, S. Vanderick, and N. Gengler. 2006. Inbreeding
depression for global and partial economic indexes, production, type, and
functional traits. J. Dairy Sci. 89:2257–2267.
Eaton, J.W., D. Bateman, S. Hauberg, and R. Wehbring. 2011. GNU Octave. A high-level
interactive language for numerical computations. 3rd ed. Free Software
Foundation, Inc., Boston, MA.
Gengler, N., and S. Vanderick. 2008. Bayesian inclusion of external evaluations into a
national evaluation system: Application to milk production traits. Interbull Bull.
38:70–74.
Gianola, D., and R.L. Fernando. 1986. Bayesian methods in animal breeding theory. J.
Anim. Sci. 63:217–244.
Henderson, C.R. 1984. Applications of linear models in animal breeding. 2nd ed.
University of Guelph, Guelph, ON, Canada.
Interbull. 2013. Interbull routine genetic evaluation for dairy production traits. April 2013.
Accessed Apr. 19, 2013. http://www.interbull.org/web/static/
mace_evaluations_archive/eval/prod-apr13.html.
Legarra, A., J.K. Bertrand, T. Strabel, R.L. Sapp, J.P. Sanchez, and I. Misztal. 2007.
Multi-breed genetic evaluation in a Gelbvieh population. J. Anim. Breed. Genet.
124:286–295.
Mäntysaari, E.A., and I. Strandén. 2010. Use of bivariate EBV-DGV model to combine
genomic and conventional breeding value evaluations. CD–ROM Comm. 353 in
Proceedings of the 9th World Congress on Genetics Applied to Livestock
Production, Leipzig, Germany.
Unified method to integrate and blend several, potentially related, sources of information for genetic evaluation
127
Misztal, I. 2013. BLUPF90 family of programs. Accessed Jul. 3, 2012.
http://nce.ads.uga.edu/wiki/doku.php.
Misztal, I., and G.R. Wiggans. 1988. Approximation of prediction error variance in large-
scale animal models. J. Dairy Sci. 71(Suppl. 2):27–32.
Přibyl, J., P. Madsen, J. Bauer, J. Přibylová, M. Šimečková, L. Vostrý, and L. Zavadilová.
2013. Contribution of domestic production records, Interbull estimated breeding
values, and single nucleotide polymorphism genetic markers to the single-step
genomic evaluation of milk production. J. Dairy Sci. 96:1865–1873.
Quaas, R.L., and Z. Zhang. 2006. Multiple-breed genetic evaluation in the US beef cattle
context: Methodology. CD–ROM Comm. 24–12 in Proceedings of the 8th World
Congress on Genetics Applied to Livestock Production, Belo Horizonte, Brazil.
Quaas, R.L., and Z.W. Zhang. 2001. Incorporating external information in multibreed
genetic evaluation. J. Anim. Sci. 79(Suppl. 1):342. (Abstr.).
Sorensen, D., and D. Gianola. 2002. Likelihood, Bayesian and MCMC methods in
quantitative genetics. Springer-Verlag, New York, NY.
Täubert, H., H. Simianer, and K. Karras. 2000. Blending Interbull breeding values into
national evaluations A new approach. Interbull Bull. 25:53–56.
Vandenplas, J., and N. Gengler. 2012. Comparison and improvements of different
Bayesian procedures to integrate external information into genetic evaluations. J.
Dairy Sci. 95:1513–1526.
VanRaden, P.M. 2001. Methods to combine estimated breeding values obtained from
separate sources. J. Dairy Sci. 84(E. Suppl.):E47–E55.
VanRaden, P.M. 2012. Avoiding bias from genomic pre-selection in converting daughter
information across countries. Interbull Bull. 45:29–33.
VanRaden, P.M., and M.E. Tooker. 2012. Methods to include foreign information in
national evaluations. J. Dairy Sci. 95:446.
VanRaden, P.M., and G.R. Wiggans. 1991. Derivation, calculation, and use of national
animal model information. J. Dairy Sci. 74:2737–2746.
Van Vleck, L.D. 1993. Selection Index and introduction to mixed model methods. CRC
Press. Boca Raton, Fl.
Van Vleck, L.D. 1994. Algorithms for simulation of animal models with multiple traits
and with maternal and non-additive genetic effects. Braz. J. Genet. 17:53–57.
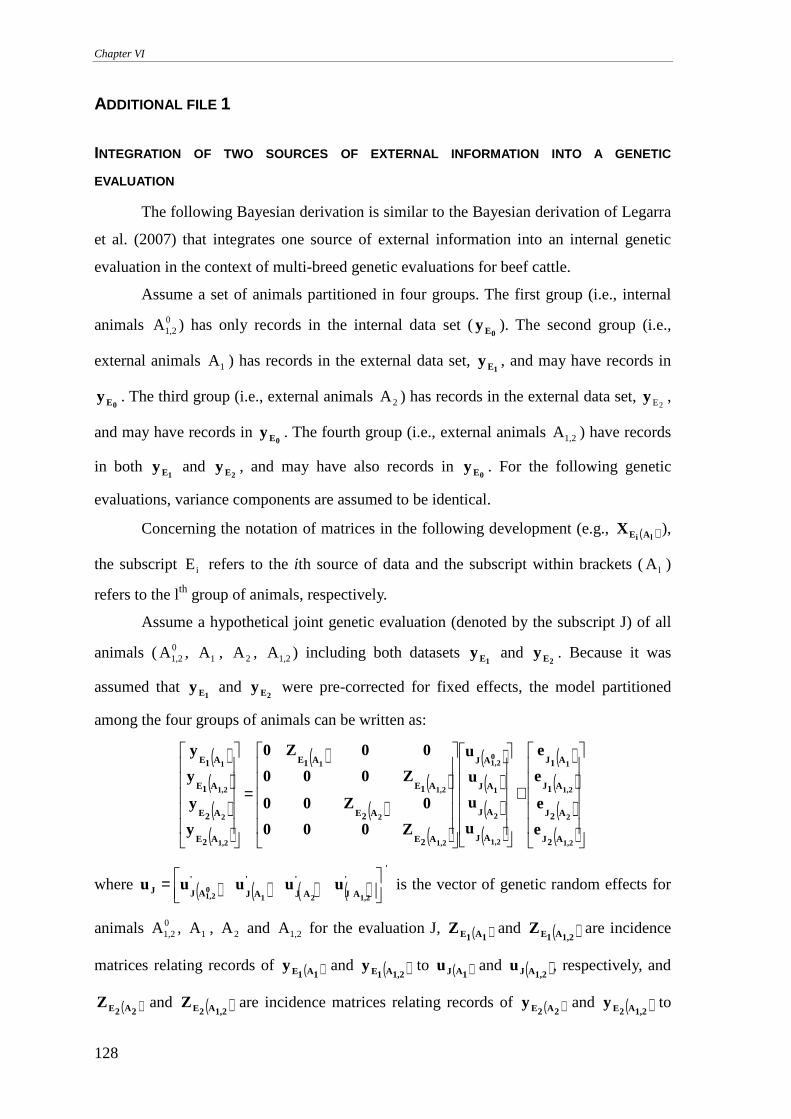
Chapter VI
128
ADDITIONAL FILE 1
INTEGRATION OF TWO SOURCES OF EXTERNAL INFORMATION INTO A GE NETIC
EVALUATION
The following Bayesian derivation is similar to the Bayesian derivation of Legarra
et al. (2007) that integrates one source of external information into an internal genetic
evaluation in the context of multi-breed genetic evaluations for beef cattle.
Assume a set of animals partitioned in four groups. The first group (i.e., internal
animals 01,2A ) has only records in the internal data set (
0Ey ). The second group (i.e.,
external animals 1A ) has records in the external data set, 1Ey , and may have records in
0Ey . The third group (i.e., external animals 2A ) has records in the external data set, 2Ey ,
and may have records in 0Ey . The fourth group (i.e., external animals 1,2A ) have records
in both 1Ey and
2Ey , and may have also records in 0Ey . For the following genetic
evaluations, variance components are assumed to be identical.
Concerning the notation of matrices in the following development (e.g., ( )li AEX ),
the subscript iE refers to the ith source of data and the subscript within brackets ( lA )
refers to the lth group of animals, respectively.
Assume a hypothetical joint genetic evaluation (denoted by the subscript J) of all
animals ( 01,2A , 1A , 2A , 1,2A ) including both datasets
1Ey and 2Ey . Because it was
assumed that 1Ey and
2Ey were pre-corrected for fixed effects, the model partitioned
among the four groups of animals can be written as:
( )( )( )
( )
( )( )
( )( )
( )( )( )
( )
( )( )( )
( )
+
=
1,2
2
1,2
1
1,2
2
1
01,2
1,2
2
1,2
1
1,2
2
1,2
1
A2J
A2J
A1J
A1J
AJ
AJ
AJ
AJ
A2E
A2E
A1E
A1E
A2E
A2E
A1E
A1E
e
e
e
e
u
u
u
u
Z000
0Z00
Z000
00Z0
y
y
y
y
where ( ) ( ) ( ) ( )'
'
AJ
'
AJ
'
AJ
'
AJJ1,221
01,2
uuuuu
= is the vector of genetic random effects for
animals 01,2A , 1A , 2A and 1,2A for the evaluation J, ( )1A1EZ and ( )1,2A1EZ are incidence
matrices relating records of ( )1A1Ey and ( )1,2A1Ey to ( )1AJu and ( )1,2AJu , respectively, and
( )2A2EZ and ( )1,2A2EZ are incidence matrices relating records of ( )2A2Ey and ( )1,2A2Ey to
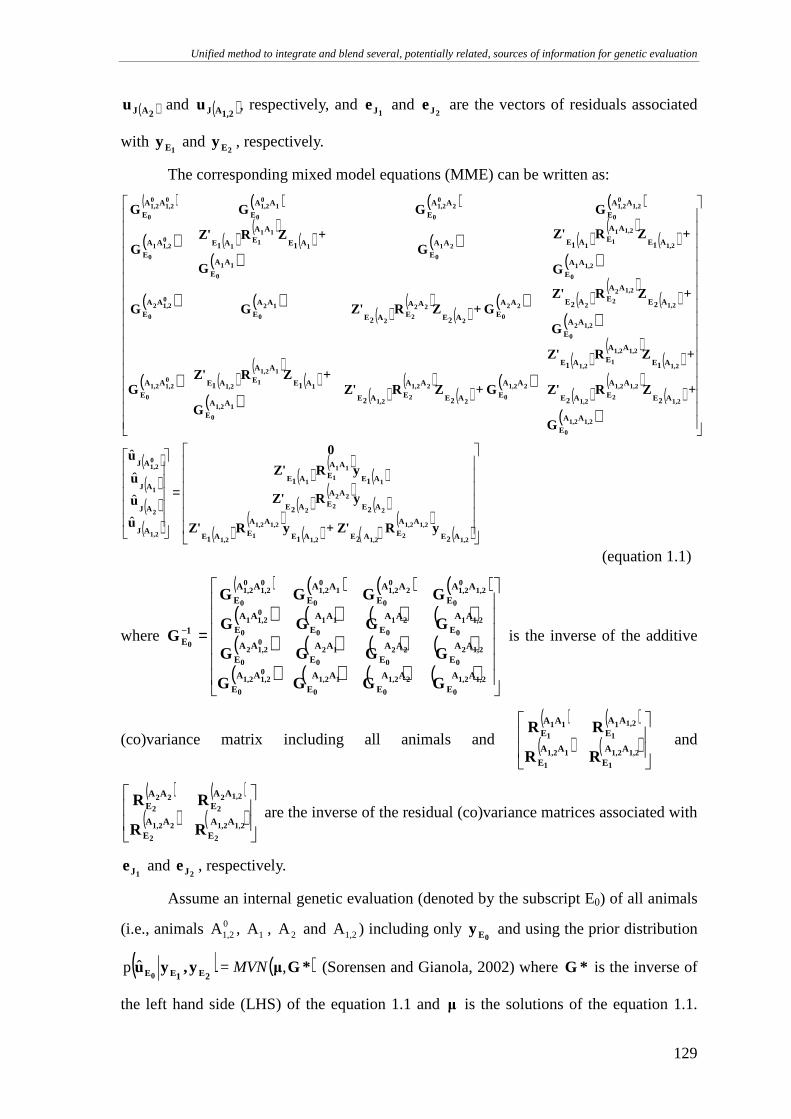
Unified method to integrate and blend several, potentially related, sources of information for genetic evaluation
129
( )2AJu and ( )1,2AJu , respectively, and 1Je and
2Je are the vectors of residuals associated
with 1Ey and
2Ey , respectively.
The corresponding mixed model equations (MME) can be written as:
( ) ( ) ( ) ( )
( ) ( )( )
( )( )
( ) ( )( )
( )( )
( ) ( )( )
( )( )
( ) ( )( )
( )( )
( ) ( )( )
( )( ) ( )
( )( )
( )( )
( )( )
( )( )
( )( )
( )( )( )
( )
( )( )
( )
( )( )
( )
( )( )
( ) ( )( )
( )
=
1,2
1,21,2
21,21,2
1,21,2
11,2
2
22
22
1
111
1
1,2
2
1
01,2
1,21,2
0
1,2
1,21,2
21,2
1,2
1,21,2
11,2
21,2
02
21,2
21,2
11,2
0
1
11,2
11,2
01,21,2
0
1,22
0
1,2
1,222
222
02
22
22
12
0
01,22
0
1,21
0
1,2
1,21
1121
011
0
1
11
11
01,21
0
1,201,2
0
201,2
0
101,2
0
01,2
01,2
0
A2E
AA
EA2EA1E
AA
EA1E
A2E
AAEA2E
A1E
AAEA1E
AJ
AJ
AJ
AJ
AA
E
A2E
AA
EA2E
A1E
AA
EA1E
AA
EA2E
AA
EA2EAA
E
A1E
AA
EA1EAA
E
AA
E
A2E
AAEA2EAA
EA2E
AAEA2E
AA
E
AA
E
AA
E
A1E
AAEA1EAA
EAA
E
A1E
AAEA1EAA
E
AA
E
AA
E
AA
E
AA
E
yRZ'+yRZ'
yRZ'
yRZ'
0
u
u
u
u
G
+ZRZ'
+ZRZ'
G+ZRZ'
G
+ZRZ'G
G
+ZRZ'G+ZRZ'GG
G
+ZRZ'G
G
+ZRZ'G
GGGG
ˆ
ˆ
ˆ
ˆ
(equation 1.1)
where
( ) ( ) ( ) ( )( ) ( ) ( ) ( )( ) ( ) ( ) ( )( ) ( ) ( ) ( )
=−
1,21,2
0
21,2
0
11,2
0
01,21,2
0
1,22
0
22
0
12
0
01,22
0
1,21
0
21
0
11
0
01,21
0
1,201,2
0
201,2
0
101,2
0
01,2
01,2
0
0
AA
E
AA
E
AA
E
AA
E
AA
E
AA
E
AA
E
AA
E
AA
E
AA
E
AA
E
AA
E
AA
E
AA
E
AA
E
AA
E
1E
GGGG
GGGG
GGGG
GGGG
G is the inverse of the additive
(co)variance matrix including all animals and ( ) ( )
( ) ( )
1,21,2
1
11,2
1
1,211
111
AA
E
AA
E
AAE
AAE
RR
RR and
( ) ( )( ) ( )
1,21,2
2
21,2
2
1,222
222
AA
E
AA
E
AAE
AAE
RR
RR are the inverse of the residual (co)variance matrices associated with
1Je and 2Je , respectively.
Assume an internal genetic evaluation (denoted by the subscript E0) of all animals
(i.e., animals 01,2A , 1A , 2A and 1,2A ) including only
0Ey and using the prior distribution
( ) ( )*Gµy,yu2E1EE0
,=ˆp MVN (Sorensen and Gianola, 2002) where *G is the inverse of
the left hand side (LHS) of the equation 1.1 and µ is the solutions of the equation 1.1.
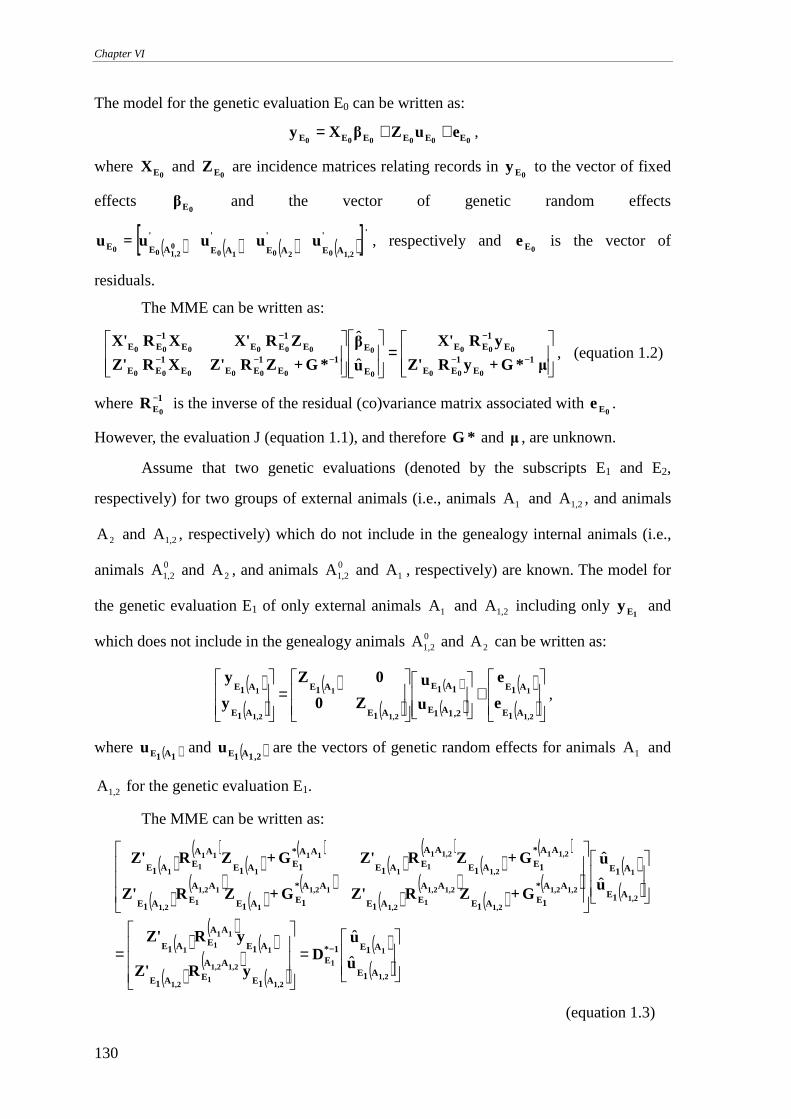
Chapter VI
130
The model for the genetic evaluation E0 can be written as:
000000 EEEEEE euZβXy ++= ,
where 0EX and
0EZ are incidence matrices relating records in 0Ey to the vector of fixed
effects 0Eβ and the vector of genetic random effects
( ) ( ) ( ) ( )[ ]' '
AE
'
AE
'
AE
'
AEE1,202010
01,200
uuuu=u , respectively and 0Ee is the vector of
residuals.
The MME can be written as:
=
−−
−
−−−
−−
µ*G+yRZ'
yRX'
u
β
*G+ZRZ'XRZ'
ZRX'XRX'1
E1
EE
E1
EE
E
E1
E1
EEE1
EE
E1
EEE1
EE
000
000
0
0
000000
000000
ˆ
ˆ, (equation 1.2)
where 1E0
R − is the inverse of the residual (co)variance matrix associated with 0Ee .
However, the evaluation J (equation 1.1), and therefore *G and µ , are unknown.
Assume that two genetic evaluations (denoted by the subscripts E1 and E2,
respectively) for two groups of external animals (i.e., animals 1A and 1,2A , and animals
2A and 1,2A , respectively) which do not include in the genealogy internal animals (i.e.,
animals 01,2A and 2A , and animals 0
1,2A and 1A , respectively) are known. The model for
the genetic evaluation E1 of only external animals 1A and 1,2A including only 1Ey and
which does not include in the genealogy animals 01,2A and 2A can be written as:
( )( )
( )( )
( )
( )( )
( )
+
=
1,2
1
1,2
1
1,2
1
A1E
A1E
,21A1E
1A1E
A1E
A1E
A1E
A1E
e
e
u
u
Z0
0Z
y
y,
where ( )1A1Eu and ( ),21A1Eu are the vectors of genetic random effects for animals 1A and
1,2A for the genetic evaluation E1.
The MME can be written as:
( )( )
( )( )
( )( )
( )( )
( )( )
( )( )
( )( )
( )( )
( )( )
( )( )
( )
( )( )
( )
( )( )
=
=
−
1,2
1
1
1,2
1,21,2
11,2
1
111
1
1,2
1
1,21,2
1,2
1,21,2
11,2
11,2
1
11,2
11,2
1,21
1,2
1,21
11
11
1
111
1
A1E
A1E1*E
A1E
AA
EA1E
A1E
AAEA1E
A1E
A1E
AA*
1EA1E
AA
EA1E
AA*
1EA1E
AA
EA1E
AA*
1EA1E
AA
EA1E
AA*
1EA1E
AAEA1E
u
uD
yRZ'
yRZ'
u
u
G+ZRZ'G+ZRZ'
G+ZRZ'G+ZRZ'
ˆ
ˆ
ˆ
ˆ
(equation 1.3)
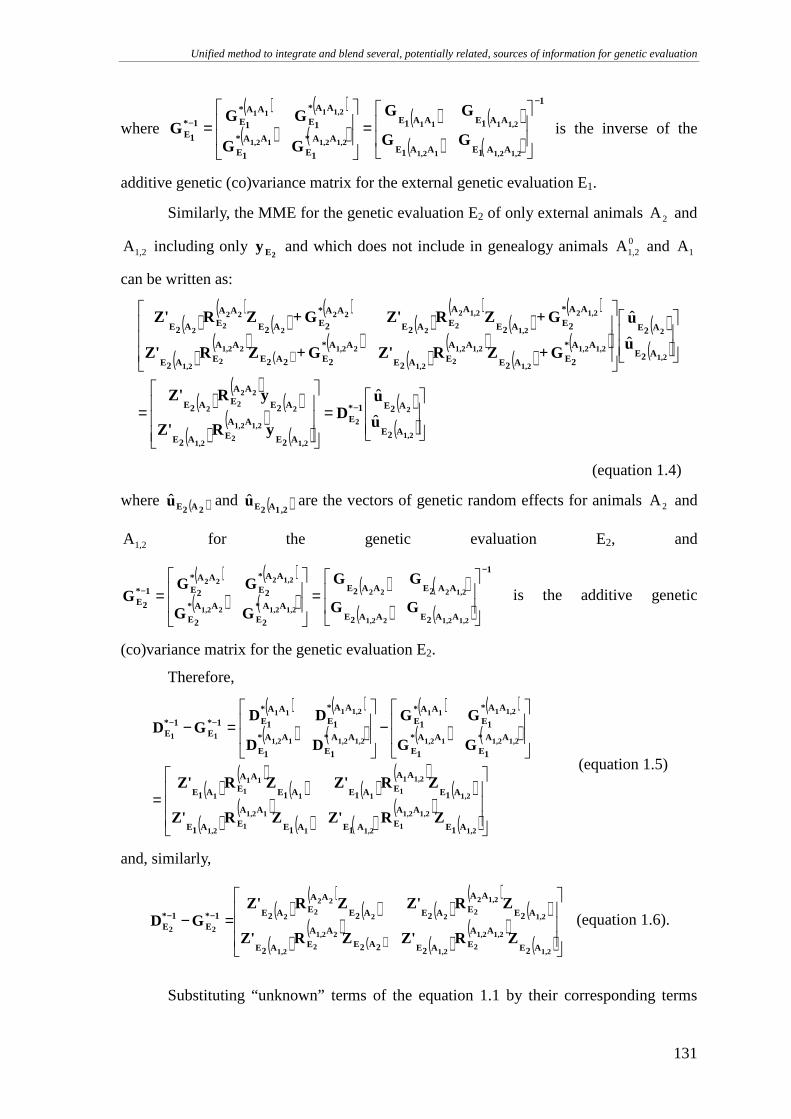
Unified method to integrate and blend several, potentially related, sources of information for genetic evaluation
131
where ( ) ( )
( ) ( )( ) ( )
( ) ( )
1
AA1EAA1E
AA1EAA1E
AA*
1E
AA*
1E
AA*
1EAA*
1E1*
1E
1,21,211,2
1,2111
1,21,211,2
1,2111
GG
GG
GG
GGG
−
−
=
= is the inverse of the
additive genetic (co)variance matrix for the external genetic evaluation E1.
Similarly, the MME for the genetic evaluation E2 of only external animals 2A and
1,2A including only 2Ey and which does not include in genealogy animals 0
1,2A and 1A
can be written as:
( )( )
( )( )
( )( )
( )( )
( )( )
( )( )
( )( )
( )( )
( )( )
( )( )
( )
( )( )
( )
( )( )
=
=
−
1,2
2
2
1,2
1,21,2
21,2
2
222
2
1,2
2
1,21,2
1,2
1,21,2
21,2
21,221,2
21,2
1,22
1,2
1,22
22
22
2
222
2
A2E
A2E1*E
A2E
AA
EA2E
A2E
AAEA2E
A2E
A2E
AA*
2EA2E
AA
EA2E
AA*
2E2A2E
AA
EA2E
AA*
2EA2E
AA
EA2E
AA*
2EA2E
AAEA2E
u
uD
yRZ'
yRZ'
u
u
G+ZRZ'G+ZRZ'
G+ZRZ'G+ZRZ'
ˆ
ˆ
ˆ
ˆ
(equation 1.4)
where ( )2A2Eu and ( ),21A2Eu are the vectors of genetic random effects for animals 2A and
1,2A for the genetic evaluation E2, and
( ) ( )( ) ( )
( ) ( )( ) ( )
1
AA2EAA2E
AA2EAA2E
AA*
2E
AA*
2E
AA*
2EAA*
2E1*
2E
1,21,221,2
1,2222
1,21,221,2
1,2222
GG
GG
GG
GGG
−
−
=
= is the additive genetic
(co)variance matrix for the genetic evaluation E2.
Therefore,
( ) ( )( ) ( )
( ) ( )( ) ( )
( )( )
( ) ( )( )
( )
( )( )
( ) ( )( )
( )
=
−
=− −−
1,2
1,21,2
11,21
11,2
11,2
1,2
1,21
111
111
1
1,21,211,2
1,2111
1,21,211,2
1,2111
11
A1E
AA
EA1EA1E
AA
EA1E
A1E
AA
EA1EA1E
AAEA1E
AA*
1E
AA*
1E
AA*
1EAA*
1E
AA*
1E
AA*
1E
AA*
1EAA*
1E1*E
1*E
ZRZ'ZRZ'
ZRZ'ZRZ'
GG
GG
DD
DDGD
(equation 1.5)
and, similarly,
( )( )
( ) ( )( )
( )
( )( )
( ) ( )( )
( )
=− −−
1,2
1,21,2
21,2
21,2
21,2
1,2
1,22
222
222
2
22
A2E
AA
EA2E2A2E
AA
EA2E
A2E
AA
EA2EA2E
AAEA2E1*
E1*
E
ZRZ'ZRZ'
ZRZ'ZRZ'GD (equation 1.6).
Substituting “unknown” terms of the equation 1.1 by their corresponding terms
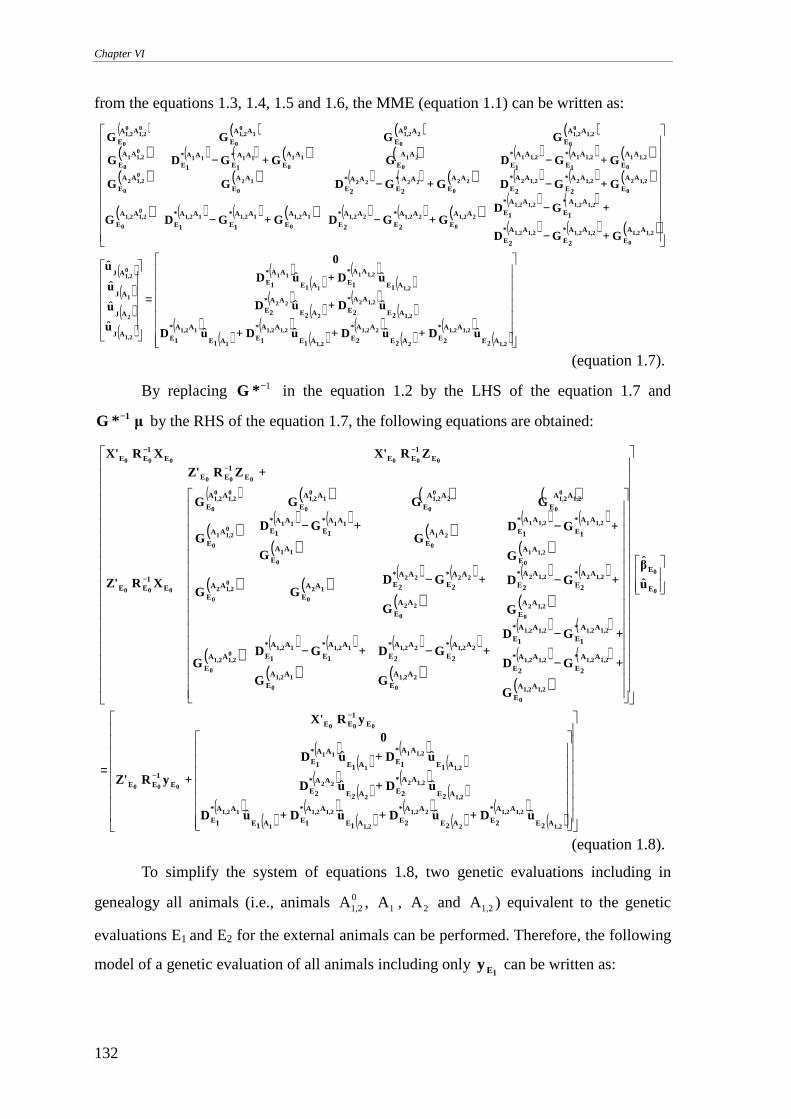
Chapter VI
132
from the equations 1.3, 1.4, 1.5 and 1.6, the MME (equation 1.1) can be written as:
( ) ( ) ( ) ( )( ) ( ) ( ) ( ) ( ) ( ) ( ) ( )( ) ( ) ( ) ( ) ( ) ( ) ( ) ( )
( ) ( ) ( ) ( ) ( ) ( ) ( )( ) ( )
( ) ( ) ( )
( )( )( )
( )
( )( )
( )( )
( )( )
( )( )
( )( )
( )( )
( )( )
( )( )
=
−
−−−
−−
−−
1,2
1,21,2
2
21,2
1,2
1,21,2
1
11,2
1,2
1,22
2
22
1,2
1,21
1
11
1,2
2
1
01,2
1,21,2
0
1,21,21,21,2
1,21,21,21,2
21,2
0
21,221,211,2
0
11,211,201,21,2
0
1,22
0
1,221,2222
0
222212
0
01,22
0
1,21
0
1,211,2121
0
11
0
111101,21
0
1,201,2
0
201,2
0
101,2
0
01,2
01,2
0
A2E
AA*
2EA2E
AA*
2EA1E
AA*
1EA1E
AA*
1E
A2E
AA*
2EA2E
AA*
2E
A1E
AA*
1EA1E
AA*
1E
AJ
AJ
AJ
AJ
AA
E
AA*
2E
AA*
2E
AA*
1E
AA*
1EAA
E
AA*
2E
AA*
2E
AA
E
AA*
1E
AA*
1E
AA
E
AA
E
AA*
2E
AA*
2E
AA
EAA*
2EAA*
2E
AA
E
AA
E
AA
E
AA*
1E
AA*
1E
AA
E
AA
EAA*
1EAA*
1E
AA
E
AA
E
AA
E
AA
E
AA
E
uD+uD+uD+uD
uD+uD
uD+uD
0
u
u
u
u
G+GD
+GDG+GDG+GDG
G+GDG+GDGG
G+GDGG+GDG
GGGG
ˆˆˆˆ
ˆˆ
ˆˆ
ˆ
ˆ
ˆ
ˆ
(equation 1.7).
By replacing 1−*G in the equation 1.2 by the LHS of the equation 1.7 and
µ*G 1− by the RHS of the equation 1.7, the following equations are obtained:
( ) ( ) ( ) ( )
( )( ) ( )
( )( )
( ) ( )
( )
( ) ( )( ) ( )
( )
( ) ( )
( )
( )( ) ( )
( )
( ) ( )
( )
( ) ( )
( ) ( )
( )
( )( )
( )( )
( )( )
( )( )
( )( )
( )( )
( )( )
( )( )
=
−
−−−
−−
−−
−
−
−
−
−−
1,2
1,21,2
2
21,2
1,2
1,21,2
1
11,2
1,2
1,22
2
22
1,2
1,21
1
11
000
000
0
0
1,21,2
0
1,21,21,21,2
1,21,21,21,2
21,2
0
21,221,2
11,2
0
11,211,201,21,2
0
1,22
0
1,221,22
22
0
2222
12
0
01,22
0
1,21
0
1,211,21
21
011
0
111101,21
0
1,201,2
0
201,2
0
101,2
0
01,2
01,2
0
000
000
000000
A2E
AA*
2EA2E
AA*
2EA1E
AA*
1EA1E
AA*
1E
A2E
AA*
2EA2E
AA*
2E
A1E
AA*
1EA1E
AA*
1E
E1
EE
E1
EE
E
E
AA
E
AA*
2E
AA*
2E
AA*
1E
AA*
1E
AA
E
AA*
2E
AA*
2E
AA
E
AA*
1E
AA*
1EAA
E
AA
E
AA*
2E
AA*
2E
AA
E
AA*
2EAA*
2EAA
E
AA
E
AA
E
AA*
1E
AA*
1EAA
EAA
E
AA*
1EAA*
1EAA
E
AA
E
AA
E
AA
E
AA
E
E1
EE
E1
EE
E1
EEE1
EE
uD+uD+uD+uD
uD+uD
uD+uD
0
+yRZ'
yRX'
u
β
G
+GD
+GD
G
+GD
G
+GDG
G
+GD
G
+GDGG
G
+GDG
G
+GDG
GGGG
+ZRZ'
XRZ'
ZRX'XRX'
ˆˆˆˆ
ˆˆ
ˆˆ
ˆ
ˆ
(equation 1.8).
To simplify the system of equations 1.8, two genetic evaluations including in
genealogy all animals (i.e., animals 01,2A , 1A , 2A and 1,2A ) equivalent to the genetic
evaluations E1 and E2 for the external animals can be performed. Therefore, the following
model of a genetic evaluation of all animals including only 1Ey can be written as:
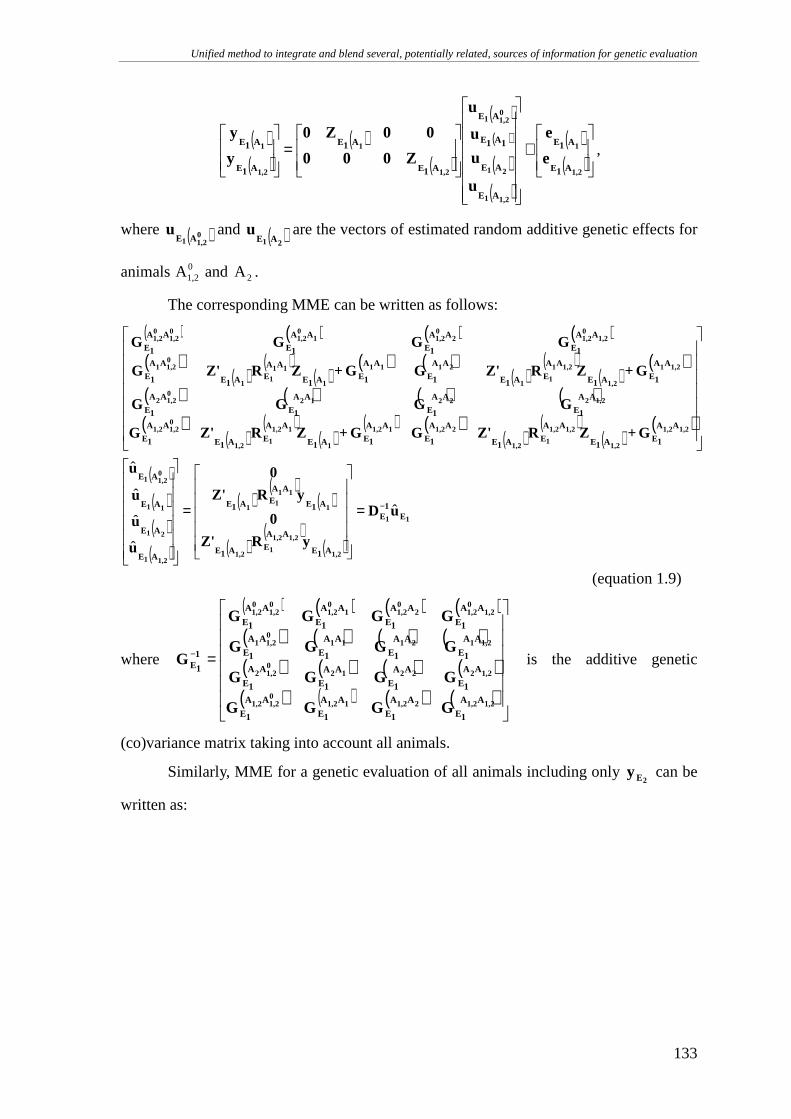
Unified method to integrate and blend several, potentially related, sources of information for genetic evaluation
133
( )( )
( )( )
( )( )
( )( )
( )( )
+
=
1,2
1
1,21
21
01,21
1,2
1
1,2
1
A1E
A1E
AE
AE
1A1E
AE
A1E
A1E
A1E
A1E
e
e
u
u
u
u
Z000
00Z0
y
y,
where ( )01,21 AE
u and ( )21 AEu are the vectors of estimated random additive genetic effects for
animals 01,2A and 2A .
The corresponding MME can be written as follows:
( ) ( ) ( ) ( )( )
( )( )
( )( ) ( )
( )( )
( )( )
( ) ( ) ( ) ( )( )
( )( )
( )( ) ( )
( )( )
( )( )
( )( )( )
( )
( )( )
( )
( )( )
( )
11
1,2
1,21,2
11,2
1
111
1
1,21
21
11
01,21
1,21,2
1,2
1,21,2
11,2
21,211,2
1
11,2
11,2
01,21,2
1,22221201,22
1,21
1,2
1,21
11
2111
1
111
1
01,21
1,201,22
01,21
01,2
01,2
01,2
E1
E
A1E
AA
EA1E
A1E
AAEA1E
AE
AE
AE
AE
AA
1EA1E
AA
EA1E
AA
1E
AA
1EA1E
AA
EA1E
AA
1E
AA
1E
AA
1E
AA
1E
AA
1E
AA
1EA1E
AA
EA1E
AA
1E
AA
1EA1E
AAEA1E
AA
1E
AA
1E
AA
1E
AA
1E
AA
1E
uD
yRZ'
0
yRZ'
0
u
u
u
u
G+ZRZ'GG+ZRZ'G
GGGG
G+ZRZ'GG+ZRZ'G
GGGG
ˆ
ˆ
ˆ
ˆ
ˆ
−=
=
(equation 1.9)
where
( ) ( ) ( ) ( )( ) ( ) ( ) ( )( ) ( ) ( ) ( )( ) ( ) ( ) ( )
=−
1,21,221,211,201,21,2
1,22221201,22
1,21211101,21
1,201,22
01,21
01,2
01,2
01,2
AA
1E
AA
1E
AA
1E
AA
1E
AA
1E
AA
1E
AA
1E
AA
1E
AA
1E
AA
1E
AA
1E
AA
1E
AA
1E
AA
1E
AA
1E
AA
1E
1
1E
GGGG
GGGG
GGGG
GGGG
G is the additive genetic
(co)variance matrix taking into account all animals.
Similarly, MME for a genetic evaluation of all animals including only 2Ey can be
written as:
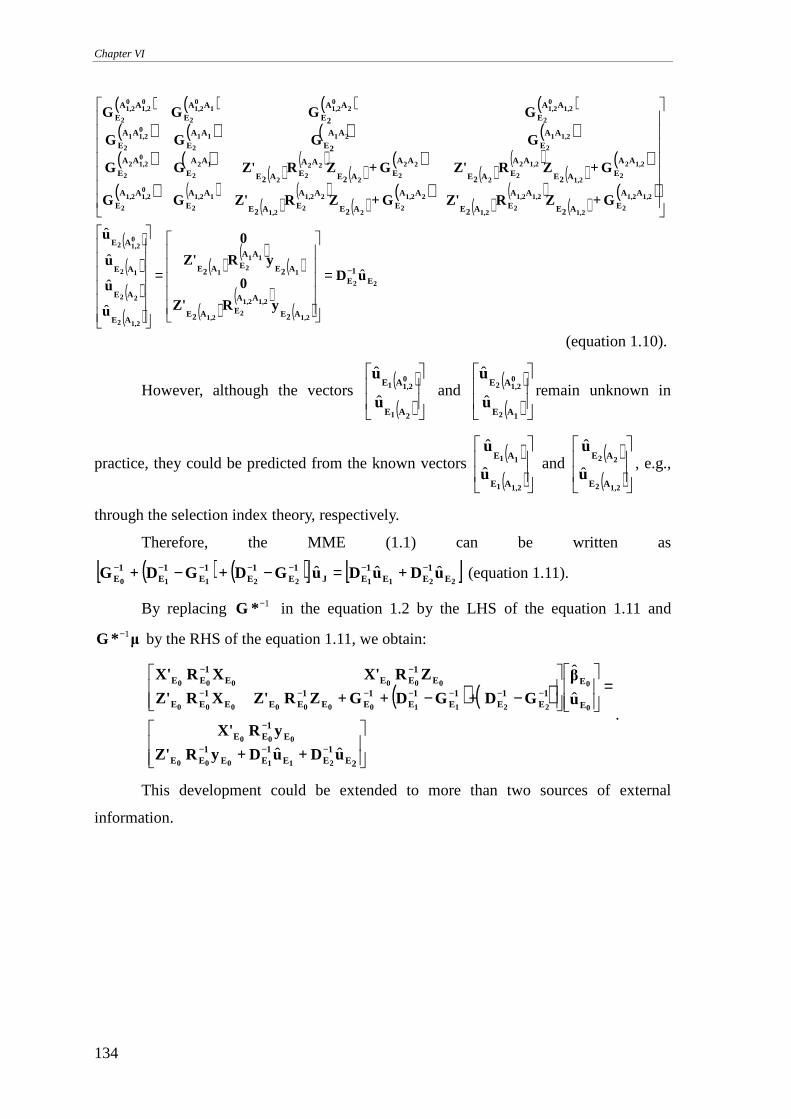
Chapter VI
134
( ) ( ) ( ) ( )( ) ( ) ( ) ( )( ) ( )
( )( )
( )( )
( )( )
( )( )
( ) ( )( )
( )( )
( )( )
( )( )
( )
( )( )( )
( )
( )( )
( )
( )( )
( )
22
1,2
1,21,2
21,2
1
112
1
1,22
22
12
01,22
1,21,2
21,2
1,21,2
21,2
21,2
22
21,2
21,2
11,2
2
01,21,2
2
1,22
21,2
1,22
22
22
22
222
2
12
2
01,22
2
1,21
2
2111
2
01,21
2
1,201,2
2
201,21
01,2
2
01,2
01,2
2
E1
E
A2E
AA
EA2E
A2E
AAEA2E
AE
AE
AE
AE
AA
EA2E
AA
EA2E
AA
EA2E
AA
EA2E
AA
E
AA
E
AA
EA2E
AA
EA2E
AA
EA2E
AAEA2E
AA
E
AA
E
AA
E
AA
2E
AA
E
AA
E
AA
E
AA
2E
AA
E
AA
E
uD
yRZ'
0
yRZ'
0
u
u
u
u
G+ZRZ'G+ZRZ'GG
G+ZRZ'G+ZRZ'GG
GGGG
GGGG
ˆ
ˆ
ˆ
ˆ
ˆ
−=
=
(equation 1.10).
However, although the vectors ( )( )
21
01,21
AE
AE
u
u
ˆ
ˆ and
( )( )
12
01,22
AE
AE
u
u
ˆ
ˆremain unknown in
practice, they could be predicted from the known vectors ( )
( )
1,21
11
AE
AE
u
u
ˆ
ˆ and
( )( )
1,22
22
AE
AE
u
u
ˆ
ˆ, e.g.,
through the selection index theory, respectively.
Therefore, the MME (1.1) can be written as
( ) ( )[ ] [ ]221122110 E
1EE
1EJ
1E
1E
1E
1E
1E uD+uDu GD+GD+G ˆˆˆ −−−−−−− =−− (equation 1.11).
By replacing 1−*G in the equation 1.2 by the LHS of the equation 1.11 and
µ*G 1− by the RHS of the equation 1.11, we obtain:
( ) ( )
=
−−
−−−
−
−−−−−−−
−−
2E1
EE1
EE1
EE
E1
EE
E
E1
E1
E1
E1
E1
EE1
EEE1
EE
E1
EEE1
EE
uD+uD+yRZ'
yRX'
u
β
GD+GD+G+ZRZ'XRZ'
ZRX'XRX'
211000
000
0
0
22110000000
000000
ˆˆ
ˆ
ˆ
.
This development could be extended to more than two sources of external
information.
Unified method to integrate and blend several, potentially related, sources of information for genetic evaluation
135
ADDITIONAL FILE 2
DOUBLE COUNTING BETWEEN INTERNAL AND EXTERNAL INFORMATION
Assume 0Eu and
000 E1
E1
E Λ+G=D −− (equation 2.1), the vector of known internal
EBV and the inverse of the associated prediction error (co)variance matrix obtained from
the genetic evaluation E0 based on the source E0 including only internal information
where 1E0
G − is the inverse of the additive (co)variance matrix for all internal and external
animals in the genetic evaluation E0 and 0EΛ is a block diagonal variance matrix. The
vector 1Eu and the matrix
111 E1
E1
E Λ+G=D −− (equation 2.2) are the vector of known
external EBV and the inverse of the associated prediction error (co)variance matrix
obtained from a genetic evaluation based on the source E1 including external and internal
information where 1E1
G − is the inverse of the additive (co)variance matrix for all internal
and external animals in the genetic evaluation E1. The vector 2Eu and the matrix 1
E2D− are
the vector of unknown external EBV and the inverse of the associated unknown
prediction error (co)variance matrix obtained from a genetic evaluation E2 based on the
source E2 including only external information. It is also assumed that double counting
among animals due to relationships is taken into account.
Therefore, from 0EΛ and
1EΛ , the diagonal matrix of RE expressing the amount
of contributions only due to records, 0ERE and
1ERE , can be estimated for the two
sources of information E0 and E1, respectively. Because these RE are free of contributions
due to relationships and due to correlated traits, the matrix of RE associated with the
source of information E2, 2ERE , can be estimated as follows:
012 EEE RERE=RE − (equation 2.3).
It can be also written that 012 EEE ΛΛ=Λ − (equation 2.4). The unknown 1
E2D−
can be approximated as 222 E
1E
1E Λ+G=D −− (equation 2.5) where 1
E2G − is the inverse of an
unknown additive (co)variance matrix for the external source E2. From the equations 2.1,
2.2 and 2.5, the equation 2.4 is equivalent to the equation
)G(D)G(D=GD 1E
1E
1E
1E
1E
1E 001122
−−−−−− −−−− (equation 2.5).
Following the equations (VI.1) and assuming the lack of phenotypes in 0Ey , it can
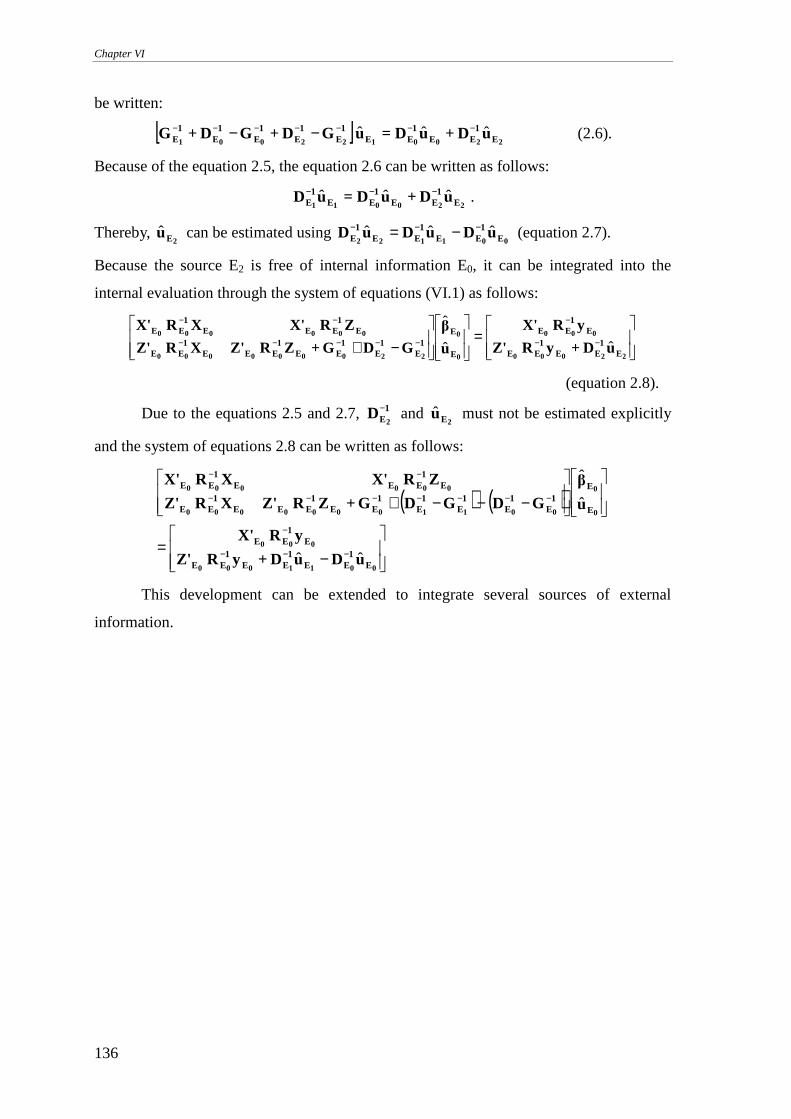
Chapter VI
136
be written:
[ ]2200122001 E
1EE
1EE
1E
1E
1E
1E
1E uD+uD=u GD+GD+G ˆˆˆ −−−−−−− −− (2.6).
Because of the equation 2.5, the equation 2.6 can be written as follows:
220011 E1
EE1
EE1
E uD+uD=uD ˆˆˆ −−− .
Thereby, 2Eu can be estimated using
001122 E1
EE1
EE1
E uDuDuD ˆˆˆ −−− −= (equation 2.7).
Because the source E2 is free of internal information E0, it can be integrated into the
internal evaluation through the system of equations (VI.1) as follows:
=
−+ −−
−
−−−−−
−−
22000
000
0
0
220000000
000000
E1
EE1
EE
E1
EE
E
E1
E1
E1
EE1
EEE1
EE
E1
EEE1
EE
uD+yRZ'
yRX'
u
β
GDG+ZRZ'XRZ'
ZRX'XRX'
ˆˆ
ˆ
(equation 2.8).
Due to the equations 2.5 and 2.7, 1E2D− and
2Eu must not be estimated explicitly
and the system of equations 2.8 can be written as follows:
( ) ( )
−=
−−−+
−−−
−
−−−−−−−
−−
0011000
000
0
0
00110000000
000000
E1
EE1
EE1
EE
E1
EE
E
E1
E1
E1
E1
E1
EE1
EEE1
EE
E1
EEE1
EE
uDuD+yRZ'
yRX'
u
β
GDGDG+ZRZ'XRZ'
ZRX'XRX'
ˆˆ
ˆ
ˆ
This development can be extended to integrate several sources of external
information.
Chapter VII. W ALLOON SINGLE -STEP GENOMIC EVALUATION
SYSTEM INTEGRATING LOCAL AND MACE EBV
As reviewed in Chapter II, single-step genomic evaluations
combine internal phenotypic and genealogic data with genomic
data without considering external information. In Chapter VI, it
has been suggested that the proposed Bayesian methods can be
extended to single-step genomic evaluations. However, the
inclusion of genomic data in the proposed Bayesian methods was
never tested in the previous Chapters. Therefore, based on the
Bayesian methods proposed in Chapter VI and based on single-
step genomic evaluations, the aim of this Chapter was to test and
implement a Walloon genomic evaluation for Holstein cattle that
combines simultaneously genomic data and all available Walloon
and external information.
Adapted from: Colinet, F.G., J. Vandenplas, P. Faux, S. Vanderick, R. Renaville, C.
Bertozzi, X. Hubin, and N. Gengler. 2013. Walloon single-step genomic evaluation
system integrating local and MACE EBV. Interbull Bull. 47:203–210.

Walloon single-step genomic evaluation system integrating local and MACE EBV
139
ABSTRACT
Walloon dairy cattle could be considered as a small scale population where the
majority of AI bulls are imported from several foreign countries. Single-step Genomic
Best Linear Unbiased Prediction (ssGBLUP) methods allow the simultaneous use of
genomic, pedigree and phenotypic information and should reduce potential biases in the
estimation of genomically enhanced breeding values (GEBV). Therefore, in the context of
developing a Walloon genomic evaluation system, it was considered as the best option.
However, in opposition to multi-step genomic predictions, ssGBLUP only uses local
phenotypic information and is unable to use directly important other sources of
information coming from abroad, e.g., multiple across country evaluation (MACE) results
provided by International Bull Service (Interbull, Uppsale, Sweden). Therefore, single-
step Genomic Bayesian Prediction (ssGBayes) was used as an alternative method for the
Walloon genomic evaluation system. The ssGBayes approach allows combining
simultaneously all available genotype, pedigree, local and foreign information in a local
evaluation by considering a correct propagation of external information avoiding double
counting of contributions due to relationships and due to records. In the Walloon genomic
evaluation system, local information refers to Walloon estimated breeding values (EBV)
and associated reliabilities (REL) and foreign information refers to MACE EBV and
associated REL. Furthermore, the Bayesian approach has the advantage to directly
combine EBV and REL without any deregression step. The ssGBayes method computed
more accurate predictions for all types of animals. For example, for genotyped animals
with low Walloon REL (<0.25) without MACE results and sired by genotyped bulls with
MACE results, the average increase of REL for the studied traits was 0.39 points of which
0.14 points could be traced to the inclusion of MACE information. For other categories of
genotyped animals, the contribution by MACE information was high too. The new
Walloon genomic evaluation system passed the Interbull GEBV tests for several traits in
July 2013. This approach has the potential to improve current genomic prediction
strategies as it can be used in other settings where the combination of different sources of
information is required.
Key words: Bayesian integration, MACE, genomic prediction
INTRODUCTION
Simultaneous use of all data by Best Linear Unbiased Prediction (BLUP) is a
Chapter VII
140
condition to predict unbiased estimated breeding values (EBV; Henderson, 1984).
However, this condition is not always fully met. For example, small scale local
populations lead to evaluations based only on local data while foreign bulls are used (e.g.,
87% of cows in 1st to 3rd parity in 2012 were sired by artificial insemination (AI) bulls
born outside of Walloon Region of Belgium). Although these bulls were strongly
preselected, foreign raw data used to select them is unavailable leading to potential biases
in local evaluations. Local EBV will be also less accurate because only incomplete data
(i.e., foreign raw data not included) is available. Genomic selection could increase these
problems for local genomic evaluations.
Most current genomic evaluation systems are multi-step, relying heavily on the
use of multiple across country evaluation (MACE) results as the primary source of
foreign phenotypic information. However, these implementations of genomic prediction
using MACE results mitigated these issues only for sires with high REL which are
introduced during the single nucleotide polymorphisms (SNP) prediction equation
estimation step.
Single-step genomic evaluations (ssGBLUP; e.g., Aguilar et al., 2010; Christensen
and Lund, 2010) should reduce potential biases in the estimation of genomically enhanced
breeding values (GEBV) by the simultaneous combination of genomic, pedigree and all
local phenotypic information (VanRaden, 2012), also because fewer approximations are
made than in multi-step methods. Therefore, in the context of developing a Walloon
genomic evaluation system, ssGBLUP was considered as the best option. However, in
opposition to multi-step genomic prediction, ssGBLUP uses only local phenotypic
information and is unable to use directly other important sources of information provided,
e.g., by MACE. Nevertheless, the recovery of such important sources of information in
the Walloon genomic evaluation system was required due to the widespread use of
imported AI bulls.
Therefore, in the context of the Walloon genomic evaluation system, the aim of
this research was to assess the potential of a Bayesian approach, based on ssGBLUP, to
simultaneously combine all available genotype, pedigree, local and foreign information in
a local genomic evaluation. This approach also avoids deregression steps, allows a correct
propagation of external information and avoids multiple considerations of contributions
due to relationships and due to records.
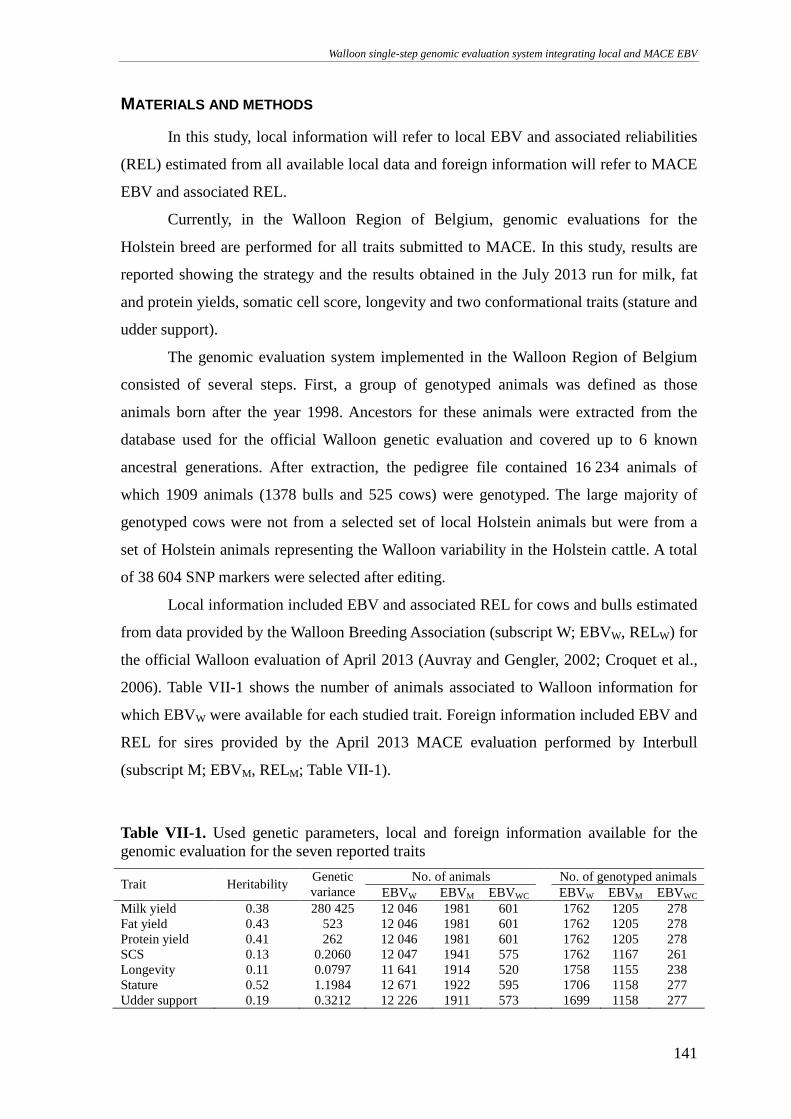
Walloon single-step genomic evaluation system integrating local and MACE EBV
141
MATERIALS AND METHODS
In this study, local information will refer to local EBV and associated reliabilities
(REL) estimated from all available local data and foreign information will refer to MACE
EBV and associated REL.
Currently, in the Walloon Region of Belgium, genomic evaluations for the
Holstein breed are performed for all traits submitted to MACE. In this study, results are
reported showing the strategy and the results obtained in the July 2013 run for milk, fat
and protein yields, somatic cell score, longevity and two conformational traits (stature and
udder support).
The genomic evaluation system implemented in the Walloon Region of Belgium
consisted of several steps. First, a group of genotyped animals was defined as those
animals born after the year 1998. Ancestors for these animals were extracted from the
database used for the official Walloon genetic evaluation and covered up to 6 known
ancestral generations. After extraction, the pedigree file contained 16 234 animals of
which 1909 animals (1378 bulls and 525 cows) were genotyped. The large majority of
genotyped cows were not from a selected set of local Holstein animals but were from a
set of Holstein animals representing the Walloon variability in the Holstein cattle. A total
of 38 604 SNP markers were selected after editing.
Local information included EBV and associated REL for cows and bulls estimated
from data provided by the Walloon Breeding Association (subscript W; EBVW, RELW) for
the official Walloon evaluation of April 2013 (Auvray and Gengler, 2002; Croquet et al.,
2006). Table VII-1 shows the number of animals associated to Walloon information for
which EBVW were available for each studied trait. Foreign information included EBV and
REL for sires provided by the April 2013 MACE evaluation performed by Interbull
(subscript M; EBVM, RELM; Table VII-1).
Table VII-1. Used genetic parameters, local and foreign information available for the genomic evaluation for the seven reported traits
No. of animals No. of genotyped animals Trait Heritability
Genetic variance EBVW EBVM EBVWC EBVW EBVM EBVWC
Milk yield 0.38 280 425 12 046 1981 601 1762 1205 278 Fat yield 0.43 523 12 046 1981 601 1762 1205 278 Protein yield 0.41 262 12 046 1981 601 1762 1205 278 SCS 0.13 0.2060 12 047 1941 575 1762 1167 261 Longevity 0.11 0.0797 11 641 1914 520 1758 1155 238 Stature 0.52 1.1984 12 671 1922 595 1706 1158 277 Udder support 0.19 0.3212 12 226 1911 573 1699 1158 277
Chapter VII
142
For every trait, contributions of Walloon information into MACE were determined
based on the domestic effective daughter equivalents (EDC) associated to EBVM and
RELM as reported by Interbull. MACE information free of Walloon information had
therefore a reported domestic EDC equal to 0. For all animals and traits with a domestic
EDC different from 0, Walloon EBV and associated REL contributing to the April 2013
MACE routine-run (subscript Wc; EBVWc, RELWc) were considered to avoid double
counting of contributions due to records (Table VII-1). Information was harmonized
between the local and MACE traits by adjusting scale and mean difference towards the
original expression of the trait in the Walloon genetic evaluation computations. As shown
in Table VII-1, numbers of available local and foreign records were slightly different
among the traits.
The Bayesian procedures that integrate multiple sources of external information
into genetic evaluations were outlined by Vandenplas et al. (2014). Also, these authors
outlined that their proposed systems of equations could be extended to integrate multiple
sources of external information into ssGBLUP (Vandenplas et al., 2014). Thereby, their
proposed equation (VI.4) that blends several sources of external information by avoiding
double counting of contributions due to records and due to relationships was adapted to
blend Walloon and MACE information into a ssGBLUP for each trait separately. This
method, hereafter called single-step Genomic Bayesian Prediction (ssGBayes), was used
as an alternative method for the Walloon genomic evaluation system. The equation
associated with ssGBayes that blends genomic, Walloon and MACE information and that
considers Walloon information contributing to MACE (hereafter called ssGBayesW+M-Wc)
can be written as follows:
( ) Wc1
WcM1
MW1
WWcMWWcMW1 * u DuDuDa ΛΛΛG ˆˆˆˆ −−−
−+− −+=−++ (VII.1)
where 2aσHG * = is the combined genomic-pedigree based (co)variance matrix, H is the
combined genomic-pedigree based relationship matrix (e.g., Aguilar et al., 2010;
Christensen and Lund, 2010), 2aσ is the additive genetic variance, WcMWa −+ˆ is the vector
of Walloon GEBV based on Walloon and MACE information, Wu is the vector of EBVW,
Mu is the vector of EBVM, ˆ Wcu is the vector of EBVWc, iΛ (i = W, M and Wc) is a
matrix mimicking least squares part of hypothetical BLUP, and 1iD− is the inverse of the
prediction error (co)variance matrix of iu .
The inverse of the combined genomic-pedigree based relationship matrix H was
Walloon single-step genomic evaluation system integrating local and MACE EBV
143
computed using the inverse of the additive pedigree relationship matrix and a modified
genomic relationship matrix using a weight equal to 0.95 for raw genomic relationships
and equal to 0.05 for pedigree relationships. For matrices compatibility, both diagonal and
off-diagonal values were respectively centred on the average of diagonal and off-diagonal
elements of the subpart of the additive relationship matrix among genotyped animals.
Regarding the vectors iu for the 3 sources of information (i.e., W, M and Wc), it
is worth noting that only some animals included in the pedigree were associated with
known EBV and REL (hereafter called external animals; Table VII-1). Therefore, for each
ith source of information, animals not associated with available EBV were called internal
animals and the vector of EBVi (i = W, M and Wc) for all animals included in the
pedigree, iu , was estimated as (Vandenplas et al., 2014):
=
−
i(E)
i(E)1
i(EE)i(IE)i u
u G Gu
ˆ
ˆˆ
where the subscript I refers to internal animals not associated with the ith source of
information, the subscript E refers to external animals associated with the ith source of
information, i(E)u is the vector of EBV for the ith source of information associated with
external animals and
1
i(II)i(IE)
i(EI)i(EE)1
GG
GGG
−
−
= is the inverse of the pedigree-based
(co)variance matrix.
For the 3 sources of information (i.e., W, M and Wc), the matrix 1iD− was
approximated as i11
i ΛGD += −− where iΛ is a diagonal variance matrix with one
diagonal element per animal equal to 2eij σRE for j = 1, 2, …, J animals (Vandenplas et
al., 2014). The element 2eσ is the residual variance and the element ijRE is the effective
number of records, so-called record equivalents, for the jth animal. Record equivalents
expressed the amount of contributions for an animal (Misztal and Wiggans, 1988). It is
worth noting that double counting of contributions due to relationships among related
animals could exist because both Walloon and MACE information were associated with
related animals. Therefore, the combination of Walloon and MACE information was
performed by taking into account contributions due to relationships among related
animals. These contributions were estimated by a two-step algorithm (TSA; Vandenplas
and Gengler, 2012). It takes into account all relationships between animals associated
Chapter VII
144
with information and their ancestors. Therefore, for the internal animals, ijRE is equal to
0. All contributions for these animals were only due to their relationships with external
animals. For the external animals, ijRE was estimated through TSA and only express the
amount of contributions due to records.
Because a major feature of the Walloon genomic evaluation system is its ability to
use MACE information, in comparison to ssGBLUP, the influence of the use of this
information was tested. To test this influence, ssGBayes was run considering only
Walloon information (ssGBayesW) using the following system of equations:
( ) W1
WWW1 uDa ΛG ˆˆ* −− =+ (VII.2)
where Wa ˆ is the vector of Walloon GEBV only based on Walloon information.
Approximation of genomic REL (GREL) for GEBV in genomic evaluation
systems is not always straight forward (Misztal, 2013). Because the equations (VII.1) and
(VII.2) associated with ssGBayesW+M-Wc and ssGBayesW, respectively, represented
hypothetical mixed model equations, the computation of REL was tested using the
standard formula:
2/1 gσPEVGREL −= (VII.3)
where 2gσ is the diagonal element of *G and PEV is the prediction error variance
obtained from the diagonal element of the inverted left hand side of the equations (VII.1)
and (VII.2), respectively. By using diagonal elements of *G , the method corrected for
inbreeding estimated using combined pedigree and genomic information.
The two ssGBayes were performed using BLUPF90 (Misztal, 2013) modified to
implement equations (VII.1) and (VII.2).
RESULTS AND DISCUSSION
For all traits, among the approximately 12 000 animals associated with available
Walloon information, around 1950 bulls were also evaluated by Interbull (Table VII-1).
Walloon information for around one third of these bulls contributed to the April 2013
MACE routine-run. Table VII-1 also indicates that at least 83% of the 1378 genotyped
bulls and at least 11% of the 16 234 animals in the considered pedigree file had foreign
information. This large amount of additional information was incorporated in the genomic
evaluation system and would allow increasing the overall accuracy of the produced
GEBV.
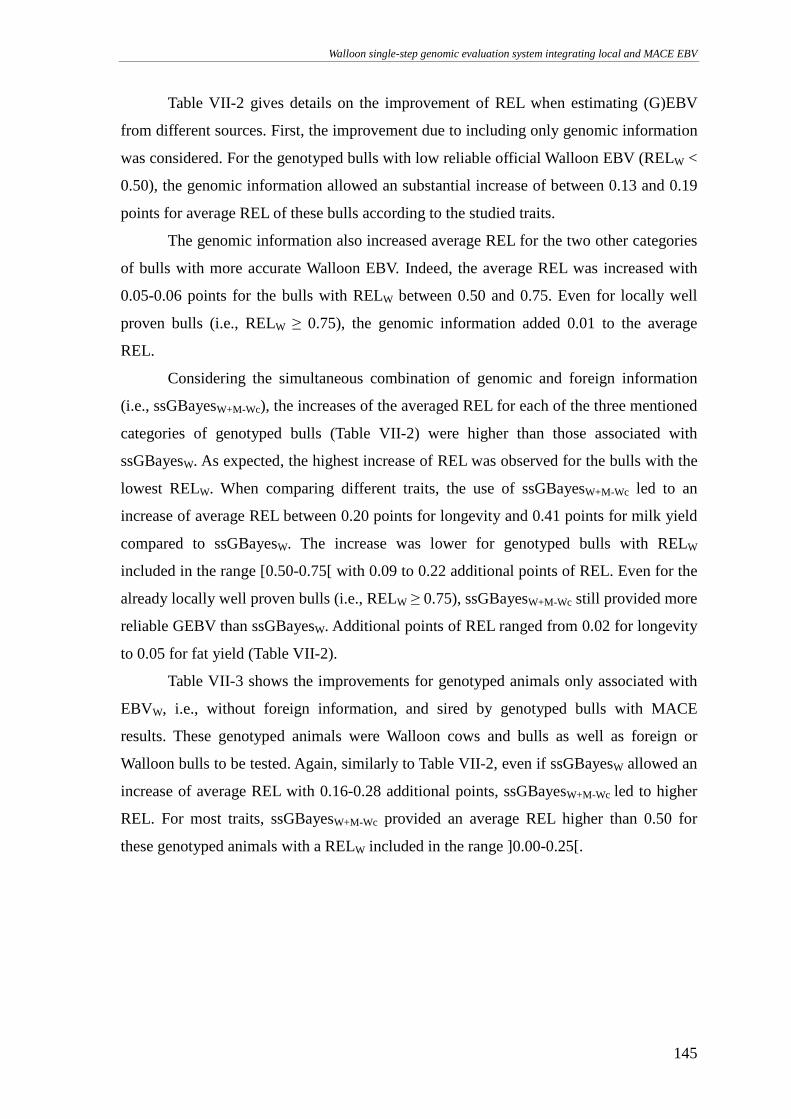
Walloon single-step genomic evaluation system integrating local and MACE EBV
145
Table VII-2 gives details on the improvement of REL when estimating (G)EBV
from different sources. First, the improvement due to including only genomic information
was considered. For the genotyped bulls with low reliable official Walloon EBV (RELW <
0.50), the genomic information allowed an substantial increase of between 0.13 and 0.19
points for average REL of these bulls according to the studied traits.
The genomic information also increased average REL for the two other categories
of bulls with more accurate Walloon EBV. Indeed, the average REL was increased with
0.05-0.06 points for the bulls with RELW between 0.50 and 0.75. Even for locally well
proven bulls (i.e., RELW ≥ 0.75), the genomic information added 0.01 to the average
REL.
Considering the simultaneous combination of genomic and foreign information
(i.e., ssGBayesW+M-Wc), the increases of the averaged REL for each of the three mentioned
categories of genotyped bulls (Table VII-2) were higher than those associated with
ssGBayesW. As expected, the highest increase of REL was observed for the bulls with the
lowest RELW. When comparing different traits, the use of ssGBayesW+M-Wc led to an
increase of average REL between 0.20 points for longevity and 0.41 points for milk yield
compared to ssGBayesW. The increase was lower for genotyped bulls with RELW
included in the range [0.50-0.75[ with 0.09 to 0.22 additional points of REL. Even for the
already locally well proven bulls (i.e., RELW ≥ 0.75), ssGBayesW+M-Wc still provided more
reliable GEBV than ssGBayesW. Additional points of REL ranged from 0.02 for longevity
to 0.05 for fat yield (Table VII-2).
Table VII-3 shows the improvements for genotyped animals only associated with
EBVW, i.e., without foreign information, and sired by genotyped bulls with MACE
results. These genotyped animals were Walloon cows and bulls as well as foreign or
Walloon bulls to be tested. Again, similarly to Table VII-2, even if ssGBayesW allowed an
increase of average REL with 0.16-0.28 additional points, ssGBayesW+M-Wc led to higher
REL. For most traits, ssGBayesW+M-Wc provided an average REL higher than 0.50 for
these genotyped animals with a RELW included in the range ]0.00-0.25[.
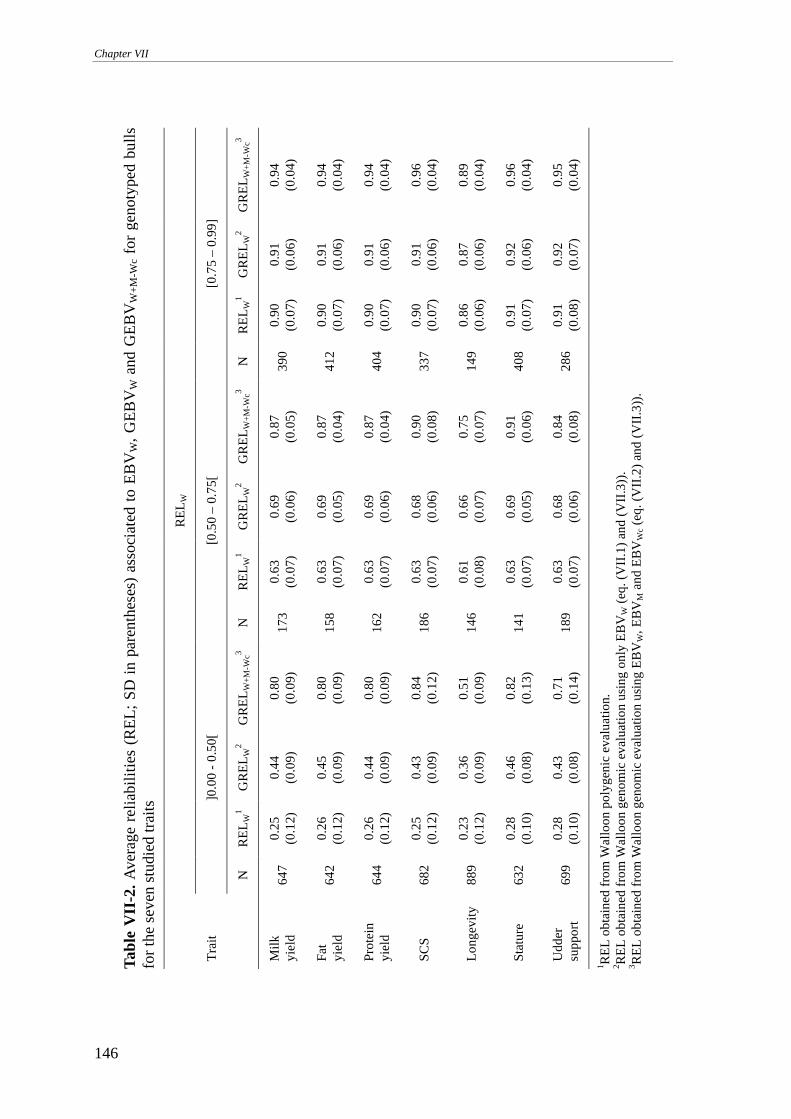
Chapter VII
146
GR
EL W
+M
-Wc3
0.9
4
(0.0
4)
0.9
4
(0.0
4)
0.9
4
(0.0
4)
0.9
6
(0.0
4)
0.8
9
(0.0
4)
0.9
6
(0.0
4)
0.9
5
(0.0
4)
GR
EL W
2
0.9
1
(0.0
6)
0.9
1
(0.0
6)
0.9
1
(0.0
6)
0.9
1
(0.0
6)
0.8
7
(0.0
6)
0.9
2
(0.0
6)
0.9
2
(0.0
7)
RE
L W1
0.9
0
(0.0
7)
0.9
0
(0.0
7)
0.9
0
(0.0
7)
0.9
0
(0.0
7)
0.8
6
(0.0
6)
0.9
1
(0.0
7)
0.9
1
(0.0
8)
[0.7
5 –
0.9
9]
N
39
0
41
2
40
4
33
7
14
9
40
8
28
6
GR
EL W
+M
-Wc3
0.8
7
(0.0
5)
0.8
7
(0.0
4)
0.8
7
(0.0
4)
0.9
0
(0.0
8)
0.7
5
(0.0
7)
0.9
1
(0.0
6)
0.8
4
(0.0
8)
GR
EL W
2
0.6
9
(0.0
6)
0.6
9
(0.0
5)
0.6
9
(0.0
6)
0.6
8
(0.0
6)
0.6
6
(0.0
7)
0.6
9
(0.0
5)
0.6
8
(0.0
6)
RE
L W1
0.6
3
(0.0
7)
0.6
3
(0.0
7)
0.6
3
(0.0
7)
0.6
3
(0.0
7)
0.6
1
(0.0
8)
0.6
3
(0.0
7)
0.6
3
(0.0
7)
[0.5
0 –
0.7
5[
N
17
3
15
8
16
2
18
6
14
6
14
1
18
9
GR
EL W
+M
-Wc3
0.8
0
(0.0
9)
0.8
0
(0.0
9)
0.8
0
(0.0
9)
0.8
4
(0.1
2)
0.5
1
(0.0
9)
0.8
2
(0.1
3)
0.7
1
(0.1
4)
GR
EL W
2
0.4
4
(0.0
9)
0.4
5
(0.0
9)
0.4
4
(0.0
9)
0.4
3
(0.0
9)
0.3
6
(0.0
9)
0.4
6
(0.0
8)
0.4
3
(0.0
8)
RE
L W1
0.2
5
(0.1
2)
0.2
6
(0.1
2)
0.2
6
(0.1
2)
0.2
5
(0.1
2)
0.2
3
(0.1
2)
0.2
8
(0.1
0)
0.2
8
(0.1
0)
RE
L W
]0.0
0 -
0.5
0[
N
64
7
64
2
64
4
68
2
88
9
63
2
69
9
Tabl
e V
II-2.
Ave
rage
re
liabi
litie
s (R
EL;
SD
in
pare
nthe
ses)
ass
oci
ated
to
EB
V W,
GE
BV W
and
GE
BV W
+M
-Wc
for
geno
type
d bu
lls
for
the
seve
n st
udie
d tr
aits
Tra
it
Milk
yi
eld
Fat
yi
eld
Pro
tein
yi
eld
SC
S
Lo
ng
evity
Sta
ture
Ud
der
su
pp
ort
1 RE
L o
bta
ined
fro
m W
allo
on
po
lyg
enic
eva
luat
ion.
2 R
EL
ob
tain
ed f
rom
Wal
loo
n g
eno
mic
eva
luat
ion
usi
ng
o
nly
EB
VW
(eq
. (V
II.1
) an
d (
VII.
3))
. 3 R
EL
ob
tain
ed f
rom
Wal
loo
n g
eno
mic
eva
luat
ion
usi
ng
E
BV
W,
EB
VM
an
d E
BV W
c (e
q.
(VII
.2)
and
(V
II.3
)).
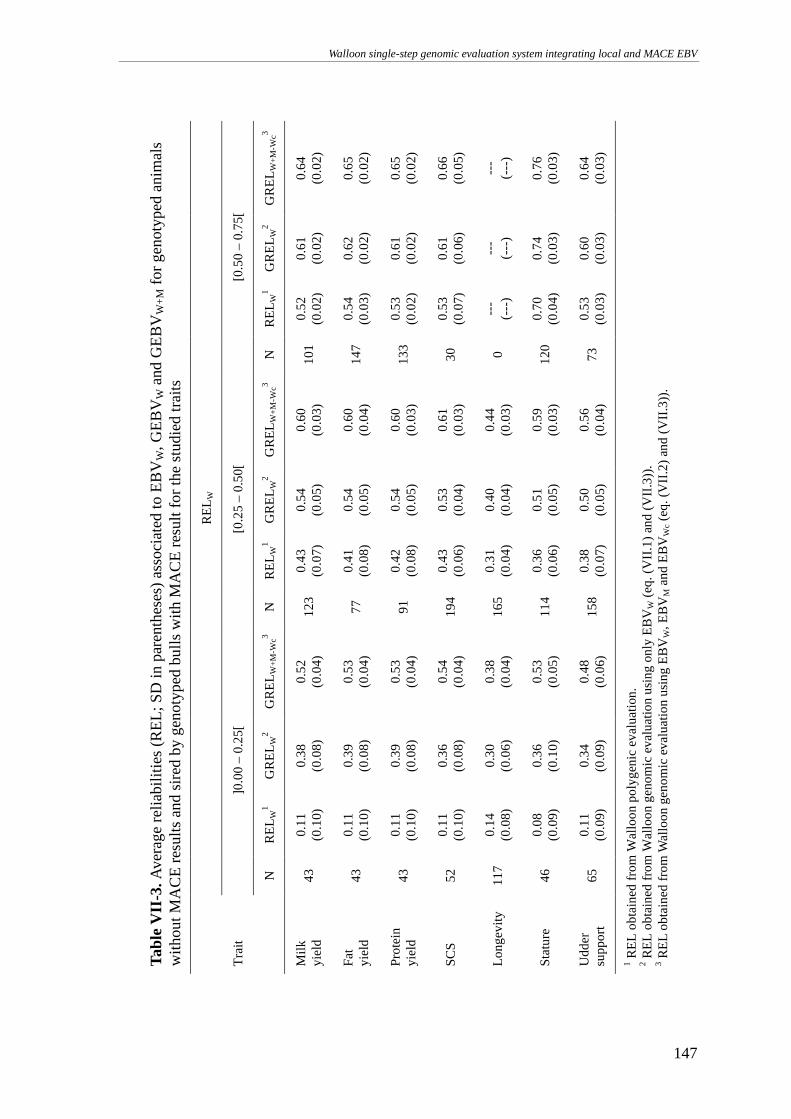
Walloon single-step genomic evaluation system integrating local and MACE EBV
147
GR
EL W
+M
-Wc3
0.6
4
(0.0
2)
0.6
5
(0.0
2)
0.6
5
(0.0
2)
0.6
6
(0.0
5)
---
(---
)
0.7
6
(0.0
3)
0.6
4
(0.0
3)
GR
EL W
2
0.6
1
(0.0
2)
0.6
2
(0.0
2)
0.6
1
(0.0
2)
0.6
1
(0.0
6)
---
(---
)
0.7
4
(0.0
3)
0.6
0
(0.0
3)
RE
L W1
0.5
2
(0.0
2)
0.5
4
(0.0
3)
0.5
3
(0.0
2)
0.5
3
(0.0
7)
---
(---
)
0.7
0
(0.0
4)
0.5
3
(0.0
3)
[0.5
0 –
0.7
5[
N
10
1
14
7
13
3
30
0
12
0
73
GR
EL W
+M
-Wc3
0.6
0
(0.0
3)
0.6
0
(0.0
4)
0.6
0
(0.0
3)
0.6
1
(0.0
3)
0.4
4
(0.0
3)
0.5
9
(0.0
3)
0.5
6
(0.0
4)
GR
EL W
2
0.5
4
(0.0
5)
0.5
4
(0.0
5)
0.5
4
(0.0
5)
0.5
3
(0.0
4)
0.4
0
(0.0
4)
0.5
1
(0.0
5)
0.5
0
(0.0
5)
RE
L W1
0.4
3
(0.0
7)
0.4
1
(0.0
8)
0.4
2
(0.0
8)
0.4
3
(0.0
6)
0.3
1
(0.0
4)
0.3
6
(0.0
6)
0.3
8
(0.0
7)
[0.2
5 –
0.5
0[
N
12
3
77
91
19
4
16
5
11
4
15
8
GR
EL W
+M
-Wc3
0.5
2
(0.0
4)
0.5
3
(0.0
4)
0.5
3
(0.0
4)
0.5
4
(0.0
4)
0.3
8
(0.0
4)
0.5
3
(0.0
5)
0.4
8
(0.0
6)
GR
EL W
2
0.3
8
(0.0
8)
0.3
9
(0.0
8)
0.3
9
(0.0
8)
0.3
6
(0.0
8)
0.3
0
(0.0
6)
0.3
6
(0.1
0)
0.3
4
(0.0
9)
RE
L W1
0.1
1
(0.1
0)
0.1
1
(0.1
0)
0.1
1
(0.1
0)
0.1
1
(0.1
0)
0.1
4
(0.0
8)
0.0
8
(0.0
9)
0.1
1
(0.0
9)
RE
L W
]0.0
0 –
0.2
5[
N
43
43
43
52
11
7
46
65
Tabl
e V
II-3.
Ave
rage
rel
iabi
litie
s (R
EL;
SD
in p
aren
thes
es)
asso
ciat
ed to
EB
V W, G
EB
V W a
nd G
EB
V W+
M fo
r ge
noty
ped
anim
als
with
out M
AC
E r
esul
ts a
nd s
ired
by g
enot
yped
bu
lls w
ith M
AC
E r
esul
t for
the
stud
ied
trai
ts
Tra
it
Milk
yi
eld
Fat
yi
eld
Pro
tein
yi
eld
SC
S
Lo
ng
evity
Sta
ture
Ud
der
su
pp
ort
1 RE
L o
bta
ined
fro
m W
allo
on
po
lyg
enic
eva
luat
ion
. 2 R
EL
ob
tain
ed fr
om
Wal
loo
n g
eno
mic
eva
luat
ion
usi
ng
on
ly E
BV W
(eq
. (V
II.1
) an
d (
VII.
3))
. 3 R
EL
ob
tain
ed fr
om
Wal
loo
n g
eno
mic
eva
luat
ion
usi
ng
EB
VW
, E
BV
M a
nd
EB
V Wc
(eq
. (V
II.2
) an
d (
VII.
3))
.
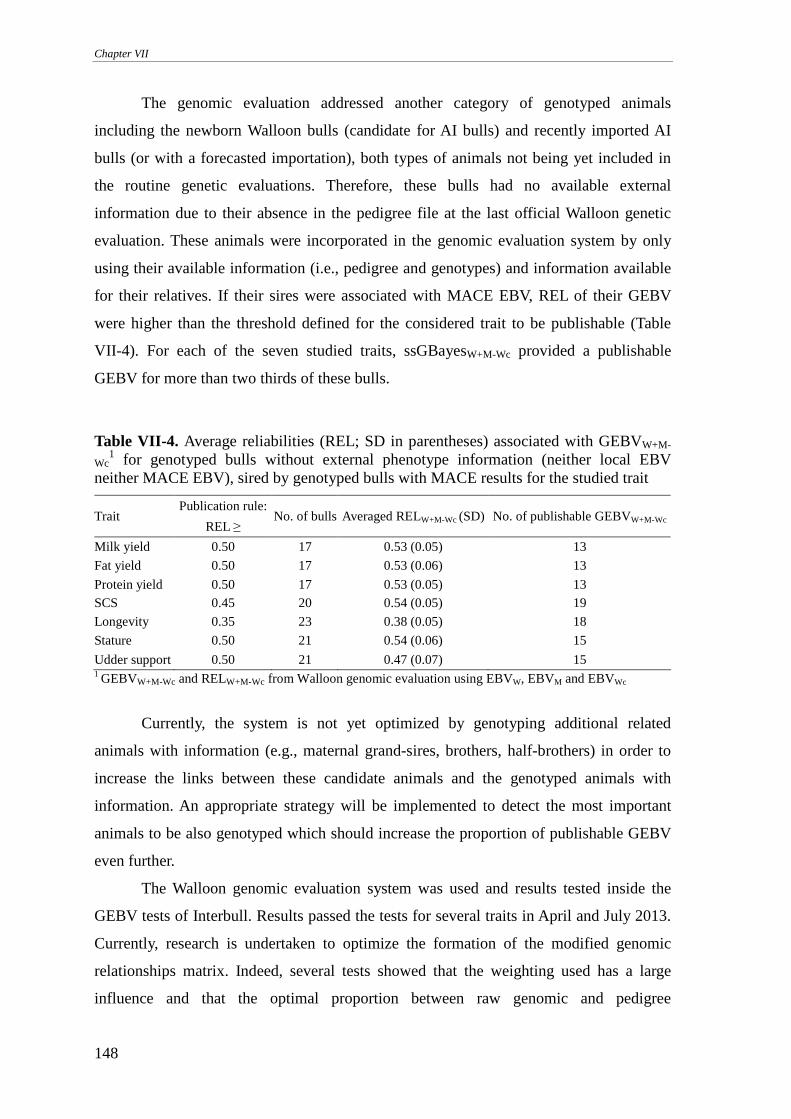
Chapter VII
148
The genomic evaluation addressed another category of genotyped animals
including the newborn Walloon bulls (candidate for AI bulls) and recently imported AI
bulls (or with a forecasted importation), both types of animals not being yet included in
the routine genetic evaluations. Therefore, these bulls had no available external
information due to their absence in the pedigree file at the last official Walloon genetic
evaluation. These animals were incorporated in the genomic evaluation system by only
using their available information (i.e., pedigree and genotypes) and information available
for their relatives. If their sires were associated with MACE EBV, REL of their GEBV
were higher than the threshold defined for the considered trait to be publishable (Table
VII-4). For each of the seven studied traits, ssGBayesW+M-Wc provided a publishable
GEBV for more than two thirds of these bulls.
Table VII-4. Average reliabilities (REL; SD in parentheses) associated with GEBVW+M-
Wc1 for genotyped bulls without external phenotype information (neither local EBV
neither MACE EBV), sired by genotyped bulls with MACE results for the studied trait
Trait Publication rule:
REL ≥ No. of bulls Averaged RELW+M-Wc (SD) No. of publishable GEBVW+M-Wc
Milk yield 0.50 17 0.53 (0.05) 13
Fat yield 0.50 17 0.53 (0.06) 13
Protein yield 0.50 17 0.53 (0.05) 13 SCS 0.45 20 0.54 (0.05) 19
Longevity 0.35 23 0.38 (0.05) 18
Stature 0.50 21 0.54 (0.06) 15
Udder support 0.50 21 0.47 (0.07) 15 1 GEBVW+M-Wc and RELW+M-Wc from Walloon genomic evaluation using EBVW, EBVM and EBVWc
Currently, the system is not yet optimized by genotyping additional related
animals with information (e.g., maternal grand-sires, brothers, half-brothers) in order to
increase the links between these candidate animals and the genotyped animals with
information. An appropriate strategy will be implemented to detect the most important
animals to be also genotyped which should increase the proportion of publishable GEBV
even further.
The Walloon genomic evaluation system was used and results tested inside the
GEBV tests of Interbull. Results passed the tests for several traits in April and July 2013.
Currently, research is undertaken to optimize the formation of the modified genomic
relationships matrix. Indeed, several tests showed that the weighting used has a large
influence and that the optimal proportion between raw genomic and pedigree
Walloon single-step genomic evaluation system integrating local and MACE EBV
149
relationships directly reflects the critical partitioning of total genetic variance in variances
explained by SNP effects or polynomial residuals.
CONCLUSIONS
The ssGBayes method, through its Bayesian approach, integrated well MACE
results into ssGBLUP and allowed recovering indirectly a large amount of phenotypic
information. All available external sources of information were correctly propagated
avoiding double counting of contributions due to relationships and due to own records.
Therefore, the ssGBayes method proved to be a good choice for the Walloon genomic
evaluation system integrating Walloon and MACE EBV. Additional optimizations are
currently under development by genotyping important sires and by adapting the correct
partitioning of additive total variance for a given trait in order to increase the number of
traits that pass the Interbull GEBV test. The ssGBayes method used in the Walloon
genomic evaluation system can also be adapted to a multi-trait setting allowing the
genomic evaluation of only locally available traits (e.g., fine milk composition, methane
emissions) using external information from correlated traits (e.g., traits evaluated by
Interbull).
Finally, the ssGBayes approach has the potential to improve current genomic
prediction strategies as it can be used in other settings (e.g., beef cattle and pigs) where
the combination of different sources of information is required.
ACKNOWLEDGEMENTS
The authors acknowledge the Ministry of Agriculture of Walloon Region of
Belgium (Service Public de Wallonie, DGO3) for financial support through several
grants, i.e. research projects D31-1233 and D31-1274. Jérémie Vandenplas, as a research
fellow, and Nicolas Gengler, as an honorary senior research associate, acknowledge the
former and ongoing support of the National Fund for Scientific Research (F.R.S.-FNRS,
Brussels, Belgium) for their positions and through several grants. Pierre Faux
acknowledges the financial support of National Research Fund, Luxembourg through
project NextGenGES-PHD-09-118, as part of a private public partnership between
CONVIS (Ettelbruck, Luxembourg) and Gembloux Agro-Bio Tech of the University of
Liege. Jérémie Vandenplas acknowledges I. Misztal for hosting him at Animal and Dairy
Sciences Department of University of Georgia (Athens, USA), G. Gorjanc for hosting him
at Animal Science Department of University of Ljubljana. The help of S. Tsuruta
Chapter VII
150
(University of Georgia, Athens, USA) and I. Aguilar (Instituto Nacional de Investigación
Agropecuaria, Las Brujas, Urugay) concerning the BLUPF90 family of programs, on
which the developed computing programs are based, is acknowledged. Computational
resources have been provided by the Consortium des Équipements de Calcul Intensif
(CÉCI) funded by the National Fund for Scientific Research (F.R.S.-FNRS, Brussels,
Belgium) under Grant No. 2.5020.11.
REFERENCES
Aguilar, I., I. Misztal, D.L. Johnson, A. Legarra, S. Tsuruta, and T.J. Lawlor. 2010. Hot
topic: A unified approach to utilize phenotypic, full pedigree, and genomic
information for genetic evaluation of Holstein final score. J. Dairy Sci. 93:743–
752.
Auvray, B., and N. Gengler. 2002. Feasibility of a Walloon test-day model and study of its
potential as tool for selection and management. Interbull Bull. 29:123–127.
Christensen, O.F., and M.S. Lund. 2010. Genomic prediction when some animals are not
genotyped. Genet. Sel. Evol. 42:2.
Croquet, C., P. Mayeres, A. Gillon, S. Vanderick, and N. Gengler. 2006. Inbreeding
depression for global and partial economic indexes, production, type, and
functional traits. J. Dairy Sci. 89:2257–2267.
Henderson, C.R. 1984. Applications of linear models in animal breeding. 2nd ed.
University of Guelph, Guelph, ON, Canada.
Misztal, I. 2013. BLUPF90 family of programs. Accessed Jul. 3, 2012.
http://nce.ads.uga.edu/wiki/doku.php.
Misztal, I., and G.R. Wiggans. 1988. Approximation of prediction error variance in large-
scale animal models? J. Dairy Sci. 71(Suppl. 2):27–32.
Vandenplas, J., F.G. Colinet and N. Gengler. 2014. Unified method to integrate and blend
several, potentially related, sources of information for genetic evaluation. Genet.
Sel. Evol. 46:59
Vandenplas, J., and N. Gengler. 2012. Comparison and improvements of different
Bayesian procedures to integrate external information into genetic evaluations. J.
Dairy Sci. 95:1513–1526.
VanRaden, P.M. 2012. Avoiding bias from genomic pre-selection in converting daughter
information across countries. Interbull Bull. 45:29–33.
Chapter VIII. G ENERAL DISCUSSION
Based on previous research, Chapter III to Chapter VII presented
improvements and implementations of Bayesian approaches that
integrate several sources of external information into an internal
genetic or single-step genomic evaluation. Although the Bayesian
approaches were developed to integrate external information
correlated to the internal phenotypic traits into a multivariate
genetic evaluation (e.g., Chapter VI), external information was
always considered to be the same trait as the internal phenotypic
trait from Chapter III to Chapter VII. Therefore, in this Chapter, a
general discussion was first initiated by investigating the
integration of correlated external information into a multivariate
genetic evaluation. Second, a comparative study among the
different approaches that combine simultaneously external
information and internal data was detailed.

General discussion
153
Bayesian approaches that integrate external information, i.e., estimated breeding
values (EBV) and associated reliabilities (REL), into an internal genetic evaluation were
proposed by several authors (e.g., Quaas and Zhang, 2006; Legarra et al., 2007). Different
issues were identified and, thereby, improvements and implementations of algorithms and
methods, as well as extension of their scope to genomics were proposed in Chapter III
until Chapter VII. This included the reduction of computational burdens (Chapter III), and
the consideration of double counting of contributions due to relationships (Chapter III)
and due to records (Chapter VI). In Chapter VI, modified mixed models equations
(MME) were presented to integrate several sources of external information into genetic
and genomic evaluations. To our knowledge, such an integration of several sources of
external information has not been showed by previous authors in the context of Bayesian
approaches. Also, the proposed improvements and algorithms were tested with real data
in the context of the Belgian genetic evaluation for jumping horses (Chapter IV) and in
the context of the Walloon single-step genomic evaluation system for Holstein cattle
(Chapter VII).
It is worth noting that external information was always considered to belong to the
same trait as the considered internal phenotypic trait from Chapter III to Chapter VII.
However, the Bayesian approaches were also developed for integrating external
information correlated to the internal phenotypic traits (hereafter called correlated
external information) into multivariate genetic evaluations (e.g., Chapter VI; Quaas and
Zhang, 2006). These Bayesian approaches need an approximation of the inverse of the
prediction error (co)variance matrix associated with external EBV obtained from external
multivariate MME. An approximation of the inverse of this matrix was proposed in
Chapter VI. As stated in this Chapter VI, the proposed approximation is different from the
approximation proposed by Quaas and Zhang (2006). The difference between the two
approximations is linked to the approximation of the least squares part of the left hand
side (LHS) of the external multivariate MME that is needed for the approximation of the
inverse of the prediction error (co)variance matrix. Therefore, our approximation (Chapter
VI) and the one presented by Quaas and Zhang (2006) were tested and compared based
on simulated data. Results are given in the subsequent section. Finally, a comparison of
the three types of approaches that combine simultaneously internal data and external
information for univariate analyses and multivariate genetic evaluations is presented in
the last section of this Chapter.
Chapter VIII
154
INTEGRATION OF CORRELATED EXTERNAL INFORMATION
Thanks to correlations among different traits, some advantages of multivariate
genetic evaluations are firstly the prediction of EBV for traits of interest for which
phenotypes could be difficult, or impossible to collect internally and, secondly, the
improvement of accuracy of EBV for the different traits, under some conditions (e.g.,
Schaeffer, 1994; Mrode, 2005). Thereby, integration of external information correlated to
the internal phenotypic traits into an internal multivariate genetic evaluation could be
interesting to solve different issues. Firstly, accuracy of internal evaluations may be still
low for some traits of interest, while accurate external evaluations for similar traits or for
correlated traits are routinely performed, potentially at an international level (e.g., MACE
evaluations for commonly evaluated traits). Therefore, integration of correlated external
information provided by external evaluations into a multivariate evaluation could improve
the accuracy of the traits of interest. Secondly, external information can be expressed on
other scales or units of measurement, or it can be associated with different heritabilities
and genetic parameters than the internal traits of interest. Therefore, like MACE,
integration of correlated external information could be an optimal approach to evaluate
genetic merits of animals without the use of conversion equations and without the
dependence of the internal genetic evaluation to these equations. In the context of the
Bayesian evaluations integrating external information into a multivariate genetic
evaluation, two different approximations of the least squares part of the LHS of the
external MME, involved in the approximation of the inverse of the prediction error
(co)variance matrix associated with external EBV (Chapter III; Chapter VI), were
proposed. The first approach to approximate the external least squares part was proposed
by Quaas and Zhang (2006) and used in Chapter III and Chapter IV. This approach
involves the matrix of additive genetic (co)variances among traits. The second approach
was proposed in Chapter VI and involves the matrix of residual (co)variances among
traits, instead of the additive genetic (co)variance matrix. Therefore, based on simulated
data, the aim of this study was to test the two proposed approximations through their use
in a Bayesian approach that combines internal pedigree and phenotypes for a trait of
interest with external information, i.e., EBV and REL provided by an external genetic
evaluation for a trait genetically correlated to this trait of interest.
MATERIAL AND METHODS
The context of the simulation was a population where only females were
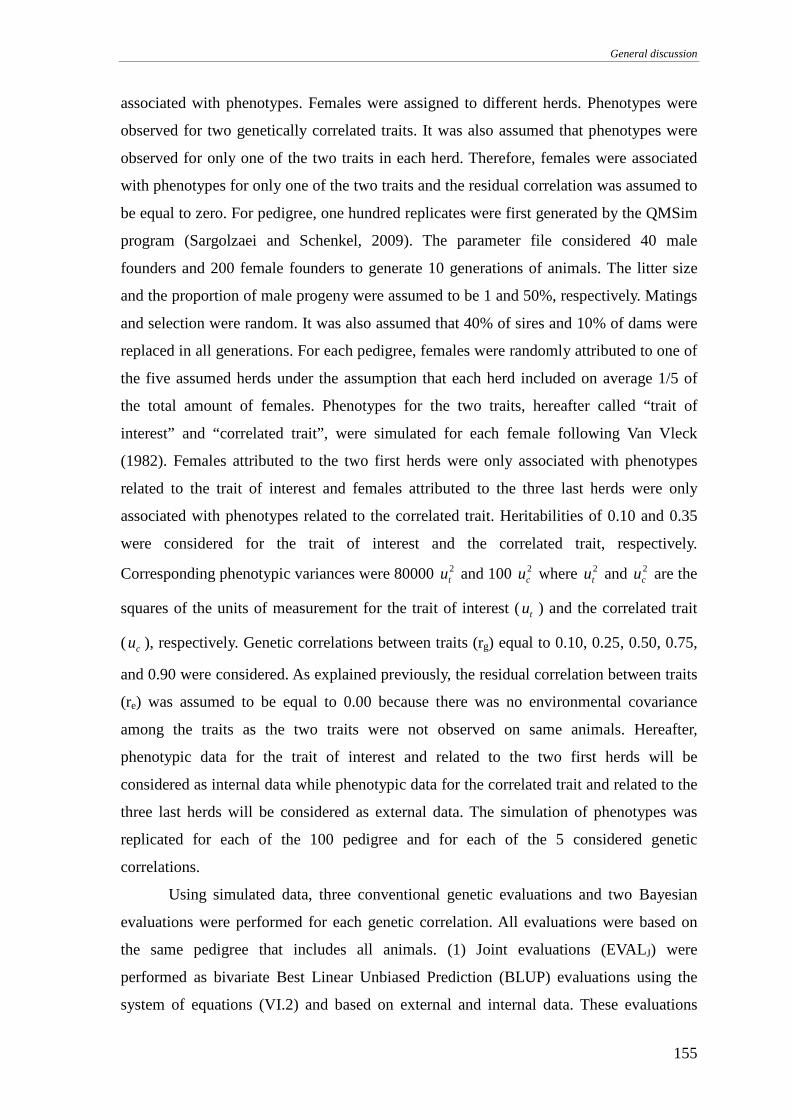
General discussion
155
associated with phenotypes. Females were assigned to different herds. Phenotypes were
observed for two genetically correlated traits. It was also assumed that phenotypes were
observed for only one of the two traits in each herd. Therefore, females were associated
with phenotypes for only one of the two traits and the residual correlation was assumed to
be equal to zero. For pedigree, one hundred replicates were first generated by the QMSim
program (Sargolzaei and Schenkel, 2009). The parameter file considered 40 male
founders and 200 female founders to generate 10 generations of animals. The litter size
and the proportion of male progeny were assumed to be 1 and 50%, respectively. Matings
and selection were random. It was also assumed that 40% of sires and 10% of dams were
replaced in all generations. For each pedigree, females were randomly attributed to one of
the five assumed herds under the assumption that each herd included on average 1/5 of
the total amount of females. Phenotypes for the two traits, hereafter called “trait of
interest” and “correlated trait”, were simulated for each female following Van Vleck
(1982). Females attributed to the two first herds were only associated with phenotypes
related to the trait of interest and females attributed to the three last herds were only
associated with phenotypes related to the correlated trait. Heritabilities of 0.10 and 0.35
were considered for the trait of interest and the correlated trait, respectively.
Corresponding phenotypic variances were 80000 2tu and 100 2
cu where 2tu and 2
cu are the
squares of the units of measurement for the trait of interest ( tu ) and the correlated trait
( cu ), respectively. Genetic correlations between traits (rg) equal to 0.10, 0.25, 0.50, 0.75,
and 0.90 were considered. As explained previously, the residual correlation between traits
(re) was assumed to be equal to 0.00 because there was no environmental covariance
among the traits as the two traits were not observed on same animals. Hereafter,
phenotypic data for the trait of interest and related to the two first herds will be
considered as internal data while phenotypic data for the correlated trait and related to the
three last herds will be considered as external data. The simulation of phenotypes was
replicated for each of the 100 pedigree and for each of the 5 considered genetic
correlations.
Using simulated data, three conventional genetic evaluations and two Bayesian
evaluations were performed for each genetic correlation. All evaluations were based on
the same pedigree that includes all animals. (1) Joint evaluations (EVALJ) were
performed as bivariate Best Linear Unbiased Prediction (BLUP) evaluations using the
system of equations (VI.2) and based on external and internal data. These evaluations
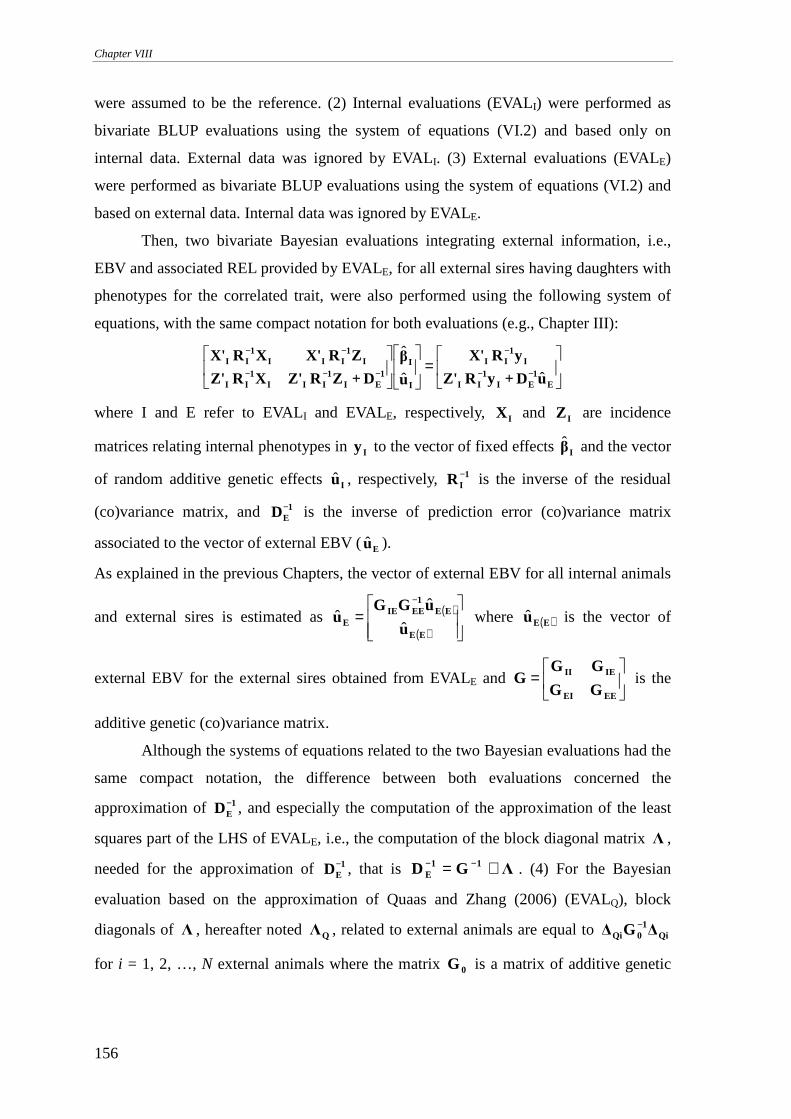
Chapter VIII
156
were assumed to be the reference. (2) Internal evaluations (EVALI) were performed as
bivariate BLUP evaluations using the system of equations (VI.2) and based only on
internal data. External data was ignored by EVALI. (3) External evaluations (EVALE)
were performed as bivariate BLUP evaluations using the system of equations (VI.2) and
based on external data. Internal data was ignored by EVALE.
Then, two bivariate Bayesian evaluations integrating external information, i.e.,
EBV and associated REL provided by EVALE, for all external sires having daughters with
phenotypes for the correlated trait, were also performed using the following system of
equations, with the same compact notation for both evaluations (e.g., Chapter III):
=
−−
−
−−−
−−
E1
EI1
II
I1
II
I
I1
EI1
III1
II
I1
III1
II
uD+yRZ'
yRX'
u
β
D+ZRZ'XRZ'
ZRX'XRX'
ˆˆ
ˆ
where I and E refer to EVALI and EVALE, respectively, IX and IZ are incidence
matrices relating internal phenotypes in Iy to the vector of fixed effects Iβ and the vector
of random additive genetic effects Iu , respectively, 1IR − is the inverse of the residual
(co)variance matrix, and 1ED− is the inverse of prediction error (co)variance matrix
associated to the vector of external EBV (Eu ).
As explained in the previous Chapters, the vector of external EBV for all internal animals
and external sires is estimated as ( )
( )
=
−
EE
EE1
EEIEE u
uGGu
ˆ
ˆˆ where ( )EEu is the vector of
external EBV for the external sires obtained from EVAL E and
=
EEEI
IEII
GG
GGG is the
additive genetic (co)variance matrix.
Although the systems of equations related to the two Bayesian evaluations had the
same compact notation, the difference between both evaluations concerned the
approximation of 1ED− , and especially the computation of the approximation of the least
squares part of the LHS of EVALE, i.e., the computation of the block diagonal matrix Λ ,
needed for the approximation of 1ED− , that is ΛGD 11
E += −− . (4) For the Bayesian
evaluation based on the approximation of Quaas and Zhang (2006) (EVALQ), block
diagonals of Λ , hereafter noted QΛ , related to external animals are equal to Qi1
0Qi ∆G∆−
for i = 1, 2, …, N external animals where the matrix 0G is a matrix of additive genetic
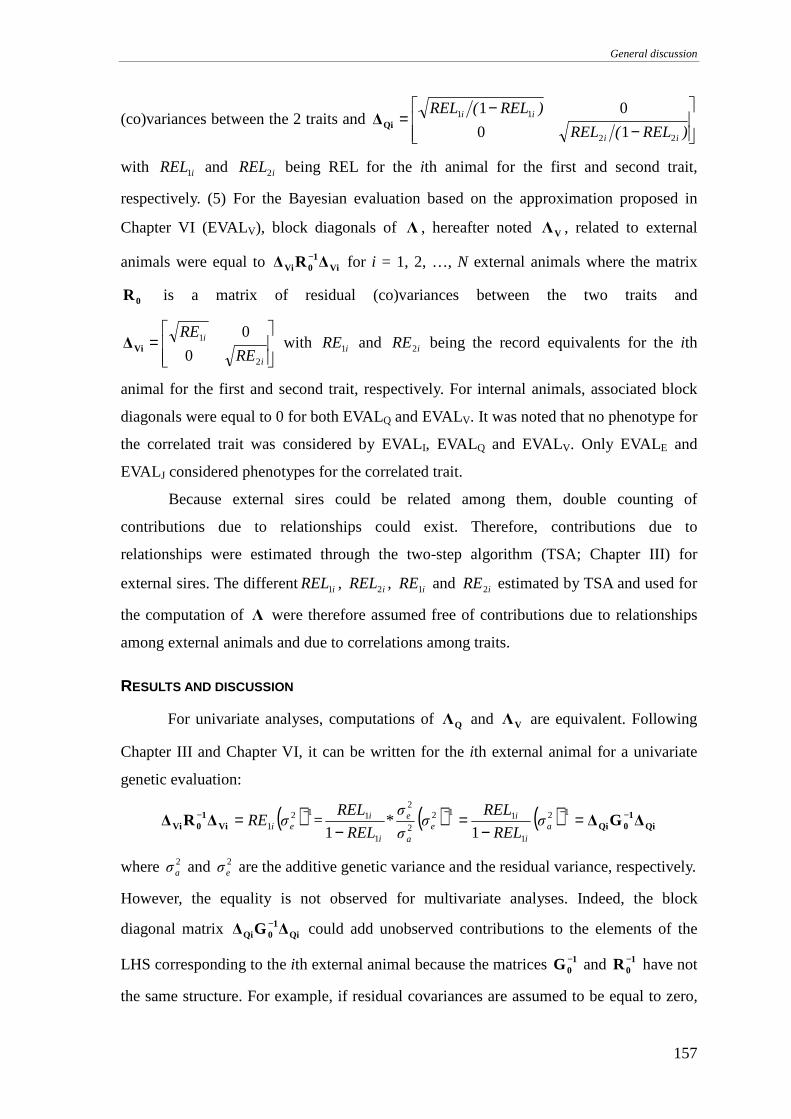
General discussion
157
(co)variances between the 2 traits and
−−
=)REL(REL
)REL(REL
ii
ii
22
11
10
01Qi∆
with iREL1 and iREL2 being REL for the ith animal for the first and second trait,
respectively. (5) For the Bayesian evaluation based on the approximation proposed in
Chapter VI (EVALV), block diagonals of Λ , hereafter noted VΛ , related to external
animals were equal to Vi1
0Vi ∆R∆− for i = 1, 2, …, N external animals where the matrix
0R is a matrix of residual (co)variances between the two traits and
=
i
i
RE
RE
2
1
0
0Vi∆ with iRE1 and iRE2 being the record equivalents for the ith
animal for the first and second trait, respectively. For internal animals, associated block
diagonals were equal to 0 for both EVALQ and EVALV. It was noted that no phenotype for
the correlated trait was considered by EVALI, EVALQ and EVALV. Only EVALE and
EVALJ considered phenotypes for the correlated trait.
Because external sires could be related among them, double counting of
contributions due to relationships could exist. Therefore, contributions due to
relationships were estimated through the two-step algorithm (TSA; Chapter III) for
external sires. The different iREL1 , iREL2 , iRE1 and iRE2 estimated by TSA and used for
the computation of Λ were therefore assumed free of contributions due to relationships
among external animals and due to correlations among traits.
RESULTS AND DISCUSSION
For univariate analyses, computations of QΛ and VΛ are equivalent. Following
Chapter III and Chapter VI, it can be written for the ith external animal for a univariate
genetic evaluation:
( ) ( ) ( ) Qi1
0QiVi1
0Vi ∆G∆∆R∆−−−−− =
−=
−= 12
1
1122
2
1
1121 11 a
i
ie
a
e
i
iei σ
REL
RELσ
σ
σ*
REL
REL=σRE
where 2aσ and 2
eσ are the additive genetic variance and the residual variance, respectively.
However, the equality is not observed for multivariate analyses. Indeed, the block
diagonal matrix Qi1
0Qi ∆G∆− could add unobserved contributions to the elements of the
LHS corresponding to the ith external animal because the matrices 10G − and 1
0R − have not
the same structure. For example, if residual covariances are assumed to be equal to zero,
Chapter VIII
158
the block diagonal matrix Qi1
0Qi ∆G∆− would add unobserved contributions to the elements
of the LHS corresponding to the ith external animal, especially through the genetic
correlations among traits. Consequences of additional unobserved contributions could
lead to overestimated REL and less accurate evaluations. Furthermore, zero residual
correlations could be a common situation in the context of integration of correlated
external information into a multivariate genetic evaluation because phenotypes used to
compute external information would not be observed on internal animals and, therefore,
would not be available for internal evaluations. Therefore, zero residual covariances were
assumed for the data simulations to illustrate such situations and consequences of the
computations of QΛ and VΛ on the Bayesian evaluations.
Regarding the simulated datasets, the 100 replicates included each 2240 animals
and all results presented hereafter concern only the trait of interest. The following
parameters were explored. Firstly, Spearman’s rank correlation coefficients (r) of EVALJ
with EVAL I, EVALQ or EVALV are presented for external sires (i.e., sires having
daughters with records for the correlated trait; Table VIII-1) and for females having
records for the trait of interest and sired by the external sires (hereafter called “female
progeny”; Table VIII-2). Secondly, the average REL computed from prediction error
variances obtained from the inverse of the LHS of EVAL J and EVALI, EVALQ and
EVALV (no corrections were performed for inbreeding) are reported for external sires
(Table VIII-1) and for female progeny (Table VIII-2). Finally, mean squared errors (MSE)
expressed as a percentage of average internal MSE for external sires (Table VIII-1) and
for female progeny (Table VIII-2) are also presented. The average internal MSE was
expressed on a base of 100. All reported parameters were the averages and the associated
standard deviations of the 100 replicates.
On average, 183.0 (±1.1) sires were associated with external information. Firstly,
whatever the computation of Λ or the considered rg, the integration of correlated external
information for external sires led to rankings that were more similar to the rankings of
EVALJ. For the external sires, r between EVALJ and EVALI varied from 0.987 for rg =
0.10 to 0.563 for rg = 0.90. The r of EVALJ with EVALQ or EVALV increased to at least
0.990 after integrating correlated external information. Furthermore, MSE also showed
that the integration of correlated external information led to better predictions of EVALJ
for the external sires, leading to MSE lower than 3.12% (±0.61), whatever rg (Table
VIII-1). Secondly, when comparing EVALQ and EVALV for the external sires, no
General discussion
159
difference can be observed between both evaluations on average across the 100 replicates
for rg = 0.10 or rg = 0.25. These results could be expected because rg, as well as the
absolute differences between rg and re, were low (Schaeffer, 1984). Differences were
observed only from rg = 0.50. The r of EVALJ with EVALQ or EVALV were similar
(≥0.990) from rg = 0.50 to rg = 0.90. Differences of rankings between EVALQ and EVALV
were lower than 0.008 points for rg = 0.90. Thereby, differences between EVALQ and
EVALV for external sires associated with external information were mostly observed
through MSE and REL. Regarding REL, REL for EVALQ were overestimated from
8.98% for rg = 0.50 to 76.21% for rg = 0.90 (Table VIII-1). REL for EVALV were
overestimated from 1.80% for rg = 0.50 to 2.74% for rg = 0.90 (Table VIII-1). As shown
in Table VIII-1, overestimation of REL for EVALQ increased with increasing rg, and
therefore, with the increase of the absolute differences between rg and re. Overestimation
of REL for EVALV could be attributed to a double counting of contributions due to
relationships since the TSA approximated these different contributions (Chapter III;
Chapter VI). However, double counting of contributions due to relationships cannot
explain the large overestimation observed for EVALQ. Contrariwise, this large
overestimation can be mainly attributed to unobserved contributions added by the product
Qi1
0Qi ∆G∆− for each ith external animal. For beef cattle and based on simulated data,
Zhang et al. (2002) studied the effects of integration of external information related to
three traits into an internal multivariate genetic evaluation evaluating the same three traits.
The Bayesian approach was the approach proposed by Quaas and Zhang (2006). External
information included sires’ EBV and their associated accuracies for the three traits
obtained from an external multivariate genetic evaluation. Variance components were
assumed to be equal among all evaluations. Unlike our simulations, residual covariances
were not equal to zero because the three traits could be observed internally, and also
externally, on the same animals. Nevertheless, results of this study also showed that
average accuracies associated with the Bayesian evaluation were higher than average
accuracies associated with a joint evaluation based on internal and external data, for the
three traits. Such an overestimation of accuracies showed that additional and unobserved
contributions were integrated into the internal multivariate genetic evaluation. In addition
to double counting of contributions due to relationships that was not taken into account in
the study of Zhang et al. (2002), the difference between the residual correlations among
the three traits (in the range between -0.08 and 0.23) and the genetic correlations (in the
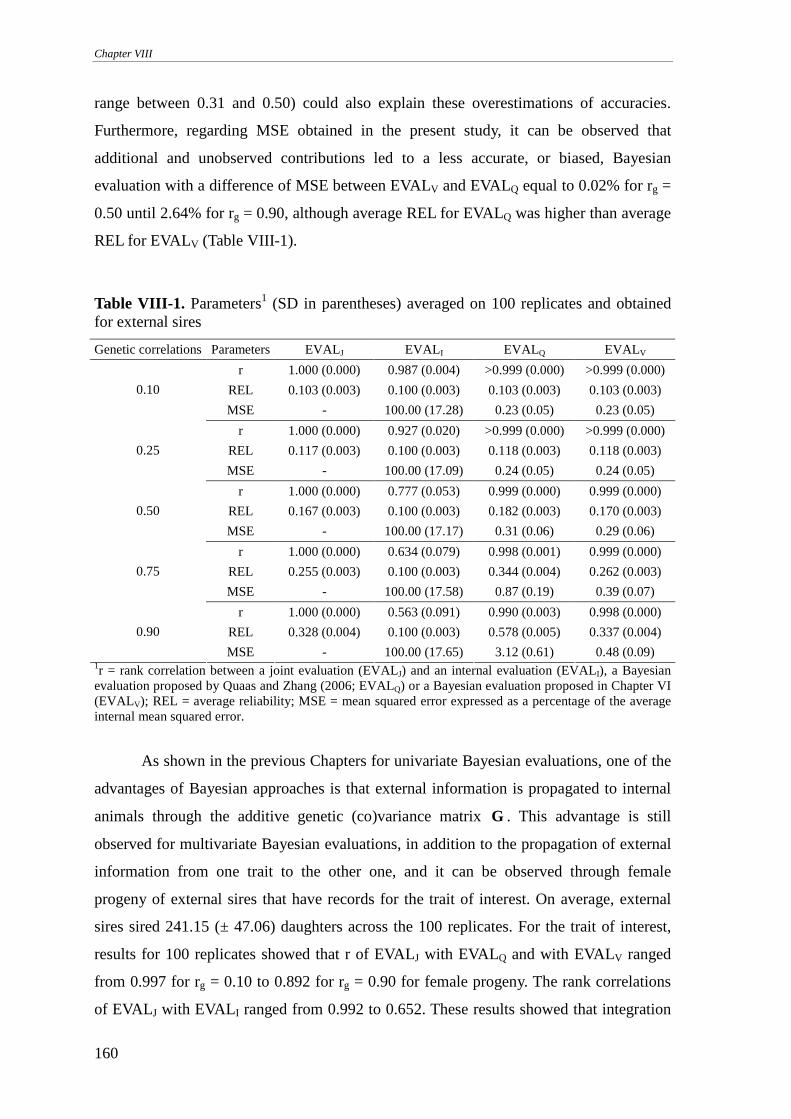
Chapter VIII
160
range between 0.31 and 0.50) could also explain these overestimations of accuracies.
Furthermore, regarding MSE obtained in the present study, it can be observed that
additional and unobserved contributions led to a less accurate, or biased, Bayesian
evaluation with a difference of MSE between EVALV and EVALQ equal to 0.02% for rg =
0.50 until 2.64% for rg = 0.90, although average REL for EVALQ was higher than average
REL for EVALV (Table VIII-1).
Table VIII-1. Parameters1 (SD in parentheses) averaged on 100 replicates and obtained for external sires
Genetic correlations Parameters EVAL J EVAL I EVALQ EVALV
r 1.000 (0.000) 0.987 (0.004) >0.999 (0.000) >0.999 (0.000)
REL 0.103 (0.003) 0.100 (0.003) 0.103 (0.003) 0.103 (0.003) 0.10
MSE - 100.00 (17.28) 0.23 (0.05) 0.23 (0.05)
r 1.000 (0.000) 0.927 (0.020) >0.999 (0.000) >0.999 (0.000)
REL 0.117 (0.003) 0.100 (0.003) 0.118 (0.003) 0.118 (0.003) 0.25
MSE - 100.00 (17.09) 0.24 (0.05) 0.24 (0.05)
r 1.000 (0.000) 0.777 (0.053) 0.999 (0.000) 0.999 (0.000)
REL 0.167 (0.003) 0.100 (0.003) 0.182 (0.003) 0.170 (0.003) 0.50
MSE - 100.00 (17.17) 0.31 (0.06) 0.29 (0.06)
r 1.000 (0.000) 0.634 (0.079) 0.998 (0.001) 0.999 (0.000)
REL 0.255 (0.003) 0.100 (0.003) 0.344 (0.004) 0.262 (0.003) 0.75
MSE - 100.00 (17.58) 0.87 (0.19) 0.39 (0.07)
r 1.000 (0.000) 0.563 (0.091) 0.990 (0.003) 0.998 (0.000)
REL 0.328 (0.004) 0.100 (0.003) 0.578 (0.005) 0.337 (0.004) 0.90
MSE - 100.00 (17.65) 3.12 (0.61) 0.48 (0.09) 1r = rank correlation between a joint evaluation (EVAL J) and an internal evaluation (EVALI), a Bayesian evaluation proposed by Quaas and Zhang (2006; EVALQ) or a Bayesian evaluation proposed in Chapter VI (EVALV); REL = average reliability; MSE = mean squared error expressed as a percentage of the average internal mean squared error.
As shown in the previous Chapters for univariate Bayesian evaluations, one of the
advantages of Bayesian approaches is that external information is propagated to internal
animals through the additive genetic (co)variance matrix G . This advantage is still
observed for multivariate Bayesian evaluations, in addition to the propagation of external
information from one trait to the other one, and it can be observed through female
progeny of external sires that have records for the trait of interest. On average, external
sires sired 241.15 (± 47.06) daughters across the 100 replicates. For the trait of interest,
results for 100 replicates showed that r of EVALJ with EVALQ and with EVALV ranged
from 0.997 for rg = 0.10 to 0.892 for rg = 0.90 for female progeny. The rank correlations
of EVALJ with EVALI ranged from 0.992 to 0.652. These results showed that integration
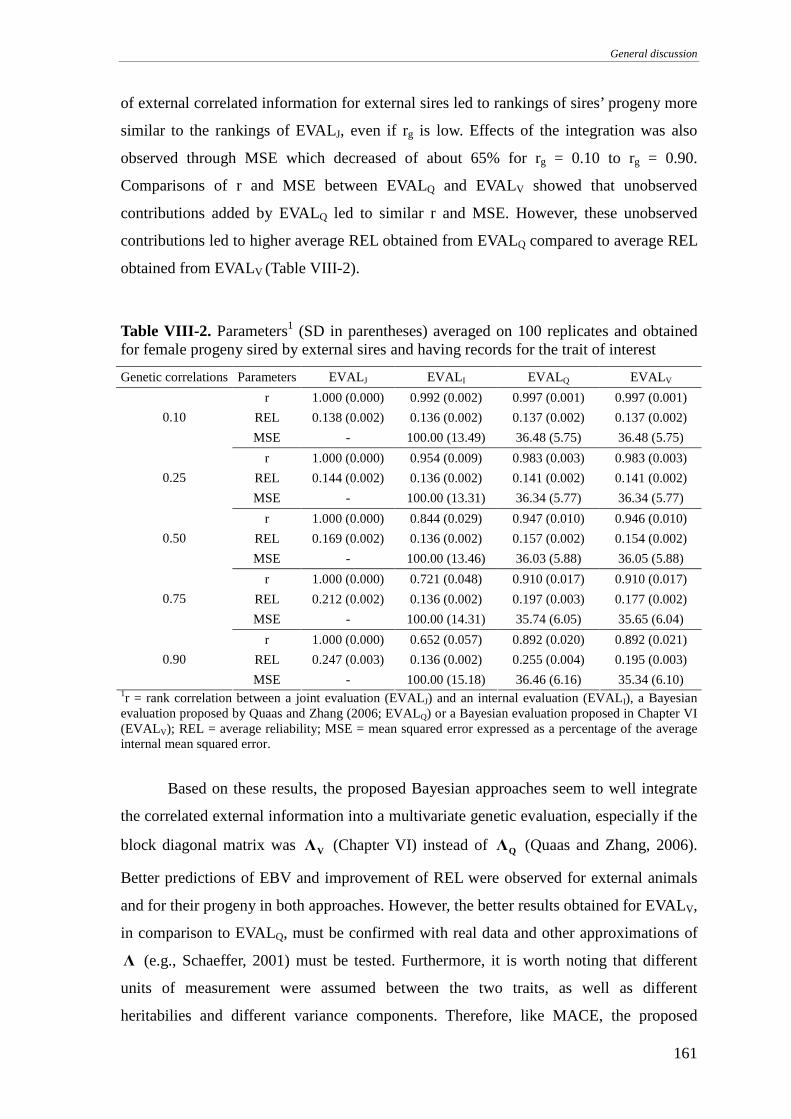
General discussion
161
of external correlated information for external sires led to rankings of sires’ progeny more
similar to the rankings of EVALJ, even if rg is low. Effects of the integration was also
observed through MSE which decreased of about 65% for rg = 0.10 to rg = 0.90.
Comparisons of r and MSE between EVALQ and EVALV showed that unobserved
contributions added by EVALQ led to similar r and MSE. However, these unobserved
contributions led to higher average REL obtained from EVALQ compared to average REL
obtained from EVALV (Table VIII-2).
Table VIII-2. Parameters1 (SD in parentheses) averaged on 100 replicates and obtained for female progeny sired by external sires and having records for the trait of interest
Genetic correlations Parameters EVAL J EVAL I EVALQ EVALV
r 1.000 (0.000) 0.992 (0.002) 0.997 (0.001) 0.997 (0.001)
REL 0.138 (0.002) 0.136 (0.002) 0.137 (0.002) 0.137 (0.002) 0.10
MSE - 100.00 (13.49) 36.48 (5.75) 36.48 (5.75)
r 1.000 (0.000) 0.954 (0.009) 0.983 (0.003) 0.983 (0.003)
REL 0.144 (0.002) 0.136 (0.002) 0.141 (0.002) 0.141 (0.002) 0.25
MSE - 100.00 (13.31) 36.34 (5.77) 36.34 (5.77)
r 1.000 (0.000) 0.844 (0.029) 0.947 (0.010) 0.946 (0.010)
REL 0.169 (0.002) 0.136 (0.002) 0.157 (0.002) 0.154 (0.002) 0.50
MSE - 100.00 (13.46) 36.03 (5.88) 36.05 (5.88)
r 1.000 (0.000) 0.721 (0.048) 0.910 (0.017) 0.910 (0.017)
REL 0.212 (0.002) 0.136 (0.002) 0.197 (0.003) 0.177 (0.002) 0.75
MSE - 100.00 (14.31) 35.74 (6.05) 35.65 (6.04)
r 1.000 (0.000) 0.652 (0.057) 0.892 (0.020) 0.892 (0.021)
REL 0.247 (0.003) 0.136 (0.002) 0.255 (0.004) 0.195 (0.003) 0.90
MSE - 100.00 (15.18) 36.46 (6.16) 35.34 (6.10) 1r = rank correlation between a joint evaluation (EVAL J) and an internal evaluation (EVALI), a Bayesian evaluation proposed by Quaas and Zhang (2006; EVALQ) or a Bayesian evaluation proposed in Chapter VI (EVALV); REL = average reliability; MSE = mean squared error expressed as a percentage of the average internal mean squared error.
Based on these results, the proposed Bayesian approaches seem to well integrate
the correlated external information into a multivariate genetic evaluation, especially if the
block diagonal matrix was VΛ (Chapter VI) instead of QΛ (Quaas and Zhang, 2006).
Better predictions of EBV and improvement of REL were observed for external animals
and for their progeny in both approaches. However, the better results obtained for EVALV,
in comparison to EVALQ, must be confirmed with real data and other approximations of
Λ (e.g., Schaeffer, 2001) must be tested. Furthermore, it is worth noting that different
units of measurement were assumed between the two traits, as well as different
heritabilies and different variance components. Therefore, like MACE, the proposed
Chapter VIII
162
Bayesian approach allows the combination of different sources of information associated
to different scales, different heritabilities and variance components, or different units of
measurement. Also, multi-trait Bayesian evaluations allow to consider genotype by
environment interactions and different trait definitions associated with the internal and
external evaluations. This latter characteristic permits to avoid conversion of external
information (e.g., expressed as indices or standardized estimates) to the expression of the
random animal effects considered by the internal evaluations. For example, in the context
of dairy cattle and for numerous countries, milk yield is a trait published as an average
yield on 305 days for three lactations while models are test-day models, possibly
considering random regressions for additive genetic effects (Gengler and Vanderick,
2008; Liu et al., 2014). In cases of random regression test-day models, Gengler and
Vanderick (2008) proposed to convert external indices which express average yields on
305 days for three lactations to (one of) the random regression additive genetic effects for
one or several lactations. Alternatively, external information can be considered as an
additional trait which has no observed phenotype internally and which is genetically
correlated to all the random regression additive genetic effects for all lactations, similarly
to the present study. Such a strategy could be considered for integrating MACE
information into single-step genomic evaluations.
Regarding the correlations, it was assumed that residual and genetic variances of
the traits as well as the residual and genetic correlations between external information and
internal data were known. However, in practice, variances and correlations are not known
and must be estimated. Therefore, approaches to estimate variances and correlations
associated with internal data and external information must be studied and developed.
Also, it is worth noting that, although a diagonal residual (co)variance matrix was
assumed for this simulation, off-diagonal elements different from zero could be
considered, for example, if phenotypes for the different traits were observed on the same
internal animals, as shown by Zhang et al. (2002).
CONCLUSIONS
Based on these results, the proposed Bayesian approaches integrated well
correlated external information into a multivariate genetic evaluation for simulated data,
especially if the block diagonal matrix was VΛ (Chapter VI) instead of QΛ (Quaas and
Zhang, 2006). Therefore, the proposed multivariate Bayesian approaches have the
potential to integrate correlated external information into a multivariate genetic evaluation
General discussion
163
allowing for different heritabilities, variance components, units of measurement or models
between external and internal traits. However, while the multivariate Bayesian approaches
seem promising, their implementation could be difficult due to availability or estimation
of correlations between external information and internal data. Hence, further research on
real data is needed to confirm these first results.
COMPARISON OF APPROACHES THAT COMBINE INTERNAL DATA AND EXTERNAL
INFORMATION
Three types of approaches allow to combine simultaneously internal data and
external information, i.e., EBV and associated REL:
(1) absorption based approaches (e.g., Henderson, 1975; Van Vleck, 1982; Bolgiano
et al., 1983),
(2) pseudo-records based approaches (e.g., Bonaiti and Boichard, 1995; VanRaden et
al., 2014), and
(3) Bayesian approaches (Chapter III, Chapter VI).
These approaches were described in the previous Chapters and some similarities among
some of them were already noted (Chapter II). Therefore, the aim of the present section is
to make pairwise comparisons of the three approaches to identify similarities and
differences among them. As reviewed in Chapter II, different implementations were
proposed for all the three approaches, and from those, the implementations proposed by
Bolgiano et al. (1983), by VanRaden et al. (2014) and in Chapter VI were chosen.
The context of the comparisons is an internal univariate evaluation integrating one
source of external information associated with external animals that have no observations
at the internal level. This assumption concerning external animals and internal records
was taken for simplification. Nevertheless, results of the comparison would be identical
without this assumption. Such a context can be observed, for example, for a dairy cattle
genetic evaluation for milk production traits that integrates external information for bulls
only (e.g., Bolgiano et al., 1983). Also, all animals are assumed to be partitioned between
internal animals (I) and external animals (E). Thereby, in this context, a system of
equations for the internal genetic evaluation combining internal data and external
information can be written for the three approaches with the same compact notation as
follows:
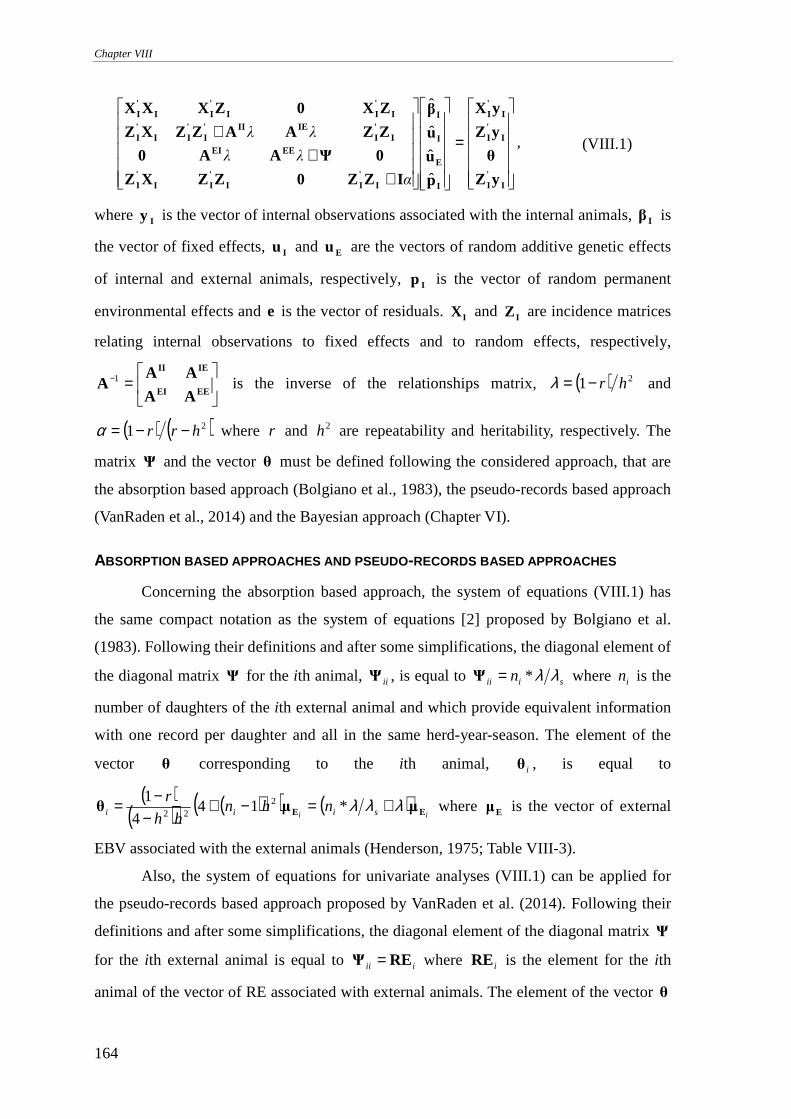
Chapter VIII
164
=
++
+
I'I
I'I
I'I
I
E
I
I
I'II
'II
'I
EEEII
'I
IEII'I
'II
'I
I'II
'II
'I
yZ
θ
yZ
yX
p
u
u
β
IZZ0ZZXZ
0ΨAA0
ZZAAZZXZ
ZX0ZXXX
ˆ
ˆ
ˆ
ˆ
α
λλ
λλ, (VIII.1)
where Iy is the vector of internal observations associated with the internal animals, Iβ is
the vector of fixed effects, Iu and Eu are the vectors of random additive genetic effects
of internal and external animals, respectively, Ip is the vector of random permanent
environmental effects and e is the vector of residuals. IX and IZ are incidence matrices
relating internal observations to fixed effects and to random effects, respectively,
=−
EEEI
IEII
AA
AAA 1 is the inverse of the relationships matrix, ( ) 21 hr−=λ and
( ) ( )21 hrr −−=α where r and 2h are repeatability and heritability, respectively. The
matrix Ψ and the vector θ must be defined following the considered approach, that are
the absorption based approach (Bolgiano et al., 1983), the pseudo-records based approach
(VanRaden et al., 2014) and the Bayesian approach (Chapter VI).
ABSORPTION BASED APPROACHES AND PSEUDO -RECORDS BASED APPROACHES
Concerning the absorption based approach, the system of equations (VIII.1) has
the same compact notation as the system of equations [2] proposed by Bolgiano et al.
(1983). Following their definitions and after some simplifications, the diagonal element of
the diagonal matrix Ψ for the ith animal, iiΨ , is equal to siii n λλ*=Ψ where in is the
number of daughters of the ith external animal and which provide equivalent information
with one record per daughter and all in the same herd-year-season. The element of the
vector θ corresponding to the ith animal, iθ , is equal to
( )( ) ( )( ) ( )
ii siii nhnhh
rEE µµθ λλλ +=−+
−−= *14
4
1 222
where Eµ is the vector of external
EBV associated with the external animals (Henderson, 1975; Table VIII-3).
Also, the system of equations for univariate analyses (VIII.1) can be applied for
the pseudo-records based approach proposed by VanRaden et al. (2014). Following their
definitions and after some simplifications, the diagonal element of the diagonal matrix Ψ
for the ith external animal is equal to iii REΨ = where iRE is the element for the ith
animal of the vector of RE associated with external animals. The element of the vector θ
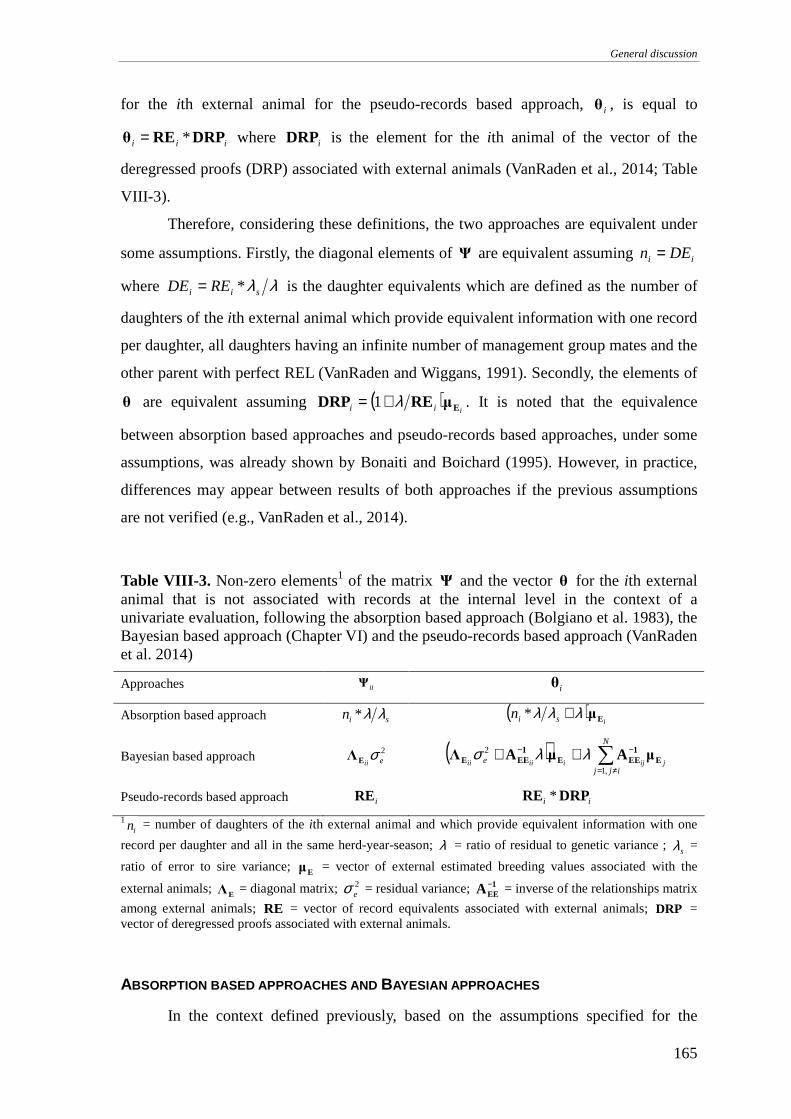
General discussion
165
for the ith external animal for the pseudo-records based approach, iθ , is equal to
iii DRPREθ *= where iDRP is the element for the ith animal of the vector of the
deregressed proofs (DRP) associated with external animals (VanRaden et al., 2014; Table
VIII-3).
Therefore, considering these definitions, the two approaches are equivalent under
some assumptions. Firstly, the diagonal elements of Ψ are equivalent assuming ii DEn =
where λλsii REDE *= is the daughter equivalents which are defined as the number of
daughters of the ith external animal which provide equivalent information with one record
per daughter, all daughters having an infinite number of management group mates and the
other parent with perfect REL (VanRaden and Wiggans, 1991). Secondly, the elements of
θ are equivalent assuming ( )iii EµREDRP λ+= 1 . It is noted that the equivalence
between absorption based approaches and pseudo-records based approaches, under some
assumptions, was already shown by Bonaiti and Boichard (1995). However, in practice,
differences may appear between results of both approaches if the previous assumptions
are not verified (e.g., VanRaden et al., 2014).
Table VIII-3. Non-zero elements1 of the matrix Ψ and the vector θ for the ith external animal that is not associated with records at the internal level in the context of a univariate evaluation, following the absorption based approach (Bolgiano et al. 1983), the Bayesian based approach (Chapter VI) and the pseudo-records based approach (VanRaden et al. 2014)
Approaches iiΨ iθ
Absorption based approach sin λλ* ( )isin Eµλλλ +*
Bayesian based approach 2eii
σEΛ ( ) ∑≠=
−− ++N
ijje jijiiiii
,1
2E
1EEE
1EEE µAµAΛ λλσ
Pseudo-records based approach iRE ii DRPRE *
1in = number of daughters of the ith external animal and which provide equivalent information with one
record per daughter and all in the same herd-year-season; λ = ratio of residual to genetic variance ; sλ =
ratio of error to sire variance; Eµ = vector of external estimated breeding values associated with the
external animals; EΛ = diagonal matrix; 2eσ = residual variance; 1
EEA − = inverse of the relationships matrix
among external animals; RE = vector of record equivalents associated with external animals; DRP = vector of deregressed proofs associated with external animals.
ABSORPTION BASED APPROACHES AND BAYESIAN APPROACHES
In the context defined previously, based on the assumptions specified for the
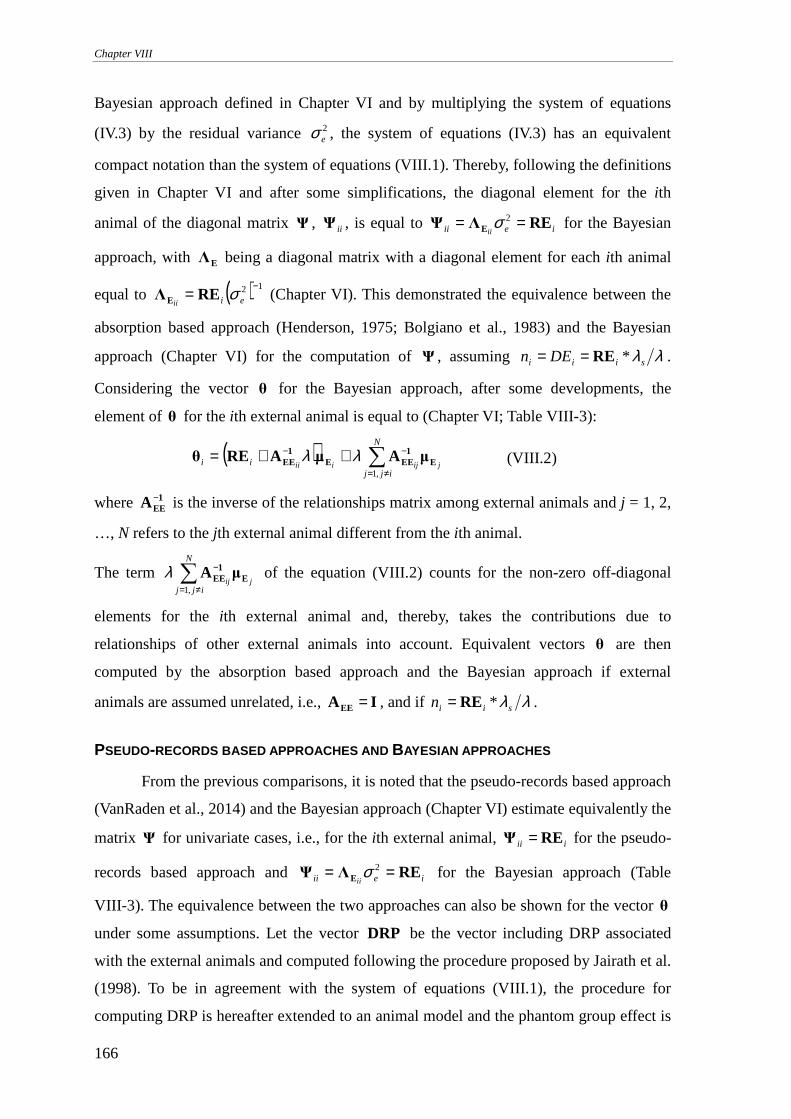
Chapter VIII
166
Bayesian approach defined in Chapter VI and by multiplying the system of equations
(IV.3) by the residual variance 2eσ , the system of equations (IV.3) has an equivalent
compact notation than the system of equations (VIII.1). Thereby, following the definitions
given in Chapter VI and after some simplifications, the diagonal element for the ith
animal of the diagonal matrix Ψ , iiΨ , is equal to ieii iiREΛΨ E == 2σ for the Bayesian
approach, with EΛ being a diagonal matrix with a diagonal element for each ith animal
equal to ( ) 12 −= eiiiσREΛE (Chapter VI). This demonstrated the equivalence between the
absorption based approach (Henderson, 1975; Bolgiano et al., 1983) and the Bayesian
approach (Chapter VI) for the computation of Ψ , assuming λλsiii DEn *RE== .
Considering the vector θ for the Bayesian approach, after some developments, the
element of θ for the ith external animal is equal to (Chapter VI; Table VIII-3):
( ) ∑≠=
−− ++=N
ijjii jijiii
,1E
1EEE
1EE µAµAREθ λλ (VIII.2)
where 1EEA − is the inverse of the relationships matrix among external animals and j = 1, 2,
…, N refers to the jth external animal different from the ith animal.
The term ∑≠=
−N
ijjjij
,1E
1EE µAλ of the equation (VIII.2) counts for the non-zero off-diagonal
elements for the ith external animal and, thereby, takes the contributions due to
relationships of other external animals into account. Equivalent vectors θ are then
computed by the absorption based approach and the Bayesian approach if external
animals are assumed unrelated, i.e., IA EE = , and if λλsiin *RE= .
PSEUDO-RECORDS BASED APPROACHES AND BAYESIAN APPROACHES
From the previous comparisons, it is noted that the pseudo-records based approach
(VanRaden et al., 2014) and the Bayesian approach (Chapter VI) estimate equivalently the
matrix Ψ for univariate cases, i.e., for the ith external animal, iii REΨ = for the pseudo-
records based approach and ieii iiREΛΨ E == 2σ for the Bayesian approach (Table
VIII-3). The equivalence between the two approaches can also be shown for the vector θ
under some assumptions. Let the vector DRP be the vector including DRP associated
with the external animals and computed following the procedure proposed by Jairath et al.
(1998). To be in agreement with the system of equations (VIII.1), the procedure for
computing DRP is hereafter extended to an animal model and the phantom group effect is
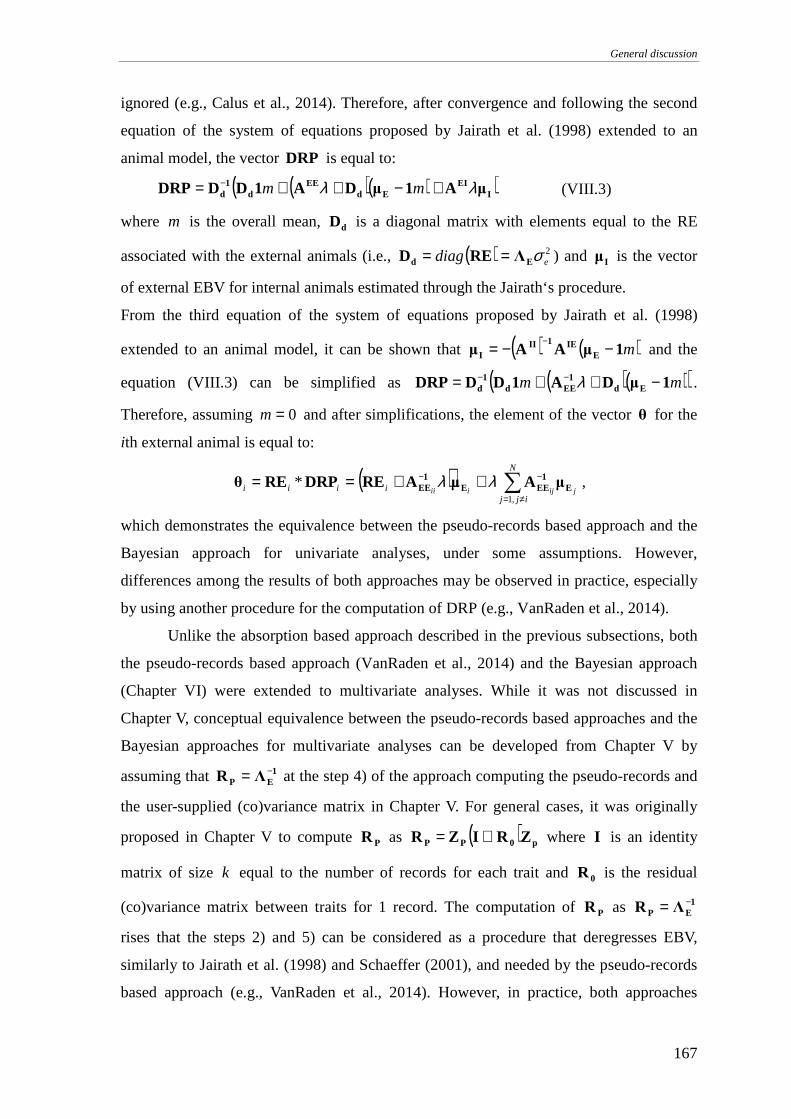
General discussion
167
ignored (e.g., Calus et al., 2014). Therefore, after convergence and following the second
equation of the system of equations proposed by Jairath et al. (1998) extended to an
animal model, the vector DRP is equal to:
( )( )( )IEI
EdEE
d1
d µA1µDA1DDDRP λλ +−++= − mm (VIII.3)
where m is the overall mean, dD is a diagonal matrix with elements equal to the RE
associated with the external animals (i.e., ( ) 2ediag σEd ΛRED == ) and Iµ is the vector
of external EBV for internal animals estimated through the Jairath‘s procedure.
From the third equation of the system of equations proposed by Jairath et al. (1998)
extended to an animal model, it can be shown that ( ) ( )m1µAAµ EIE1II
I −−= − and the
equation (VIII.3) can be simplified as ( )( )( )mm 1µDA1DDDRP Ed1
EEd1
d −++= −− λ .
Therefore, assuming 0=m and after simplifications, the element of the vector θ for the
ith external animal is equal to:
( ) ∑≠=
−− ++==N
ijjiiii jijiii
,1
* E1
EEE1
EE µAµAREDRPREθ λλ ,
which demonstrates the equivalence between the pseudo-records based approach and the
Bayesian approach for univariate analyses, under some assumptions. However,
differences among the results of both approaches may be observed in practice, especially
by using another procedure for the computation of DRP (e.g., VanRaden et al., 2014).
Unlike the absorption based approach described in the previous subsections, both
the pseudo-records based approach (VanRaden et al., 2014) and the Bayesian approach
(Chapter VI) were extended to multivariate analyses. While it was not discussed in
Chapter V, conceptual equivalence between the pseudo-records based approaches and the
Bayesian approaches for multivariate analyses can be developed from Chapter V by
assuming that 1EP ΛR −= at the step 4) of the approach computing the pseudo-records and
the user-supplied (co)variance matrix in Chapter V. For general cases, it was originally
proposed in Chapter V to compute PR as ( ) p0PP ZRIZR ⊗= where I is an identity
matrix of size k equal to the number of records for each trait and 0R is the residual
(co)variance matrix between traits for 1 record. The computation of PR as 1EP ΛR −=
rises that the steps 2) and 5) can be considered as a procedure that deregresses EBV,
similarly to Jairath et al. (1998) and Schaeffer (2001), and needed by the pseudo-records
based approach (e.g., VanRaden et al., 2014). However, in practice, both approaches
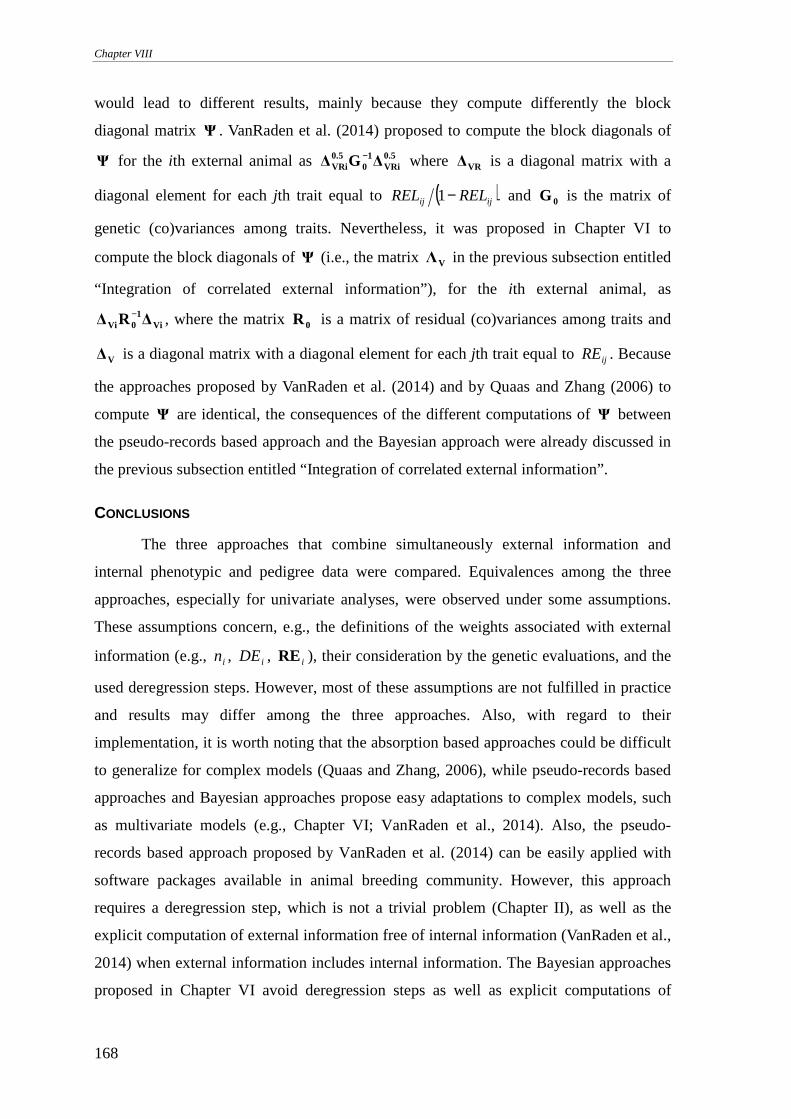
Chapter VIII
168
would lead to different results, mainly because they compute differently the block
diagonal matrix Ψ . VanRaden et al. (2014) proposed to compute the block diagonals of
Ψ for the ith external animal as 0.5VRi
10
0.5VRi ∆G∆
− where VR∆ is a diagonal matrix with a
diagonal element for each jth trait equal to ( )ijij RELREL −1 and 0G is the matrix of
genetic (co)variances among traits. Nevertheless, it was proposed in Chapter VI to
compute the block diagonals of Ψ (i.e., the matrix VΛ in the previous subsection entitled
“Integration of correlated external information”), for the ith external animal, as
Vi1
0Vi ∆R∆− , where the matrix 0R is a matrix of residual (co)variances among traits and
V∆ is a diagonal matrix with a diagonal element for each jth trait equal to ijRE . Because
the approaches proposed by VanRaden et al. (2014) and by Quaas and Zhang (2006) to
compute Ψ are identical, the consequences of the different computations of Ψ between
the pseudo-records based approach and the Bayesian approach were already discussed in
the previous subsection entitled “Integration of correlated external information”.
CONCLUSIONS
The three approaches that combine simultaneously external information and
internal phenotypic and pedigree data were compared. Equivalences among the three
approaches, especially for univariate analyses, were observed under some assumptions.
These assumptions concern, e.g., the definitions of the weights associated with external
information (e.g., in , iDE , iRE ), their consideration by the genetic evaluations, and the
used deregression steps. However, most of these assumptions are not fulfilled in practice
and results may differ among the three approaches. Also, with regard to their
implementation, it is worth noting that the absorption based approaches could be difficult
to generalize for complex models (Quaas and Zhang, 2006), while pseudo-records based
approaches and Bayesian approaches propose easy adaptations to complex models, such
as multivariate models (e.g., Chapter VI; VanRaden et al., 2014). Also, the pseudo-
records based approach proposed by VanRaden et al. (2014) can be easily applied with
software packages available in animal breeding community. However, this approach
requires a deregression step, which is not a trivial problem (Chapter II), as well as the
explicit computation of external information free of internal information (VanRaden et al.,
2014) when external information includes internal information. The Bayesian approaches
proposed in Chapter VI avoid deregression steps as well as explicit computations of
General discussion
169
external information free of internal information. Computational burden is then simplified
and risks of potential computational errors propagated through the different steps
performed before the evaluations are avoided. Also, Chapter V proposed a method to
perform the Bayesian approaches using currently available software packages.
REFERENCES
Bolgiano, D.C., R.L. Quaas, and L.D. Van Vleck. 1983. Variances of prediction errors for
differences of estimated genetic values of cows in the same and in different herds.
J. Dairy Sci. 66:1370–1376.
Bonaiti, B., and D. Boichard. 1995. Accounting for foreign information in genetic
evaluation. Interbull Bull. 11:4pp.
Calus, M., G. Schopen, and R. Veerkamp. 2014. Simultaneous deregression of cow and
bull breeding values. Interbull Bull. 48:63–67.
Gengler, N., and S. Vanderick. 2008. Bayesian inclusion of external evaluations into a
national evaluation system: Application to milk production traits. Interbull Bull.
38:70–74.
Henderson, C.R. 1975. Use of all relatives in intraherd prediction of breeding values and
producing abilities. J. Dairy Sci. 58:1910–1916.
Jairath, L., J.C.M. Dekkers, L.R. Schaeffer, Z. Liu, E.B. Burnside, and B. Kolstad. 1998.
Genetic evaluation for herd life in Canada. J. Dairy Sci. 81:550–562.
Legarra, A., J.K. Bertrand, T. Strabel, R.L. Sapp, J.P. Sanchez, and I. Misztal. 2007.
Multi-breed genetic evaluation in a Gelbvieh population. J. Anim. Breed. Genet.
124:286–295.
Liu, Z., M.E. Goddard, F. Reinhardt, and R. Reents. 2014. A single-step genomic model
with direct estimation of marker effects. J. Dairy Sci. 97:5833–5850.
Mrode, R.A. 2005. Linear models for the prediction of animal breeding values. 2nd ed.
CABI Publishing, Wallingford, UK.
Quaas, R.L., and Z. Zhang. 2006. Multiple-breed genetic evaluation in the US beef cattle
context: Methodology. CD–ROM Comm. 24–12 in Proceedings of the 8th World
Congress on Genetics Applied to Livestock Production, Belo Horizonte, Brazil.
Sargolzaei, M., and F.S. Schenkel. 2009. QMSim: a large-scale genome simulator for
livestock. Bioinformatics 25:680–681.
Schaeffer, L.R. 1984. Sire and cow evaluation under multiple trait models. J. Dairy Sci.
67:1567–1580.
Chapter VIII
170
Schaeffer, L.R. 1994. Multiple-country comparison of dairy sires. J. Dairy Sci. 77:2671–
2678.
Schaeffer, L.R. 2001. Multiple trait international bull comparisons. Livest. Prod. Sci.
69:145–153.
VanRaden, P.M., M.E. Tooker, J.R. Wright, C. Sun, and J.L. Hutchison. 2014.
Comparison of single-trait to multi-trait national evaluations for yield, health, and
fertility. J. Dairy Sci. 97:7952-7962.
VanRaden, P.M., and G.R. Wiggans. 1991. Derivation, calculation, and use of national
animal model information. J. Dairy Sci. 74:2737–2746.
Van Vleck, L.D. 1982. Derivation of Henderson’s method of incorporating artificial
insemination sire evaluations into intraherd prediction of breeding values. J. Dairy
Sci. 65:284–286.
Zhang, Z.W., R.L. Quaas, and E.J. Pollak. 2002. Simulation study on the effects of
incorporating external genetic evaluation results. CD–ROM Comm. 20–14 in
Proceedings of the 7th World Congress on Genetics Applied to Livestock
Production, Montpellier, France.
Chapter IX. I MPLICATIONS , FUTURE RESEARCH TOPICS AND
GENERAL CONCLUSION
The last Chapter of this thesis presents implications of the
research presented in the previous Chapters and introduces four
topics for future research. A general conclusion closes this
Chapter.

Implications, future research topics and general conclusion
173
IMPLICATIONS
Research undertaken during this thesis led to the development of a Bayesian
approach that integrates several sources of external information into a genetic or a single-
step genomic evaluation. This Bayesian approach can be easily adapted to complex
models and considers double counting of contributions due to relationships and due to
records. Therefore, these results allowed for different advances in genetic and genomic
evaluations.
Another implication of the present thesis is the development of a genomic
evaluation system for Holstein cattle in the Walloon Region of Belgium. The Walloon
genomic evaluation presents several advanced features and combines simultaneously all
available genotypes, pedigree, Walloon and multiple across country evaluation (MACE)
information (i.e., estimated breeding values (EBV) and reliabilities (REL) provided by
Walloon evaluations and MACE) for the milk, fat and protein yields, as well as for other
traits, like somatic cell score. Contributions considered by both Walloon evaluations and
MACE are also considered by the Walloon genomic evaluation in order to avoid their
double counting. The development of the Walloon genomic evaluation system allowed the
Walloon Region of Belgium to participate to the international genomic evaluations
performed by International Bull Service (Interbull, Uppsala, Sweden).
FUTURE RESEARCH TOPICS
Several important research topics were identified during this thesis and shall be
explored in the future. These topics address different issues:
ON THE ESTIMATION OF CONTRIBUTIONS DUE TO RELATIONSHIPS
An iterative algorithm that estimates the contributions due to relationships
included in the external information (so-called two-step algorithm; TSA) was proposed in
Chapter III. Several applications on different simulated and real data (Chapter III, Chapter
IV, Chapter VI and Chapter VII) showed that the TSA performed well. However, an issue
of the TSA is that each iteration needs the inversion of a matrix that is a function of the
relationship matrix that accounts for the relationships between external animals and their
ancestors. For the Walloon genomic evaluations, a Fortran implementation of the TSA
using the multithreaded Intel® Math Kernel Library (Intel® MKL) allows the estimation
of contributions due to relationships for around 21 000 external animals using 12 threads
Chapter IX
174
and around 50 GB of RAM during less than 5 hours on a cluster made of 26 computing
nodes, each with two Intel Sandy Bridge 8-cores E5-2670 processors at 2.6 GHz and with
128 GB of RAM. However, such an inversion could lead to a difficult implementation of
the TSA if a higher number of animals is associated with external information or if an
adequate cluster is not available. Because the TSA is a fixed point algorithm, an
acceleration procedure could be used to accelerate the convergence (Brezinski and
Chehab, 1998) and to avoid some iterations and, therefore, also some matrix inversions.
Although tested only on simulated data with the software package GNU Octave (Eaton et
al., 2011), the implementation of the method of Lemaréchal (Brezinski and Chehab, 1998)
in the TSA allowed for a faster convergence. However, such acceleration procedures do
not solve the issue of the matrix inversion when a high number of animals are associated
to external information. Therefore, an algorithm that avoids matrix inversions and that
estimates the diagonal elements of an unknown matrix D involved in the following
equation should be developed:
( ) PDG11 =+ −−
where 1G − is the inverse of a known positive-definite symmetric matrix, D is an
unknown diagonal matrix (for the first step of the TSA) or an unknown positive-definite
symmetric matrix (for the second step of the TSA) and P is a positive-definite symmetric
matrix for which only the diagonal elements are known.
Finally, pending the development of an algorithm estimating the diagonal elements
of D without matrix inversions, the results from the simulation in Chapter III as well as
from the Walloon example in Chapter VI suggest that contributions due to relationships
could be ignored. However, it was worth noting that effects of double counting of
contributions due to relationships should be tested before ignoring them.
ON THE INTEGRATION OF CORRELATED EXTERNAL INFORMATION
A simulation study on the integration of correlated external information into a
multivariate genetic evaluation was proposed in Chapter VIII. These first results showed
that the proposed Bayesian approaches integrated well correlated external information,
based on rank correlations, mean squared errors and average REL. It was also shown that
the approximation of the least squares part of the left hand side (LHS) of the external
evaluation proposed by Quaas and Zhang (2006) led to overestimated REL because
unobserved contributions were considered. However, all these observations were based on
Implications, future research topics and general conclusion
175
a simulation study and may be influenced by the different assumptions, as the
consideration of known (co)variances or low average REL. Indeed, residual and genetic
(co)variances among traits are usually unknown and covariances among EBV increase
from residual to approach genetic covariances as REL increase (VanRaden et al., 2014).
Therefore, studies on real data should be performed to confirm these first results and other
approximations of the least squares part of the LHS of the external evaluation (e.g.,
Schaeffer, 2001) should be tested.
ON THE ESTIMATION OF CORRELATIONS BETWEEN EXTERNAL INFORMATION A ND
INTERNAL DATA
One strong assumption was taken in Chapter VIII: all variance components were
assumed to be known. In practice, this is usually not the case and (co)variances must be
estimated. For linear mixed models that assume expectations equal to zero for random
effects, Gibbs sampling (e.g., Sorensen and Gianola, 2002) and restricted maximum
likelihood (Patterson and Thompson, 1971) are the most popular methods for the
estimation of variance components. However, current programs do not allow to estimate
of variance components for linear mixed models that assume expectations different from
zero for random effects. Therefore, approaches should be developed to estimate variance
components for (multivariate) mixed models considering both internal data and external
information. Because the equivalence between pseudo-records based approaches and
Bayesian approaches was shown, at least under some assumptions (Chapter VIII), an
approach could consist of estimating the variance components for a mixed model
including external information as weighted pseudo-records. Another approach could
consist of estimating variance components with current software modified to consider
expectations different form zero and non-conventional (co)variance matrices (e.g., the
sum of (co)variance matrices (e.g., Chapter III, Chapter VI) instead of the conventional
genetic (co)variance matrix) associated with random effects.
ON THE INTEGRATION OF GENOMIC INFORMATION
With the development of genomic selection in many species and the increase of
available SNP data and information derived from this data source (e.g., direct genomic
values (DGV) and their associated REL) approaches and algorithms that combine sources
of phenotypic, genealogical and genomic data and information are needed. In this context,
Chapter VII proposed a Bayesian approach, based on the single-step genomic evaluation

Chapter IX
176
(Aguilar et al., 2010; Christensen and Lund, 2010) to combine genomic data with internal
and external information. However, this thesis does not propose approaches to integrate
external genomic information, e.g., DGV and associated REL, into an internal genetic
evaluation, while it was previously suggested and studied in a Bayesian context (Gengler
and Vanderick, 2008; Hyde et al., 2013). Such situation may arise in different emerging
situations as, for example, through the wish to integrate externally generated DGV for
novel phenotypes (e.g., dry matter intake, methane). However, several issues should be
further explored, such as the double counting of the same information used in both the
genetic evaluation and in the estimation of genomic prediction equations, the scaling of
DGV, or the consideration that DGV follow, or does not follow, the same distribution as
internal EBV (Mäntysaari and Strandén, 2010; Hyde et al., 2013).
GENERAL CONCLUSION
The aim of this thesis was to develop algorithms to combine phenotypic,
genealogical and genomic data as well as information originating from diverse sources
and to test them on simulated and real data. After a review of the various proposed
approaches to combine different sources of information, it was chosen to focus on the
Bayesian approaches, based on a Bayesian view of the linear mixed models. Research
presented in this thesis solved different issues to finally develop equations for
(multivariate) genetic and single-step genomic evaluations that integrate and blend
simultaneously several sources of information and that avoid double counting of
contributions due to relationships and due to records. Computational burden was also
considered during this research. The performance of the developed algorithms and
equations were evaluated using simulated and real datasets. The different results showed
that:
- the developed equations integrated and blended several sources of information in a
proper way into a genetic or a single-step genomic evaluation,
- more reliable EBV were obtained for external animals after integration of external
information,
- relatives of external animals benefited from integrated external information, also
leading to more reliable EBV, because all available external sources of
information were correctly propagated,
- double counting of contributions due to relationships and due to records were
(almost) avoided, and
Implications, future research topics and general conclusion
177
- correlated external information was properly integrated following the approach
proposed to approximate the prediction error (co)variance matrix associated with
multivariate EBV.
The developed equations were applied to develop a genomic evaluation system for
Holstein cattle in the Walloon Region of Belgium that combines simultaneously all
available genotypes, pedigree, Walloon and MACE information (i.e., EBV and REL
provided by Walloon evaluations and MACE) for the production traits, as well as for
other traits, like somatic cell scores. However, in spite of these developments, further
research should be carried out, especially, on the estimation of contributions due to
relationships, on the integration of correlated external information, on the estimation of
correlations between external information and internal data, and on the integration of
genomic information, such as DGV.
REFERENCES
Aguilar, I., I. Misztal, D.L. Johnson, A. Legarra, S. Tsuruta, and T.J. Lawlor. 2010. Hot
topic: A unified approach to utilize phenotypic, full pedigree, and genomic
information for genetic evaluation of Holstein final score. J. Dairy Sci. 93:743–
752.
Brezinski, C., and J. Chehab. 1998. Nonlinear hybrid procedures and fixed point
iterations. Numer. Funct. Anal. Optim. 19:465–487.
Christensen, O.F., and M.S. Lund. 2010. Genomic prediction when some animals are not
genotyped. Genet. Sel. Evol. 42:2.
Eaton, J.W., D. Bateman, S. Hauberg, and R. Wehbring. 2011. GNU Octave. A high-level
interactive language for numerical computations. 3rd ed. Free Software
Foundation, Inc., Boston, MA.
Gengler, N., and S. Vanderick. 2008. Bayesian inclusion of external evaluations into a
national evaluation system: Application to milk production traits. Interbull Bull.
38:70–74.
Hyde, L.R., W.R. Shafer, S.C. McGuire, M. Saatchi, and D.J. Garrick. 2013. ASA
experience with incorporating genomics into genetic evaluation. Pages 10–14 in
Proceedings of the 10th Genetic Prediction Workshop. Beef Improvement
Federation, Kansas City, MO.
Mäntysaari, E.A., and I. Strandén. 2010. Use of bivariate EBV-DGV model to combine
genomic and conventional breeding value evaluations. CD–ROM Comm. 353 in
Chapter IX
178
Proceedings of the 9th World Congress on Genetics Applied to Livestock
Production, Leipzig, Germany.
Patterson, H.D., and R. Thompson. 1971. Recovery of inter-block information when
block sizes are unequal. Biometrika 58:545–554.
Quaas, R.L., and Z. Zhang. 2006. Multiple-breed genetic evaluation in the US beef cattle
context: Methodology. CD–ROM Comm. 24–12 in Proceedings of the 8th World
Congress on Genetics Applied to Livestock Production, Belo Horizonte, Brazil.
Schaeffer, L.R. 2001. Multiple trait international bull comparisons. Livest. Prod. Sci.
69:145–153.
Sorensen, D., and D. Gianola. 2002. Likelihood, Bayesian and MCMC methods in
quantitative genetics. Springer-Verlag, New York, NY.
VanRaden, P.M., M.E. Tooker, J.R. Wright, C. Sun, and J.L. Hutchison. 2014.
Comparison of single-trait to multi-trait national evaluations for yield, health, and
fertility. J. Dairy Sci. 97:7952–7962.
179
LIST OF ABBREVIATIONS
AI Artificial insemination
BLUE Best Linear Unbiased Estimate
BLUP Best Linear Unbiased Prediction
DE Daughter equivalent
DGV Direct genomic value
DNA Deoxyribonucleic acid
DRP Deregressed proof
DYD Daughter yield deviation
EBV Estimated breeding value
EDC Effective daughter contribution
EGM Estimate of genetic merit for animals (e.g., EBV) or for what they transmit
to their progeny (e.g., PTA)
FBE First version of modified Bayesian evaluation
GEBV Genomically enhanced breeding value
GMACE Genomic multiple across country evaluation
h2 Heritability
LBE Legarra-type Bayesian evaluation
LHS Left hand side
MACE Multiple across country evaluation
MB Mean biais
MCE Multiple-country evaluation
MME Mixed model equations
MSE Mean squared error
MSEP Mean squared errors of prediction
MT-MACE Multiple-trait multiple across country evaluation
MVN Multivariate normal
PA Parent average
PC Progeny contribution
PEV Prediction error variance
PL Productive life
PTA Predicted transmitting ability
List of abbreviations
180
QBE Quaas-type Bayesian evaluation
RE Records equivalent
re Residual correlation between traits
REL Reliability
rg Genetic correlation between traits
RHS Right hand side
y:yr ˆ Pearson correlation coefficient between observed and estimated
performances
SBE Second version of modified Bayesian evaluation
SD Standard deviation
SI Selection index
SNP Single nucleotide polymorphism
ssGBayes Single-step Genomic Bayesian Prediction
ssGBLUP Single-step genomic BLUP
TSA Two-step algorithm
181
LIST OF TABLES
Table III-1. Main differences concerning the prior mean and variance among Legarra-type
Bayesian evaluation, Quaas-type Bayesian evaluation, first version of modified
Bayesian evaluation, and second version of modified Bayesian evaluation ............. 44
Table III-2. Rank correlations (r) and mean squared errors (MSE) expressed as a
percentage of the internal MSE between joint evaluation and an external evaluation,
an internal evaluation, and 4 different Bayesian procedures, regression coefficients
(a), and coefficients of determination (R2) of the regression of the joint evaluation on
the 6 other evaluations1.............................................................................................. 51
Table III-3. Rank correlations (r) and mean squared errors (MSE) expressed as a
percentage of the internal MSE between joint evaluation, and an internal evaluation
and 4 different Bayesian procedures, and regression coefficients (a), and coefficients
of determination (R2) of the regression of the joint evaluation on the 6 other
evaluations1................................................................................................................ 52
Table IV-1. Performed genetic evaluations, estimated breeding values (EBV) and
reliabilities (REL) ...................................................................................................... 68
Table IV-2. Coefficients of determination (R2) of the conversion equations and Pearson
correlation coefficients (r) between internal and external estimated breeding values.
Means and standard deviations (SD) of nonzero external reliabilities (RELE), non-
zero reliabilities of a converted estimated breeding value (RELc) and non-zero record
equivalents free of contributions due to relationships (RE) as well as the number of
foreign stallions (Nb) associated with non-zero RELE, RELc and RE ...................... 72
Table IV-3. Spearman rank correlation coefficients between breeding values (EBV)
estimated by the Belgian genetic evaluation based on the complete data I (EBVAI)
and EBV estimated by a Bayesian1 evaluation based on data I (EBVBI), Spearman
rank correlation coefficients between EBVAI and external EBV (EBVE), and
Spearman rank correlation coefficients between EBVBI and EBVE for all horses, for
the 100 best stallions, for the French stallions and for the Dutch stallions ............... 74
Table IV-4. Number of performances (Nb) associated with the Belgian trait for all horses,
the 100 best stallions, the French stallions and the Dutch stallions. Mean bias (MB),
mean squared errors of prediction (MSEP) and Pearson correlation coefficients
between observed and estimated performances (y:yr ) for the evaluation AI1 and the
List of tables
182
evaluation BI2 applying all the performances, performances associated with the 100
best stallions, French performances and Dutch performances for the Belgian trait.
MB and MSEP are expressed as a percentage of the average performance of all the
performances and performances associated with the 100 best stallions, the French
and Dutch stallions, respectively................................................................................75
Table IV-5. Pearson correlation coefficients (rII) and variances of differences (VARII)
between EBVAI1 and EBVAII , and EBVBI and EBVBII, and Pearson correlation
coefficients (rIII) and variances of differences (VARIII) between EBVAI and EBVAIII ,
and EBVBI and EBVBIII for all horses, for the 100 best stallions, for the French
stallions and the Dutch stallions.................................................................................76
Table IV-6. Means and standard deviations (SD) of reliabilities (REL)AI1, RELAII , RELAIII ,
RELBI, RELBII and RELBIII for all horses, for the French stallions and for the Dutch
stallions.......................................................................................................................78
Table V-1. Design and solutions for example 1 .................................................................90
Table VI-1. Concepts related to the terminology of internal and external animals and
information ...............................................................................................................101
Table VI-2. Genetic evaluations performed for the simulated example...........................106
Table VI-3. Bayesian evaluations performed for the Walloon example...........................110
Table VI-4. Average (SD in parentheses) of parameters obtained for the simulated
example over 100 replicates.....................................................................................112
Table VI-5. Average reliabilities (REL; SD in parentheses) associated with Walloon
estimated breeding values for internally used and unused sires...............................115
Table VI-6. Parameters obtained for the Walloon example for 1212 internally used sires
..................................................................................................................................116
Table VI-7. Parameters obtained for the Walloon example for 631 internally unused sires
..................................................................................................................................119
Table VI-8. Parameters for internal animals with a Walloon reliability less than 0.50 and
sired by internally used sires ....................................................................................120
Table VI-9. Parameters for internal animals with a Walloon reliability between 0.50 and
0.74 and sired by internally used sires .....................................................................121
Table VI-10. Parameters for internal animals with a Walloon reliability greater than 0.74
and sired by internally used sires .............................................................................121
Table VII-1. Used genetic parameters, local and foreign information available for the
genomic evaluation for the seven reported traits .....................................................141
List of tables
183
Table VII-2. Average reliabilities (REL; SD in parentheses) associated to EBVW, GEBVW
and GEBVW+M-Wc for genotyped bulls for the seven studied traits ......................... 146
Table VII-3. Average reliabilities (REL; SD in parentheses) associated to EBVW, GEBVW
and GEBVW+M for genotyped animals without MACE results and sired by genotyped
bulls with MACE result for the studied traits.......................................................... 147
Table VII-4. Average reliabilities (REL; SD in parentheses) associated with GEBVW+M-
Wc1 for genotyped bulls without external phenotype information (neither local EBV
neither MACE EBV), sired by genotyped bulls with MACE results for the studied
trait........................................................................................................................... 148
Table VIII-1. Parameters1 (SD in parentheses) averaged on 100 replicates and obtained
for external sires ...................................................................................................... 160
Table VIII-2. Parameters1 (SD in parentheses) averaged on 100 replicates and obtained
for female progeny sired by external sires and having records for the trait of interest
................................................................................................................................. 161
Table VIII-3. Non-zero elements1 of the matrix Ψ and the vector θ for the ith external
animal that is not associated with records at the internal level in the context of a
univariate evaluation, following the absorption based approach (Bolgiano et al.
1983), the Bayesian based approach (Chapter VI) and the pseudo-records based
approach (VanRaden et al. 2014)............................................................................. 165

185
LIST OF FIGURES
Figure III-1. Examples from one randomly chosen simulation showing EBV of the 50
external animals between joint evaluation and external and internal evaluations,
Legarra-type Bayesian evaluation (LBE; i.e., a Bayesian evaluation following
Legarra et al. (2007) and using external EBV and prediction error variances (PEV)
associated with external sires obtained from the external evaluation), Quaas-type
Bayesian evaluation (QBE; i.e., a Bayesian evaluation following Quaas and Zhang
(2006) and using external EBV and PEV associated with external sires obtained from
the external evaluation), first version of modified Bayesian evaluation (FBE; i.e., a
Bayesian evaluation using external EBV and PEV associated with external sires
obtained from the external evaluation where external EBV for all internal and
external animals were predicted and used), and second version of modified Bayesian
evaluation (SBE; i.e., a Bayesian evaluation using external EBV and PEV associated
with external sires obtained from the external evaluation where external EBV for all
internal and external animals were predicted and used and the double counting
among external animals was avoided). ...................................................................... 53
Figure VI-1. Percentage of contributions due to records and due to relationships for the
Walloon example. Percentage of contributions due to records (blue squares) and due
to relationships (red squares) associated with Walloon information for all animals,
internally used and unused sires and associated with MACE information for
internally used and unused sires for milk (M), fat yield (F) and protein (P) yields. 114
Figure VI-2. Reliabilities for internal progeny. Reliabilities associated with the Bayesian
evaluation that considers double counting of contributions due to relationships and
due to records (RELBL) as a function of reliabilities associated with the official
Walloon evaluation (RELRW) for the 3331 internal animals sired by internally used
sires (i.e., having daughters with records in the Walloon Region) for milk yield. .. 122

187
LIST OF PUBLICATIONS , ORAL PRESENTATIONS , AND POSTERS
PUBLICATIONS
Colinet, F., J. Vandenplas, P. Faux, S. Vanderick, R. Renaville, C. Bertozzi, X. Hubin, and
N. Gengler. 2013. Walloon single-step genomic evaluation system integrating
local and MACE EBV. Interbull Bull. 47:203–210.
Hammami, H., J. Vandenplas, M.J. Carabaño, B. Logar, J. Bormann, C. Bertozzi, and N.
Gengler. 2014. Strategies to combine novel traits across countries: example of heat
stress. Interbull Bull., 48:79–84.
Soyeurt, H., C. Bastin, F. Colinet, V. Arnould, D. Berry, E. Wall, F. Dehareng, N. Nguyen,
P. Dardenne, J. Schefers, J. Vandenplas, K. Weigel, M. Coffey, L. Theron, J.
Detilleux, E. Reding, N. Gengler, and S. McParland. 2012. Mid-Infrared
Prediction of Lactoferrin Content in Bovine Milk: Potential Indicator of Mastitis.
Animal. 6:1830–1838.
Vandenplas, J., C. Bastin, N. Gengler, and H.A. Mulder. 2013. Genetic variance in micro-
environmental sensitivity for milk and milk quality in Walloon Holstein cattle. J.
Dairy Sci. 96:5977–5990.
Vandenplas, J., O.F. Christensen, and N. Gengler. 2014. Short communication: Alteration
of priors for random effects in Gaussian linear mixed models. J. Dairy Sci.
97:5880–5884.
Vandenplas, J., F.G. Colinet, and N. Gengler. 2014. Unified method to integrate and blend
several, potentially related, sources of information for genetic evaluation. Genet.
Sel. Evol. 46:59.
Vandenplas, J., and N. Gengler. 2012. Comparison and improvements of different
Bayesian procedures to integrate external information into genetic evaluations. J.
Dairy Sci. 95:1513–1526.
Vandenplas, J., S. Janssens, N. Buys, and N. Gengler. 2013. An integration of external
information for foreign stallions into the Belgian genetic evaluation for jumping
horses. J. Anim. Breed. Genet. 130:209–217.
Vanrobays, M.-L., J. Vandenplas, H. Hammami, E. Froidmont, and N. Gengler. 2014.
Short communication: Novel method to predict body weight of primiparous dairy
cows throughout the lactation. J. Dairy Sci. In press.
List of publications, oral presentations, and posters
188
ORAL PRESENTATIONS
ON INVITATION
Bastin, C., J. Vandenplas, and N. Gengler. 2014. Improving dairy cow fertility using milk-
based indicator traits. CD–ROM Comm. 155 in Proceedings of the 10th World
Congress on Genetics Applied to Livestock Production, Vancouver, Canada.
Bastin, C., D.P. Berry, J. Vandenplas, H. Soyeurt, and N. Gengler. 2014. Selection of milk
fatty acid composition for improved dairy products from more fertile and healthier
cows. Proceedings of the 69th British Cattle Conference, Telford, UK.
ON A PERSONAL PROPOSAL
Bastin, C., J. Vandenplas, A. Laine, and N. Gengler. 2013. Genetics of mastitis in the
Walloon Region of Belgium. Page 523 in Book of Abstracts of the 64th Annual
Meeting of the European Federation of Animal Science, Nantes, Frances.
Wageningen Academic Publishers, Wageningen, the Netherlands.
Colinet, F.G., A. Vanlierde, S. Vanden Bossche, M. Sindic, F. Dehareng, G. Sinnaeve, J.
Vandenplas, H. Soyeurt, C. Bastin, and N. Gengler. 2012. Mid-infrared prediction
of milk titratable acidity and its genetic variability in first-parity cows. Page 17 in
Book of Abstracts of the 63rd Annual Meeting of the European Federation of
Animal Science, Bratislava, Slovakia. Wageningen Academic Publishers,
Wageningen, the Netherlands.
Vandenplas, J., C. Bastin, N. Gengler, and H.A. Mulder. 2012. Genetic variance in
environmental sensitivity for milk and milk quality in Walloon Holstein cattle.
Page 15 in Book of Abstracts of the 63rd Annual Meeting of the European
Federation of Animal Science, Bratislava, Slovakia. Wageningen Academic
Publishers, Wageningen, the Netherlands.
Vandenplas, J., F.G. Colinet, P. Faux, S. Vanderick, and N. Gengler. 2013. Direct use of
MACE EBV in the Walloon single-step Bayesian genomic evaluation system. J.
Dairy Sci. 96(E-Suppl.):ii.
Vandenplas, J., F.G. Colinet, and N. Gengler. 2013. Combination of genotype, pedigree,
local and foreign information. Page 452 in Book of Abstracts of the 64th Annual
Meeting of the European Federation of Animal Science, Nantes, France.
Wageningen Academic Publishers, Wageningen, the Netherlands.
Vandenplas, J., and N. Gengler. 2012. Extension of Bayesian procedures to integrate and
List of publications, oral presentations, and posters
189
to blend multiple external information into genetic evaluations. J. Dairy Sci.
95(Suppl. 2):449–450.
Vandenplas, J., and N. Gengler. 2014. Bayesian approach integrating correlated foreign
information into a multivariate genetic evaluation. Page 317 in Book of Abstracts
of the 65th Annual Meeting of the European Federation of Animal Science,
Copenhagen, Denmark. Wageningen Academic Publishers, Wageningen, the
Netherlands.
Vandenplas, J., I. Misztal, P. Faux, and N. Gengler. 2012. Bayesian integration of external
information into the single step approach for genomically enhanced prediction of
breeding values. J. Dairy Sci. 95(Suppl. 2):682.
Vanrobays, M.-L., C. Bastin, F.G. Colinet, J. Vandenplas, T. Troch, H. Soyeurt, and N.
Gengler. 2012. Estimation of Myostatin gene effects on production traits and fatty
acid contents in bovine milk. Page 78 in Book of Abstracts of the 63rd Annual
Meeting of the European Federation of Animal Science, Bratislava, Slovakia.
Wageningen Academic Publishers, Wageningen, the Netherlands.
POSTERS
Colinet, F.G., J. Vandenplas, P. Faux, S. Vanderick, C. Bertozzi, X. Hubin, and N.
Gengler. 2013. Development of a genomic evaluation for milk production for a
local bovine breed. Page 233 in Book of Abstracts of the 64th Annual Meeting of
the European Federation of Animal Science, Nantes, France. Wageningen
Academic Publishers, Wageningen, the Netherlands.
Vandenplas, J., and N. Gengler. 2012. Integration of external information into genetic
evaluations by a Bayesian procedure. Communication in the Proceedings of the
17th Symposium on Applied Biological Sciences, Leuven, Belgium.
Vandenplas, J., and N. Gengler. 2014. Use of high performance computing in animal
breeding. Page 326 in Book of Abstracts of the 65th Annual Meeting of the
European Federation of Animal Science, Copenhagen, Denmark. Wageningen
Academic Publishers, Wageningen, the Netherlands.
Vandenplas, J., S. Janssens, and N. Gengler. 2011. Integration of foreign breeding values
for stallions into the Belgian genetic evaluation for jumping horses. Page 140 in
Book of Abstracts of the 62nd Annual Meeting of the European Federation of
Animal Science, Stavanger, Norway. Wageningen Academic Publishers,
Wageningen, the Netherlands.
List of publications, oral presentations, and posters
190
Vanrobays, M.-L., J. Vandenplas, H. Hammami, and N. Gengler. 2014. Prediction of body
weight of primiparous dairy cows throughout lactation. CD-ROM comm. 572 in
Proceedings of the 10th World Congress on Genetics Applied to Livestock
Production, Vancouver, Canada.