Embed Size (px)
Citation preview
_____________________________
Integrated Service Network Design for Rail Freight Transportation Endong Zhu Teodor Gabriel Crainic Michel Gendreau November 2009 CIRRELT-2009-45
G1V 0A6
Bureaux de Montréal : Bureaux de Québec : Université de Montréal Université Laval C.P. 6128, succ. Centre-ville 2325, de la Terrasse, bureau 2642 Montréal (Québec) Québec (Québec) Canada H3C 3J7 Canada G1V 0A6 Téléphone : 514 343-7575 Téléphone : 418 656-2073 Télécopie : 514 343-7121 Télécopie : 418 656-2624
www.cirrelt.ca
Integrated Service Network Design for Rail Freight Transportation
Endong Zhu1,2,†, Teodor Gabriel Crainic1,3,*, Michel Gendreau1,4
1 Interuniversity Research Centre on Enterprise Networks, Logistics and Transportation (CIRRELT)
2 Department of Computer Science and Operations Research, Université de Montréal, P.O. Box 6128, Station Centre-ville, Montréal, Canada H3C 3J7
3 Department of Management and Technology, Université du Québec à Montréal, P.O. Box 8888, Station Centre-Ville, Montréal, Canada H3C 3P8
4 Department of Mathematics and Industrial Engineering, École Polytechnique de Montréal, P.O. Box 6079, Station Centre-ville, Montréal, Canada H3C 3A7
Abstract. The research aims to produce a good operating plan at the tactical level for
freight rail transportation. The service network design problem is studied, as we consider
the scheduled service selection, blocking policy, train make-up policy and car distribution
together. A 2-layer time-space network is proposed to model the car flow as well as the
decisions on both blocks and services. The mixed-integer programming model is difficult
and a tabu search heuristic is developed to provide good feasible solutions within
reasonable solving effort. Numerical results show the proposed method is robust, and
capable to provide near-optimal solutions for rather large instances.
Keywords. Service network design, freight transportation, rail application, capacitated
multi-commodity network design.
Acknowledgements. Funding for this project has been provided by the Natural Sciences
and Engineering Council of Canada (NSERC), through its Industrial Research Chair and
Discovery Grants programs and by the partners of the Chair, CN, Rona, Alimentation
Couche-Tard and the Ministry of Transportation of Québec.
† This paper received the first prize in the 2009 Student Research Paper Contest of Railway Applications Section (RAS), a subdivision of INFORMS.
Results and views expressed in this publication are the sole responsibility of the authors and do not necessarily reflect those of CIRRELT. Les résultats et opinions contenus dans cette publication ne reflètent pas nécessairement la position du CIRRELT et n'engagent pas sa responsabilité. _____________________________
* Corresponding author: [email protected]
Dépôt légal – Bibliothèque et Archives nationales du Québec, Bibliothèque et Archives Canada, 2009
© Copyright Zhu, Crainic, Gendreau and CIRRELT, 2009
1 Introduction
As one of the major components of the logistic chain, freight rail transportationis distinguished by its economics and mass volume. It also facilitates interna-tional trade and economic growth in most countries.
To distribute all kinds of commodities, railways need to provide services sothat transportation demands from customers can be met. A service is carriedout by a train which is characterized by its origin, destination, route, interme-diate stops, speed, capacity, and schedule. Services without any intermediatestops are called direct services or non-stop services. A service plan maintains alist of services to be provided. Generally, a service plan is based on a planninghorizon (usually 1 or 2 weeks), and is cyclic over a certain period of time (4 to6 months) with the probability of slight occasional changes.
In order to ensure the proper implementation of the proposed services, extrapolicies and configurations are adopted to manage internal operations, whichhave great impacts on the services’ performance. The service plan and interiorpolicies thus form an overall operating plan. The operating plan is vital toeach rail carrier because it conducts the operating efficiency, balances customersatisfaction and rail profits. According to the planning horizon, rail operationplanning is grouped into three levels: strategic (long term), tactical (mediumterm) and operational (short term). Refer to Crainic (1999) for hierarchicaldetails.
Guiding the daily operating process, tactical planning is particularly im-portant and interesting for rails. When planning the medium-term operations,scheduling is unavoidable because the operating cost and time might be consid-erably affected by congestions and delays. In convention, planning and schedul-ing are separately addressed because of the complexity of each subject. Fewworks have been developed to analyze the relations between them, except invery simplified settings.
Aiming to combine operation planning together with scheduling at the tac-tical level, we study the service network design problem. In the problem, wesimultaneously consider a mixture of operations. The operations consideredare performed in different facilities and may require conflicting resources. Theservice network design problem analyzes the interactions among the processesand minimizes the total operating cost while meeting the customers’ service ex-pectations, avoiding congestions, and obeying various capacities from differentresources.
As an extension of the classic network design, a service network design prob-lem generally shows complex formulation. For real-size instances, a servicenetwork design aggregating many operations may puzzle any existing solutionmethods. A simpler case is studied where only direct services are featured. Di-rect services contribute to a rather large portion of the service set if it is notthe only setting as in some small rails. A good direct service design forms thebackbone, and can be later used to generate the final service plan.
The major contribution of this paper is twofold. The first aspect is a com-prehensive modeling approach that brings the key tactical decisions together in
1
Integrated Service Network Design for Rail Freight Transportation
CIRRELT-2009-45
the scheduling context. To analyze the various operations on different aspectsas well as the temporal effects, a 2-layer time-space network is constructed, inwhich we are able to explicitly address the shipment in different formats in atime-dependent manner. Second, we propose an algorithm to solve this formu-lation at dimensions that may be of interest in practice. The heuristic methodis developed on a cycle-based neighborhood, and is proven to be efficient toprovide good solutions in reasonable time for large-scale instances. We launchequal endeavors on both modeling and solution method in order to keep themodel meaningful in practice as well as successfully solved in the end.
This paper is organized as follows. After the introduction of freight railoperations, we review the previous research works, and detail our problem. AMIP model is then constructed based on a special structure. This model is verycomplicated, and no optimization technique is known to be efficient on real-sizedinstances. A tabu search algorithm is developed to find acceptable solutions.The results of random experiments are then presented and analyzed. In theend, we summarize our work and propose extensions.
2 Rail Transportation
The rail network consists of stations and yards, which are connected by railtracks. Working on the rail network, railways receive transportation demandsfrom customers for shipping cars of commodities from their origin station totheir destination station.
Trains are provided on rail tracks. A train is composed of one or moreengines providing power, as well as a series of cars. A train assembles at itsorigin and disassembles at its destination. During the journey on a sequenceof rail tracks, the train picks up/unloads some cars at some intermediate stops.Because of the expensive crew charge and locomotive depreciation cost, in gen-eral, dedicated trains are not provided for each customer unless the demand isregular and with high volume. To share some common trains on their journey,shipments from different customers have to be consolidated. The consolidationis implemented in yards interspersing in rail network. Feeder trains are usedto provide transportation between the customer’s station and the yard nearby,and main-line trains carry cars through the yards.
A service is carried out by a train. Conventionally, a service is characterizedby a train route and addressed by frequency. When schedule is concerned, whichis the timetable depicting the departing/arrival time at each stop on the trainroute, each service refers to a train with a predefined timetable.
To benefit from the economy-of-scale, cars are not handled individually, andblocks are built. A block consists of a group of cars with different origins anddestinations, and the cars in a block will be processed as a unit and share acommon trip from the block origin to the block destination. Blocks are built atparticular yards, called classification yards, where many parallel tracks calledclassification tracks exist. To build blocks, cars are sorted by being slipped into(in the case of hump yards) or hauled into (in the case of flat yards) classifica-
2
Integrated Service Network Design for Rail Freight Transportation
CIRRELT-2009-45
tion tracks at block origin. One classification track must be exclusively assignedto the block for a certain time. The cars are accumulated in the classificationtrack until enough cars are gathered and the block is formed up. The clas-sification process requires a considerable amount of resources, and on average,each re-classification results approximately in a one-day delay for the shipments,making it a major source of expenses and delays. At its destination yard, theblock is broken down and its component cars are delivered to the consignees byfeeder service if it’s their final yard, or are re-classified and go through anotherblock. Clearly, each car may go through one or several blocks before reachingits destination yard.
Services transport blocks on tracks. After a block is built up in its origin,a service, either departing from or passing the classification yard, then takesthe block to another yard. If it’s not the destination of the block, the blockis unloaded onto a transfer track and will later be transferred (or switched) toanother service. The transfer process usually causes delays due to the connectionbetween services. Each block is therefore shipped by one service or more. Wenotice, it’s possible that each block only uses several sub-services (service portionbetween two unnecessarily consecutive stops on a route).
The loaded cars are cleared at their destination. When returned to rails,empty cars need to be repositioned, which means they will be moved from areaswith a surplus to areas with a deficit in order to fulfill the future demands.
Managing the complex daily operations, the operating plan at the tacticallevel has quite complicated setup, and comprises many policies affecting differentoperations. The most common policies are introduced below. Given a set ofpotential services, service selection determines which services to provide in orderto form the service plan. The blocking policy is probably the most essentialinternal regulation, which concerns the decisions on building blocks. Throughthe train make-up policy, one figures out which service takes which block. Traffic
distribution gives the assignment of cars on blocks, and specifies the itineraryfor each demand. The movements of empty cars are managed by the empty
reposition policy. All these policies have network-wide impacts and are stronglyand complexly linked both in economic terms and in their time-space dimension.To study the trade-offs, one need to consider these intertwined issues in onemodel, and determines those policies concurrently to identify the most efficientway of delivering all shipments while satisfying a set of technological constraintsfrom block, train, track and yard capacity.
3 Literature Review and Problem Description
Service selection, blocking policy, train make-up policy, traffic distribution andempty reposition policy form the fundamentals of a rail operating plan. Alarge number of articles for planning freight rail operations exist, focusing ondifferent aspects. In this section, we limit ourselves to the works on serviceselection and blocking policy, as well as some attempts to combine those twoaspects. Complete reviews on former rail models can be found in Cordeau et al.
3
Integrated Service Network Design for Rail Freight Transportation
CIRRELT-2009-45
(1998) and Ahuja et al. (2005).Service selection is typically developed and solved in two steps. Service rout-
ing models (e.g. Marın and Salmeron, 1996; Goossens et al., 2004) first determinethe routing and frequency of services, and the train timetable is then addressedby scheduling models (e.g. Brannlund et al., 1998; Caprara et al., 2002, 2006)based on the routing pattern. However, the congestion during the train tran-sition suggests modifications to the routing plan. Morlok and Peterson (1970)first determined the train routing and train scheduling in a single optimizationmodel. Huntley et al. (1995) developed a computerized routing and schedulingsystem to help planners at CSX Transportation where each stop-to-stop linkin the routes is assumed to follow an established path. Newman and Yano(2000) proposed a model within the context of scheduling trains and assigningcontainers for each trains in the rail portion of intermodal shipment.
Bodin et al. (1980) worked on the blocking policy and developed a non-linear mixed-integer programming model. The blocking model is extended byNewton et al. (1998), and the researchers considered demands with differentpriorities. A formulation similar to the aforementioned one is used by Barnhartet al. (2000), and they applied a dual-based Lagrangian relaxation approachto solve the problem. Another extension of the blocking model is studied byAhuja et al. (2007). A special neighborhood search algorithm is developed toheuristically improve the current solution. The algorithm provides blockingpolicies efficiently and has a real potential to be applied to rails.
Only few efforts have been made to address both service selection and block-ing policy simultaneously. Compared with the previous models, these compoundmodels are more complex and much harder to solve. Crainic et al. (1984) defineda feasible journey for each shipment as an itinerary. An itinerary includes theservice path followed and the operations performed at each intermediate stop.By selecting the best itinerary for each demand, the model not only solves thetraffic routing problem but also determines the blocking and make-up strate-gies, as well as the distribution of classification workload among yards. A goodoperating strategy balancing the service cost and quality is obtained. However,blocking decisions are indirect and no service schedule is provided. Crainic andRousseau (1986) presented a general model of multi-commodity multi-modefreight transportation and explained the solution methodology in greater detail.
Haghani (1989) attempted to combine train routing and scheduling, make-up, as well as empty car distribution problems based on a time-space networkwith fixed travel times. Keaton (1989, 1992) examined the problem of decidingwhich pairs of yards are provided with direct service and the frequency, as wellas car routing and make-up policy. The proposed model has a linear formulationsince neither yard delay nor train transit time is determined endogenously. Theobjective is to minimize the total cost which includes train costs, car time costs,and classification costs in yards. A similar formulation is solved by Gorman(1998a) with genetic and tabu search and the model is applied in Santa Fe Rail-way (Gorman, 1998b). All these researches tried to model the blocking processby including classification costs while planning scheduled services. However, noexplicit blocking decisions are addressed.
4
Integrated Service Network Design for Rail Freight Transportation
CIRRELT-2009-45
Planning processes have been applied to generate the holistic operating planfor railways, such as Ireland et al. (2004) for Canadian Pacific Railway. Thesesolutions track the entire operating plan problem by aggregating many separatealgorithms within a systematic frame. However, the aggregating method failedto analyze the detailed relations among different policies, and further improve-ments on the operating plan may be available if we are able to consider thevarious operations together.
Our review of many previous works reveals an opportunity for developinga new framework to link decisions from different aspects of the rail operation.Since no prior work takes the service schedule into account while making theblocking policy, it might be difficult to find a feasible train timetable to accom-modate all proposed blocks. On the contrary, if we fix the scheduled serviceplan first, the outcome blocking policy may violate the block building capacitiesin yards. Therefore, explicit blocking decisions in scheduled service networkdesign, which are absent in reports, will coordinate the decisions on blocks andservices, and synchronize the yard operations.
Our objective is to produce a good operating plan consisting of the essentialpolicies to help rails work in a smooth, rational and cost-efficient way. First, weare interested in the scheduled service design and blocking policy these two vitaldecision makings. Moreover, to allocate the blocks built to the services offered,we need a train make-up policy. By achieving all these, cars are distributed anda time-dependent itinerary is determined for every traffic demand. The emptyreposition policy is assumed to be given so that empty demands come with thedemand pattern, and car flows in our model are the mixed flow of loaded andempty cars.
In order to simultaneously address the scheduled service design, blocking pol-icy, make-up policy and traffic distribution, we study a time-dependent servicenetwork design problem where the most substantial operations at the tacticallevel and additional operations at the operational level are integrated. By en-suring the proper delivery for customers, we minimize the total operating costand provide decisions for both services and blocks.
4 Service Network Design Model
The working procedure in rails can be briefly reviewed as follows. Cars (loadedor empty) received from customers are first put into receiving tracks. After apossible waiting time, the cars are classified and moved into classification trackswhere the cars are held until enough cars are gathered and blocks are formed.After that, the blocks are loaded onto services and transported on rail tracks.At a midway stop, some blocks may be unloaded onto transfer tracks in yardsand later transferred to another service after connection delays. Thus, ship-ments are generally processed in the form of cars and blocks, respectively. Forcars, shipments are either waiting in receiving tracks, or classified, or accumu-lated in classification tracks. For blocks, shipments are transported by services,transferred, or delayed in transfer tracks for connection.
5
Integrated Service Network Design for Rail Freight Transportation
CIRRELT-2009-45
B
A C
D
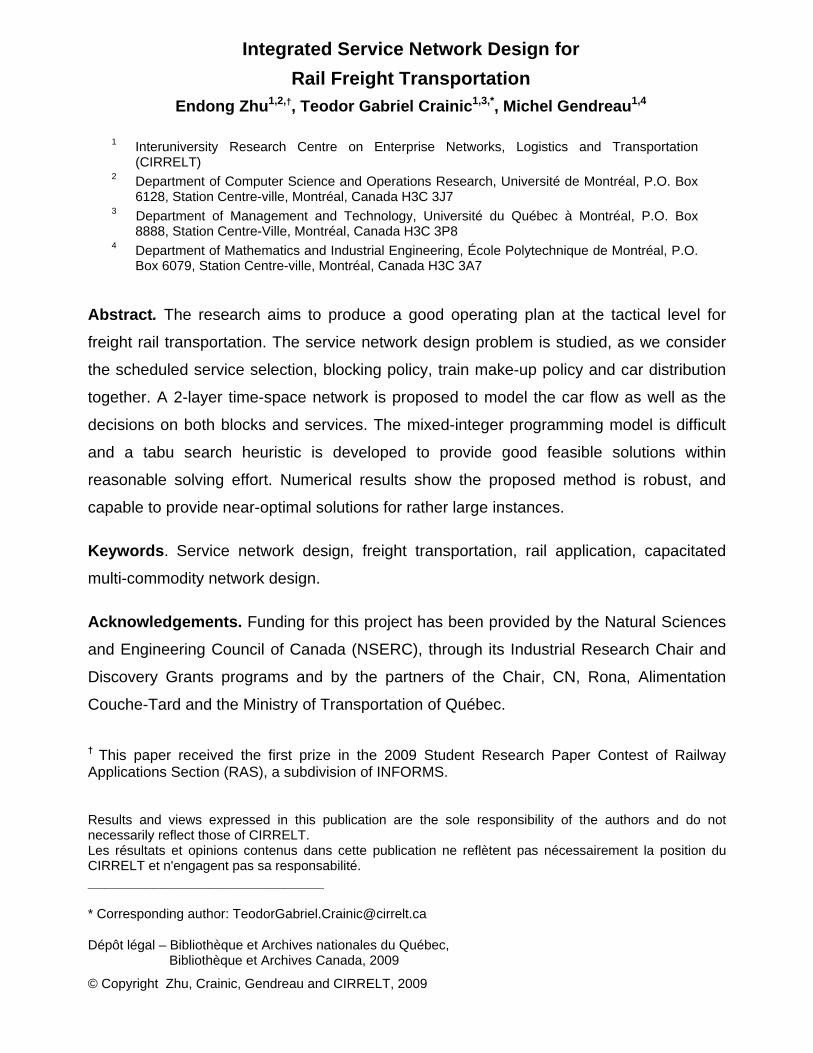
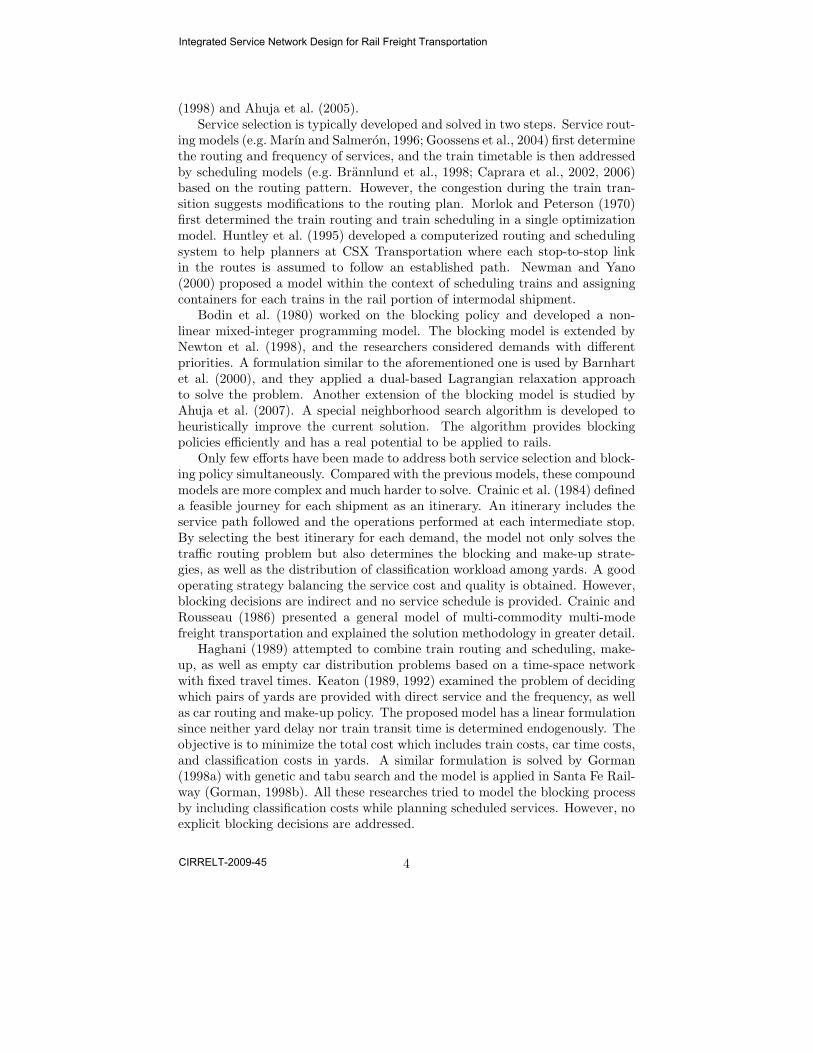
Figure 1: A Simple Physical Network.
������������������������������������������������������������������������������������
������������������������������������������������������������������������������������
������������������������������������������������������������������������������������
������������������������������������������������������������������������������������
Car Layer
Block Layer
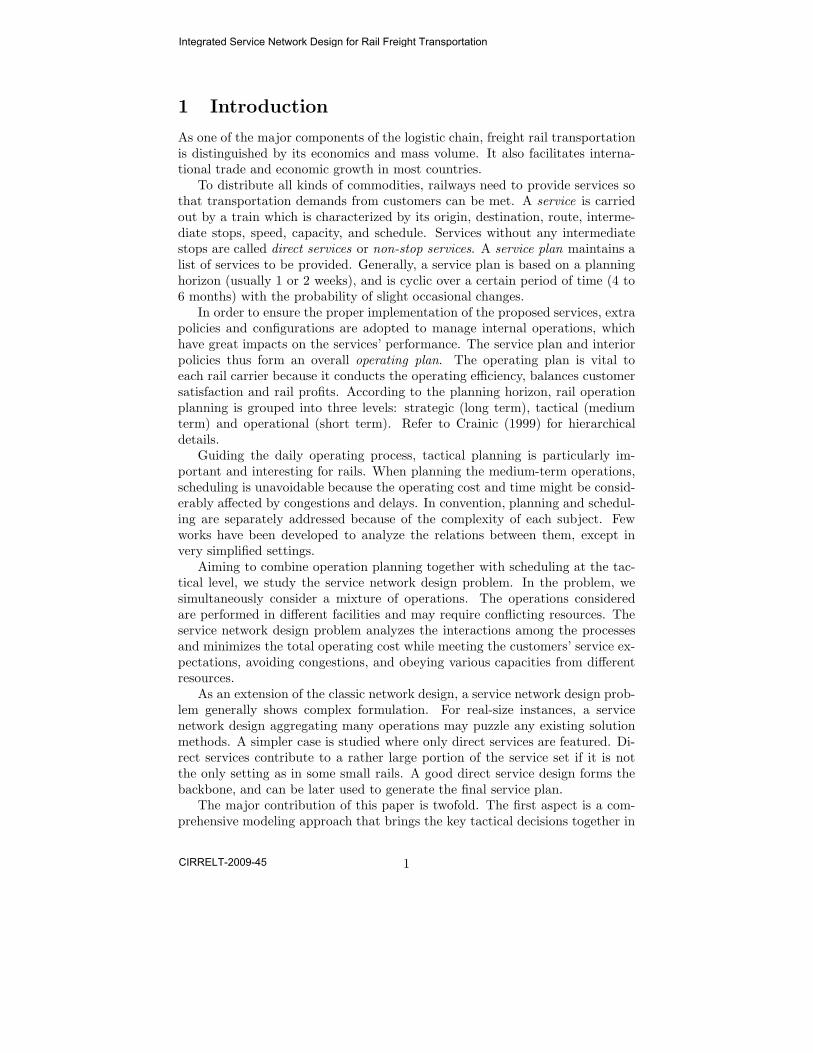
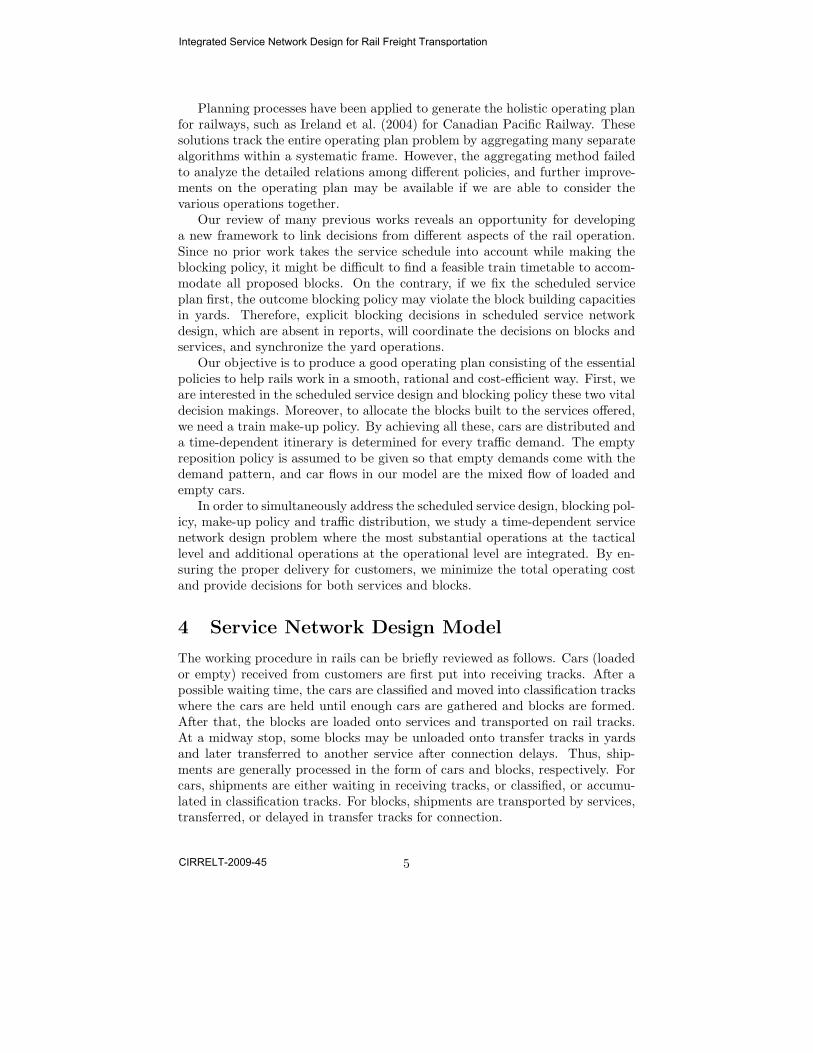
Figure 2: 2-Layer Structure.
4.1 2-Layer Time-Space Network
Trains run on a physical network G = (V, E), where each vertex v ∈ V representsa yard and each link e ∈ E stands for a rail track section. Planning at thetactical level, minor stations are aggregated and only major yards handling alarge number of traffic, and main-line tracks connecting yards are considered.One simple physical network with 4 yards and 4 directed tracks is illustrated inFigure 1.
Apparently, the physical network, which often appears in earlier works, isinsufficient to picture the temporal information and the flows in different for-mats. To describe the various operations on different objects, we delaminate thephysical network into layers. Based on a physical network, a 2-layer structureis constructed (shown in Figure 2). The structure has two parallel layers: thetop layer concerns the flow of blocks and is denoted as the block layer, and thebottom layer, called the car layer, describes the flow of cars.
Moreover, considering the service schedule as well as the delays, temporalinformation must be addressed. In each layer, a time dimension is attached. Aunified granularity is adopted for both layers, where the time horizon is dividedinto T time periods by T time points, denoted by t ∈ {0, · · · ,T − 1}. Becauseof the continuity of the operating plan, we adopt a cyclic time dimension, thatis, the next time point of T− 1 is back to 0.
To further specify the yard operations, at each time point, each yard isdivided into two nodes: the IN node and the OUT node. The IN node indicatesthat the objects (cars or blocks as in car layer or block layer) are received in theyard at the time point, and the OUT node says the objects are ready to ship
6
Integrated Service Network Design for Rail Freight Transportation
CIRRELT-2009-45
out. With all these considerations, a special network structure is constructed,and the total number of nodes in each layer is equal to,
2 × number of yards× number of time periods.
Links in the time-space network include the links in each layer, and thevertical links connecting the two layers. The definition of the temporal length
(or length) of a link is the total time periods this link covers.In the block layer, links are defined to represent the operations applied on
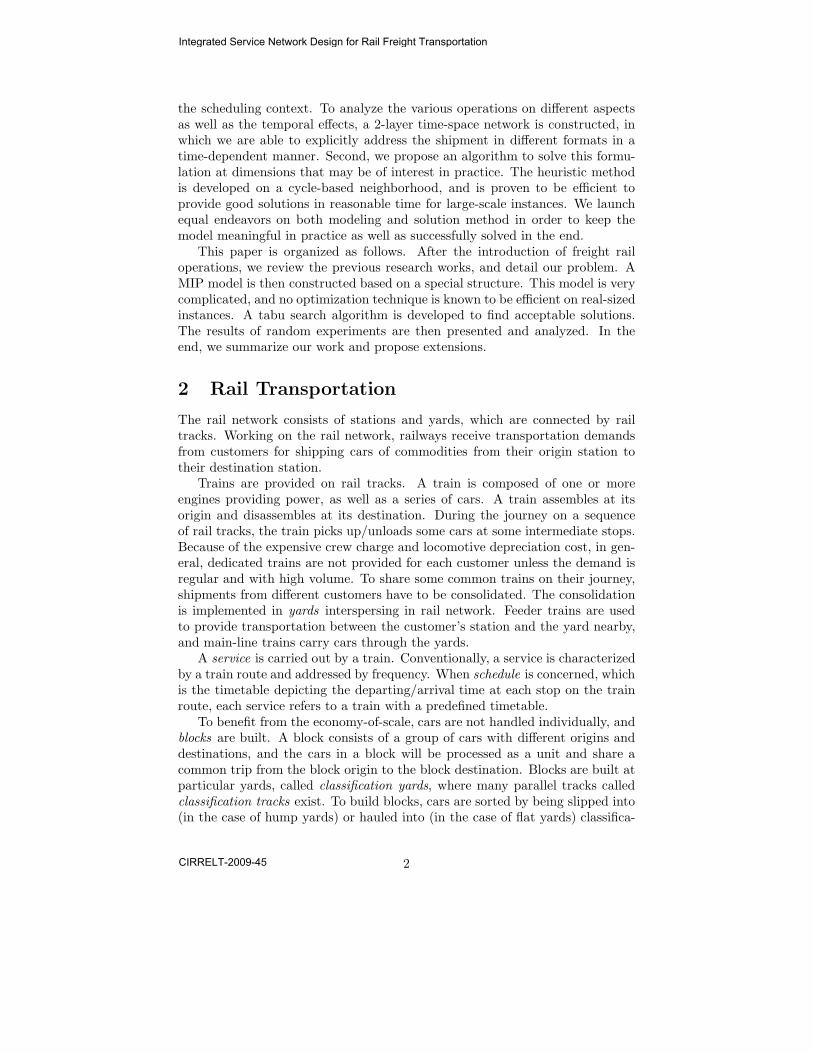
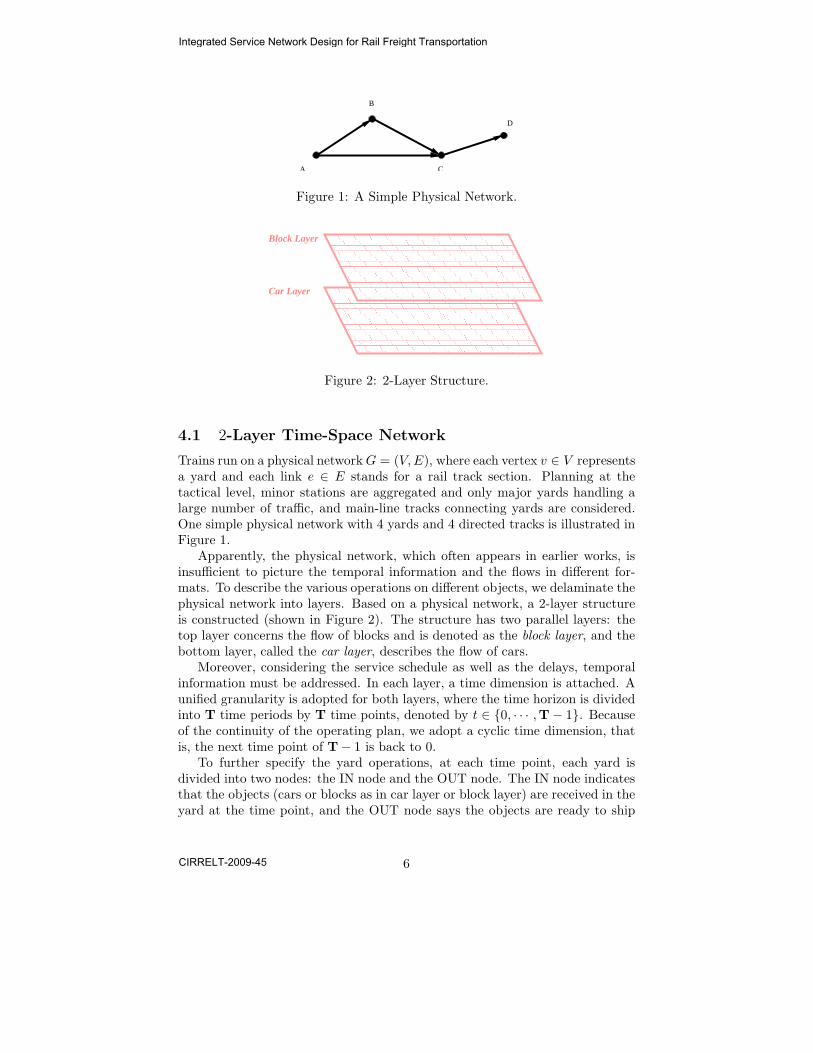
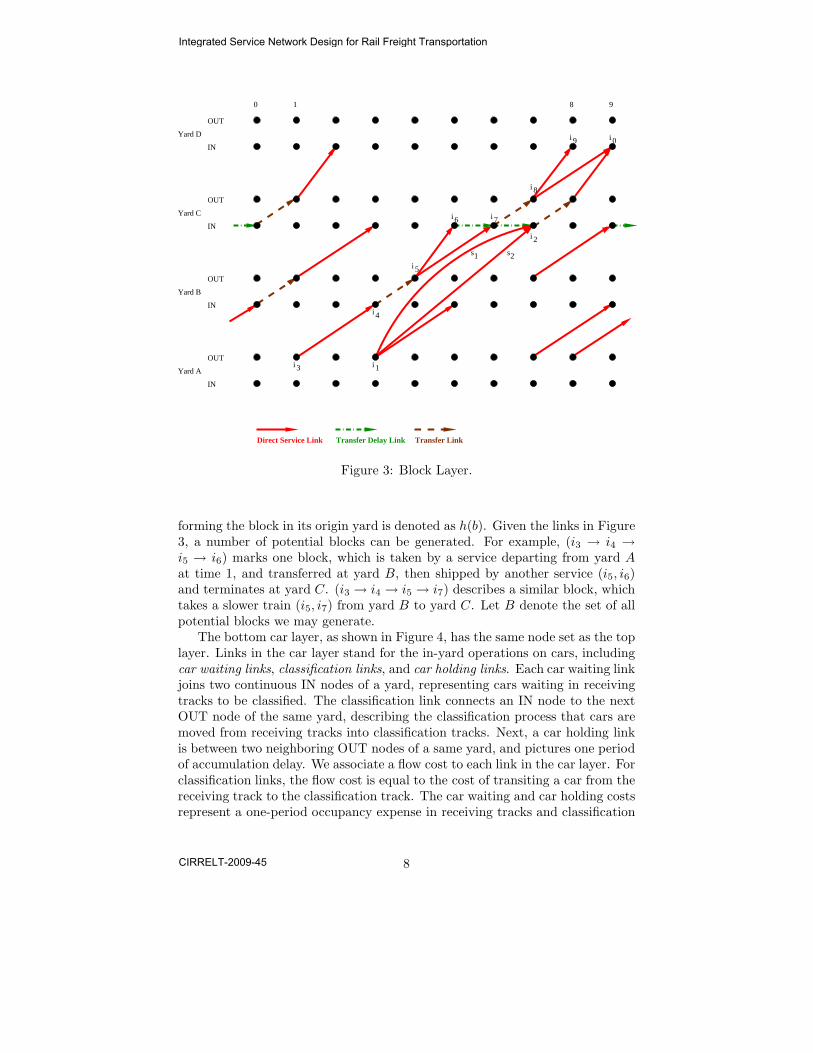
blocks, including movement on service, transfer and delay for connection. Cor-responding to the physical network in Figure 1, the block layer is shown inFigure 3.
Each service is represented by a direct service link, denoted as s, which isfrom an OUT node of one yard to an IN node of another yard. The physicalroute passed is addressed by a set of tracks E(s). For each service, we aretherefore aware of its origin, destination, departure time, fixed running timeand service route. A fixed cost cf (s), which stands for the cost of supplyinglocomotives and crew, is appended if the service is provided. The flow cost ofa direct service link is the fuel cost which is linear with the train load. Directservice links are enumerated by departing each combination of one rail routeand one possible speed from each time point. On a pre-arranged route, theservice with shorter transit time represents the train running on greater speed,and using lower speed trains causes a longer service time. We notice paralleldirect service links, which have the same origin and destination nodes as wellas the same transit time, may exist. One example is service s1 and s2 in Figure3. They both depart from node i1 and end at node i2. Parallel direct servicelinks distinguish each other by their track sequence, that is, they representtrain movements between two yards following different physical routes. In thisinstance, s1 and s2 follow route (A → B → C) and route (A → C) respectively.S is the set of all direct service links.
A transfer link connects an IN node to the OUT node of the same yard atthe next time point, e.g. (i4, i5), standing for the transfer procedure. The flowcost on a transfer link is the cost to unload and later load blocks onto anotherservice. One transfer delay link attaches two consecutive IN nodes of a sameyard, e.g. (i6, i7), representing a one-period delay for catching the next service.Ai is the set of all inter-service transfer links, and Ad the set of transfer delaylinks.
With direct service links, transfer links and transfer delay links describingthe operations on blocks, the journey of a block can be represented by a path.Despite of the building process, we define such a path as a block path (or block).A block is formed by a series of direct service links which are connected bytransfer delay links and transfer links. For each block b, a sequence of directservice links S(b) ⊂ S is kept to depict the movements on services. The blockflow cost is the sum of the flow costs on its component links. Moreover, whena block b is built, we attach a fixed cost cf (b) to represent the classificationtrack occupancy during the building process. The estimated building time for
7
Integrated Service Network Design for Rail Freight Transportation
CIRRELT-2009-45
0 1 98
OUT
IN
OUT
IN
OUT
IN
OUT
IN
Yard A
Yard B
Yard C
Yard D
i 6 i
i
i
7
8
9 i 0
Transfer Link
i 3 i 1
i 4
5i
i 2
s1 s2
Direct Service Link Transfer Delay Link
Figure 3: Block Layer.
forming the block in its origin yard is denoted as h(b). Given the links in Figure3, a number of potential blocks can be generated. For example, (i3 → i4 →i5 → i6) marks one block, which is taken by a service departing from yard Aat time 1, and transferred at yard B, then shipped by another service (i5, i6)and terminates at yard C. (i3 → i4 → i5 → i7) describes a similar block, whichtakes a slower train (i5, i7) from yard B to yard C. Let B denote the set of allpotential blocks we may generate.
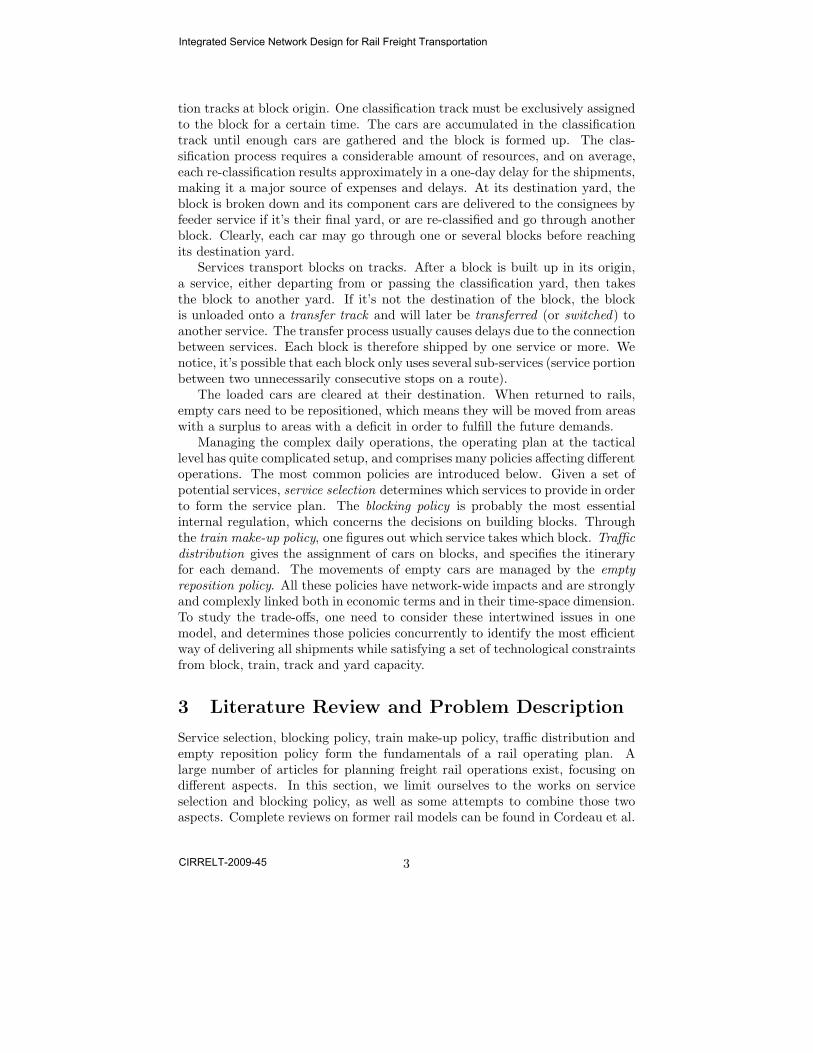
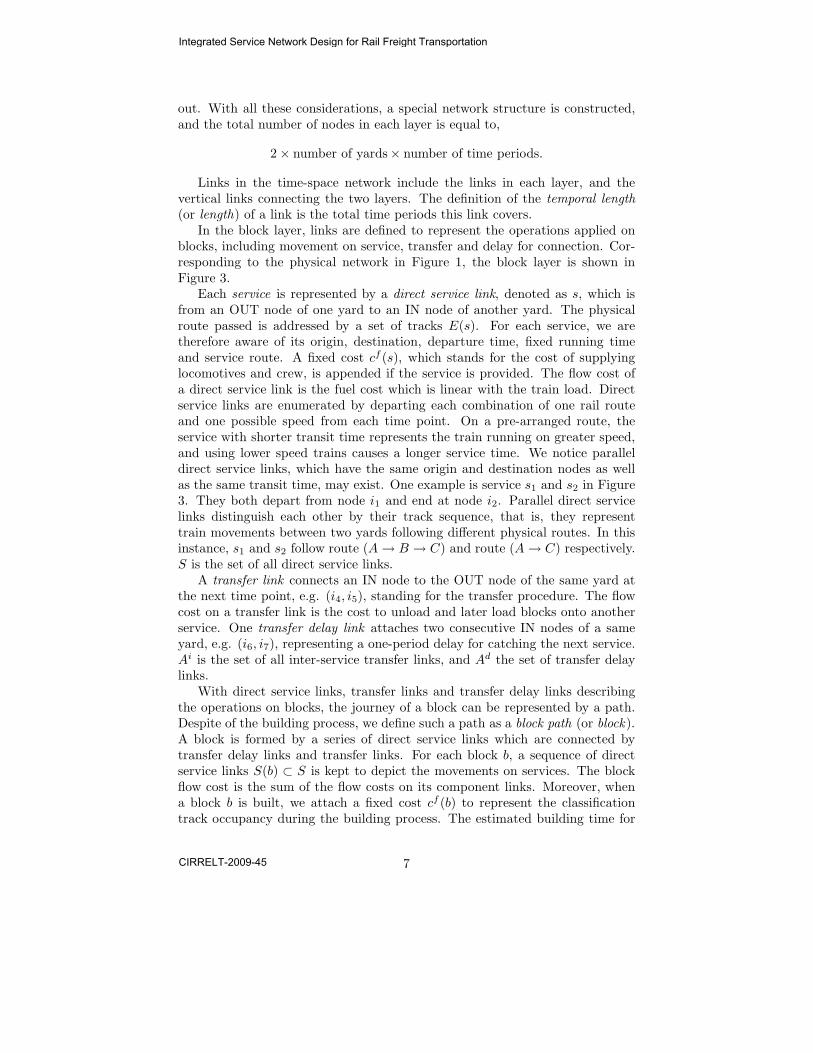
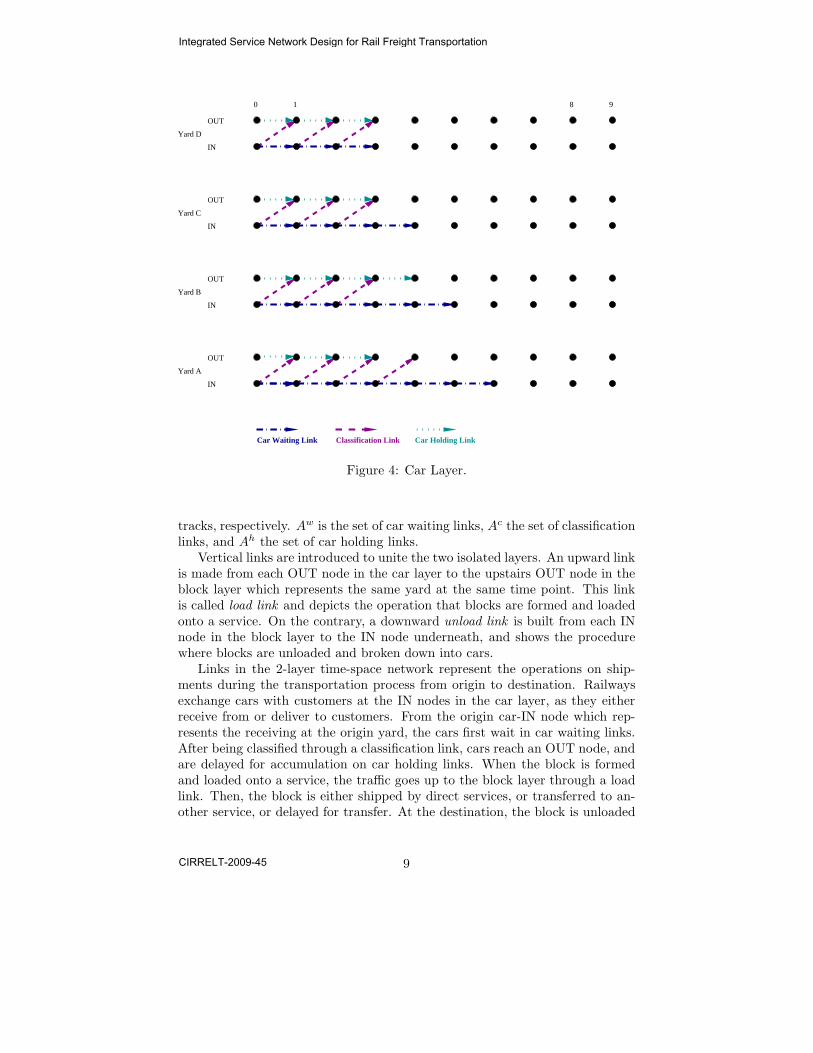
The bottom car layer, as shown in Figure 4, has the same node set as the toplayer. Links in the car layer stand for the in-yard operations on cars, includingcar waiting links, classification links, and car holding links. Each car waiting linkjoins two continuous IN nodes of a yard, representing cars waiting in receivingtracks to be classified. The classification link connects an IN node to the nextOUT node of the same yard, describing the classification process that cars aremoved from receiving tracks into classification tracks. Next, a car holding linkis between two neighboring OUT nodes of a same yard, and pictures one periodof accumulation delay. We associate a flow cost to each link in the car layer. Forclassification links, the flow cost is equal to the cost of transiting a car from thereceiving track to the classification track. The car waiting and car holding costsrepresent a one-period occupancy expense in receiving tracks and classification
8
Integrated Service Network Design for Rail Freight Transportation
CIRRELT-2009-45
0 1 98
OUT
IN
OUT
IN
OUT
IN
OUT
IN
Yard A
Yard B
Yard C
Yard D
Classification LinkCar Waiting Link Car Holding Link
Figure 4: Car Layer.
tracks, respectively. Aw is the set of car waiting links, Ac the set of classificationlinks, and Ah the set of car holding links.
Vertical links are introduced to unite the two isolated layers. An upward linkis made from each OUT node in the car layer to the upstairs OUT node in theblock layer which represents the same yard at the same time point. This linkis called load link and depicts the operation that blocks are formed and loadedonto a service. On the contrary, a downward unload link is built from each INnode in the block layer to the IN node underneath, and shows the procedurewhere blocks are unloaded and broken down into cars.
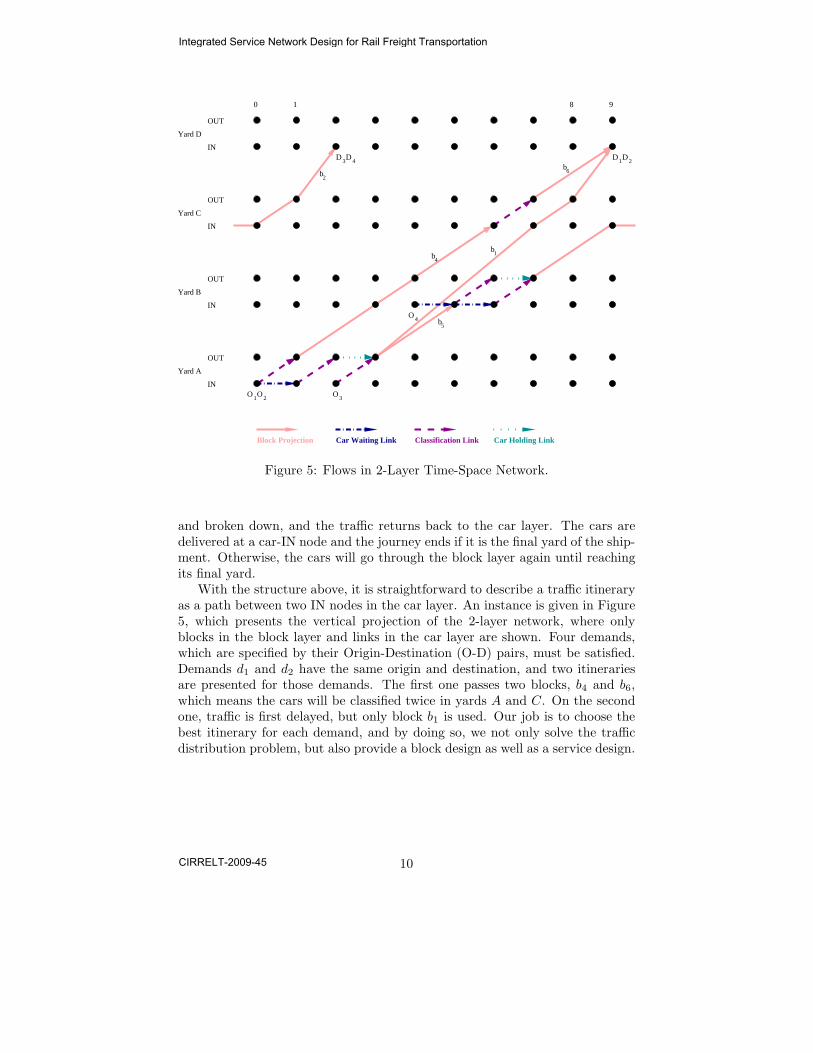
Links in the 2-layer time-space network represent the operations on ship-ments during the transportation process from origin to destination. Railwaysexchange cars with customers at the IN nodes in the car layer, as they eitherreceive from or deliver to customers. From the origin car-IN node which rep-resents the receiving at the origin yard, the cars first wait in car waiting links.After being classified through a classification link, cars reach an OUT node, andare delayed for accumulation on car holding links. When the block is formedand loaded onto a service, the traffic goes up to the block layer through a loadlink. Then, the block is either shipped by direct services, or transferred to an-other service, or delayed for transfer. At the destination, the block is unloaded
9
Integrated Service Network Design for Rail Freight Transportation
CIRRELT-2009-45
0 1 98
OUT
IN
OUT
IN
OUT
IN
OUT
IN
Yard A
Yard B
Yard C
Yard D
O3O1O2
D1D2D D3 4
Block Projection Classification Link
O4 b5
b2
b4
b6
1b
Car Waiting Link Car Holding Link
Figure 5: Flows in 2-Layer Time-Space Network.
and broken down, and the traffic returns back to the car layer. The cars aredelivered at a car-IN node and the journey ends if it is the final yard of the ship-ment. Otherwise, the cars will go through the block layer again until reachingits final yard.
With the structure above, it is straightforward to describe a traffic itineraryas a path between two IN nodes in the car layer. An instance is given in Figure5, which presents the vertical projection of the 2-layer network, where onlyblocks in the block layer and links in the car layer are shown. Four demands,which are specified by their Origin-Destination (O-D) pairs, must be satisfied.Demands d1 and d2 have the same origin and destination, and two itinerariesare presented for those demands. The first one passes two blocks, b4 and b6,which means the cars will be classified twice in yards A and C. On the secondone, traffic is first delayed, but only block b1 is used. Our job is to choose thebest itinerary for each demand, and by doing so, we not only solve the trafficdistribution problem, but also provide a block design as well as a service design.
10
Integrated Service Network Design for Rail Freight Transportation
CIRRELT-2009-45
4.2 Mathematical Formulation
To specify the characteristics of different traffic demands, we first define traffic
class. Each traffic class represents a shipment, which is distinguished by theorigin yard o and destination yard d, type of commodity m, the receiving timer when cars are available at the origin yard, as well as the due date. However,working with cyclic time dimension, it is complicated to count the exact date.The due transit hour h, which is the due date minus the receiving time, is usedto express the maximal transit time allowed till the final yard. Precisely, atraffic class is defined as,
p = (o, d, m, r, h).
Let P be the set of all traffic classes.Our model includes three types of variables. Let A be the union of all car
layer links and all blocks in the block layer. The first type, denoted as xpa, is the
continuous variable representing car flow of traffic class p on each link a ∈ A.A binary decision variable is adopted to model the building decision on eachblock, which is defined as yb = 1 if block b is built, yb = 0 otherwise. The lasttype is another binary design variable addressing the service selection, zs = 1 ifwe include the direct service s in the final design, zs = 0 otherwise.
The objective is to minimize the total operating cost in both layers, whichincludes the fixed cost on open services, the fixed cost on open blocks, as wellas the flow cost on all the links/blocks. The objective function is written as (1),
min Φ =∑
p∈P
∑
a∈A
c(p, a) · xpa +
∑
b∈B
cf (b) · yb +∑
s∈S
cf (s) · zs (1)
where c(p, a) is the unit flow cost on car layer links/blocks a for traffic class p.The first constraint comes from the car flow conservation, which guarantees
the proper delivery for each traffic demand. Let dp denote the demand fortraffic class p. Since empty flows are present as well, car number is used toaddress demand. In equation (2), A+(n) and A−(n) are the set of outward andinward links (including classification links, car waiting links, car holding linksand blocks) of car-layer node n, and wp
n is the absolute demand for traffic classp on node n. If n is the origin of traffic class p, wp
n = dp; if n is the destinationof p, wp
n = −dp; otherwise wpn = 0.
∑
a∈A+(n)
xpa −
∑
a∈A−(n)
xpa = wp
n ∀n ∈ N, ∀p ∈ P. (2)
Next, we have two linking constraints (3) and (4) which explicitly specifythe relations between the flow of cars and the flow of blocks, as well as the flowof blocks and the flow of services.
∑
p∈P
xpb ≤ ybub ∀b ∈ B; (3)
∑
b∈B|s∈S(b)
yb ≤ zsus ∀s ∈ S; (4)
11
Integrated Service Network Design for Rail Freight Transportation
CIRRELT-2009-45
where us is the maximum cars that a train can haul on direct service link s ∈ S,and ub is the car flow capacity on block b.
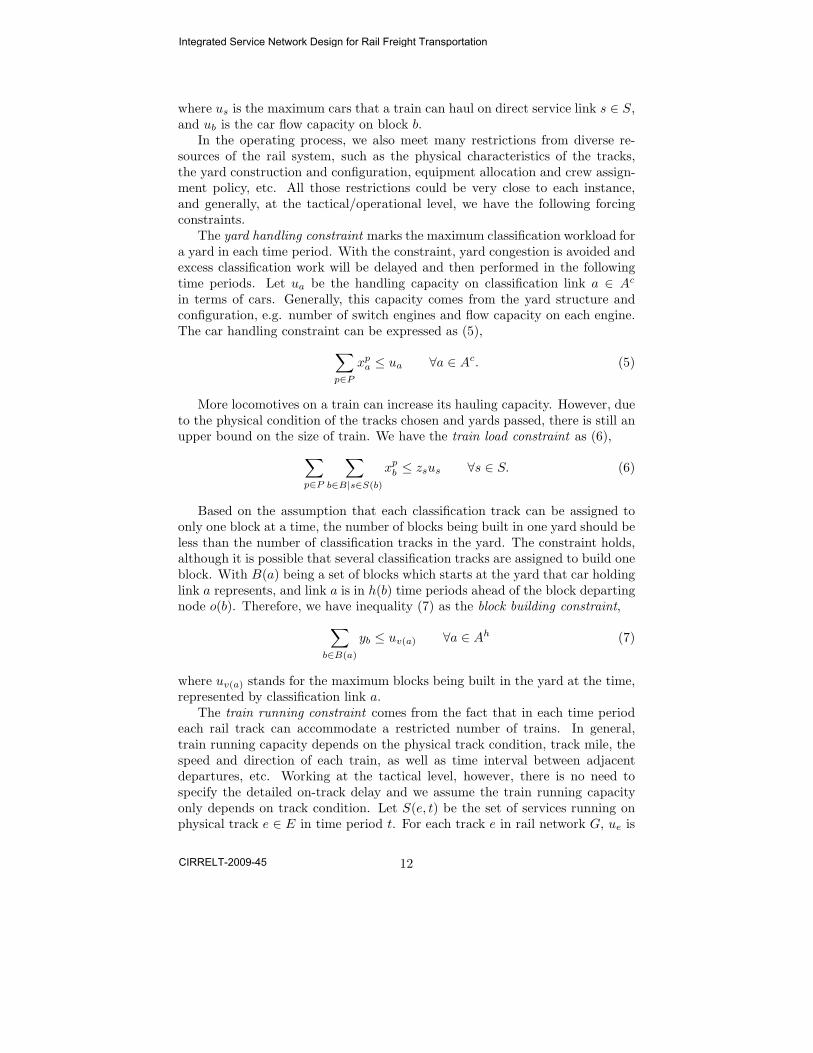
In the operating process, we also meet many restrictions from diverse re-sources of the rail system, such as the physical characteristics of the tracks,the yard construction and configuration, equipment allocation and crew assign-ment policy, etc. All those restrictions could be very close to each instance,and generally, at the tactical/operational level, we have the following forcingconstraints.
The yard handling constraint marks the maximum classification workload fora yard in each time period. With the constraint, yard congestion is avoided andexcess classification work will be delayed and then performed in the followingtime periods. Let ua be the handling capacity on classification link a ∈ Ac
in terms of cars. Generally, this capacity comes from the yard structure andconfiguration, e.g. number of switch engines and flow capacity on each engine.The car handling constraint can be expressed as (5),
∑
p∈P
xpa ≤ ua ∀a ∈ Ac. (5)
More locomotives on a train can increase its hauling capacity. However, dueto the physical condition of the tracks chosen and yards passed, there is still anupper bound on the size of train. We have the train load constraint as (6),
∑
p∈P
∑
b∈B|s∈S(b)
xpb ≤ zsus ∀s ∈ S. (6)
Based on the assumption that each classification track can be assigned toonly one block at a time, the number of blocks being built in one yard should beless than the number of classification tracks in the yard. The constraint holds,although it is possible that several classification tracks are assigned to build oneblock. With B(a) being a set of blocks which starts at the yard that car holdinglink a represents, and link a is in h(b) time periods ahead of the block departingnode o(b). Therefore, we have inequality (7) as the block building constraint,
∑
b∈B(a)
yb ≤ uv(a) ∀a ∈ Ah (7)
where uv(a) stands for the maximum blocks being built in the yard at the time,represented by classification link a.
The train running constraint comes from the fact that in each time periodeach rail track can accommodate a restricted number of trains. In general,train running capacity depends on the physical track condition, track mile, thespeed and direction of each train, as well as time interval between adjacentdepartures, etc. Working at the tactical level, however, there is no need tospecify the detailed on-track delay and we assume the train running capacityonly depends on track condition. Let S(e, t) be the set of services running onphysical track e ∈ E in time period t. For each track e in rail network G, ue is
12
Integrated Service Network Design for Rail Freight Transportation
CIRRELT-2009-45
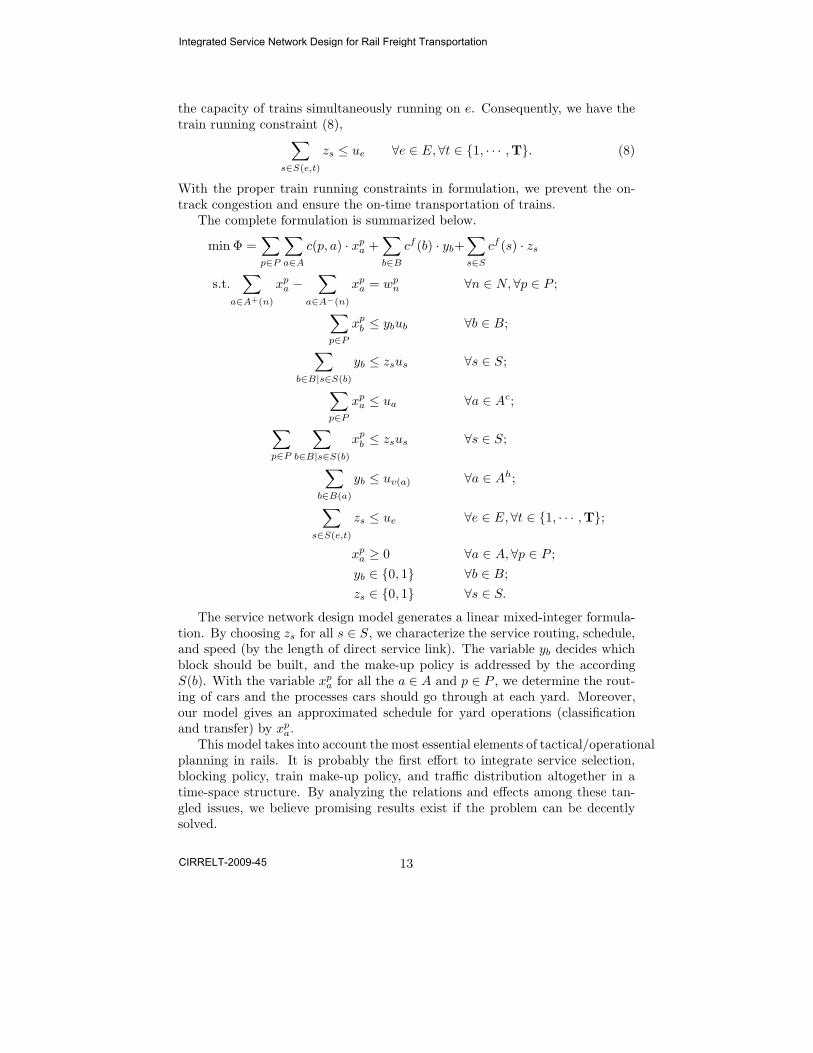
the capacity of trains simultaneously running on e. Consequently, we have thetrain running constraint (8),
∑
s∈S(e,t)
zs ≤ ue ∀e ∈ E, ∀t ∈ {1, · · · ,T}. (8)
With the proper train running constraints in formulation, we prevent the on-track congestion and ensure the on-time transportation of trains.
The complete formulation is summarized below.
min Φ =∑
p∈P
∑
a∈A
c(p, a) · xpa +
∑
b∈B
cf (b) · yb+∑
s∈S
cf (s) · zs
s.t.∑
a∈A+(n)
xpa −
∑
a∈A−(n)
xpa = wp
n ∀n ∈ N, ∀p ∈ P ;
∑
p∈P
xpb ≤ ybub ∀b ∈ B;
∑
b∈B|s∈S(b)
yb ≤ zsus ∀s ∈ S;
∑
p∈P
xpa ≤ ua ∀a ∈ Ac;
∑
p∈P
∑
b∈B|s∈S(b)
xpb ≤ zsus ∀s ∈ S;
∑
b∈B(a)
yb ≤ uv(a) ∀a ∈ Ah;
∑
s∈S(e,t)
zs ≤ ue ∀e ∈ E, ∀t ∈ {1, · · · ,T};
xpa ≥ 0 ∀a ∈ A, ∀p ∈ P ;
yb ∈ {0, 1} ∀b ∈ B;
zs ∈ {0, 1} ∀s ∈ S.
The service network design model generates a linear mixed-integer formula-tion. By choosing zs for all s ∈ S, we characterize the service routing, schedule,and speed (by the length of direct service link). The variable yb decides whichblock should be built, and the make-up policy is addressed by the accordingS(b). With the variable xp
a for all the a ∈ A and p ∈ P , we determine the rout-ing of cars and the processes cars should go through at each yard. Moreover,our model gives an approximated schedule for yard operations (classificationand transfer) by xp
a.This model takes into account the most essential elements of tactical/operational
planning in rails. It is probably the first effort to integrate service selection,blocking policy, train make-up policy, and traffic distribution altogether in atime-space structure. By analyzing the relations and effects among these tan-gled issues, we believe promising results exist if the problem can be decentlysolved.
13
Integrated Service Network Design for Rail Freight Transportation
CIRRELT-2009-45
5 Tabu Search Algorithm
The service network design model introduced above takes a special form of theFixed-cost Multi-commodity Capacitated Network Design (FMCND) formula-tion, which belongs to the NP -hard complexity class. Moreover, our model ismuch more complicated than the general FMCND because of the additionalvariables introduced and constraints considered. For instances of interestingsizes, we therefore believe only specially tailored heuristics can discover goodsolutions in a rational computing time.
Several heuristic methods have been developed for the general FMCND prob-lem. The simplest one is the add/drop procedure (e.g. Powell, 1986) based onreduced-cost calculations, that is, in each iteration, one or several arcs are in-cluded or excluded in the current design. The add/drop idea is pretty simple butis proven as inefficient on large instances. Subgradient (Farvolden and Powell,1994) and slope scaling (Kim and Pardalos, 1999) methods have also been devel-oped. These heuristics fail to explore beyond the local optimum. Even guidedby long-term memory (Crainic et al., 2004; Kim et al., 2006), the search couldstill terminate far from optimum. A simplex-based tabu search on path-basedformulation was presented by Crainic et al. (2000). The algorithm derives fromapplying column generation in the simplex method, and is capable to identifygood solutions for pretty large instances. However, the process requires a fittinglinearization of the objective function which may be inapplicable here becauseof double sets of integer variables in the model. The cycle-based neighborhoodby Ghamlouche et al. (2003) is another structure that allows meta-heuristics tofind good solutions on the network design problem. The cycle-based neighbor-hood defines moves that may explicitly consider the impact on the total designcost of potential modifications to the flow distribution of several commoditiessimultaneously. The fundamental idea is to explore the space of the designvariables by redirecting flow around cycles, closing and opening design arcs ac-cordingly. Thus, compared with link-based neighborhoods, move evaluationsare more comprehensive since all commodities on a cycle are considered, plusthe range of moves is broader because flow deviations are no longer restrictedto paths linking origins and destinations of actual commodities. A tabu searchis developed and computational experiments on problems of various sizes (upto 700 arcs and 400 commodities) show that the heuristic works quite well onthe cycle-based neighborhood. The tabu search algorithm is later strengthenedby the path relinking method (Ghamlouche et al., 2004).
The cycle-based neighborhood idea is applied here due to the promising per-formance on FMCND. As in a minimization problem, we notice in our model,services which are not used by any open block should not appear in the finaldesign, and whenever a block is open, all its component services must also beopen. Each block pattern thus has its optimal direct service pattern. The ad-vantage gives us the privilege to focus on the block design, and only implicitlyconsider the service decisions during the solution procedure. Based on the ob-servation, we define a neighborhood focusing on changing the status of blocksin the means of deviating traffic flows within a cycle in the time-space network.
14
Integrated Service Network Design for Rail Freight Transportation
CIRRELT-2009-45
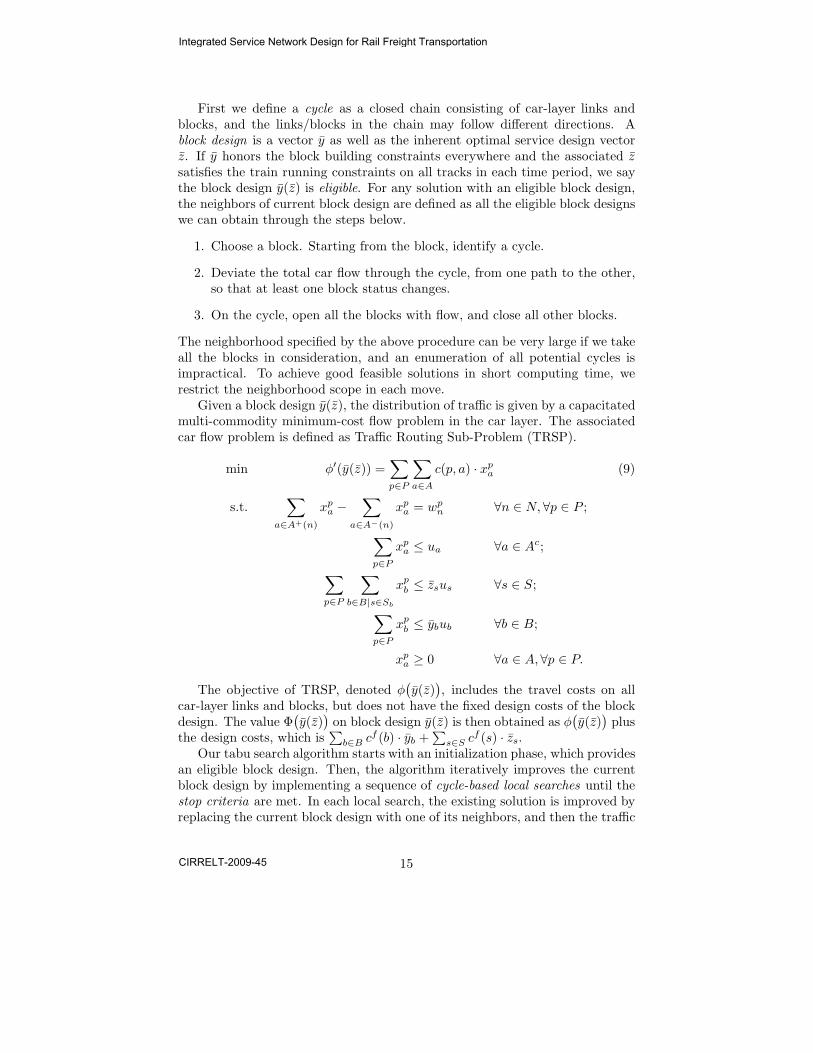
First we define a cycle as a closed chain consisting of car-layer links andblocks, and the links/blocks in the chain may follow different directions. Ablock design is a vector y as well as the inherent optimal service design vectorz. If y honors the block building constraints everywhere and the associated zsatisfies the train running constraints on all tracks in each time period, we saythe block design y(z) is eligible. For any solution with an eligible block design,the neighbors of current block design are defined as all the eligible block designswe can obtain through the steps below.
1. Choose a block. Starting from the block, identify a cycle.
2. Deviate the total car flow through the cycle, from one path to the other,so that at least one block status changes.
3. On the cycle, open all the blocks with flow, and close all other blocks.
The neighborhood specified by the above procedure can be very large if we takeall the blocks in consideration, and an enumeration of all potential cycles isimpractical. To achieve good feasible solutions in short computing time, werestrict the neighborhood scope in each move.
Given a block design y(z), the distribution of traffic is given by a capacitatedmulti-commodity minimum-cost flow problem in the car layer. The associatedcar flow problem is defined as Traffic Routing Sub-Problem (TRSP).
min φ′(y(z)) =∑
p∈P
∑
a∈A
c(p, a) · xpa (9)
s.t.∑
a∈A+(n)
xpa −
∑
a∈A−(n)
xpa = wp
n ∀n ∈ N, ∀p ∈ P ;
∑
p∈P
xpa ≤ ua ∀a ∈ Ac;
∑
p∈P
∑
b∈B|s∈Sb
xpb ≤ zsus ∀s ∈ S;
∑
p∈P
xpb ≤ ybub ∀b ∈ B;
xpa ≥ 0 ∀a ∈ A, ∀p ∈ P.
The objective of TRSP, denoted φ(
y(z))
, includes the travel costs on allcar-layer links and blocks, but does not have the fixed design costs of the blockdesign. The value Φ
(
y(z))
on block design y(z) is then obtained as φ(
y(z))
plusthe design costs, which is
∑
b∈B cf (b) · yb +∑
s∈S cf (s) · zs.Our tabu search algorithm starts with an initialization phase, which provides
an eligible block design. Then, the algorithm iteratively improves the currentblock design by implementing a sequence of cycle-based local searches until thestop criteria are met. In each local search, the existing solution is improved byreplacing the current block design with one of its neighbors, and then the traffic
15
Integrated Service Network Design for Rail Freight Transportation
CIRRELT-2009-45
distribution is determined by the associated TRSP. When we reach a promisingarea, an intensification phase is called for further improvement. In case theimprovement of a local search is insignificant or no good neighbor shows up,diversification is launched to escape from the local optimum. Schematically, anoutline of the tabu search algorithm is written as,
1. Initialization.
2. Repeat until stop criteria are met,
• cycle-based local search;
• if the current solution is better than or close to the best overall,intensification;
• else if the improvement is negligible, diversification.
3. Stop.
In the following, we describe the main algorithmic choices and detail eachprocedure, except the stop criteria which will be set within computational ex-periments.
5.1 Initialization
The initialization phase provides us an initial eligible block design. In order tosatisfy the customers’ demands to the maximum extent, it is preferable to openall potential blocks in the very beginning. However, the train running capacityand the block building capacity prevent us from opening all the blocks.
An integer programming formulation is solved to generate an eligible blockdesign with a maximal number of blocks. The problem has two sets of binarydecision variables on blocks and services correspondingly. The objective (10) isto maximize the number of open blocks, subject to block building constraintsand train running constraints, as well as the linking constraints between blocksand services. The IP problem is then solved by the branch-and-bound method.As there is little need to find the optimal solution for the initial problem, thesolving procedure stops when a near-optimal solution is obtained in a short
16
Integrated Service Network Design for Rail Freight Transportation
CIRRELT-2009-45
time.
max∑
b∈B
yb (10)
s.t.∑
b∈B|s∈S(b)
yb ≤ zsus ∀s ∈ S;
∑
b∈B(a)
yb ≤ uv(a) ∀a ∈ Ah;
∑
s∈S(e,t)
zs ≤ ue ∀e ∈ E, ∀t ∈ {1, · · · ,T};
yb ∈ {0, 1} ∀b ∈ B;
zs ∈ {0, 1} ∀s ∈ S.
By opening as many blocks as possible, the initial block design leads topreposterously large design costs on both blocks and services. Nevertheless, theextra high fixed cost cannot guarantee the feasible flow of cars. This is due to theadditional constraints considered in the model, coming from the car handlingcapacity restricting the number of cars that can be classified at each yard, aswell as the car flow capacity on each block. The infeasibility of the accordingTRSP is avoided by introducing the artificial links (or super itineraries) in thecar layer. For each traffic class, an artificial link is appended, from the IN nodethat represents the receiving of the demand to the IN node that correspondsto the destination. The length of the artificial link equals to the due transithour of the traffic class. Each artificial link receives the same flow capacity asthe demand of the associated traffic, and an arbitrarily high flow cost ensuresthat the artificial link will bear positive flow only if the distribution is infeasible.With the additional artificial links, the associated TRSP always has a solutionirrespective of the current block design. Our algorithm will start with the initialeligible block design, regardless if the artificial links are used or not, and try toreach a feasible distribution before meeting the stop criteria.
5.2 Residual Network and Local Search
Starting from an initial block design, we progress to improve the current solutionby running a series of local searches. The intention of local search is to divertflows following a cycle, so that the status of one or several blocks is modified,which leads to significant modification of traffic flows. Keeping the idea inmind, we are particularly interested in the cycles bearing enough flow and afterdeviation flows on some blocks are empty so that those blocks are free to close.
First, we define residual value the flow volume one can deviate around thecycle. Consequently, we are interested in such cycles with their residual valueequal to the flow on one open block. On a block design y(z), we denote Γ asthe set of flow volumes on all open blocks,
Γ(y) = {∑
p∈P
xpb > 0, b ∈ B and yb = 1}.
17
Integrated Service Network Design for Rail Freight Transportation
CIRRELT-2009-45
4321
n−OUT
n−IN
m−OUT
m−IN
Car Layer
open blockclose block
classification link
i 3 i 4
i 2i 1
i 5 i 6
1 2
3 4
5 6
t =
Residual Networkγ
i
i i
i i
icar waiting link
car holding link
0
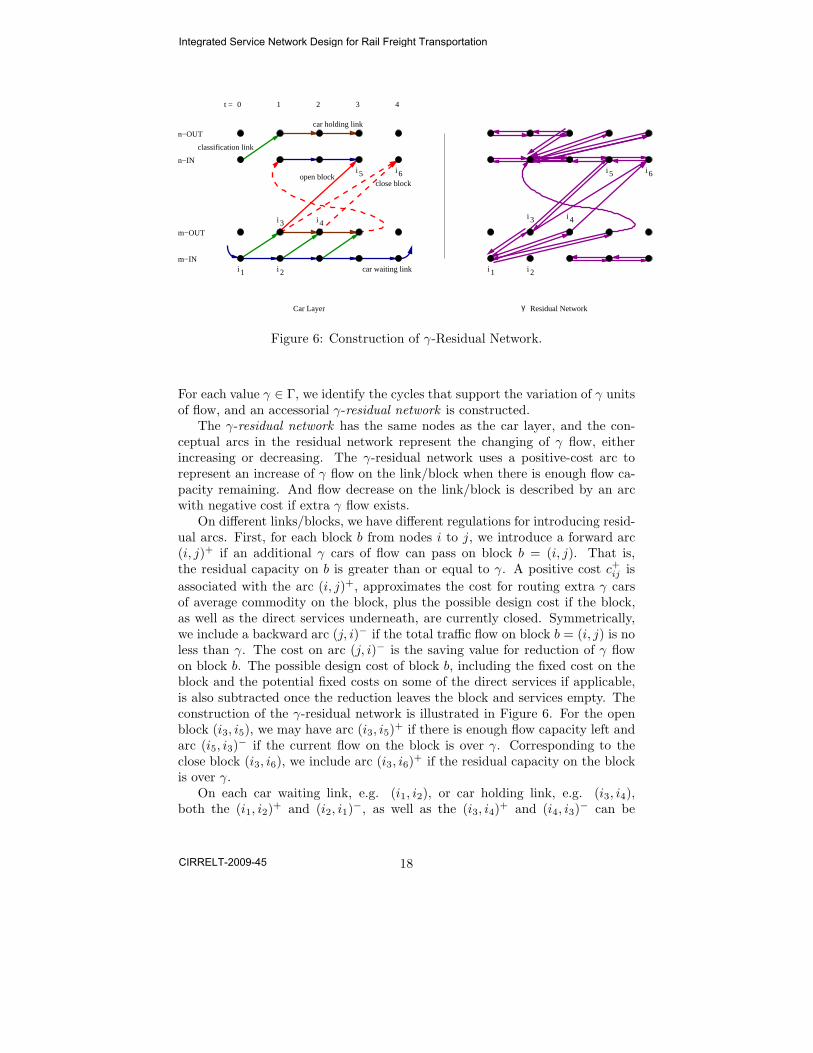
Figure 6: Construction of γ-Residual Network.
For each value γ ∈ Γ, we identify the cycles that support the variation of γ unitsof flow, and an accessorial γ-residual network is constructed.
The γ-residual network has the same nodes as the car layer, and the con-ceptual arcs in the residual network represent the changing of γ flow, eitherincreasing or decreasing. The γ-residual network uses a positive-cost arc torepresent an increase of γ flow on the link/block when there is enough flow ca-pacity remaining. And flow decrease on the link/block is described by an arcwith negative cost if extra γ flow exists.
On different links/blocks, we have different regulations for introducing resid-ual arcs. First, for each block b from nodes i to j, we introduce a forward arc(i, j)+ if an additional γ cars of flow can pass on block b = (i, j). That is,the residual capacity on b is greater than or equal to γ. A positive cost c+
ij is
associated with the arc (i, j)+, approximates the cost for routing extra γ carsof average commodity on the block, plus the possible design cost if the block,as well as the direct services underneath, are currently closed. Symmetrically,we include a backward arc (j, i)− if the total traffic flow on block b = (i, j) is noless than γ. The cost on arc (j, i)− is the saving value for reduction of γ flowon block b. The possible design cost of block b, including the fixed cost on theblock and the potential fixed costs on some of the direct services if applicable,is also subtracted once the reduction leaves the block and services empty. Theconstruction of the γ-residual network is illustrated in Figure 6. For the openblock (i3, i5), we may have arc (i3, i5)
+ if there is enough flow capacity left andarc (i5, i3)
− if the current flow on the block is over γ. Corresponding to theclose block (i3, i6), we include arc (i3, i6)
+ if the residual capacity on the blockis over γ.
On each car waiting link, e.g. (i1, i2), or car holding link, e.g. (i3, i4),both the (i1, i2)
+ and (i2, i1)−, as well as the (i3, i4)
+ and (i4, i3)− can be
18
Integrated Service Network Design for Rail Freight Transportation
CIRRELT-2009-45
defined following the same principle above. Particularly, we always have arc(i1, i2)
+ and arc (i3, i4)+ since there is no flow capacity applicable on both car
waiting links and car holding links. Focusing our attention on design decisions,instead of constructing residual arcs for each classification link, we aggregatethe classification flows and build residual arcs to represent adding/subtractingflows on in-yard paths made of classification links, car waiting links and carholding links between each IN-OUT node pair. For example, an arc (i1, i4)
+
is used to represent that extra γ flow is added between i1 and i4, precisely onpaths (i1 → i2 → i4) and (i1 → i3 → i4). If the total flow on these pathsexceeds γ, an arc (i4, i1)
− is included on which we associate a negative cost torepresent the saving for the decline of γ flow on the in-yard paths between i1and i4.
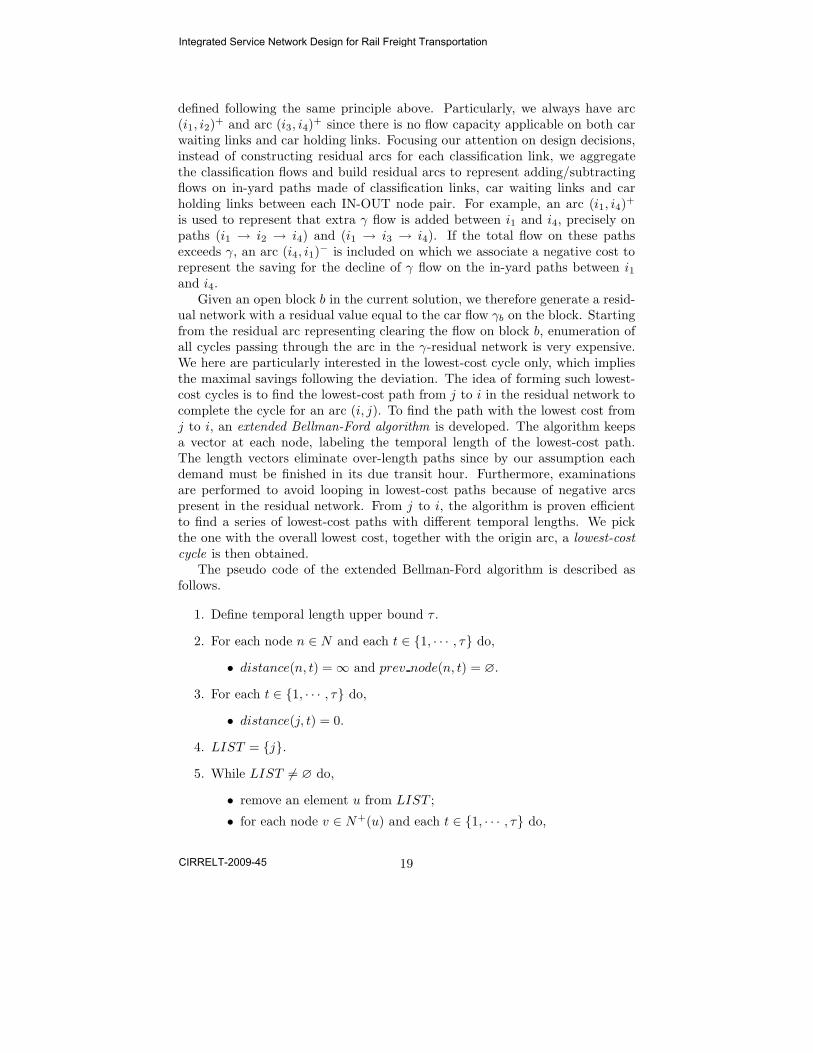
Given an open block b in the current solution, we therefore generate a resid-ual network with a residual value equal to the car flow γb on the block. Startingfrom the residual arc representing clearing the flow on block b, enumeration ofall cycles passing through the arc in the γ-residual network is very expensive.We here are particularly interested in the lowest-cost cycle only, which impliesthe maximal savings following the deviation. The idea of forming such lowest-cost cycles is to find the lowest-cost path from j to i in the residual network tocomplete the cycle for an arc (i, j). To find the path with the lowest cost fromj to i, an extended Bellman-Ford algorithm is developed. The algorithm keepsa vector at each node, labeling the temporal length of the lowest-cost path.The length vectors eliminate over-length paths since by our assumption eachdemand must be finished in its due transit hour. Furthermore, examinationsare performed to avoid looping in lowest-cost paths because of negative arcspresent in the residual network. From j to i, the algorithm is proven efficientto find a series of lowest-cost paths with different temporal lengths. We pickthe one with the overall lowest cost, together with the origin arc, a lowest-cost
cycle is then obtained.The pseudo code of the extended Bellman-Ford algorithm is described as
follows.
1. Define temporal length upper bound τ .
2. For each node n ∈ N and each t ∈ {1, · · · , τ} do,
• distance(n, t) = ∞ and prev node(n, t) = ∅.
3. For each t ∈ {1, · · · , τ} do,
• distance(j, t) = 0.
4. LIST = {j}.
5. While LIST 6= ∅ do,
• remove an element u from LIST ;
• for each node v ∈ N+(u) and each t ∈ {1, · · · , τ} do,
19
Integrated Service Network Design for Rail Freight Transportation
CIRRELT-2009-45
0 1 98
OUT
IN
OUT
IN
OUT
IN
OUT
IN
Yard A
Yard B
Yard C
Yard D
b2
5
b6
O3
O
O1O2
D1D2D D3 4
b
(−,10,15,−)
(4000,50,20,100)
(5000,60,20,150)
(−,5,15,−)
(−,25,20,60)
(−,20,20,80) (−,20,15,80)(−,20,80,80)
(6000,75,15,200)
b4
b1
4
Block Projection Classification LinkCar Waiting Link Car Holding Link
Figure 7: Solution in 2-Layer Time-Space Network (Projection).
– t′ = t + len(u, v);
– if t′ ≤ τ and distance(v, t′) > distance(u, t) + costu,v and v isnot in the path from j to u do,
∗ distance(v, t′) = distance(u, t) + costu,v;
∗ prev node(v, t′) = u;
∗ if v /∈ LIST , then add v to LIST .
6. Stop.
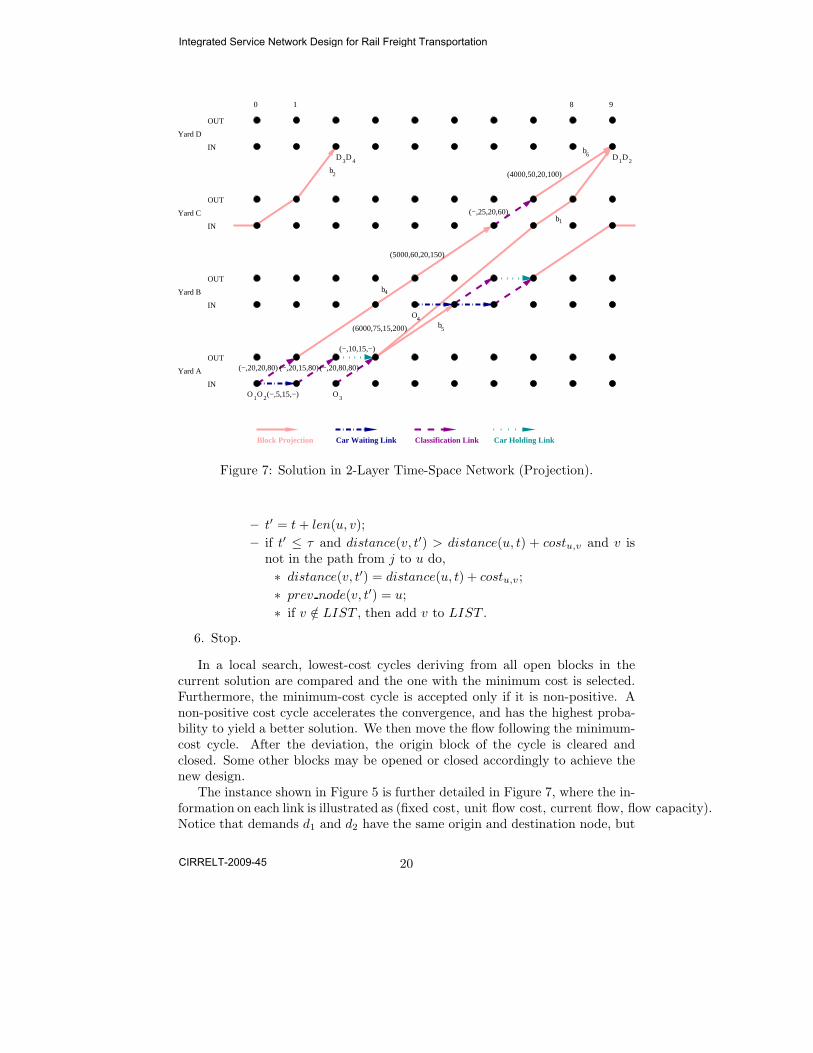
In a local search, lowest-cost cycles deriving from all open blocks in thecurrent solution are compared and the one with the minimum cost is selected.Furthermore, the minimum-cost cycle is accepted only if it is non-positive. Anon-positive cost cycle accelerates the convergence, and has the highest proba-bility to yield a better solution. We then move the flow following the minimum-cost cycle. After the deviation, the origin block of the cycle is cleared andclosed. Some other blocks may be opened or closed accordingly to achieve thenew design.
The instance shown in Figure 5 is further detailed in Figure 7, where the in-formation on each link is illustrated as (fixed cost, unit flow cost, current flow, flow capacity).Notice that demands d1 and d2 have the same origin and destination node, but
20
Integrated Service Network Design for Rail Freight Transportation
CIRRELT-2009-45
0 1 98
OUT
IN
OUT
IN
OUT
IN
OUT
IN
Yard A
Yard B
Yard C
Yard D
(−5000)
(1500)
(800)
(−6200)
(100)
(200)
Residual Arc
i(−1000)
i
i
i i 2
3
1
i 4
5
6
7
i
(−800)
Figure 8: A Lowest-Cost Cycle in Residual Network.
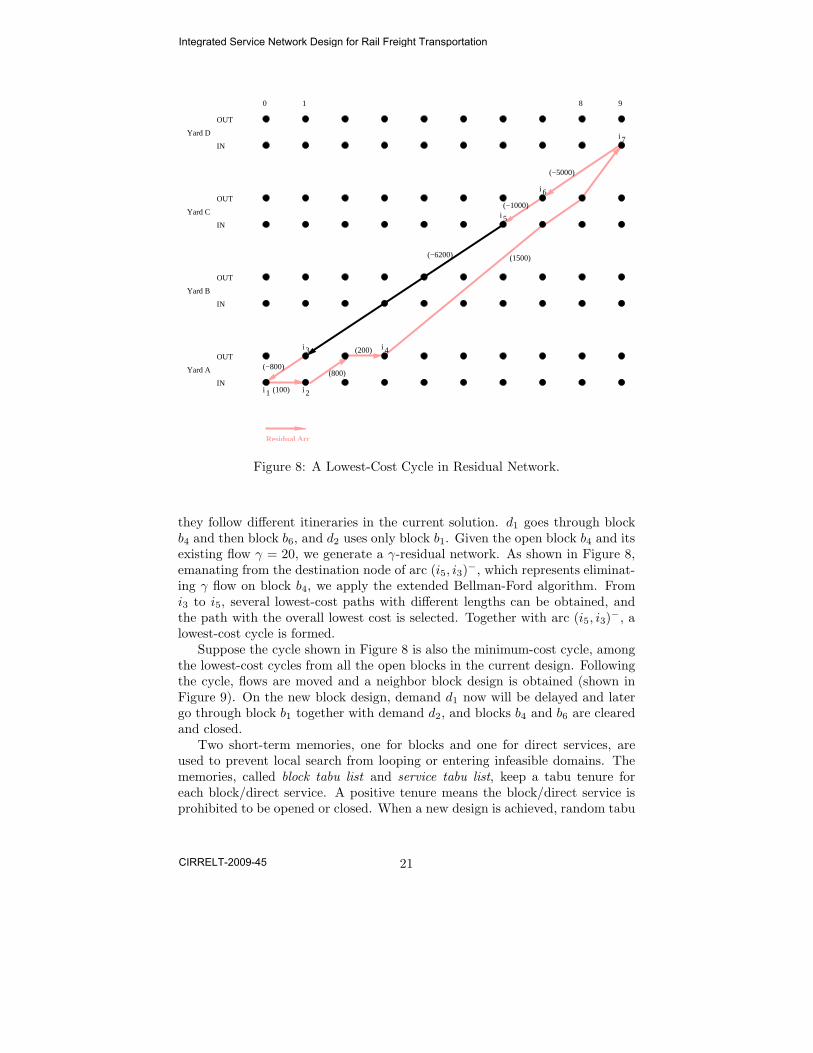
they follow different itineraries in the current solution. d1 goes through blockb4 and then block b6, and d2 uses only block b1. Given the open block b4 and itsexisting flow γ = 20, we generate a γ-residual network. As shown in Figure 8,emanating from the destination node of arc (i5, i3)
−, which represents eliminat-ing γ flow on block b4, we apply the extended Bellman-Ford algorithm. Fromi3 to i5, several lowest-cost paths with different lengths can be obtained, andthe path with the overall lowest cost is selected. Together with arc (i5, i3)
−, alowest-cost cycle is formed.
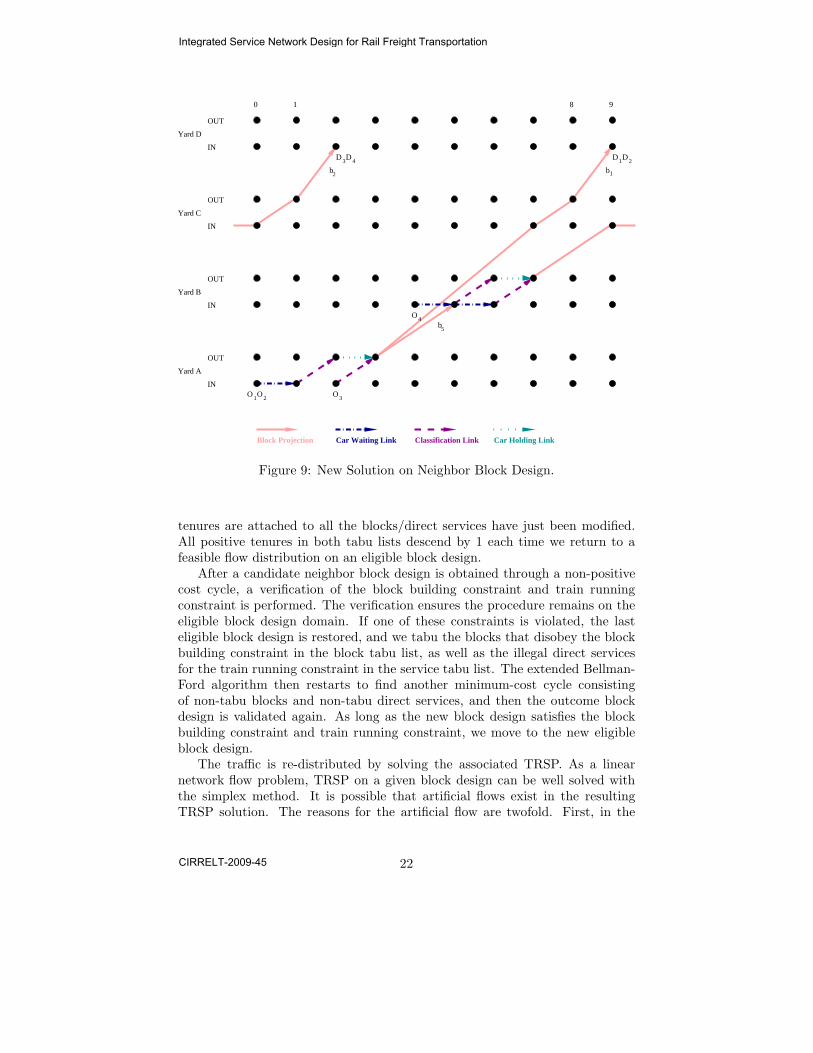
Suppose the cycle shown in Figure 8 is also the minimum-cost cycle, amongthe lowest-cost cycles from all the open blocks in the current design. Followingthe cycle, flows are moved and a neighbor block design is obtained (shown inFigure 9). On the new block design, demand d1 now will be delayed and latergo through block b1 together with demand d2, and blocks b4 and b6 are clearedand closed.
Two short-term memories, one for blocks and one for direct services, areused to prevent local search from looping or entering infeasible domains. Thememories, called block tabu list and service tabu list, keep a tabu tenure foreach block/direct service. A positive tenure means the block/direct service isprohibited to be opened or closed. When a new design is achieved, random tabu
21
Integrated Service Network Design for Rail Freight Transportation
CIRRELT-2009-45
0 1 98
OUT
IN
OUT
IN
OUT
IN
OUT
IN
Yard A
Yard B
Yard C
Yard D
b1b2
5
O3
O4
O1O2
D1D2D D3 4
b
Block Projection Classification LinkCar Waiting Link Car Holding Link
Figure 9: New Solution on Neighbor Block Design.
tenures are attached to all the blocks/direct services have just been modified.All positive tenures in both tabu lists descend by 1 each time we return to afeasible flow distribution on an eligible block design.
After a candidate neighbor block design is obtained through a non-positivecost cycle, a verification of the block building constraint and train runningconstraint is performed. The verification ensures the procedure remains on theeligible block design domain. If one of these constraints is violated, the lasteligible block design is restored, and we tabu the blocks that disobey the blockbuilding constraint in the block tabu list, as well as the illegal direct servicesfor the train running constraint in the service tabu list. The extended Bellman-Ford algorithm then restarts to find another minimum-cost cycle consistingof non-tabu blocks and non-tabu direct services, and then the outcome blockdesign is validated again. As long as the new block design satisfies the blockbuilding constraint and train running constraint, we move to the new eligibleblock design.
The traffic is re-distributed by solving the associated TRSP. As a linearnetwork flow problem, TRSP on a given block design can be well solved withthe simplex method. It is possible that artificial flows exist in the resultingTRSP solution. The reasons for the artificial flow are twofold. First, in the
22
Integrated Service Network Design for Rail Freight Transportation
CIRRELT-2009-45
local search procedure, we failed to explicitly take the train load constraint intoaccount, and the defacto relaxation may lead to an overflow on some services.Second, we move a group of demand flows at each time. As a common part oftraffic itineraries is replaced, the modification may not be practicable for all therelative demands. A restoration phase is then implemented to regain a feasibleflow distribution. The restoration phase is similar to the local search procedure.However, we generate cycles deriving from artificial links instead of open blocks,and the residual value set is restricted to the flow volumes on artificial links.
The local search procedure is synthesized below.
1. Given the current solution, for each open block b do,
• determine the current flow γ on block b ;
• construct the γ-residual network;
• based on block b, apply the extended Bellman-Ford algorithm todetermine a set of lowest-cost paths with different lengths by non-tabu blocks and direct services;
• pick the path with the lowest cost, and form a lowest-cost cycle;
• update the minimum-cost cycle.
2. If the minimum-cost cycle is non-positive do,
• following the minimum-cost cycle, obtain a candidate block design;
• update block tabu list and service tabu list ;
• if the candidate block design is eligible,
– move to the candidate block design by opening and closing theappropriate blocks and the associated direct services;
– solve the associated TRSP;
– if artificial links are used, restoration;
3. Stop.
The local search performs the basic search move in the cycle-based neighbor-hood. Compared with the cycle-based tabu search by Ghamlouche et al. (2003),in which the algorithm evaluates all the cycles coming from all the links, ourlocal search is restricted to the cycles deriving from blocks currently open, andwe only adopt the non-positive cycles. Furthermore, in our algorithm, we focusour attention on the design decisions only, and leave the in-yard flow determinedby the network flow problem. All these arrangements impel the procedure toconverge faster, and enable us to find superior solutions within logical solvingtime.
23
Integrated Service Network Design for Rail Freight Transportation
CIRRELT-2009-45
5.3 Intensification
One of the privileges of the cycle-based neighborhood is the wide range of movesin the solution space. However, when working in a petite promising space,it becomes a drawback and the search may “step over” the optimum with afaulty cycle, which shows a considerable cost reduction but leads to an infeasiblesolution. We propose the intensification, a supplementary procedure aims toelaborately polish the current solution. Two separate intensification phases areemployed in a sequence.
In the first intensification phase, an elite service network design problemis solved. The elite problem has the same formulation as the original model,and only includes the opening blocks as well as their “parallel” blocks – theblocks with the same routing departing at the previous time point as well as thenext time point. The elite problem integrates many cycles that represent post-pone/advance the existing open blocks for one period, and it helps to convergesteeply by avoiding the analysis of a sequence of “small” cycles separately. Withonly a few variables considered, the elite problem is tractable with the branch-and-bound method.
No matter the first intensification progresses or not, we implement a secondphase. The second phase can be viewed as a special local search procedure,and we consider the flow of a demand at each time, assuming the flows of otherdemands remain unchanged. The same cycle-based neighborhood definition isapplied. As in the local search, a set of residual values is first determined, whichis the flow of a traffic class on every open block. For a traffic class p ∈ P , Γp
is then defined as Γp(y) = {xpb > 0, b ∈ B and yb = 1}. A γ-residual network
is built based on each γ, and the lowest-cost cycles are formed and evaluated.Moves are adapted only if the minimum-cost cycle has negative value. Theprocess repeats until no negative cycle is detected in any γ-residual network,and then the process continues to the next traffic p. Since the pivots in theintensification phase concern the flow of one traffic class only, there is no needto re-solve the associated TRSP every time. Car flows will be shifted by hand,as long as the train load constraints are satisfied.
The intensification phases are implemented when reaching a hopeful solutionarea, that is, when a new best or near-best solution is found.
5.4 Diversification
In case the local search fails to improve the current best solution, or the improve-ment is insignificant, it implies that we are encaged in a local optimum. As weare working in a huge solution space, being trapped in a local area is inevitable.To jailbreak from the local optima, we develop a diversification process.
The diversification is actualized by two long-term memories, which are usedto keep the opening frequency for blocks and direct services. These memories aredenoted as block frequency list and service frequency list, respectively. Each timea feasible flow distribution on an eligible block design is obtained, we accumulatethe opening frequencies of all the open blocks and open direct services by 1 in
24
Integrated Service Network Design for Rail Freight Transportation
CIRRELT-2009-45
frequency lists.To diversify the solution space, a small fraction of open blocks with high
opening frequencies are forced to close. Also, tabu tenures of these blocks areupdated to avoid returning back in the following several local searches. Samestrategy is applied on direct services, and by closing the most-opened directservices, all blocks passing on the direct service are also closed. Furthermore, toprevent closing the same backbone block repeatedly, an additional local memoryis adopted to keep the diversification history.
With the closure of several essential blocks, artificial links might be used tocarry extra flows. Restoration process is applied to find an alternative blockdesign and recover the feasible traffic distribution. The local search will restartthere when a feasible solution is achieved.
6 Experiments
To evaluate the performance of the tabu search algorithm proposed, experimentsare implemented.
6.1 Random Instances
The input of the model includes the physical characteristics, demand pattern, aswell as the potential direct services and blocks. Deriving from the rail system,the physical network features and demand pattern are straightforward, and canbe easily accessed. Furthermore, we suppose that a complete list of possibledirect services is also known. The potential blocks are provided by a block
generation process.By definition, a block is a path constructed by direct services together with
transfer links and transfer delay links. In the block layer, starting from an OUTnode, each block has to start with a direct service. To ensure that the block alsoends with a direct service, instead of searching a path between the origin OUTnode i to a destination IN node j, we first build a path from i to another OUTnode k, where k indicates a different yard from i. A simple deep-first-searchalgorithm is applied to enumerate all paths from i to every other OUT node k,and then each path is attached with a direct service departing from k if thereexists, so that one complete block is formed.
The potential blocks we generate should be practicable, which is always re-stricted by the equipments, environment, operation time, transportation laws,human resources, etc. For example, the total travelling time for a block shouldbe less than a preset amount of time, e.g. T − 1, the over-flexuous blocks andthe blocks following a loop in the physical network should always be pruned,etc. These restrictions are denoted as application constraints. The applicationconstraints are closely related to individual instance, and different rails couldhave different application constraints according to their company policy, scale,location, etc. By erasing the redundant and impracticable blocks, these appli-cation constraints may dramatically simplify the time-space network, and show
25
Integrated Service Network Design for Rail Freight Transportation
CIRRELT-2009-45
Inst Block D-Serv Yard Track Time Demands01 360 160 3 6 10 30s02 270 140 3 6 10 60s03 310 140 3 6 10 90s04 1340 400 4 10 10 40s05 720 280 4 10 10 80s06 660 280 4 10 10 120s07 1790 680 5 18 10 50s08 1050 500 5 18 10 100s09 1420 620 5 18 10 150
Table 1: Instance Set S
great effects on the solution procedure.The instances tested are randomly generated. Even with the same physical
magnitude and the same time horizon, random instances greatly differ in thenumber of blocks and services. Moreover, various constraints on different op-erations with diverse resources make it impossible to unify the compact/looseconcept between all capacities and flows in the 2-layer time-space network. Therelative ratio between fixed cost and flow cost is also hard to specify becausewe have fixed costs from both blocks and services. As a result, we leave thevariance of the instances to randomicity, and for each combination of physi-cal magnitude and time horizon, three instances are produced with increasingdemand numbers to roughly partition the car flow density.
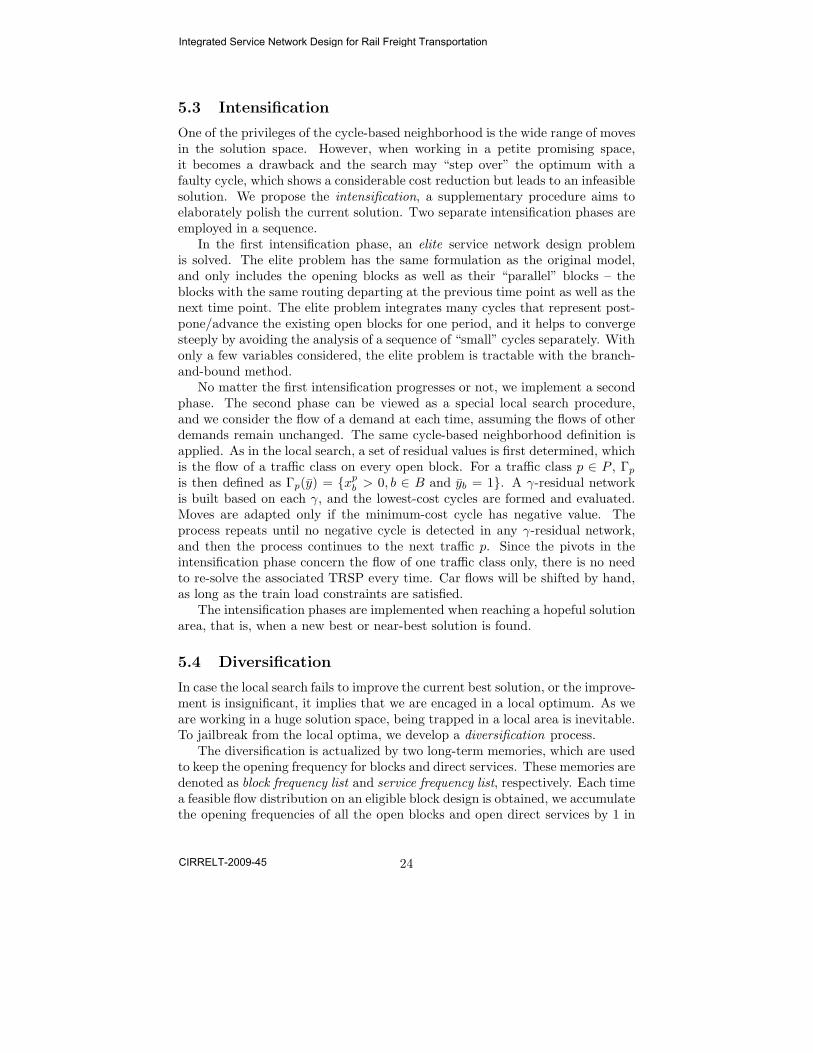
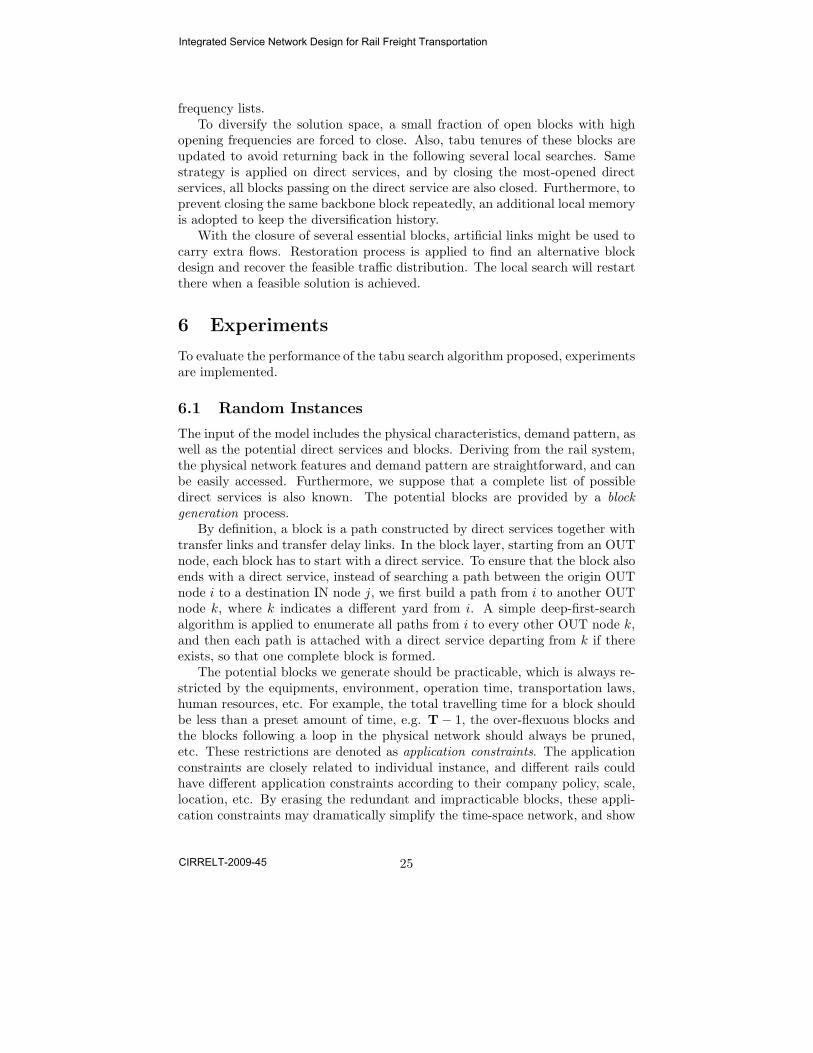
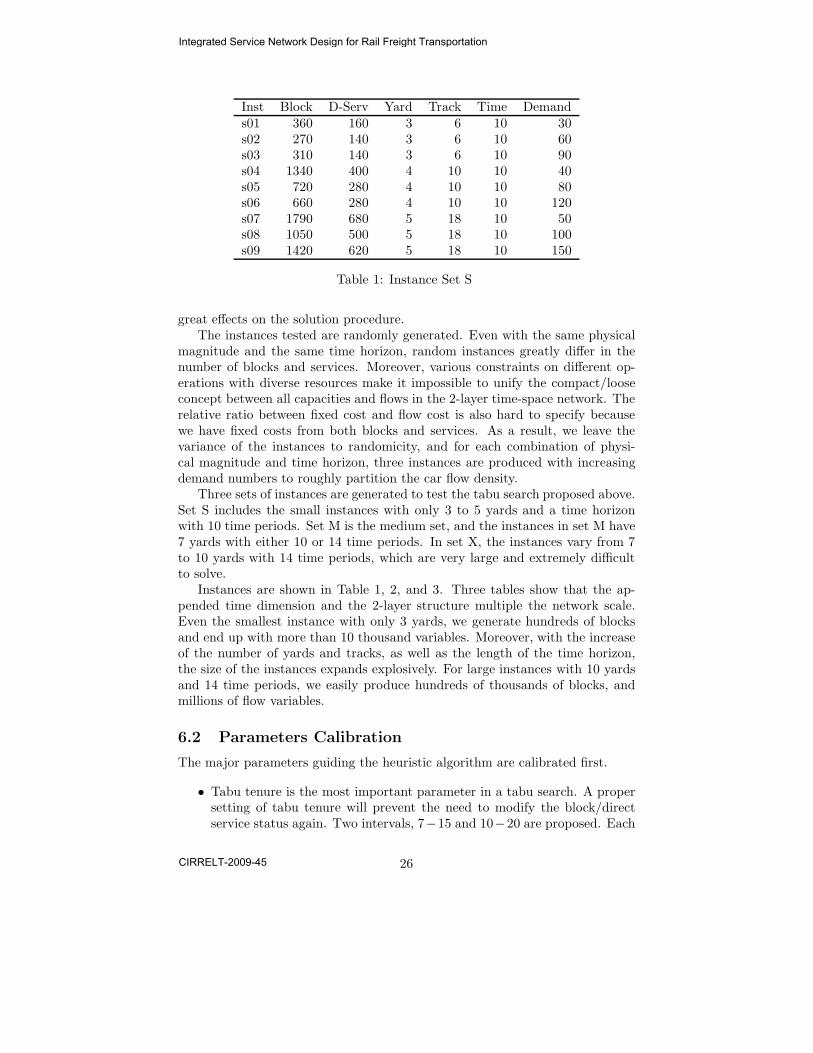
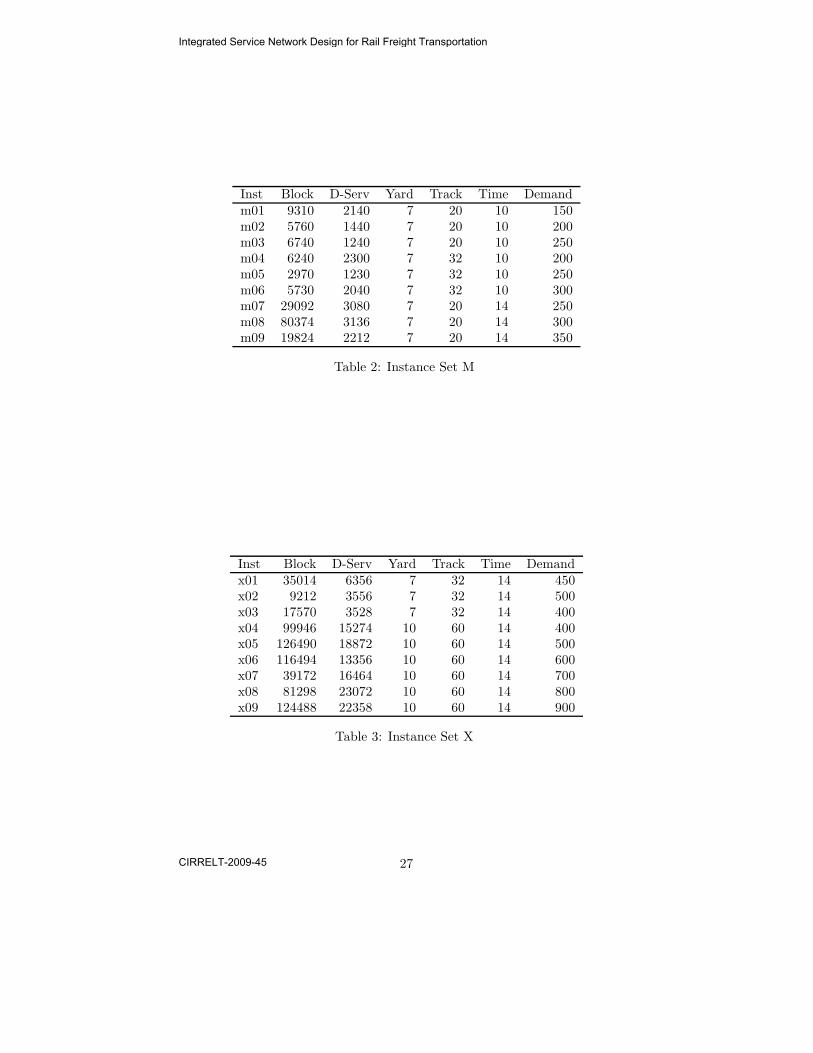
Three sets of instances are generated to test the tabu search proposed above.Set S includes the small instances with only 3 to 5 yards and a time horizonwith 10 time periods. Set M is the medium set, and the instances in set M have7 yards with either 10 or 14 time periods. In set X, the instances vary from 7to 10 yards with 14 time periods, which are very large and extremely difficultto solve.
Instances are shown in Table 1, 2, and 3. Three tables show that the ap-pended time dimension and the 2-layer structure multiple the network scale.Even the smallest instance with only 3 yards, we generate hundreds of blocksand end up with more than 10 thousand variables. Moreover, with the increaseof the number of yards and tracks, as well as the length of the time horizon,the size of the instances expands explosively. For large instances with 10 yardsand 14 time periods, we easily produce hundreds of thousands of blocks, andmillions of flow variables.
6.2 Parameters Calibration
The major parameters guiding the heuristic algorithm are calibrated first.
• Tabu tenure is the most important parameter in a tabu search. A propersetting of tabu tenure will prevent the need to modify the block/directservice status again. Two intervals, 7−15 and 10−20 are proposed. Each
26
Integrated Service Network Design for Rail Freight Transportation
CIRRELT-2009-45
Inst Block D-Serv Yard Track Time Demandm01 9310 2140 7 20 10 150m02 5760 1440 7 20 10 200m03 6740 1240 7 20 10 250m04 6240 2300 7 32 10 200m05 2970 1230 7 32 10 250m06 5730 2040 7 32 10 300m07 29092 3080 7 20 14 250m08 80374 3136 7 20 14 300m09 19824 2212 7 20 14 350
Table 2: Instance Set M
Inst Block D-Serv Yard Track Time Demandx01 35014 6356 7 32 14 450x02 9212 3556 7 32 14 500x03 17570 3528 7 32 14 400x04 99946 15274 10 60 14 400x05 126490 18872 10 60 14 500x06 116494 13356 10 60 14 600x07 39172 16464 10 60 14 700x08 81298 23072 10 60 14 800x09 124488 22358 10 60 14 900
Table 3: Instance Set X
27
Integrated Service Network Design for Rail Freight Transportation
CIRRELT-2009-45
TabuTenure IntensThreshold DiversRatio Sol. Score Time Score Ttl Score07-15 5% 8% 47 43 9007-15 5% 10% 41 51 9207-15 5% 15% 64 30 9407-15 7% 8% 46 39 8507-15 7% 10% 35 48 8307-15 7% 15% 59 27 8610-20 5% 8% 48 40 8810-20 5% 10% 35 32 6710-20 5% 15% 49 47 9610-20 7% 8% 35 41 7610-20 7% 10% 42 45 8710-20 7% 15% 57 35 92
Table 4: Parameter Calibration
time a tabu status is updated, either in block tabu list or service tabulist, a random tenure is selected in the interval and is associated to theaccording block or direct service.
• To conduct the intensification phase, a threshold is used to determinethe good solutions. When the gap between the current solution and thebest solution so far is less than the threshold, the intensification phase istriggered. Two values, 5% and 7%, are compared.
• The diversification percentage figures out the variance range in each di-versification phase, and manages the searching scope of the algorithm.Either the 8%, 10% or 15% top-frequency blocks/services are closed indiversification phase.
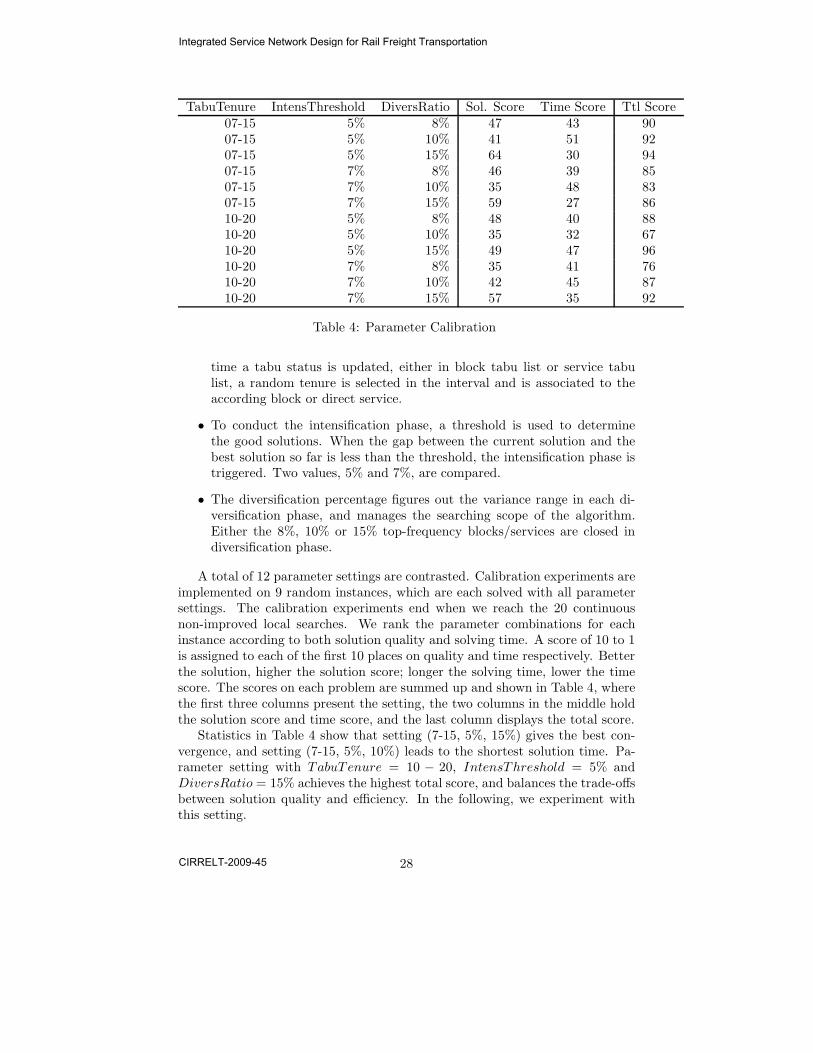
A total of 12 parameter settings are contrasted. Calibration experiments areimplemented on 9 random instances, which are each solved with all parametersettings. The calibration experiments end when we reach the 20 continuousnon-improved local searches. We rank the parameter combinations for eachinstance according to both solution quality and solving time. A score of 10 to 1is assigned to each of the first 10 places on quality and time respectively. Betterthe solution, higher the solution score; longer the solving time, lower the timescore. The scores on each problem are summed up and shown in Table 4, wherethe first three columns present the setting, the two columns in the middle holdthe solution score and time score, and the last column displays the total score.
Statistics in Table 4 show that setting (7-15, 5%, 15%) gives the best con-vergence, and setting (7-15, 5%, 10%) leads to the shortest solution time. Pa-rameter setting with TabuTenure = 10 − 20, IntensThreshold = 5% andDiversRatio = 15% achieves the highest total score, and balances the trade-offsbetween solution quality and efficiency. In the following, we experiment withthis setting.
28
Integrated Service Network Design for Rail Freight Transportation
CIRRELT-2009-45
6.3 Result Analysis
The instances in Table 1, 2, 3 are then put into the proposed tabu searchalgorithm. The program is coded in C++ under Linux. All instances are testedon the computers with the same configuration: AMD 2.4G CPU and 16GBMEM.
For comparison purposes, the instances are also solved by CPLEX, a state-of-the-art mathematical solver. CPLEX v.10.1.1 is applied, and the implemen-tation is coded and tested under the same programming language and computa-tional environment as the tabu search program. The CPLEX solver stops eitherwhen the optimum is found or when we reach the maximum CPU time (t = 10hours = 36, 000 sec).
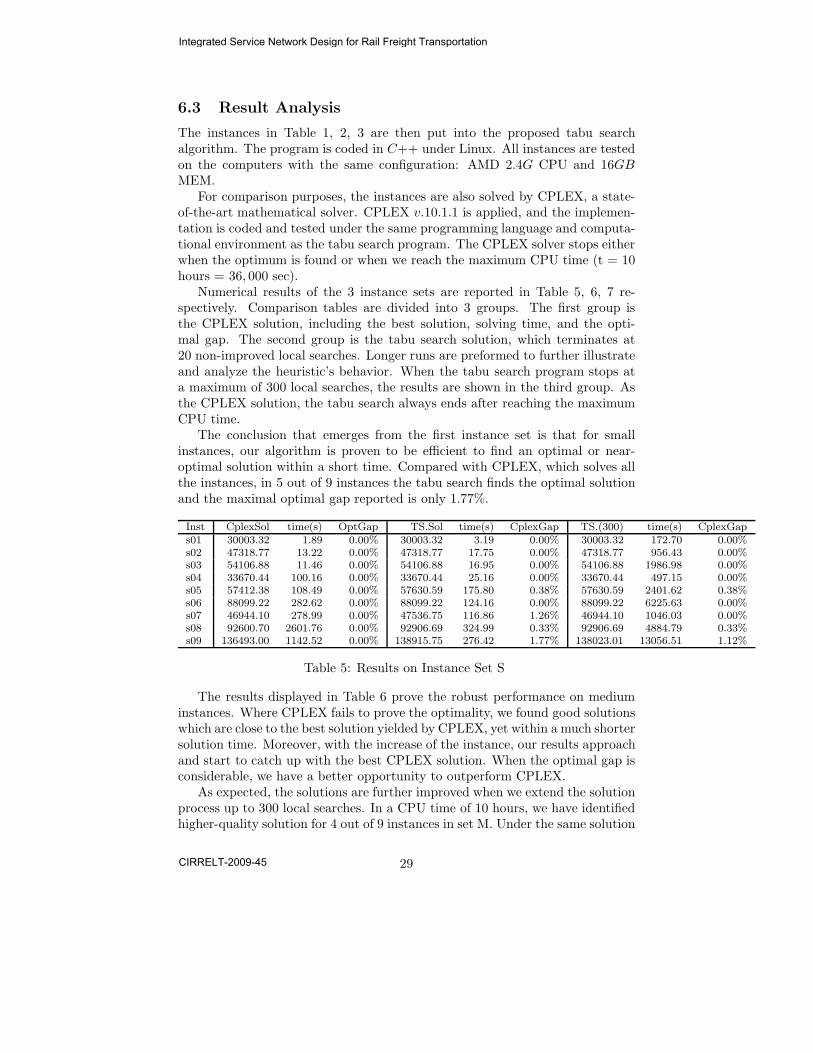
Numerical results of the 3 instance sets are reported in Table 5, 6, 7 re-spectively. Comparison tables are divided into 3 groups. The first group isthe CPLEX solution, including the best solution, solving time, and the opti-mal gap. The second group is the tabu search solution, which terminates at20 non-improved local searches. Longer runs are preformed to further illustrateand analyze the heuristic’s behavior. When the tabu search program stops ata maximum of 300 local searches, the results are shown in the third group. Asthe CPLEX solution, the tabu search always ends after reaching the maximumCPU time.
The conclusion that emerges from the first instance set is that for smallinstances, our algorithm is proven to be efficient to find an optimal or near-optimal solution within a short time. Compared with CPLEX, which solves allthe instances, in 5 out of 9 instances the tabu search finds the optimal solutionand the maximal optimal gap reported is only 1.77%.
Inst CplexSol time(s) OptGap TS.Sol time(s) CplexGap TS.(300) time(s) CplexGaps01 30003.32 1.89 0.00% 30003.32 3.19 0.00% 30003.32 172.70 0.00%s02 47318.77 13.22 0.00% 47318.77 17.75 0.00% 47318.77 956.43 0.00%s03 54106.88 11.46 0.00% 54106.88 16.95 0.00% 54106.88 1986.98 0.00%s04 33670.44 100.16 0.00% 33670.44 25.16 0.00% 33670.44 497.15 0.00%s05 57412.38 108.49 0.00% 57630.59 175.80 0.38% 57630.59 2401.62 0.38%s06 88099.22 282.62 0.00% 88099.22 124.16 0.00% 88099.22 6225.63 0.00%s07 46944.10 278.99 0.00% 47536.75 116.86 1.26% 46944.10 1046.03 0.00%s08 92600.70 2601.76 0.00% 92906.69 324.99 0.33% 92906.69 4884.79 0.33%s09 136493.00 1142.52 0.00% 138915.75 276.42 1.77% 138023.01 13056.51 1.12%
Table 5: Results on Instance Set S
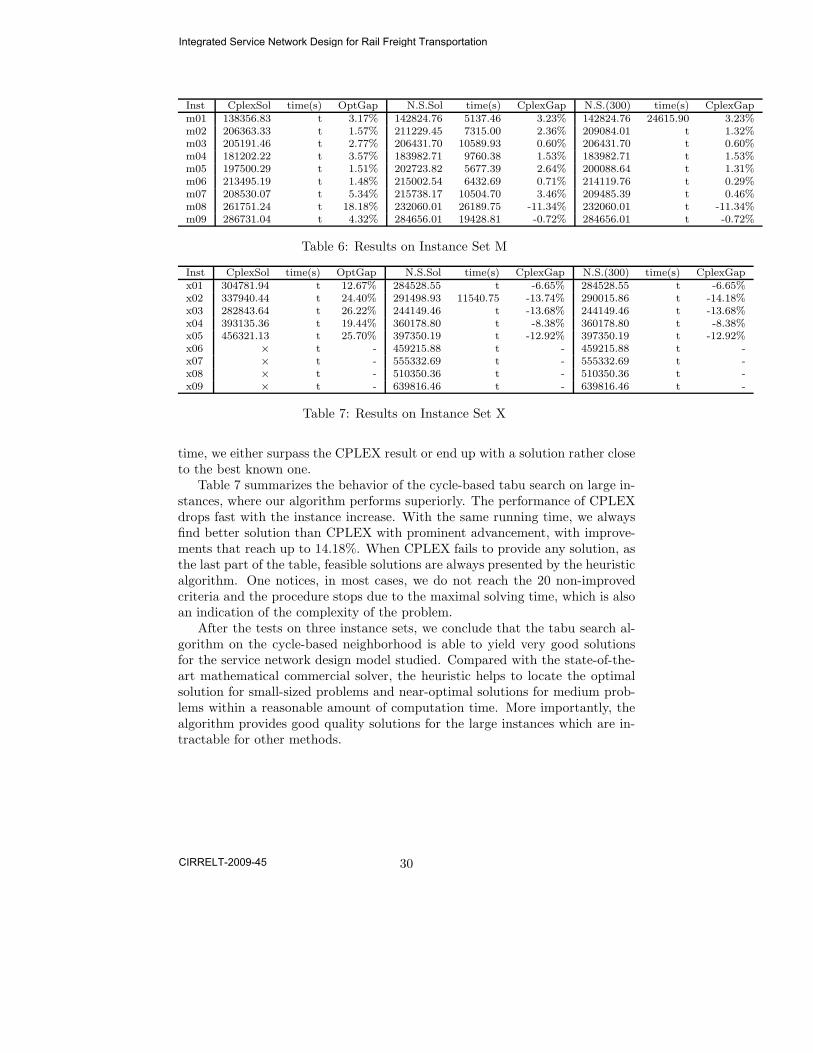
The results displayed in Table 6 prove the robust performance on mediuminstances. Where CPLEX fails to prove the optimality, we found good solutionswhich are close to the best solution yielded by CPLEX, yet within a much shortersolution time. Moreover, with the increase of the instance, our results approachand start to catch up with the best CPLEX solution. When the optimal gap isconsiderable, we have a better opportunity to outperform CPLEX.
As expected, the solutions are further improved when we extend the solutionprocess up to 300 local searches. In a CPU time of 10 hours, we have identifiedhigher-quality solution for 4 out of 9 instances in set M. Under the same solution
29
Integrated Service Network Design for Rail Freight Transportation
CIRRELT-2009-45
Inst CplexSol time(s) OptGap N.S.Sol time(s) CplexGap N.S.(300) time(s) CplexGapm01 138356.83 t 3.17% 142824.76 5137.46 3.23% 142824.76 24615.90 3.23%m02 206363.33 t 1.57% 211229.45 7315.00 2.36% 209084.01 t 1.32%m03 205191.46 t 2.77% 206431.70 10589.93 0.60% 206431.70 t 0.60%m04 181202.22 t 3.57% 183982.71 9760.38 1.53% 183982.71 t 1.53%m05 197500.29 t 1.51% 202723.82 5677.39 2.64% 200088.64 t 1.31%m06 213495.19 t 1.48% 215002.54 6432.69 0.71% 214119.76 t 0.29%m07 208530.07 t 5.34% 215738.17 10504.70 3.46% 209485.39 t 0.46%m08 261751.24 t 18.18% 232060.01 26189.75 -11.34% 232060.01 t -11.34%m09 286731.04 t 4.32% 284656.01 19428.81 -0.72% 284656.01 t -0.72%
Table 6: Results on Instance Set M
Inst CplexSol time(s) OptGap N.S.Sol time(s) CplexGap N.S.(300) time(s) CplexGapx01 304781.94 t 12.67% 284528.55 t -6.65% 284528.55 t -6.65%x02 337940.44 t 24.40% 291498.93 11540.75 -13.74% 290015.86 t -14.18%x03 282843.64 t 26.22% 244149.46 t -13.68% 244149.46 t -13.68%x04 393135.36 t 19.44% 360178.80 t -8.38% 360178.80 t -8.38%x05 456321.13 t 25.70% 397350.19 t -12.92% 397350.19 t -12.92%x06 × t - 459215.88 t - 459215.88 t -x07 × t - 555332.69 t - 555332.69 t -x08 × t - 510350.36 t - 510350.36 t -x09 × t - 639816.46 t - 639816.46 t -
Table 7: Results on Instance Set X
time, we either surpass the CPLEX result or end up with a solution rather closeto the best known one.
Table 7 summarizes the behavior of the cycle-based tabu search on large in-stances, where our algorithm performs superiorly. The performance of CPLEXdrops fast with the instance increase. With the same running time, we alwaysfind better solution than CPLEX with prominent advancement, with improve-ments that reach up to 14.18%. When CPLEX fails to provide any solution, asthe last part of the table, feasible solutions are always presented by the heuristicalgorithm. One notices, in most cases, we do not reach the 20 non-improvedcriteria and the procedure stops due to the maximal solving time, which is alsoan indication of the complexity of the problem.
After the tests on three instance sets, we conclude that the tabu search al-gorithm on the cycle-based neighborhood is able to yield very good solutionsfor the service network design model studied. Compared with the state-of-the-art mathematical commercial solver, the heuristic helps to locate the optimalsolution for small-sized problems and near-optimal solutions for medium prob-lems within a reasonable amount of computation time. More importantly, thealgorithm provides good quality solutions for the large instances which are in-tractable for other methods.
30
Integrated Service Network Design for Rail Freight Transportation
CIRRELT-2009-45
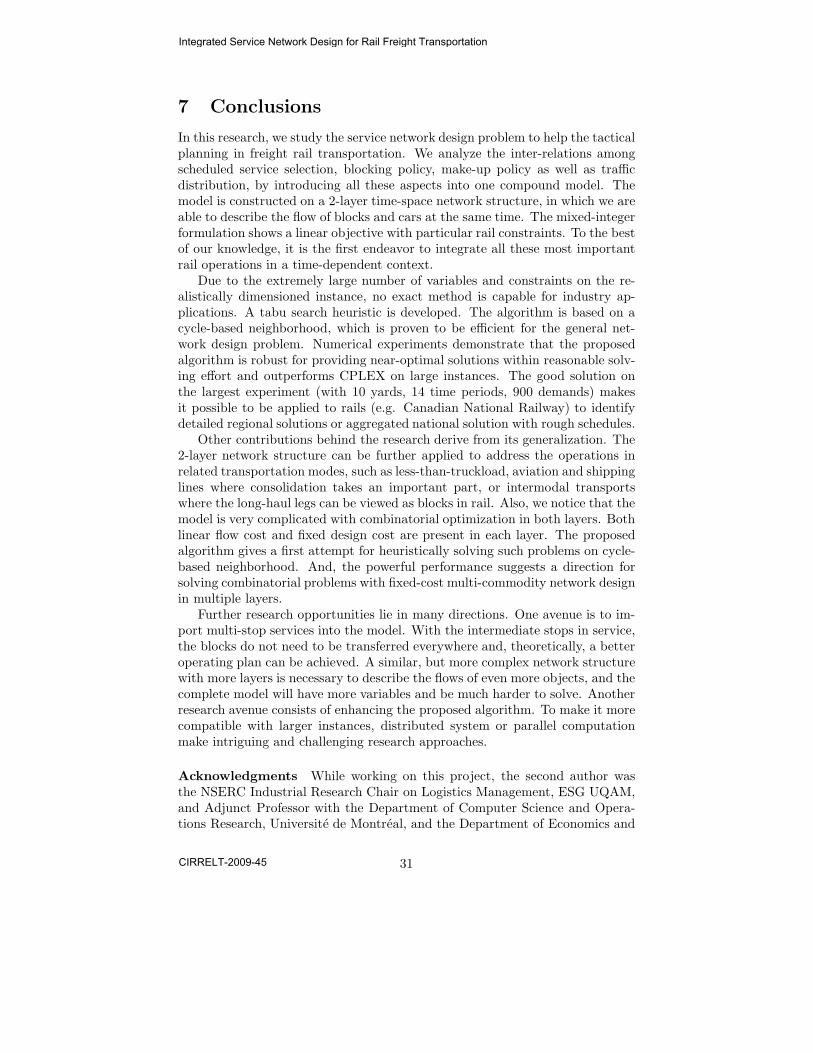
7 Conclusions
In this research, we study the service network design problem to help the tacticalplanning in freight rail transportation. We analyze the inter-relations amongscheduled service selection, blocking policy, make-up policy as well as trafficdistribution, by introducing all these aspects into one compound model. Themodel is constructed on a 2-layer time-space network structure, in which we areable to describe the flow of blocks and cars at the same time. The mixed-integerformulation shows a linear objective with particular rail constraints. To the bestof our knowledge, it is the first endeavor to integrate all these most importantrail operations in a time-dependent context.
Due to the extremely large number of variables and constraints on the re-alistically dimensioned instance, no exact method is capable for industry ap-plications. A tabu search heuristic is developed. The algorithm is based on acycle-based neighborhood, which is proven to be efficient for the general net-work design problem. Numerical experiments demonstrate that the proposedalgorithm is robust for providing near-optimal solutions within reasonable solv-ing effort and outperforms CPLEX on large instances. The good solution onthe largest experiment (with 10 yards, 14 time periods, 900 demands) makesit possible to be applied to rails (e.g. Canadian National Railway) to identifydetailed regional solutions or aggregated national solution with rough schedules.
Other contributions behind the research derive from its generalization. The2-layer network structure can be further applied to address the operations inrelated transportation modes, such as less-than-truckload, aviation and shippinglines where consolidation takes an important part, or intermodal transportswhere the long-haul legs can be viewed as blocks in rail. Also, we notice that themodel is very complicated with combinatorial optimization in both layers. Bothlinear flow cost and fixed design cost are present in each layer. The proposedalgorithm gives a first attempt for heuristically solving such problems on cycle-based neighborhood. And, the powerful performance suggests a direction forsolving combinatorial problems with fixed-cost multi-commodity network designin multiple layers.
Further research opportunities lie in many directions. One avenue is to im-port multi-stop services into the model. With the intermediate stops in service,the blocks do not need to be transferred everywhere and, theoretically, a betteroperating plan can be achieved. A similar, but more complex network structurewith more layers is necessary to describe the flows of even more objects, and thecomplete model will have more variables and be much harder to solve. Anotherresearch avenue consists of enhancing the proposed algorithm. To make it morecompatible with larger instances, distributed system or parallel computationmake intriguing and challenging research approaches.
Acknowledgments While working on this project, the second author wasthe NSERC Industrial Research Chair on Logistics Management, ESG UQAM,and Adjunct Professor with the Department of Computer Science and Opera-tions Research, Universite de Montreal, and the Department of Economics and
31
Integrated Service Network Design for Rail Freight Transportation
CIRRELT-2009-45
Business Administration, Molde University College, Norway. Funding for thisproject has been provided by the Natural Sciences and Engineering Council ofCanada (NSERC), through its Industrial Research Chair and Discovery Grantsprograms and by the partners of the Chair, CN, Rona, Alimentation Couche-Tard and the Ministry of Transportation of Quebec.
References
Ahuja, R. K., C. B. Cunha, G. Sahin. 2005. Network models in railroad planningand scheduling. Tutorials in Operations Research 1 54–101.
Ahuja, R. K., K. C. Jha, J. Liu. 2007. Solving real-life railroad blocking prob-lems. Interfaces 37 404–419.
Barnhart, C., H. Jin, P. H. Vance. 2000. Railroad blocking: A network designapplication. Oper. Res. 48(4) 603–614.
Bodin, L. D., B. L. Golden, A. D. Schuster, W. Romig. 1980. A model for theblocking of trains. Transportation Res. B 14(1-2) 115–120.
Brannlund, U., P. O. Lindberg, A. Nou, J.-E. Nilsson. 1998. Railway timetablingusing Lagrangian relaxation. Transportation Sci. 32(4) 358–369.
Caprara, A., M. Fischetti, P. Toth. 2002. Modeling and solving the traintimetabling problem. Oper. Res. 50(5) 851–861.
Caprara, A., M. Monaci, P. Toth, P. L. Guida. 2006. A Lagrangian heuris-tic algorithm for a real-world train timetabling problem. Discrete Applied
Mathematics 154 738–753.
Cordeau, J.-F., P. Toth, D. Vigo. 1998. A survey of optimization models fortrain routing and scheduling. Transportation Sci. 32(4) 380–404.
Crainic, T. G. 1999. Long-haul freight transportation. R. W. Hall, ed., Handbook
of Transportation Science. Kluwer, Norwell, MA.
Crainic, T. G., J. A. Ferland, J.-M. Rousseau. 1984. A tactical planning modelfor rail freight transportation. Transportation Sci. 18(2) 165–184.
Crainic, T. G., M. Gendreau, J. M. Farvolden. 2000. A simplex-based tabusearch method for capacitated network design. INFORMS J. Comput. 12(3)223–236.
Crainic, T. G., B. Gendron, G. Hernu. 2004. A slope scaling/Lagrangean per-turbation heuristic with long-term memory for multicommodity capacitatedfixed-charge network design. Journal of Heuristics 10(5) 525–545.
Crainic, T. G., J.-M. Rousseau. 1986. Multicommodity, multimode freight trans-portation: A general modeling and algorithmic framework for the servicenetwork design problem. Transportation Res. B 20B(3) 225–242.
32
Integrated Service Network Design for Rail Freight Transportation
CIRRELT-2009-45
Farvolden, J. M., W. B. Powell. 1994. Subgradient methods for the servicenetwork design problem. Transportation Sci. 28 256–272.
Ghamlouche, I., T. G. Crainic, M. Gendreau. 2003. Cycle-based neighbour-hoods for fixed-charge capacitated multicommodity network design. Oper.
Res. 51(4) 655–667.
Ghamlouche, I., T. G. Crainic, M. Gendreau. 2004. Path relinking, cycle-basedneighbourhoods and capacitated multicommodity network design. Annals of
Oper. Res. 131(1-4) 109–133.
Goossens, J. W., S. van Hoesel, L. Kroon. 2004. A branch-and-cut approach forsolving railway line-planning problems. Transportation Sci. 38(3) 379–393.
Gorman, M. F. 1998a. An application of genetic and tabu searches to the freightrailroad operating plan problem. Annals of Oper. Res. 78 51–69.
Gorman, M. F. 1998b. Santa Fe Railway uses an operating plan model toimprove its service design. Interfaces 28(4) 1–12.
Haghani, A. E. 1989. Formulation and solution of combined train routing andmakeup, and empty car distribution model. Transportation Res. B 23B(6)433–452.
Huntley, C. L., D. E. Brown, D. E. Sappington, B. P. Markowicz. 1995. Freightrouting and scheduling at CSX transportation. Interfaces 25(3) 58–71.
Ireland, P., R. Case, J. Fallis, C. Van Dyke, J. Kuehn, M. Meketon. 2004. TheCanadian Pacific Railway transforms operations by using models to developits operating plans. Interfaces 34(1) 5–14.
Keaton, M. H. 1989. Designing optimal railroad operating plans: Lagrangianrelaxation and heuristic approaches. Transportation Res. 23B 415–431.
Keaton, M. H. 1992. Designing railroad operating plans: A dual adjustmentmethod for implementing Lagrangian relaxation. Transportation Sci. 26(4)263–279.
Kim, D., X. Pan, P. M. Pardalos. 2006. An enhanced dynamic slope scalingprocedure with tabu scheme for fixed charge network flow problem. Compu-
tational Economics 27 273–293.
Kim, D., P. M. Pardalos. 1999. A solution approach to the fixed charge networkflow problem using a dynamic slope scaling procedure. Operations Research
Letters 24 195–203.
Marın, A., J. Salmeron. 1996. Tactical design of rail freight network. part i:Exact and heuristic methods. Eur. J. Oper. Res. 90(1) 26–44.
33
Integrated Service Network Design for Rail Freight Transportation
CIRRELT-2009-45
Morlok, E. K., R. B. Peterson. 1970. Final report on a development of a geo-graphic transportation network generation and evaluation model. Processing
of the Eleventh Annual Meeting. Transportation Research Forum, 71–105.
Newman, A. M., C. A. Yano. 2000. Centralized and decentralized train schedul-ing for intermodal operations. IIE Transactions 32 743–754.
Newton, H. N., C. Barnhart, P. H. Vance. 1998. Constructing railroad blockingplans to minimize handling costs. Transportation Sci. 32(4) 330–345.
Powell, W. B. 1986. A local improvement heuristic for the design of less-than-truckload motor carrier networks. Transportation Sci. 20(4) 246–257.
34
Integrated Service Network Design for Rail Freight Transportation
CIRRELT-2009-45