Embed Size (px)
Citation preview
www.elsevier.com/locate/coastaleng
Coastal Engineering 51
Investigations on the morphodynamics of sandy tidal flats:
a modeling application
Gonzalo Malvareza,*, F. Navasb, D.W.T. Jacksonc
aUniversidad Pablo de Olavide, Sevilla, Ctra. Utrera, km 1, Sevilla, 41013, SpainbUniversidad de Sevilla, Sevilla, Spain
cUniversity of Ulster, Coleraine, Londonderry, Northern Ireland
Available online 11 September 2004
Abstract
Modeling of morphodynamic behavior and evolution of sandy tidal flats commonly comprises the utilization of a sequence
of techniques to characterize and/or quantify the interaction between various hydrodynamic forcing factors and the
geomorphologic response of the receiving environment. An alternative for establishing the geomorphological behavior of sandy
tidal flats could be introduced in the context of coastal classification of morphodynamic regime. This contribution investigates
tidal flat morphodynamics in the context of generic coastal classifications and aims at a medium to long-term characterization of
its evolution, by presenting the methodology and results of a series of investigations conducted on sandy tidal flats in Northern
Ireland.
The active inter-tidal sandy tidal flats of Newtownards vary between 1200 and 500 m wide and can be characterized by a
relative tidal range (RTR) factor of 2.3–7. This situates the inter-tidal zones in the mixed waves and tide domain. The sensitivity
of sediment redistribution to combined water level/wave height makes wave energy dissipation due to bottom friction the
primary shoaling process during relative high-energy events. Tidal currents, a constant feature on the ultra dissipative
environments, are also most acute when combined wave/tide currents are present. Thresholds of sediment entrainment are
exceeded and resuspension initiated when water levels approach 1.0 m OD and significant wave height are at a maxima of 1.5
m. These modeling results when taken into an empirical situation by deployment of instruments illustrated that the relationship
between waves and water levels in these environments is very dependent on wave penetration in the water column.
Morphodynamic characterization of tidal flats could allow for further understanding on their long-term behavior if modeling is
utilized to reproduce morphodynamic scenarios, which help identify wave/water level relationships on fine sands.
D 2004 Elsevier B.V. All rights reserved.
Keywords: Waves; Tidal flat; Sand flat; Orbital velocity; Strangford Lough; Northern Ireland
0378-3839/$ - see front matter D 2004 Elsevier B.V. All rights reserved.
doi:10.1016/j.coastaleng.2004.07.006
* Corresponding author.
E-mail address: [email protected] (G. Malvarez).
1. Introduction
Coastal classification schemes have been developed
to synthesize morphodynamics and its rather complex
(2004) 731–747
G. Malvarez et al. / Coastal Engineering 51 (2004) 731–747732
morphological and dynamical interactions. Some
expressions are able to characterize most littoral
settings on beaches ranging from reflective to dis-
sipative environments that behave in a somewhat
predictable manner (if the environment is natural and
sediment supply stable). However, at the very extreme
of the morphodynamic classifications of ultra dissipa-
tive beaches, sandy tidal flats are neglected in the
literature of beach science as the result of the
complexity of investigating wave shoaling, breaking
and swash on a high spatial resolution on such low
energy and flat morphology. While open ocean
beaches have been the subject of a tremendous variety
of empirical and numerical studies and three morpho-
dynamic zones (the swash zone, the surf zone and the
zone of shoaling waves) are considered, tidal flats have
consistently been the focus of separate research efforts.
Dominance of cohesive sediments, extreme flat-
ness of its morphology, higher degree of biological
bioturbation and variable strength of tidal flows as the
main hydrodynamic force built a strong case for the
isolation of tidal flats in morphodynamic approaches,
especially in the case of muddy tidal flats. Sandy tidal
flats, however, are dominated by hydrodynamic
forcing factors and morphologic settings that put
them closer to open ocean beaches and, thus, a
morphodynamic approach seems appropriate since
wave-induced sediment entrainment and combined
wave–current interactions are expressed in complex
sedimentary spatial distributions.
In macro-tidal environments, it is generally accep-
ted that the influence of waves is diminished, mainly
because tidal translation over the inter-tidal region
results in rapid movement of surf and swash zones over
the active area and, thus, tidal currents should play a
greater role both in absolute terms and relative to local
waves (Nordstrom and Jackson, 1992). The role of
waves in tidal flat sedimentation is acknowledged to be
particularly important in the inter-tidal area (e.g.,
Reineck, 1967; Amos, 1995; Ryan and Cooper,
1998). On sandy tidal flats affected by frequent wave
action, waves may be expected to exert a control on
sedimentation patterns particularly because high-fre-
quency wind waves dominate estuaries when sheltered
from open seas. Wind waves exhibit broad spectra of
frequency and direction (Holtuijsen et al., 1989) and,
therefore, may be subject to sharp directional changes
induced by refraction and/or diffraction. The effects on
local morphodynamics are that wave-induced potential
sediment transport may occur in multiple pathways
linked to slight variations in topography of the sea bed.
Inter-tidal flat topography commonly lacks relief (out-
side channels) and, therefore, a highly sensitive
analysis of wave propagation and decay is essential if
energy gradients at different stages of the tide are to be
interpreted in terms of their effect on sediment entrain-
ment and/or transport. Wave energy dissipation, related
to bottom friction and breaking, can be directly linked
to water depth in shallow environments (Collins, 1976)
and thus the expanding/contracting tidal prism affects
wave fetch and water depth. Variations in tidal water
level affect wave sediment interaction but wave
parameters are difficult to assess across a broad spatial
zone, and the study of their effect on tidal flats is further
hampered by difficulties of measurement and simu-
lation under regular tidal variation.
Several studies have demonstrated a broad link
between wave energy and tidal flat morphology (Boyd
et al., 1992; Ryan and Cooper, 1998) and the
distribution of flora (Hammond et al., 2002). At a
local scale, Carling (1982) investigated the role of
waves by the deployment of a wave pole at a single
location and using time-averaged results as a measure
of wave intensity. While the results showed a link
between wave action and tidal flat behavior at the
scale of the whole tidal flat, these results were based
on data from a single point and cannot explain
adequately, variability within a tidal flat.
Rates of wave energy dissipation (due to shoaling
and not breaking) must affect tidal flats in the same
fashion as nearshore regions of beaches despite the
morphological adjustments. Tidal currents are a
constant feature on the ultra dissipative environments
of tidal flats but the hydrodynamic effects of them are
most acute when combined wave/tide currents are
present. For instance, tidal flows of 0.2 m s�1 in the
Foyle estuary may be amplified to 0.93 m s�1 under
the combined action of tide and waves (Nordstrom and
Jackson, 1992). The complex interaction of the two
forcing factors have been analyzed by many authors
but it appears that it is accepted that tidal forces have
little influence on beach morphodynamics (Masselink
and Turner, 1999). However, these authors explain that
as tidal range increases tidal flows and coupling tide/
wave interaction play a significant role in affecting the
directional component of sediment transport.
G. Malvarez et al. / Coastal Engineering 51 (2004) 731–747 733
Inside estuaries waves are the result of filtering
through its seaward entrance and, mostly, as a result of
wind generation inside the estuary. The types of
waves generated in this way are typically short
crested, high frequency and steep, and their geometry
reflects the fetch available given constant wind
conditions. Under steady wind, waves are highest at
high tide because fetch is generally longer (in onshore
wind conditions) but wave-induced stress on the
bottom surface may be small because, under short
period waves, wave orbital motions cannot penetrate
to the bed. Green and Macdonald (2001) illustrated
that at some optimum combination of wave/water
depth, wave penetration under steep waves influences
resuspension of bottom sediments. Changing wind
conditions and stable water levels are responsible for
sediment resuspension in lakes given that wind
generated waves are the only force in play that
induces water column deep stresses (Jin and Ji, 2001).
Wave sensitivity to water level (induced by tidal
effects) appears, therefore, to be a crucial element in
shoaling processes associated with waves acting
across tidal flats. As is the case on macro-tidal
beaches, tidal stage determines how waves affect the
bed sediments and also where. The duration of the
effects of shoaling waves on the mobile bnearshoreQdictates potential morphodynamical stages (Masselink
and Turner, 1999). Whereas beach profiles seem
relatively insensitive to wave height across the
dissipation zone, tidal flats appear to respond to
variations in wave energy dissipation and wave orbital
velocity by relocating sediments according to fine
variations in grain size (Navas et al., 2001). The
combined effect of water level variation, fetch and
tidal prism dynamics and related wave penetration
presents a very complex scenario for characterization
of morphodynamic criteria for tidal flats resulting in
greatly fine-tuned models of waves, currents, mor-
phology and sediment grain sizes interactions.
The aim of this contribution is to illustrate a series
of efforts in characterizing long-term sandy tidal flat
morphodynamics centered on modeling and empirical
investigations conducted over the extensive sandy
tidal flats of Newtownards in Strangford Lough,
Northern Ireland. The structure follows: (i) a numerical
modeling exercise simulating storm waves from the
S.E., the most effective fetch generating greater wave
energy, and establishment of relationship between
wave related parameters and the spatial distribution
of mean grain sizes to identify effects of varying water
levels, (ii) numerical modeling of multiple wave
conditions as generated by local (recorded) winds at
the identified optimum water level, and establishment
of relationship with distribution of mean grain sizes,
and (iii) deployment of an empirical measurement
campaign around a high energy event (characterized
by strong winds) at optimum water level using
morphodynamic indicators to test modeled results.
1.1. Study area
The study area is located at the northern end of
Strangford Lough (Fig. 1), on the eastern coast of
Northern Ireland. The eastern coastline of Ireland, the
Irish Sea, is typically of lower energy levels than the
more exposed Atlantic open coasts of the west. The
Lough is an elongate embayment with a north–south
axis (approximately 30 km long). It is bordered by
bedrock topped by glacial sediments and contains
many drowned drumlins within its margins. Contem-
porary marine conditions in Strangford Lough are
characterized by an average tidal range of 3.0 m
(spring tide range 3.5 m) with little amplification of
the tidal wave in the Lough. It is connected to the Irish
Sea by the Narrows, in which tidal velocities reach 3.5
m s�1.These strong currents are confined to central
deep channels and are significantly weakened approx-
imately 14 km north of the Narrows. The northern end
of the Lough is affected by minor tidal forces confined
to the major tidal channels. Tidal modeling (KKM,
1993) indicates that currents on the Newtownards tidal
flat reach a maximum at mid-tide levels (approx-
imately 0.1 m s�1). Waves develop within the Lough
and propagate following local wind direction. The
wave climate is dominated by these wind waves
within the Lough with limited fetch. Irish Sea swell
does not penetrate the Lough with sufficient energy to
have any significant morphodynamic effects in the
northern end. Wind directions affecting the wave
climate at Newtownards are typically from the south-
east and effective fetch is about 16 km (BBV, 1997).
Central regions of the Lough reach 60 m in depth
whereas the margins of the system are characterized
by a variety of inter-tidal flats, bedrock, and relict
glacial shorelines. The inter-tidal areas at Newtow-
nards exhibit a flat or gently sloping sandy surface
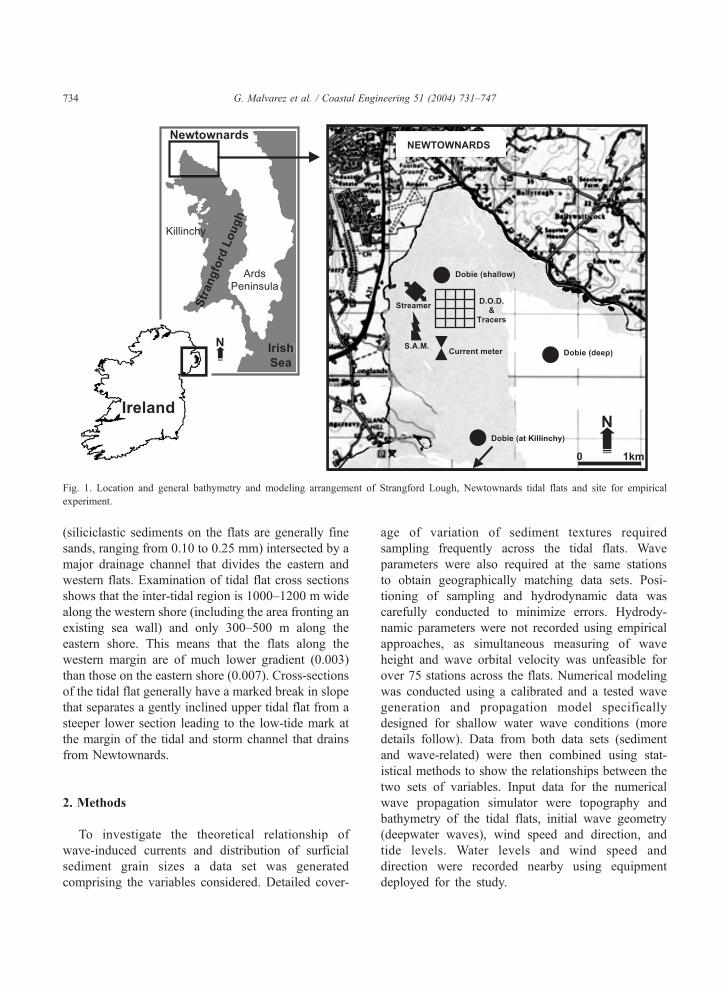
Fig. 1. Location and general bathymetry and modeling arrangement of Strangford Lough, Newtownards tidal flats and site for empirical
experiment.
G. Malvarez et al. / Coastal Engineering 51 (2004) 731–747734
(siliciclastic sediments on the flats are generally fine
sands, ranging from 0.10 to 0.25 mm) intersected by a
major drainage channel that divides the eastern and
western flats. Examination of tidal flat cross sections
shows that the inter-tidal region is 1000–1200 m wide
along the western shore (including the area fronting an
existing sea wall) and only 300–500 m along the
eastern shore. This means that the flats along the
western margin are of much lower gradient (0.003)
than those on the eastern shore (0.007). Cross-sections
of the tidal flat generally have a marked break in slope
that separates a gently inclined upper tidal flat from a
steeper lower section leading to the low-tide mark at
the margin of the tidal and storm channel that drains
from Newtownards.
2. Methods
To investigate the theoretical relationship of
wave-induced currents and distribution of surficial
sediment grain sizes a data set was generated
comprising the variables considered. Detailed cover-
age of variation of sediment textures required
sampling frequently across the tidal flats. Wave
parameters were also required at the same stations
to obtain geographically matching data sets. Posi-
tioning of sampling and hydrodynamic data was
carefully conducted to minimize errors. Hydrody-
namic parameters were not recorded using empirical
approaches, as simultaneous measuring of wave
height and wave orbital velocity was unfeasible for
over 75 stations across the flats. Numerical modeling
was conducted using a calibrated and a tested wave
generation and propagation model specifically
designed for shallow water wave conditions (more
details follow). Data from both data sets (sediment
and wave-related) were then combined using stat-
istical methods to show the relationships between the
two sets of variables. Input data for the numerical
wave propagation simulator were topography and
bathymetry of the tidal flats, initial wave geometry
(deepwater waves), wind speed and direction, and
tide levels. Water levels and wind speed and
direction were recorded nearby using equipment
deployed for the study.
G. Malvarez et al. / Coastal Engineering 51 (2004) 731–747 735
2.1. Topography and bathymetry (DGPS)
Topographic surveys were carried out using a
Trimble 4400 Ssi Differential Global Positioning
System (DGPS) achieving theoretical sub-centimeter
accuracy. The topographic data from the high-reso-
lution topographic DGPS surveys was appended to
digitized bathymetric data (from published Admiralty
Chart bathymetric charts of the Lough), which
described sea bed topography of the deepwater areas.
All the coordinates were then normalized to Irish Grid
Reference and elevations were reduced to meters
(Ordnance Datum Belfast). The resulting random
points of the synthetic topography of the inter-tidal
flats and sea bed were organized in a grid for use in
the wave propagation model.
2.2. Sediment sampling and analysis
A total of 75 sediment samples were collected in
the area. Samples consisted of about 30 g of surficial
(2–4 cm depth) sediments randomly taken in the area.
The sample grain size was analyzed using an
automated settling column linked to a computer that
provided moment measures and settling velocities for
sediment. The analyses provide the median, mean,
sorting and skewness of the distribution as well as
settling velocities of the different fractions of the
spectrum of grain sizes, which are classified in groups
of very fine sands, fine sands, medium sands and
course sands.
Results from the sediment particle analysis are
directly geo-referenced given sample location
recorded in the field with DGPS during collection.
This facilitated mapping of the spatial distribution of
textural information and guarantees reliability of
subsequent analysis of spatial variability in sediment
particle size and correlations.
2.3. Water level recording
An automated bDobieQ water level recording
system from the National Institute of Water and
Atmospheric Research (New Zealand) was deployed
near the site.
The interrogation period was set to 30 min to
reduce excessive resolution and simplify wave prop-
agation simulation. Data from the water level recorded
were calibrated before deployment and output records
were normalized using DGPS for local elevation
control. The tidal record was input directly into a
wave propagation model, which was modified to input
sequential water levels up to 50 times, at intervals of
30 min thus covering semidiurnal tidal cycle.
2.4. Wind data recording
Wind data were recorded using aWeatherWizard III
meteorological station from Davis. It was installed at
the Ulster Flying Club facilities in Newtownards with
the measuring apparatus at an elevation of approx-
imately 5 m above the ground to reduce turbulence.
Wind velocity and direction were logged at 30-min
intervals. Retrieval of data was carried out using PC-
LINK software via modem and data were input in the
wave model to achieve realistic wave conditions
(wind-generated waves and directional effects).
2.5. Wave propagation modeling
The numerical computer model HISWA (HIndcast-
ing of Shallow Water wAves; Holtuijsen et al., 1989;
Booij and Holthuijsen, 1995) was used to generate
wave energy scenarios, and to analyze spatial dis-
tribution of wave-related hydrodynamic parameters.
The package uses gridded bathymetric information
and parametric deepwater wave data. This enables
calculation of wave characteristics in shallow waters
and at the shoreline. Gridded output of the model can
be plotted and/or tabulated for interpretation.
High-resolution (grid cellsb10 m2) computations
were then enabled by sequential simulation of wave
propagation over the inshore bathymetry at different
water levels.
Because of the restrained inlet morphology, it was
considered necessary to establish whether Irish Sea
waves exerted an influence on wave energy distribu-
tion within the Lough. The results, not discussed
further in this contribution, showed no significant
penetration, and thus waves inside the Lough can be
regarded as locally generated within the Lough.
Deepwater wave parameters for Newtownards tidal
flats were established from wind speed in the fetch
limited environment. Effective fetch calculations were
carried out to establish maximum development of
waves from high wind velocities. Single wave
G. Malvarez et al. / Coastal Engineering 51 (2004) 731–747736
geometry was generated from fetch limited wind
generation resulting in significant wave height of 1.5
m, zero crossing period of 4.5 s and approach from the
S.E. This wave climate was coupled with a wind field
that extended over the entire study area in the
simulation to reproduce realistic wave action over
the sand flats. Wind speed data were taken from the
recorded series at the Ards Airfield and the mean
high-speed value was 10 m s�1. The wind was set
constant for upper Strangford Lough. For multidirec-
tional simulations, wind data taken from the mete-
orological station were directly used as wave
generator. HISWA was run without initial wave
parameters so that the wave generation and propaga-
tion would correspond entirely to the appropriate fetch
distances and wind force for modal conditions.
Wave propagation, as performed by HISWA, is
stationary (i.e., waves propagate simultaneously over
the area but there is no time evolution in the model).
The results can be interpreted as a dsnap-shotT of thedistribution of wave energies in an area. The water
level is therefore also fixed at one stage of the tidal
cycle. This was modified and the model was run in a
loop, reading sequential water levels and wind speed
and directions from data recorded for this experiment
(see Sections 2.3 and 2.4). Spatial distributions of
different wave energy scenarios across the tidal flats
were generated at 49 stages of the tide (i.e., more than
a full semidiurnal tidal cycle at 30-min interval
readings) and nine wind directions.
Several output parameters of the model (significant
wave height, wave energy dissipation, wave-induced
stress and near bottom orbital velocity) were provided
at fixed geographical points.
2.6. Empirical measurements
An empirical measurement campaign was also
conducted after the optimum location and water level
and most probable optimum exposure had been
identified using the modeling approach described
above (Fig. 1). A morphological and hydrodynamical
experiment was organized to cover three tidal events
during Spring tides. In all, sediment transport was
measured using a specially designed streamer trap and
fluorescent tracers, depth of disturbance and sediment
bed change, and tidal currents. Wave height, period and
orbital velocities were recorded in shallow and deep
water andwater levels in three sites (deep channel, deep
flats and shallow flats). All the measurements were
recorded in high temporal resolution over the three
semidiurnal tidal cycles coinciding with Spring tides.
The rationale behind the experiment was to
measure simultaneously tides, waves and sediment
transport (bedload and suspended load) to establish
relationships between the morphodynamic variables.
Three time slots, coinciding with predicted optimum
water levels and tidal current velocities were targeted
for short duration streamer trap measuring periods.
Divers would open sequentially the streamer trap at
given times for given duration (see Fig. 2A). The rest
of the instrumentation (described below) was
deployed to record continuous time series and/or
depth of disturbance during the three tides under
investigation. An electromagnetic current meter was
deployed across the flood-ebb tidal current path to
record flow velocities during the experiment. The
interrogation period for the data logger was set at 5
min. The measuring probe was fixed to a stainless
steel frame held in position at 1.0 m height. Three
Dobie wave and tide gauges (Green, 1998) were
deployed at different locations to record waves and
water levels. Hydrostatic pressure was recorded as a
time series of 2048 samples at 10-min intervals during
the three events. Hydrostatic pressure was then
processed through the PEDP software, which uses
semi-empirical formulas to establish wave height,
period, significant orbital speed at the bed, wave
penetration through the column of water, etc. Water
levels were recorded for temporal mesoscale tidal
reference as well. One of the wave recorders was
deployed in the center of the instrument array to
establish local wave hydrodynamics on the shallow
(higher) flats. A second unit was deployed at the
deeper end of the tidal flats (barely exposed in Spring
Low Water) and the third wave/water level recorder
was deployed 10 km south of the experimental site to
record deeper water conditions. Data were recorded
simultaneously on the two wave recorders to enable
synchronous post experiment analysis.
A sediment transport Streamer Trap was con-
structed based on a modified design after that of
Kraus (1987) (Fig. 2A). The trap was located in the
instrument array site facing the incoming flood tide in
the first instance and was then rotated after the first
tide to measure ebb related sediment transport. The
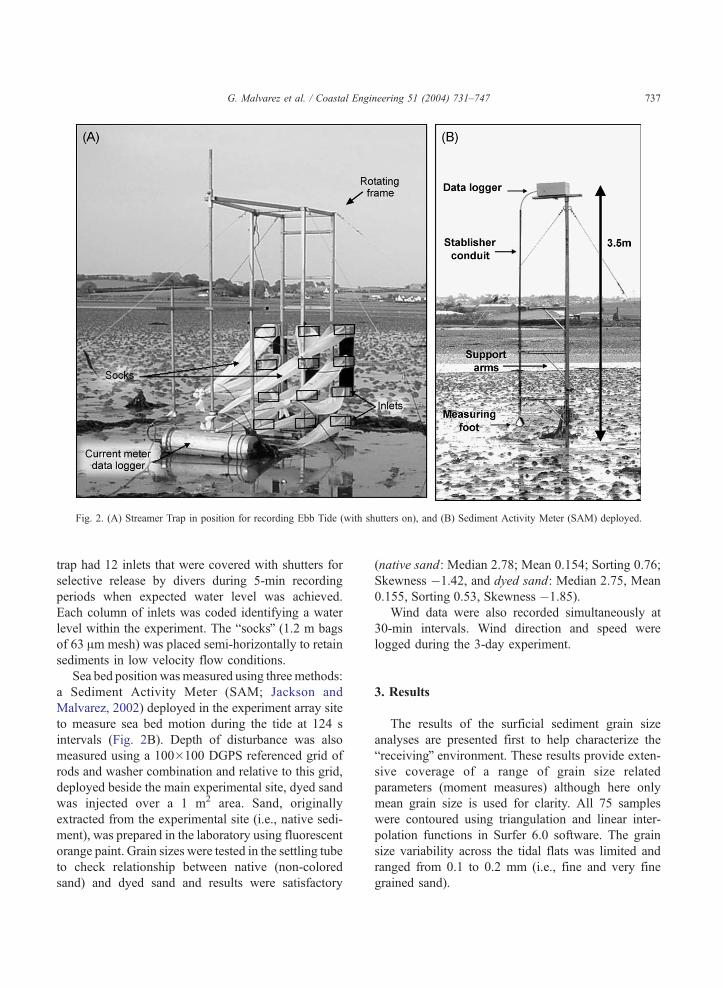
Fig. 2. (A) Streamer Trap in position for recording Ebb Tide (with shutters on), and (B) Sediment Activity Meter (SAM) deployed.
G. Malvarez et al. / Coastal Engineering 51 (2004) 731–747 737
trap had 12 inlets that were covered with shutters for
selective release by divers during 5-min recording
periods when expected water level was achieved.
Each column of inlets was coded identifying a water
level within the experiment. The bsocksQ (1.2 m bags
of 63 Am mesh) was placed semi-horizontally to retain
sediments in low velocity flow conditions.
Sea bed position wasmeasured using three methods:
a Sediment Activity Meter (SAM; Jackson and
Malvarez, 2002) deployed in the experiment array site
to measure sea bed motion during the tide at 124 s
intervals (Fig. 2B). Depth of disturbance was also
measured using a 100�100 DGPS referenced grid of
rods and washer combination and relative to this grid,
deployed beside the main experimental site, dyed sand
was injected over a 1 m2 area. Sand, originally
extracted from the experimental site (i.e., native sedi-
ment), was prepared in the laboratory using fluorescent
orange paint. Grain sizes were tested in the settling tube
to check relationship between native (non-colored
sand) and dyed sand and results were satisfactory
(native sand: Median 2.78; Mean 0.154; Sorting 0.76;
Skewness �1.42, and dyed sand: Median 2.75, Mean
0.155, Sorting 0.53, Skewness �1.85).
Wind data were also recorded simultaneously at
30-min intervals. Wind direction and speed were
logged during the 3-day experiment.
3. Results
The results of the surficial sediment grain size
analyses are presented first to help characterize the
breceivingQ environment. These results provide exten-
sive coverage of a range of grain size related
parameters (moment measures) although here only
mean grain size is used for clarity. All 75 samples
were contoured using triangulation and linear inter-
polation functions in Surfer 6.0 software. The grain
size variability across the tidal flats was limited and
ranged from 0.1 to 0.2 mm (i.e., fine and very fine
grained sand).
G. Malvarez et al. / Coastal Engineering 51 (2004) 731–747738
Finer particles are found near the existing north-
ern end and at the S.W. section of tidal flats. A zone
of larger mean grain size between those two regions
is characterized by an average size of 0.19 mm.
Mean sizes of particles range from 0.12 mm to about
0.20 mm. Finer material is found at higher eleva-
tions, and coarser sediment normally corresponds to
the central areas and the southeastern shore, where
drainage of the flats produces a steeper topography.
The western shore is nearly homogeneous with
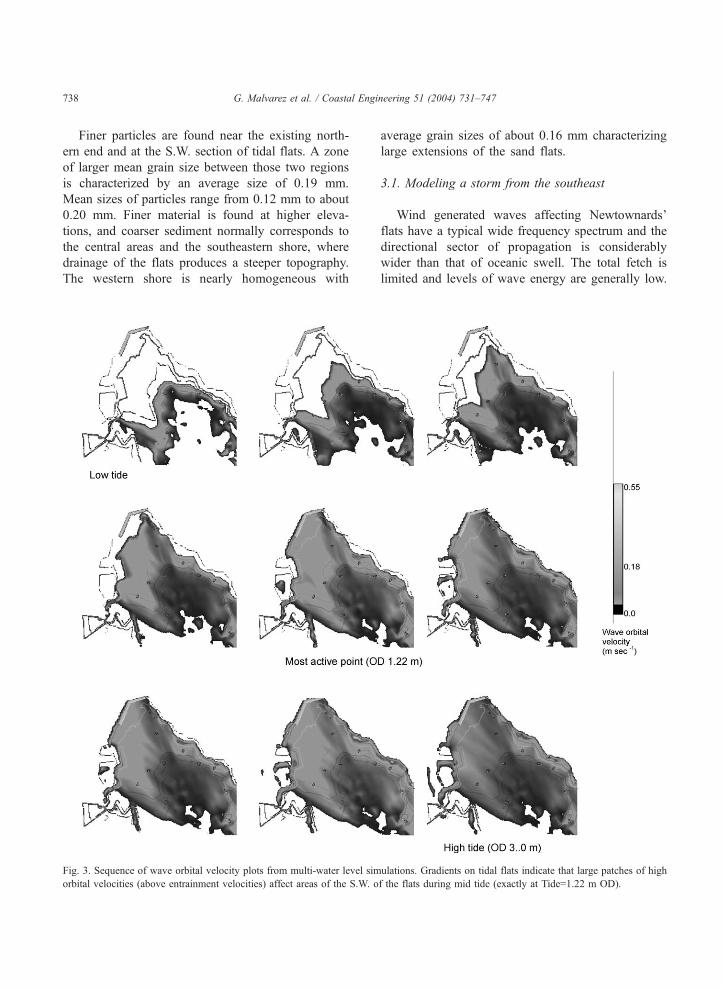
Fig. 3. Sequence of wave orbital velocity plots from multi-water level sim
orbital velocities (above entrainment velocities) affect areas of the S.W. o
average grain sizes of about 0.16 mm characterizing
large extensions of the sand flats.
3.1. Modeling a storm from the southeast
Wind generated waves affecting Newtownards’
flats have a typical wide frequency spectrum and the
directional sector of propagation is considerably
wider than that of oceanic swell. The total fetch is
limited and levels of wave energy are generally low.
ulations. Gradients on tidal flats indicate that large patches of high
f the flats during mid tide (exactly at Tide=1.22 m OD).
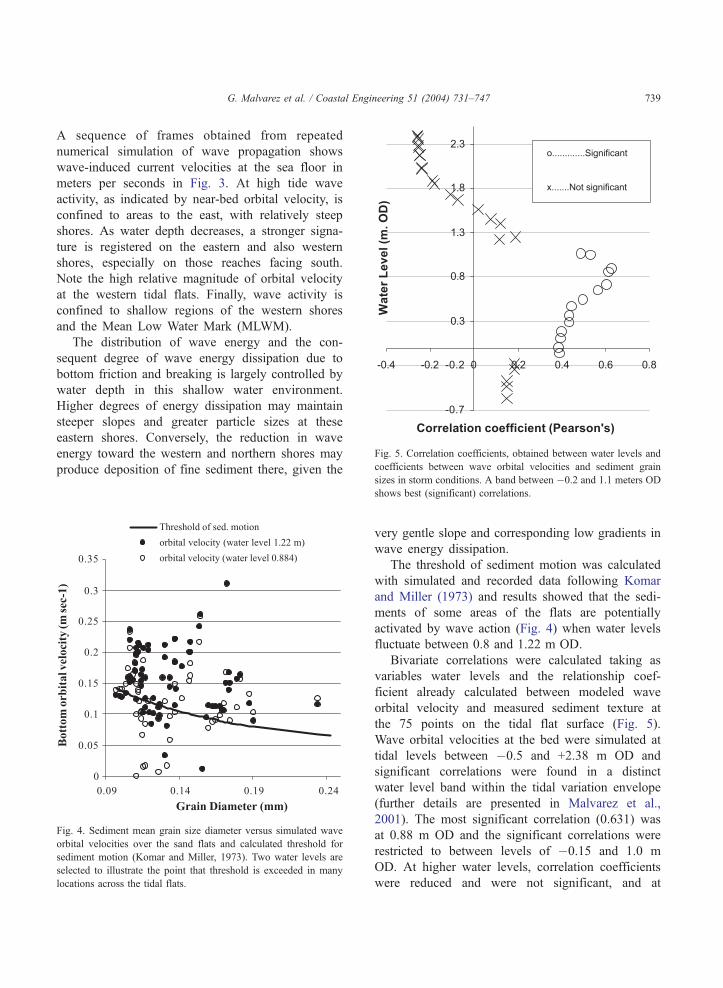
Fig. 5. Correlation coefficients, obtained between water levels and
coefficients between wave orbital velocities and sediment grain
G. Malvarez et al. / Coastal Engineering 51 (2004) 731–747 739
A sequence of frames obtained from repeated
numerical simulation of wave propagation shows
wave-induced current velocities at the sea floor in
meters per seconds in Fig. 3. At high tide wave
activity, as indicated by near-bed orbital velocity, is
confined to areas to the east, with relatively steep
shores. As water depth decreases, a stronger signa-
ture is registered on the eastern and also western
shores, especially on those reaches facing south.
Note the high relative magnitude of orbital velocity
at the western tidal flats. Finally, wave activity is
confined to shallow regions of the western shores
and the Mean Low Water Mark (MLWM).
The distribution of wave energy and the con-
sequent degree of wave energy dissipation due to
bottom friction and breaking is largely controlled by
water depth in this shallow water environment.
Higher degrees of energy dissipation may maintain
steeper slopes and greater particle sizes at these
eastern shores. Conversely, the reduction in wave
energy toward the western and northern shores may
produce deposition of fine sediment there, given the
Fig. 4. Sediment mean grain size diameter versus simulated wave
orbital velocities over the sand flats and calculated threshold for
sediment motion (Komar and Miller, 1973). Two water levels are
selected to illustrate the point that threshold is exceeded in many
locations across the tidal flats.
sizes in storm conditions. A band between �0.2 and 1.1 meters OD
shows best (significant) correlations.
very gentle slope and corresponding low gradients in
wave energy dissipation.
The threshold of sediment motion was calculated
with simulated and recorded data following Komar
and Miller (1973) and results showed that the sedi-
ments of some areas of the flats are potentially
activated by wave action (Fig. 4) when water levels
fluctuate between 0.8 and 1.22 m OD.
Bivariate correlations were calculated taking as
variables water levels and the relationship coef-
ficient already calculated between modeled wave
orbital velocity and measured sediment texture at
the 75 points on the tidal flat surface (Fig. 5).
Wave orbital velocities at the bed were simulated at
tidal levels between �0.5 and +2.38 m OD and
significant correlations were found in a distinct
water level band within the tidal variation envelope
(further details are presented in Malvarez et al.,
2001). The most significant correlation (0.631) was
at 0.88 m OD and the significant correlations were
restricted to between levels of �0.15 and 1.0 m
OD. At higher water levels, correlation coefficients
were reduced and were not significant, and at
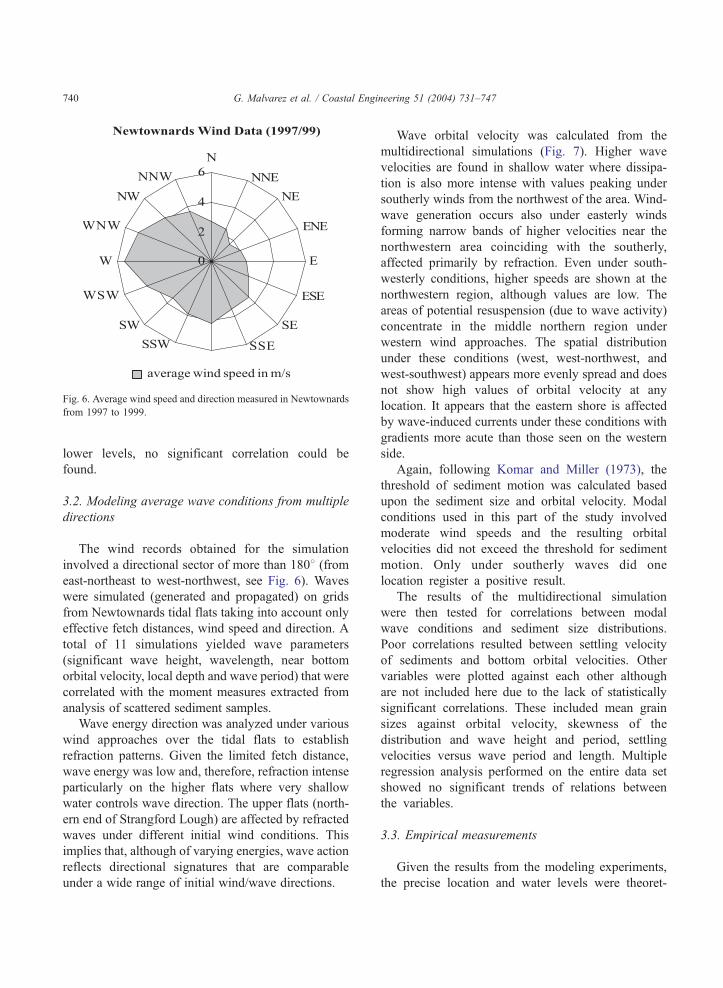
Fig. 6. Average wind speed and direction measured in Newtownards
from 1997 to 1999.
G. Malvarez et al. / Coastal Engineering 51 (2004) 731–747740
lower levels, no significant correlation could be
found.
3.2. Modeling average wave conditions from multiple
directions
The wind records obtained for the simulation
involved a directional sector of more than 1808 (fromeast-northeast to west-northwest, see Fig. 6). Waves
were simulated (generated and propagated) on grids
from Newtownards tidal flats taking into account only
effective fetch distances, wind speed and direction. A
total of 11 simulations yielded wave parameters
(significant wave height, wavelength, near bottom
orbital velocity, local depth and wave period) that were
correlated with the moment measures extracted from
analysis of scattered sediment samples.
Wave energy direction was analyzed under various
wind approaches over the tidal flats to establish
refraction patterns. Given the limited fetch distance,
wave energy was low and, therefore, refraction intense
particularly on the higher flats where very shallow
water controls wave direction. The upper flats (north-
ern end of Strangford Lough) are affected by refracted
waves under different initial wind conditions. This
implies that, although of varying energies, wave action
reflects directional signatures that are comparable
under a wide range of initial wind/wave directions.
Wave orbital velocity was calculated from the
multidirectional simulations (Fig. 7). Higher wave
velocities are found in shallow water where dissipa-
tion is also more intense with values peaking under
southerly winds from the northwest of the area. Wind-
wave generation occurs also under easterly winds
forming narrow bands of higher velocities near the
northwestern area coinciding with the southerly,
affected primarily by refraction. Even under south-
westerly conditions, higher speeds are shown at the
northwestern region, although values are low. The
areas of potential resuspension (due to wave activity)
concentrate in the middle northern region under
western wind approaches. The spatial distribution
under these conditions (west, west-northwest, and
west-southwest) appears more evenly spread and does
not show high values of orbital velocity at any
location. It appears that the eastern shore is affected
by wave-induced currents under these conditions with
gradients more acute than those seen on the western
side.
Again, following Komar and Miller (1973), the
threshold of sediment motion was calculated based
upon the sediment size and orbital velocity. Modal
conditions used in this part of the study involved
moderate wind speeds and the resulting orbital
velocities did not exceed the threshold for sediment
motion. Only under southerly waves did one
location register a positive result.
The results of the multidirectional simulation
were then tested for correlations between modal
wave conditions and sediment size distributions.
Poor correlations resulted between settling velocity
of sediments and bottom orbital velocities. Other
variables were plotted against each other although
are not included here due to the lack of statistically
significant correlations. These included mean grain
sizes against orbital velocity, skewness of the
distribution and wave height and period, settling
velocities versus wave period and length. Multiple
regression analysis performed on the entire data set
showed no significant trends of relations between
the variables.
3.3. Empirical measurements
Given the results from the modeling experiments,
the precise location and water levels were theoret-
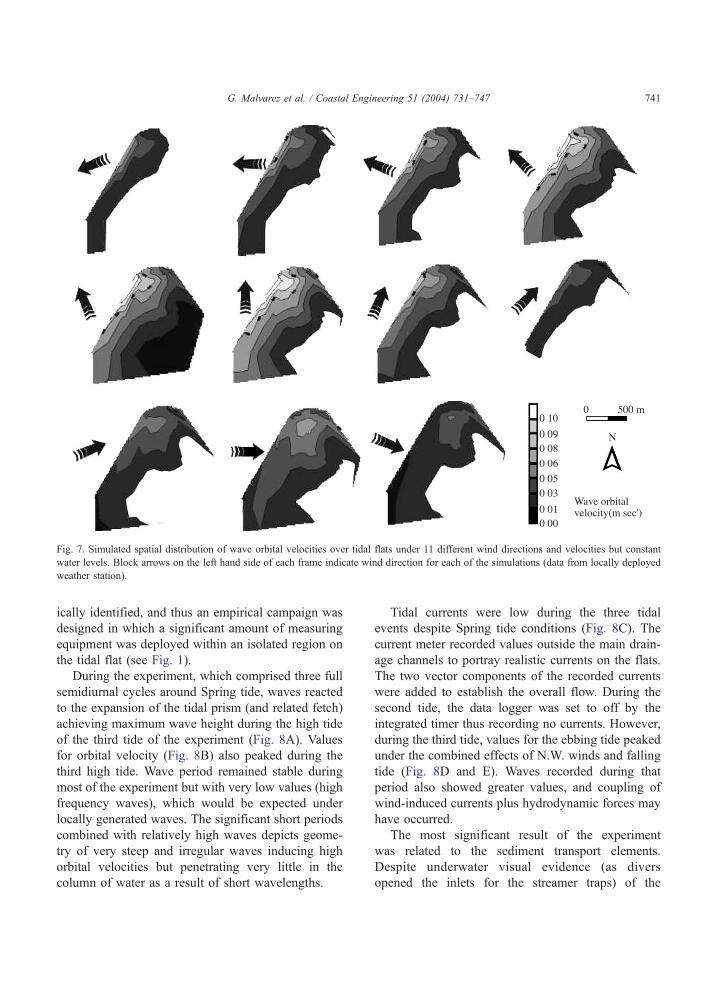
Fig. 7. Simulated spatial distribution of wave orbital velocities over tidal flats under 11 different wind directions and velocities but constant
water levels. Block arrows on the left hand side of each frame indicate wind direction for each of the simulations (data from locally deployed
weather station).
G. Malvarez et al. / Coastal Engineering 51 (2004) 731–747 741
ically identified, and thus an empirical campaign was
designed in which a significant amount of measuring
equipment was deployed within an isolated region on
the tidal flat (see Fig. 1).
During the experiment, which comprised three full
semidiurnal cycles around Spring tide, waves reacted
to the expansion of the tidal prism (and related fetch)
achieving maximum wave height during the high tide
of the third tide of the experiment (Fig. 8A). Values
for orbital velocity (Fig. 8B) also peaked during the
third high tide. Wave period remained stable during
most of the experiment but with very low values (high
frequency waves), which would be expected under
locally generated waves. The significant short periods
combined with relatively high waves depicts geome-
try of very steep and irregular waves inducing high
orbital velocities but penetrating very little in the
column of water as a result of short wavelengths.
Tidal currents were low during the three tidal
events despite Spring tide conditions (Fig. 8C). The
current meter recorded values outside the main drain-
age channels to portray realistic currents on the flats.
The two vector components of the recorded currents
were added to establish the overall flow. During the
second tide, the data logger was set to off by the
integrated timer thus recording no currents. However,
during the third tide, values for the ebbing tide peaked
under the combined effects of N.W. winds and falling
tide (Fig. 8D and E). Waves recorded during that
period also showed greater values, and coupling of
wind-induced currents plus hydrodynamic forces may
have occurred.
The most significant result of the experiment
was related to the sediment transport elements.
Despite underwater visual evidence (as divers
opened the inlets for the streamer traps) of the
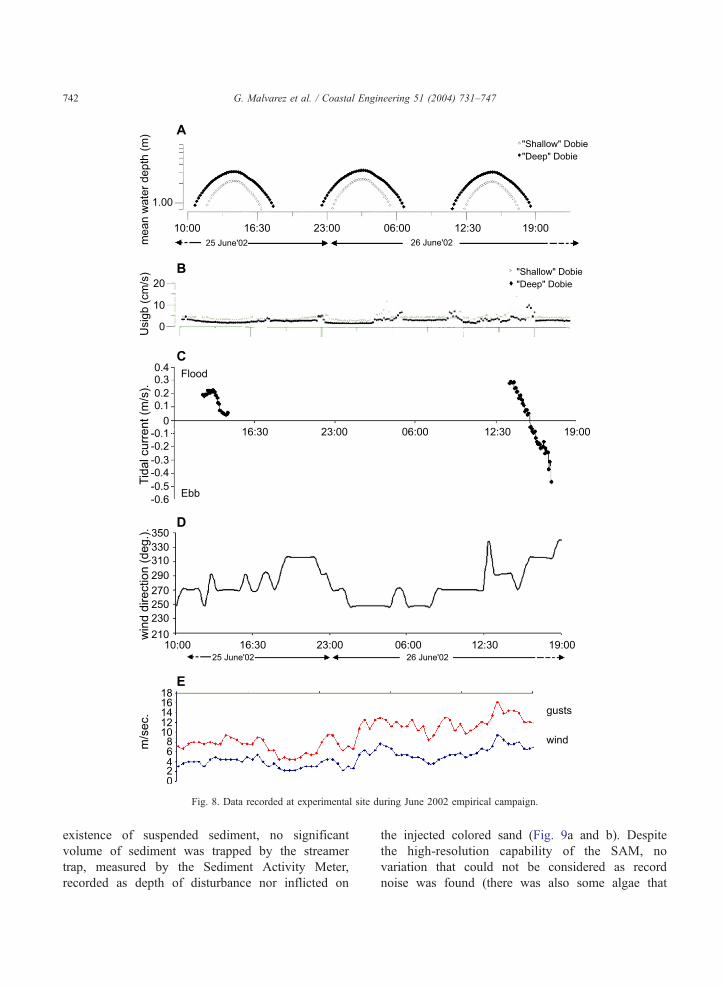
Fig. 8. Data recorded at experimental site during June 2002 empirical campaign.
G. Malvarez et al. / Coastal Engineering 51 (2004) 731–747742
existence of suspended sediment, no significant
volume of sediment was trapped by the streamer
trap, measured by the Sediment Activity Meter,
recorded as depth of disturbance nor inflicted on
the injected colored sand (Fig. 9a and b). Despite
the high-resolution capability of the SAM, no
variation that could not be considered as record
noise was found (there was also some algae that
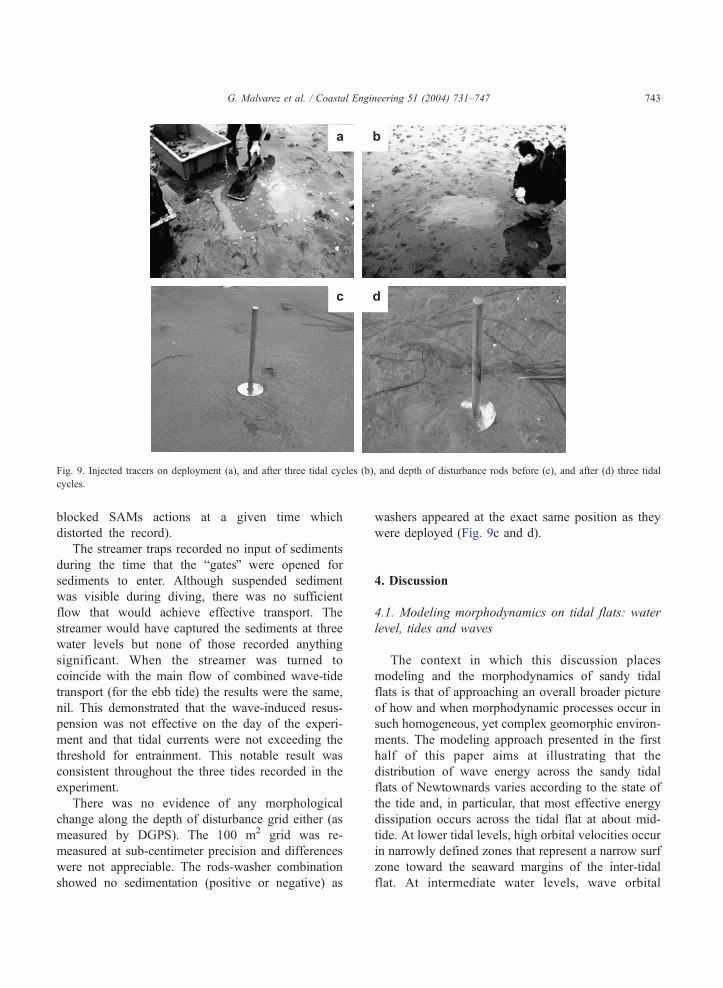
Fig. 9. Injected tracers on deployment (a), and after three tidal cycles (b), and depth of disturbance rods before (c), and after (d) three tidal
cycles.
G. Malvarez et al. / Coastal Engineering 51 (2004) 731–747 743
blocked SAMs actions at a given time which
distorted the record).
The streamer traps recorded no input of sediments
during the time that the bgatesQ were opened for
sediments to enter. Although suspended sediment
was visible during diving, there was no sufficient
flow that would achieve effective transport. The
streamer would have captured the sediments at three
water levels but none of those recorded anything
significant. When the streamer was turned to
coincide with the main flow of combined wave-tide
transport (for the ebb tide) the results were the same,
nil. This demonstrated that the wave-induced resus-
pension was not effective on the day of the experi-
ment and that tidal currents were not exceeding the
threshold for entrainment. This notable result was
consistent throughout the three tides recorded in the
experiment.
There was no evidence of any morphological
change along the depth of disturbance grid either (as
measured by DGPS). The 100 m2 grid was re-
measured at sub-centimeter precision and differences
were not appreciable. The rods-washer combination
showed no sedimentation (positive or negative) as
washers appeared at the exact same position as they
were deployed (Fig. 9c and d).
4. Discussion
4.1. Modeling morphodynamics on tidal flats: water
level, tides and waves
The context in which this discussion places
modeling and the morphodynamics of sandy tidal
flats is that of approaching an overall broader picture
of how and when morphodynamic processes occur in
such homogeneous, yet complex geomorphic environ-
ments. The modeling approach presented in the first
half of this paper aims at illustrating that the
distribution of wave energy across the sandy tidal
flats of Newtownards varies according to the state of
the tide and, in particular, that most effective energy
dissipation occurs across the tidal flat at about mid-
tide. At lower tidal levels, high orbital velocities occur
in narrowly defined zones that represent a narrow surf
zone toward the seaward margins of the inter-tidal
flat. At intermediate water levels, wave orbital
G. Malvarez et al. / Coastal Engineering 51 (2004) 731–747744
velocities are less intense but are above sediment
transport thresholds capable of work across a much
greater area of the tidal flat. At elevations greater than
1 m OD, wave bottom orbital velocities decrease
across most of the tidal flat and a narrow zone of high
orbital velocity develops at the high-tide margin of the
tidal flat. Above this depth, penetration of wave
energy through the water column is impeded and
wave action on the sea bed does not produce sediment
movement.
Examination of results indicates best (and statisti-
cally significant) correlations between sediment
mean grain size and wave orbital velocity at water
levels between �0.15 and 1.0 m OD. At higher and
lower water levels, the correlation between grain size
and wave orbital velocity is not significant. The
significant correlations between grain size and orbital
velocity exist in the presence of other (not assessed)
potential variations in sediment transport related
factors (including spatially variable algal and diatom
concentrations, mucus cementation of grains, dis-
turbances by grazing birds, etc). On the basis of the
wave-energy simulations alone, these results suggest
that variations in wave energy can explain some of
the observed variation in sediment grain size. In
addition, a number of interesting findings indicated
the relationship between wave processes and sed-
imentation. For example, rather than a rapidly
migrating zone of intense activity of breaking waves
(such as exists at the margin of the advancing or
retreating tide) being the main control on sediment
texture on such a sandy tidal flat, prolonged activity
at a slightly lower energy level may have a more
significant role on the distribution of sediment
texture. Thus, when water levels are between
�0.15 and 1.0 m OD and wave shoaling processes
are active across a broad area of the tidal flat, the
strongest relationship is found between wave veloc-
ities and sediment texture. The most effective and
widespread sediment transport under wave action
appears to occur while shoaling waves affect the
tidal flat surface for a prolonged period (i.e., when
water level is rising over large areas after flooding
tidal channels).
The results further suggest that to examine the role
of wave energy on sedimentation on the tidal flats
requires analysis at different water levels. Interest-
ingly, the periods of maximum wave influence at
mid-tide are also likely to be coincident with
maximum tidal current velocities although, in the
case of Strangford Lough, model studies (KMM,
1993) have shown that tidal current velocities are
relatively low on the tidal flats. It is thus possible that
previous workers, who have ascribed sediment trans-
port and sorting on tidal flats solely to tidal currents,
may have disregarded the contribution of wave-
induced forces, which may also exert their maximum
influence at mid-tide.
The results of the multidirectional modeling
effort show that modal waves synthetically propa-
gated over the tidal flats are not significantly related
to spatial distribution of sediment sizes or its
modification. Good correlations between near bot-
tom orbital velocity and elevation of the sample
location validates the technique, and demonstrate
that lack of correlations with spatial distributions of
sediments may be due to the intervention of some
other environmental parameters, or the fact that
forcing factors are not powerful enough to trigger
morphodynamic processes. Parameters characteristi-
cally contemplated in beach morphodynamics, such
as bed slope, may make wave propagation and
morphodynamic adjustment more sensitive. Thus,
although potentially the threshold for entrainment
may be approached, sediment activation and trans-
port is the sole response to high-energy events and/
or coupling of tidal, wave and water level induced
morphodynamics that occur in narrow temporal
bands.
4.2. Tidal flat morphodynamics
The mega dissipative environments found in
tidal flats are not frequently classified under
morphodynamic classification due to expected
dominance of tidal flows over wave-induced mor-
phodynamics. In macro-tidal environments in par-
ticular, the extent of beaches can dictate that the
flat morphology dissipate wave and tidal energy
generating a shift by which the tide may be
regarded as a water level controller rather than a
dynamic forcing factor. Tidal current alone may not
be sufficient in these conditions to exert entrain-
ment velocities on sea bed sediments, and thus
deposition dominates (extremely fine sediments and
muds).
G. Malvarez et al. / Coastal Engineering 51 (2004) 731–747 745
If considered like a beach, the extent of tidal flats
can be characterized by the expression (from Masse-
link and Turner, 1999)
XIT ¼ TR=tanb ð1Þ
where XIT is the lateral extent of the inter-tidal area,
TR is the tidal range and tanb is the beach gradient.
Newtownards tidal flats described in this paper could
be characterized by inter-tidal extents of 1230 and 520
m for the western and eastern shores, respectively. A
better definition of the morphodynamic states are
described by the parametric factor RTR
RTR ¼ TR=H ð2Þ
where RTR is the relative tidal range, TR is the tidal
range, and H is wave height. Using this index for
Newtownards the tidal flats may be characterized as
wave dominated to mixed wave-tide dominated (index
2.5 using local measured H and TR on the inter-tidal,
2.3 using storm H, and 7 on average conditions)
clearly placing the study of these tidal flats in the
context of other macro-tidal beaches.
Given then the classification of these environments
as mixed wave-tide dominated, it follows that the
approach taken to the investigation of such environ-
ments could be marked within empirical and numer-
ical investigations on macro-tidal beaches. Sandy tidal
flats have, however, never been viewed in this way.
There is little research done from this standpoint and,
to our knowledge, has always coincided with under-
stated reflections on the role of wave action on the
sedimentation of tidal flats.
Variations in wave energy can explain much of
the observed variability in sediment grain size.
Rather than a rapidly migrating zone of intense
activity of breaking waves (such as exists at the
margin of the advancing or retreating tide) being the
main control on sediment texture on such a sandy
tidal flat, prolonged activity at a slightly lower
energy level may have a more significant role on
the distribution of sediment texture. Wave shoaling
processes are active across a broad area of the tidal
flat; the strongest relationship is found between wave
velocities and sediment texture.
Previous research shows how wave penetration
through the column of water and the variability of
shoaling and surf zones lead to the sandy tidal flat
sedimentation in the context of generic coastal
morphodynamics. On tidal flats, Green and MacDon-
ald (2001) indicated that some optimum water level
appeared to occur during their experiments in New
Zealand that affected sedimentation under the effects
of waves. This optimum water level was documented
in the first section of this contribution. The encourag-
ing results shown here under higher energy waves
(modeled) helped to identify the location of an
empirical exercise.
The focus of the empirical experiment presented
here was to measure how high tidal flow velocities
(Spring tides in the area) and strong winds could be
used to illustrate the forcing factors in play upon the
macro-tidal beach using a suit of equipment designed
for surf zone investigations. Although wind speeds
and current velocities reached as high values as
expected and relatively high and steep waves were
generated locally under very limited fetch, no
morphological or sedimentological response was
noted at any point (despite measuring at theoretically
optimum water levels).
The tidal prism was blown from the N.W. quadrant
and the effects on tidal current velocities were also
noted during the third ebbing tide. The coupling of
optimum wave penetration (combination of high
orbital velocities and water levels within closure
depth) did not appear to affect the decisive role
indicated in previous research, perhaps because the
limited fetch controlled wave generation and develop-
ment above water depth.
Flocculation during the experiment was not
visible, and suspended sediment was very little.
This was radically documented by the lack of
motion on the dyed sands deployed over the study
area. Ciavola et al. (1997) reported the effect of
breaking wave height on activation of sediments as
documented by measurements of depth of disturb-
ance. Using this framework the SAM apparatus was
tested on open beaches in the North of Ireland
yielding results that were comparable but used
shoaling wave height (local) rather than breaking
(Jackson and Malvarez, 2002). Within the frame-
work of morphodynamic research, measurements of
depth of disturbance should have yielded results
despite the fact that the slope (as a controlling
factor) was much lower than on beaches. Thus, the
lack of sedimentation under waves of significant
potential for activation shows that the temporal
G. Malvarez et al. / Coastal Engineering 51 (2004) 731–747746
scales under which beaches operate may not be
comparable to that of tidal flats.
The effects of combined wave and tidal action is
the current focus of a variety of research projects, but
further research is needed to document the complex
scenario presented on sandy tidal flat sedimentation.
The decisive role of biological factors in sedimenta-
tion processes may be more significant than antici-
pated, and certainly than it is considered in beach
science. The sensitive balance of tidal and wave
interaction may also need to be reflected in the
manner in which sea bed morphology is described.
5. Conclusions
On tidal flats modeling and empirical studies,
investigating medium term evolution as well as
engineering applications are possibly using the wrong
tools or basing calculations on equations and methods
that were most definitely not designed for these
environments. This shortcoming has an effect in the
way we expect tidal flat morphodynamics to behave
and consequently, this contribution aims at demon-
strating that tidal flats cannot be monitored or
investigated as open beaches.
However, morphodynamic classification schemes
are capable of placing sandy tidal flats within mega
dissipative beach environments. The tidal flats of
Newtownards in Northern Ireland are included in
such classification schemes, and thus it is now a
matter of fine tuning modeling and morphodynamic
research to enable better characterization of sedi-
mentation and long-term evolution of these low
energy, low gradient environments. The extreme low
variation found in both forcing and receiving
environments presents a serious challenge to coastal
modelers, scientist and engineers.
References
Amos, C.L., 1995. Siliciclastic tidal-flats. In: Perillo, G.M.E.
(Ed.), Geomorphology and Sedimentology of Estuaries, Devel-
opments in Sedimentology, vol. 53. Elsevier, Amsterdam, The
Netherlands, pp. 273–306.
BBV (Binnie, Black and Veatch, Consulting Engineers), 1997.
Strangford Lough Sea Defences at Newtownards. Environ-
mental Assessment Report. Internal Report, March 1997.
Boyd, R., Dalrymple, R., Zaitlin, B.A., 1992. Classification of
clastic coastal depositional environments. Sedimentary Geology
80, 139–150.
Booij, N., Holthuijsen, L.H., 1995. HISWA (HIndcasting of
Shallow Water wAves) User Manual. Prediction of Stationary,
Short-crested Waves in Shallow Water with Ambient Currents.
Version 110.43. Department of Civil Engineering, Delft Uni-
versity of Technology, Delft, The Netherlands. 87 pp.
Carling, P.A., 1982. Temporal and spatial variation in intertidal
sedimentation rates. Sedimentology 29, 17–23.
Ciavola, P., Taborda, R., Ferreira, O’., Alveirinho Dias, J., 1997.
Field observations of sand-mixing depths on steep beaches.
Marine Geology 141, 147–156.
Collins, J.I., 1976. Wave modeling and hydrodynamics. In: Davis,
R., Ethington, R.L. (Eds.), Beach and Nearshore Sedimentation.
Society of Economic Paleontologists and Mineralogists, Tulsa,
OK, pp. 54–68.
Green, M.O., 1998. DOBIE the intelligent wave gauge. Operator
Manual. NIWA (National Institute of Water and Atmospheric
Research), Christchurch, New Zealand. Manufactured by NIWA
Instrument Systems.
Green, M.O., MacDonald, I.T., 2001. Processes driving estuary
infilling by marine sands on an embayed coast. Marine Geology
178 (1–4), 11–37.
Hammond, M.E.R., Malvarez, G.C., Cooper, A., 2002. The
distribution of Spartina anglica on estuarine mudflats in relation
to wave-related hydrodynamic parameters. Journal of Coastal
Research 36, 352–355 (special issue).
Holtuijsen, L.H., Booij, N., Herbers, T.H.C., 1989. A
prediction model for stationary, short crested waves in
shallow water with ambient currents. Coastal Engineering 13,
23–54.
Jackson, D.W.T., Malvarez, G., 2002. A new, high-resolution ddepthof disturbanceT instrument (SAM) for use in the surf zone.
Journal of Coastal Research 36, 406–413 (special issue).
Jin, K.R., Ji, Z.G., 2001. Calibration and verification of a spectral
wind-wave model for Lake Okeechobee. Journal of Ocean
Engineering 28, 571–584.
KKM (Kirk, McClure, Morton Consulting Engineers), 1993.
Computational Models for Management of Water Quality in
Strangford Lough. Report to Department of Environment (NI).
Environmental Protection Division, Belfast.
Komar, P.D., Miller, M.C., 1973. The threshold of sediment
movement under oscillatory water waves. Journal of Sedimen-
tary Petrology 43, 1101–1110.
Kraus, N.C., 1987. Application of portable traps for obtaining point
measurements of sediment transport rates in the surf zone.
Journal of Coastal Research 3 (2), 139–152.
Malvarez, G., Cooper, J.A.G., Jackson, D.W.T., 2001. Relationship
between waves and tidal flat sedimentation. Journal of
Sedimentary Research 71 (5), 705–712.
Masselink, G., Turner, I.L., 1999. The effect of tides
on beach morphodynamics. In: Short, A.D. (Ed.), Handbook
of Beach and Shoreface Morphodynamics. Wiley, Chichester,
pp. 204–229.
Navas, F., Cooper, J.A.G., Malvarez, G.C., 2001. Theoretical
approach to the investigation of ridge and runnel topography

G. Malvarez et al. / Coastal Engineering 51 (2004) 731–747 747
of a macrotidal beach: Dundrum bay Northern Ireland. Journal
of Coastal Research, 183–193 (special issue, Proceedings of
ICS2000).
Nordstrom, K.F., Jackson, N.L., 1992. Two dimensional change on
sandy beaches in estuaries. Zeitschrift fqr Geomorphologie 36,
465–478.
Reineck, H.E., 1967. Layered sediments of tidal-flats, beaches and
shelf bottoms of the north sea. In: Lauff, G.H. (Ed.), Estuaries,
vol. 83. American Association for the Advancement of Science,
Washington, pp. 191–206. Special Publication.
Ryan, N.M., Cooper, J.A.G., 1998. Spatial variability of tidal-
flats in response to wave exposure: examples from Strangford
Lough, Northern Ireland. In: Black, K.S., Paterson, D.M.,
Cramp, A. (Eds.), Sedimentary Processes in the Intertidal Zone.
Special Publication - Geological Society of London, vol. 139,
pp. 221–230.