Embed Size (px)
Citation preview
J. MARCZILLE T. BOELY M. UNAR G.S. MERTA B. SABHOTOMO J.C.B. UKTOLSEJA
Éditions de i’0 RSTO Dl INSTITUT FRANÇAIS DE RECHEliCHE SCIENTIFIQUE POUR LE L¶ÉVELBPPEMENT EN COOPÉRATION
TUNA FISHING
IN INDONESIA

(( La loi du II mars 1957 n’autorisant, aux termes des alinéas 2 et 3 de l’article 41, d’une part, (( que les ((copies ou reproductions strictement réservées à l’usage privé du copiste et non destinées (( à une utilisation collective» et, d’autre part, que les analyses et les courtes citations dans un but (( d’exemple et d’illustration, ((toute représentation ou reproduction intégrale, ou partielle, faite sans le G consentement de l’auteur ou de ses ayants droit ou ayant cause, est illicite)) (alinéa Ier de l’article 40).
(( Cette représentation ou reproduction, par quelque procédé que ce soit, constituerait donc une (( contrefaçon sanctionnée par les articles 425 et suivants du Code Pénal)). . . . . . . . . . . . . . . . . . . . . . ;: . . . . .
I.S.B.N. : 2-7099-0739-9 @ O.R.S.T.O.M. 1984
Balai Peneletian Perikanan Laut Institut Français de Recherche Scientifique pour le Dbveloppemnt en Coopération (O.R.S.T.O.M.)
TUNA FISHING
IN
INDONESIA
by
f. "w?&LLE "
Il: UNAR: G.S. MERTA - 8. SAOHOTOMG - J.C.B. UKTOLSEJA -
* Institut Français de Recherche Scientifique pour le Développement en Coopération (O.R.S.T.O.M.).
+W Central Research Institute for Fisheries - Jakarta. +HI+ Research Institute for Marine Fisheries - Jakarta.
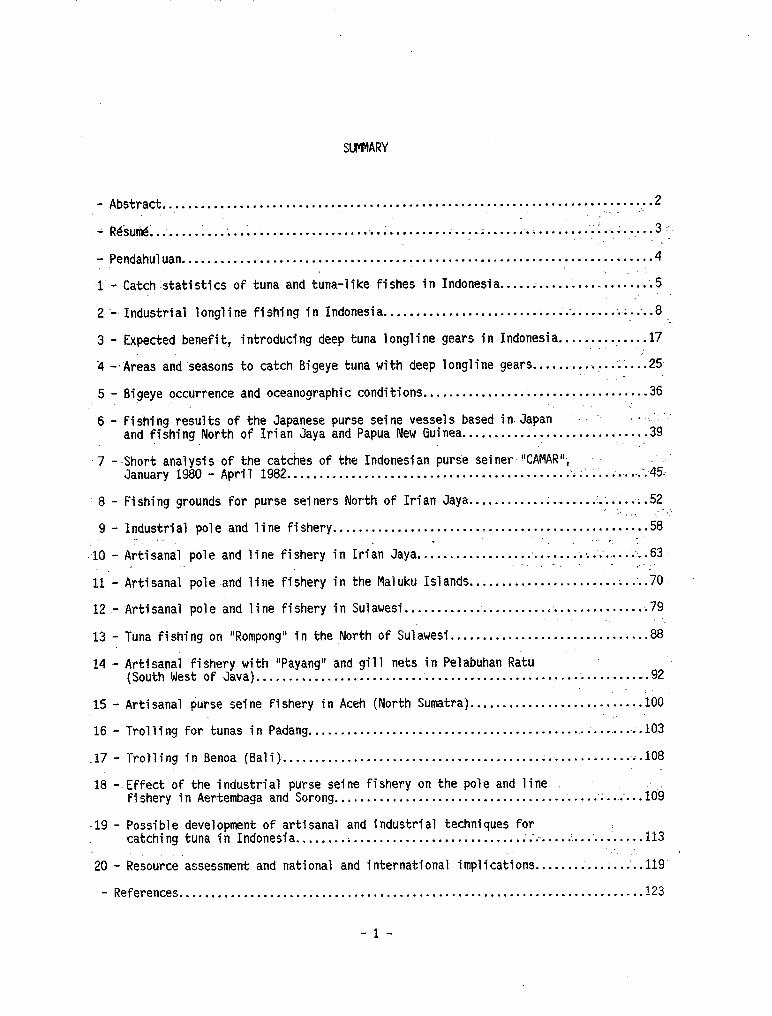
SUIUMARY
- Abstract . . . . . . . . . . . . . . . . . . . . . . . . . . . . . . . . . . . ..*.......*...*......*................... 2 _.'-
A R&U~&.......;...:..: <. . .
. . . . . . . . . . . . . . . . ..~.......................'.................... 3, <,).'
- Pendahuluan .-...............a......... . . . . . . . . . . . . . . . . . . . . . . . . . . . . . . . . . . . . . . . . . . . ..B 4 ,-
.l. -
2‘-
3-
4-
5-
6-
Catch-statistics of tuna and tuna-like fishes in Indonesia.....;.................;5 : :
Industrial longline fishing in Indonesia .. 8 . . . . . . . . . . . . . . ..*....................‘..... '..
Expected benefit, introducing deep tuna longline gears in Indonesia.........,....17
Areas.and Seasons to catch Bigeye tuna with deep longline gears......-...i...;....25
Bigeye occurrence and oceanographic conditions...................................36
7-
-8-
9-
.-10 - . ll’-
Fishing results of the Japanese purse Seine vessels based in Japan a’:‘:’ and fishing North of Irian Jaya and Papua New Guinea.............................39 ,Y-.
Short analysis of the catches of the Indonesian purse seiner "CAMAR"; January 1980 - April 1982 . .$ . . . . . . . . . . . . . . . . . . . . . . . . . . . . . . . . . . . . . . . . . . . ..~~...........
Fishing grounds for purse seiners North of Irian Jaya . . . . . . . . . . . . . . . . . . . . . . . . . . . . 52 . . --:...
Industrial pole and line fishery . . . . . . . . . . . . . . . . . . . . . ..~......................... 58 .
Artisanal pole and line fishery in Iriàn Jaya. . . . . . . . . . . . . . . ..: . . . . ..:-.::.- . . . . . ,.-‘..63 <-. - ,... Artisanal pole.and line fishery in the Maluku Islands -70 . . . . . . . . . . . . . . . . . . . . . . . ..a..
12 - Artisanal pole and line fishery in Sulawesi . . . . . . . . . . . . . . . . . . . . ..oi............... 79
13 - Tuna fishing on "Rompong" in the North of Sulawesi...............................88
14 - Artisanal fishery with "Payang" and gill nets in Pelabuhan Ratu (South West of Java) . . . . . . . . . . . . . . ..*............ . . . . . . . . . . . . . . . ..‘.....S......V. 92
15 - Artisanal purse Seine fishery in Aceh (North Sumatra)......................~.....lOO
16 - Trolling for tunas in Padang...............................................~.....lQ3
-17 - Trolling in Benoa (Bali).................... . . . . . . . . . . . . . . . . . . . . . . . . . . . . . . . . . ...108
18 -.Effect of the industrial purse Seine fishery on the pole and line fishery in Aertembaga and Sorong . . . . . . . . . . . . . . . . . . . . . . . . . . . . . . . . . . . . . . . . . '. . :;. . . io9
-19 - Possible development of artisanal and industrial techniques for catching tuna in Indonesia . . . . . . . . . . . . . . . . . . . . . . . . . . . . . . . . . . . . . . ...*.... . . . .:. . . . .113
: ,. 20 - Resource.assessment and national and international implications...............'.. 119’
- References . . . . . . . . . . . . . . . . . . . . . . . . . . . . . . . . . . . . . . . . . . . . . . . . . . . . . . . . . . . . . . . . . . . . . . . . 123
-l-
- ABSTRACT -
Traditionally, major countries :
industrial tuna fishing in the Pacifie Ocean has been done by four Japan, USA, Taiwan and South Korea ; a11 of them catching tuna mainly
outside their exclusive economic zone (EEZ).
For some years, industrial fishing has been extensively developed by new countries which have the resources in their own EEZ but did not have the required technology nor the access to the markets, which are essentialy limited to Japan and the United States. Those new countries are Mexico in the Eastern Pacifie and the Philippines i.n,the Western Pacifie.
In Indonesia, as in the Philippines, consumption of tuna is high, depending on the area, and tuna fishing is traditional in many islands as it is shown by the great number of artisanal technics used to catch those fishes.
Until now, areas exploited were usually very close to the shore and quite limited and offshore resources were almost not exploited at least by the Indonesian themselves.
There is no doubt about the fact that Indonesia Will become, in the future, a major tuna producer in the Western Pacifie and the Indi an Ocean and will increase its possible future development.
In this report, we Will describe the present tuna fishing and its possible future development.
It is almost impossible to completely review tuna fishing in a country like Indonesia because the area to study is too wide and the fishing methods used as well as the species caught are SO diversified ; instead we have limited our study to the main commercial species which.are yellowfin, bigeye tuna and skipjack, the most abundant ones.
Fishing of tuna-like fishes, generally done by small scale fisheries, as it occurs in the Java Sea, is not included in this report.
After a short presentation of the statistics of tuna and tuna-like fishes in the country (chapter l), we Will studythe catches of big tunas using longliners (chapter 2 to 5) and its possible development, then skipjack catches by industrial purse seiners (chapter 6 to 8) and industrial.pole and line boats (chapter 9).
Artisanal fishing of skipjack by pole and line is well developed in many areas of Western Indonesia. It Will be presented in chapter 10 to 12.
Many other artisanal technics such as trolling, angling on fish shelter, purse seining and gillneting are used to catch skipjack and other tuna and tuna-like fish. flepending on the areas, one. or several of these methods may be predominent ; some of those technics and areas are covered in chapter 13 to 17.
In chapters 18 to 20, we Will expose a few of our ideas about the effect of the industrial purse Seine developmant on the artisanal activities and about the possible development of artisanal and industrial technics to catch tuna in Indonesia, also considering national and international implications.
-2-
'REME
"LA PECHE AU THON EN INDONESIE"
Traditionnellement la pêche thoniere industrielle dans l'ocban Pacifique était le fait de quatre pays principaux : 1 e Japon, les Etats Unis, Taiwan et la Corée-du Sud. Presque tous ces pays péchent le thon en dehors de leur zone économique~exclusive.
Depuis plusieurs annees, la pêche industrielle s'est considbrablement developpée dans des pays nouveaux qui possèdent la ressource, mais qui jusqu'alors n'avaient ni la technologie requise ni l'actes aux marchés ; les principaux sont le Mexique, dans le Pacifique Est, et les Philippines, dans le Pacifique Ouest.
En Indonesie, conmm c'est le cas aux Philippines, la consommation des thons est importante, au moins dans certaines regions, et leur p@che y est une activite très ancienne cormne .le suggère la grande diversite des techniques artisanales qui existent. Les zones exploitées se situent en génbral a proximite des cbtes et, de,ce fait, les ressources du grand large ne sont jusqu'à présent que tres peu touchées. :
Il ne fait pas de doute que ?'Indon&ie deviendra, dans un futur proche, un producteur important de thons destinés aussi bien a l'exportation qu'au marché intérieur. Dans cette perspective, il paraissait utile de faire un état de la pêcherie actuel-le et de.ses possibilités de développement.
Entreprendre une revue complète de la peche au 'thon en Indonésie est une tache presque impossible du fait de la taille m&ne de cet immense archipel et de l'extrême diversité des techniques de péche qui y sont employees. Pour cette raison, nous nous sonnnes limites a l'étude des trois principales espkes qui sont commercialisées sur le marché international, à savoir 1 'albacore, le patudo et le listao. Les pècheries des autres petits thonides, qui peuvent etre localement tres importantes, en mer de Java par exemple, ne sont pas btudiées en détail.
Après une courte présentation de l'ensemble des statistiques thonières (chapitre l), nous examinons plus en detail les prises obtenues par les palangriers (chapitre 2) et les possibilites. de developpement offertes par l'introduction de palangres profondes (chapitres 3 a. 5). Les pêches de listao par les senneurs et les tanneurs-industriels recemnent introduits, sont presentées dans les chapitres 6 a 9.
.La peche artisanale au moyen de tanneurs à appat vivant est importante et déj& ancienne dans tout l'ouest indonésien ; les chapitres 10 a 12 y sont consacrés.
De nombreuses autres techniques artisanales pêche à la trafne,
sont employées pour pêcher le thon : a la ligne a main, B la senne ou au filet maillant. Suivant les
rbgions, 13 a 17.
certaines de ces techniques predominent ; elles sont étudiees dans les chapitres
En - fin. de rapport nous examinons l'effet du developpement récent de la pêche à la senne sur la p@che artisanale a la canne dans les secteurs limitrophes(chapitre 18) et envisageons les possibilités d'accroftre les pêcheries tant industrielles qu'artisanales (chapitre 191, en considerant les implications nationales et internationales de ce type de développement (chapitre 20).
-3-
PENDAHULUAN
"PENANGKAPAN IKAN TUNA DI INDONESIA"
Secara tradisi penangkapan ikan tuna untuk industri lautan Pasifik adalah masalah empat negara : Jepang, Amerika Serikat, Taiwan dan Korea Selatan.Hampir semua negara itu menangkap ikan tuna di luar zona ikonomi eksklusif.
Sejak beberapa tahun yang lalu, penangkapan tuna untuk industri berkembangpesat di negara-negara yang memiliki sumber tetapi yang sejauh itu belum mempunyai teknologi yang diperlukan ataupun daerah pemasaran ; yang paling utama adalah Meksiko di Pasifik Timur dan Pilipina di Pasifik Barat.
Di Indonesia, seperti halnya di Pilipina, konsumsi ikan tuna sangatlah besar, sekurang-kurangnya di daerah-daerah tertentu, dan penangkapannya di sana merupakan kegiatan yang sudah sangat kuno seperti yang diperlihatkan oleh beraneka ragam teknik dalam perikanan rakyat. Daerah-daerah penangkapan biasanya terdapat di dekat pantai dan karena itu sumber-sumber di laut lepas sampai sekarang kurang disentuh.
Tak pelak lagi bahwa Indonesia, dalam waktu dekat, akan menjadi produsen penting ikan tuna yang ditujukan baik untuk ekspor maupun untuk pasaran dalam negeri. Dalam prospek ini, tampaknya penting untuk mengemukakan keadaan perikanan sekarang dan kemungkinan-kemungkiana pengembangannya.
Membuat suatu gambaran yang lengkap tentang penangkapan tuna di Indonesia adalah . suatu pekerjaan yang sangat sukar karena luasnya kepulauan ini dan karena sangat beraneka ragamnya teknik penangkapan yang digunakan ki sana. Karena alasan ini kami membatasi kiri pada penelitian tiga jenis utama yang diperdagangkan di pasaran internasional, yaitu : madidihang, tuna mata besar san cakalang. Penangkapan jenis-jenis tuna kecil yang lain, yang secara local bisa sangat penting, misalnya di laut Jawa, yang belum depelajari secara terperinci.
Setelah dekemukakan secara ringkas kesel,uruhan statistik. ikan tuna (bab l), kami pelajari lebih terperinci penangkapan dengan rawai tuna (bab 2) dan kemungkinan-kemungkinan pengembangannya perikanan industri untuk cakalang dengan pukat cincfn dan huhate yang baru-baru ini diperkenalkan, dikemukakan dalam bab-bab 6 sampai 9.
Penangkapan ikan tuna dengan menggunakan kail berumpan hidup yang telah berkembang di Indonesia bagian 6arat ; disajikan dalam bab 10 sampai dengan bab 12.
Berbagai teknik penangkapan yang digunakan untuk menangkap ikan tuna seperti tonda, pancing, jaring insang, pukat cincin dan rumpon sebagai mana diterapkan didaerah-daerah tertentu j diliput dalam bab 13 sampai dengan 17.
Pada akhir laporan dipelajari akibat perkembangan baru penangkapan ikan dengan pukat cincin terhadap perikanan rahyat (bab 18) dan merencanakan kemungkinan untuk pengembangan perikanan industri dan perikanan rahyat (bab 19), dengan mempertimbangkan keterlibatan nasional dan internasional dari jenis pembangunan ini (bab 20).
-4-
-._ __~ - 1 CATCH-STATISTICS OF &VA AND'TUNA-Lh FISilES Iti ItiDDNÈSIA.‘--'- %-.--s " :
: ; ..< . . :t .I
., --. , . _ . c Statistics on tuna and tuna-like fish catches are collected each year by the Directorate
General of Fishery and are estimated for a11 provinces by species and by year. There are three main categories of species : "Tuna", "Cakalang" and Tongkol'!.. _
.-. ,: ;
The first ‘category, "Tuna", includes a11 big tunas such as albacore,: yellowfin and bigeye ; the- two dominant species caught in Indonesia, mainly with longline gears and troll lines are yellowfin (Thunnus albacares) and bigeye tuna (Ttiunnus obesus). .' .-'. :- '.
*. The second category, Yakalang", is more homogenous since it only includes skipjacktuna
(Katsuwonus pelamis) caught by pole and line boats and trollers ; son?etimes locally- frigate mackerel' :-(Auxis thazard) and eastern little tuna (Euthvnnus affinis) may be inc-luded in.this ~3worY. _ . . .., -. .-_: .._.
The third ,one, "Tongkol", includes a11 kinds of tuna-like fish such.as longgai tuna (Thunnus tonqqol), frigate mackerel and bullet mackerel (Auxis thazard. and Auxis rochei), eastern little tuna (Euthvnnus affinis) or oriental bonito (Sarda orientalis).
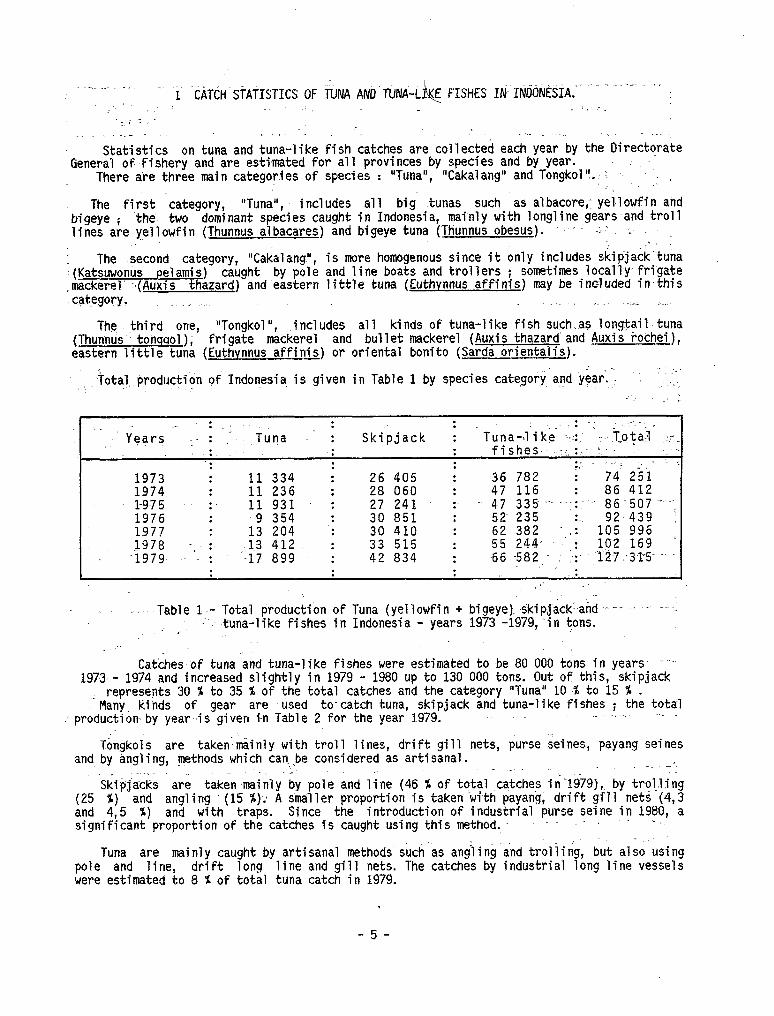
-Total, production of Indonesia is given in Table 1 by species category, and year.: : '..::" .' -,:
: _- Y&rs -.- : ad
: Tuna -' :
. . . : . . :
1973 I 11 334 : 1974 : 11 236 : l-975 :- 11 931 : 1976 : ,9 354 : 1977 : 13 204 : 1978 -/. : .1~3 412 :
.1979 - : -17 899 :
: fishes - .,:.:v t. - : .,, : . . .., ;- _ :' -
26 405 : 36 782 28 060 : 47 116 27 241 :- .. 47 335. -- 30 851 : 52. 235 30 410 : 62 382 -, 33 515 : 55 244, 42 834 : 66 -582 .
: 74 251 : 86 412 . , . .-86x507 -.
. . . 92 439 : : 105 996 : 102 169 ’ .~_ .~ . -12.7 ,.31.5- .
.’
.
Table lu- Total production of Tuna (yellowfin + bigeye) skipja&-and -- ..'- : < .tuna-like fishes in Indonesia - years 1973 -1979,‘i n tons.
~_
Catches of tuna and tuna-like fishes were estimated to be 80 000,tons in years- ".'- 1973 - 1974 and increased slightly in 1979 - 1980 up to 130 000 tons. Out of this, skipjack
. . represents 30 % to 35 % of the total catches and the category "Tuna" 10 % to 15 % . Many. kinds of gear are used to-catch tuna, skipjack and tuna-like fishes ; the total
_.... . : production by year..is given in Table 2 for the year 1979. _
Tongkols are taken:mainly with troll lines, drift gill nets, purse seines, payang seines and by angling, -@thods which can..~be considered as artisanal. -.. - '.
Skiejacks are taken mainly by pole and line (46 X of total catches in %79), by trolling (25 P) and angling (15 a): A smaller proportion is taken with payang, drift gïll nets-(4,3 and 4,s %) and with traps. Since the introduction of industrial purse Seine in 1960, a significant proportion of the catches is caught, using this method. - _
-. Tuna are mainly caught by artisanal methods such as angling'and trolling, but also using
pole and line, drift long line and gill nets. The catches by industrial long line vessels were estimated to 8 % of total tuna catch in 1979.
-s-
: : : Gears' : Tuna : Skipjack : Tuna-like
: : . . fishes . .
: : : Payang : : Purse Seine
~ Gill net : 3: *
1 792 : 6 003 338 : 6 388
.
I
432 ; 1 875 : 17 316
Tuna longline 1 487 : : Other longlines : 2 907 : 842 : 2 87: Pole and line : 2 004 : 19 037 : 724 Angling : 5811 : 6 629 : 9‘ 505 Troll : 4760 : 10 061 : 16 040 Traps : : 191 : 360 Other gears :
9: : 667 :. 3 742
. . : :
Table 2 - Production of tuna, skipjack and tuna-like fishes by gear in 1979 (in tons).
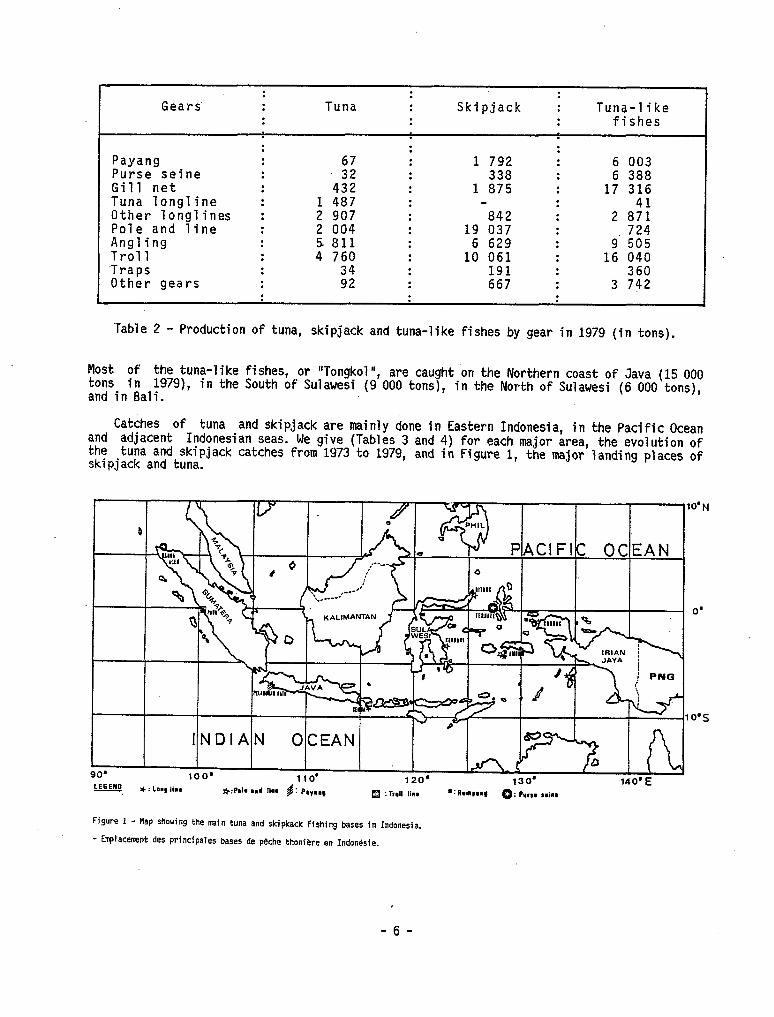
Most of the tuna-like fishes, or "Tongkol", are caught 'on the Northern toast of Java (15 000 tons in 1979), in the South of Sulawesi (9 000 tons), in the North of Sulawesi (6 000 tons), and in Bali.
Catches of tuna and skipjack are mainly done in Eastern Indonesia, in the Pacifie Ocean and adjacent Indonesian seas. We give (Tables 3 and 4) for each major area, the evolution of the tuna and skipjack catches from 1973 to 1979, and in Figure 1, the major landing places of skipjack and tuna.
10’N
---y@- -* 0
I e T’
0 INDIAN OCEAN(
Figure 1 - fiap showing the main tuna and skipkack fishing bases in Indonesia.
- Enylacemnt des principales bases de peche thoniere en Indonésie.
-6-
~..~.
: 1973 : i974 : 1975- :. .1976 : 1977 : 1978 : 1979 :
East Sumatra 1 430 : : 1 751 hi 869 ; 1251 : 2 177 : 2764 : 3 151 South Java . : - : - : - : 66 --.: 168--.: .- 4.7. :-. 85 Malacca Strait : - : - : - 554 : 453 : 456 West Sumatra : - : - 254 : -330 : 338 : 145 : -
North Java : - : -56 . ; 10 : Bali-Nusatengara 222 : 1 210 : l-585 : 2 3:: : 2 6;: : 2 255 East and South Kalimantan : - : - : -
-145 -153 : 2. .
West Kalimantan : 7-607 S-968
: - : : -70 : -122 South Sulawesi : : : 6041 : 919 : 1 844 : 2 333 : 6 164 North Sulawesi : 1 877 : 2 657 : 1762 : 3 535 : 3 544 : 2 637 : 2 934 Maluku Islands : 7: 668 : 1686 : 1 245 : 1712 : Irian Jaya : : 136 :- 99 : 279 276.
2< 126 : 2 081 . 183 : : : 635
:
Total : 11 334 I .:
11 236 : 11 931 : 9354 : 13 204 : 13’412 : 17 899
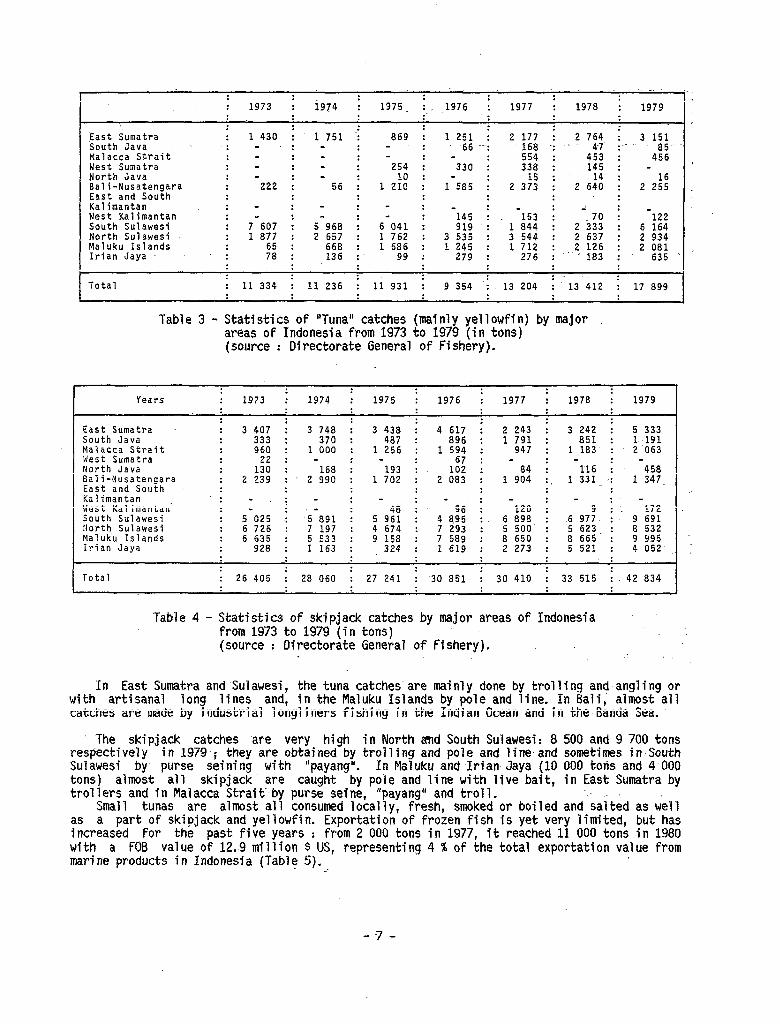
Table 3 - Statistics of "Tuna" catches (mainly yellowfin) by major areas of Indonesia from 1973 to 1979 (in tons) (source : Directorate General of Fishery).
: : Years : 1973 : 1974 : 1975 : 1976 : 1977 : 1978 : 1979
East Sumatra South Java Malacca Strait West Sumatra North Java Bali-Nusatengara East and South Kalimantan West Kal imantan‘ South Sulawesi North Sulawesi Maluku Islands irian Jaya
3 407 333 960
22 130
2 239
: 3 748 ; 3 438 i 4617 ; 2 243 : 3 242 : 5 333 370 : 487 : 896 : 1 791 : 851 : l-.191
: 1 000 : 1 256 : 1 594 : 947 : 1 183 : 2 063
: - : - : - : - 168 : 193 : 1% : 116 ; -458 : 2 990 : 1 702 : 2 083 : 1 9:: :, 1 331 -: 1 347 : : - : - : - : - : - : -
- : : 120 : 9 : 172 5 025 ,i 5 891 : 5 961 : 4 $9 : 6 898 : 6 977 : 9 691 6 726 : 7 197 : 4674 : 7 293 : 5 500’ : 5 623 : 8 532 6 635 : 5533 : 9158 : 7 589 : 8 ,650 : 8 665 : 9 995
928 : 1163 : 324 : 1 619 : 2 273 : 5 521 : 4 052
Total : 26 405 i 28 060 ; 27 241 : 30 851 i 30 410 : 33 515 i 42 834
Table 4 - Statistics of skipjack catches by major areas of Indonesia from 1973 to 1979 (in tons) (source : Directorate General of Fishery).
‘-
In East Sumatra and'sulawesi, the tuna catches are mainly done by trolling-and angling or with artisanal long lines and, in the Maluku Islands by pole and line. In Bali,' almost a11 catches are made by industrial longliners fishing in the Indian Ocean and in the Banda Sea.
The skipjack catches "are very high in North amd South Sulawesi: 8 500 and 9 700 tons respectively in 1979 ; they are obtained by trolling and pole and line-and sometimes in-South Sulawesi by purse seining with "payang". In Maluku and Irian Jaya (10 000 tons and 4 000 tons) almost a11 skipjack are caught by pole and line with live bait, in East Sumatra by trollers and in Malacca Strait'by purse Seine, "payang" and troll.
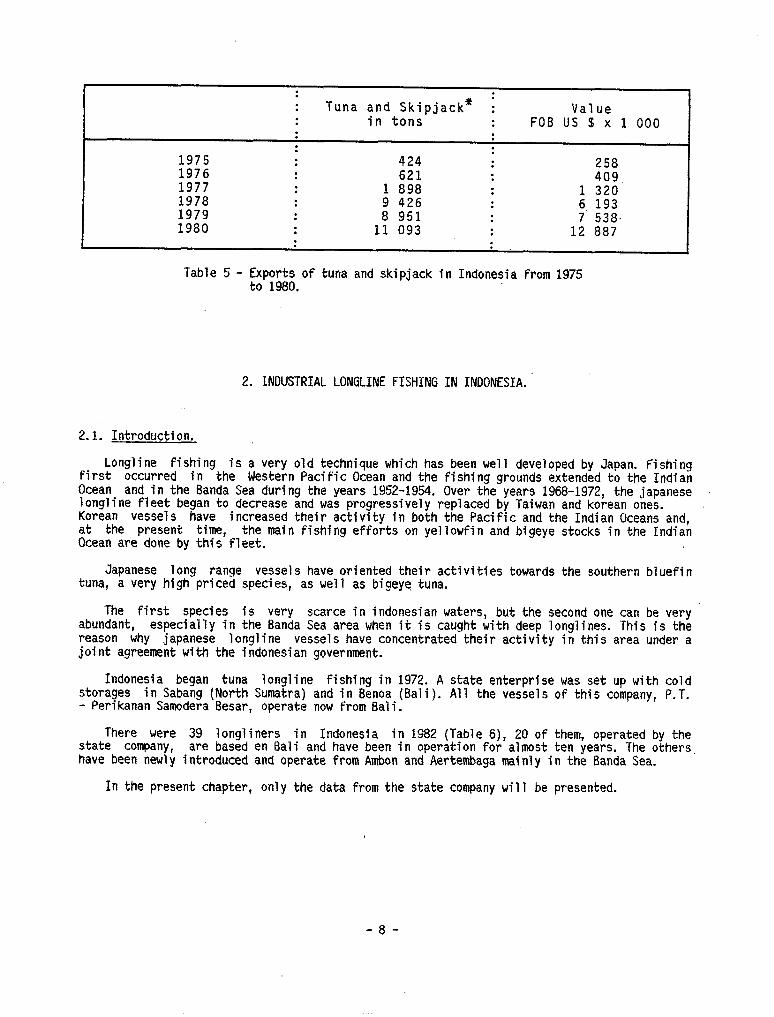
Small tunas are almost a11 consumed locally, 'fresh, smoked or boiled and salted as Weil as a part of skipjack and yellowfin. Exportation of frozen fish is yet very limited, but has i ncreased for the past five years : from 2 000 tons in 1977, it reached 11 000 tons in 1980 with a FOB value of 12.9 million s US, representing 4 % of the total exportation value from mari ne products in Indonesia (Table 5). _.
. ; : Tuna and Skipjack* : Value
. . in tons . . FOB US 15 x 1 000
1975 : 424 : 258 1976 : 621 : 409 1977 . . 1 898 : 1 320 1978 . . 9 426 : 6 193 1979 : 8 951 . 7. 538.
I 1980 : 11 093 ---
12 887
Table 5 - Exports of tuna and skipjack in Indonesia from 1975 to 1980.
2. INDUSTRIAL LONGLINE FISHING IN INDONESIA.'
2.1. Introduction.
Longline fishing is a very old technique which has been well developed by Japan. Fishing Pirst occurred in the Western Pacifie Ocean and the fishing grounds extended to the Indian Ocean and in the Banda Sea during the years 1952-1954. Over the years 1968-1972, the japanese longline fleet began to decrease and was progressively replaced by Taiwan and korean ones. Korean vessels have increased their activity in both the Pacifie and the Indian Oceans and, at the present tinte, the main fishing efforts on yellowfin and bigeye stocks in the Indian Ocean are done by this fleet.
Japanese long range vessels have oriented their activities towards the southern bluefin tuna, a very high priced species, as well as bigeye tuna.
The first species is very scarce in indonesian waters, but the second one cari be very abundant, especially in the Banda Sea area when it is caught with deep longlines. This is the reason why japanese longline vessels have concentrated their activity in this area under a joint agreement with the indonesian government.
Indonesia began tuna longline fishing in 1972. A state enterprise was set up with cold storages in Sabang (North Sumatra) and in Benoa (Bali). - Perikanan Samodera Besar, operate now from Bali.
Al1 the vessels of this company, P.T.
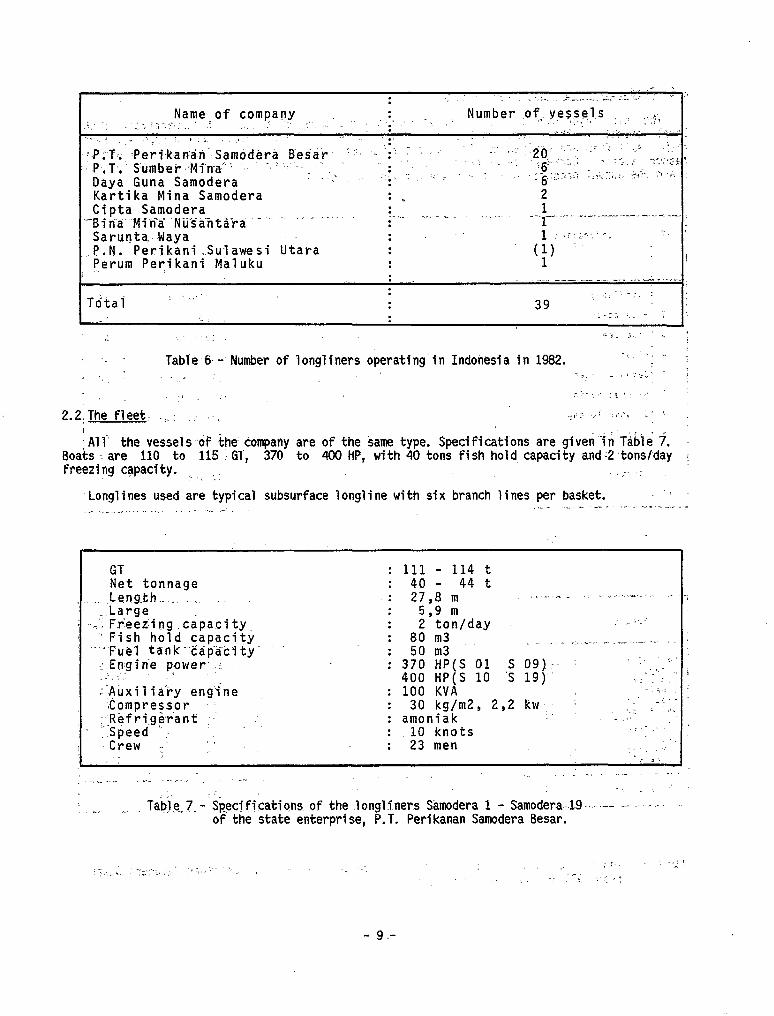
There were 39 longliners in Indonesia in 1982 (Table 6), 20 of them, operated by the state company, are based en Bali and have been in operation for almost ten years. The others have been newly introduced and operate from Ambon and Aertembaga mainly in the Banda Sea.
In the present chapter, only the data from the state company Will be presented.
-8-
:
-., -~.Bi~ri.a',.Mina Nüsa~tà‘ra _ ._ _ ."_.. i-.. -- .-- .-. -..--.;-..=- -.-.--..-.-.-r------.
Sarunta. k'aya : . lc,;.r .<_. -- c .?.N. Perikani Sulawesi Utara : Perum Perikani Maluku :
(:, 7 - :
: _. ___ _-_- _,_ .._ -2 v-.-s
Tdtai " : :
3g ._ .:y" -._ ;
_ '- : .z.-- :,_ . . .; . _.
-
__ Tabie.6.- Number of longliners operating.in Indonesia in 1982. -" 'J 1 : ‘ , -.;- _ 5 :.<:<‘ .
' ,I :
2.2:The fleet. .:.I . . . I 'Al1 the vesselsof the. company are of the sanm type. Specifications are given'?n'Table 7.
Boats - are 110 to 115 'GT, 370 to 400 HP, with 40 tons fish hold capacity andl2,tonslday ! freezing capacity. .. .: ._ ,-..
Longlines used are typical subsurface longline with six branch lines per basket. ': .,__ ,___ - --. .-. _ . ..s -_. .= _ . ,.~ ..,_ - .~ .~_ ^_
GT : 111 - 114 t Net tonnage : 40 - 44 t Length.. : j _ __. _ .‘ - em" ..._.l.. _- __ _. .___ . 27,8 m
-Large F.tieez.ing.capacity
: 5,9 m
" Fish hold capacity : 2 ton/day ; _ :,_-' : 80 m3 _ . i .--_ c._..j -... 1 Fuel tank ..-<ap.asi ty .
.' En.gin'e ,power. I. I 3% E(S 01 s 09) -. ,. I_ .: ’ 400 HP(S 10 3 19)’
_,a.- . . .::Auxilia'iy eng'fne
.r. .- * 100 KVA -.1 I
-.Compress.or :. I 30 kg/m2, 2,2 kw ' ;;,,Rêfri.ge'rant :- : amoniak
-',:‘ :-':. -, . .
,Speed L_ Crew ,. y'
: 10 knots 2 : 23 men -, _ j. . Y. >. I ~. .- .
i . - ..-. -,“- .._--
- Sam&ra..,19 ._ ..-._ - . . . ~ .~ -__ -. . . Tao~e~7~-~Spe~ilications of the longliners Samodera 1 ofthe state enterprise, P.T. Perikanan Samodera Besar.
.-..’ _.’ ; f, .,:I
. : Y”., r. . . .:.‘.‘Y! ,. ;.:,.. “. .I ,
~. --* ; 1,;
-9-
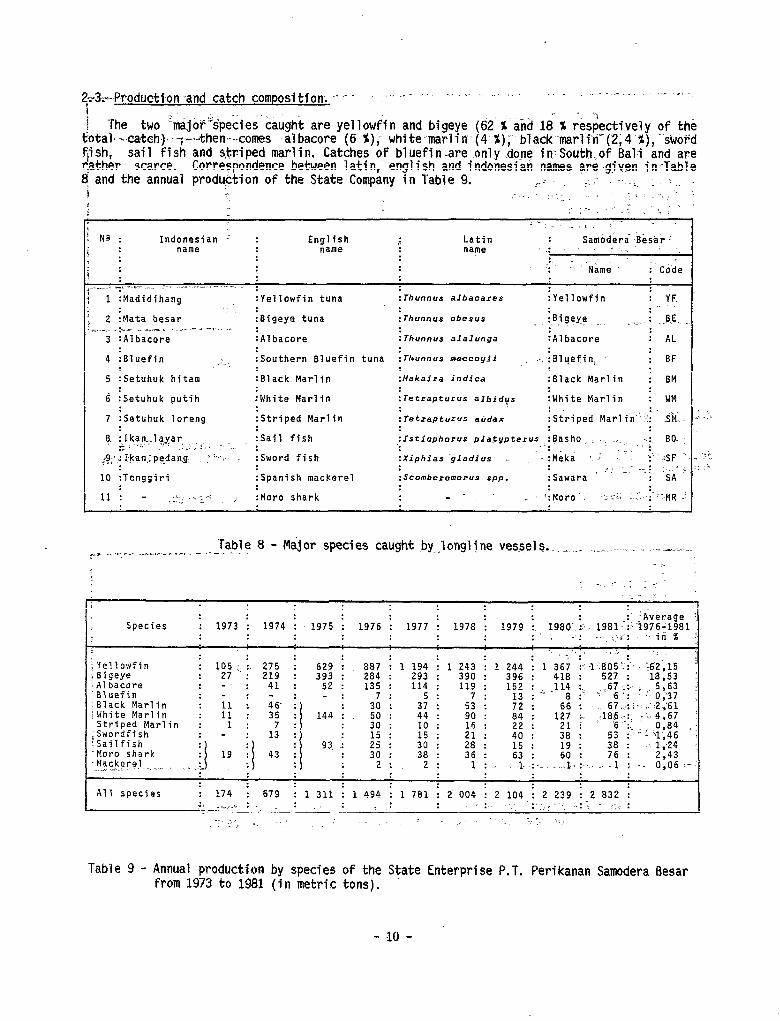
Z+Production -and catch composition; -- - = ' =m.- ., .. 1 j. . ..< i The two 'major'species'caught are yellowfin and bigeye (62'X'and 18 X respectively of the
tota-l---.catch3-.?--.,-then--comes ..albacore- (6 X); white,marlin(4- X); black marli"n"(2;4 %), sword fii sh, sail fish and striped marlin. Catches of bluefin-are only done inSouth.,of Bali and are r~ather scarce. Correspondence between latin, english and indonesiati names are-gjven in-Table q and the annual production of the State Company in Table 9. (.. :,. e.'..__ Iv, I _'-, ;y.., i '. . j ._ .> ; - :-. . : .< b ._ .I.‘_
! No : Indonesian ' : English ,! Latin Samoderâ-Besar- \ name : name name ,: .~ r . . j.
: ,:. _
i . : : : '-Name i' Code
i=i _*a. L CT-... -_-; .~,a ..~.~. <- .--. :
: 1 :Madidihang :Yellowfin tuna
. 2 :Mata besar :
? :Bigeye tuna .-..-_j ->-A- ‘. "i-L~. . ..n.= -.--1. i. :
3 :Albacore :Albacore
4 i*luefin ,-. :Southern Bluefin tuna
5 iSetuhuk hitam :Black Marlin
6 iSetuhuk putih :White Marlin
7 !Setuhuk loreng :Striped Marlin
8, : Ikan~,l :?a;, .: :Sail fish :-; i I :. , : I . -. ,, .
9;‘~ I-kan.:pqdang 7 i--?. :Sword fish
/
10 ITenggiri :Spanish mackerel
11 : - :f::....?.' , :More shark
: : : Thunnus albacares :Yellowfin : YF.
: Thunnus obesus iBigeye , = .: .-BE
: Thunnus alalunga :Albacore : AL
:Thunnus naccoyii .-:iBlueCin:. .- : BF
:Makaira indica :Black Marlin : BM
:Tt?trapturus albidys :White Marlin : WM :
: Tetrapturus atidax :Striped Marli'n" :i ' 34.
:Istiophorus platypterus :Basho .-,...:, si B,O. ‘: --.
:Xiphias gladius ;,,&a I. _. ., '- f -:SF ' : i . . : i ~< _ . -- t :Scomberomorus spp. :Sawara ‘ : SA
-- -' .-
Table 8 - Major species caught by."longljne vessels.~.-' ~_ ..__ 5 _ I _^,-____ $." ~_ r.--. _.__- _ ..-.- ~.-v. -
: :: i :-:.
Species : 1973 : 1974 : 1975 : 1976 : 1977 : 1978 : 1979 j. :
198O’.i: - 1981 +~~~;~81 > -: . ..-i.
.
;Yellowfin : i Bigeye l;;.., i. 275 : 629 : : 1 : 1 : 219 : 393 : ;;; ;;;
:Albacore : - : 41 : 52: 135 : 114 : 'Bluefin - 7: 5 :
Elack Marlin : 30 : :White Marlin 144 : 50 : 5 :
Striped Marlin 30 : 'Swordfish isailfish :5 :
:5 93. .I : : ‘Moro shark 3. 3;
-Nackere! ._ -_ _.., .*e..: ~,=_~ 2:. 2:
Al1 species : 174 i 679 : 1 311 : 1 494 ; 1 781 : 2 004 : 2 104 : 2 239 : 2 : 832 :; _I_j_I. : : . . ,, . . . .- “.1 _ a__:
*: .< -
Table 9 - Annual productian by species of the State Enterprise P.T. Perikanan Samodera Besar from 1973 to 1931 (in metric tons).
-l(J-
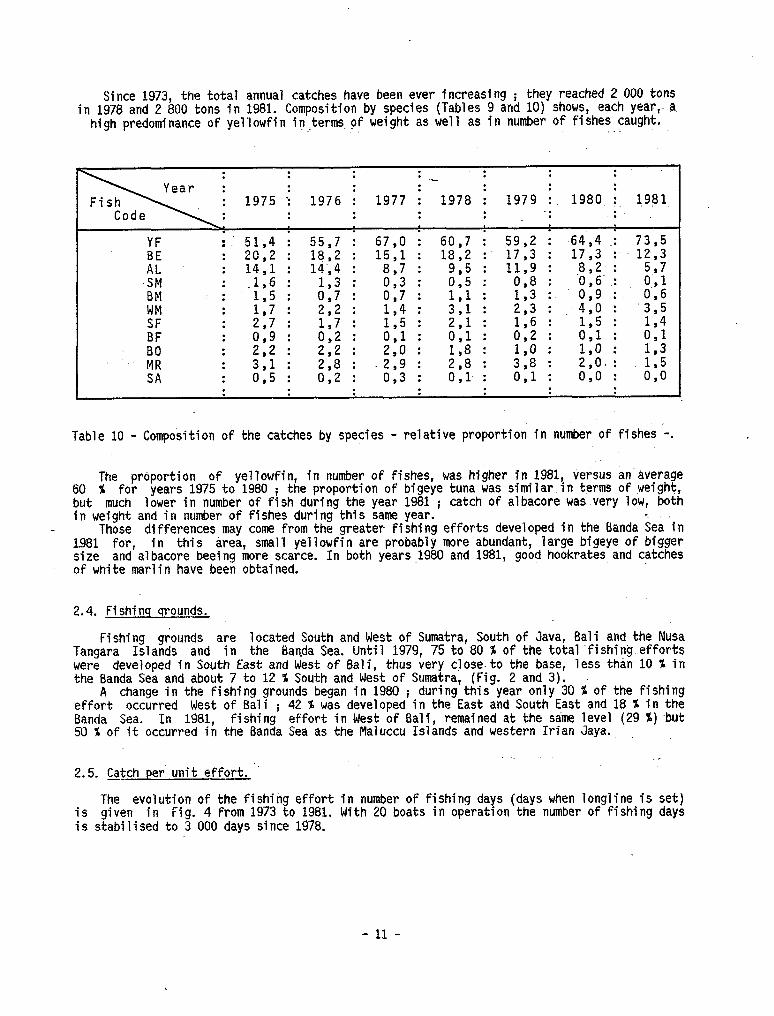
Since 1973, the total annual catches have been ever increasing ; they reached 2 000 tons in 1978 and 2 800 tons in 1981. Composition by species (Tables 9 and 10) shows, each year,. a
high predominance of yellowfin in;terms of weight as well as in number of flshes caught.
.
K :. : 51,4 2c,2 I : 55,7 18,2 I : 67,0 15,l ; : 60,7 18,2 i : 59,2 17,3 i : 64,4 17,3 .: : 73,5 12,3
-& : : 14,l : 14,4 : 8,7 : i?: : * 1:1 I :
11 O:S 9 : : -0 8,2, ,6- : : 2: ;,; wi : : 0,9 : 0:6
BF : . . ;‘: 0'1
. :’
1’8 : : 0'2 1’6 ; :
;; :
2’8 : 1’0 * . . :
0:1- : 3’8 ;
SA . . : 011 : 1 . . : : : . * : :
Table 10 - Composition of the catches by species - relative proportion in number of fishes -.
The proportion of yellowfin, in number of fishes, was higher in 1981, versus an average 60 % for years 1975 to 1980 ; the proportion of bigeye tuna was similar in terms of weight, but much lower in number of fish during the year 1981 ; catch of albacore was very low, both in weight and in number of fishes during this same year.
Those differences may tome from the greater fishing efforts developed in the Banda Sea in 1981 for, in this area, small yellowfin are probably more abundant, large bigeye.of bigger size and albacore beeing more scarce. In both years.1980 and 1981, good hookrates and catches of white marlin have been obtained.
2.4. Fishincr qrounds.
Fishing grounds are located South and West of Sumatra, South of Java, Bali and the Nusa Tangara Islands and in the Banda Sea. Until 1979, 75 to 80 % of the total 'fishing efforts were developed in South East and West of Bali, thus very cjose-to the base, less than 10 % in the Banda Sea and about 7 to 12 5; South and West of Sumatra, (Fig. 2 and 3).
A change in the fishing grounds began in 1980 ; during this year only 30 % of.the fishing effort occurred West of Bali i 42 % was developed in the East and South East and 18 X in the Banda Sea. In 1981, fishing effort in West of Bali, remained at the same level (29 X)-but 50 X of it occurred in the Banda Sea as the Maluccu Islands and western Irian Jaya.,
2.5. Q$ch per unit effort.
The evolution of the fishing effort in number of fishing days (days when longline is set) is given in Fig. 4 from 1973 to 1981. With 20 boats in operation the number of fishing days is stabilised to 3 000 days since 1978.
- 11 -
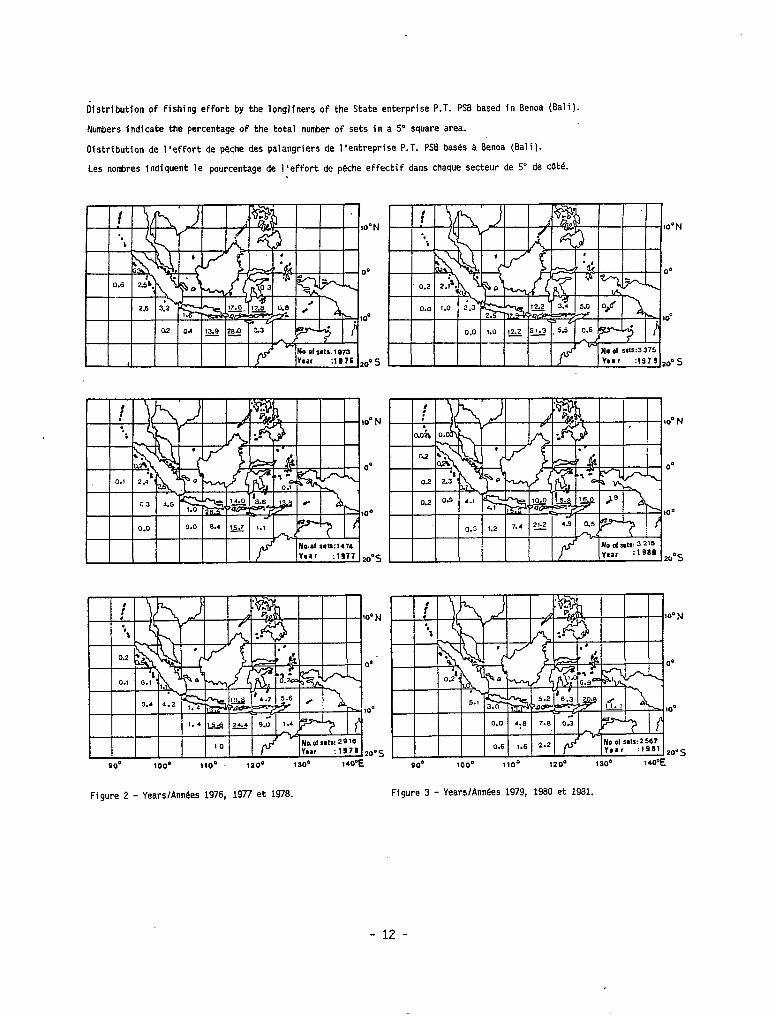
Distribution of fishing effort by the longliners of the State enterprise P.T. PSB based in Benoa (Bali).
Nuders indfcate the percentage of the total nutir of sets in a 5" square area.
Oistributlon de l'effort de peche des palangriers de l'entreprise P.T. PSB bases a Benoa (Bali).
Les notires indiquent le pourcentage de l'effort de peche effectif dans chaque secteur de 5" de Cote.
figure 2 - YearslAnnées 1976, 1977 et 1978. Figure 3 - YearslAnnées 1979, 1960 et 1981.
- 12 -
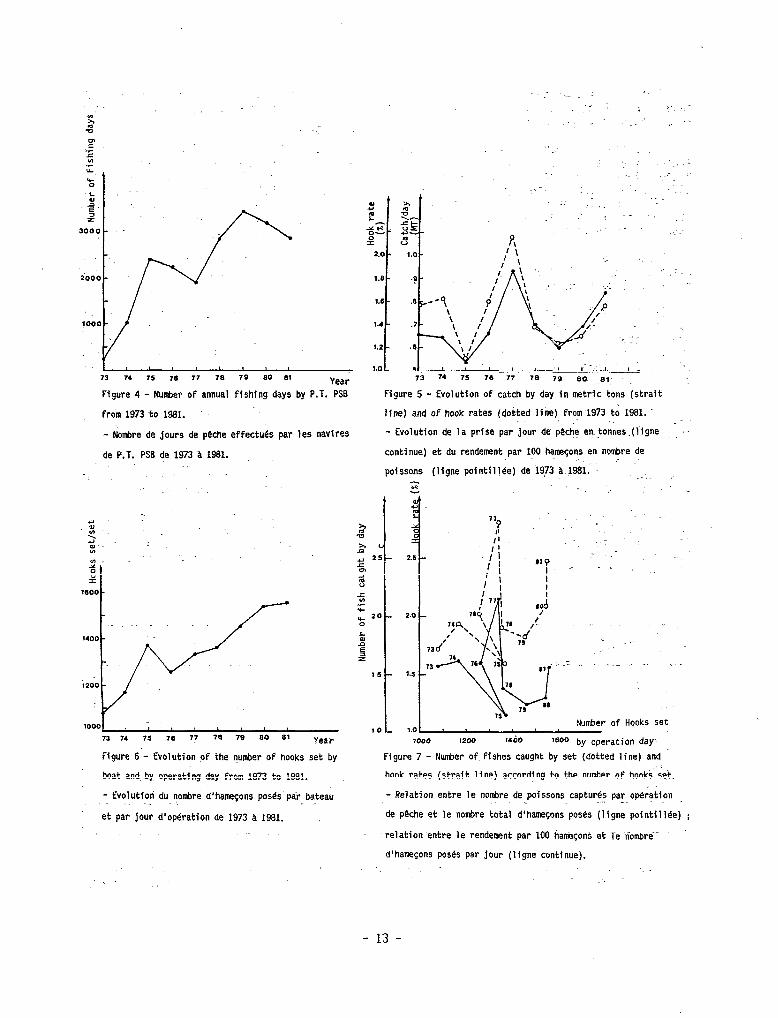
73 74 7.5 76 77 78 79 00 01 Year Figure 4 - Nutier of annual fishing days by P.i. PSB
from 1973 to 1981.
- hotire de jours de peche effectues par les navlres
de P.T. PSB de 1973 a 1981.
.~
1000
73 7, 75 76 77 70 79 00 81 Ycar
Figure 6.- Evolution of the number of hooks set by
boat and;by operating day from 1973 to 1981.
- Evolution du -tire d'hanmçons poses par bateau . _
et par jour d'operation de 1973 a 1981.
,-
, ru f
SE- E
2.0 -
1.8 -
1.6 -
7.4 -
1.2 -
1.OL
.:- .,-.
-- _. .~-
.
73 74 75 76 77 78 79 80. 01’
Figure 5 - Evolution of catch by day in mtric tons (strait
line) and of hook rates (dotted line) from 1973 to 1981.. _-
- Evolution de la prise par jour de peche en.tonnes.(iigne : ..
continue) et du rendement par 100 hameçons en nombre de
poissons (ligne pointillee) de 1973 2 198;. .-
__,-
.._ :
77 p
II
y-y;. ;,
Number of Hooks set ,000 1200 1.00 lsoo by operation day
Figure 7 - Number of fishes caught by set (dotted line) and
hook rates (strait line) according to the number of hooks'set.
- Relation entre le nombre de poissons captures par oporation . _
de peche et le nombre total d‘hameçons poses (ligne pointillee) ;
relation-entre le rendement par 100 hameçons et le nombre-
d'hameçons poses par jour (ligne continue).
- 13 -
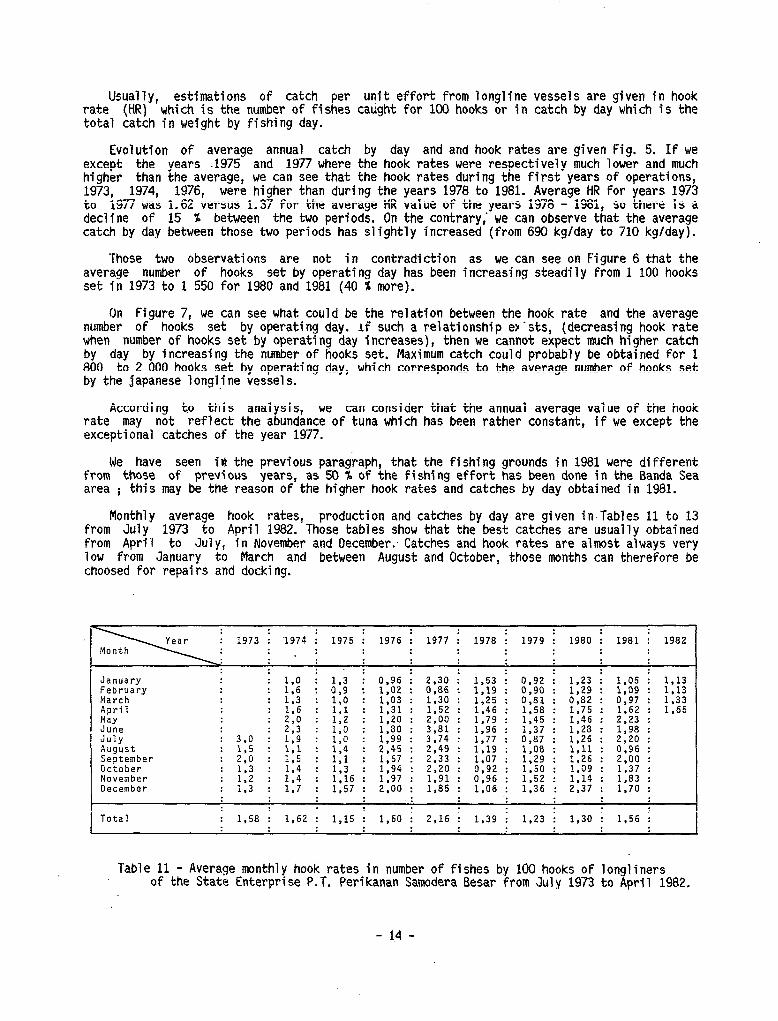
Usually, estimations of catch per unit effort from longline vessels are given in hook rate (HR) which is the number of fishes caught for 100 hooks or in catch by day which is the total catch in weight by fishing day.
Evolution of average annual catch by day and and hook rates are given Fig. 5. If we except the years .1975 and 1977 where the hook rates were respectively much lower and much higher than the average, we cari see that the hook rates during the first years of operations, 1973, 1974, 1976, were higher than during the years 1978 to 1981. Average HR for years 1973 to 1977 was 1.62 versus 1.37 for the average HR value of the years 1978 - 1981, SO there is a decline of 15 % between the two periods. On the contrary; we cari observe that the average catch by day between those two periods has slightly increased (from 690 kglday to 710 kg/day).
Those two observations are not in contradiction as we cari see on Figure 6 that the average number of hooks set by operating day has been increasing steadily from 1 100 hooks set in 1973 to 1 550 for 1980 and 1981 (40 % more).
On Figure 7, we cari see what could be the relation between the hook rate and the average number of hooks set by operating day. if such a relationship er'sts, (decreasing hook rate when number of hooks set by operating day increases), then we cannot expect much higher catch by day by increasing the number of hooks set. Maximum catch could probably be obtained for 1 800 to 2 000 hooks set by operating day, which corresponds to the average number of hooks set by the japanese longline vessels.
According to this analysis, we cari consider that the annual average value of the hook rate may not reflect the abundance of tuna which has been rather constant, if we except the exceptional catches of the year 1977.
We have seen il the previous paragraph, that the fishing grounds in 1981 were different fram those of previous years, as 50 % of the fishing effort has been done in the Banda Sea area ; this may be the reason of the higher hook rates and catches by day obtained in 1981.
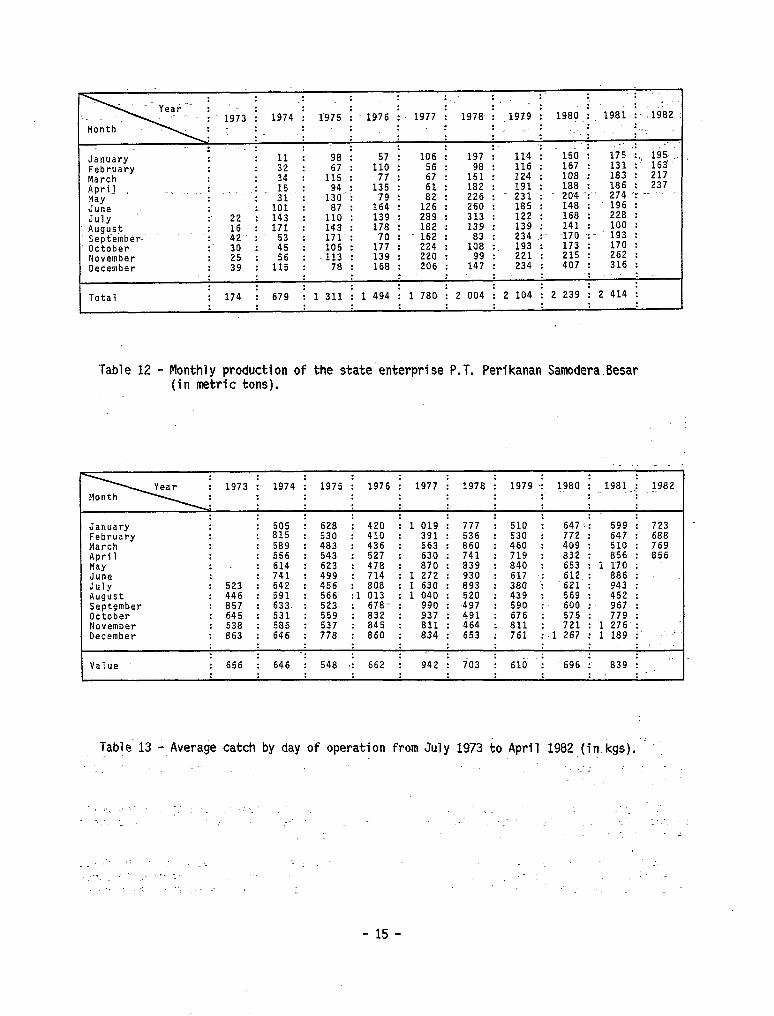
Monthly average hook rates, production and catches by day are given in.Tables 11 to 13 from July 1973 to April 1982. Those tables show that the best catches are usually obtained from April to July, in November and December: Catches and hook rates are almost always very low from January to March and between August and October, those months cari therefore be choosed for repairs and docking.
M- i 1973 i ‘4’4 i 1975 ; 1976 i 1977 i 1978 i 1979 j 1980 i 1981 i 1982
January February Ma r c h April May June July August September October November Oecember
:s : 1.3 : 0,96 : 2.30 : 1.53 I 0,92 I 1.23 : 1.05 : 1,13
: 113
: 0,9 : 1.02 : 0,86 : 1.19 : 0.90 : 1,29 : 1.09 : 1,13 : : l,o : 1.03 : 1,30 : 1,25 : 0,81 : 0,82 : 0,97 : 1,33 : 1,6 : 1.1 : 1.31 : 1.52 : 1,46 : 1,58 : 1,75 : 1.62 : 1,65
: 2'30 ?O : 1,20 : 2.00 : 1,79 : 1,45 : 1,46 : 2.23 :
119 :
l:o : 1.80 : 3,81 : 1.96 : 1,37 : 1,28 : 1,98 :
: 3.0 : : : 1,99 : 3.74 : 1.77 : 0,87 : 1,26 : 2,20 : ::Fi : 1 1
1:5 : 1 4
1’1 : 2.45 : 2,49 : 1.19 : 1,08 : 1,ll : 0.96 :
: : : 1:3
: 1,67 : 2.33 : 1.07 : 1.29 : 1,26 : 2,00 :
: :y;
: ?4 : : 1.94 : 2.20 : 0.92 : 1.50 : 1.09 : 1,37 :
113 I 1:7 : 1,16 : 1.97 : 1.91 : 0,96 : 1,52 : 1,14 : 1.83 :
: : 1,57 : 2.00 : 1,85 : 1,06 : 1,36 : 2,37 : 1,70 :
Total : 1,58 : 1.62 : 1.15 : 1,60 ; 2,16 : 1.39 : 1.23 : 1.30 : 1.56 :
Table 11 - Average nmnthly hook rates in number of fishes by 100 hooks of longlîners of the State Enterprise P.T. Perikanan Samodera Besar from July 1973 to April 1982.
- 14 -
January February March
,._, June July :' 22 : 143 : August : 16 171 : Seotember. : 42' i 53 :
lzl : : 164: 139 : 289 126 : : 260 :
143 : 178 : 1s
: 217 188 : 186 : 237
-- - --- . .:- 185 :
% '-i y& :
313 : 12? : 168 : 228 : 62 : 139 *
83-I 139 : 141 : 100 :
62 : 234 : -17 0 : - 193 : Ociober : 30 : 45 : ii:- i 1:;
: l.- . : 224 : lai I. 193 ': 173 : 170 :
November : 25 : Oecember : 39 :
1:: : 113 : 139 : 220 : 221 : 215 : 262 : : 78 : 168 : 206
: 143 : : 234 : 407 : 316 : :. : : -:.
Total : 174 : 679 : 1 311 : 1 494 : 1 780 : 2 004 : 2 104 : 2 239 : 2 414 :
: :: 1% i 135 : 2 : 182: 191 : : : 79 : : '226 : 711 t
Table 12 - Monthly production of the state.enterprise P.T. Perikanan S&odera.Besar (in metric tons).
: January : 505 : 628 : 420 : 1 019 : 777 : 510 : 647-i 599 : 723 February : 815 : 530 : 410 : 391 : 536 : 530 : 772 : 647 : 688 #arch : 589 : 483 : 436 : 563 : 860 : 460 : 409 : 510 : 769 April : 556 : 543 : 527 : 630 : 741 : 719 : 832 : 856 : 856 Mw : : 614 : 623 : 478 : 870 : 839 : 840 : 653 : 1 170 : June : 741 : 499 : 714 : 1 272 : 930 : 617 : 612 : 886 : July : 523 : 642 : 456 : 808 : 1 630 : 893 : 380 : '621 : 943 : August : 446 : 591 : 566 :l 013 : 1 040 : 520 : 439 : 569 : 452 : September : 857 : 633. : 523 : 678- : 990 : -497 : 590 :. 600 : 967 : October : 645 : 531 : 559 : 832 : : 676 : 575 : 779 : November : 538 : 585 : 537 : 845 :
83; i N(i : 811 : 721 : 1 276 :
Oecember : 863 : 646 : 778 : 860 : 834: 653 : 761 :.1267:1189: ,' : '_ a.
Value : 656 : 646 i 548 .i 662 : 942 : 703 : 610 'i 696 :' 839 : -- :
Table 13 - Average catch by day of operation from July 1973 to.April 1982,(in.kgs).-'
z
SII ‘Y. .: ._
i .
i
.:,: _.
_“i .- , ._ .- : .’ - ,
.:. .- . . . I. _’
- 15 -
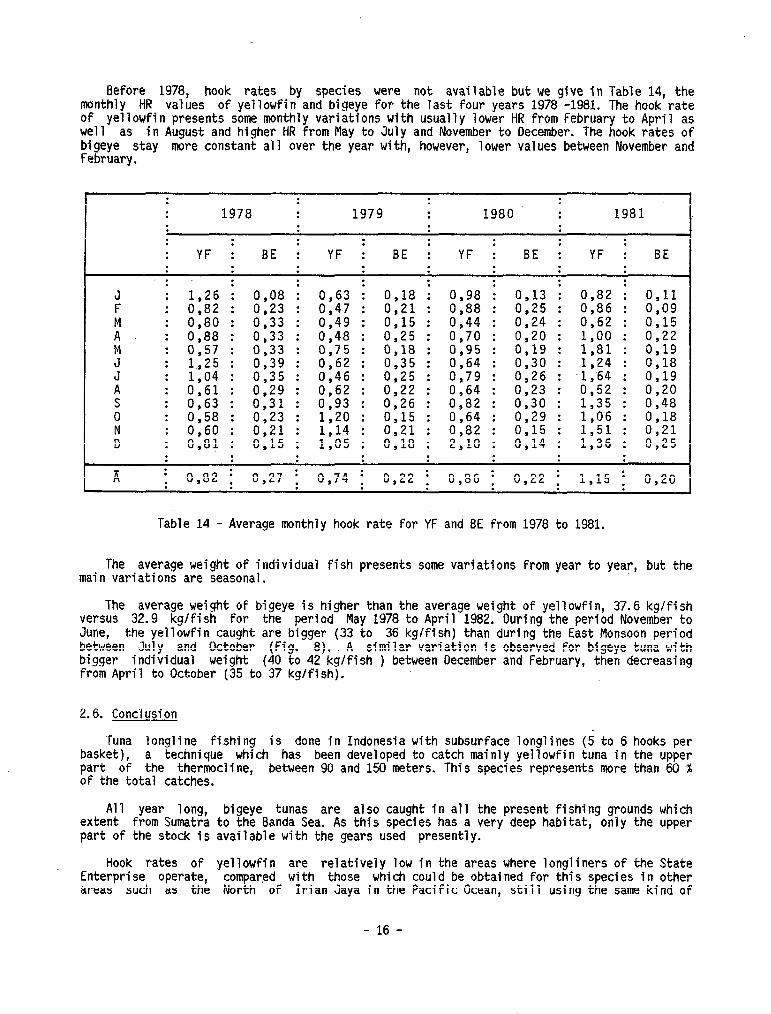
Before 1978, hook rates by species were not available but we gîve in Table 14, the monthly HR values of yellowfin and bigeye for the last four years 1978 -1981. The hook rate of yellowfin presents some monthly variations with usually lower HR from February to Aprîl as well as in August and hîgher HR from May to July and November to December. The hook rates of bigeye stay more constant a11 over the year with, however, lower values between November and February.
: . : . . 1978 i 1979 . : 1980 ; 1981 : . . : : : : : : : : : . : YF : BE : YF : BE : YF : BE : YF ; BE : : . . . . . . : : . . . . . . . .
J ; 1,26 i 0,08 ; 0,63 ; 0,18 ; :
0,98 : 0,13 I :
0,82 : 0,ll F : 0,82 : 0,23 : 0,47 : 0,21 : 0,88 : 0,25 : 0,86 : 0,09
A”, IO’88: . 0 80 : 0,33 0,33 : : 0,49 0,48 : : 0,25 0,15
: : 0157 : : 0,33 : : 0,75 : : 0,18
: : 0,44 0,70 : : 0,24 0,20 : : 0,62 l,oo : : 0,15 0,22
!Y 1,25 0,39 0,62 0,35 : : 0,95 0,64 : : 0,19 0,30 : : 1,81 1,24 : : 0,19 0,18
ii : : 1,04 : : 0,35 : : 0,46 : : 0,25 0,61 0,29 0,62 0,22 : : 0,79 : : 0,26 0,23 0,64 : : .1;64 0,52 : : 0,19 0,20 S : 0,63 : 0,31 : 0,93 : 0,26 : 0,82 : 0,30 : 1,35 : 0,48 0 : 0,58 : 0,23 : 1,20 : 0,15 : 0,64 : 0,29 : 1,06 : 0,18
! : : 0,60 : : 0,21 0,15 : : 1,05 1,14 : : 0,18 0,21 0,8! : : 0,82 2,lO ,: : 0,14 0,15 : : 1,36 1,51 : : 0,21 0,25 : . . : ; 0,82 i ; ;
: : : : A 0,27 0,74 0,22 ; 0,86 0,22 i ; 1,15 i 0,20
Table 14 - hook rate for Average monthly YF and BE from 1978 to 1981.
The average weight of individual fish presents some variations from year to year, but the main variations are seasonal.
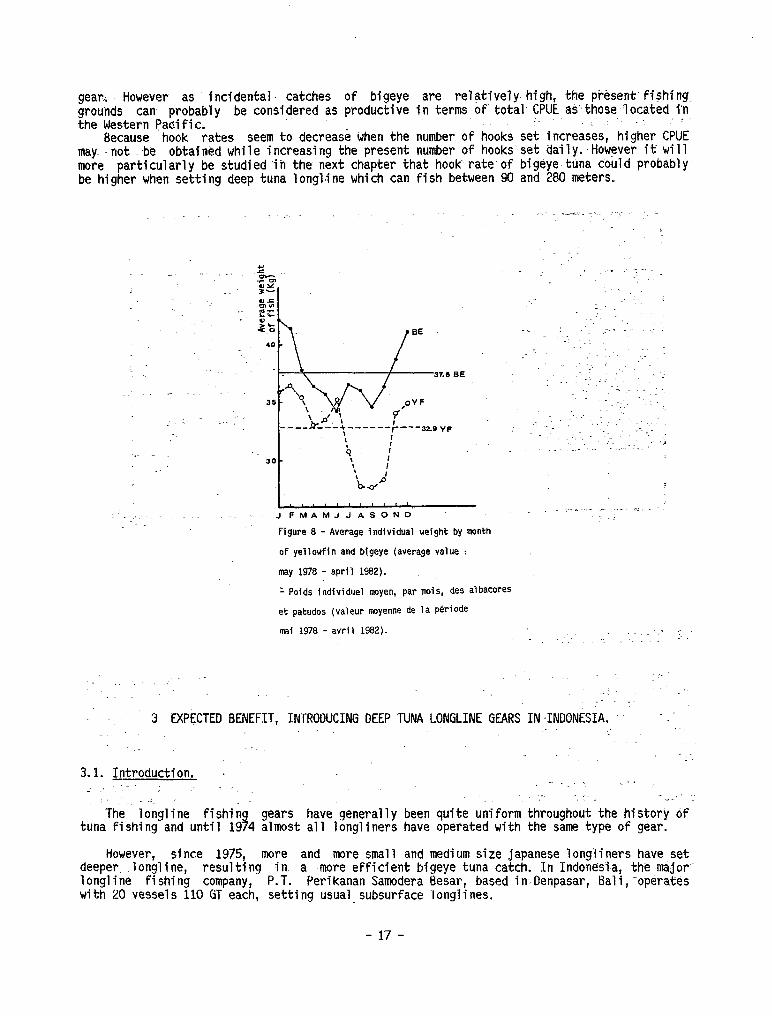
The average weîght of bigeye is hîgher than the average weight of yellowfin, 37.6 kglfish versus 32.9 kglfish for the perîod May 1978 to April 1982. During the period November to June, the yellowfin caught are bigger (33 to 36 kglfish) than durîng the East Monsoon perîod between July and October (Fig. 8). A sîmilar variation is observed for bigeye tuna with bigger indîvîdual weight (40 to 42 kg/fish ) between December and February, then decreasing from Aprîl to October (35 to 37 kg/fîsh).
2.6. Conclusion --
Tuna longline fishing is done in Indonesia with subsurface longlines (5 to 6 hooks per basket), a technique which has been developed to catch mainly yellowfin tuna in the Upper part of the thermocline, between 90 and 150 meters. Thîs species represents more than 60 % of the total catches.
Al1 year long, bigeye tunas are also caught in a11 the present fishîng grounds which extent from Sumatra to the Banda Sea. As this species has a very deep habitat, only the Upper part of the stock is available wîth the gears used presently.
Hook rates of yellowfin are relatively low in the areas where longliners of the State Enterprise operate, compar.ed with those which could be obtained for this species in other areas such as the North of Irian Jaya in the Pacifie Ocean, still using the same kînd of
- 16 -
gear.; However as incidental. catches of bigeye are relatfvely~high, the-prèsent'fishing grounds cari probably be considered as productive in terms of total. CPUE as'those-located in the Western Paaific. .:.
Because hook rates seem to decrease when the number of hooks set increases, higher CPUE maya .not be obtainèd while increasing the present number of hooks.set daily:However it Will more particularly be studied in the next chapter that hooK rate of bigeye-tuna could probably be higher when setting deep tuna longline which cari fish between 90 and 280 meters.
J FMAMJ J ASOND
Figure 8 - Average indlvidual weight by nmth
of yelloufin and bigeye (average value :
may 1978 - april 1982).
- Poids individuel moyen, par mis, des albacores
et patudos (valeur moyenne de la perfode
mai 1978 - avril 1982). . -, '_- c
: . . .-
3 EXPECTED BENEFIT, INTRODUCING OEEP TUNA LONGLINE GEARS IN-INDONESIA.
3.1. Introduction. -',. .I .
..:
The lonqline fishing tuna fishing‘and until 1974
However, since 1975, - __ _. _
gears have generally almost a11 longliners
more and more small _-_ .
“’
. . -
_.: .- . .-
I. : . “,.
been quite uniform throughout the history of have operated with the same type of gear.
and medium size japanese longliners have set ._ - _. ,. deeper .longline, resuiting in. a more efficient bigeye tuna catch. ln lndonësia, thë majors longline fishing company, P.T. Perikanan Samodera Besar, based in Denpasar, Bali,-operafes with 20 vessels 110 GT each, setting usual subsurface longlines.
- 17 -
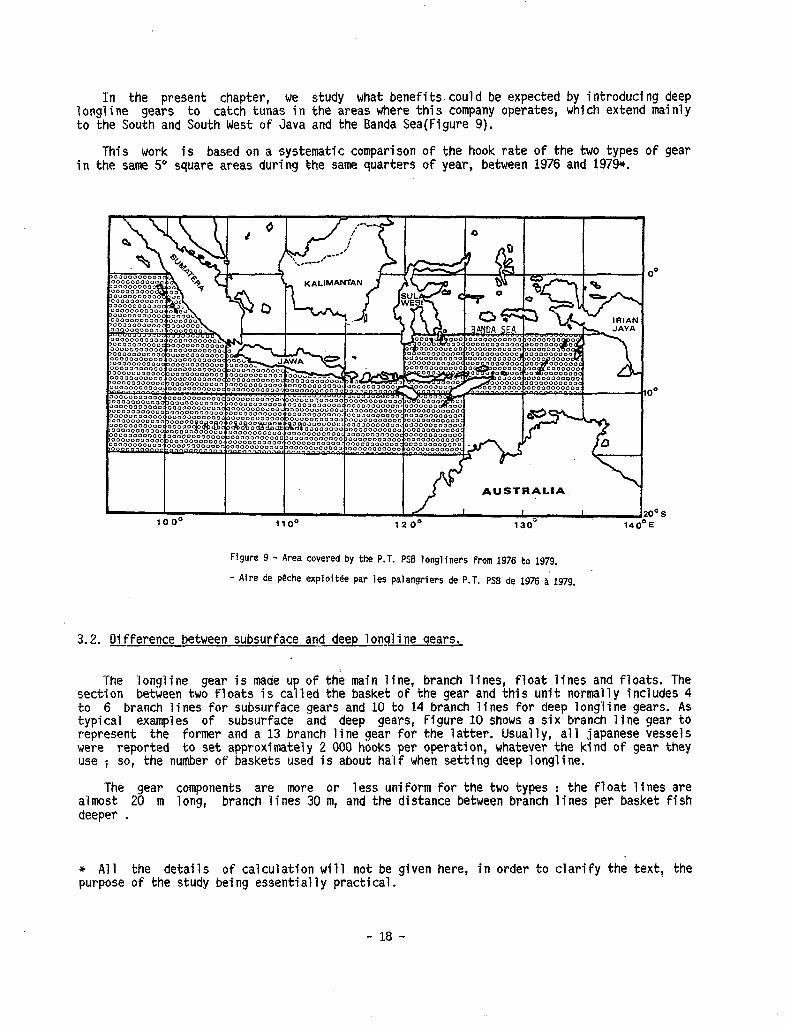
In the present chapter, we study what benefitscould be expected by introducing deep longline gears to catch tunas in the areas where this company operates, which extend mainly to the South and South West of Java and the Banda Sea(Figure 9).
This work is based on a systematic comparison of the hook rate of the two types of gear in the same 5" square areas durin fhe same quarters of year, between 1976 and 197%.
V%A y p ( . . ..-----
h O0
KAL’MANTAN 2
AUSTRALIA
I 1 I I I/ 1 1 l l *no
120° s
Figure 9 - Area covered by the P.T. PS6 longliners from 1976 to 1979.
- Aire de peche exploitée par les palangriers de P.T. PS6 de 1976 a.1979.
3.2. Oifference between subsurface and deep longline qears.
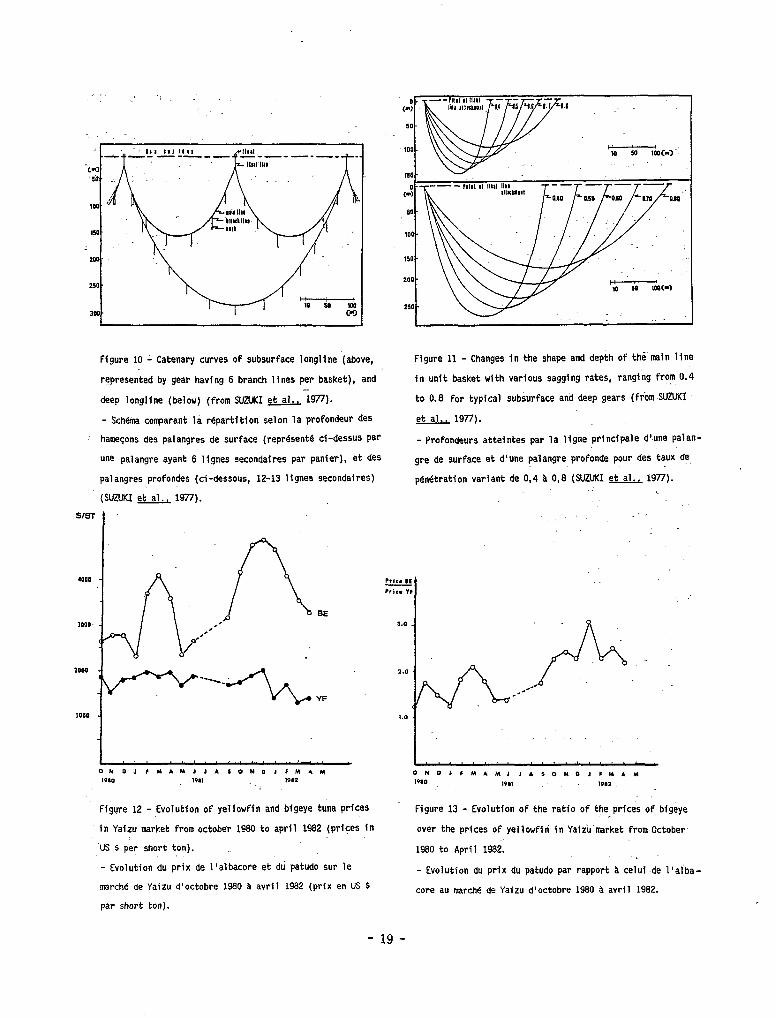
The longline gear is made up of the main line, branch lines, float lines and floats. The section between two floats is called the basket of the gear and this unit normally includes 4 to 6 branch lines for subsurface gears and 10 to 14 branch lines for deep longline gears. As typical examples of subsurface and deep gears, Figure 10 shows a six branch line gear to represent the former and a 13 branch line gear for the latter. Usually, a11 japanese vessels were reported to set approximately 2 000 hooks per operation, whatever the kind of gear they use i SO, the number of baskets used is about half when setting deep longline.
The gear components are more or less uniform for the two types : the float lines are almost 20 m long, branch lines 30 m, and the distance between branch lines per basket fish deeper .
+ Al1 the details of calculation Will not be given here, in order to clarify the text, the purpose of the study being essentially practical.
- 18 -
< . .
Figure 10 J Catenary curves of subsurface longline (above,
represented by gear having 6 branch lines per basket), and - deep longline (below) (from SUZW et a1.,19n).
- Schema comparant la répartition selon la profondeur des
hameçons des palangres de surface (represente ci-dessus Par
une palangre ayant 6 lignes secondaires par panier), et des
palangres profondes (ci-dessous, 12-13 lignes secondaires)
(SUZUKI et al., 1977).
SIS1
Figure 11 - Changes in the shape and depth of thë main line
in unit basket with various sagging rates, ranging from 0.4
to 0.8 for typical subsurface and deep gears (from SUZUKI
et al., 1977).
- profondeurs atteintes par la ligne principale dtune palan-
gre de surface et d'une palangre profonde pour~des taux de
pdnetration variant de 0,4 a 0,6 (SUZUKI et 1977).
.~
Figure 12 - Evolution of yellowfin and bigeye tuna prices
in Yaizu market from october 1960 to april 1962 (Pri:es in
‘US.S pei short ton).
Figure 13 - Evolution of the ratfo of the prices of bigeye , -
over the prices of yellowfin in Yaizu market from-October
1980 to April 1962.
- Evolution du prix de l'albacore et du patudo sur le
marche de Yaizu d'octobre 1960 a avril 1962 (prix en US s
par short ton).
- Evolution du prix du patudo par rapport a celuide l'al'ba-
tore au marche de Yaizu d'octobre 1980 o avril 1962.
- 19 -

Before 1974. jauanese lonqliners usinq subsurface aears predominated. while the contrary happened after 1975; this in order to catch-more bigeye iuna which live deeper.
P.T. Perikanan Samodera Besar longliners have been usjng typical subsurface long1 ever since the begining of their operations in 1973 : float lines are about 20 to 25 m, the distance between branch lines in 50 to 60 m ; there are 6 branch lines per basket. number of hooks set by operation has been substancially increased from 1 300 in 1976 to 1 in 1981.
Figure 11 shows the changes in the-shape and depth of the main line in unit basket
nes and The 550
ith various sagging rates, ranging from 0.4 to 0.8 typical subsurface (6 branch lines) and deep (12 branch lines) gears. Taking into account the length of branch lines and float lines, we cari estimate that subsurface longlines fish between 90 m and 180 m and deep longlines between 90 m and 290 m.
3.3 Difference of hook rates by qear type.
From 1976 to 1979 and for each quarter of year and 5" square areas which have been exploited simultaneously by indonesian and japanese longliners, we have done a systematic comparison between the obtained hook rates. The data available for indonesian vessels were the total hook rates of the two main species caught, which are bigeye and yellowfin tunas.
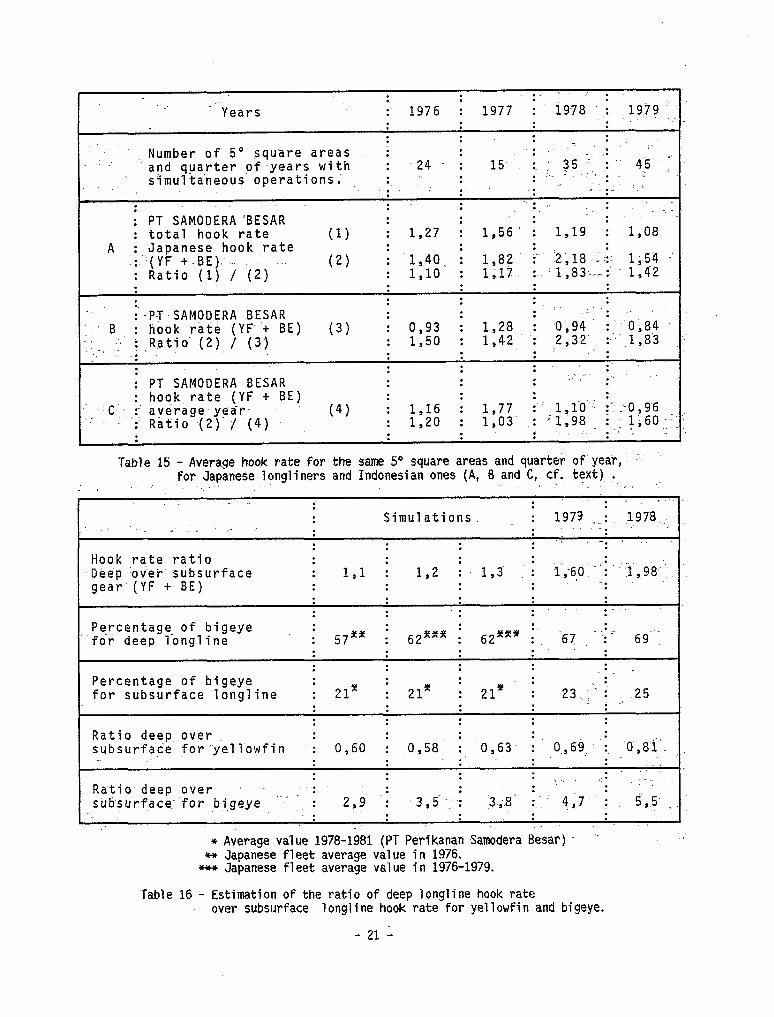
For 119 couples of data, the average hook rate by deep longlines is 1.52 time the value of the subsurface hook rate. The ratio hook rate using deep longline over hook rate subsurface longline is greater than one for any quarter of the year considered. We give in Table 15 the value of this ratio for the years 1976 through 1979 (A).
As this ratio is underestimated because the hook rates obtained by the japanese vessels do not include other species than bigeye and yellowfin, we have also estimated the average hook rate of indonesian vessels for those two species (6). We must take into consideration that the average quartely hook rate by 5* square area does not necessarily reflect the average hook rate of the fleet for the whole year which is always higher because the boats rate operate more intensively in areas of higher hook rate ; SO we also present in Table 15 (C) the average annual hook rate for yellowfin and bigeye obtained by Indonesian vessels and the ratio over japanese hook rate calculated using average value by 5' square area.
Al1 the results of the calculations show that japanese longline vessels, using deep longline gears, have higher hook rates that indonesian ones, using subsurface gears. This ratio averages 1.1 to 1.4 for the years 1976 and 1977, and 1.6 to 2.0 for the years 1978 and 1979. The increasing ratio during the two latter years may reflect the increasing proportion of the deep long line gears used by the japanese fleet, which is shown by an increased proportion of bigeye tuna in their catch, from 56 X to 66 X between the two periods.
3.4. Ratio of deep lonqline hook rate over subsurface lonqline hook rate for vellowfin and biqeve.
We have considered that the average hook rate of indonesian longliners is 0.89 for yellowfin and 0.23 for bigeye (average of the years 1978 to 1981). Taking this into account and using different ratios of hook rate between deep longline and subsurface longline and an average estimation of 62 % of bigeye for deep longline catch in number of fishes (average value from 1976 to 1979), we give; in Table 16, different estimations of the ratio deep over subsurface hook rates for yellowfin and bigeye. We also give estimation of this ratio for the years 1978 and 1979.
- 20 -
: Years . . 1976 : 1.977 I 1978 : ,19!?
: : . . : : : : : -
Number of 5" square areas : : . . .
“and quarter of years with : 24 : 15 : : 35 '- 'i " 45 simultaneous operations; : : : I . ..‘. :' -
:' : . . .- ,%.C ". b . . . _ ; PT SAMODERA 'BESAR
: : : : : _. . : : : total hook rate (1) i 1,27 : 1.56’ : 1,19 : 1,08
A * Japanese hook rate : (2) i l,lo. :
: .;.::(YF t-B-E) : Ratio (1) / (2)
1 40 l,B? i- :2;18 _ :;~ 1;54 . - 9 : 1,17 :- i 1 ,83--e :- 1,4-Z
:-PT SAM-ODER-A BESAR :~ B,: 'hook rate (YF "+ BE) 0 93 i,28
_-. ; LR.atio' ,(2), / (3). (3) i 1,50 i
: 3 : 1,42 : _Y-, :
.2,32' :-.. !,83 : : . .
. . : : : PT SAMODERA BESAR : ilooi : rate. (YF t BE)
,-. Cl, -:y avèrage, yeàr. - : Ratio (2) / (4) :
Table 15 - Average hook rate for the same 5" square areas and quarter of.year,' '.~ '
: : : for Japanese longliners and Indonesian ones (A, B and C, cf. text) -, _ ., , _. _” -: . : Simulations. I 1973 ._I 1978. ._ -, ., -: : ., __. . ‘i . . . . . . . _., -* -. . . . . .
Hook rate ratio Déep ‘over subsurface gear'(YF t BE)
. : . . : 1,l : 1,2 I 1,3’~ :~i lY60---‘; :l , 98.-‘; : : : : . : : : . .
: : . .~. . Percentage. of bigeye for deep longline
: : 62xx* i . ‘67 --;- 69‘: : : : . : : : : : :
Percentage of bigeye . . . - . : for subsurface longline : 21' : 21'
: : 21’ I 23.. :- i 25
: ; . . : : . . : : : : : :
Ratio dee-p, over . : . . : . subsurface for yellowfin : 0,60 : 0,58- ; -0,63. : O., 69: ,’ ; ‘.’ 0,8l
. . . . . .
+ Average value 1978-1981 (PT Perikanan ,Samodera Besar) . . ' * Japanese fleet average value in 1976.
- Japanese fleet average value in 1976-1979.
Table 16 - Estimation of the ratio of deep longline hook rate _ over subsurface longline hook rate for yellowfin and bigeye.
- 21 -
. . . . , .- . . . Ratio.deep over * ' ._ : . . su'bsurface--for bi.geye- : 2,9 I 3,5 . . . i
_.. .: * : . '._
5 ,.5- , - _ . . . 3.;8. : : .’ 4 ,7: i
. : .; .
We cari see that deep longlines allow catches 3 to 5 times more important for bigeye tuna with the same number of hooks set and 20 to 40 X less for yellowfin, comparatively with subsurface gears.
In similar study done by SUZUKI, WARASHINA and KISHAOA in 1977, in Western Pacifie between lO"S-20"N and 16O"W, the estimation of the ratio of deep gear over subsurface gear had been estimated as 1.79 for bigeye and 0.73 for yellowfin. The ratio we have estimated for the indonesian area is similar for yellowfin, but much higher for bigeye tuna, and shows us that areas including the Southern part of Indonesia, the South of Sumatra and Banda Sea are mainly bigeye fishing grounds.
3.5. Ratio deep lonqline hook rate over subsurface longline hook rate for fishes other than vellowfin and bigx
A lot of other fishes are caught by subsurface longline. The total averages 19.3 X of the total catch in weight of PT Perikanan jamodera Besar for the period 1976 to 1981. The main species are by importance : albacore (5.6 X), white marlin (4.7 X), black marlin (2.6 a), moro shark (2.4 X), swordfish (1.5 %), sailfish (1.2 Z), striped marlin (0.8 %) and bluefin (0.4 %). Average catch in weight for yellowfin and bigeye was respectively 62.2 X and 18.5 % for the same period.
We have seen in the precedent chapter that the hook rate of bigeye was higher when using deep longline. On the contrary, hook rate for yellowfin tuna is lower when using this gear, this is also true for a11 billfishes and albacore.
From the work of SUZUKI (1977), we cari estimate that :
- For swordfish the difference.in fishing efficiency by gear type is relatively small with a tendency of slightly higher hook rates for subsurface gear except perhaps in Banda Sea. c
- For striped marlin, hook rate by subsurface gear show generally higher value i the same is true for white marlin.
- For sailfish and shortbill spear fish, the hook rates by subsurface gears are much higher than those obtained by deep gears.
- for albacore, the difference between the two types of gear is low.
The average ratio of specific hook rate of deep gear over subsurface gear as estimated by SUZUKI are the following : .
albacore : 0.82 swordfish : 0.79 white marlin : 0.55 sailfish : 0.06 black marlin : 0.34 striped marlin : 0.28
No estimation has ratio of 0.5 for both, and bigeye.
been made for moro sharks and bluefin ; but if we arbitrarily give a we obtain an average ratio of 0.5 for a11 species other than yellowfin
Al1 this estimation is done using individual ratio values b3( species calculated for others areas than those exploited by indonesian longliners ; it must be taken cautiously : this is why we have done the following calculations with a "pessimistic" value of 0.3 which means that we have considered that deep longlines fish about three times less (except for yellowfin and bigeye) than subsurface longlines.
- 22 -
3.6.. Estimation of the expected benefit bv usinq deep longline. .; ‘.. ‘.
,’
-_ i :_ .. .~
3.6;1 Benefit in weight. ,., " _ -._ . _. :
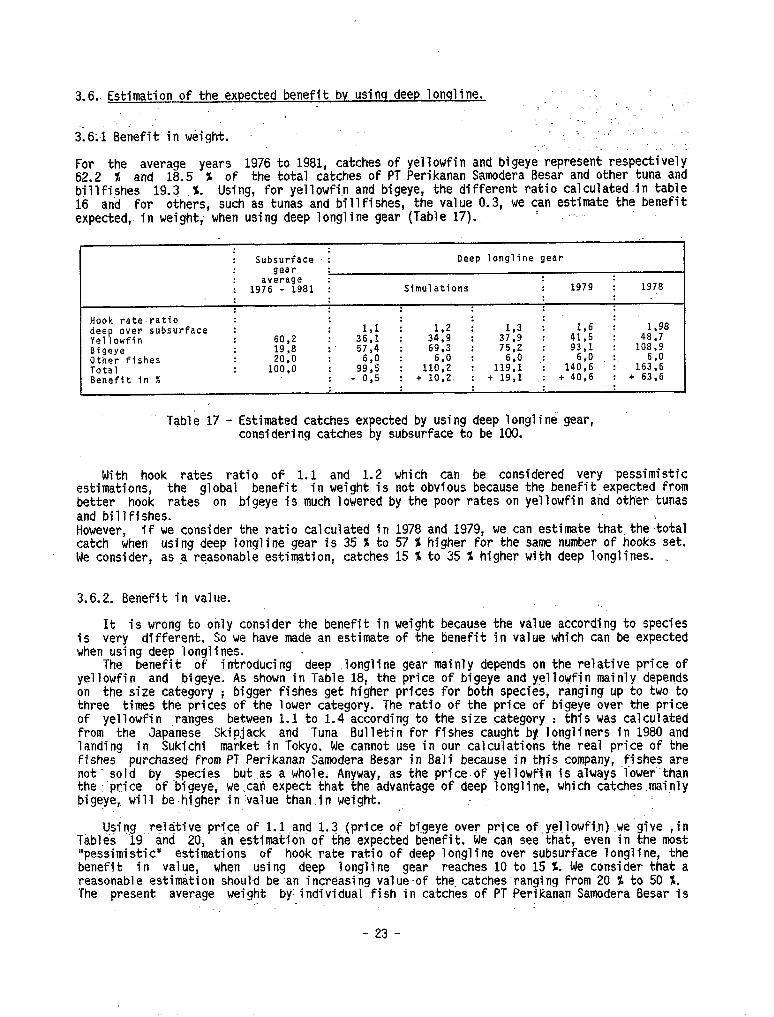
For the average years 1976 to 1981, catches of yellowfin and bigeye represent respectively 62.2 % and 18.5 % of the total catches of PT Perikanan Samodera Besar and other tuna and billfishes 19.3 %. Using, for yellowfin and bigeye, the different ratio calculated.in table 16 and for others, such as tunas and billfishes, the value 0.3, we cari estimate the benefit expected, in weight; when using deep longline gear (Table 17). ' :
: Subsurface I gear
average : 1976 - 1981 :
Deep longline gear
Simulations 1979 : 1978
Hook rate ratio : . deep over subsurface : 1,l : 1.2 : 1,3 : 1,6 : -- l,YO
I
Yellowfin 60,2 36.1 : 34,9 : 37.9 : 41.5 : 48.7 Bigeye : 19,8 : 57,4 : 69.3 : 75.2 : 93.1 : ioa ,9 Other fishes 20,o
6.0 : 6.0 : .g,o .: : Total 100.0 99.5 : 110,z : 119,l : _.^ 6.0 - :636'5 14U,b : J
Benefit in X : - 0,5 : + 10,2. : + 19.1 : + 40.6 : + 63:6
Table 17 - Estimated catches expected by using deep longline gear, considering catches by subsurface to be 100.
With hook rates ratio of 1.1 and 1.2 which cari be considered very pessimistic estimations, the global benefit in weight is not obvious because the benefit expected from better hook rates on bigeye is much lowered by the poor rates on yellowfin and other tunas - - and billfishes. However, if we consider the ratio calculated in catch when using deep longline gear is 35 I to We consider, as 3 reasonable estimation, catches
1978 and 1979, we cari estimate that the total 57 % higher for the same number of hooks set. 15 I to 35 % higher with deep longlines. _
3.6.2. Benefit in value.
It is wrong to only consider the benefit in is very different. SO we have made an estimate when using deep longlines.
weight because the value according to species of the benefit in value which cari be expected
The benefit of introducing deep .longline gear mainly depends on the relative price of yellowfin and bigeye. As shown in Table 18, the price of bigeye and yellowfin mainly depends on the size category i bigger fishes get higher prices for both species, ranging up to two to three times the prices of the lower category. The ratio of the price of bigeye over the price of yellowfin ranges between 1.1 to 1.4 according ta the size category : this was calculated from the Japanese Skipjack and Tuna Bulletin for fishes caught by longliners in 1980 and landing in Sukichi market in Tokyo. We cannot use in our calculations the real price of the fishes purchased from PT Perikanan Samodera Besar in Bali because in this company, ,fishes are net sold by species butsas a whole. Anyway, as the price of yellowfin isalways lower'than the -‘price of bigeye, we-tan expect that the advantage of deep longline, which catches.mainly bigeye, Will be.higher in-value than in weight. “
Using -relative price of 1.1 and 1.3 (price of bigeye over price of yellowfin)_we g-lue ,in Tables -19 and 20, an 'estimationof the expected benefit. We cari see that, even in the most "pessimistic" estimations of hook rate ratio of deep longline over subsurface longline, the benefit in value, when using deep longline gear reaches 10 to 15 %. We consider that a reasonable estitition should be -an increasing value-of the.catches'ranging from 20 X to 50 1. The present average weight byLindividua1 fish in catches of PT Perikanan Samodera Besar is
. . - :
- 23 -
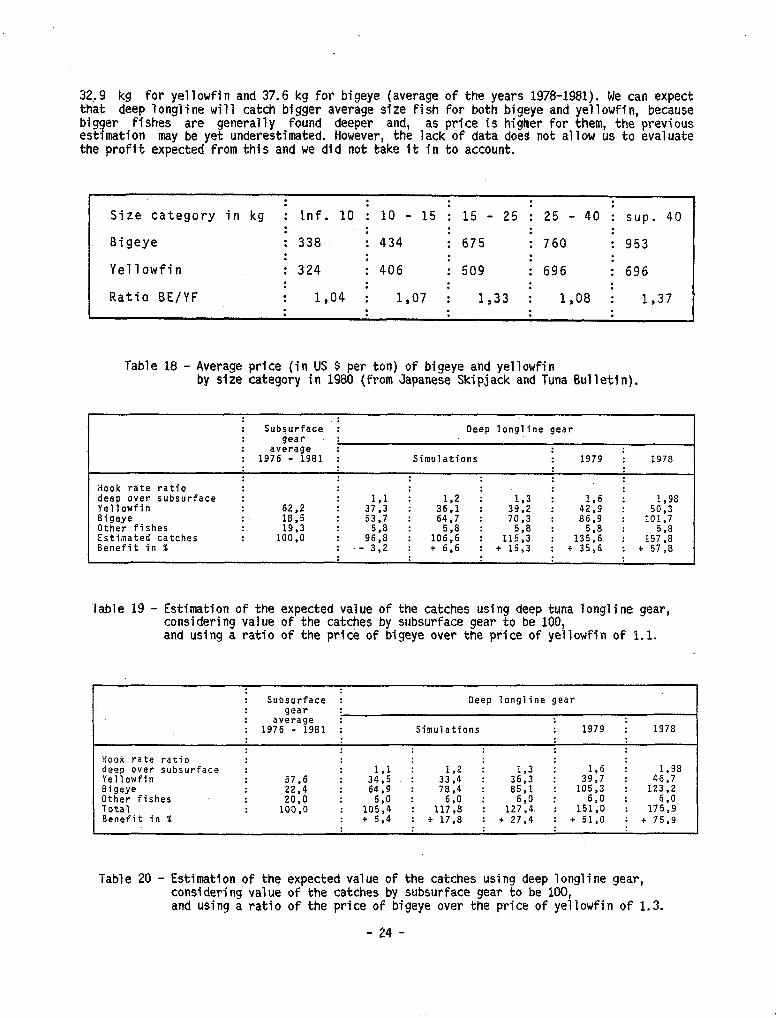
32,9 kg for yellowfin and 37.6 kg for bigeye (average of the years 1978-1981). We cari expect that deep longline Will catch bigger average size fish for both bigeye and yellowfin, because bigger fishes are generally found deeper and, as price is higher for them, the previous estimation may be yet underestimated. However, the lack of data doeg not allow us to evaluate the profit expected from this and we did not take it in to account.
. : : . I
: Size category in kg tnf. 10 : 10 - 15 : 15 - 25 ; 25 - 40 : sup. 40
: . : : : Bigeye : 338 ; 434 : 675 : 760 : 953
. . . . . Yellowfin ; 324 ; 406 ; 509 i 696 ; 696
: : : : . Ratio BE/YF : 1,04 : 1,07 : 1,33 : 1,08 ; 1,37
: . . . . : :
Table 18 - Average price (in US $ per ton) of bigeye and yellowfin by size category in 1980 (from Japanese Skipjack and Tuna Bulletin).
: : Subsurface : Deep longline gear
gear average :
: 1976 - 1981 : Simulations 1979 i 1978
Hook rate ratio : : deep over subsurface : 39: 35'12 392 4296 1,98 Yellowfin 62.2 . : . : 50,3 aigeye : 18.5 53:7 I 64:7 : 70:3 I 8619 : 101.7
Other fishes 19.3 Estimated catches 100,o 9x . 3:2 ;
1025 : + 616 :
11X + 1513
: 13x : + 3516
i 1575'8 Benefit in % : .- : + 57:B
Table 19 - Estimation of the expected value of the catches using deep tuna longline gear, considering value of the catches by subsurface gear to be 100, and using a ratio of the price of bigeye over the price of yellowfin of 1.1.
: Subsurface : Deep longline gear gear
average : : 1976 - 1981 : Simulations 1979 : 1978
Hook rate ratio deep over subsurface I 1.1 : 1,2 : 1,3 1,98 Yellowfin 57,6
6Z i 33.4 : 36.3
: 39'76 : : 10513
: 46,7 Bigeye 22,4 78.4 : 85,l : 123,2 Other fishes 20.0 : 6:O : 6,D : 6,0 : 690 Total 100.0 : 105.4 : llxl I 127.4 : 151,o : 175.9 Bcnefit in % : i5.4 : + 17:8 : f 27.4 : + 51,o : + 75.9
Table 20 - Estimation of the expected value of the catches using deep longline gear, considering value of the catches by subsurface gear to be 100, and using a ratio of the price of bigeye over the price of yellowfin of 1.3.
- 24 -
3.7; 7endericv. of biqeye price. .s. . .
" We hàve seen' that- the -benefit of introducing deep longline geai mainly depends'on-thë relative' 'price of yellowfin and .bigeye. This is why we present on Figure 12; the evo'lutio.n.'of. the --price of those two species from October 1980 to April 1982 in Yaizu market. These values' must- be taken cauti.ously as they are average prices which do not reflect-the quality of the fish' nor the.size 'category. 'However, we cari see that the average ratio of the price of bi.gëye' over the% price of yellowfin (Figure 13) is increasing. A conclusion could- be thati the‘ interest of'catching more.bigeye by using deep longline becomes higher... _.. 1:
. :_ >..
3.8. Investments to be made to convert the vessels.
Investmnts .must be made in order to convert subsurface gear longliners into deép gear ;iongliners; Particularly, vessels.must get bigger haulers and also more powërful genérators.' Tho.se .u$ed at pr,esent by indonesian longliners of the'society PT Perikanan Samodera Besar-are 150 HP ; generators 200 HP could probably be used to replace the former:A study-of the' necessary investments bas yet to be done. It would take us beyond the scope-of.this paper.‘.. _I"
-. ._ I ..'__. 1.. .- li. .,
3.9. Conclusions. ~, -- .
. -- -- ,- . . = - .-.
The -areas where the indonesian longliners of the State Company PT Penikanan iamodera B&ar operate, seem to be very good areas to catch bigeye tuna which is a fish with-a:deep' habitat usually situated well under the thermocline. Introduction of deep longline .gear.could quite -substantialy increase the. total catches (about 15 X to 35 X) and the earnings"of the company needing only relatively small investments compared to the benefits, expected which have.becn~ estimated to range between 20~ % to SO % at least.
. . -._ . -. . 5 _ .._ ..- / .- _- _. .- -
'._.., .i ._ _' __ : ._ .,~
;c .. - ., <' . . .: I : ,. _ ,< _ - i ~.__,... / i _.j'-_ "'. ,~ .-' _
! . . _~ . . . ._ . _: ~. <_'. .- 4':.AREAS AN0 SEASONS TO.CATCH BIGEYE TUNA WITH.DEEP LONGLINE GEARS;' ~- .- “;‘:_'-‘:-.
< : _' _- -. . - :. 7. <,' ._ - :
,;.: :.-y.~ *: ,y.-. ..:i;.~~-..-, -. _ : ..~ . 4:l.: Introduction. .'..-
_. ..<~.. .._'
-_ .- . . ..The. &jor indonesian longline fishing company, P.T. Perikanan Samodera Besar;based in
Denpasar, Bali, operates in the Indian Ocean and Banda Sea with 20 vessels.-IlO GT each. setting.typical subsurface longline.
-... . . ' It lias been shown in a previous chapter, what is the expected benefit when introducing
deep tuna longline gears to replace traditional subsurface longlines. It was.estimated that total catches should be 15 % to 35 % higher and since deep longline catch mainly bigeye'tuna*‘ which has a higher price than yellowfin, the benefit in value should range between 20 X to 50 x.
.:
The question is .now to settle where to fish if deep longline gears rëplace,subsurface ones as the former are used to catch mainly bigeye and the latter, yellowfin.
“:,,
4.2. Sources and limits of data available.
For many years, japanese longliners operate Java to catch yellowfin and bigeye tunas. Until
-/ . ,. .̂ ._
. . . . .:-
in Banda Sea'and-in areas South and.West"of 1974, alrnost a11 vessels used the same type
of subsurface longline ; however, since 1975, more and more small and medium size boats have set deeper longline in order to catch bigeye tuna more" efficiently; ' .,.'.' -, ."
-.. .-'
- 25 -
In our study, we used the 1976 to 1979 data from the annual reports of effort and catch statistics by area on japanese tuna longline fishery, Oevelopment Department,
published by the Research and Fisheries Agency of Japan. Unfortunately hook rates are given by 5"
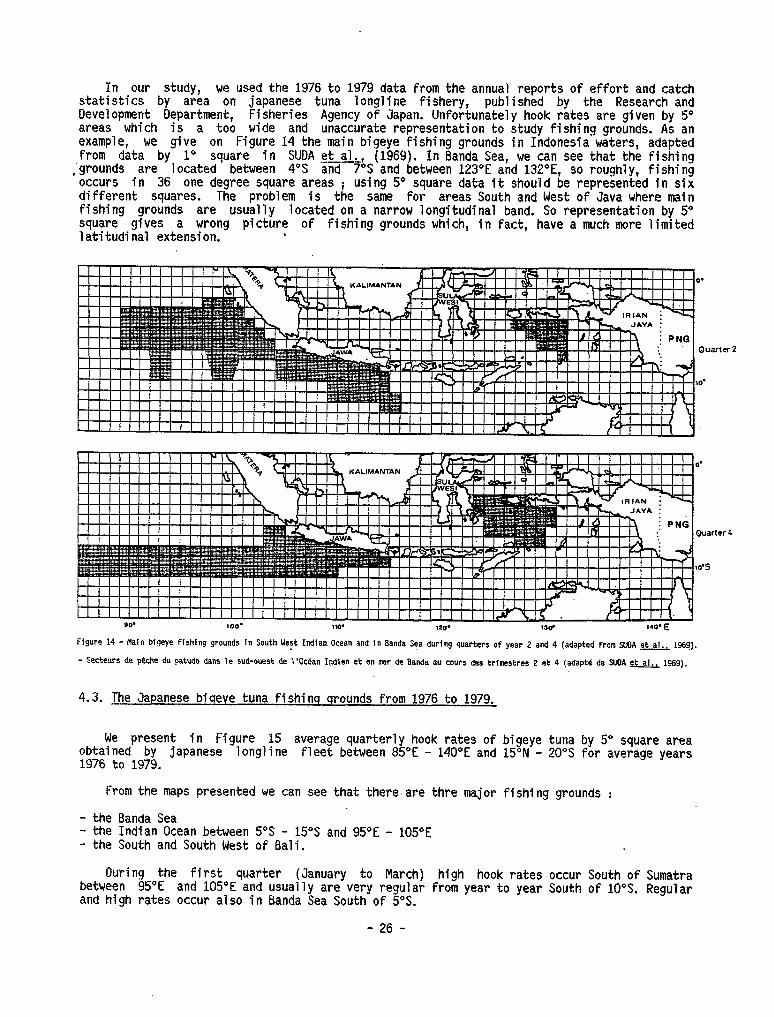
areas which is a too wide and unaccurate representation to study fishing grounds. As an example, we give on Figure 14 the main bigeye fishing grounds in Indonesia waters, adapted from data by l" square in SUDA et al., (1969). In Banda Sea, we cari see that the fishing
,'grounds are located between 4"s and 7"s and between 123°E and 132OE, SO roughly, fishing occurs in 36 one degree square areas ; different squares.
using 5' square data it should be represented in six The problem is the same for areas South and West of Java where main
fishing grounds are usually located on a narrow longitudinal band. SO representation by 5" square gives a wrong picture of fishing grounds which, in fact, have a much more limited latitudinal extension. t
Figure 14 - Mn bigeye fishlng grounds in South West Indfan.Ocean and fn Banda Sea during quarters of year 2 and 4 (adapted From SWA et 1969).
- Secteurs de peche du patudo dans le sud-ouest de l'Oc@an Indfen et en mr de aanda au cours des trimestres 2 et 4 (adapte de SJRA ef 1969).
4.3. The Japanese biqeve tuna fishinq qrounds from 1976 to 1979.
We present in Figure 15 average quarterly hook rates of bigeye tuna by 5" square area obtained by japanese longline fleet between 85"E - 1976 to 1979.
140"E and 15"N - 20"s for average years
From the maps presented we cari see that there. are thre major fishing grounds :
- the Banda Sea - the Indian Ocean between 5"s - 15OS and 95"E - 105"E - the South and South West of Bali.
‘ter 2
During the first quarter (January to March) high hook rates occur South of Sumatra between 95OE and 105OE and usually are very regular from year to year South of 10”s. Regular and hfgh rates occur also in Banda Sea South of 5"s.
- 26 -
*u “.y : w
Pff ,000 , ,
POD ZOO s
coljo vo* _ .%?O?, . 320’ MODE
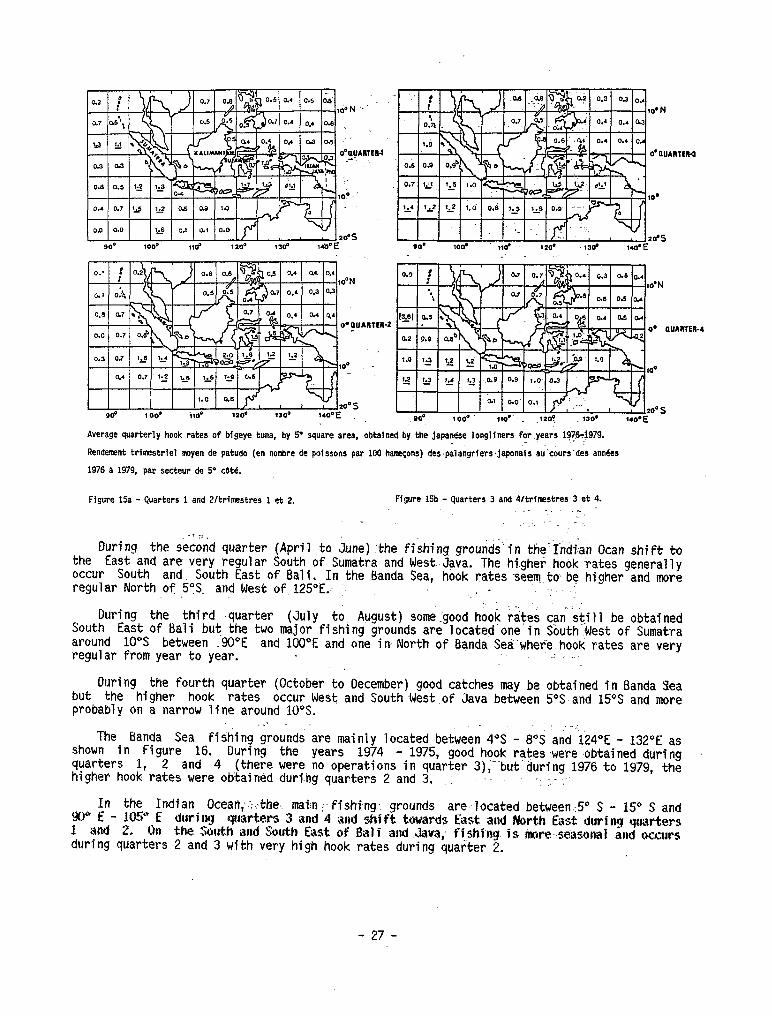
Average quarterly hook rates of bigeye tune, by 5' square area, obtained by the japanèse longliners for years.lq+g79. _
Rendemnt trimestrfel myen de patudo (en no!rbre de poissons par 100 hamçons) des pala&riers~japonals au'coursTdis anneeS
1976 a 1979, par secteur de 5' cbtd.
IUAIITER4
Figure 15a - guarters 1 and Pltrinstres 1 et 2. Ffgure 15b - C@arters 3 and 4Itrimstres 3 et 4. . . .i. *. __ -
_- _
.'.- . ..-.
- 7 :-.
During the second quarter (April to June) the fishing grounds'in the%&an Ocan shift to the East and are very regular South of Sumatra and West Java. The higher hook rates generally occur South and, South East of Bali. In the Banda Sea, hook rates seem.tobe higher and more regular North of 5:s. and West of.125"E.. : . . .
During the third .quarter (July to August) some!good hook rates cari still be obtained South East of Bali but the two major fishing grounds are located one'in South-West of Sumatra around 10"s between .9O"E and 1OO"E and one in. North of Banda Sea-where hook rates are very regular from year to year. : _:
During the fourth quarter (October to December) good catches may be obtained in Banda Yea but the higher hook rates occur West and South West of Java between SOS.and 15's and more probably on a narrow line around 10°S.
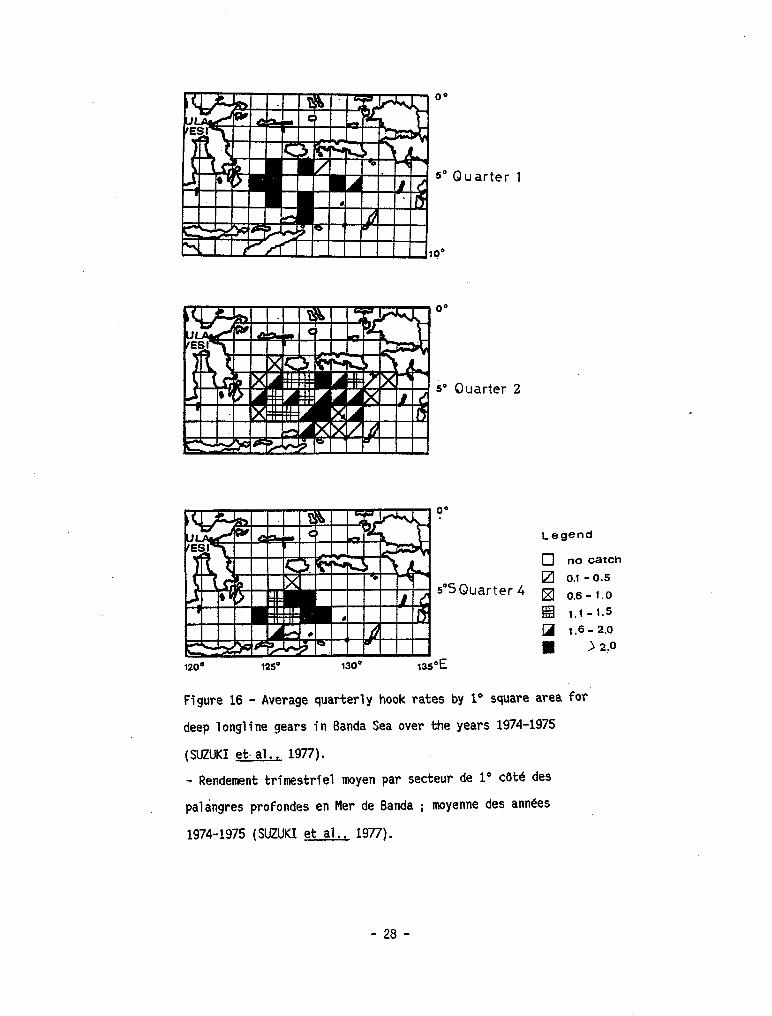
<&. ..; The Banda Sea fishing grounds are mainly located between 4"s - 8OS and 124"E - 132"E as
shown in Figure 16. quarters 1,
During the years 1974 - 1975, good hook rates.were .obtained during 2 and 4 (there were no operations in quarter 3),-but‘during 1976 to 1979, the
higher hook rates were obtainéd during quarters 2 and 3. ._ -_ -- ;
In the Indian Ocean,~:.-the: mai:n;.fishing. grounds are located betweenlS S - 15" S and !Xl* E - lctc;" E dtrri II~ qJJarters 3 atti 4 and shift tocards East and Mwth hst drrrinq rqJJwtmS 1 311d 2. I)II thp. SrJth and %&h ikt of Bal i aad .Jam; fishtng. $3 mrt3-saw.mal &td t)ilc(Jrs during quarters 2 and 3 with very high hook rates during quarter 2.
- 27 -
5’ Quarter 1
5’ Ouarter 2
5”SQuarter 4
gend
no catch
0.1 -0.5
0.6 - 1.0
1.1 - 1.5
1.6 - 2.0
> 2.0
Figure 16 - Average quarterly hook rates by l" square area for
deep longline gears in Banda Sea over the years 1974-1975
(SUZUKI et al.. 1977).
- Rendement trimestriel moyen par secteur de 1’ cbtb des
palingres profondes en Mer de Banda ; moyenne des annees
1974-1975 (SUZUKI et a1 . , 1977).
- 28 -
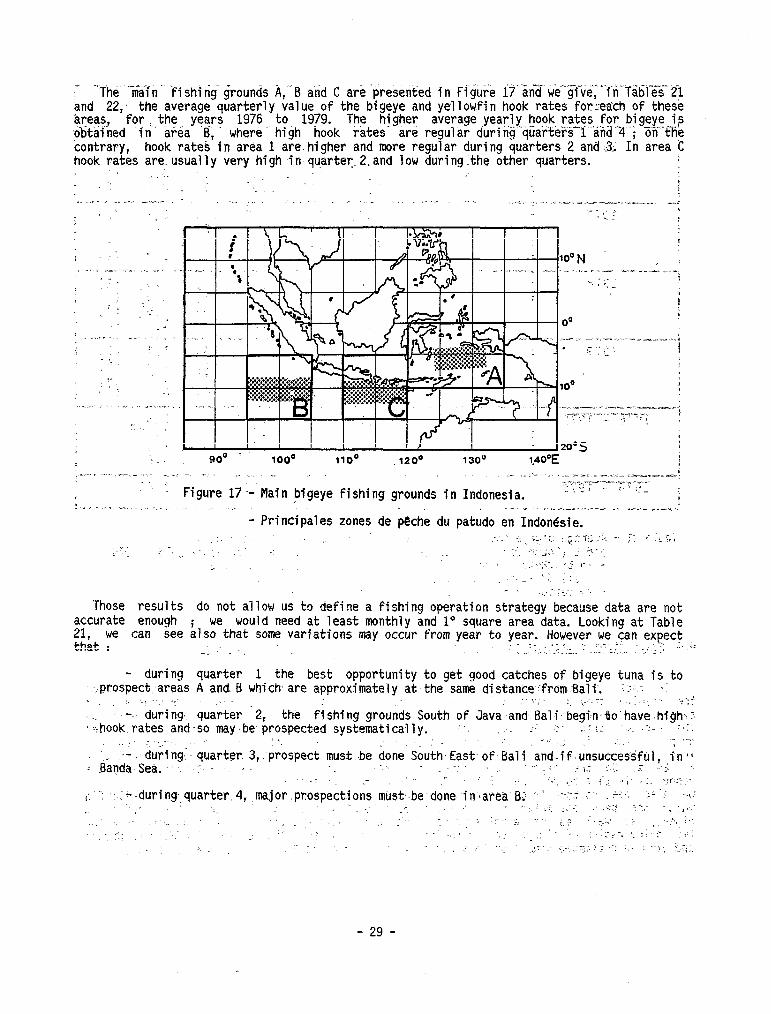
.r -Thë- -main- fishing grounds A,-ZE! and C &%‘presented in Figure i7‘and~we-giYë;"in'Taljies~21 and 22,, the average quarterly value of the bigeye and yellowfin hook.rates for:each of thesè areas, for ,-.the. years 1976 to 1979. The higher average yearly hook rates for bigeye i-s obtained .in area ‘B;'-
--.-.~ . . . . ~- ._ -~. where high hook rates are regular during-qùarters 1 and 4 i ÏZÏthe
contrary, hook rates in area 1 are.higher and more regular during quarters 2 and.:3; In area C hook rates are.usually very high in qu.arter 2.and low duringithe other quarters.
.,,~ _ 1 .
. . i . ., _. . . . _ .1. . _I ._. _ _ _ .._ I- .- . . ..a.. a_-. /.-- - __ -.-_-. _-__ __^ -,c - - ;- '_ i “J
t .- lo"N I ; . _ Or-., .._ ._ ~.. . . - _,.._.- - c-m --_- _ .-
, " __. ! 2 ! I. 1 I', _ i : ..~ i '_-
'_ . - 00
_...z-~.. "<.~_~ _ 1 __. c ..~ _ -. -- _-. -_ _...- _.__ m-i :. :- . ,- ._<." r ': _? i -
. Figure 17'--Main bigeye fishing grounds in Indonesia. >
i .=" .-.. .,.__ .__._ _~. ..-. -. . ..~_ .~_.,....._-.l~.e. __- .-a-_ _..-. -.
- Principales zones de peche du patudo en Indonésie. :. ;. .“ -,- .;--. z :.. ~,;a 7;' ,.. _. :_' ,- ‘- :"; 20 ,_ ~_. ( ‘ - ..- . . ~ .' . . _' .~ ,-: ,~, .& . " ..; I, ;-, . -: _ _: , -< I-. -
1 I . . _:_ - . ... .,._ _
Those results do not allow us to define a fishing operation strategy'because data are net accurate enough ; we would need at least monthly and 1’ square area data. Looking at Table 21, we cari see also that some variations may occur from year to year. However we cari expect that : : . , " .,; -:. : - - - - .-. _," ,;= ' _-. .._ ‘..-.: ._._ . __ _.- L' 2
- during quarter 1 the best opportunity to get good catches of bigeye tuna is-to : -:prospect areas A-and, B which. are approximately at-the same distanceifrom:Bali; :-..-.
,; .-. -- .: ..<. L . . ,: -1 " .~, i I i. .-_ p.-. during quarter .2, the fishing grounds South of Java and.Balia begin.tlo'have'highir ,.-:hook rates-and-so may.be-prospected system&icaJly. :-. _.-. z.1 -: ;;;: ;. .i.. -*:'
__ . . .- 1," i . . . -i ._: / -: ..-. during" quarter. 3,.prospect must ,be done South.East-of Bali and-if.unsuccessfuil,.ihll
i. &pja Sea. ; . -, : .-- _ ~? , _ -- : i, :'..y .-. __ .: . . - .: '.._ ‘-.' z. ! ,~ SS 1 ,r:-: ."
r; 7' -. (2 - i .during,-quarter4, ~major.prospections must."be done inlarea-Bi i ' _._v - j I. .r‘-',: :.'-: --:- : I_ : ~ _ < r--t :*--: .._ . . . . 1 ./..-
__, ., '- . . . . _ _ ._ . . -_ ? . ;.:... _ 3. ., . . .~ . .' _' '.. .' ; _;.a '_ :T‘-:- ","
.-. *:: : I.;-. YrnT", ; :" i ; _ - : I-:; -_
- 29 -
: : . : Year : Quarter : A I B : C
. : : . . .
. : 1976 ; 2' : l,l*
: : : :
4 1,3,
: 1,2 *: 0,9
1977 : :
: l,O, (4) : 0,3 (3) : : 1,5, : : 1,8, : i. : 1,l
1978 : ; 1,4 : 21 : 1,6* : : 1,3% : : : 1,3 . .
1979 : :
: 1,l (6) I 1,7% [q ; yx (3) : .: 0,9 : 1,l :
i : l,O, 1:; : l,O, (3) : 110 ::j
: : l,o (6) : 1,4 (4) : 0,9 (4) .
1916 - 1979 : : 1,3*% : 1,3 : 1,3,, : 1,3
: 04, : 1,7 : l,o : 0,8
. . .
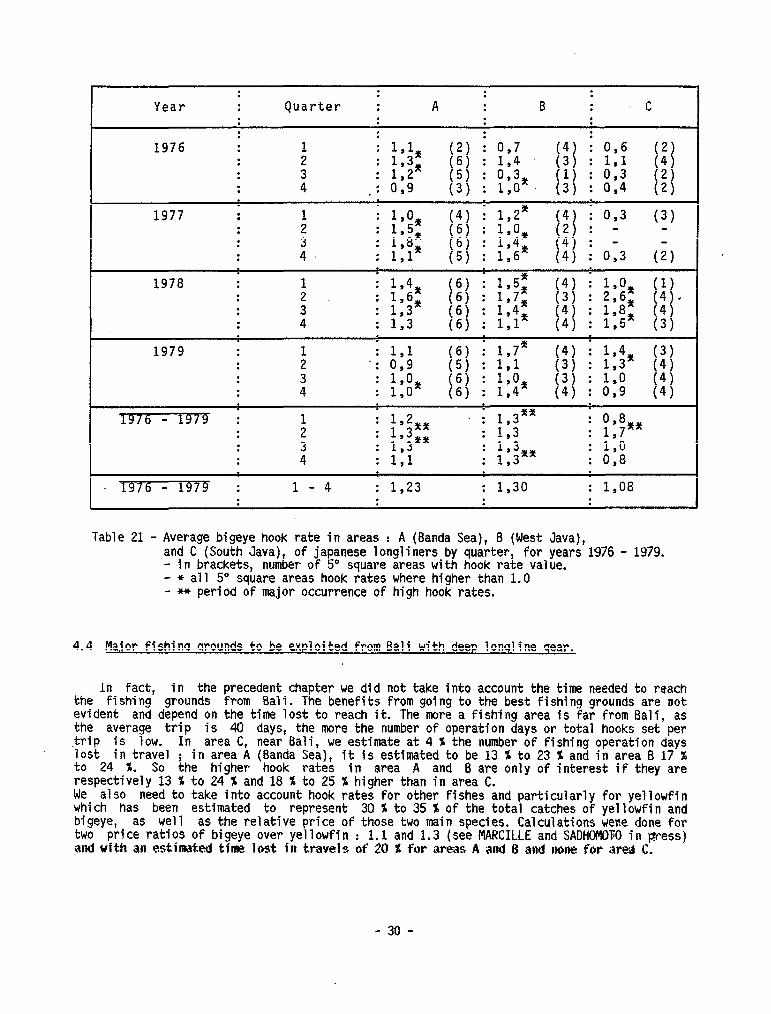
1976 - 1975 : 1 -4 : 1,23 : 1,30 : 1,08 I
Table 21 - Average bigeye hook rate in areas : A (Banda Sea), B (West Java), and C (South Java), of japanese longliners by quarter, for years 1976 - 1979. - in brackets, number of 5" square areas with hook rate value. - * a11 5" square areas hook rates where higher than 1.0 - 3c+ period of major occurrence of high hook rates.
4.4 Major fishinq qrounds to be exploited from Bali with deep lonqline qear.
In fact, in the precedent chapter we did not take into account the time needed to reach the fishing grounds from Bali. The benefits from going to the best fishing grounds are mot evident and depend on the time lest to reach it. The more a fishing area is far from Bali, as the average trip is 40 days, the more the number of operation days or total hooks set per .trip is low. lost in travel
In area C, near Bali, we estimate at 4 % the number of fishing operation days ; in area A (Banda Sea), it is estimated to be 13 % to 23 % and in area B 17 X
to 24 X. SO the higher hook rates in area A and B are only of interest if they are respectively 13 % to 24 % and 18 X to 25 X higher than in area C. We also need to take into account hook rates for other fishes and particularly for yellowfin which has been estimated to represent 30 % to 35 X of the total catches of yellowfin and bigeye, as well as the relative price of those two main species. Calculations wece done for two price ratios of bigeye over yellowfin : 1.1 and 1.3 (see MARCILLE and SADHQMOVO in ptress) ml with an er;timated tinw: lust in trwels of 20 X for wcas A ami 8 an4 I~)IE for ared C.
- 30 -
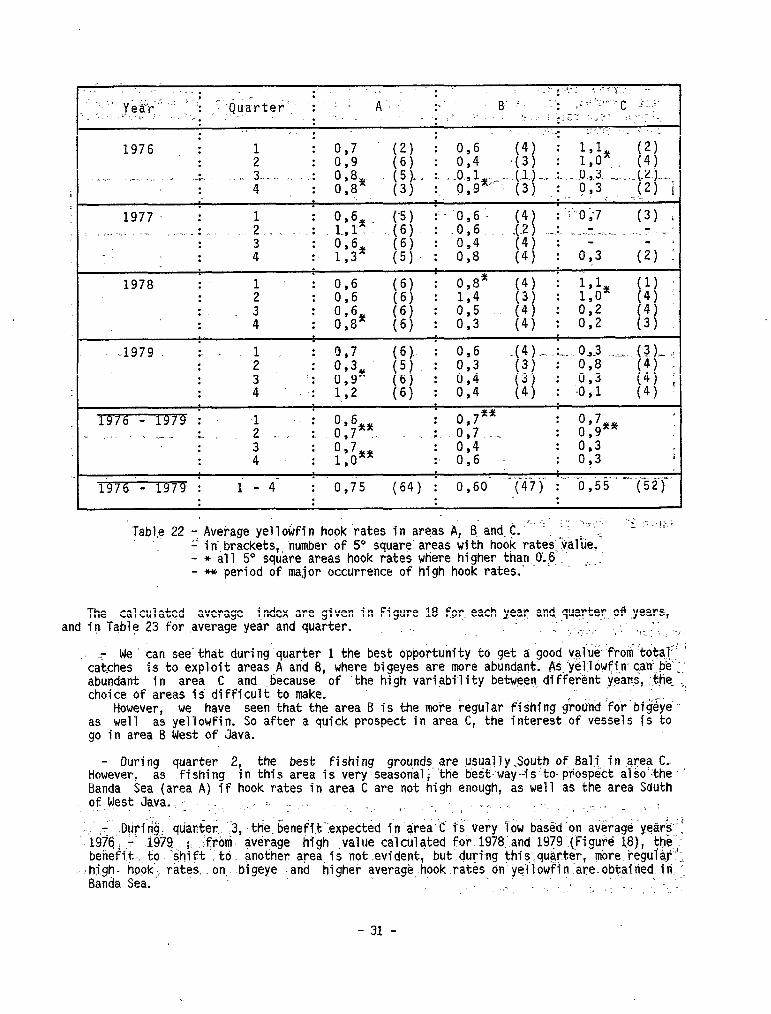
1976 . 0.7 - -.a. (2) : 0.6 (4) : 1,l.. (2) : : - : 0,9 (6j : 014 .(3j : i;oX (4j . ...Ij. ___, _ . -.. ._ . 3. -I-. i -. : OJ8% (5 j- 2. -0 ; i : 4 _ : O,! (3) : WX" (3) :-. 93. _<
: ;-;;x - (6j : -0; : (6) : ;,4 (41 : - : 1:3* (5). : > 8 (4j : 0,3 (2) : .
1978 : . : : I 0’66 : .3 : 0:6 : 4 : 0,8*
-.1979 I 1 . . : : .
1976 - 1979 : . " . .^ ._ ._ < . . :
1976'- 1979 ; i - 4‘ ; oj5
Table 22 -. Avekage yellowfin hook 'rates in areas A, < and.C. j'y" 1.: “""~ "' ' 'G" 1 :
- in:brackets,, number of 5" square'areas with hook rates.,:value! - * a11 5' square areas hook rates where higher tha.n.0.F. . ,.-..' - i«c period of major occurrence of high hook rates.
The calculated average i,ndex are given in Figure 18 for each year and:quaytey oP.years, and in- Table 23 for .average year and quarter. < ", s;.:,i .‘. ‘:-.-y ( -;,
We. cari see.tha;t during'quarter 1 the best oppo&uuity to qet a good valuePro total+ -7 catches i.s to exploit areas A and 8, where bigeyes are more abundaut. A~:y'él.lowf~.n- cari',&';. abundant in area C and because of .the high variabi-lity betwee- differënt yea-, -t,he- + choice of areas is difficult to make.
However, we have seen that the area 6 is the more Eegular fishing gioo'nd 'for‘bigeye' as well as yellowfin. SO after a quick prospect in area C, the interest of vessels is to go in area l3 West of Java.
- During quarter 2, the best fishing grounds are usually.South of Bali-,-in ayea C.. However, as fishing in this area is very seasotial;"‘the best-way-is -to-pnospect also'the ' Banda Sea (area A) if hook rates in area C are not high enough, as well as the area South ofwest Java.._ .:: .,: : __ ..- ; I_ 1. .~ , -. .: . . ~:-. .,~-. ._ _ ,, :
,. ‘*~:.. - INring. qua~ter":3,:tt;ie-beneQi,t.:éxpectéd in ârea.C i-i very i& basëd'on average yeàrS."E
-iii6 Y. .i97q ; ,:-froni avérage high .value calculated for 1978:.and l979.(Figur'e,18), thê : betiefi't. to "shift to. another'ayea.is nat.evident; but.during thisquayte'r, &re.Pegui@;
. -hj,gh- ho&: rates..onL bigeye -and -higher averagé hook.rateson-yellowfin:[email protected] ' Banda Sea.
% . . :- ': -. \
- 31 -
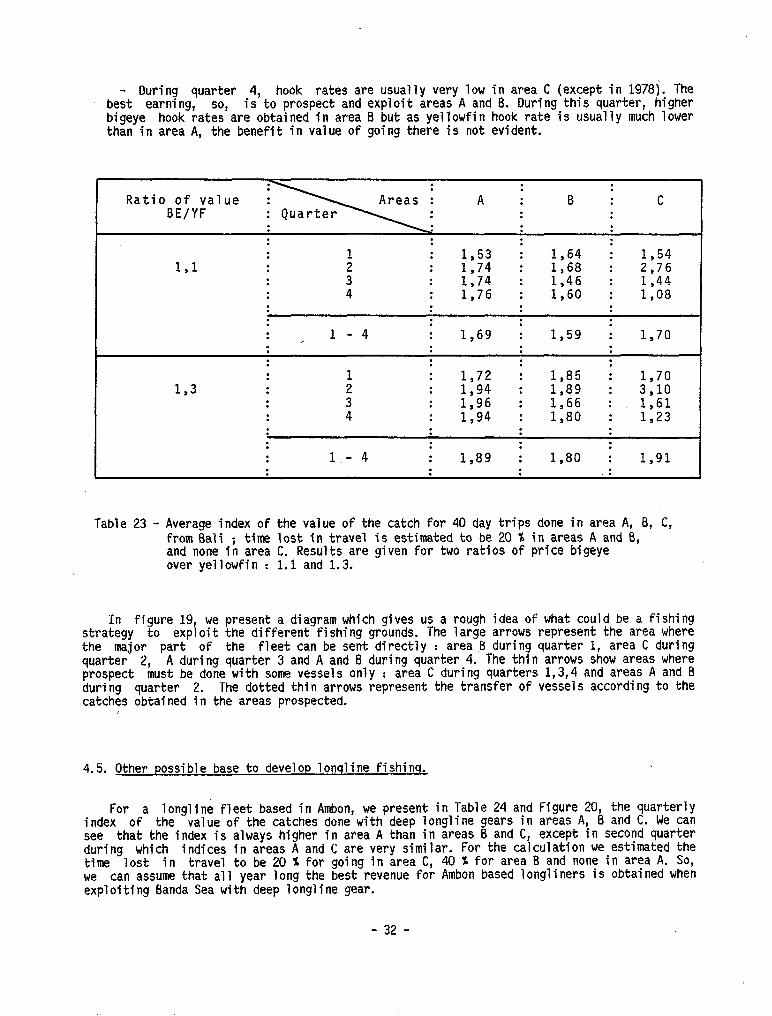
- During quarter 4, hook rates are usually very low in area C (except in 1978j. The best earning, SO, is to prospect and exploit areas A and 8. During this quarter, higher bigeye hook rates are obtained in area B but as yellowfin hook rate is usually much lower than in area A,. the benefit in value of going there is not evident.
. : . Ratio of value : A : B ; C
BE/YF : : : : : : : : : :
: : 1,53 : 1,64 : 1,54
131 : : 1,74 : 1,68 : 2,76 : i : 1,74 : 1,46 : 1,44 : : 1,76 : 1,60 : 1,08 . . : : : : : : . : 1 -4 : 1,69 : 1,59 I 1,70 : : . . : : : : : : 1 : 1,72 : 1,85 : 1,70
1,3 : 3’ : 1,94 : 1,89 : 3,lO . . : 1,96 : 1,66 : 1,61 : 4 : 1,94 : 1,80 : 1,23 : : : : : : : . : 1 -4 : 1,89 : 1,80 ; 1,91 : : : :
Table 23 - Average index of the value of the catch for 40 day trips done in area A, B, C, from Bali ; time lost in travel is estimated to be 20 % in areas A and 8, and none in area C. Results are given for two ratios of price bigeye over yellowfin : 1.1 and 1.3.
In figure 19, we present a diagram which gives us a rough idea of what could be a fishing strategy to exploit the different fishing grounds. The large arrows represent the area where the major part of the fleet cari be sent directly : area B during quarter 1, area C during quarter 2, A during quarter 3 and A and B during quarter 4. The thin arrows show areas where prospect must be done with some vessels only : area C during quarters 1,3,4 and areas A and B during quarter 2. The dotted thin arrows represent the transfer of vessels according to the catches obtained in the areas prospected.
4.5. Other possible base to develop lonqline fishinq.
For a longline fleet based in Ambon, we present in Table 24 and figure 20, the quarterly index of the value of the catches done with deep longline gears in areas A, B and C. We cari see that the index is always higher in area A than in areas B and C, except in second quarter during which indices in areas A and C are very similar. For the calculation we estimated the time 'Iost in travel to be 20 X for going in area C, 40 X for area B and none in area A. SO, we cari assume that a11 year long the best revenue for Ambon based longliners is obtained when exploiting Banda Sea with deep longline gear.
- 32 -
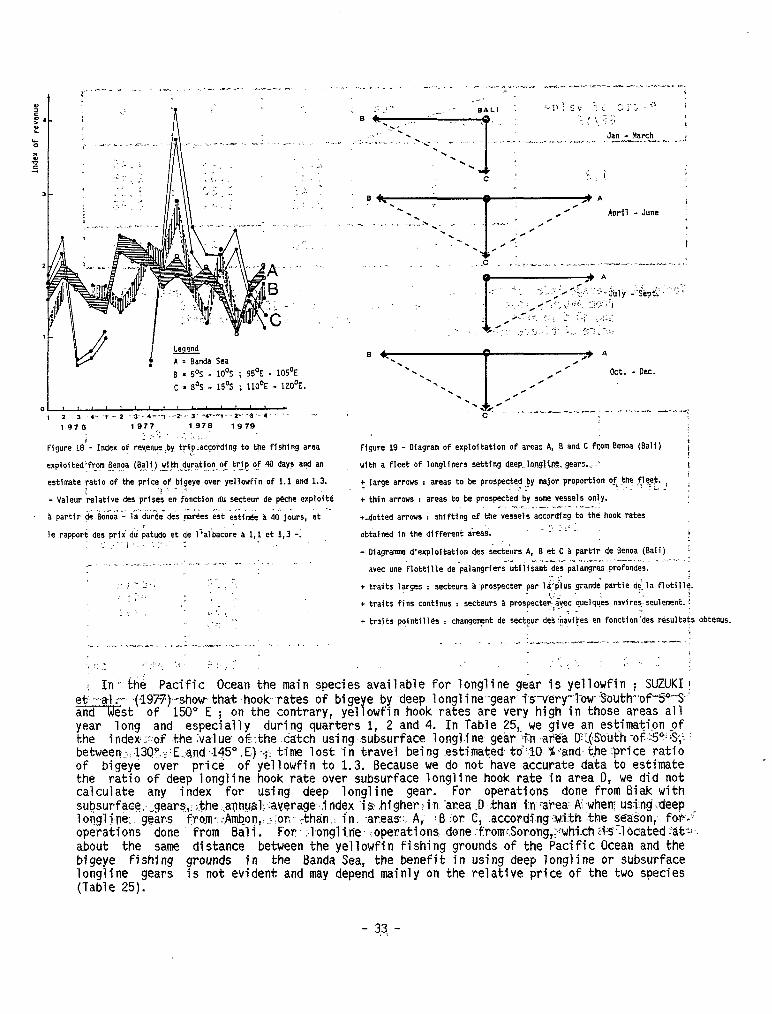
A = Banda Sea
6 = 5% - 10's ; 95'E - 105'E
C = 8's - 15's ; 110'E - 1ZO'E.
Figure 18.- Index of reqenue,by,tf!p.accoiding to the Ffshing ares
expiofted'From~Benoa (Bali) vfth durati??of trie of 40 days a?d an -. v_ _. . <__ I--
estimate ratio of the price of bigeye over yellowfin of 1.1 and 1.3. .j . . - ~,
- Vaieur belative des prises en fonction du secteur de peche explolt.6 . .i__,_. ~_._ .‘.< F ..-. v--..,-- . .._ -< . .
a partir de Eenoa - la duree des -parees est estimée a 40 Jours, et
le rapport des prix'ii patudo et de l'albacore a 1,l et l,j -i ._ ~
'? ,' ._
Figure 19 - Oiagram OF exploitatfon of areas A, B and C fom Benoa (Bali) i 1
vith a Fleet of longliners settlng deep.nonglQe_ gears.;.‘ I
t large arrous : areas to te prospecteb.oy major proportton ot.+ f!Fb / ' ;
+ thin arrovs : areas to be prospected by soms vessels onty. m-r. _._,. ̂ - .e_-
+dotted arrows : shifting of the vessels accordfng to the hook rates
obtalned in the different aieai. - 1:;' .
- Diagramme d'exploitatfon des &ct&rs A, 8 et C a partir-de Benoa (Bali) - _.̂ Y 1 -_, .~ . . . ", -- _ i. -. -- __ _ _ _._ _
avec une Flottille de palangriers utlllsant des palangrea profondes. . . _.
+ traits larges : secteurs a prospecter par l.sjius grande partie de';la Flotill~. ! : _
+ traits Fins continus : secteurs a pros@cterj?ye: quelques navires.seulement.:
+ traits wjntilles : changem$ de secteur de5$ialires en Fonctlon'des rèsulta&
In- the Paci.fic Ocean the main species available for longline ge.ar is yellowfin ; SUZUKI! ei. .-.a.] andst of 150" E
---(1977)--show-that-hookrates of bigere by deep longline--gear i‘s-~ery_'low-~outh"‘of-S"S-. ; on the contrary, yel owfln hook rates are very hlgh in those areas a11
year long and especially during quarters 1, 2 and 4. In Table 25,. we give an estimation of the index-:of the ;Value- of the.catch using subsurface longline geàr Sh +arei;a D:@o'uth-~f-$?~~;': between=:.13QP.-~:E-and-~l45".-E)~; time lost in travel being .estimatedto"";lO %and~theprice ratio of bigeyé over price of yellowfin to 1.3. Because we do not have accurate data to estimate the ratio of deep longline hook rate over subsurface longline hook rate in area D, we did not calculate any index for using deep longline gear. For operations done from Biak with -.. . . .
obtenus.
sudsurfaae,,_,ggar~,:~.~he -annual:-average index .is ,higher;in ‘ar.ea.lJ -than in -ares A; wnen: us~l.ngXteep longline: gears from~.$vnbon, .:;or' than.: 1 n. .areas:. A, *B ior C, .according+i2h..the season, fa-;" operations done from Bali. For :~l~ongline~~operations'done~from~Sorong,~-~wh~ch~ia~-lo~ated~~~~~. about the same distance between the yellowfin fishing grounds of the Pacifie Ocean and the bigeye fishing grounds in the Banda Sea, the benefit in using deep longline or subsurface longline gears is not evident and may depend mainly on the relative price of the two species (Table 25).
-. 33, -
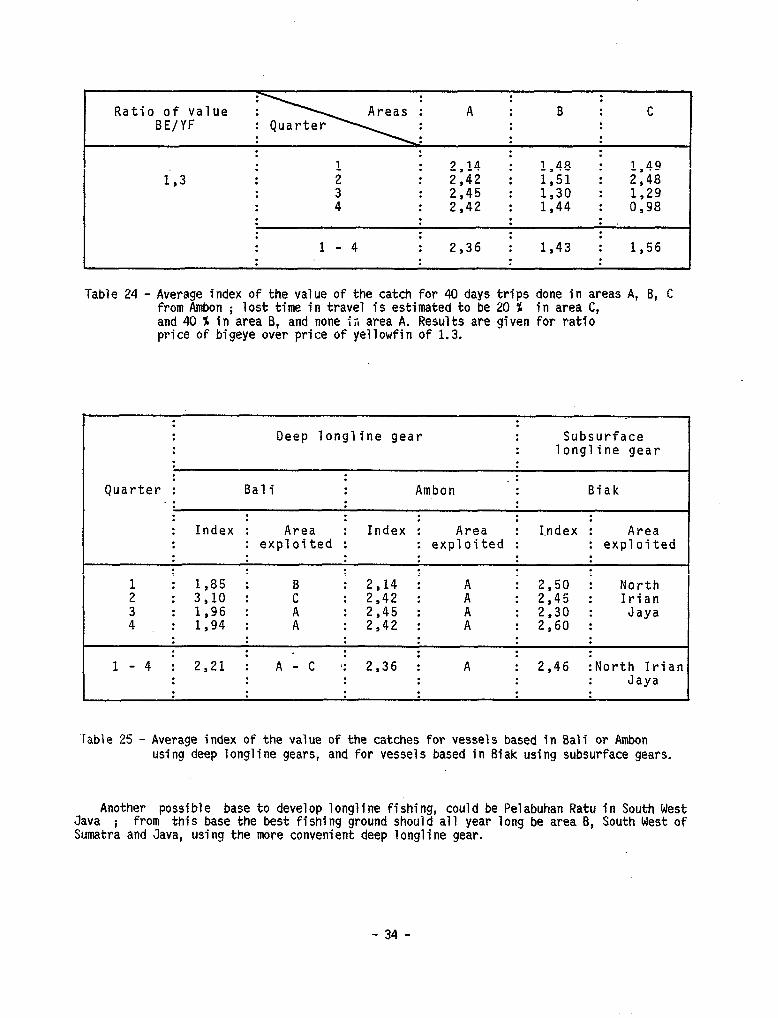
; Ratio of value A ; B : C
BE/YF . . . . : . . . . . . : . : . .
193 : : : 2,14 ; 1,48 : 1,49 : 2,42 : 1,51 : 2,48
: i
: 2,45 : 1,30 : 1,29 : . . 2,42 : 1,44 : 0,98
: : : : : 1 - 4 : 2,36 : 1,43 : 1,56 l
Table 24 - Average index of the value of the catch for 40 days trips done in areas A, B, C from Ambon ; lost time in travel is estimated to be 20 % in area C, and 40 % in area B, and none in area A. Results are given for ratio price of bigeye over price of yellowfin of 1.3.
i : : : :
Oeep longline gear : Subsurface : longline gear
I : Quarter : Bali
: : Ambon
. : . . Biak
. . : : : : : : . : : Index : Area : Index : Area I I.ndex : Area : : exploited : : exploited : : exploited : . . : : : : : : : : : : .
: I 1,85 : :
c" : 2,14 : .
A” I 2,50 : North
3,lO : 2,42 : 2,45 : Irian :
i : 1,96 : :
i : 2,45 :
ri : 2,30 : Jaya
1,94 : 2,42 : : 2,60 : : : : . . . . : . .
1 -4 I :
2,21 : A - C si : :
2,36 : A : 2,46 INorth Irian . . : : : : : Jaya : : : i . : :
Table 25 - Average index of the value of the catches for vessels based in Bali or Ambon using deep longline gears, and for vessels based in Biak using subsurface gears.
Java Another possible base to develop longline fishing, could be Pelabuhan Ratu in South West
; from this base the best fishing ground should a11 year long be area B, South West of Sumatra and Java, using the more convenient deep longline gear.
- 34 -
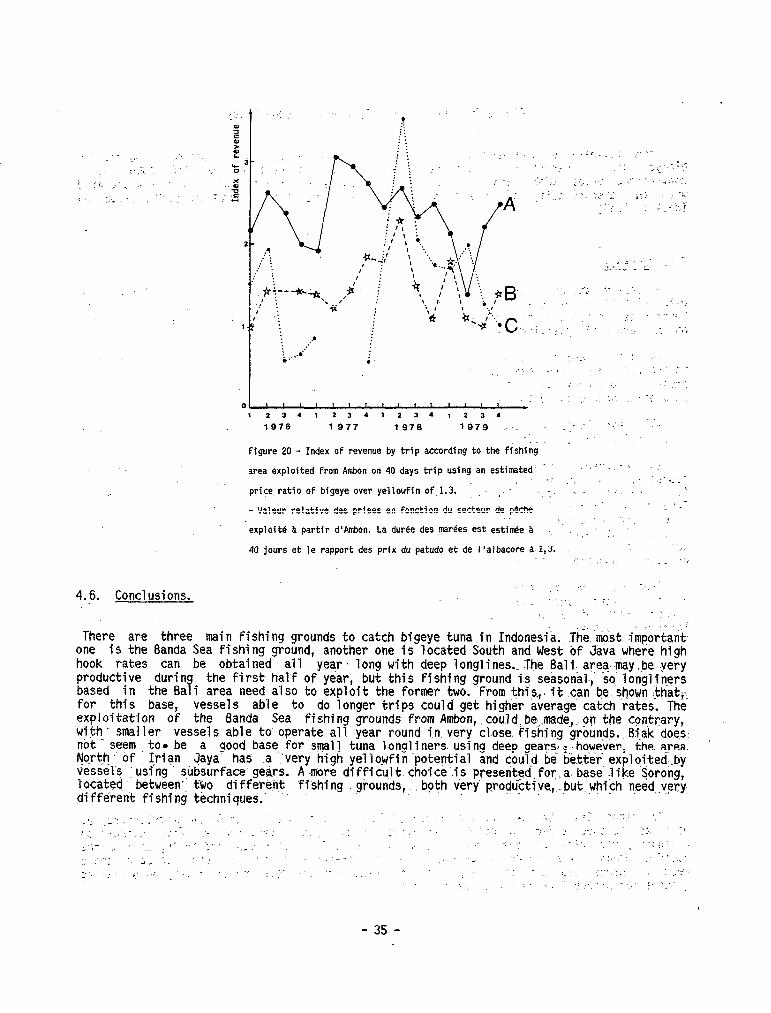
,234<23*1234,23.
1976 1977 1976 1979 ..' -'; _'
Figure 20 - Index of revenue by trip according to the fishing 1
area exploited From Ambon on 40 days trip using an estimated' ".'. ' ,--
price ratio of bigeye over yellowfin of 1.3. . :.
I % .
- Valeur relative des prises en Fonction du secteur de peche -'
: _'< ,. exploité a partir d'Ambon. La duree des marees est estitie a : .,
40 jours et le rapport des prfx du patudo et de l'albacore a‘1,3. -.
4.6. Conclusions.
There are three main fishing grounds to catch bigeye tuna"in Indonesi'à. Them&t important one is the Banda Sea fishing ground, another one is located South and West of JaVa where high hook rates cari be obtained ail year. long with deep longlines..The Bal-i- area may,be yery productive during the first half of year, but this fishing ground is seasonal-, SO longljners based in the Bali area need also to exploit the former two. 'From this,. tt .can be shown :thati: for this base, vessels able to do longer trips could get higtier average catch rates. The exploitation of the Banda Sea fishing grounds from Ambon, could.be. made.,.on the contyary, wjth. smaller vessels able to. operate a11 year round in very close. fi&ing grounds..B.i.ak d0e.s. not 1 seem ,to: be a .gaod base for smalj tuna longljners. using deep gears;.;:howe.ver, the. area. &+h -of. Irian -Jaya has .a ‘very high yellowfin potential and could be better exploited.by vesse1.s ‘using subsurface gears. A more difficujt.choice'.is presented,for:a, base .like Sorong, located', between', two different fishing grounds,..both very' prodüctive,.but which n:eed..very. different fishing techniques.‘
- 35 -
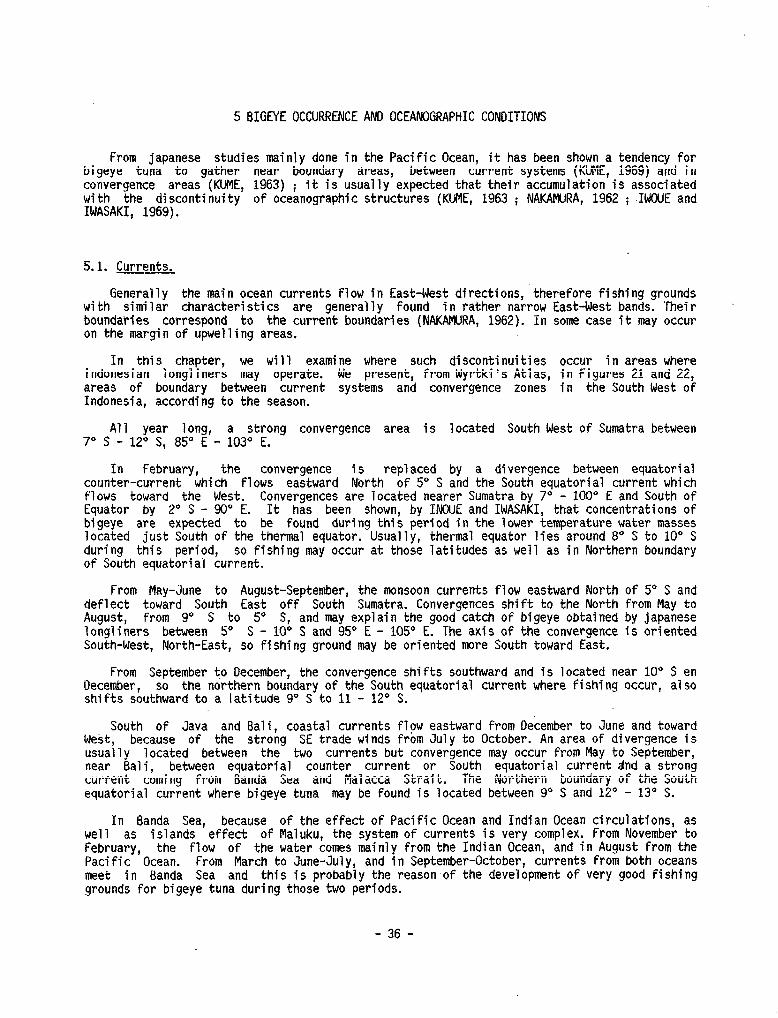
5 BIGEYE OCCURRENCE AND OCEANOGRAPHIC CONDITIONS
From japanese studies mainly done in the Pacifie Ocean, it has been shown a tendency for bigeye tuna to gather near boundary areas, between current systems (KUME, 1969) and in convergence areas (KUME, 1963) ; it is usually expected that their accumulation is associated with the discontinuity of oceanographic structures (KUME, 1963 ; NAKAMURA, 1962 ; .IWOUE and IWASAKI, 1969).
5.1. Currents.
Generally the main ocean currents flow in East-West directions, therefore fishing grounds with similar characteristics are generally found in rather narrow East-West bands. Their boundaries correspond to the current boundaries (NAKAmrRA, 1962). In some case it may occur on the margin of upwelling areas.
In this chapter, we Will examine where such discontinuities occur in areas where indonesian longliners may operate. We present, from Wyrtki's Atlas, in Figures 21 and 22, areas of boundary between current systems and convergence zones in the South West of Indonesia, according to the season.
Al1 year long, a strong convergence area is located South West of Sumatra between 7" S - 12" S, 85" E - 103" E.
In February, the convergence is replaced by a divergence between equatorial counter-current which flows eastward North of 5" S and the South equatorial current which flows toward the West. Convergences are located nearer Sumatra by 7" - 100” E and South of Equator by 2" S - 90" E. It has been shown, by INOUE and IWASAKI, that concentrations of bigeye are expected to be found during this period in the lower temperature water masses located just South of the thermal equator. Usually, thermal equator lies around 8O S to 10” S during this period, SO fishing may occur at those latitudes as well as in Northern boundary of South equatorial current.
From May-June to August-September, the monsoon currents flow eastward North of 5" S and deflect toward South East off South Sumatra. Convergences shift to the North from May to August, from 9" S to 5" S, and may explain the good catch of bigeye obtained by japanese longliners between 5" S - 10" S aod 95" E - 105" E. The axis of the convergence is oriented South-West, North-East, SO fishing ground may be oriented more South toward East.
From September t,o December, the convergence shifts southward and is located near 10” S en December, SO the northern boundary of the South equatorial current where Fishing occur, also shifts southward to a latitude 9" S to 11 - 12” S.
South of Java and Bali, coastal currents flpw eastward from December to June and toward West, because of the strong SE trade winds from July to October. An area of divergence is usually located between the two currents but convergence may occur from May to September, near Bali, between equatorial counter current or South equatorial current ànd a strong current coming from Banda Sea and Malacca Strait. The Northern boundary of the South equatorial current where bigeye tuna may be found is located between 9' S and 12O - 13' S.
In Banda Sea, because of the effect of Pacifie Ocean and Indian Ocean circulations, as well as islands effect of Maluku, the system of currents is very complex. From November to February, the flow of the water tomes mainly from the Indian Ocean, and in August from the Pacifie Ocean. From March to June-July, and in September-October, currents from both oceans meet in Banda Sea and this is probably the reason of the development of very good fishing grounds for bigeye tuna during those two periods.
- 36 -
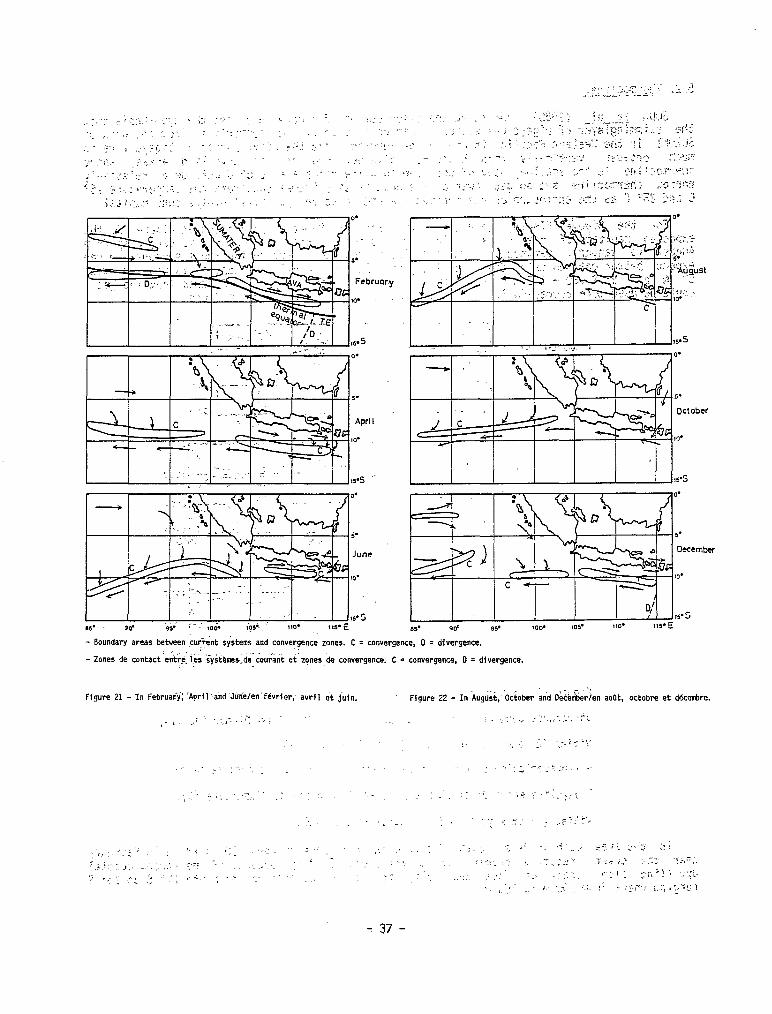
Apri
- Boundary areas between cu+nt &tem and convergence zones. C = canergence, D = divergence.
-Zones de contact ent»lë~.iyjtears,dé-courant et.zgnes de convergence. C = convergence. D = d4vergence. _
Ffgure 21 - In Februa$ 'Aprilland Junélen'fCvr~er, avrfl et juin.
_ / ,.. 1 i .s '.'d;'..-. < .:, ,.
Flgure 22 - In A&, Ocher dnd C&e&e~;en ao(lt, octobre et ddcetire.
‘~ '_', .J ; ;', :. -. .L'. -:;
:' - .: ::y -:'
-:. r,. b .,~ ; ,, _~ _i .- .
ï 37 -
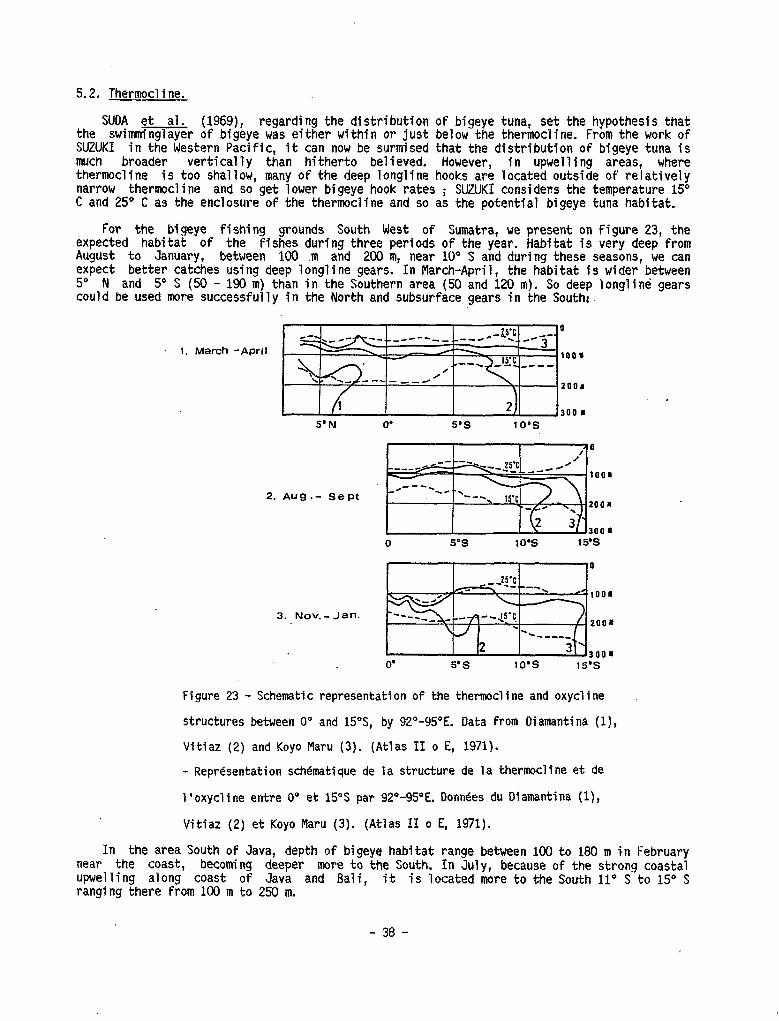
5.2. Thermocline.
SUDA et al. (1969), regarding the distribution the swinmnmr of bigeye was either within or just SUZUKI in the Western Pacifie, it cari now be surmised much broader vertically than hitherto believed. thermocline is too shallow, many of the deep longline
of bigeye tuna, set the hypothesis that below the thermocline. From the work of that the distribution of bigeye tuna is However, in upwelling areas, where
hooks are located outside of relatively narrow thermocline and SO get lower bigeye hook rates ; SUZUKI considens the temperature 15' C and 25" C as the enclosure of the thermocline and SO as the potential bigeye tuna habitat.
For the bigeye fishing grounds South West of Sumatra, we present on Figure 23, the expected habitat of the fishes during three periods of the year. Habitat is very deep from August to January, between 100 .m and 200 m, near 1U" S and during these seasons, we cari expect better catches using deep longline gears. In March-April, the habitat is wider between 5" N and 5' S (50 - 190 m) than in the Southern area (50 and 120 m). SO deep longlinè gears could be used more successfully in the North and subsurface gears in the Southl.
1. March -April 1001
2001 .
300 I 5’ N 0’ S’S 109s
2. Aug.- Sept
3. Nov.- Jan.
Figure 23 - Schematic representation of the thermocline and oxycline
structures between 0' and 15"S, by 920-950E. Data from Diamantina (l),
Vitiaz (2) and Koyo Maru (3). (Atlas II o E, 1971).
- Représentation schbatique de la structure de la thermocline et de
1 ‘oxycline entre 0" et 15”s par 92"-95"E. Donnees du Diamantina (l),
Vitiaz (2) et Koyo Maru (3). (Atlas II o E, 1971).
'in the area South of Java, depth of bigeye habitat range between 100 to 160 m in February near the toast, becoming deeper more to the South. In July, because of the strong coastal upwelling along toast of Java and Bali, it is located more to the South 11” S to 15O S ranging there from 100 m to 250 m.
- 38 -
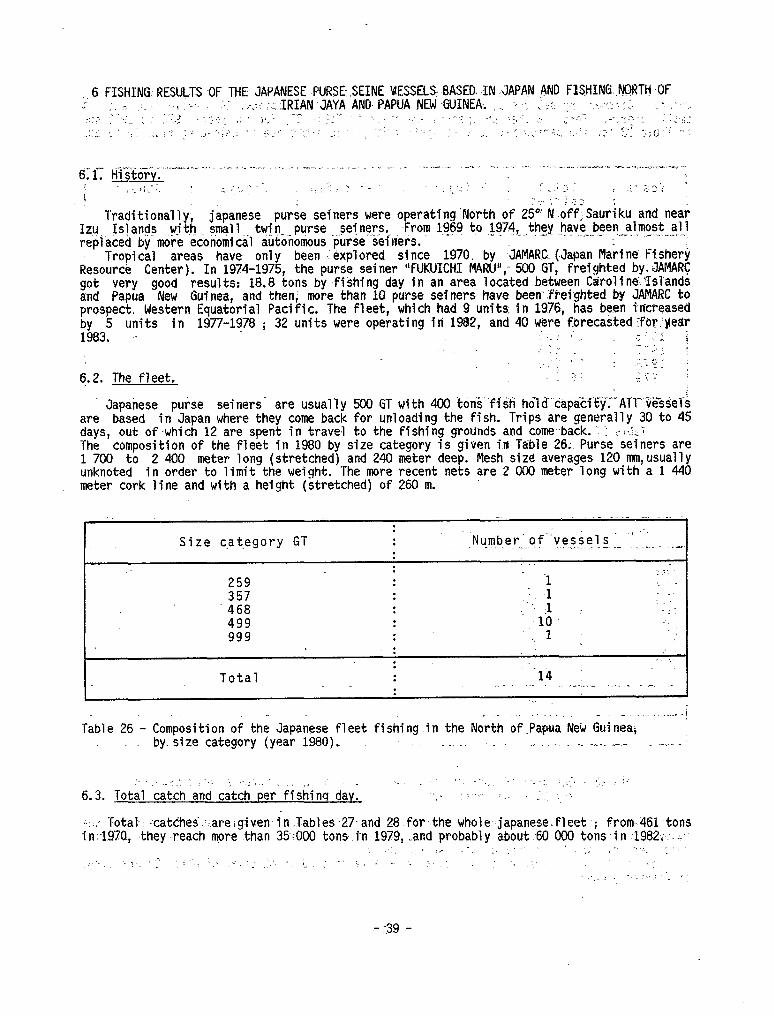
.:6 FISHING. RESULTS OF THE.JAPANESE PURSESEINE \aESSELSBASED.IN-JAPAN AND FISHINGNGRTH OF 7 i ->'. .; : .., ,..'_ ..~ ._:.- :.:-IRIAN ,JAYA AN0 PAPUA NEW GUINEA. _ i r; ':-: L : ., . : .ld .L -. -, .' -,. ,_: :.: -I-*.: : : :.':,; - . . -, .-e . ,~ .;- Y. . ~: .- -_ L /...,, -.;,Y : : ,i,: :. .' -;> ',_,_ ._ 1.. . 1 ..'Z -: ._ _ '" 1 . . : z3 - .$ ; -- _ Y ,. : ,_ _ _ _, I . . r r 1 ;, :, .- ~ r ;, _ --. I (j .'
-, ” _., 1 -’ ] -: ?
Traditionally, japanese purse seiners were operating'North of Z!? N-.off:Sauriku and near Izu.. ?S!a@s with small twin__purse 2einerstc From 1969 t,o 1974,-they bave-.been_almost a11 replaced by more economical autonomous purse selliers.
- .- _ -_-, -.:
Tropical areas have only been .'explored since 1970. by JAMARG (Japan Marine- Fishery Resource Center). In 1974-1975, the purse seiner "FUKUICHI MARU"; 500 GT, freighted by;JAMAR< got very good resul tsi 18.8 tons by -fishing day in an area located between CarolinePslands and Papua New Guinea, and then; more than 10 purse seiners have been.freighted by JAMARC to prospect. Western Equatorial Pacifie. The fleet, which had 9 units in 1976, has been increased Fi,35 units in 1977-1978 i 32 units were operating in 1982, and 40 were forecasted:for:Mear
-. . -r : , -: ,j.^ : ._ ^ : _ -' --:. 8 . . . . . .' - f. 1 _: : ,'-,. y, _ : 6.2. The fleet. - .>- . .- :: ' _
Japanese purse seiners- are usually 500 GT with 400 tonS%'fisti hóld.CaPa«-~~.~--~'T'VesSels are based in Japan where they corne back for unloading the fish. Trips are generally 30 to 45 days, out of-which 12 are spent in travel to the fishing grounds and corne-back. : : -i:i,; The composition of the fleet in 1980 by size category is given in Table 26; Purse seiners are 1 700 to 2 400 meter long (stretched) and 240 meter deep. Mesh sizé averages 120 nnn,usually unknoted in order to limit the weight. The more recent nets are 2 000 meter long with a 1 440 meter cork line and with a height (stretched) of 260 m.
- _ ._ _ ~_ _-.. . .
Size cmat.egory 6T : : .Number of'vessels' '..‘ _ . ,. ‘__ . ~, ~_.. ~_- . .._ .~,_._~ _-, : .- . . : - .
259 : ‘1 _ .._ . .
357 . . ‘. 1 '468 : .. ,l . -
499 : -. .lO. :
999 : *. 1 : : :
Total : -14 ,. ,_~^._ ._. ? . I. ._ : ..- .~ . .._ -. . _~ - _ _ .li ..~ . . j *
Table 26 - Composition of the Japanese fleet fishing in the North of.Papua New Guinea; by size category.(year 1980). _ _I ., _~...-_-. _-- ------
. . _ . _ ;, 1 -,-.
6.3. Total 'catch and catch 'per‘ fishinq dav. " :. :. -. ‘.> ::
."<._ ; .: _ '. ..
&, ;’ Total' --catches:tareigiven in:Tables"27-and 28.for the whole japanese.fleet.; from 461tons in:-1970, they.reach more than 35GOO tons in 1979, .and probably about -60 000 tons in -1982:.“.-:
: : ,: -- : < :. : ,; ).. 1.2. _ -- L .l : . . : : :’ .
. <.. _: j’
- .-39 -
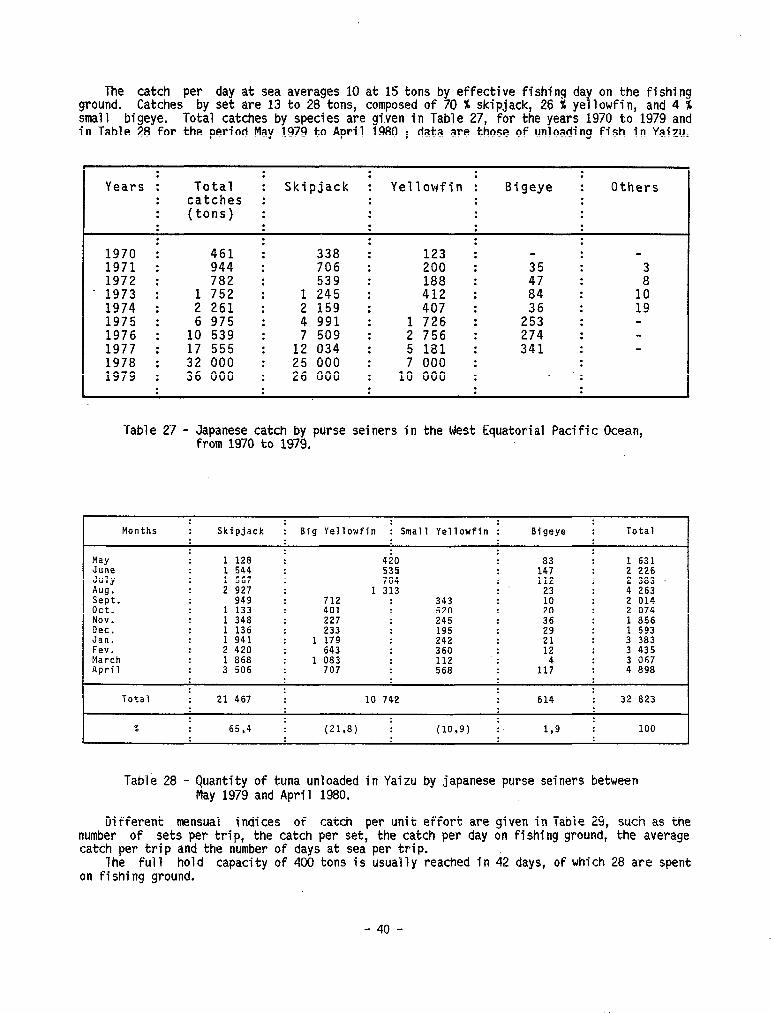
The catch per day at sea averages 10 at 15 tons by effective fishing day on the fishing ground. Catches by set are 13 to 28 tons, composed of 70 X skipjack, 26 % yellowfin, and 4 % small bigeye. Total catches by species are given in Table 27, for the years 1970 to 1979 and in Table 28 for the period May 1979 to April 1980 i data are those of unloading fish in Yaizu.
; Total I Skipjack i
; Years : Yellowfin : Bigeye I Others
: catches : . . : : : (tons) : : : : : : : : : : .
; : : :
1970 : 461 338 : 123 : - :
1971 : 944 : 706 : 200 : 1972 : 782 : 539 : 188 : :; : : 8 - 1973 : 1 752 : 1 245 : 412 : : 10
1974 : 2 261 : 2 159 : 407 : 3;
: 19 1975 : 6 975 : 4 991 : 1 726 : 253 : - 1976 : 10 539 : 7 509 : 2 756 : 274 : - 1977 : 17 555 : 12 034 : 5 181 : 341 : - 1978 : 32 000 : 25 000 : 7 000 : : 1979 : 36 000 : 26 000 : 10 000 : ‘. .
. . : : : :
Table 27 - Japanese catch by purse seiners in the West Equatorial Pacifie Ocean, from 1970 to 1979.
I Months Skipjack : Big Yellowfin : Small Yellowfin : Bigeye : Total
MaY 1 128 410 1:: 1 631 June 1 544 535 2 226 July 1 567 704 112 : 2 383 Aug. 2 927 1 313 23 4 263 Sept. 949 712 343
:i 2 014
oct. 1 133 401 520 2 074 Nov. 1 348 227 245 36 1 856 Dec. 1 136 233 195
;: 1 593
Jan. 1 941 1 179 242 3 383 Fev. 2 420 : 643 360 12 3 435 March 1 868 1 083 112 3 067 April 3 506 707 568
113 4 898
Total 21 467 10 742 614 32 823
% 65,4 (21.8) i (10,9) i 1,g 100
Table 28 - Quantity of tuna unloaded in Yaizu by japanese purse seiners between May 1979 and April 1980.
Different mensual indices of catch per unit effort are given in Table 29, such as the number of sets per trip, the catch per set, the catch per day on fishing ground, the average catch per trip and the number of days at sea per trip.
The full hold capacity of 400 tons is usually reached in 42 days, of which 28 are spent on fishing ground.
- 40 -
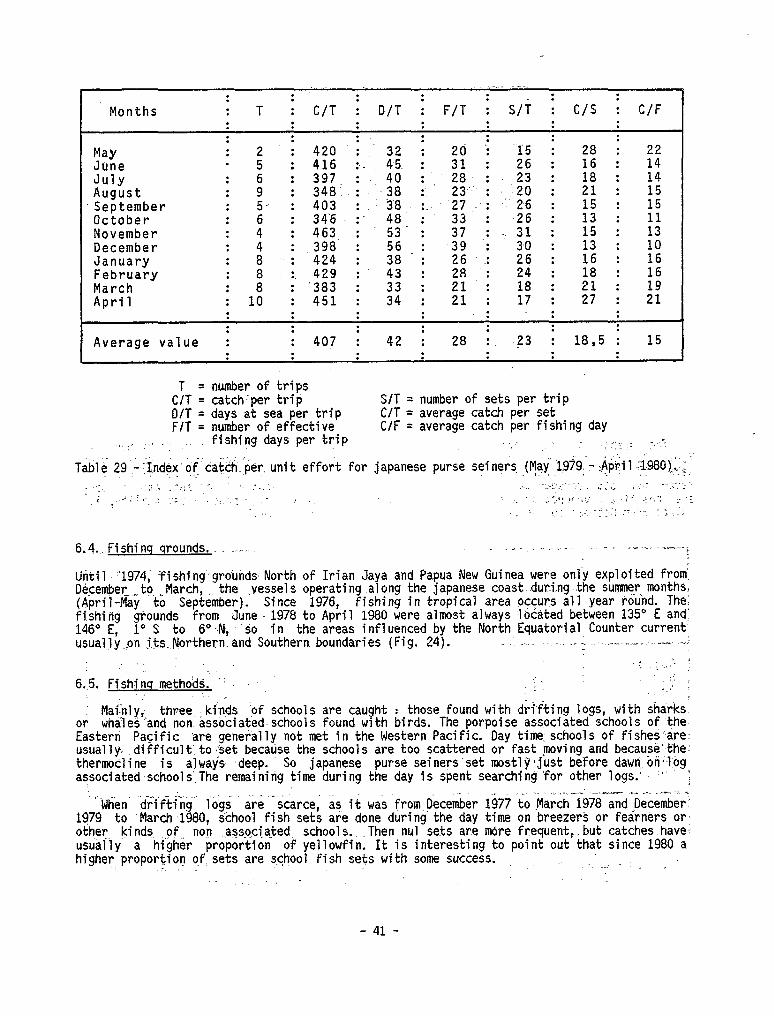
: : : . : : : Months : T : C/T : D/T ; F/T : S/i : C/S : CIF
: : : . . . . . . : : . : :
; 420 : 32 : : : :
W : ; ‘. : : Jiine . ri : 41.6 1. 45. : :1 I :z- : :5 : :4’ July : : 397 : 40 : ‘, 28 : 23 : : August : 9 * 348: : 38 :
'September : 5.. ; 23” : ‘20 : :Y : :z
403 : 38 ::. 27 : -26 : . October :
4" : 34’6 :‘ 48 : .
3: ;.. . :3” I :1
November . . : 463. : --53’ : :1” I 15 : 13 December :
ii : -398 : . -39 :
:8 ; 26 : 3.0 : : 10
January : : 424 : : :“6 : 16 February : 8 :. 429 : 43 : :
;l : -2 : :
March : 8 : ‘383 : . 3: I 21 :
: :Y, : :9 April : 10 : 451 : :!: : 27 : 21
: : : : : : . . : : : : . :
Average value : : 407 : 42 : 28 ;, .?3 : :
18,5 : 15 : . : : . . . : :
T = number of trips GIT = catch'per trip S/T = number of sets per trip D/T = days at sea per trip C/T = average catch per set F/T = number of effective CIF = average catch per fishing day
'.-:'. ,..' fishing days per trip ,..5. : ./-. . . .-
Table 29--:$dex,of catch'per unit effort for japanese purse seiners. (mayi979L-- $p$l$986)~~~~;" _ . . : ;i '. 1 ri ', - -. :. ,- , : ,._ ",,AzLo :.-" .i;,, .- .'.;...'L .i t"-':i,' . . -:, - ‘ '.,‘ ,/ ,.!I' $ _: ;.: _:/.-, ~.-.-
.a !,- _ -. . ~_ -: _I . :,,, :-, 1 .:
6,4,.Fishinq qrounds. _ _ ._- ~, _.,~ -1 .-.I, -~_~ -.* i --GV.--..
Until~~"1974, fishing',grounds North of Irian Jaya and Papua New Guinea were only exploited From' December-_to _Ma@. the .vessels operating.along the japanese coast..duringthe summer,,monthsl (April-May to September). Since 1976, fishing in tropical area occurs a11 year round. Thel fishing qrounds from June 1978 to April 1980 were almost always located between 135' E and: 146' E, 1' S to 6".-N, 'SO in the areas influenced by the North Equatorial Counter current usually.Yon i.fs,.Northern and Southern. boundaries (Fig. 24). __.. I__ ,-- .--- -i
- .; ‘,-. 8
6.5. Fishinq metho& .' 1 ,: : _: ..<-
Mainly- or
three kinds ‘of schools are caught : those found with drifting logs, with sharks whales“and non associated schools found with birds. The porpoise associated schools of the
Eastern Pacifie are generally not met in the Western Pacifie. Day time. schools of fishes'are- usually difficult to.set because the schools are too scattered or fast moving and because'the: thermocline is always deep. SO japanese purse seiners'set mostly*just before dawn on;l:og% associated schools'.The remaining time during the day is spent searching 'for other legs: " i
c .- .~ -"When‘ drifting' legs are esscarce~ as it was from December 1977 to ma,Ch-isi81an9.~écember'
1979 to 'March ~1980, school fish sets are done duringthe day time on breezers or fearners or, other kinds, of.. non .asso.ci,ated schools. Then nul sets are more frequent,.but catches.havel ustially a higher proportion of yellowfin. It is interesting to point out that since 1980 a higher proportion of. sets are school fish sets with some success. _ 2 : -.;... _ .
"
- 41 -
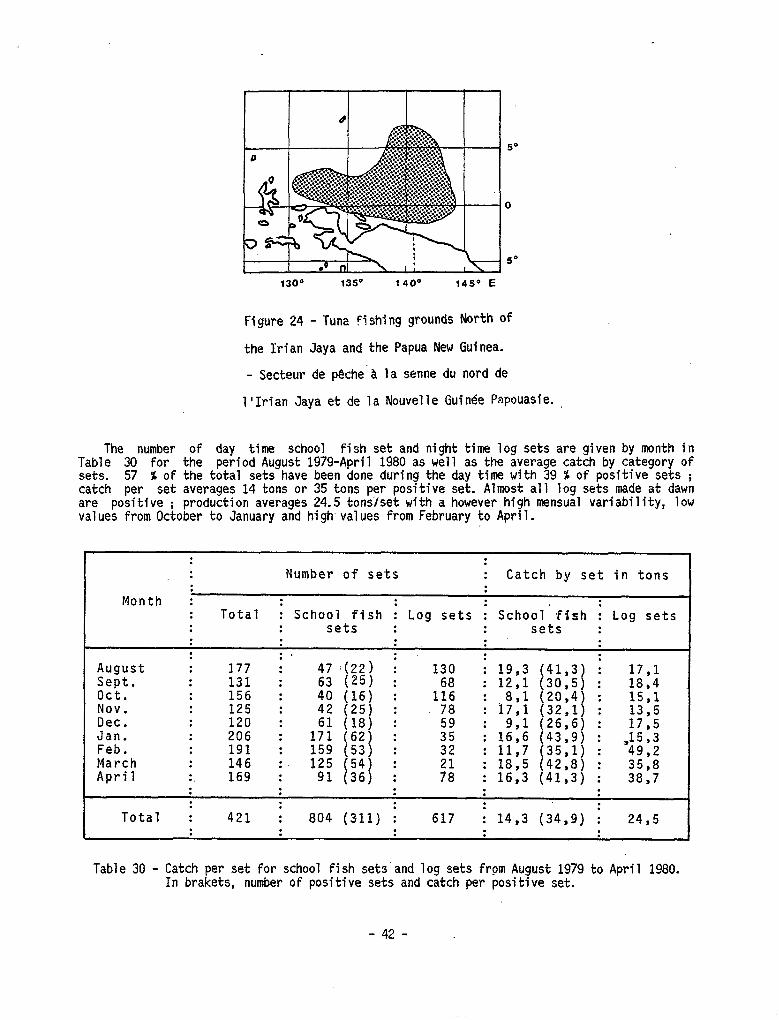
1300 1350 1400 145O E
Figure 24 - Tuna fishing grounds North Of
the Irian Jaya and the Papua New Guinea.
- Secteur de pêche-a la senne du nord de
l'Irian Jaya et de la Nouvelle Guinée Papouasie.
The number of day time school fish set and night time log sets are given by month in Table 30 for the period August 1979-April 1980 as well as the average catch by category of sets. 57 X of the total sets have been done during the day time with 39 % of positive sets ; catch per set averages 14 tons or 35 tons per positive set. Almost a11 log sets made at dawn are positive ; production averages 24.5 tons/set with a however high mensual variability, low values from October to January and high.values from February to April.
. . :
. . Number of sets . . Catch by set in tons
. Month I
: .
Total I : . :
: School fish : Log sets i School'fish : Log sets : : sets : : sets : : : : : :
August Sept. oct. Nov. Dec. Jan. Feb. March April
: 156 : 40 : 125 : 42 : 120 : : 206 : 13: : 191 : 159 : 146 :. 125 . . . 169 : 91
. . : : . . : : : 18,5 . . El : 16,3
: 41,3) : 17,l 30,5) : 18,4 20,4) : 15,l 32,l) : 13,5 26,6) : 17,5 43,9) : 35,l) :
-1533 49,2
42,8) : 35,8 41,3) : 38,7
: : : : I . . .
Total I : :
421 : 804 (311) : 617 ; 14,3 (34,9) I 24,5 : : : : :
Table 30 - Catch per set for school fish sets'and log sets frpm August 1979 to April 1980. In brakets, number of positive sets and catch per positive set.
-42- .
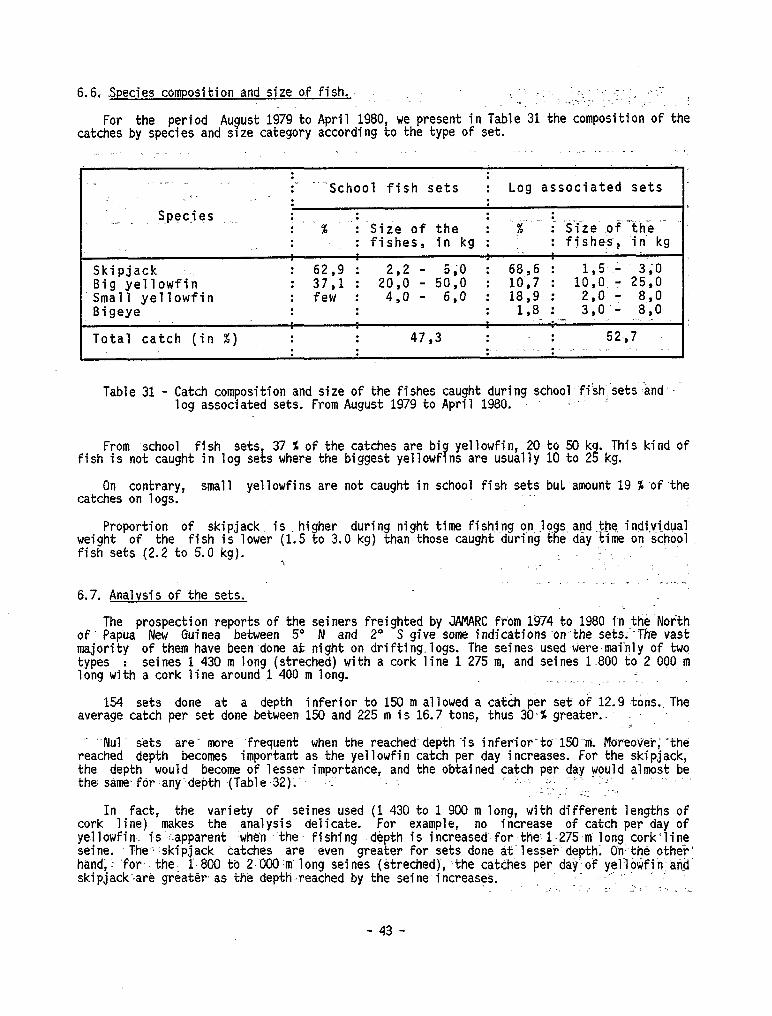
6.6; Species composition and size of fish. ._ '. ._ :; _ : _- I <, _~ .~=
For the period August 1979 to April 1980, we present in.Table- the composition of the catches by species and slze category according to the type of set.
: : _1 . . -. .~- : School fish sets : Log associated sets . . : :
__ . Species __~ : : : . : % -: -Size of the : %- -. i 'Size .of '-thé -~ : : fishes, in kg : : fjshes? -in‘ kg
Skipjack Big yellowfi'n
: 62,9 : * 37,l : I
2x -5;0; _ 1,5’, A 3.;o
- 50,O 68,,6 I
: Small yellowfin few : 4:O - 6,0 :
10,7 : lO,O,- 25,0 18,9 : 2,0 - 8,0
Bigeye : : : 1,8 : ,~. . . .II 3,0’- 890
Total catch (in X) : . . 47,3 : : 52.,7 . . : . . e-_..m.. ._ --. . .
Table 31 - Catch composition and size of the fishes caught during school fish'setssand.~- log associated sets. From August 1979 to April 1980. I ~.. '.
From .school fish sets, 37 X of the catches are big yellowfin, 20 to 50 k.. This kind of fish is not caught in log sets where the biggest yellowflns are usually 10 to 2 s; kg.
On contrary, small yellowfins are not caught in school fish sets bu1 amount19 % ofthe catches on logs.
Proportion of skipjack is higher during night time fishing on lqgs.and&a. individua weight of the fish is lower (1.5 to 3.0 kg) than those caught during the day time on school fish sets (2.2 to 5.0 kg). - _
'i .:
6.7. Analvsis of the sets. . _ _ - . .
The prospection reports of the seiners freighted by JAMARC from 1974 to 1980 in the'North of. Papua New Guinea between 5" N and 2" S give some indications‘on-the sets;'-The vast majority of them have been .done at night on drifting.logs. The seines used+jere.mainly of two types : seines 1 430 m long (streched) with a cork line 1 275 m, and seines 1.800 to 2 000 m long with a cork line around 1 400 m long. .__.~.~ .
154 sets done at a depth inferior to 150 m allowed a catch per set of 12.9 tons..The average catch per set done between 150 and 225 m is 16.7 tons, thus 307% greater..
Nul' séts are- more- frequent when the reached depth is inferior-to'15Gm. Moreovei;"fhë reached depth becomes important as the yellowfin catch per day increases. For the skipjack, the depth would become of lesser importance, and the obtained catch per day would almost be the same~.for.any‘depth (Table.32); ..: '. -. ;. _ -. ..:.-.
..- ,_ _-.- -_. .: In fact, the variety of seines used (1 430 to 1 900 m long, with different lengths of
cork line) makes the analysis delicate. For example, no increase of catch per day of yellowfin. is:-apparent whën 'the' fishing dépth is increased for'the 1.275 m long cork'line Seine. The,' skipjack catches are 'even greater for sets done at'lesser=depth; On: thè other; hand;: 'for .the. I-800 to 2 'WG:m long seines (streched), the catches per day';of yelloWfin:-and skipjack',are greatër~as the depth-reached by the Seine increaseh. _ - - -. .. i : ., ,_,
- 43 -
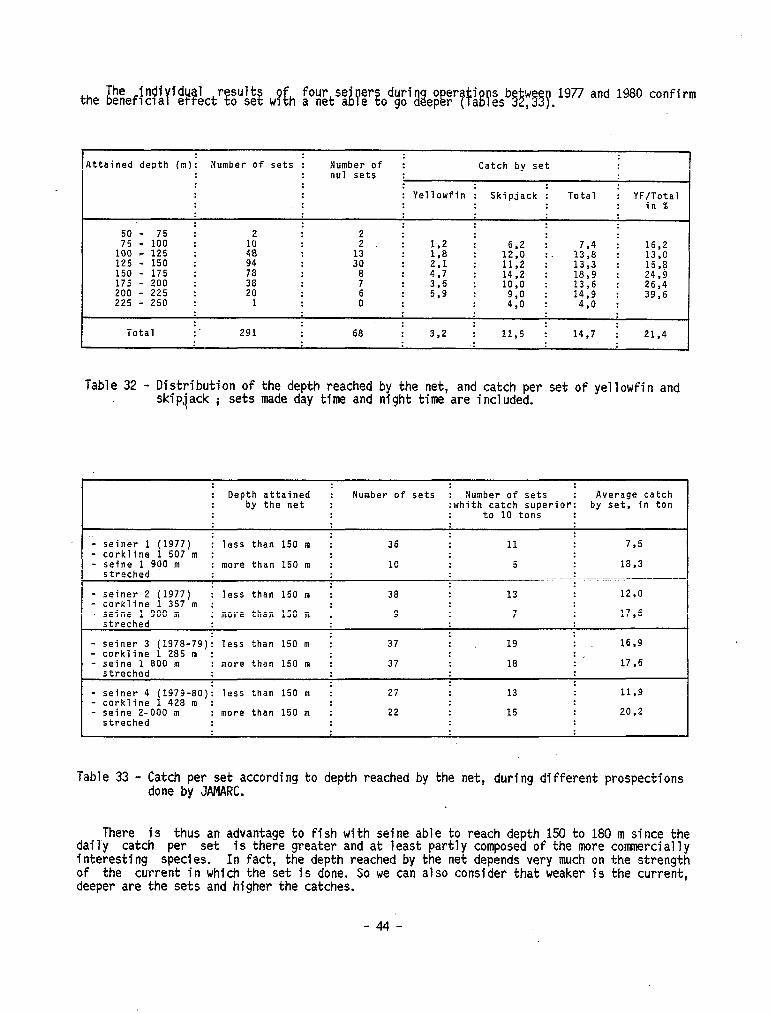
the beneficia e ect o se wi h a net a e o go The indilidrz#l r&sul$ 9{ four se),ferg duria~,ps~rtfgee,bs~~sp.19n and 1980 confirm
Attained depth (m)i Number of sets : Number of : nul sets
Catch by set :
: Yellowfin : Skipjack : Total : YF/Total in %
: 50 - 75 : 2
12 - - 125 100 : : ii 2. i 1.2 : 6,2 12,0
I :. 128 16.2 :
125 - 150 13,0
: 30 :c : Il,2 : 1313 : 150 - 175 : 7': 8 417
15,8 : 14.2 : 18,9 :
175 - 200 24.9
: 2: ii
3.6 : 10,o : 13,o : 200 - 225
26,4 : 5,9 :
225 - 250 : 1 0 ::o” 14.9 : 39,6
: 4,0 :
Total 291 68 i 3,2 : 11.5 : 14,7 : 21.4
Table 32 - Distribution of the depth reached by the net, and catch per set of yellowfin and skipjack ; sets made day time and night time are included.
: Depth attained : Number of sets : Number of sets : Average catch : by the net : :whith catch superior: by set, in ton
to 10 tons
- seiner 1 (1977) : less than 150 m : 36 11 7,5 - corkline 1 507 m : - Seine 1 900 m : more than 150 m : 10 5 18,3
streched
- seiner 2 (1977) : less than 150 m : 38 13 12,o - corkline 1 357 m : - Seine 1 900 m : more than 150 m : 9 7 17.6
streched
- seiner 3 (1978-79): less than 150 m : 37 : 19 : 16,9 - corkline 1 285 m : : , - Seine 1 800 m : more than 150 m : 37 18 17.6
streched
- seiner 4 (1979-80): less than 150 m : 27 13 11,9 - corkline 1 428 m : - Seine 2-000 m : more than 150 m : 22 15 20.2
streched
Table 33 - Catch per set according to depth reached by the net, during different prospections done by JAMARC.
There is thus an advantage to fish with Seine able to reach depth 150 to 180 m since the dail'y catch per set is there greater and at least partly composed of the more comnercially interesting species. In fact, the depth reached by the net depends very much on the strength of the current in which the set is done. SO we cari also consider that weaker is the current, deeper are the sets and higher the catches.
-44-
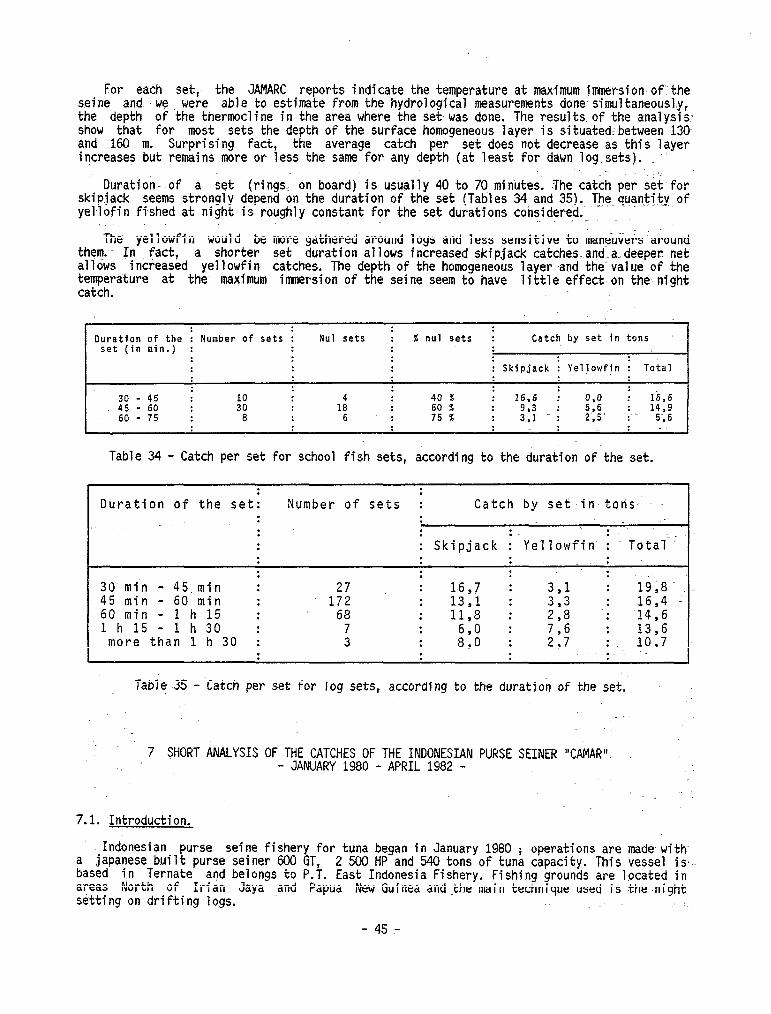
For each set, the JAMARC reports indicate the temperature at maximum immersion of'the Seine and we were abie to estimate from the hydrological measurements done simultaneously, the depth of the thermocline in the area where the set was done. The resultsof the analysis. show that for most sets the depth of the surface homogeneous layer is situatedrbetween 130 and 160 m. Surprising fact, the average catch per set does not decrease as this layer increases but remains more or less the same for any depth (at least for.dawn log.sets). .'
Duration- of a set (rings, on board).is usually 40 to 70 minutes. The catch per set for skipjack seems strongly depend on the duration of the set (Tables 34 and 35). The-quantity of yel-lofin fished at night is roughly constant for the set durations considered. . .
The yellowfin them. In fact,
.would be more gathered around logs and less sensitive to manëuvers-around a shorter set duration allows increased skipjack catches.andla-deepec net
allows increased yellowfin catches. The depth of the homogeneous layer and the value of the tempertiture at the maximum immersion of the Seine seem to have little effect on the night catch.
Duration of the : Number of sets : Nul sets : % nul sets : Catch by set in tons set (in min.) :
: Skipjack : Yeljowfin : Total
: is - - 45 60 3: la 40 60 % % : 16.6 :
- 60 - 75 a : 6 : 75 % : -: -'
Table 34 - Catch per set for school fish sets, according to the duration of‘the set.
Duration of the set: :
Number of sets : Catch by set.in tons- - : . . . -. : . . : : : : Skipjack : Yellowfin : Total-'
. I
: i
: 30 min - 45 min 27 : : 16,7 3,l 45min-60min : 172 : 13,l : : :5y4. 60 min - 1 h 15 : 68 : 11,8 :
;'; .
716 ; 1416
1 h 15 -1h30 : 7 : 6,0 : 13,6 more than 1 h 30 : 3 : 8,0 : 2,7 :. 10,7
Table 35 - Catch per set for log sets, according to the duration of the set.
7 SHORT
7.1. Introduction.
ANALYSIS OF THE CATCHES OF THE INDONESIAN PURSE SEINER "CAMAR"' . - JANUARY 1980 - APRIL 1982 -
Indonesian purse s,eine fishery for tuna began in January 1980 ; operations are made with a ,japanese built purse seiner 600 GT, 2 500 HP and 540 tons of tuna capacity. This vesse1 is: based in Ternate and belongs to P.T. East Indonesia Fishery. Fishing grounds are located in areas North of Irian Jaya and Papua New Guinea and .the main technique used is the-night setting on drifting logs. :.
- 45 7
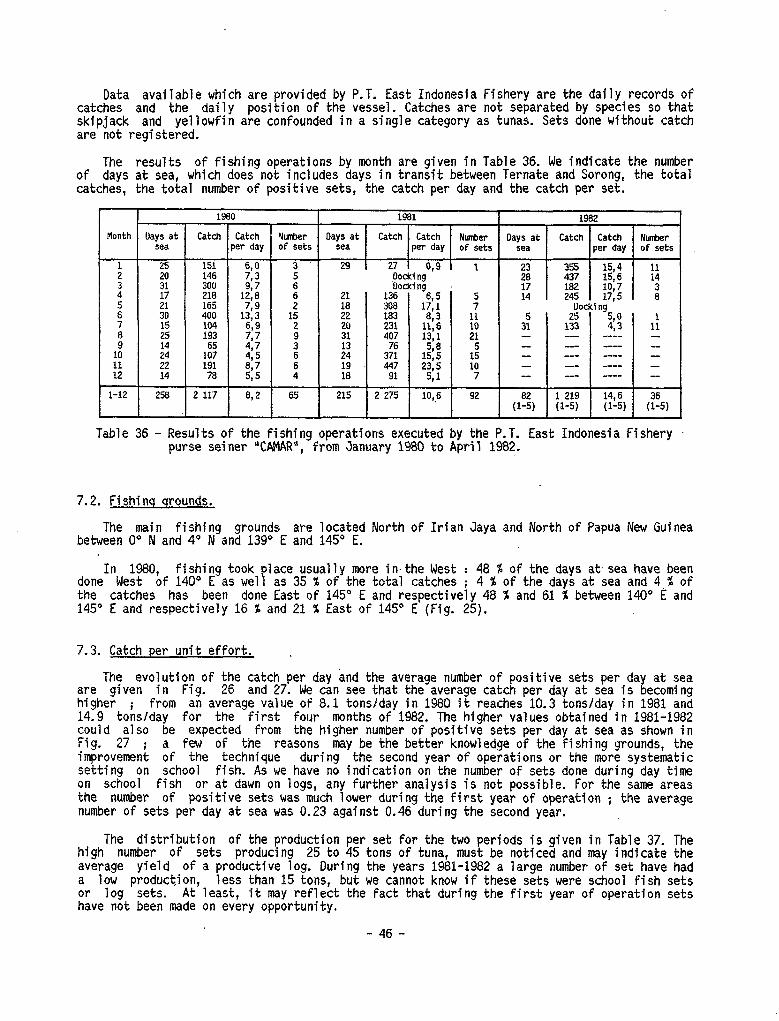
Data available which are provided by P.T. East Indonesia Fishery are the daily records of catches and the daily position of the vessel. Catches are not separated by species SO that skipjack and yellowfin are confounded in a single category as tunas. Sets done without catch are not registered.
The results of fishing operations by month are given in Table 36. We indicate the number of davs at sea. which does not includes davs in transit between Ternate and Soronq, the total catches, the total number of positive sets,-the catch per day and the catch per set; catches, the total number of positive sets,-the catch per day and the catch per set;
1980 1980 1981 1981 1982 1982
Month Uays at Month Uays at Catch Catch Catch Catch Qmber Umber Days at Days at Catch Catch Catch Catch Number Number Days at Days at Catch Catch Catch Catch Number Number sea sea per day per day of sets of sets sea sea per day per day of sets of sets sea sea per day per day of sets of sets
: : 25 25 151 146 151 146 ::i ::i 3‘ 3‘ 29 29 27 0,9 27 0,9 1 1
31 31
28 28 % :x % :x :i :i
: : 30 ii 30 ii
300 218 300 218 6 5 6 5
Docking Docking
128' 128’ 17 17 5 5 400 165 400 165 1;:: 1;:: 15 15 22 2 22 2
136 Docking 136 Docking 308 183 14:: 308 183 14::
la2 10:7 182 10:7 5 5
14 14 245 17,5 245 17,s 8 8 Docking Docking
7 7 ii ii
:5 :5 :F3 :F3 $3 $3 231 1% 231 1% :li :li 31 31 50 50
9 9 20 20 1: 1: 31 31 455 13;1 455 13;1 21 21 - I
1% 53 1% 53 -- -- -- -- 14 14
10 10
22 14 22 14
1:: 1:: 4s 4s
3 3
i: i: 371 151; 371 151; 1; 1; II II 1 ::II 1 ::II II II
:: :: 191 78 191 78 0:7 0:7 5,s 5,5 4 i 4 i 19 ia 19 ia 447 91 23;s 447 91 23;s 5,l 5,l 10 7 l,, 7 -- -- -- -- -- v-w m--m --- -- v-w m--m --- -- -- -- --
1-12 1-12 258 258 2 2 117 117 EI,2 EI,2 65 65 215 215 2 2 27s 10,,6 27s 10,,6 92 92 (15, 1 1 219 14,6 219 14,6 (r-5) (r-5) (l-5) (l-5) (15) (15)
Table 36 - Results of the fishing operations executed by the P.T. East Indonesia Fishery purse seiner V#AR", from January 1980 to April 1982.
Table 36 - Results of the fishing operations executed by the P.T. East Indonesia Fishery purse seiner V#AR", from January 1980 to April 1982.
7.2. Fishinq qrounds.
The main fishing grounds are located North of Irian Jaya and North of Papua New Guinea between 0" N and 4' N and 139" E and 145' E.
In 1980, fishing took place usually more in-the West : done West of 140" E as well as 35 % of the total catches ;
48 % of the days at sea have been 4 % of the days at sea and 4,% of
the catches has been done East of 145' E and respectively 48 % and 61 % between 140" E and 145 E and respectively 16 % and 21 % East of 145' E (Fig. 25).
7.3. Catch per unit effort. .
The evolution of the catch per day and the average number of positive sets per day at sea are given in Fig. 26 and 27. We cari see that the average catch per day at sea is becoming higher ; from an average value of 8.1 tons/day in 1980 it reaches 10.3 tons/day in 1981 and 14.9 tonslday for the first four months of 1982. The higher values obtained in 1981-1982 could also be expected from the higher number of positive sets per day at sea as shown in Fig. 27 i a few of the reasons may be the better knowledge of the fishing grounds, the improvement of the technique during the second year of operations or the more systematic setting on school fish. As we have no indication on the number of sets done during day time on school fish or at dawn on logs, any further analysis is not possible. For the same areas the number of positive sets was much lower during the first year of operation i the average number of sets per day at sea was 0.23 against 0.46 during the second year.
high The distribution of the production per set for the two periods is given in Table 37. The
number of sets producing 25 to 45 tons of tuna, must be noticed and may indicate the average yield of a productive log. During the years 1981-1982 a large number of set have had a low production, less than 15 tons, but we cannot know if these sets were school fish sets or log sets. At least, it may reflect the fact that during the first year of operation sets have not been made on every opportunity.
- 46 -
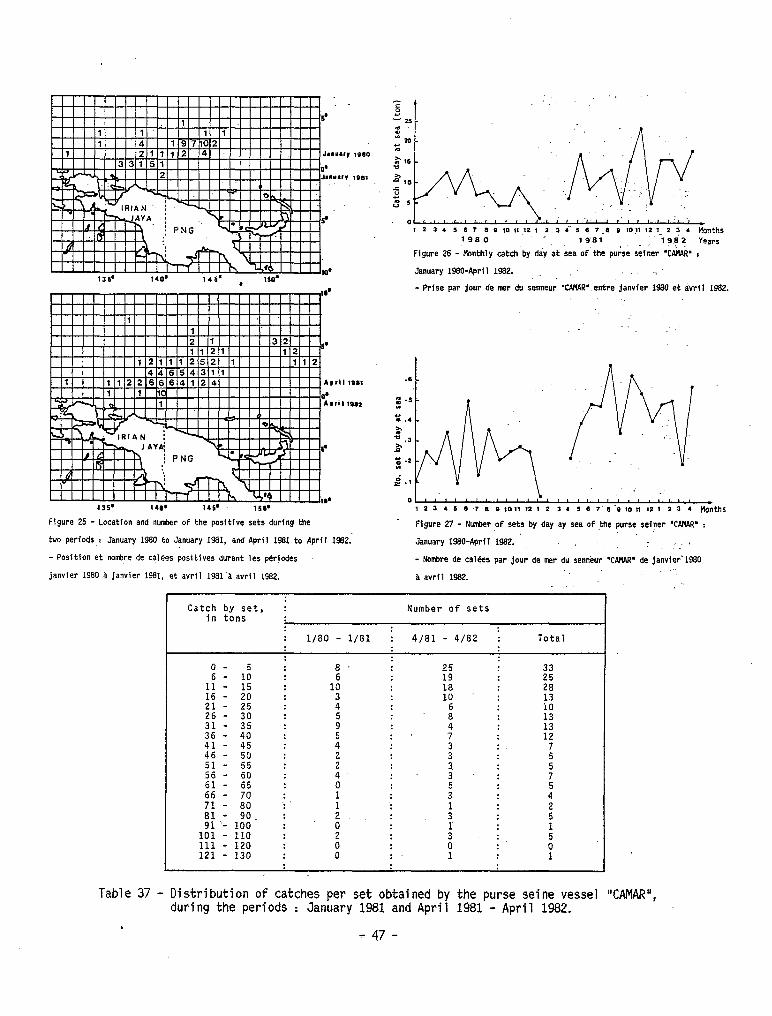
Iril
* r < , , < < , , I., , 2, i < >-1.1 > >-, > , I ,‘< ,
t2145.I.O,0‘,12,2.li^r.7.4O10~1~2~~2?.)r~nths
1980 _
1981 ̂ . ‘9$2 years
Figure 26 - tinthly catch by dây at sea of'the pu& seiner *CA&* :
January MO-April 1962.
- Prise par jour de mer du senneur 'CAï4AR" entre janvfer 1980 et avrfl 1962.
1011
1912
Figure 25 - Location and nu&er of the positive sets durlng the Ffgure 27 - NuMer of sets by day ay sea of the purse M?er 'C#AR' : 1 .
tvo periods,: January 1980 to January 1981, and April 196l.ta April 1962.
- Position et nombre de calees positives durant les périodes
janvier 1960 a janvier 1961, et avril 1961‘b avril 1962.
January lSBO-Aprfl 1962. .* _,~_'
- Notire de cai&s par jour de mer du sennéur ‘CAMAR’ de janvler.1980
a avril 1962.
Catch by set, : in tons
Number of sets
: 1/80 - 1/81 : 4101 - 4182 - Total
o- 5 a . 25 6- 10 6 19 2
:: - :o 10 3 18 10 : 28 13 21 - 25 4 i0 26 - 30 5
86
2 - -35 40 : ; : ’ 7 4 :; 12 :5 - - 45 50 4
;
3 3 7
51- 55 3 2 51 - - 60 65 4 0 : 3 : 7
71 - - 80 70 : 3” 1 4
81 - 90. : 3 : 91 .- 100
fl 1
101 - 110 111 - 120
: i 5’ 0
121 - 130 : 0 1 1
Table 37 - Distribution of catches per set obtained by the purse Seine vesse1 YAMAR", during the periods : January 1981 and April 1981 - April 1982.
- 47 -
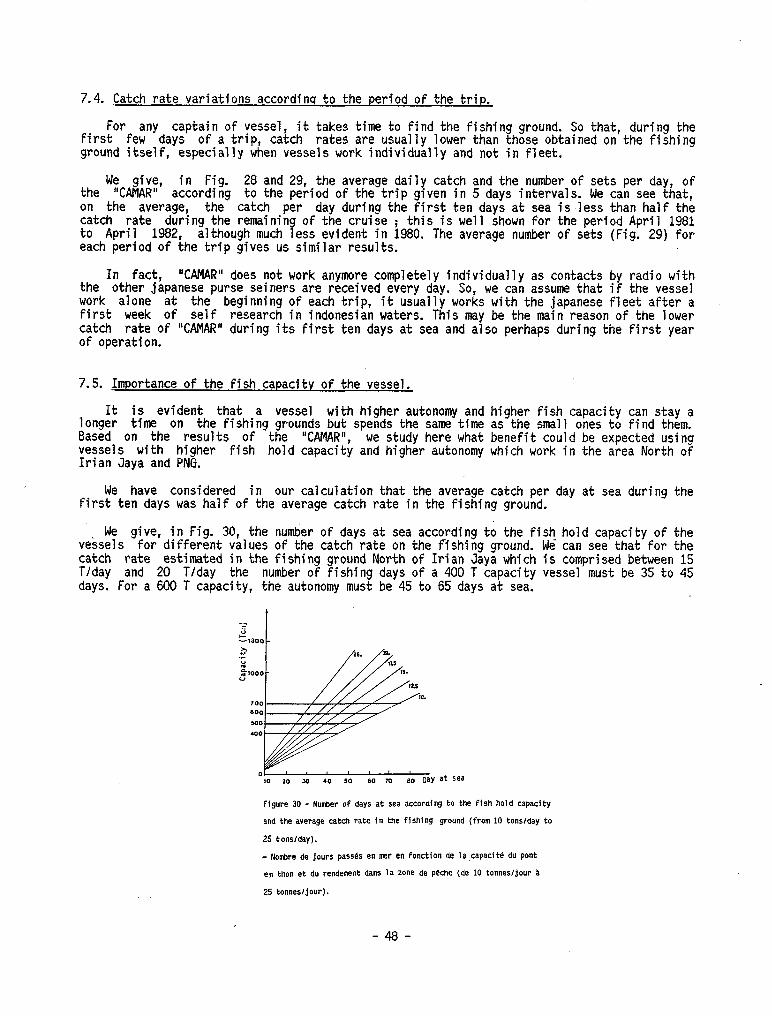
7.4. Catch rate variations accordinq to the period of the trip.
For any captain of vessel, it takes time to find the fishing ground. SO that, during the first few days of a trip, catch rates are usually lower than those obtained on the fishing ground itself, especially when vessels work individually and not in fleet.
We give, in Fig. 28 and 29, the average daily catch and the number of sets per day, of the "CAMAR" according to the period of the trip given in 5 days intervals. We cari see that, on the average, the catch per day durins the first ten days at sea is less than half the catch rate during the remaining of the cruise to April 1982,
; this is well shown for the period April 1981 although much less evident in 1980. The average number of sets (Fig. 29) for
each period of the trip gives us similar results.
In fac!, YAMAR" does not work anymore completely individually as contacts by radio with the other japanese purse seiners are received every day. SO, we cari assume that if the vesse1 work alone at the beginning of each trip, it usually works with the japanese fleet after a first week of self research in indonesian waters. This may be the main reason of the lower catch rate of YANAR" during its first ten days at sea and also perhaps during the first year of operation.
7.5. Importance of the fish capacitv of the vessel.
It is evident that a vesse1 with higher autonomy and higher fish capacity cari stay a longer time on the fishing grounds but spends the same time as the small ones to find them. Based on the results of the "CAMAR", we study here what benefit could be expected using vessels with higher fish hold capacity and higher autonomy which work in the area North of Irian Jaya and PNG.
We have considered in our calculation that the average catch per day at sea during the first ten days was half of the average catch rate in the fishing ground.
We give, in Fig. 30, the number of days at sea according to the fish hold capacity of the vessels for different values of the catch rate on the fishing ground. Wé cari see that for the catch rate estimated in the fishing ground North of Irian Jaya which is comprised between 15 T/day and 20 T/day the number of fishing days of a 400 T capacity vesse1 must be 35 to 45 days. For a 600 T capacity, the autonomy must be 45 to 65 days at sea.
2 .r Y x u 1000
100
000
SO0
.oo
10 20 30 .o SO a0 70 80 OaY at sea
Figure 30 - Nuuixer of days at sea according to the fish hold capacity
and the average catch rate in the Fishing ground (From 10 tons/day to
25 tons/day).
- Notire de jours pas.%% en mer en fonction de la,capacite du pont
en thon et du rendemnt dans la zone de peche (de 10 tonnesljour &
25 tonnesljour).
- 48 -
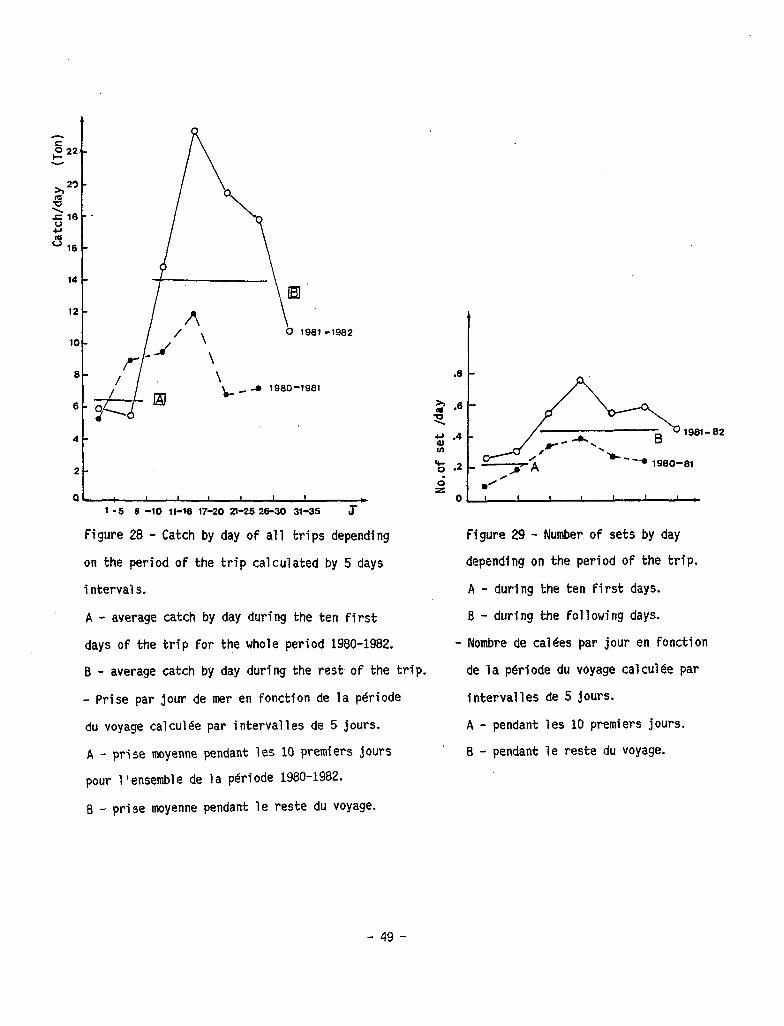
14 -
12 -
-1982 lO-
8- .8 1
4-
2-
!;!!;;-82
. ,'
z l ’ Qc I I I 1 1 1 * 0 1 I 1 t t I I
l-6 6 -10 Il-l6 17-20 21-25 26-30 31-35 ;r
Figure 28 - Catch by day of a11 trips depending Figure 29 - Number of sets by day
on the period of the trip calculated by 5 days depending on the period of the trip.
intervals. A - during the ten first days.
A - average catch by day during the ten first B - during the following days.
days of the trip for the whole period 1980-1982. - Nombre de calees par jour en fonction
B - average catch by day during the rest of the trip. de la periode du voyage calculee par
- Prise par jour de mer en fonction de la période intervalles de 5 jours.
du voyage calculde par intervalles de 5 jours. A - pendant les 10 premiers jours.
A - prise moyenne pendant les 10 premierS jOUrS 6 - pendant le reste du voyage.
pour l'ensemble de la periode 1980-1982.
B - prise moyenne pendant le reste du Voyage.
- 49 -
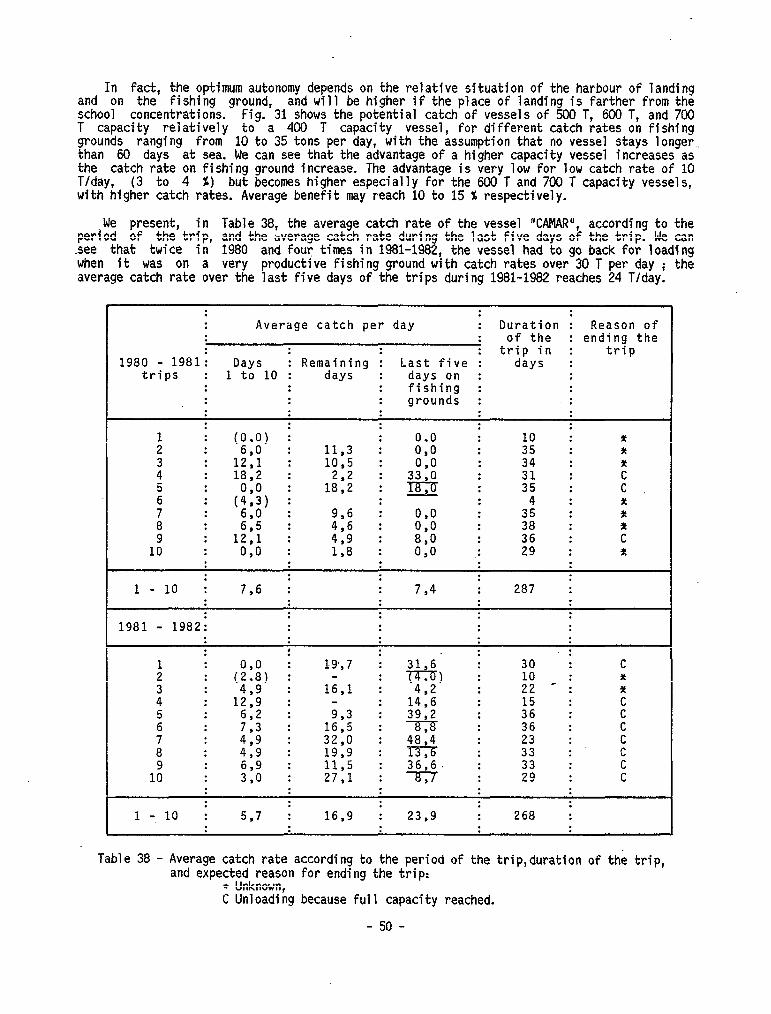
In fact, the optimum autonomy depends on the relative situation of the harbour of landing and on the fishing ground, and Will be higher if the place of landing is farther from the school concentrations. Fig. 31 shows the potential catch of vessels of 500 T, 600 T, and 700 T capacity relatively to a 400 T capacity vessel, for different catch rates on fishing grounds ranging from 10 to 35 tons per day, with the assumption that no vesse1 stays longer., than 60 days at sea. We cari see that the advantage of a higher capacity vesse1 increases as the catch rate on fishing ground increase. The advantage is very low for low catch rate of 10 T/day, (3 to 4 %) but becomes higher especially for the 600 T and 700 T capacity vessels, with higher catch rates. Average benefit may reach 10 to 15 % respectively.
We present, in Table 38, the average catch rate of the vesse1 YAMAR", according to the period of the trip, and the overage catch rate during the last five days of the trip. We cari .see that twice in 1980 and four times in 1981-1982, the vesse1 had to go back for loading when it was on a very productive fishing ground with catch rates over 30 T per day ; the average catch rate over the last five days of the trips during 1981-1982 reaches 24 Tfday.
: : : : Average catch per day : Duration : Reason of : : of the : ending the
1980 - 1981 i : : : trip in : trip
Days : Remaining : Last five : days : trips : 1 to 10 : days : days on : :
: : : fishing : : : : : grounds : : : : : :
: : (yp i
: : : : : 10 : *
: 12:1 :
11,3 : ;a; .
4 : 10,5 : 0:o I
: z4 :
* *
: 18,2 : : : : :
5 : (i$) i 1;:: : g : 35 * :
: : 4 I *
i : .
pi ; :
: 1211 :
42 : 419 :
0:: : :
ii : * x
9 : . 36 : C 10 : 0,o : 1,8 : i:o I 29 : x
: : : :
1 - 10 i 7,6 : : : : : 7,4 : 287 :
: : : :
1981 - 1982: : : : : : : :
: : : : : : : : :
: :
(%i) : 19,7 : 31,O’ 30 : C
: 15 1
; 42’ i : x
4 : :
12:; : -’ : 1416 : :2 - : *
: : 15 : .
5 I :
::: : 15s : 39 2 : 7is
: 36 : c :
z : :
29 : 3210 : 48:4 : 2: : E
: 619 :
19,9 : 13 : 33 : C 9 : 11,5 : 36,6. : :
10 : 3,0 : 27,l : ‘-8;7 : 29 : c : : : : : : . :
1 -. 10 : 5,7 : 16,9 i 23,9 : 268 i : : : : :
Table 38 - Average catch rate according to the period of the trip,duration of thé trip, and expected reason for ending the trip:
* Unknown, C Unloading because full capacity reached.
- 50 -
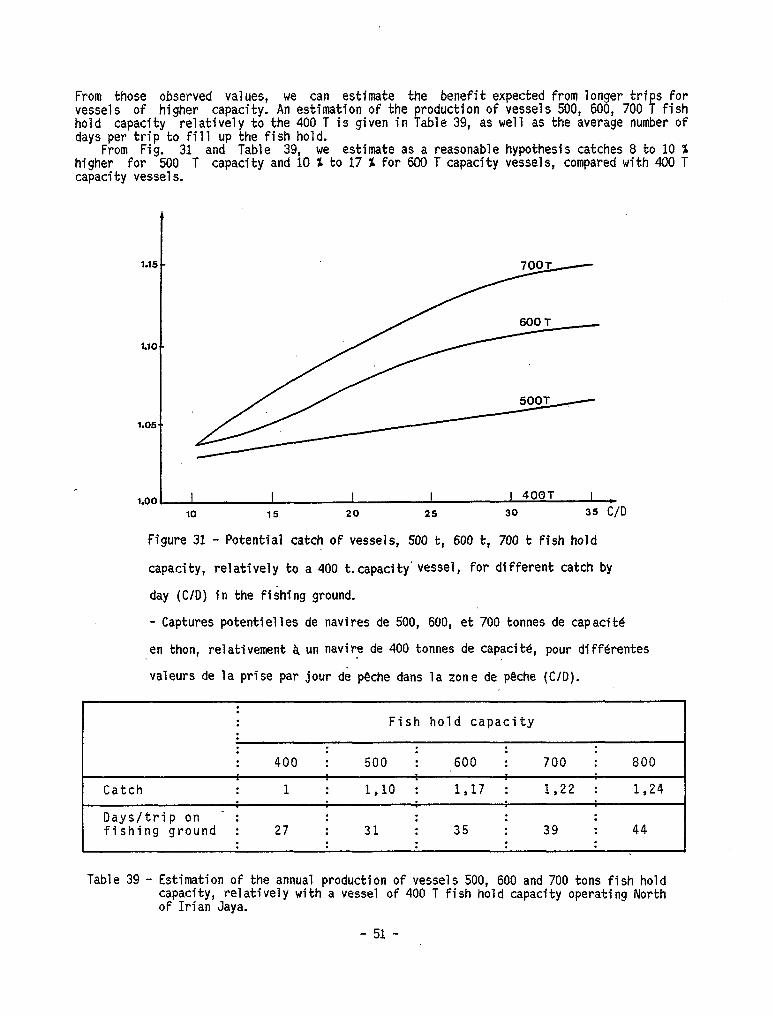
From those observed values, we cari estimate the benefit expected from longer trips for vessels of higher capacity. An estimation of the production of vessels 500, 600, 700 T fish hold capacity relatively to the 400 T is given in Table 39, as well as the average number of days per trip to fil1 up the fish hold.
From Fig. 31 and Table 39, we estimate as a reasonable hypothesis catches 8 to 10 X higher for 500 T capacity and 10 X to 17 X for 600 T capacity vessels, compared with 400 T capacity vessels.
4
1.15 -
1.70 -
1.05..
1.00 l I I I 1 400T I t 10 15 20 25 30 35 C/D
Figure 31 - Potential catch of vessels, 500 t, 600 t, 700 t fish hold
capacity, relatively to a 400 tcapacity vessel, for different catch by
day (C/D) in the fishing ground.
- Captures potentielles de navires de 500, 600, et 700 tonnes de capacité
en thon, relativement a un navire de 400 tonnes de capacité, pour différentes
valeurs de la prise par jour de péche dans la zone de péche (C/D).
; : Fish hold capacity : : : . . . : 400 : 500 I 600 ; 700 I 800 . : : : .
Catch : 1 : 1,lO : 1,17 : 1,22 : 1,24 . .
Days/trip on : . : : : fishing ground : 27 I 31 : 35 : 39 : 44
Table 39 - Estimation of the annual production of vessels 500, 600 and 700 tons fish hold capacity, relatively with a vesse1 of 400 T fish hold capacity operating North of Irian Jaya.
- 51 -
7.6. Conclusion.
Because operations done by purse Seine vesse1 'QVIAR" are very recent, the results must be taken cautiously. Results of the fishing were very poor during the first year of operation in 1980, but much better in 1981 and during the first months of 1982. Based upon this last period, we cari expect for the near future, an average annual production of 2 800 to 3 GOG tons, with 70 % skipjack, 30 X yellowfin for purse seiners of the category of "CAMAR" (600 GT, 430 T fish hold capacity) going 240 days at sea per year and 3 000 to 3 300 tons for vessels 750 GT with 530 tons fish hold capacity and working in fleet.
8 FISHING GROUNDS FOR PURSE SEINERS NORTH OF IRIAN JAYA.
In Figures 32 to 35 (p. 54 8 55), we present the monthly fishing grounds of the Japanese purse seiners North of Irian Jaya and Papua New Guinea front June 1976 to April 1980.
Sets appear generally to be done between 1’ S - 4O N and 135' E - 145"'E, and the fishing areas are usually found on a narrow latitudinal strip with a wide East-West extension. It is why it was expected that the currents which have an East-West direction in this area may be the major factor which determines fishi.ng grounds. We give in Fig. 36, the currents charts North of Irian Jaya established by WYRTKI : the current system is composed of four major currents ; from South to North, we find :
- The current of Guinea : it flows toward South East along the toast of Irian Jaya and Papua New Guinea from November to March and created a strong upwellig along this toast during this period. From March to November, a westward current takes its place.
- The Equatorial current (EC) flows westward at the latitude of the Equator.
- The North Equatorial Countercurrent (NECC) flows eastward North of Equatorial current.
- The North Tropical Current, which flows eastward. .
The boundaries of those currents may change from month to month and from year to.year SO does their strength, according to the strength of the North-East or South-East tradewinds.
* December - February. Th No th W t
Tropical CLrrentesand Pacifie is caracterised by strong tradewinds which reinforce the North
by a secondary effect, the North Equatorial Countercurrent. At the Equator, the tradewihds are replaced by west winds which strengthen the NECC and allow the development of the current of Guinea along Irian Jaya. This latter current may be strong in December-January : 50 to 75 cm/s. The Equatorial Current is weak and eddies may occur North of the Equator. During this period, fishing grounds may be found on the northern boundary of the current of Guinea, usually near the Equator.
*.A ril. +tr e North East tradewinds predominate North of the Equator, shifting toward the South
between Equator and 5" S. TO North of Irian Jaya the current flows westward (25 - 38 cm/s) and the NECC is weak. The fishing grounds seems to occur between Oo and 3" N with a large variability from year to year and are located in the area of the Equatorial Current.
+ June - Au ust. --TE+- ast and South East tradewinds predominate and are very strong South of the Equator
shifting toward North West North of Equator. The Equatorial Current flowing West is strong
- 52 -
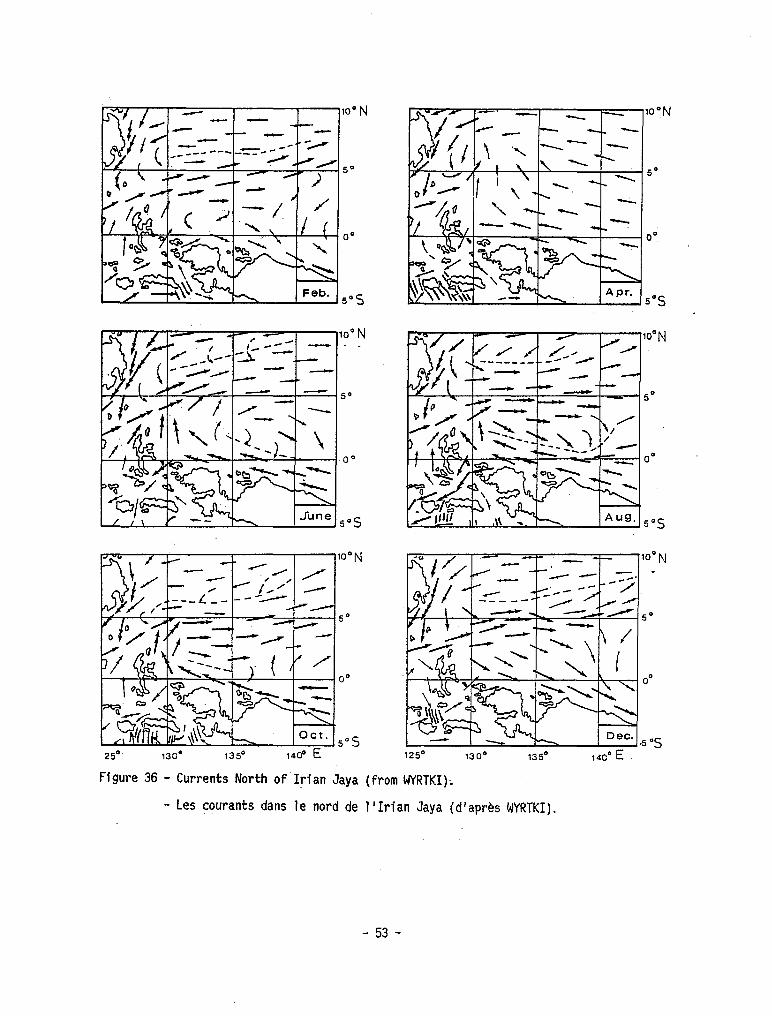
10~ N
- -
~O”N
50
00
50s
L----‘--I- - A---A
25O 130' 139 1400 E 129 130° 13e 14~ E
I+i=/ .r- -1 H I -I I~O”N
l0
“S
Figure 36 - Currents North of ‘Irian Jaya (from WYRTKI);
- Les courants dans le nord de l'Irian Jaya (d'après WYRTKI).
- 53 -
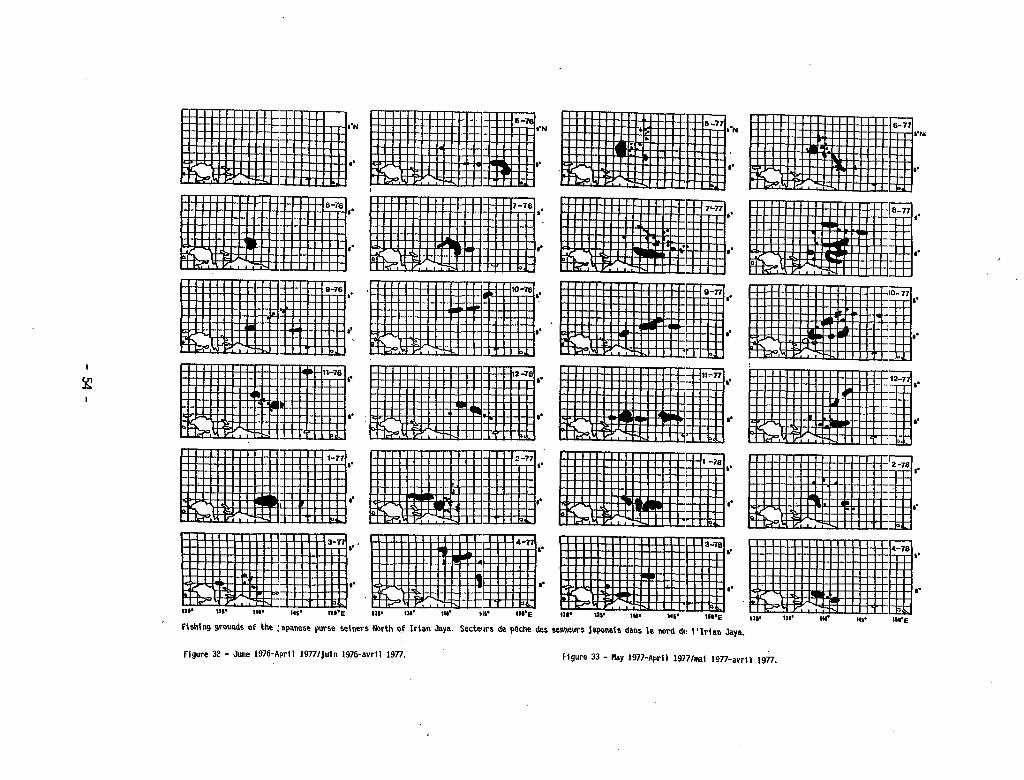
t i i
-54-
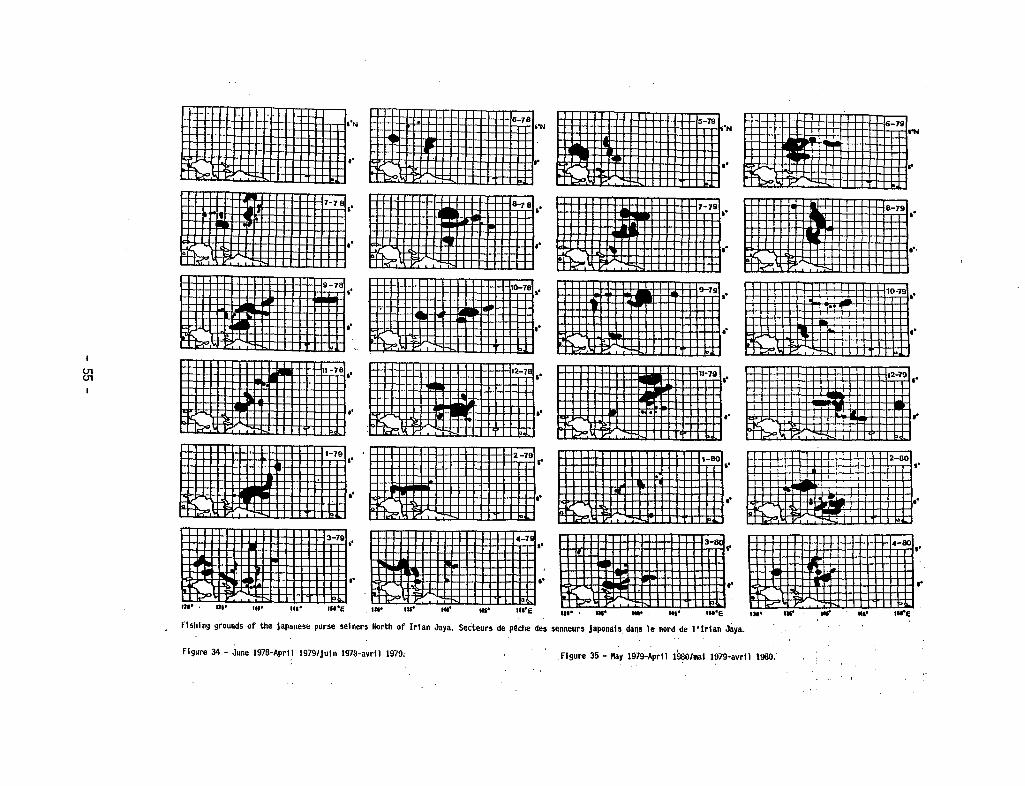
tiiiiiiiiil
I!!!!!!!!I 1 ,:::
::;: : :,
- 55 -
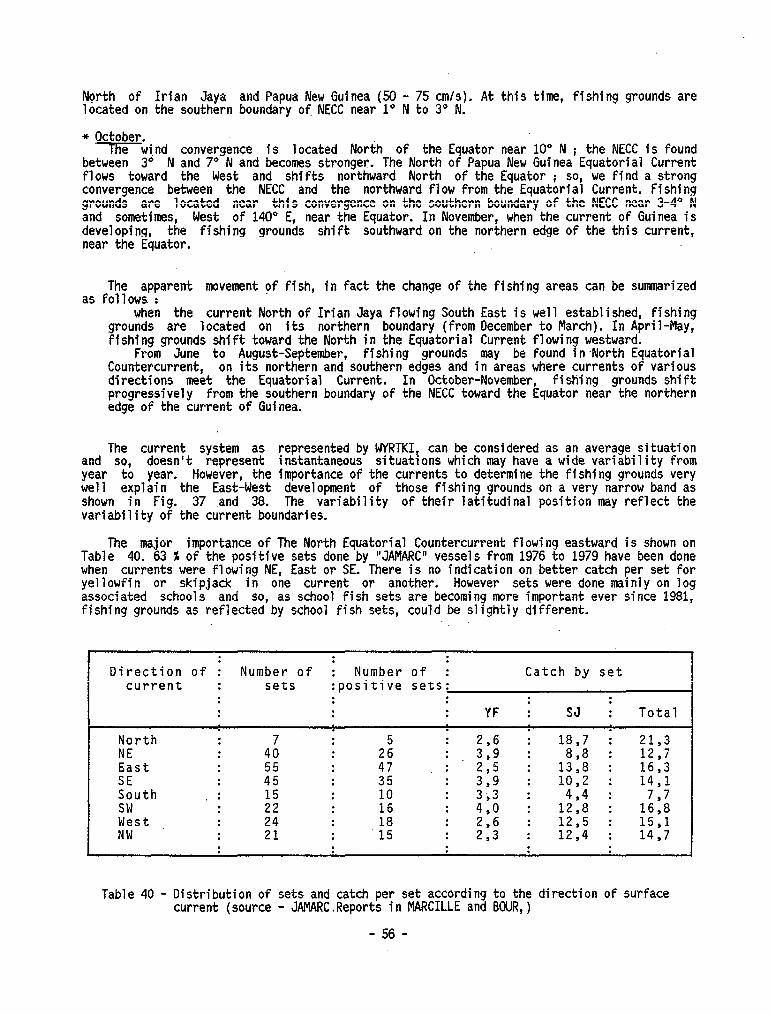
North of Irian Jaya and Papua New Guinea (50 - 75 cm/s). At this time, fishing grounds are located on the southern boundary of. NECC near 1' N to 3" N.
+ October. Thewi,nd convergence is located North of the Equator near 10” N i the NECC is found
between 3O N and 7" N and becomes stronger. The North of Papua New Guinea Equatorial Current flows toward the West and shifts northward North of the Equator i SO, we find a strong convergence between the NECC and the northward flow from the Equatorial Current. Fishing grounds are located near this convergence on the southern boundary of the NECC near 3-4" N and sometimes, West of 140" E, near the Equator. In November, when the current of Guinea is developing, the fishing grounds shift southward on the northern edge of the this current, near the Equator.
The apparent movement of fish, in fact the change of the fishing areas cari be sumnarized as follows :
when the current North of Irian Jaya flowing South East is well established, fishing grounds are located on its northern boundary (from December to March). In April-May, fishing grounds shift toward the North in the Equatorial Current flowing westward.
From June to August-September, fishing grounds may be found in-North Equatorial Countercurrent, on its northern and southern edges and in areas where currents of various directions meet the Equatorial Current. In October-November, fishing grounds shift progressively from the southern boundary of the NECC toward the Equator near the northern edge of the current of Guinea.
The current system as represented by WYRTKI, cari be considered as an average situation and SO, doesn't represent instantaneous situations which may have a wide variability from year to year. However, the importance of the currents to determine the fishing grounds very well explain the East-West development of those fishing grounds on a very narrow band as shown in Fig. 37 .and 38. The variability of their latitudinal position may reflect the variability of the current boundaries.
The major importance of The North Equatorial Countercurrent flowing eastward is shown on Table 40. 63 X of the positive sets done by "JAMARC" vessels from 1976 to 1979 have been done when currents were flowing NE, East or SE. There is no indication on better catch per set for yellowfin or skipjack in one current or another. However sets were done mainly on log associated schools and SO, as school fish sets are becoming more important ever since 1981, fishing grounds as reflected by school fish sets, could be slightly different.
: : : Direction of : Number of : Number of : Catch by set
current : sets :Positive sets: . . . : : . : : : YF ; S3 ; Total
North NE East SE South : SW West NW
. . : . : 4; I : : . . E : : : : :2 : : : 21
: :
. .
5 4276 35 10
:Fi 15
. : : 187 : 21,3 : 3:: : 818 : 12,7 : 2,5 : 13,8 : 16,3 : 3:; .
; 10,2 : 14,l
. 410
12G : 737 : :
1215 : 16,8
: . : 15,l :
22:; I 12,4 : 14,7 . . .
Table 40 - Distribution of sets and catch per set according to the direction of surface current (source - JAMARC .Reports in MARCILLE and BOUR,)
- 56 -
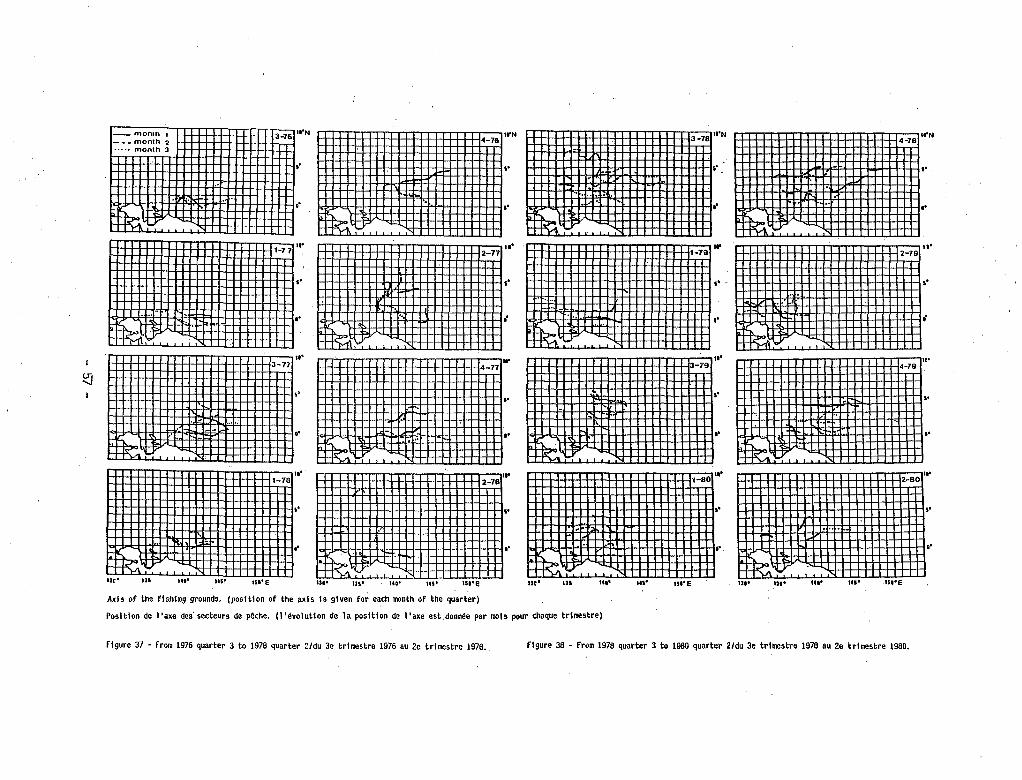
tiiiiiiiiiif++-t
n 0
-57-
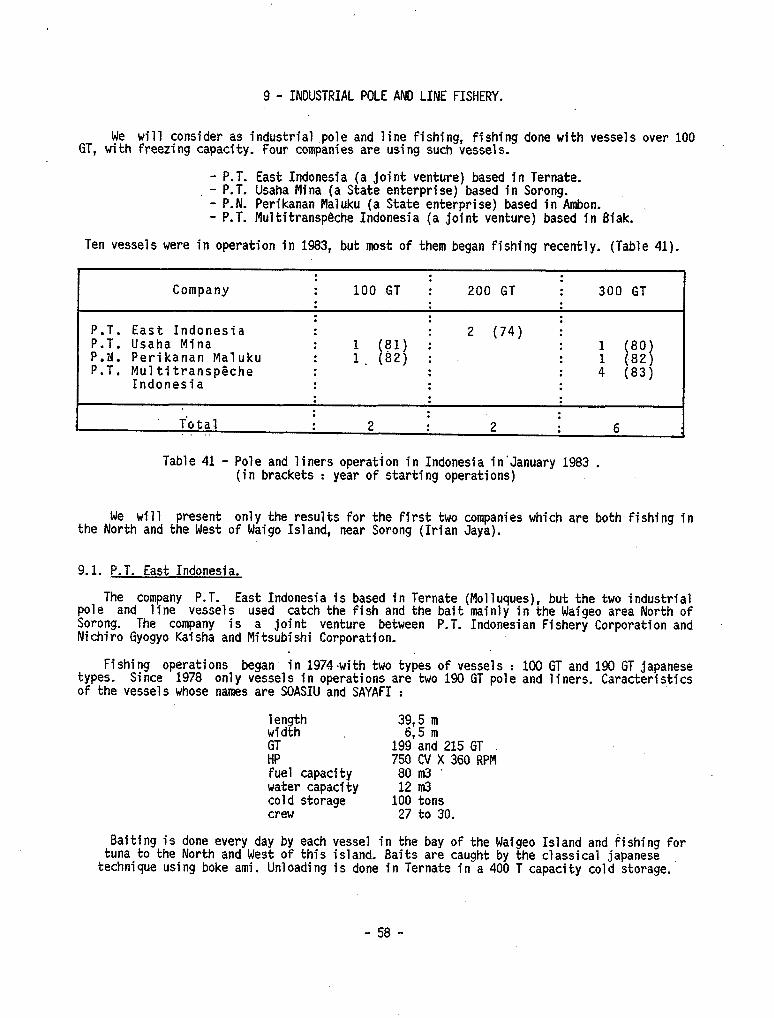
9 - INDUSTRIAL POLE AND LINE FISHERY.
We will consider as industrial .pole and line fishing, fishing done with vessels over 100 GT, with freezing capacity. Four companies are using such vessels.
I
- P.T. East Indonesia (a joint venture) based in Ternate. - P.T. Usaha Mina (a State enterprise) based in Sorong. - P.N. Perikanan Maluku (a State enterprise) based in Ambon. - P.T. Multitranspêche Indonesia (a joint venture) based in Biak.
Ten vessels were in operation in 1983, but most of them began fishing recently. (Table 41).
Company
P.T. East Indonesia P.T. Usaha Mina P.iJ. Perikanan Maluku P.T. Multitranspêche
Indonesia
: : . : 100 GT : 200 GT : 300 GT . . : . . : : : : . 2 (74) : . : i
1 (81) I 1. (82) : : : [.y
: : : 4 (83) : . . :
Table 41 - Pole and liners operation in Indonesia in'January 1983 . (in brackets : year of starting operations)
We Will present only the results for the first two companies which are both fish i the North and the West of Waigo Island, near Sorong (Irian Jaya).
9.1. P.T. East Indonesia.
ng in
pole The company P.T.
and line vessels East Indonesia is based in Ternate (Molluques), but the two indus, tria1
used catch the fish and the bait mainly in the Waigeo area North of Sorong. The company is a joint venture between P.T. Indonesian Fishery Corporation and Nichiro Gyogyo Kai sha and Mitsubishi Corporation.
Fishing operations began in 1974iwith two types of vessels : 100 GT and 190 GT japanese types. Since 1978 only vessels in operations are two 190 GT pole and liners. Caracteristics of the vessels whose names are SOASIU and SAYAFI :
length width
HFT fuel capacity water capacity cold storage crew
35,; ;
199'and 215 GT 750 CV X 360 RPM 80 m3 12 m3
100 tons 27 to 30.
Baiting is done every day by each vesse1 in the bay of the Waigeo Island and fishing for tuna to the North and West of this island. Baits are caught by the classical japanese
technique using boke ami. Unloading is done in Ternate in a 400 T capacity cold storage.
- 58 -
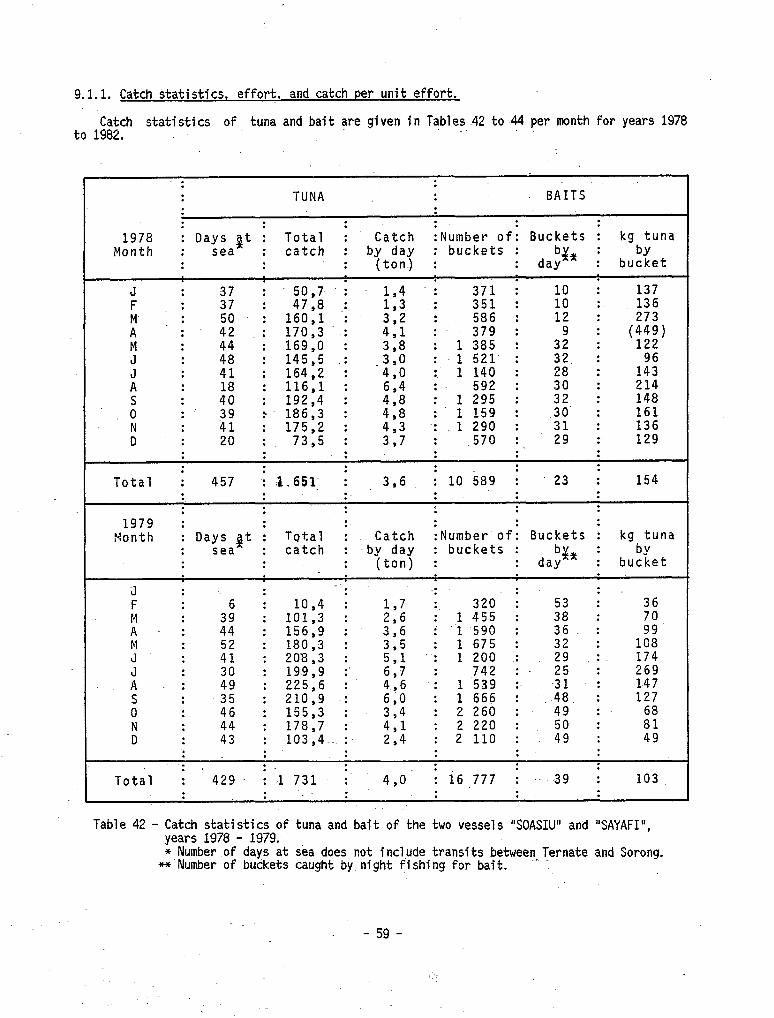
9.1.1. Catch statistics, effort, and catch per unit effort.
Catch statistics of tuna and bait are given in Tables 42 to 44 per month for years 1978 to 1982.
. : . : TUNA : BAITS : : : : : . :
1978 : Days sea at
: Total : Catch INumber ofi Buckets : kg tuna Month : : catch : by day : buckets : : by
: : : (ton) : : b&
day : bucket .
J : 3: : 50,7 -- I 1,4 I 371 I .
ii : 137 F : 1,3
1: A : :2
: : 160,l 47,8 : :
.: 170,3 .-: i::
: : 351 586 : : 12 : : 273 136
: 379 : 32 .
J : : 44 : : 169,0 145,5 .: : .;:: : : 1 1 385 521 : : ; :
'1;;)
; if 18. 32
; : : 164,2 116,l : : 4,0 : l 592 140 : : 3: : : 214 14936
s : 40 : 192,4 : 4,; ;. 1 295 : 32, : 148 0 :
;y ; 186,3 :
418 : 1 159 :
3: : 161
N : 175,2 : 4,3 : I 1 290 : : 136 D : 20 : 73,5 : 3,7 : -570 : 29 : 129
: : . . : : : . . .
Total I 457 ,; -2.651 ; : : :
396 : 10 589 : -23 : 154 :. : . . . . : : : : . . . . : . .
1979 : : : : . : Month : Days $t : Total : Catch :Number ofi Buckets : kg tuna
: sea : catch : -by day : buckets : bgx : by : : : (ton) : : day : bucket
. . . . . J : : : . . : : F : 6 : 10,4 : : 320 : 53 : 36
A : : 44 : : 101,3 156,9 : : 316 p; ; . ‘1 1 .590 455 : : 38 36 : : 99 70 M -
; 4: : 180,3 : 3,5 : 1 675 : 32 : 108
J’ : 208,3 :
4:6 2;
: 1 200 : 29 .: 174
A : : 49 : : 225,6 199,9 :’ : : : 1 742 539 : :~ -31 25 : : 269 147
0 : : iz : : 210,9 155,3 : : 3,4 6,0 : : 2 1 666 260 : : :48 49 : : 127 68 N : ii : 178,7 : : 2 220 : : 81 4,l D : : 103,4.. :. 2,4 : 2110 :
vi : 49
l . . . : . : .
. .
.
Total : : Q 429 - I ,l 731 I 4,0 : : i6 777 : : ‘~ .39 : : 103 : . . . : :
Table 42 - Catch statistics of tuna and bait of the two vessels "SOASIU" and “SAYAFI”, years 1978 - 1979. * Number of days at séa does not include transits between.Ternate and Sorong.
* Number of buckets caught by night fishing for bait.
- 59 -
. .
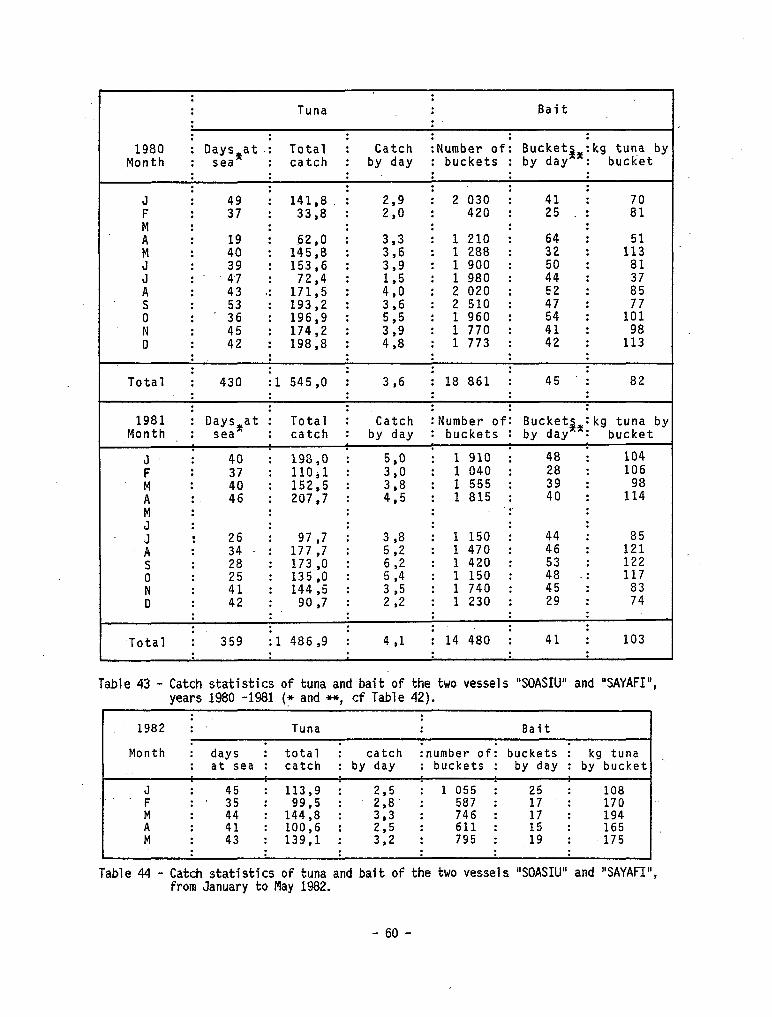
: : : Tuna : Bait : : : : :
1980 : Days*at .i Total : Catch :Number ofi BucketgSikg tuna by Month : sea : catch : by day : buckets : by day : bucket
: : : : : : : : : : : :
J : : 141,B. : : 2 030 : 41 : F : i: : 33,8 : 2:; : 420 : 25 : 8; . : : : : : !l : : 62,0 : 3,3 i 1 210 :
ii : :
: 145,B : 3,6 : 1 288 : 362 : 1:: i! : 153,6 : 3,9 : 1 900 : 81
.;.y ; :
: 72,4 : : 1 980 : 44 : A : 43 2: 171,5 : i:: : 2 020 : 52 : 8; : : 193,2 : 3,6 : 2 510 : 47 : ; : 46 : 196,9 : 5,5 : 1 960 : : 1:; N : : 174,2 : : 1 770 : :t : Il : i; : 198,8 : i:8 : 1 773 : 42 : 1::
: : : : : : : : : : : :
Total : 430 :l 545,O : 3,6 : 18 861 : 45 : 82 : : : : : :
. : : : : 1981 : Days%at : Total i Catch :Number ofi Bucketf; :kg tuna by
Month : sea : catch : by day : buckets : by day ': bucket
J, ; 40 ; 198,O I 5,o I 1 910 ; 48 ; 104 F : : 11Ojl : 3,0 : 1 040 : 28 : 1.0 6
: :Cl : 152,5 : : 1 555 : : A : 46 : 207,7 : ::5 : 1 815 : 4: : 114
‘.. : : : . : JM . : : : : :
: 26 : 97,7 : 3,B : 1 150 I 44 : A : 34 - : 177,7 : 5,2 : 1 470 : 46 : 1;;
: 28 : 173,0 : : 1 420 : : 122 ; : : 135 ,o : 55 : 1 150 : i8 -: 117 N : 4: : 144,5 : 315 : 1 740 : 45 : 83 D : 42 : 90,7 : 2,2 : 1 230 : 29 : 74
: : : : : : : : : : :
Total : 359 :l 486,9 : 4 ,l : 14 4’80 : 41 : 103 : : : : : :
Table 43 - Catch statistics of tuna and bai t of the two vesse1 s “SOASIU” and "SAYAFI", years 1980 -1981 (7 and +y, cf Table 42).
1982 ; .. :
Tuna : Bait
Month I .
days I total I catch :number ofI buckets I kg tuna : at sea : catch : by day : buckets : by day : by bucket .
: 45 : 113,9 ; 2,5 ; 1 055 ; 25 ; 108 "F : ' 35 : 99,5 :
2:. : 587 : 17 : 170
: : 144,8 : 746 : Ii :
: 194 ii :
s : 100,6 : 611 : :5 : 165
M : 43 : 139,l : ::: : 795 : 19 : 175 : : : : : :
Table 44 - Catch statistics of tuna and bait of the two vessels "SOASIU" and "SAYAFI", from January to May 1982.
- 60 -
9.1.1.1. Tuna.
There is no indication on the tuna species caught because data were not available. However, it is estimated that skipjack enters for 95 % of the catches and yellowfin for 5 %. Evolution of the monthly catch per fishing day is presented'on Figure 39 for the years 1978 to 1982 and the average monthly value for a11 years on Fig. 40:It shows us that the higher catch rate occurs from June to November sometime with some good catch rate in April-May.
Average yearly catch rates do not show any trend ; they range between 3 to 4 tons a day.
9.1.1.2. Bait.
Data on bait are net so consistant caught by fishing night.
; they are given in number of buckets and in buckets A bucket is considered to contain 3 to 5 kg of bait, but it may
depend on the species caught'and we have no accurate data on species composition of the bait according to the years and months.
The number of buckets caught by night fishing averages usually 40 to 50 buckets which cari be considered as enough for a'one day tuna fishing trip. Vessels need to catch bait every dw, at night time, and SO may operate only on tuna fishing grounds located very near the bait fishing grounds. Catch rates were very low in 1978 and 1982 (20 bucketsjnight) and much higher in 1979 to 1981 (40 buckets per night).
Avera e kg and ?
catch of tuna per bucket was 80 to 100 kg from 1979 to 1981 and much higher, 154 62 kg in 1978 and 1981 respectively.
differences, We do not know the reasons for such high
and 1982, it however as the average number of buckets caught per day was very high in 1978
cari be ,expected than during those two years the average weight of bait per bucket was higher. As a bucket may contain 3 to 5 kg of bait we cari roughly estimate that 25 to 35 kg of tuna are caught per kilo of bait, and that better catch of tuna per bucket may be obtained during the period June to October.
For this, we cari expect of chuming rather than a higher abundance-of tuna.
9.1.1.3. Size of tuna cauaht.
There is no accurate data on size composition of the fish. However, as the total number of fish caught on each trip is estimated, we cari know average mensual weight by individual fish. It was estimated to be around 2.6 kg in 1978, 1980 and 1981 and around 3.2 kg in 1979. The lower average weights are obtained from January to April and the higher from June-July to September-October. As we do not have the composition of the catch by species we cannot know if the higher values are not the'effect of higher proportion of yellowfin in the catch during those months.
9.2. P.T. Usaha Mina.
Operations with pole atid line boats 100 GT and 300 GT are relativelly new for the company P.T. Usaha Mina.
In one year of. operation, 'in 1981, the catches of the 100 GT pole and line vesse1 have reached 218 tons ; catches of the 300 GT vesse1 were 510 tons in 1980, for 134 days with an average CPUE of 3.8 tons per day, and 748 tons in 1981 for a 8 month period of continuai operation and 185 days at sea. Statistics of catch and effort are given in Table 45.
- 61 -
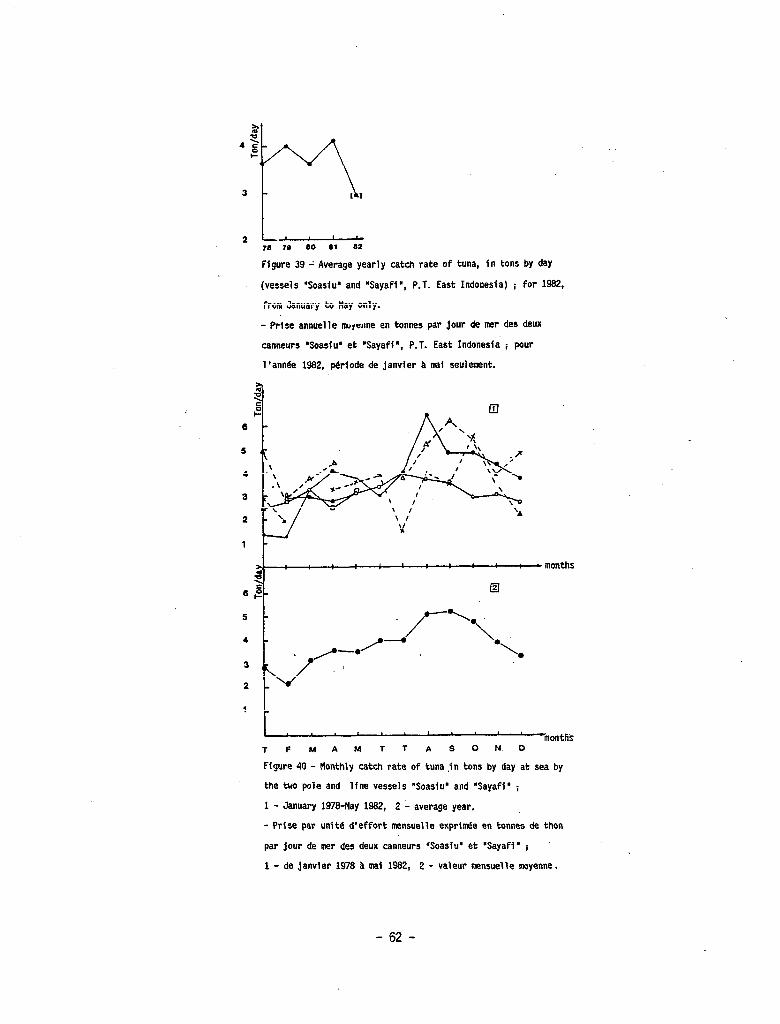
6
Figure 39 2 Average yearly catch rate of tuna, in tons by day
(vessels 'Soasiu' and "Sayaff', P.T. East Indonesia) ; for 1982,
fron January to May only.
- Prise annuelle morenne en tonnes par jour de msr des deux
tanneurs "Soasfu' et 'Sayafi', P.T. East Indonesfa ; pour
l'annee 1982, p&iode de janvier a mai seulement.
z : : : : : ’ ! ! : : : months a
0 ;- El
5
4
I-J
.
Y-\*<
/@-.f - l 3 i
2
1 t
mcatk T F M A M T T A S 0 N. 0
Figure 40 - Ronthly catch rate of tuna in tons by day at sea by
the tuo pole and lfne vessels "Soasiu" and "Sayafi' 1
1 - January 1979-May 1992, 2 1 average year.
- Prise par unite d'effort mensuelle exprfde en tonnes de thon
par jour de mer des deux tanneurs *Soasfu* et 'Sayafi" ;
1 - de janvier 1978 a mai 1982, 2 - valeur mnsuelle moyenne.
- 62 -
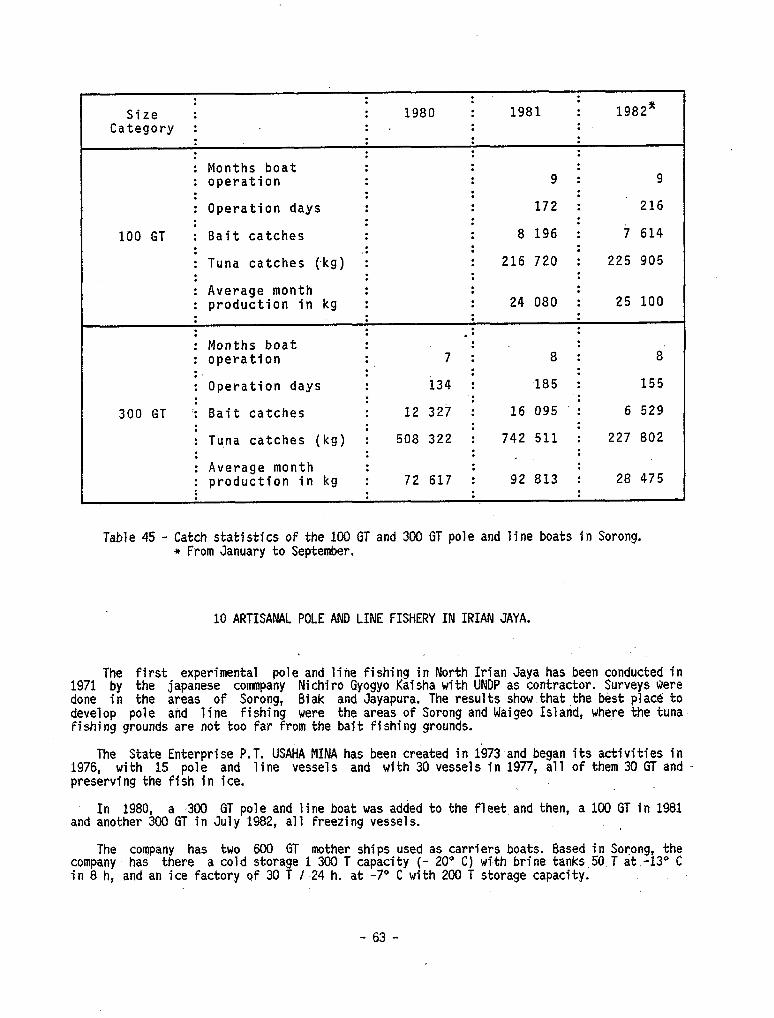
: : : : Size : : 1980 : 1981 : 1982*
Category : : - : : : : : : . i Months boat
: : : : : :
: operation . . : 9 : 9 : : : : : Operation days : : 172 : 216 : . . . . .
100 GT : Bait catches : : 8196 i i 614 . . . . : Tuna catches (kg) .I
. : : 216 720 : 225 905
. I Average month
: : : : : .
: production in kg : . . 24 080 i 25 100
. . : Months boat : : operation : 7; 8 ; 8
. : .
. . : Operation days I 134 I -185 I 15-5
-i : -. .
12 327 i 16 095 300 GT Bait catches . . : 6 529 . : .
. : Tu.na catches (kg) i 508 322 i 742 511 ; 227 802 . : . . : I Average month : : : : production in kg : 72 617 : 92 813 : 28 475
Table 45 - Catch statistics of the 100 GT and 300 GT pole and line boats in Sorong. * From January to September.
10 ARTISANAL POLE AND LINE FISHERY IN IRIAN JAYA.
The first experimental pole and line fishing in North Irian Jaya has been conducted in 1971 by the japanese commpany Nichiro Gyogyo Kaisha with UNDP as contracter. Surveys were done in the areas of Sorong, Biak and Jayapura. The results show.that.the bést place to develop pole and line fishing were the areas of Sorong and Waigeo Island, where the tuna fishing grounds are not too far from the bait fishing grounds.
The State Enterprise P.T. USAHA MINA has been created in 1973,and began its activities in 1976, with 15 pole and line vessels and with 30 vessels in 1977, a11 of them 30 GT and preserving the fish in ice.
In 1980, a ,300 GT pole and line boat was added to the fleet.and then, a 100 GT in 1981 and another 300 GT in July 1982, a11 freezing vessels.
The company has two 600 GT mother ships used as carriers boats. Based in Sorong, the company- has there a cold storage 1 300 T capacity (- 20" C) with brine tanks.%~T at -13O C in 8 h, and an ice factory of 30 T 1.24 h. at -7" C with 200 T storage capacity.
- 63 -
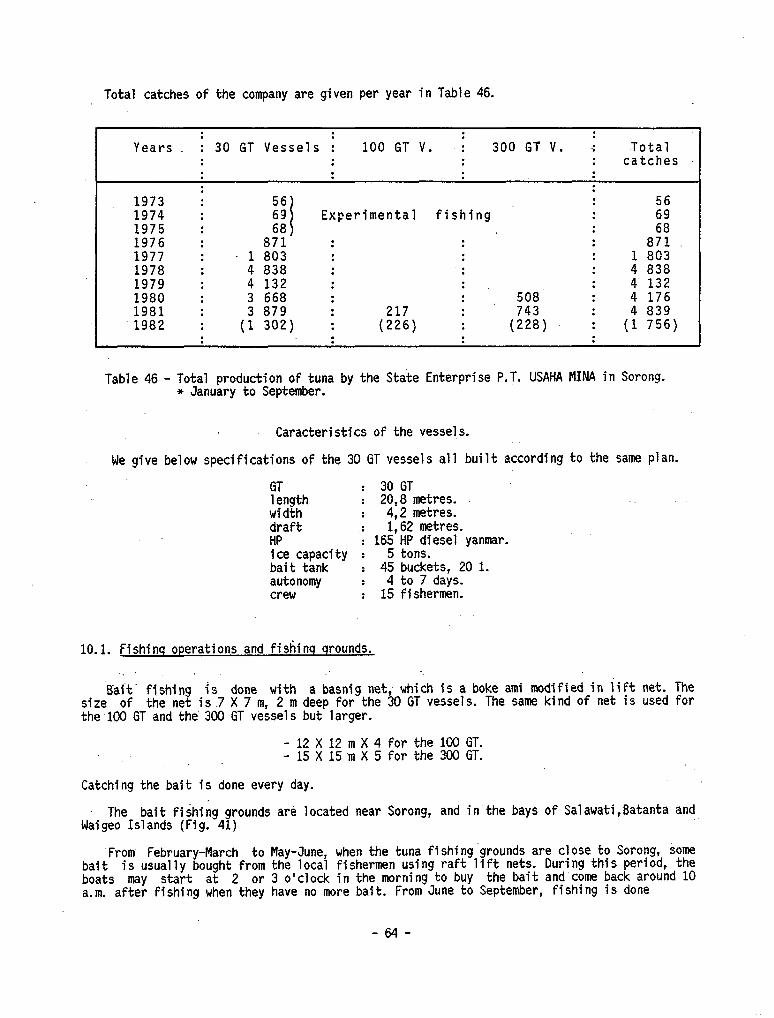
Total catches of the company are given per year in Table 46.
: : : : Years :‘30 GT Vessels : 1OOGTV. : 300 GT V. -: Total
: . . : : catches
l 1973 1974 1975 1976 1977 1978 1979 1980 1981 1982
: : 561 * . : K : 871 . . 1 803 : 4 838 : 4 132 : 3 668 : 3 879 : (1 302) .
; :
Experimental fishing . . 69 : 68
. . : : 871
. : . . . 1 803 . . . : . 4 838
. . : : 4’ 132 : : 508. : 4 176 : 217
i 743 : 4 839
: (226) (228) : (1 756) . . .
Table 46 - Total production of tuna by the State Enterprise P.T. USAHA MINA in Sorong. + January to September.
Caracteristics of the Vesse!s.
We give below specifications of the 30 GT vessels a11 built according to the same plan.
GT : 30 GT length width
: 2;,; me;;:;. :
draft : 1:62 metrei. HP : 165 HP diesel yanmar. ice capacity : 5 tons. bait tank : 45 buckets, 20 1. autonomy : 4 to 7 days. crew : 15 fishermen.
10.1. Fishinq operations and fishinq qrounds.
‘. .
Bai‘t- fi,shing is done with a basnig net, which is a boke ami modified in iift net. The size of the net is .7 X 7 m, 2 m deep for the 30 GT vessels. The same kind of net is used for the 100 GT and the 300 GT vessels but larger.
- 12 X 12 m X 4 for the 100 GT. - 15 X 15 m X 5 for the 300 GT.
Catching the bait is done every day.
The bait fiihing grounds are located near Sorong, and in'the bays of Salawati,Batanta-and Waigeo Islands (Fig. 41)
'From February-March to May-June, when the tuna fishing grounds are close to Sorong, iome bait is usually bought from the local fishermen using raft lift nets. During this penod, the boats may start at 2 or 3 o'clock in the morning to buy the bait and tome back around 10 a.m. after fishing when they have no more bait. From June to September, fishing is done
-64-

usually North of Waigeo and the bait is taken there. From October to January-February, fishing occurs generally near the islands of Gag, Gebe and Kofiau ; duration of the trips are then 4 to 5 days and some bait is also bought from local fishermen, especially in October and November.
!!JO 13OO
Figure 41 - Fishlng grounda For tuna aed bait In the vlcinity of Sorong aod Uaigeo Island.
- Secteur5 de pkhe du thon et de I'appat vivant dans les regione de Sorong et de I'tle Walgeo.
The fishing grounds for tuna are mainly determined by the sea conditions and the weather may limit the number of days at sea between June and September. Schools of tuna are in great number North of Sorong and in the East of Waigeo Island, but the size of the schools is rather small i the fish is usually 2.5 to 3 kg a piece.
In the North of Waigeo, schools are usualy bigger but scarcer. In the Western fishing grounds, between Waigeo and Halmahera and near Gebe island fish is usually smaller, 2.0 to 2.5 kg and according to a fishing master we met, there is no fish there in association with the logs. In the West of Waigeo and Salawati, small yellowfin, 3 to 6 kg are often met from December to March in association with whales and small forage fishes.
10.2. Catch statistics and catch per unit effort.
Statistics of the catch and effort statistics for tuna and bait are given in Tables 47 and 48 for the 30 GT fleet.
- 65 -
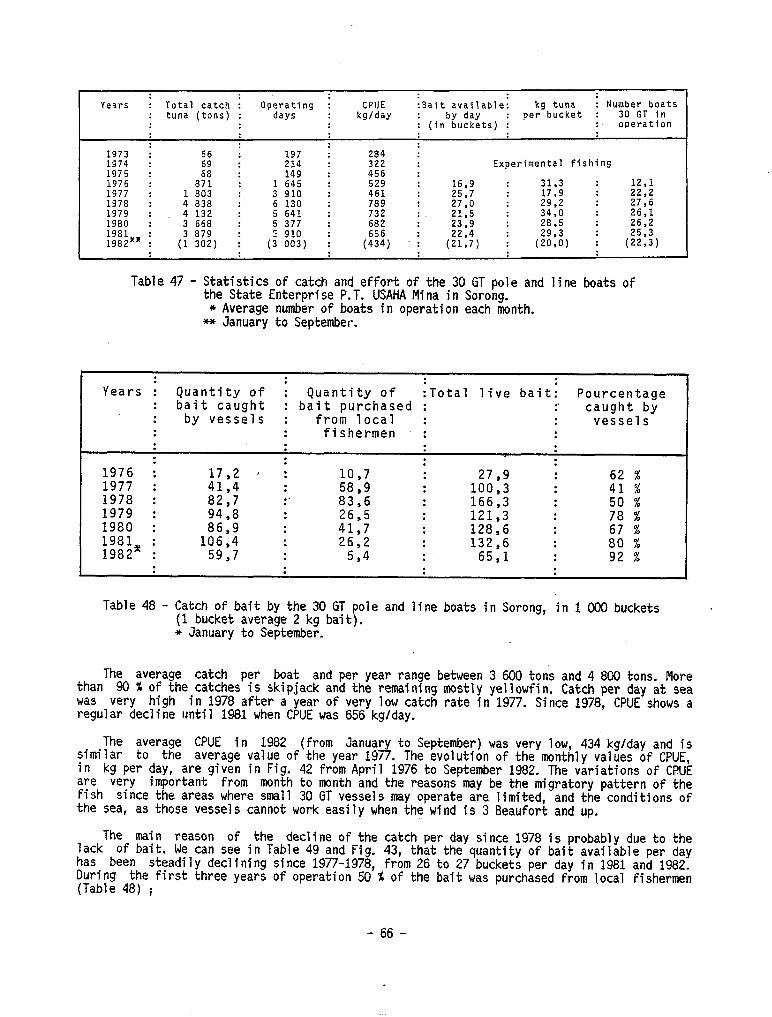
Years : Total catch : Operating : CPUE :Eait availablei kg tuna : Number boats : tuna (tons) : days kg/day : by day : per bucket : 30 GT in
: (in buckets) : : operation
1973 1974 1975 1976 1977 1978 1979 1980 1981 198PX
a:81 1 803 4 838 4 132 3 668 3 879
(1 302)
197 214 149
1 645 3 910 6 130 5 641 5 377 F 910
(3 003)
:
204 322 456 529 461 709 732 682 656
(434) .
16,9 31,3 12.1 25.7 17,9 22,2 27.0 29,2 27,6 21,s 34,0 26,l 23.9 28,5 26.2 22.4 29,3 : 25,3
(21>71 (20.0) : (22,3)
Experimental fishing
Table 47 - Statistics of catch and effort of the 30 GT pole and line boats of the State Enterprise P.T. USAHA Mina in Sorong. * Average number of boats in operation each month.
+it January to September.
. Years I
: . Quantity of : Quantity of :Total live baiti bait caught
Pourcentage : : bait purchased : .' . : by vessels : from local *
caught by
fishermen I : vessels
: : . .
i .
1976 17,2 * ; :
10,7 I : 62 % 1977
27,9 : 41,4 : 58,9 : 100,3 : 41 %
1978 : 82,7 :' 83,6 : 166,3 : 50 % 1979 : 94,8 : 26,5 : 121,3 : 78 % 1980 : 86,9 : 41,7 : 128,6 : 67 % 1981 1982’ : 106,4 : 26,2 : 132,6 : 80 % :
59,7 :
5,4 :
65,l :
92 %
Table 48 - Catch of bait by the 30 GT pole and line boats in Sorong, in 1 000 buckets (1 bucket average 2 kg bait). * January to September.
than The average catch per boat and per year range between 3 600 tons and 4 800 tons. More
90 f of the catches is skipjack and the remaining mostly yellowfin. Catch per day at sea
was very high in 1978 after a year of very low catch rate in 1977. Since 1978, CPUE shows a regular decline until 1981 when CPUE was 656 kg/day.
The average CPUE in 1982 (from January to September) was very low, 434 kglday and is similar t-o the average value of the year 1977. The evolution of the monthly values of CPUE, in kg per day, are given in Fig. 42 from April 1976 to September 1982. The variations of CPUE are very important from month to month and the reasons may be the migratory pattern of the fish since the areas where small 30 GT vessels may operate are limited, and the conditions of the sea, as those vessels cannot work easily when the wind is 3 Beaufort and up.
lack The main reason of the decline of the catch per day since 1978 is probably due to the
of bait. We cari see in Table 49 and Fig. 43, that the quantity of bait available per day has been steadily declining since 1977-1978, from 26 to 27 buckets per day in 1981 and 1982. During the first three years of operation XI 1 of the bait was purchased from 1,ocal fishermen (Table 48) ;
- 66 -
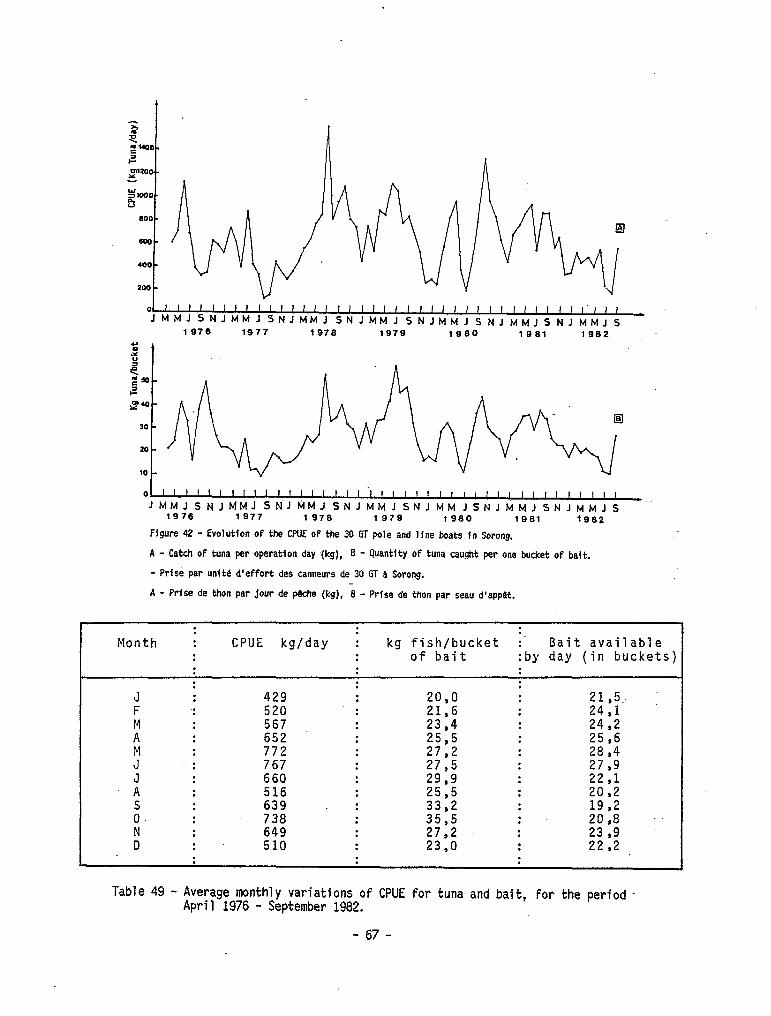
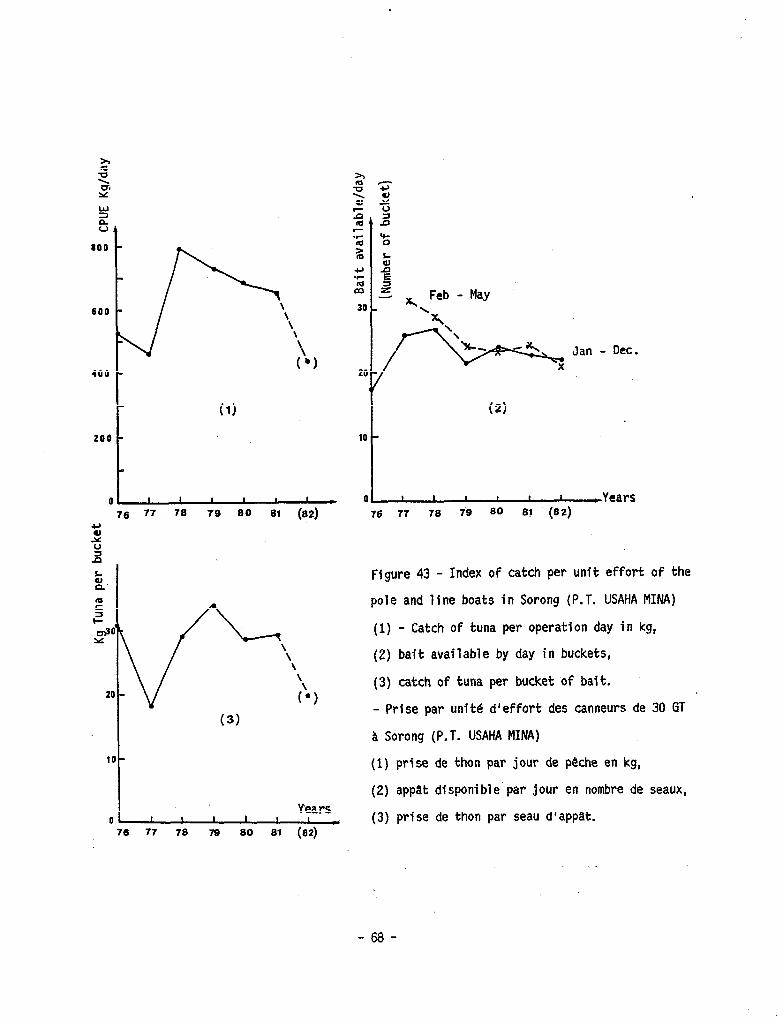
Jan - Dec.
76 77 76 79 60 81 (82)
10 -
Years 0 I I I I I 1 LL
76 77 78 79 80 81 (82)
Odyears 76 77 76 fs 60
Figure 43 - Index of catch per unit effort of the
pole and line boats in Sorong (P.T. USAHA NINA)
(1) - Catch of tuna per operation day in kg,
(2) bait available by day in buckefs,
(3) catch of tuna per bucket of hait.
- Prise par unité d'effort des tanneurs de 30 GT
a Sorong (P.T. USAHA MINA)
(1) prise de thon par jour de peche en kg,
(2) appat disponible par jour en nombre de seaux,
(3) prise de thon par seau d'appat.
-68-
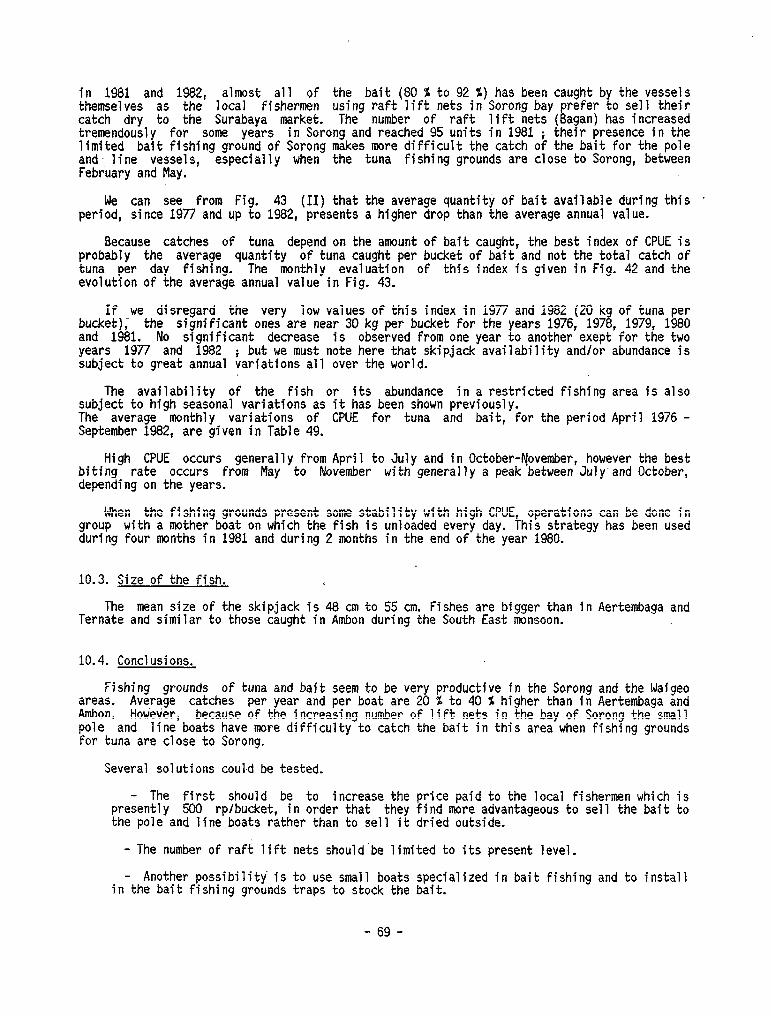
in 1981 and 1982, almost a11 of the bait (80 1 to 92 X) has been caught by the vessels themselves as the local fishermen using raft lift nets in Sorong bay prefer to se17 their catch dry to the Surabaya market. The number of raft lift nets (Bagan) has increased tremendously for some years in Sorong and reached 95 units in 1981 ; their presence in the limited bait fishing ground of Sorong makes more difficult the catch of the bait for the pole and line vessels, especially when the tuna fishing grounds are close to Sorong, between February and May.
We cari see from Fig. 43 (II) that the average quantity of bait available during this ' period, since 1977 and up to 1982, presents a higher drop than the average annual value.
Because catches of tuna depend on the amount of bait caught, the best index of CPUE is probably the average quantity of tuna caught per bucket of bait and not the total catch of tuna per day fishing. The monthly evaluation of this index is given in Fig. 42 and the evolution of the average annual value in Fig. 43.
If we disregard the very low values of this index in 1977 and 1982 (20 kg of tuna per bucket); the significant ones are near 30 kg per bucket for the years 1976, 1978, 1979, 1980 and 1981. No significant decrease is observed from one year to another exept for the two years 1977 and 1982 ; but we must note here that skipjack availability andior abundance is subject to great annual variations a11 over the world.
The availability of the fish or its abundance in a restricted fishing area is also subject to high seasonal variations as it has been shown previously. The average monthly variations of CPUE for tuna and bait, for the period April 1976 - September 1982, are given in Table 49.
High CPUE occurs generally from April to July and in October-November, however the best biting rate occurs from May to November with generally a peak between July and October, depending on the years.
When the fishing grounds present some stability with high CPUE, operations cari be done in group with a mother boat on which the fish is unloaded every day. This strategy has been used during four months in 1981 and during 2 months in the end of the year 1980.
10.3. Size of the fish.
The mean size of the skipjack is 48 cm to 55 cm. Fishes are bigger than in Aertembaga and Ternate and similar to those caught in Ambon during the South East monsoon.
10.4. Conclusions.
Fishing grounds of tuna and bait seem to be very productive in the Sorong and the Waigeo areas. Average catches per year and per boat are 20 % to 40 % higher than in Aertembaga and Ambon. However, because of the increasing number of lift nets in the bay of Sorong the small pole and line boats have more difficulty to catch the bait in this area when fishing grounds for tuna are close to Sorong.
Several solutions coul-d be tested.
- The first should be to increase the price paid to the local fishermen which is presently 500 rpibucket, in order that they find more advantageous to sel1 the bait to the pole and line boats rather than to sel1 it dried outside.
- The number of raft lift nets should'be limited to its present level.
in - Another possibility is to use small boats specialized in bait fishing and to install the bait fishing grounds traps to stock the bait.
- 69 -
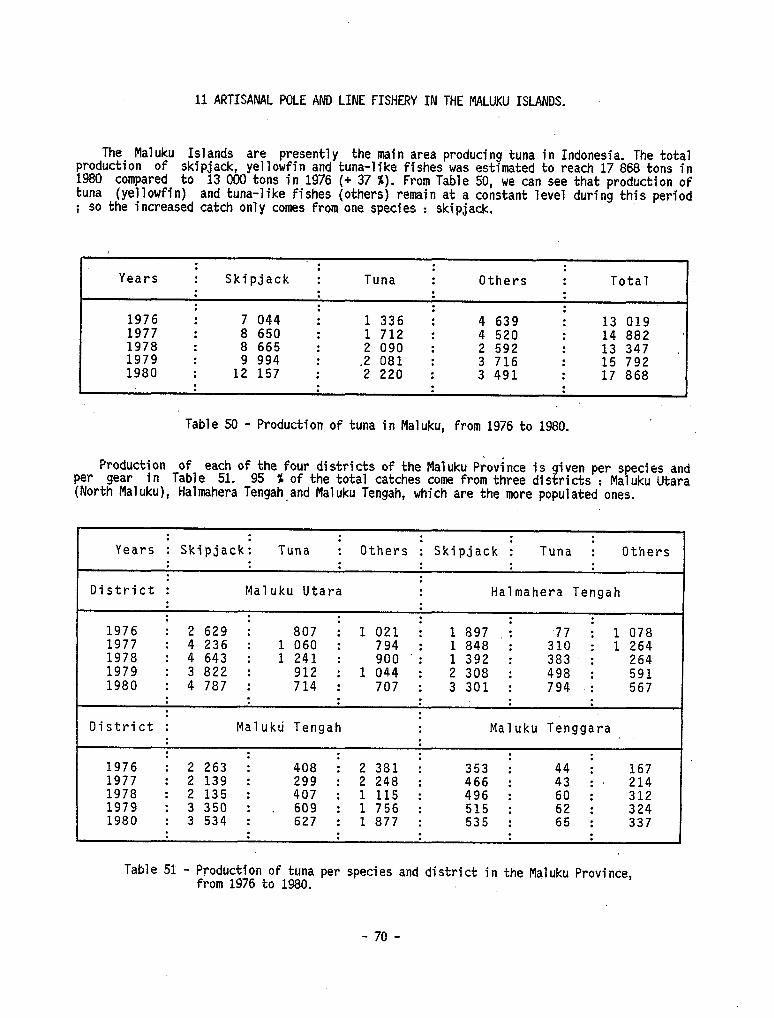
11 ARTISANAL POLE AN0 LINE FISHERY IN THE MALUKU ISLANDS.
The Maluku Islands are presently the main area producing tuna in Indonesia. The total production of skipjack, yellowfin and tuna-like fishes was estimated to reach 17 866 tons in 1980 compared to 13 000 tons in 1976 (+ 37 %). From Table 50, we cari see that production of tuna (yellowfin) and tuna-like fishes (others) remain at a constant level during this period ; SO the increased catch only cornes from one species : skipjack.
. . : : Years I Skipjack I Tuna : Others : Total
: . . : . . : . : :
1976 : 7 044 I 1 336 : 4 639 : 13 019 1977 : 8 650 : 1 712 : 4 520 : 14 882 1978 : 8 665 : 2 090 : 2 592 : 13 347 1979 : 9 994 : ‘2 081 : 3 716 : 15 792 1980 : 12 157 : 2 220 : 3 491 : 17 868
: : . . :
Table 50 - Production of tuna in Maluku, from 1976 to 1980.
Production of each of the four districts of the Maluku Province is given per species and per gear in Table 51. 95 X of the total catches tome from three districts : Maluku Utara (North Maluku), Halmahera Tengah,and Maluku Tengah, which are the more populated ones.
Years I . ; : : :
Skipjack: Tuna : Others : Skipjack : Tuna : Others I
District : Maluku Utara : Halmahera Tengah
; : 1976 : 2 629 ; 807 i 1 021 i 1 897 : .77 * 1 078 I 1977 : 4 236 : 1 060 : 794 1978 : 4 643 1241 900 ' : : : 1 392 : 383 : 264 1979 : 3 822 : 912 : 1 044 : 2 30R ! 898 * 591 I 1980 : 4 787 : 714 :
. . :
District : :
: :
Malukti Tengah
: i 848 ; 3iO I i 264 1
70; I 3 soi ; 794 '-- ; 567 I : :
Maluku Tenggara . : . : : . :
' 1976 : 2 263 i 408 : 2381 : 353 I 43 : 167 1977 : 2 139 : 299 : 2 248 : 466 : :, 214 1978 : 2135 : 407 : 1 115 : 496 : 60 : 312 1979 : 3 350 : , 609 : 1756 : 515 : 62 : 324 1980 : 3 534 : 627 : 1 877 : 535 : 65 : 337
Table 51 - Production of tuna per species and district in the Maluku Province, from 1976 to 1980.
- 70 -
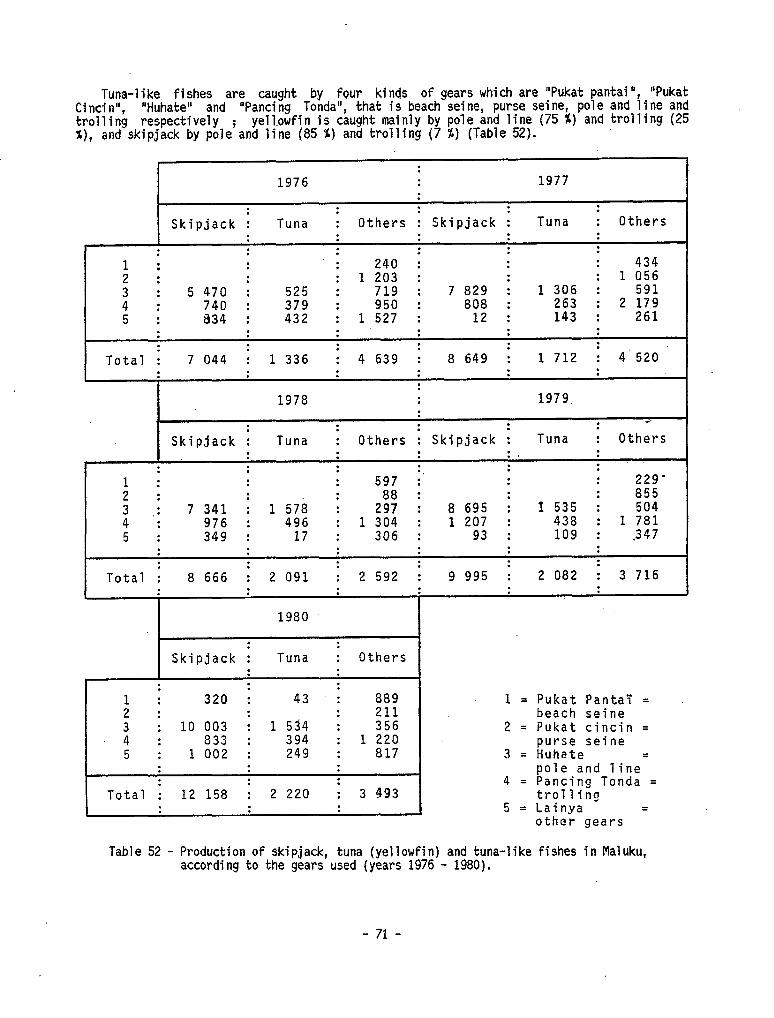
Tuna-like fishes are caught by four kinds of gears which are "Pukat pantai", "Pukat Cincin", "Huhate" and "Pancing Tonda", that is beach Seine, purse Seine, pole and line and trolling respectively ; yell.owfin is caught mainly by pale and line (75 X) and trolling (25 %), and skipjack by pole and line (85 %) and trolling (7 X) (Table 52).
. . 1976 : 1977
: : : : : :
Skipjack : Tuna : Others : Skipjack : Tuna : Others
: ; ; . .
2 : : : : . . : 1 240 203 ; : : . : . 1 434 056
i : * I
5 470 740 : : 379 525 : : 719 950 : : 7 829 808 ; : 1 306 263 i : 2 591 179 5 834 : 432 : 1 527 : 12 : 143 : 261
. . . . . . . . . : . : : . : .
Total : 7 044 : 1336 ; 4 639 : 8 649 ; :
1 712 : 4’520 . : : . . . : . .
: 1978 : 1979.
: -1 : : : : : Skipjack : Tuna : Others : Skipjack : Tuna : Others
: . . . . : . : : : : :. : . .
: - : : . . : : : 597
1 304 289;
: . : . : : 855 229
; .; . 7 341 976 : : 1 496 578 : : I : B 1 695 207 ; : 1 438 535 : : 1 504 781 5 : 349 : 17 : 306 : 93 : 109 : .347
: : : : : . . : : : . : :
Total : 8 666 : 2 091 : 2 592 I 9 995 : 2 082 : 3 716
1980
: : l Skipjack : Tuna : Others
: . . . . . .
: : : 320 i : 43 I : 889 211
-fi : : 10 003 833 : : 1 394 534 : : 1 356 220 5 : 1 002 : 249 : 817
: : : : : :
Total : 12 158 : 2 220 : 3 493
1 = Pukat Pantaï = beach seine
2 = Pukat cincin = put-se Seine
3 = Huhate pole and line=
4 = Pancing Tonda = trolling
5 = Lainya = other gears
Table 52 - Production of skipjack, tuna (yellowfin) and tuna-like fishes in Maluku, according to the gears used (years 1976 - 1980).
- 71 -
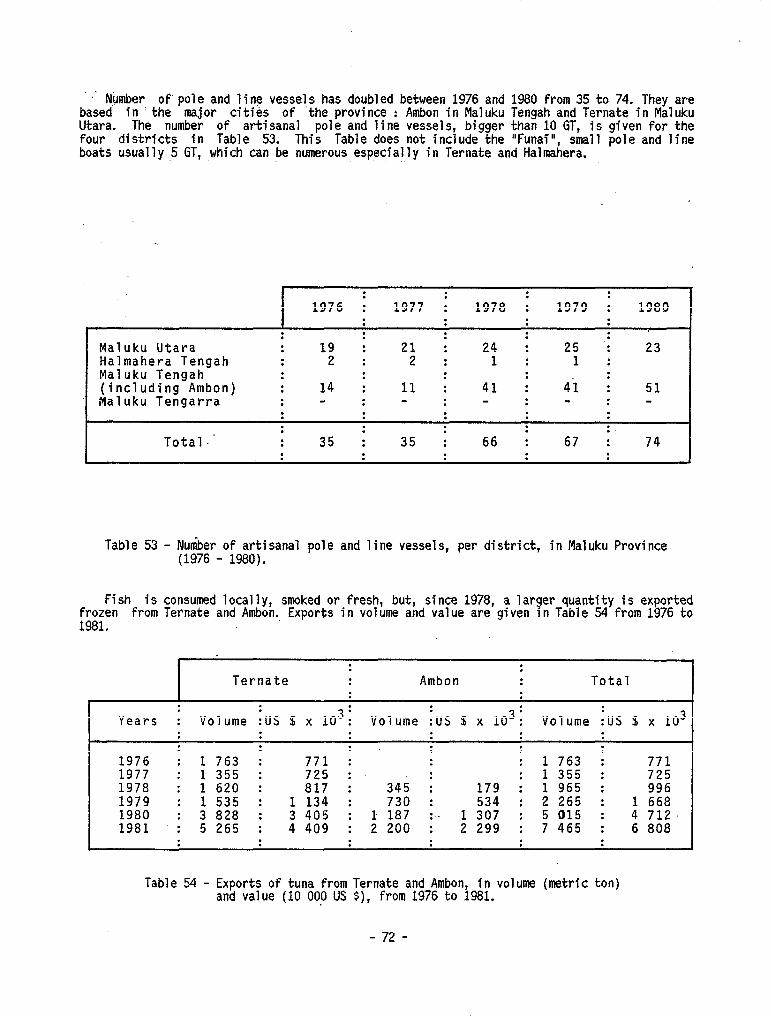
..- Nbmber of-pole and line vessels has doubled between 1976 and 1980 from 35 to 74. They are based in 'the major cities of 'the province : Ambon in Maluku Tengah and Ternate in Maluku Utara. The number of artisanal pole and line vessels, bigger than 10 GT, is given for the four districts in Table 53; This Table does not include the "Funai", small pole and line boats usually 5 GT, which cari be numerous especially in Ternate and Halmahera.
l : : : . 1976 : 1977 : 1978 : 1979 I 1980
1 . . : : : : : : : .
Maluku Utara : 19 : 21 : 24 : 25 ; 23 Halmahera Tengah : 2 : 2 : 1 : 1 : Maluku Tengah : : : : : (including Ambon) : 14 : 11 : 41 : 4i : 51 Maluku Tengarra : - : : : :
: : : . . . . : . : : :
Total-' . . 35 ; 35 : 66 : 67 : 74 : : : : :
Table 53 - Nuniber of artisanal pole and line vessels, per district, in Maluku Province (1976 - 1980).
Fish is consumed locally, smoked or fresh, but, since 1978, a larger quantity is exported frozen from Ternate and Ambon. Exports in volume and value are given In Table 54 from 1976 to 1981.
1 : . , Ternate : Ambon : Total
I : : : :
Years : Volume :US B x 103: Volume iUS S x 103i :
Volume :US B x 103
. .
; ; : : : :
1976 1763 771 : . . : 1763 : 771 1977 : 1 355 : 725 : : : 1 355 : 725 1978 : 1 620 : 817 : 345 : 179 : 1 965 : 996 1979 : 1 535 : 1 134 : 730 : 534 : 2 265 : 1 668 1980 : 3 828 : 3 405 : 1 187 :.. 1 307 : 5015 : 4 712 1981 : 5 265 : 4 409 : 2 200 : 2 299 : 7 465 : 6 808
Table 54 - Exports of tuna from Ternate and Ambon, in volume (metric ton) and value (10 000 US $), from 1976 to 1981.
- 72 -
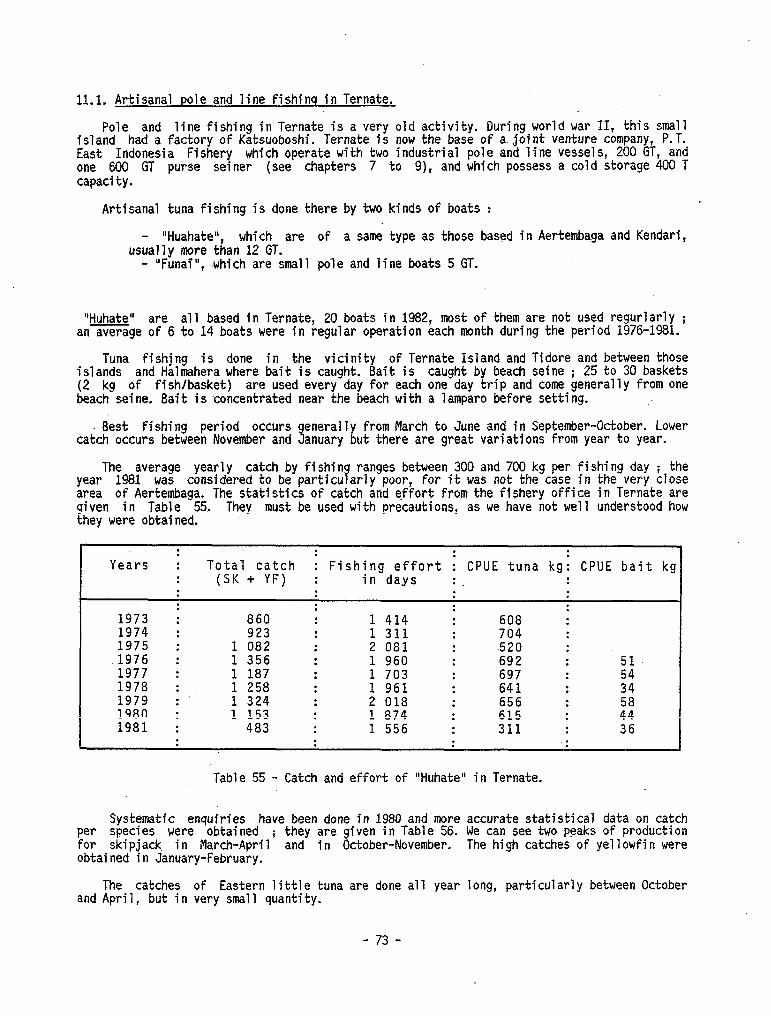
11.1. Artisanal pale and line fishinq in Ternate.
Pole and line fishing in Ternate is a very old activity. During world war II, this small island had a factory of Katsuoboshi. Ternate is now the base of a joint venture company, P.T. East Indones ia Fishery which operate with two industrial pole and line vessels, 200 GT, and one 600 GT purse seiner (see chapters 7 to 9), and which possess a cold storage 400 T capacity.
Artisanal tuna fishing is done there by two kinds of boats :
- "Huahate", which are of a same type as those based in Aertembaga and Kendari, usually more than 12 GT.
- "Funai" , .which are small pole and line boats 5 GT.
"Huhate" are a11 based in Ternate, 20 boats in 1982, most of them are not used regurlarly ; an average of 6 to 14 boats were in regular operation each month during the period 1976-1981.
Tuna fishjng is done in the vicinity of Ternate Island and Tidore and between those islands and Halmahera where bait is caught. Bait is caught by beach Seine ; 25 to 30 baskets (2 kg of fish/basket) are used every day for each one day trip and tome generally from one beach Seine. Bait is concentrated near the beach with a lamparo before setting.
Best fishing period occurs enerally from March to June and in September-October. Lower catch occurs between November and 3 anuary but Chere are great variations from year to year.
The average yearly catch by fishin ranges between 300 and 700 kg per fishing day ; the year 1981 was considered to be particu arly poor, for it was not the case in the very close 7 area of Aertembaga. The statistics of catch and effort From the fishery office in Ternate are given in Table 55. They must be used with precautions, as we have not well understood how they were obtained.
: : : .- Years : Total catch : Fishing effort : CPUE tuna kg; CPUE bait kg
. . (SK + YF) : in days : : : : : . . : : : .
1973 : 860 : 1 414 : 608 I 1974 : 923 : 1 311 : 704 : 1975 : 1 082 : 2 081 : .520 : 1976 : 1 356 : 1 960 : 692 : 51 1977 : 1 187 : 1 703 : 697 : 54 1978 : 1 258 : 1 961 : 641 : 34 1979 : .. 1 324 : 2 018 : 656 : 1980 : 1 153 : 1 874 : 615 : 2: 1981 : 483 : 1 556 : 311 : 36
: : : ~. .
Table 55 - Catch and effort of "Huhate" in Ternate.
Systematic enquiries have been done in 1980 and more accurate statistical data on catch per species were obtained ; they are given in Table 56. We cari see two peaks of production for skipjack. in March-April and in October-November. The high catches of yellowfin were obtained in January-February.
The catches of Eastern little tuna are done a11 year long, particularly between October and April, but in very small quantity.
- 73 -
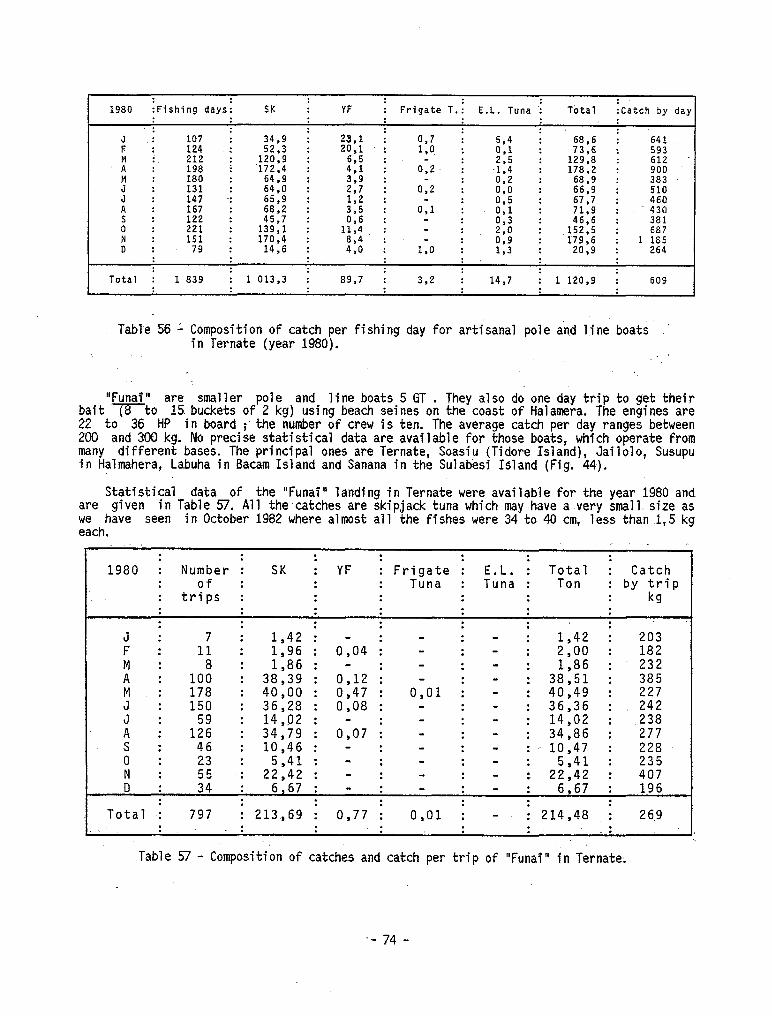
1980 IFishing daysi SK ; YF ; Frigate T.i E.L. Tuna : Total :Catch by da)
: J- : 107 : 34.9 : 23.1 : 0.7 : : 641 F : 124 : 52.3 : 20,l :
68,6 1.0 :
i:: : 73.6 : 593
AM 212 198 ; : ‘172,4 120.9 : : 46:: : : : 012
: -::: 129.8 : 178,2
: i 900 612
f;l 180 131 : :
.i :
64.9 64,0 : : 2:: : 012 k’:o I 68.9 : 66.9 : : 383 510
ii : 147 167 65,9 68,2 : : ::: : Oll 67.7 : 2; : 71.9 : : - 460 430
i : 221 122 : : 139.1 45,7 : : 1x.: 013 : 46,6 - : 152.5 : : 381 687 i : 151 79 : : 170.4 14,6 : : ::lf: - 2;
1.0 :
113 : : 1’79.6 1
20,9 : : 264 185
Total : 1 839 : 1 013.3 : 89,7 : 3,2 : 14.7 : 1 120,9 1 609
Table 56 L Composition of catch per fishing day for artisanal pole and line boats .' in Ternate (year 1980).
:
"Funai" are smaller pole and line boats 5 GT . They also do one day trip to get their bait (8to 15 buckets of 2 kg) using beach seines on the toast of Halamera. The engines are 22 to 36 HP in board ; the number of crew is ten. The average catch per day ranges between 200 and 300 kg. No precise statistical data are available for those boats, which operate from many different bases. The principal ones are Ternate, Soasiu (Tidore Island), Jailolo, Susupu in Halmahera, Labuha in Bacam Island and Sanana in the Sulabesi 1~1 and (Fig. 44).
Statistical data of the "Funai" landing in Ternate were available for the year 1980 and, are given in Table 57. Al1 the,catches are skipjack tuna which may have a very small. size as we have seen in October 1982 where almost a11 the fishes were 34 to 40 cm, less than .1,5 kg each.
: : : . : : Number : SK : YF I Frigate : E.L. :
: 1980 : Total : Catch
: of : : : Tuna : Tuna : Ton : by trip : trips : : : : : : kg : : : : : : : : : : : .
J : : 1; :
1,42 : - * - ; - : : :
: ii :
1,96 : 0,04 I - : - : 1,42 : 203 2,00 : 182
8 : 1,86 : - - - : - : 0,12 I - : - :
1,86 : 232 A : 100 : 38,39 : 38,51 : 385
: J” :
178 : 40,oo : 0,47 : 0,Ol : - : 40,49 : 227 150 : 36,28 : 0,08 : - : - : 36,36 : 242
. A I
. 1;; I
14,02 : - : - : - : 14,02 : 238 34,79 : 0,07 : - : - : 34,86 : 277
S : 46 : 10,46 : - : - : - : - 10,47 : 228 0 : : 5,41 : - : - : - : 5,41 : 235
. 55 : FI I 34 :
22,42 : - : - : - : 22,42 : 407 6,67 : - : - : - : 6,67 : 196
Total .i : : : . : :
797 : 213,69 : 0,77 : 0,Ol ; - : 214,48 : 2 6.9 : : : : : : . :
Table 57 - Composition of catches and catch per trip of "Funai" in Ternate:
-- 74 -
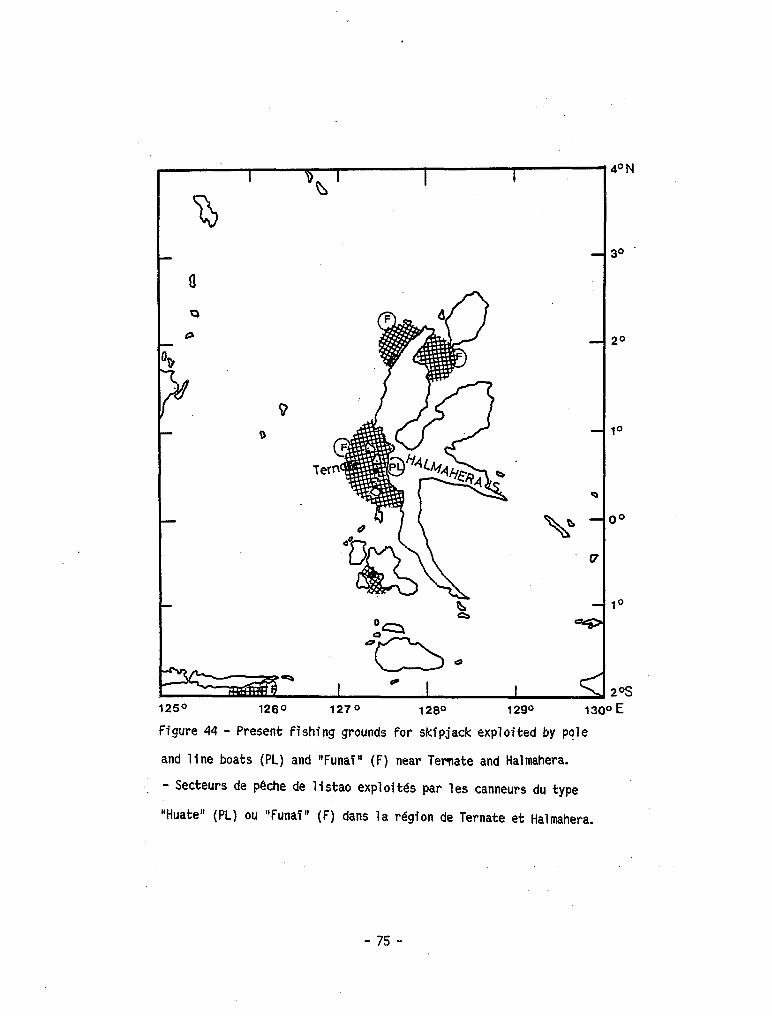
1 Db ’
I I
‘1s
m
. V
0 c
,
Terri
4ON
30
20
10
oo
10
20s 125- 1260 1270 128O 1290 1300 E
Figure 44 - Present flshing grounds for skipjack exploited by Pqle
and line boats (PL) and "FunaT" (F) near Ternate and Halmahera.
- Secteurs de pêche de listao exploités par les tanneurs du type
"Huate" (PL) ou "Funai" (F) dans la région de Ternate et Halmhera.
- 75 -
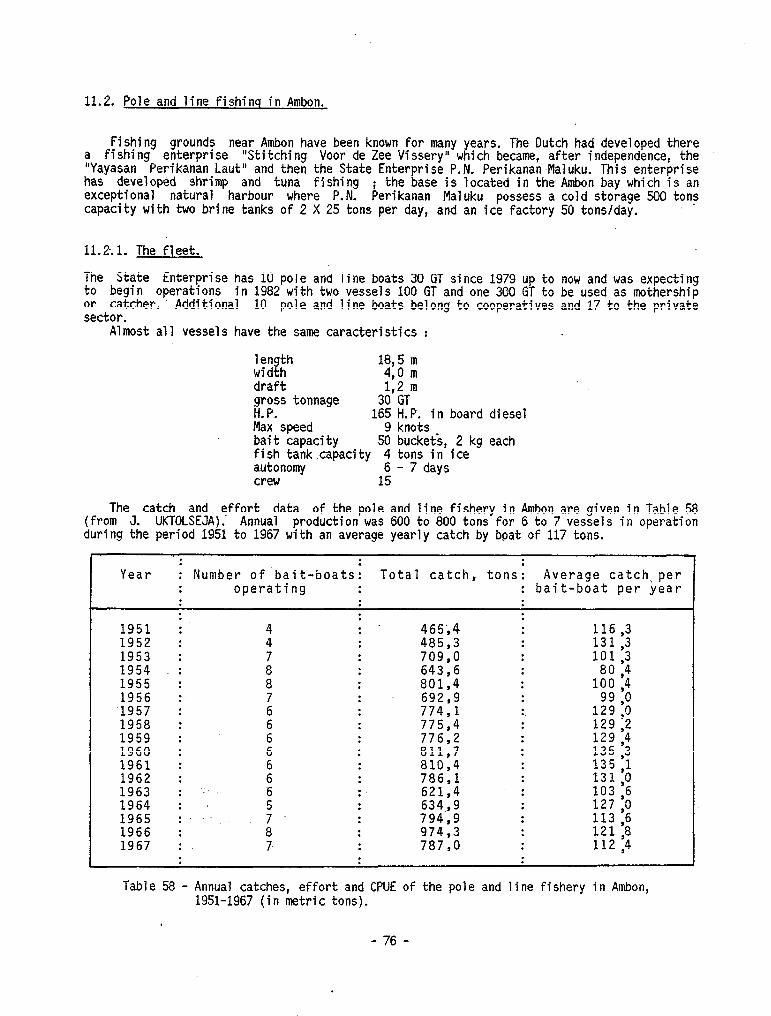
11.2. Pole and line fishing in Ambon.
Fishing grounds near Ambon have been known for many years. The Dutch had developed there a fishing enterprise "Stitching Voor de Zee Vissery" which became, after independence, the "Yayasan Perikanan Laut" and then the State Enterprise P.N. Perikanan Maluku. This enterprise has developed shrimp and tuna fishing exceptional natural harbour where P.N.
; the base 1s located in the Ambon bay which is an Perikanan Maluku possess a cold storage 500 tons
capacity with two brine tanks of 2 X 25 tons per day, and an ice factory 50 tonslday.
11.2.1. The fleet.
The State Enterprise to begin operations
has 10 pole and line boats 30 GT since 1979 up to now and was expecting
or catcher.' in 1982 with two vessels 100 GT and one 300 GT to be used as mothership
Additional sector.
10 pole and line boats belong to cooperatives and 17 to the private
Almost a11 vessels have the same caracteristics :
length width
18,5 m 4,0 m
draft 1,2 m gross tonnage 30 GT H.P. 165 H.P. in board diesel Max speed 9 knots bait capacity 50 buckets, 2 kg each fish tank capacity 4 tons in ice autonomy 6 - 7 days crew 15
The catch and effort (from J. UKTOLSEJA).
data of the pole and line fishery in Ambon are given in Table 58 Annual production was 600 to 800 tons for 6 to 7 vessels in operation
during the period 1951 to 1967 with an average yearly catch by boat of 117 tons.
: . Year : Number of bait-boatsi Total catch, tons i Average catch,per
: operating : : bait-boat per year
: 1951 : 1952 : 1953 : 1954 : 1955 : 1956 : ‘1957 : 1958 : 1959 : 1960 : 1961 : 1962 : 1963 : -, 1964 : 1965 : 1966 : 1967 :
:
: : : : : : : : : : : : : : : . .
465;4 485,3 709,o 643,6 801,4 692,9 774;1 775,4 776,2 811,7 810,4 786,l 621,4 634,9 794,9 974,3 787,0
: : : : : : : : . . : . . : : : : : : :
116 ,3 131 ,3 101,3
80 ,4 100 ,4
99 ,o 329 ,o 129,2 129,4 135 ,3 135 ,l 131 ,o 103 ,6 127 ,0 113 ,6 121 ,8 112,4
Table 58 - Annual catches, effort and CPUE of the pole and line fishery in Ambon, 1951-1967 (in metric tons).
- 76 -
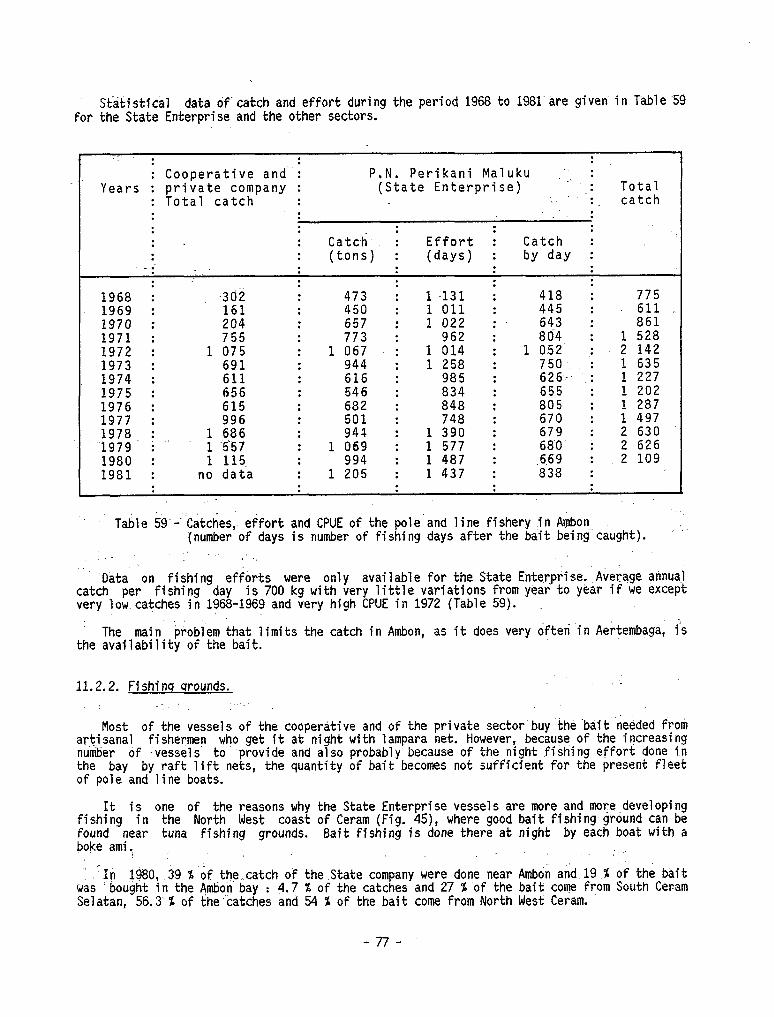
St&istical data of--catch and effort during the period 1968 to 1981 are given in Table 59 for the State Enterprise and the other sectors.
. and.i . . .
* I
Cooperative P.N. Perikani Maluku :~_ : Years private company : (State Enterprise) : Total
Total catch : : : catch : : : : : : : : : . : Catch : Effort : Catch : : : (tons) : (days) : by day :
- . . . . . : : : : . . .
1968 : -362 I :
473 : 1 -131 I 418 i 775 1969 : 161 : 450 : 1 011 : 445 : 611 1970 : 204 : 657 : 1 022 : 6.43 : 861 1971 : 755 : 773 : 962 : 80-4 : 1 528 1972 : 1 075 : 1 067 : 1 014 : 1 052 : 2 142 1973 : 691 : 944 : 1 258 : 750 ‘: 1 635 1974 : 611 : 616 : 985 : 626- .: 1 227 1975 : 656 : 546 : 834 : 655 : 1 202 1976 : 615 : 682 : 848 : 805 : 1 287 1977 : 996 : 501 : 748 : 670 : 1 497 1978 : 1 686 : 944 : 1 390 : 679 : 2 630
-’ .1979 i 1557 : 1 069 : 1 577 : 680 : 2 626 1980 : 1 115. : 994 : 1 487 : -6.69 : 2 109 1981 : no data : 1 205 : 1 437 : 838 :
. . : : : : .
Table 59 -'Catches,. effort and CPUE of the pole'and line fishery in Ambon (number of days is number of fishing days after the bait being'caught).
',
‘Data on fishing efforts were only available for the State Enterprise.'Average annual catch per fishing day is 700 kg with very little variations from year to year if we except very low catches in 1968-1969 and very high CPUE in 1972 (Table 59).
The main problem that limits the catch in Ambon, as it does very often in Aertembaga, is the availability of the bait.
11.2.2. Fishino qrounds. .'"
Most of the vessels of the coopertitive and of the private sector-buy ‘the .bait 'neéded from artisanal fishermen who get it at night with lampara net. However, because of the increasing number of -vessels to- provide and also probably because of the night fishing effort done in the bay by raft lift nets, the quantity of bait becomes not sufficient for the present fleet of pole and line boats.
It is one of the reasons why the State Enterprise vessels are more and more developing fishing in the North West toast of Ceram (Fig. 45), where good bait fishing ground cari be found near tuna fishing grounds. Sait fishi ng is done there at night by each boat with a boke ami.
I_ 'In 19i30,.39 X'of the catch of the State company were done near Ambon and 19 % of the bait was 'bought in the Ambon'bay : 4.7 % of the catches and 27 % of the bait tome from South Ceram Selatan, 56.3 % of the‘catches and 54 % of the bait tome from North West Ceram.
-77-
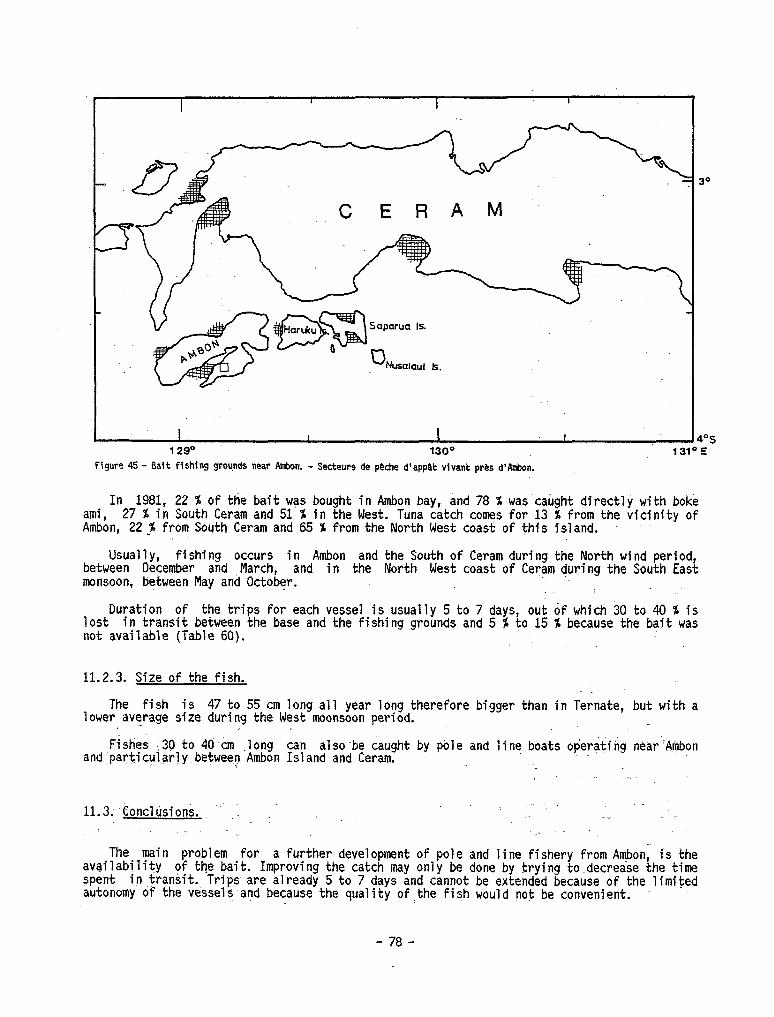
30
(ZERAM-
4Yl 129O 130° 131"E
Figure 45 - Eait Fishing groqnds near Anar - Secteurs de pkhe d'appat vivant près d'lbnbon.
ami, In 1981, 22 X of the bait was bought in Ambon bay, and 78 % was caüght directly with boké
27 95 in South Ceram and 51 % in the West. Tuna catch tomes for 13 X from the vicinity of Ambon, 22p6 from South Ceram and 65 9: from the North West toast of this island.
Usually, fishing occurs in Ambon and the South of Ceram during the North wind period, between December and March, and in the North West toast of Ceram during the South East monsoon, between May atid October.
lest Duration of the trips for each vesse1 is usually 5 to 7 days, out of which 30 to 40 % is
in transit between the base and the fishing grounds and 5 % to 15 1 because the bait was not available (Table 60).
11.2.3. Size of the fish.
The fish is 47 to 55 cm long a11 year long therefore bigger than in Ternate, but with a lower average size during the West moonsoon period.
Fishès :3D to 40'cm .long cari also'be caught by pale and line boats op‘erating near'Ambon an.d~particular1y.betwee.n Ambon Island and Ceram. '_
11;3; Conclusion& . . . : .
- _ - . . _- ,<
The main problem for a further development of pole and line fishery from Ambon; is the availability of the bait. Improving the catch may only be done by trying to decrez&e the time spent in,transit. Trips are already 5 to 7 days and cannot be extended because of the limited autonomy of the vessels and because the quality of:the fish would net be convenient.
- 78 -
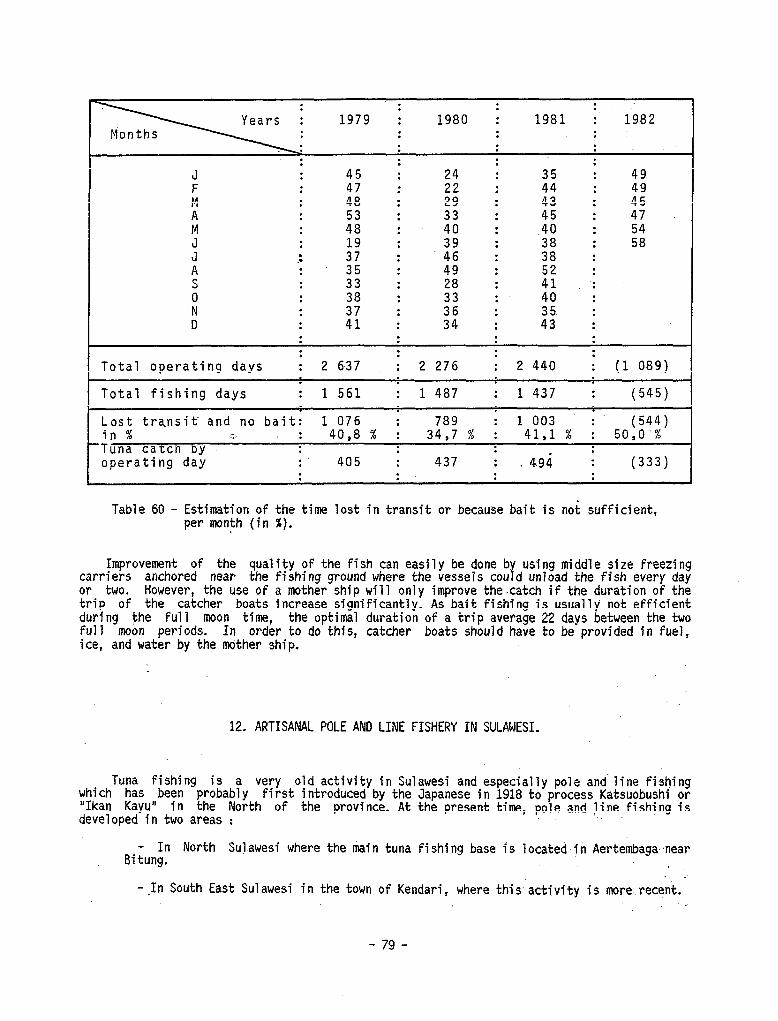
l\ : 1979 I 1980 ;
; Years : 1981 :- 1982
Months : : : . . : . .
. . . : :
: : 45 I 24 : : 49 : .
ii I .
M : 29' I ii :
: 4";
E; . . : 33 : 4: : 47 : 48 : 40 : .40 : 54
J : : :
i5 : :
.: if : Z8 : 58
A . . : z: :
49 : :
z : 28 : 4: .: : :
3"; : :
,N : 35 : 40 :
: D . . 41 : 34 : 4; :
. . : . . . . : . :
Total operating days : 2 637 _ ; 2276 : 2 440 i (1 089) . . .
Total fishing days : 1 561 ; 1 487 : 1 437 : (545) . . . Lost trqnsit and no bait: 1076 : 789 ; 1 003 : in % u? : 40,8 % : 34,7 % :
50(;?8) 41,l % : ) J 'Tuna catch by : : : :
operating day . . 405 : 437 : . 4.94 : (333) d
Table 60 - Estimation of the time lost in transit or because bait is net sufficient, per month (in %).
Improvement of the quality of the fish cari easily be done b using middle size freezing carriers anchored near the fishing ground where the vessels cou d unload the fish every day 7 or two. However, the use of a mother ship Will only improve thecatch if the duration of the trip of the catcher boats increase significantly. As bait fishing is usually not efficient during the full moon time, the optimal duration of a trip average 22 days between the two full moon periods. In order to do this, catcher boats should have to be provided in fuel, ice, and water by the mother ship.
12. ARTISANAL POLE AND LINE FISHERY IN SULAWESI.
which Tuna fishing is a very old activity in Sulawesi and especially pole and line fishing
has been probably first introduced by the Japanese in 1918 to process Katsuobushi or "Ikan Kayu" in the North of the province. At the present time, pole and line fishing is developed in two areas :
- In North Sulawesi where the main tuna fishing base is located in Aertembaga-near Bitung. 4
- .In South East Sulawesi in the town of Kendari, where thisactivity is more.recent.
- 79 -
12.i; North Sulawesi.' .:
The total number of pole and line boats was estimated to 66 in 1981, out of which 60 were based in Bitung, 3 in the district of Minahasa, 1 in Gorondalo and 2 in Manado.
The distribution of-the size of the vessels for 1981 is given as follows (in GT) :
ii Ilo g; : i 10 - 20 GT = 18 20 - 30 GT = 11 30 - 50 = 32
200 GT = 1
One 200 GT pole and line boat is used as a carrier boat. In the category 30-50 GT, a11 the vessels are of the same model, wooden boats of 30 GT built in Banyuwangi, and 30 of them belong to the State Company P.N. Perikani Aertembaga. The main source of data available is this company and Will be presented now.
12.1.1. The fleet.
From 1967 and 1977, the State Company had 10 to 12 vessels in operations, however, from 1973 .to 1978, due to mis-management the number of days of operation at sea was very low. Tine fleet has been increased to 20 boats in 1979 and since 1980, 30 vessels are in regular operations. Al1 vessels have same caracteristics as follows : 72 .
length 18 m width 4m draft 1,55 m G.T. 30 GT ix. speed 9 kts H.P. -165 H.P. Diesel capacity 5 tons of ice crew 18 .
- . .
12.:1:2. Fishinq operations.
The bait- is collected every day from artisanal fishermen using lift nets. When bait fishing is good, lift net
one -boat cari obtain its needed 40 to 50 baskets (2 kg each), on the same ; however, they usually need to get it from 3 to 6 different ones and sometime from
as much as 10 to 20. The bait is never bought but the owners of the lifts nets get the equivalent of 20 X of the catch of the boat they supply. Trips cari be 2 to 7 days long according to the quantity of tuna caught. The average number of days per trip was 3.0 in 1980, a year with a high average catch per day fishing, and 4.1 in 1982, which is a more connmn average annual value. Average percentage of the number of days at sea lost by lack of bait range from 13 !L to 19 % depending on the year. It cari be seasonally very high, especially from December to February and in July and August. Ever since 1979, the average number of days at sea per boat in operation ranges from 180 to 210. Those values are much higher than during.the period 1972-1978, but could yet be improved.
'3 li " . . i 12.1.3. Fishinq qrounds. -
Fishi,ng grounds for tuna are usually North West Sulawesi from June to August and in the South from September ‘to May. Decision to go North'or South depends on the strength and direction of the wind which may easily prevent fishing in good conditions for such small boats. We‘.. present, in Figure 46, the main fishing grounds in 1981 according to the months ; we cari see that fishing occurs almost a11 year long near Aertembaga i,n the South and East.
- 80 -
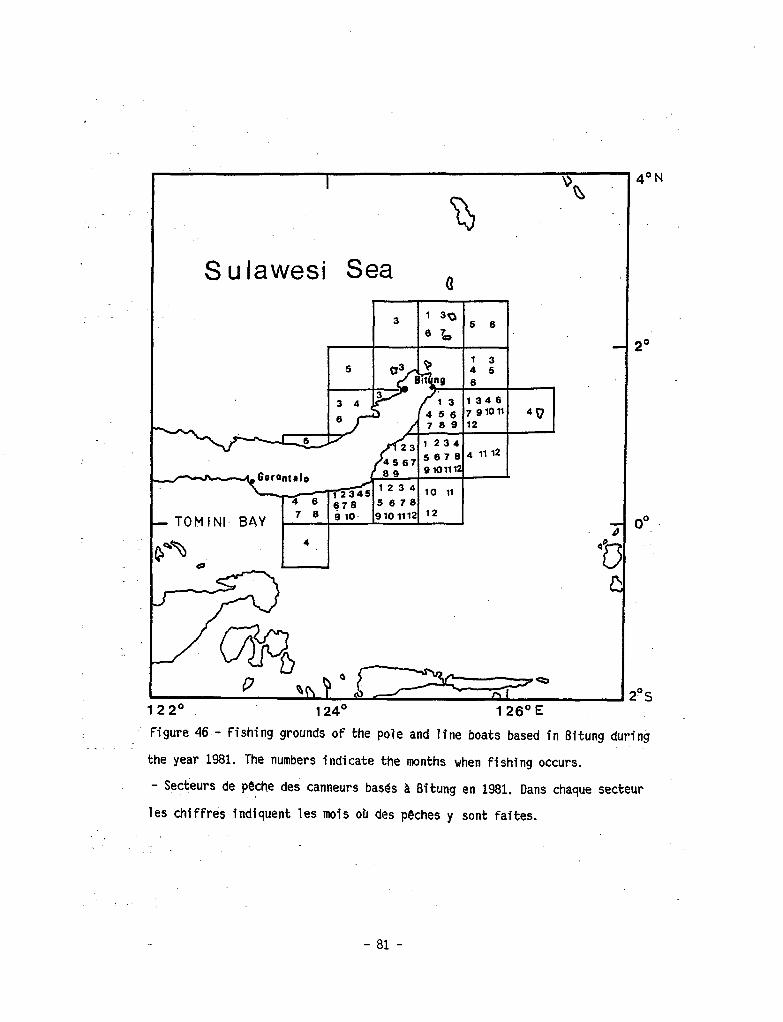
I ‘is
x -
S u lawesi Sea
122O.
I I
5 678
TOM ,N, *~y 7 5
978
910. 9101112 l2 - d
4
c
124' 126'E
4’N
OO.-
. figure 46.- Fishing grounds of the pale and 1Sne boats based in Bitung during
the year 1981. The numbers indicate the months when fishing occurs.
- Sec$eurs de peche des tanneurs basés a Bitung en 1981. Dans chaque secteur
les chiffrés indiquent les mois où des peches y sont faites.
- 81 -
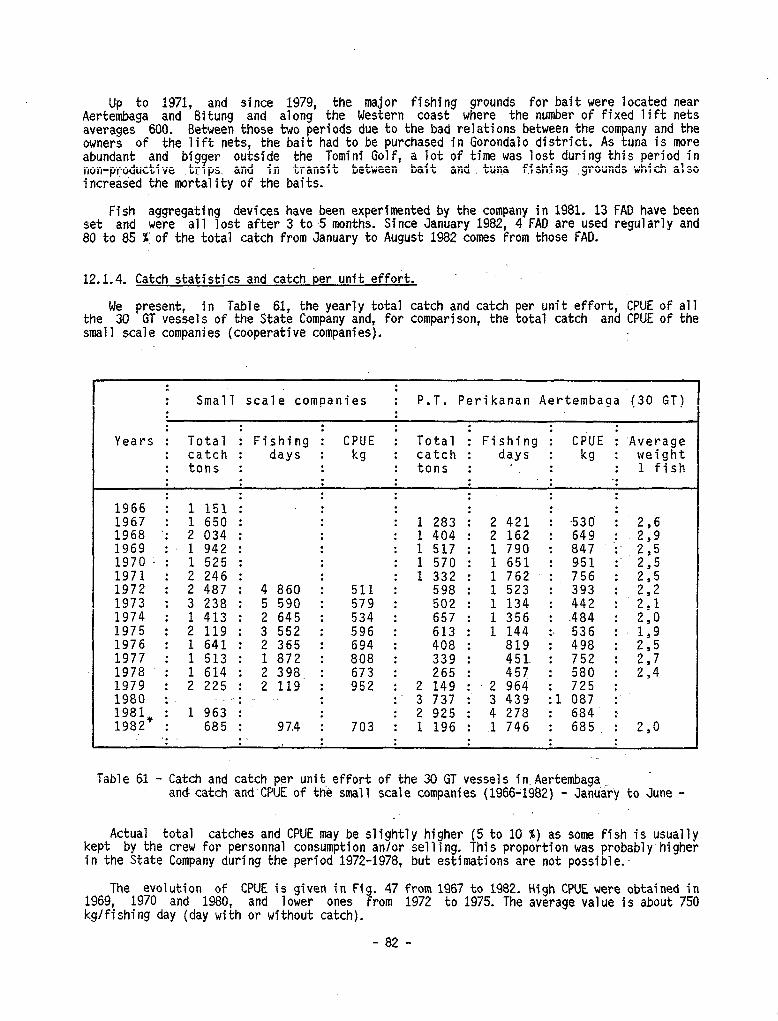
up to 1971, and since 1979, the major fishing grounds for bait were located near Aertembaga and Bitung and along the Western toast where the number of fixed lift nets averages 600. Between those two periods due to the bad relations between the company and the owners of the lift nets, the bait had to be purchased in Gorondalo district. As tuna is more abundant and bigger outside the Tomini Golf, a lot of time was lest during this period in non-productive trips and in transit between bait and. tuna fishing grounds which also increased the mortality of the baits.
Fish aggregating devices have been experimented by the company in 1981. 13 FAD have been set and were a11 lest after 3 to 5 months. Since January 1982, 4 FAD are used regularly and 80 to 85 %-of the total catch from January to August 1982 cornes from those FAO.
12.1.4. Catch statistics and catch per unit effort.
We present, in Table 61, the yearly total catch and catch per unit effort, CPUE of a11 the 30 GT vessels of the State Company and, for comparison, the total catch and CPUE of the small scale companies (cooperative companies).
: : : Small scale companies : P.T. Perikanan Aertembaga (30 GT) : : : . . : . . . .
Years : Total : Fishing I CPUE : Total I Fishing : CPUE ; ‘Average : catch : days : kg : catch : days : kg : weight : tons : : . . tons : . : : 1 fish : : : : : : -. . . .
1966 ; 1 151 I : : : : : : . . : : .
1967 : 1 650 : : : 1 283 : 2 421 : -530 ; 2,6
1968 .: 2 034 : : : 1 404 : 2 162 : 649 1969 : 1 942 : : : 1 517 : 1 790 : 847 i 25 1970 : 1 525 : : : 1 570 : 1 651 : 951 :’ 215 1971 : 2 246 : . . 1972 : 2 487 : 4860 i 511 I
1 332 : 1 762 : 756 : 2,5 598 : 1 523 : ,393 : 2,2
1973 : 3 238 : 5 590 : 579 : 502 : 1 134 : 442 : 2,l 1974 : 1 413 : 2645 : 534 : 657 : 1 356 : .484 :;2,0 1975 : 2 119 : 3 552 : 596 : 613 : 1 144 :. 536 : 1,9 1976 : 1 641 : 2 365 : 694 : 408 : 819 : 498 : 2,5 1977 : 1 513 : 1 872 : 808 : 339 : 451. : 752 : 2,7 1978 : 1 614 : 2398 : 673 : 265 : 457 : 580 : 2,4 1979 : 2 225 : 2119 : 952 : 2 149 : 2 964 : 725 :
E1 .’ : : 1 963 . I : . . * . 1982’ 3 2 737 925 : : 4 3 439. 278 :l : 087 : : : 685 : 97,4 I 703 I 1 196 : 1 746 : ::5- : 2,0 ,. . .
L . . . : : : : 1 _
Table 61 - Catch and catch per unit effort of the 30 GT vessels in Aertembaga,.. and: catch and CPUE of thé small scale companies (1966-1982) - January to June -
kept Actual total catches and CPUE may be slightly higher (5 to 10 I) as some fish is usually
by the crew for personnal consumption an/or selling. This proportion was probably,higher in the State Company during the period 1972-1978, but estimations are not possible..
The evolution of CPUE is given in Fig. 47 from 1967 to 1982. High CPUE were obtained in 1969, 1970 and 1980, and lower ones from 1972 to 1975. kglfishing day (day with or without catch).
The average value is about 750
- 82 -
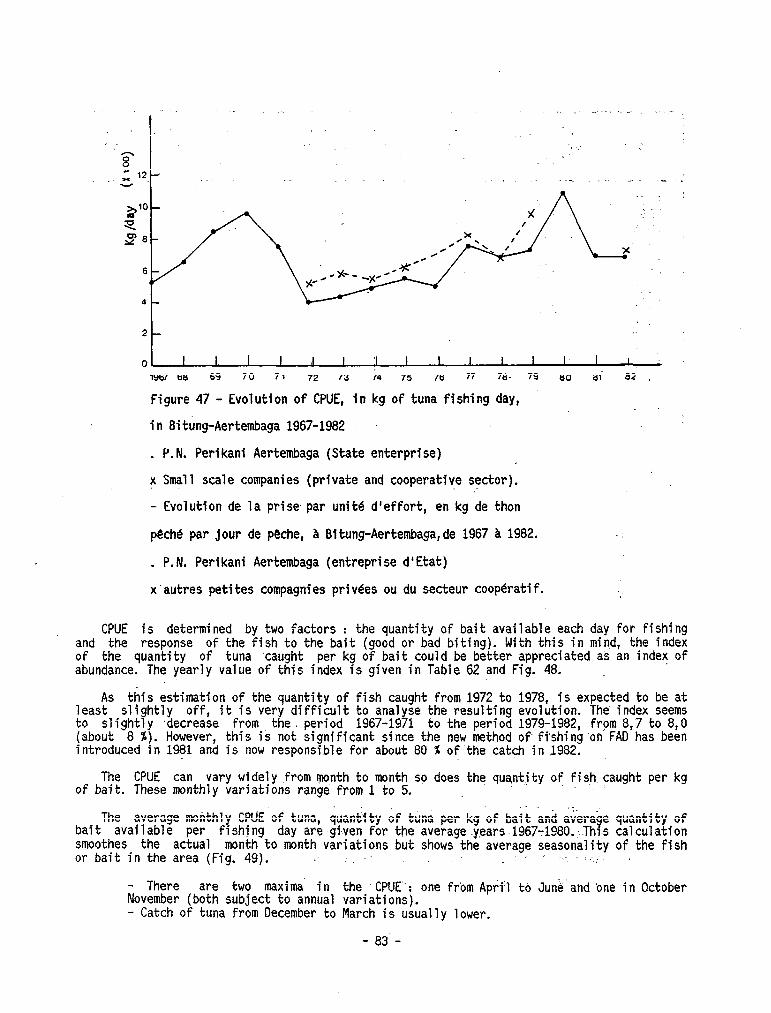
’
0 I l I I I I I I I I I I 1. I I
1967 66 69 70 7 1 72 73 74 75 76 77 78. 79 a0 ai a2
Figure 47 - Evolution of CPUE, in kg of tuna fishing day,
in Bitung-Aertembaga 1967-1982
. P.N. Perikani Aertembaga (State enterprise)
x Small scale companies (private and cooperative sector). :
- Evolution de la prise par unfte d'effort, en kg de thon
peche par jour de peche, à Bitung-Aertembaga,de 1967 a 1982.
. P.N. Perikani Aertembaga (entreprise d'Etat)
x'autres petites compagnies privees ou du secteur coopératif.
CPUE is determined by two factors : the quantity of bait available each day for fishing and the response of the fish to the bait (good or bad biting). With this in mind, the index of the quantity of tuna caught per kg of bait could be better appreciated as an index of abundance. The yearly value of this index is given in Table 62 and Fig. 48.
As this estimation of the quantity of fish caught from 1972 to 1978, is expected to be at least slightly off, it is very difficult to analyse the resulting evolution. The index seems to slightly ,decrease from the I period 1967-1971 to the period 1979-1982, frpm 8,7 to 8,0 (about 8 %). However, this is not significant since the new method of‘ fishing on FAD has been introduced in 1981 and is now responsible for about 80 % of the catch in 1982.
The CPUE cari vary widely .from month to month SO does the quantity of fishcaught per kg of bait. These monthly variations range from 1 to 5.
bait The average monthly CPUÉ of tuna, quantity of tuna per kg of hait and average quantity of
available per fishjng day are-given for the average .years 1967-1980. ..Thi.s calculation smoothes the actual month to month variations but shows the average seasonality of the fish or bait in the area (Fig. 49). . , . .,_ : ., :
- There are two maxima' in the CPUE“: one fr'om Apri:l to June'and one in October November (bath subject to annual variations). - Catch of tuna from December to March is usually lower.
- 83. -
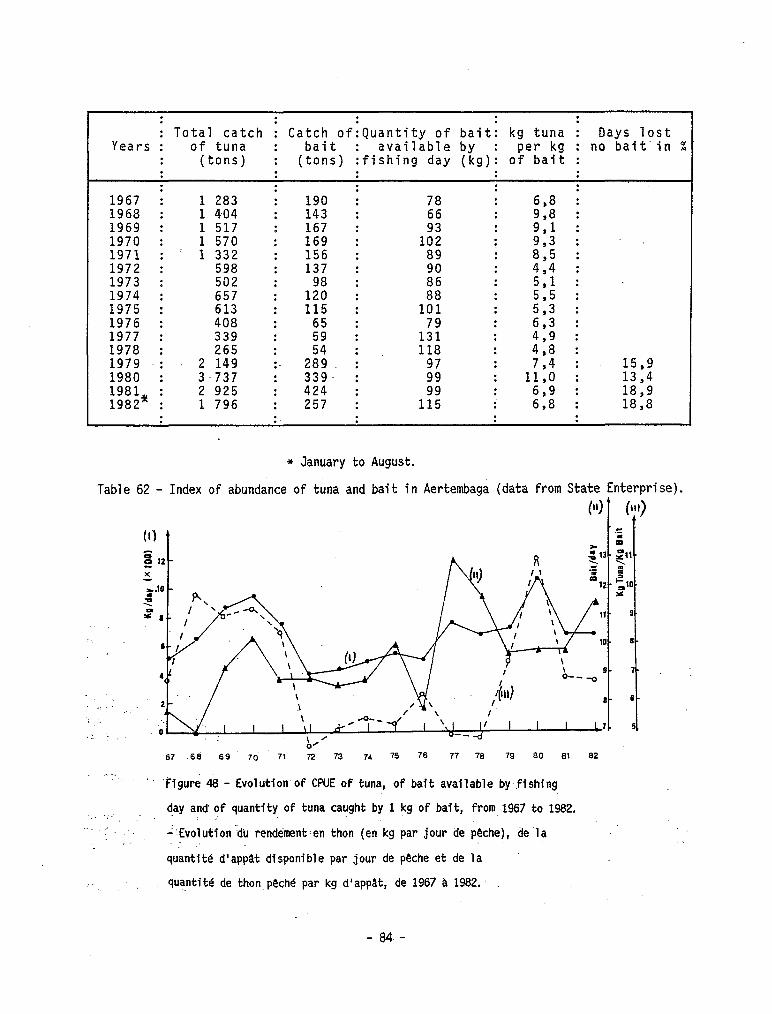
: : : Total catch : Catch of
ofiguantity baiti : kg tuna : Days lost
Years : of tuna : bait : available by : per kg : no bait'in % : (tons) : (tons) :fishing day (kg): of bait : : : : : : : : : : . .
1967 : 1 283 : 190 : 78 : : 1968 : 1404 : : 9:: : 1969 : 1 517 :
143 : 93” 167 : : .
1970 : 1 570 : 169 : 102 : z::
I 1971 ’ : 1 332 : 156 : 89 i fi:: : 1972 : 598 : 137 : 90 : : 1973 : 502 : : : 1974 : 657 :
12: : 88 : :
55’; .
1975 : 613 : 115 : 101 : 5:3 I 1976 : 408 : : 1977 : 339 :
65 : 1:: 5: : :
2: : :
1978 : 265 : : 118 : 418 : 1979 -: 2 149 :- : 7,4 : 15,9 1980 : 3 737 :
289 : 9; 339. : : 11,o : 13,4
1981 1982’
: 2 925 : : : 1 796 :
424 : 1;; 257 : :
ii:; : 18,9 : 18,8
. : : : . .
* January to August.
Table 62 - Index of abundance of tuna and bait in Aertembaga (data from State Enterprise).
‘. 'figure 48 - Evolution'of CWE of tuna, of bait available by..Pishing
:,: .~ day and- of quantity of tuna caught by 1 kg of bait, from,1967 to 1982. . . . _ ::Evolution-du rendément:en thon (en kg par jour de peche), de la
,
quantite dlappat disponiblè par jour de peche et de la
: quantité de thon pech& par kg dlappat, de 1967 ii 1982. *_
- 84. -
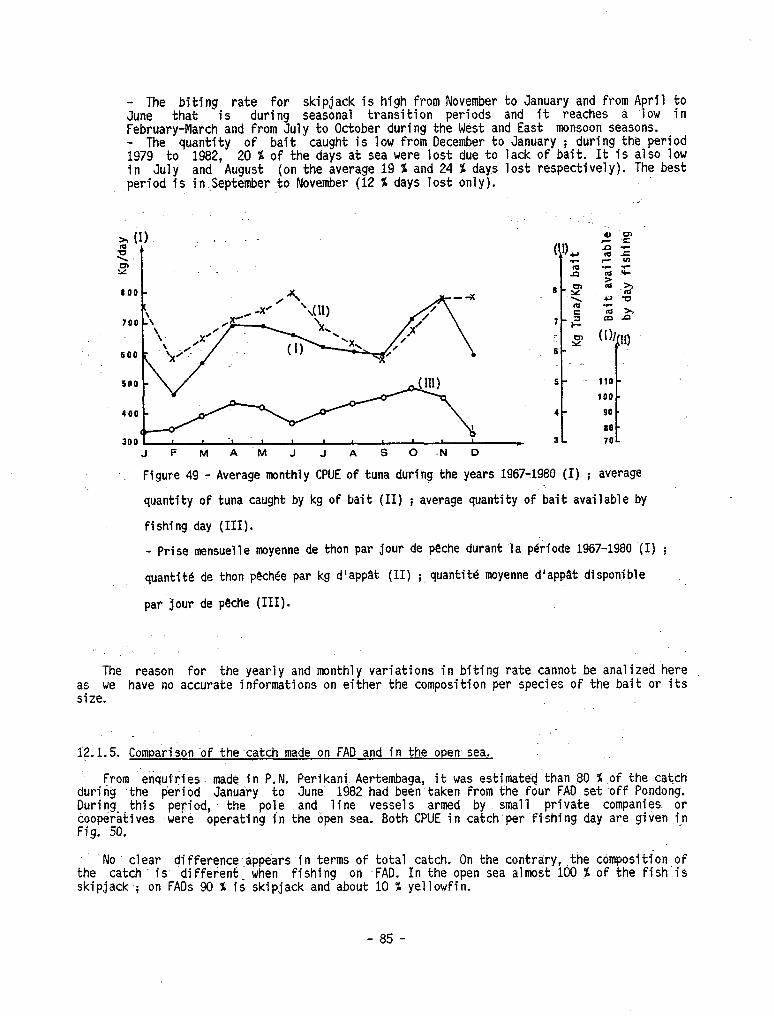
- The biting rate for skipjack is high from November to January and from April to June that is during seasonal transition periods and it reaches a low in February-March and from July to October during the West and East monsoon seasons. - The quantity of bait caught is low from December to January ; during the period 1979 to 1982, 20 % of the days at sea were lost due to lack of bait. It is also low in Jul y and August (on the average 19 % and 24 1 days lost respectively). The best period is in September to November (12 % days lost only).
600
600
300 I . I I t *
J F M A M J J A S 0 .N D
-. Figure 49 - Average monthly CPUE of tuna during the years 1967-1980 (1) i average '_
quantity of tuna caught by kg of bait (II) i average quantity of bait available by
fishing day (III).
- Prise mensuelle moyenne de thon par jour de peche durant la periode 1967-1980 (1) i
quantité de thon pechee par kg d'appat (II) ;,quantité moyenne d'appat disponible
par jour de peche (III).
The reason for the yearly and monthly variations in biting rate cannot be analized here as we have no accurate informations on either the composition per species of the bait or its size.
i?. 1.5. Comp&ison of the catch made on FAD and in the open sea.
From 'enquiries made. in P.N. Perikani. Aertembaga, it was estimated than 89 96 of the catch durin the period January to June 1982 had been taken from the four FAD set off Pondong. During-.this period, the pole and line vessels armed by small private companiss or cooperatives were operating in the open sea. 60th CPUE in catch'per'fishing day are given in Fig. 50.
=No clear ,difference.appéarsin terms of total catch. On the contrary, -the composition of the catch is different- when fishing on FAD. In the open sea almst 100 $ of the fish'is skipjack ; on FADs 90 % is skipjack and about 10 % yellowfin.
- 85 -
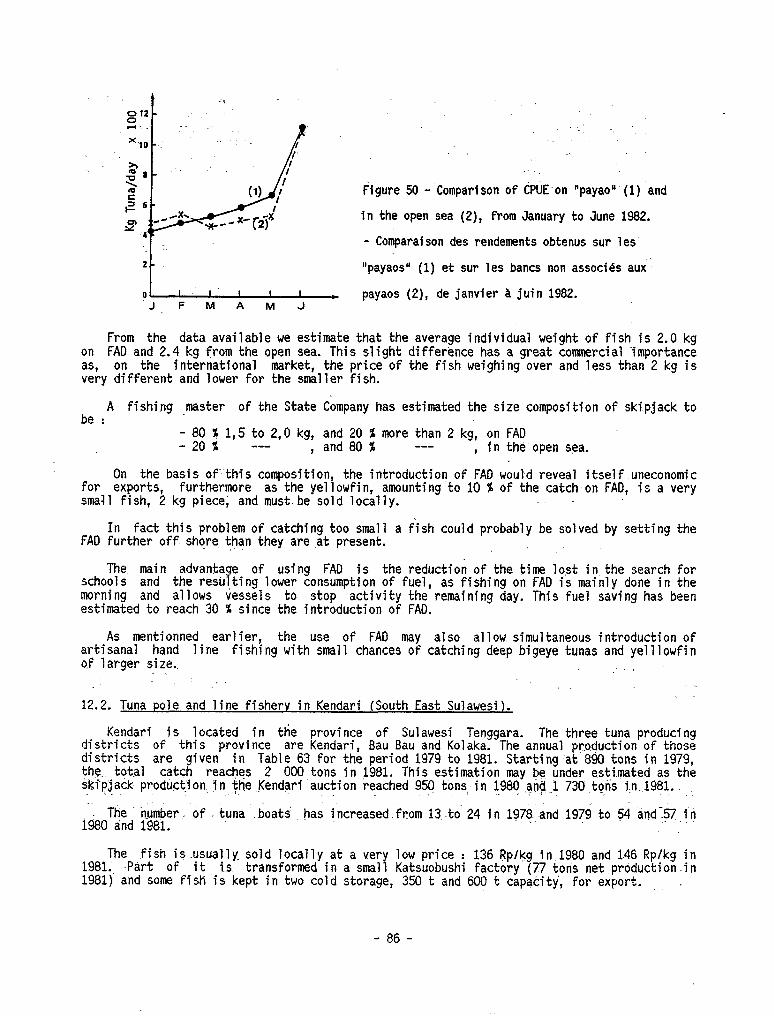
- :. A -- !
5412 - : ;
%lO -' . . '_
~~
Figure 50 - Comparison of CPÜE on "payao' (1) and
in the open sea (2), from January to June 1982.
- Comparaison des rendements obtenus sur les' - 2- "payaos" (1) et sur les bancs non assocfds aux‘
0 I - , l 1 I * payaos (2), de janvier a juin 1982. JFMAMJ
From the data available we estimate that the average individual weight of fish is 2.0 kg on FAD and 2.4 kg from the open sea. This slight differénce has a great commercial ïmportance as, on the international market, the price of the fish weighing over and less than 2 kg is very different and lower for the smaller fish.
be : A fishing ,master of the State Company has estimated the size composition of skipjack to
- 80 % 1,5 to 2,0 kg, and 20 % more than 2 kg, on FAD - 20 % A,, , and 80 % --- , in the open sëa.
On the basis of-this composition, the introduction of FAD would reveal itself uneconomic for exports, furthermore as the yellowfin, amounting to 10 % of the catch.on FAD, is a very small fish, 2 kg piece; and mustbe sold locally.
In fact this problem of catching too small a fish could probably be solved by setting the FAD further off shore, than they are .at present.
The main advantage of using FAD is the reduction of the time lost in the search for schools and the resùl.ting lower consumption of fuel, as fishing on FAD is mainly done in the morning and allows vessels to stop activity the remaining day. This fuel saving has been estimated to reach 30 % since the introduction of FAD.
As mentionned earlier, the use of FAD may also allow simultaneous introduction of artisanal hand line fishing with small chances of catching deep bigeye tunas and yelllowfin of larger size., :
12.2. Tuna pole and line fisherv in Kendari (South East Sulawesi).
Kendari is located in the province of Sulawesi Tenggara. The three tuna producing districts of this province are Kendari, Bau Bau and Kolaka. The annual production of those districts are given in Table 63 for the period 1979 to 1981. Starting at 890 tons in 1979, the. total catch reaches 2 000 tons in 1981. This estimation may be under estimated as the skrpjack prodùctlon,in, th,e,Kendari auction reached 950 tons: in 1988 and-1 730.tons iZn-1981.. ., :
The number..-of tuna ".boats has increased.from 13.-to. 24 in 1978 and 1979 to $4 and-n,i'n i&O tind 1981.
The fish is usually. sold locally at a very low price : 136 Rplkg in.1980 and 1.46 Rplkg in 1981.. -Part of it is transformed in a small. Katsuobushi factory (77 tons net production-in 1981) and some fish is kept in two cold storage, 350 t and 600 t capacity, for export. 1
- 86 -
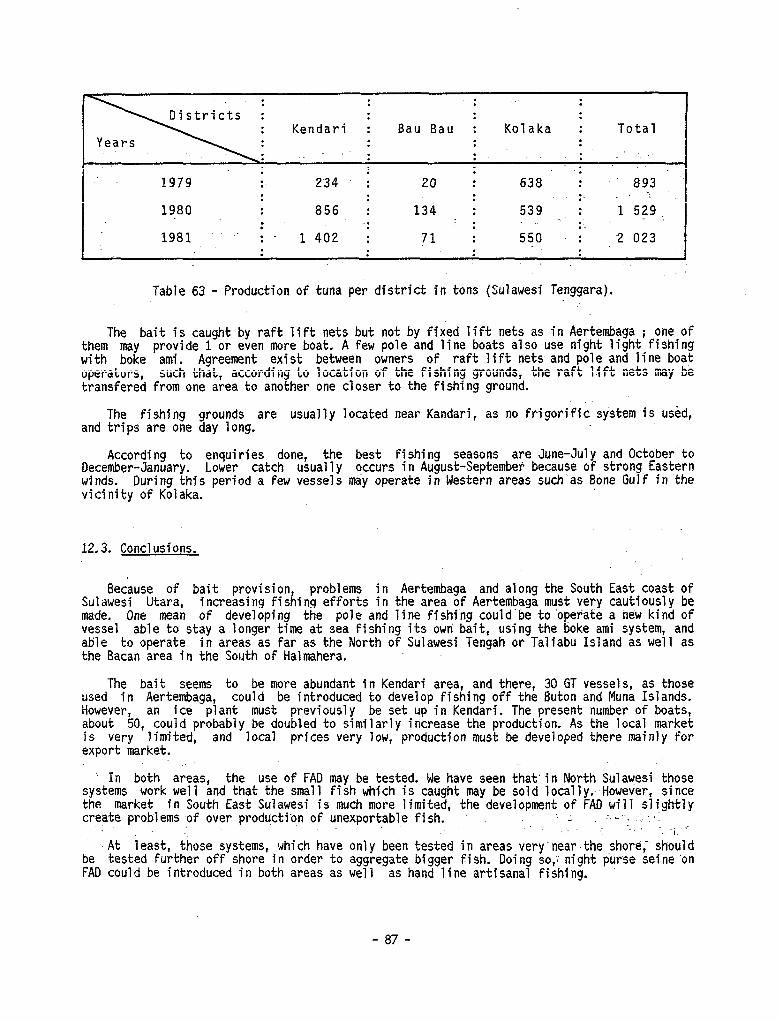
: : : :
Kendari : Bau Bau : Kolaka : Total : : . .
: 1979 : 234 i
: ..: .' 20 : 638 - ; .' 893
: . 1980 : 856 ;
: 134 :
: 539 : -1 529
: _ . . . . 1981 ,- ; 1 402 ;
:~ 71 I -_, ; 550 -2 023
. . .
Table 63 - Production of tuna per district in tons (Sulawesi Tenggara).
The bait is caught by raft lift nets but not by fixed lift nets as in Aertembaga ; one of them may provide 1 or even more boat. A few pole and line boats also use night light fishing with boke ami. Agreement exist between owners of raft lift nets and pole and line boat operators, such that, according to location o.f the fishing grounds,.the raft lift nets may.be transfered from one area to another one closer to the fishing ground.
The fishing grounds are usually located near Kandari, as no frigorifie system is used, and trips are one day long.
According to enquiries done, December-January.
the best fishing seasons are June-July and October'to Lower catch usually occurs in August-September because of strong~ Eastern
winds. During this period a few vessels tiy operate in Western areas such‘as Bone Gulf in the vicinity of Kolaka.
12.3. Conclusions.
Because of bait provision, problems in Aertembaga and along the South East toast of Sulawesi Utara, increasing fishing efforts in the area of Aertembaga must very cautiously be made. One mean of developing the pole and lin@ fishing could.be to'operate a new kind of vesse1 able to stay a longer time at sea fishing its own bait, using the boke ami system, and able to operate in areas as far as the North of Sulawesi Tengah or Taliabu Island as well as the Bacan area in the South of Halmahera.
The bait seems to be more abundant in Kendari area, and there, 30 GT vessels, as those used in Aertembaga, could be introduced to develop fishing off the Buton and Muna Islands. However, an ice plant must previously be set up in Kendari. The present number of boats, about 50, could probably be doubled to similarly increase the production. As the local market is very limited, and local prices very low, production must be developed there mainly for export market.
In both areas, the use of FAD may be tested. We have seen that'in North Sulawesi those systems work well and that the small fish which is caught may be sold locally. However, since tha market in South East Sulawesi is much more limited, the development of FAD Will slightly creste problems of over production of unexportabl,e fish. :. ."i. . ,; ".
I t At least, those systems, which have only been tested in areas very‘near.the~ shore; should
be tested further off shore in order to aggregate bigger fish. Doing SO,: night purse seine'on FAD could be introduced in both areas as well as hand line artisanal fishing.
- 87 -
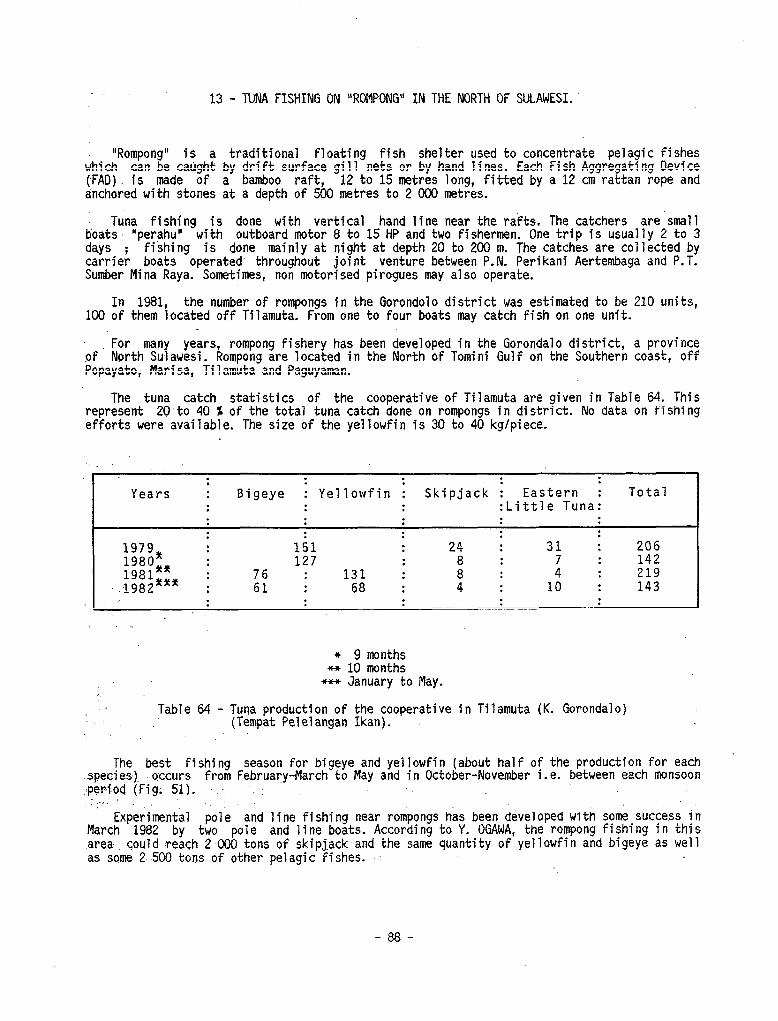
13 - TUNA FISHING ON "ROMPONG" IN THE NORTH OF SULAWESI.
"Rompong" is a which -cari be caught (FAD). is made of anchored with stones
traditional floating fish shelter used to concentrate pelagic fishes by drift surface gill nets or by hand lines. Each Fish Aggregating Device a bamboo raft, 12 to 15 metres long, fitted by a 12 cm rattan rope and at a depth of 500 metres to 2 CCKI metres.
: Tuna fishing is done with vertical hand line near the rafts. The catchers are small boats. "perahu" with outboard motor 8 to 15 HP and two fishermen. One trip is usually 2 to 3 dw i fishing is done mainly at night at depth 20 to 200 m. The catches are collected by carrier boats operated throughout joint venture between P.N. Perikani Aertembaga and P.T. Sumber Mina Raya. Sometimes, non motorised pirogues may also operate.
In 1981, the number of rompongs in the Gorondolo district was estimated to be 210 units, 100 of them located off Tilamuta. From one to four boats may catch fish on one unit.
For many years, rompong fishery has been developed in the Gorondalo district, a province of: North Sulawesi. Rompong are located in the North of Tomini Gulf on the Southern toast, off Popayato, Marisa, Tilamuta and Paguyaman.
The tuna catch statistics of the cooperative of Tilamuta are given in Table 64. This represent 2D.to 40 % of the total tuna catch done on rompongs in district. No data on fishing efforts were available. The size of the yellowfin is 30 to 40 kg/piece.
_
. . . . : : :
Years : Bigeye I Yellowfin : Skipjack : Eastern * : : : :Little Tuna;
Total
1 : : : : : : : : : 206 142 219 143
I . . . . . . . . : I .”
+ 9 months +f+ 10 months
+u+ January to May.
Table 64 - Tuna production of the cooperative in Tilamuta (K. Gorondalo) (Tempat Pelelangan Ikan).
The best fishing season for bigeye and yellowfin (about half of the production for each species). occurs from February-March to May and in October-November i.e. between each monsoon :peri.od (.Fig: 51). '. . . . . ;
Experimental pole and line fishing near rompongs has been developed with some success in March 1982 by two pole and line boats. According to Y. OGAWA, the rompong fishing in this ares could reach 2 -000 tons of skipj.ack and the same quantity of yellowfin and bigeye as well as some 2 500 tons of other pelagic fishes.
-88-
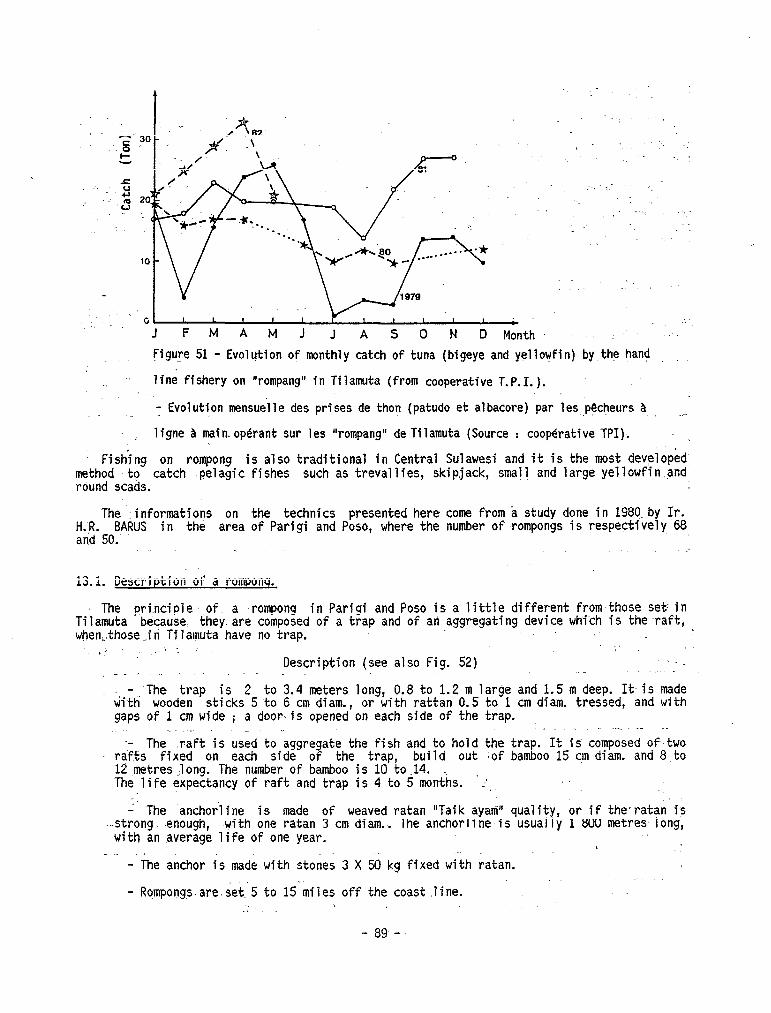
‘. ‘. ... ._ ... ._ . . 1 . . 1
‘- ‘- ._’ ._’
J J FMAMJJASON FMAMJJASON D Month D Month
figure 51 - Evolution of monthly catch of tuna (bigeye and yellowfin) by the hand figure 51 - Evolution of monthly catch of tuna (bigeye and yellowfin) by the hand
. . line ffshery on 'rompang" fn Tflamuta (from cooperative T.P.I.). line ffshery on 'rompang" fn Tflamuta (from cooperative T.P.I.).
. . ,_ . . ,_ - Evolution mensuelle des prises de thon (patudo et albacore) par les pecheurs a - Evolution mensuelle des prises de thon (patudo et albacore) par les pecheurs a . . _ .,c _ .,c
I ligne a main.opérant sur les "rompang" de Tilamuta (Source : cooperative TPI).
Fishing on rompong is also traditional in Central Sulawesi and it is the most developed' method to catch pelagic fishes such as trevallies, skipjack, small and large yellowfin and round scads.
The informations on the technics presented here tome from a study done in 198eby Ir. $....50B~RUS in the area of Parigi and Poso, where the number of rompongs is respectlvely 68
.
13.1. Description of a romponq.
The principle off a rompong in Parigi and Poso is a little different from those set: in Tilamuta because they.are composed of a trap and of an aggregating device which is the raft, when,.those,.in Tilamuta have no trap.
.:: i -. ; Description (see also Fig. 52) _ _- _ ._ _ .- .
- 'The trap is 2 to 3.4 meters long, 0.8 to 1.2 m large and 1.5 m deep. It is made &th wooden sticks 5 to 6 cm diam., or with rattan 0.5 to 1 cm diam. tressed, and with gaps of 1 cm wide i a door is opened on each side of the trap.
-- The raft is used to aggregate the fish and to hold the trap. It is composed of-two rafts fixed on each side of the trap, build out :of bamboo 15 cm diam. and 8.to 12 metres:long. The number of bamboo is 10 to.14. The life expectancy of raft and trap is 4 to 5 months. ':,
- The anchorline is made of weaved ratan "Taik ayam" quality, or if the*ratan is strong. .enough, with one ratan 3 cm diam... The anchorline is usually 1 800 metres,long,
with an .average life of one year. -_. . . .
- The anchor is made with stones 3 X 56 kg fixed with ratan.
- Rqmpongs.are.set'5 to 15‘miles off the coast.line. . _-
.
- 89..-
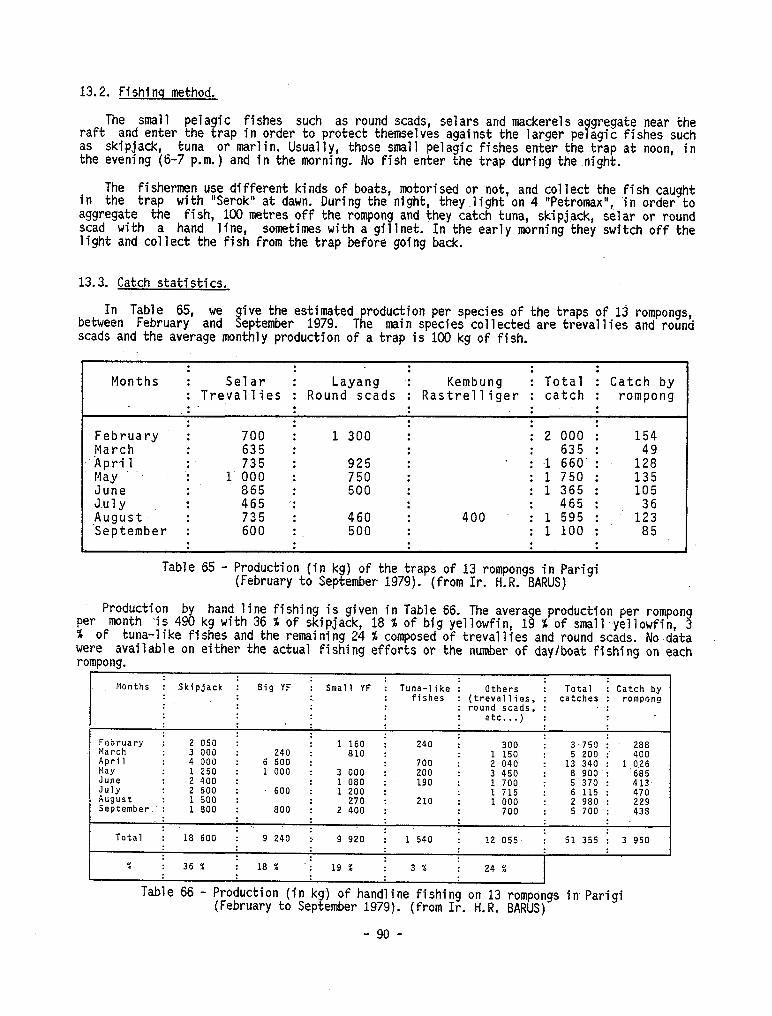
13.2. Fishinq method.
The small raft
pela ic and enter the z
fishes such as round scads, selars and mackerels a gregate near the
as skipjack, rap in order to prote& themselves against the larger pe agit fishes such 7
tuna or marlin. Usually, those small pelagic fishes enter the trap at noon, in the evening (6-7 p.m.) and in the morning. No fish enter the trap during the night.
The fishermen use different kinds of boats, motorised or not, and colle& the fish caught in the trap with "Serok" at dawn. During the night, they~light on 4 "Petromax", 'in order to aggregate the fish, 100 metres off the rompong and they catch tuna, skipjack, selar or round scad with a hand line, sometimes with a gillnet. In the early morning they switch off the light and collect the fish from the trap before going back.
13.3. Catch statistics.
In Table 65, we between February and 8
ive the estimated production per species of the traps of 13 rompongs, eptember 1979. The main species collected are trevallies and round
scads and the average monthly production of a trap is 100 kg of fish.
: : : : : Months : Selar : Layang : Kembung : Total : Catch by
: Trevallies : Round scads : Rastrelliger : catch : rompong .: . . : : : : : . : :
February : 700 : 1 300 I : 2 000 : 154
March : 635 : : . . 635 : April : 735 : 925 : ’ : 1;: May ‘. : 1 000 : 750 : ;
1 3;;. . 135
June : 865 500 : : 1 365 ; 105 J.u 1 y : 465 ,i : .
I 465 :
pugus t : 735 : 460 : 400 1 595 : 12 September : 600 : 500 : : 1 100 : 85
. : . . . . . :
7
Table 65 - Production (in kg) of the traps of 13 rompongs in Parigi (February to September 1979). (from Ir. H.R. BARUS)
Production by hand line fishing is given in Table 66. The average production per rompong per month -is 490 kg with 36 % of skipjack, 18 % of big yellowfin, 19 % of small yellowfin, 3 ix of tuna-like fishes and the remaining 24 % composed of trevallies and round scads. No.data were available on either the actual fishing efforts or the number of day/boat fishing on each romponu.
I ”
Months : Skipjack : Big YF I Small YF : Tuna-like : Others : Total fishes
: Catch by ; ;;(;;a;;;;:, catches rompong
> : : -: :
etc...) :
February : 2 050 : 1160 Narch
; 240 : 300 I 3 750 : 288 3 000 : 240 : 810 :
April 1150 : 5 200 :. 400
4 000 : 6 600 : 700 : Hay 2040 : 13 340 : 1 1 250 : 1 000 0.26 : 3 000 : 200
June
: 3 450 :
8 900 : 685
2 400 : 1 080 190 July
: : 1 700 : 5 370 : 413, 2 600 : 600 : 1 200
August : 1 715 6 115 : 470
1 500 : : 270 : September
210 : 1 000 : 2 980 : 229 : 1 800 : 800 : 2 400 : 700 : 5.700 : 438
: : Total : 18 600 : 9 240 : 9 920 : 1 540 : 12 055 : 51 355 : 3 950
% : 36% : 18% -i 19 % 3% 24 %
Table 66 - Production (in kg) of handline fishing on 13 rompongs in Parigi (February to September 1979). (from Ir. H.R. BARUS)
- 90 -
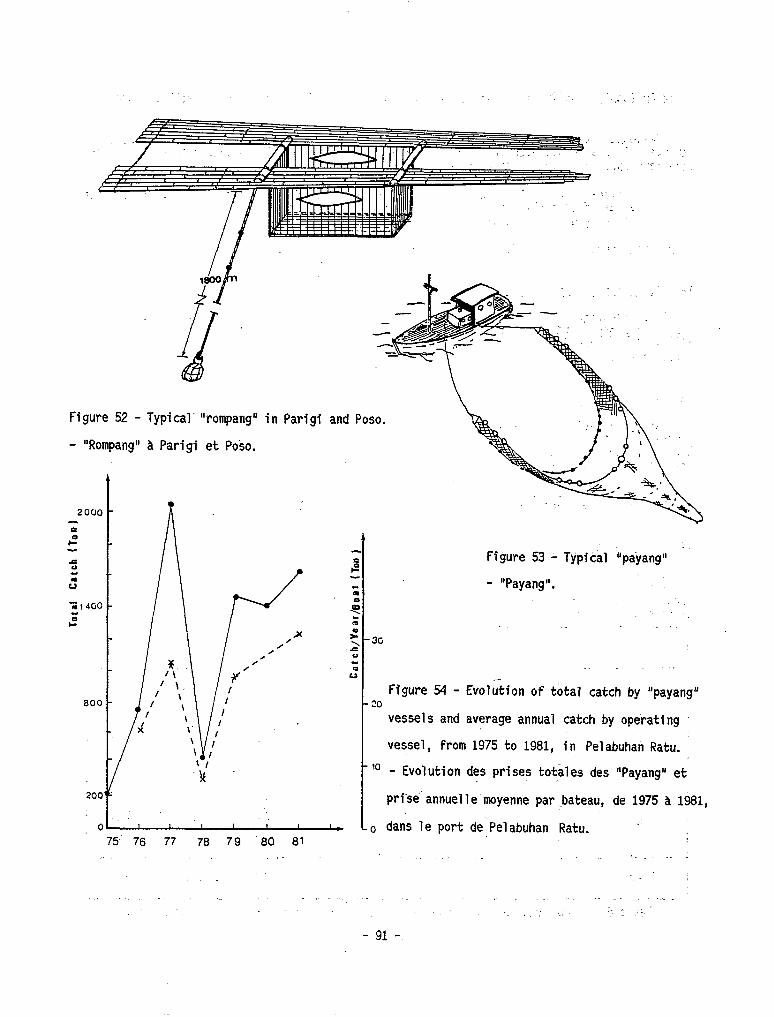
2000
c
t
5
u"
Zl4GO
0 c
800
200
C
/ ,
l-
Figure 52 - Typical‘ Vompang" in Parigi and Poso.
- "Rompang" à Parigi et Poso.
75’ 76 77 70 79 80 81 <,
Figure 53 - Typical :"payang"
- "Payang". ._
. . ._ -.
30
Figure 54 - Evolution of total catch by "payang" 20
vessels and average annual catch by opérating
vessel, from 1975 to 1981, in Pelabuhan Ratu.
10 - Evolution des prises totales des "Payang" et
prïsé'annuelle moyenne par~bateau, de 1975 a 1%X,
o dans le port de.Pelabuhan Ratu. '
,. . . ..:
._ _ . . _ .~
:“y :.
- 91 -.
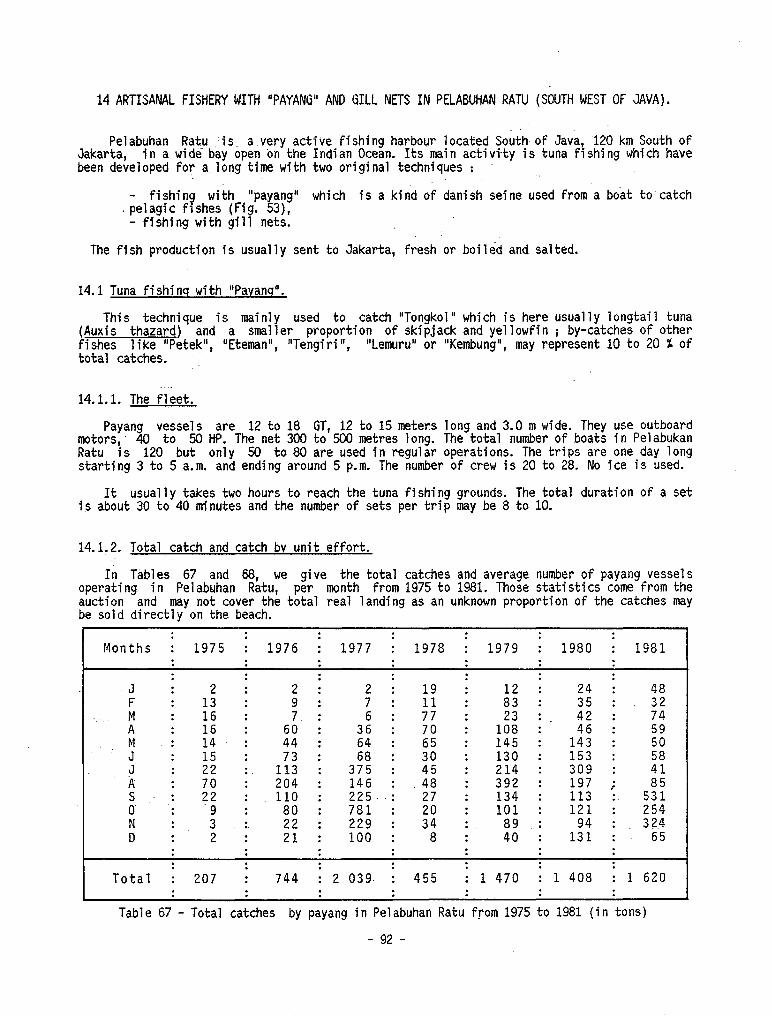
14 ARTISANAL FISHERY WITH "PAYANG" AND GILL NETS IN PELABUHAN RATU (SOUTH WEST OF JAVA).
Pelabuhan Ratu -is a very active fishing harbour located South of Java, 120~km South of Jakarta, in a widë bay open on the Indian Ocean. Its main activi-ty is tuna fishing which have been developed for a long time with two original techniques :
- fishing with "pa ang" !i
which is a kind of danish Seine used from a boat to-catch . pelagic fishes (Fig. 3),
- fishing with gill nets.
The fish production is usually sent to Jakarta, fresh or boiled and salted.
14.1 Tuna fishinq with "Payanq".
This technique is mainly used to catch "Tongkol" which is here usually longtail tuna (Auxis thazard) and a smaller proportion of skipjack and yellowfin ; by-catches of other fishes like "Petek", "Eteman", "Tengiri", "Lemuru" or "Kembung", may represent 10 to 20 1 of total catches.
14.1.1. The fleet.
Payang vessels are 12 to 18 GT, 12 to 15 meters long and 3.0 m wide. They use outboard motors; 40 to 50 Ht'. The net 300 to 500 metres long. The total number of boats in Pelabukan Ratu is 120 but only 50 to 80 are used in regular operations. The trips are one day long starting 3 to 5 a.m. and ending around 5 p.m. The number of crew is 20 to 28. No ice is used.
.It usually takes two hours to reach the tuna fishing grounds. The total duration of a set is about 30 to 40 minutes and the number of sets per trip may be 8 to 10.
14.1.2. Total catch and catch bv unit effort.
In Tables 67 and 68, we give the total catches and average number of payang vessels operating in Pelabuhan Ratu, per month from 1975 to 1981. Those statistics tome from the auction and may not caver the total real landing as an unknown proportion of the catches may be sold directly on the beach.
: : : : : . Months : 1975 : 1976 : 1977 : 1978 : 1979 : 1980 ; 1981
: : : : . . . . . : : : : . :
,J : 2 : 2 : 19 I . 24 : 48
L . . I
:6 I : 9 :
3 :
: :: :
tz
I 6 : : 10;
: 42 :
: 74
. A : 36 : : : M -: :4. : : ii : : 64 : 55 : 145 : 1:: I 5:
J :
15 :
73 :
68 :
i5 :
130 :
153 :
J
i
:
7’; :
113 : 375 : : 214 : 309 : 41
k 204 : 146 : .48 : 392 : 197 ; s : 22 : 110 : 225.. : 34 2;
: 134 : 113 :. 5:: N- : . 3 9.. I 80: : 781 229 : : : : 101
2: : ii
: .
I I
121 94 : : 324 254
D 2 : 100 : 8 : 131 : 65 . . : : : : : : : : .
744 I : : : :
Total : 207 : 2 039, : 455 : 1 470 : 1 408 : 1 620 : : : : : : :
Table 67 - Total catches by payang in Pelabuhan Ratu from 1975 to 1981 (in tons)
- 92 -
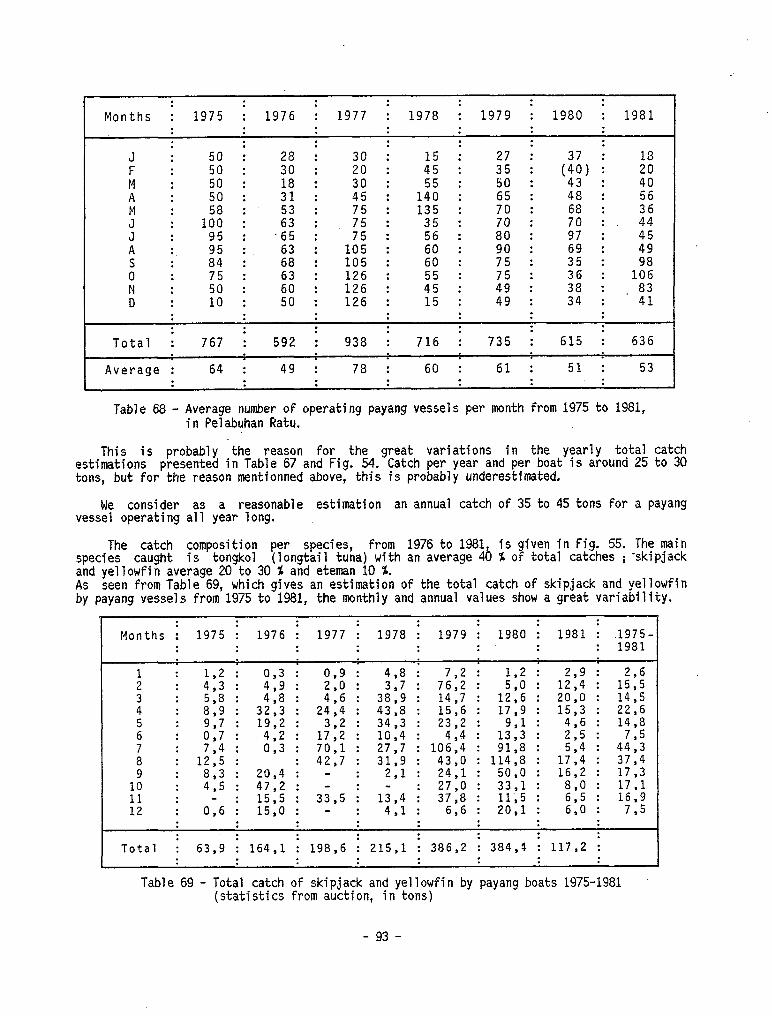
. : . . : . : Months i 1975 : 1976 : 1977 I 1978 : 1979 i 1980 : 1981
: . . : . . : :
i : . :
J F :
:: : 28 ; 30 - : : :
: 30 : 20 I 2 .
I 27 35
: (Z) 13 :
i
M : 5: . 3:: : 30 : I 45:
1:; : 50 : 43 : :i A : : 65 : 48 : 56
J” : : 1:: I . 53 : : :5 : : 135 35 : : 70 70 : : 68 J : 95: .65 : : 80 : 93
: . I
i4”
A : 05 : :
ci : :i . 105 : : : I : 105 126 : :
5: : 90 : 69 : 495 60 : 75 : : 35 36 : : 106 98
FI I :o 10 : : 50 6: : : 126 126 : : :; 15 : : 4; 49 : : 38 34 : : 83 41 : : : : . : : : : : : : : :
Total : 767 : 592 : 938 : 716 : 735 : 615 : 636 . . .
Average : 64 : 49 : 78 : 60 : 61 : 51 : 53 : : : : : : :
Table 68 - Average number of operating payang vessels per month from 1975 to 1981, in Pelabuhan Ratu.
This is probably the reason for the great variations in the yearly total catch estimations presented in Table 67 and Fig. 54. Catch per year and per boat is around 25 to 30 tons, but for the reason mentionned above, this is probably underestimated.
We consider as a reasonable estimation an annual catch of 35 to 45 tons for a payang vesse1 operating a11 year long.
The catch composition per species, from 1976 to 1981, is given in Fig. 55. The main species caught is tongkol (longtail tuna) with an average 40 % of total catches ; skipjack and yellowfin average 20 to 30 % and eteman 10 %. As seen from Table 69, which gives an estimation of the total catch of skipjack and yellowfin by payang vessels from 1975 to 1981, the monthly and annual values show a great variability.
: : : : : : Months : 1975 : 1976 : 1977 : 1978 : 1979 : 1980 : 1981 : .1975-
: : : : : 1981
: : ii:: : :
4:; : 90” : 48: 7,2:
: ; :
: 8:“9 : 32? :
416 : 3’7 :
3819 : 76,2 : 5G : 12: : 12: 14,7 : 1216 : 2010 : 1415
24,4 : 19:2 : 3,2 :
43,8 : 15,6 : 17,9 : 15,3 : 22,O
2 : :
23 : 34,3 : 14,8
.4,2 : 7 : 7:4: 0,3:
17,2 : 10,4 : 23,2 : 9,l : 2,; :
4,4 : 13,3 : 795 70,l : 27,7 : 106,4 : 91,8 : 5:4 : 44,3
8 : 12,5 : : 42,7 : 31,9 : 43,0 : 114,B : 17,4 : 37,4 9 : :
fi? : 20,4 : - : 2,l : 24,l : 50,o : 16,2 : 17,3
10 : 11 : i:
47,2 : - : - : 27,0 : 15,5 : 33,5 : 13,4 : 37,8 :
;;,; : ;a; : 17,l : : 16,9
12 : 0,6 : 15,0 : - : 4,l : 6,6 : 2O:l : 610 : 7,5 : : : :
: : : : : : : Total : 63,9 : 164,l : 198,6 : 215,l : 386,2 : 384,s : 117,2 :
: : : :
Table 69 - Total catch of skipjack and yellowfin by payang boats 1975-1981 (statistics from auction, in tons)
- 93 -
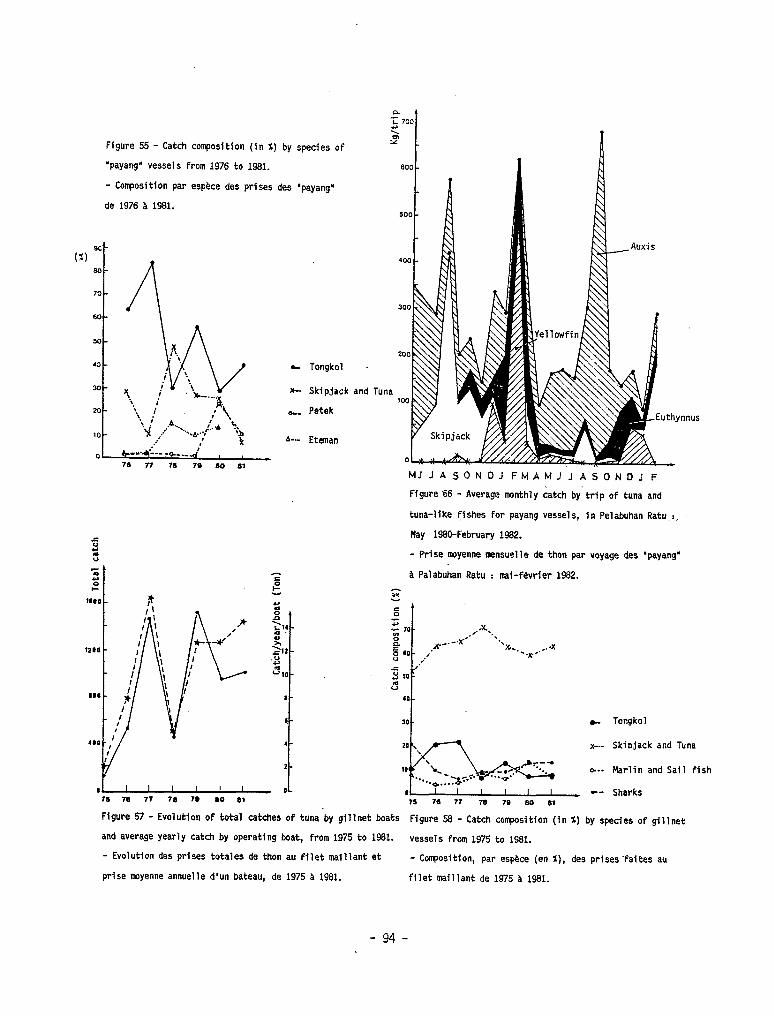
Figure 55 - Catch composition (fn I) by species of
'payang" vesses from 1976 to 1961.
- Composition par espece des prises des "payang"
de 1976 a 1981.
e Tongkol .
x-. Skipjack and
P,.- Petek
A-- Etanan
Tuna
MJJA50NDJFMAMJJASONDJF
Figure 66 - Average monthly catch by trip of tuna and
tuna-llke flshes for payang vessels, In Pelabuhan Ratu :~
May l%%February 1962.
- Prise moyenne mensuelle de thon par voyage des 'payang"
a Palabuhan Ratu : mai-fevrfer 1962.
H
c Tongkol
x-- Skiojack and Tuna
o.a- Marlin and Sail fish
-- Sharks 7s 76 77 76 79 80 *1
Figure 57 - Evolution of total catches of tuna by gillnet boats Figure 56 - Catch composition (in X) by species of gillnet
and average yearly catch by operating boat, From 1975 to 1961. vessels from 1975 to 1981.
- Evolutlon des prises totales de thon au fflet maillant et - Compositfon, par esp&ce (en I), des prises'faites au
prise moyenne annuelle d'un bateau, de 1975 a 1981. Filet maillant de 1975 a 1391.
-94-
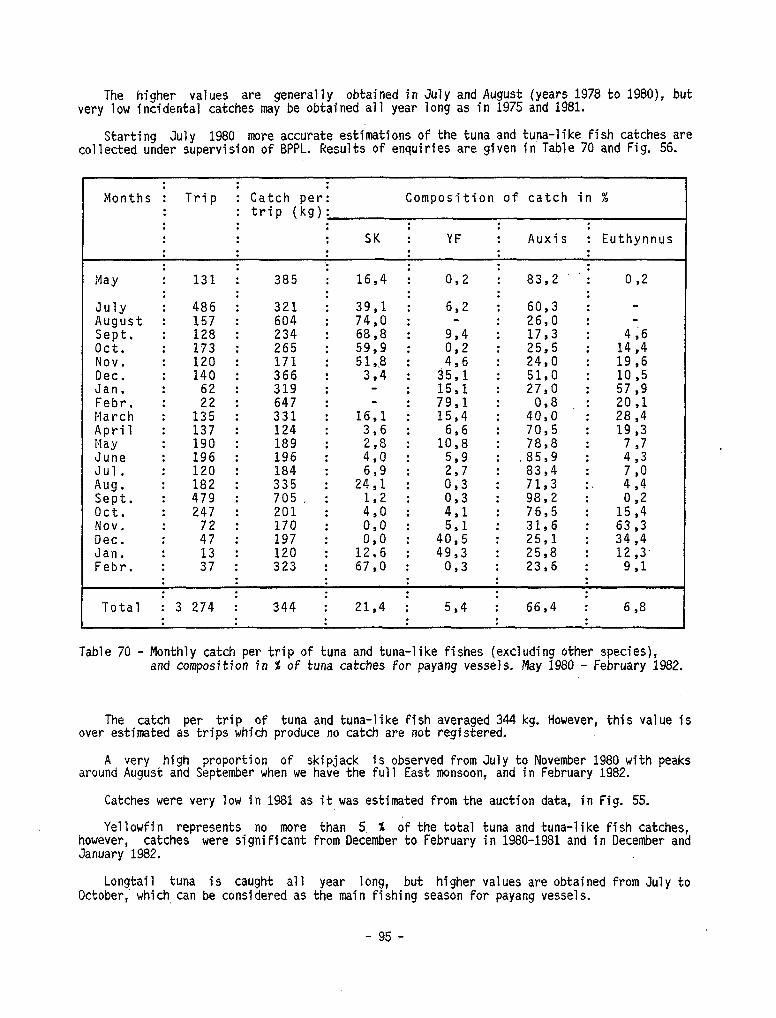
The higher values are generally obtained in Jul y and August (years 1978 to 1980), but very low incidental catches may be obtained a11 year long as in 1975 and 1981.
Starting July 1980 more accurate estimations of the tuna and tuna-like fish catches are collected under supervision of BPPL. Results of enquiries are given in Table 70 and Fig. 56.
. Months i
: Trip : Catch peri Composition of catch in %
: : trip (kg): . . : . . .
: : : : : SK ; YF : Auxis : Euthynnus : : : : : : : : '.
385 i : : :
Ma y : 131 : 16,4 : 0,2 : 83,2 : 0,2 : : : .
July : 486 : 321 : 39,l ; : :
6,2 : 60,3 : - August : 157 : 604 : 74,0 : - : 26,0 : -, Sept, : 128 : 234 : 68,8 : : 17,3 : oct. : 173 : 265 : 59,9 : 0:; : 25,5 : 12: Nov. : 120 : 171 : 51,8 : . 24,0 : 1916 Dec. : 140 : 366 : 3,4 :
$51;
15:1 ; 51,0 : 10,5
Jan. : Fi; . 319 : - I
: : 27,0 : 57,9 Febr. : 647 : - : 79,l : : 20 ,l March : 135 : 331 : 16,1 : 15,4 : 42: : 28 ,4 April : 137 : 124 : 3,6 : 6,6 : 7015 : 19,3 Ma y : 190 : 189 : : 108 : 78,8 : 7,7 June : 196 : 196 :
42:: : 519 : . 85,9 : 4,3
Jul. : 120 : 184 : 24::
: 0’3
: 83,4 : Aug. : 182 : 335 : :
0’3 : 71,3 :. 2:
Sept. : 479 : 705 , : i::
: : 98,2 : 0:2 oct. : 247 : 201 : : 411 : 76,5 : 15,4 Nov. : ii: . 170 : pi . .
I ; 4x
I 31,6 : 63 13
Dec. : 197 : 25,l : 34,4 Jan. : Febr. :
3'3 : 120 : 12:6 : 4913 : 25,8 : 12,3. : 323 : 67,0 : 0,3 : 23,6 : 9,l
: : : : : : . . . . i
: Total 3 274 ; 344 I 21,4 ; 5,4 ; 66,4 : 6,8
: : : : : :
Table 70 - Monthly catch per trip of tuna and tuna-like fishes (excluding other species), and composition in % of tuna catches for payang vessels. May 1980 - February 1982.
The catch per trip of tuna and tuna-like Fish averaged 344 kg. However, this value is over estimated as trips which produce no catch are not registered.
A very high proportion of skipjack is observed from July to November 1980 with peaks around August and September when we have the full East monsoon, and in February 1982.
Catches were very low in 1981 as it was estimated from the auction data, in Fig. 55.
Yellowfin represents no more than 5. 2 of the total tuna and tuna-like fish catches, however, catches were significant from December to February in 1980-1981 and in December and January 1982.
Longtail tuna is caught a11 year long, but higher values are obtained from July to October,' which, cari be considered as the main fishing season for payang vessels.
- 95 -
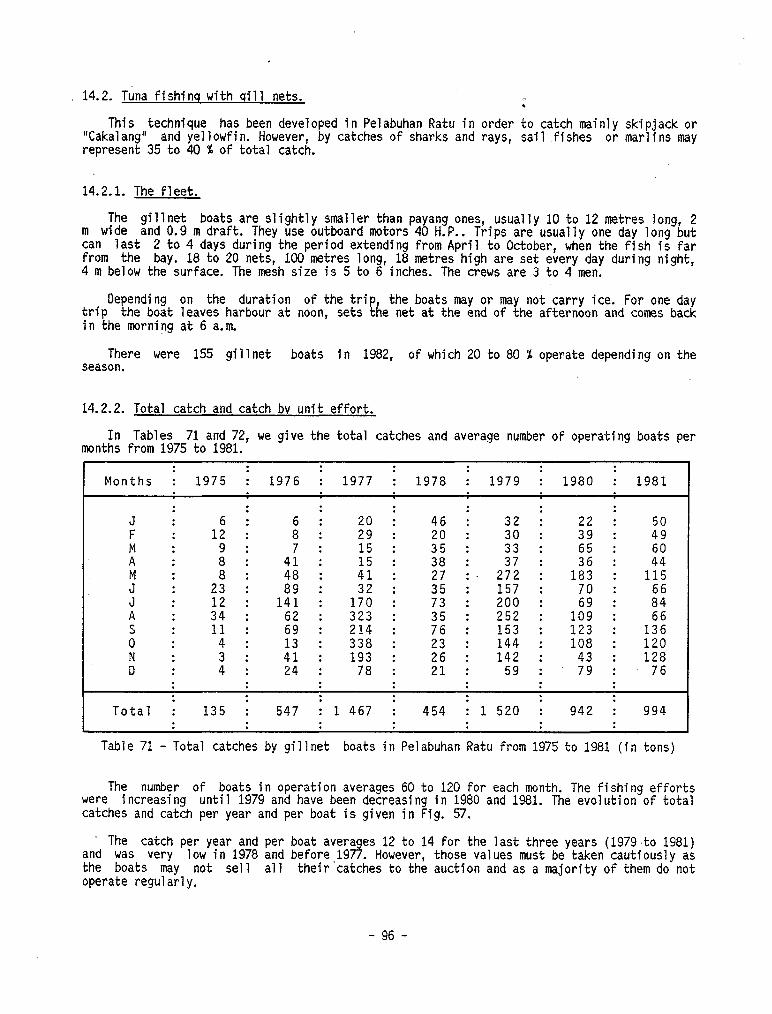
14.2. Tuna fishinq with qill nets. t
This technique has been developed in Pelabuhan Ratu in order to catch mainly skipjack or "Cakalang" and yellowfin. However, by catches of sharks and rays, sail .fishes or marlins may represent 35 to 40 % of total catch.
14.21. The fleet.
The gillnet boats are slightly smaller than payang ones, usually 10 to 12 metres long, 2 m wide and 0.9 m draft. They use outboard motors 40 H.P.. Trips are usually one day long but cari last 2 to 4 days during the period extending from April to October, when the fish is far from the bay. 18 to 20 nets, 100 metres long, 18 metres high are set every day during night, 4 m below the surface. The mesh size is 5 to 6 inches. The crews are 3 to 4 men.
trip Depending on the duration of the trip, the boats may or may not carry ice. For one day
the boat leaves harbour at noon, sets the net at the end of the afternoon and cornes back in the morning at 6 a.m.
There were 155 gillnet boats in 1982, of which 20 to 80 % operate depending on the season.
14.2.2. Total catch and catch bv unit effort.
In Tables 71 and 72, we give the total catches and average number of operating boats per months from 1975 to 1981.
: : : : : : : Months : 1975 : 1976 : 1977 : 1978 : 1979 : 1980 : 1981
. . . . .
. :
i 1:; .
: : : : .
J ii : :9 : 46 - 32 - 22 ; F : : : 20 I 30 I 39 : 2: A : : 8 9 : : 7 : : 15 : : 35 38 : : 33 : : 65 : 60
M : 2: : zi : i: : 575 : 23772 : 12 1 1;:
J . Il2: : 141 89 : : 1;: : :
;5
: : 200 157 : : 70 : : 8”:
A : 34 : ;9 . I .
323 : : 252 : 1:; : 0 : : 11 4 : : 214 338 : : 76
E ;5 : .
I I 153 144 : : 123 108 : :
1% 120
N : i . 193 : 142 - : ;
43 : 128 D 24 : 78 : 21 : 59 ; 79 : 76
: : : : : : : : : : : . : .
Total : 135 : 547 : 1 467 : 454 i 1 520 : 942 I 994 : : : : : : :
Table 71 - Total catches by gillnet boats in Pelabuhan Ratu from 1975 to 1981 (in tons)
The number of boats in operation averages 60 to 120 for each month. The fishing efforts were increasing until 1979 and have been decreasing in 1980 and 1981. The evolution of total catches and catch per year and per boat is given in Fig. 57.
I The catch per year and per boat averages 12 to 14 for the last three years (1979 to 1981) and was very low in 1978 and before,l977. However, those values must be taken cautiously as the boats may not sel1 a11 their catches to the auction and as a majority of them do not operate regularly.
- 96 -
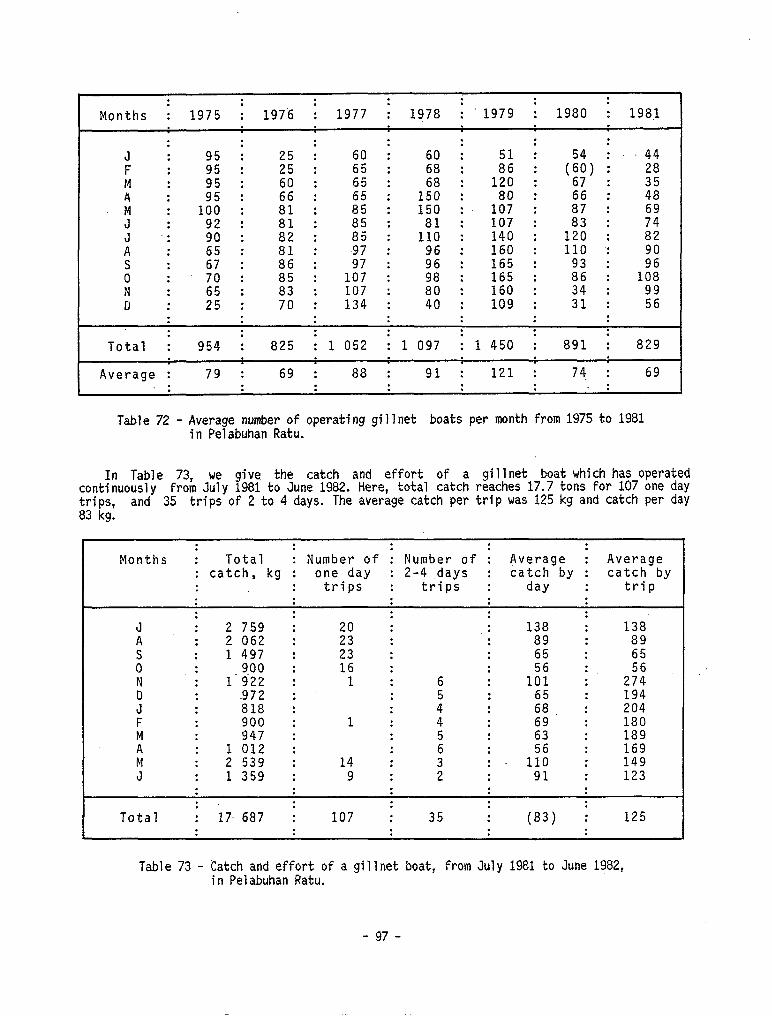
: : : . : : . Months : 1975 : 1976 : 1977 I 1978 : '1979 : 1980 ; 1981
: : . . : . . . . : J : : 60 : : : 44 F :
95 : :
2; :
!l I . 95 : : 6": : : 65 ii5 :
68 :
8": :
(ii) i
: - 150 68 : : 120 : . 5; : : 48 3’:
.M : 100 : . 85 i 150 : 1:; I : 69
: .: : 92 90 : :
;:
82 I : E : : 1:; : : 107 140 : :
:;
120 : : 82
A : 65 : 81 : .97 : 9: . 160 : 110 ‘: 5 : 67: : 97 : I 165 : . 9: 0 : 70 :
:5 : 107 : : 165 :
2 I 108
D : : 25 : : ;i : : 107 134 : :
B"o
40 : : 160 109 : : ii : : 99 56 : : : : : : : . : : : . . .
Total I 954 : 825 : 1 052 : 1 097 I 1 450 I 891 ; 829
Averaqe : 79 : 69 : 88 : 91 : 121 : 74 : 69
Table 72 - Average number of operating gillnet boats per month from 1975 to 1981 in Pelabuhan Ratu.
In Table 73, we give. the catch and effort of a gillnet boat which has operated continuously from July 1981 to June 1982. Here, total catch reaches 17.7 tons for 107 one day trips, and 35 trips of 2 to 4 days. The average catch per trip was 125 kg and catch per day 83 kg.
: : . . . Months : Total : Number of i Number of i Average I Average
: catch, kg : one day : 2-4 days : catch by : catch by . . . trips : trips : day : trip : : : : : . . : : : :
A . I 2 2 759 062 : : 23 : : : : 138 89 : : 138 89 5 : 1 497 : 23 : : 65 : 65
0 : 900 : 16 : : 56 : cf . I 1’922 972 : : 1 : : 5 : : 101 65 : :
2:: 194
J : 818 : : 4 : 68. : 204
F : 900 947 : : 1: : 4 3 6
: . :- I
ii : : 180 189 M : : 2 1 012 539 : : 14 I . 11: : : 149 169
J : 1 359 : 9 : 2 : 91 : 123
: : : : Total : 17. 687 : 107 : 35 : (83) i 125
: . . . : . :
Table 73 - Catch and effort of a gillnet boat, from July 1981 to June 1982, in Pelabuhan Ratu.
- 97 -
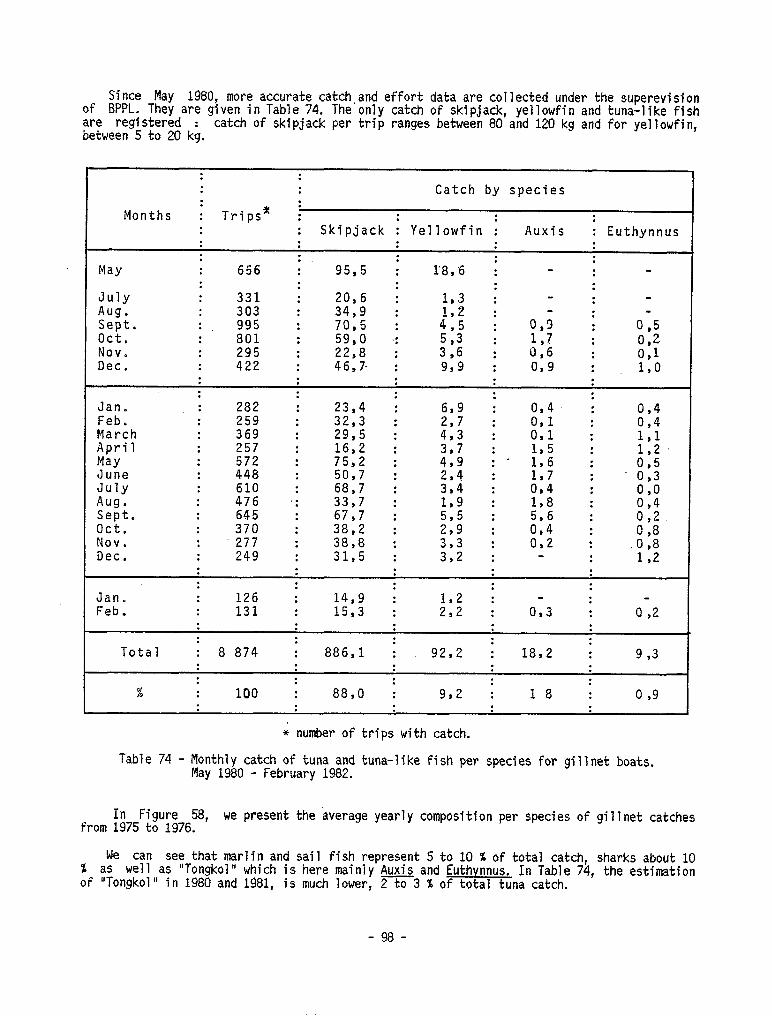
Since May 1980, more accurate catch.and effort data are collected under the superevision of BPPL. They are given in Table 74. The only catch of skipjack, yellowfin and tuna-like fish are registered : between 5 to 20 kg.
catch of skipjack per trip ranges between 80 and 120 kg and for yellowfin,
: : . . : Catch by species .
Months I :
Trips* : . . : . : Skipjack I Yellowfin I Auxis : Euthynnus : : : : : : : :
May : 656 : 95,5 : 1’8;6 ; - i - : . . . .
July : 331 I 20,6 ; 1.3 I - I - Aug. . . 303 : 34,9 : : : Sept. . * _ 995 : 70,5 : t5 : 03 : 095 Oct. : 801 : 59,0 .: 513 : 117 : 092 Nov. : 295 : 22,8 : 3,6 : 0,6 : os1 Dec. : 422 : 46,7. : 9,9 : 0,9 : 130
: : . . : : : . . .
282 ; 23,4 ; . :
Jan. : : 0,4. : Feb. : 259 : 32,3 : Es7 : : i:: March . . 369 : 29,5 : 4:3 : i:: : April : 257 : 16>2 : . . p;
Mw : 572 : 75,2 : 43:; ; * ::5 I 015 June : 448 : 50,7 : : : July : 610 : 68,7 : 3:: : 2: : :Ii Aug. : 476 .: 33,7 : 1,9 : : Sept. . . 645 : 67,7 : 595 : 5? : ii:2 Oct. : 370 : 38,2 : 2,9 : 0:4 : Nov. : 277 : 38,8 : 3,3 : 0,2 : .28 Dec. : 249 : 31,5 : 3,2 : - : 112
. . . . . . : : : : : : :
Jan D . . 126 : 14,9 : 132 : - : Feb. : 131 : 1513 : 2,2 : os3 : 0 92
. . : : : . . : : : : :
Total : 8 874 : 886,l : 92,2 : 1892 : 9 93 : . . : : : .
% I : : : :
100 : 88,O : 992 : 1 8 : 0 99 : : : : :
4 number of trips with catch.
Table 74 - Monthly catch of tuna and tuna-like fish per species for gillnet boats. May 1980 - February 1982.
In Figure 58, from 1975 to 1976.
we present the average yearly composition per species of gillnet catches
We cari see that marlin and sail fish represent 5 to 10 % of total catch, sharks about 10 % as well as "Tongkol" which is here mainly Auxis and Euthvnnus. In Table 74, the estimation of "Tongkol" in 1980 and 1981, is much lower, 2 to 3 % of total tuna catch.
- 98 -
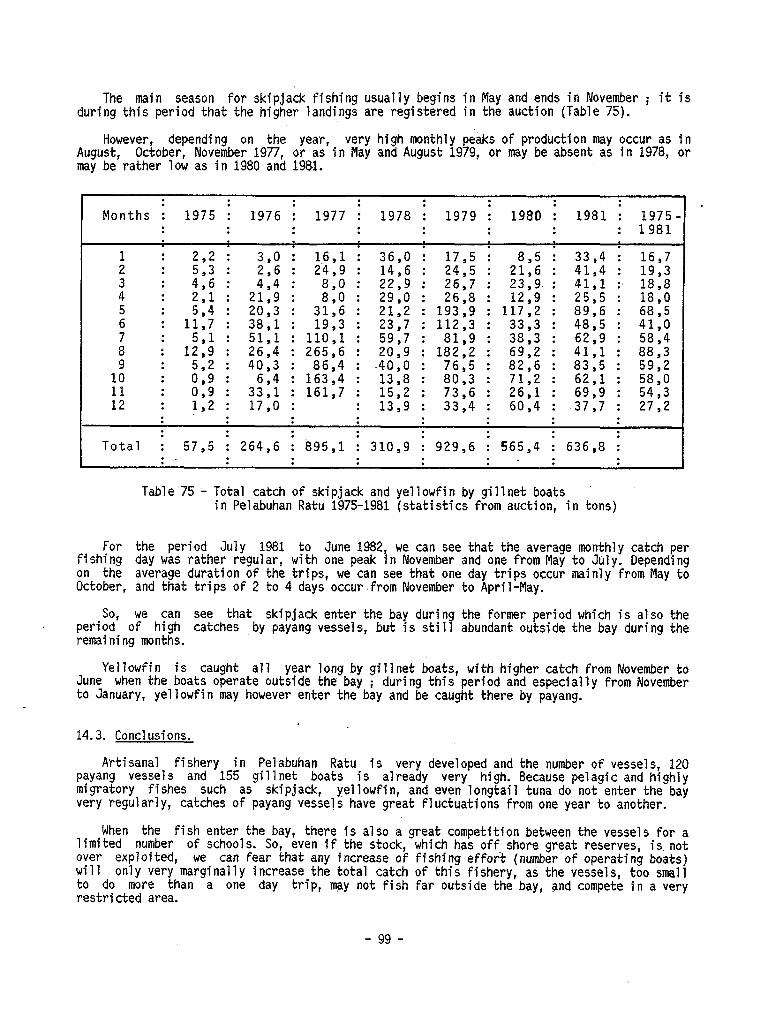
The main season for skipjack fishing usually begins in May and ends in November ; it is during this period that the higher landings are registered in the auction (Table 75).
However, depending on the year, very high monthly peaks of production may occur as in August, October, November 1977, or as in May and August 1979, or may be absent as in 1978, or may be rather low as in 1980 and 1981.
: : : . : : : Months : 1975 : 1976 i 1977 : 1978 ; 1979 : 1980 : 1981 : 1975-
. : . . . : : : : : 1981
. . . 1 :
416 ;y; : 3,0 : 16,l ; 36,0 ; 17,5 I : 33,4 I 16,7
3’ : : ; . 42’46 : - 2’4 810 9 : : 14,6 : : 24,5 : : 2% 2319.
: : 41,4 :, : 19,3 22,9 26,7 41,l 18,8
4 : 24 : 21:9 I 3x : 29,0 : 26,8 : 12,9 : 25,5 : 18,0 5 I .
1117 : : 20,3
38,l : :
1913 : : 21,2
23,7 : : 193,9 117,2 89,6 68,5
112,3 : :
33,3 : :
48,5 : :
41,0 i i * 5,l : : 51,l : : 110,l : : 59,7 : : 81,9 : : 38,3 : : 62,9
12,9 26,4 265,6 20,9 182,2 69,2 41,l : : 58,4
88,3 9 :
2; : 40,3 : 86,4 : -40,O : 76,5 : 82,6 : 83,5 : 59,2
10 : 019
: 336’; : 163,4 : 13,8 : 80,3 : 71,2 : 62,l : 58,0 11 : :
1710 : 161,7 : 15,2 : 73,6 : 26,l : 69,9 : 54,3
12 : 1,2 : : . . 13,9 : 33,4 : 60,4 : 37,7 : 27,2 : . . : : . . . . : : : . : : : . . .
Total : 57,5 ; 264,6 : 895,l : 310,9 : 929,6 ; 565,4 ; 636,8 i : - : : : : . . . : :
Table 75 - Total catch of skipjack and yellowfin by gillnet boats in Pelabuhan Ratu 1975-1981 (statistics from auction, in tons)
For the period July 1981 to June 1982, we cari see that the average monthly catch per fishing day was rather regular, with one peak in November and one from May to Jul y. Depending on the average duration of the trips, we cari see that one day trips occur mainly from May to October, and that trips of 2 to 4 days occur from November to April-May.
SO, we cari see that skipjack enter the bay during the former period which is also the period of high catches by payang vessels, but is still abundant outside the bay during the remaining months.
June Yellowfin is caught a11 year long by gillnet boats, with higher catch from November to
when the boats operate outside the bay ; during this period and especially from November to January, yellowfin may however enter the bay and be caught there by payang.
14.3. Conclusions.
Artisanal fishery in Pelabuhan Ratu is very developed and the number of vessels, 120 payang vessels and 155 gillnet boats is already very high. Because pelagic and highly migratory fishes such as skipjack, yellowfin, and even longtail tuna do not enter the bay very regularly, catches of payang Vesse!s have great fluctuations from one year to another.
When the fish enter the bay, there is also a great competition between the vessels for a limited number of schools. SO, even if the stock, which has off. shore great reserves, is not over exploited, we cari fear that any increase of fishing effort (number of operating boats) Will only very marginally increase the total catch of this fishery, as the vessels, too small to do more than a one day trip, may not fish far outside the bay, and compete in a very restricted area.
- 99 -
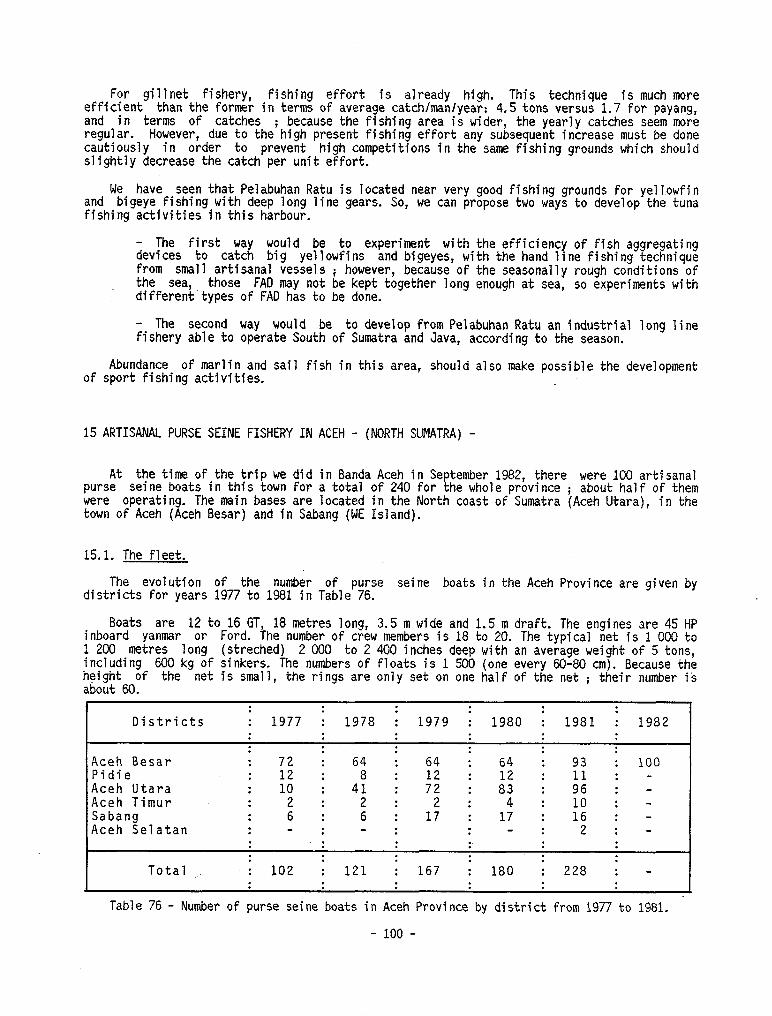
For gillnet fishery, fishing effort is already high. This technique is much more efficient than the former in terms of average catchlmanlyear: 4.5 tons versus 1.7 for payang, and in terms of catches ; because the fishing area is wider, the yearly catches seem more regular. However, due to the high present fishing effort any subsequent increase must be done cautiously in order to prevent high competitions in the same fishing grounds which should slightly decrease the catch per unit effort.
We have seen that Pelabuhan Ratu is located near very good fishing grounds for yellowfin and bigeye fishing with deep long line gears. SO, we cari propose two ways to develop the tuna fishing activities in this harbour.
- The first way would be to experiment with the efficiency of fish aggregating devices to catch big yellowfins and bigeyes, with the hand line fishing technique from small artisanal vessels the sea,
; however, because of the seasonally rough conditions of those FAO may not be kept together long enough at sea, SO experiments with
different'types of FAO has to be done.
- The second way would be to develop from Pelabuhan Ratu an industrial long line fishery able to operate South of Sumatra and Java, according to the season.
Abundance of marlin and sail fish in this area, should also make possible the development of sport fishing activities.
15 ARTISANAL PURSE SEINE FISHERY IN ACEH - (NORTH SUMATRA) -
At the time of the trip we did in Banda Aceh in September 1982, there were 100 artisanal purse Seine boats in this town for a total of 240 for the whole province ; about half of them were operating. The main bases are located in the North toast of Sumatra (Aceh Utara), in the town of Aceh (Aceh Besar) and in Sabang (WE Island).
15.1. The fleet.
The evolution of the number of purse Seine districts for years 1977 to 1981 in Table 76.
boats in the Aceh Province are given by
Boats are inboard yanmar 1 200 metres including 600
12 to 16 GT, 18 metres long, 3.5 m wide and 1.5 m draft. The engines are 45 HP * or Ford. The number of crew members is 18 to 20. The typical net is 1 OOC! to long (streched) 2 000 to 2 400 inches deep with an average weight of 5 tons, kg of sinkers. The numbers of floats is 1 500 (one every 60-80 cm). Because the
height of the net is small, the rings are only set on one half of the net ; their number is about 60.
: : . . Districts : 1977 : 1978 i 1979 I
: : 1980 : 1981 : 1982
: : : : : : : : : :
Aceh Besar : 72 : 64 : 64 : 64 : 93 : 100 Pidie : 12 : : : : : - Aceh Utara : 10 : 41 : :: : z : 9; : - Aceh Timur : 2 : 2 : 2 : 4 : 10 : - Sabang : 6 : 6 : 17 : 17 : 16 : - Aceh Selatan . - * . . : : : 2 : -
: : : : : : : . . . : 102 I 121 I 167 ;
: . Total 180 : 228 ; -
: : : : : :
Table 76 - Number of purse Seine boats in Aceh Province by district from 1977 to 1981.
- 100 -
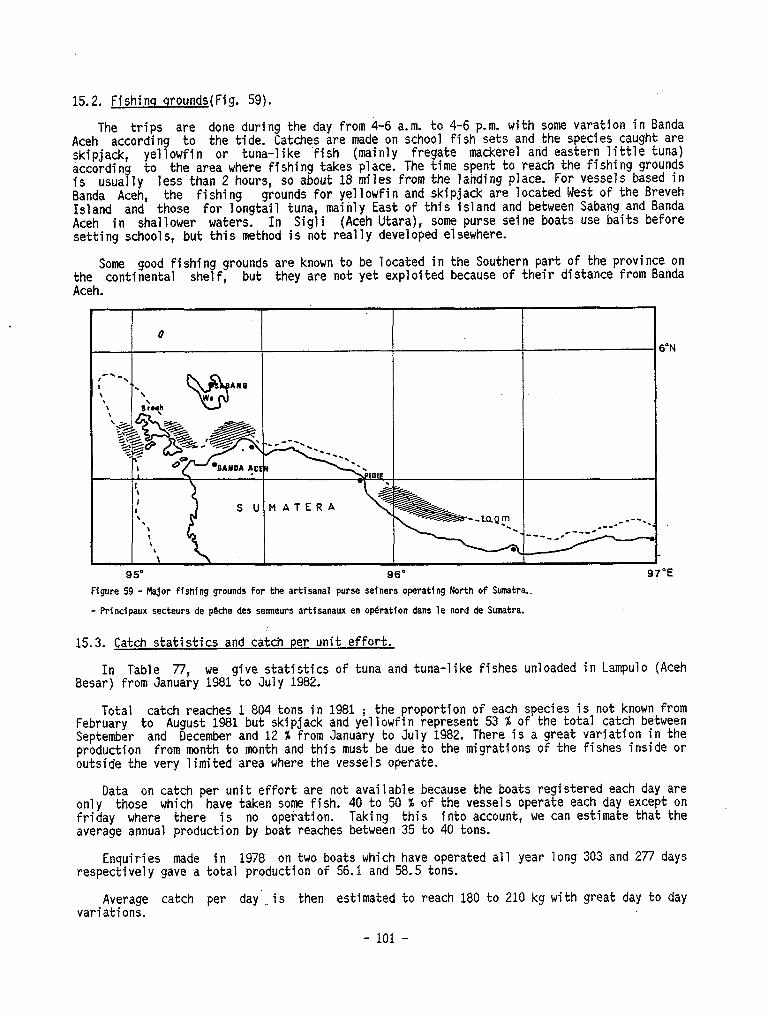
15.2. Fishinq qrounds(Fig. 59).
The trips are done during the day from 4-6 a.m. to 4-6 p.m. with some varation in Banda Aceh according to the tide. Catches are made on school fish sets and the species caught are skipjack, yellowfin or tuna-like 'fish (mainly fregate mackerel and eastern little tuna) according to the area where fishing takes place. The time spent to reach the fishing grounds is usually less than 2 hours, SO about 18 miles from the landing Pl~ace. For vessels based in Banda Aceh, the fishing grounds for yellowfin and skipjack are located West of the Breveh Island and those for longtail tuna, mainly East of this island and between Sabang and Banda Aceh in shallower waters. In Sigli (Aceh Utara), some purse Seine boats use baits before setting schools, but this method is not really developed elsewhere.
Some good fishing grounds are known to be located in the Southern part of the province on the continental shelf, but they are not yet exploited because of their distance from Banda Aceh.
PN
95’ 96’ 97”E Figure 59 - Najor Fishing grounds for the artisanal purse seiners operating North of Sumatra.
- Principaux secteurs de pe&e des senneurs artisanaux en op&ation dans le nord de Sumatra.
15.3. Catch statistics and catch per unit effort.
In Table 77, we give statistics of tuna and tuna-like fishes unloaded in Lampulo (Aceh Besar) from January 1981 to July 1982.
Total catch reaches 1 804 tons in 1981 ; the proportion of each species is not known from February to August 1981 but skipjack and yellowfin represent 53 % of the total catch between September and December and 12 % from January to Jul y 1982. There is a great variation ln the production from month to month and this must be due to the migrations of the fishes inside or outside the very limited area where the vessels operate.
Data on catch per unit effort are not available because the boats registered each day are only those which have taken some fish. 40 to 50 9; of the vessels operate each day except on friday where there is no operation. Taking this into account, we cari estimate that the average annual production by boat reaches between 35 to 40 tons.
Enquiries made in 1978 on two boats which have operated a11 year long 303 and 277 days respectively gave a total production of 56.1 and 58.5 tons.
Average catch per day-. is then estimated to reach 180 to 210 kg with great day to day variations.
- 101 -
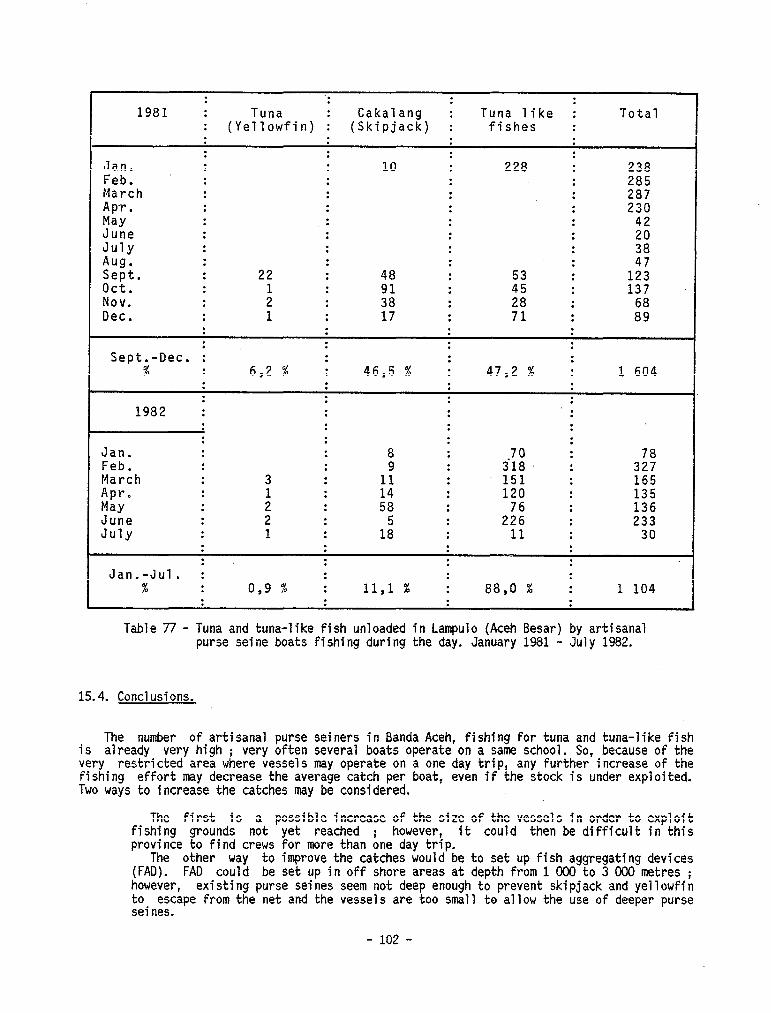
: ‘.
. : :
1981 : Tuna : Cakalang : Tuna like : Total : (Yellowfin) : (Skipjack) : fishes : : : : : : : : :
Jan, : : 10 : 228 : 238 Feb. : : . . : 285 March : : : : 287 Apr. . . . . . . . . 230 May : : : : 42 June : : : . . July : : : : 3: Aug. . . .
22 I : :
Sept. : 48 : . 123 oct. :
: : 91 : :z I 137
Nov. . . : 38 : . Dec. : 1 : 17 : 7'1 I i9
: . . . . : .
Sept.-Dec. I : : : : .
46,5 40 i :
% : 6,2 % : 47,2 % : 1 604 . . . . . : . : : : :
1982 : : : . * : : : : : : : :
Jan. : : 8 : . Feb. : : 9 : a:: I 32; March . . 3 :
:i : 151 : 165
Apr. : :
: : 120 : 135 May . . : 58 :
2;: : 136
June . . 2 : 1;
: : 233 July : 1 : : 11 : 30
. . : : . . : : : :
Jan .-Jul. : : . : % : 0,9 % : 11,l % I 88,O % : 1 104
: : : :
Table 77 - Tuna and tuna-like fish unloaded in Lampulo (Aceh Besar) by artisanal purse Seine boats fishing during the day. January 1981 - Juiy 1982.
15.4. Conclusions.
The number of artisanal purse seiners in Banda Aceh, fishing for tuna and tuna-like fish is already very high ; very often several boats operate on a same school. SO, because of the very restricted area where vessels may operate on a one day trip, any further increase of the fishing effort may decrease the average catch per boat, even if the stock is under exploited. Two ways to i ncrease the catches may be considered.
The first is a possible increase of the size of the vessels in order to exploit fishing grounds not yet reached ; however, it could then be difficult in this province to find crews for more than one day trip.
The other way to improve the catches would be to set up fish aggregating devices (FAD). FAD could be set up in off shore areas at depth from 1 OOD to 3 000 metres ; however, existing purse seines seem not deep enough to prevent skipjack and yellowfin to escape from the net and the vessels are too small to allow the use of deeper purse seines.
- 102 -
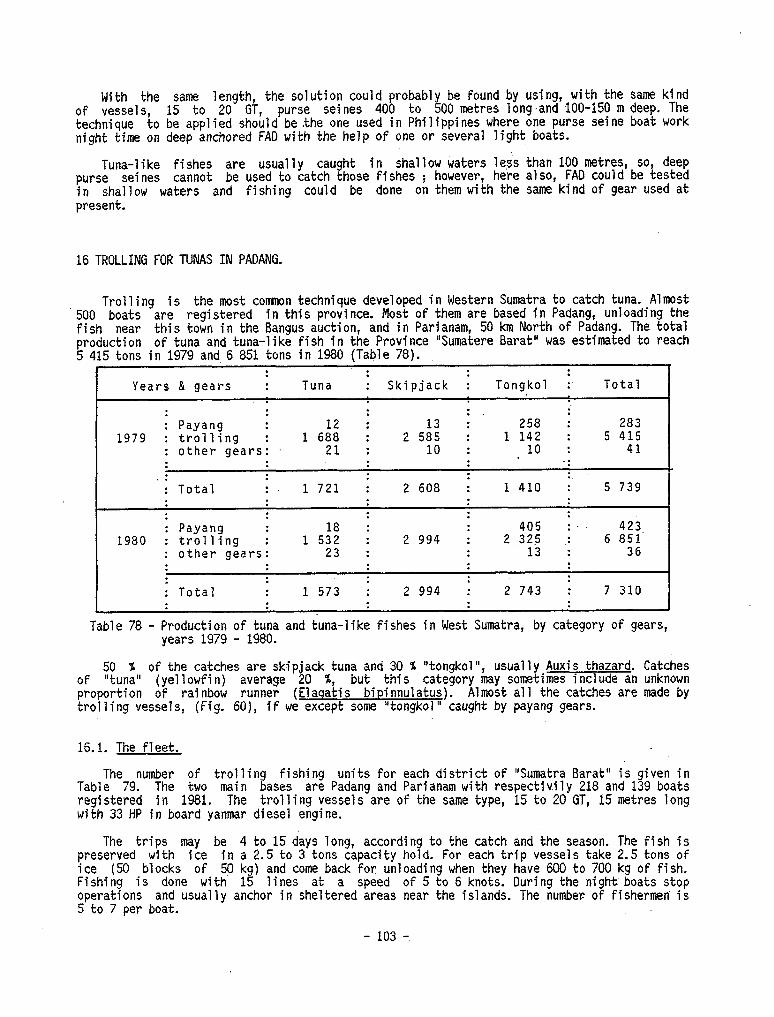
With the same length, the solution could probably be found by using, with the same kind of vessels, 15 to 20 GT, purse seines 400 to 500 metres long.and 100-150 m deep. The technique to be applied should be ,the one used in Philippines where one purse Seine boat work night time on deep anchored FAD with the help of one or several light boats.
Tuna-like fishes are usually caught in shallow waters le& than 100 metres, SO, deep purse seines cannot be used to catch those fishes i however, here also, FAD could be tested in shallow waters and fishing could be done on them with the same kind of gear used at present.
16 TROLLING FOR TUNAS IN PADANG.
Trolling is the most conm'aon technique developed in Western Sumatra to catch tuna. Almost 500 boats are registered in this province. Most of them are based in Padang, unloading the fish near this town in the Bangus auction, and in Parianam, 50 km North of Padang. The total production of tuna and tuna-like fish in the Province "Sumatere Barat" was estimated to reach 5 415 tons in 1979 and 6 851 tons in 1980 (Table 78).
l : : : :
Years & gears : Tuna : Skipjack : Tongkol :' Total
: : : : : : Payang : 12 : 13 : 258 : 283
1979 : trolling : 1 688 : 2 585 : 1 142 : 5 415 : other gears: 21 : 10 : 10 : 41 : : : : _. .
: :. : Total : 1 721 : 2 608 : 1 410 : 5 739
l : : : : : Payang I
5312 : : 405 :. 423
1980 : trolling : 1 : 2 994 : 2 325 .: 6 851 : other gears: 23 : : 13 : 36 : : : : :
: 573
: : : : Total : 1 : 2 994 : 2 743 : 7 310 : : : : :
Table 78 - Production of tuna and tuna-like fishes in West Sumatra, by category of gears, years 1979 - 1980.
st,,;,, of the catches are skipjack tuna and 30 % "tongkol ", usually Auxis thazard. Catches Of (yellowfln) average 20 X, but thls category may sometimes include an unknown proportion of rainbow runner (Elaqatis bipinnulatus). Almost a11 the catches are made by trolling vessels, (Fig. 60), if we except some "tongkol" caught by payang gears.
16.1. The fleet.
The number of trolling fishing units for each district of "Sumatra Barat" is given in Table 79. The two main bases are Padang and Parianam with respectivily 218 and 139 boats registered in 1981. The trolling vessels are of the same type, 15 to 20 GT, 15 metres long with 33 HP in board yanmar diesel engine.
The trips may be 4 to 15 days long, according to the catch and the season. The fish is preserved with ice in a 2.5 to 3 tons capacity hold. For each trip vessels take 2.5 tons of ice (50 blocks of 50 kg) and tome back for unloading when they have 600 to 700 kg of fish. Fishing is done with 15 lines at a speed of 5 to 6 knots. During the night boats stop operations and usually anchor in sheltered areas near the islands. The number of fishermen is 5 to 7 per boat.
- 103 -
Figure 60 - Troller in Padang
- Ligneur à Padang.
. . . : Districts : 1979 : 1980 i 1981
: : : : : :
Pesisir Selatan : 80 : 80 : 57 . .
Padang Parianam ': 133 I 110 : 139 .
Kotamadya Padang : 201 : 196 ; 218 .
Agam . . 25 ; 40 I 40
Pasaman : 33 I 46 ; (50) . Total . . 472 : 472 : (504)
: : .
Table 79 - Number of trolling fishing units by district in Sumatra Barat (Fishery Service in Padang).
16.2. Fishinq qrounds.
Fishing grounds are located off Padang near the Mentawaï Islands. SO, it usually takes 10 to 12 hours to reach them.
From October to December, fishing occurs mainly on the North West of Padang near Telo and Simuk Islands in the West of Tanah Masa and Tanah Bala, and between Tanah Bala and Siberut Islands. Fishing may be done on drifting logs which are sometimes very numerous rather far West of those islands from November to March-April.
From May to August, fishing occurs mainly South-West of Padang i from March to May, a good fishing ground for skipjack is located North of Sipura and East of the Siburu Islands.
From July to August-September fishing is usually poor because of strong South winds, but rather scattered schools are found South of Siberut and West of Sipura.
According to the fishermen we met, the best season is from December to May-June. During this period, many "jumpers" islands in the West
cari be found near logs (Idan Batang) 40 to 60 miles off the i then, a trip may be 4 or 5 days only versus an average 7 to 10 days or
even 15 days during the bad season.
- 104 -
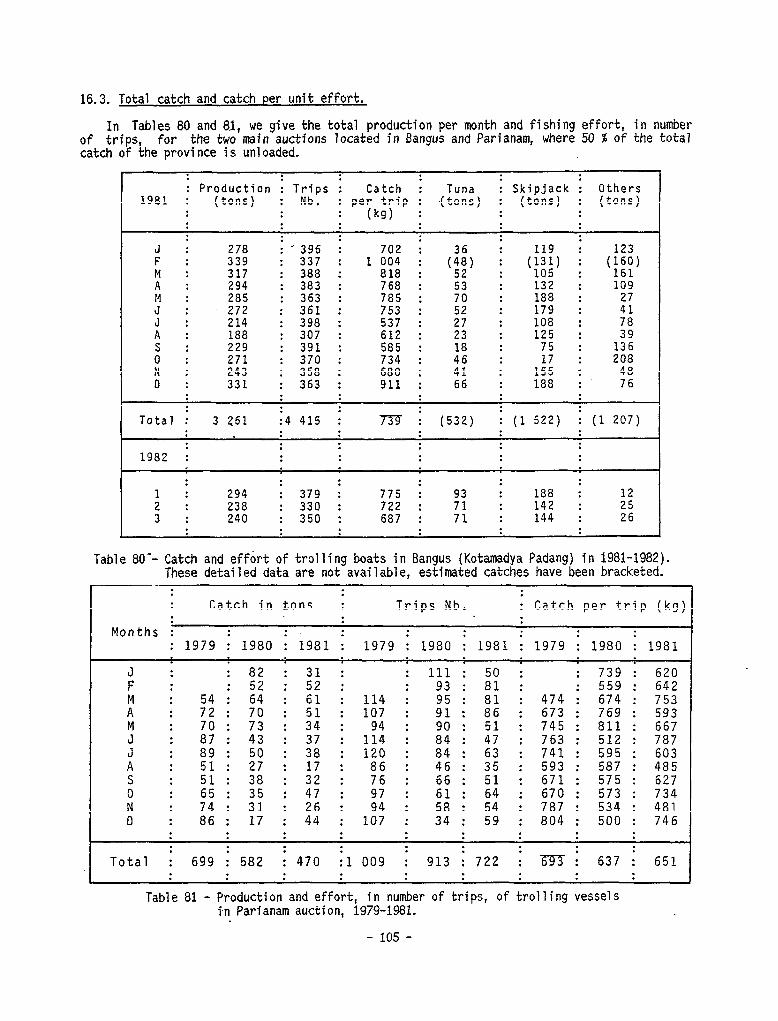
16.3. Total catch and catch per unit effort.
In Tables 80 and 81, we give the total production per month and fishing effort, in number of trips, for the two main auctions located in Bangus and Parianam, where 50 % of the total catch of the province is unloaded.
; . i Production : Trips :
; ; Catch : Tuna : Skipjack : Others
1981 : (tons) : Nb . : per trip : ,(tons) : (tons) : (tons) : : : (kg) : : : : : : : :
;! I . 339 278 I : : : :
- 337 396 : : 1 004 702 : ; (ii) i 119 : : 123
A : : 317 294 : : 388 383 : : 818 768 : : 52 : J” 272 285 : : 361 363 : : 785 753 : : :i
P;;I 132 : ‘;;y’ 109 : . : 179 188 : : 27
J : 214 : 398 : 537 : 2: I 108 : 78
A : 188 : 307 : 612 : 23 : 125 : 0 : : 229 271 : : 391 370 : : 734 585 : : 18 : : 75 : :
1::
:1 66 188 155
208
D : : 243 331 : : 358 363 : : 680 911 : : : : : : 48 76 : :
: : * Total : 3 261 :4 415 I m i (532) i (1 522) i (1 207)
: : : : : : :
1 1982 : : : : : I
: : : . : :
: : : 294 238 : : 379 330 : : 775 722 I : 71 : : 188 142 : : :: 3 : 240 : 350 : 687 : 71 : 144 : 26
:
Table 80-- Catch and effort of trolling boats in Bangus (Kotamadya Padang) in 1981-1982). These detailed data are not available, estimated catches have been bracketed. : : : : Catch in Zens : Trips Nb. : Catch per trip (kg) : : :
Months : * - * . : . : 1979 ; 1980 ; 1981 ; 1979 I 1980 : 1981 ; 1979 ; 1980 ; 1981 :
J : ; 82 : 31 : : 111 : 50 : : 739 : 620 F : :52:52: . 93:81: *
I : 474 673 : I
559 : 642
; ; ;; ; . 7; ; . 5: : : 107 114 91 : : 886 : : 769 674 : : 753 593 M : ci: : 73 : 34 : 94 : i4 : :: : 745 : 811 : 667
J” : : 89: : 43 : : 38 37 ; - 5: : ;; : 17 :
114 120 : : 84 ; ’ 63 : : 741 763 : : 595 512 : : 787 603 A : 86 . 46 : 35 : 593 : 587 : 485 Fi I : -35: 38 : i7’ : : 76
N : 34; 31 : 86 : 17 : 424” :
97:
; : 51: : 51 : -
: 5”: I
671 670 : : 575 573 : : 734 627
: 787 : 534 : 481 0 : 107 : 3: : 59 : 804 : 500 : 746
. : : : . . . : : : : : : : : : :
913 : 722 ; m; :
Total : 699 : 582 : 470 :l 009 : 637 : 651 : : : . . . . . . . . . . :
Table 81 - Production and effort, in number of trips, of trolling vessels in Parianam auction, 1979-1981.
- 105 -
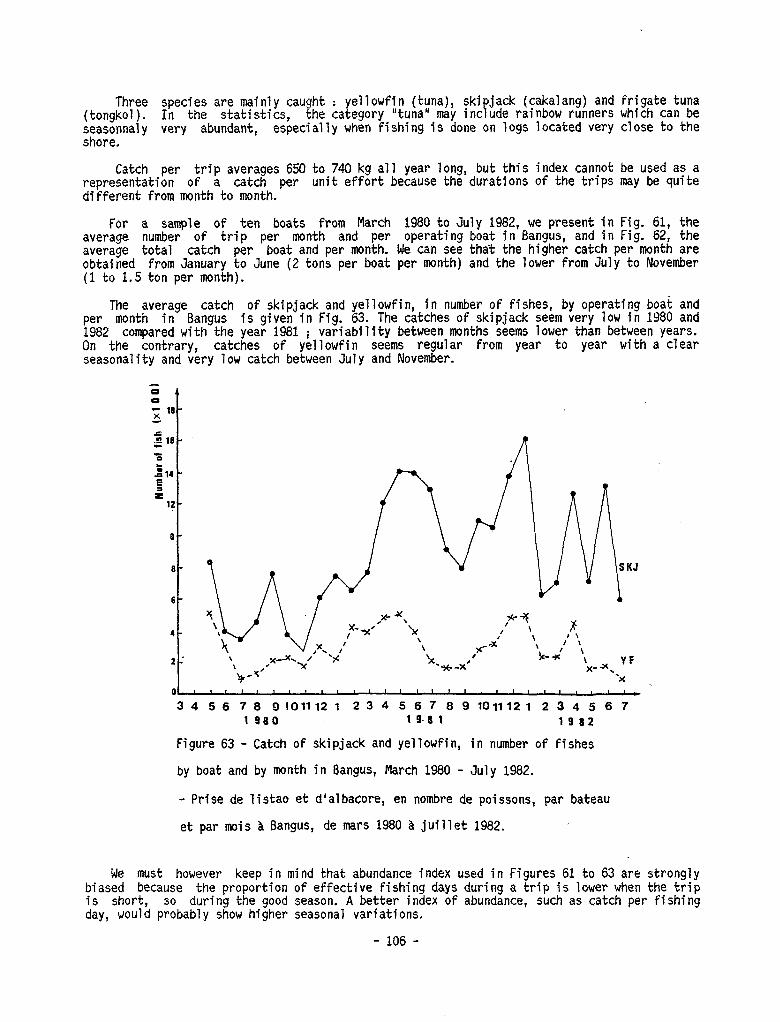
Three species are mainly caught : yellowfin (tuna), skipjack (cakalang) and (tongkol). In the statistics, the category "tuna" may include rainbow runners ;;;asennaly very abundant, especially when fishing is done on logs located very
.
Catch per trip averages 650 to 740 kg a11 year long, but this index cannot representation of a catch per unit effort because the durations of the trips different from month to month.
Fig. 61, the Fig. 62, the ,
For a sample of ten boats from March 1980 to July 1982, we present in average number of trip per month and per operating boat in Bangus, and in average total catch per boat and per month. We cari see that the higher catch per month are obtained from January to June (2 tons per boat per month) and the lower from July to November (1 to 1.5 ton per month).
frigate tuna which cari be close to the
be used as a may be quite
The average catch of skipjack and yellowfin, in number of fishes, by operating boat and per mont-h in Bangus is given in Fig. 63. The catches of skipjack seem very low in 1980 and 1982 compared with the year 1981 ; variability between months seems lower than between years. On the contrary, catches of yellowfin seems regular from year to year with a clear seasonality and very low catch between July and November.
O-
a-
6-
4-
2-
345678 91011121 234567891011121 234567 1980 19-8 1 1982
Figure 63 - Catch of skipjack and yellowfin, in number of fishes
by boat and by month in Bangus, March 1980 - July 1982.
- Prise de listao et d'albacore, en nombre de poissons, par bateau
et par mois a Bangus, de mars 1980 a juillet 1982.
We must however keep in mind that abundance index used in Figures.61 to 63 are strongly ;;as;horecause the proportion of effective fishing days during a trip 1s lower when the trip
SO dunng the good season. A better Index of abundance, such as catch per Flshlng day, would probably show higher seasonal variations.
- 106 -
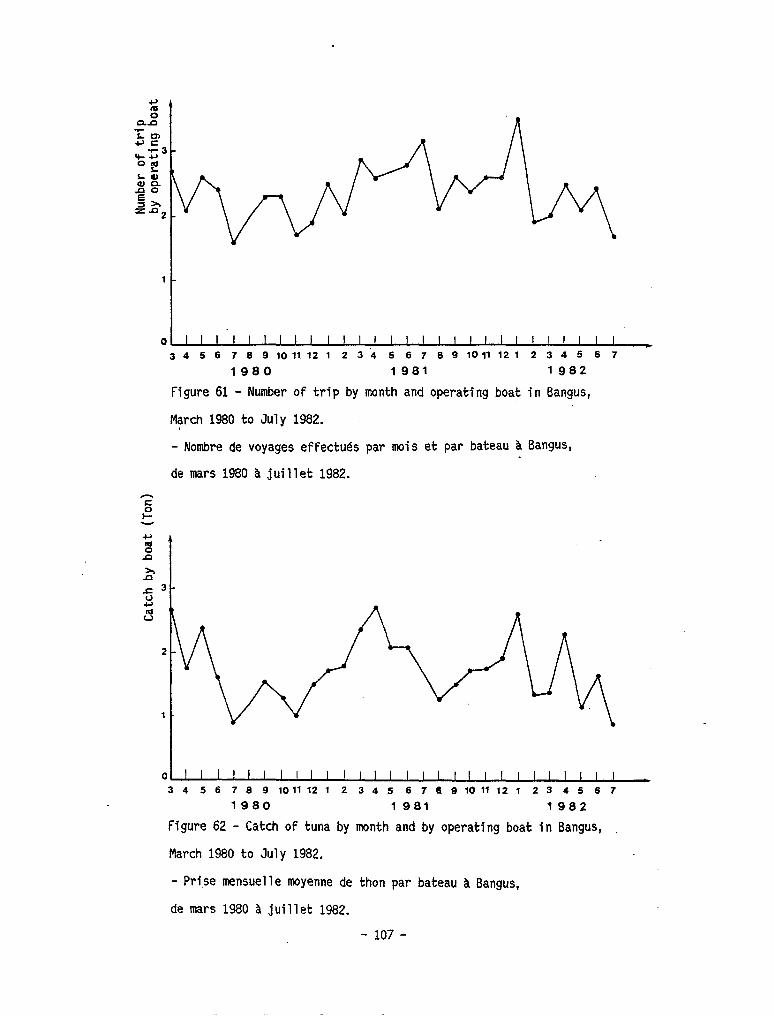
Q
3456789101112123~45678910~121234567
1980 1981 1982
Figure 61 - Number of trip by nwnth and operating boat in Bangus,
March 1980 to July 1982.
- Nombre de voyages effectubs par mis et par bateau Zï Bangus,
de mars 1980 3 juillet 1982.
/ I I I I l I I I I I I I I I i I I l I I I I i I I I I . 3456709101112123456769101f121234567
1980 1981 1982
Figure 62 - Catch of tuna by month and by operating boat in Bangus,
March 1980 to July 1982.
- Pri.se mensuelle moyenne de thon par bateau A Bangus,
de mars 1980 à juillet 1982.
- 107 -
On the other hand, low catch per unit effort from July to October may not reflect a lower abundance of fish in the area, but rather a poor hook biting rate during this season because the seasonal upwelling of the West toast of Sumatra make natural food more abundant for the fishes.
At least, bad weather during Southern winds may also be a reason for the poor catches of skipjack and yellowfin during this season ; fishing may then be done near the islands on the continental shelf, to catch frigate tuna (Auxis thazard).
16.4. Annual production bv vessel.
From enquiries made in Padang in August 1932, we cari expect that the yearly production of a troll boat ranges between 18 to 25 tons. From log books of three boats, KM Tuna 01, KM Tuna 02 and KM Bracung, S. MERTA estimated that the average yearly production was 27 tonslboat for 240 days at sea in 1978-1979. In Bangus, the production in 1981 was 3 260 tons for the 218 boats registered but only an average of 160 boats were in regular operations.
SO, a production of 20 tonsfboatlyear seems to be a reasonable estimation. From Figures 61 and 62, we estimated the average production per vesse1 (from a sample of 10 of which 6
operating a11 year long) to be 22 to 23 tons in 1981. Skipjack and yellowfin weight ly 1 to 1.5 kg per fish. '
were usual
16.5. Conclusions.
One of the limitation of the trolling fishery in Padang tomes from the fact that the fishing grounds are very far from the unloading facilities. Boats need to carry large quantity of ice and long trips have a bad effect on the quality of the fish, especially during the poor season when trips are longer. 30 % only of the fish caught is of first quality and 70 % is quality two or three. This could be improved by setting cold storage and ice plants in Pagai, Siberut or Tanahmasa Islands.
Improving the total catch and catch per vesse1 would be accomplished by setting fish aggregating devices (FAD) off the Pagai Islands, South of Siberut or further off the Northern Islands especially in areas near cold storage facilities. Such FAD would allow better catch and less fuel consumption (at present 100 liters per day), especially during the season from July to October when the fish is present in the area but does not bite to the hooks. FAD could allow a simultaneous development of hand line fishing for big tunas such as yellowfin ; this kind of fishery could be developed with smaller artisanal vessels as it is done in the Philippines and in many others Pacifie Islands.
The type of FAD cannot be an artisanal mode1 similar to those used in Tomini Gulf in North Sulawisi but models as those developed in the Central Pacifie Islands (Hawai, Samoa, Fidji) which would be more resistant during the strong Southern wind period.
17 TROLLING IN BENOA (BALI)
Trolling has be&n a comnon practice since the 1950’s. Althou h motorized boats have been used since 1980, fishing operation are still limited to about lO- 0 miles South of the toast, % mainly in the Badung Strait, located between the Islands Bali and Nusa Pomido. The fishing season is mostly during the East monsoon period. The fishermen have been dependent on artificial bait made of goat-hair and only recently they started using plastic baits. There has beew a decline in the use of sail boats as more motorized boats have become more popular (Table 82).
- 108 -
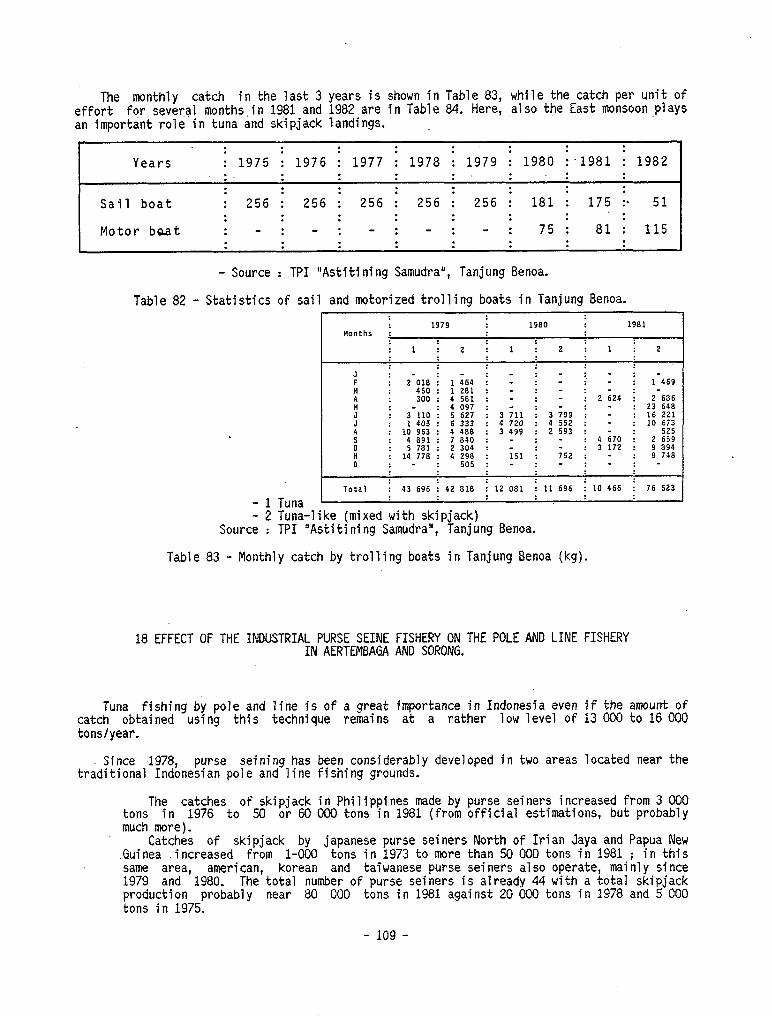
The monthly catch in the last 3 years is shown in Table 83, while the catch per unit of effort for several months,in 1981 and 1982 are in Table 84. Here, also the East monsoonplays an important role in tuna and skipjack landings.
: : : : . : . .
Years : 1975 : 1976 : 1977 : 1978 ; 1979 : 1980 i. 1981 ; 1982 : - . . : : : * . . . : : : .
256 ; : : : .
Sail boat : 256 : 256 : 256 : 256 : 181 : 175 I- 51 : . : : : : : :
Motor baat : - I - : - : - : - : 75 : 81: 115 . : : . . : : :
- Source : TP1 "Astitining Samudra", Tanjung Benoa.
Table 82 - Statistics of sail and motorized trolling boats in Tanjung Benoa.
1979 1980 1981 Months :
: 1 : 2 : 1 : 2 : 1 : 2
J : F : 2-018 : A : 450 300 : : 4 :
J : : 3110: - :4 5 A : : 10 1405: 963 : 4 6
0 : : 4691: 5 781 : 7 2 N : 14 770 : 4 D :-:
464 281 581 097 627 333 488 840 304 298 505
3 711 4 720 3 499
Ï51
3 799 4 552 2 593
;52
2 624
4 670 3 172
Total : 43 696 : 42 818 : 12 081 : 11 696 : 10 466 : 76 523
- 1 Tuna - 2 Tuna-like (mixed with skipjack)
Source : TP1 "Astitining Samudra", Tanjung Benoa.
Table 83 - Monthly catch by trolling boats in Tanjung Benoa (kg).
18 EFFECT OF THE INDUSTRIAL PURSE SEINE FISHERY ON THE POLE AND LINE FISHERY IN AERTEMBAGA AND SORONG.
Tuna fishing by pole and line is of a great catch obtained using this technique remains tonslyear.
importance in Indonesia even if the amount of at a rather low level of 13 000 to 16 000
Si nce 1978, purse seining has been considerably developed in two areas located near the traditional Indonesian pole and line fishing grounds.
The catches of skipjack in Philippines made by purse seiners increased from 3 000 tons in 1976 to 50 or 60 000 tons in 1981 (from officia1 estimations, but probably much more).
Catches of skipjack by japanese purse seiners North of Irian Jaya and Papua New Guinea .increased from l-000 tons in 1973 to more than 50 000 tons in 1981 ; in this same area, american, korean and taiwanese purse seiners also operate, mainly since 1979 and 1980. The total number of purse seiners is already 44 with a total skipjack production probably near 80 000 tons in 1981 against 20 CG0 tons in 1978 and 5 000 tons in 1975.
- 109 -
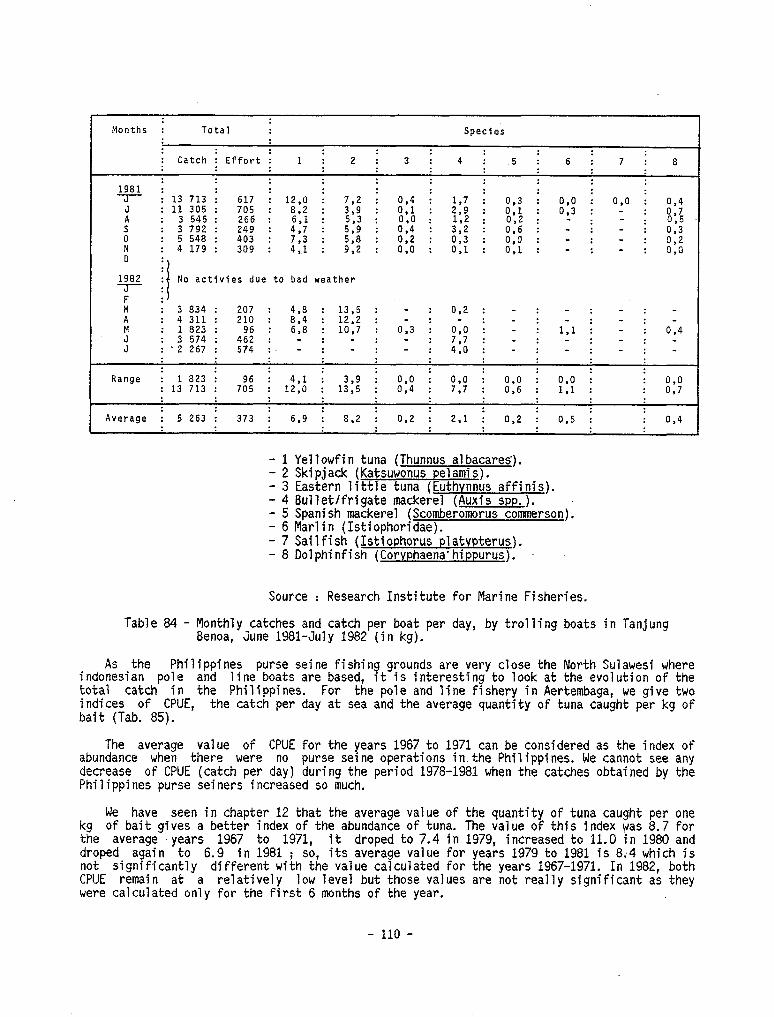
Months : Total Species
: Catch I Effort : 1 : 2 : 3 : 4 : 5 : 6 : 7 i 8
:, 1981 : -il-- : 13 713 : 617 : 12.0 : 7,2 : 0.4 : : 00 :
;1 : : 11 3 305 545 : : 705 266 : : 8.2 6,l : : 3,9 : 0.1 0.0 : : :*i: 1:2 i : o"*l 0;2 : : 6$: : : 1 - ; 2: 0:5 s : 3 792 : 249 : 7*: : : 0.6 : - : - : 0,3 0 : 5 548 : 403 : : N : 4179: 309 : 4:1 :
No activies due to bad weather
: 3 a34 : 207 : 4,8 : 13.5 : - : 0.2 : - : - : - : - A : 4 311 : 210 : a,4 : 12.2 :
o-3 1
: - : - - . : .
J I : Ei : 45; : : 68 i : ; 10 i 7 : : ; . ;*y. : - - : : 1-1 1 : : - - ; * o-4 i J : '2 267 : 574:. - : - : - : 4;0; _ : - : - : -
Range : 1 a23 : 705 : 4,l : 00 : 00 : : 13 713 : : 12.0 :
::: : : 016 : 1:l :
Average : 5 263 : 373 : 6.9 : a,2 : 0.2 : 2.1 : 0.2 : 0.5 : : 0.4
- 1 Yellowfin tuna (Thunnus albacares). - 2 Skipjack (Katsuwonus pelamis). - 3 Eastern little tuna (Euthvnnus affinis). - 4 Bulletlfrigate mackerel (Auxis spp.). - 5 Spanish mackerel (Scomberomorus commerson): - 6 Marlin (Istiophoridae). - 7 Sailfish (Istiophorus.platvpterus). - 8 Dolphinfish (Corvphaena-hippurus).
Source : Research Institute for Marine Fisheries.
Table 84 - Monthly catches and catch per boat per day, by trolling boats in Tanjung Benoa, June 1981-July 1982 (in kg).
As the Philippines purse Seine fishing grounds are very close the North Sulawesi where indonesian pole and line boats are based, it is interesting to look at the evolution of the total catch in the Philippines. For the pole and line fishery in Aertembaga, we give two indices of CPUE, the catch per day at sea and the average quantity of tuna caught per kg of bait (Tab. 85).
The average value of CPUE for the years 1967 to 1971 cari be considered as the index of abundance when there were no purse Seine operations inthe Philippines. We cannot see any decrease of CPUE (catch per day) during the period 1978-1981 when the catches obtained by the Philippines purse seiners increased SO much.
We have seen in chapter 12 that the average value of the quantity of tuna caught per one kg of bait gives a better index of the abundance of tuna. The value of this index was 8.7 for the average -years 1967 to 1971, it droped to 7.4 in 1979, increased to 11.0 in 1980 and droped again to 6.9 in 1981 ; SO, its average value for years 1979 to 1981 is 8;4 which is not significantly different with the value calculated for the years 1967-1971. In 1982, both CPUE remain at a relatively low level but those values are not really significant as they were calculated only for the first 6 months of the year.
- 110 -
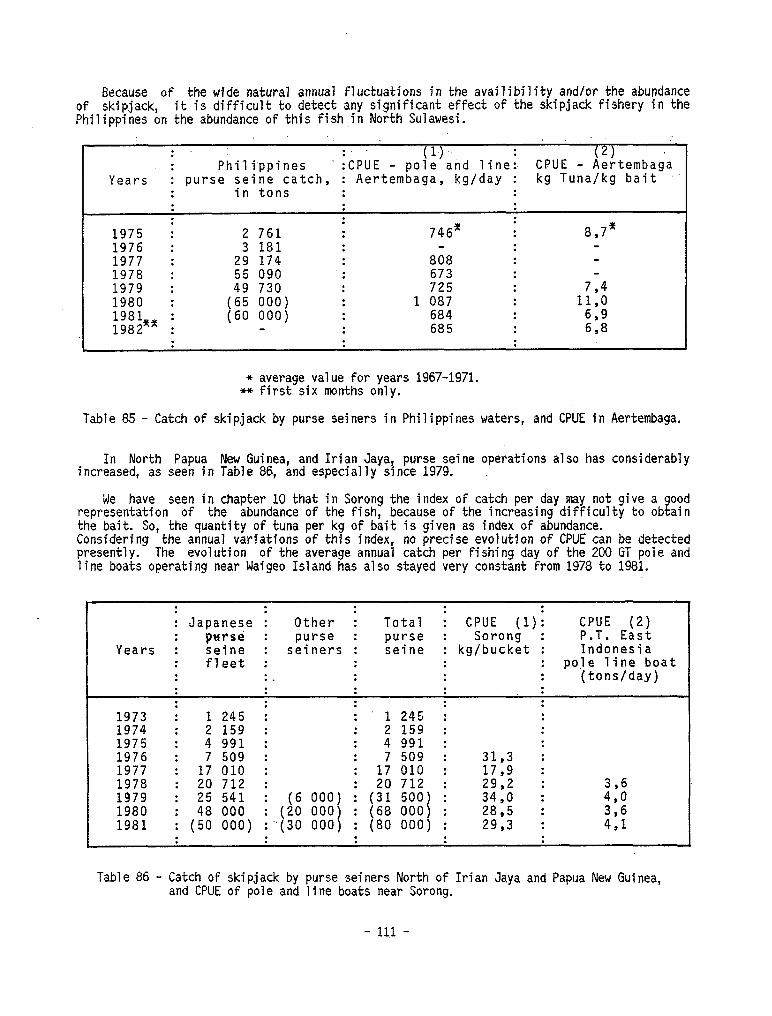
Because of the wide natural annual fluctuations in the availibility and/or the abundance of skipjack, it is difficult to detect any significant effect of the skipjack fishery in the Philippines on the abundance of this fish in North Sulawesi.
:
: Philippines ici,", (l,l-
- pole and linei .(Z)
CPUE - Aertembaga Years : purse Seine catch, : Aertembaga, kg/day : kg Tuna/kg bait
: in tons : : : : . .
. 1975 I 1976 : 1977 : 1978 : 1979 : 1980 : 1981 : 1982’* :
3 181 29 174 55 090 49 730
; : 746’
.
. . 8,7’ . . : : 808 : : 673 : : 725 : . . . 1 087 . . . 684 . . . . 685 :
* average value for years 1967-1971. * first six months only.
Table 85 - Catch of skipjack by purse seiners in Philippines waters, and CPUE in Aertembaga.
In North Papua New Guinea, and Irian Jaya, purse Seine operations also has considerably increased, as seen in Table 86, and especially since 1979. .
We have seen in chapter 10 that in Sorong the index of catch per day may not give a good representation of the abundance of the fish, because of the increasing difficulty to obtain the bait. SO, the quantity of tuna per kg of bait is given as index of abundance. Considering the annual variations of this index, no precise evolution of CPUE cari be detected presently. The evolution of the average annual catch per fishing day of the 200 GT pole and line boats operating near Waigeo Island has also stayed very constant from 1978 to 1981.
; ; ; : Japanese : Other : Total ; CPUE (1): CPUE (2) : pwrsè : purse : purse : Sorong : P.T. East
Years : Seine : seiners : Seine : kglbucket : Indonesia : fleet : : : : pale lin@ boat : : _ : . . : (tons/day)
: : : : : 1973 1245 : : : 1 245 : : 1974 : 2 159 : : 2 159 : : 1975 : 4 991 : : 4991 : : 1976 : 7 509 : . . 7 509 : 31,3 : 1977 : 17 010 : : 17 010 : 17,9 : 1978 : 20 712 : 29,2 : 1979 : 25 541 : (6 000) ; ($1 ;o’;, ; 34,0 : 1980 : 48 000 : (20 000) : (68 000) : 28,5 : 1981 : (50 000) : ‘( 30 000) : (80 000) : 29,3 :
Table 86 - Catch of skipjack by purse seiners North of Irian Jaya and Papua New Guinea, and CPUE of pole and line boats near Sorong.
- 111 -

Conclusions.
The increasing catches of skip'ack by purse seiners in the Philippines waters and in the North of Irian Jaya and Papua ii ew Guinea, have not presently affected the abundance of the fish in the Indonesian pole and line fishing grounds in the.North of Sulawesi and the North West of Irian Jaya.
- 112 -
19 POSSIBLE DEVELOPMENT OF ARTISANAL AN0 INDUSTRIAL TECHNIQUES FOR CATCHING TUNA IN INDONESIA.
Catches of tuna fishes in Indonesia has reached in 1979, 127 000 tons.
This value includes catches of big tunas like yellowfin, bigeye, marlin and sailfish (18 000 tons ), those of skipjack (42 500 tons) and show the predominance of the catches of small tunas like frigate mackerel, longtaiil tuna, eastern little tuna, frigate and bullet tuna which have been estimated at 66 000 tons in 1979.
One of the purposes of this report and more particularly of this chapter, is to study the possibility of increasing catches and exports of tuna from Indonesia ; SO we Will examine the possibilities of developing artisanal, semi-industrial or industrial techniques in order to increase tuna catches of-exportable value mainly skipjack and yellowfin.
Increasing tuna catches cari be imagined using two ways :
- Increasi ng number of artisanal or half industrial units as 'small artisanal longliners, handliners, trollers, gillnetters or middle size pole and line and purse Seine boats. - Increasing the number of industrial fishing units of large longliners, pole and line boats or large purse seiners.
Each solution. has its own advantages and drawbacks, which would be too long to develop ; SO, we will give here a quick revue of those different techniques and our opinion on the possibility to develop them.
19.1. Artisanal and semi industrial techniques which cari be developed or introduced.
;~;y, artisanal techniques cari be developed such as trolling, handline, longline or pole and . Efflclency of some of these techniques could be lncreased wlth simultaneous
introduction of aggregating device as it exists in the Philippines.
19.1.1. Handline fishinq on pavaos.
This method is very old in Indonesian waters and presently exists in North Central and South Sulawesi as well as in the Moluccas (Ceram), under the name of rompong..It could be developed in other areas where' systems should be set up. In the Philippines outriggered handline boats used are 2 GT with inboard engine, and one crew using two handlines of one hook each; The bait used is round-scad; small tuna or squid. The catch rates are 2 or 3, 40 , kg yellowfin per fishing day and 200 kgltrip (one trip is 3 to 5 days). This technique of handlining on aggregating device has also been developed for a few years in Hawaii where the bait used is squid.
Fishing is done during the day time in the Philippines, but cari also be done by night as it is in Hawaii. This technique has the advantage of obtaining a high price product (big yellowfin) for a low investment which cari be done by individual people.
On the other hand, the method is only possible in areas where the payaos should be set up in deep waters ; because of the high price of the payaos (2 000 to 4 000 US $ depending on the depth) this could be organized only on payaos yet set up by industrial enterprises which could invest in payaos. Catches done by those handline fishermen could then be sold back to those industrial enterprises with, as a result, among others, a better price for them.
- 113 -
19.1.2. Surface trollinq.
This technique is well developed near Padang (West Sumatra) where there are more than 350 troll boats, 15 to 20 GT, 30 to 40 HP engine using 10 to 15 lines each. Average catch rates are 600 fishes per trip (one trip is 6 to 9 days). Catches are preserved in ice but the quality of the product, mainly skipjack is usually poor. Catches are made on surface schools located by birds, or near drifting logs.
Main fishing grounds are off Pagai and Siberut Island% But because of brittle mouth of skipjack, trolllng, it is well known, is not the most convenient technique to catch this fish and SO cari only be developed in area where surface yellowfin are abundant.
19.1.3. Deep trollinq near pavaos.
There too, the technique has become popular in the Philippines for some time and has been developed in areas where payaos are set up. Small outriggered boatsl to 2 GT, 16 HP with 6 hooks, used one troll line 300 m long, weighted with 10 kg of load. The bait used is squid or milkfish ; fishing speed is 1.5 knots. The average catches, mainly yellowfin are 10 fishes of 25 to 50 kg each, per fishing day.
Similarly to handlining, this technique could be very simple to develop in Indonesia but cari only be started in areas where payaos are yet to be set up.
19.1.4. Artisanal lonq line.
This method is already developed to catch tuna in South West Sulawesi, but there also, the method used in the Philippines waters could be implemented and tested as a model. In this country, small tuna long liners 13-18 meter long, 18 to 30 GT, 100 HP, cari set 100 baskets of 5 to 6 secondary lines. Bait is made with milkfish alive and catch rate reach 3 to 5 %, including 70 % of yellowfin or bigeye of 25 to 60 kg. Duration of trips is 7 days and longliners fleet generally work with a mother boat.
The lines are short and total duration of a set is about 6 hours in order to prevent fish damage by sharks. Fish is preserved with dry ice because its destination is sashimi market. 1 This technique could be developed in Indonesia, especially in area North of North Sulawes from Manado, in North East Kalimantan and from Ambon (Maluku) which is close to the fishing grounds of Banda Sea. It could also be developed in the North of Irian Jaya, from Sorong, where good catch rate of yellowfin tuna cari be obtained from April to September.
19.1.5. Pole and line fisherv with live bait.
Small pole and liner boats, 12 GT to 30 GT with 50 to 165 HP engine and 15 to 26 crew members catch mainly skipjack. Fish is preserved in ice for the bigger boats which make 4 to 7 days trips, the smallest generally performing daily trips. Catch rates are usually depending on the season, 600 to 800 kg per boat and per fishing day.
This technique is the more used and the more productive to catch skipjack in Indonesia ; SO? as it is very well known, one would be tempted in order to increase the catches, to consider only increasing the total number of pole and line vessels. However, in this case, we cari fear that the problem of catching the bait Will be more and more difficult and Will become a major limitation of having good catch rate of tuna. Such problems already occurs in Manado, Ambon and Sorong. At present, abundance of bait is enough only in Kendary allowing further development of this fishery.
Because of bait problems, it is now often necessary to exploit areas far from the base which makes more complex the logistics and the conservation problems for small boats.
- 114 -
Better catches and catch rate per individual boat could be obtained by using mother boats (200 to 300 GT) as cold storage near.the fishing grounds. This technique has already been started in Ambon and Sorong.
Another possibility would be to set. up payaos near fishing bases in coastal areas in order to increase catches and lower fuel consumption. However; the result may be the obtention of higher proportion of very small skipjack nqt big enough to be exported on the international market, as we have seen in Aertembaga. An advantage of using payaos is that it simultaneously allows development of big yellowfin fishing by handline and'deep trolling.
19.1.6. Purse Seine fisherv with.small purse seiners. :.
Artisanal fishery of tuna and tuna-like fish using this method, is alreasy developed in Indonesia, mainly in Aceh and in Pelabuhan Ratu (South West Java). Two kinds of fishing gear are used . payang and ring net (pukat cincin) ; second in Banda Aceh.
the first one is used in Pelabuhan Ratu, the
A great proportion of catches is, in fact, not skipjack but tuna-like fishes such as frigate mackerel, eastern little tuna and longtail tuna as well as scads and mackerels. Tuna fishing is done during the day time on surface schools. The total production of tuna and skipjack using these gears averages 3 GQO tons/year in Aceh Province and 1 000 tons in South West Java.
In the Philippines waters, tuna catch using small purse Seine (ring nets) is well developed. The number of boats is about 300 units with total yearly catch near 30 000 tons. The catches are made on payaos set up near the shore. Boats are 20 GT, 65 HP using ring net 400-500 m long X 120 m. Fishing is done at night using one light boat to concentrate the fish. The catch rate averages 0.5 ton/set.
This method could be developed in Indoneiia, especial.ly in the Eastern province&, but we cari fear it would take many very small fishes not tradeable on the international market. However, for local consumption, this technique could be adapted on some of the existing units. The composition of the catches and the size of the fish may depend on the distance between the shore and the aggregating device set up.
19.1.7. Conclusions on the-possible development of artisanal and semi-industrial- techniques to increase the catches of tuna.
We have seen that many methods could be used and tested to increase tuna catches in Indonesia :
- Artisanal longliners, in conjunction with mother boat could be used in the Banda Sea, in the area North of Sorong and with good probability of success in the Sulawesi Sea (area North of Sulawesi and North East of Kalimantan).
- Handlining and deep trolling could be déveloped in a11 areas where payaos would be set up.
- Pole and line fishing on payaos, set up far enougb from shore in.order to restrict catches of too small yellowfin and skipjack, could be implemented near present fishing bases, to increase catch rates and lower fuel consumption.
The generalization of the use of the mother boat Will help'to find an answer to the lack of bait near the main bases and Will readily allow to get better quality fish.
Even by increasing artisanal techniques, the increase of catches of skipjack and yellowfin Will remain very limited if we develop only such techniques. SO it appears that Indonesia also need to implement industrial methods of catching tunas in order to increase export trade.
- 115 -
19.2. Industrial techniques to develop.
There are mainly three industrial methods to catch tuna :
- Longlining with big longliners, able to move out to better fishing grounds according with the season, 1s used to exploit stock of large yellowfin and bigeye as well as marlin, sailfish and sharks found in deep waters.
- Pole and line and purse Seine vessels catch shools of skipjack and yellowf i in surface or subsurface.
n found
19.2.1. Lonqlinins.
In Indonesia, this technique has been developed from Bali for 10 years. The fil longliners 110 GT, 365 HP, catch 100 to 120 tons/year per vessel, South Java and Bali Banda Sea, according to the season.
eet, 20 and in
In Ambon, a new company has begun this fishing in 1981 using 5 modified trawlers 300 GT. According to the reports of effort and catch statistics by area on japanese tuna longline fishery, very good catch rates of yellowfin cari be obtained a11 year long in the sea of Sulawesi and in the Pacifie Ocean North of Irian Jaya. Bigeye tuna is abundant in the South West of Sumatra and in the Banda Sea, and we have seen in chapter 3, that benefits could be expected when introducing in Indonesia, for those two areas, deep tuna longliners.
19.2.2 Impact of industrial pale and line and purse Seine fisheries on the resources available to the artisanal pale and line fishery.
Before developing industrial pole and line and purse Seine techniques, it is advisable to pay attention to the impact of the introduction of those methods on the surface stock already exploited by the present pole and line fishery in Indonesia.
Therefore, we need to examine what the stock exploited by long range pole and line and purse Seine vessels is, for the two species : skipjack and yellowfin.
19.2.2.1. SKIPJACK.
During long time, migratory stocks of
it has been considered that in the same area there were only largely skipjack, being shared by different countries and different EEZ. The
facts seem more complex.
Tagging done by South Pacifie Commission in the South West Pacifie shows a very wide migration of fishes from one area to others, confirming that skipjack cari be a very migratory species but, on the other hand, we cari see that from the many fishes tagged in Papua New Guinea, for example, a weak proportion has ever been recaptured very far from the tagging area ; the major recapture has been done near the area of tagging, sometimes after a long period at sea.
- SO we cari imagine the existence of local stocks, remaining near the same islands and archipelagos, and more largely ones usually living more off shore or sometimes melted with the local ones.
- This hypothesis of "local stocks" and "largely migratory ones is making its way, at present time, for many scientists.
- 116 -
- This cari explain the fact that in some areas the average catch are obtained a11 year long on the “local stock" with high peak of production during "migratory ones" crossings. It is not impossible SO far for the "local stock" to be renewed by migratory ones during that crossing, or that some fishes from "local stocks" leave the area with the migratory ones of the same size.
- The importance of melting between stocks could be very variable accordingtothe areas and latitudes considered.
In higher latitudes (Japan, Australia, New Zealand) fishes arriving there are a11 highly migratory ones, going back in tropical areas for spawning, explaining that in those areas fishing seasons are usually well defined in time.
In middle latitudes (Hawaii, New Caledonia, Fidji) local stocks tied up with islands and shallow waters could be periodically renewed when crossing of the migratory fishes.
In lower latitudes and in Equatorial areas (as in Indonesia) local stocks tied up with islands could be less melted with the stock of migratory origin which should remain more offshore.
- In the Western Pacifie, thehypothesis of a mainly "local stock* in Philippines cari be made, taking into account that though 100 000 to 150 000 tons are annually caught there, no indication of lower fishing catch rated in Sorong or Manado is noticed although catch of skipjack in Philippines have decreased in 1980-1981 in spite of increasing fishing effort (chapter 18). The other hypothesis is that only a part of the whole "mi-gratory stock" from which migrant fishes corne, migrate seasonally in higher latitudes.
Conclusions are that in offshore areas in the North of Irian Jaya and Western Sumatra, exploitation with purse Seine vessels or long range pole and line boats m8st possibly should not affect the artisanal pole and line fishery operating in Sorong, Ambon, Kendari or Aertembaga, and SO cari be widely developed.
SO are the stocks South of Java and the Nusatenggara Island. In the interipr seas of Indonesia, as the Maluku Sea, the Ceram Sea and the Banda Sea, the relations between the near shore stocks and the offshore ones are not known but the very weak leves of present skipjack exploitation in those areas and soma simi,larity with the Gulf of Mindanao area allow us to expect large possibility of developing tuna fishing both with artisanal and industrial techniques.
19.2.2.2. YELLOWFIN.
The development of industrial techniques must not affect the catch rates of yellowfin by longliners. As a matter of fact, the proportion of yellowfin in total catches by pole and liners and purse seiners Will probably remain low and Will be done on Young fish with high natural mortality rate.
On the other hand, the introduction of purse Seine or/and pole and line fishery on aggregating device in the interior sea Will ease the development of artisanal handlining and longlining fisheries, as it happened in the Philippines.
Purse Seine cari be introduced in the interior seas of Indonesia, if fishing effort is not too high (5 to 10 vessels) and with only some limitations as, for example, a limitation of the fishing grounds outside the 10 miles off the shore.
- 117 -
19.23. Industrial pale and line.
There are presently four industrial pole and liners in operations in Indonesia with an average catch of 700 to 800 tons per boat and per year, mainly skipjack, and with an average catch by Fishing day of 2.6 to 4.1 tons, dependi ng on the season.
The fishing grounds are located East or South West and West of the Waigeo Island, where the bait is caught. The bait is usually found in small quantity (35 to 50 buckets per fishing night) and has to be caught every night, thus restricting tuna fishing grounds to those located near the bait fishing grounds,'The catch of tuna per bucket of bait averages 100 kg.
In the Sorong area, the bait is often difficult to obtain from May to August. However, the main advantage of pole and line fishing with freezing industrial boats (over 100 GT) is being able to obtain bait in areas far from the existing bases of small pole and liners, usually less or not yet exploited.
This kind of fishing cari be developed in the near future, but there too, it Will be interesting to develop new fishing strategies in order to lower the need of bait or to increase the catches of bait for each unit, using small boats specialized in night bait catching with lampara and lift nets.
19.24. Industrial purse Seine fisherv.
North of Irian Jaya and Papua New Guinea, purse Seine fishery is yet very active and the Japanese fleet catch there almost 60 000 tons a year (72 % skipjack, 26 2 yellowfin and 2 % bigeye). The technique used is night fishing (just before dawn) on drifting logs, but the day time school sets have become more successful for the past two ygars.. According to KEARNY, the potential should there still be very important but still barely known.
The main problem for developing industrial purse Seine fishery is a technical one. Purse seining is not possible when schools are too small or too scattered. This is the reason why purse Seine cannot operate in the fishing grounds of the small pole and line boats which may prevent any conflict. We present briefly, here, areas where purse seining cari be introduced in Indonesia : we consider four main areas :
19.2.4.1. North of Irian Java.
That area is well known to japanese and american purse seine fishing companies. Trials have been done by JAMARC for the past ten years and the technique of night fishing on drifting logs is now being used. We must notice however that for two years, a higher proportion of catches has been done on fish school set during the daytime. Catch rate by japanese purse Seine averages 20 tons per set, 10 tons per day at sea and 15 tons per effective fishing day. Japanese purse seiners tome in the area from Japan, making 30 to 40 daytrips on which 10 days.are lest in travels. SO, we cari expect better annual catches for vessels based in Ternate, Sorong which are very near the fishing grounds. However, because the fishing grounds are wide and the schools available for purse always difficult to find, we recommend the companies in order to be efficient, to with, at least, 2 or 3 vessels.
or Biak
seiners operate
19.2.4.2. West of Sumatra.
Areas North West and South of Sumatra are yet completely inexploited'and largely inexplored for their tuna resources. Only small scale fisherieslbased in Padang and Banda Aceh catch 2 500 to 4 000 tons of skipjack and yellowfin. Schools are met a11 year long off Siberut and Pagai Islands but these schools are usually scattered.
- 118 -
From January to April-May, hydrological structures, are convenient between 5O N - 5O S and from toast line to 85" E (a homogeneous layer of 100 m or les5 with a temperature gradient of 2" to 3"C/lO metres in the thermocline).,.During this season school fish sets could be possible during the daytime. More over, drifting logs are numerous off .shore in November-December and from March to June and could allow the setting on drifting logs.
Using this method, purse seiner "LADY SUSHILL" has caught 517.tons in 50 days in the area 0 - 2" S, between 87" E and 90" E, in January-February 1980. During this period, we note a strong convergence at this latitude. In March 1982, a Japanese purse seiner has been observed by local fishermen do.ing trials on drifting logs off Pagai Islands.
From April to October, we cari also observe a strong convergence.of surface current between 8' S - 10° S and 85" E - 100" E. From August to October, this convergence may be very close to Southern Sumatra about 6" S to 8" S.
19.2.4.3. South of Java and Nusatenqqara Islands.
Convenient hydrological conditions may occur in those areas from July to September because of coastal upwelling in South of Java and Bali. At this time coastal sea surface temperature may be 1.5" to 2OC below offshore temperature, and frontal areas could be convenient for purse seining. A longline vesse1 captain confirmed to us the abundance of active skipjack schools in this area from May to August.
SO, during this period, we could expect a season for purse seining on daytime fish schools. A well recorded thermocline (even if a little too deep, 100-120 m) has been observed in South and South West Java during the “Jetindofish” cruises done in February-March. During this period, many drifting logs cari be encountered offshore and could allow night logs setting, if those logs have fish, which must be verified. Consequently, .there is in Southern Indonesia (Indian Ocean) two complementary fishing seasons for purse Seine : one from January to May in South West Java on drifting logs and another from June to August-September in South of Bali and Nusatenggara. During the period October to December, fishing could occur either in West Sumatra or in Ceram and Buru Seas.
19.2.4.4. Conclusions.
If we except the North toast of Irian Jaya, we cari say that the purse Seine fishing grounds of Indonesia are yet to be discovered.
This is why we recommand experimental surveys by conmnercial boats-particularly in the Indian Ocean West of Sumatra and in the South of Java and Nusatenggara Islands.
20 RESOURCE ASSESSMENT AND NATIONAL AND INTERNATIONAL IMPLICATIONS.
20.1. Western Pacifie Ocean.
Skipjack are highly" fecund, larger tunas.
fast growing and relatively short lived, if compared to Stock assessments made by the South Pacifie Commission (SPC) indicate that the
present fishing level in the Western Pacifie, probably near 500 000 tP 600~000 tons in recent years, is very low, offering a considerable potential for increased catches.
- 119 -
SPC scientists calculated the Western Pacifie stock to be about 10 millions tons with a turn over of 20 % a month (that is 20 % of the stock is replaced each month). If 50 % of this turn over was caught, a potential annual catch of 12 millions tons is possible. These calculations are yet to be confirmed as they greatly exceed the previous estimations but they indicate, at least, that there is no overfishing problem for this species at the present time.
Areas where the vessels may operate are usually limited during a given period, SO, the stock available to purse seining is also limited. Even if there is no global overfishing a too large number of vessels in the area where the fish is catchable means a higher competition between them and SO lower the catch rates for each vessel. On the other hand, as it always takes time to find the concentration of schools or logs, the number of vessels operating in one area, must not be too low. Individual vesse1 should not loose too much time finding grounds SO, the interest of the companies is to work in fleet of two or three vessels at least.
Big oceanic purse seiners cannot usually operate in areas very close to the shore where the schools are too small or too scattered (there are some exceptions) ; and SO they need to be able to operate seasonally in different areas and often in different EEZ. This is of great importance if we consider the national and international resources management.
Since the oceanographic conditions in the area North of Irian Jaya may change from one year to another, and because some of the fishing grounds usually found inthe Indonesian EEZ may be found, according to the season or the year, in neighbouring waters and vice versa, we think that a mutual agreement between those countries would be of a great i nterest for the future Indonesian purse Seine fleet.
In tuna .fishing, especially with purse Seine, a better mobility and a wider choice FEzezn flshlng grounds mean a better catch. We consider that 10 to 20 purse seiners, at
may operate from Indonesia in Indonesian EEZ and international waters of Eastern Indonésia.
We have seen that the risk is very small to overfish skipjack , whose potential is very high. It is the reason why we do not find any sign of an hypothetic effect of the purse Seine fishing on the abundance of the stock available to the small scale pole and line fishery (chapters 18, 19). As artisanal pole and liners and purse seiners do not compete in the same areas and for the same schools, there is no restriction to develop both kinds of fishery simultaneously.
The problem of resource management which has been sometimes pointed out in the Western Pacifie cornes from the fact that juvenile yellowfin constitute significant proportion of the catches of purse seiners (about 15 96). Adult yelllowfin are caught by long liners and are considered to be fully exploited, SO, in order to protect yellowfin tuna stock, skipjack purse seining might have to be restricted. In order to know the real effect, we cari see what happened in the Atlantic Ocean when yellowfin surface fishery was introduced ; before its introduction the Maximum Sustainable Yield (MSY) calculated from the catch and effort of the longline fleet was estimated to be around 45 000 tons ; at the present time, the catches by purse seiners have reached 120 000 tons and the longline catches have become stable at a lower level of 35 000 tons. SO, the total catches of yellowfin has been multiplied nearly by three, with the introduction surface fishing.
20.2. Indian Ocean.
Presently, the main species caught in the Indonesian waters of the Indian Ocean are yellowfin and bigeye, both fished by longline fleets. According to SUZUKI (1979), the estimated MSY for yellowfin is about 40 to 60 000 tons. In recent years, the total production by the longline fishery was around 30 000 tons and it has generally been agreed that, even if the fishing effort by the longline fishery was increased, no marginal increase in the catch could be expected (FAO, 1969 ; HONMA and SUZUKI 1972, SUZUKI 1979). However, the development of the surface fishery may potentially increase the total production.
- 120 -
With the introduction of deep long line, it appears that the stock of bigeye tuna in the Indian Ocean offers scope for further exploitations. According to RIGGS, 1981 (if SILAS and PILLAI, 1982), the yield curve shows increasing catch with effort. As stated by FAO, an increase in the total catch could be obtained by increasing the longline fishery effort, but the CPUE Will probably tend to decline gradually. However, the increased use of deep long line gear might further the production of bigeye without lower CPUE, at least in a short future (see chapter 3).
As already seen for the Western Pacifie, the main potential in the future remaitis the skipjack. The total potential for this species is not known ; estimates recently discussed in IOFC give a potential of 225 to 400 000 tons with present catches no more than 30 to 60 oo0 tons. If we exclude the possible development of the mal1 scale sector, which catches the fish close to the coastal and insular areas, one way to increase the catches of skipjack is to introduce there purse seiners fishing offshore. As seen for the Western Pacifie, the introduction of this technique Will not, most probably, have any effect on the existing artisanal fishery. However, as the resources are little known, we consider that it could be of great interest for the country to favour experimental fishing, there.
-------------------------
- 121 -
: ‘1 _ ‘T ‘.; ;~ : : .-: !’ <-
.-. ‘REFERENCES _. : .. ‘. -_g_ ~
, ._.
‘. :
L.., -. IC’ :, j‘... .- -. L
: : I :- ‘_ :- .. i .I. -1 ,; . . ~Y$,. .:
. . -. T _-.. __ ,I ‘.~ ̂-- / - . .."' FAO, 1969. - Report of the IOFC Working Party on Stock Assessment in relation to immediate
problems of management in the Indian Ocean, Rome, 30 Sept.-3 Oct. 1969. FAO Fish.Rep. 82 ; 25 pp. ~. 1 >.e<... . . pu. : . . .' ,'. ,.', iEl .;
~, : r ,,- _ ;- i. .: : ..-
: .l< ; >" : I '_ _. ;',__ ‘ '._- _' . : ._ _-
_ ., FAO, 1980. - State of selected stocks of tuna and billfish in the Pacifie and Indian Oceans
FAO Fish.Tech.paper no 200.
HONMA, M. and SUZUKI, Z., 1972 - Stock assessment of yellowfin tuna'exploited by longline fishery in the Indian Ocean 1959-1969. Bull. Far Seas Fish. Res. Lab., 7 : l-26.
_ ., ..".'_ ._ . . . . ) -:.-.:--, _
INOUE, M. and IWASAKI, Y., 1969 - Movement of the thermal equator and the fishing grounds mainly for yellowfin tuna in the Indian Ocean. Bull. Jap. Soc. Sci. Fish. 35 (10) : 957-963. . i <.-
JAPAN
.: r. ; ,: . : ‘_ ; . . 1. .
--’ .;: . .
.A.” _. ,__-.’ ~. _ . . -
MARINE FISHERIES RESOURCE CENTER - Investigation reports (in Japanese) 6/50, 3/51, 6/52, 11152, lli54, 4/55, 8155.
I ,. ‘. :,i i : . . : : ; *. -: >Zl . . ._,
-.. _-._ -
KEARNEY, R-E., 1979. - An overview of recent changes in the fisheries for highly migratory species in the Western Pacifie Ocean and projections for future development. SPE .(.79)- 17.‘.
-- ‘. . ; - _ <.“_ -. . . .
_ 1.. _ ‘-‘:
KEARNEY, R.E., 1982. - SPC tagging shows big increase in skipjack tuna catch posseble. Austr. Fish. February, 1982. .
. . -. : _. .~ : _I . .
,’ KUME, S., 1979. - Bi
8 eye
of the stock, tùna resource in the Paci fit Ocean, i ts fi shery’. b;ol ogy and status
AWS/BP/G.Workshop on the assessment of selected tunas in the Pacifie ..and,Indian.Oceans. Shimizu, Japan, 13-22, June, 1979.
MARCILLE J., et BCUR W., 1981. - La pêche des thons à la senne et a la canne dans 1'Ccéan _ .- : .-,
.- Pacifique,tropical.-Trav. DO~.- ORSTOM no 134 : 259 p. , _ . .
.._. ' . . . . -, -:
MARCILLE J. et UKTOLSEJA J., 1982. seiner "CAMAR",
- Short analysis of the catches of the indonesian purse during the period January 1980 to April 1982. (mimeo)
,Y '. ~ < ,': .i- .>- _.,- : I
.' i .. _. - 2 _ - .c ': . . .
. . .
- 123 -
MARCILLE J. et SADHOMORO B., 1982. - Expected benefit by introducing deep long1 in Indonesia. Unpublished manuscript, 12 p. multigr.
ine gears
OTTESEN P. and GRANT C., 1982. - Prospects for australians in the Western Pacif fishery. Austr. Fish. April 1982.
ic Skipjack
Research and Development Depcrtment, Fisheries Agency of Japan. Annual report of effort and catch statistics by area on Japanese tuna longline fishery. Years 1976-1977 and 1978-1979.
RIGGS, F.V., 1981. - Status report : Tuna in the Indian Ocean - NOAA Tech. Mem.. NMFS, NOAA-TM-NMFS. SWFC, 15.
SILAS, E.G. and PILLAI, P.P., 1982. - Resources of Tunas and related species and their fisheries in the Indian Ocean - CMFRI Bull. no 32.
SIMORANGKIR, S., 1981. - Skipjack and tuna in Indonesia. PT. (Persero) Perikanan Samodera b Besar, Jakarta, 20 p.
SIMORANGKIR, S., 1982. - Perikanan tuna longline di Indonesia'PT. (Pesero) Perikanan Samodera Besar, Jakarta, 87 hal.
SUDA, A., KUME S. and SHIOHAMA T., 1969. - An Indicative note on the roli of permanent thermocline as a factor controlling the longline fishing ground for bigeye tuna. Bull. Far Seas Fish. Res. Lab. (l), 99 - 114.
SUZUKI, z., 1979. - Stock assessment of yellowfin tuna in the Indian Ocean SAWS/BP/21, prepared for the Workshop on the assessment of selected tuna and billfish stocks in .the Pacifie and Indian Oceans, Shimizu, Japan 12-22 June 1979.
SUZUKI, Z., TOMLINSON P.K. and HONMA M., 1978. - tuna. Bull IATTC, 17 : 227-441.
Population structure of Pacifie yellowfin
SUZUKI, Z., WARASHINA Y. and KISHIDA M., 1977. - The comparison of catches by regular and deep tuna longline gears in the Western and Central Equatorial Pacifie. Bull. Far Seas Fish. Lab. (15), 51-89.
TANAKA, T., 1980. - Atlas of skipjack tuna fishing grounds in Southern waters, 1979 Fishing season 5 May 1979 - April 1980. Translation by T. Otsu. Southwest Fisherv Center, NMFS, NOAA, no 48.
-124 -
UKTOLSEJA, J., 1980. - Length frequency distribution of skipjack landed in Ternate Sorong and Ambon ; MFRI/LPPL. Unpublished.
UKTOLSEJA, J.C.B., SADHOTOMO B. and UKTOLSEJA R.E., 1982. - Sumberdaya perikanan tuna. Balai Penelitian Perikanan Laut, Jakarta. 57 hal. (unpublished).
UNAR, M., 1972 Tria1 fishing surveys for skipjack as an largely development of the Indonesian skipjack fishery. IPEC/72/Svm/36.
UNAR, M., 1980. - Fisheries Statistics of Indonesia, 1978. Directorate General of Fisheries no 8.
UNAR, M., 1981. - Fisheries Statistics of Indonesia, 1979. Directorate General of Fisheries.
UNAR, M., 1981. - A review of the East Indonesian skipjack pole and line fishery. Res. Inst. Mar. Fish., Jakarta, 24 p.
UNAR, M., 1981. - A review of the East Indonesian ski pjack pole and line fishery. Bull. Pen. Perikanan. 1 (2) : 143 - 156.
UNAR, M., (ed.) 1982. - Perikanan tuna dan cakalang di Indonesia. Pus. Lit. Banq. Kan., Jakarta. 214 hal.
WIDODO, J., 1973. - Survey on skipjack pole and line fishing by joint - venture companies in the Eastern Indonesian waters, MFRI/LPPL 11/73- PL. 045/73.
- 125 -

OFFICE DE LA RECHERCHE SCIENTIFIQUE ET TECHNIQUE OUTRE-MER
Direcl’ion générale : 24, rue Bayard - 75008 PARIS
Srrvice des Publicatiom :
70-74, route d’Aulnay - 93140 BONDY
O.R.S.T.O.M. Éditeur
Dépôt légal : 3é trim. 1984. I.S.B.N. : 2-7999-0739-9
IWRO.GRWI~IBUE FA%T 101 ,o 16