Embed Size (px)
Citation preview
Le Pole Hospitalier dans l’IHULe Pole Hospitalier dans l’IHU
Forces et faiblesses
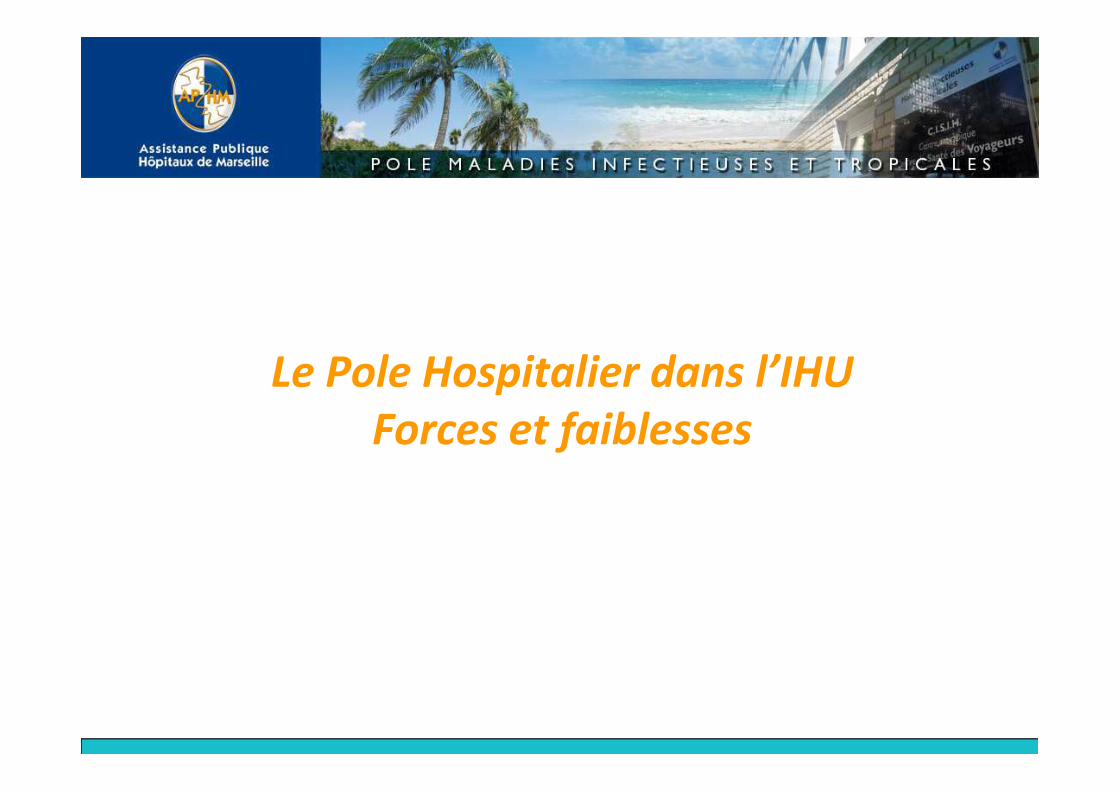
La carte d’identité du pole actuelle
• Le pole comprend toutes les UM et UF des
services
Service Pr. BROUQUI
Service Pr. STEIN
services
– Maladies infectieuses et Tropicales secteur Nord
• P Brouqui ( 18 lits)
– Maladies infectieuses et Tropicales secteur Centre
• A Stein ( 18 lits)
– Fédération de microbiologie, virologie, hygiène
• D Raoult, M Drancourt, B La Scola
– Laboratoire de parasitologie
• R Piarroux
Service Pr. RAOULT – Service Pr. DRANCOURT Service Pr. La SCOLA Service Pr PIARROUX
ANTENNE Sud Pr DRANCOURT
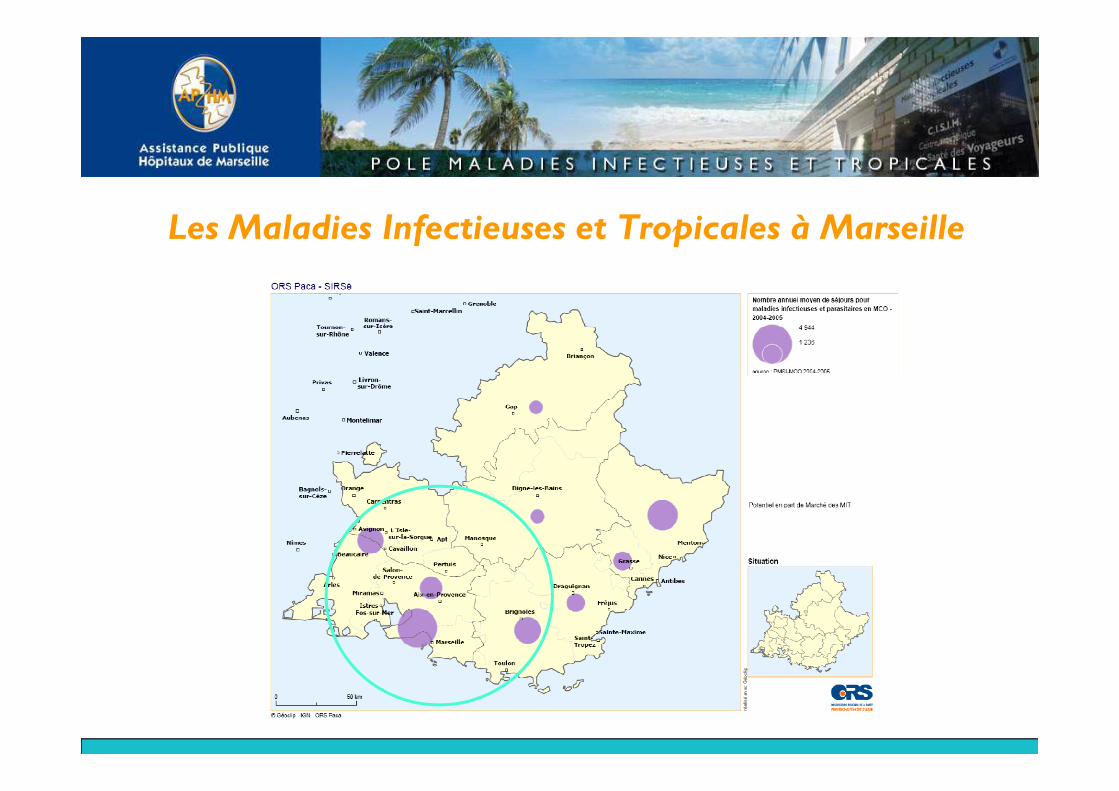
Les Maladies Infectieuses et Tropicales à Marseille
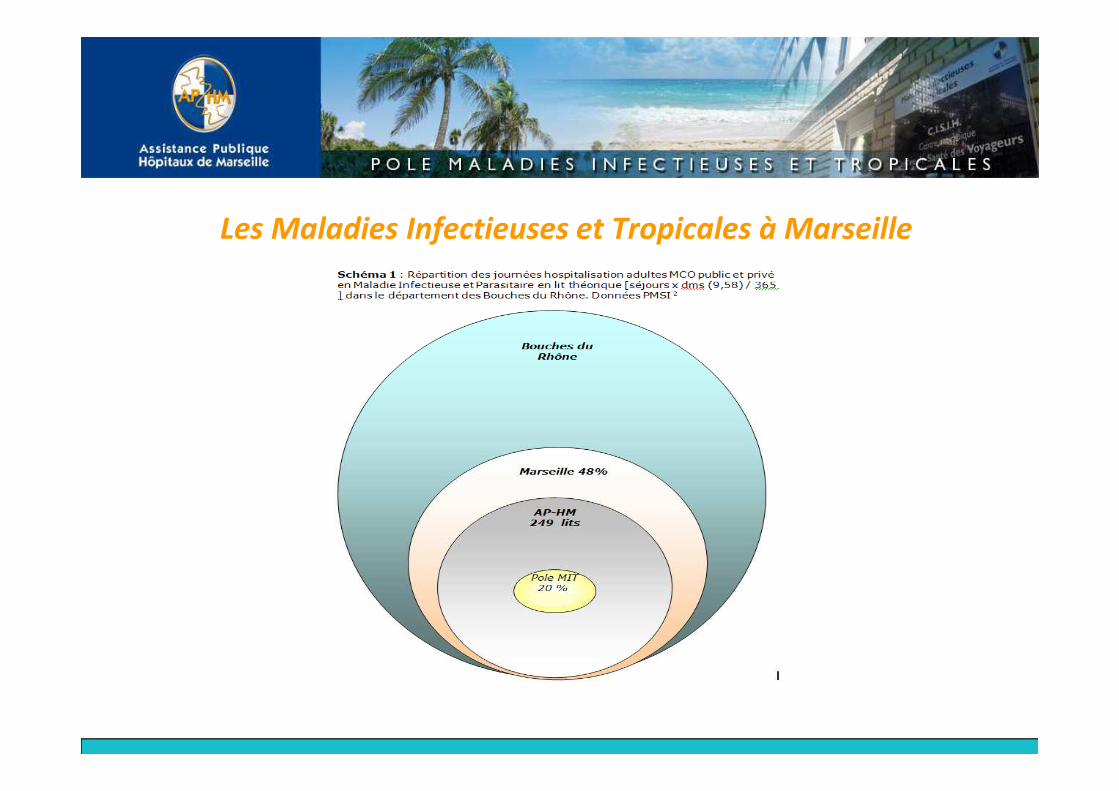
Les Maladies Infectieuses et Tropicales à Marseille
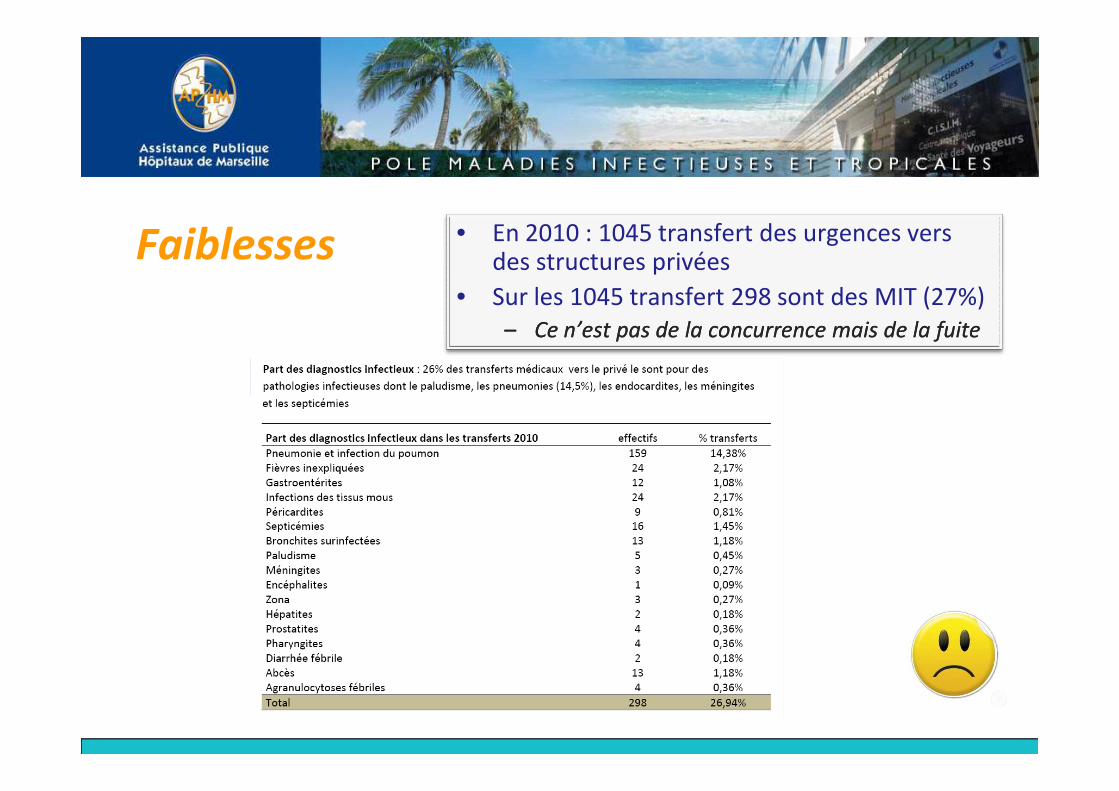
Faiblesses • En 2010 : 1045 transfert des urgences vers des structures privées
• Sur les 1045 transfert 298 sont des MIT (27%)
–– Ce n’est pas de la concurrence mais de la fuite Ce n’est pas de la concurrence mais de la fuite
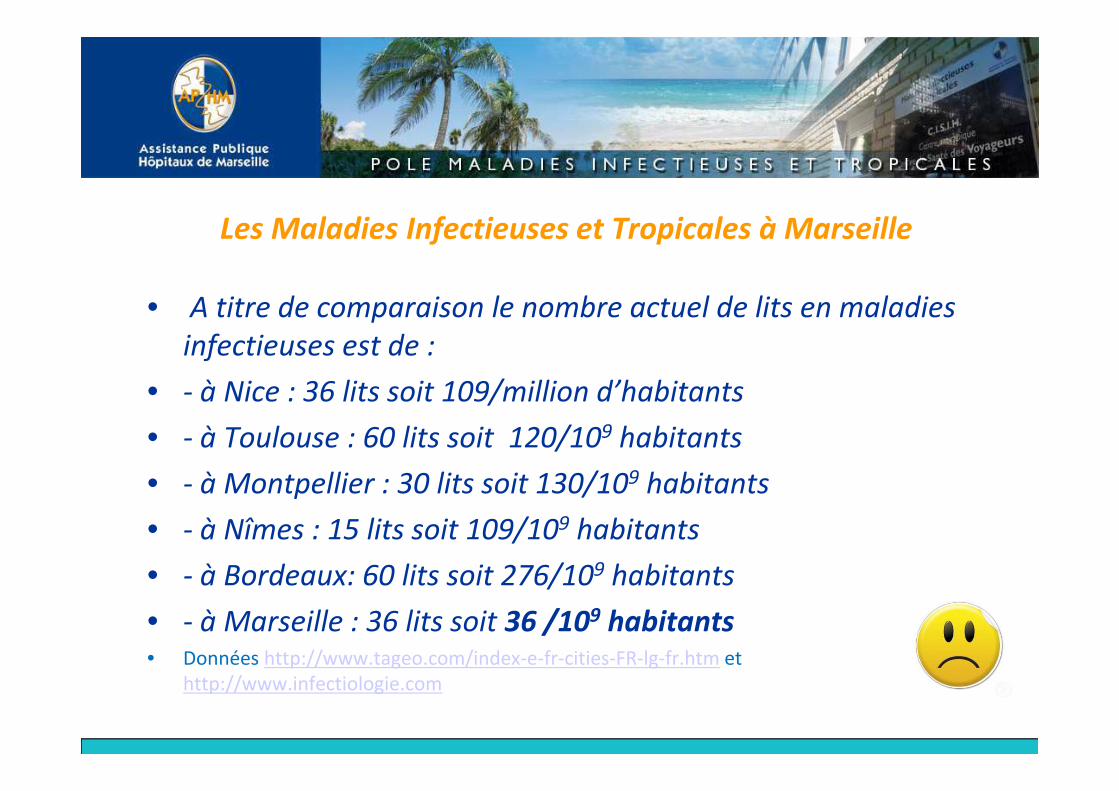
• A titre de comparaison le nombre actuel de lits en maladies
infectieuses est de :
• - à Nice : 36 lits soit 109/million d’habitants
Les Maladies Infectieuses et Tropicales à Marseille
• - à Nice : 36 lits soit 109/million d’habitants
• - à Toulouse : 60 lits soit 120/109 habitants
• - à Montpellier : 30 lits soit 130/109 habitants
• - à Nîmes : 15 lits soit 109/109 habitants
• - à Bordeaux: 60 lits soit 276/109 habitants
• - à Marseille : 36 lits soit 36 /109 habitants• Données http://www.tageo.com/index-e-fr-cities-FR-lg-fr.htm et
http://www.infectiologie.com
Valorisation des MIT dans le Pôle MITValorisation des MIT dans le Pôle MIT
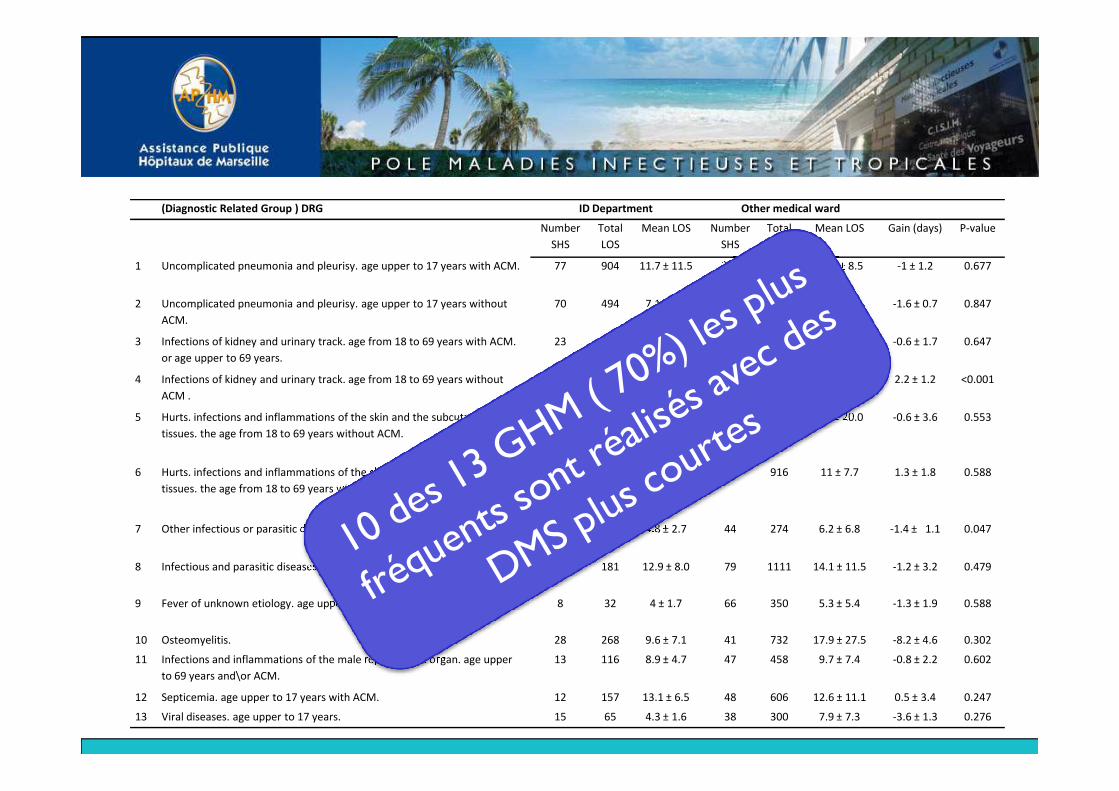
(Diagnostic Related Group ) DRG ID Department Other medical ward
Number
SHS
Total
LOS
Mean LOS Number
SHS
Total
LOS
Mean LOS Gain (days) P-value
1 Uncomplicated pneumonia and pleurisy. age upper to 17 years with ACM. 77 904 11.7 ± 11.5 315 4010 12.7 ± 8.5 -1 ± 1.2 0.677
2 Uncomplicated pneumonia and pleurisy. age upper to 17 years without
ACM.
70 494 7.1 ± 4.8 224 1943 8.7 ± 6.2 -1.6 ± 0.7 0.847
3 Infections of kidney and urinary track. age from 18 to 69 years with ACM.
or age upper to 69 years.
23 212 9.2 ± 4.4 137 1342 9.8 ± 8.1 -0.6 ± 1.7 0.647
4 Infections of kidney and urinary track. age from 18 to 69 years without
ACM .
18 115 6.4 ± 3.5 119 499 4.2 ± 4.8 2.2 ± 1.2 <0.001
ACM .
5 Hurts. infections and inflammations of the skin and the subcutaneous
tissues. the age from 18 to 69 years without ACM.
34 274 8.1 ± 8.0 79 687 8.7 ± 20.0 -0.6 ± 3.6 0.553
6 Hurts. infections and inflammations of the skin and the subcutaneous
tissues. the age from 18 to 69 years with ACM. or age upper to 69 years.
25 308 12.3 ± 8.9 83 916 11 ± 7.7 1.3 ± 1.8 0.588
7 Other infectious or parasitic diseases. age under 70-year-old without ACM. 60 289 4.8 ± 2.7 44 274 6.2 ± 6.8 -1.4 ± 1.1 0.047
8 Infectious and parasitic diseases. with ACMS. with or without act. 14 181 12.9 ± 8.0 79 1111 14.1 ± 11.5 -1.2 ± 3.2 0.479
9 Fever of unknown etiology. age upper to 17 years without ACM. 8 32 4 ± 1.7 66 350 5.3 ± 5.4 -1.3 ± 1.9 0.588
10 Osteomyelitis. 28 268 9.6 ± 7.1 41 732 17.9 ± 27.5 -8.2 ± 4.6 0.302
11 Infections and inflammations of the male reproductive organ. age upper
to 69 years and\or ACM.
13 116 8.9 ± 4.7 47 458 9.7 ± 7.4 -0.8 ± 2.2 0.602
12 Septicemia. age upper to 17 years with ACM. 12 157 13.1 ± 6.5 48 606 12.6 ± 11.1 0.5 ± 3.4 0.247
13 Viral diseases. age upper to 17 years. 15 65 4.3 ± 1.6 38 300 7.9 ± 7.3 -3.6 ± 1.3 0.276

DRG of patients Other medical ward ID Department Calculated saved cost
a/Number
SHS
b/Total LOS c/ID Mean
LOS
ID Total
LOS
Saved days Saved DRG DRG Cost Saved cost
1. Uncomplicated pneumonia and pleurisy, age upper to 17 years with
ACM.
315 4010 11.7 3685.5 -324.5 -27.7 4 447€ -123 337.74 €
1. Uncomplicated pneumonia and pleurisy, age upper to 17 years without
ACM.
224 1943 7.1 1590.4 -352.6 -49.7 2 995€ -148 737.61 €
1. Infections of kidney and urinary track, age from 18 to 69 years with
ACM, or age upper to 69 years.
137 1342 9.2 1260.4 -81.6 -8.9 3 215€ -28 515.65 €
1. Infections of kidney and urinary track, age from 18 to 69 years without
ACM, or age upper to 69 years.
119 499 6.4 761.6 262.6 41.0 1 664€ 68 276.00 €
1. Hurts, infections and inflammations of the skin and the subcutaneous
tissues, age 18 to 69 years without ACM.
79 687 8.1 639.9 -47.1 -5.8 2 136€ -12 420.44 €
tissues, age 18 to 69 years without ACM.
1. Hurts, infections and inflammations of the skin and the subcutaneous
tissues, age 18 to 69 years with ACM.
83 916 12.3 1020.9 104.9 8.5 4 013€ 34 224.69 €
1. Other infectious or parasitic diseases, age under 70-year-old without
ACM.
44 274 4.8 211.2 -62.8 -13.1 2 185€ -28 587.08 €
1. Infectious and parasitic diseases, with ACM, with or without act. 79 1111 12.9 1019.1 -91.9 -7.1 3 945€ -28 104.30 €
1. Fever of unknown etiology, age upper to 17 years without ACM. 66 350 4 264 -86 -21.5 2 294€ -49 321.00 €
1. osteomyelitis 41 732 9.6 393.6 -338.4 -35.3 5 586€ -196 906.50 €
1. Infections and inflammations of the male reproductive organ, age upper
to 69 years and\or ACM.
47 458 8.9 418.3 -39.7 -4.5 3 041€ -13 564.91 €
1. Septicemia, age upper to 17 years with ACM. 48 606 13.1 628.8 22.8 1.7 5 280€ 9 189.62 €
1. Viral diseases, age upper to 17 years 38 300 4.3 163.4 -136.6 -31.8 4 015€ -127 546.28 €
Total 1320 13228 12057.1 -1170.9 -154 -645 351.20 €
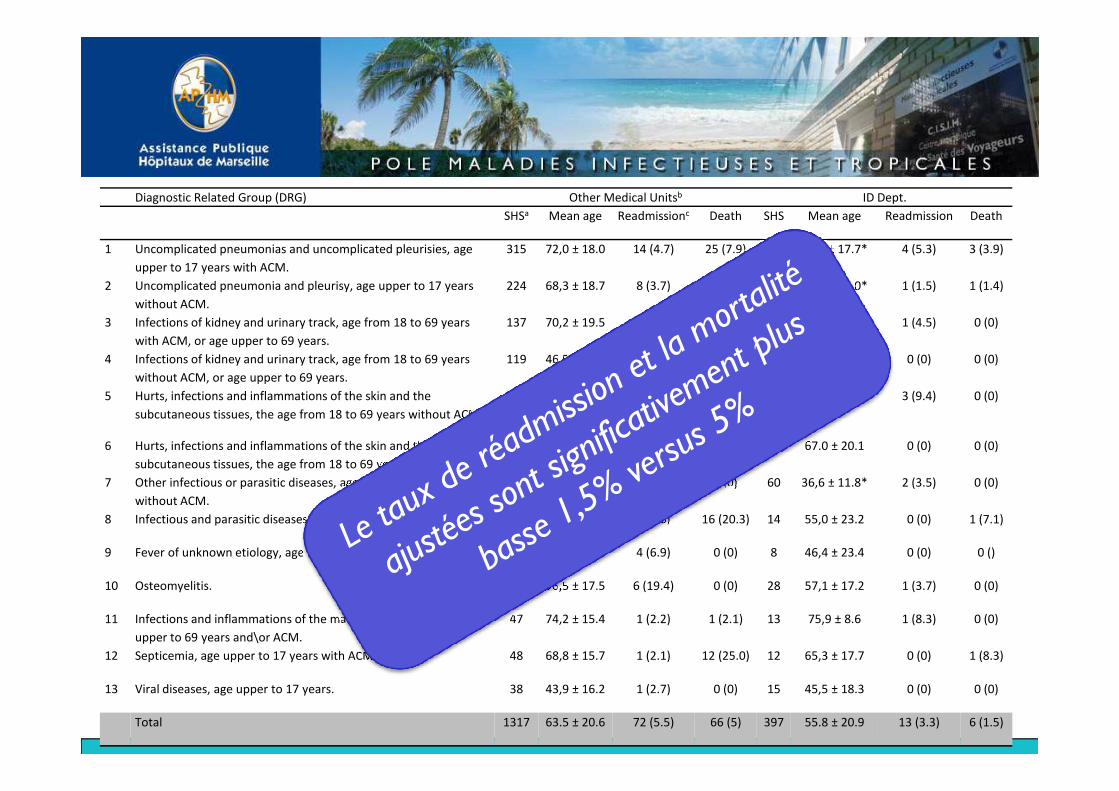
Diagnostic Related Group (DRG) Other Medical Unitsb ID Dept.
SHSa Mean age Readmissionc Death SHS Mean age Readmission Death
1 Uncomplicated pneumonias and uncomplicated pleurisies, age
upper to 17 years with ACM.
315 72,0 ± 18.0 14 (4.7) 25 (7.9) 77 66,5 ± 17.7* 4 (5.3) 3 (3.9)
2 Uncomplicated pneumonia and pleurisy, age upper to 17 years
without ACM.
224 68,3 ± 18.7 8 (3.7) 9 (4.0) 70 56,6 ± 19.0* 1 (1.5) 1 (1.4)
3 Infections of kidney and urinary track, age from 18 to 69 years
with ACM, or age upper to 69 years.
137 70,2 ± 19.5 5 (3.8) 2 (1.5) 23 78,9 ± 14.9* 1 (4.5) 0 (0)
4 Infections of kidney and urinary track, age from 18 to 69 years
without ACM, or age upper to 69 years.
119 46,5 ± 18.9 6 (5.3) 0 (0) 18 36,6 ± 14.2* 0 (0) 0 (0)
5 Hurts, infections and inflammations of the skin and the 79 46.0 ± 15.2 2 (2.6) 0 (0) 34 44,6 ± 13.1 3 (9.4) 0 (0)5 Hurts, infections and inflammations of the skin and the
subcutaneous tissues, the age from 18 to 69 years without ACM.
79 46.0 ± 15.2 2 (2.6) 0 (0) 34 44,6 ± 13.1 3 (9.4) 0 (0)
6 Hurts, infections and inflammations of the skin and the
subcutaneous tissues, the age from 18 to 69 years with ACM.
83 69,9 ± 16.9 4 (5.1) 1 (1.2) 25 67.0 ± 20.1 0 (0) 0 (0)
7 Other infectious or parasitic diseases, age under 70-year-old
without ACM.
43 44,8 ± 14.6 6 (16.2) 0 (0) 60 36,6 ± 11.8* 2 (3.5) 0 (0)
8 Infectious and parasitic diseases, with ACMS, with or without act. 79 61,4 ± 20.0 2 (2.6) 16 (20.3) 14 55,0 ± 23.2 0 (0) 1 (7.1)
9 Fever of unknown etiology, age upper to 17 years without ACM. 66 55,6 ± 16.2 4 (6.9) 0 (0) 8 46,4 ± 23.4 0 (0) 0 ()
10 Osteomyelitis. 39 56,5 ± 17.5 6 (19.4) 0 (0) 28 57,1 ± 17.2 1 (3.7) 0 (0)
11 Infections and inflammations of the male reproductive organ, age
upper to 69 years and\or ACM.
47 74,2 ± 15.4 1 (2.2) 1 (2.1) 13 75,9 ± 8.6 1 (8.3) 0 (0)
12 Septicemia, age upper to 17 years with ACM. 48 68,8 ± 15.7 1 (2.1) 12 (25.0) 12 65,3 ± 17.7 0 (0) 1 (8.3)
13 Viral diseases, age upper to 17 years. 38 43,9 ± 16.2 1 (2.7) 0 (0) 15 45,5 ± 18.3 0 (0) 0 (0)
Total 1317 63.5 ± 20.6 72 (5.5) 66 (5) 397 55.8 ± 20.9 13 (3.3) 6 (1.5)
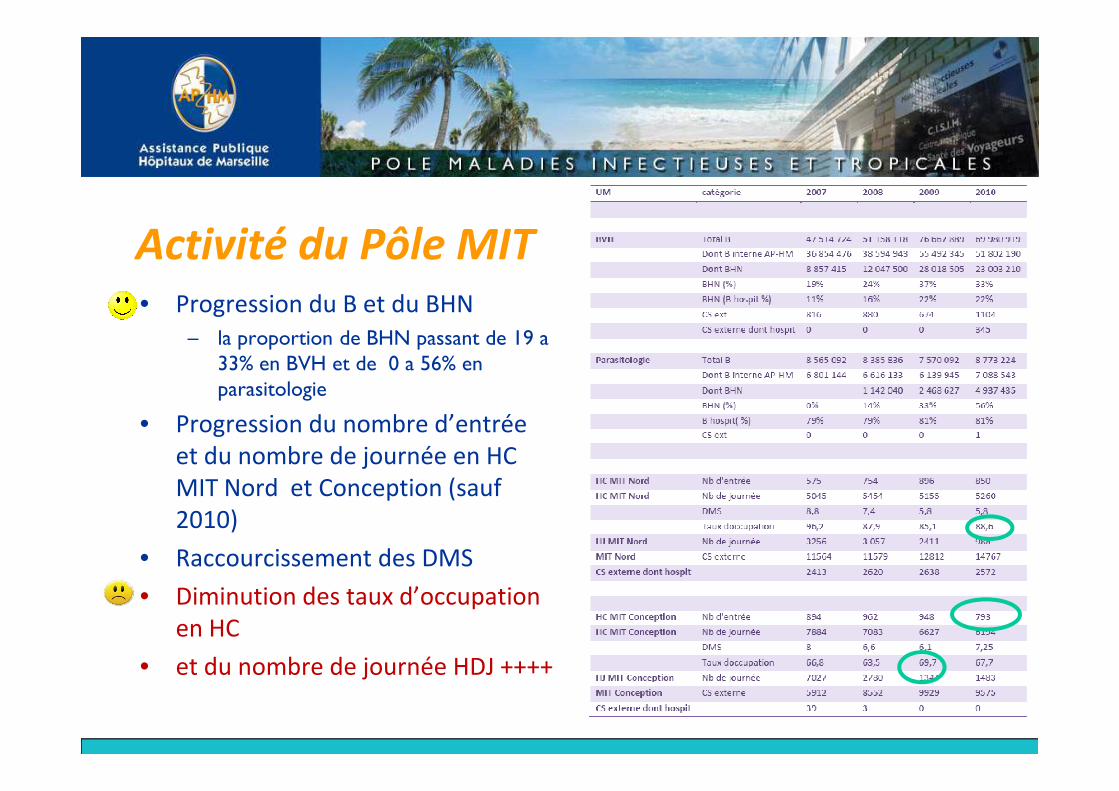
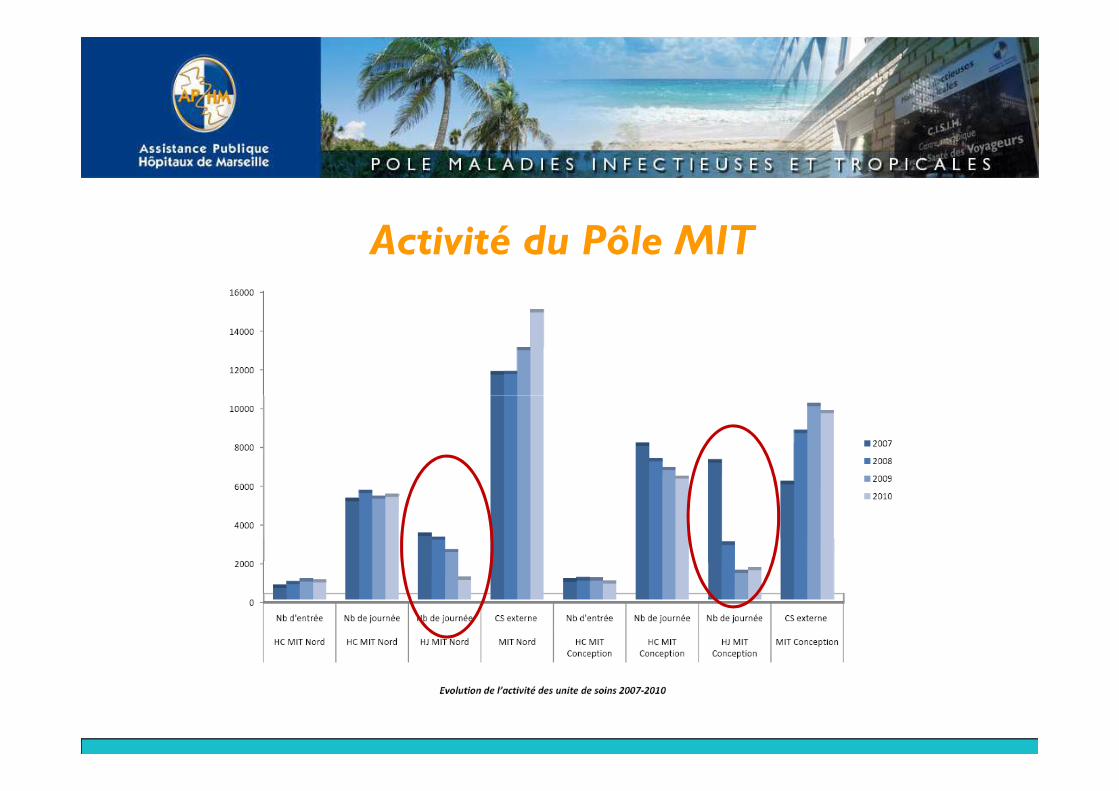
Activité du Pôle MIT• Progression du B et du BHN
– la proportion de BHN passant de 19 a 33% en BVH et de 0 a 56% en parasitologieparasitologie
• Progression du nombre d’entrée
et du nombre de journée en HC
MIT Nord et Conception (sauf
2010)
• Raccourcissement des DMS
• Diminution des taux d’occupation
en HC
• et du nombre de journée HDJ ++++
Activité du Pôle MIT
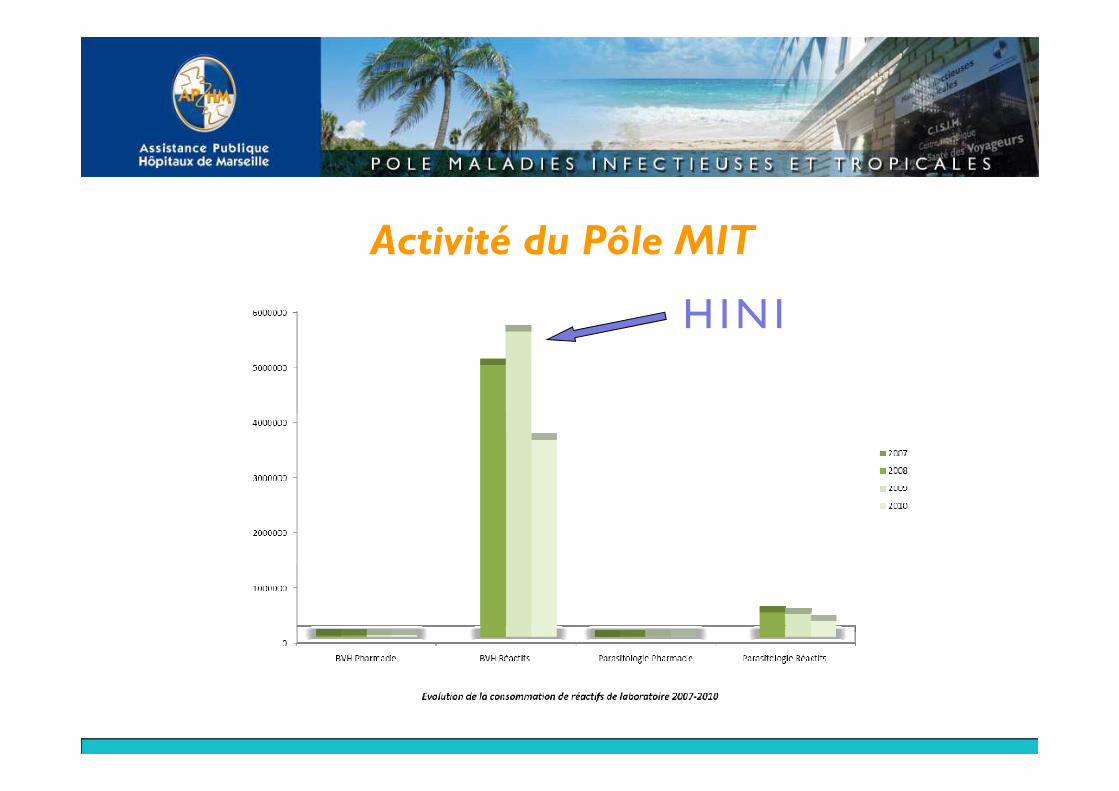
Activité du Pôle MIT
H1N1
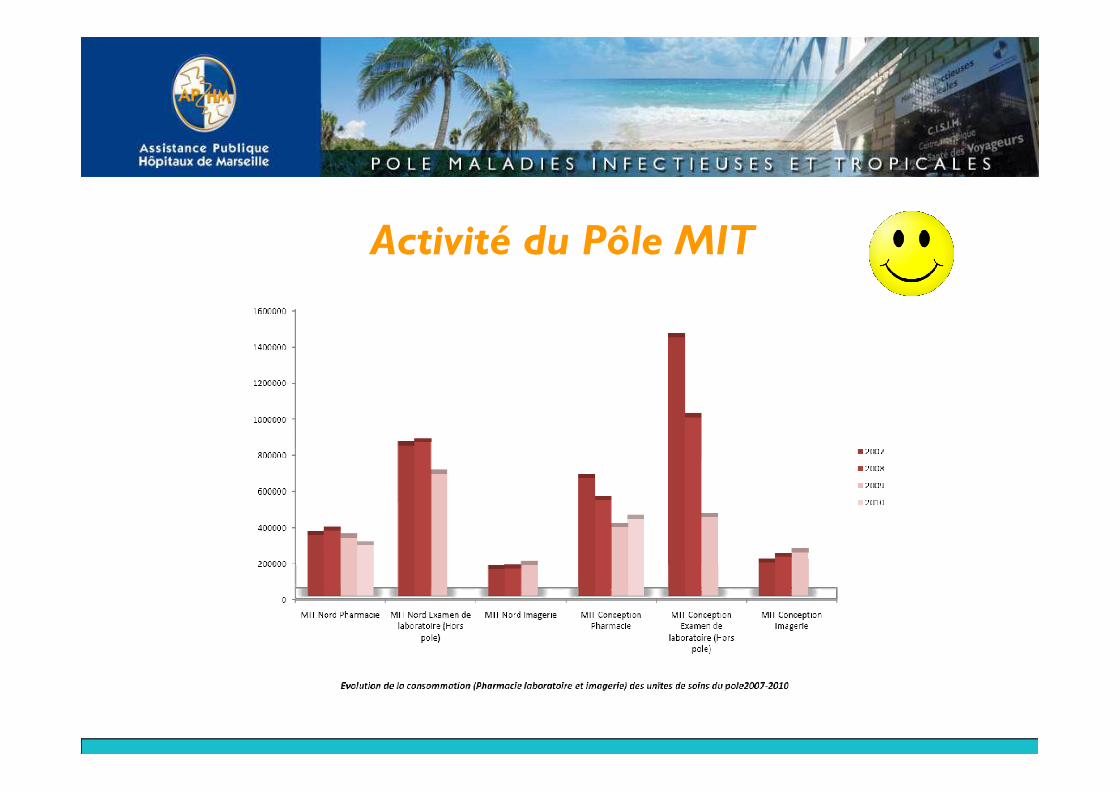
Activité du Pôle MIT
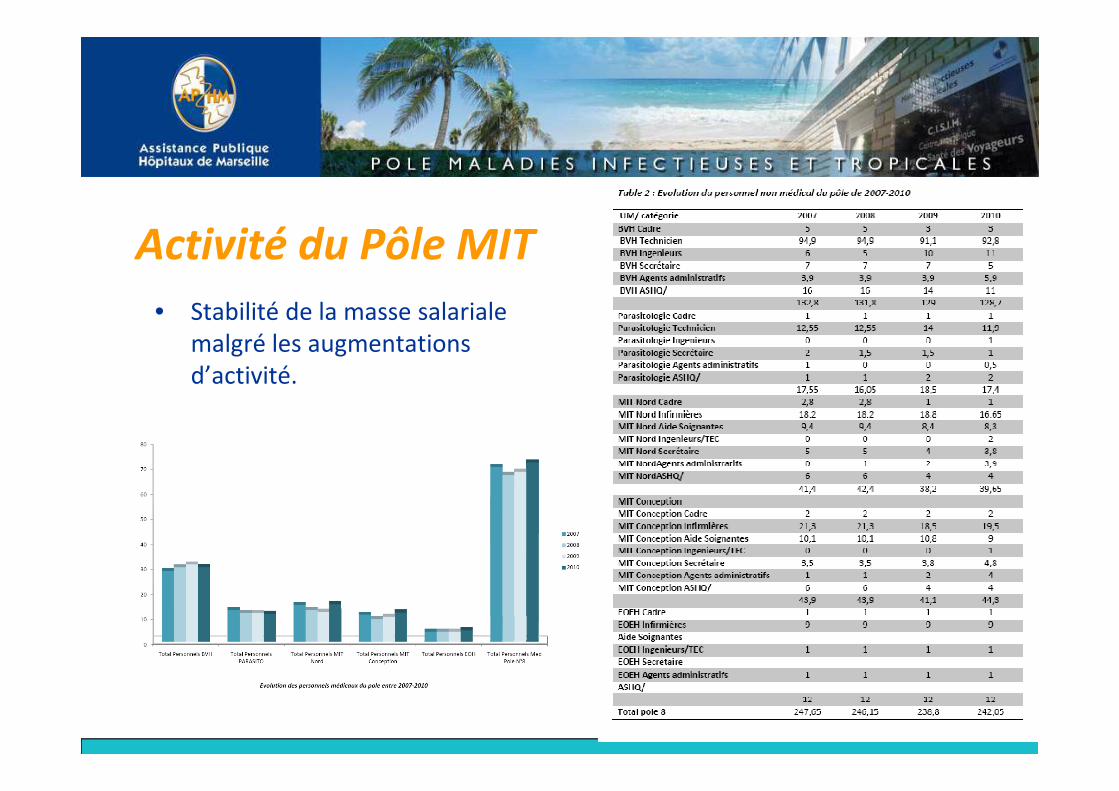
Activité du Pôle MIT
• Stabilité de la masse salariale
malgré les augmentations
d’activité.
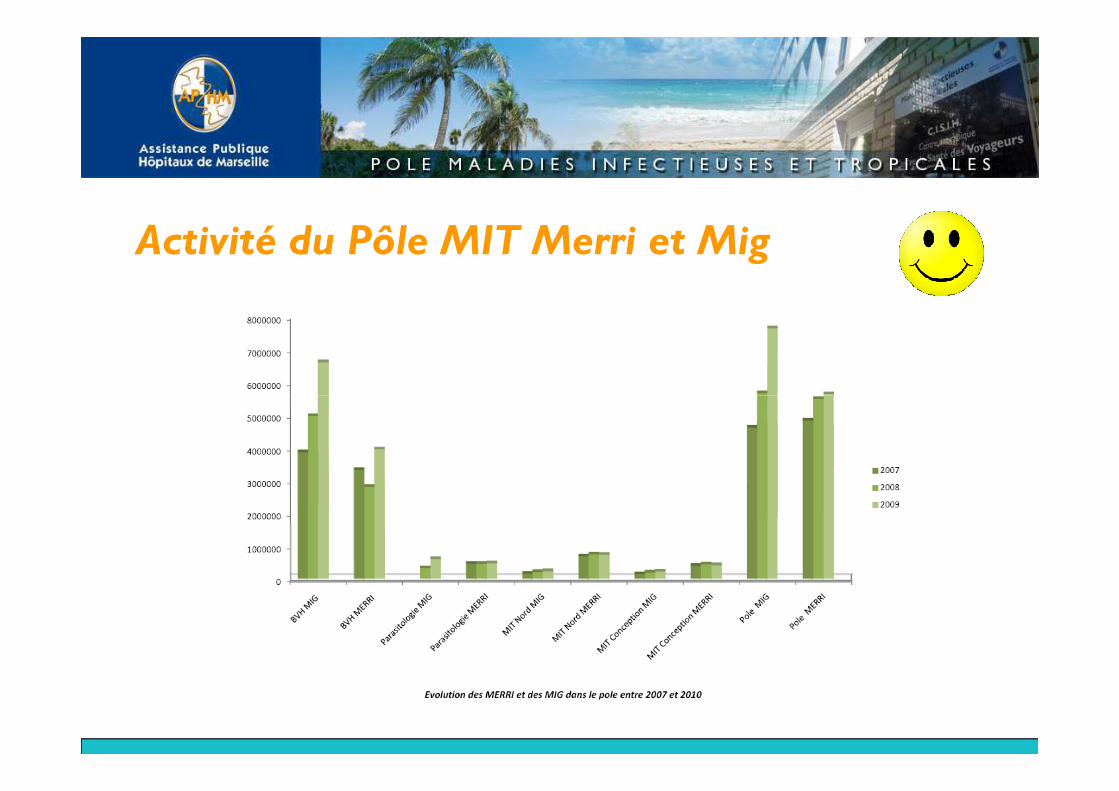
Activité du Pôle MIT Merri et Mig
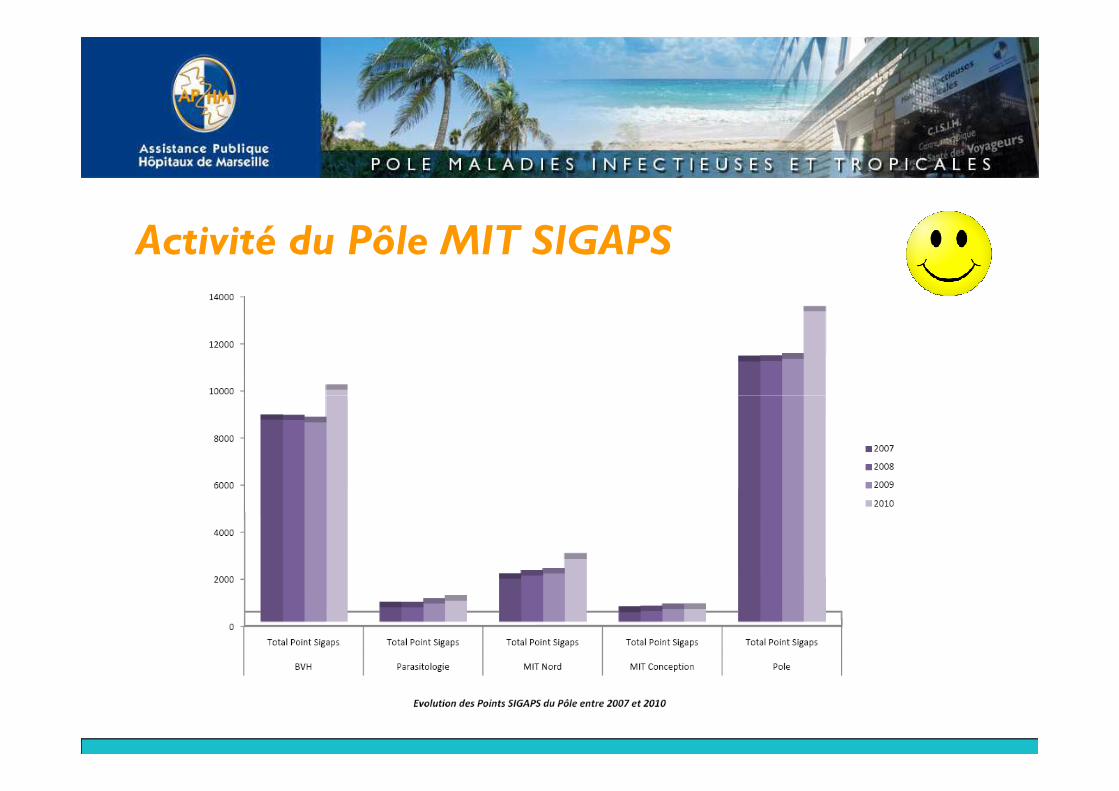
Activité du Pôle MIT SIGAPS
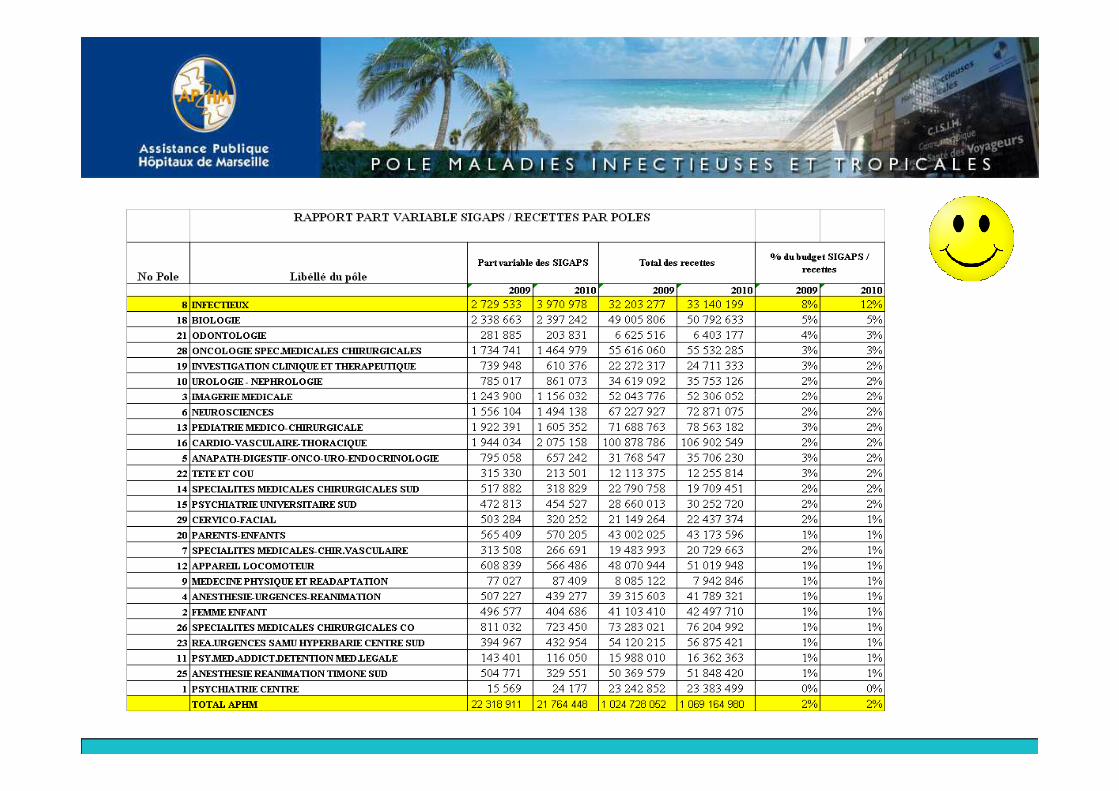
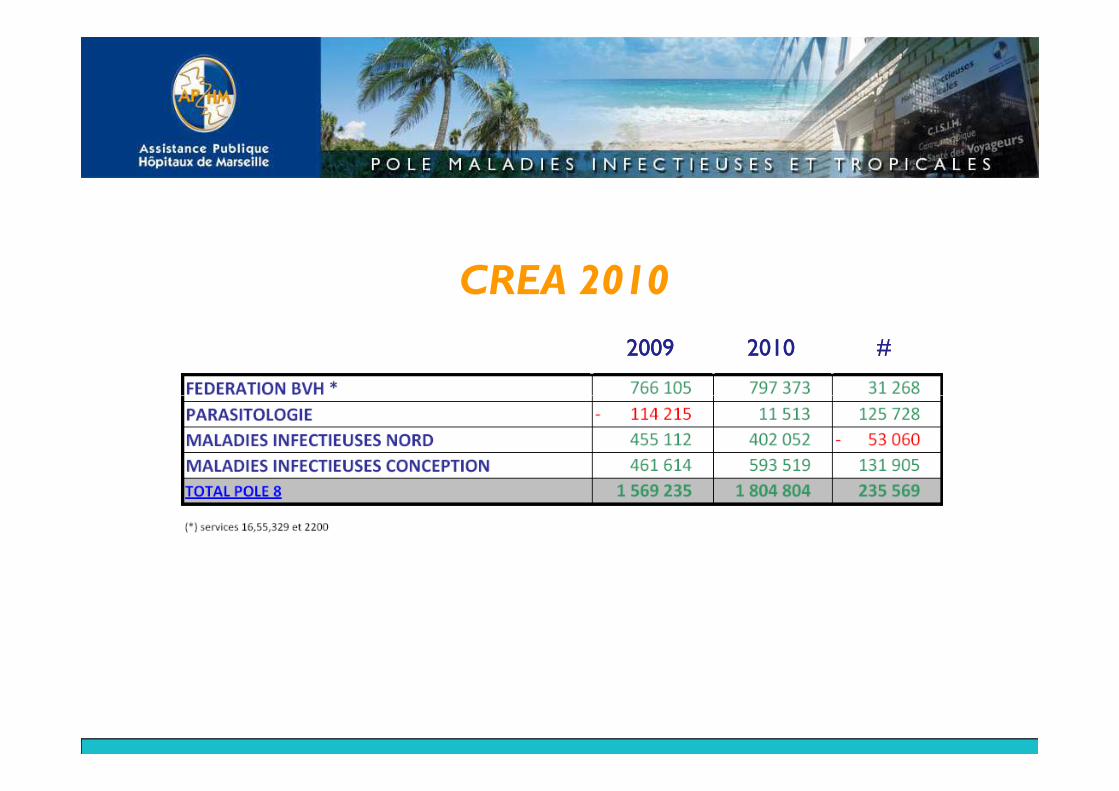
CREA 2010
2010201020092009 ##
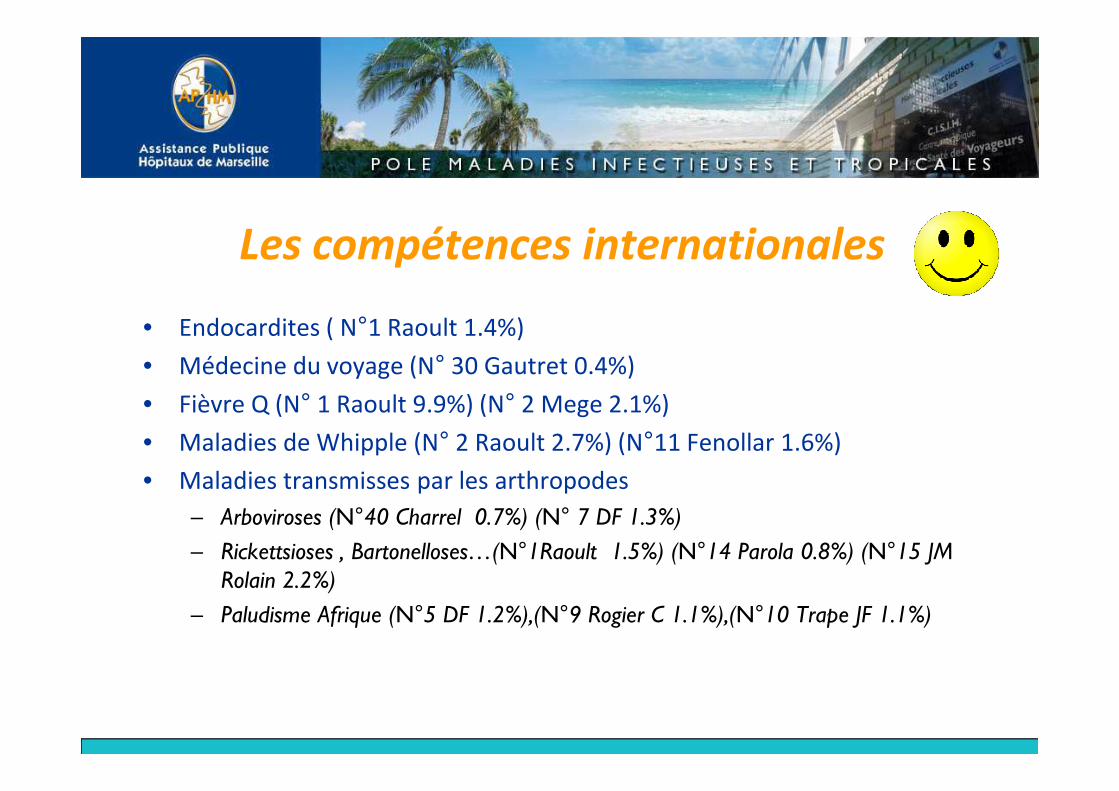
Les compétences internationales
• Endocardites ( N°1 Raoult 1.4%)
• Médecine du voyage (N° 30 Gautret 0.4%)
• Fièvre Q (N° 1 Raoult 9.9%) (N° 2 Mege 2.1%)• Fièvre Q (N° 1 Raoult 9.9%) (N° 2 Mege 2.1%)
• Maladies de Whipple (N° 2 Raoult 2.7%) (N°11 Fenollar 1.6%)
• Maladies transmisses par les arthropodes
– Arboviroses (N°40 Charrel 0.7%) (N° 7 DF 1.3%)– Rickettsioses , Bartonelloses…(N°1Raoult 1.5%) (N°14 Parola 0.8%) (N°15 JM Rolain 2.2%)
– Paludisme Afrique (N°5 DF 1.2%),(N°9 Rogier C 1.1%),(N°10 Trape JF 1.1%)
Les Centres de références
• CNR et Centre collaborateur OMS– Unité des Rickettsies– Rickettsioses et bactéries transmisses par vecteur– Rickettsioses et bactéries transmisses par vecteur
• Réseau de surveillance des maladies d’importations– Centre coordinateur Eurotravnet® (ECDC) et coordinateur Europe de Geosentinel® (CDC)
• Réseau Européen des hôpitaux de référence pour la PEC des malades contagieux– SC Eunid puis EuroNHID
• Centre coordinateur interrégional pour les IOA
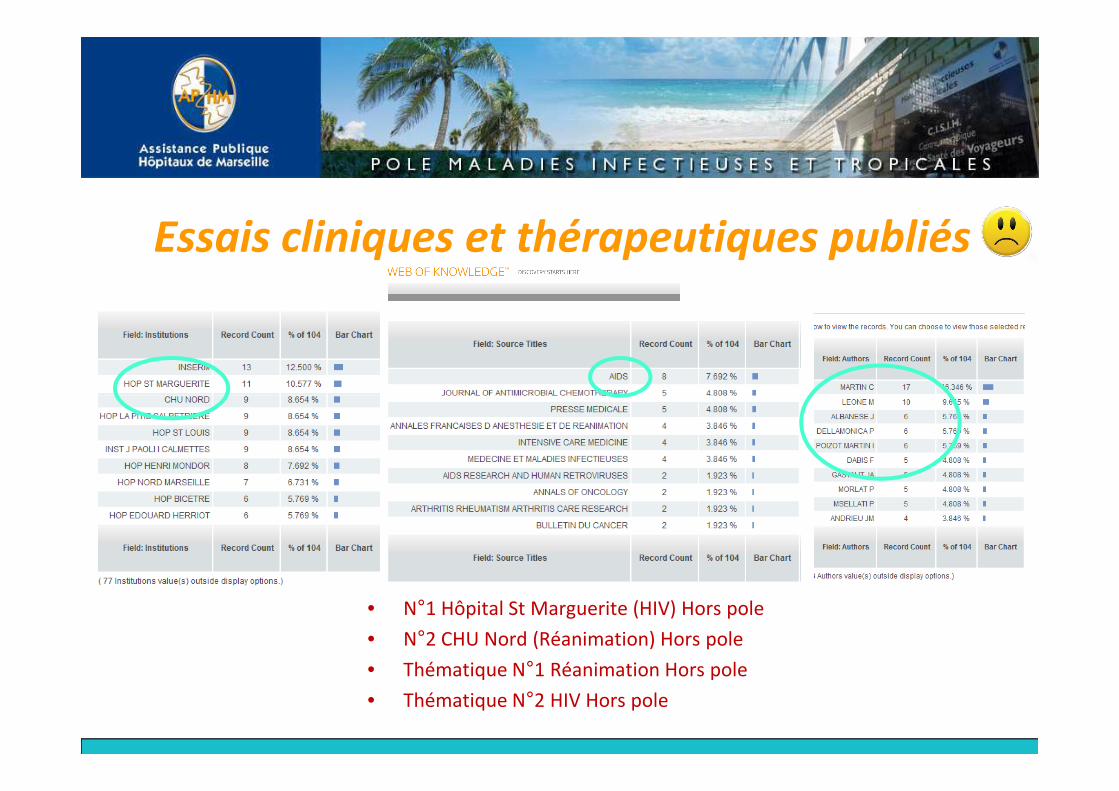
Essais cliniques et thérapeutiques publiés
• N°1 Hôpital St Marguerite (HIV) Hors pole
• N°2 CHU Nord (Réanimation) Hors pole
• Thématique N°1 Réanimation Hors pole
• Thématique N°2 HIV Hors pole
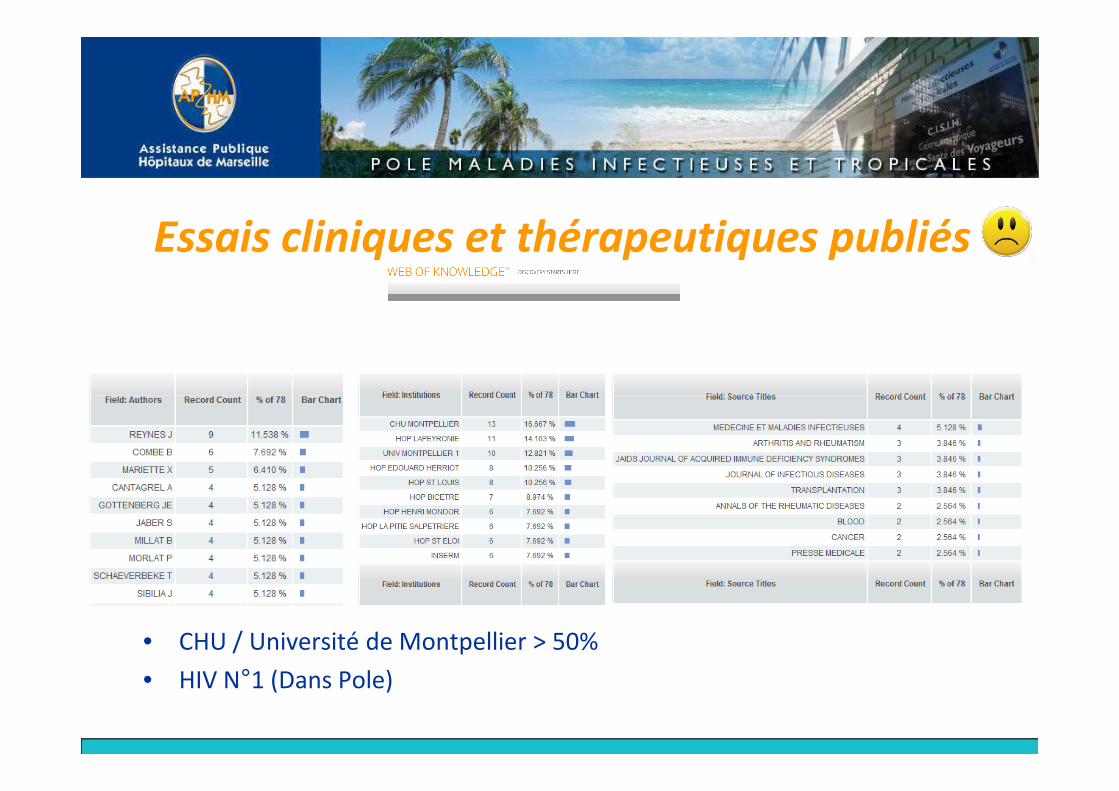
Essais cliniques et thérapeutiques publiés
• CHU / Université de Montpellier > 50%
• HIV N°1 (Dans Pole)
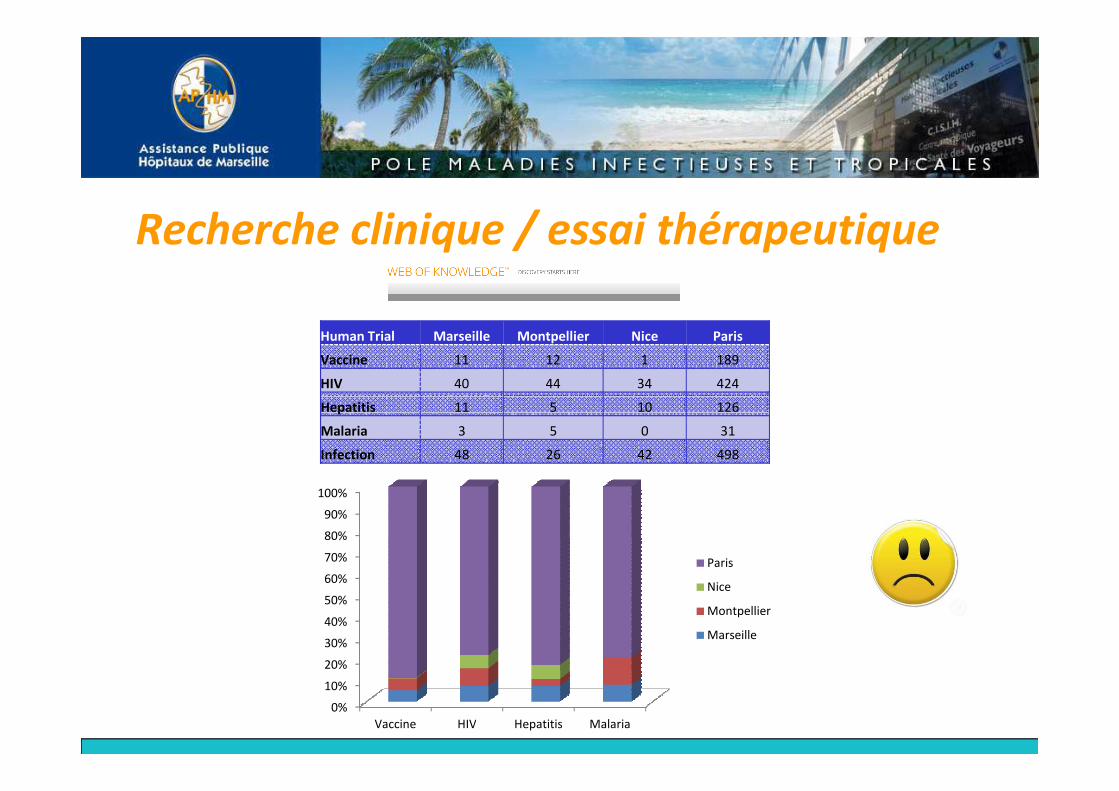
Recherche clinique / essai thérapeutique
Human Trial Marseille Montpellier Nice Paris
Vaccine 11 12 1 189
HIV 40 44 34 424
0%
10%
20%
30%
40%
50%
60%
70%
80%
90%
100%
Vaccine HIV Hepatitis Malaria
Paris
Nice
Montpellier
Marseille
Hepatitis 11 5 10 126
Malaria 3 5 0 31
Infection 48 26 42 498
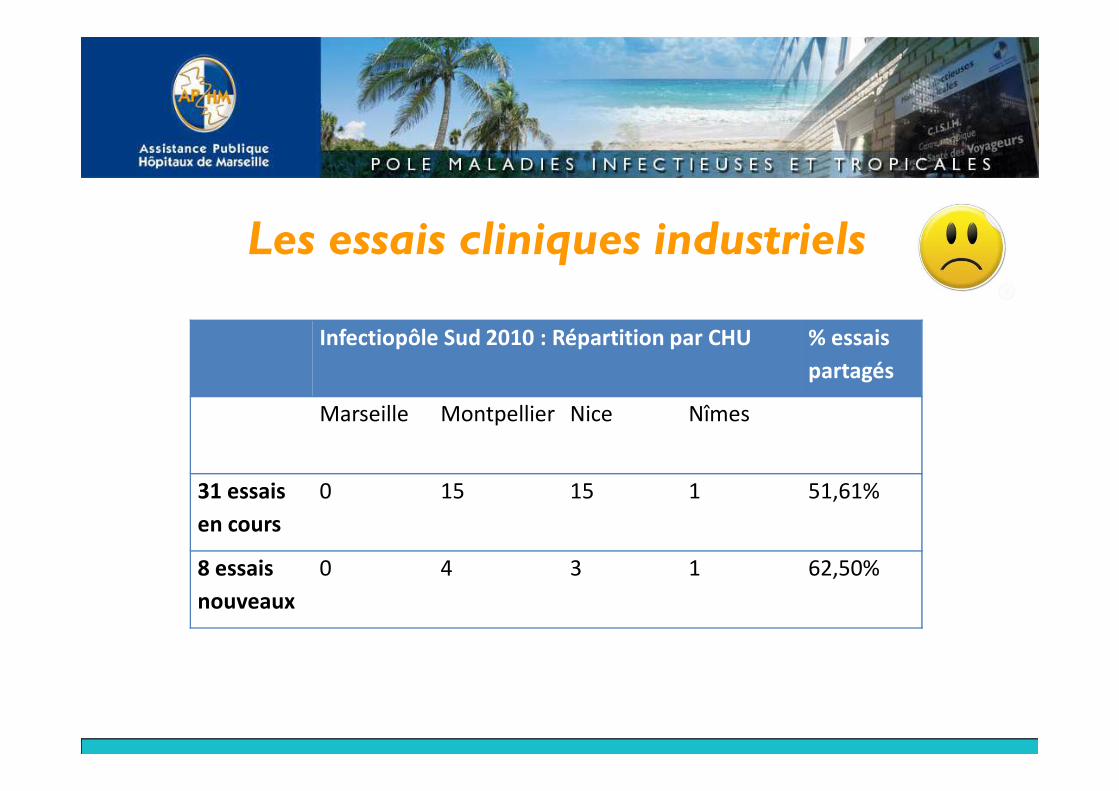
Les essais cliniques industriels
Infectiopôle Sud 2010 : Répartition par CHU % essais
partagés
Marseille Montpellier Nice Nîmes
31 essais
en cours
0 15 15 1 51,61%
8 essais
nouveaux
0 4 3 1 62,50%
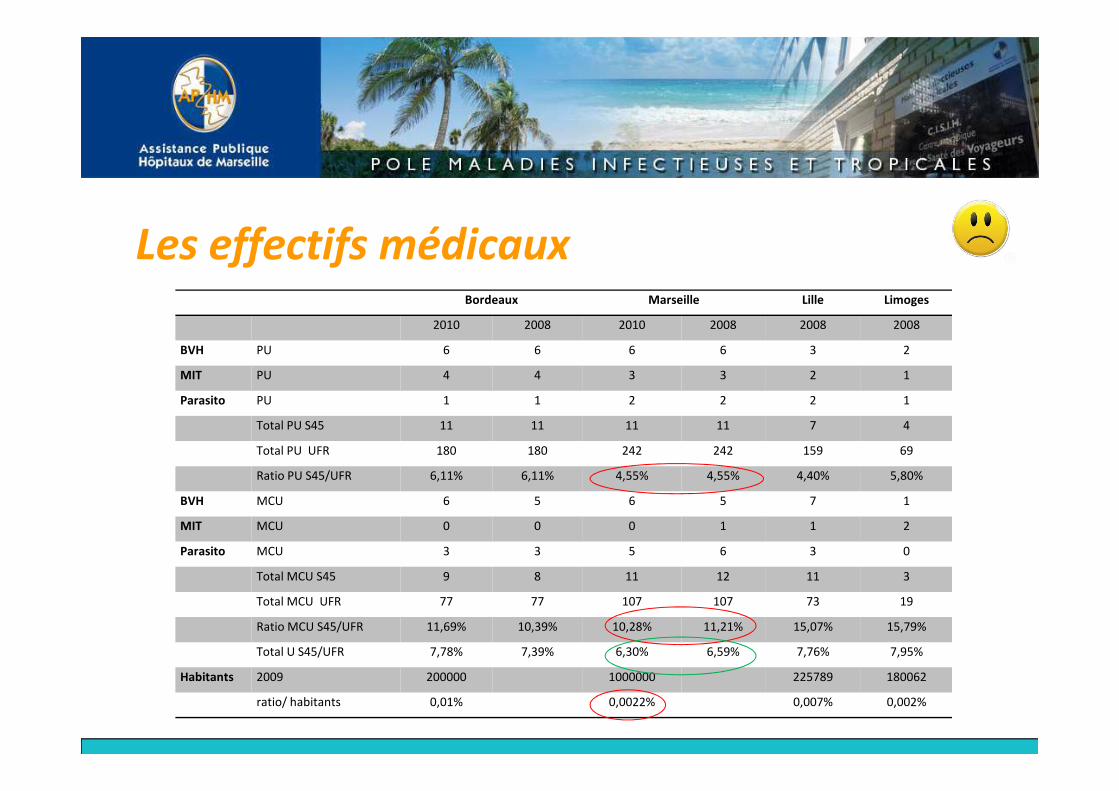
Les effectifs médicauxBordeaux Marseille Lille Limoges
2010 2008 2010 2008 2008 2008
BVH PU 6 6 6 6 3 2
MIT PU 4 4 3 3 2 1
Parasito PU 1 1 2 2 2 1Parasito PU 1 1 2 2 2 1
Total PU S45 11 11 11 11 7 4
Total PU UFR 180 180 242 242 159 69
Ratio PU S45/UFR 6,11% 6,11% 4,55% 4,55% 4,40% 5,80%
BVH MCU 6 5 6 5 7 1
MIT MCU 0 0 0 1 1 2
Parasito MCU 3 3 5 6 3 0
Total MCU S45 9 8 11 12 11 3
Total MCU UFR 77 77 107 107 73 19
Ratio MCU S45/UFR 11,69% 10,39% 10,28% 11,21% 15,07% 15,79%
Total U S45/UFR 7,78% 7,39% 6,30% 6,59% 7,76% 7,95%
Habitants 2009 200000 1000000 225789 180062
ratio/ habitants 0,01% 0,0022% 0,007% 0,002%
Merci pour votre attentionMerci pour votre attention