Embed Size (px)
Citation preview
Maintenance Planning Optimisation for the
Boeing 737 Next Generation
Masters Thesis
By ir. Anthony K. Muchiri
Supervisors: Prof. ir Klaas Smit
ing. Willem van Steenis
Delft/ Schiphol East, 30 May 2002

Colophon
i
Colophon Final Report Title: Maintenance Planning Optimisation for the Boeing 737 Next
Generation Author: Anthony K. Muchiri Date: Thursday, 30 May 2002 Board Of Examiners:
Prof. Ir. K. Smit - TU Delft (Coach) Ir. B. Agusdinata - TU Delft ing. W. van Steenis - Transavia Airlines (Supervisor) Ir. R. Hol - Transavia Airlines
Delft University of Technology Faculty of Aerospace Engineering Department of Industrial Engineering and Technical Management P.O. Box 5058, 2600 GB Delft The Netherlands
Transavia Airlines Technical Department
Maintenance Planning & Support P.O. Box 7777, 1118 ZM Schiphol Airport
The Netherlands

Preface
iii
Preface This thesis represents the results of my graduation assignment, a research project carried out to conclude the Master Phase of the Industrial Engineering Department, Faculty of Aerospace Engineering, of the Delft University of Technology. The assignment was assigned and carried out at the Maintenance Planning and Support (MP& S) department of Transavia Airline’s Technical Department, and it entails the optimisation of maintenance planning for the 737 Next Generation fleet of the airline. The report has been subdivided into five chapters, and it can be read as follows:
- For readers interested in the development of a new maintenance planning strategy, Chapters 3 and 4.4 are recommended
- For readers interested in the analysis of the current situation and the proposed situation, it is recommended that they read Chapter 4.4
- For readers interested in the conclusions and recommendations, they should look at Chapter 5
- For readers interested in the development of the whole research, all chapters and Appendix documents are recommended. A summary highlighting all major items from the report has also been included
In all cases, some knowledge on aircraft maintenance is needed. I would also like to take this opportunity to thank my professor, Prof. Ir. K. Smit of the TU Delft, and my supervisor, Mr. W. van Steenis, Maintenance Manager Transavia Airlines, for their coaching and encouragement. My thanks also go to all staffers of the MP&S department for their assistance and for the good time they gave me at the department, the head of Engineering, Mr. R. Hol, all maintenance engineers - and especially the maintenance programme engineers, and all members of the technical department for their corporation. Anthony Muchiri Delft, May 2002

Executive Summary
v
Executive Summary With the increasing need to reduce maintenance costs and increase aircraft availability, the need to simplify the way maintenance is planned and executed has become a major issue in the aircraft industry. Aircraft manufacturers continue to develop aircraft with a low maintenance demand, while airlines strive to keep their maintenance costs as low as possible. The Boeing 737 Next Generation (737 NG) is an example of such an aircraft, developed to demand less maintenance, as compared to previous versions of the Boeing 737 series. This 737 NG aircraft has a Maintenance Planning Data (MPD) document that is based on the Maintenance Steering Group (MSG)-3 philosophy. This is a task-based maintenance philosophy that looks at maintenance more at a task-level, as compared to previous philosophies, which were more focused on maintenance processes. Transavia airlines currently possesses 13 737 NG aircraft, but has a maintenance program that strongly borrows from other aircraft models in its fleet (namely the B 757-200 and the B 737-300). This assignment is aimed at developing a cost-effective maintenance planning and packaging method that will lead to the reduction in direct maintenance costs, yet maintaining the reliability of the 737 NG fleet.
Maintenance Planning and Scheduling Background Maintenance at Transavia is broadly categorised into Line Maintenance (maintenance performed within Transavia), and Base Maintenance (Maintenance work contracted out). Line maintenance is performed at short intervals (given in weeks). Currently, line maintenance is performed at a frequency of 5 weeks. Every line maintenance visit is planned in a so-called hangar slot. A single hangar slot is 7.75 hours long and it can produce 55 maintenance man-hours, while 2 slots produce 100 man-hours. Three slots lead to 300 man-hours. Each aircraft receives 14 maintenance slots a year for routine line maintenance. These slots have a repeating distribution rhythm of 1-1-2-1-1-3-1-1-2-, and are also planned in this rhythm. However, the realisation of the planning for these slots deviates from the pattern above. A reason for this may be attributed to the dependence of maintenance on the utilisation of the aircraft, unpredictable events, large work packages that are not executable within the stipulated time, and aircraft operations. Base maintenance is performed every 1½-years (18 months). Transavia has an operational pattern that is strongly seasonal (high between April –October, and low between November - March). Base maintenance is preferably planned in the low season, because it requires aircraft to be withdrawn from operations for multiple days. However, a frequency of 18 months will always lead to maintenance due dates that fall in the high season. This problem is solved by performing the maintenance in advance (at 16 or 17 months), an undesired situation.
Maintenance Clusters Definition and Development Clustering is the process of grouping maintenance tasks together into packages that can be planned in for execution. Clustering can be done by following two
Maintenance Planning Optimisation: B737 NG
vi
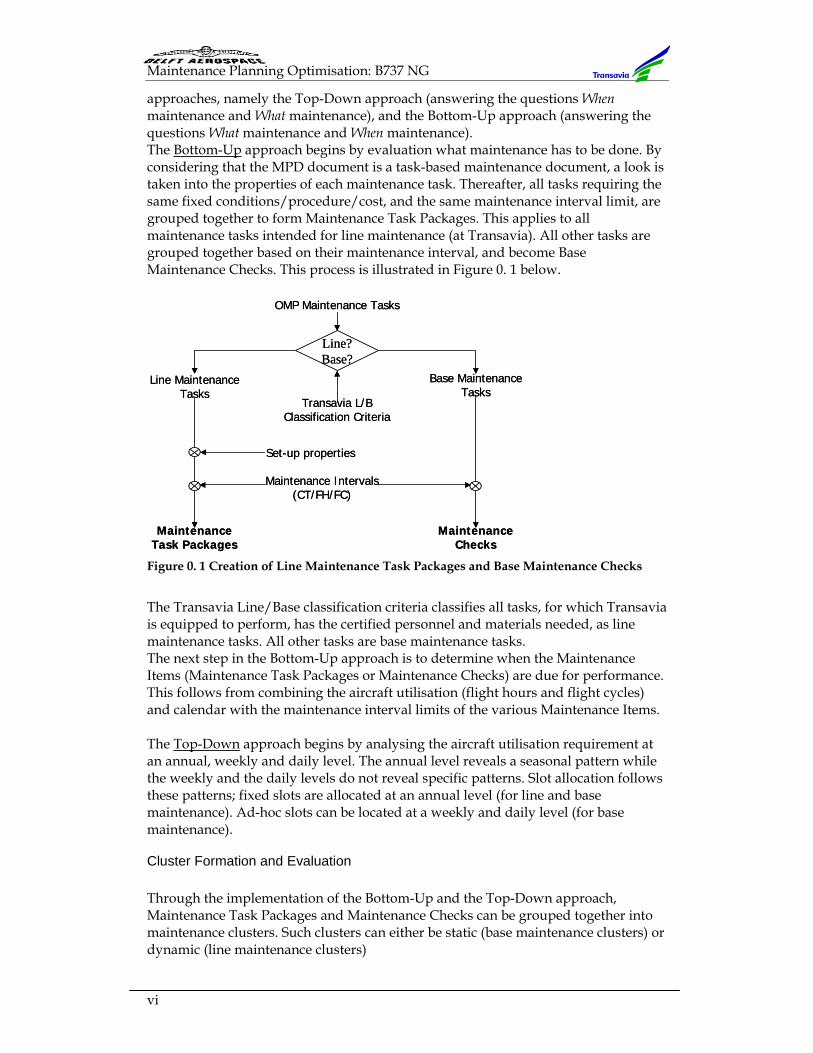
approaches, namely the Top-Down approach (answering the questions When maintenance and What maintenance), and the Bottom-Up approach (answering the questions What maintenance and When maintenance). The Bottom-Up approach begins by evaluation what maintenance has to be done. By considering that the MPD document is a task-based maintenance document, a look is taken into the properties of each maintenance task. Thereafter, all tasks requiring the same fixed conditions/procedure/cost, and the same maintenance interval limit, are grouped together to form Maintenance Task Packages. This applies to all maintenance tasks intended for line maintenance (at Transavia). All other tasks are grouped together based on their maintenance interval, and become Base Maintenance Checks. This process is illustrated in Figure 0. 1 below.
Figure 0. 1 Creation of Line Maintenance Task Packages and Base Maintenance Checks
The Transavia Line/Base classification criteria classifies all tasks, for which Transavia is equipped to perform, has the certified personnel and materials needed, as line maintenance tasks. All other tasks are base maintenance tasks. The next step in the Bottom-Up approach is to determine when the Maintenance Items (Maintenance Task Packages or Maintenance Checks) are due for performance. This follows from combining the aircraft utilisation (flight hours and flight cycles) and calendar with the maintenance interval limits of the various Maintenance Items. The Top-Down approach begins by analysing the aircraft utilisation requirement at an annual, weekly and daily level. The annual level reveals a seasonal pattern while the weekly and the daily levels do not reveal specific patterns. Slot allocation follows these patterns; fixed slots are allocated at an annual level (for line and base maintenance). Ad-hoc slots can be located at a weekly and daily level (for base maintenance).
Cluster Formation and Evaluation Through the implementation of the Bottom-Up and the Top-Down approach, Maintenance Task Packages and Maintenance Checks can be grouped together into maintenance clusters. Such clusters can either be static (base maintenance clusters) or dynamic (line maintenance clusters)
OMP Maintenance Tasks
Line MaintenanceTasks
Base MaintenanceTasks
Line?Base?
Set-up properties
Maintenance Intervals(CT/FH/FC)
Transavia L/BClassification Criteria
MaintenanceChecks
MaintenanceTask Packages
OMP Maintenance Tasks
Line MaintenanceTasks
Base MaintenanceTasks
Line?Base?
Set-up properties
Maintenance Intervals(CT/FH/FC)
Transavia L/BClassification Criteria
MaintenanceChecks
MaintenanceTask Packages
Executive Summary
vii
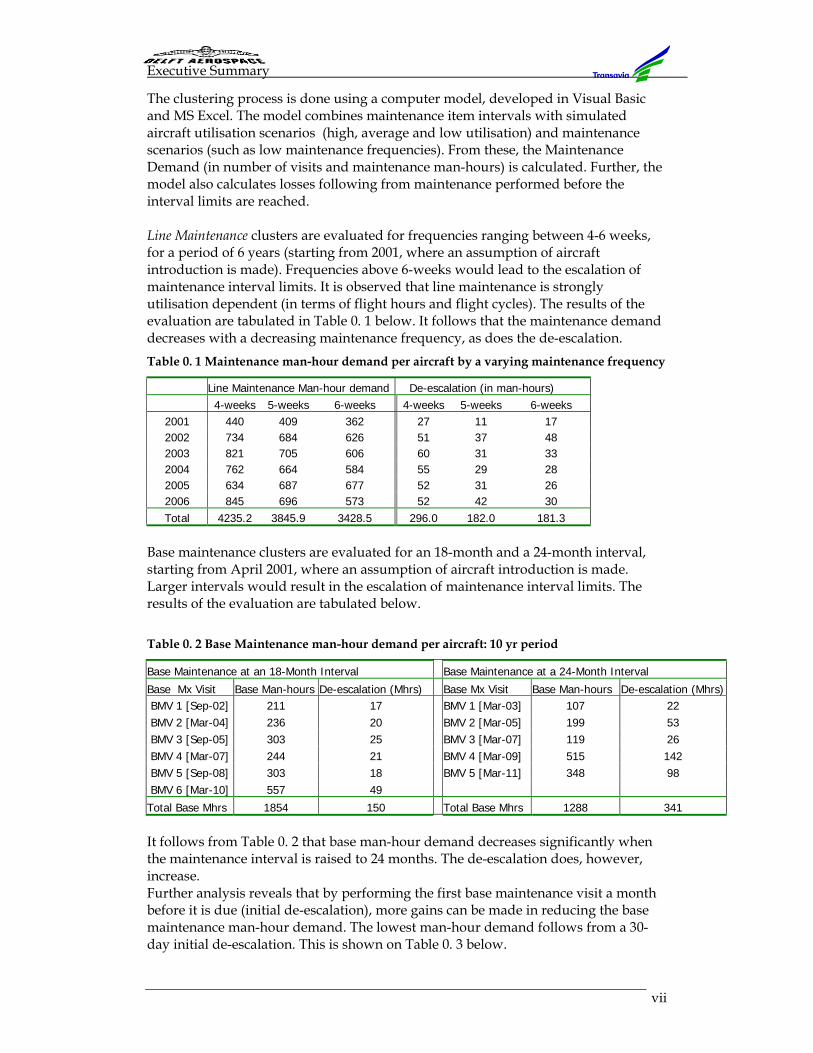
The clustering process is done using a computer model, developed in Visual Basic and MS Excel. The model combines maintenance item intervals with simulated aircraft utilisation scenarios (high, average and low utilisation) and maintenance scenarios (such as low maintenance frequencies). From these, the Maintenance Demand (in number of visits and maintenance man-hours) is calculated. Further, the model also calculates losses following from maintenance performed before the interval limits are reached. Line Maintenance clusters are evaluated for frequencies ranging between 4-6 weeks, for a period of 6 years (starting from 2001, where an assumption of aircraft introduction is made). Frequencies above 6-weeks would lead to the escalation of maintenance interval limits. It is observed that line maintenance is strongly utilisation dependent (in terms of flight hours and flight cycles). The results of the evaluation are tabulated in Table 0. 1 below. It follows that the maintenance demand decreases with a decreasing maintenance frequency, as does the de-escalation. Table 0. 1 Maintenance man-hour demand per aircraft by a varying maintenance frequency
Line Maintenance Man-hour demand De-escalation (in man-hours) 4-weeks 5-weeks 6-weeks 4-weeks 5-weeks 6-weeks
2001 440 409 362 27 11 17 2002 734 684 626 51 37 48 2003 821 705 606 60 31 33 2004 762 664 584 55 29 28 2005 634 687 677 52 31 26 2006 845 696 573 52 42 30 Total 4235.2 3845.9 3428.5 296.0 182.0 181.3
Base maintenance clusters are evaluated for an 18-month and a 24-month interval, starting from April 2001, where an assumption of aircraft introduction is made. Larger intervals would result in the escalation of maintenance interval limits. The results of the evaluation are tabulated below. Table 0. 2 Base Maintenance man-hour demand per aircraft: 10 yr period
Base Maintenance at an 18-Month Interval Base Maintenance at a 24-Month Interval
Base Mx Visit Base Man-hours De-escalation (Mhrs) Base Mx Visit Base Man-hours De-escalation (Mhrs)BMV 1 [Sep-02] 211 17 BMV 1 [Mar-03] 107 22 BMV 2 [Mar-04] 236 20 BMV 2 [Mar-05] 199 53 BMV 3 [Sep-05] 303 25 BMV 3 [Mar-07] 119 26 BMV 4 [Mar-07] 244 21 BMV 4 [Mar-09] 515 142 BMV 5 [Sep-08] 303 18 BMV 5 [Mar-11] 348 98 BMV 6 [Mar-10] 557 49
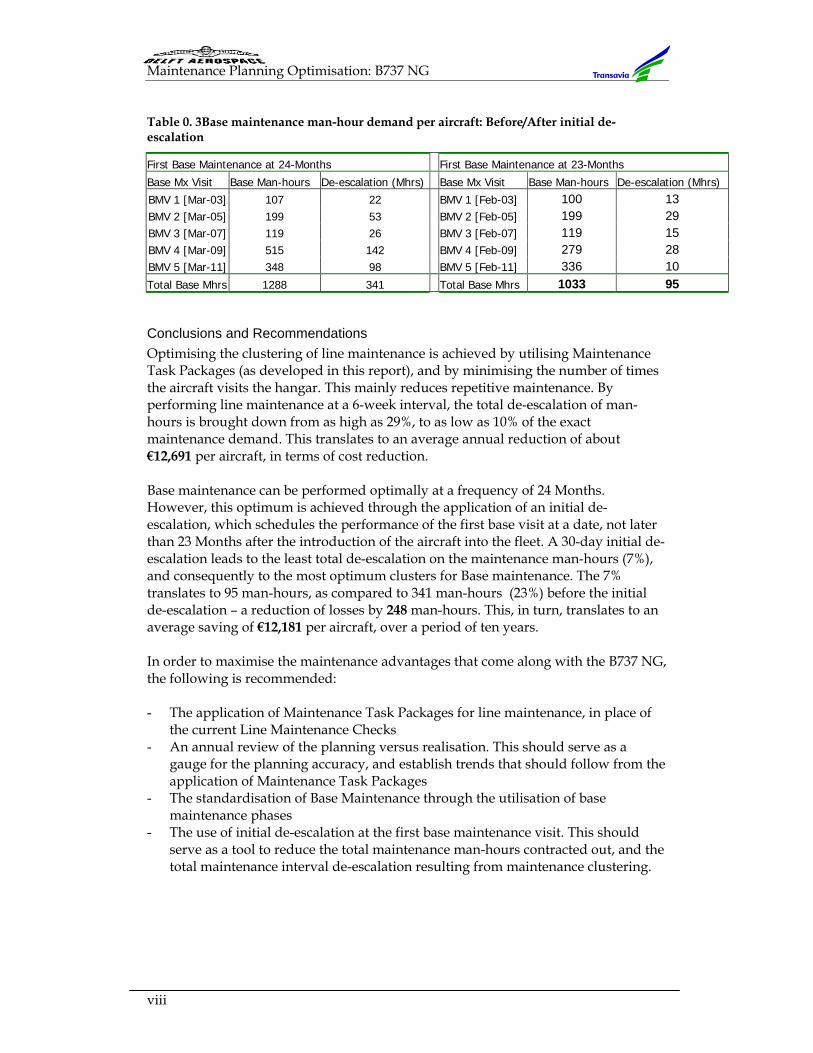
Total Base Mhrs 1854 150 Total Base Mhrs 1288 341 It follows from Table 0. 2 that base man-hour demand decreases significantly when the maintenance interval is raised to 24 months. The de-escalation does, however, increase. Further analysis reveals that by performing the first base maintenance visit a month before it is due (initial de-escalation), more gains can be made in reducing the base maintenance man-hour demand. The lowest man-hour demand follows from a 30-day initial de-escalation. This is shown on Table 0. 3 below.
Maintenance Planning Optimisation: B737 NG
viii
Table 0. 3Base maintenance man-hour demand per aircraft: Before/After initial de-escalation
First Base Maintenance at 24-Months First Base Maintenance at 23-Months
Base Mx Visit Base Man-hours De-escalation (Mhrs) Base Mx Visit Base Man-hours De-escalation (Mhrs)
BMV 1 [Mar-03] 107 22 BMV 1 [Feb-03] 100 13 BMV 2 [Mar-05] 199 53 BMV 2 [Feb-05] 199 29 BMV 3 [Mar-07] 119 26 BMV 3 [Feb-07] 119 15 BMV 4 [Mar-09] 515 142 BMV 4 [Feb-09] 279 28 BMV 5 [Mar-11] 348 98 BMV 5 [Feb-11] 336 10 Total Base Mhrs 1288 341 Total Base Mhrs 1033 95
Conclusions and Recommendations Optimising the clustering of line maintenance is achieved by utilising Maintenance Task Packages (as developed in this report), and by minimising the number of times the aircraft visits the hangar. This mainly reduces repetitive maintenance. By performing line maintenance at a 6-week interval, the total de-escalation of man-hours is brought down from as high as 29%, to as low as 10% of the exact maintenance demand. This translates to an average annual reduction of about €12,691 per aircraft, in terms of cost reduction. Base maintenance can be performed optimally at a frequency of 24 Months. However, this optimum is achieved through the application of an initial de-escalation, which schedules the performance of the first base visit at a date, not later than 23 Months after the introduction of the aircraft into the fleet. A 30-day initial de-escalation leads to the least total de-escalation on the maintenance man-hours (7%), and consequently to the most optimum clusters for Base maintenance. The 7% translates to 95 man-hours, as compared to 341 man-hours (23%) before the initial de-escalation – a reduction of losses by 248 man-hours. This, in turn, translates to an average saving of €12,181 per aircraft, over a period of ten years. In order to maximise the maintenance advantages that come along with the B737 NG, the following is recommended: - The application of Maintenance Task Packages for line maintenance, in place of
the current Line Maintenance Checks - An annual review of the planning versus realisation. This should serve as a
gauge for the planning accuracy, and establish trends that should follow from the application of Maintenance Task Packages
- The standardisation of Base Maintenance through the utilisation of base maintenance phases
- The use of initial de-escalation at the first base maintenance visit. This should serve as a tool to reduce the total maintenance man-hours contracted out, and the total maintenance interval de-escalation resulting from maintenance clustering.
Samenvatting
ix
Samenvatting Door de toenemende behoefte om onderhoudskosten te verlagen, en de beschikbaarheid van vliegtuigen te verhogen, is er een behoefte om het plannen en uitvoeren van onderhoud te vergemakkelijken. Vliegtuigfabrikanten blijven vliegtuigen ontwikkelen met weinig behoefte aan onderhoud. Tegelijkertijd streven vliegtuigmaatschappijen er naar om de onderhoudskosten zo laag mogelijk te houden. De Boeing 737 Next Generation (737NG) is een voorbeeld van zo'n vliegtuig, ontwikkeld met een lage onderhoudsbehoefte, in vergelijking met voorgaande versies van Boeing 737 Series. Dit 737NG-vliegtuig heeft een Onderhouds Plannig document (MPD) dat gebaseerd is op het MSG-3 onderhoudsconcept. Dit is een taakgericht onderhoudsconcept, dat het onderhoud bekijkt van een taakniveau, vergeleken met voorgaande concepten, waar gekeken wordt naar onderhoudsprocessen. Transavia Airlines heeft momenteel 13 vliegtuigen van het type 737NG, met een onderhoudsprogramma dat sterk ontleend is aan andere vliegtuig modellen in haar vloot (de B757-200 en de B737-300). Deze opdracht is gericht op het ontwikkelen van een kosten-effectieve onderhoudsplanning en pakketerrings methode, dat zal leiden tot het verminderen van directe onderhoudskosten, en toch de betrouwbaarheid van de 737NG vloot behouden.
Onderhoudsplanning en inplanningsachtergrond Vliegtuigonderhoud binnen Transavia is verdeeld in lijn/hangar-onderhoud (onderhoud uitgevoerd door Transavia zelf), en groot-onderhoud (onderhoud uitbesteed aan derden). Lijn-onderhoud wordt uitgevoerd binnen korte intervallen (beschreven in weken). Momenteel is dit met een regelmaat van 5-weken. Elk hangarbezoek wordt gepland in een zgn. "Hangar-slot". Een enkel slot duurt 7 ¾ uur, en zorgt voor 55 man-uren. Twee slots leveren 100 man-uren op, terwij drie slots voor 300 man-uren zorgen. Elk vliegtuig krijgt 14 hangar-slots toegewezen per jaar voor routine onderhoud. Deze slots hebben een herhaaldelijk ritme van 1-1-2-1-1-3-1-1-2-, en worden met hetzelfde ritme ingepland. In werkelijkheid, wijkt de realisatie van deze van de planning af van het ritme hierboven. Oorzaken hiervan zijn: afhankelijkheid van het onderhoud op vliegtuig utilisatie en operaties, onvoorziene gebeurtenissen, en werk-pakketten die niet uitvoerbaar zijn binnen de aangegeven tijd. Groot-onderhoud wordt uitgevoerd om de 18 maanden. Transavia heeft een operationeel patroon dat sterk seizoen-gebonden is (met een hoog-seizoen van april tot oktober, en een laag-seizoen van november tot maart). Groot onderhoud wordt bij voorkeur gepland in het laag seizoen, want het vereist het weghalen van een vliegtuig van de operatie. Een gevolg van een regelmaat van 18 maanden is dat groot-onderhoud soms uitgevoerd moet worden in het hoog seizoen. Dit probleem wordt opgelost door het onderhoud naar voren te schuiven (met een maand of twee), een ongewenste situatie.
Maintenance Planning Optimisation: B737 NG
x
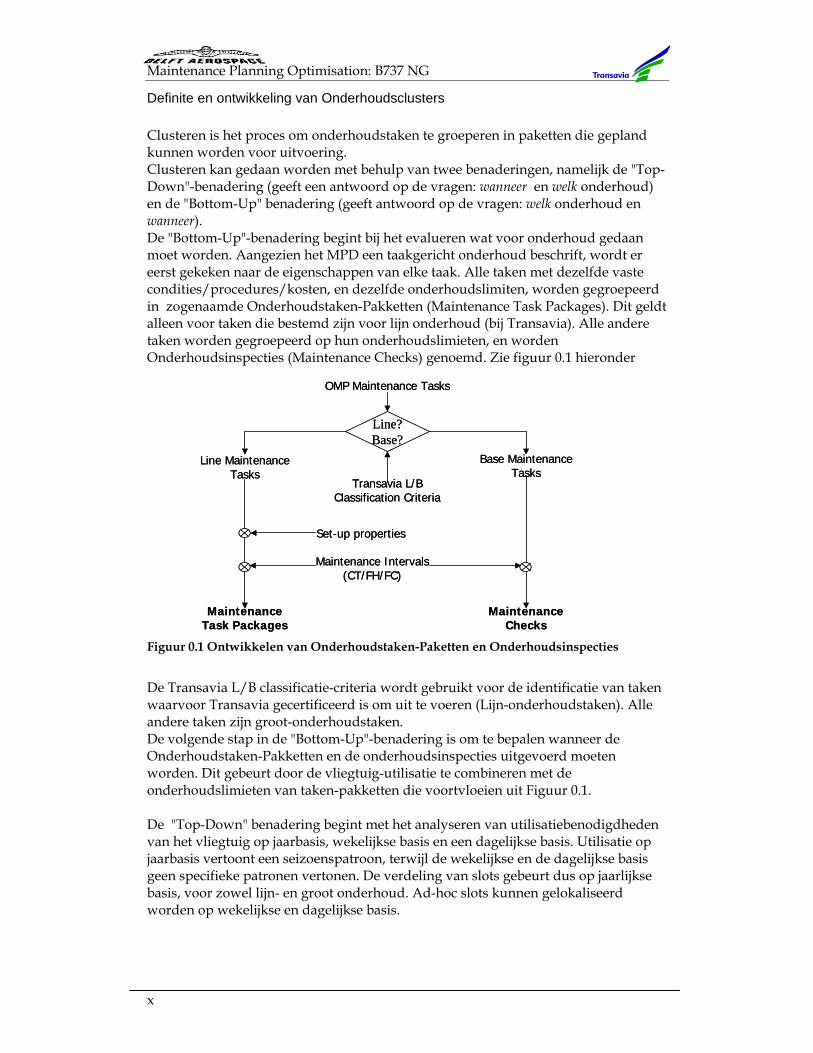
Definite en ontwikkeling van Onderhoudsclusters Clusteren is het proces om onderhoudstaken te groeperen in paketten die gepland kunnen worden voor uitvoering. Clusteren kan gedaan worden met behulp van twee benaderingen, namelijk de "Top-Down"-benadering (geeft een antwoord op de vragen: wanneer en welk onderhoud) en de "Bottom-Up" benadering (geeft antwoord op de vragen: welk onderhoud en wanneer). De "Bottom-Up"-benadering begint bij het evalueren wat voor onderhoud gedaan moet worden. Aangezien het MPD een taakgericht onderhoud beschrift, wordt er eerst gekeken naar de eigenschappen van elke taak. Alle taken met dezelfde vaste condities/procedures/kosten, en dezelfde onderhoudslimiten, worden gegroepeerd in zogenaamde Onderhoudstaken-Pakketten (Maintenance Task Packages). Dit geldt alleen voor taken die bestemd zijn voor lijn onderhoud (bij Transavia). Alle andere taken worden gegroepeerd op hun onderhoudslimieten, en worden Onderhoudsinspecties (Maintenance Checks) genoemd. Zie figuur 0.1 hieronder
Figuur 0.1 Ontwikkelen van Onderhoudstaken-Paketten en Onderhoudsinspecties
De Transavia L/B classificatie-criteria wordt gebruikt voor de identificatie van taken waarvoor Transavia gecertificeerd is om uit te voeren (Lijn-onderhoudstaken). Alle andere taken zijn groot-onderhoudstaken. De volgende stap in de "Bottom-Up"-benadering is om te bepalen wanneer de Onderhoudstaken-Pakketten en de onderhoudsinspecties uitgevoerd moeten worden. Dit gebeurt door de vliegtuig-utilisatie te combineren met de onderhoudslimieten van taken-pakketten die voortvloeien uit Figuur 0.1. De "Top-Down" benadering begint met het analyseren van utilisatiebenodigdheden van het vliegtuig op jaarbasis, wekelijkse basis en een dagelijkse basis. Utilisatie op jaarbasis vertoont een seizoenspatroon, terwijl de wekelijkse en de dagelijkse basis geen specifieke patronen vertonen. De verdeling van slots gebeurt dus op jaarlijkse basis, voor zowel lijn- en groot onderhoud. Ad-hoc slots kunnen gelokaliseerd worden op wekelijkse en dagelijkse basis.
OMP Maintenance Tasks
Line MaintenanceTasks
Base MaintenanceTasks
Line?Base?
Set-up properties
Maintenance Intervals(CT/FH/FC)
Transavia L/BClassification Criteria
MaintenanceChecks
MaintenanceTask Packages
OMP Maintenance Tasks
Line MaintenanceTasks
Base MaintenanceTasks
Line?Base?
Set-up properties
Maintenance Intervals(CT/FH/FC)
Transavia L/BClassification Criteria
MaintenanceChecks
MaintenanceTask Packages
Samenvatting
xi
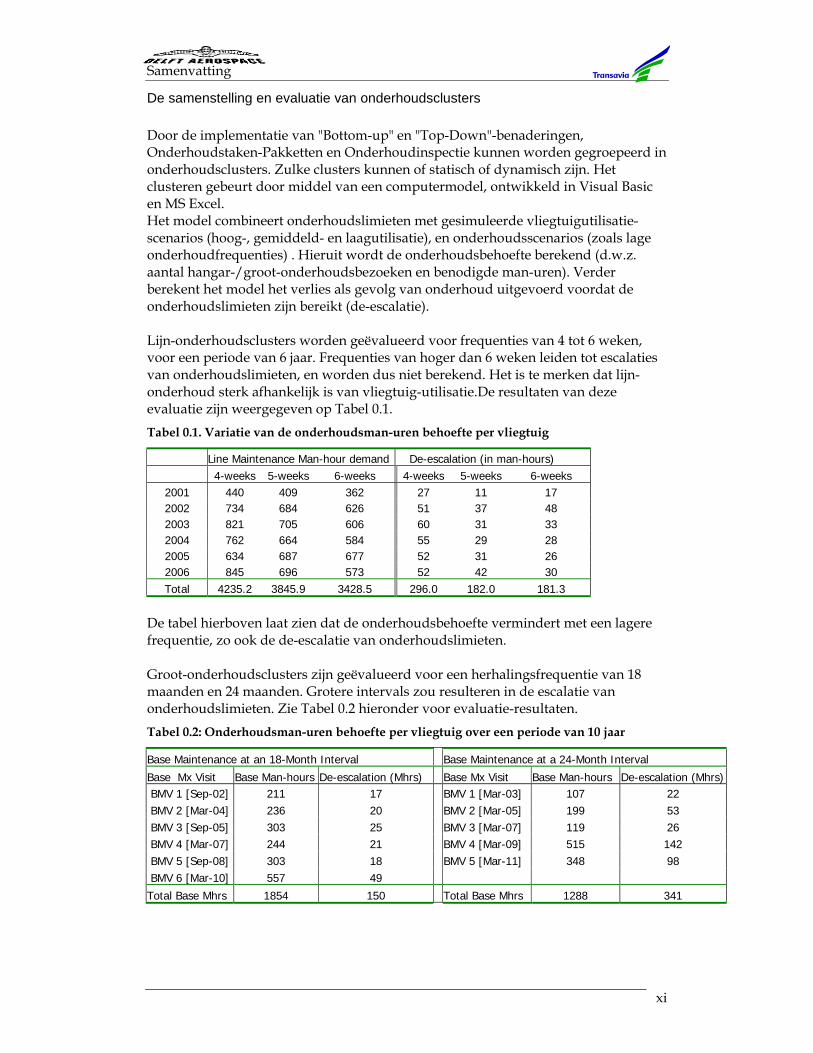
De samenstelling en evaluatie van onderhoudsclusters Door de implementatie van "Bottom-up" en "Top-Down"-benaderingen, Onderhoudstaken-Pakketten en Onderhoudinspectie kunnen worden gegroepeerd in onderhoudsclusters. Zulke clusters kunnen of statisch of dynamisch zijn. Het clusteren gebeurt door middel van een computermodel, ontwikkeld in Visual Basic en MS Excel. Het model combineert onderhoudslimieten met gesimuleerde vliegtuigutilisatie-scenarios (hoog-, gemiddeld- en laagutilisatie), en onderhoudsscenarios (zoals lage onderhoudfrequenties) . Hieruit wordt de onderhoudsbehoefte berekend (d.w.z. aantal hangar-/groot-onderhoudsbezoeken en benodigde man-uren). Verder berekent het model het verlies als gevolg van onderhoud uitgevoerd voordat de onderhoudslimieten zijn bereikt (de-escalatie). Lijn-onderhoudsclusters worden geëvalueerd voor frequenties van 4 tot 6 weken, voor een periode van 6 jaar. Frequenties van hoger dan 6 weken leiden tot escalaties van onderhoudslimieten, en worden dus niet berekend. Het is te merken dat lijn-onderhoud sterk afhankelijk is van vliegtuig-utilisatie.De resultaten van deze evaluatie zijn weergegeven op Tabel 0.1. Tabel 0.1. Variatie van de onderhoudsman-uren behoefte per vliegtuig
Line Maintenance Man-hour demand De-escalation (in man-hours) 4-weeks 5-weeks 6-weeks 4-weeks 5-weeks 6-weeks
2001 440 409 362 27 11 17 2002 734 684 626 51 37 48 2003 821 705 606 60 31 33 2004 762 664 584 55 29 28 2005 634 687 677 52 31 26 2006 845 696 573 52 42 30 Total 4235.2 3845.9 3428.5 296.0 182.0 181.3
De tabel hierboven laat zien dat de onderhoudsbehoefte vermindert met een lagere frequentie, zo ook de de-escalatie van onderhoudslimieten. Groot-onderhoudsclusters zijn geëvalueerd voor een herhalingsfrequentie van 18 maanden en 24 maanden. Grotere intervals zou resulteren in de escalatie van onderhoudslimieten. Zie Tabel 0.2 hieronder voor evaluatie-resultaten. Tabel 0.2: Onderhoudsman-uren behoefte per vliegtuig over een periode van 10 jaar
Base Maintenance at an 18-Month Interval Base Maintenance at a 24-Month Interval
Base Mx Visit Base Man-hours De-escalation (Mhrs) Base Mx Visit Base Man-hours De-escalation (Mhrs)BMV 1 [Sep-02] 211 17 BMV 1 [Mar-03] 107 22 BMV 2 [Mar-04] 236 20 BMV 2 [Mar-05] 199 53 BMV 3 [Sep-05] 303 25 BMV 3 [Mar-07] 119 26 BMV 4 [Mar-07] 244 21 BMV 4 [Mar-09] 515 142 BMV 5 [Sep-08] 303 18 BMV 5 [Mar-11] 348 98 BMV 6 [Mar-10] 557 49
Total Base Mhrs 1854 150 Total Base Mhrs 1288 341
Maintenance Planning Optimisation: B737 NG
xii
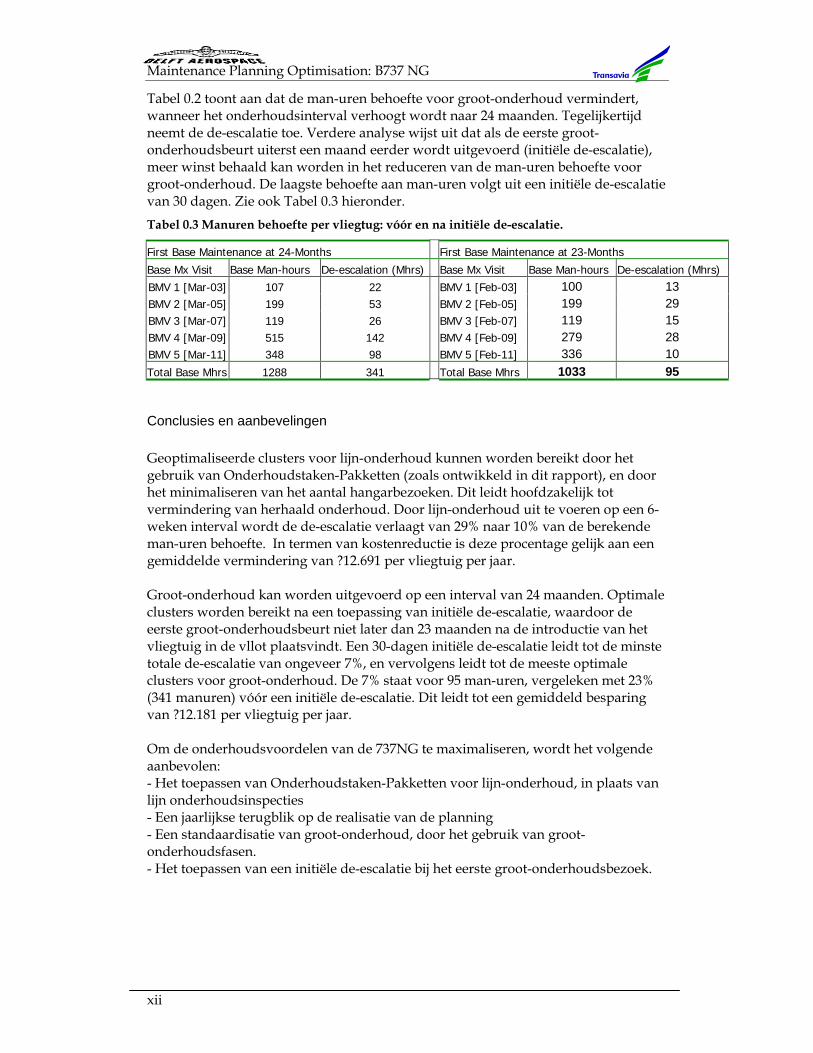
Tabel 0.2 toont aan dat de man-uren behoefte voor groot-onderhoud vermindert, wanneer het onderhoudsinterval verhoogt wordt naar 24 maanden. Tegelijkertijd neemt de de-escalatie toe. Verdere analyse wijst uit dat als de eerste groot-onderhoudsbeurt uiterst een maand eerder wordt uitgevoerd (initiële de-escalatie), meer winst behaald kan worden in het reduceren van de man-uren behoefte voor groot-onderhoud. De laagste behoefte aan man-uren volgt uit een initiële de-escalatie van 30 dagen. Zie ook Tabel 0.3 hieronder. Tabel 0.3 Manuren behoefte per vliegtug: vóór en na initiële de-escalatie.
First Base Maintenance at 24-Months First Base Maintenance at 23-Months
Base Mx Visit Base Man-hours De-escalation (Mhrs) Base Mx Visit Base Man-hours De-escalation (Mhrs)
BMV 1 [Mar-03] 107 22 BMV 1 [Feb-03] 100 13 BMV 2 [Mar-05] 199 53 BMV 2 [Feb-05] 199 29 BMV 3 [Mar-07] 119 26 BMV 3 [Feb-07] 119 15 BMV 4 [Mar-09] 515 142 BMV 4 [Feb-09] 279 28 BMV 5 [Mar-11] 348 98 BMV 5 [Feb-11] 336 10 Total Base Mhrs 1288 341 Total Base Mhrs 1033 95
Conclusies en aanbevelingen Geoptimaliseerde clusters voor lijn-onderhoud kunnen worden bereikt door het gebruik van Onderhoudstaken-Pakketten (zoals ontwikkeld in dit rapport), en door het minimaliseren van het aantal hangarbezoeken. Dit leidt hoofdzakelijk tot vermindering van herhaald onderhoud. Door lijn-onderhoud uit te voeren op een 6-weken interval wordt de de-escalatie verlaagt van 29% naar 10% van de berekende man-uren behoefte. In termen van kostenreductie is deze procentage gelijk aan een gemiddelde vermindering van ?12.691 per vliegtuig per jaar. Groot-onderhoud kan worden uitgevoerd op een interval van 24 maanden. Optimale clusters worden bereikt na een toepassing van initiële de-escalatie, waardoor de eerste groot-onderhoudsbeurt niet later dan 23 maanden na de introductie van het vliegtuig in de vllot plaatsvindt. Een 30-dagen initiële de-escalatie leidt tot de minste totale de-escalatie van ongeveer 7%, en vervolgens leidt tot de meeste optimale clusters voor groot-onderhoud. De 7% staat voor 95 man-uren, vergeleken met 23% (341 manuren) vóór een initiële de-escalatie. Dit leidt tot een gemiddeld besparing van ?12.181 per vliegtuig per jaar. Om de onderhoudsvoordelen van de 737NG te maximaliseren, wordt het volgende aanbevolen: - Het toepassen van Onderhoudstaken-Pakketten voor lijn-onderhoud, in plaats van lijn onderhoudsinspecties - Een jaarlijkse terugblik op de realisatie van de planning - Een standaardisatie van groot-onderhoud, door het gebruik van groot-onderhoudsfasen. - Het toepassen van een initiële de-escalatie bij het eerste groot-onderhoudsbezoek.
Acronyms
xiii
Acronyms 737 NG Boeing 737 Next Generation AD Airworthiness Directive AM Aircraft Modification APU Auxiliary Power Unit ATA Air Transport Association AV Annual Visit AWL Air Worthiness Limitations BM Base Maintenance CMR Certification Maintenance Requirements Cons. Conservative CPCP Corrosion Prevention Control Program CPV Commerciële Planning en Verkoop CYC Cycles DDS Dispatch Deviation Sheet FAA Federal Aviation Authority FAR Federal Aviation Requirement FC Flight Cycles FH Flight Hours HMx Heavy Maintenance HRS Hours HV Transavia airlines JAA Joint Aviation Authority JAR Joint Airworthiness Requirements LM Line Maintenance MEL Minimum Equipment List METALS Maintenance Engineering Transavia Airline Logistics System MI Maintenance Instruction ML Most Likely MP Maintenance Program MP&S Maintenance Planning and Support MPD Maintenance Planning Data MRB Maintenance Review Board MRI Maintenance Requirement Items MSG Maintenance Steering Group MSI Maintenance Significant Items Mx Maintenance NLA Nederlandse Luchtvaart Autoriteit OMP Transavia’s Operator’s Maintenance Program Opt. Optimistic RI Repair Instruction SB Service Bulletin SL Service Letter SPL Schiphol SSI Structural Significant Items

Definition of Terms
xv
Definition of terms Airworthiness: Conformation to the regulations under which an
aeronautical product is certified Block Checks: Groups of maintenance tasks packaged together for
repetition at specific intervals Cluster: A collection of Maintenance items, grouped together
under specific circumstances De-escalation: Loss of man-hours resulting from the execution of a
maintenance task before the maintenance limit is reached
Equalised Checks: Groups of maintenance tasks arranged into many small
packages, all having approximately the same ground time
Inherent Reliability: Reliability with which the aircraft is designed Maintenance Check: A group of maintenance tasks that share the same
maintenance interval, as defined in the OMP Maintenance Demand: The total amount of man-hours required to perform all
maintenance work due on an aircraft Maintenance Items: A collection of Maintenance Task Packages and
Maintenance Checks Maintenance Slot: A specified amount within which an aircraft is
withdrawn from operations for the purpose of maintenance
Maintenance Task: Unit task as defined in the MPD Maintenance Task Package: A group of maintenance tasks that share the same set-
up activities, and have a common maintenance interval Maintenance Visit: The presence of an aircraft in a maintenance facility for
the purpose of maintenance Maintenance Window: A specified period of time in which the aircraft is not
utilised, considered sufficient enough for the execution of maintenance
Maintenance Work Package: A collection of maintenance tasks specifically prepared
for execution on the work floor Total De-escalation: Summation of all de-escalations for a given situation Transavia Check: Equivalent to Maintenance Check

Outline
xvii
Outline
Colophon .................................................................................................................................. i Preface ..................................................................................................................................... iii Executive Summary ............................................................................................................... v Samenvatting .......................................................................................................................... ix Acronyms .............................................................................................................................. xiii Definition of terms ................................................................................................................ xv Outline .................................................................................................................................. xvii 1 Assignment Analysis ...................................................................................................... 1
1.1 Problem Background .............................................................................................. 1 1.2 Problem formulation .............................................................................................. 2 1.3 Objectives ................................................................................................................. 3 1.4 Research environment ........................................................................................... 6 1.5 Approach Strategy .................................................................................................. 6
1.5.1 Assignment analysis ....................................................................................... 7 1.5.2 Background research ...................................................................................... 7 1.5.3 Maintenance program analysis: 737NG ...................................................... 8 1.5.4 Maintenance planning definition and development ................................. 9 1.5.5 Report phase .................................................................................................... 9
1.6 Requirements, constraints and assumptions ...................................................... 9 1.6.1 Requirements .................................................................................................. 9 1.6.2 Constraints ....................................................................................................... 9 1.6.3 Assumptions ...................................................................................................10
2 Maintenance Planning and Scheduling ......................................................................11 2.1 Maintenance Program (MP) Development ........................................................11
2.1.1 MRIs based MPD items:................................................................................12 2.1.2 MRIs based on non-MPD items ...................................................................12 2.1.3 Maintenance Checks ......................................................................................13 2.1.4 Maintenance Task Cards and task card control ........................................14 2.1.5 The B737-300 MP vs. the B737 NG MP .......................................................15
2.2 Maintenance Planning and scheduling ..............................................................17 2.2.1 Long term planning .......................................................................................18 2.2.2 Medium term planning .................................................................................18 2.2.3 Short term planning ......................................................................................18
2.3 Line Maintenance ..................................................................................................19 2.3.1 Scheduling of hangar visits ..........................................................................19
2.4 Base Maintenance ..................................................................................................22 2.4.1 Scheduling of Base Maintenance .................................................................22
2.5 The Planning department vs. the Sales department .........................................25 2.5.1 Commercial Planning ....................................................................................25
2.6 Maintenance planning and the cost of ownership ............................................26 2.7 Conclusions: ...........................................................................................................27
3 Maintenance Clusters Definition and Development ................................................29 3.1 Approach ................................................................................................................29 3.2 Bottom-Up approach .............................................................................................30
3.2.1 Maintenance Checks ......................................................................................30 3.2.2 Maintenance Task Packages .........................................................................30
Maintenance Planning Optimisation: B737 NG
xviii
3.2.3 Aircraft utilisation: Determining due dates and due items .....................32 3.2.4 Maintenance Scheduling ..............................................................................35
3.3 Top-down approach ..............................................................................................38 3.3.1 Aircraft utilisation requirement ...................................................................38 3.3.2 Maintenance scheduling ...............................................................................41
3.4 Conclusions ............................................................................................................43 4 Cluster formation and evaluation ...............................................................................45
4.1 Approach ................................................................................................................45 4.2 Maintenance Item Clustering ...............................................................................46
4.2.1 Clustering method selection ........................................................................46 4.2.2 Calculation and simulation software ..........................................................47
4.3 Simulation process description ............................................................................48 4.3.1 Simulation Components: ..............................................................................48 4.3.2 Maintenance Item Allocation Model (MIAM): Model design .................51 4.3.3 Clustering: Line Maintenance – Transavia Hangar ..................................53 4.3.4 Clustering: Base Maintenance – MRO Station ...........................................53 4.3.5 Maintenance item Interval de-escalation ...................................................54 4.3.6 Model Validation and verification ..............................................................55
4.4 MIAM Results ........................................................................................................56 4.4.1 Base Maintenance ..........................................................................................56 4.4.2 Base Maintenance Optimisation ..................................................................62 4.4.3 Line Maintenance ..........................................................................................67 4.4.4 Line Maintenance Optimisation ..................................................................75
4.5 Summary .................................................................................................................80 5 Conclusions and Recommendations ...........................................................................81
5.1 Conclusions ............................................................................................................81 5.2 Recommendations .................................................................................................83
References ...............................................................................................................................85 A. Assignment .................................................................................................................87 B. Transavia Airlines......................................................................................................89
B.1. History .....................................................................................................................89 B.2. The fleet ...................................................................................................................89 B.3. Maintenance Facilities ...........................................................................................90 B.4. Organisation ...........................................................................................................90 B.5. Operational area ....................................................................................................93
C. The MSG-3 Philosophy .............................................................................................97 C.1. MSG Development: ...............................................................................................97
C.1.1. MSG-2 (Process oriented) .....................................................................97 C.1.2. RCM (Reliability Centred Maintenance) ............................................98 C.1.3. MSG-3 (Task oriented maintenance) ...................................................98
C.2. Maintenance program objectives (MSG-3) .........................................................98 C.3. MSG-3 Logic flow analysis ...................................................................................99
D. Maintenance Program Packaging Methods .........................................................101 D.1. Maintenance program packaging methods .....................................................101 D.2. Block Packaging ...................................................................................................101 D.3. Equalised/Phased or progressive packaging: .................................................102
E. Line and Base Maintenance Redefinition .............................................................105 E.1. Cause .....................................................................................................................105 E.2. Aim ........................................................................................................................105 E.3. Approach ..............................................................................................................105
E.3.1. Engineering...........................................................................................106
Outline
xix
E.3.2. Purchases and Logistics ......................................................................107 E.3.3. Maintenance planning and support ..................................................107 E.3.4. Safety & Quality Assurance (S&QA) ................................................107
F. Transavia Airplane Reliability Program ...................................................................109 G. Maintenance Governing Regulations ...................................................................113
G.1. The Federal Aviation Administration (FAA) ..................................................113 G.1.1. Reliability program requirements .....................................................114 G.1.2. Airworthiness Directives (ADs) ........................................................114 G.1.3. Airworthiness .......................................................................................115
G.2. The Joint Aviation Authority (JAA) ..................................................................115 H. Line Maintenance Planning Norm ........................................................................117 I. List of Line and Base Maintenance Checks ..............................................................119
I.1. Line Maintenance Checks ...................................................................................119 I.2. Base Maintenance Checks ..................................................................................120 I.3. List of all Line Maintenance Tasks in Task Packages .....................................120
J. The Maintenance Item Allocation Model (MIAM) .................................................131 J.1. Necessity ...............................................................................................................131 J.2. Hybrid Simulation ...............................................................................................131
J.2.1. Components of a Discrete-Event simulation model ...............................131 J.3. Library Routine: Utilisation Simulation ...........................................................131
J.3.1. Actual Aircraft Utilisation ..........................................................................131 J.3.2. Variable Aircraft Utilisation .......................................................................133
J.4. Visual Basic Code ................................................................................................135 J.4.1. Line Maintenance Codes ............................................................................135 J.4.2. Base Maintenance Codes ............................................................................140
J.5. Model Verification and Validation ....................................................................142 Figure J. 3 Model Verification and Validation Process ..........................................142
J.5.1. Validation .....................................................................................................142 J.5.2. Verification ...................................................................................................144
K. MIAM Results - Tables ...........................................................................................153 K.1. Base Maintenance ................................................................................................153 K.2. Line Maintenance ................................................................................................157
L. Appendix L ...............................................................................................................161

Introduction
1
1 Assignment Analysis
1.1 Problem Background
In order to sustain the inherent reliability1 of an aircraft, the aircraft manufacturer develops a document referred to as Maintenance Planning Data (MPD). This is a generic document as it contains all Maintenance Review Board (MRB) requirements, plus Boeing requirements that result from service experience. It also includes aircraft information such as zonal diagrams, ground rules, and recommended check intervals. The document provides maintenance planning information necessary for an operator to develop a customised scheduled maintenance program [Boeing CAS, 2000]. On top of tasks stipulated in the MPD, airlines also have additional tasks that follow from Airline specific task cards. These tasks are meant to satisfy the operator’s specific needs for aircraft utilisation. Such tasks may be scheduled in as routine maintenance. Other tasks follow from incidents and accidents (Repair Instructions), Deferred Defects (non-routine maintenance tasks), Maintenance Instructions and Aircraft Modifications (from Service letters, Service bulletins and Airworthiness Directives). These are tasks that are performed when opportunity arises, but may also have specified time limits. Following the stipulated maintenance tasks and intervals from the MPD, an operator develops a Maintenance Program (referred to as the Operator’s Maintenance Program –OMP- by Transavia). The maintenance program has to be approved by the local Aviation Authority. This document reflects how an operator intends to schedule, package and perform maintenance (maintenance checks). The operator arrives at an OMP by reviewing the aircraft anticipated utilisation, fleet size, seasonal constraints, and maintenance capabilities, operational requirements, dispatch reliability, amongst other factors, and combining these with aircraft operational requirements. The band of possible task packages2 for a given aircraft can range from:
1. A program consisting of a large number of progressively performed small packages, resulting from Task-Based Maintenance (Equalised/Progressive check)
2. A program which bundles most scheduled tasks in relatively few large checks performed at higher intervals (Block check).
Traditionally, the MPD documents recommended the use of Block checks (letter checks A, B, C, D), by pre-determining the packages for each letter check. However, with the advancements in aircraft maintenance analysis brought about by the task-oriented MSG-3 and its revisions (rev.1 en rev.2)3, the Boeing Company is tending to opt for non-packaging of maintenance tasks in the MPD, leaving this open for the operator. This has been the case with the Boeing 737 Next Generation (henceforth referred to as 737NG) MPD document. The main reason for this is that the operator gets more freedom to plan maintenance based on aircraft scheduling and utilisation, hence having more control over direct maintenance costs. By reviewing an operator’s anticipated utilisation, environmental considerations, fleet size, seasonal constraints, and other factors, it is possible to package an aircraft’s maintenance program taking full advantage of the allowable utilisation parameters as specified in the MPD document. 1 See also Appendix F: Airplane Reliability Program 2 See also Appendix D: Maintenance program packaging methods 3 See also Appendix C: The MSG-3 Philosophy
Maintenance Planning Optimisation: B737 NG
2
The planning and execution of maintenance tasks can be boldly classified into two categories: a. Line maintenance: This can generally be defined as maintenance activities with a pre-
flight, daily, weekly, and periodic (A Check, B Check) frequency (JAR-145 Section 2, paragraph 3.2.2). It mainly consists of visual inspections, lubrication, and general servicing of aircraft and does not require the opening of panels and access doors for detailed inspections. Line maintenance is mainly characterised by short downtime periods of twenty-four hours or less and small maintenance packages, quantified in terms of man-hours.
b. Heavy (Base) maintenance: This can generally be defined as maintenance activities falling under C Checks and D checks (JAR-145 Section 2 paragraph 3.2.3), requiring panel and access doors opening and disassembly for deeper inspection and eventually repair. Base maintenance is mainly characterised by long downtime periods and large maintenance packages, quantified in terms of man-hours
1.2 Problem formulation
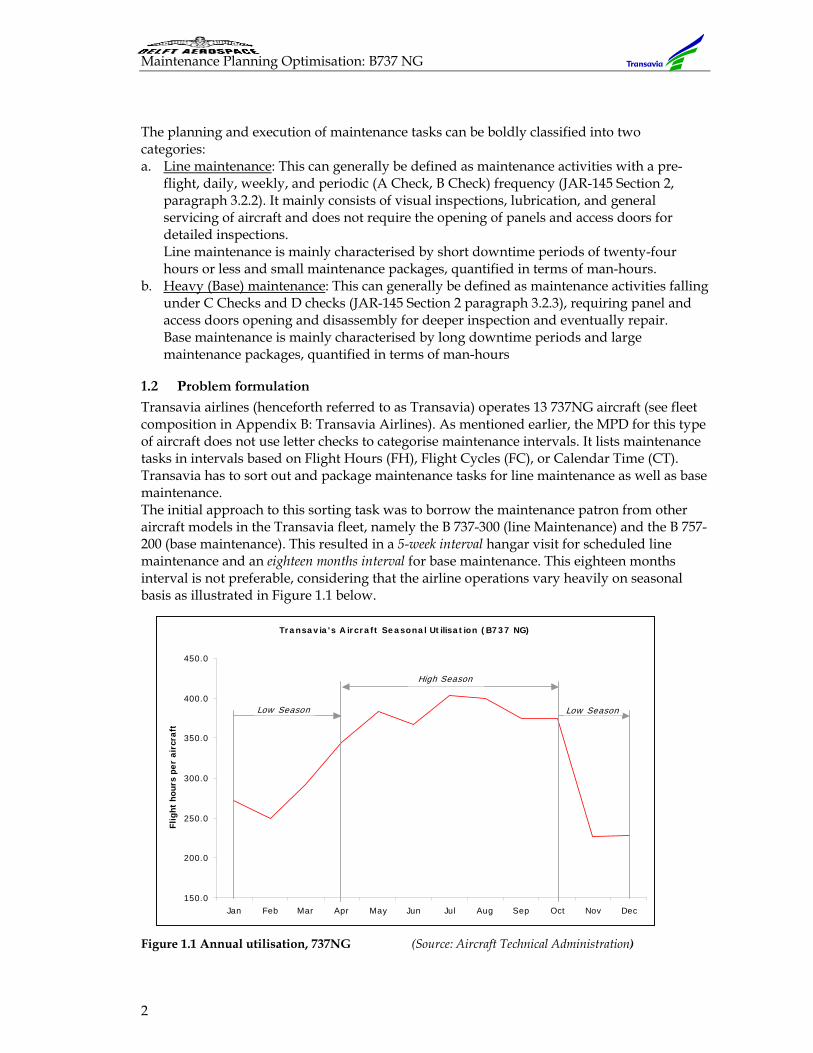
Transavia airlines (henceforth referred to as Transavia) operates 13 737NG aircraft (see fleet composition in Appendix B: Transavia Airlines). As mentioned earlier, the MPD for this type of aircraft does not use letter checks to categorise maintenance intervals. It lists maintenance tasks in intervals based on Flight Hours (FH), Flight Cycles (FC), or Calendar Time (CT). Transavia has to sort out and package maintenance tasks for line maintenance as well as base maintenance. The initial approach to this sorting task was to borrow the maintenance patron from other aircraft models in the Transavia fleet, namely the B 737-300 (line Maintenance) and the B 757-200 (base maintenance). This resulted in a 5-week interval hangar visit for scheduled line maintenance and an eighteen months interval for base maintenance. This eighteen months interval is not preferable, considering that the airline operations vary heavily on seasonal basis as illustrated in Figure 1.1 below.
Figure 1.1 Annual utilisation, 737NG (Source: Aircraft Technical Administration)
Transav ia 's A ircraft Seasonal Ut ilisat ion (B737 NG)
150.0
200.0
250.0
300.0
350.0
400.0
450.0
Jan Feb Mar Apr May Jun Jul Aug S ep Oct Nov Dec
Flig
ht h
ours
per
air
craf
t
High S eason
Low S eason Low S eason
Introduction
3
Maximum aircraft availability is desired during the summer (high) season (May - October) when fleet utilisation is high. During the winter (low) season (November - April), the aircraft utilisation demand is low. Maintenance tasks requiring significant downtime (mainly base maintenance tasks) are, therefore, performed during the winter season. This often results in the de-escalation of task-intervals for items performed much in advance (e.g. by performing base maintenance at a frequency of 18 months, all maintenance tasks that will be due between 19-35 months will have to be performed then, leading to an interval de-escalation of between 19-35 months, depending on the task interval). There is, therefore, a need to determine when, and how often, maintenance should be performed, in order to reduce task de-escalation and consequently, maintenance costs. In an effort to reduce maintenance costs arising from work contracted out and task-interval de-escalation, line and base maintenance has been redefined within Transavia [Stam, 2001]. The new definitions for these terms are as follows: a. 1. Line Maintenance: defined as all Pre-flight checks, Daily Checks, Service checks, and
all MRIs classified upon their demand for certified staff, required tools/equipment/materials and facility demands, for which Transavia can provide, i.e. Transavia meets these demands.
a. 2. Base Maintenance: defined as all MRIs classified upon their demand for certified staff, required tools/equipment/materials and facility demands, for which Transavia cannot provide, i.e. Transavia does not meet these demands. (See also Appendix E: Line and Base Maintenance Redefinition)
These two definitions, which differ from those given in section 1.1, imply that each individual task has to be analysed before being classified into either line or base maintenance. They also imply that the line maintenance tasks (work performed in-house) will significantly increase (coupled with a decrease in Base Maintenance tasks), hence demanding a new approach in the planning and scheduling of maintenance in-house and maintenance work contracted out. There is, therefore, the need to determine the impacts of the increase in line maintenance tasks, and how this should be dealt with within the Transavia, with as end-result the reduction of maintenance costs. Finally, there is also the need to define exact work packages for both line and base maintenance in order to facilitate easier financial budgeting. This financial budgeting is done once a year, and it creates a capital reserve for base maintenance, as well as line maintenance. The base maintenance reserve is based on the anticipated work to be issued out, and the current/ projected rates of base maintenance. The definition of exact work packages would also help monitor and evaluate the impact of line and base maintenance redefinition and hence facilitate further optimisation of the maintenance program and maintenance planning. This assignment can therefore be formulated as follows: Develop a cost-effective maintenance planning and packaging method that will lead to the reduction of direct maintenance costs, yet maintaining the reliability of the 737 Next Generation fleet.
1.3 Objectives
The objectives of the above-stated assignment can be achieved by answering the following major questions, which will serve as the main topics:
Maintenance Planning Optimisation: B737 NG
4
A. What are the most significant factors determining maintenance task clustering and
planning optimisation within the Transavia organisation? B. What is the most optimum way of clustering maintenance tasks to be performed by the
maintenance department at Transavia, and by a base maintenance station? C. What impact do such clusters have on the cost of ownership4 of the aircraft (with regard
to maintenance)? These questions have in turn been split into sub-questions for a deeper analysis of the assignment. These sub-questions will also serve as the sub-topics for the research. The assignment will be carried out in four phases (see the next chapter), in the course of which the following sub-questions will be answered. Ad A. The following sub-questions will be used to collect facts on the current situation
within the organisation, and to establish a base on which an eventual clustering will be implemented.
A.1 How is the maintenance execution department of Transavia airlines structured?
It is important to establish the structure of the technical department in order to determine where different responsibilities fall in the maintenance process.
A.2 How is the maintenance execution planned? The end result of this research should be an optimum maintenance planning. This implies that there is a need to look into the current maintenance planning structure in order to establish elements that need to be optimised. Such elements may include: total maintenance items, manpower demand and availability, maintenance capacity and maintenance planning tolerances. A constraint on the maintenance planning is the certification of Transavia’s maintenance department (see A.4 below)
A.3 How do the maintenance costs of the old and new fleet compare (-300, -800 Cost breakdown)? As mentioned in section 1.2 above, the B737-300 MPD differs in many aspects from that of the 737 NG. The aircraft operator (Transavia) expects a reduction in maintenance costs through the maximisation of improved maintenance characteristics of the 737 NG. It is, therefore, necessary to establish whether this is currently the case.
A.4 What are the boundary conditions for operations and maintenance? The research results are expected to be as realistic as possible. Therefore, various factors that may limit the implementation of results should be established early in advance in order to realise the objectives of the research.
Ad B. The following sub-questions will be used to guide the formation of maintenance task packages.
B.1 What are the significant differences between the old and the new operator’s maintenance
program? The maintenance planning is based on an approved maintenance program. The maintenance program identifies all maintenance tasks that have to be performed, and how often they have to be performed.
4 See definition in section 2.6
Introduction
5
This sub-question should lead to the determination of the key differences between the traditional maintenance program structure and the new maintenance program structure for the 737NG.
B.2 How are the new tasks quantified? This entails establishing what kind of system is used to group maintenance tasks and maintenance checks, and what information can be derived from this coding system
B.3 How do the tasks interrelate? This sub-question should establish whether the maintenance execution department sets certain conditions on when various tasks should be performed (e.g. day or night), and what tasks should not be combined in a package (relationship between set-up activities).
B.4 What are the lessons learnt from the past on scheduled and unscheduled maintenance? This is to establish whether the maintenance execution department employs a certain policy as pertains to performing unscheduled maintenance in combination with routine maintenance. This sub-question should also determine how Deferred Defects are dealt with within the organisation.
B.5 What is the policy of the Boeing Company on B737NG maintenance? The MPD document normally includes a customised maintenance program, in which various maintenance check intervals are recommended. It is therefore advisable to look at whether the recommended program is of any significance to the Transavia program.
B.6 What conclusions can be drawn from the answers to the questions above on fields that need to be optimised? Information gathered through sub-questions B.1 – B.5 should form a base on which maintenance clusters should be built on to satisfy the needs of Transavia’s technical department
B.7 What is the criteria to be used in the clustering of maintenance tasks? The end result of the research will be maintenance clusters for the 737NG aircraft. This sub-question should therefore lead to the establishment of a system to be utilised in packaging maintenance tasks, and consequently maintenance clusters.
Ad C. After the formation of clusters, an evaluation will have to be done in order to establish their effectiveness within the organisation. Sub-questions to be used in the evaluation are:
C.1 How do the new task packages and tasks compare/differ from the previous task packages?
It will be necessary to establish the main similarities and differences between the current and the new maintenance packages. This will be the first step in the evaluation of maintenance packages resulting created from section B.7 above.
C.2 Is it possible to determine what impact the new work schedule will have on the maintenance department? The second step in the evaluation and optimisation of maintenance clusters is establishing what impact such clusters have on the planning and execution of maintenance, both on the work floor and at the planning department
Maintenance Planning Optimisation: B737 NG
6
C.3 Is it possible to determine the financial implications of the new planning? It is also important to establish how the new packages behave under different circumstances, based on the aircraft utilisation. This also forms a part of the optimisation process. Further, it is necessary to establish whether the new planning will lead to the reduction of maintenance costs, as indicated in the assignment.
C.4 Will the new clusters have an impact on the organisation on the work floor? Is there any re-organisation required? This sub-question is meant to establish what impact the new packages might have on the general organisation on the work floor.
C.5 Are these clusters also applicable for the KLM Business Unit 737? Finally, it is desired that the maintenance packages developed should also be applicable for the KLM Business Unit 737. This sub-question should, therefore, assist in establishing the applicability of the clusters to the KLM 737NG fleet.
1.4 Research environment
The research is to be carried out at the Maintenance Planning and Support (MP&S) department of the Transavia airlines (Appendix B).
1.5 Approach Strategy
This research will be carried out in four phases, namely
A. (1) Assignment analysis B. (2a.) Background research B. (2b.) Maintenance program and maintenance planning analysis C. (3) Maintenance planning definition, development, and implementation D. Report phase
This subdivision is necessitated by the following factors:
1. The research requires a strategy that reflects what the assignment is about, what is expected from the assignment, why, and how these expectations are to be met.
2. The research requires a schedule illustrating what is being done at what stage and what the various deliverables are.
3. The assignment creates the need to assess the situation within the organisation in order to establish the organisation requirements. This has been translated to main question 1.3.A (See section 1.3)
4. The end result of the assignment should be an optimum packaging of maintenance tasks. Optimisation entails identifying areas needing improvement, identifying elements of maintenance that are directly associated with task packaging (such as maintenance downtime, maintenance frequency)- main question 1.3.B, and combining all these such that the most favourable situation is achieved- main question 1.3.C
5. The documentation of all findings from the research.
Introduction
7
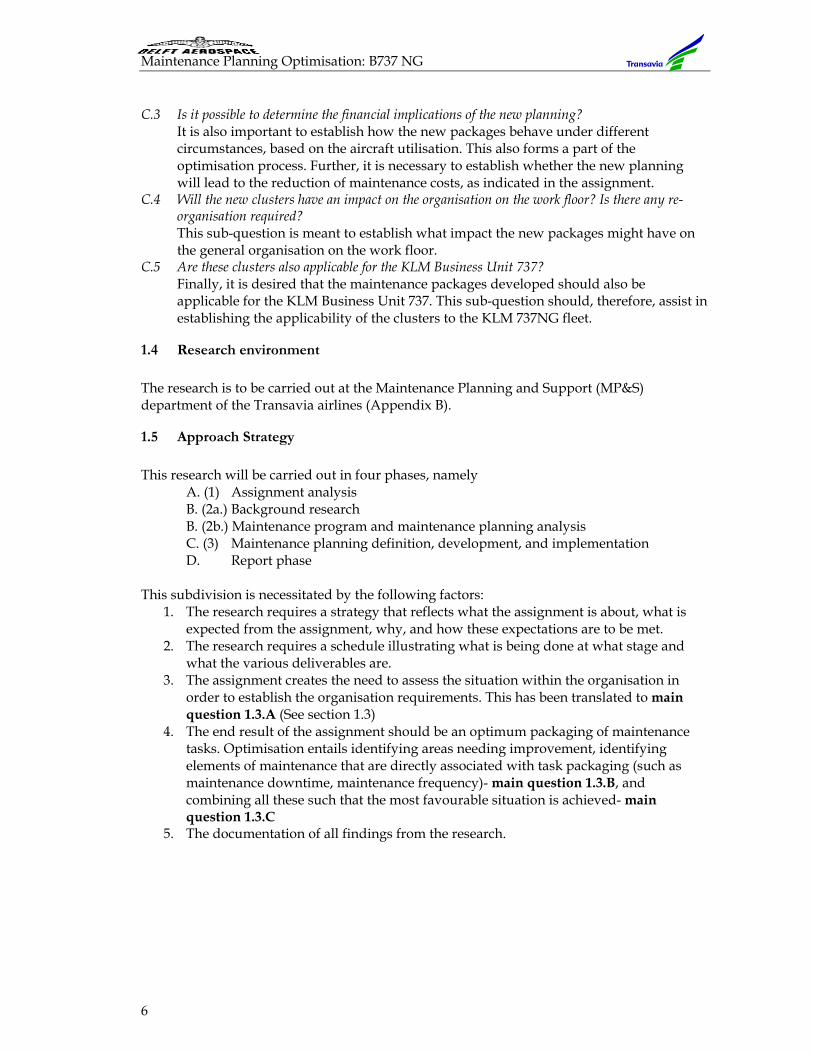
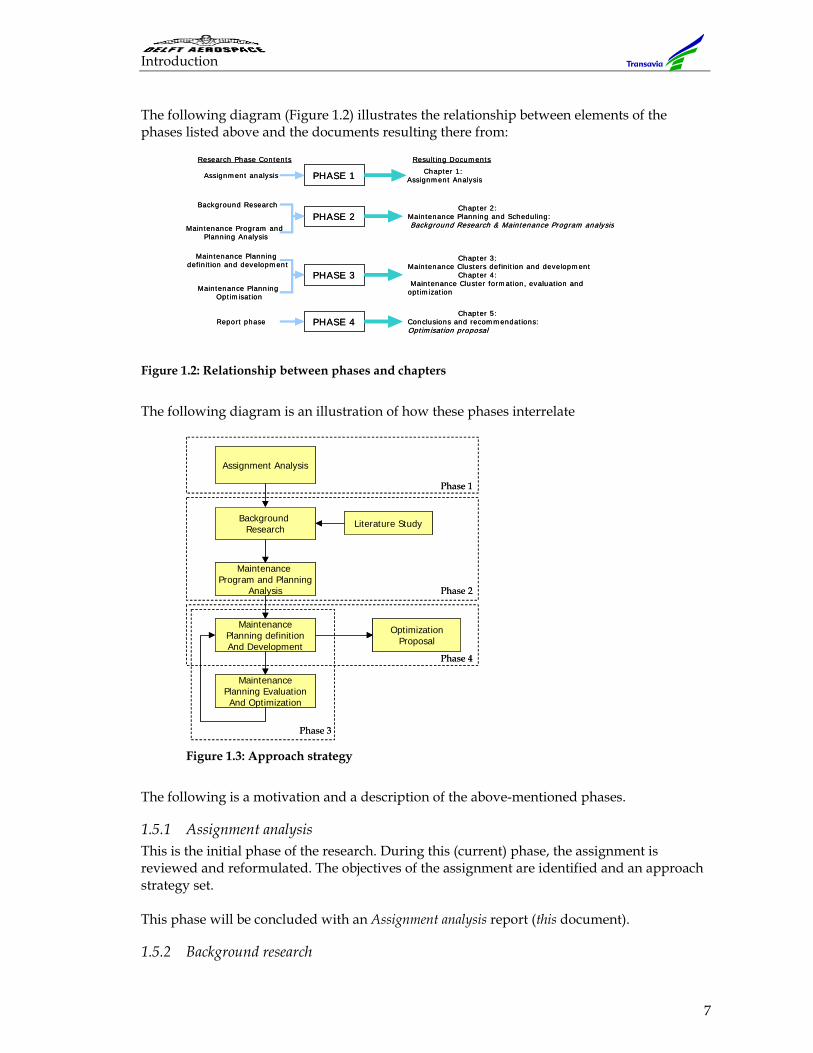
The following diagram (Figure 1.2) illustrates the relationship between elements of the phases listed above and the documents resulting there from:
Figure 1.2: Relationship between phases and chapters
The following diagram is an illustration of how these phases interrelate
Figure 1.3: Approach strategy
The following is a motivation and a description of the above-mentioned phases.
1.5.1 Assignment analysis This is the initial phase of the research. During this (current) phase, the assignment is reviewed and reformulated. The objectives of the assignment are identified and an approach strategy set. This phase will be concluded with an Assignment analysis report (this document).
1.5.2 Background research
PHASE 1 Chapter 1: Assignm ent Analysis
PHASE 2
PHASE 3
PHASE 4
Chapter 2:Maintenance Planning and Schedu ling:Background Research & Maintenance Program analysis
Chapter 5: Conclusions and recom m endations:Optim isation proposal
Chapter 3: Maintenance Clusters defin ition and development
Chapter 4:Maintenance Cluster form ation, evaluation and
optim ization
Assignment analysis
Background Research
Maintenance Program and Planning Analysis
Maintenance Planning defin ition and developm ent
Maintenance Planning Optim isation
Report phase
Research Phase Contents Resulting Docum ents
Assignment Analysis
Background Research
Maintenance Program and Planning
Analysis
MaintenancePlanning definitionAnd Development
MaintenancePlanning EvaluationAnd Optimization
OptimizationProposal
Literature Study
Phase 1
Phase 2
Phase 3
Phase 4
Assignment Analysis
Background Research
Maintenance Program and Planning
Analysis
MaintenancePlanning definitionAnd Development
MaintenancePlanning EvaluationAnd Optimization
OptimizationProposal
Literature Study
Phase 1
Phase 2
Phase 3
Phase 4
Maintenance Planning Optimisation: B737 NG
8
This first part of phase 2 will assess the current situation within the Engineering and maintenance department of Transavia, as pertains to the maintenance of its B737 fleet. Information gathered from this phase will be used to form a technical and economic base for the research. The following is a description of the approach for this phase:
a. Consultation of records and relevant publications Relevant documents on the organisation of the technical department, maintenance procedures, and maintenance governing regulations are readily available from the technical library of the engineering department. Other documents such as Transavia’s OMP and the NG MPD document, need to be consulted owing to the fact that they are the guiding documents for maintenance planning.
b. Interviews and information systems such as the organisation’s intranet Interviews form a good source for undocumented information, and especially information on past experiences and on various traditions in maintenance planning and execution. The organisation’s intranet is a good source for up-to-date information. Information gathered from this may include: fleet mutations, new maintenance strategies and aircraft utilisation trends.
c. Literature Study Literature references may provide an insight on various elements affecting maintenance planning and maintenance processes, and also proposals for solutions on similar problems.
1.5.3 Maintenance program analysis: 737NG During this second part of phase 2, a deeper look will be taken into the MPD and the Operator’s Maintenance Manual (OMP) of the 737NG. The following is a description of the contents of this phase
a. Analysis of specifications on the maintenance program and maintenance tasks b. A comparison between the maintenance programs of the 737NG and the 737 Classics c. An evaluation of maintenance planning recommendations on the MPD document
Relationship between the maintenance program and the maintenance planning: The maintenance planning is based on the maintenance program. The maintenance program identifies the tasks that have to be done, and when these have to be done. The questions that arise are: what do the tasks entail and what are the intervals linked to these tasks? It may also be important to establish what elements of the Next Generation MPD make the maintenance planning and execution on the aircraft better than that of previous models, as stated by the aircraft manufacturer (Boeing). Owing to the fact that the MPD also proposes a maintenance-planning schedule, it is worth analysing this schedule in order to establish whether it is also applicable for the Transavia fleet. Ideas on an eventual maintenance-planning schedule may also be borrowed from this proposal.
Introduction
9
1.5.4 Maintenance planning definition and development Information gathered from the previous phases will be put together in this phase, and this should result in new maintenance clusters. The intervals in which different clusters fall will be pre-determined before clustering is done. These clusters will then be evaluated with the help of a maintenance allocation model (see Chapter 4), and optimised where necessary. This will be done as follows:
a. Listing all maintenance tasks with all relevant features established in section 1.5.3a above
b. Developing a clustering strategy and forming clusters based on facts gathered from the previous stages of the research
c. Evaluating the effectiveness of maintenance clusters created in (b.) above, and if necessary, optimising these. This should then result in the identification of the most effective way to cluster task packages and perform maintenance.
The above strategy is preferred, owing to the fact that it has a logical sequence as pertains to achieving the desired results of the research. Phase 3 will be concluded with a Maintenance planning definition and development report.
1.5.5 Report phase All facts and results gathered from the three phases above will be documented and presented as a report. This phase will also include recommendations, deduced from the most important results of the whole research.
1.6 Requirements, constraints and assumptions
1.6.1 Requirements - The research should be completed within the stipulated period of nine months - The results of the research should be realistic and should fit within the framework of
Transavia airlines. A look should also be taken on how the results fit into the KLM 737 Business Unit
1.6.2 Constraints a. Transavia flight operations are seasonal in nature
Implications: • Large variations in the number of flight hours and cycles between summer and
winter • Maximum availability is required for the summer season, thus maintenance activities
with long downtime periods should not fall in this season b. The airline frequently leases aircraft in and out
Implications: • Variations in fleet capacity, as requested by the flight operations department, and
consequently the (non-) availability of aircraft. • Introduction of different maintenance programs for aircraft leased in under foreign
registration. c. Aviation authorities regulate maintenance programs
Implications:
Maintenance Planning Optimisation: B737 NG
10
• All proposals and modifications on the maintenance program and maintenance execution are subject to approval by relevant authorities
d. The company’s financial year runs from the first of April of a given year to the thirty-first of March of the year thereafter. Implication: • In order to keep the total cost of heavy maintenance low, not more than two aircraft
should be planned into heavy maintenance per financial year.
e. The airline has no back shops, except for seat repair Implications: • All repair activities (with the exception of seat repair) cannot be performed within the
premises of the company. Such activities have to be contracted out. • Discussions on line and base maintenance pivot on this limitation.
1.6.3 Assumptions • The term B737 NG is used to define both the B737-800 and the B737-700. Presently, the –
800 version totals 12 aircraft and the –700 totals 1 aircraft. • Unless otherwise stated, maintenance programs, maintenance strategies and
maintenance tasks referred to in the report are 737 NG specific
Chapter 2
11
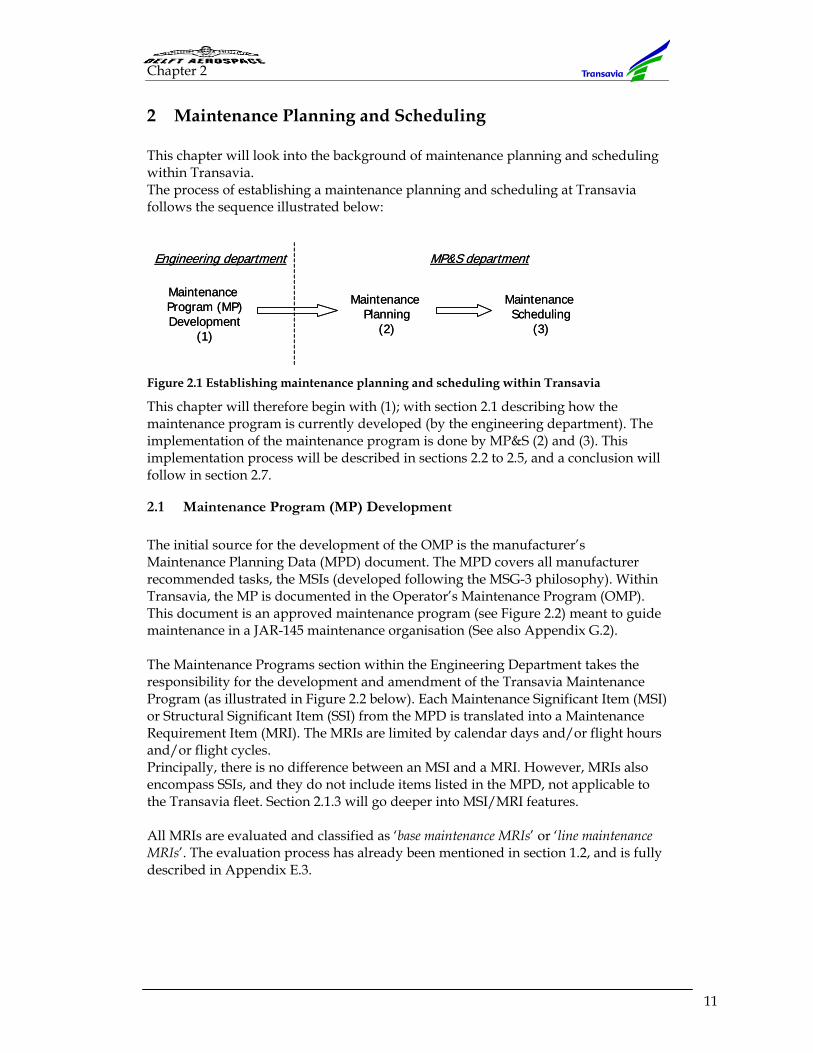
2 Maintenance Planning and Scheduling This chapter will look into the background of maintenance planning and scheduling within Transavia. The process of establishing a maintenance planning and scheduling at Transavia follows the sequence illustrated below:
Figure 2.1 Establishing maintenance planning and scheduling within Transavia
This chapter will therefore begin with (1); with section 2.1 describing how the maintenance program is currently developed (by the engineering department). The implementation of the maintenance program is done by MP&S (2) and (3). This implementation process will be described in sections 2.2 to 2.5, and a conclusion will follow in section 2.7.
2.1 Maintenance Program (MP) Development
The initial source for the development of the OMP is the manufacturer’s Maintenance Planning Data (MPD) document. The MPD covers all manufacturer recommended tasks, the MSIs (developed following the MSG-3 philosophy). Within Transavia, the MP is documented in the Operator’s Maintenance Program (OMP). This document is an approved maintenance program (see Figure 2.2) meant to guide maintenance in a JAR-145 maintenance organisation (See also Appendix G.2). The Maintenance Programs section within the Engineering Department takes the responsibility for the development and amendment of the Transavia Maintenance Program (as illustrated in Figure 2.2 below). Each Maintenance Significant Item (MSI) or Structural Significant Item (SSI) from the MPD is translated into a Maintenance Requirement Item (MRI). The MRIs are limited by calendar days and/or flight hours and/or flight cycles. Principally, there is no difference between an MSI and a MRI. However, MRIs also encompass SSIs, and they do not include items listed in the MPD, not applicable to the Transavia fleet. Section 2.1.3 will go deeper into MSI/MRI features. All MRIs are evaluated and classified as ‘base maintenance MRIs’ or ‘line maintenance MRIs’. The evaluation process has already been mentioned in section 1.2, and is fully described in Appendix E.3.
Maintenance Program (MP)Development
(1)
Maintenance Planning
(2)
Maintenance Scheduling
(3)
MP&S departmentEngineering department
Maintenance Program (MP)Development
(1)
Maintenance Planning
(2)
Maintenance Scheduling
(3)
MP&S departmentEngineering department
Maintenance Planning Optimisation: B737 NG
12
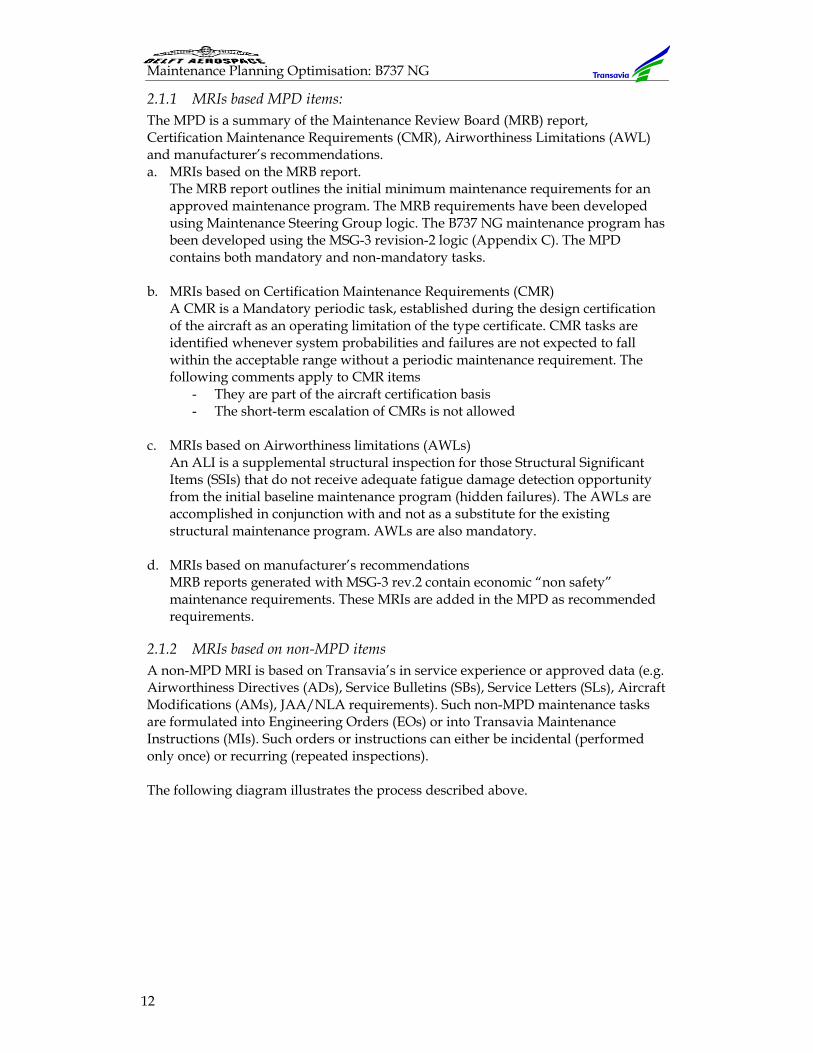
2.1.1 MRIs based MPD items: The MPD is a summary of the Maintenance Review Board (MRB) report, Certification Maintenance Requirements (CMR), Airworthiness Limitations (AWL) and manufacturer’s recommendations. a. MRIs based on the MRB report.
The MRB report outlines the initial minimum maintenance requirements for an approved maintenance program. The MRB requirements have been developed using Maintenance Steering Group logic. The B737 NG maintenance program has been developed using the MSG-3 revision-2 logic (Appendix C). The MPD contains both mandatory and non-mandatory tasks.
b. MRIs based on Certification Maintenance Requirements (CMR)
A CMR is a Mandatory periodic task, established during the design certification of the aircraft as an operating limitation of the type certificate. CMR tasks are identified whenever system probabilities and failures are not expected to fall within the acceptable range without a periodic maintenance requirement. The following comments apply to CMR items
- They are part of the aircraft certification basis - The short-term escalation of CMRs is not allowed
c. MRIs based on Airworthiness limitations (AWLs)
An ALI is a supplemental structural inspection for those Structural Significant Items (SSIs) that do not receive adequate fatigue damage detection opportunity from the initial baseline maintenance program (hidden failures). The AWLs are accomplished in conjunction with and not as a substitute for the existing structural maintenance program. AWLs are also mandatory.
d. MRIs based on manufacturer’s recommendations
MRB reports generated with MSG-3 rev.2 contain economic “non safety” maintenance requirements. These MRIs are added in the MPD as recommended requirements.
2.1.2 MRIs based on non-MPD items A non-MPD MRI is based on Transavia’s in service experience or approved data (e.g. Airworthiness Directives (ADs), Service Bulletins (SBs), Service Letters (SLs), Aircraft Modifications (AMs), JAA/NLA requirements). Such non-MPD maintenance tasks are formulated into Engineering Orders (EOs) or into Transavia Maintenance Instructions (MIs). Such orders or instructions can either be incidental (performed only once) or recurring (repeated inspections). The following diagram illustrates the process described above.
Chapter 2
13
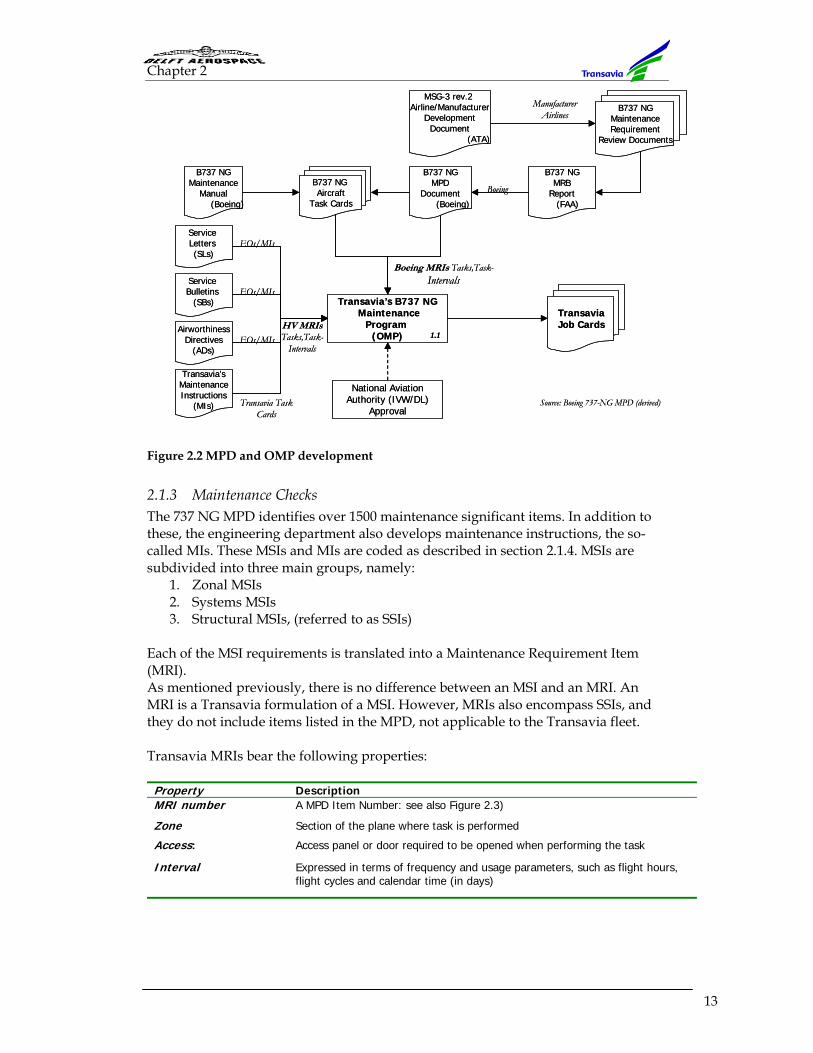
Figure 2.2 MPD and OMP development
2.1.3 Maintenance Checks The 737 NG MPD identifies over 1500 maintenance significant items. In addition to these, the engineering department also develops maintenance instructions, the so-called MIs. These MSIs and MIs are coded as described in section 2.1.4. MSIs are subdivided into three main groups, namely:
1. Zonal MSIs 2. Systems MSIs 3. Structural MSIs, (referred to as SSIs)
Each of the MSI requirements is translated into a Maintenance Requirement Item (MRI). As mentioned previously, there is no difference between an MSI and an MRI. An MRI is a Transavia formulation of a MSI. However, MRIs also encompass SSIs, and they do not include items listed in the MPD, not applicable to the Transavia fleet. Transavia MRIs bear the following properties:
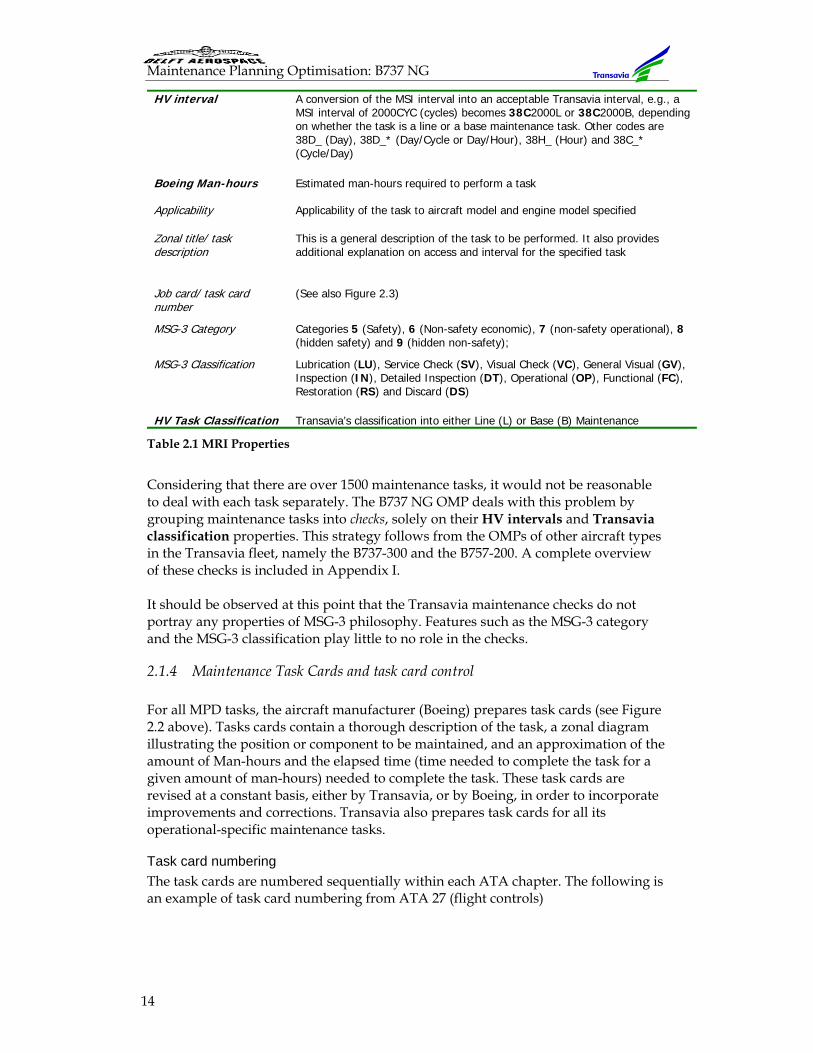
Property Description MRI number A MPD Item Number: see also Figure 2.3)
Zone Section of the plane where task is performed
Access: Access panel or door required to be opened when performing the task
Interval Expressed in terms of frequency and usage parameters, such as flight hours, flight cycles and calendar time (in days)
MSG-3 rev.2 Airline/Manufacturer
DevelopmentDocument
(ATA)
B737 NGMaintenanceRequirement
Review Documents
B737 NGMaintenance
Manual(Boeing)
Service Letters (SLs)
Transavia’s B737 NGMaintenance
Program (OMP)
TransaviaJob Cards
Service Bulletins
(SBs)
AirworthinessDirectives
(ADs)
Transavia’sMaintenanceInstructions
(MIs)
B737 NGMRB
Report(FAA)
B737 NGMPD
Document(Boeing)
B737 NG Aircraft
Task Cards
Manufacturer Airlines
Transavia Task Cards
Boeing
Boeing MRIs Tasks,Task-Intervals
HV MRIs Tasks,Task-
Intervals1.1
Source: Boeing 737-NG MPD (derived)National Aviation
Authority (IVW/DL)Approval
EOs/MIs
EOs/MIs
EOs/MIs
Maintenance Planning Optimisation: B737 NG
14
HV interval A conversion of the MSI interval into an acceptable Transavia interval, e.g., a MSI interval of 2000CYC (cycles) becomes 38C2000L or 38C2000B, depending on whether the task is a line or a base maintenance task. Other codes are 38D_ (Day), 38D_* (Day/Cycle or Day/Hour), 38H_ (Hour) and 38C_* (Cycle/Day)
Boeing Man-hours Estimated man-hours required to perform a task
Applicability Applicability of the task to aircraft model and engine model specified
Zonal title/ task description
This is a general description of the task to be performed. It also provides additional explanation on access and interval for the specified task
Job card/ task card number
(See also Figure 2.3)
MSG-3 Category Categories 5 (Safety), 6 (Non-safety economic), 7 (non-safety operational), 8 (hidden safety) and 9 (hidden non-safety);
MSG-3 Classification Lubrication (LU), Service Check (SV), Visual Check (VC), General Visual (GV), Inspection (IN), Detailed Inspection (DT), Operational (OP), Functional (FC), Restoration (RS) and Discard (DS)
HV Task Classification Transavia’s classification into either Line (L) or Base (B) Maintenance
Table 2.1 MRI Properties
Considering that there are over 1500 maintenance tasks, it would not be reasonable to deal with each task separately. The B737 NG OMP deals with this problem by grouping maintenance tasks into checks, solely on their HV intervals and Transavia classification properties. This strategy follows from the OMPs of other aircraft types in the Transavia fleet, namely the B737-300 and the B757-200. A complete overview of these checks is included in Appendix I. It should be observed at this point that the Transavia maintenance checks do not portray any properties of MSG-3 philosophy. Features such as the MSG-3 category and the MSG-3 classification play little to no role in the checks.
2.1.4 Maintenance Task Cards and task card control For all MPD tasks, the aircraft manufacturer (Boeing) prepares task cards (see Figure 2.2 above). Tasks cards contain a thorough description of the task, a zonal diagram illustrating the position or component to be maintained, and an approximation of the amount of Man-hours and the elapsed time (time needed to complete the task for a given amount of man-hours) needed to complete the task. These task cards are revised at a constant basis, either by Transavia, or by Boeing, in order to incorporate improvements and corrections. Transavia also prepares task cards for all its operational-specific maintenance tasks.
Task card numbering The task cards are numbered sequentially within each ATA chapter. The following is an example of task card numbering from ATA 27 (flight controls)
Chapter 2
15
Figure 2.3 Task card numbering
Maintenance Job cards For each task card, a corresponding job card is prepared by the engineering department, and filed in the METALS system. Job Cards are actually identical to task cards, only that job cards are used once, on the work floor, while task cards are used for reference purposes. Job cards do also have a provision for a signature and a stamp for the technician performing the maintenance task. The following job cards are in use:
1. Routine job cards Pertaining to MPD and non-MPD based recurring MRIs
2. Corrosion Prevention Control Program (CPCP) job cards These are, in fact, routine job cards, which are based on the manufacturer’s CPCP, as referred to in the MPD
3. Maintenance Instructions (MI) task cards - Pertaining to recurring MRIs which do not fit in a regular maintenance
inspection interval - Pertaining to non-recurring (one-time) inspections, which are mostly
initiated as a result of a SB or a SL evaluation. Such maintenance instructions do not form a part of the maintenance program, as they are non-recurring.
4. Modification job cards Pertaining to non-recurring (one-time) modification instructions, which are initiated as a result of an engineering evaluation, which leads to an Aircraft Modification (AM). Such modifications are not part of the maintenance program, as they are non-recurring.
2.1.5 The B737-300 MP vs. the B737 NG MP
Before the introduction of the 737NG aircraft (the subject of this research), Transavia was, and still is, operating the B 737-300 (classics). The B733 (classic) maintenance program differs from that of the next generation on a number of aspects. These aspects are tabulated below:
27 - 010 – 01 - 01
ATA Chapter
MRB Sequence Number
Indicates position where applicable: 00 – N/A
01 - LEFT
02 - RIGHT
03 - CENTRE
Task Card Sequence Number
MRI Number
27 - 010 – 01 - 01
ATA Chapter
MRB Sequence Number
Indicates position where applicable: 00 – N/A
01 - LEFT
02 - RIGHT
03 - CENTRE
Task Card Sequence Number
MRI Number
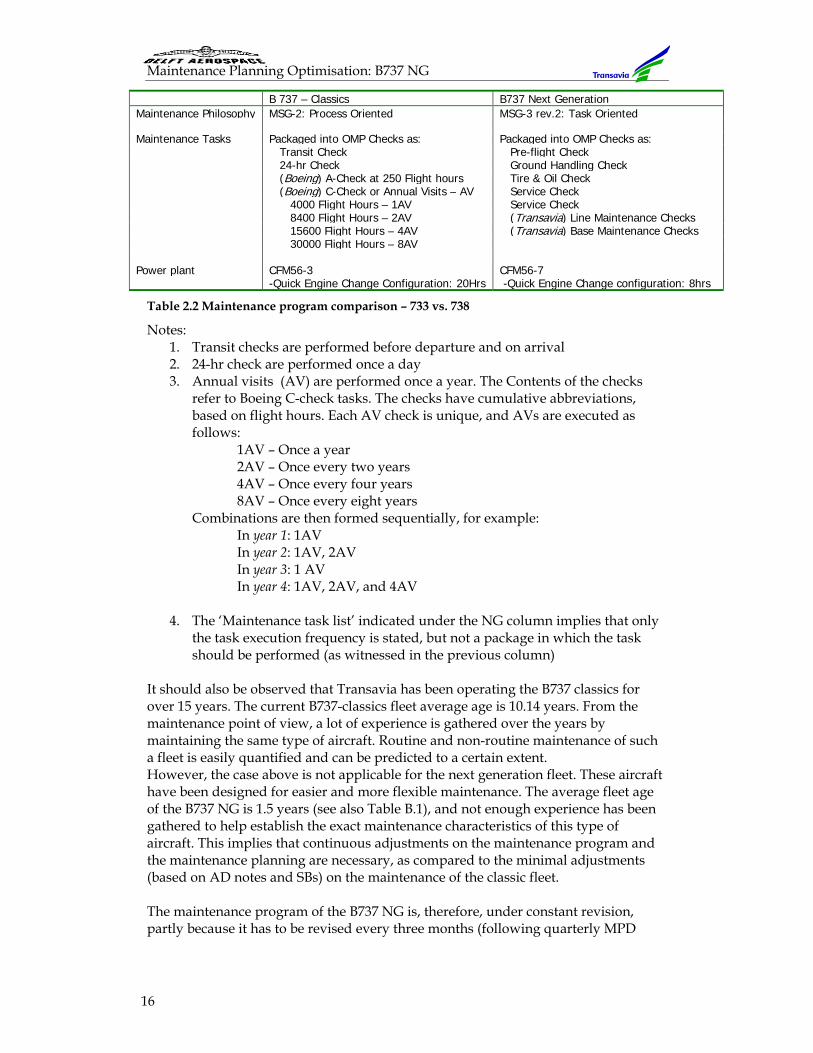
Maintenance Planning Optimisation: B737 NG
16
B 737 – Classics B737 Next Generation Maintenance Philosophy MSG-2: Process Oriented MSG-3 rev.2: Task Oriented Maintenance Tasks Packaged into OMP Checks as: Packaged into OMP Checks as: Transit Check Pre-flight Check 24-hr Check Ground Handling Check (Boeing) A-Check at 250 Flight hours Tire & Oil Check (Boeing) C-Check or Annual Visits – AV Service Check 4000 Flight Hours – 1AV Service Check 8400 Flight Hours – 2AV (Transavia) Line Maintenance Checks 15600 Flight Hours – 4AV (Transavia) Base Maintenance Checks 30000 Flight Hours – 8AV Power plant CFM56-3 CFM56-7 -Quick Engine Change Configuration: 20Hrs -Quick Engine Change configuration: 8hrs
Table 2.2 Maintenance program comparison – 733 vs. 738
Notes: 1. Transit checks are performed before departure and on arrival 2. 24-hr check are performed once a day 3. Annual visits (AV) are performed once a year. The Contents of the checks
refer to Boeing C-check tasks. The checks have cumulative abbreviations, based on flight hours. Each AV check is unique, and AVs are executed as follows:
1AV – Once a year 2AV – Once every two years 4AV – Once every four years 8AV – Once every eight years
Combinations are then formed sequentially, for example: In year 1: 1AV In year 2: 1AV, 2AV
In year 3: 1 AV In year 4: 1AV, 2AV, and 4AV
4. The ‘Maintenance task list’ indicated under the NG column implies that only
the task execution frequency is stated, but not a package in which the task should be performed (as witnessed in the previous column)
It should also be observed that Transavia has been operating the B737 classics for over 15 years. The current B737-classics fleet average age is 10.14 years. From the maintenance point of view, a lot of experience is gathered over the years by maintaining the same type of aircraft. Routine and non-routine maintenance of such a fleet is easily quantified and can be predicted to a certain extent. However, the case above is not applicable for the next generation fleet. These aircraft have been designed for easier and more flexible maintenance. The average fleet age of the B737 NG is 1.5 years (see also Table B.1), and not enough experience has been gathered to help establish the exact maintenance characteristics of this type of aircraft. This implies that continuous adjustments on the maintenance program and the maintenance planning are necessary, as compared to the minimal adjustments (based on AD notes and SBs) on the maintenance of the classic fleet. The maintenance program of the B737 NG is, therefore, under constant revision, partly because it has to be revised every three months (following quarterly MPD
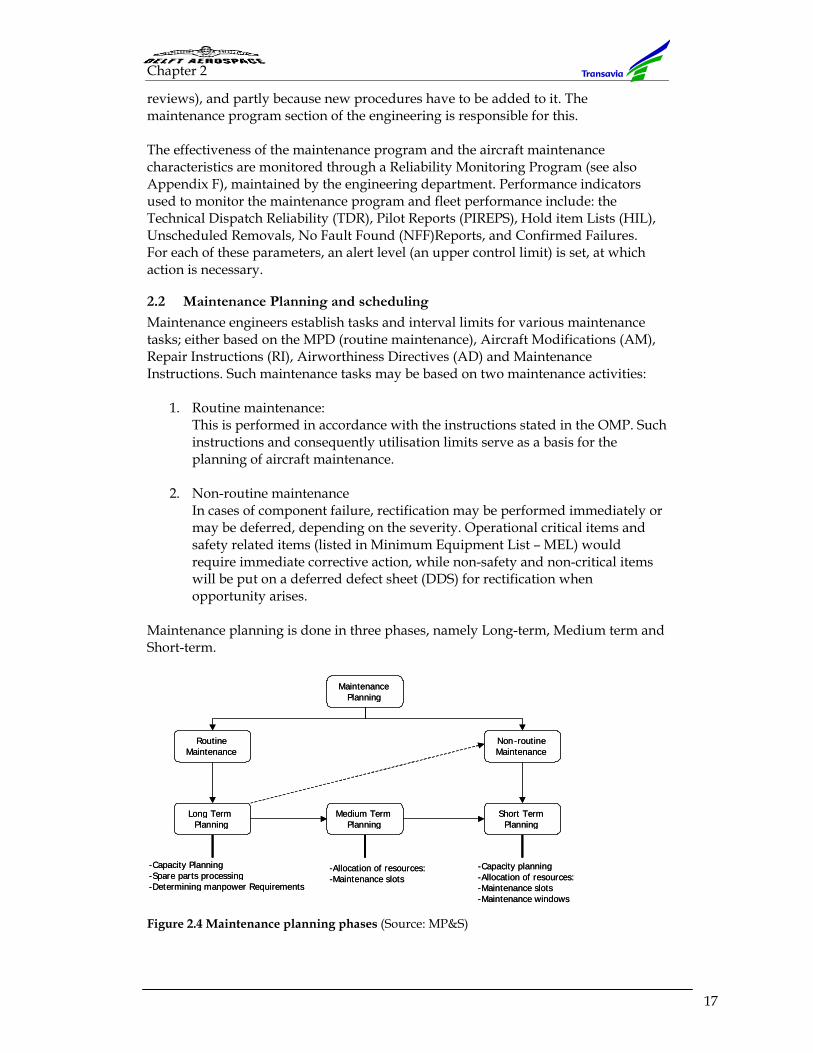
Chapter 2
17
reviews), and partly because new procedures have to be added to it. The maintenance program section of the engineering is responsible for this. The effectiveness of the maintenance program and the aircraft maintenance characteristics are monitored through a Reliability Monitoring Program (see also Appendix F), maintained by the engineering department. Performance indicators used to monitor the maintenance program and fleet performance include: the Technical Dispatch Reliability (TDR), Pilot Reports (PIREPS), Hold item Lists (HIL), Unscheduled Removals, No Fault Found (NFF)Reports, and Confirmed Failures. For each of these parameters, an alert level (an upper control limit) is set, at which action is necessary.
2.2 Maintenance Planning and scheduling
Maintenance engineers establish tasks and interval limits for various maintenance tasks; either based on the MPD (routine maintenance), Aircraft Modifications (AM), Repair Instructions (RI), Airworthiness Directives (AD) and Maintenance Instructions. Such maintenance tasks may be based on two maintenance activities:
1. Routine maintenance: This is performed in accordance with the instructions stated in the OMP. Such instructions and consequently utilisation limits serve as a basis for the planning of aircraft maintenance.
2. Non-routine maintenance
In cases of component failure, rectification may be performed immediately or may be deferred, depending on the severity. Operational critical items and safety related items (listed in Minimum Equipment List – MEL) would require immediate corrective action, while non-safety and non-critical items will be put on a deferred defect sheet (DDS) for rectification when opportunity arises.
Maintenance planning is done in three phases, namely Long-term, Medium term and Short-term.
Figure 2.4 Maintenance planning phases (Source: MP&S)
Maintenance Planning
Routine Maintenance
Non - routine Maintenance
Long Term Planning
Short Term Planning
Medium Term Planning
- Capacity Planning - Spare parts processing - Determining manpower Requirements
- Allocation of resources: - Maintenance slots
- Capacity planning - Allocation of resources: - Maintenance slots - Maintenance windows
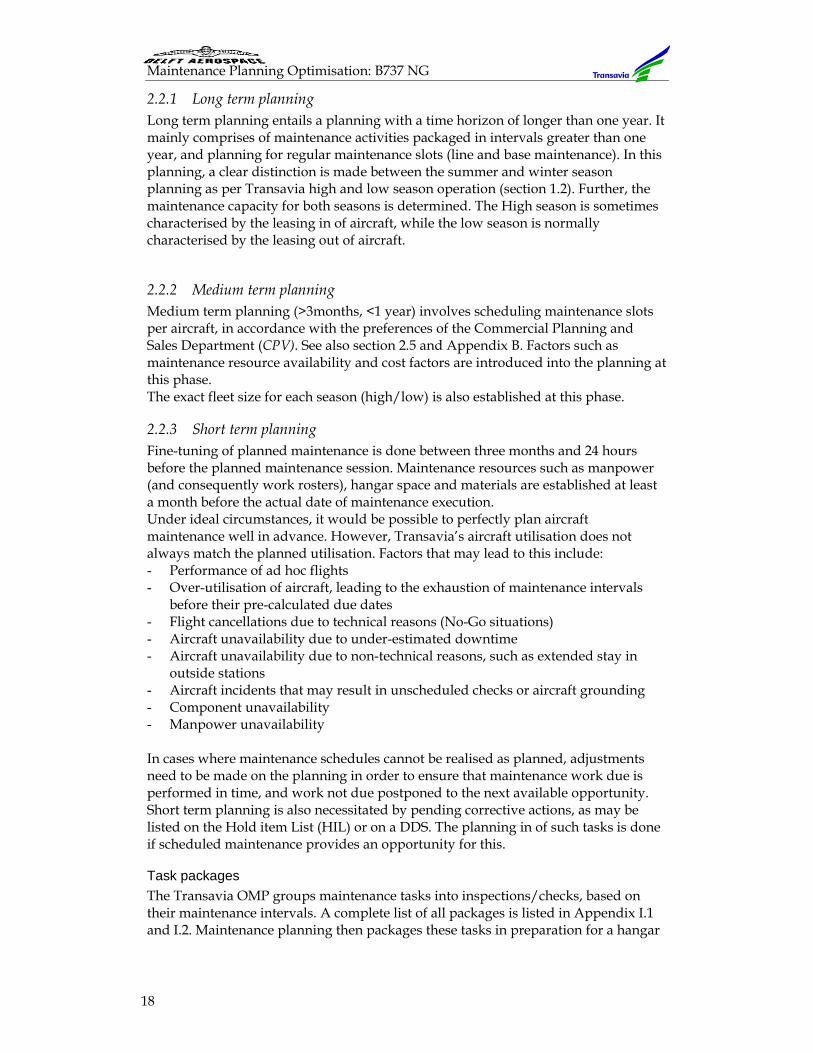
Maintenance Planning Optimisation: B737 NG
18
2.2.1 Long term planning Long term planning entails a planning with a time horizon of longer than one year. It mainly comprises of maintenance activities packaged in intervals greater than one year, and planning for regular maintenance slots (line and base maintenance). In this planning, a clear distinction is made between the summer and winter season planning as per Transavia high and low season operation (section 1.2). Further, the maintenance capacity for both seasons is determined. The High season is sometimes characterised by the leasing in of aircraft, while the low season is normally characterised by the leasing out of aircraft.
2.2.2 Medium term planning Medium term planning (>3months, <1 year) involves scheduling maintenance slots per aircraft, in accordance with the preferences of the Commercial Planning and Sales Department (CPV). See also section 2.5 and Appendix B. Factors such as maintenance resource availability and cost factors are introduced into the planning at this phase. The exact fleet size for each season (high/low) is also established at this phase.
2.2.3 Short term planning Fine-tuning of planned maintenance is done between three months and 24 hours before the planned maintenance session. Maintenance resources such as manpower (and consequently work rosters), hangar space and materials are established at least a month before the actual date of maintenance execution. Under ideal circumstances, it would be possible to perfectly plan aircraft maintenance well in advance. However, Transavia’s aircraft utilisation does not always match the planned utilisation. Factors that may lead to this include: - Performance of ad hoc flights - Over-utilisation of aircraft, leading to the exhaustion of maintenance intervals
before their pre-calculated due dates - Flight cancellations due to technical reasons (No-Go situations) - Aircraft unavailability due to under-estimated downtime - Aircraft unavailability due to non-technical reasons, such as extended stay in
outside stations - Aircraft incidents that may result in unscheduled checks or aircraft grounding - Component unavailability - Manpower unavailability In cases where maintenance schedules cannot be realised as planned, adjustments need to be made on the planning in order to ensure that maintenance work due is performed in time, and work not due postponed to the next available opportunity. Short term planning is also necessitated by pending corrective actions, as may be listed on the Hold item List (HIL) or on a DDS. The planning in of such tasks is done if scheduled maintenance provides an opportunity for this.
Task packages The Transavia OMP groups maintenance tasks into inspections/checks, based on their maintenance intervals. A complete list of all packages is listed in Appendix I.1 and I.2. Maintenance planning then packages these tasks in preparation for a hangar
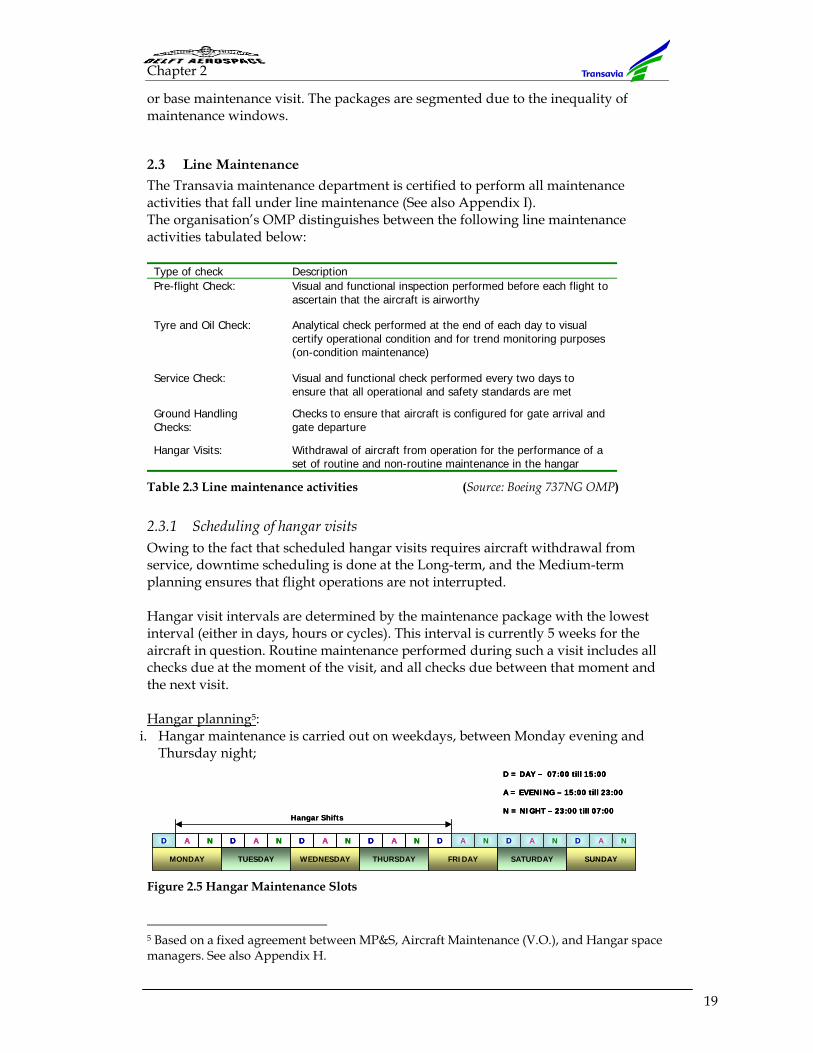
Chapter 2
19
or base maintenance visit. The packages are segmented due to the inequality of maintenance windows.
2.3 Line Maintenance
The Transavia maintenance department is certified to perform all maintenance activities that fall under line maintenance (See also Appendix I). The organisation’s OMP distinguishes between the following line maintenance activities tabulated below: Type of check Description Pre-flight Check: Visual and functional inspection performed before each flight to
ascertain that the aircraft is airworthy
Tyre and Oil Check: Analytical check performed at the end of each day to visual certify operational condition and for trend monitoring purposes (on-condition maintenance)
Service Check: Visual and functional check performed every two days to ensure that all operational and safety standards are met
Ground Handling Checks:
Checks to ensure that aircraft is configured for gate arrival and gate departure
Hangar Visits: Withdrawal of aircraft from operation for the performance of a set of routine and non-routine maintenance in the hangar
Table 2.3 Line maintenance activities (Source: Boeing 737NG OMP)
2.3.1 Scheduling of hangar visits Owing to the fact that scheduled hangar visits requires aircraft withdrawal from service, downtime scheduling is done at the Long-term, and the Medium-term planning ensures that flight operations are not interrupted. Hangar visit intervals are determined by the maintenance package with the lowest interval (either in days, hours or cycles). This interval is currently 5 weeks for the aircraft in question. Routine maintenance performed during such a visit includes all checks due at the moment of the visit, and all checks due between that moment and the next visit. Hangar planning5:
i. Hangar maintenance is carried out on weekdays, between Monday evening and Thursday night;
Figure 2.5 Hangar Maintenance Slots
5 Based on a fixed agreement between MP&S, Aircraft Maintenance (V.O.), and Hangar space managers. See also Appendix H.
Hangar Shifts
MONDAY THURSDAYTUESDAY WEDNESDAY SUNDAYSATURDAYFRIDAY
D A N
D = DAY – 07:00 till 15:00
A = EVENING – 15:00 till 23:00
N = NIGHT – 23:00 till 07:00
D A N D A ND A ND A ND A ND A N
Hangar Shifts
MONDAY THURSDAYTUESDAY WEDNESDAY SUNDAYSATURDAYFRIDAY
D A ND A N
D = DAY – 07:00 till 15:00
A = EVENING – 15:00 till 23:00
N = NIGHT – 23:00 till 07:00
D = DAY – 07:00 till 15:00
A = EVENING – 15:00 till 23:00
N = NIGHT – 23:00 till 07:00
D A ND A N D A ND A ND A ND A ND A ND A ND A N
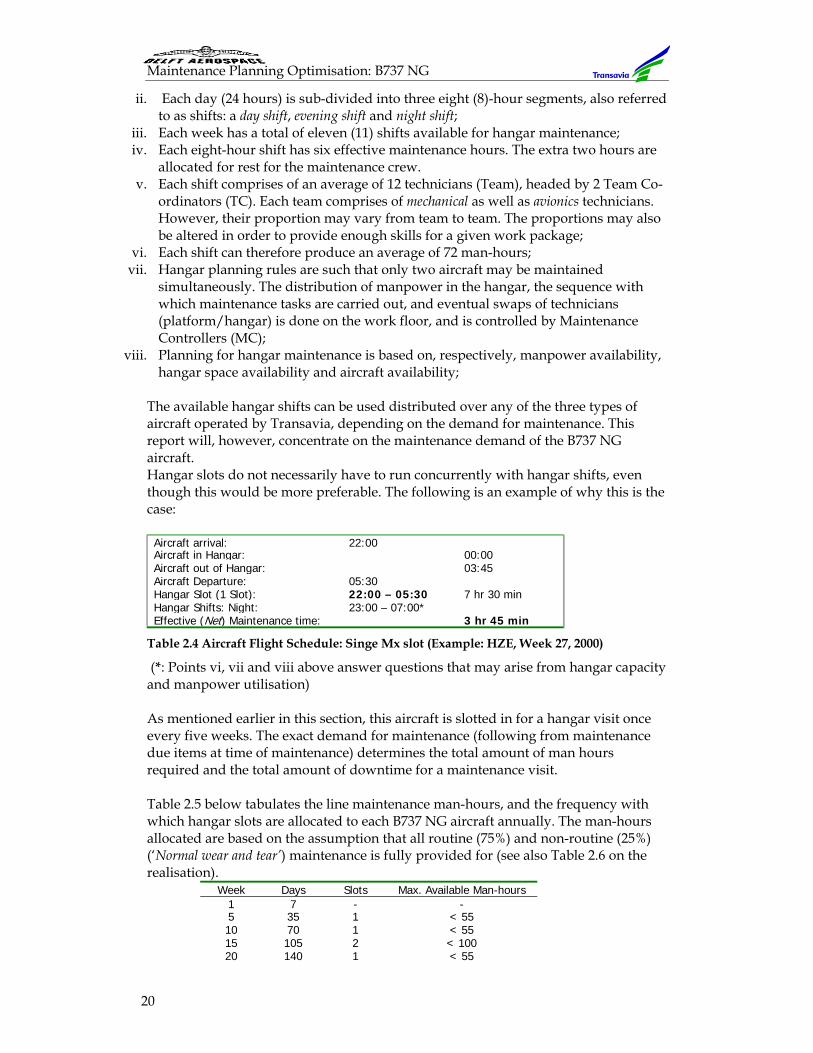
Maintenance Planning Optimisation: B737 NG
20
ii. Each day (24 hours) is sub-divided into three eight (8)-hour segments, also referred to as shifts: a day shift, evening shift and night shift;
iii. Each week has a total of eleven (11) shifts available for hangar maintenance; iv. Each eight-hour shift has six effective maintenance hours. The extra two hours are
allocated for rest for the maintenance crew. v. Each shift comprises of an average of 12 technicians (Team), headed by 2 Team Co-
ordinators (TC). Each team comprises of mechanical as well as avionics technicians. However, their proportion may vary from team to team. The proportions may also be altered in order to provide enough skills for a given work package;
vi. Each shift can therefore produce an average of 72 man-hours; vii. Hangar planning rules are such that only two aircraft may be maintained
simultaneously. The distribution of manpower in the hangar, the sequence with which maintenance tasks are carried out, and eventual swaps of technicians (platform/hangar) is done on the work floor, and is controlled by Maintenance Controllers (MC);
viii. Planning for hangar maintenance is based on, respectively, manpower availability, hangar space availability and aircraft availability;
The available hangar shifts can be used distributed over any of the three types of aircraft operated by Transavia, depending on the demand for maintenance. This report will, however, concentrate on the maintenance demand of the B737 NG aircraft. Hangar slots do not necessarily have to run concurrently with hangar shifts, even though this would be more preferable. The following is an example of why this is the case: Aircraft arrival: 22:00Aircraft in Hangar: 00:00Aircraft out of Hangar: 03:45Aircraft Departure: 05:30Hangar Slot (1 Slot): 22:00 – 05:30 7 hr 30 minHangar Shifts: Night: 23:00 – 07:00*Effective (Net) Maintenance time: 3 hr 45 min
Table 2.4 Aircraft Flight Schedule: Singe Mx slot (Example: HZE, Week 27, 2000)
(*: Points vi, vii and viii above answer questions that may arise from hangar capacity and manpower utilisation) As mentioned earlier in this section, this aircraft is slotted in for a hangar visit once every five weeks. The exact demand for maintenance (following from maintenance due items at time of maintenance) determines the total amount of man hours required and the total amount of downtime for a maintenance visit. Table 2.5 below tabulates the line maintenance man-hours, and the frequency with which hangar slots are allocated to each B737 NG aircraft annually. The man-hours allocated are based on the assumption that all routine (75%) and non-routine (25%) (‘Normal wear and tear’) maintenance is fully provided for (see also Table 2.6 on the realisation).
Week Days Slots Max. Available Man-hours 1 7 - -5 35 1 < 5510 70 1 < 5515 105 2 < 10020 140 1 < 55
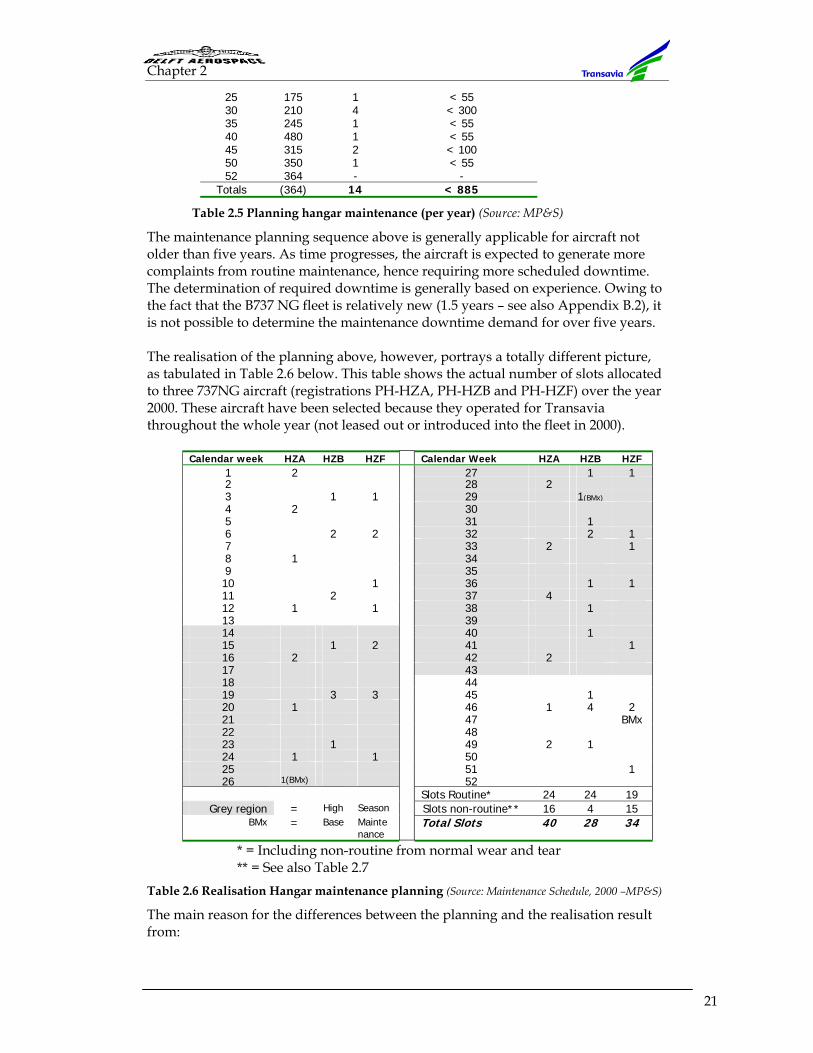
Chapter 2
21
25 175 1 < 5530 210 4 < 30035 245 1 < 5540 480 1 < 5545 315 2 < 10050 350 1 < 5552 364 - -
Totals (364) 14 < 885
Table 2.5 Planning hangar maintenance (per year) (Source: MP&S)
The maintenance planning sequence above is generally applicable for aircraft not older than five years. As time progresses, the aircraft is expected to generate more complaints from routine maintenance, hence requiring more scheduled downtime. The determination of required downtime is generally based on experience. Owing to the fact that the B737 NG fleet is relatively new (1.5 years – see also Appendix B.2), it is not possible to determine the maintenance downtime demand for over five years. The realisation of the planning above, however, portrays a totally different picture, as tabulated in Table 2.6 below. This table shows the actual number of slots allocated to three 737NG aircraft (registrations PH-HZA, PH-HZB and PH-HZF) over the year 2000. These aircraft have been selected because they operated for Transavia throughout the whole year (not leased out or introduced into the fleet in 2000).
Calendar week HZA HZB HZF Calendar Week HZA HZB HZF 1 2 27 1 1 2 28 2 3 1 1 29 1(BMx) 4 2 30 5 31 1 6 2 2 32 2 1 7 33 2 1 8 1 34 9 35 10 1 36 1 1 11 2 37 4 12 1 1 38 1 13 39 14 40 1 15 1 2 41 1 16 2 42 2 17 43 18 44 19 3 3 45 1 20 1 46 1 4 2 21 47 BMx 22 48 23 1 49 2 1 24 1 1 50 25 51 1 26 1(BMx) 52
Slots Routine* 24 24 19 Grey region = High Season Slots non-routine** 16 4 15
BMx = Base Maintenance
Total Slots 40 28 34
* = Including non-routine from normal wear and tear ** = See also Table 2.7 Table 2.6 Realisation Hangar maintenance planning (Source: Maintenance Schedule, 2000 –MP&S)
The main reason for the differences between the planning and the realisation result from:
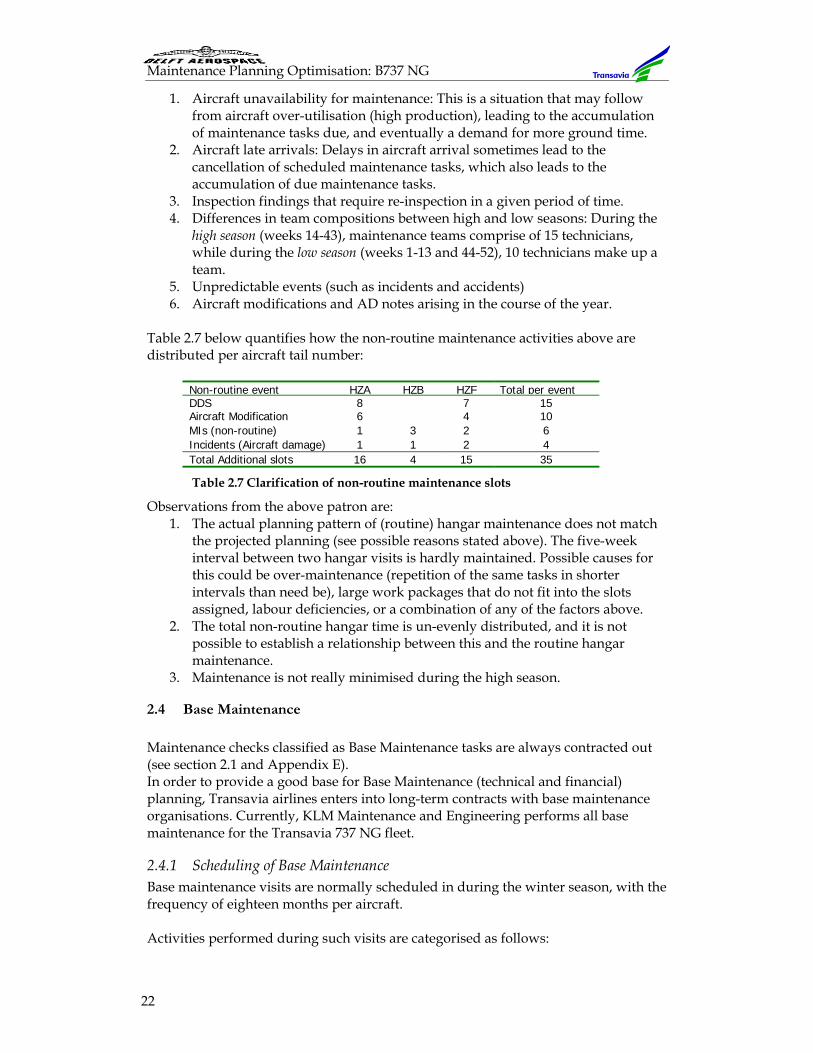
Maintenance Planning Optimisation: B737 NG
22
1. Aircraft unavailability for maintenance: This is a situation that may follow from aircraft over-utilisation (high production), leading to the accumulation of maintenance tasks due, and eventually a demand for more ground time.
2. Aircraft late arrivals: Delays in aircraft arrival sometimes lead to the cancellation of scheduled maintenance tasks, which also leads to the accumulation of due maintenance tasks.
3. Inspection findings that require re-inspection in a given period of time. 4. Differences in team compositions between high and low seasons: During the
high season (weeks 14-43), maintenance teams comprise of 15 technicians, while during the low season (weeks 1-13 and 44-52), 10 technicians make up a team.
5. Unpredictable events (such as incidents and accidents) 6. Aircraft modifications and AD notes arising in the course of the year.
Table 2.7 below quantifies how the non-routine maintenance activities above are distributed per aircraft tail number:
Non-routine event HZA HZB HZF Total per event DDS 8 7 15Aircraft Modification 6 4 10 MIs (non-routine) 1 3 2 6 Incidents (Aircraft damage) 1 1 2 4 Total Additional slots 16 4 15 35
Table 2.7 Clarification of non-routine maintenance slots
Observations from the above patron are: 1. The actual planning pattern of (routine) hangar maintenance does not match
the projected planning (see possible reasons stated above). The five-week interval between two hangar visits is hardly maintained. Possible causes for this could be over-maintenance (repetition of the same tasks in shorter intervals than need be), large work packages that do not fit into the slots assigned, labour deficiencies, or a combination of any of the factors above.
2. The total non-routine hangar time is un-evenly distributed, and it is not possible to establish a relationship between this and the routine hangar maintenance.
3. Maintenance is not really minimised during the high season.
2.4 Base Maintenance
Maintenance checks classified as Base Maintenance tasks are always contracted out (see section 2.1 and Appendix E). In order to provide a good base for Base Maintenance (technical and financial) planning, Transavia airlines enters into long-term contracts with base maintenance organisations. Currently, KLM Maintenance and Engineering performs all base maintenance for the Transavia 737 NG fleet.
2.4.1 Scheduling of Base Maintenance Base maintenance visits are normally scheduled in during the winter season, with the frequency of eighteen months per aircraft. Activities performed during such visits are categorised as follows:
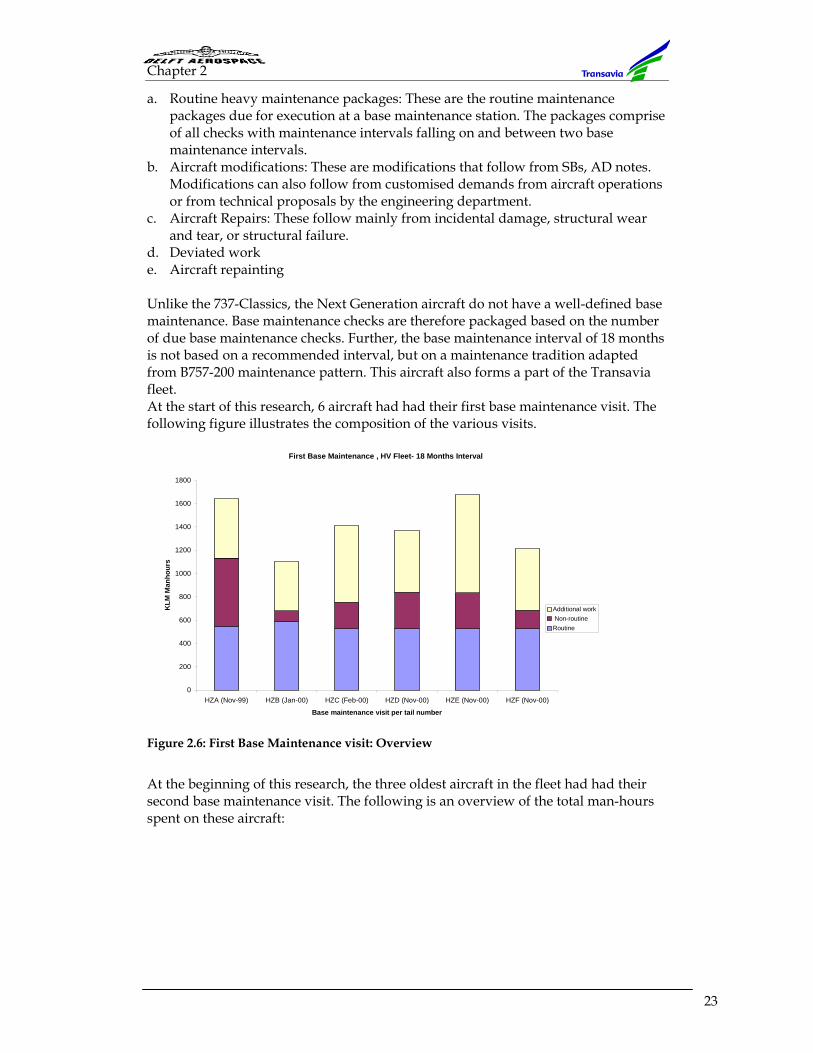
Chapter 2
23
a. Routine heavy maintenance packages: These are the routine maintenance packages due for execution at a base maintenance station. The packages comprise of all checks with maintenance intervals falling on and between two base maintenance intervals.
b. Aircraft modifications: These are modifications that follow from SBs, AD notes. Modifications can also follow from customised demands from aircraft operations or from technical proposals by the engineering department.
c. Aircraft Repairs: These follow mainly from incidental damage, structural wear and tear, or structural failure.
d. Deviated work e. Aircraft repainting
Unlike the 737-Classics, the Next Generation aircraft do not have a well-defined base maintenance. Base maintenance checks are therefore packaged based on the number of due base maintenance checks. Further, the base maintenance interval of 18 months is not based on a recommended interval, but on a maintenance tradition adapted from B757-200 maintenance pattern. This aircraft also forms a part of the Transavia fleet. At the start of this research, 6 aircraft had had their first base maintenance visit. The following figure illustrates the composition of the various visits.
Figure 2.6: First Base Maintenance visit: Overview
At the beginning of this research, the three oldest aircraft in the fleet had had their second base maintenance visit. The following is an overview of the total man-hours spent on these aircraft:
First Base Maintenance , HV Fleet- 18 Months Interval
0
200
400
600
800
1000
1200
1400
1600
1800
HZA (Nov-99) HZB (Jan-00) HZC (Feb-00) HZD (Nov-00) HZE (Nov-00) HZF (Nov-00)
Base maintenance visit per tail number
KLM
Man
hour
s
Additional work Non-routineRoutine
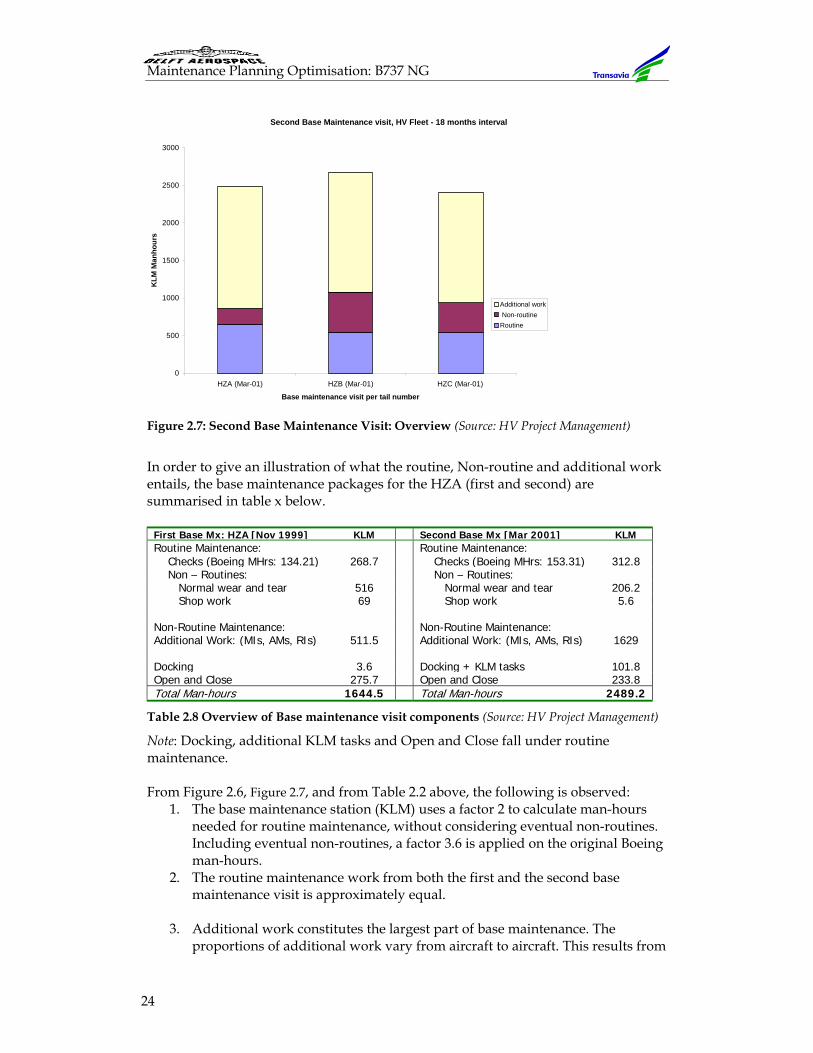
Maintenance Planning Optimisation: B737 NG
24
Figure 2.7: Second Base Maintenance Visit: Overview (Source: HV Project Management)
In order to give an illustration of what the routine, Non-routine and additional work entails, the base maintenance packages for the HZA (first and second) are summarised in table x below.
First Base Mx: HZA [Nov 1999] KLM Second Base Mx [Mar 2001] KLM Routine Maintenance: Routine Maintenance: Checks (Boeing MHrs: 134.21) 268.7 Checks (Boeing MHrs: 153.31) 312.8 Non – Routines: Non – Routines: Normal wear and tear 516 Normal wear and tear 206.2 Shop work 69 Shop work 5.6 Non-Routine Maintenance: Non-Routine Maintenance: Additional Work: (MIs, AMs, RIs) 511.5 Additional Work: (MIs, AMs, RIs) 1629 Docking 3.6 Docking + KLM tasks 101.8 Open and Close 275.7 Open and Close 233.8 Total Man-hours 1644.5 Total Man-hours 2489.2
Table 2.8 Overview of Base maintenance visit components (Source: HV Project Management)
Note: Docking, additional KLM tasks and Open and Close fall under routine maintenance. From Figure 2.6, Figure 2.7, and from Table 2.2 above, the following is observed:
1. The base maintenance station (KLM) uses a factor 2 to calculate man-hours needed for routine maintenance, without considering eventual non-routines. Including eventual non-routines, a factor 3.6 is applied on the original Boeing man-hours.
2. The routine maintenance work from both the first and the second base maintenance visit is approximately equal.
3. Additional work constitutes the largest part of base maintenance. The
proportions of additional work vary from aircraft to aircraft. This results from
Second Base Maintenance visit, HV Fleet - 18 months interval
0
500
1000
1500
2000
2500
3000
HZA (Mar-01) HZB (Mar-01) HZC (Mar-01)
Base maintenance visit per tail number
KLM
Man
hour
s
Additional work Non-routineRoutine
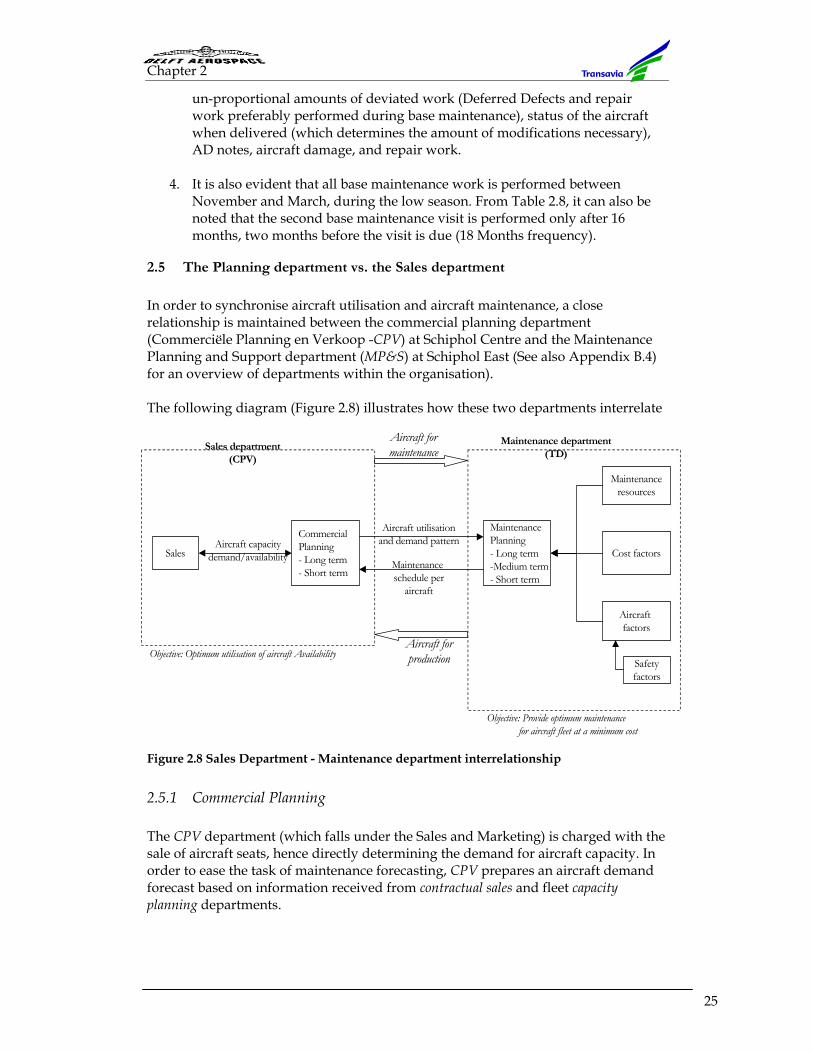
Chapter 2
25
un-proportional amounts of deviated work (Deferred Defects and repair work preferably performed during base maintenance), status of the aircraft when delivered (which determines the amount of modifications necessary), AD notes, aircraft damage, and repair work.
4. It is also evident that all base maintenance work is performed between
November and March, during the low season. From Table 2.8, it can also be noted that the second base maintenance visit is performed only after 16 months, two months before the visit is due (18 Months frequency).
2.5 The Planning department vs. the Sales department
In order to synchronise aircraft utilisation and aircraft maintenance, a close relationship is maintained between the commercial planning department (Commerciële Planning en Verkoop -CPV) at Schiphol Centre and the Maintenance Planning and Support department (MP&S) at Schiphol East (See also Appendix B.4) for an overview of departments within the organisation). The following diagram (Figure 2.8) illustrates how these two departments interrelate
Figure 2.8 Sales Department - Maintenance department interrelationship
2.5.1 Commercial Planning The CPV department (which falls under the Sales and Marketing) is charged with the sale of aircraft seats, hence directly determining the demand for aircraft capacity. In order to ease the task of maintenance forecasting, CPV prepares an aircraft demand forecast based on information received from contractual sales and fleet capacity planning departments.
Aircraft utilisationand demand pattern
Maintenance schedule per
aircraft
CommercialPlanning- Long term- Short term
Sales
MaintenancePlanning- Long term-Medium term- Short term
Safetyfactors
Aircraft factors
Cost factors
Maintenanceresources
Aircraft formaintenance
Aircraft forproduction
Sales department(CPV)
Maintenance department(TD)
Objective: Optimum utilisation of aircraft Availability
Objective: Provide optimum maintenance for aircraft fleet at a minimum cost
Aircraft capacitydemand/availability
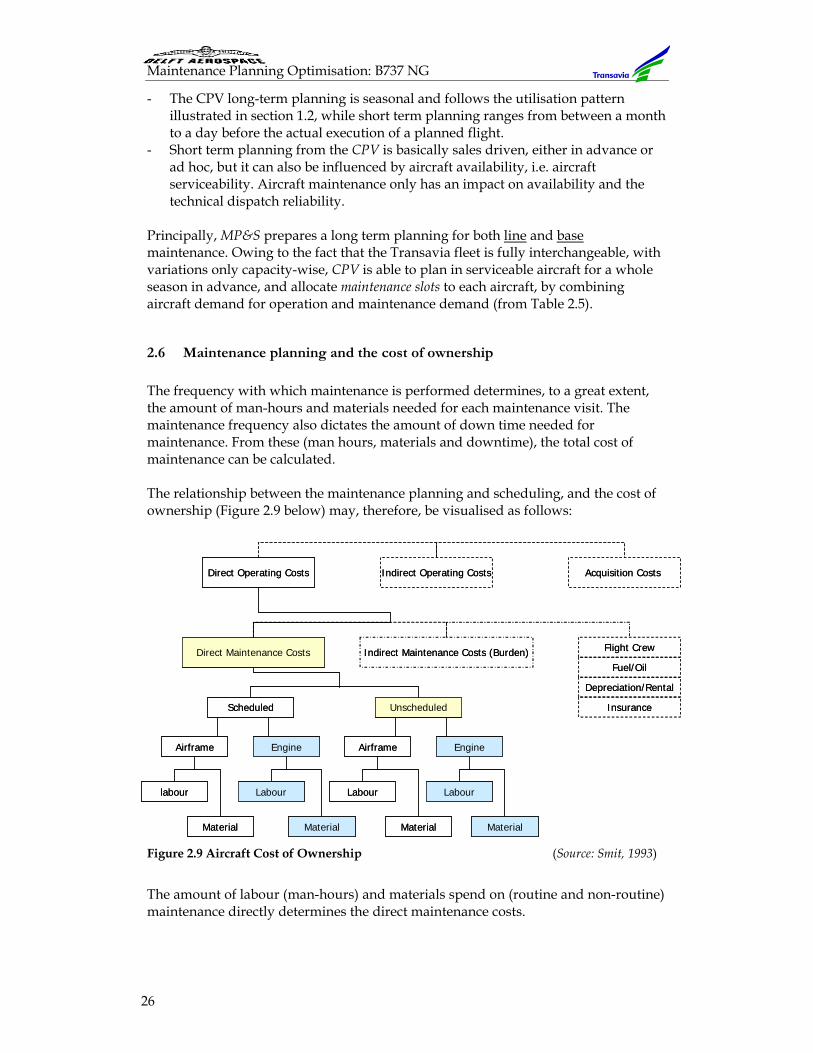
Maintenance Planning Optimisation: B737 NG
26
- The CPV long-term planning is seasonal and follows the utilisation pattern illustrated in section 1.2, while short term planning ranges from between a month to a day before the actual execution of a planned flight.
- Short term planning from the CPV is basically sales driven, either in advance or ad hoc, but it can also be influenced by aircraft availability, i.e. aircraft serviceability. Aircraft maintenance only has an impact on availability and the technical dispatch reliability.
Principally, MP&S prepares a long term planning for both line and base maintenance. Owing to the fact that the Transavia fleet is fully interchangeable, with variations only capacity-wise, CPV is able to plan in serviceable aircraft for a whole season in advance, and allocate maintenance slots to each aircraft, by combining aircraft demand for operation and maintenance demand (from Table 2.5).
2.6 Maintenance planning and the cost of ownership
The frequency with which maintenance is performed determines, to a great extent, the amount of man-hours and materials needed for each maintenance visit. The maintenance frequency also dictates the amount of down time needed for maintenance. From these (man hours, materials and downtime), the total cost of maintenance can be calculated. The relationship between the maintenance planning and scheduling, and the cost of ownership (Figure 2.9 below) may, therefore, be visualised as follows:
Figure 2.9 Aircraft Cost of Ownership (Source: Smit, 1993)
The amount of labour (man-hours) and materials spend on (routine and non-routine) maintenance directly determines the direct maintenance costs.
Direct Operating Costs Indirect Operating Costs Acquisition Costs
Indirect Maintenance Costs (Burden) Flight Crew
Insurance
Depreciation/Rental
Fuel/Oil
Scheduled
Airframe
Unscheduled
Engine Airframe Engine
labour Labour Labour Labour
Material Material Material Material
Direct Maintenance Costs
Direct Operating Costs Indirect Operating Costs Acquisition Costs
Indirect Maintenance Costs (Burden) Flight Crew
Insurance
Depreciation/Rental
Fuel/Oil
Scheduled
Airframe
Unscheduled
Engine Airframe Engine
labour Labour Labour Labour
Material Material Material Material
Direct Maintenance Costs
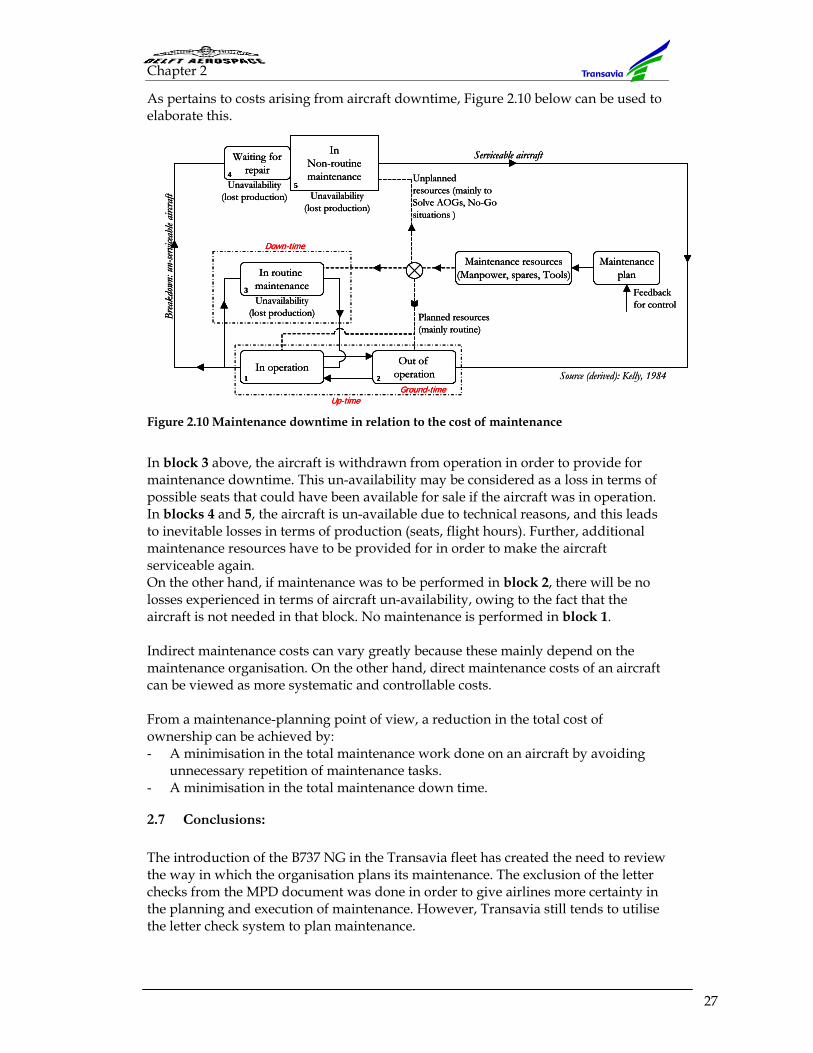
Chapter 2
27
As pertains to costs arising from aircraft downtime, Figure 2.10 below can be used to elaborate this.
Figure 2.10 Maintenance downtime in relation to the cost of maintenance
In block 3 above, the aircraft is withdrawn from operation in order to provide for maintenance downtime. This un-availability may be considered as a loss in terms of possible seats that could have been available for sale if the aircraft was in operation. In blocks 4 and 5, the aircraft is un-available due to technical reasons, and this leads to inevitable losses in terms of production (seats, flight hours). Further, additional maintenance resources have to be provided for in order to make the aircraft serviceable again. On the other hand, if maintenance was to be performed in block 2, there will be no losses experienced in terms of aircraft un-availability, owing to the fact that the aircraft is not needed in that block. No maintenance is performed in block 1. Indirect maintenance costs can vary greatly because these mainly depend on the maintenance organisation. On the other hand, direct maintenance costs of an aircraft can be viewed as more systematic and controllable costs. From a maintenance-planning point of view, a reduction in the total cost of ownership can be achieved by: - A minimisation in the total maintenance work done on an aircraft by avoiding
unnecessary repetition of maintenance tasks. - A minimisation in the total maintenance down time.
2.7 Conclusions:
The introduction of the B737 NG in the Transavia fleet has created the need to review the way in which the organisation plans its maintenance. The exclusion of the letter checks from the MPD document was done in order to give airlines more certainty in the planning and execution of maintenance. However, Transavia still tends to utilise the letter check system to plan maintenance.
InNon-routinemaintenance
Feedbackfor control
Unplannedresources (mainly toSolve AOGs, No-Gosituations )
Unavailability(lost production)
Unavailability(lost production)
Unavailability(lost production) Planned resources
(mainly routine)
Waiting forrepair
Out of operationIn operation
In routinemaintenance
Brea
kdow
n: un
-servi
ceable
airc
raft
Serviceable aircraft
Up-time
1 2
3
45
Down-time
Ground-time
Maintenance resources(Manpower, spares, Tools)
Maintenanceplan
Source (derived): Kelly, 1984
InNon-routinemaintenance
Feedbackfor control
Unplannedresources (mainly toSolve AOGs, No-Gosituations )
Unavailability(lost production)
Unavailability(lost production)
Unavailability(lost production) Planned resources
(mainly routine)
Waiting forrepair
Out of operationIn operation
In routinemaintenance
Brea
kdow
n: un
-servi
ceable
airc
raft
Serviceable aircraft
Up-time
1 2
3
45
Down-time
Ground-time
Maintenance resources(Manpower, spares, Tools)
Maintenanceplan
Source (derived): Kelly, 1984
Maintenance Planning Optimisation: B737 NG
28
There is, therefore, a need to radically change the mentality and the traditions of maintenance program development and maintenance planning and scheduling in order to utilise fully the advantages of Next Generation aircraft, which should lead to a reduction in the amount of maintenance performed on the fleet
The engineering department of Transavia has developed a new approach toward maintenance program development by evaluating all MRIs and classifying them to either line or base maintenance MRIs. This classification is based on the contents and requirements of each MRI, instead of just looking at the MRI interval. The task is now upon the maintenance planning (and consequently this assignment), to optimally plan maintenance tasks, in order to optimise maintenance execution and to minimise maintenance costs.
In short:
1. There is a need to determine the composition and the contents of maintenance packages for both line and base maintenance (Main question 1.3.B)
2. There is a need to determine optimum intervals for both line and base maintenance scheduling (Main question 1.3.B)
3. There is a need to quantify the gains made from (1) and (2) above, in terms of cost reduction and improved maintenance effectiveness (Main question 1.3.C)
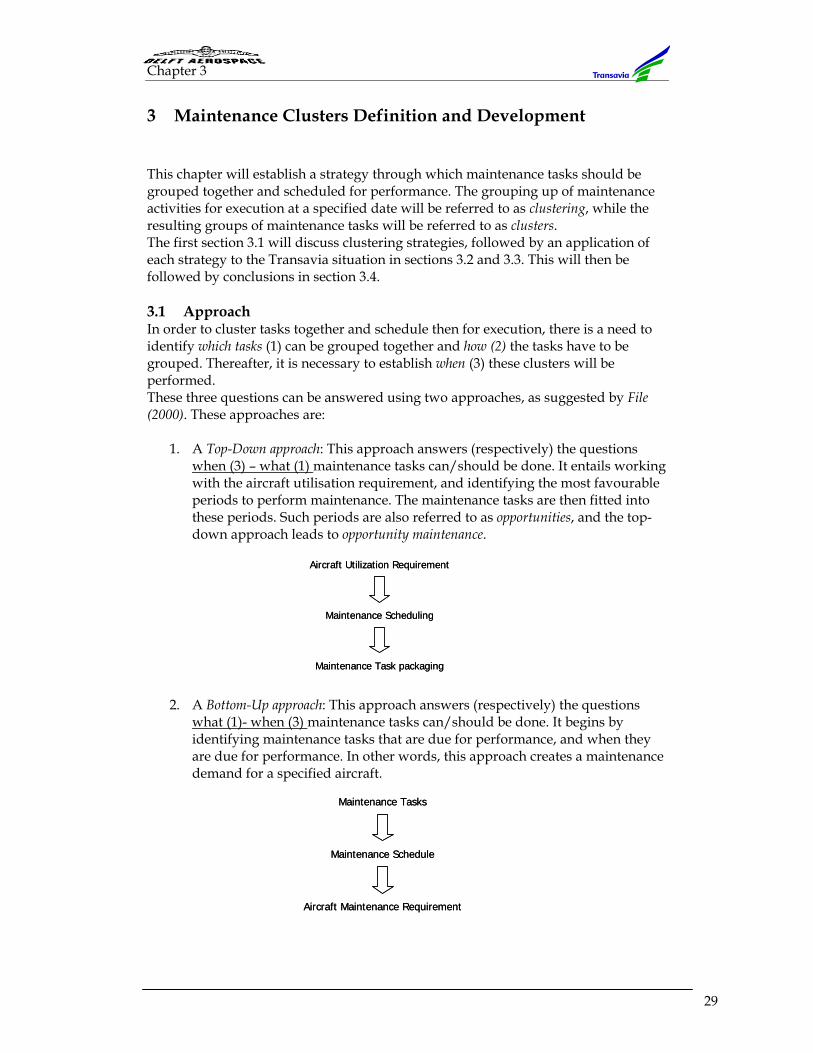
Chapter 3
29
3 Maintenance Clusters Definition and Development
This chapter will establish a strategy through which maintenance tasks should be grouped together and scheduled for performance. The grouping up of maintenance activities for execution at a specified date will be referred to as clustering, while the resulting groups of maintenance tasks will be referred to as clusters. The first section 3.1 will discuss clustering strategies, followed by an application of each strategy to the Transavia situation in sections 3.2 and 3.3. This will then be followed by conclusions in section 3.4. 3.1 Approach In order to cluster tasks together and schedule then for execution, there is a need to identify which tasks (1) can be grouped together and how (2) the tasks have to be grouped. Thereafter, it is necessary to establish when (3) these clusters will be performed. These three questions can be answered using two approaches, as suggested by File (2000). These approaches are:
1. A Top-Down approach: This approach answers (respectively) the questions when (3) – what (1) maintenance tasks can/should be done. It entails working with the aircraft utilisation requirement, and identifying the most favourable periods to perform maintenance. The maintenance tasks are then fitted into these periods. Such periods are also referred to as opportunities, and the top-down approach leads to opportunity maintenance.
2. A Bottom-Up approach: This approach answers (respectively) the questions
what (1)- when (3) maintenance tasks can/should be done. It begins by identifying maintenance tasks that are due for performance, and when they are due for performance. In other words, this approach creates a maintenance demand for a specified aircraft.
Aircraft Utilization Requirement
Maintenance Scheduling
Maintenance Task packaging
Aircraft Utilization Requirement
Maintenance Scheduling
Maintenance Task packaging
Maintenance Tasks
Maintenance Schedule
Aircraft Maintenance Requirement
Maintenance Tasks
Maintenance Schedule
Aircraft Maintenance Requirement
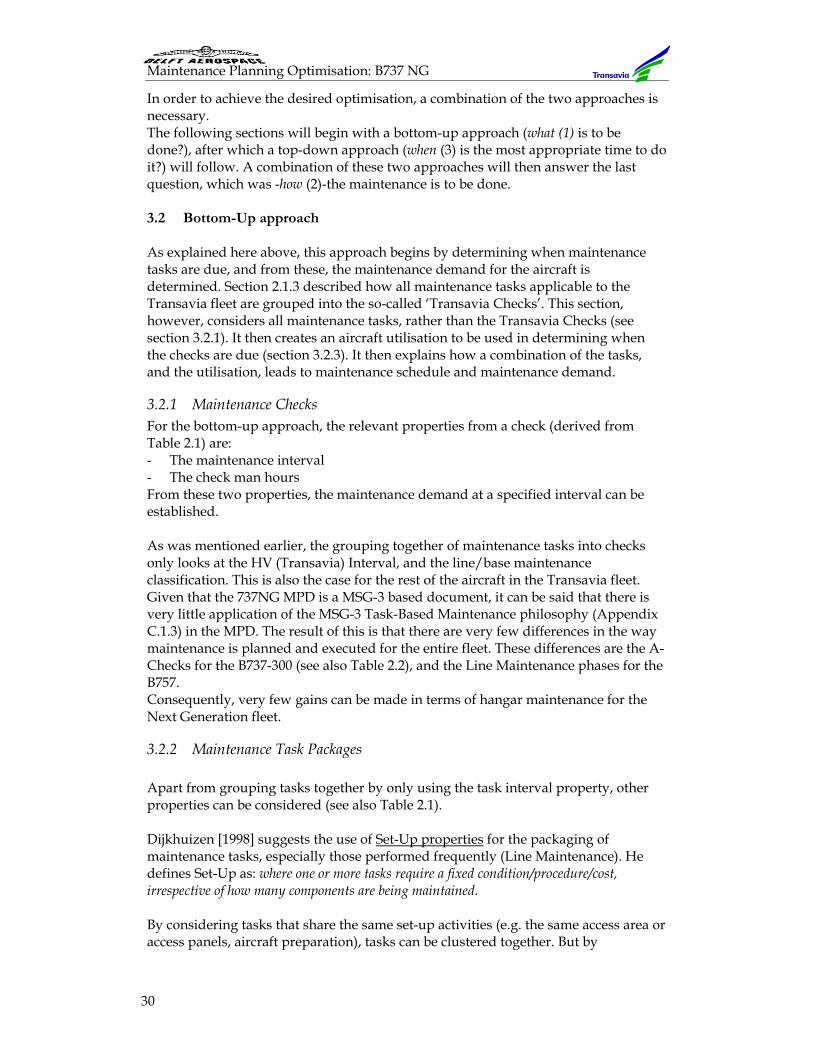
Maintenance Planning Optimisation: B737 NG
30
In order to achieve the desired optimisation, a combination of the two approaches is necessary. The following sections will begin with a bottom-up approach (what (1) is to be done?), after which a top-down approach (when (3) is the most appropriate time to do it?) will follow. A combination of these two approaches will then answer the last question, which was -how (2)-the maintenance is to be done. 3.2 Bottom-Up approach As explained here above, this approach begins by determining when maintenance tasks are due, and from these, the maintenance demand for the aircraft is determined. Section 2.1.3 described how all maintenance tasks applicable to the Transavia fleet are grouped into the so-called ‘Transavia Checks’. This section, however, considers all maintenance tasks, rather than the Transavia Checks (see section 3.2.1). It then creates an aircraft utilisation to be used in determining when the checks are due (section 3.2.3). It then explains how a combination of the tasks, and the utilisation, leads to maintenance schedule and maintenance demand.
3.2.1 Maintenance Checks For the bottom-up approach, the relevant properties from a check (derived from Table 2.1) are: - The maintenance interval - The check man hours From these two properties, the maintenance demand at a specified interval can be established. As was mentioned earlier, the grouping together of maintenance tasks into checks only looks at the HV (Transavia) Interval, and the line/base maintenance classification. This is also the case for the rest of the aircraft in the Transavia fleet. Given that the 737NG MPD is a MSG-3 based document, it can be said that there is very little application of the MSG-3 Task-Based Maintenance philosophy (Appendix C.1.3) in the MPD. The result of this is that there are very few differences in the way maintenance is planned and executed for the entire fleet. These differences are the A-Checks for the B737-300 (see also Table 2.2), and the Line Maintenance phases for the B757. Consequently, very few gains can be made in terms of hangar maintenance for the Next Generation fleet.
3.2.2 Maintenance Task Packages Apart from grouping tasks together by only using the task interval property, other properties can be considered (see also Table 2.1). Dijkhuizen [1998] suggests the use of Set-Up properties for the packaging of maintenance tasks, especially those performed frequently (Line Maintenance). He defines Set-Up as: where one or more tasks require a fixed condition/procedure/cost, irrespective of how many components are being maintained. By considering tasks that share the same set-up activities (e.g. the same access area or access panels, aircraft preparation), tasks can be clustered together. But by
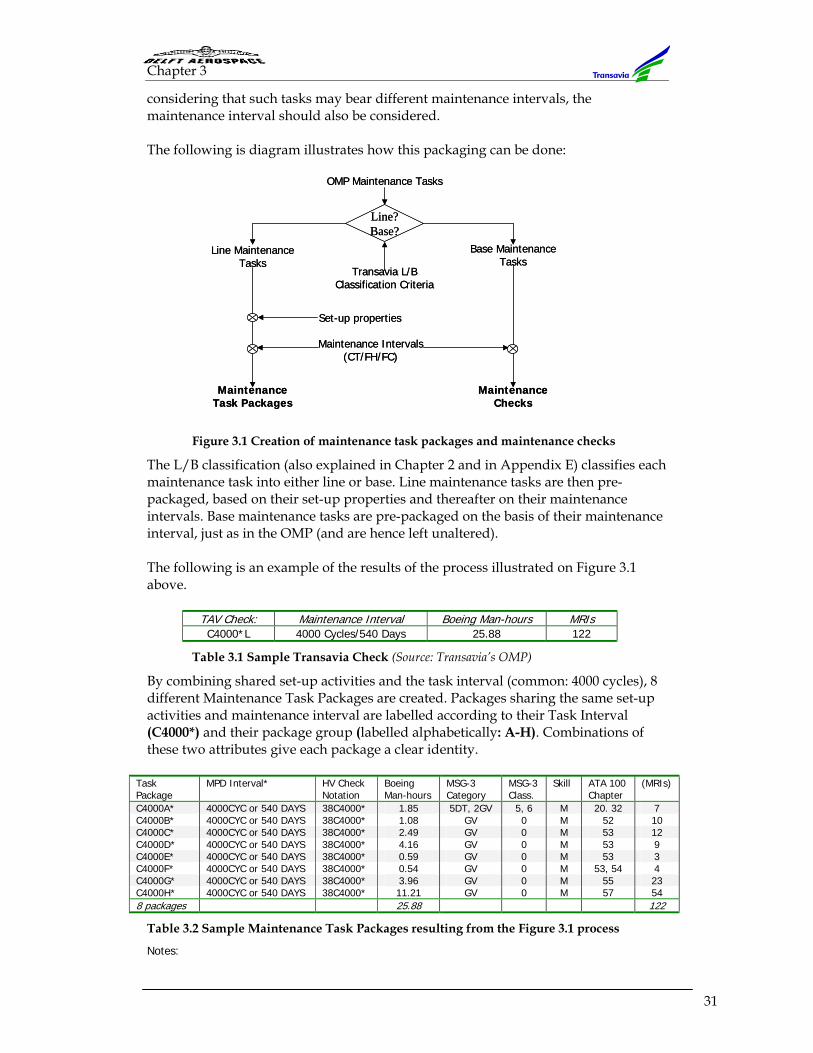
Chapter 3
31
considering that such tasks may bear different maintenance intervals, the maintenance interval should also be considered. The following is diagram illustrates how this packaging can be done:
Figure 3.1 Creation of maintenance task packages and maintenance checks
The L/B classification (also explained in Chapter 2 and in Appendix E) classifies each maintenance task into either line or base. Line maintenance tasks are then pre-packaged, based on their set-up properties and thereafter on their maintenance intervals. Base maintenance tasks are pre-packaged on the basis of their maintenance interval, just as in the OMP (and are hence left unaltered). The following is an example of the results of the process illustrated on Figure 3.1 above.
TAV Check: Maintenance Interval Boeing Man-hours MRIs C4000*L 4000 Cycles/540 Days 25.88 122
Table 3.1 Sample Transavia Check (Source: Transavia’s OMP)
By combining shared set-up activities and the task interval (common: 4000 cycles), 8 different Maintenance Task Packages are created. Packages sharing the same set-up activities and maintenance interval are labelled according to their Task Interval (C4000*) and their package group (labelled alphabetically: A-H). Combinations of these two attributes give each package a clear identity.
Task Package
MPD Interval* HV Check Notation
Boeing Man-hours
MSG-3 Category
MSG-3 Class.
Skill ATA 100 Chapter
(MRIs)
C4000A* 4000CYC or 540 DAYS 38C4000* 1.85 5DT, 2GV 5, 6 M 20. 32 7 C4000B* 4000CYC or 540 DAYS 38C4000* 1.08 GV 0 M 52 10 C4000C* 4000CYC or 540 DAYS 38C4000* 2.49 GV 0 M 53 12 C4000D* 4000CYC or 540 DAYS 38C4000* 4.16 GV 0 M 53 9 C4000E* 4000CYC or 540 DAYS 38C4000* 0.59 GV 0 M 53 3 C4000F* 4000CYC or 540 DAYS 38C4000* 0.54 GV 0 M 53, 54 4 C4000G* 4000CYC or 540 DAYS 38C4000* 3.96 GV 0 M 55 23 C4000H* 4000CYC or 540 DAYS 38C4000* 11.21 GV 0 M 57 54 8 packages 25.88 122
Table 3.2 Sample Maintenance Task Packages resulting from the Figure 3.1 process
Notes:
OMP Maintenance Tasks
Line MaintenanceTasks
Base MaintenanceTasks
Line?Base?
Set-up properties
Maintenance Intervals(CT/FH/FC)
Transavia L/BClassification Criteria
MaintenanceChecks
MaintenanceTask Packages
OMP Maintenance Tasks
Line MaintenanceTasks
Base MaintenanceTasks
Line?Base?
Set-up properties
Maintenance Intervals(CT/FH/FC)
Transavia L/BClassification Criteria
MaintenanceChecks
MaintenanceTask Packages
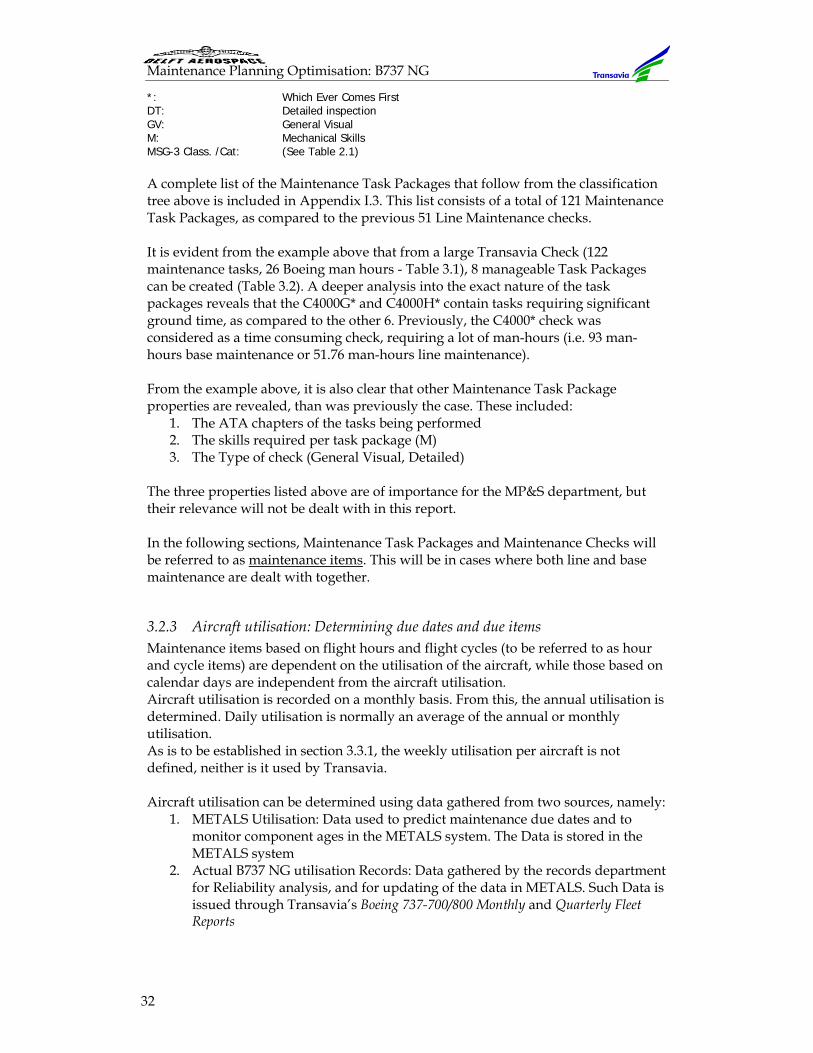
Maintenance Planning Optimisation: B737 NG
32
*: Which Ever Comes First DT: Detailed inspection GV: General Visual M: Mechanical Skills MSG-3 Class. /Cat: (See Table 2.1) A complete list of the Maintenance Task Packages that follow from the classification tree above is included in Appendix I.3. This list consists of a total of 121 Maintenance Task Packages, as compared to the previous 51 Line Maintenance checks. It is evident from the example above that from a large Transavia Check (122 maintenance tasks, 26 Boeing man hours - Table 3.1), 8 manageable Task Packages can be created (Table 3.2). A deeper analysis into the exact nature of the task packages reveals that the C4000G* and C4000H* contain tasks requiring significant ground time, as compared to the other 6. Previously, the C4000* check was considered as a time consuming check, requiring a lot of man-hours (i.e. 93 man-hours base maintenance or 51.76 man-hours line maintenance). From the example above, it is also clear that other Maintenance Task Package properties are revealed, than was previously the case. These included:
1. The ATA chapters of the tasks being performed 2. The skills required per task package (M) 3. The Type of check (General Visual, Detailed)
The three properties listed above are of importance for the MP&S department, but their relevance will not be dealt with in this report. In the following sections, Maintenance Task Packages and Maintenance Checks will be referred to as maintenance items. This will be in cases where both line and base maintenance are dealt with together.
3.2.3 Aircraft utilisation: Determining due dates and due items Maintenance items based on flight hours and flight cycles (to be referred to as hour and cycle items) are dependent on the utilisation of the aircraft, while those based on calendar days are independent from the aircraft utilisation. Aircraft utilisation is recorded on a monthly basis. From this, the annual utilisation is determined. Daily utilisation is normally an average of the annual or monthly utilisation. As is to be established in section 3.3.1, the weekly utilisation per aircraft is not defined, neither is it used by Transavia. Aircraft utilisation can be determined using data gathered from two sources, namely:
1. METALS Utilisation: Data used to predict maintenance due dates and to monitor component ages in the METALS system. The Data is stored in the METALS system
2. Actual B737 NG utilisation Records: Data gathered by the records department for Reliability analysis, and for updating of the data in METALS. Such Data is issued through Transavia’s Boeing 737-700/800 Monthly and Quarterly Fleet Reports
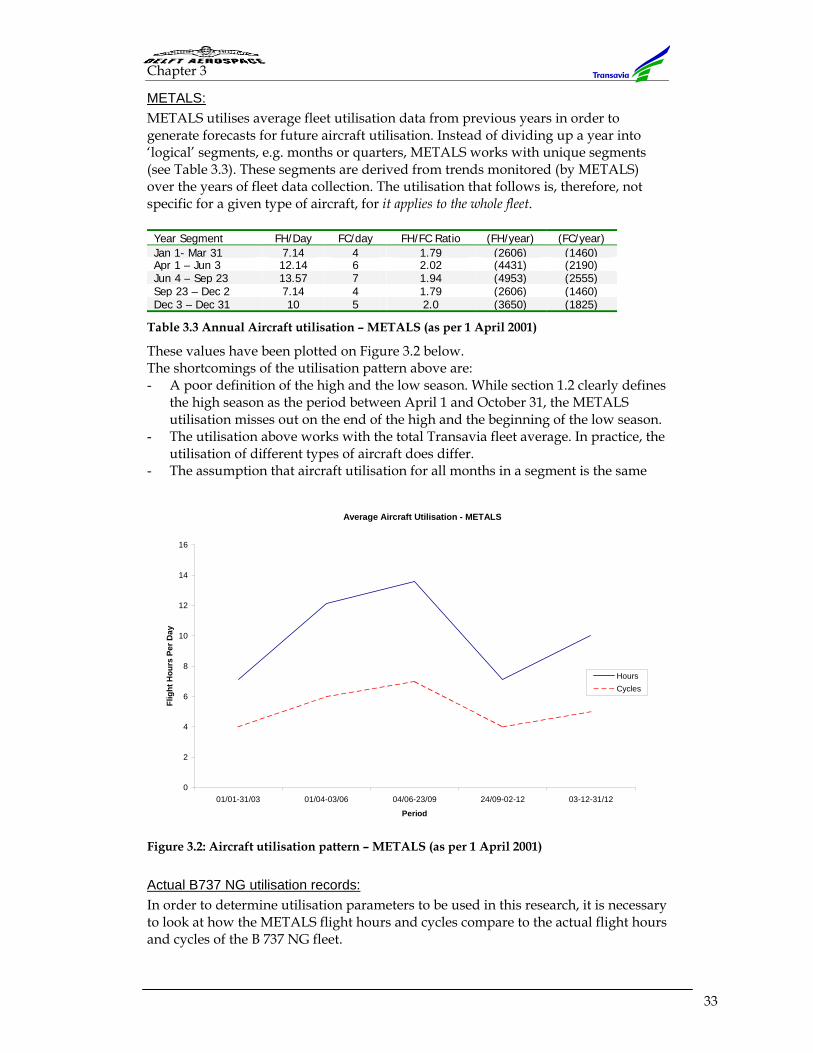
Chapter 3
33
METALS: METALS utilises average fleet utilisation data from previous years in order to generate forecasts for future aircraft utilisation. Instead of dividing up a year into ‘logical’ segments, e.g. months or quarters, METALS works with unique segments (see Table 3.3). These segments are derived from trends monitored (by METALS) over the years of fleet data collection. The utilisation that follows is, therefore, not specific for a given type of aircraft, for it applies to the whole fleet. Year Segment FH/Day FC/day FH/FC Ratio (FH/year) (FC/year) Jan 1- Mar 31 7.14 4 1.79 (2606) (1460) Apr 1 – Jun 3 12.14 6 2.02 (4431) (2190) Jun 4 – Sep 23 13.57 7 1.94 (4953) (2555) Sep 23 – Dec 2 7.14 4 1.79 (2606) (1460) Dec 3 – Dec 31 10 5 2.0 (3650) (1825)
Table 3.3 Annual Aircraft utilisation – METALS (as per 1 April 2001)
These values have been plotted on Figure 3.2 below. The shortcomings of the utilisation pattern above are: - A poor definition of the high and the low season. While section 1.2 clearly defines
the high season as the period between April 1 and October 31, the METALS utilisation misses out on the end of the high and the beginning of the low season.
- The utilisation above works with the total Transavia fleet average. In practice, the utilisation of different types of aircraft does differ.
- The assumption that aircraft utilisation for all months in a segment is the same
Figure 3.2: Aircraft utilisation pattern – METALS (as per 1 April 2001)
Actual B737 NG utilisation records: In order to determine utilisation parameters to be used in this research, it is necessary to look at how the METALS flight hours and cycles compare to the actual flight hours and cycles of the B 737 NG fleet.
Average Aircraft Utilisation - METALS
0
2
4
6
8
10
12
14
16
01/01-31/03 01/04-03/06 04/06-23/09 24/09-02-12 03-12-31/12
Period
Flig
ht H
ours
Per
Day
HoursCycles
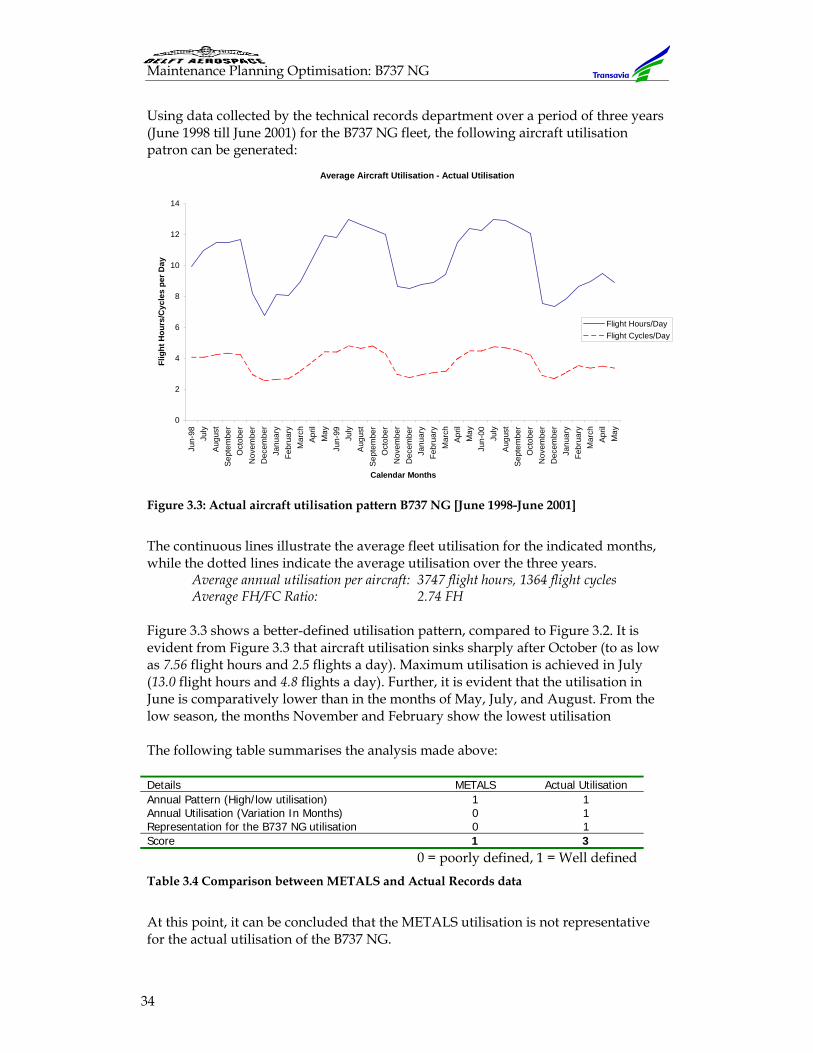
Maintenance Planning Optimisation: B737 NG
34
Using data collected by the technical records department over a period of three years (June 1998 till June 2001) for the B737 NG fleet, the following aircraft utilisation patron can be generated:
Figure 3.3: Actual aircraft utilisation pattern B737 NG [June 1998-June 2001]
The continuous lines illustrate the average fleet utilisation for the indicated months, while the dotted lines indicate the average utilisation over the three years.
Average annual utilisation per aircraft: 3747 flight hours, 1364 flight cycles Average FH/FC Ratio: 2.74 FH
Figure 3.3 shows a better-defined utilisation pattern, compared to Figure 3.2. It is evident from Figure 3.3 that aircraft utilisation sinks sharply after October (to as low as 7.56 flight hours and 2.5 flights a day). Maximum utilisation is achieved in July (13.0 flight hours and 4.8 flights a day). Further, it is evident that the utilisation in June is comparatively lower than in the months of May, July, and August. From the low season, the months November and February show the lowest utilisation The following table summarises the analysis made above: Details METALS Actual Utilisation Annual Pattern (High/low utilisation) 1 1 Annual Utilisation (Variation In Months) 0 1 Representation for the B737 NG utilisation 0 1 Score 1 3
0 = poorly defined, 1 = Well defined Table 3.4 Comparison between METALS and Actual Records data
At this point, it can be concluded that the METALS utilisation is not representative for the actual utilisation of the B737 NG.
Average Aircraft Utilisation - Actual Utilisation
0
2
4
6
8
10
12
14Ju
n-98 July
Aug
ust
Sep
tem
ber
Oct
ober
Nov
embe
rD
ecem
ber
Janu
ary
Febr
uary
Mar
chA
pril
May
Jun-
99 July
Aug
ust
Sep
tem
ber
Oct
ober
Nov
embe
rD
ecem
ber
Janu
ary
Febr
uary
Mar
chA
pril
May
Jun-
00 July
Aug
ust
Sep
tem
ber
Oct
ober
Nov
embe
rD
ecem
ber
Janu
ary
Febr
uary
Mar
chA
pril
May
Calendar Months
Flig
ht H
ours
/Cyc
les
per D
ay
Flight Hours/DayFlight Cycles/Day
Chapter 3
35
It is, therefore, preferred to use pattern that is based on Figure 3.3, rather than that from METALS.
3.2.4 Maintenance Scheduling By combining the aircraft utilisation with the maintenance items, maintenance due dates per item can be generated After determining maintenance due dates and Items, the next step in the bottom-up approach is to determine when these items can be performed (hence scheduling). This section will mainly focus on factors influencing and limiting the scheduling of aircraft maintenance. Line Maintenance: As described earlier in section 2.3.1, the scheduling of line maintenance follows guidelines laid down in a Maintenance-Planning guide. This guide allocates eleven slots a week to the technical department for hangar maintenance. The maintenance planning then sub-divides these slots over the three types of aircraft in the Transavia fleet. For the purpose of definition only, the following values of slot allocation will be used: Aircraft Type Fleet Size Minimum slots
per hangar visit per aircraft
Hangar Visit frequency (Routine Mx)
Aircraft Visiting hangar per week
Total slots per aircraft type per week (approx)
737-300 7 2 4 weeks 1.75 3.5 (4) 757-200 4 3 5 weeks 0.8 2.4 (3) 737 - NG 13 1.5 5 weeks 2.6 3.9 (4) Slots required Per week (Routine Mx) 9.8 (11)
Table 3.5 Minimum maintenance slot allocations for the Transavia fleet (Sources: MP&S)
This research is on the 737NG, and will therefore concentrate on the maintenance demand for this aircraft. Table 3.5 reveals that a maximum of 4 slots are available per week for routine maintenance of the 737NG fleet. This also translates to 15 slots a year. In order to determine how frequent the aircraft has to visit the hangar for maintenance, it is necessary to look at intervals of maintenance tasks performed during such visits. For this purpose, only the common variations in the Maintenance Task Package intervals will be analysed: Package Intervals Boeing Man-hours Package Intervals Boeing Man-hours 60 DAYS 0.2 450 HOURS 13 60 DAYS/ 400 CYCLES 1.6 1000 HOURS 6.05 100 DAYS 11.2 1600 HOURS 3.85 100 DAYS/ 1000CYCLES 1.22 2000 HOURS 3.21 240 DAYS/ 1250CYCLES 2.95 4000 HOURS 10.75 360 DAYS 4.05 5000 HOURS 49.21 360 DAYS/ 2000CYCLES 0.2 6500 HOURS 0.6 480 DAYS/ 2500CYCLES 0.6 8000 HOURS 3 540 DAYS 2.5 10000 HOURS 6.05 720 DAYS 7.85 12000 HOURS 2 720 DAYS/ 4000CYCLES 35.5 12500 HOURS 1.9
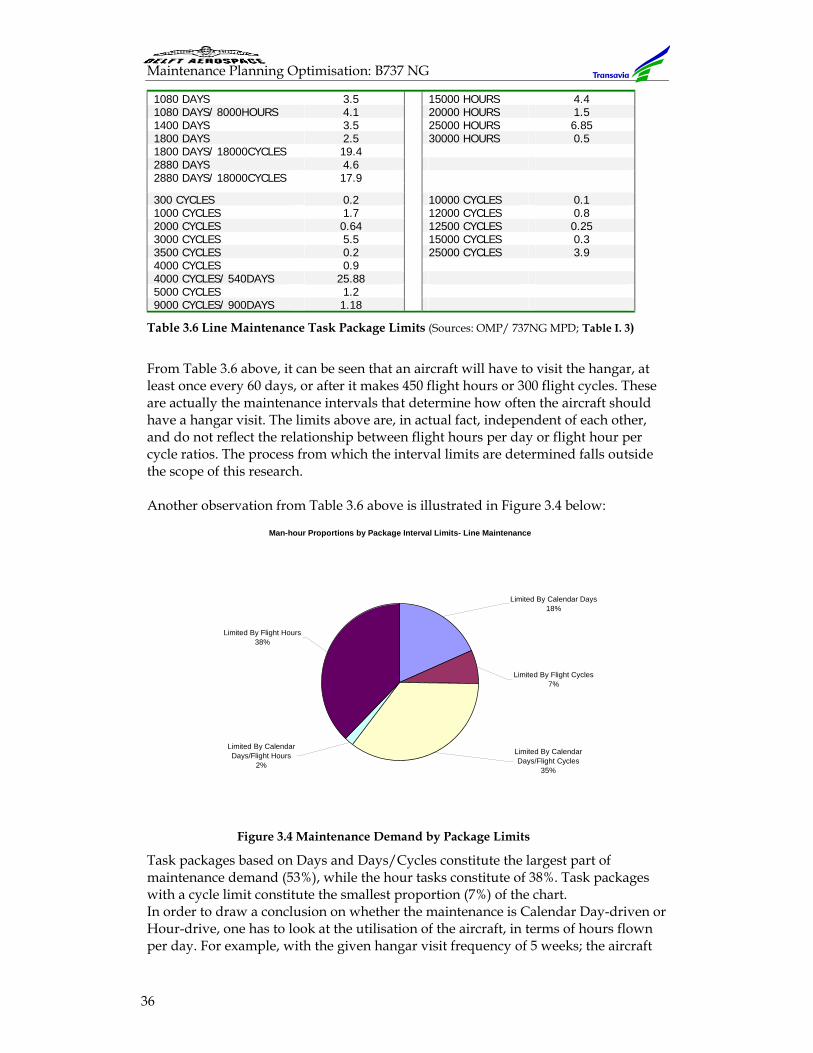
Maintenance Planning Optimisation: B737 NG
36
1080 DAYS 3.5 15000 HOURS 4.4 1080 DAYS/ 8000HOURS 4.1 20000 HOURS 1.5 1400 DAYS 3.5 25000 HOURS 6.85 1800 DAYS 2.5 30000 HOURS 0.5 1800 DAYS/ 18000CYCLES 19.4 2880 DAYS 4.62880 DAYS/ 18000CYCLES 17.9
300 CYCLES 0.2 10000 CYCLES 0.1 1000 CYCLES 1.7 12000 CYCLES 0.8 2000 CYCLES 0.64 12500 CYCLES 0.25 3000 CYCLES 5.5 15000 CYCLES 0.3 3500 CYCLES 0.2 25000 CYCLES 3.9 4000 CYCLES 0.9 4000 CYCLES/ 540DAYS 25.885000 CYCLES 1.29000 CYCLES/ 900DAYS 1.18
Table 3.6 Line Maintenance Task Package Limits (Sources: OMP/ 737NG MPD; Table I. 3)
From Table 3.6 above, it can be seen that an aircraft will have to visit the hangar, at least once every 60 days, or after it makes 450 flight hours or 300 flight cycles. These are actually the maintenance intervals that determine how often the aircraft should have a hangar visit. The limits above are, in actual fact, independent of each other, and do not reflect the relationship between flight hours per day or flight hour per cycle ratios. The process from which the interval limits are determined falls outside the scope of this research. Another observation from Table 3.6 above is illustrated in Figure 3.4 below:
Figure 3.4 Maintenance Demand by Package Limits
Task packages based on Days and Days/Cycles constitute the largest part of maintenance demand (53%), while the hour tasks constitute of 38%. Task packages with a cycle limit constitute the smallest proportion (7%) of the chart. In order to draw a conclusion on whether the maintenance is Calendar Day-driven or Hour-drive, one has to look at the utilisation of the aircraft, in terms of hours flown per day. For example, with the given hangar visit frequency of 5 weeks; the aircraft
Man-hour Proportions by Package Interval Limits- Line Maintenance
Limited By Calendar Days/Flight Hours
2%
Limited By Flight Hours38%
Limited By Calendar Days/Flight Cycles
35%
Limited By Flight Cycles7%
Limited By Calendar Days18%
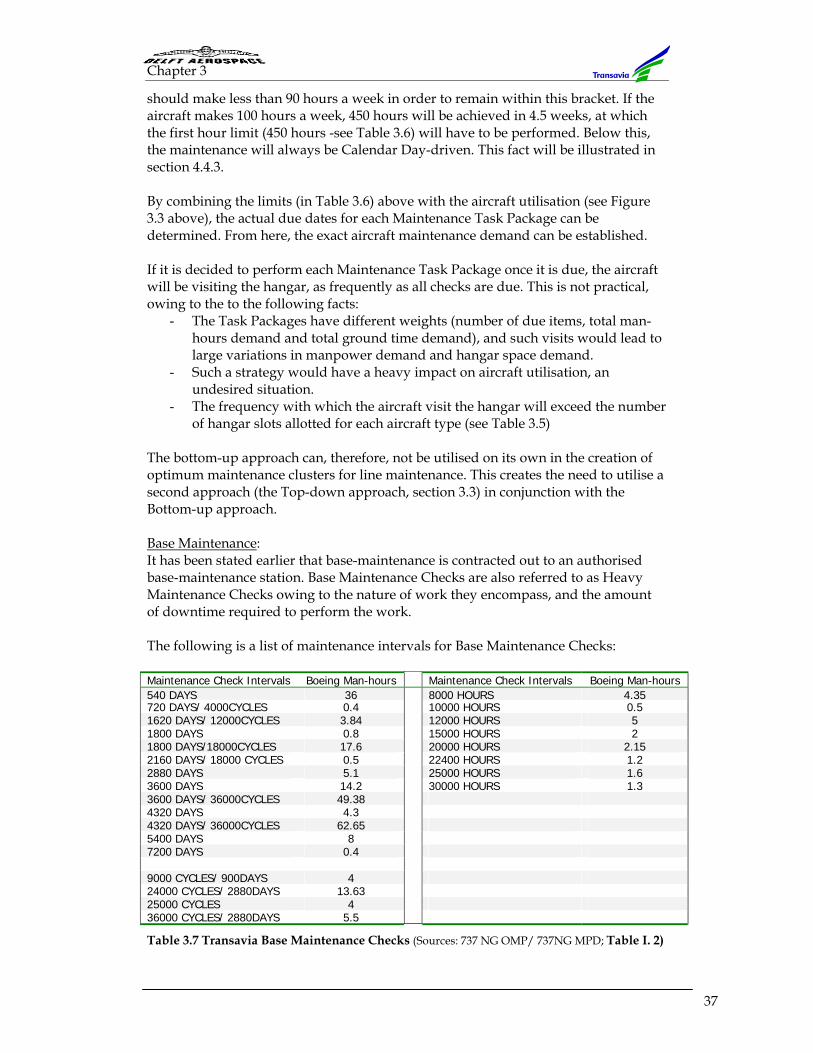
Chapter 3
37
should make less than 90 hours a week in order to remain within this bracket. If the aircraft makes 100 hours a week, 450 hours will be achieved in 4.5 weeks, at which the first hour limit (450 hours -see Table 3.6) will have to be performed. Below this, the maintenance will always be Calendar Day-driven. This fact will be illustrated in section 4.4.3. By combining the limits (in Table 3.6) above with the aircraft utilisation (see Figure 3.3 above), the actual due dates for each Maintenance Task Package can be determined. From here, the exact aircraft maintenance demand can be established. If it is decided to perform each Maintenance Task Package once it is due, the aircraft will be visiting the hangar, as frequently as all checks are due. This is not practical, owing to the to the following facts:
- The Task Packages have different weights (number of due items, total man-hours demand and total ground time demand), and such visits would lead to large variations in manpower demand and hangar space demand.
- Such a strategy would have a heavy impact on aircraft utilisation, an undesired situation.
- The frequency with which the aircraft visit the hangar will exceed the number of hangar slots allotted for each aircraft type (see Table 3.5)
The bottom-up approach can, therefore, not be utilised on its own in the creation of optimum maintenance clusters for line maintenance. This creates the need to utilise a second approach (the Top-down approach, section 3.3) in conjunction with the Bottom-up approach. Base Maintenance: It has been stated earlier that base-maintenance is contracted out to an authorised base-maintenance station. Base Maintenance Checks are also referred to as Heavy Maintenance Checks owing to the nature of work they encompass, and the amount of downtime required to perform the work. The following is a list of maintenance intervals for Base Maintenance Checks: Maintenance Check Intervals Boeing Man-hours Maintenance Check Intervals Boeing Man-hours 540 DAYS 36 8000 HOURS 4.35 720 DAYS/ 4000CYCLES 0.4 10000 HOURS 0.5 1620 DAYS/ 12000CYCLES 3.84 12000 HOURS 5 1800 DAYS 0.8 15000 HOURS 2 1800 DAYS/18000CYCLES 17.6 20000 HOURS 2.15 2160 DAYS/ 18000 CYCLES 0.5 22400 HOURS 1.2 2880 DAYS 5.1 25000 HOURS 1.6 3600 DAYS 14.2 30000 HOURS 1.3 3600 DAYS/ 36000CYCLES 49.38 4320 DAYS 4.3 4320 DAYS/ 36000CYCLES 62.65 5400 DAYS 8 7200 DAYS 0.4 9000 CYCLES/ 900DAYS 4 24000 CYCLES/ 2880DAYS 13.63 25000 CYCLES 4 36000 CYCLES/ 2880DAYS 5.5
Table 3.7 Transavia Base Maintenance Checks (Sources: 737 NG OMP/ 737NG MPD; Table I. 2)
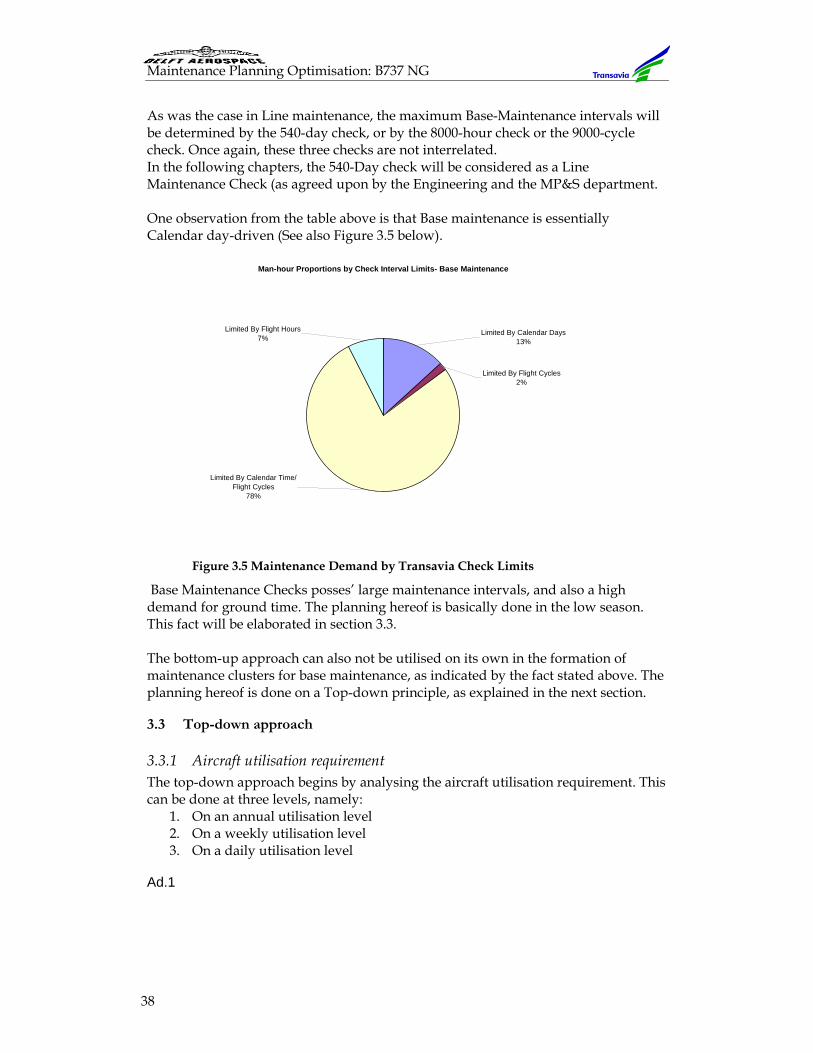
Maintenance Planning Optimisation: B737 NG
38
As was the case in Line maintenance, the maximum Base-Maintenance intervals will be determined by the 540-day check, or by the 8000-hour check or the 9000-cycle check. Once again, these three checks are not interrelated. In the following chapters, the 540-Day check will be considered as a Line Maintenance Check (as agreed upon by the Engineering and the MP&S department. One observation from the table above is that Base maintenance is essentially Calendar day-driven (See also Figure 3.5 below).
Figure 3.5 Maintenance Demand by Transavia Check Limits
Base Maintenance Checks posses’ large maintenance intervals, and also a high demand for ground time. The planning hereof is basically done in the low season. This fact will be elaborated in section 3.3. The bottom-up approach can also not be utilised on its own in the formation of maintenance clusters for base maintenance, as indicated by the fact stated above. The planning hereof is done on a Top-down principle, as explained in the next section.
3.3 Top-down approach
3.3.1 Aircraft utilisation requirement The top-down approach begins by analysing the aircraft utilisation requirement. This can be done at three levels, namely:
1. On an annual utilisation level 2. On a weekly utilisation level 3. On a daily utilisation level
Ad.1
Man-hour Proportions by Check Interval Limits- Base Maintenance
Limited By Calendar Time/ Flight Cycles
78%
Limited By Flight Hours7%
Limited By Flight Cycles2%
Limited By Calendar Days13%
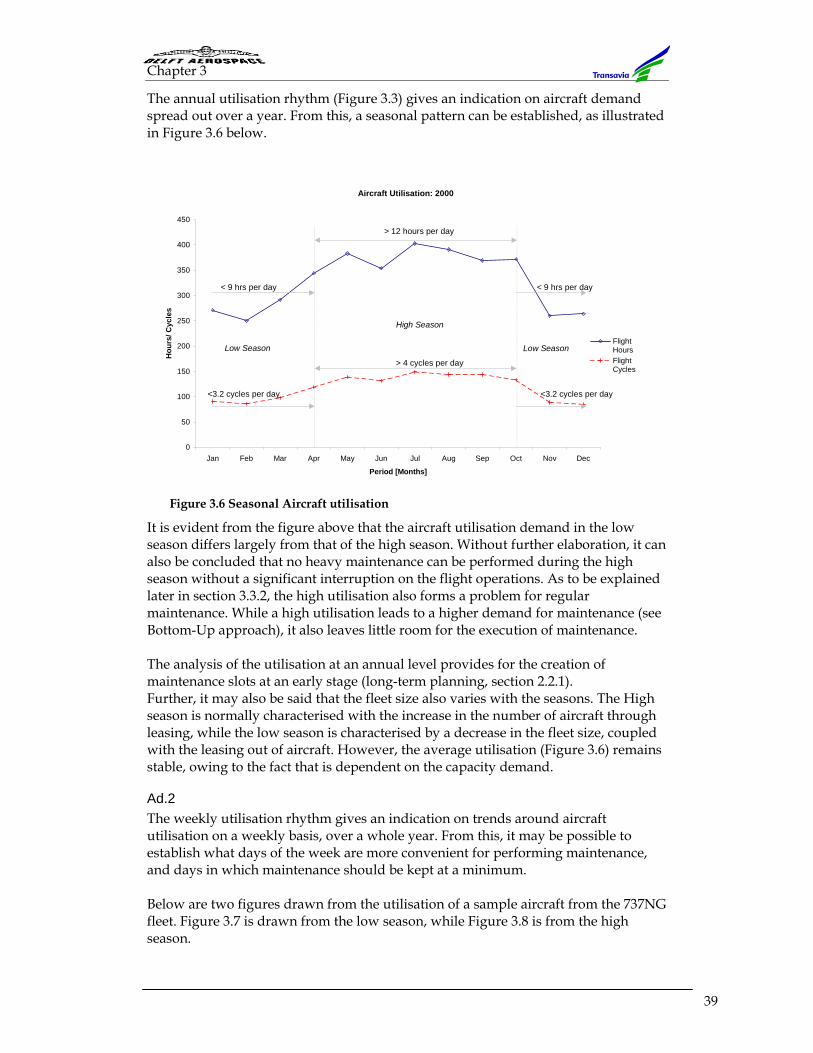
Chapter 3
39
The annual utilisation rhythm (Figure 3.3) gives an indication on aircraft demand spread out over a year. From this, a seasonal pattern can be established, as illustrated in Figure 3.6 below.
Figure 3.6 Seasonal Aircraft utilisation
It is evident from the figure above that the aircraft utilisation demand in the low season differs largely from that of the high season. Without further elaboration, it can also be concluded that no heavy maintenance can be performed during the high season without a significant interruption on the flight operations. As to be explained later in section 3.3.2, the high utilisation also forms a problem for regular maintenance. While a high utilisation leads to a higher demand for maintenance (see Bottom-Up approach), it also leaves little room for the execution of maintenance. The analysis of the utilisation at an annual level provides for the creation of maintenance slots at an early stage (long-term planning, section 2.2.1). Further, it may also be said that the fleet size also varies with the seasons. The High season is normally characterised with the increase in the number of aircraft through leasing, while the low season is characterised by a decrease in the fleet size, coupled with the leasing out of aircraft. However, the average utilisation (Figure 3.6) remains stable, owing to the fact that is dependent on the capacity demand.
Ad.2 The weekly utilisation rhythm gives an indication on trends around aircraft utilisation on a weekly basis, over a whole year. From this, it may be possible to establish what days of the week are more convenient for performing maintenance, and days in which maintenance should be kept at a minimum.
Below are two figures drawn from the utilisation of a sample aircraft from the 737NG fleet. Figure 3.7 is drawn from the low season, while Figure 3.8 is from the high season.
Aircraft Utilisation: 2000
0
50
100
150
200
250
300
350
400
450
Jan Feb Mar Apr May Jun Jul Aug Sep Oct Nov Dec
Period [Months]
Hou
rs/ C
ycle
s
FlightHoursFlightCycles
< 9 hrs per day
> 12 hours per day
> 4 cycles per day
< 9 hrs per day
<3.2 cycles per day <3.2 cycles per day
High Season
Low Season Low Season
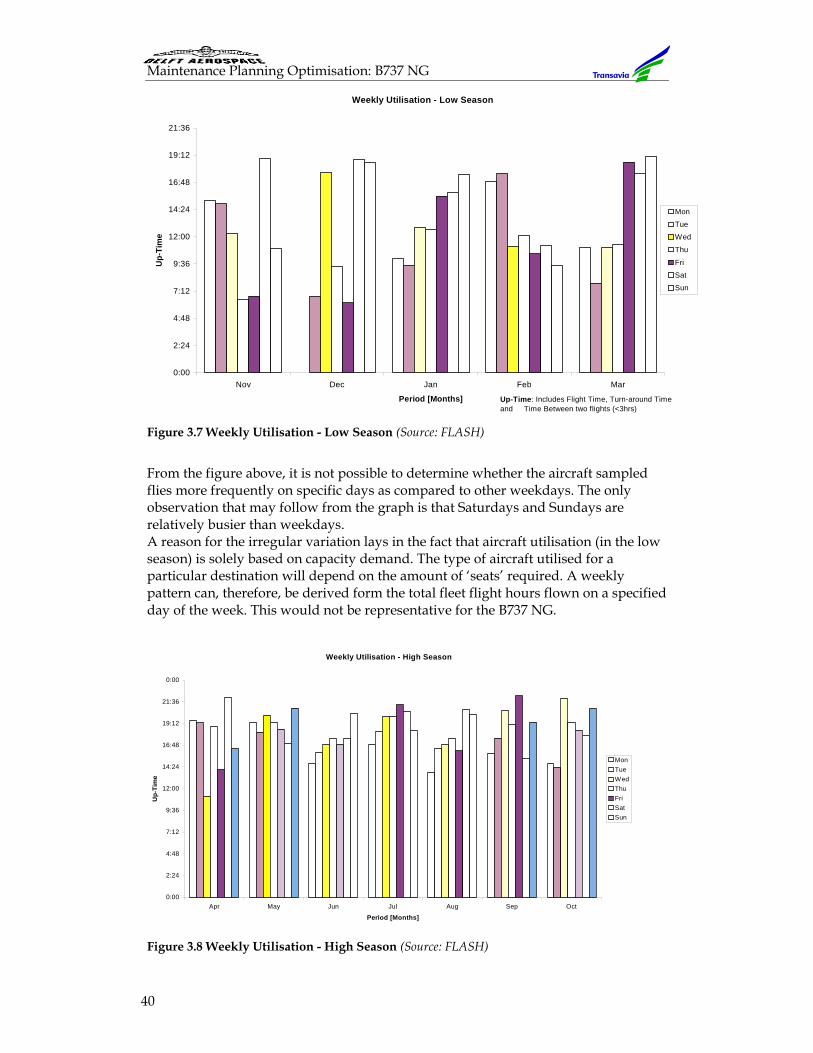
Maintenance Planning Optimisation: B737 NG
40
Figure 3.7 Weekly Utilisation - Low Season (Source: FLASH)
From the figure above, it is not possible to determine whether the aircraft sampled flies more frequently on specific days as compared to other weekdays. The only observation that may follow from the graph is that Saturdays and Sundays are relatively busier than weekdays. A reason for the irregular variation lays in the fact that aircraft utilisation (in the low season) is solely based on capacity demand. The type of aircraft utilised for a particular destination will depend on the amount of ‘seats’ required. A weekly pattern can, therefore, be derived form the total fleet flight hours flown on a specified day of the week. This would not be representative for the B737 NG.
Figure 3.8 Weekly Utilisation - High Season (Source: FLASH)
Weekly Utilisation - Low Season
0:00
2:24
4:48
7:12
9:36
12:00
14:24
16:48
19:12
21:36
Nov Dec Jan Feb Mar
Period [Months]
Up-
Tim
e
Mon
Tue
Wed
Thu
Fri
Sat
Sun
Up-Time: Includes Flight Time, Turn-around Time and Time Between two flights (<3hrs)
Weekly Utilisation - High Season
0:00
2:24
4:48
7:12
9:36
12:00
14:24
16:48
19:12
21:36
0:00
Apr May Jun Jul Aug Sep Oct
Period [Months]
Up-
Tim
e
MonTueWedThuFriSatSun
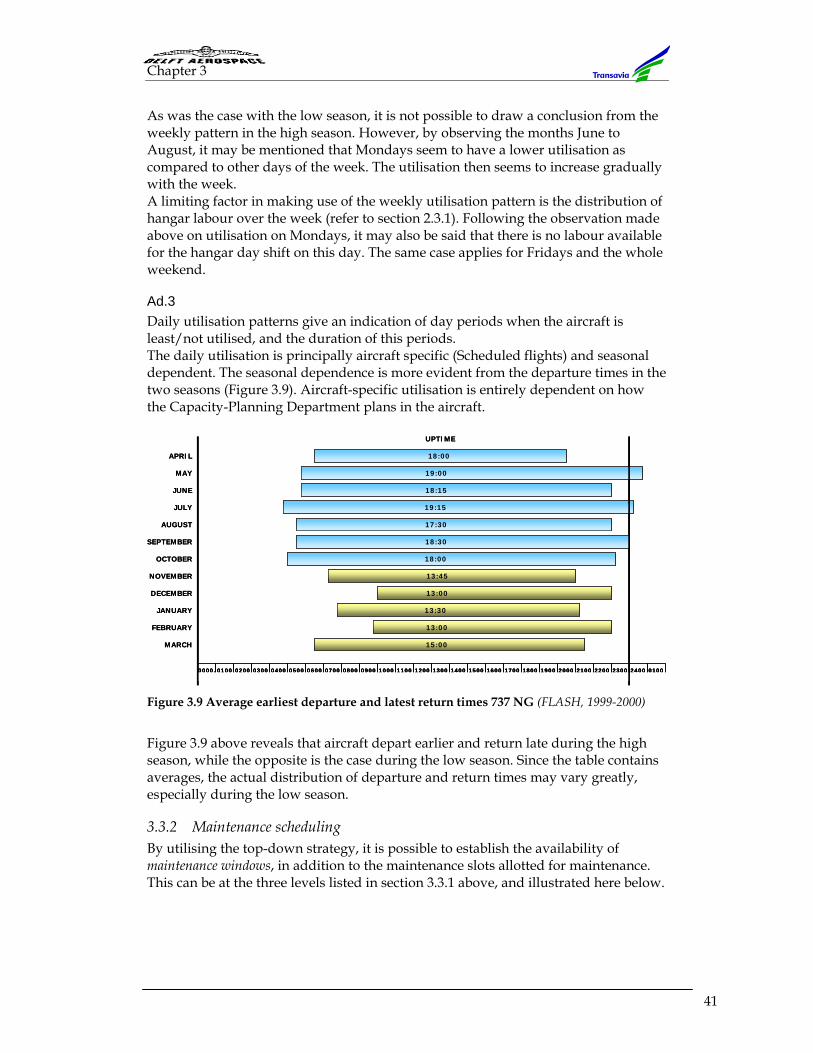
Chapter 3
41
As was the case with the low season, it is not possible to draw a conclusion from the weekly pattern in the high season. However, by observing the months June to August, it may be mentioned that Mondays seem to have a lower utilisation as compared to other days of the week. The utilisation then seems to increase gradually with the week. A limiting factor in making use of the weekly utilisation pattern is the distribution of hangar labour over the week (refer to section 2.3.1). Following the observation made above on utilisation on Mondays, it may also be said that there is no labour available for the hangar day shift on this day. The same case applies for Fridays and the whole weekend.
Ad.3 Daily utilisation patterns give an indication of day periods when the aircraft is least/not utilised, and the duration of this periods. The daily utilisation is principally aircraft specific (Scheduled flights) and seasonal dependent. The seasonal dependence is more evident from the departure times in the two seasons (Figure 3.9). Aircraft-specific utilisation is entirely dependent on how the Capacity-Planning Department plans in the aircraft.
Figure 3.9 Average earliest departure and latest return times 737 NG (FLASH, 1999-2000)
Figure 3.9 above reveals that aircraft depart earlier and return late during the high season, while the opposite is the case during the low season. Since the table contains averages, the actual distribution of departure and return times may vary greatly, especially during the low season.
3.3.2 Maintenance scheduling By utilising the top-down strategy, it is possible to establish the availability of maintenance windows, in addition to the maintenance slots allotted for maintenance. This can be at the three levels listed in section 3.3.1 above, and illustrated here below.
0100 0200 0300 0400 0500 0600 0700 0800 0900 1000 1100 1200 1300 1400 24002300220021002000190018001700160015000000. 0100
13:00
18:00
15:00
13:00
13:30
17:30
19:15
18:15
19:00
13:45
18:00
18:30
DECEMBER
NOVEMBER
OCTOBER
SEPTEMBER
AUGUST
JULY
JUNE
MAY
APRIL
MARCH
FEBRUARY
JANUARY
UPTIME
0100 0200 0300 0400 0500 0600 0700 0800 0900 1000 1100 1200 1300 1400 24002300220021002000190018001700160015000000. 01000100 0200 0300 0400 0500 0600 0700 0800 0900 1000 1100 1200 1300 1400 24002300220021002000190018001700160015000000. 0100
13:00
18:00
15:00
13:00
13:30
17:30
19:15
18:15
19:00
13:45
18:00
18:30
DECEMBER
NOVEMBER
OCTOBER
SEPTEMBER
AUGUST
JULY
JUNE
MAY
APRIL
MARCH
FEBRUARY
JANUARY
UPTIME
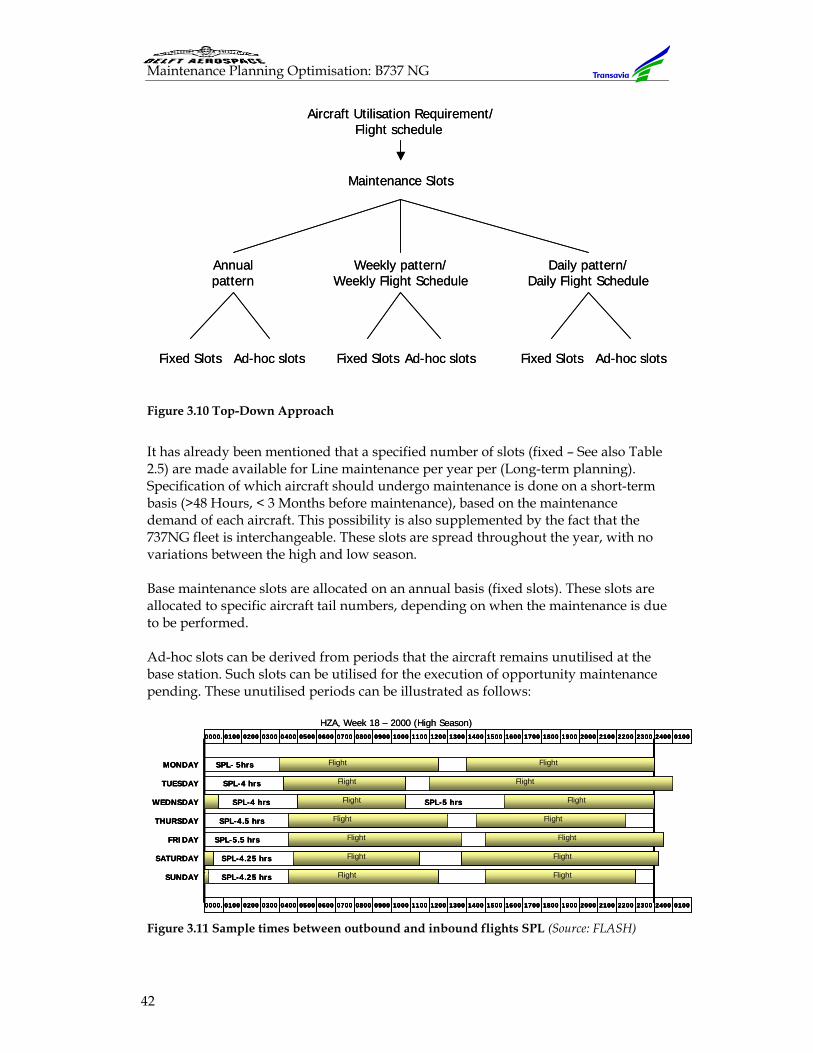
Maintenance Planning Optimisation: B737 NG
42
Figure 3.10 Top-Down Approach
It has already been mentioned that a specified number of slots (fixed – See also Table 2.5) are made available for Line maintenance per year per (Long-term planning). Specification of which aircraft should undergo maintenance is done on a short-term basis (>48 Hours, < 3 Months before maintenance), based on the maintenance demand of each aircraft. This possibility is also supplemented by the fact that the 737NG fleet is interchangeable. These slots are spread throughout the year, with no variations between the high and low season. Base maintenance slots are allocated on an annual basis (fixed slots). These slots are allocated to specific aircraft tail numbers, depending on when the maintenance is due to be performed. Ad-hoc slots can be derived from periods that the aircraft remains unutilised at the base station. Such slots can be utilised for the execution of opportunity maintenance pending. These unutilised periods can be illustrated as follows:
Figure 3.11 Sample times between outbound and inbound flights SPL (Source: FLASH)
Maintenance Slots
Weekly pattern/Weekly Flight Schedule
Annualpattern
Daily pattern/Daily Flight Schedule
Fixed Slots Ad-hoc slotsFixed Slots Fixed SlotsAd-hoc slots Ad-hoc slots
Aircraft Utilisation Requirement/Flight schedule
Maintenance Slots
Weekly pattern/Weekly Flight Schedule
Annualpattern
Daily pattern/Daily Flight Schedule
Fixed Slots Ad-hoc slotsFixed Slots Fixed SlotsAd-hoc slots Ad-hoc slots
Aircraft Utilisation Requirement/Flight schedule
0100 0200 0300 0400 0500 0600 0700 0800 0900 1000 1100 1200 1300 1400 24002300220021002000190018001700160015000000. 0100
THURSDAY
WEDNSDAY
TUESDAY
MONDAY
SUNDAY
SATURDAY
FRIDAY
Flight
0100 0200 0300 0400 0500 0600 0700 0800 0900 1000 1100 1200 1300 1400 24002300220021002000190018001700160015000000. 0100
SPL-5 hrs
SPL-4 hrs
SPL-4 hrs
SPL-4.5 hrs
SPL-5.5 hrs
SPL-4.25 hrs
SPL-4.25 hrs
Flight
FlightFlight
Flight
Flight
FlightFlight
Flight
Flight
Flight
Flight
Flight
Flight
SPL- 5hrs
HZA, Week 18 – 2000 (High Season)0100 0200 0300 0400 0500 0600 0700 0800 0900 1000 1100 1200 1300 1400 24002300220021002000190018001700160015000000. 0100
THURSDAY
WEDNSDAY
TUESDAY
MONDAY
SUNDAY
SATURDAY
FRIDAY
Flight
0100 0200 0300 0400 0500 0600 0700 0800 0900 1000 1100 1200 1300 1400 24002300220021002000190018001700160015000000. 0100
SPL-5 hrs
SPL-4 hrs
SPL-4 hrs
SPL-4.5 hrs
SPL-5.5 hrs
SPL-4.25 hrs
SPL-4.25 hrs
Flight
FlightFlight
Flight
Flight
FlightFlight
Flight
Flight
Flight
Flight
Flight
Flight
SPL- 5hrs
0100 0200 0300 0400 0500 0600 0700 0800 0900 1000 1100 1200 1300 1400 24002300220021002000190018001700160015000000. 01000100 0200 0300 0400 0500 0600 0700 0800 0900 1000 1100 1200 1300 1400 24002300220021002000190018001700160015000000. 0100
THURSDAY
WEDNSDAY
TUESDAY
MONDAY
SUNDAY
SATURDAY
FRIDAY
Flight
0100 0200 0300 0400 0500 0600 0700 0800 0900 1000 1100 1200 1300 1400 24002300220021002000190018001700160015000000. 01000100 0200 0300 0400 0500 0600 0700 0800 0900 1000 1100 1200 1300 1400 24002300220021002000190018001700160015000000. 0100
SPL-5 hrs
SPL-4 hrs
SPL-4 hrs
SPL-4.5 hrs
SPL-5.5 hrs
SPL-4.25 hrs
SPL-4.25 hrs
Flight
FlightFlight
Flight
Flight
FlightFlight
Flight
Flight
Flight
Flight
Flight
Flight
SPL- 5hrs
HZA, Week 18 – 2000 (High Season)
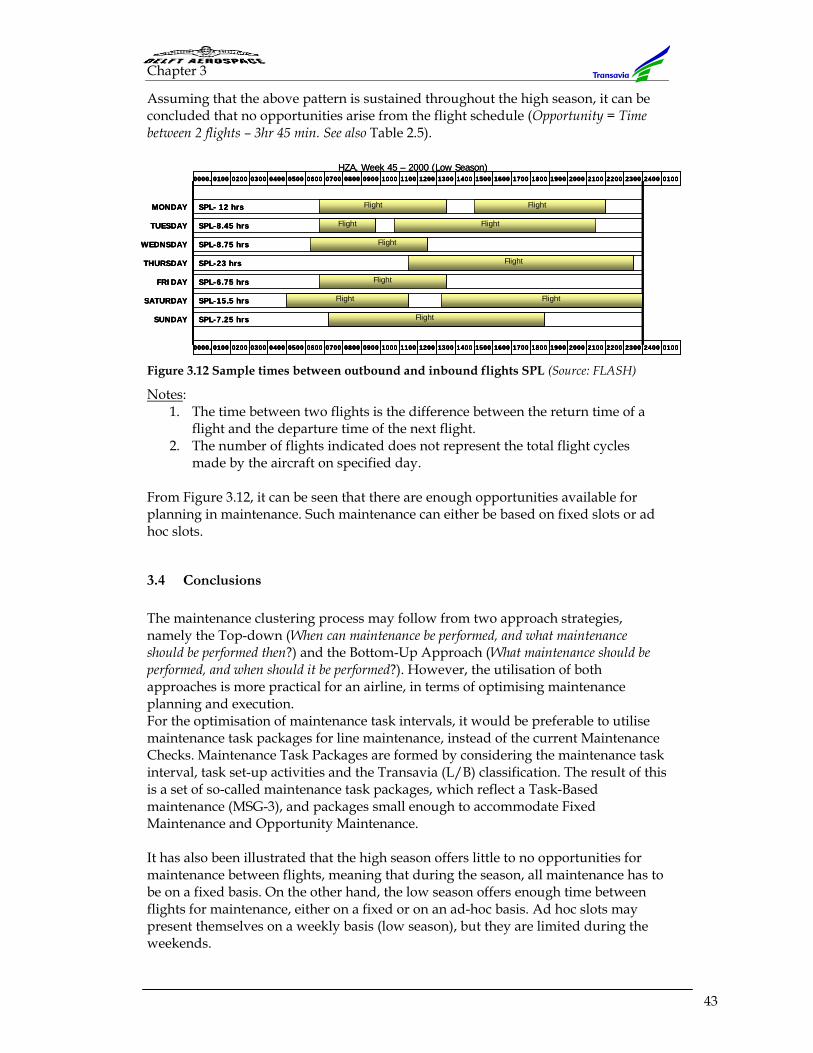
Chapter 3
43
Assuming that the above pattern is sustained throughout the high season, it can be concluded that no opportunities arise from the flight schedule (Opportunity = Time between 2 flights – 3hr 45 min. See also Table 2.5).
Figure 3.12 Sample times between outbound and inbound flights SPL (Source: FLASH)
Notes: 1. The time between two flights is the difference between the return time of a
flight and the departure time of the next flight. 2. The number of flights indicated does not represent the total flight cycles
made by the aircraft on specified day. From Figure 3.12, it can be seen that there are enough opportunities available for planning in maintenance. Such maintenance can either be based on fixed slots or ad hoc slots.
3.4 Conclusions
The maintenance clustering process may follow from two approach strategies, namely the Top-down (When can maintenance be performed, and what maintenance should be performed then?) and the Bottom-Up Approach (What maintenance should be performed, and when should it be performed?). However, the utilisation of both approaches is more practical for an airline, in terms of optimising maintenance planning and execution. For the optimisation of maintenance task intervals, it would be preferable to utilise maintenance task packages for line maintenance, instead of the current Maintenance Checks. Maintenance Task Packages are formed by considering the maintenance task interval, task set-up activities and the Transavia (L/B) classification. The result of this is a set of so-called maintenance task packages, which reflect a Task-Based maintenance (MSG-3), and packages small enough to accommodate Fixed Maintenance and Opportunity Maintenance. It has also been illustrated that the high season offers little to no opportunities for maintenance between flights, meaning that during the season, all maintenance has to be on a fixed basis. On the other hand, the low season offers enough time between flights for maintenance, either on a fixed or on an ad-hoc basis. Ad hoc slots may present themselves on a weekly basis (low season), but they are limited during the weekends.
0100 0200 0300 0400 0500 0600 0700 0800 0900 1000 1100 1200 1300 1400 24002300220021002000190018001700160015000000. 0100
THURSDAY
WEDNSDAY
TUESDAY
MONDAY
SUNDAY
SATURDAY
FRIDAY
Flight
0100 0200 0300 0400 0500 0600 0700 0800 0900 1000 1100 1200 1300 1400 24002300220021002000190018001700160015000000. 0100
SPL-8.45 hrs
SPL-8.75 hrs
SPL-23 hrs
SPL-6.75 hrs
SPL-15.5 hrs
SPL-7.25 hrs
Flight
FlightFlight
Flight
Flight
Flight
Flight
Flight
Flight
SPL- 12 hrs
HZA, Week 45 – 2000 (Low Season)0100 0200 0300 0400 0500 0600 0700 0800 0900 1000 1100 1200 1300 1400 24002300220021002000190018001700160015000000. 0100
THURSDAY
WEDNSDAY
TUESDAY
MONDAY
SUNDAY
SATURDAY
FRIDAY
Flight
0100 0200 0300 0400 0500 0600 0700 0800 0900 1000 1100 1200 1300 1400 24002300220021002000190018001700160015000000. 0100
SPL-8.45 hrs
SPL-8.75 hrs
SPL-23 hrs
SPL-6.75 hrs
SPL-15.5 hrs
SPL-7.25 hrs
Flight
FlightFlight
Flight
Flight
Flight
Flight
Flight
Flight
SPL- 12 hrs
0100 0200 0300 0400 0500 0600 0700 0800 0900 1000 1100 1200 1300 1400 24002300220021002000190018001700160015000000. 01000100 0200 0300 0400 0500 0600 0700 0800 0900 1000 1100 1200 1300 1400 24002300220021002000190018001700160015000000. 0100
THURSDAY
WEDNSDAY
TUESDAY
MONDAY
SUNDAY
SATURDAY
FRIDAY
Flight
0100 0200 0300 0400 0500 0600 0700 0800 0900 1000 1100 1200 1300 1400 24002300220021002000190018001700160015000000. 01000100 0200 0300 0400 0500 0600 0700 0800 0900 1000 1100 1200 1300 1400 24002300220021002000190018001700160015000000. 0100
SPL-8.45 hrs
SPL-8.75 hrs
SPL-23 hrs
SPL-6.75 hrs
SPL-15.5 hrs
SPL-7.25 hrs
Flight
FlightFlight
Flight
Flight
Flight
Flight
Flight
Flight
SPL- 12 hrs
HZA, Week 45 – 2000 (Low Season)

Maintenance Planning Optimisation: B737 NG
44
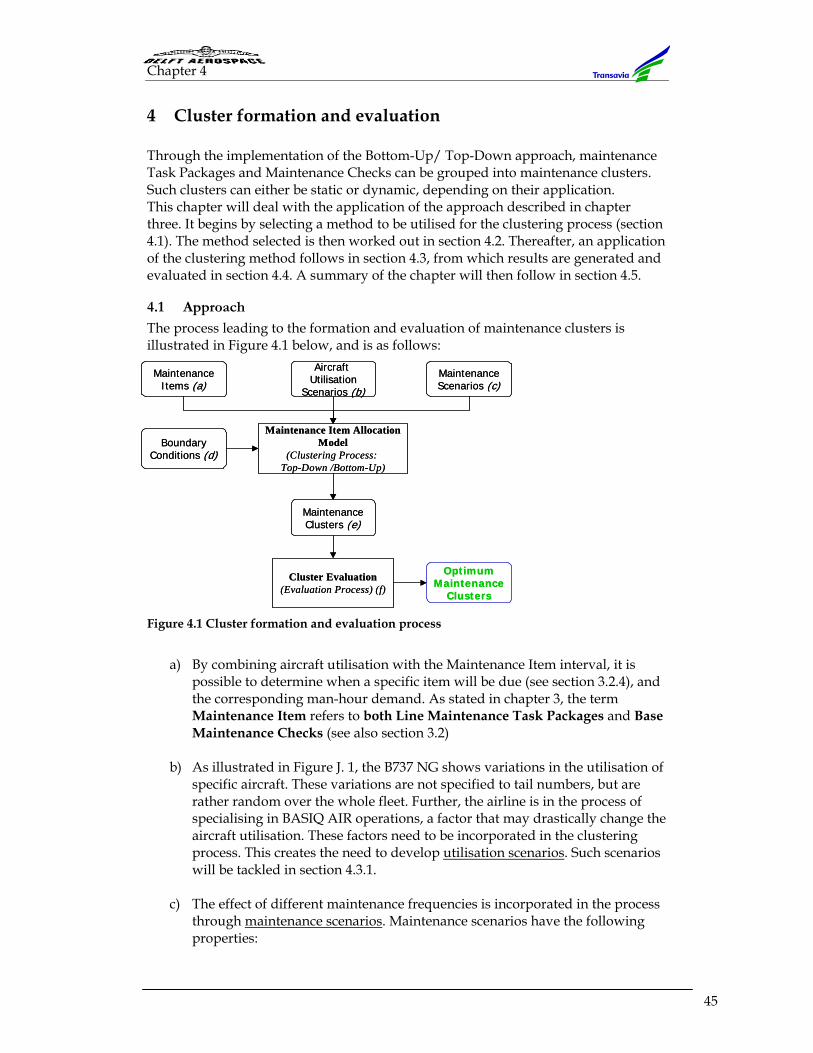
Chapter 4
45
4 Cluster formation and evaluation Through the implementation of the Bottom-Up/ Top-Down approach, maintenance Task Packages and Maintenance Checks can be grouped into maintenance clusters. Such clusters can either be static or dynamic, depending on their application. This chapter will deal with the application of the approach described in chapter three. It begins by selecting a method to be utilised for the clustering process (section 4.1). The method selected is then worked out in section 4.2. Thereafter, an application of the clustering method follows in section 4.3, from which results are generated and evaluated in section 4.4. A summary of the chapter will then follow in section 4.5.
4.1 Approach
The process leading to the formation and evaluation of maintenance clusters is illustrated in Figure 4.1 below, and is as follows:
Figure 4.1 Cluster formation and evaluation process
a) By combining aircraft utilisation with the Maintenance Item interval, it is
possible to determine when a specific item will be due (see section 3.2.4), and the corresponding man-hour demand. As stated in chapter 3, the term Maintenance Item refers to both Line Maintenance Task Packages and Base Maintenance Checks (see also section 3.2)
b) As illustrated in Figure J. 1, the B737 NG shows variations in the utilisation of specific aircraft. These variations are not specified to tail numbers, but are rather random over the whole fleet. Further, the airline is in the process of specialising in BASIQ AIR operations, a factor that may drastically change the aircraft utilisation. These factors need to be incorporated in the clustering process. This creates the need to develop utilisation scenarios. Such scenarios will be tackled in section 4.3.1.
c) The effect of different maintenance frequencies is incorporated in the process through maintenance scenarios. Maintenance scenarios have the following properties:
MaintenanceItems (a)
MaintenanceClusters (e)
Maintenance Item AllocationModel
(Clustering Process: Top-Down /Bottom-Up)
OptimumMaintenance
Clusters
Cluster Evaluation(Evaluation Process) (f)
BoundaryConditions (d)
MaintenanceScenarios (c)
Aircraft Utilisation
Scenarios (b)
MaintenanceItems (a)
MaintenanceClusters (e)
Maintenance Item AllocationModel
(Clustering Process: Top-Down /Bottom-Up)
OptimumMaintenance
Clusters
Cluster Evaluation(Evaluation Process) (f)
BoundaryConditions (d)
MaintenanceScenarios (c)
Aircraft Utilisation
Scenarios (b)
Maintenance Planning Optimisation: B737 NG
46
For line maintenance: - Hangar visit frequency in weeks/days
For Base maintenance: - Base maintenance frequency (Heavy Maintenance Visit # – HMV) in
years/days
d) Conditions governing maintenance planning and execution, such as those described in section 1.6, are incorporated in the process through boundary conditions
e) The maintenance item clustering process will be done using a Maintenance
Item Allocation Model (MIAM), described in section 4.3.2. Maintenance clusters possess the following properties:
- Maintenance items (Maintenance Task Package clusters or Maintenance Check clusters)
- Maintenance item properties - Total (cluster) man-hours - Total maintenance-item interval de-escalation (see also section 4.3.5)
f) Task clusters resulting from (e.) above will then be evaluated (see also
sections 4.4.2 and 4.4.4), and from these, clusters deemed as optimum will be identified
4.2 Maintenance Item Clustering
4.2.1 Clustering method selection A choice for a cluster formation and evaluation method can be made between:
1. An analytical method: The analytical method involves the design of a formal model of the process in
question. This model incorporates all relevant process parameters, and the relationship between them is presented mathematically. Manipulating or solving these equations achieves a solution to the problem [Bratley, 1987; Hillston, 2001]
2. Computer simulation method Involves the utilisation of a computer program to solve the problem in question. The simulation experiment begins by designing a formal model (in the form of a flow chart) of the process in question, which is then translated into programming language of simulation software. Computer simulations borrow some properties of the analytical method. The resulting programme is normally a comprehensive description of the process, in which only the relevant process properties and parameters are incorporated. This is also referred to as a Hybrid Simulation [Bratley, 1987; Hillston, 2001]
For this research, it is preferable to utilise the Hybrid Simulation for the creation and evaluation of maintenance clusters. The model will be utilised to generate events (maintenance items turning due) and gather data (man-hours required and task interval de-escalations).
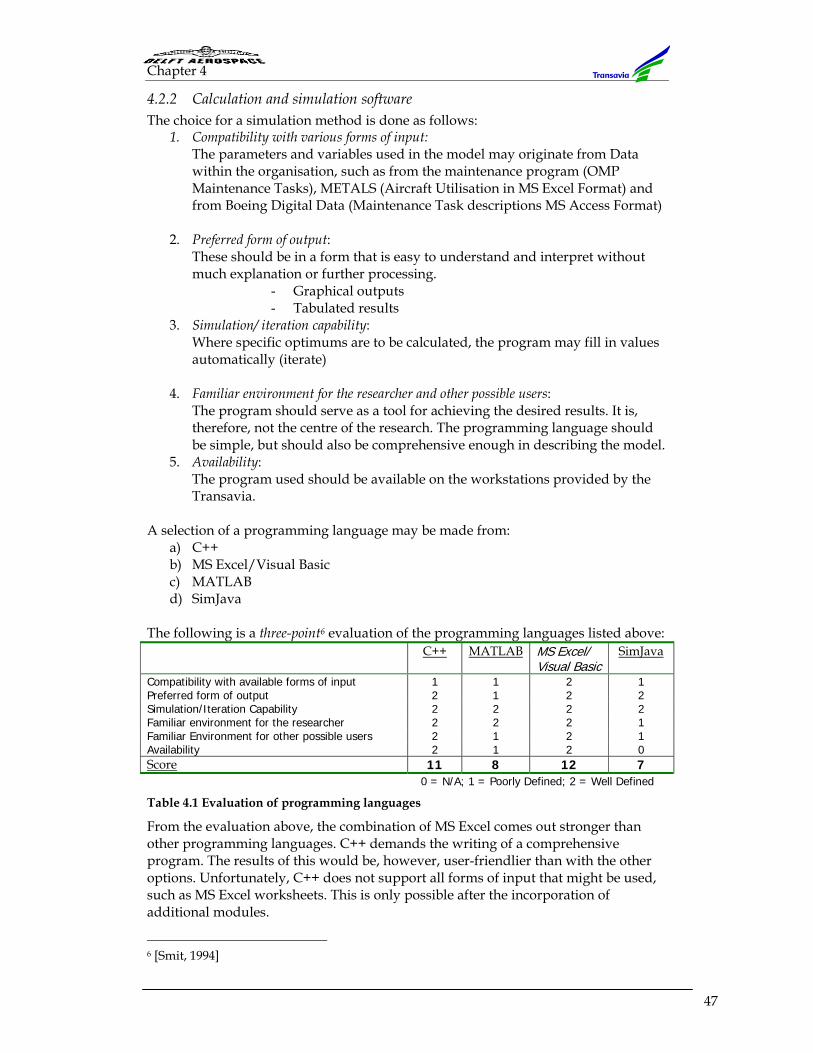
Chapter 4
47
4.2.2 Calculation and simulation software The choice for a simulation method is done as follows:
1. Compatibility with various forms of input: The parameters and variables used in the model may originate from Data within the organisation, such as from the maintenance program (OMP Maintenance Tasks), METALS (Aircraft Utilisation in MS Excel Format) and from Boeing Digital Data (Maintenance Task descriptions MS Access Format)
2. Preferred form of output: These should be in a form that is easy to understand and interpret without much explanation or further processing.
- Graphical outputs - Tabulated results
3. Simulation/ iteration capability: Where specific optimums are to be calculated, the program may fill in values automatically (iterate)
4. Familiar environment for the researcher and other possible users: The program should serve as a tool for achieving the desired results. It is, therefore, not the centre of the research. The programming language should be simple, but should also be comprehensive enough in describing the model.
5. Availability: The program used should be available on the workstations provided by the Transavia.
A selection of a programming language may be made from:
a) C++ b) MS Excel/Visual Basic c) MATLAB d) SimJava
The following is a three-point6 evaluation of the programming languages listed above: C++ MATLAB MS Excel/
Visual Basic SimJava
Compatibility with available forms of input 1 1 2 1 Preferred form of output 2 1 2 2 Simulation/Iteration Capability 2 2 2 2 Familiar environment for the researcher 2 2 2 1 Familiar Environment for other possible users 2 1 2 1 Availability 2 1 2 0 Score 11 8 12 7
0 = N/A; 1 = Poorly Defined; 2 = Well Defined
Table 4.1 Evaluation of programming languages
From the evaluation above, the combination of MS Excel comes out stronger than other programming languages. C++ demands the writing of a comprehensive program. The results of this would be, however, user-friendlier than with the other options. Unfortunately, C++ does not support all forms of input that might be used, such as MS Excel worksheets. This is only possible after the incorporation of additional modules.
6 [Smit, 1994]
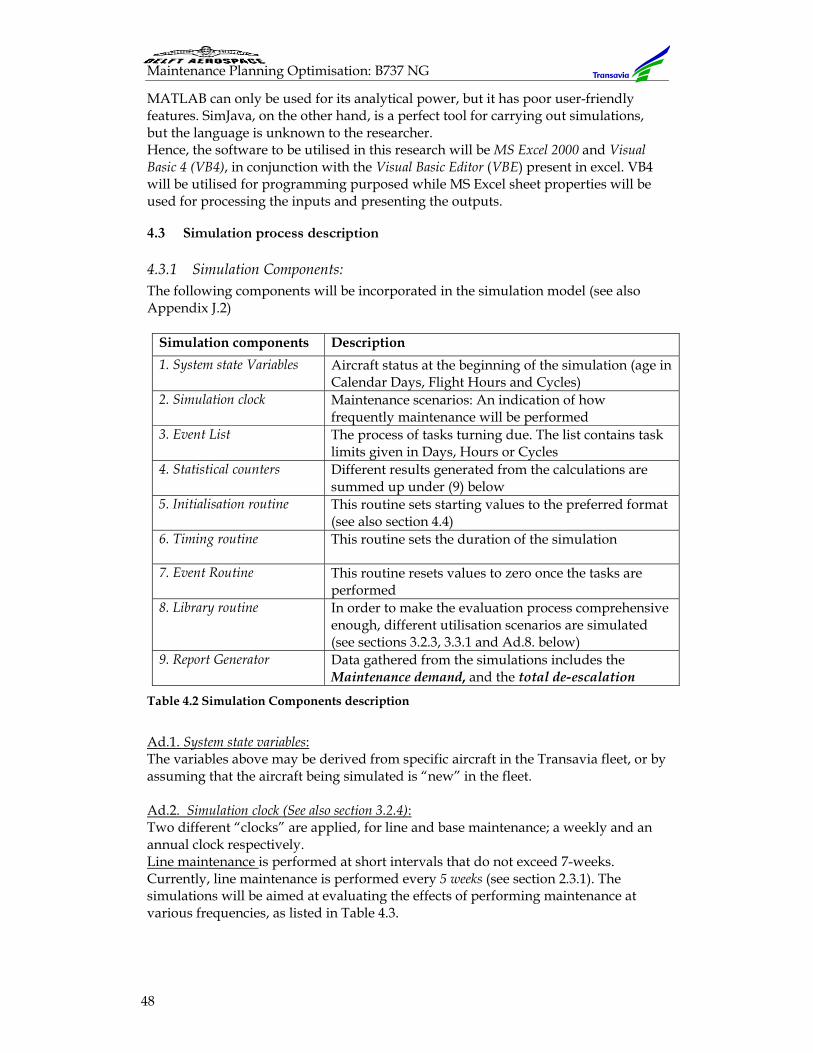
Maintenance Planning Optimisation: B737 NG
48
MATLAB can only be used for its analytical power, but it has poor user-friendly features. SimJava, on the other hand, is a perfect tool for carrying out simulations, but the language is unknown to the researcher. Hence, the software to be utilised in this research will be MS Excel 2000 and Visual Basic 4 (VB4), in conjunction with the Visual Basic Editor (VBE) present in excel. VB4 will be utilised for programming purposed while MS Excel sheet properties will be used for processing the inputs and presenting the outputs.
4.3 Simulation process description
4.3.1 Simulation Components: The following components will be incorporated in the simulation model (see also Appendix J.2)
Simulation components Description 1. System state Variables
Aircraft status at the beginning of the simulation (age in Calendar Days, Flight Hours and Cycles)
2. Simulation clock
Maintenance scenarios: An indication of how frequently maintenance will be performed
3. Event List
The process of tasks turning due. The list contains task limits given in Days, Hours or Cycles
4. Statistical counters
Different results generated from the calculations are summed up under (9) below
5. Initialisation routine
This routine sets starting values to the preferred format (see also section 4.4)
6. Timing routine
This routine sets the duration of the simulation
7. Event Routine
This routine resets values to zero once the tasks are performed
8. Library routine
In order to make the evaluation process comprehensive enough, different utilisation scenarios are simulated (see sections 3.2.3, 3.3.1 and Ad.8. below)
9. Report Generator
Data gathered from the simulations includes the Maintenance demand, and the total de-escalation
Table 4.2 Simulation Components description
Ad.1. System state variables: The variables above may be derived from specific aircraft in the Transavia fleet, or by assuming that the aircraft being simulated is “new” in the fleet. Ad.2. Simulation clock (See also section 3.2.4): Two different “clocks” are applied, for line and base maintenance; a weekly and an annual clock respectively. Line maintenance is performed at short intervals that do not exceed 7-weeks. Currently, line maintenance is performed every 5 weeks (see section 2.3.1). The simulations will be aimed at evaluating the effects of performing maintenance at various frequencies, as listed in Table 4.3.
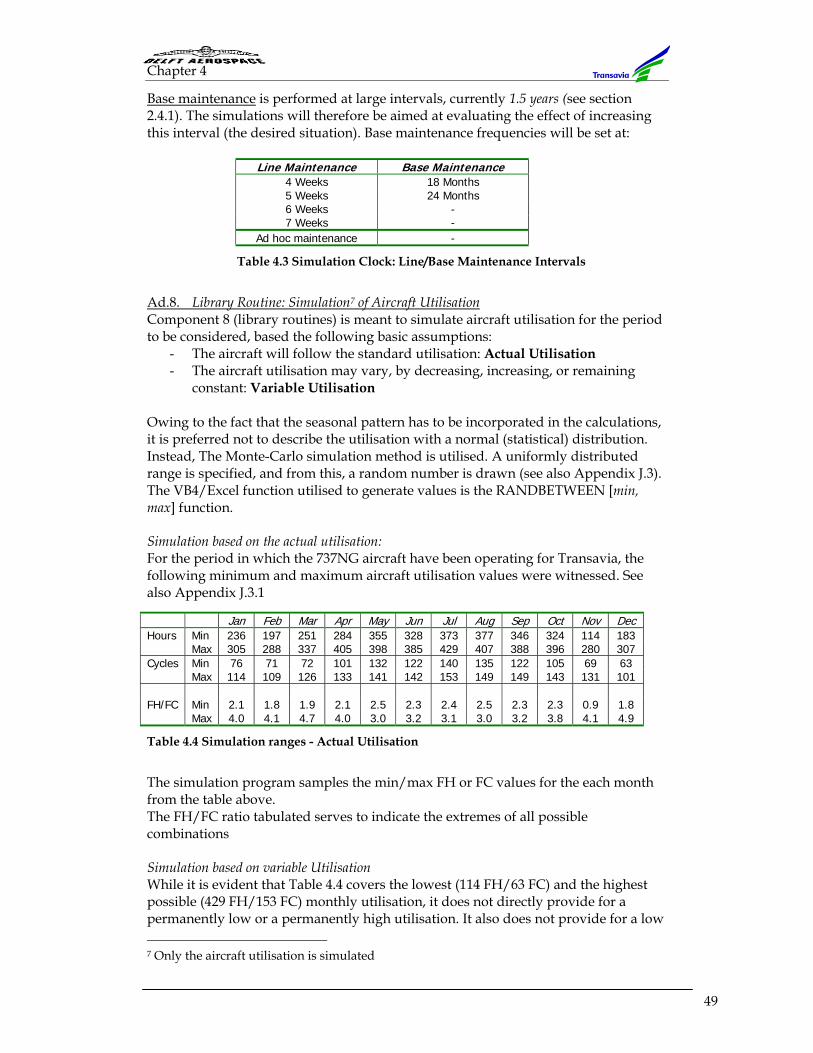
Chapter 4
49
Base maintenance is performed at large intervals, currently 1.5 years (see section 2.4.1). The simulations will therefore be aimed at evaluating the effect of increasing this interval (the desired situation). Base maintenance frequencies will be set at:
Line Maintenance Base Maintenance 4 Weeks 18 Months 5 Weeks 24 Months 6 Weeks - 7 Weeks -
Ad hoc maintenance -
Table 4.3 Simulation Clock: Line/Base Maintenance Intervals
Ad.8. Library Routine: Simulation7 of Aircraft Utilisation Component 8 (library routines) is meant to simulate aircraft utilisation for the period to be considered, based the following basic assumptions:
- The aircraft will follow the standard utilisation: Actual Utilisation - The aircraft utilisation may vary, by decreasing, increasing, or remaining
constant: Variable Utilisation Owing to the fact that the seasonal pattern has to be incorporated in the calculations, it is preferred not to describe the utilisation with a normal (statistical) distribution. Instead, The Monte-Carlo simulation method is utilised. A uniformly distributed range is specified, and from this, a random number is drawn (see also Appendix J.3). The VB4/Excel function utilised to generate values is the RANDBETWEEN [min, max] function.
Simulation based on the actual utilisation: For the period in which the 737NG aircraft have been operating for Transavia, the following minimum and maximum aircraft utilisation values were witnessed. See also Appendix J.3.1
Table 4.4 Simulation ranges - Actual Utilisation
The simulation program samples the min/max FH or FC values for the each month from the table above. The FH/FC ratio tabulated serves to indicate the extremes of all possible combinations Simulation based on variable Utilisation While it is evident that Table 4.4 covers the lowest (114 FH/63 FC) and the highest possible (429 FH/153 FC) monthly utilisation, it does not directly provide for a permanently low or a permanently high utilisation. It also does not provide for a low 7 Only the aircraft utilisation is simulated
Jan Feb Mar Apr May Jun Jul Aug Sep Oct Nov Dec Hours Min 236 197 251 284 355 328 373 377 346 324 114 183 Max 305 288 337 405 398 385 429 407 388 396 280 307 Cycles Min 76 71 72 101 132 122 140 135 122 105 69 63 Max 114 109 126 133 141 142 153 149 149 143 131 101 FH/FC Min 2.1 1.8 1.9 2.1 2.5 2.3 2.4 2.5 2.3 2.3 0.9 1.8 Max 4.0 4.1 4.7 4.0 3.0 3.2 3.1 3.0 3.2 3.8 4.1 4.9
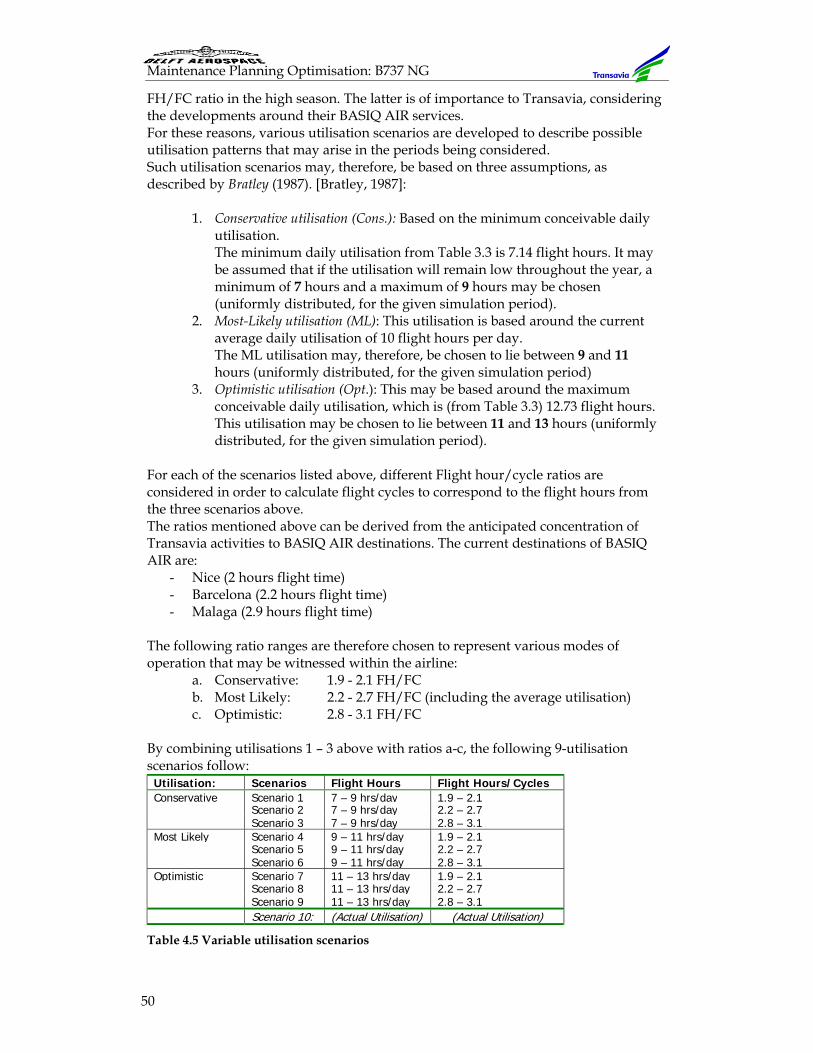
Maintenance Planning Optimisation: B737 NG
50
FH/FC ratio in the high season. The latter is of importance to Transavia, considering the developments around their BASIQ AIR services. For these reasons, various utilisation scenarios are developed to describe possible utilisation patterns that may arise in the periods being considered. Such utilisation scenarios may, therefore, be based on three assumptions, as described by Bratley (1987). [Bratley, 1987]:
1. Conservative utilisation (Cons.): Based on the minimum conceivable daily
utilisation. The minimum daily utilisation from Table 3.3 is 7.14 flight hours. It may be assumed that if the utilisation will remain low throughout the year, a minimum of 7 hours and a maximum of 9 hours may be chosen (uniformly distributed, for the given simulation period).
2. Most-Likely utilisation (ML): This utilisation is based around the current average daily utilisation of 10 flight hours per day. The ML utilisation may, therefore, be chosen to lie between 9 and 11 hours (uniformly distributed, for the given simulation period)
3. Optimistic utilisation (Opt.): This may be based around the maximum conceivable daily utilisation, which is (from Table 3.3) 12.73 flight hours. This utilisation may be chosen to lie between 11 and 13 hours (uniformly distributed, for the given simulation period).
For each of the scenarios listed above, different Flight hour/cycle ratios are considered in order to calculate flight cycles to correspond to the flight hours from the three scenarios above. The ratios mentioned above can be derived from the anticipated concentration of Transavia activities to BASIQ AIR destinations. The current destinations of BASIQ AIR are:
- Nice (2 hours flight time) - Barcelona (2.2 hours flight time) - Malaga (2.9 hours flight time)
The following ratio ranges are therefore chosen to represent various modes of operation that may be witnessed within the airline:
a. Conservative: 1.9 - 2.1 FH/FC b. Most Likely: 2.2 - 2.7 FH/FC (including the average utilisation) c. Optimistic: 2.8 - 3.1 FH/FC
By combining utilisations 1 – 3 above with ratios a-c, the following 9-utilisation scenarios follow:
Utilisation: Scenarios Flight Hours Flight Hours/Cycles Conservative Scenario 1 7 – 9 hrs/day 1.9 – 2.1 Scenario 2 7 – 9 hrs/day 2.2 – 2.7 Scenario 3 7 – 9 hrs/day 2.8 – 3.1Most Likely Scenario 4 9 – 11 hrs/day 1.9 – 2.1 Scenario 5 9 – 11 hrs/day 2.2 – 2.7 Scenario 6 9 – 11 hrs/day 2.8 – 3.1Optimistic Scenario 7 11 – 13 hrs/day 1.9 – 2.1 Scenario 8 11 – 13 hrs/day 2.2 – 2.7 Scenario 9 11 – 13 hrs/day 2.8 – 3.1 Scenario 10: (Actual Utilisation) (Actual Utilisation)
Table 4.5 Variable utilisation scenarios
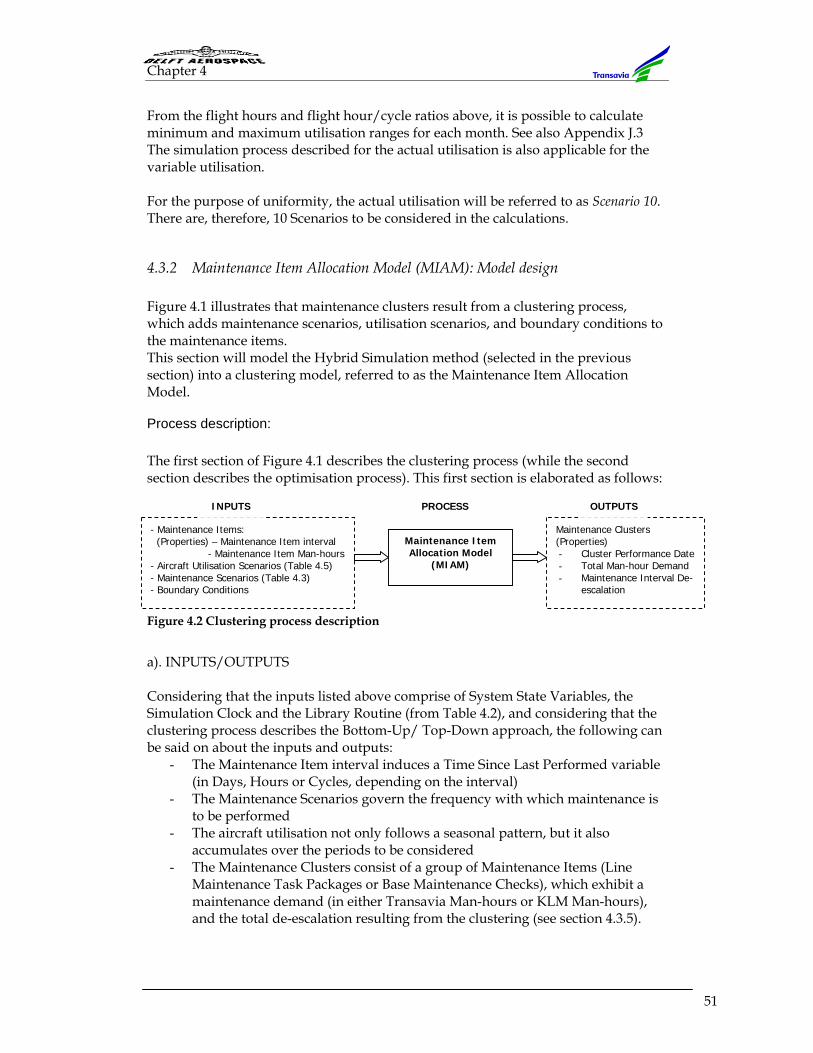
Chapter 4
51
From the flight hours and flight hour/cycle ratios above, it is possible to calculate minimum and maximum utilisation ranges for each month. See also Appendix J.3 The simulation process described for the actual utilisation is also applicable for the variable utilisation. For the purpose of uniformity, the actual utilisation will be referred to as Scenario 10. There are, therefore, 10 Scenarios to be considered in the calculations.
4.3.2 Maintenance Item Allocation Model (MIAM): Model design Figure 4.1 illustrates that maintenance clusters result from a clustering process, which adds maintenance scenarios, utilisation scenarios, and boundary conditions to the maintenance items. This section will model the Hybrid Simulation method (selected in the previous section) into a clustering model, referred to as the Maintenance Item Allocation Model.
Process description: The first section of Figure 4.1 describes the clustering process (while the second section describes the optimisation process). This first section is elaborated as follows: Figure 4.2 Clustering process description
a). INPUTS/OUTPUTS Considering that the inputs listed above comprise of System State Variables, the Simulation Clock and the Library Routine (from Table 4.2), and considering that the clustering process describes the Bottom-Up/ Top-Down approach, the following can be said on about the inputs and outputs:
- The Maintenance Item interval induces a Time Since Last Performed variable (in Days, Hours or Cycles, depending on the interval)
- The Maintenance Scenarios govern the frequency with which maintenance is to be performed
- The aircraft utilisation not only follows a seasonal pattern, but it also accumulates over the periods to be considered
- The Maintenance Clusters consist of a group of Maintenance Items (Line Maintenance Task Packages or Base Maintenance Checks), which exhibit a maintenance demand (in either Transavia Man-hours or KLM Man-hours), and the total de-escalation resulting from the clustering (see section 4.3.5).
- Maintenance Items: (Properties) – Maintenance Item interval
- Maintenance Item Man-hours - Aircraft Utilisation Scenarios (Table 4.5) - Maintenance Scenarios (Table 4.3) - Boundary Conditions
Maintenance Item Allocation Model
(MIAM)
Maintenance Clusters (Properties) - Cluster Performance Date - Total Man-hour Demand - Maintenance Interval De-
escalation
INPUTS PROCESS OUTPUTS
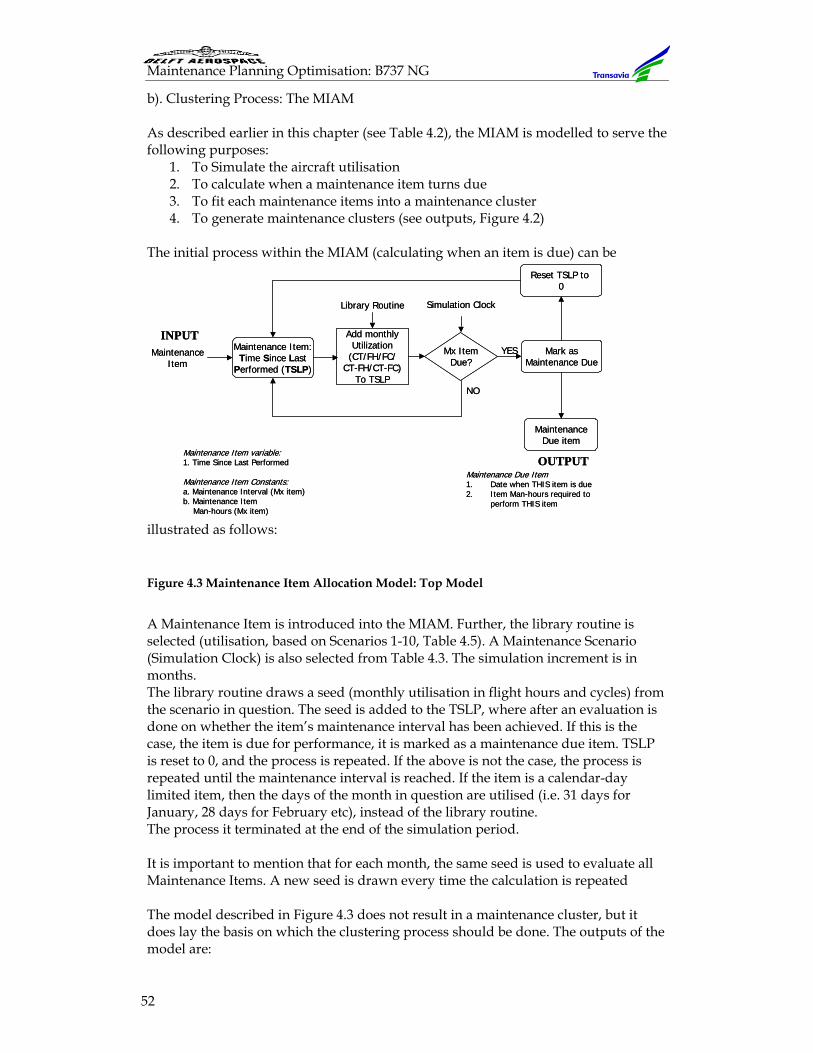
Maintenance Planning Optimisation: B737 NG
52
b). Clustering Process: The MIAM As described earlier in this chapter (see Table 4.2), the MIAM is modelled to serve the following purposes:
1. To Simulate the aircraft utilisation 2. To calculate when a maintenance item turns due 3. To fit each maintenance items into a maintenance cluster 4. To generate maintenance clusters (see outputs, Figure 4.2)
The initial process within the MIAM (calculating when an item is due) can be
illustrated as follows:
Figure 4.3 Maintenance Item Allocation Model: Top Model
A Maintenance Item is introduced into the MIAM. Further, the library routine is selected (utilisation, based on Scenarios 1-10, Table 4.5). A Maintenance Scenario (Simulation Clock) is also selected from Table 4.3. The simulation increment is in months. The library routine draws a seed (monthly utilisation in flight hours and cycles) from the scenario in question. The seed is added to the TSLP, where after an evaluation is done on whether the item’s maintenance interval has been achieved. If this is the case, the item is due for performance, it is marked as a maintenance due item. TSLP is reset to 0, and the process is repeated. If the above is not the case, the process is repeated until the maintenance interval is reached. If the item is a calendar-day limited item, then the days of the month in question are utilised (i.e. 31 days for January, 28 days for February etc), instead of the library routine. The process it terminated at the end of the simulation period. It is important to mention that for each month, the same seed is used to evaluate all Maintenance Items. A new seed is drawn every time the calculation is repeated The model described in Figure 4.3 does not result in a maintenance cluster, but it does lay the basis on which the clustering process should be done. The outputs of the model are:
Maintenance Item:Time Since Last
Performed (TSLP)
Add monthlyUtilization
(CT/FH/FC/CT-FH/CT-FC)
To TSLP
Mark asMaintenance Due
MaintenanceDue item
Reset TSLP to 0
Mx ItemDue?
Simulation Clock
NO
YES
OUTPUT
INPUT
Library Routine
Maintenance Item variable:1. Time Since Last Performed
Maintenance Item Constants:a. Maintenance Interval (Mx item)b. Maintenance Item
Man-hours (Mx item)
Maintenance Due Item 1. Date when THIS item is due2. Item Man-hours required to
perform THIS item
MaintenanceItem
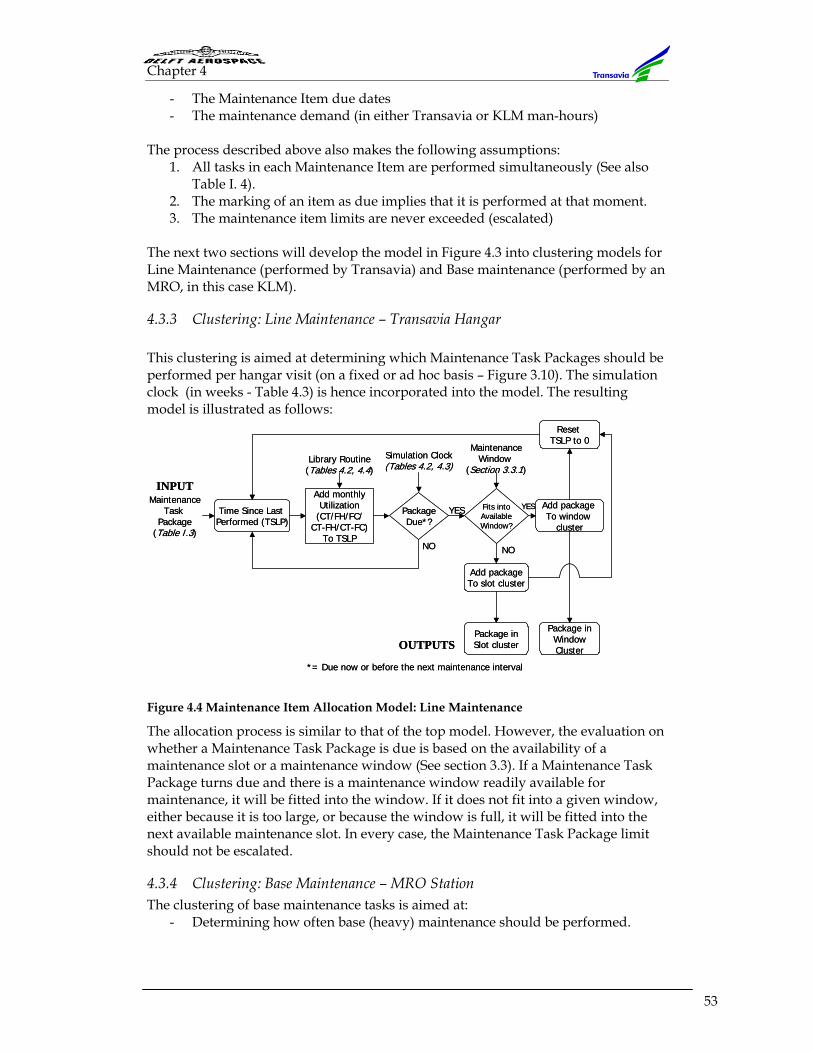
Chapter 4
53
- The Maintenance Item due dates - The maintenance demand (in either Transavia or KLM man-hours)
The process described above also makes the following assumptions:
1. All tasks in each Maintenance Item are performed simultaneously (See also Table I. 4).
2. The marking of an item as due implies that it is performed at that moment. 3. The maintenance item limits are never exceeded (escalated)
The next two sections will develop the model in Figure 4.3 into clustering models for Line Maintenance (performed by Transavia) and Base maintenance (performed by an MRO, in this case KLM).
4.3.3 Clustering: Line Maintenance – Transavia Hangar This clustering is aimed at determining which Maintenance Task Packages should be performed per hangar visit (on a fixed or ad hoc basis – Figure 3.10). The simulation clock (in weeks - Table 4.3) is hence incorporated into the model. The resulting model is illustrated as follows:
Figure 4.4 Maintenance Item Allocation Model: Line Maintenance
The allocation process is similar to that of the top model. However, the evaluation on whether a Maintenance Task Package is due is based on the availability of a maintenance slot or a maintenance window (See section 3.3). If a Maintenance Task Package turns due and there is a maintenance window readily available for maintenance, it will be fitted into the window. If it does not fit into a given window, either because it is too large, or because the window is full, it will be fitted into the next available maintenance slot. In every case, the Maintenance Task Package limit should not be escalated.
4.3.4 Clustering: Base Maintenance – MRO Station The clustering of base maintenance tasks is aimed at:
- Determining how often base (heavy) maintenance should be performed.
Time Since Last Performed (TSLP)
Add monthlyUtilization
(CT/FH/FC/CT-FH/CT-FC)
To TSLP
Add package To window
cluster
Package inWindowCluster
Reset TSLP to 0
PackageDue*?
Simulation Clock(Tables 4.2, 4.3)
NO
YES
*= Due now or before the next maintenance interval
Fits intoAvailableWindow?
YES
MaintenanceWindow
(Section 3.3.1)
Add packageTo slot cluster
Package inSlot cluster
NO
INPUT
OUTPUTS
MaintenanceTask
Package(Table I.3)
Library Routine(Tables 4.2, 4.4)
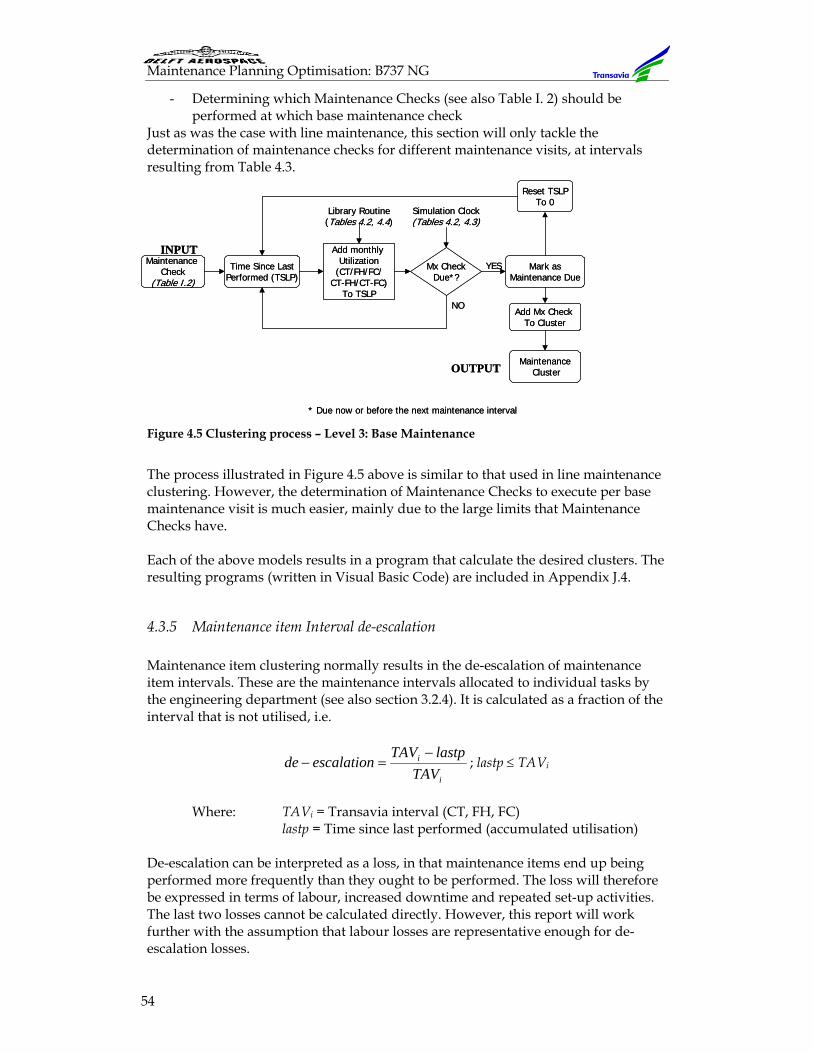
Maintenance Planning Optimisation: B737 NG
54
- Determining which Maintenance Checks (see also Table I. 2) should be performed at which base maintenance check
Just as was the case with line maintenance, this section will only tackle the determination of maintenance checks for different maintenance visits, at intervals resulting from Table 4.3.
Figure 4.5 Clustering process – Level 3: Base Maintenance
The process illustrated in Figure 4.5 above is similar to that used in line maintenance clustering. However, the determination of Maintenance Checks to execute per base maintenance visit is much easier, mainly due to the large limits that Maintenance Checks have. Each of the above models results in a program that calculate the desired clusters. The resulting programs (written in Visual Basic Code) are included in Appendix J.4.
4.3.5 Maintenance item Interval de-escalation Maintenance item clustering normally results in the de-escalation of maintenance item intervals. These are the maintenance intervals allocated to individual tasks by the engineering department (see also section 3.2.4). It is calculated as a fraction of the interval that is not utilised, i.e.
i
i
TAVlastpTAV
escalationde−
=− ; lastp ≤ TAVi
Where: TAVi = Transavia interval (CT, FH, FC)
lastp = Time since last performed (accumulated utilisation) De-escalation can be interpreted as a loss, in that maintenance items end up being performed more frequently than they ought to be performed. The loss will therefore be expressed in terms of labour, increased downtime and repeated set-up activities. The last two losses cannot be calculated directly. However, this report will work further with the assumption that labour losses are representative enough for de-escalation losses.
Time Since LastPerformed (TSLP)
Add monthly Utilization
(CT/FH/FC/CT-FH/CT-FC)
To TSLP
Mark asMaintenance Due
MaintenanceCluster
Reset TSLPTo 0
Mx CheckDue*?
NO
YES
* Due now or before the next maintenance interval
INPUT
OUTPUT
Add Mx Check To Cluster
Maintenance Check
(Table I.2)
Simulation Clock(Tables 4.2, 4.3)
Library Routine(Tables 4.2, 4.4)
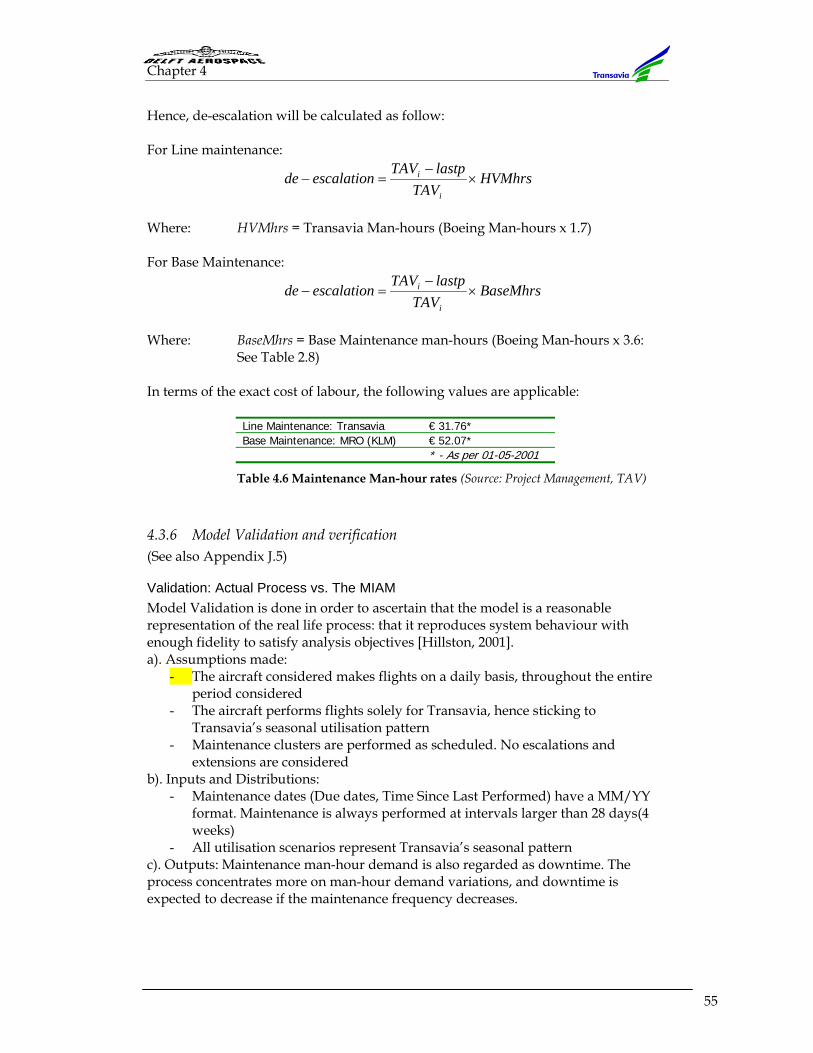
Chapter 4
55
Hence, de-escalation will be calculated as follow: For Line maintenance:
HVMhrsTAV
lastpTAVescalationde
i
i ×−
=−
Where: HVMhrs = Transavia Man-hours (Boeing Man-hours x 1.7) For Base Maintenance:
BaseMhrsTAV
lastpTAVescalationde
i
i ×−
=−
Where: BaseMhrs = Base Maintenance man-hours (Boeing Man-hours x 3.6:
See Table 2.8) In terms of the exact cost of labour, the following values are applicable:
Line Maintenance: Transavia € 31.76* Base Maintenance: MRO (KLM) € 52.07* * - As per 01-05-2001
Table 4.6 Maintenance Man-hour rates (Source: Project Management, TAV)
4.3.6 Model Validation and verification (See also Appendix J.5)
Validation: Actual Process vs. The MIAM Model Validation is done in order to ascertain that the model is a reasonable representation of the real life process: that it reproduces system behaviour with enough fidelity to satisfy analysis objectives [Hillston, 2001]. a). Assumptions made:
- The aircraft considered makes flights on a daily basis, throughout the entire period considered
- The aircraft performs flights solely for Transavia, hence sticking to Transavia’s seasonal utilisation pattern
- Maintenance clusters are performed as scheduled. No escalations and extensions are considered
b). Inputs and Distributions: - Maintenance dates (Due dates, Time Since Last Performed) have a MM/YY
format. Maintenance is always performed at intervals larger than 28 days(4 weeks)
- All utilisation scenarios represent Transavia’s seasonal pattern c). Outputs: Maintenance man-hour demand is also regarded as downtime. The process concentrates more on man-hour demand variations, and downtime is expected to decrease if the maintenance frequency decreases.
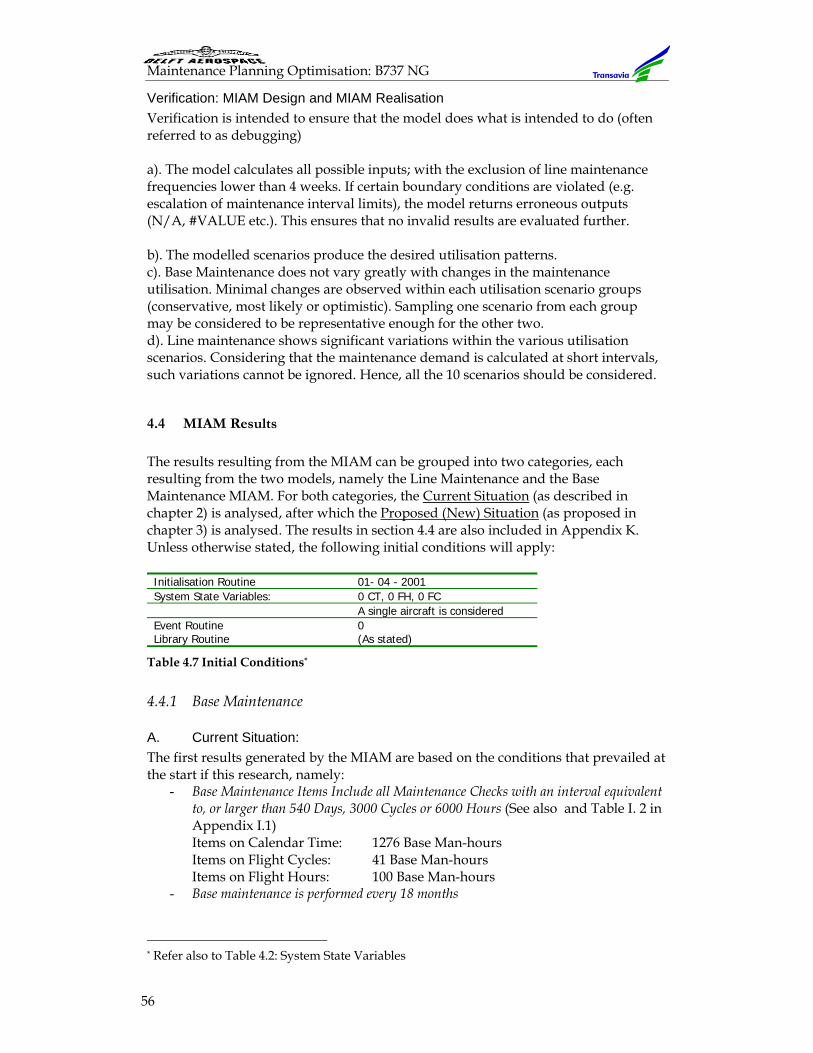
Maintenance Planning Optimisation: B737 NG
56
Verification: MIAM Design and MIAM Realisation Verification is intended to ensure that the model does what is intended to do (often referred to as debugging) a). The model calculates all possible inputs; with the exclusion of line maintenance frequencies lower than 4 weeks. If certain boundary conditions are violated (e.g. escalation of maintenance interval limits), the model returns erroneous outputs (N/A, #VALUE etc.). This ensures that no invalid results are evaluated further. b). The modelled scenarios produce the desired utilisation patterns. c). Base Maintenance does not vary greatly with changes in the maintenance utilisation. Minimal changes are observed within each utilisation scenario groups (conservative, most likely or optimistic). Sampling one scenario from each group may be considered to be representative enough for the other two. d). Line maintenance shows significant variations within the various utilisation scenarios. Considering that the maintenance demand is calculated at short intervals, such variations cannot be ignored. Hence, all the 10 scenarios should be considered.
4.4 MIAM Results
The results resulting from the MIAM can be grouped into two categories, each resulting from the two models, namely the Line Maintenance and the Base Maintenance MIAM. For both categories, the Current Situation (as described in chapter 2) is analysed, after which the Proposed (New) Situation (as proposed in chapter 3) is analysed. The results in section 4.4 are also included in Appendix K. Unless otherwise stated, the following initial conditions will apply: Initialisation Routine 01- 04 - 2001 System State Variables: 0 CT, 0 FH, 0 FC A single aircraft is considered Event Routine 0 Library Routine (As stated)
Table 4.7 Initial Conditions*
4.4.1 Base Maintenance
A. Current Situation: The first results generated by the MIAM are based on the conditions that prevailed at the start if this research, namely:
- Base Maintenance Items Include all Maintenance Checks with an interval equivalent to, or larger than 540 Days, 3000 Cycles or 6000 Hours (See also and Table I. 2 in Appendix I.1) Items on Calendar Time: 1276 Base Man-hours Items on Flight Cycles: 41 Base Man-hours Items on Flight Hours: 100 Base Man-hours
- Base maintenance is performed every 18 months
* Refer also to Table 4.2: System State Variables
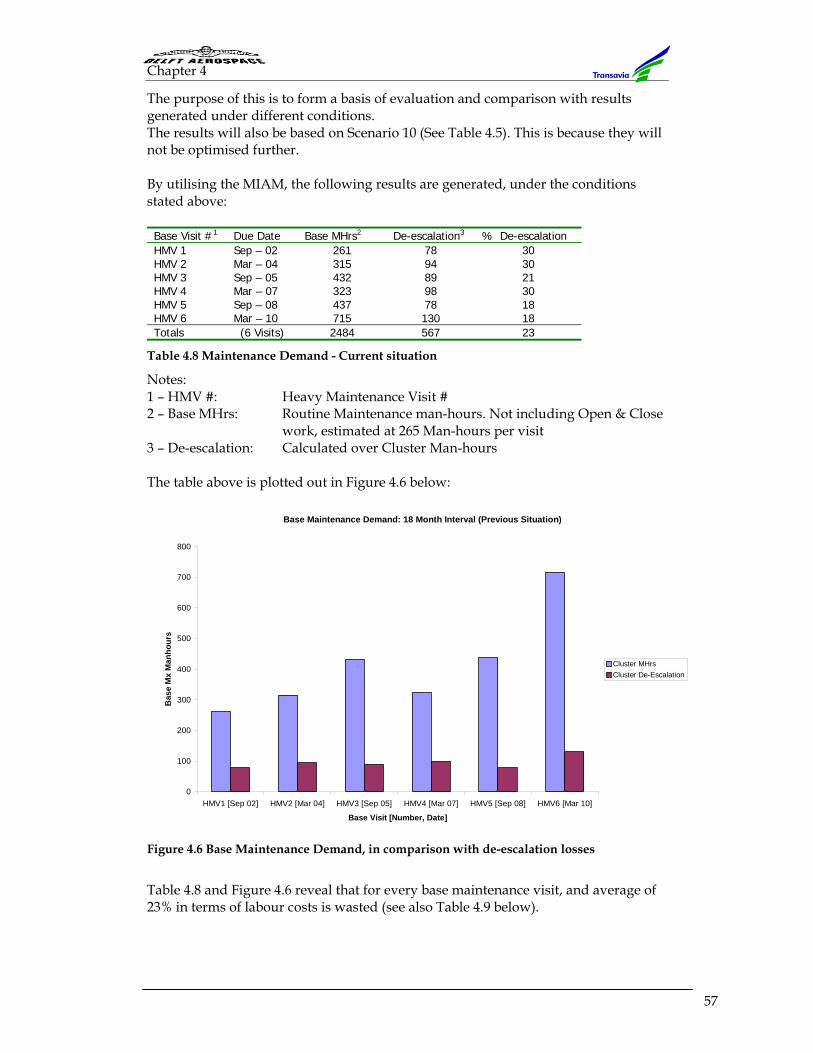
Chapter 4
57
The purpose of this is to form a basis of evaluation and comparison with results generated under different conditions. The results will also be based on Scenario 10 (See Table 4.5). This is because they will not be optimised further. By utilising the MIAM, the following results are generated, under the conditions stated above: Base Visit #1 Due Date Base MHrs2 De-escalation3 % De-escalation HMV 1 Sep – 02 261 78 30 HMV 2 Mar – 04 315 94 30 HMV 3 Sep – 05 432 89 21 HMV 4 Mar – 07 323 98 30 HMV 5 Sep – 08 437 78 18 HMV 6 Mar – 10 715 130 18 Totals (6 Visits) 2484 567 23
Table 4.8 Maintenance Demand - Current situation
Notes: 1 – HMV #: Heavy Maintenance Visit # 2 – Base MHrs: Routine Maintenance man-hours. Not including Open & Close
work, estimated at 265 Man-hours per visit 3 – De-escalation: Calculated over Cluster Man-hours The table above is plotted out in Figure 4.6 below:
Figure 4.6 Base Maintenance Demand, in comparison with de-escalation losses
Table 4.8 and Figure 4.6 reveal that for every base maintenance visit, and average of 23% in terms of labour costs is wasted (see also Table 4.9 below).
Base Maintenance Demand: 18 Month Interval (Previous Situation)
0
100
200
300
400
500
600
700
800
HMV1 [Sep 02] HMV2 [Mar 04] HMV3 [Sep 05] HMV4 [Mar 07] HMV5 [Sep 08] HMV6 [Mar 10]
Base Visit [Number, Date]
Bas
e M
x M
anho
urs
Cluster MHrsCluster De-Escalation
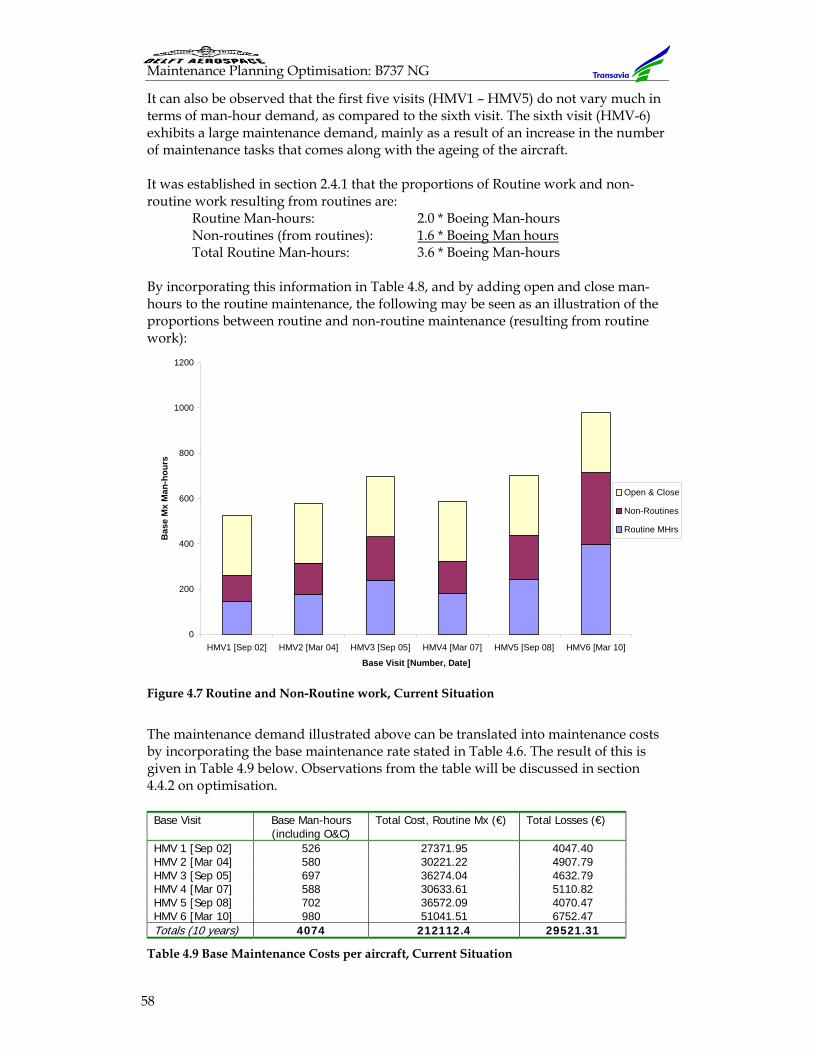
Maintenance Planning Optimisation: B737 NG
58
It can also be observed that the first five visits (HMV1 – HMV5) do not vary much in terms of man-hour demand, as compared to the sixth visit. The sixth visit (HMV-6) exhibits a large maintenance demand, mainly as a result of an increase in the number of maintenance tasks that comes along with the ageing of the aircraft. It was established in section 2.4.1 that the proportions of Routine work and non-routine work resulting from routines are:
Routine Man-hours: 2.0 * Boeing Man-hours Non-routines (from routines): 1.6 * Boeing Man hours Total Routine Man-hours: 3.6 * Boeing Man-hours By incorporating this information in Table 4.8, and by adding open and close man-hours to the routine maintenance, the following may be seen as an illustration of the proportions between routine and non-routine maintenance (resulting from routine work):
Figure 4.7 Routine and Non-Routine work, Current Situation
The maintenance demand illustrated above can be translated into maintenance costs by incorporating the base maintenance rate stated in Table 4.6. The result of this is given in Table 4.9 below. Observations from the table will be discussed in section 4.4.2 on optimisation. Base Visit Base Man-hours
(including O&C) Total Cost, Routine Mx (€) Total Losses (€)
HMV 1 [Sep 02] 526 27371.95 4047.40 HMV 2 [Mar 04] 580 30221.22 4907.79 HMV 3 [Sep 05] 697 36274.04 4632.79 HMV 4 [Mar 07] 588 30633.61 5110.82 HMV 5 [Sep 08] 702 36572.09 4070.47 HMV 6 [Mar 10] 980 51041.51 6752.47 Totals (10 years) 4074 212112.4 29521.31
Table 4.9 Base Maintenance Costs per aircraft, Current Situation
0
200
400
600
800
1000
1200
HMV1 [Sep 02] HMV2 [Mar 04] HMV3 [Sep 05] HMV4 [Mar 07] HMV5 [Sep 08] HMV6 [Mar 10]
Base Visit [Number, Date]
Bas
e M
x M
an-h
ours
Open & Close
Non-Routines
Routine MHrs
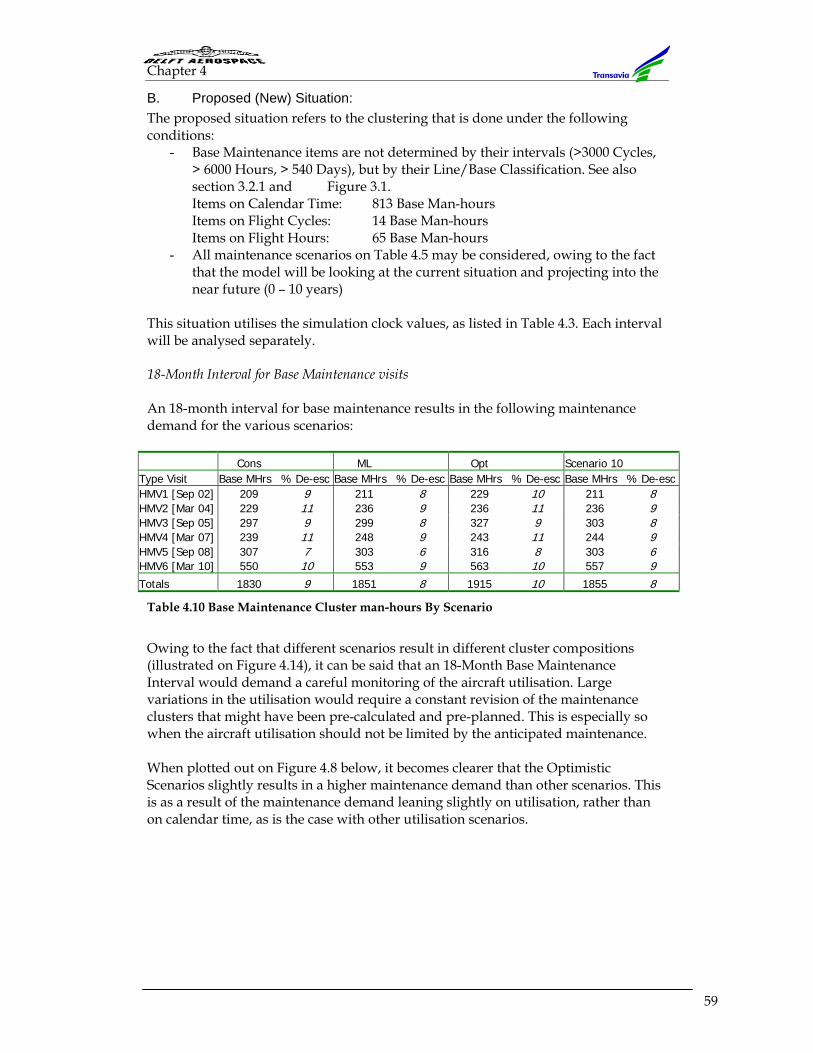
Chapter 4
59
B. Proposed (New) Situation: The proposed situation refers to the clustering that is done under the following conditions:
- Base Maintenance items are not determined by their intervals (>3000 Cycles, > 6000 Hours, > 540 Days), but by their Line/Base Classification. See also section 3.2.1 and Figure 3.1. Items on Calendar Time: 813 Base Man-hours Items on Flight Cycles: 14 Base Man-hours Items on Flight Hours: 65 Base Man-hours
- All maintenance scenarios on Table 4.5 may be considered, owing to the fact that the model will be looking at the current situation and projecting into the near future (0 – 10 years)
This situation utilises the simulation clock values, as listed in Table 4.3. Each interval will be analysed separately. 18-Month Interval for Base Maintenance visits An 18-month interval for base maintenance results in the following maintenance demand for the various scenarios:
Cons ML Opt Scenario 10 Type Visit Base MHrs % De-esc Base MHrs % De-esc Base MHrs % De-esc Base MHrs % De-escHMV1 [Sep 02] 209 9 211 8 229 10 211 8 HMV2 [Mar 04] 229 11 236 9 236 11 236 9 HMV3 [Sep 05] 297 9 299 8 327 9 303 8 HMV4 [Mar 07] 239 11 248 9 243 11 244 9 HMV5 [Sep 08] 307 7 303 6 316 8 303 6 HMV6 [Mar 10] 550 10 553 9 563 10 557 9 Totals 1830 9 1851 8 1915 10 1855 8
Table 4.10 Base Maintenance Cluster man-hours By Scenario
Owing to the fact that different scenarios result in different cluster compositions (illustrated on Figure 4.14), it can be said that an 18-Month Base Maintenance Interval would demand a careful monitoring of the aircraft utilisation. Large variations in the utilisation would require a constant revision of the maintenance clusters that might have been pre-calculated and pre-planned. This is especially so when the aircraft utilisation should not be limited by the anticipated maintenance. When plotted out on Figure 4.8 below, it becomes clearer that the Optimistic Scenarios slightly results in a higher maintenance demand than other scenarios. This is as a result of the maintenance demand leaning slightly on utilisation, rather than on calendar time, as is the case with other utilisation scenarios.
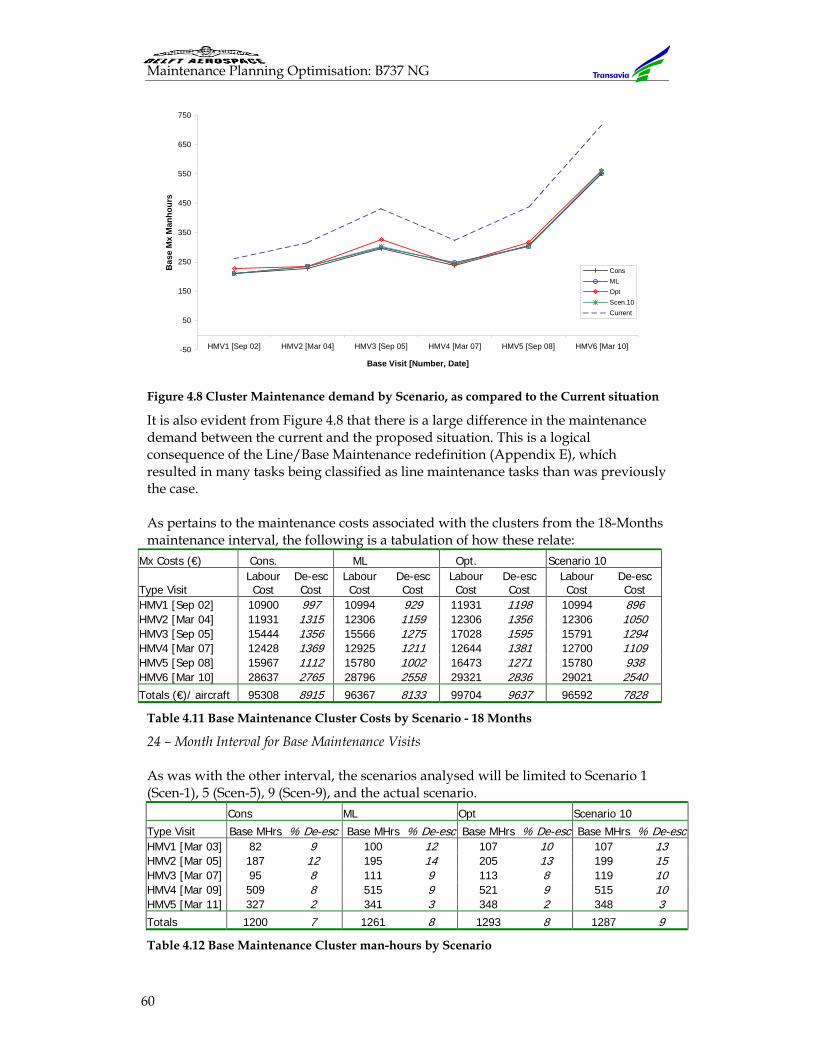
Maintenance Planning Optimisation: B737 NG
60
Figure 4.8 Cluster Maintenance demand by Scenario, as compared to the Current situation
It is also evident from Figure 4.8 that there is a large difference in the maintenance demand between the current and the proposed situation. This is a logical consequence of the Line/Base Maintenance redefinition (Appendix E), which resulted in many tasks being classified as line maintenance tasks than was previously the case. As pertains to the maintenance costs associated with the clusters from the 18-Months maintenance interval, the following is a tabulation of how these relate:
Mx Costs (€) Cons. ML Opt. Scenario 10
Type Visit Labour Cost
De-esc Cost
Labour Cost
De-esc Cost
Labour Cost
De-esc Cost
Labour Cost
De-esc Cost
HMV1 [Sep 02] 10900 997 10994 929 11931 1198 10994 896 HMV2 [Mar 04] 11931 1315 12306 1159 12306 1356 12306 1050 HMV3 [Sep 05] 15444 1356 15566 1275 17028 1595 15791 1294 HMV4 [Mar 07] 12428 1369 12925 1211 12644 1381 12700 1109 HMV5 [Sep 08] 15967 1112 15780 1002 16473 1271 15780 938 HMV6 [Mar 10] 28637 2765 28796 2558 29321 2836 29021 2540 Totals (€)/ aircraft 95308 8915 96367 8133 99704 9637 96592 7828
Table 4.11 Base Maintenance Cluster Costs by Scenario - 18 Months
24 – Month Interval for Base Maintenance Visits As was with the other interval, the scenarios analysed will be limited to Scenario 1 (Scen-1), 5 (Scen-5), 9 (Scen-9), and the actual scenario. Cons ML Opt Scenario 10 Type Visit Base MHrs % De-esc Base MHrs % De-esc Base MHrs % De-esc Base MHrs % De-escHMV1 [Mar 03] 82 9 100 12 107 10 107 13 HMV2 [Mar 05] 187 12 195 14 205 13 199 15 HMV3 [Mar 07] 95 8 111 9 113 8 119 10 HMV4 [Mar 09] 509 8 515 9 521 9 515 10 HMV5 [Mar 11] 327 2 341 3 348 2 348 3 Totals 1200 7 1261 8 1293 8 1287 9
Table 4.12 Base Maintenance Cluster man-hours by Scenario
-50
50
150
250
350
450
550
650
750
HMV1 [Sep 02] HMV2 [Mar 04] HMV3 [Sep 05] HMV4 [Mar 07] HMV5 [Sep 08] HMV6 [Mar 10]
Base Visit [Number, Date]
Bas
e M
x M
anho
urs
ConsMLOptScen.10Current
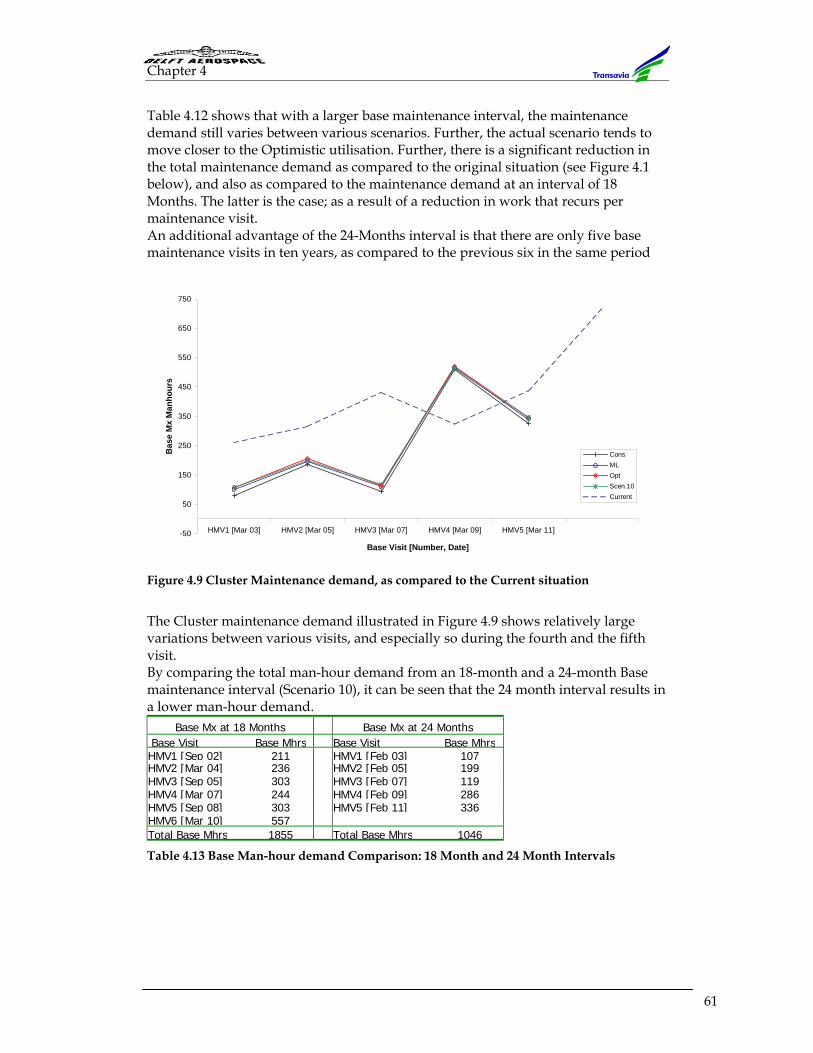
Chapter 4
61
Table 4.12 shows that with a larger base maintenance interval, the maintenance demand still varies between various scenarios. Further, the actual scenario tends to move closer to the Optimistic utilisation. Further, there is a significant reduction in the total maintenance demand as compared to the original situation (see Figure 4.1 below), and also as compared to the maintenance demand at an interval of 18 Months. The latter is the case; as a result of a reduction in work that recurs per maintenance visit. An additional advantage of the 24-Months interval is that there are only five base maintenance visits in ten years, as compared to the previous six in the same period
Figure 4.9 Cluster Maintenance demand, as compared to the Current situation
The Cluster maintenance demand illustrated in Figure 4.9 shows relatively large variations between various visits, and especially so during the fourth and the fifth visit. By comparing the total man-hour demand from an 18-month and a 24-month Base maintenance interval (Scenario 10), it can be seen that the 24 month interval results in a lower man-hour demand.
Base Mx at 18 Months Base Mx at 24 Months Base Visit Base Mhrs Base Visit Base MhrsHMV1 [Sep 02] 211 HMV1 [Feb 03] 107HMV2 [Mar 04] 236 HMV2 [Feb 05] 199HMV3 [Sep 05] 303 HMV3 [Feb 07] 119HMV4 [Mar 07] 244 HMV4 [Feb 09] 286HMV5 [Sep 08] 303 HMV5 [Feb 11] 336HMV6 [Mar 10] 557 Total Base Mhrs 1855 Total Base Mhrs 1046
Table 4.13 Base Man-hour demand Comparison: 18 Month and 24 Month Intervals
-50
50
150
250
350
450
550
650
750
HMV1 [Mar 03] HMV2 [Mar 05] HMV3 [Mar 07] HMV4 [Mar 09] HMV5 [Mar 11]
Base Visit [Number, Date]
Bas
e M
x M
anho
urs
ConsMLOptScen.10Current
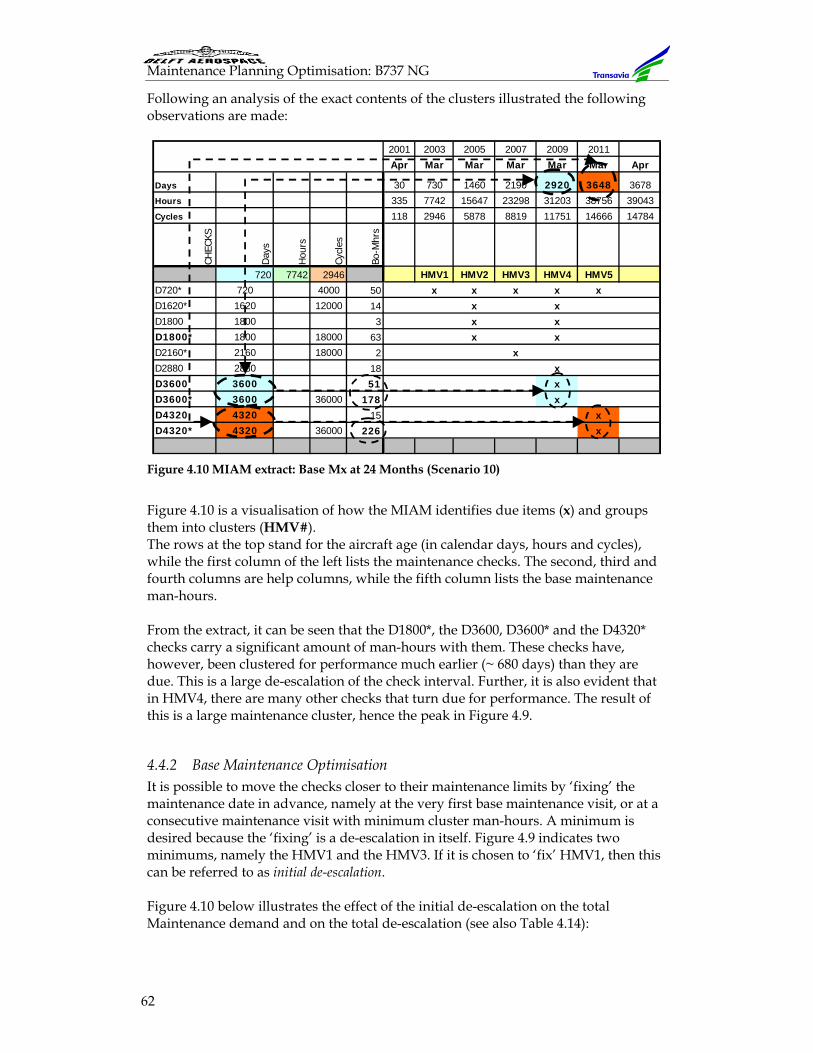
Maintenance Planning Optimisation: B737 NG
62
Following an analysis of the exact contents of the clusters illustrated the following observations are made:
Figure 4.10 MIAM extract: Base Mx at 24 Months (Scenario 10)
Figure 4.10 is a visualisation of how the MIAM identifies due items (x) and groups them into clusters (HMV#). The rows at the top stand for the aircraft age (in calendar days, hours and cycles), while the first column of the left lists the maintenance checks. The second, third and fourth columns are help columns, while the fifth column lists the base maintenance man-hours. From the extract, it can be seen that the D1800*, the D3600, D3600* and the D4320* checks carry a significant amount of man-hours with them. These checks have, however, been clustered for performance much earlier (~ 680 days) than they are due. This is a large de-escalation of the check interval. Further, it is also evident that in HMV4, there are many other checks that turn due for performance. The result of this is a large maintenance cluster, hence the peak in Figure 4.9.
4.4.2 Base Maintenance Optimisation It is possible to move the checks closer to their maintenance limits by ‘fixing’ the maintenance date in advance, namely at the very first base maintenance visit, or at a consecutive maintenance visit with minimum cluster man-hours. A minimum is desired because the ‘fixing’ is a de-escalation in itself. Figure 4.9 indicates two minimums, namely the HMV1 and the HMV3. If it is chosen to ‘fix’ HMV1, then this can be referred to as initial de-escalation. Figure 4.10 below illustrates the effect of the initial de-escalation on the total Maintenance demand and on the total de-escalation (see also Table 4.14):
hzy 2001 2003 2005 2007 2009 2011
hzl Frequency 35 0 Apr Mar Mar Mar Mar Mar Apr
Days 30 730 1460 2190 2920 3648 3678
Hours 335 7742 15647 23298 31203 38756 39043
Cycles 118 2946 5878 8819 11751 14666 14784CH
ECKS
Day
s
Hou
rs
Cycl
es
Bo-M
hrs
720 7742 2946 HMV1 HMV2 HMV3 HMV4 HMV5D720* 720 4000 50 x x x x x D1620* 1620 12000 14 x x D1800 1800 3 x x D1800* 1800 18000 63 x x D2160* 2160 18000 2 x D2880 2880 18 x D3600 3600 51 x D3600* 3600 36000 178 x D4320 4320 15 x D4320* 4320 36000 226 x
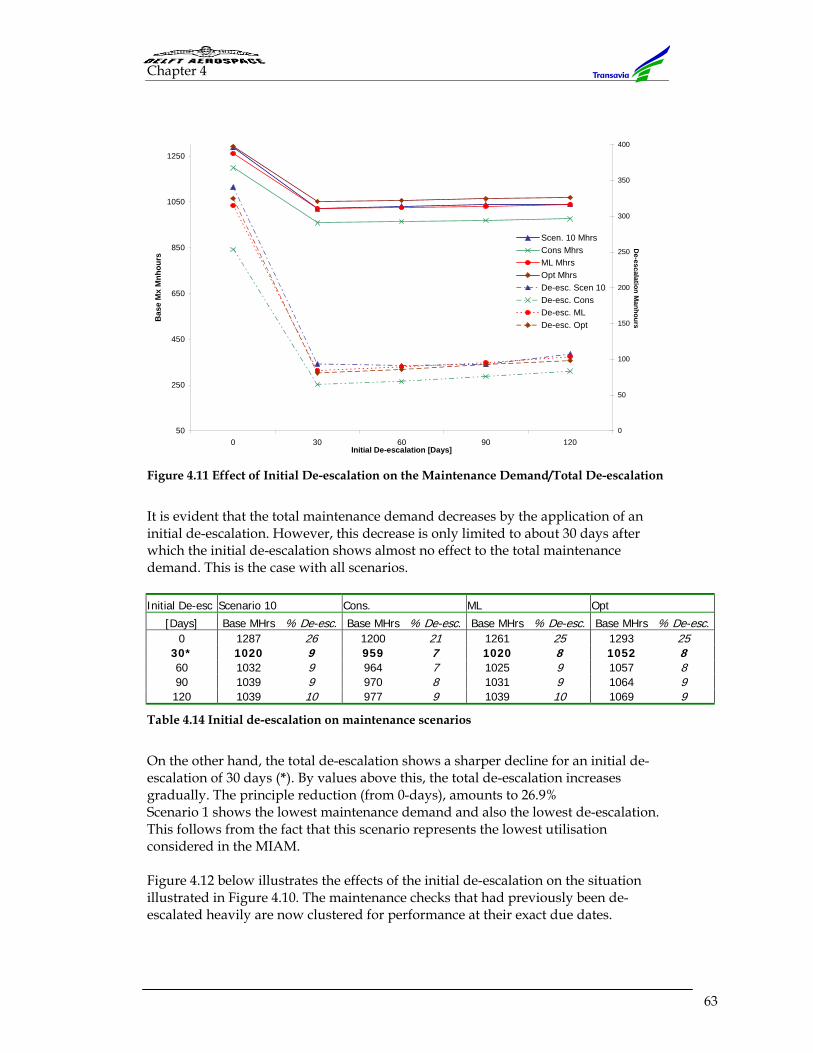
Chapter 4
63
Figure 4.11 Effect of Initial De-escalation on the Maintenance Demand/Total De-escalation
It is evident that the total maintenance demand decreases by the application of an initial de-escalation. However, this decrease is only limited to about 30 days after which the initial de-escalation shows almost no effect to the total maintenance demand. This is the case with all scenarios. Initial De-esc Scenario 10 Cons. ML Opt
[Days] Base MHrs % De-esc. Base MHrs % De-esc. Base MHrs % De-esc. Base MHrs % De-esc.0 1287 26 1200 21 1261 25 1293 25
30* 1020 9 959 7 1020 8 1052 8 60 1032 9 964 7 1025 9 1057 8 90 1039 9 970 8 1031 9 1064 9 120 1039 10 977 9 1039 10 1069 9
Table 4.14 Initial de-escalation on maintenance scenarios
On the other hand, the total de-escalation shows a sharper decline for an initial de-escalation of 30 days (*). By values above this, the total de-escalation increases gradually. The principle reduction (from 0-days), amounts to 26.9% Scenario 1 shows the lowest maintenance demand and also the lowest de-escalation. This follows from the fact that this scenario represents the lowest utilisation considered in the MIAM. Figure 4.12 below illustrates the effects of the initial de-escalation on the situation illustrated in Figure 4.10. The maintenance checks that had previously been de-escalated heavily are now clustered for performance at their exact due dates.
50
250
450
650
850
1050
1250
0 30 60 90 120Initial De-escalation [Days]
Bas
e M
x M
nhou
rs
0
50
100
150
200
250
300
350
400
De-escalation M
anhours
Scen. 10 MhrsCons MhrsML MhrsOpt MhrsDe-esc. Scen 10De-esc. ConsDe-esc. MLDe-esc. Opt
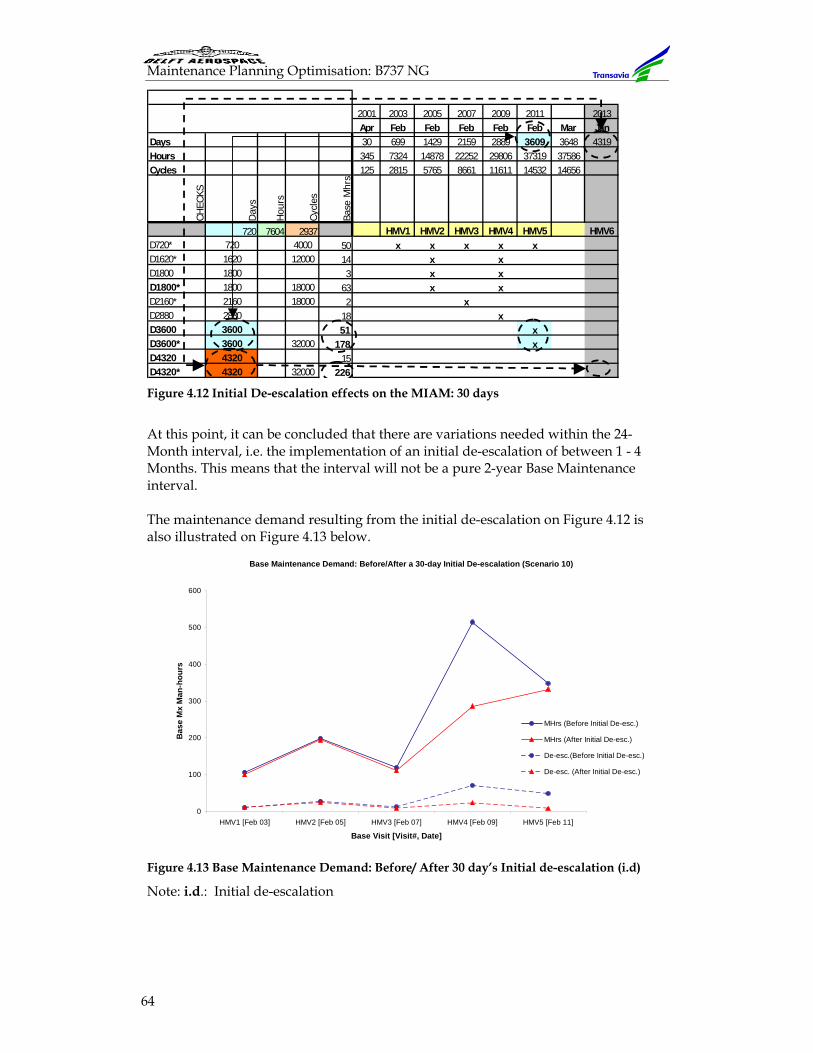
Maintenance Planning Optimisation: B737 NG
64
Figure 4.12 Initial De-escalation effects on the MIAM: 30 days
At this point, it can be concluded that there are variations needed within the 24-Month interval, i.e. the implementation of an initial de-escalation of between 1 - 4 Months. This means that the interval will not be a pure 2-year Base Maintenance interval. The maintenance demand resulting from the initial de-escalation on Figure 4.12 is also illustrated on Figure 4.13 below.
Figure 4.13 Base Maintenance Demand: Before/ After 30 day’s Initial de-escalation (i.d)
Note: i.d.: Initial de-escalation
Base Maintenance Demand: Before/After a 30-day Initial De-escalation (Scenario 10)
0
100
200
300
400
500
600
HMV1 [Feb 03] HMV2 [Feb 05] HMV3 [Feb 07] HMV4 [Feb 09] HMV5 [Feb 11]
Base Visit [Visit#, Date]
Bas
e M
x M
an-h
ours
MHrs (Before Initial De-esc.)
MHrs (After Initial De-esc.)
De-esc.(Before Initial De-esc.)
De-esc. (After Initial De-esc.)
2001 2003 2005 2007 2009 2011 2013Apr Feb Feb Feb Feb Feb Mar Jan
Days 30 699 1429 2159 2889 3609 3648 4319Hours 345 7324 14878 22252 29806 37319 37586Cycles 125 2815 5765 8661 11611 14532 14656
CHEC
KS
Day
s
Hou
rs
Cycl
es
Base
Mhr
s
720 7604 2937 HMV1 HMV2 HMV3 HMV4 HMV5 HMV6D720* 720 4000 50 x x x x x D1620* 1620 12000 14 x x D1800 1800 3 x x D1800* 1800 18000 63 x x D2160* 2160 18000 2 x D2880 2880 18 x D3600 3600 51 x D3600* 3600 32000 178 x D4320 4320 15 D4320* 4320 32000 226
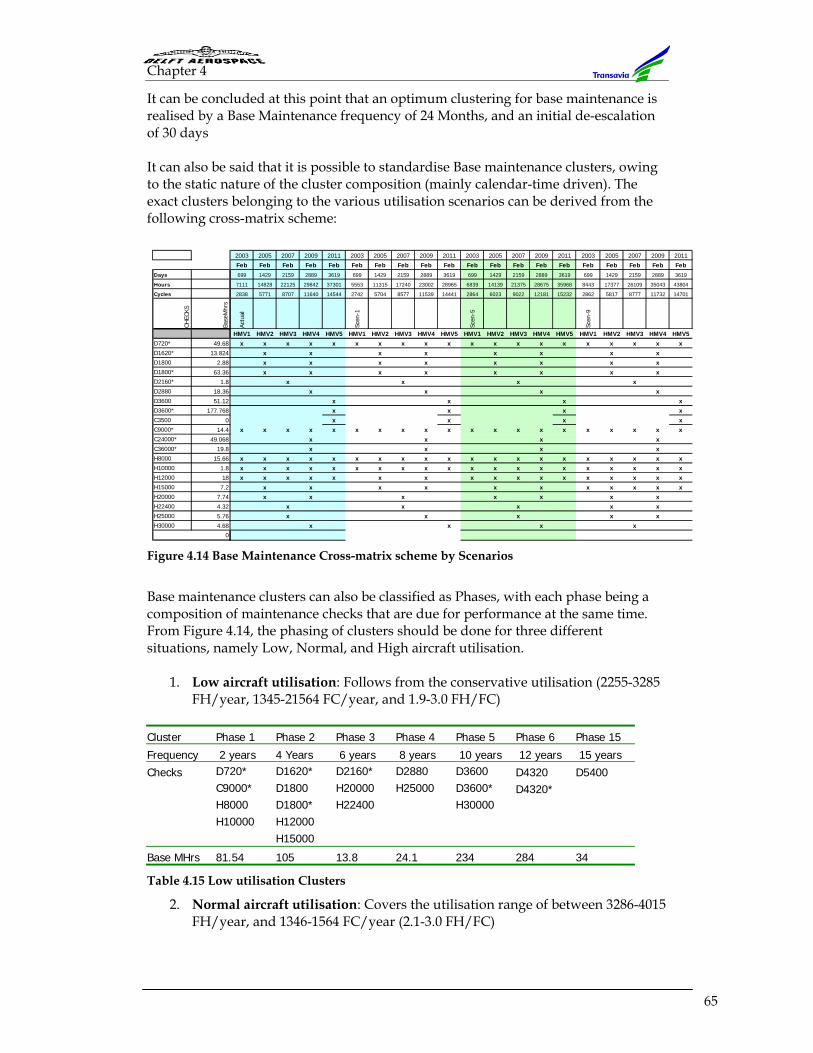
Chapter 4
65
It can be concluded at this point that an optimum clustering for base maintenance is realised by a Base Maintenance frequency of 24 Months, and an initial de-escalation of 30 days It can also be said that it is possible to standardise Base maintenance clusters, owing to the static nature of the cluster composition (mainly calendar-time driven). The exact clusters belonging to the various utilisation scenarios can be derived from the following cross-matrix scheme:
Figure 4.14 Base Maintenance Cross-matrix scheme by Scenarios
Base maintenance clusters can also be classified as Phases, with each phase being a composition of maintenance checks that are due for performance at the same time. From Figure 4.14, the phasing of clusters should be done for three different situations, namely Low, Normal, and High aircraft utilisation.
1. Low aircraft utilisation: Follows from the conservative utilisation (2255-3285 FH/year, 1345-21564 FC/year, and 1.9-3.0 FH/FC)
Cluster Phase 1 Phase 2 Phase 3 Phase 4 Phase 5 Phase 6 Phase 15
Frequency 2 years 4 Years 6 years 8 years 10 years 12 years 15 years
Checks D720* D1620* D2160* D2880 D3600 D4320 D5400 C9000* D1800 H20000 H25000 D3600* D4320* H8000 D1800* H22400 H30000 H10000 H12000 H15000
Base MHrs 81.54 105 13.8 24.1 234 284 34
Table 4.15 Low utilisation Clusters
2. Normal aircraft utilisation: Covers the utilisation range of between 3286-4015 FH/year, and 1346-1564 FC/year (2.1-3.0 FH/FC)
2003 2005 2007 2009 2011 2003 2005 2007 2009 2011 2003 2005 2007 2009 2011 2003 2005 2007 2009 2011
Feb Feb Feb Feb Feb Feb Feb Feb Feb Feb Feb Feb Feb Feb Feb Feb Feb Feb Feb FebDays 699 1429 2159 2889 3619 699 1429 2159 2889 3619 699 1429 2159 2889 3619 699 1429 2159 2889 3619
Hours 7111 14828 22125 29842 37301 5553 11315 17240 23002 28965 6839 14139 21375 28675 35968 8443 17377 26109 35043 43804
Cycles 2838 5771 8707 11640 14544 2742 5704 8577 11539 14441 2864 6023 9022 12181 15232 2862 5817 8777 11732 14701
CHEC
KS
Base
Mhr
s
Actu
al
Scen
-1
Scen
-5
Scen
-9
HMV1 HMV2 HMV3 HMV4 HMV5 HMV1 HMV2 HMV3 HMV4 HMV5 HMV1 HMV2 HMV3 HMV4 HMV5 HMV1 HMV2 HMV3 HMV4 HMV5D720* 49.68 x x x x x x x x x x x x x x x x x x x xD1620* 13.824 x x x x x x x x D1800 2.88 x x x x x x x x D1800* 63.36 x x x x x x x x D2160* 1.8 x x x x D2880 18.36 x x x x D3600 51.12 x x x xD3600* 177.768 x x x xC3500 0 x x x xC9000* 14.4 x x x x x x x x x x x x x x x x x x x xC24000* 49.068 x x x x C36000* 19.8 x x x x H8000 15.66 x x x x x x x x x x x x x x x x x x x xH10000 1.8 x x x x x x x x x x x x x x x x x x x xH12000 18 x x x x x x x x x x x x x x x x xH15000 7.2 x x x x x x x x x x xH20000 7.74 x x x x x x x H22400 4.32 x x x x x H25000 5.76 x x x x x H30000 4.68 x x x x
0
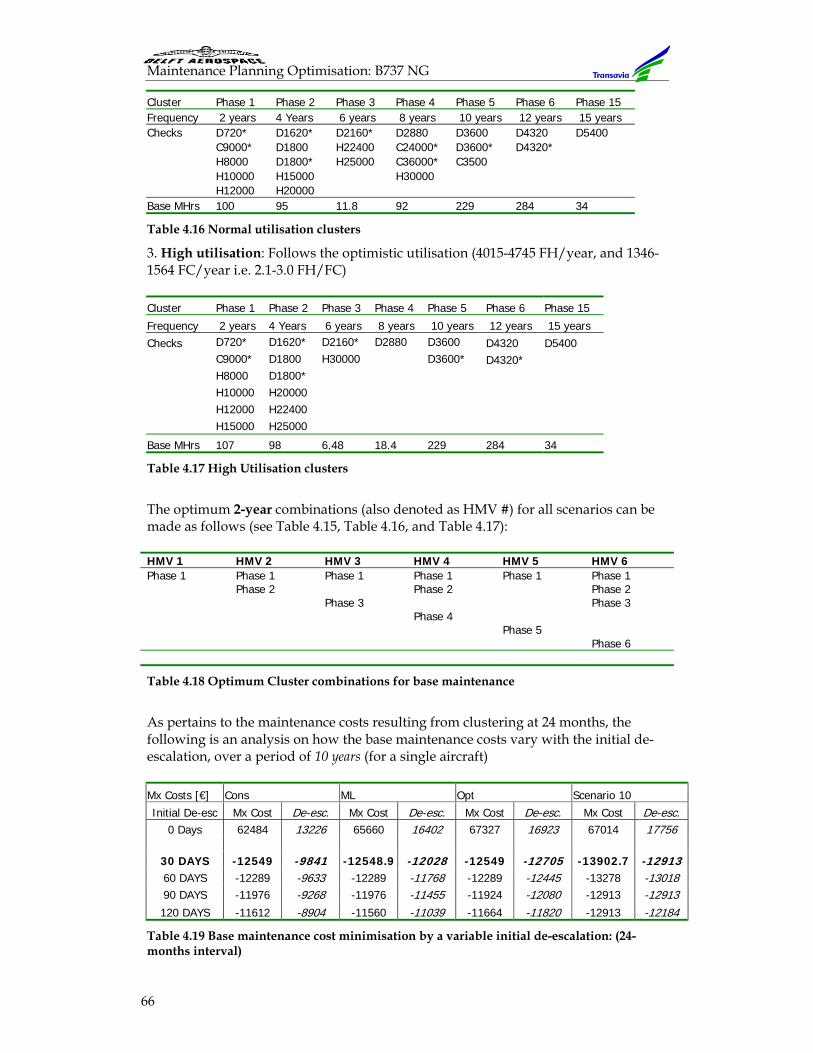
Maintenance Planning Optimisation: B737 NG
66
Cluster Phase 1 Phase 2 Phase 3 Phase 4 Phase 5 Phase 6 Phase 15 Frequency 2 years 4 Years 6 years 8 years 10 years 12 years 15 years Checks D720* D1620* D2160* D2880 D3600 D4320 D5400 C9000* D1800 H22400 C24000* D3600* D4320* H8000 D1800* H25000 C36000* C3500 H10000 H15000 H30000 H12000 H20000 Base MHrs 100 95 11.8 92 229 284 34
Table 4.16 Normal utilisation clusters
3. High utilisation: Follows the optimistic utilisation (4015-4745 FH/year, and 1346-1564 FC/year i.e. 2.1-3.0 FH/FC) Cluster Phase 1 Phase 2 Phase 3 Phase 4 Phase 5 Phase 6 Phase 15
Frequency 2 years 4 Years 6 years 8 years 10 years 12 years 15 years Checks D720* D1620* D2160* D2880 D3600 D4320 D5400 C9000* D1800 H30000 D3600* D4320* H8000 D1800* H10000 H20000 H12000 H22400 H15000 H25000
Base MHrs 107 98 6.48 18.4 229 284 34
Table 4.17 High Utilisation clusters
The optimum 2-year combinations (also denoted as HMV #) for all scenarios can be made as follows (see Table 4.15, Table 4.16, and Table 4.17): HMV 1 HMV 2 HMV 3 HMV 4 HMV 5 HMV 6 Phase 1 Phase 1 Phase 1 Phase 1 Phase 1 Phase 1 Phase 2 Phase 2 Phase 2 Phase 3 Phase 3 Phase 4 Phase 5 Phase 6
Table 4.18 Optimum Cluster combinations for base maintenance
As pertains to the maintenance costs resulting from clustering at 24 months, the following is an analysis on how the base maintenance costs vary with the initial de-escalation, over a period of 10 years (for a single aircraft) Mx Costs [€] Cons ML Opt Scenario 10 Initial De-esc Mx Cost De-esc. Mx Cost De-esc. Mx Cost De-esc. Mx Cost De-esc.
0 Days 62484 13226 65660 16402 67327 16923 67014 17756
30 DAYS -12549 -9841 -12548.9 -12028 -12549 -12705 -13902.7 -1291360 DAYS -12289 -9633 -12289 -11768 -12289 -12445 -13278 -13018 90 DAYS -11976 -9268 -11976 -11455 -11924 -12080 -12913 -12913 120 DAYS -11612 -8904 -11560 -11039 -11664 -11820 -12913 -12184
Table 4.19 Base maintenance cost minimisation by a variable initial de-escalation: (24-months interval)
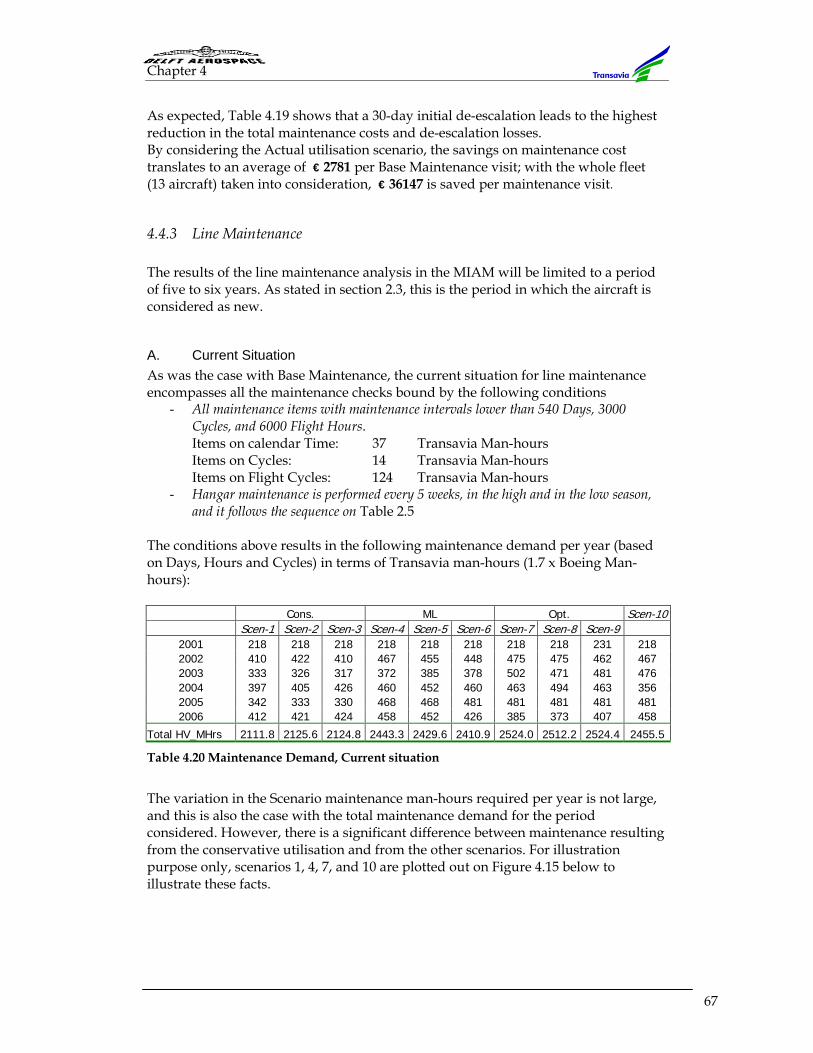
Chapter 4
67
As expected, Table 4.19 shows that a 30-day initial de-escalation leads to the highest reduction in the total maintenance costs and de-escalation losses. By considering the Actual utilisation scenario, the savings on maintenance cost translates to an average of € 2781 per Base Maintenance visit; with the whole fleet (13 aircraft) taken into consideration, € 36147 is saved per maintenance visit.
4.4.3 Line Maintenance The results of the line maintenance analysis in the MIAM will be limited to a period of five to six years. As stated in section 2.3, this is the period in which the aircraft is considered as new.
A. Current Situation As was the case with Base Maintenance, the current situation for line maintenance encompasses all the maintenance checks bound by the following conditions
- All maintenance items with maintenance intervals lower than 540 Days, 3000 Cycles, and 6000 Flight Hours. Items on calendar Time: 37 Transavia Man-hours Items on Cycles: 14 Transavia Man-hours Items on Flight Cycles: 124 Transavia Man-hours
- Hangar maintenance is performed every 5 weeks, in the high and in the low season, and it follows the sequence on Table 2.5
The conditions above results in the following maintenance demand per year (based on Days, Hours and Cycles) in terms of Transavia man-hours (1.7 x Boeing Man-hours):
Cons. ML Opt. Scen-10 Scen-1 Scen-2 Scen-3 Scen-4 Scen-5 Scen-6 Scen-7 Scen-8 Scen-9
2001 218 218 218 218 218 218 218 218 231 218 2002 410 422 410 467 455 448 475 475 462 467 2003 333 326 317 372 385 378 502 471 481 476 2004 397 405 426 460 452 460 463 494 463 356 2005 342 333 330 468 468 481 481 481 481 481 2006 412 421 424 458 452 426 385 373 407 458
Total HV_MHrs 2111.8 2125.6 2124.8 2443.3 2429.6 2410.9 2524.0 2512.2 2524.4 2455.5
Table 4.20 Maintenance Demand, Current situation
The variation in the Scenario maintenance man-hours required per year is not large, and this is also the case with the total maintenance demand for the period considered. However, there is a significant difference between maintenance resulting from the conservative utilisation and from the other scenarios. For illustration purpose only, scenarios 1, 4, 7, and 10 are plotted out on Figure 4.15 below to illustrate these facts.
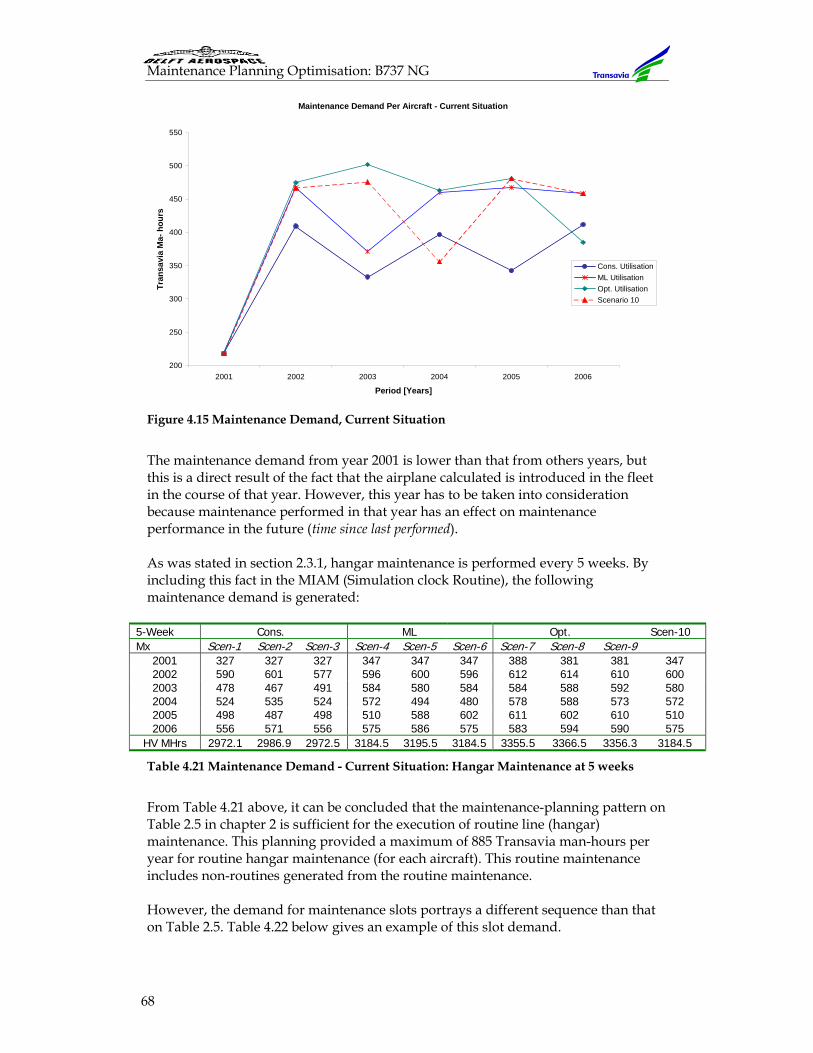
Maintenance Planning Optimisation: B737 NG
68
Figure 4.15 Maintenance Demand, Current Situation
The maintenance demand from year 2001 is lower than that from others years, but this is a direct result of the fact that the airplane calculated is introduced in the fleet in the course of that year. However, this year has to be taken into consideration because maintenance performed in that year has an effect on maintenance performance in the future (time since last performed). As was stated in section 2.3.1, hangar maintenance is performed every 5 weeks. By including this fact in the MIAM (Simulation clock Routine), the following maintenance demand is generated:
5-Week Cons. ML Opt. Scen-10 Mx Scen-1 Scen-2 Scen-3 Scen-4 Scen-5 Scen-6 Scen-7 Scen-8 Scen-9
2001 327 327 327 347 347 347 388 381 381 347 2002 590 601 577 596 600 596 612 614 610 600 2003 478 467 491 584 580 584 584 588 592 580 2004 524 535 524 572 494 480 578 588 573 572 2005 498 487 498 510 588 602 611 602 610 510 2006 556 571 556 575 586 575 583 594 590 575
HV MHrs 2972.1 2986.9 2972.5 3184.5 3195.5 3184.5 3355.5 3366.5 3356.3 3184.5
Table 4.21 Maintenance Demand - Current Situation: Hangar Maintenance at 5 weeks
From Table 4.21 above, it can be concluded that the maintenance-planning pattern on Table 2.5 in chapter 2 is sufficient for the execution of routine line (hangar) maintenance. This planning provided a maximum of 885 Transavia man-hours per year for routine hangar maintenance (for each aircraft). This routine maintenance includes non-routines generated from the routine maintenance. However, the demand for maintenance slots portrays a different sequence than that on Table 2.5. Table 4.22 below gives an example of this slot demand.
Maintenance Demand Per Aircraft - Current Situation
200
250
300
350
400
450
500
550
2001 2002 2003 2004 2005 2006
Period [Years]
Tran
savi
a M
a- h
ours
Cons. UtilisationML UtilisationOpt. UtilisationScenario 10
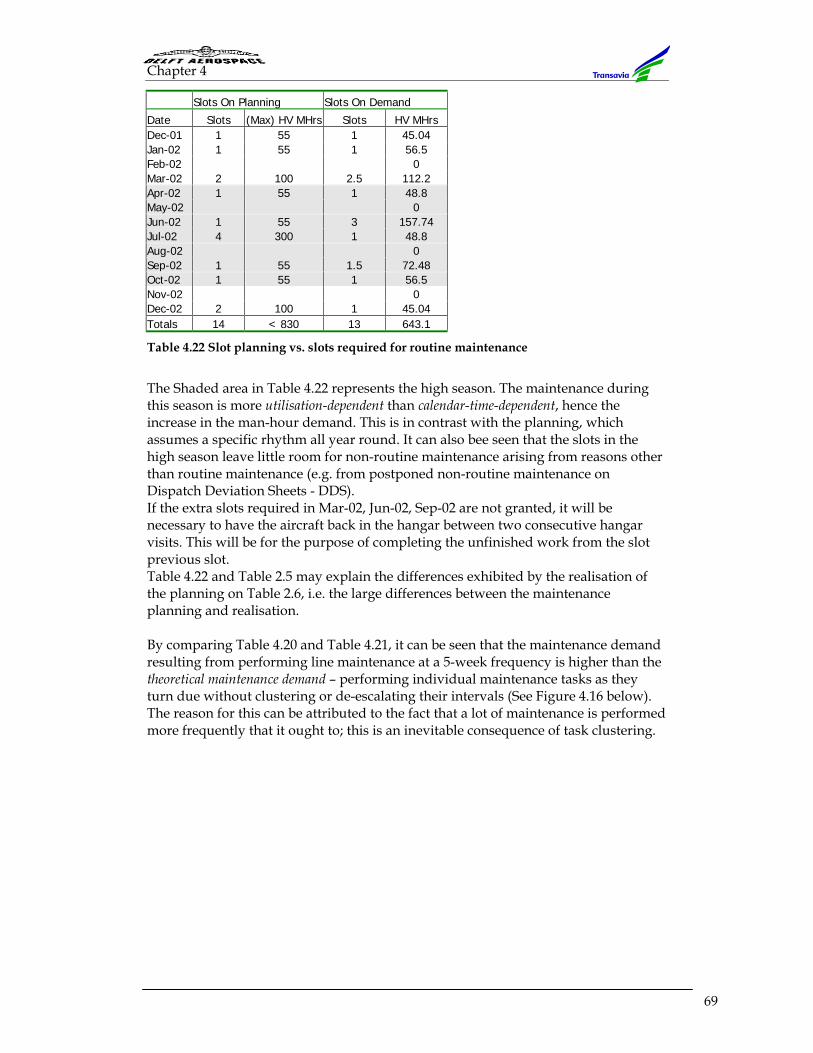
Chapter 4
69
Slots On Planning Slots On Demand
Date Slots (Max) HV MHrs Slots HV MHrs Dec-01 1 55 1 45.04 Jan-02 1 55 1 56.5 Feb-02 0 Mar-02 2 100 2.5 112.2 Apr-02 1 55 1 48.8 May-02 0 Jun-02 1 55 3 157.74 Jul-02 4 300 1 48.8 Aug-02 0 Sep-02 1 55 1.5 72.48 Oct-02 1 55 1 56.5 Nov-02 0 Dec-02 2 100 1 45.04 Totals 14 < 830 13 643.1
Table 4.22 Slot planning vs. slots required for routine maintenance
The Shaded area in Table 4.22 represents the high season. The maintenance during this season is more utilisation-dependent than calendar-time-dependent, hence the increase in the man-hour demand. This is in contrast with the planning, which assumes a specific rhythm all year round. It can also bee seen that the slots in the high season leave little room for non-routine maintenance arising from reasons other than routine maintenance (e.g. from postponed non-routine maintenance on Dispatch Deviation Sheets - DDS). If the extra slots required in Mar-02, Jun-02, Sep-02 are not granted, it will be necessary to have the aircraft back in the hangar between two consecutive hangar visits. This will be for the purpose of completing the unfinished work from the slot previous slot. Table 4.22 and Table 2.5 may explain the differences exhibited by the realisation of the planning on Table 2.6, i.e. the large differences between the maintenance planning and realisation. By comparing Table 4.20 and Table 4.21, it can be seen that the maintenance demand resulting from performing line maintenance at a 5-week frequency is higher than the theoretical maintenance demand – performing individual maintenance tasks as they turn due without clustering or de-escalating their intervals (See Figure 4.16 below). The reason for this can be attributed to the fact that a lot of maintenance is performed more frequently that it ought to; this is an inevitable consequence of task clustering.
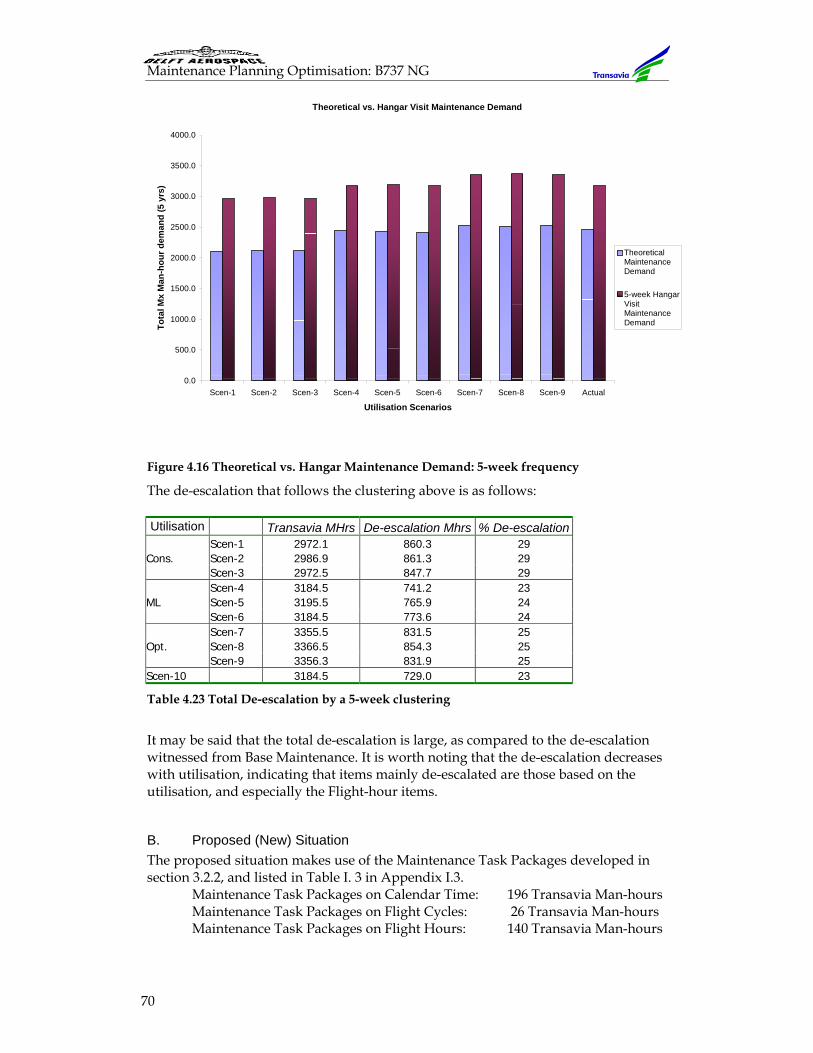
Maintenance Planning Optimisation: B737 NG
70
Figure 4.16 Theoretical vs. Hangar Maintenance Demand: 5-week frequency
The de-escalation that follows the clustering above is as follows: Utilisation Transavia MHrs De-escalation Mhrs % De-escalation
Scen-1 2972.1 860.3 29 Cons. Scen-2 2986.9 861.3 29 Scen-3 2972.5 847.7 29 Scen-4 3184.5 741.2 23 ML Scen-5 3195.5 765.9 24 Scen-6 3184.5 773.6 24 Scen-7 3355.5 831.5 25 Opt. Scen-8 3366.5 854.3 25 Scen-9 3356.3 831.9 25 Scen-10 3184.5 729.0 23
Table 4.23 Total De-escalation by a 5-week clustering
It may be said that the total de-escalation is large, as compared to the de-escalation witnessed from Base Maintenance. It is worth noting that the de-escalation decreases with utilisation, indicating that items mainly de-escalated are those based on the utilisation, and especially the Flight-hour items.
B. Proposed (New) Situation The proposed situation makes use of the Maintenance Task Packages developed in section 3.2.2, and listed in Table I. 3 in Appendix I.3.
Maintenance Task Packages on Calendar Time: 196 Transavia Man-hours Maintenance Task Packages on Flight Cycles: 26 Transavia Man-hours Maintenance Task Packages on Flight Hours: 140 Transavia Man-hours
Theoretical vs. Hangar Visit Maintenance Demand
0.0
500.0
1000.0
1500.0
2000.0
2500.0
3000.0
3500.0
4000.0
Scen-1 Scen-2 Scen-3 Scen-4 Scen-5 Scen-6 Scen-7 Scen-8 Scen-9 Actual
Utilisation Scenarios
Tota
l Mx
Man
-hou
r dem
and
(5 y
rs)
TheoreticalMaintenanceDemand
5-week HangarVisitMaintenanceDemand
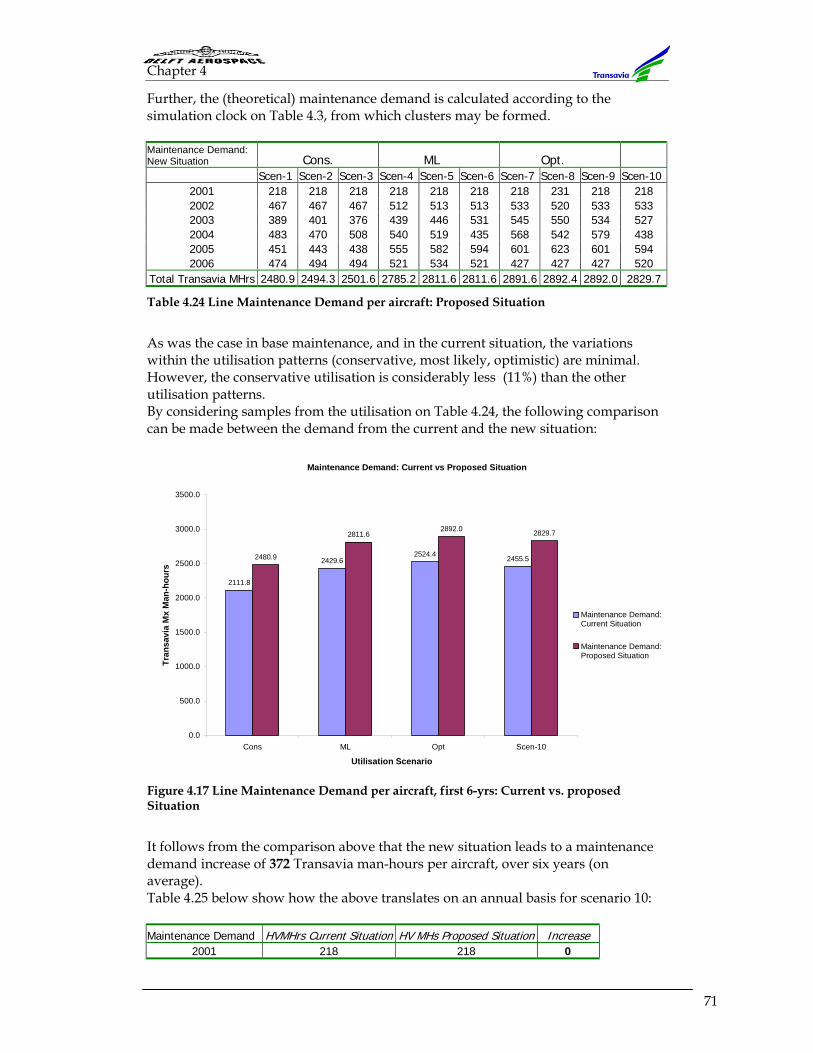
Chapter 4
71
Further, the (theoretical) maintenance demand is calculated according to the simulation clock on Table 4.3, from which clusters may be formed. Maintenance Demand: New Situation Cons. ML Opt. Scen-1 Scen-2 Scen-3 Scen-4 Scen-5 Scen-6 Scen-7 Scen-8 Scen-9 Scen-10
2001 218 218 218 218 218 218 218 231 218 218 2002 467 467 467 512 513 513 533 520 533 533 2003 389 401 376 439 446 531 545 550 534 527 2004 483 470 508 540 519 435 568 542 579 438 2005 451 443 438 555 582 594 601 623 601 594 2006 474 494 494 521 534 521 427 427 427 520
Total Transavia MHrs 2480.9 2494.3 2501.6 2785.2 2811.6 2811.6 2891.6 2892.4 2892.0 2829.7
Table 4.24 Line Maintenance Demand per aircraft: Proposed Situation
As was the case in base maintenance, and in the current situation, the variations within the utilisation patterns (conservative, most likely, optimistic) are minimal. However, the conservative utilisation is considerably less (11%) than the other utilisation patterns. By considering samples from the utilisation on Table 4.24, the following comparison can be made between the demand from the current and the new situation:
Figure 4.17 Line Maintenance Demand per aircraft, first 6-yrs: Current vs. proposed Situation
It follows from the comparison above that the new situation leads to a maintenance demand increase of 372 Transavia man-hours per aircraft, over six years (on average). Table 4.25 below show how the above translates on an annual basis for scenario 10: Maintenance Demand HVMHrs Current Situation HV MHs Proposed Situation Increase
2001 218 218 0
Maintenance Demand: Current vs Proposed Situation
2111.8
2429.62524.4 2455.52480.9
2811.62892.0 2829.7
0.0
500.0
1000.0
1500.0
2000.0
2500.0
3000.0
3500.0
Cons ML Opt Scen-10
Utilisation Scenario
Tran
savi
a M
x M
an-h
ours
Maintenance Demand:Current Situation
Maintenance Demand:Proposed Situation
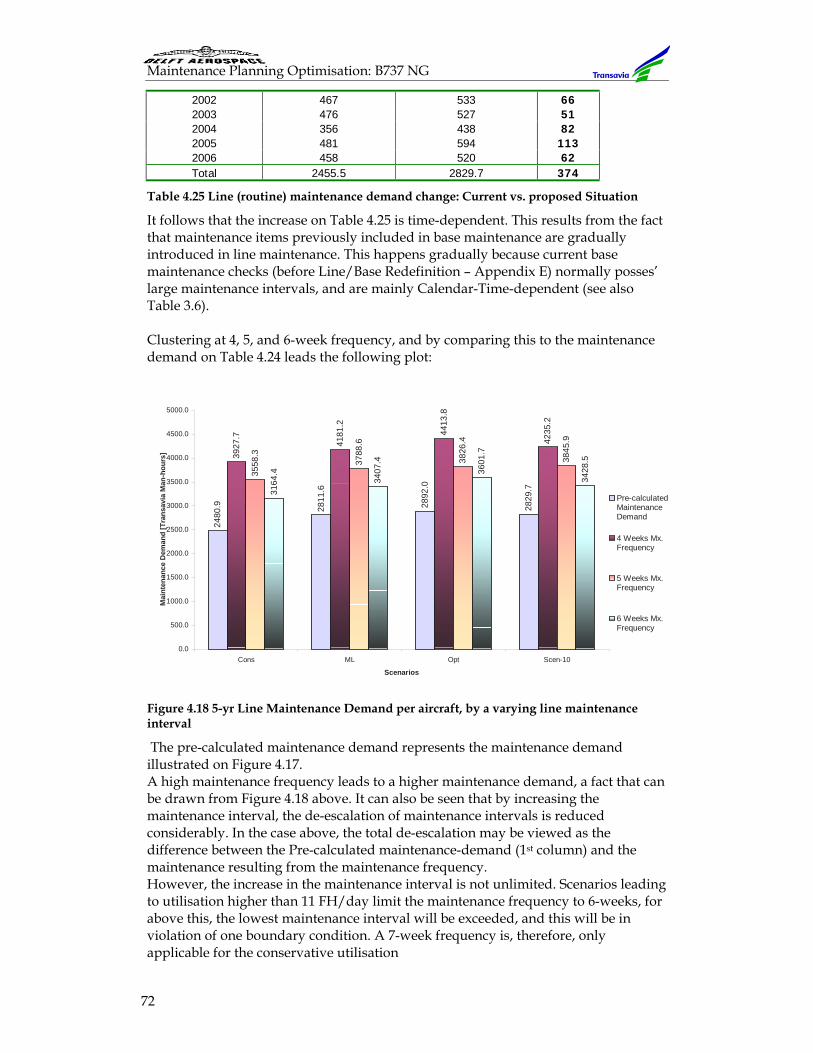
Maintenance Planning Optimisation: B737 NG
72
2002 467 533 66 2003 476 527 51 2004 356 438 82 2005 481 594 113 2006 458 520 62 Total 2455.5 2829.7 374
Table 4.25 Line (routine) maintenance demand change: Current vs. proposed Situation
It follows that the increase on Table 4.25 is time-dependent. This results from the fact that maintenance items previously included in base maintenance are gradually introduced in line maintenance. This happens gradually because current base maintenance checks (before Line/Base Redefinition – Appendix E) normally posses’ large maintenance intervals, and are mainly Calendar-Time-dependent (see also Table 3.6). Clustering at 4, 5, and 6-week frequency, and by comparing this to the maintenance demand on Table 4.24 leads the following plot:
Figure 4.18 5-yr Line Maintenance Demand per aircraft, by a varying line maintenance interval
The pre-calculated maintenance demand represents the maintenance demand illustrated on Figure 4.17. A high maintenance frequency leads to a higher maintenance demand, a fact that can be drawn from Figure 4.18 above. It can also be seen that by increasing the maintenance interval, the de-escalation of maintenance intervals is reduced considerably. In the case above, the total de-escalation may be viewed as the difference between the Pre-calculated maintenance-demand (1st column) and the maintenance resulting from the maintenance frequency. However, the increase in the maintenance interval is not unlimited. Scenarios leading to utilisation higher than 11 FH/day limit the maintenance frequency to 6-weeks, for above this, the lowest maintenance interval will be exceeded, and this will be in violation of one boundary condition. A 7-week frequency is, therefore, only applicable for the conservative utilisation
2480
.9 2811
.6
2892
.0
2829
.7
3927
.7
4181
.2
4413
.8
4235
.2
3558
.3
3788
.6
3826
.4
3845
.9
3164
.4
3407
.4
3601
.7
3428
.5
0.0
500.0
1000.0
1500.0
2000.0
2500.0
3000.0
3500.0
4000.0
4500.0
5000.0
Cons ML Opt Scen-10
Scenarios
Mai
nten
ance
Dem
and
[Tra
nsav
ia M
an-h
ours
]
Pre-calculatedMaintenanceDemand
4 Weeks Mx.Frequency
5 Weeks Mx.Frequency
6 Weeks Mx.Frequency
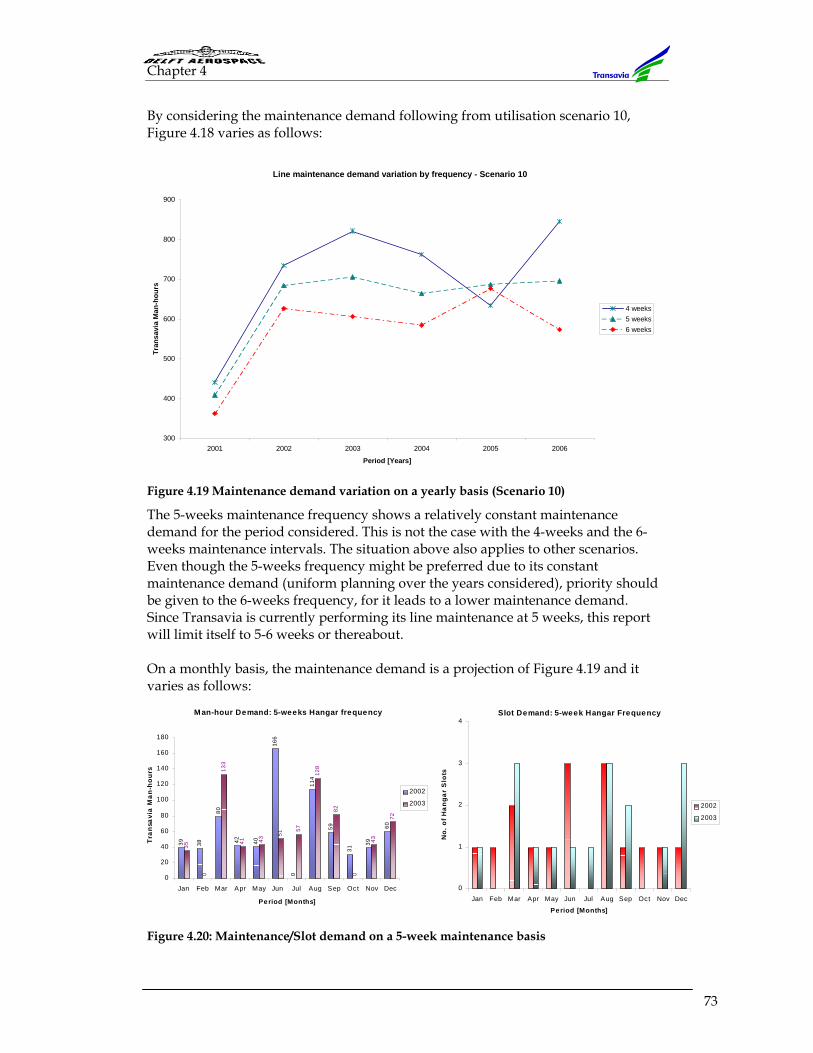
Chapter 4
73
By considering the maintenance demand following from utilisation scenario 10, Figure 4.18 varies as follows:
Figure 4.19 Maintenance demand variation on a yearly basis (Scenario 10)
The 5-weeks maintenance frequency shows a relatively constant maintenance demand for the period considered. This is not the case with the 4-weeks and the 6-weeks maintenance intervals. The situation above also applies to other scenarios. Even though the 5-weeks frequency might be preferred due to its constant maintenance demand (uniform planning over the years considered), priority should be given to the 6-weeks frequency, for it leads to a lower maintenance demand. Since Transavia is currently performing its line maintenance at 5 weeks, this report will limit itself to 5-6 weeks or thereabout. On a monthly basis, the maintenance demand is a projection of Figure 4.19 and it varies as follows:
Figure 4.20: Maintenance/Slot demand on a 5-week maintenance basis
Line maintenance demand variation by frequency - Scenario 10
300
400
500
600
700
800
900
2001 2002 2003 2004 2005 2006
Period [Years]
Tran
savi
a M
an-h
ours
4 weeks5 weeks6 weeks
Man-hour Demand: 5-weeks Hangar frequency
39 38
80
42 40
166
0
114
59
31
39
60
35
0
133
41 43
51
57
128
82
0
43
72
0
20
40
60
80
100
120
140
160
180
Jan Feb Mar Apr May Jun Jul Aug Sep Oct Nov Dec
Period [Months]
Tran
savi
a M
an-h
ours
2002
2003
Slot Demand: 5-week Hangar Frequency
0
1
2
3
4
Jan Feb Mar Apr May Jun Jul Aug Sep Oct Nov Dec
Period [Months]
No.
of H
anga
r S
lots
2002
2003
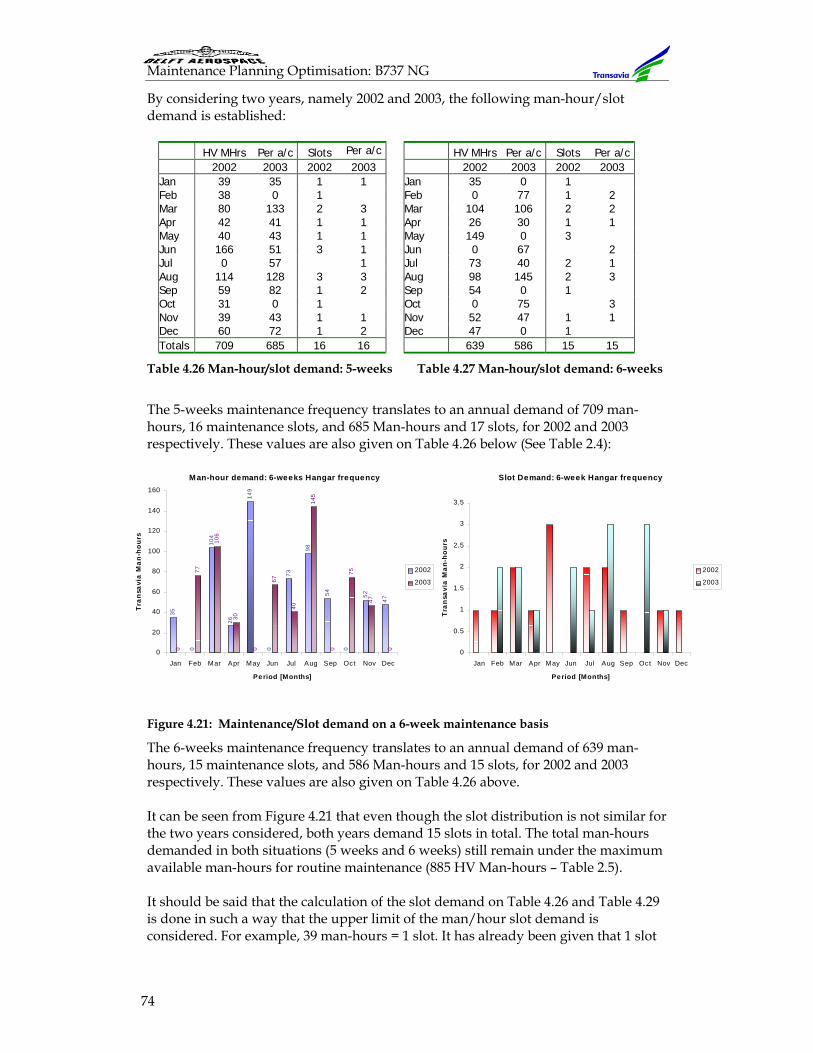
Maintenance Planning Optimisation: B737 NG
74
By considering two years, namely 2002 and 2003, the following man-hour/slot demand is established:
HV MHrs Per a/c Slots Per a/c HV MHrs Per a/c Slots Per a/c 2002 2003 2002 2003 2002 2003 2002 2003 Jan 39 35 1 1 Jan 35 0 1 Feb 38 0 1 Feb 0 77 1 2 Mar 80 133 2 3 Mar 104 106 2 2 Apr 42 41 1 1 Apr 26 30 1 1 May 40 43 1 1 May 149 0 3 Jun 166 51 3 1 Jun 0 67 2 Jul 0 57 1 Jul 73 40 2 1 Aug 114 128 3 3 Aug 98 145 2 3 Sep 59 82 1 2 Sep 54 0 1 Oct 31 0 1 Oct 0 75 3 Nov 39 43 1 1 Nov 52 47 1 1 Dec 60 72 1 2 Dec 47 0 1 Totals 709 685 16 16 639 586 15 15
Table 4.26 Man-hour/slot demand: 5-weeks Table 4.27 Man-hour/slot demand: 6-weeks
The 5-weeks maintenance frequency translates to an annual demand of 709 man-hours, 16 maintenance slots, and 685 Man-hours and 17 slots, for 2002 and 2003 respectively. These values are also given on Table 4.26 below (See Table 2.4):
Figure 4.21: Maintenance/Slot demand on a 6-week maintenance basis
The 6-weeks maintenance frequency translates to an annual demand of 639 man-hours, 15 maintenance slots, and 586 Man-hours and 15 slots, for 2002 and 2003 respectively. These values are also given on Table 4.26 above. It can be seen from Figure 4.21 that even though the slot distribution is not similar for the two years considered, both years demand 15 slots in total. The total man-hours demanded in both situations (5 weeks and 6 weeks) still remain under the maximum available man-hours for routine maintenance (885 HV Man-hours – Table 2.5). It should be said that the calculation of the slot demand on Table 4.26 and Table 4.29 is done in such a way that the upper limit of the man/hour slot demand is considered. For example, 39 man-hours = 1 slot. It has already been given that 1 slot
Man-hour demand: 6-weeks Hangar frequency
35
0
104
26
149
0
73
98
54
0
52
47
0
77
106
30
0
67
40
145
0
75
47
00
20
40
60
80
100
120
140
160
Jan Feb Mar Apr May Jun Jul Aug Sep Oct Nov Dec
Period [Months]
Tran
savi
a M
an-h
ours
2002
2003
Slot Demand: 6-week Hangar frequency
0
0.5
1
1.5
2
2.5
3
3.5
Jan Feb Mar Apr May Jun Jul Aug Sep Oct Nov Dec
Period [Months]
Tran
savi
a M
an-h
ours
2002
2003
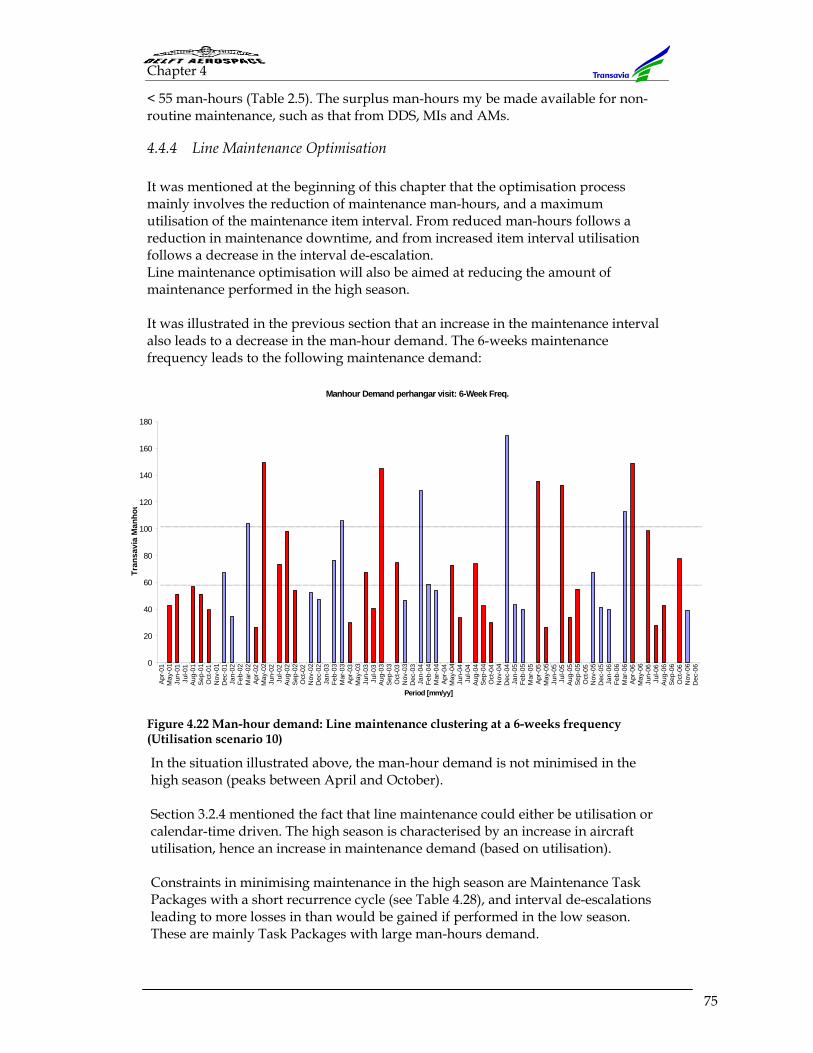
Chapter 4
75
< 55 man-hours (Table 2.5). The surplus man-hours my be made available for non-routine maintenance, such as that from DDS, MIs and AMs.
4.4.4 Line Maintenance Optimisation It was mentioned at the beginning of this chapter that the optimisation process mainly involves the reduction of maintenance man-hours, and a maximum utilisation of the maintenance item interval. From reduced man-hours follows a reduction in maintenance downtime, and from increased item interval utilisation follows a decrease in the interval de-escalation. Line maintenance optimisation will also be aimed at reducing the amount of maintenance performed in the high season. It was illustrated in the previous section that an increase in the maintenance interval also leads to a decrease in the man-hour demand. The 6-weeks maintenance frequency leads to the following maintenance demand:
Figure 4.22 Man-hour demand: Line maintenance clustering at a 6-weeks frequency (Utilisation scenario 10)
In the situation illustrated above, the man-hour demand is not minimised in the high season (peaks between April and October). Section 3.2.4 mentioned the fact that line maintenance could either be utilisation or calendar-time driven. The high season is characterised by an increase in aircraft utilisation, hence an increase in maintenance demand (based on utilisation). Constraints in minimising maintenance in the high season are Maintenance Task Packages with a short recurrence cycle (see Table 4.28), and interval de-escalations leading to more losses in than would be gained if performed in the low season. These are mainly Task Packages with large man-hours demand.
Manhour Demand perhangar visit: 6-Week Freq.
0
20
40
60
80
100
120
140
160
180
Apr
-01
May
-01
Jun-
01Ju
l-01
Aug
-01
Sep
-01
Oct
-01
Nov
-01
Dec
-01
Jan-
02Fe
b-02
Mar
-02
Apr
-02
May
-02
Jun-
02Ju
l-02
Aug
-02
Sep
-02
Oct
-02
Nov
-02
Dec
-02
Jan-
03Fe
b-03
Mar
-03
Apr
-03
May
-03
Jun-
03Ju
l-03
Aug
-03
Sep
-03
Oct
-03
Nov
-03
Dec
-03
Jan-
04Fe
b-04
Mar
-04
Apr
-04
May
-04
Jun-
04Ju
l-04
Aug
-04
Sep
-04
Oct
-04
Nov
-04
Dec
-04
Jan-
05Fe
b-05
Mar
-05
Apr
-05
May
-05
Jun-
05Ju
l-05
Aug
-05
Sep
-05
Oct
-05
Nov
-05
Dec
-05
Jan-
06Fe
b-06
Mar
-06
Apr
-06
May
-06
Jun-
06Ju
l-06
Aug
-06
Sep
-06
Oct
-06
Nov
-06
Dec
-06
Period [mm/yy]
Tran
savi
a M
anho
u
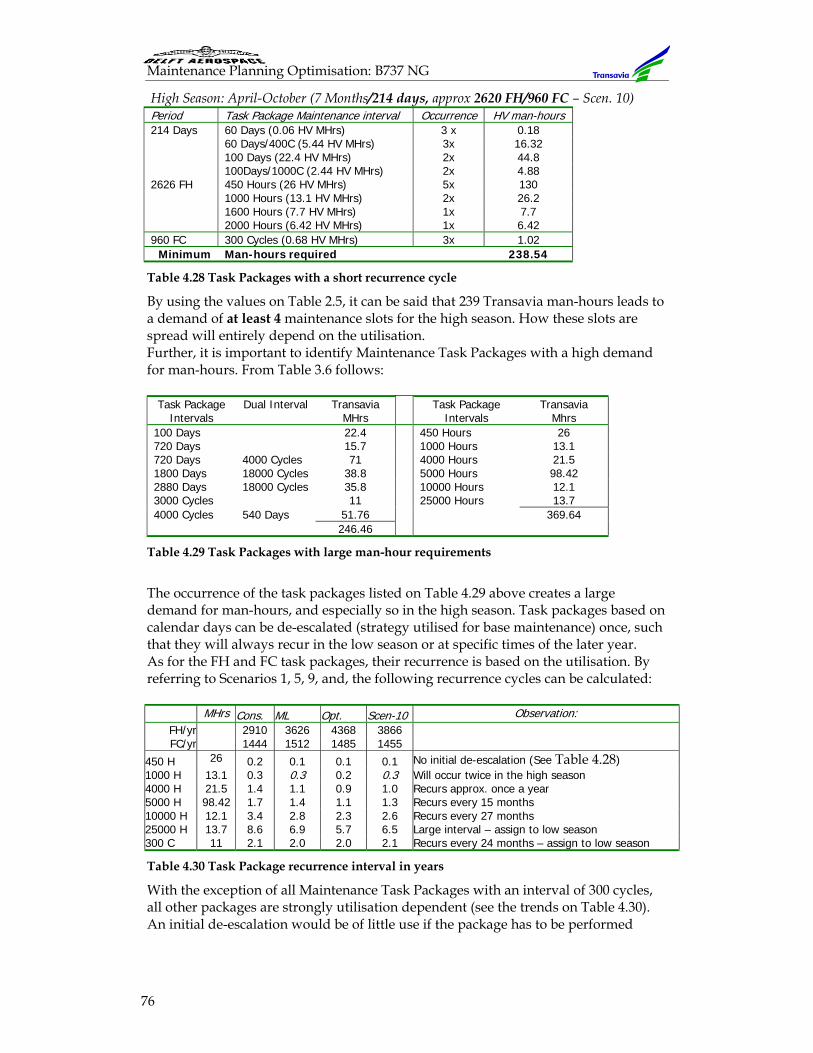
Maintenance Planning Optimisation: B737 NG
76
High Season: April-October (7 Months/214 days, approx 2620 FH/960 FC – Scen. 10) Period Task Package Maintenance interval Occurrence HV man-hours 214 Days 60 Days (0.06 HV MHrs) 3 x 0.18 60 Days/400C (5.44 HV MHrs) 3x 16.32 100 Days (22.4 HV MHrs) 2x 44.8 100Days/1000C (2.44 HV MHrs) 2x 4.88 2626 FH 450 Hours (26 HV MHrs) 5x 130
1000 Hours (13.1 HV MHrs) 2x 26.2 1600 Hours (7.7 HV MHrs) 1x 7.7 2000 Hours (6.42 HV MHrs) 1x 6.42 960 FC 300 Cycles (0.68 HV MHrs) 3x 1.02
Minimum Man-hours required 238.54
Table 4.28 Task Packages with a short recurrence cycle
By using the values on Table 2.5, it can be said that 239 Transavia man-hours leads to a demand of at least 4 maintenance slots for the high season. How these slots are spread will entirely depend on the utilisation. Further, it is important to identify Maintenance Task Packages with a high demand for man-hours. From Table 3.6 follows: Task Package
Intervals Dual Interval Transavia
MHrs Task Package
Intervals Transavia
Mhrs 100 Days 22.4 450 Hours 26 720 Days 15.7 1000 Hours 13.1 720 Days 4000 Cycles 71 4000 Hours 21.5 1800 Days 18000 Cycles 38.8 5000 Hours 98.42 2880 Days 18000 Cycles 35.8 10000 Hours 12.1 3000 Cycles 11 25000 Hours 13.7 4000 Cycles 540 Days 51.76 369.64 246.46
Table 4.29 Task Packages with large man-hour requirements
The occurrence of the task packages listed on Table 4.29 above creates a large demand for man-hours, and especially so in the high season. Task packages based on calendar days can be de-escalated (strategy utilised for base maintenance) once, such that they will always recur in the low season or at specific times of the later year. As for the FH and FC task packages, their recurrence is based on the utilisation. By referring to Scenarios 1, 5, 9, and, the following recurrence cycles can be calculated: MHrs Cons. ML Opt. Scen-10 Observation:
FH/yr 2910 3626 4368 3866 FC/yr 1444 1512 1485 1455
450 H 26 0.2 0.1 0.1 0.1 No initial de-escalation (See Table 4.28) 1000 H 13.1 0.3 0.3 0.2 0.3 Will occur twice in the high season 4000 H 21.5 1.4 1.1 0.9 1.0 Recurs approx. once a year 5000 H 98.42 1.7 1.4 1.1 1.3 Recurs every 15 months 10000 H 12.1 3.4 2.8 2.3 2.6 Recurs every 27 months 25000 H 13.7 8.6 6.9 5.7 6.5 Large interval – assign to low season 300 C 11 2.1 2.0 2.0 2.1 Recurs every 24 months – assign to low season
Table 4.30 Task Package recurrence interval in years
With the exception of all Maintenance Task Packages with an interval of 300 cycles, all other packages are strongly utilisation dependent (see the trends on Table 4.30). An initial de-escalation would be of little use if the package has to be performed
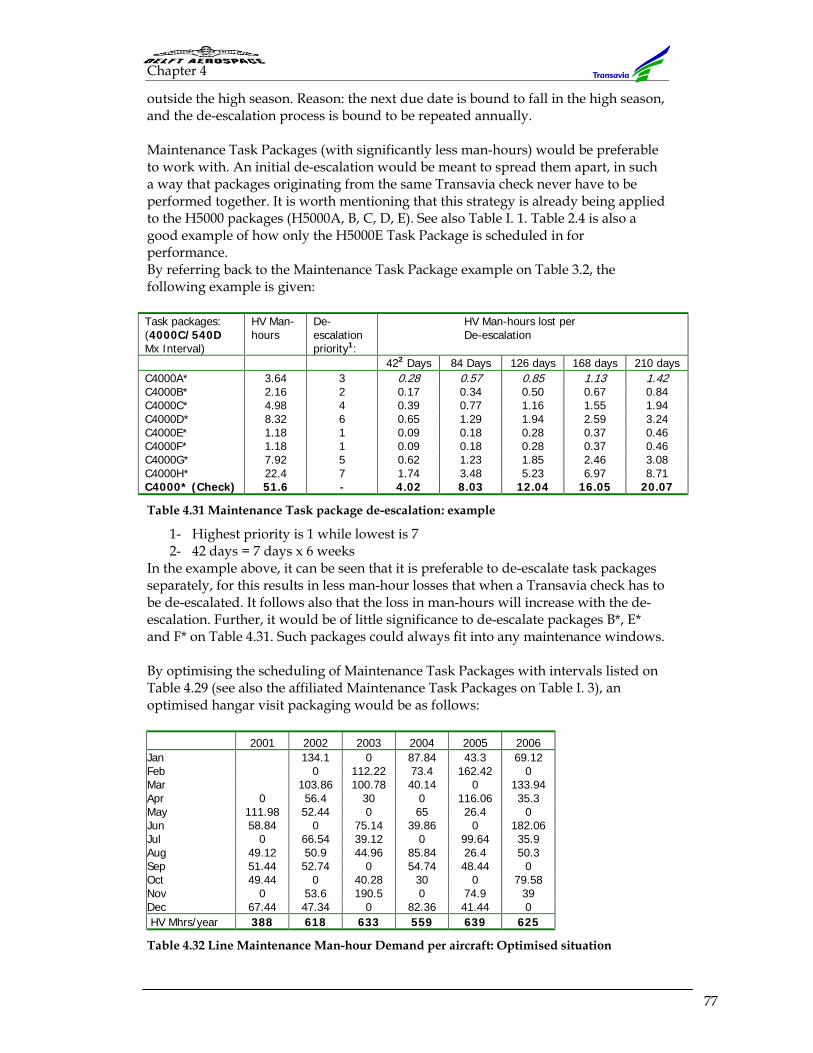
Chapter 4
77
outside the high season. Reason: the next due date is bound to fall in the high season, and the de-escalation process is bound to be repeated annually. Maintenance Task Packages (with significantly less man-hours) would be preferable to work with. An initial de-escalation would be meant to spread them apart, in such a way that packages originating from the same Transavia check never have to be performed together. It is worth mentioning that this strategy is already being applied to the H5000 packages (H5000A, B, C, D, E). See also Table I. 1. Table 2.4 is also a good example of how only the H5000E Task Package is scheduled in for performance. By referring back to the Maintenance Task Package example on Table 3.2, the following example is given: Task packages: (4000C/540D Mx Interval)
HV Man-hours
De-escalation priority1:
HV Man-hours lost per De-escalation
422 Days 84 Days 126 days 168 days 210 days C4000A* 3.64 3 0.28 0.57 0.85 1.13 1.42 C4000B* 2.16 2 0.17 0.34 0.50 0.67 0.84 C4000C* 4.98 4 0.39 0.77 1.16 1.55 1.94 C4000D* 8.32 6 0.65 1.29 1.94 2.59 3.24 C4000E* 1.18 1 0.09 0.18 0.28 0.37 0.46 C4000F* 1.18 1 0.09 0.18 0.28 0.37 0.46 C4000G* 7.92 5 0.62 1.23 1.85 2.46 3.08 C4000H* 22.4 7 1.74 3.48 5.23 6.97 8.71 C4000* (Check) 51.6 - 4.02 8.03 12.04 16.05 20.07
Table 4.31 Maintenance Task package de-escalation: example
1- Highest priority is 1 while lowest is 7 2- 42 days = 7 days x 6 weeks
In the example above, it can be seen that it is preferable to de-escalate task packages separately, for this results in less man-hour losses that when a Transavia check has to be de-escalated. It follows also that the loss in man-hours will increase with the de-escalation. Further, it would be of little significance to de-escalate packages B*, E* and F* on Table 4.31. Such packages could always fit into any maintenance windows. By optimising the scheduling of Maintenance Task Packages with intervals listed on Table 4.29 (see also the affiliated Maintenance Task Packages on Table I. 3), an optimised hangar visit packaging would be as follows: 2001 2002 2003 2004 2005 2006 Jan 134.1 0 87.84 43.3 69.12 Feb 0 112.22 73.4 162.42 0 Mar 103.86 100.78 40.14 0 133.94 Apr 0 56.4 30 0 116.06 35.3 May 111.98 52.44 0 65 26.4 0 Jun 58.84 0 75.14 39.86 0 182.06 Jul 0 66.54 39.12 0 99.64 35.9 Aug 49.12 50.9 44.96 85.84 26.4 50.3 Sep 51.44 52.74 0 54.74 48.44 0 Oct 49.44 0 40.28 30 0 79.58 Nov 0 53.6 190.5 0 74.9 39 Dec 67.44 47.34 0 82.36 41.44 0 HV Mhrs/year 388 618 633 559 639 625
Table 4.32 Line Maintenance Man-hour Demand per aircraft: Optimised situation
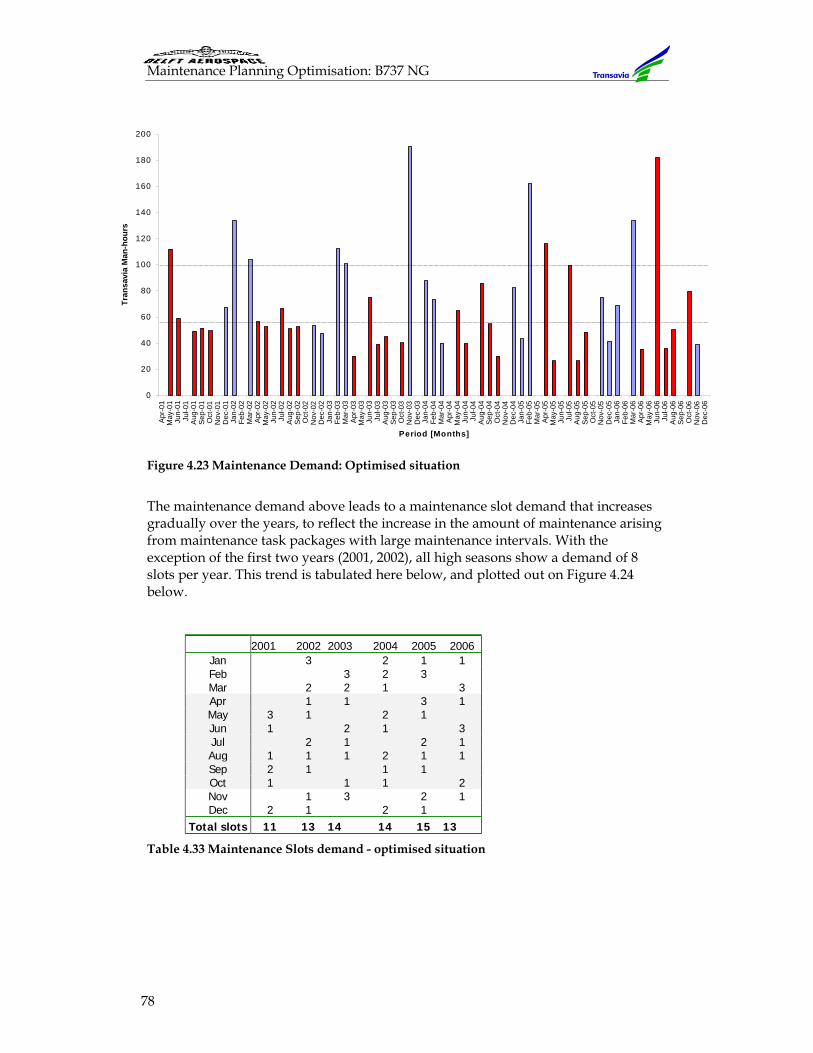
Maintenance Planning Optimisation: B737 NG
78
Figure 4.23 Maintenance Demand: Optimised situation
The maintenance demand above leads to a maintenance slot demand that increases gradually over the years, to reflect the increase in the amount of maintenance arising from maintenance task packages with large maintenance intervals. With the exception of the first two years (2001, 2002), all high seasons show a demand of 8 slots per year. This trend is tabulated here below, and plotted out on Figure 4.24 below.
2001 2002 2003 2004 2005 2006 Jan 3 2 1 1 Feb 3 2 3 Mar 2 2 1 3 Apr 1 1 3 1 May 3 1 2 1 Jun 1 2 1 3 Jul 2 1 2 1 Aug 1 1 1 2 1 1 Sep 2 1 1 1 Oct 1 1 1 2 Nov 1 3 2 1 Dec 2 1 2 1
Total slots 11 13 14 14 15 13
Table 4.33 Maintenance Slots demand - optimised situation
0
20
40
60
80
100
120
140
160
180
200
Apr
-01
May
-01
Jun-
01Ju
l-01
Aug
-01
Sep
-01
Oct
-01
Nov
-01
Dec
-01
Jan-
02Fe
b-02
Mar
-02
Apr
-02
May
-02
Jun-
02Ju
l-02
Aug
-02
Sep
-02
Oct
-02
Nov
-02
Dec
-02
Jan-
03Fe
b-03
Mar
-03
Apr
-03
May
-03
Jun-
03Ju
l-03
Aug
-03
Sep
-03
Oct
-03
Nov
-03
Dec
-03
Jan-
04Fe
b-04
Mar
-04
Apr
-04
May
-04
Jun-
04Ju
l-04
Aug
-04
Sep
-04
Oct
-04
Nov
-04
Dec
-04
Jan-
05Fe
b-05
Mar
-05
Apr
-05
May
-05
Jun-
05Ju
l-05
Aug
-05
Sep
-05
Oct
-05
Nov
-05
Dec
-05
Jan-
06Fe
b-06
Mar
-06
Apr
-06
May
-06
Jun-
06Ju
l-06
Aug
-06
Sep
-06
Oct
-06
Nov
-06
Dec
-06
Period [Months]
Tran
savi
a M
an-h
ours
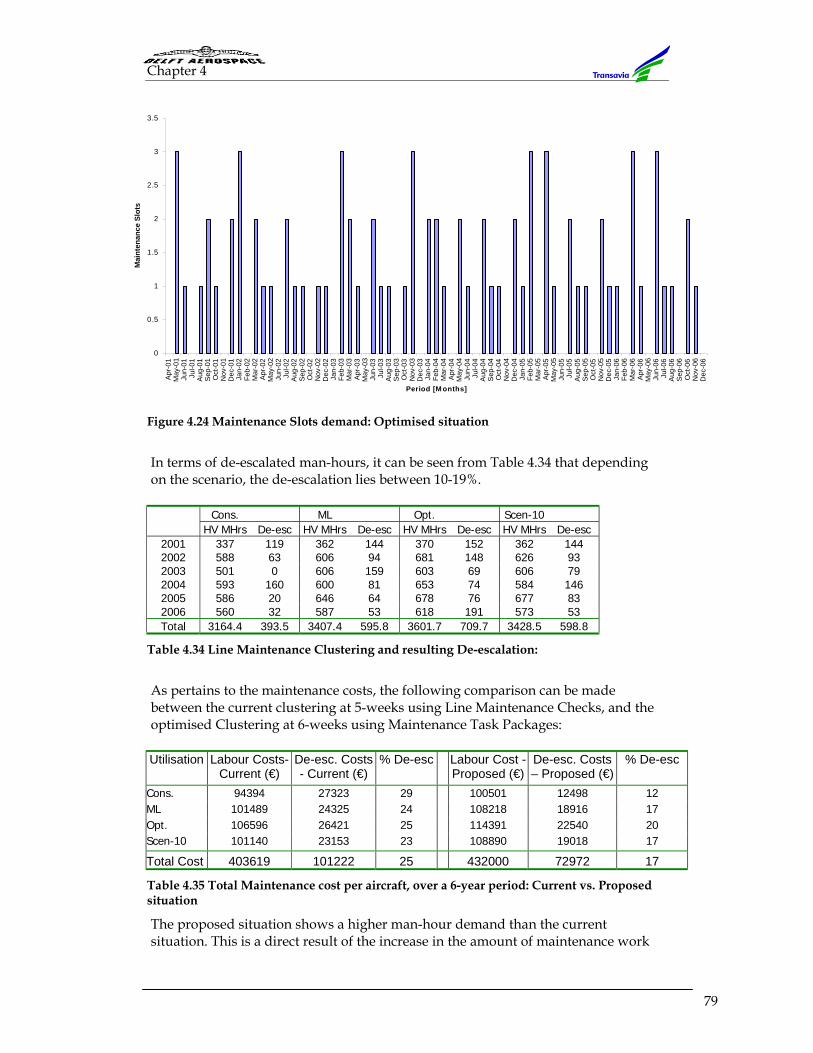
Chapter 4
79
Figure 4.24 Maintenance Slots demand: Optimised situation
In terms of de-escalated man-hours, it can be seen from Table 4.34 that depending on the scenario, the de-escalation lies between 10-19%.
Cons. ML Opt. Scen-10 HV MHrs De-esc HV MHrs De-esc HV MHrs De-esc HV MHrs De-esc
2001 337 119 362 144 370 152 362 144 2002 588 63 606 94 681 148 626 93 2003 501 0 606 159 603 69 606 79 2004 593 160 600 81 653 74 584 146 2005 586 20 646 64 678 76 677 83 2006 560 32 587 53 618 191 573 53 Total 3164.4 393.5 3407.4 595.8 3601.7 709.7 3428.5 598.8
Table 4.34 Line Maintenance Clustering and resulting De-escalation:
As pertains to the maintenance costs, the following comparison can be made between the current clustering at 5-weeks using Line Maintenance Checks, and the optimised Clustering at 6-weeks using Maintenance Task Packages: Utilisation Labour Costs-
Current (€) De-esc. Costs - Current (€)
% De-esc Labour Cost -Proposed (€)
De-esc. Costs – Proposed (€)
% De-esc
Cons. 94394 27323 29 100501 12498 12 ML 101489 24325 24 108218 18916 17 Opt. 106596 26421 25 114391 22540 20 Scen-10 101140 23153 23 108890 19018 17
Total Cost 403619 101222 25 432000 72972 17
Table 4.35 Total Maintenance cost per aircraft, over a 6-year period: Current vs. Proposed situation
The proposed situation shows a higher man-hour demand than the current situation. This is a direct result of the increase in the amount of maintenance work
0
0.5
1
1.5
2
2.5
3
3.5
Apr
-01
May
-01
Jun-
01Ju
l-01
Aug
-01
Sep
-01
Oct
-01
Nov
-01
Dec
-01
Jan-
02Fe
b-02
Mar
-02
Apr
-02
May
-02
Jun-
02Ju
l-02
Aug
-02
Sep
-02
Oct
-02
Nov
-02
Dec
-02
Jan-
03Fe
b-03
Mar
-03
Apr
-03
May
-03
Jun-
03Ju
l-03
Aug
-03
Sep
-03
Oct
-03
Nov
-03
Dec
-03
Jan-
04Fe
b-04
Mar
-04
Apr
-04
May
-04
Jun-
04Ju
l-04
Aug
-04
Sep
-04
Oct
-04
Nov
-04
Dec
-04
Jan-
05Fe
b-05
Mar
-05
Apr
-05
May
-05
Jun-
05Ju
l-05
Aug
-05
Sep
-05
Oct
-05
Nov
-05
Dec
-05
Jan-
06Fe
b-06
Mar
-06
Apr
-06
May
-06
Jun-
06Ju
l-06
Aug
-06
Sep
-06
Oct
-06
Nov
-06
Dec
-06
Period [M onths]
Mai
nten
ance
Slo
ts
Maintenance Planning Optimisation: B737 NG
80
for line maintenance (Line/Base maintenance redefinition), as compared to the current situation. Despite the fact above, the total de-escalation is lower in the proposed situation, as compared to the current situation, and leads to an average annual reduction in line maintenance costs of about €12,691 per aircraft.
4.5 Summary
Through the implementation of the Top-Down and the Bottom-Up approaches, it is determined that the amount of maintenance demand is dependent on the utilisation of the aircraft. This is especially the case for line maintenance, which strongly varies through the increase and decrease of flight hours. A variation in the number of flight cycles does not lead to any significant variations in the maintenance demand. The application of the two approaches also leads to the conclusion that Base maintenance can be performed optimally at a frequency of 24 Months. However, this optimum is achieved through the application of an initial de-escalation, which schedules the performance of the first base visit at a date, not later than 23 Months after the introduction of the aircraft into the fleet. This leads to the clustering of maintenance checks to clusters closest tot their maintenance intervals. A 30-day initial de-escalation leads to the least total de-escalation of check-intervals, and consequently to the most optimum clusters for Base maintenance. The clustering of base maintenance checks leads to static maintenance clusters, which may also be viewed as phases in maintenance. Such phases are of importance, especially in the planning of long-term maintenance.
It can also be concluded that Line maintenance is strongly utilisation dependent during the high season, and calendar-time dependent during the low season. Consequently, the maintenance demand increases with the utilisation. Herewith, the maintenance demand rises during the high season. By reducing the total maintenance demand in the high season to a minimum, an increase in the de-escalated man-hours results. This also follows from the fact that the high season lasts 7 months, and the low season 5. Line maintenance demand also increases with the maintenance frequency. This increase follows from repetitive maintenance. A frequency of 4 weeks results in a higher maintenance demand than that resulting from a 5-week or a 6-week frequency. A 6-week frequency results in the lowest maintenance demand. A 7-week frequency would result in an even lower maintenance demand, but it is only applicable where the aircraft utilisation low. In other instances, the utilisation-dependent maintenance intervals would be violated. Line maintenance clustering is, therefore, a dynamic clustering process, that is strongly dependent on the utilisation of the aircraft and on the frequency with which maintenance is performed. Maintenance task packages are of importance in that they provide for the creation of smaller maintenance clusters with minimum de-escalation.
Conclusions and Recommendations
81
5 Conclusions and Recommendations
5.1 Conclusions
The optimisation of the maintenance of the B737 NG can be sub-divided into Line Maintenance Optimisation and Base Maintenance Optimisation. This follows from the fact that Transavia performs Line Maintenance in house, and contracts out Base Maintenance.
Line Maintenance The B737 NG MPD is a document developed from the MSG-3 maintenance philosophy, which leads to task based maintenance. This is unlike the other aircraft operated by Transavia, which have an MSG-2 (Process Oriented) MPD. This, therefore, calls for a different approach in the way the maintenance program (OMP) is developed, as pertains to task packaging, and the execution thereof. This entails looking at task properties, such as the MSG-3 classification (such as lubrication, Discard, Restoration) and the set-up demand (common procedure/conditions/cost). The result of this is smaller task packages demanding less man-hours, as compared to the conventional Maintenance checks currently used by Transavia. The shift from the current situation, (where line maintenance is limited by 3000 Flight Cycles, 6000 Flight Hours and 540 Days), to a Line-Base classification results in an increase in maintenance demand of between 66-113 man-hours per year. Line maintenance demand is strongly dependent on the utilisation of the aircraft, and on the seasonal pattern followed By the Transavia fleet. The clustering hereof is, therefore, dynamic. Aircraft utilisation below 3000 flight hours a year leads to a maintenance demand that is 11% less than that from above 3000 flight hours. While the low season offers enough ground time for maintenance, the high season leaves little room for this, yet creates a higher demand for maintenance. The demand for maintenance slots does not follow a specific pattern, but is also dependent on the utilisation. The departure situation was a rhythmic distribution of maintenance slots (1-1-2-1-1-4-1-1-2-...), irrespective of the season or utilisation. In reality, the actual demand and distribution of maintenance slots varies from year to year. This leads to distributions such as 3-2-1-2-1-1-1-3-… or 2-2-1-2-1-2-1-1-2-…. However, the total demand for maintenance slots remains at 15 in all cases. Maintenance clustering always will result in the de-escalation of maintenance task intervals. This de-escalation, of Calendar-Time, Flight Hours, or Flight Cycles, is in actual fact a loss that can be quantified in man-hours. De-escalation leads to an increased frequency of maintenance item execution, hence an excessive labour spending on the item. The minimisation of maintenance during the high season inevitably results in interval de-escalation. Owing to the fact that most items that have to be de-escalated (for this purpose) are mainly utilisation dependent (flight hour/Cycle items), de-
Maintenance Planning Optimisation: B737 NG
82
escalation will have to be done every new season, and the cost of this will be dependent on the utilisation of the aircraft. Optimising the clustering of line maintenance is achieved by minimising the number of times the aircraft visits the hangar. This mainly reduces repetitive maintenance. By performing line maintenance at a 6-week interval, the total de-escalation of man-hours is brought down from as high as 29%, to as low as 10% of the exact maintenance demand. This translates to an average annual reduction in line maintenance costs of about €12,691 per aircraft. A 7-week frequency can be achieved if the aircraft is utilised for less than 3000 flight hours per year, resulting in de-escalation less than 10%.
Base Maintenance Base maintenance items are characterised by large maintenance intervals and a high demand for man-hours and ground time. The scheduling of this is, therefore, done only in the low season. The optimisation of base maintenance follows from the reduction in the frequency (of the maintenance), a reduction in the number of man-hours contracted out, and a minimisation in the interval (man-hour) de-escalation. Base maintenance can be performed optimally at a frequency of 24 Months. However, this optimum is achieved through the application of an initial de-escalation, which schedules the performance of the first base visit at a date, not later than 23 Months after the introduction of the aircraft into the fleet. This leads to the clustering of maintenance checks to clusters closest to their maintenance intervals. A 30-day initial de-escalation leads to the least total de-escalation on the maintenance man-hours (7%), and consequently to the most optimum clusters for Base maintenance. The 7% translates to 93 man-hours, as compared to 341 man-hours (23%) before the initial de-escalation – a reduction of losses by 248 man-hours. This, in turn, translates to an average saving of €12,181 per aircraft, over a period of ten years.
Base maintenance shows a dependence on aircraft utilisation, depending on whether this is low (below 3210 Flight hours per year), normal (between 3210 and 4015 flight hours per year), or high (above 4015, but below 48 flight hours per year). A variation of flight hours/cycles ratio of between 1.9 and 3.1 has no impact on the base maintenance demand. The clustering of base maintenance checks leads to static maintenance clusters, which may also be viewed as phases in maintenance. Base Maintenance checks can be clustered together into six unique phases, starting from a phase that recurs every 2 years, to a sixth phase that recurs every 12 years. However, the composition of the phases varies according to the aircraft utilisation. Maintenance labour forms a component of the direct maintenance costs. It also has a direct proportionality with the downtime, and the material costs, which are also elements of direct maintenance costs. In turn, direct maintenance costs are a part of the cost of ownership. Hence, the reduction of maintenance labour (man-hours) directly leads to the reduction of the cost of ownership
Conclusions and Recommendations
83
5.2 Recommendations
In order to maximise the maintenance advantages that came along with the B737 NG, the following is recommended:
1. The application of Maintenance Task Packages for line maintenance, in place of the current line maintenance checks.
2. An annual review of the maintenance planning versus realisation. This
should serve as a gauge for the planning accuracy, and establish trends that follow from the application of (1) above.
3. The standardisation of Base Maintenance through the utilisation of base
maintenance phases.
4. The use of initial de-escalation at the first base maintenance visit. This should serve as a tool to reduce the total maintenance man-hours contracted out, and the total de-escalation resulting from maintenance clustering.

References
85
References [1] Kececioglu, D., Maintainability, Availability & Operational Readiness
Engineering, Department of Aerospace and Mechanical Engineering, University of Arizona, Prentice Hall PTR, New Jersey (USA), 1995
[2] Patton, J.D., Preventive Maintenance, 2nd edition, ISA, North Carolina (USA), 1995
[3] Kelly, A., Maintenance Planning and Control, Butterworths, Manchester (UK), 1984
[4] Ben-Daya et al., Maintenance, Modelling and Optimisation, Kluwer Academic Publishers, Boston (USA), 2000
[5] Lalli et al., Reliability and Maintainability (RAM) Training, NASA/TP-2000-207428, NASA Publications, Washington/Ohio (USA), 2000
[6] Kent, R.M., Health Monitoring System Technology Assessments: Cost Benefit Analysis, NASA/CR-2000-299848, pg.(?-?), Washington/Maryland (USA), 2000
[7] File, W.T., Cost Effective Maintenance: Design and Implementation, , Butterworths-Heinemann, 1991
[8] Niebel, B.W., Engineering Maintenance Management, 2nd edition, , Marcel Dekker Inc., New York (USA), 1994
[9] Smit, K., Maintenance Engineering, Lecture Notes D-96, Faculty of Aerospace Engineering, Delft University of Education, Delft, 1993
[10] Smit, K, Onderhoudsmanagement (Maintenance Management), Lecture Notes wb5415, Faculty of Mechanical Engineering and Marine Technology, Delft University of Technology, Delft, 1988
[11] Boeing, Airline Maintenance Program Development, Fleet Maintenance Seminar Notes, Commercial Aviation Services, Seattle (USA), 2000
[12] Boeing, 737 –600/ -700/ -800 / -900 Maintenance Planning Data Document, D626A001, Revision June 2001, Commercial Aviation Services, Seattle (USA), 2001
[13] Boeing, Production Planning Requirements To Maintain Continued Airworthiness, Fleet Maintenance Seminar Notes, Commercial Aviation Services, Seattle (USA), 2001
[14] Bratley et al., A Guide To Simulation, 2nd edition, pg. 1-11, Springer-Verlag New York Inc, New York, 1987
[15] Stam, T., Lems, W., Line and Base Maintenance Redefinition, Maintenance
program concept redefinition, Schiphol East, 2001 [16] Dijkhuizen, G. van, Maintenance Meets Production: On the Ups and
Downs of a Repairable System, Dissertation TU Twente, pg. 23-29, Print
Maintenance Planning Optimisation: B737 NG
86
Partners Ipskamp, Enschede, 1998 [17] Smit, K., Besturing Onderhoud met behulp van Computers (Computer-
Assisted Maintenance Management), J2020, pg. 8, Department of Industrial Engineering Management, Delft University of Technology, 1994
[18] Hillston, J., Modelling and Simulation, Lecture Notes, Department of Informatics, University of Edinburgh, 2001
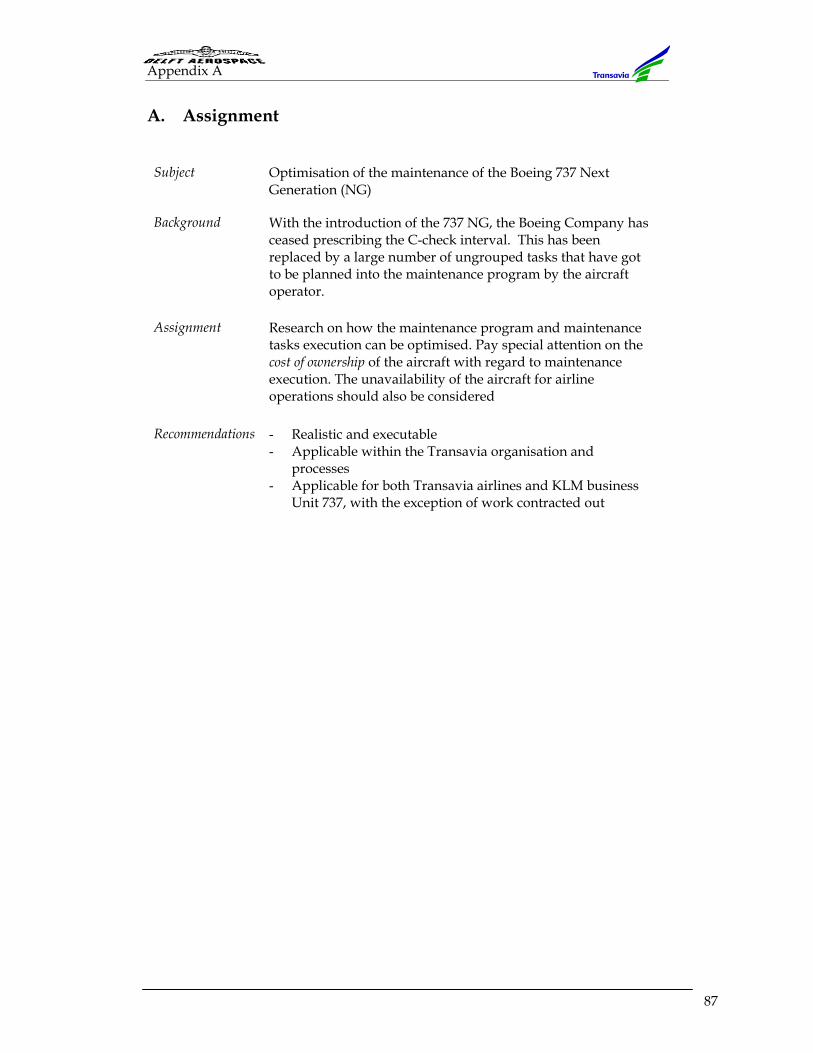
Appendix A
87
A. Assignment Subject Optimisation of the maintenance of the Boeing 737 Next
Generation (NG)
Background With the introduction of the 737 NG, the Boeing Company has ceased prescribing the C-check interval. This has been replaced by a large number of ungrouped tasks that have got to be planned into the maintenance program by the aircraft operator.
Assignment Research on how the maintenance program and maintenance tasks execution can be optimised. Pay special attention on the cost of ownership of the aircraft with regard to maintenance execution. The unavailability of the aircraft for airline operations should also be considered
Recommendations - Realistic and executable - Applicable within the Transavia organisation and
processes - Applicable for both Transavia airlines and KLM business
Unit 737, with the exception of work contracted out

Appendix B
89
B. Transavia Airlines
B.1. History
Transavia Limburg N.V. was founded in 1965. It received an airline licence in 1966, with which it could operate charter flights from Beek (Maastricht) and Zestienhoven (Rotterdam) airports. Shortly thereafter, an American company, the American Boreas Corporation, bought all company shares. The company’s name was later changed to Transavia Holland so that it could also operate from Schiphol airport. Despite various problems with the acquisition of licences, the airline transported 21.000 passengers in its first year of operation. In 1968, the airline began operating charter flight to the United States, and it also stated leasing out its aircraft and cabin/cockpit crew. By 1971, the Transavia passenger count had reached 447.000, and it had 420 employees. In 1972, the Royal Dutch Steamship Company (KNSM) took over 40% of the company’s shares. In the same year, the Caravell fleet was replaced with the Boeing 737-200, at the cost of fl. 20 million per aircraft. KNSM acquired all the company shares in 1977. Transavia Holland changed its name to Transavia airlines in 1986, and in the same year, it acquired its first B737-300. During the same year, the company transported its millionth passenger. An introduction of a line service to London Gatwick led to the introduction of Business Class seats for the fleet. A merger of the KNSM and Ned Lloyd in 1988 resulted in the sale of 40% of the shares to KLM. Transavia airlines also introduced a line service to holiday destinations along the Mediterranean Coast. 1991 saw the acquisition of 80% of the shares by KLM. A year later, the airline received a delivery of its first Boeing 757-200. Transavia airlines still operates as an independent organisation, with the following major activities:
- Holiday charter flights - Scheduled business and holiday flights - Aircraft leasing - Ad-hoc flights
The airline has its head office at Amsterdam Airport Schiphol. Its main operation base is also Schiphol Airport. Its other base is at Rotterdam Airport. Staff Currently, Transavia has an average of 1500 employees, serving on board, as ground staff and as administrative staff.
B.2. The fleet
The Transavia fleet is currently under modernisation in order to cater optimally for the needs of the airline and its passengers. The following list gives an overview of the fleet, as per 28-06-2001
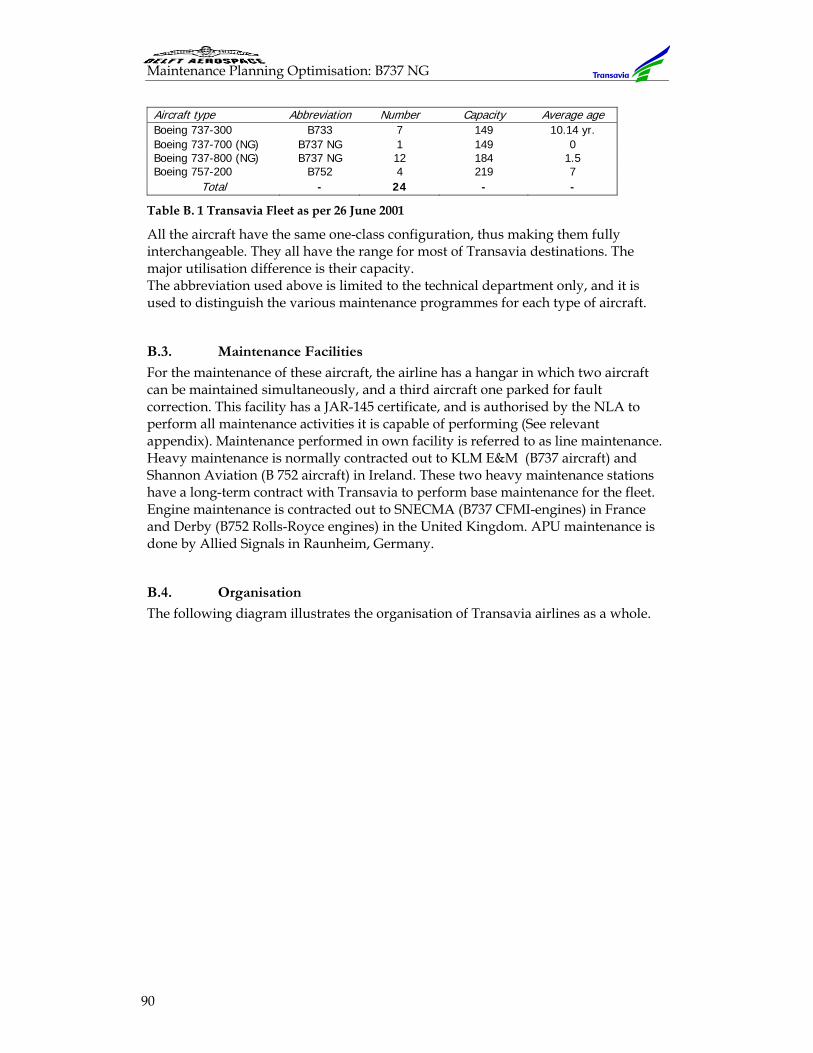
Maintenance Planning Optimisation: B737 NG
90
Aircraft type Abbreviation Number Capacity Average age Boeing 737-300 B733 7 149 10.14 yr. Boeing 737-700 (NG) B737 NG 1 149 0 Boeing 737-800 (NG) B737 NG 12 184 1.5 Boeing 757-200 B752 4 219 7
Total - 24 - -
Table B. 1 Transavia Fleet as per 26 June 2001
All the aircraft have the same one-class configuration, thus making them fully interchangeable. They all have the range for most of Transavia destinations. The major utilisation difference is their capacity. The abbreviation used above is limited to the technical department only, and it is used to distinguish the various maintenance programmes for each type of aircraft.
B.3. Maintenance Facilities
For the maintenance of these aircraft, the airline has a hangar in which two aircraft can be maintained simultaneously, and a third aircraft one parked for fault correction. This facility has a JAR-145 certificate, and is authorised by the NLA to perform all maintenance activities it is capable of performing (See relevant appendix). Maintenance performed in own facility is referred to as line maintenance. Heavy maintenance is normally contracted out to KLM E&M (B737 aircraft) and Shannon Aviation (B 752 aircraft) in Ireland. These two heavy maintenance stations have a long-term contract with Transavia to perform base maintenance for the fleet. Engine maintenance is contracted out to SNECMA (B737 CFMI-engines) in France and Derby (B752 Rolls-Royce engines) in the United Kingdom. APU maintenance is done by Allied Signals in Raunheim, Germany.
B.4. Organisation
The following diagram illustrates the organisation of Transavia airlines as a whole.
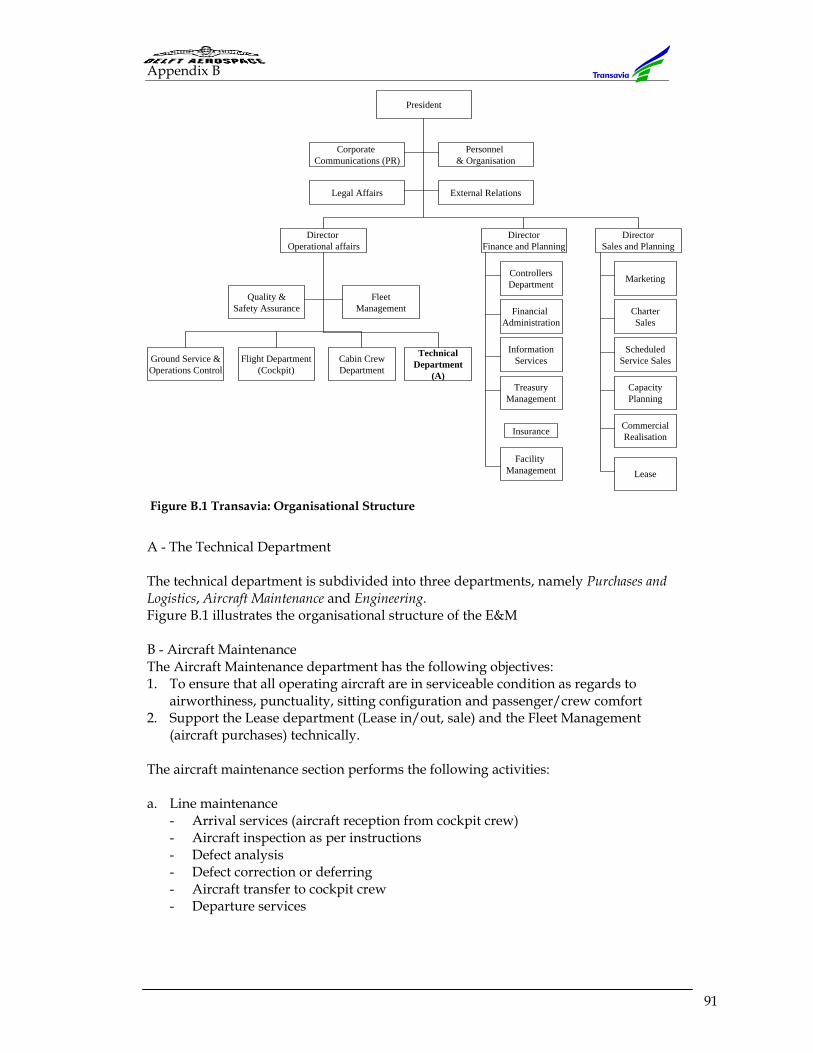
Appendix B
91
Figure B.1 Transavia: Organisational Structure
A - The Technical Department The technical department is subdivided into three departments, namely Purchases and Logistics, Aircraft Maintenance and Engineering. Figure B.1 illustrates the organisational structure of the E&M B - Aircraft Maintenance The Aircraft Maintenance department has the following objectives: 1. To ensure that all operating aircraft are in serviceable condition as regards to
airworthiness, punctuality, sitting configuration and passenger/crew comfort 2. Support the Lease department (Lease in/out, sale) and the Fleet Management
(aircraft purchases) technically. The aircraft maintenance section performs the following activities: a. Line maintenance
- Arrival services (aircraft reception from cockpit crew) - Aircraft inspection as per instructions - Defect analysis - Defect correction or deferring - Aircraft transfer to cockpit crew - Departure services
President
Corporate Communications (PR)
Legal Affairs
Personnel & Organisation
External Relations
Quality &Safety Assurance
DirectorSales and Planning
DirectorFinance and Planning
Director Operational affairs
FleetManagement
Ground Service &Operations Control
Flight Department(Cockpit)
Cabin CrewDepartment
TechnicalDepartment
(A)
ControllersDepartment
Financial Administration
InformationServices
TreasuryManagement
Facility Management Lease
CommercialRealisation
CapacityPlanning
ScheduledService Sales
CharterSales
Marketing
Insurance
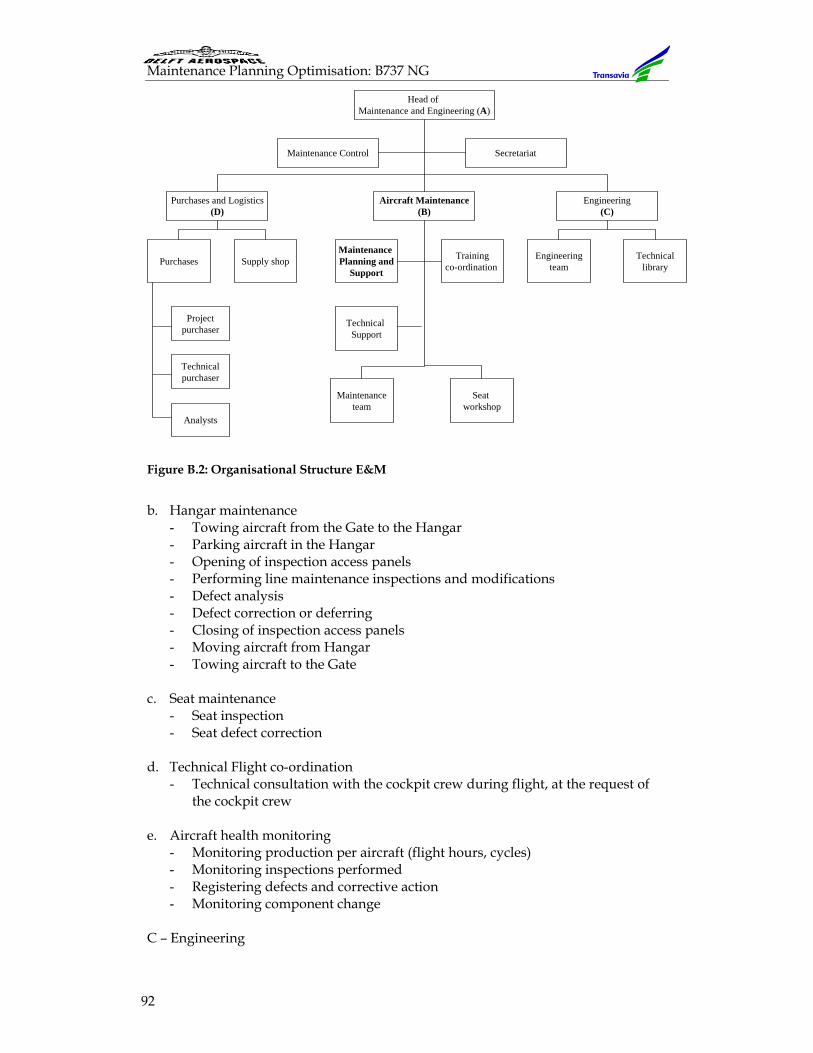
Maintenance Planning Optimisation: B737 NG
92
Figure B.2: Organisational Structure E&M
b. Hangar maintenance
- Towing aircraft from the Gate to the Hangar - Parking aircraft in the Hangar - Opening of inspection access panels - Performing line maintenance inspections and modifications - Defect analysis - Defect correction or deferring - Closing of inspection access panels - Moving aircraft from Hangar - Towing aircraft to the Gate
c. Seat maintenance
- Seat inspection - Seat defect correction
d. Technical Flight co-ordination
- Technical consultation with the cockpit crew during flight, at the request of the cockpit crew
e. Aircraft health monitoring
- Monitoring production per aircraft (flight hours, cycles) - Monitoring inspections performed - Registering defects and corrective action - Monitoring component change
C – Engineering
Head of Maintenance and Engineering (A)
Maintenance Control Secretariat
Purchases and Logistics(D)
Aircraft Maintenance(B)
Engineering(C)
Purchases Supply shopMaintenance Planning and
Support
Trainingco-ordination
Engineeringteam
Technicallibrary
Technical Support
Maintenanceteam
Seat workshop
Projectpurchaser
Technicalpurchaser
Analysts
Appendix B
93
Objectives: 1. Setting technical standards and specifications for new or modified aircraft and
components so that aircraft maintenance may be performed in accordance with Transavia and NLA maintenance execution requirements, while keeping cost as low as possible
2. Supporting the aircraft maintenance department in faultfinding and rectification of complex faults. Also issue repair instructions for specific tasks, and help in investigating the course of the most common defects
3. Participate technically in the purchase of new aircraft, and in making specifications on aircraft modification in order to fulfil the wishes of the Flight and cabin services, marketing and lease department.
This department is subdivided into five sections, broadly categorised according to ATA 100 classification. These sections are:
a. Maintenance programs b. Power Plants c. Structures/Systems d. Interiors e. Avionics
D - Purchases and Logistics Objectives Realisation of all commercial activities (purchases, outsourcing and sales) of goods and services (including personnel) and all logistical services in order to support the E&M in maintaining its JAROPS1 and JAR145 standard and low cost of ownership strategies. Activities a. Project purchases: purchasing specified goods and services for maintenance
activities and modifications from specialised vendors. This also involves preparing contracts for out-source work and pooling activities.
b. Purchases: Purchasing goods and materials for (ad hoc) maintenance activities and toping up component stocks for normal activities. Purchases also deals with the disposal (sale) of unnecessary materials.
c. Analysis: Determining optimum stock and spare-parts levels and re-order levels and monitoring contracts and co-operation agreements.
d. Warranty management: Monitoring aircraft and component warranty as a tool of minimising spending on maintenance.
e. Supplies shop: Mainly deals with the reception, storage and distribution of materials/articles and technical consignments.
B.5. Operational area
Transavia mainly operates holiday charters and scheduled services (including the BASIQ AIR service) to destinations along the Mediterranean Sea. It also makes flights to destinations such as Tel Aviv (Israel) and Kathmandu (Nepal).
Maintenance Planning Optimisation: B737 NG
94
Table B.2 below gives an overview of all Transavia destinations. The Transavia operational year is typically divided into two periods: the summer period (high season) and the winter period (low season). The high season begins in May and runs through October. During this season, the airline operates at its maximum capacity (utilises all aircraft) and, where necessary, leases in aircraft. Consequently, minimum ground time (turn around time and maintenance time) is desired in order to suit operational demands. The low season begins in November and runs through April, the following year. This season demands the availability of at least half of the fleet, hence offering more ground time for maintenance activities. It is during this season that heavy maintenance is carried out.
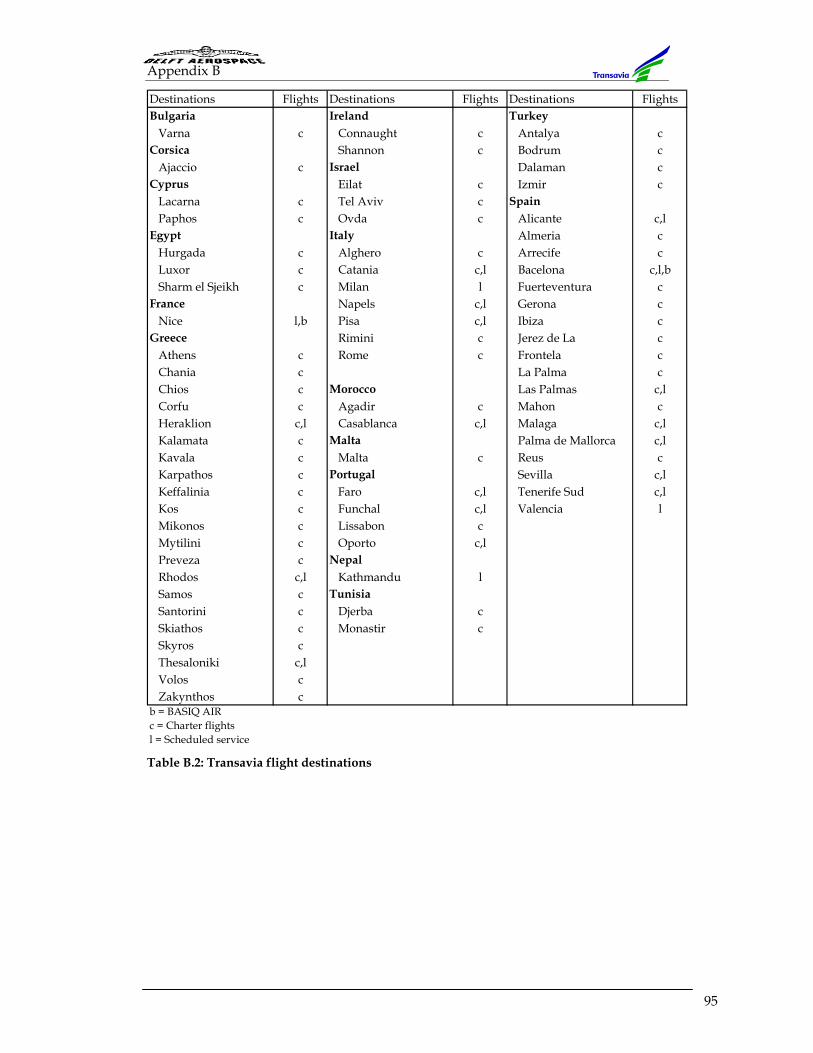
Appendix B
95
Table B.2: Transavia flight destinations
Destinations Flights Destinations Flights Destinations FlightsBulgaria Ireland Turkey
Varna c Connaught c Antalya cCorsica Shannon c Bodrum c
Ajaccio c Israel Dalaman cCyprus Eilat c Izmir c
Lacarna c Tel Aviv c SpainPaphos c Ovda c Alicante c,l
Egypt Italy Almeria cHurgada c Alghero c Arrecife cLuxor c Catania c,l Bacelona c,l,bSharm el Sjeikh c Milan l Fuerteventura c
France Napels c,l Gerona cNice l,b Pisa c,l Ibiza c
Greece Rimini c Jerez de La cAthens c Rome c Frontela cChania c La Palma cChios c Morocco Las Palmas c,lCorfu c Agadir c Mahon cHeraklion c,l Casablanca c,l Malaga c,lKalamata c Malta Palma de Mallorca c,lKavala c Malta c Reus cKarpathos c Portugal Sevilla c,lKeffalinia c Faro c,l Tenerife Sud c,lKos c Funchal c,l Valencia lMikonos c Lissabon cMytilini c Oporto c,lPreveza c NepalRhodos c,l Kathmandu lSamos c TunisiaSantorini c Djerba cSkiathos c Monastir cSkyros cThesaloniki c,lVolos cZakynthos c
b = BASIQ AIRc = Charter flightsl = Scheduled service

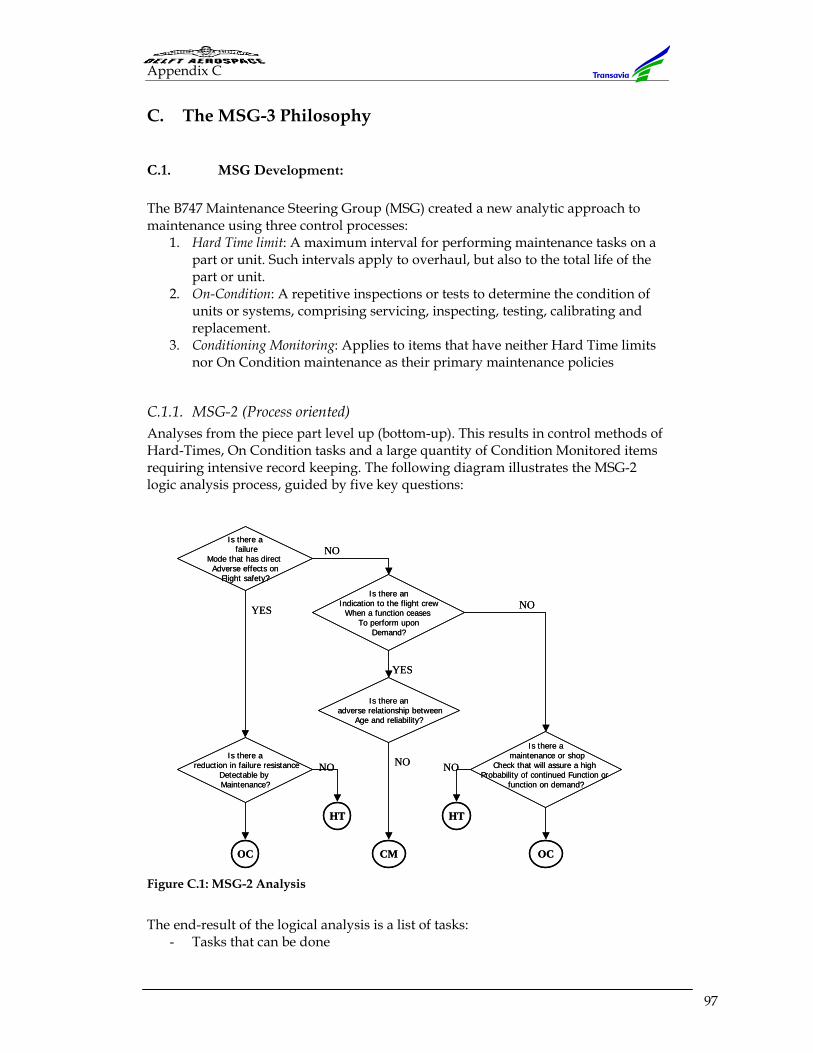
Appendix C
97
C. The MSG-3 Philosophy
C.1. MSG Development:
The B747 Maintenance Steering Group (MSG) created a new analytic approach to maintenance using three control processes:
1. Hard Time limit: A maximum interval for performing maintenance tasks on a part or unit. Such intervals apply to overhaul, but also to the total life of the part or unit.
2. On-Condition: A repetitive inspections or tests to determine the condition of units or systems, comprising servicing, inspecting, testing, calibrating and replacement.
3. Conditioning Monitoring: Applies to items that have neither Hard Time limits nor On Condition maintenance as their primary maintenance policies
C.1.1. MSG-2 (Process oriented) Analyses from the piece part level up (bottom-up). This results in control methods of Hard-Times, On Condition tasks and a large quantity of Condition Monitored items requiring intensive record keeping. The following diagram illustrates the MSG-2 logic analysis process, guided by five key questions:
Figure C.1: MSG-2 Analysis
The end-result of the logical analysis is a list of tasks:
- Tasks that can be done
Is there afailure
Mode that has direct Adverse effects on
Flight safety?
Is there anIndication to the flight crew
When a function ceases To perform upon
Demand?
Is there areduction in failure resistance
Detectable by Maintenance?
Is there anadverse relationship between
Age and reliability?
Is there amaintenance or shop
Check that will assure a high Probability of continued Function or
function on demand?
HT HT
OCOC CM
NO
NO
NONO NO
YES
YES
Maintenance Planning Optimisation: B737 NG
98
- Tasks that have to be done - Tasks that should be done
C.1.2. RCM (Reliability Centred Maintenance) The Reliability Centred Maintenance (RCM) concept refined the logic process leading to MSG-3.
C.1.3. MSG-3 (Task oriented maintenance) Task oriented process, analyses through system failure from the top down. Results in maintenance tasks that are performed for safety, operational or economic reasons. It involves preventive maintenance, performed before failure occurs (and is intended to prevent failure) as well as failure finding tasks. The tasks referred to consist of Lubrication/Servicing, Operational/Visual, Inspection/Functional, Restoration and discard. These are mostly derived from the MSG-3 logic analysis.
MSG-3 Revision 1 This was a refining of the original MSG-3 in order to make it user-friendlier. It led to the elimination of the Operating Crew Monitoring strategy in the original MSG-3
MSG-3 Revision 2 This is a revision of the MSG-3 policy. It provides additional clarification and guidelines on development of Corrosion Prevention Control Programs (CPCP).
C.2. Maintenance program objectives (MSG-3)
- To ensure realisation of inherent safety and reliability levels of the equipment - To restore safety and reliability to their inherent levels when deterioration has
occurred - To obtain the information necessary for the design improvement of those items
whose inherent reliability proves inadequate - To accomplish these goals at minimum total cost, including maintenance costs
and the cost of residual failure Contents Maintenance Program MSG-3 Tasks are sub-divided into two categories: 1. Scheduled tasks: these are tasks to be accomplished at scheduled intervals
Lubrication/servicing (LU/SV) Operational Visual check (OP/VC) Inspection-General Visual/ Functional check (GV/FC) Detailed Inspection (IN) Restoration (RS) Discard (DS)
2. Non-scheduled tasks: these result from Scheduled tasks accomplished at specific intervals Reports of malfunction (usually originating from operating crew) Data analysis
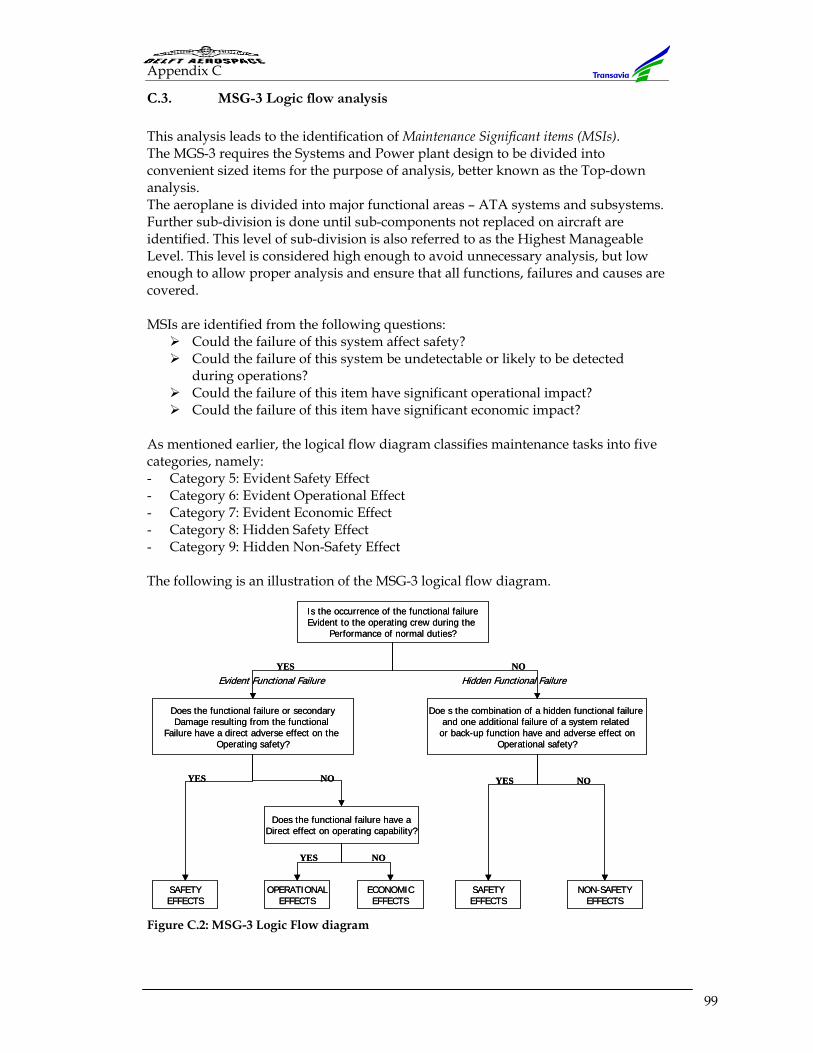
Appendix C
99
C.3. MSG-3 Logic flow analysis
This analysis leads to the identification of Maintenance Significant items (MSIs). The MGS-3 requires the Systems and Power plant design to be divided into convenient sized items for the purpose of analysis, better known as the Top-down analysis. The aeroplane is divided into major functional areas – ATA systems and subsystems. Further sub-division is done until sub-components not replaced on aircraft are identified. This level of sub-division is also referred to as the Highest Manageable Level. This level is considered high enough to avoid unnecessary analysis, but low enough to allow proper analysis and ensure that all functions, failures and causes are covered. MSIs are identified from the following questions:
Could the failure of this system affect safety? Could the failure of this system be undetectable or likely to be detected
during operations? Could the failure of this item have significant operational impact? Could the failure of this item have significant economic impact?
As mentioned earlier, the logical flow diagram classifies maintenance tasks into five categories, namely: - Category 5: Evident Safety Effect - Category 6: Evident Operational Effect - Category 7: Evident Economic Effect - Category 8: Hidden Safety Effect - Category 9: Hidden Non-Safety Effect The following is an illustration of the MSG-3 logical flow diagram.
Figure C.2: MSG-3 Logic Flow diagram
Is the occurrence of the functional failureEvident to the operating crew during the
Performance of normal duties?
Does the functional failure or secondaryDamage resulting from the functional
Failure have a direct adverse effect on the Operating safety?
Doe s the combination of a hidden functional failure and one additional failure of a system related
or back-up function have and adverse effect onOperational safety?
Does the functional failure have aDirect effect on operating capability?
YES
YES
YES
YES
NO
NO
NO NO
SAFETYEFFECTS
OPERATIONALEFFECTS
ECONOMICEFFECTS
SAFETYEFFECTS
NON-SAFETYEFFECTS
Evident Functional Failure Hidden Functional Failure
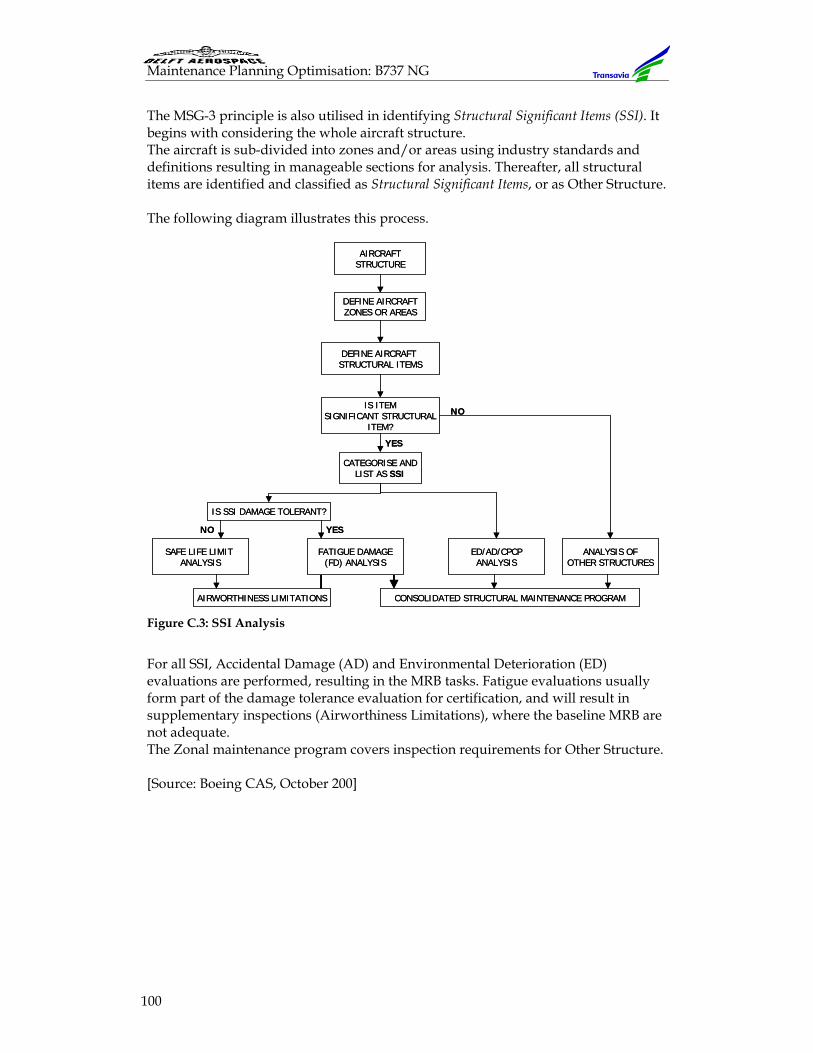
Maintenance Planning Optimisation: B737 NG
100
The MSG-3 principle is also utilised in identifying Structural Significant Items (SSI). It begins with considering the whole aircraft structure. The aircraft is sub-divided into zones and/or areas using industry standards and definitions resulting in manageable sections for analysis. Thereafter, all structural items are identified and classified as Structural Significant Items, or as Other Structure. The following diagram illustrates this process.
Figure C.3: SSI Analysis
For all SSI, Accidental Damage (AD) and Environmental Deterioration (ED) evaluations are performed, resulting in the MRB tasks. Fatigue evaluations usually form part of the damage tolerance evaluation for certification, and will result in supplementary inspections (Airworthiness Limitations), where the baseline MRB are not adequate. The Zonal maintenance program covers inspection requirements for Other Structure. [Source: Boeing CAS, October 200]
AIRCRAFTSTRUCTURE
DEFINE AIRCRAFTZONES OR AREAS
DEFINE AIRCRAFT STRUCTURAL ITEMS
IS ITEMSIGNIFICANT STRUCTURAL
ITEM?
CATEGORISE ANDLIST AS SSI
FATIGUE DAMAGE(FD) ANALYSIS
SAFE LIFE LIMIT ANALYSIS
ED/AD/CPCPANALYSIS
ANALYSIS OFOTHER STRUCTURES
IS SSI DAMAGE TOLERANT?
AIRWORTHINESS LIMITATIONS CONSOLIDATED STRUCTURAL MAINTENANCE PROGRAM
YES
YES
NO
NO
Appendix D
101
D. Maintenance Program Packaging Methods
D.1. Maintenance program packaging methods
Objectives Manufacturer
• To provide the operator with packaging options for fleet maintenance program
• Increase the production efficiency of an organisation Operator
• Increase aircraft availability • Reduce production costs
By reviewing an operator’s anticipated utilisation, environmental considerations, fleet size, seasonal constraints, and other factors, it is possible to package an aircraft’s maintenance program taking full advantage of the allowable utilisation parameters (Hours, Cycles and Calendar Time) as specified in the MPD document. The band of possible task packaging for a given airplane can range from a program consisting of a large number of progressively performed small work packages equalised/progressive check) to a program which bundles most scheduled tasks in relatively few large checks performed at higher intervals (block check). The traditional A, B, C & D check programs are typically situated somewhere between the two extremes (also referred to as Segmented Checks). Most airlines’ scheduled programs fall in this category. The selection of the right task packaging method that satisfies an operator’s requirements will depend on three primary considerations: - Operational considerations (route structure, flight length, frequency of flight) - Commercial considerations (traffic patterns, seasonal constraints) Technical considerations (maintenance program, manpower skills, tooling etc)
D.2. Block Packaging
This is focused on the principle of grouping all maintenance tasks that require frequent repetition under a letter check (i.e. “A”, “B”, “C”, “D” Checks). This method produces a small number of relatively large work packages having the disadvantage of a relatively long maintenance ground time Conditions favouring BLOCK packaging include
- Large airplane fleet - High utilisation - Spare airplane available - Long range operation - Flexible manpower - Non-scheduled maintenance - Single centrally located maintenance
base - Utilisation varies with calendar
season - Contract maintenance
Advantages: • Reduces spare requirements at out stations
Maintenance Planning Optimisation: B737 NG
102
• Increased ground time Increased ground time simplifies scheduling or the logical sequencing of work to be performed. Sequencing considerations include specific configuration for the accomplishment of various tasks. For example, many operational tasks require electric or hydraulic power. Engine tasks may require cowls and thrust-reversers to be Open. This could conflict with wing tasks requiring flaps and leading edge devices to be deployed.
• Logistical considerations for spares are also simplified. • Accomplishment of modifications • Rectification of non-routines • More efficient sequencing of long jobs
Disadvantages Manpower requirements can be adversely affected if airplane fleet planning cannot support back-to-back scheduling of airplanes. Component parts may be replaced several hundred hours before replacement is necessary. However, the benefit quite often outweighs the disadvantages. Operator scheduling constraints are typically the reason for early replacements. Block check programs increase the risk of the airplane becoming a parts department in support of in-service airplanes.
D.3. Equalised/Phased or progressive packaging:
Packages requiring shorter ground time Equalised packaging is an alternative method of packaging maintenance tasks. In this method, tasks are arranged into many small packages all having approximately the same ground time. Each package may contain only a few tasks but with a ground time (elapsed time) of less than 8 hours. This may also be elapsed time that satisfies the availability requirements specified by airline operations and scheduling. In their description of the functions of a maintenance management tool, MX Technologies refer to equalised maintenance as a program “derived through updated MSG-3 analysis”. This implies that equalised maintenance is, in actual fact, Task-Based Maintenance. In an equalized program, the larger letter checks are segmented into smaller but more frequent work packages, with the result that the aircraft has greater overall availability for revenue-generating service. Also, segmentation helps to get the maximum life out of life-limited components Conditions favouring equalised packaging include
- Small aircraft fleet - Low utilisation - No spare airplane - Short range operations - Manpower equalisation - Scheduled operations - Multiple maintenance locations - Constant utilisation - Maintenance performed in house
Advantages Equalised packaging simplifies manpower-planning requirements. This is because, moving tasks from one check package to another minimises peaks and valleys in manpower requirements. However, when considering equalisation, it is important to weigh all operational considerations.
Appendix D
103
Other advantages include:
- Reduced ground time - Frequent visit supports full component life
- Increased aircraft availability - Balanced workload on small fleets - Reduced size of workload - More opportunities to correct deferred
maintenance - Flexibility of grouping tasks with
common access
Disadvantages As with the block check, if taken to an extreme, disadvantages can offset the efficiency gained in another area if all aspects of the program are not carefully considered. Equalised work packages increase open/close access requirements. This in turn increases the stress on fasteners, causing a consequent replacement due to induced damage. Additionally, over time, total man-hours as compared to a block check will be higher. Other disadvantages include: • Increase in production planning and scheduling workload • Careful planning is required due to the limited ground time • There is limited time for the accomplishment of modifications • Short jobs are inherently inefficient • Limited time to identify and rectify non-routines
[Sources: Boeing CAS, 2000; Mxi Technologies (www.mxi.com), 2002]

Appendix E
105
E. Line and Base Maintenance Redefinition
Transavia JAR-145 scope of work
E.1. Cause
The MPD of the 737-800 does not make a distinction between A and C checks. Instead, it just lists all maintenance tasks that need to be performed on the aircraft. This allows the operator to set up his own maintenance program, depending on the aircraft utilisation. Transavia opted to define line maintenance task as ‘all tasks with maintenance limits of less than 540 Days, 3000 Cycles or 6000 Hours’. All tasks with limits above these were classified as base maintenance tasks. Such a definition was not reasonable, owing to the fact that there were many tasks with higher intervals, which Transavia was fully capable of performing. The JAA Leaflet No. 6 on the JAR-145 Definition of Line Maintenance also supported this view. Point 4 of this leaflet states: “Taking into account the wide range of aircraft used in commercial aircraft transport, e.g. light single engine, helicopter and large transport airplanes, and furthermore considering their different maintenance programmes, it is not appropriate to use hours, letter checks, or calendar time as a divider between line and base maintenance.” Transavia would therefore prefer to perform some base maintenance tasks at its own hangar, in order to reduce this de-escalation.
E.2. Aim
To carry out an evaluation on which tasks, classified under the current definition (see E.1 above) as Base Maintenance tasks, can be performed by Transavia, a JAR-145 Line Maintenance organisation (JAR-145 Section 2, paragraphs 3.2.1-3.2.4). Transavia Airlines is currently certified as a Line Maintenance Organisation, and hence licensed to perform all Line Maintenance tasks. Line Maintenance referred to is as defined in this document, and as approved by the National Aviation Authority (Inspectie Verkeer and Waterstaat - Divisie Luchtvaart, IVW-DL, formally RLD), in accordance to JAR-OPS 1.910(b) and 3.910(b).
E.3. Approach
All maintenance tasks Transavia is capable of performing will be evaluated by considering the following aspects:
Staff Whether the Transavia Certified staff (JAR-66, Category B1) has the knowledge and expertise to perform such tasks, and to rectify defects where necessary.
Means Whether Transavia has the necessary components, materials, tools, equipment and documentation needed to perform such tasks, and to rectify defects where necessary.
Materials Whether Transavia has the necessary facilities required to perform such tasks, and to rectify defects where necessary.
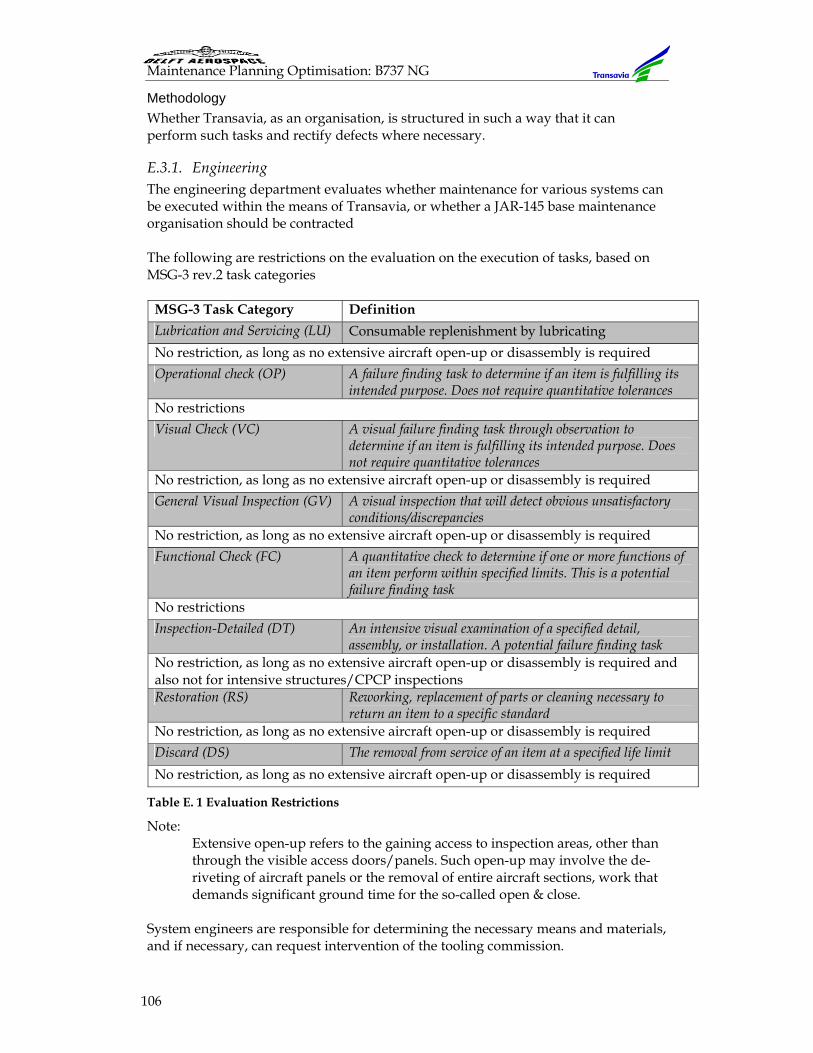
Maintenance Planning Optimisation: B737 NG
106
Methodology Whether Transavia, as an organisation, is structured in such a way that it can perform such tasks and rectify defects where necessary.
E.3.1. Engineering The engineering department evaluates whether maintenance for various systems can be executed within the means of Transavia, or whether a JAR-145 base maintenance organisation should be contracted The following are restrictions on the evaluation on the execution of tasks, based on MSG-3 rev.2 task categories
MSG-3 Task Category Definition Lubrication and Servicing (LU) Consumable replenishment by lubricating No restriction, as long as no extensive aircraft open-up or disassembly is required Operational check (OP) A failure finding task to determine if an item is fulfilling its
intended purpose. Does not require quantitative tolerances No restrictions Visual Check (VC) A visual failure finding task through observation to
determine if an item is fulfilling its intended purpose. Does not require quantitative tolerances
No restriction, as long as no extensive aircraft open-up or disassembly is required General Visual Inspection (GV) A visual inspection that will detect obvious unsatisfactory
conditions/discrepancies No restriction, as long as no extensive aircraft open-up or disassembly is required Functional Check (FC) A quantitative check to determine if one or more functions of
an item perform within specified limits. This is a potential failure finding task
No restrictions Inspection-Detailed (DT) An intensive visual examination of a specified detail,
assembly, or installation. A potential failure finding task No restriction, as long as no extensive aircraft open-up or disassembly is required and also not for intensive structures/CPCP inspections Restoration (RS) Reworking, replacement of parts or cleaning necessary to
return an item to a specific standard No restriction, as long as no extensive aircraft open-up or disassembly is required Discard (DS) The removal from service of an item at a specified life limit No restriction, as long as no extensive aircraft open-up or disassembly is required
Table E. 1 Evaluation Restrictions
Note: Extensive open-up refers to the gaining access to inspection areas, other than through the visible access doors/panels. Such open-up may involve the de-riveting of aircraft panels or the removal of entire aircraft sections, work that demands significant ground time for the so-called open & close.
System engineers are responsible for determining the necessary means and materials, and if necessary, can request intervention of the tooling commission.
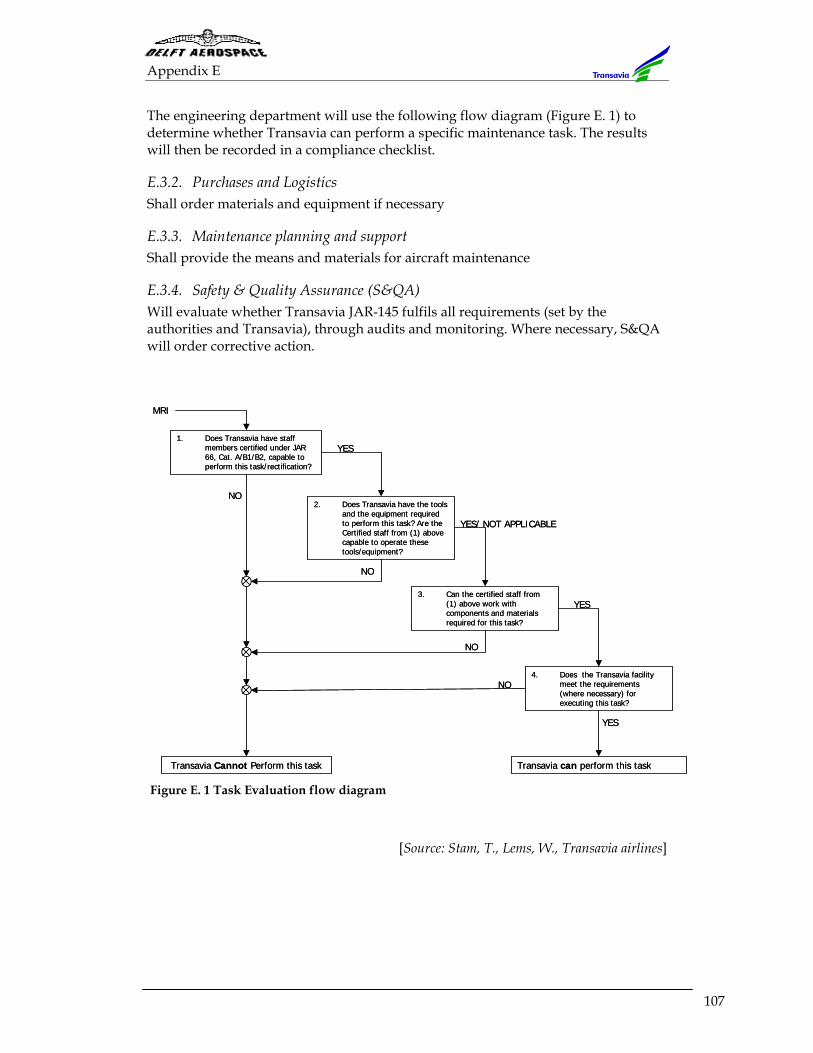
Appendix E
107
The engineering department will use the following flow diagram (Figure E. 1) to determine whether Transavia can perform a specific maintenance task. The results will then be recorded in a compliance checklist.
E.3.2. Purchases and Logistics Shall order materials and equipment if necessary
E.3.3. Maintenance planning and support Shall provide the means and materials for aircraft maintenance
E.3.4. Safety & Quality Assurance (S&QA) Will evaluate whether Transavia JAR-145 fulfils all requirements (set by the authorities and Transavia), through audits and monitoring. Where necessary, S&QA will order corrective action.
Figure E. 1 Task Evaluation flow diagram
[Source: Stam, T., Lems, W., Transavia airlines]
1. Does Transavia have staff members certified under JAR 66, Cat. A/B1/B2, capable to perform this task/rectification?
2. Does Transavia have the tools and the equipment required to perform this task? Are the Certified staff from (1) above capable to operate these tools/equipment?
3. Can the certified staff from (1) above work with components and materials required for this task?
4. Does the Transavia facility meet the requirements (where necessary) for executing this task?
Transavia Cannot Perform this task Transavia can perform this task
MRI
YES
NO
NO
NO
NO
YES
YES/ NOT APPLICABLE
YES1. Does Transavia have staff
members certified under JAR 66, Cat. A/B1/B2, capable to perform this task/rectification?
2. Does Transavia have the tools and the equipment required to perform this task? Are the Certified staff from (1) above capable to operate these tools/equipment?
3. Can the certified staff from (1) above work with components and materials required for this task?
4. Does the Transavia facility meet the requirements (where necessary) for executing this task?
Transavia Cannot Perform this task Transavia can perform this task
MRI
YES
NO
NO
NO
NO
YES
YES/ NOT APPLICABLE
YES

Appendix F
109
F. Transavia Airplane Reliability Program Airplane Reliability program This is a set of rules and practices developed by the airline and approved by the regulatory authority. It is an event reporting system based on performance values experienced under actual operating conditions. It provides continuous audits of maintenance functions to enhance safety and cost effective maintenance. The program identifies problem areas within in the airplane maintenance process so that corrective action can be taken to fix these problems. The reliability program principals are applicable to all airplane models operated by the airline. Guidelines for establishing a reliability programs are provided in the FAA Advisory Circular 120-17A. The reliability program is a close loop cycle, accomplished by applying the following steps: 1. Identification of performance parameters that reflect airplane reliability. 2. Collection, analysing and reporting of data gathered from service experience and reflecting airplane reliability. 3. Problems are investigated and identified. 4. Corrective actions are proposed and applied. 5. Corrective actions are monitored to ensure that maintenance cycle problems are
solved. Reliability program flowchart A Reliability Program Flow Chart (Figure F. 1 below) will include the following steps: 1. Identification of performance parameters. 2. Collection of. Service data 3. Reporting and analysing of service data 4. Decisions are made if performance standards are met 5. Engineering investigates alerts and determines corrective actions 6. Reliability Control Board (RCB) approves corrective action. 7. Engineering issue engineering order (EO) to correct problem. 8. Maintenance accomplishes EO on airplane. 9. Cycle repeat it self. Reliability program responsibilities are shared by
− Reliability Section (RS): this section conducts the day-to- day operations of the program and report directly to the Quality Assurance Manager.
− A Reliability Control Board (RCB): this is an audit and standard committee, composed of a permanent and advisory members responsible to manage the overall operation of the program and approves corrective action
− Various Engineering and Production units of the Maintenance and Engineering Division: these provide support to the various aspects of the program.
The reliability program supports the long and short-term surveillance of fleet reliability through a progressive schedule of activities, which include a daily
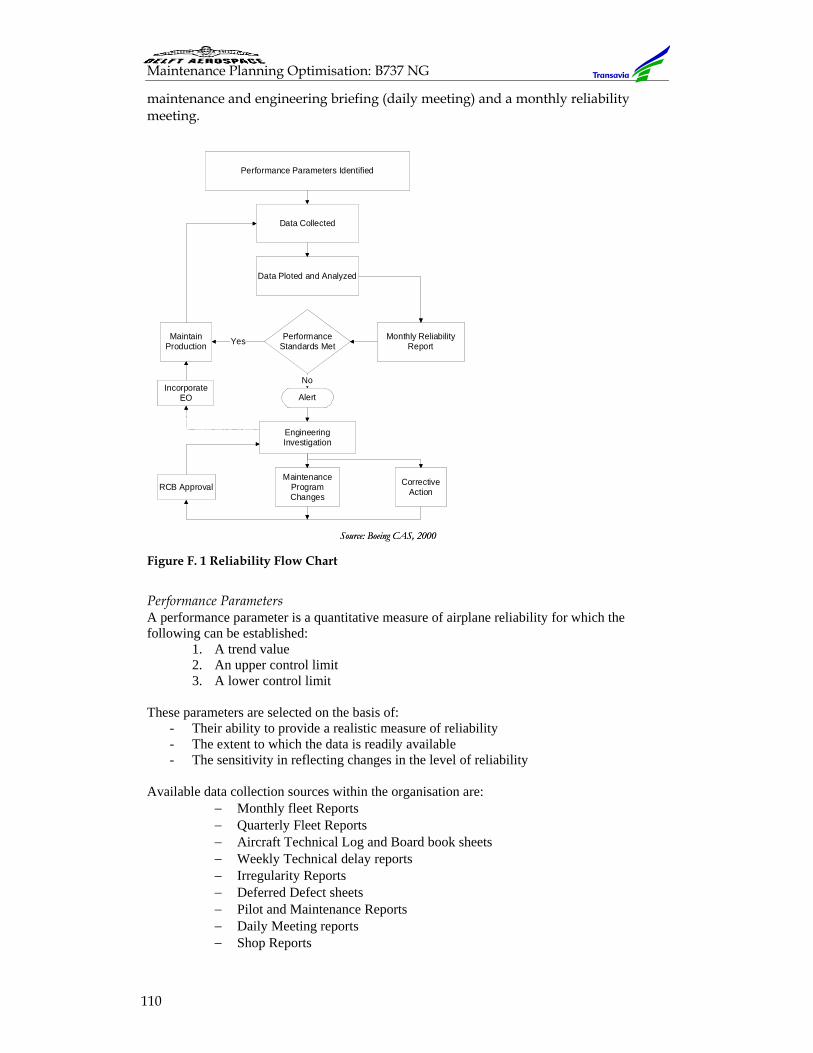
Maintenance Planning Optimisation: B737 NG
110
maintenance and engineering briefing (daily meeting) and a monthly reliability meeting.
Figure F. 1 Reliability Flow Chart
Performance Parameters A performance parameter is a quantitative measure of airplane reliability for which the following can be established:
1. A trend value 2. An upper control limit 3. A lower control limit
These parameters are selected on the basis of:
- Their ability to provide a realistic measure of reliability - The extent to which the data is readily available - The sensitivity in reflecting changes in the level of reliability
Available data collection sources within the organisation are:
− Monthly fleet Reports − Quarterly Fleet Reports − Aircraft Technical Log and Board book sheets − Weekly Technical delay reports − Irregularity Reports − Deferred Defect sheets − Pilot and Maintenance Reports − Daily Meeting reports − Shop Reports
Performance Parameters Identified
Data Collected
Data Ploted and Analyzed
PerformanceStandards Met
MaintainProduction
IncorporateEO Alert
EngineeringInvestigation
RCB ApprovalMaintenance
ProgramChanges
CorrectiveAction
Monthly ReliabilityReport
No
Yes
Source: Boeing CAS, 2000
Performance Parameters Identified
Data Collected
Data Ploted and Analyzed
PerformanceStandards Met
MaintainProduction
IncorporateEO Alert
EngineeringInvestigation
RCB ApprovalMaintenance
ProgramChanges
CorrectiveAction
Monthly ReliabilityReport
No
Yes
Source: Boeing CAS, 2000
Appendix F
111
− Work Performance sheet − Digital engine trend monitoring data − System and component reliability reports (METALS) − Flight Data Recorder
The following is a list of parameters used in measuring reliability performance:
- Technical Dispatch Reliability - Pilot Reports - Hold Item Lists - Deferred defect Reports - Delays/cancellations - Review of structural inspection findings - In Flight shut downs (IFSD) - Unscheduled removals - Confirmed failures
1. Trend Value Monitoring Airplane reliability is monitored at various levels, which are:
a. Aircraft level: performance parameter used for reflecting the airplane reliability will be whether the aircraft has made the next flight or not. The following parameters are utilised:
Average Daily Utilisation Airtime per month
Days in the month*No. of a/c in fleet=
Average Stage length Airtime per monthCycles per Month
=
Fleet Technical PerformancePilot Reports*1000
Airtime per evaluation interval=
b. System level: performance parameters used are Pilots reports (PIREPS) per 100
landings and/or Mechanical delays/Cancellations per 100 Revenue Departures, the ATA chapters considered when calculating the rate of these two parameters are ATA 21 through 36, 38 and 49.
c. Power plant level: parameters used are In-flight shutdowns events (IFSD) per
1000 engine hours and/or unscheduled removal per 1000 engine hours. Transavia airlines also works with an engine removal rate parameter, which is:
Engine Removal RateNo. of engines removed*1000
Engine Hours=
The ATA chapters considered when calculating the rate of these parameters are ATA 71 through 80.
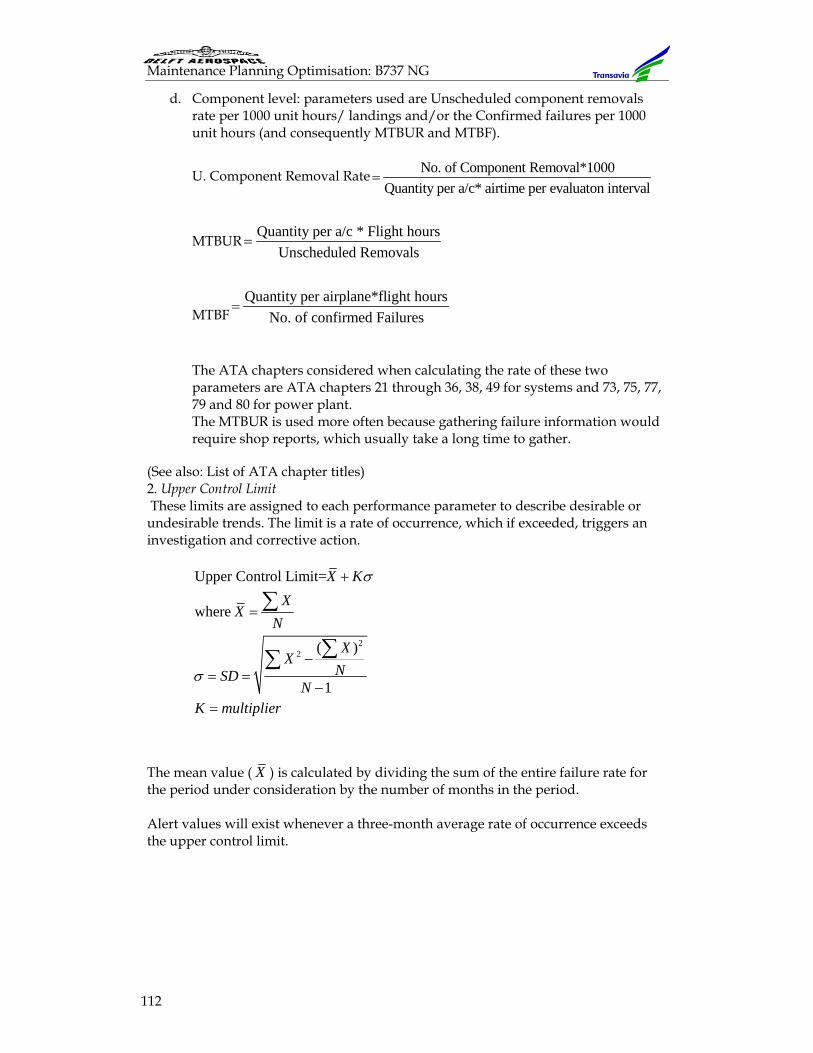
Maintenance Planning Optimisation: B737 NG
112
d. Component level: parameters used are Unscheduled component removals rate per 1000 unit hours/ landings and/or the Confirmed failures per 1000 unit hours (and consequently MTBUR and MTBF).
U. Component Removal Rate No. of Component Removal*1000Quantity per a/c* airtime per evaluaton interval
=
MTBURQuantity per a/c * Flight hours
Unscheduled Removals=
MTBFQuantity per airplane*flight hours
No. of confirmed Failures=
The ATA chapters considered when calculating the rate of these two parameters are ATA chapters 21 through 36, 38, 49 for systems and 73, 75, 77, 79 and 80 for power plant. The MTBUR is used more often because gathering failure information would require shop reports, which usually take a long time to gather.
(See also: List of ATA chapter titles) 2. Upper Control Limit These limits are assigned to each performance parameter to describe desirable or undesirable trends. The limit is a rate of occurrence, which if exceeded, triggers an investigation and corrective action.
22
Upper Control Limit=
where
( )
1
X KX
XN
XX
NSDN
K multiplier
σ
σ
+
=
−= =
−=
∑
∑∑
The mean value ( X ) is calculated by dividing the sum of the entire failure rate for the period under consideration by the number of months in the period. Alert values will exist whenever a three-month average rate of occurrence exceeds the upper control limit.
Appendix G
113
G. Maintenance Governing Regulations The Standards for design and operation are issued as regulations. These can apply to both Manufacturers and Operators. Approvals by the Regulatory authority showing compliance with these standards are shown by means of issuing certificates.
G.1. The Federal Aviation Administration (FAA)
The FAA issues its standards through the Federal Aviation Regulations (FARs). The Code of Federal Regulation is divided into 50 titles that represent broad areas subject to federal regulation. The Aviation Regulations are found in the Code of Federal Regulations Title 14, Chapter I, Parts 1 through 199. The major Parts from Chapter I of the Code that have an impact on Maintenance are:
♦ Parts 25, 33, 34, and 36 contain the design standards that are used as the basis of Certification.
♦ Parts 39 and 121 are applicable to operating airplanes Standards for Safety in Design are contained in Part 25 and mandatory changes to the certified Design are covered by part 39. Part 25.1529 (Appendix H) contains the requirement for Instructions for Continued Airworthiness. This means that Maintenance Manuals must support a new design. This must include an approved Maintenance Program. The standards in the FARs that relate to how an operator must perform maintenance are found in part 121 and Part 43. Part 121.365 requires a certificate holder to have an adequate maintenance and inspection organization. Part 121.379 requires certificate holders to use approved data for major repairs and alterations. Part 43 requires that methods, techniques, and practices acceptable to the administrator be used for inspection and repair of civil aircraft. FAA approved services documents are the major source that fill this requirement. This FAR also identifies what is required (by paper work sign offs) to return an aircraft back to service also defines a Major and Minor Repair or Alteration. Advisory Circulars are the FAA primary means of distributing information of a non-regulatory nature to the public. They provide a description of non-regulatory guidance, policy, and information. There is a Master Index that lists all effective ACs. There are several Advisory Circulars that have an impact on Maintenance Programs. These include:
1. AC 120-16C: Continuous Airworthiness Maintenance Programs This AC gives airline the privilege and responsibility of aircraft maintenance. It provides information and guidance on Continuous Airworthiness Maintenance Programs. Five elements of an airworthiness maintenance program include:
- Performance and approval of maintenance & alterations (routine and non-routine maintenance)
Maintenance Planning Optimisation: B737 NG
114
- Arrangements for maintenance and alterations (Maintenance scheduling)
- Responsibility for airworthiness - Continuous analysis and surveillance - Maintenance and inspection organisation
2. AC 121-22A: Maintenance Review Board (MRB)
This AC provides guidelines that may be used by industry during its development and revision of the initial minimum scheduled maintenance/inspection requirements for derivative or newly type certificated transport category aircraft and power plants for submittal to the FAA for approval. These initial minimum scheduled maintenance/inspection requirements are referred to in this AC as the Maintenance review Board Report (MRBR). The requirements, after approval by the FAA, become the framework around which each air carrier develops its own individual maintenance program.
FAA regulations require that specific operational authorizations and limitations applicable to an Air Operator Certificate, issued in conjunction with the issue of the Air Operations Specifications, are to supplement the general requirements of the basic certificate, and are to list authorizations and limitations not specifically covered by other FAA regulations. Part 121.25 lists the contents of the Operating Certificate and the Operations Specification. This combined issuance of the Air Operator Certificate and the Operations Specification constitute the FAA approval of the unique airline operation. Variables affecting unique carrier operations include:
o Aircraft types o Operating environment o Operator capability o Level of experience o Facilities o Organizational structure
G.1.1. Reliability program requirements FAR Part 121.373 requires each certificate holder to establish and maintain a system for the continuing analysis and surveillance of the performance and effectiveness of its maintenance program. On the other hand, AC120-17A provides information and guidance materials which may be used to design or develop maintenance reliability programs utilising reliability control methods.
G.1.2. Airworthiness Directives (ADs) If it is determined that Service Instructions (inspections, repairs, or modifications) are necessary, the manufacturer is required by Part 21 to provide them. The FAA approves all Service Instructions that the manufacturer may develop. An Airworthiness Directive is the only means by which owners and operators (airlines) can be forced to accomplish a manufacturer Service Bulletin. Airworthiness Directives are the end result of the Continued Airworthiness Program performed by the FAA. [References: FAR Parts 21,121, 135]
Appendix G
115
G.1.3. Airworthiness Two conditions must be met for an airplane to be considered airworthy: An aeronautical product is airworthy when it conforms to the regulations under which it has been certified. This means that the product has to comply with the documentation that demonstrates that the design meets the regulations. This documentation has been submitted to the FAA as the basis for Certification approval. The airplane configuration and the components installed must be consistent with the drawings, specifications, and other data that are part of the Type Certificate. An aeronautical product must conform to its type design, supplemental type design, any applicable Airworthiness Directives (AD), and be in a condition for safe operation. This means that an airplane continues to be airworthy when it continues to meet the design (or approved design changes) and is being inspected in accordance with, and meeting the requirements of, the approved manuals. The condition for safe operation refers to the condition of the airplane relative to wear and deterioration
G.2. The Joint Aviation Authority (JAA)
The Joint Aviation Authorities (JAA) is an associated body of the European Civil Aviation Conference (ECAC) representing the civil aviation regulatory authorities of a number of European States who have agreed to co-operate in developing and implementing common safety regulatory standards and procedures. This co-operation is intended to provide high and consistent standards of safety and a "level playing-field" for competition in Europe. Much emphasis is also placed on harmonising the JAA regulations with those of the USA (FAA). The JAA develops and implements Joint Aviation Requirements (JARs) in the fields of:
- Aircraft design and manufacture, - Aircraft operations and maintenance, - Licensing of aviation personnel
Parts of the JAR directly associated with aircraft maintenance include: 1. The JAR-OPS part 1&3: Maintenance
This is a section of JAR-OPS and covers the operator's responsibility for maintenance management and includes the aircraft maintenance programme and flight technical log. The JAR-OPS Part 1 prescribes requirements applicable to the operation of any civil aeroplane for the purpose of commercial air transportation by any operator whose principal place of business is in a JAA Member State.
2. JAR-145: Approved Maintenance Organisations
The JAR-145 is a requirement to approve/accept maintenance organisations to maintain any aircraft used for commercial air transport.
Maintenance Planning Optimisation: B737 NG
116
3. JAR-66: Certifying Staff
JAR-66 is a requirement about qualifying maintenance personnel to issue certificates of release to service for JAR-145 organisations. JAR-66 specifically covers the issue of an aircraft maintenance basic licence.
4. JAR-147: Approved Maintenance Training
JAR-147 is a requirement for approved maintenance training to satisfy part of the JAR-66 requirements including in particular the conduct of basic and type examinations to be accepted by the JAA-NAA as a basis for issue of the proposed JAR-66 Licence.
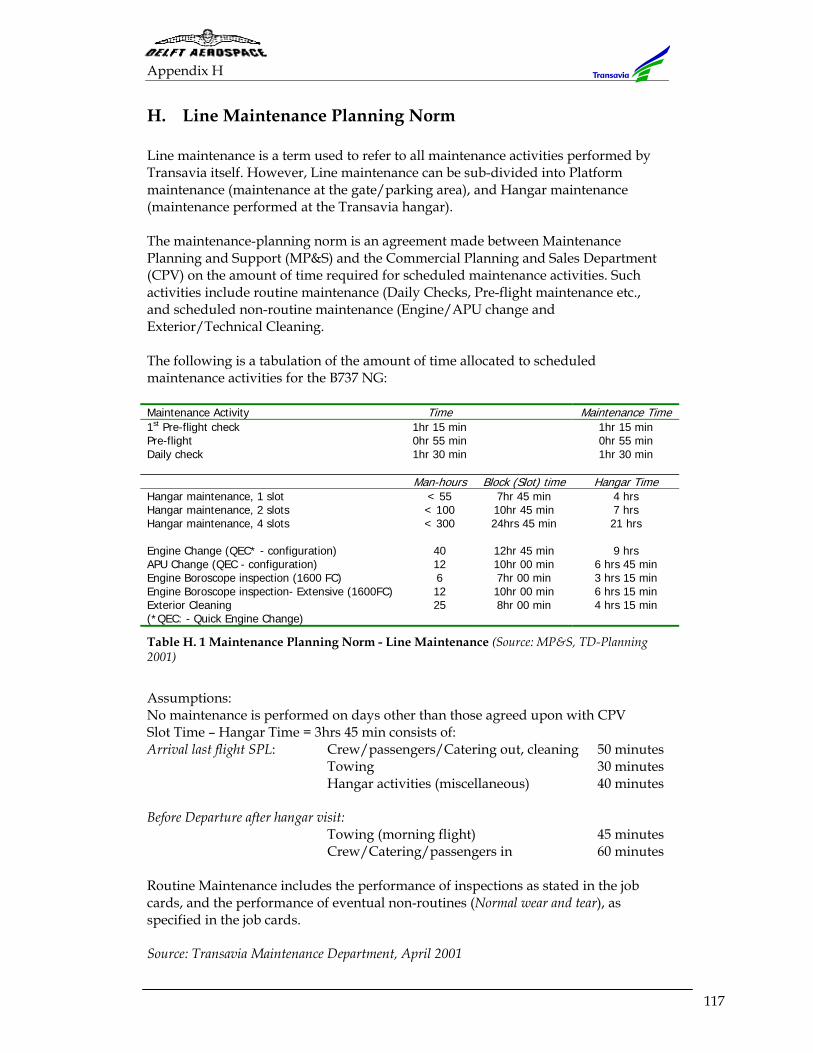
Appendix H
117
H. Line Maintenance Planning Norm Line maintenance is a term used to refer to all maintenance activities performed by Transavia itself. However, Line maintenance can be sub-divided into Platform maintenance (maintenance at the gate/parking area), and Hangar maintenance (maintenance performed at the Transavia hangar). The maintenance-planning norm is an agreement made between Maintenance Planning and Support (MP&S) and the Commercial Planning and Sales Department (CPV) on the amount of time required for scheduled maintenance activities. Such activities include routine maintenance (Daily Checks, Pre-flight maintenance etc., and scheduled non-routine maintenance (Engine/APU change and Exterior/Technical Cleaning. The following is a tabulation of the amount of time allocated to scheduled maintenance activities for the B737 NG: Maintenance Activity Time Maintenance Time 1st Pre-flight check 1hr 15 min 1hr 15 min Pre-flight 0hr 55 min 0hr 55 min Daily check 1hr 30 min 1hr 30 min Man-hours Block (Slot) time Hangar Time Hangar maintenance, 1 slot < 55 7hr 45 min 4 hrs Hangar maintenance, 2 slots < 100 10hr 45 min 7 hrs Hangar maintenance, 4 slots < 300 24hrs 45 min 21 hrs Engine Change (QEC* - configuration) 40 12hr 45 min 9 hrs APU Change (QEC - configuration) 12 10hr 00 min 6 hrs 45 min Engine Boroscope inspection (1600 FC) 6 7hr 00 min 3 hrs 15 min Engine Boroscope inspection- Extensive (1600FC) 12 10hr 00 min 6 hrs 15 min Exterior Cleaning 25 8hr 00 min 4 hrs 15 min (*QEC: - Quick Engine Change)
Table H. 1 Maintenance Planning Norm - Line Maintenance (Source: MP&S, TD-Planning 2001)
Assumptions: No maintenance is performed on days other than those agreed upon with CPV Slot Time – Hangar Time = 3hrs 45 min consists of: Arrival last flight SPL: Crew/passengers/Catering out, cleaning 50 minutes Towing 30 minutes Hangar activities (miscellaneous) 40 minutes Before Departure after hangar visit: Towing (morning flight) 45 minutes Crew/Catering/passengers in 60 minutes Routine Maintenance includes the performance of inspections as stated in the job cards, and the performance of eventual non-routines (Normal wear and tear), as specified in the job cards. Source: Transavia Maintenance Department, April 2001
Maintenance Planning Optimisation: B737 NG
118
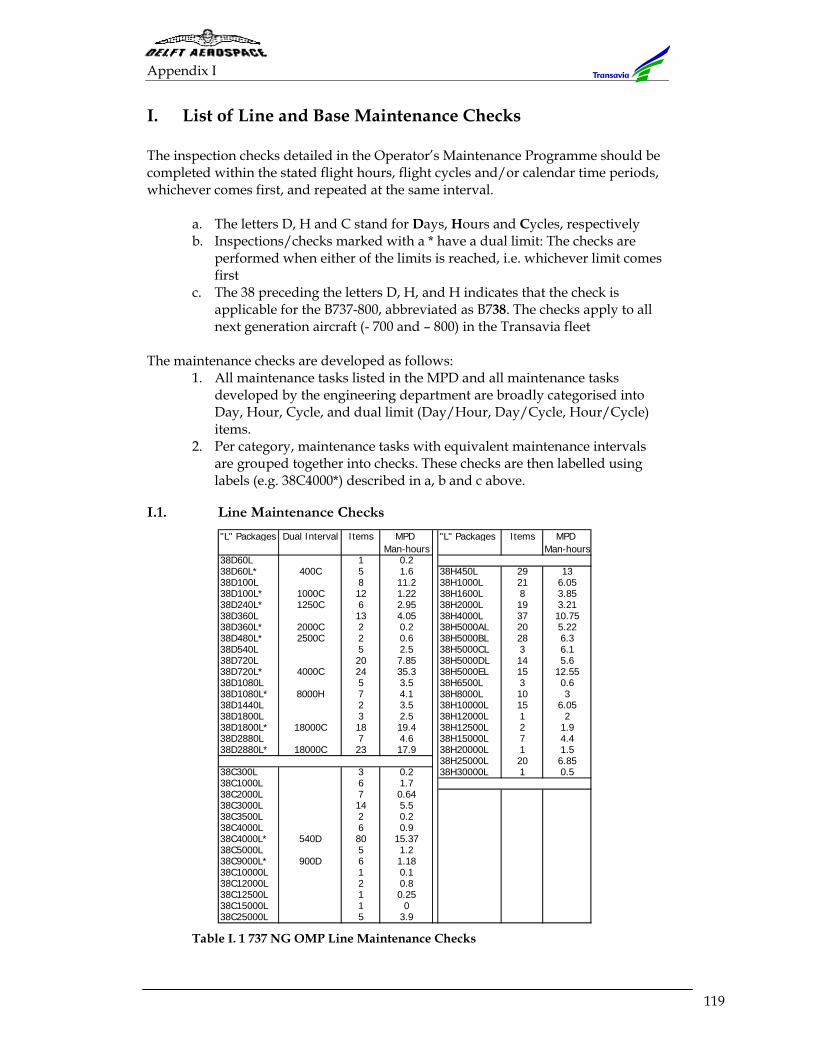
Appendix I
119
I. List of Line and Base Maintenance Checks The inspection checks detailed in the Operator’s Maintenance Programme should be completed within the stated flight hours, flight cycles and/or calendar time periods, whichever comes first, and repeated at the same interval.
a. The letters D, H and C stand for Days, Hours and Cycles, respectively b. Inspections/checks marked with a * have a dual limit: The checks are
performed when either of the limits is reached, i.e. whichever limit comes first
c. The 38 preceding the letters D, H, and H indicates that the check is applicable for the B737-800, abbreviated as B738. The checks apply to all next generation aircraft (- 700 and – 800) in the Transavia fleet
The maintenance checks are developed as follows:
1. All maintenance tasks listed in the MPD and all maintenance tasks developed by the engineering department are broadly categorised into Day, Hour, Cycle, and dual limit (Day/Hour, Day/Cycle, Hour/Cycle) items.
2. Per category, maintenance tasks with equivalent maintenance intervals are grouped together into checks. These checks are then labelled using labels (e.g. 38C4000*) described in a, b and c above.
I.1. Line Maintenance Checks
Table I. 1 737 NG OMP Line Maintenance Checks
"L" Packages Dual Interval Items MPD "L" Packages Items MPD Man-hours Man-hours
38D60L 1 0.238D60L* 400C 5 1.6 38H450L 29 1338D100L 8 11.2 38H1000L 21 6.0538D100L* 1000C 12 1.22 38H1600L 8 3.8538D240L* 1250C 6 2.95 38H2000L 19 3.2138D360L 13 4.05 38H4000L 37 10.7538D360L* 2000C 2 0.2 38H5000AL 20 5.2238D480L* 2500C 2 0.6 38H5000BL 28 6.338D540L 5 2.5 38H5000CL 3 6.138D720L 20 7.85 38H5000DL 14 5.638D720L* 4000C 24 35.3 38H5000EL 15 12.5538D1080L 5 3.5 38H6500L 3 0.638D1080L* 8000H 7 4.1 38H8000L 10 338D1440L 2 3.5 38H10000L 15 6.0538D1800L 3 2.5 38H12000L 1 238D1800L* 18000C 18 19.4 38H12500L 2 1.938D2880L 7 4.6 38H15000L 7 4.438D2880L* 18000C 23 17.9 38H20000L 1 1.5
38H25000L 20 6.8538C300L 3 0.2 38H30000L 1 0.538C1000L 6 1.738C2000L 7 0.6438C3000L 14 5.538C3500L 2 0.238C4000L 6 0.938C4000L* 540D 80 15.3738C5000L 5 1.238C9000L* 900D 6 1.1838C10000L 1 0.138C12000L 2 0.838C12500L 1 0.2538C15000L 1 038C25000L 5 3.9
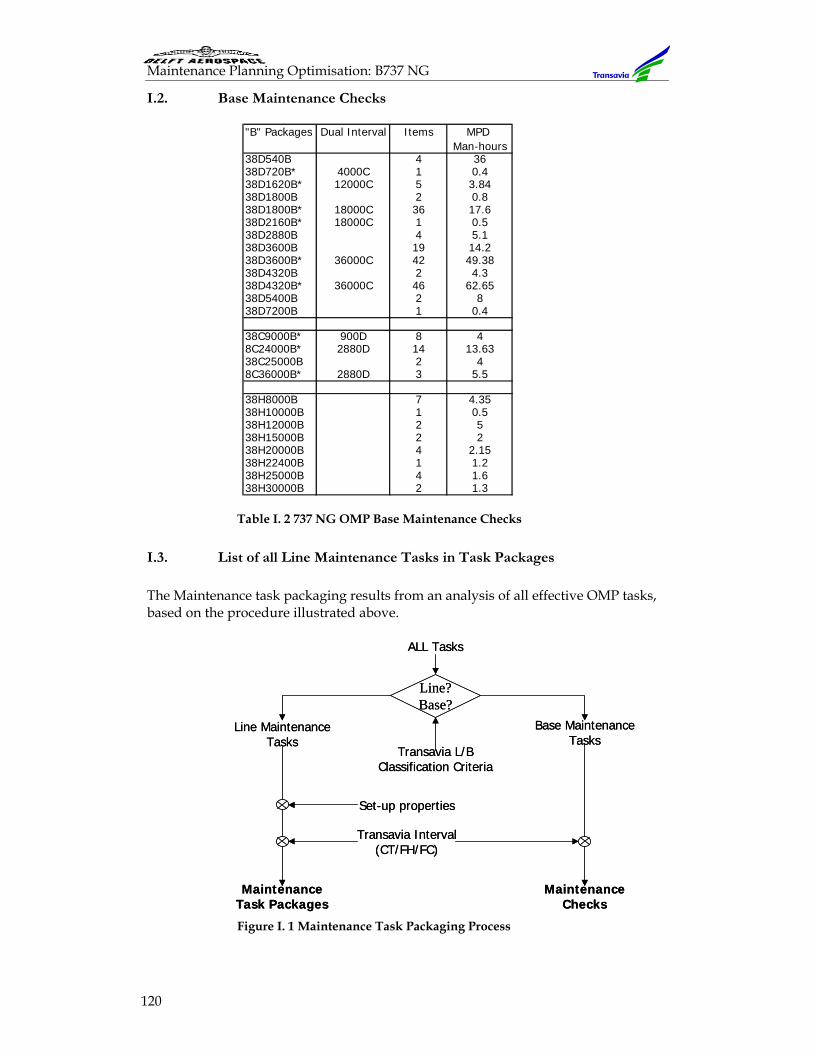
Maintenance Planning Optimisation: B737 NG
120
I.2. Base Maintenance Checks
Table I. 2 737 NG OMP Base Maintenance Checks
I.3. List of all Line Maintenance Tasks in Task Packages
The Maintenance task packaging results from an analysis of all effective OMP tasks, based on the procedure illustrated above.
Figure I. 1 Maintenance Task Packaging Process
"B" Packages Dual Interval Items MPD Man-hours
38D540B 4 3638D720B* 4000C 1 0.438D1620B* 12000C 5 3.8438D1800B 2 0.838D1800B* 18000C 36 17.638D2160B* 18000C 1 0.538D2880B 4 5.138D3600B 19 14.238D3600B* 36000C 42 49.3838D4320B 2 4.338D4320B* 36000C 46 62.6538D5400B 2 838D7200B 1 0.4
38C9000B* 900D 8 48C24000B* 2880D 14 13.6338C25000B 2 48C36000B* 2880D 3 5.5
38H8000B 7 4.3538H10000B 1 0.538H12000B 2 538H15000B 2 238H20000B 4 2.1538H22400B 1 1.238H25000B 4 1.638H30000B 2 1.3
ALL Tasks
Line MaintenanceTasks
Base MaintenanceTasks
Line?Base?
Set-up properties
Transavia Interval(CT/FH/FC)
Transavia L/BClassification Criteria
MaintenanceChecks
MaintenanceTask Packages
ALL Tasks
Line MaintenanceTasks
Base MaintenanceTasks
Line?Base?
Set-up properties
Transavia Interval(CT/FH/FC)
Transavia L/BClassification Criteria
MaintenanceChecks
MaintenanceTask Packages
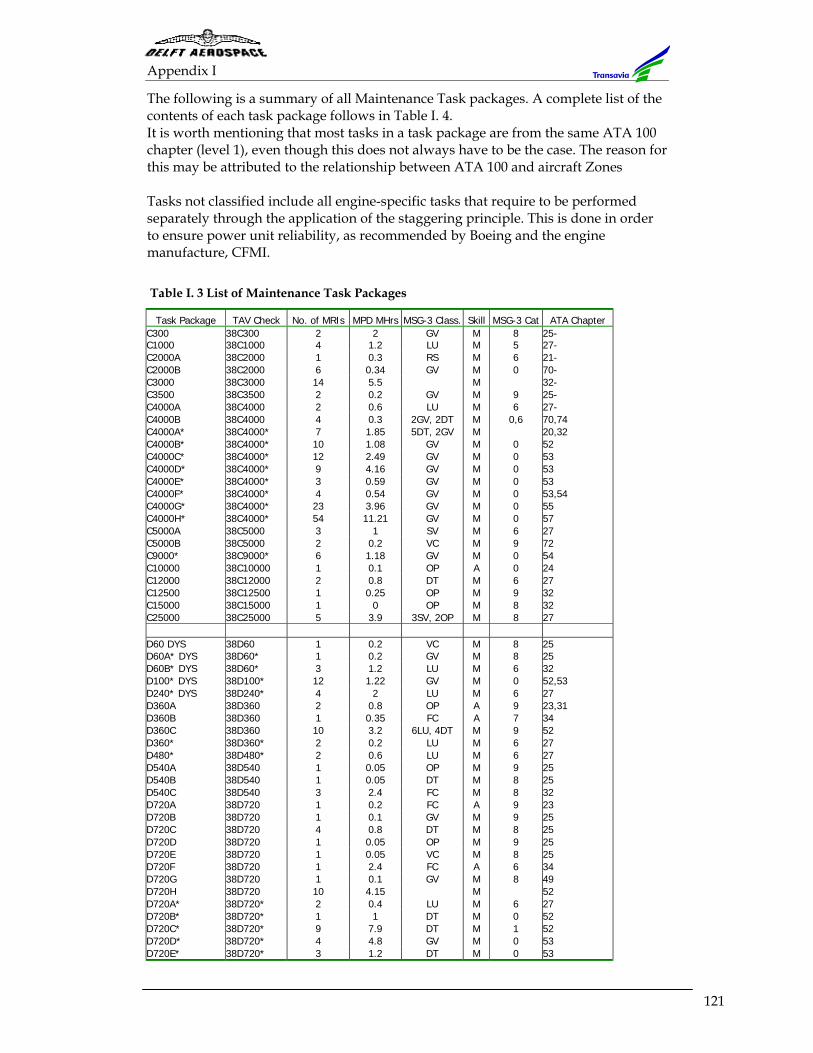
Appendix I
121
The following is a summary of all Maintenance Task packages. A complete list of the contents of each task package follows in Table I. 4. It is worth mentioning that most tasks in a task package are from the same ATA 100 chapter (level 1), even though this does not always have to be the case. The reason for this may be attributed to the relationship between ATA 100 and aircraft Zones Tasks not classified include all engine-specific tasks that require to be performed separately through the application of the staggering principle. This is done in order to ensure power unit reliability, as recommended by Boeing and the engine manufacture, CFMI. Table I. 3 List of Maintenance Task Packages
Task Package TAV Check No. of MRIs MPD MHrs MSG-3 Class. Skill MSG-3 Cat ATA Chapter C300 38C300 2 2 GV M 8 25-C1000 38C1000 4 1.2 LU M 5 27-C2000A 38C2000 1 0.3 RS M 6 21- C2000B 38C2000 6 0.34 GV M 0 70-C3000 38C3000 14 5.5 M 32-C3500 38C3500 2 0.2 GV M 9 25-C4000A 38C4000 2 0.6 LU M 6 27- C4000B 38C4000 4 0.3 2GV, 2DT M 0,6 70,74C4000A* 38C4000* 7 1.85 5DT, 2GV M 20,32C4000B* 38C4000* 10 1.08 GV M 0 52C4000C* 38C4000* 12 2.49 GV M 0 53 C4000D* 38C4000* 9 4.16 GV M 0 53 C4000E* 38C4000* 3 0.59 GV M 0 53C4000F* 38C4000* 4 0.54 GV M 0 53,54C4000G* 38C4000* 23 3.96 GV M 0 55 C4000H* 38C4000* 54 11.21 GV M 0 57 C5000A 38C5000 3 1 SV M 6 27C5000B 38C5000 2 0.2 VC M 9 72C9000* 38C9000* 6 1.18 GV M 0 54C10000 38C10000 1 0.1 OP A 0 24 C12000 38C12000 2 0.8 DT M 6 27C12500 38C12500 1 0.25 OP M 9 32C15000 38C15000 1 0 OP M 8 32C25000 38C25000 5 3.9 3SV, 2OP M 8 27 D60 DYS 38D60 1 0.2 VC M 8 25D60A* DYS 38D60* 1 0.2 GV M 8 25 D60B* DYS 38D60* 3 1.2 LU M 6 32 D100* DYS 38D100* 12 1.22 GV M 0 52,53 D240* DYS 38D240* 4 2 LU M 6 27 D360A 38D360 2 0.8 OP A 9 23,31 D360B 38D360 1 0.35 FC A 7 34 D360C 38D360 10 3.2 6LU, 4DT M 9 52 D360* 38D360* 2 0.2 LU M 6 27 D480* 38D480* 2 0.6 LU M 6 27 D540A 38D540 1 0.05 OP M 9 25 D540B 38D540 1 0.05 DT M 8 25 D540C 38D540 3 2.4 FC M 8 32 D720A 38D720 1 0.2 FC A 9 23 D720B 38D720 1 0.1 GV M 9 25 D720C 38D720 4 0.8 DT M 8 25 D720D 38D720 1 0.05 OP M 9 25 D720E 38D720 1 0.05 VC M 8 25 D720F 38D720 1 2.4 FC A 6 34 D720G 38D720 1 0.1 GV M 8 49 D720H 38D720 10 4.15 M 52 D720A* 38D720* 2 0.4 LU M 6 27 D720B* 38D720* 1 1 DT M 0 52 D720C* 38D720* 9 7.9 DT M 1 52 D720D* 38D720* 4 4.8 GV M 0 53 D720E* 38D720* 3 1.2 DT M 0 53
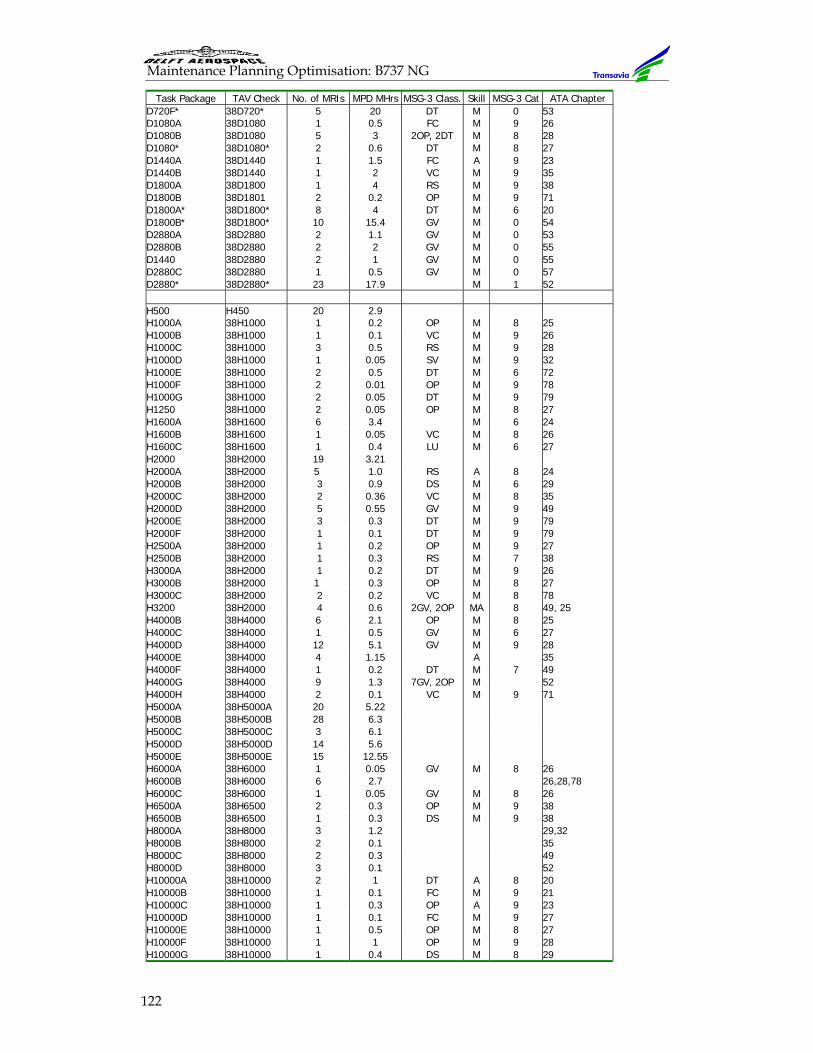
Maintenance Planning Optimisation: B737 NG
122
Task Package TAV Check No. of MRIs MPD MHrs MSG-3 Class. Skill MSG-3 Cat ATA Chapter D720F* 38D720* 5 20 DT M 0 53D1080A 38D1080 1 0.5 FC M 9 26 D1080B 38D1080 5 3 2OP, 2DT M 8 28 D1080* 38D1080* 2 0.6 DT M 8 27 D1440A 38D1440 1 1.5 FC A 9 23 D1440B 38D1440 1 2 VC M 9 35 D1800A 38D1800 1 4 RS M 9 38 D1800B 38D1801 2 0.2 OP M 9 71 D1800A* 38D1800* 8 4 DT M 6 20 D1800B* 38D1800* 10 15.4 GV M 0 54 D2880A 38D2880 2 1.1 GV M 0 53 D2880B 38D2880 2 2 GV M 0 55 D1440 38D2880 2 1 GV M 0 55 D2880C 38D2880 1 0.5 GV M 0 57 D2880* 38D2880* 23 17.9 M 1 52 H500 H450 20 2.9H1000A 38H1000 1 0.2 OP M 8 25 H1000B 38H1000 1 0.1 VC M 9 26 H1000C 38H1000 3 0.5 RS M 9 28 H1000D 38H1000 1 0.05 SV M 9 32 H1000E 38H1000 2 0.5 DT M 6 72 H1000F 38H1000 2 0.01 OP M 9 78 H1000G 38H1000 2 0.05 DT M 9 79 H1250 38H1000 2 0.05 OP M 8 27 H1600A 38H1600 6 3.4 M 6 24 H1600B 38H1600 1 0.05 VC M 8 26 H1600C 38H1600 1 0.4 LU M 6 27 H2000 38H2000 19 3.21 H2000A 38H2000 5 1.0 RS A 8 24 H2000B 38H2000 3 0.9 DS M 6 29 H2000C 38H2000 2 0.36 VC M 8 35 H2000D 38H2000 5 0.55 GV M 9 49 H2000E 38H2000 3 0.3 DT M 9 79 H2000F 38H2000 1 0.1 DT M 9 79 H2500A 38H2000 1 0.2 OP M 9 27 H2500B 38H2000 1 0.3 RS M 7 38 H3000A 38H2000 1 0.2 DT M 9 26 H3000B 38H2000 1 0.3 OP M 8 27 H3000C 38H2000 2 0.2 VC M 8 78 H3200 38H2000 4 0.6 2GV, 2OP MA 8 49, 25 H4000B 38H4000 6 2.1 OP M 8 25 H4000C 38H4000 1 0.5 GV M 6 27 H4000D 38H4000 12 5.1 GV M 9 28 H4000E 38H4000 4 1.15 A 35 H4000F 38H4000 1 0.2 DT M 7 49 H4000G 38H4000 9 1.3 7GV, 2OP M 52 H4000H 38H4000 2 0.1 VC M 9 71 H5000A 38H5000A 20 5.22 H5000B 38H5000B 28 6.3 H5000C 38H5000C 3 6.1 H5000D 38H5000D 14 5.6 H5000E 38H5000E 15 12.55 H6000A 38H6000 1 0.05 GV M 8 26 H6000B 38H6000 6 2.7 26,28,78 H6000C 38H6000 1 0.05 GV M 8 26 H6500A 38H6500 2 0.3 OP M 9 38 H6500B 38H6500 1 0.3 DS M 9 38 H8000A 38H8000 3 1.2 29,32 H8000B 38H8000 2 0.1 35 H8000C 38H8000 2 0.3 49 H8000D 38H8000 3 0.1 52 H10000A 38H10000 2 1 DT A 8 20 H10000B 38H10000 1 0.1 FC M 9 21 H10000C 38H10000 1 0.3 OP A 9 23 H10000D 38H10000 1 0.1 FC M 9 27 H10000E 38H10000 1 0.5 OP M 8 27 H10000F 38H10000 1 1 OP M 9 28 H10000G 38H10000 1 0.4 DS M 8 29
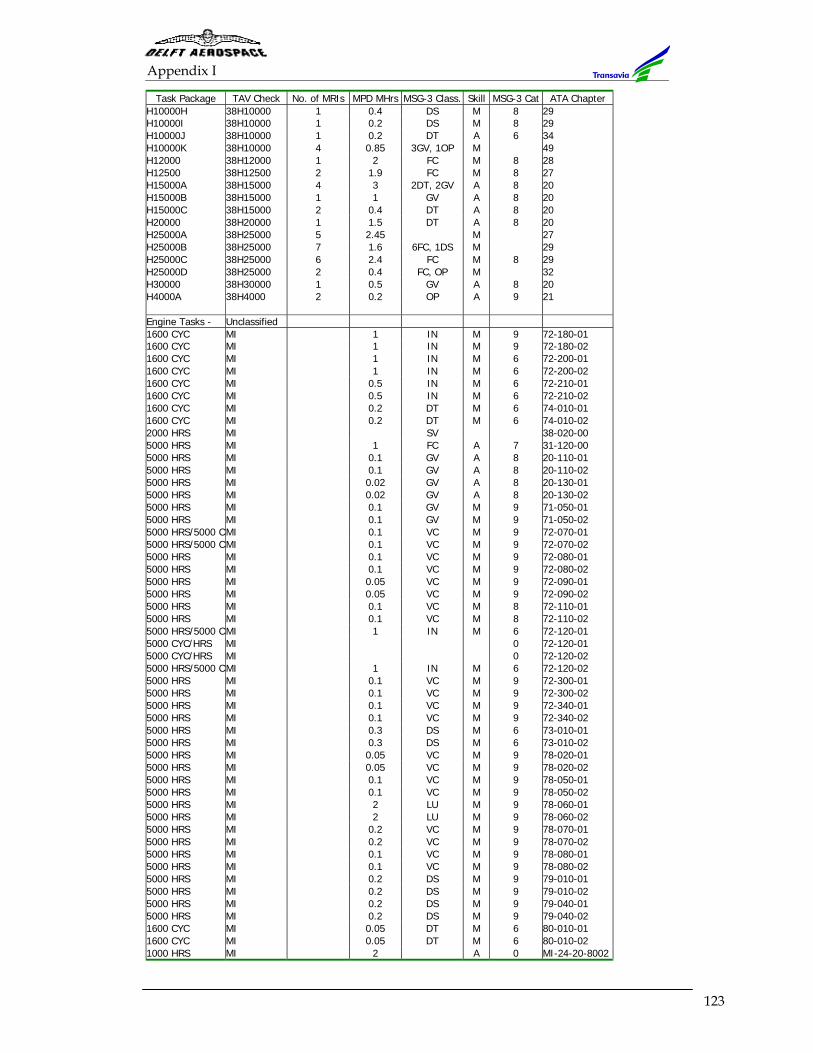
Appendix I
123
Task Package TAV Check No. of MRIs MPD MHrs MSG-3 Class. Skill MSG-3 Cat ATA Chapter H10000H 38H10000 1 0.4 DS M 8 29H10000I 38H10000 1 0.2 DS M 8 29 H10000J 38H10000 1 0.2 DT A 6 34 H10000K 38H10000 4 0.85 3GV, 1OP M 49 H12000 38H12000 1 2 FC M 8 28 H12500 38H12500 2 1.9 FC M 8 27 H15000A 38H15000 4 3 2DT, 2GV A 8 20 H15000B 38H15000 1 1 GV A 8 20 H15000C 38H15000 2 0.4 DT A 8 20 H20000 38H20000 1 1.5 DT A 8 20 H25000A 38H25000 5 2.45 M 27 H25000B 38H25000 7 1.6 6FC, 1DS M 29 H25000C 38H25000 6 2.4 FC M 8 29 H25000D 38H25000 2 0.4 FC, OP M 32 H30000 38H30000 1 0.5 GV A 8 20 H4000A 38H4000 2 0.2 OP A 9 21 Engine Tasks - Unclassified 1600 CYC MI 1 IN M 9 72-180-01 1600 CYC MI 1 IN M 9 72-180-02 1600 CYC MI 1 IN M 6 72-200-01 1600 CYC MI 1 IN M 6 72-200-02 1600 CYC MI 0.5 IN M 6 72-210-01 1600 CYC MI 0.5 IN M 6 72-210-02 1600 CYC MI 0.2 DT M 6 74-010-01 1600 CYC MI 0.2 DT M 6 74-010-02 2000 HRS MI SV 38-020-00 5000 HRS MI 1 FC A 7 31-120-00 5000 HRS MI 0.1 GV A 8 20-110-01 5000 HRS MI 0.1 GV A 8 20-110-02 5000 HRS MI 0.02 GV A 8 20-130-01 5000 HRS MI 0.02 GV A 8 20-130-02 5000 HRS MI 0.1 GV M 9 71-050-01 5000 HRS MI 0.1 GV M 9 71-050-02 5000 HRS/5000 C MI 0.1 VC M 9 72-070-01 5000 HRS/5000 C MI 0.1 VC M 9 72-070-02 5000 HRS MI 0.1 VC M 9 72-080-01 5000 HRS MI 0.1 VC M 9 72-080-02 5000 HRS MI 0.05 VC M 9 72-090-01 5000 HRS MI 0.05 VC M 9 72-090-02 5000 HRS MI 0.1 VC M 8 72-110-01 5000 HRS MI 0.1 VC M 8 72-110-02 5000 HRS/5000 C MI 1 IN M 6 72-120-01 5000 CYC/HRS MI 0 72-120-01 5000 CYC/HRS MI 0 72-120-02 5000 HRS/5000 C MI 1 IN M 6 72-120-02 5000 HRS MI 0.1 VC M 9 72-300-01 5000 HRS MI 0.1 VC M 9 72-300-02 5000 HRS MI 0.1 VC M 9 72-340-01 5000 HRS MI 0.1 VC M 9 72-340-02 5000 HRS MI 0.3 DS M 6 73-010-01 5000 HRS MI 0.3 DS M 6 73-010-02 5000 HRS MI 0.05 VC M 9 78-020-01 5000 HRS MI 0.05 VC M 9 78-020-02 5000 HRS MI 0.1 VC M 9 78-050-01 5000 HRS MI 0.1 VC M 9 78-050-02 5000 HRS MI 2 LU M 9 78-060-01 5000 HRS MI 2 LU M 9 78-060-02 5000 HRS MI 0.2 VC M 9 78-070-01 5000 HRS MI 0.2 VC M 9 78-070-02 5000 HRS MI 0.1 VC M 9 78-080-01 5000 HRS MI 0.1 VC M 9 78-080-02 5000 HRS MI 0.2 DS M 9 79-010-01 5000 HRS MI 0.2 DS M 9 79-010-02 5000 HRS MI 0.2 DS M 9 79-040-01 5000 HRS MI 0.2 DS M 9 79-040-02 1600 CYC MI 0.05 DT M 6 80-010-01 1600 CYC MI 0.05 DT M 6 80-010-02 1000 HRS MI 2 A 0 MI-24-20-8002
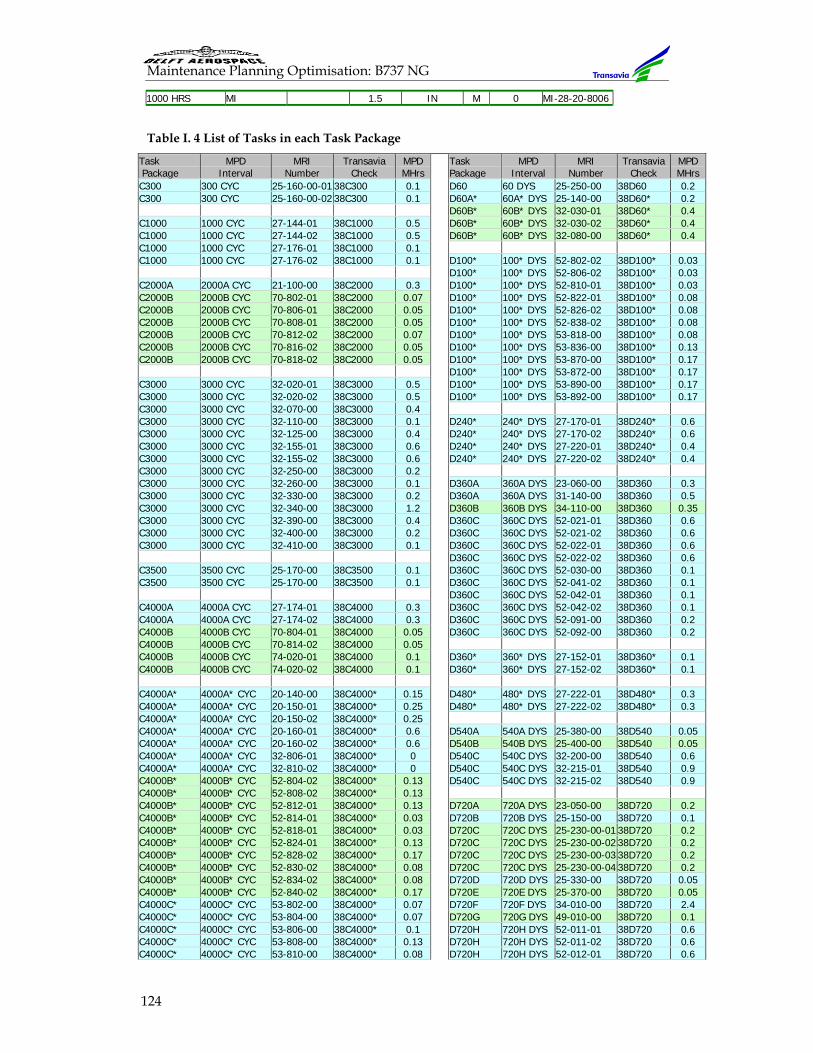
Maintenance Planning Optimisation: B737 NG
124
1000 HRS MI 1.5 IN M 0 MI-28-20-8006
Table I. 4 List of Tasks in each Task Package
Task Package
MPD Interval
MRI Number
Transavia Check
MPD MHrs
Task Package
MPD Interval
MRI Number
Transavia Check
MPD MHrs
C300 300 CYC 25-160-00-01 38C300 0.1 D60 60 DYS 25-250-00 38D60 0.2C300 300 CYC 25-160-00-02 38C300 0.1 D60A* 60A* DYS 25-140-00 38D60* 0.2 D60B* 60B* DYS 32-030-01 38D60* 0.4C1000 1000 CYC 27-144-01 38C1000 0.5 D60B* 60B* DYS 32-030-02 38D60* 0.4C1000 1000 CYC 27-144-02 38C1000 0.5 D60B* 60B* DYS 32-080-00 38D60* 0.4C1000 1000 CYC 27-176-01 38C1000 0.1 C1000 1000 CYC 27-176-02 38C1000 0.1 D100* 100* DYS 52-802-02 38D100* 0.03 D100* 100* DYS 52-806-02 38D100* 0.03C2000A 2000A CYC 21-100-00 38C2000 0.3 D100* 100* DYS 52-810-01 38D100* 0.03C2000B 2000B CYC 70-802-01 38C2000 0.07 D100* 100* DYS 52-822-01 38D100* 0.08C2000B 2000B CYC 70-806-01 38C2000 0.05 D100* 100* DYS 52-826-02 38D100* 0.08C2000B 2000B CYC 70-808-01 38C2000 0.05 D100* 100* DYS 52-838-02 38D100* 0.08C2000B 2000B CYC 70-812-02 38C2000 0.07 D100* 100* DYS 53-818-00 38D100* 0.08C2000B 2000B CYC 70-816-02 38C2000 0.05 D100* 100* DYS 53-836-00 38D100* 0.13C2000B 2000B CYC 70-818-02 38C2000 0.05 D100* 100* DYS 53-870-00 38D100* 0.17 D100* 100* DYS 53-872-00 38D100* 0.17C3000 3000 CYC 32-020-01 38C3000 0.5 D100* 100* DYS 53-890-00 38D100* 0.17C3000 3000 CYC 32-020-02 38C3000 0.5 D100* 100* DYS 53-892-00 38D100* 0.17C3000 3000 CYC 32-070-00 38C3000 0.4 C3000 3000 CYC 32-110-00 38C3000 0.1 D240* 240* DYS 27-170-01 38D240* 0.6C3000 3000 CYC 32-125-00 38C3000 0.4 D240* 240* DYS 27-170-02 38D240* 0.6C3000 3000 CYC 32-155-01 38C3000 0.6 D240* 240* DYS 27-220-01 38D240* 0.4C3000 3000 CYC 32-155-02 38C3000 0.6 D240* 240* DYS 27-220-02 38D240* 0.4C3000 3000 CYC 32-250-00 38C3000 0.2 C3000 3000 CYC 32-260-00 38C3000 0.1 D360A 360A DYS 23-060-00 38D360 0.3C3000 3000 CYC 32-330-00 38C3000 0.2 D360A 360A DYS 31-140-00 38D360 0.5C3000 3000 CYC 32-340-00 38C3000 1.2 D360B 360B DYS 34-110-00 38D360 0.35C3000 3000 CYC 32-390-00 38C3000 0.4 D360C 360C DYS 52-021-01 38D360 0.6C3000 3000 CYC 32-400-00 38C3000 0.2 D360C 360C DYS 52-021-02 38D360 0.6C3000 3000 CYC 32-410-00 38C3000 0.1 D360C 360C DYS 52-022-01 38D360 0.6 D360C 360C DYS 52-022-02 38D360 0.6C3500 3500 CYC 25-170-00 38C3500 0.1 D360C 360C DYS 52-030-00 38D360 0.1C3500 3500 CYC 25-170-00 38C3500 0.1 D360C 360C DYS 52-041-02 38D360 0.1 D360C 360C DYS 52-042-01 38D360 0.1C4000A 4000A CYC 27-174-01 38C4000 0.3 D360C 360C DYS 52-042-02 38D360 0.1C4000A 4000A CYC 27-174-02 38C4000 0.3 D360C 360C DYS 52-091-00 38D360 0.2C4000B 4000B CYC 70-804-01 38C4000 0.05 D360C 360C DYS 52-092-00 38D360 0.2C4000B 4000B CYC 70-814-02 38C4000 0.05 C4000B 4000B CYC 74-020-01 38C4000 0.1 D360* 360* DYS 27-152-01 38D360* 0.1C4000B 4000B CYC 74-020-02 38C4000 0.1 D360* 360* DYS 27-152-02 38D360* 0.1 C4000A* 4000A* CYC 20-140-00 38C4000* 0.15 D480* 480* DYS 27-222-01 38D480* 0.3C4000A* 4000A* CYC 20-150-01 38C4000* 0.25 D480* 480* DYS 27-222-02 38D480* 0.3C4000A* 4000A* CYC 20-150-02 38C4000* 0.25 C4000A* 4000A* CYC 20-160-01 38C4000* 0.6 D540A 540A DYS 25-380-00 38D540 0.05C4000A* 4000A* CYC 20-160-02 38C4000* 0.6 D540B 540B DYS 25-400-00 38D540 0.05C4000A* 4000A* CYC 32-806-01 38C4000* 0 D540C 540C DYS 32-200-00 38D540 0.6C4000A* 4000A* CYC 32-810-02 38C4000* 0 D540C 540C DYS 32-215-01 38D540 0.9C4000B* 4000B* CYC 52-804-02 38C4000* 0.13 D540C 540C DYS 32-215-02 38D540 0.9C4000B* 4000B* CYC 52-808-02 38C4000* 0.13 C4000B* 4000B* CYC 52-812-01 38C4000* 0.13 D720A 720A DYS 23-050-00 38D720 0.2C4000B* 4000B* CYC 52-814-01 38C4000* 0.03 D720B 720B DYS 25-150-00 38D720 0.1C4000B* 4000B* CYC 52-818-01 38C4000* 0.03 D720C 720C DYS 25-230-00-01 38D720 0.2C4000B* 4000B* CYC 52-824-01 38C4000* 0.13 D720C 720C DYS 25-230-00-02 38D720 0.2C4000B* 4000B* CYC 52-828-02 38C4000* 0.17 D720C 720C DYS 25-230-00-03 38D720 0.2C4000B* 4000B* CYC 52-830-02 38C4000* 0.08 D720C 720C DYS 25-230-00-04 38D720 0.2C4000B* 4000B* CYC 52-834-02 38C4000* 0.08 D720D 720D DYS 25-330-00 38D720 0.05C4000B* 4000B* CYC 52-840-02 38C4000* 0.17 D720E 720E DYS 25-370-00 38D720 0.05C4000C* 4000C* CYC 53-802-00 38C4000* 0.07 D720F 720F DYS 34-010-00 38D720 2.4C4000C* 4000C* CYC 53-804-00 38C4000* 0.07 D720G 720G DYS 49-010-00 38D720 0.1C4000C* 4000C* CYC 53-806-00 38C4000* 0.1 D720H 720H DYS 52-011-01 38D720 0.6C4000C* 4000C* CYC 53-808-00 38C4000* 0.13 D720H 720H DYS 52-011-02 38D720 0.6C4000C* 4000C* CYC 53-810-00 38C4000* 0.08 D720H 720H DYS 52-012-01 38D720 0.6
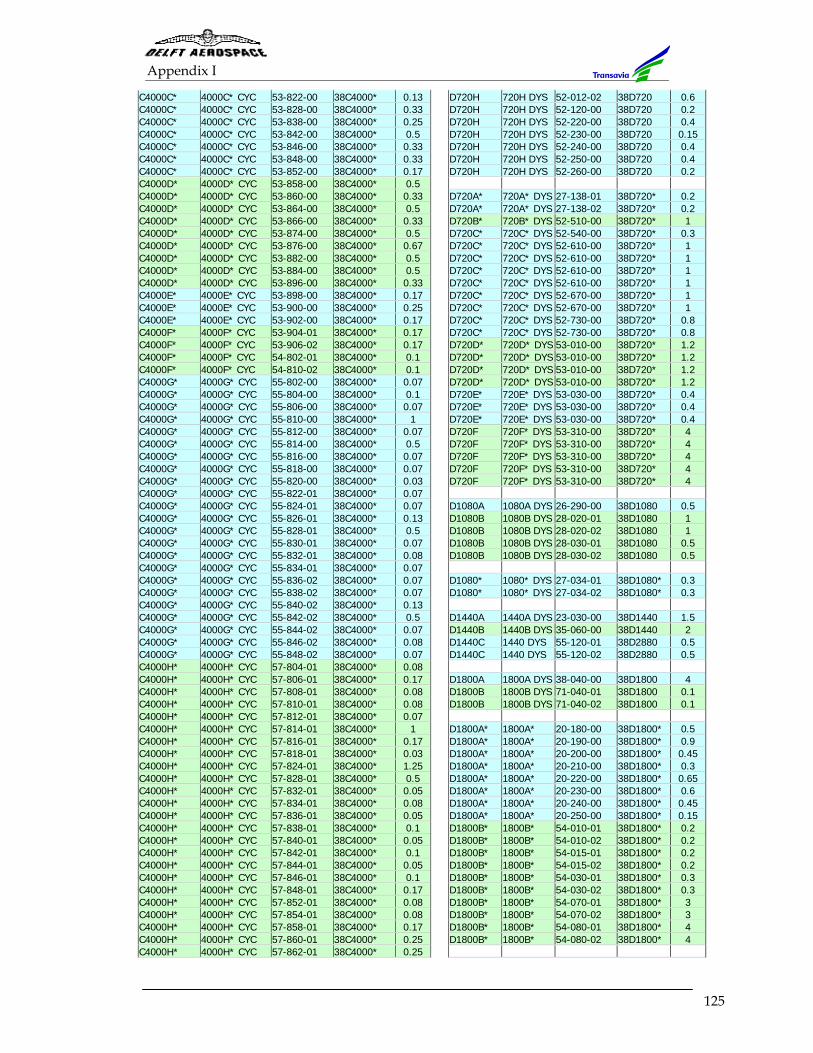
Appendix I
125
C4000C* 4000C* CYC 53-822-00 38C4000* 0.13 D720H 720H DYS 52-012-02 38D720 0.6C4000C* 4000C* CYC 53-828-00 38C4000* 0.33 D720H 720H DYS 52-120-00 38D720 0.2C4000C* 4000C* CYC 53-838-00 38C4000* 0.25 D720H 720H DYS 52-220-00 38D720 0.4C4000C* 4000C* CYC 53-842-00 38C4000* 0.5 D720H 720H DYS 52-230-00 38D720 0.15C4000C* 4000C* CYC 53-846-00 38C4000* 0.33 D720H 720H DYS 52-240-00 38D720 0.4C4000C* 4000C* CYC 53-848-00 38C4000* 0.33 D720H 720H DYS 52-250-00 38D720 0.4C4000C* 4000C* CYC 53-852-00 38C4000* 0.17 D720H 720H DYS 52-260-00 38D720 0.2C4000D* 4000D* CYC 53-858-00 38C4000* 0.5 C4000D* 4000D* CYC 53-860-00 38C4000* 0.33 D720A* 720A* DYS 27-138-01 38D720* 0.2C4000D* 4000D* CYC 53-864-00 38C4000* 0.5 D720A* 720A* DYS 27-138-02 38D720* 0.2C4000D* 4000D* CYC 53-866-00 38C4000* 0.33 D720B* 720B* DYS 52-510-00 38D720* 1C4000D* 4000D* CYC 53-874-00 38C4000* 0.5 D720C* 720C* DYS 52-540-00 38D720* 0.3C4000D* 4000D* CYC 53-876-00 38C4000* 0.67 D720C* 720C* DYS 52-610-00 38D720* 1C4000D* 4000D* CYC 53-882-00 38C4000* 0.5 D720C* 720C* DYS 52-610-00 38D720* 1C4000D* 4000D* CYC 53-884-00 38C4000* 0.5 D720C* 720C* DYS 52-610-00 38D720* 1C4000D* 4000D* CYC 53-896-00 38C4000* 0.33 D720C* 720C* DYS 52-610-00 38D720* 1C4000E* 4000E* CYC 53-898-00 38C4000* 0.17 D720C* 720C* DYS 52-670-00 38D720* 1C4000E* 4000E* CYC 53-900-00 38C4000* 0.25 D720C* 720C* DYS 52-670-00 38D720* 1C4000E* 4000E* CYC 53-902-00 38C4000* 0.17 D720C* 720C* DYS 52-730-00 38D720* 0.8C4000F* 4000F* CYC 53-904-01 38C4000* 0.17 D720C* 720C* DYS 52-730-00 38D720* 0.8C4000F* 4000F* CYC 53-906-02 38C4000* 0.17 D720D* 720D* DYS 53-010-00 38D720* 1.2C4000F* 4000F* CYC 54-802-01 38C4000* 0.1 D720D* 720D* DYS 53-010-00 38D720* 1.2C4000F* 4000F* CYC 54-810-02 38C4000* 0.1 D720D* 720D* DYS 53-010-00 38D720* 1.2C4000G* 4000G* CYC 55-802-00 38C4000* 0.07 D720D* 720D* DYS 53-010-00 38D720* 1.2C4000G* 4000G* CYC 55-804-00 38C4000* 0.1 D720E* 720E* DYS 53-030-00 38D720* 0.4C4000G* 4000G* CYC 55-806-00 38C4000* 0.07 D720E* 720E* DYS 53-030-00 38D720* 0.4C4000G* 4000G* CYC 55-810-00 38C4000* 1 D720E* 720E* DYS 53-030-00 38D720* 0.4C4000G* 4000G* CYC 55-812-00 38C4000* 0.07 D720F 720F* DYS 53-310-00 38D720* 4C4000G* 4000G* CYC 55-814-00 38C4000* 0.5 D720F 720F* DYS 53-310-00 38D720* 4C4000G* 4000G* CYC 55-816-00 38C4000* 0.07 D720F 720F* DYS 53-310-00 38D720* 4C4000G* 4000G* CYC 55-818-00 38C4000* 0.07 D720F 720F* DYS 53-310-00 38D720* 4C4000G* 4000G* CYC 55-820-00 38C4000* 0.03 D720F 720F* DYS 53-310-00 38D720* 4C4000G* 4000G* CYC 55-822-01 38C4000* 0.07 C4000G* 4000G* CYC 55-824-01 38C4000* 0.07 D1080A 1080A DYS 26-290-00 38D1080 0.5C4000G* 4000G* CYC 55-826-01 38C4000* 0.13 D1080B 1080B DYS 28-020-01 38D1080 1C4000G* 4000G* CYC 55-828-01 38C4000* 0.5 D1080B 1080B DYS 28-020-02 38D1080 1C4000G* 4000G* CYC 55-830-01 38C4000* 0.07 D1080B 1080B DYS 28-030-01 38D1080 0.5C4000G* 4000G* CYC 55-832-01 38C4000* 0.08 D1080B 1080B DYS 28-030-02 38D1080 0.5C4000G* 4000G* CYC 55-834-01 38C4000* 0.07 C4000G* 4000G* CYC 55-836-02 38C4000* 0.07 D1080* 1080* DYS 27-034-01 38D1080* 0.3C4000G* 4000G* CYC 55-838-02 38C4000* 0.07 D1080* 1080* DYS 27-034-02 38D1080* 0.3C4000G* 4000G* CYC 55-840-02 38C4000* 0.13 C4000G* 4000G* CYC 55-842-02 38C4000* 0.5 D1440A 1440A DYS 23-030-00 38D1440 1.5C4000G* 4000G* CYC 55-844-02 38C4000* 0.07 D1440B 1440B DYS 35-060-00 38D1440 2C4000G* 4000G* CYC 55-846-02 38C4000* 0.08 D1440C 1440 DYS 55-120-01 38D2880 0.5C4000G* 4000G* CYC 55-848-02 38C4000* 0.07 D1440C 1440 DYS 55-120-02 38D2880 0.5C4000H* 4000H* CYC 57-804-01 38C4000* 0.08 C4000H* 4000H* CYC 57-806-01 38C4000* 0.17 D1800A 1800A DYS 38-040-00 38D1800 4C4000H* 4000H* CYC 57-808-01 38C4000* 0.08 D1800B 1800B DYS 71-040-01 38D1800 0.1C4000H* 4000H* CYC 57-810-01 38C4000* 0.08 D1800B 1800B DYS 71-040-02 38D1800 0.1C4000H* 4000H* CYC 57-812-01 38C4000* 0.07 C4000H* 4000H* CYC 57-814-01 38C4000* 1 D1800A* 1800A* 20-180-00 38D1800* 0.5C4000H* 4000H* CYC 57-816-01 38C4000* 0.17 D1800A* 1800A* 20-190-00 38D1800* 0.9C4000H* 4000H* CYC 57-818-01 38C4000* 0.03 D1800A* 1800A* 20-200-00 38D1800* 0.45C4000H* 4000H* CYC 57-824-01 38C4000* 1.25 D1800A* 1800A* 20-210-00 38D1800* 0.3C4000H* 4000H* CYC 57-828-01 38C4000* 0.5 D1800A* 1800A* 20-220-00 38D1800* 0.65C4000H* 4000H* CYC 57-832-01 38C4000* 0.05 D1800A* 1800A* 20-230-00 38D1800* 0.6C4000H* 4000H* CYC 57-834-01 38C4000* 0.08 D1800A* 1800A* 20-240-00 38D1800* 0.45C4000H* 4000H* CYC 57-836-01 38C4000* 0.05 D1800A* 1800A* 20-250-00 38D1800* 0.15C4000H* 4000H* CYC 57-838-01 38C4000* 0.1 D1800B* 1800B* 54-010-01 38D1800* 0.2C4000H* 4000H* CYC 57-840-01 38C4000* 0.05 D1800B* 1800B* 54-010-02 38D1800* 0.2C4000H* 4000H* CYC 57-842-01 38C4000* 0.1 D1800B* 1800B* 54-015-01 38D1800* 0.2C4000H* 4000H* CYC 57-844-01 38C4000* 0.05 D1800B* 1800B* 54-015-02 38D1800* 0.2C4000H* 4000H* CYC 57-846-01 38C4000* 0.1 D1800B* 1800B* 54-030-01 38D1800* 0.3C4000H* 4000H* CYC 57-848-01 38C4000* 0.17 D1800B* 1800B* 54-030-02 38D1800* 0.3C4000H* 4000H* CYC 57-852-01 38C4000* 0.08 D1800B* 1800B* 54-070-01 38D1800* 3C4000H* 4000H* CYC 57-854-01 38C4000* 0.08 D1800B* 1800B* 54-070-02 38D1800* 3C4000H* 4000H* CYC 57-858-01 38C4000* 0.17 D1800B* 1800B* 54-080-01 38D1800* 4C4000H* 4000H* CYC 57-860-01 38C4000* 0.25 D1800B* 1800B* 54-080-02 38D1800* 4C4000H* 4000H* CYC 57-862-01 38C4000* 0.25
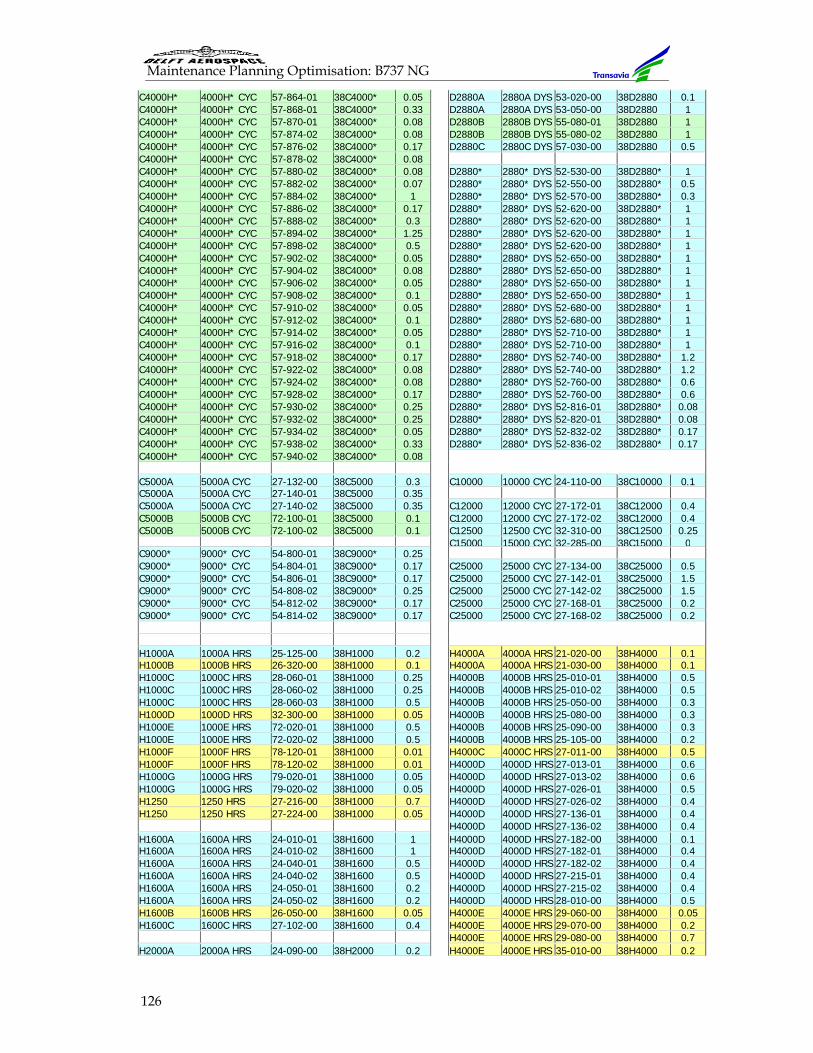
Maintenance Planning Optimisation: B737 NG
126
C4000H* 4000H* CYC 57-864-01 38C4000* 0.05 D2880A 2880A DYS 53-020-00 38D2880 0.1C4000H* 4000H* CYC 57-868-01 38C4000* 0.33 D2880A 2880A DYS 53-050-00 38D2880 1C4000H* 4000H* CYC 57-870-01 38C4000* 0.08 D2880B 2880B DYS 55-080-01 38D2880 1C4000H* 4000H* CYC 57-874-02 38C4000* 0.08 D2880B 2880B DYS 55-080-02 38D2880 1C4000H* 4000H* CYC 57-876-02 38C4000* 0.17 D2880C 2880C DYS 57-030-00 38D2880 0.5C4000H* 4000H* CYC 57-878-02 38C4000* 0.08 C4000H* 4000H* CYC 57-880-02 38C4000* 0.08 D2880* 2880* DYS 52-530-00 38D2880* 1C4000H* 4000H* CYC 57-882-02 38C4000* 0.07 D2880* 2880* DYS 52-550-00 38D2880* 0.5C4000H* 4000H* CYC 57-884-02 38C4000* 1 D2880* 2880* DYS 52-570-00 38D2880* 0.3C4000H* 4000H* CYC 57-886-02 38C4000* 0.17 D2880* 2880* DYS 52-620-00 38D2880* 1C4000H* 4000H* CYC 57-888-02 38C4000* 0.3 D2880* 2880* DYS 52-620-00 38D2880* 1C4000H* 4000H* CYC 57-894-02 38C4000* 1.25 D2880* 2880* DYS 52-620-00 38D2880* 1C4000H* 4000H* CYC 57-898-02 38C4000* 0.5 D2880* 2880* DYS 52-620-00 38D2880* 1C4000H* 4000H* CYC 57-902-02 38C4000* 0.05 D2880* 2880* DYS 52-650-00 38D2880* 1C4000H* 4000H* CYC 57-904-02 38C4000* 0.08 D2880* 2880* DYS 52-650-00 38D2880* 1C4000H* 4000H* CYC 57-906-02 38C4000* 0.05 D2880* 2880* DYS 52-650-00 38D2880* 1C4000H* 4000H* CYC 57-908-02 38C4000* 0.1 D2880* 2880* DYS 52-650-00 38D2880* 1C4000H* 4000H* CYC 57-910-02 38C4000* 0.05 D2880* 2880* DYS 52-680-00 38D2880* 1C4000H* 4000H* CYC 57-912-02 38C4000* 0.1 D2880* 2880* DYS 52-680-00 38D2880* 1C4000H* 4000H* CYC 57-914-02 38C4000* 0.05 D2880* 2880* DYS 52-710-00 38D2880* 1C4000H* 4000H* CYC 57-916-02 38C4000* 0.1 D2880* 2880* DYS 52-710-00 38D2880* 1C4000H* 4000H* CYC 57-918-02 38C4000* 0.17 D2880* 2880* DYS 52-740-00 38D2880* 1.2C4000H* 4000H* CYC 57-922-02 38C4000* 0.08 D2880* 2880* DYS 52-740-00 38D2880* 1.2C4000H* 4000H* CYC 57-924-02 38C4000* 0.08 D2880* 2880* DYS 52-760-00 38D2880* 0.6C4000H* 4000H* CYC 57-928-02 38C4000* 0.17 D2880* 2880* DYS 52-760-00 38D2880* 0.6C4000H* 4000H* CYC 57-930-02 38C4000* 0.25 D2880* 2880* DYS 52-816-01 38D2880* 0.08C4000H* 4000H* CYC 57-932-02 38C4000* 0.25 D2880* 2880* DYS 52-820-01 38D2880* 0.08C4000H* 4000H* CYC 57-934-02 38C4000* 0.05 D2880* 2880* DYS 52-832-02 38D2880* 0.17C4000H* 4000H* CYC 57-938-02 38C4000* 0.33 D2880* 2880* DYS 52-836-02 38D2880* 0.17C4000H* 4000H* CYC 57-940-02 38C4000* 0.08 C5000A 5000A CYC 27-132-00 38C5000 0.3 C10000 10000 CYC 24-110-00 38C10000 0.1C5000A 5000A CYC 27-140-01 38C5000 0.35 C5000A 5000A CYC 27-140-02 38C5000 0.35 C12000 12000 CYC 27-172-01 38C12000 0.4C5000B 5000B CYC 72-100-01 38C5000 0.1 C12000 12000 CYC 27-172-02 38C12000 0.4C5000B 5000B CYC 72-100-02 38C5000 0.1 C12500 12500 CYC 32-310-00 38C12500 0.25
C15000 15000 CYC 32-285-00 38C15000 0C9000* 9000* CYC 54-800-01 38C9000* 0.25 C9000* 9000* CYC 54-804-01 38C9000* 0.17 C25000 25000 CYC 27-134-00 38C25000 0.5C9000* 9000* CYC 54-806-01 38C9000* 0.17 C25000 25000 CYC 27-142-01 38C25000 1.5C9000* 9000* CYC 54-808-02 38C9000* 0.25 C25000 25000 CYC 27-142-02 38C25000 1.5C9000* 9000* CYC 54-812-02 38C9000* 0.17 C25000 25000 CYC 27-168-01 38C25000 0.2C9000* 9000* CYC 54-814-02 38C9000* 0.17 C25000 25000 CYC 27-168-02 38C25000 0.2 H1000A 1000A HRS 25-125-00 38H1000 0.2 H4000A 4000A HRS 21-020-00 38H4000 0.1H1000B 1000B HRS 26-320-00 38H1000 0.1 H4000A 4000A HRS 21-030-00 38H4000 0.1H1000C 1000C HRS 28-060-01 38H1000 0.25 H4000B 4000B HRS 25-010-01 38H4000 0.5H1000C 1000C HRS 28-060-02 38H1000 0.25 H4000B 4000B HRS 25-010-02 38H4000 0.5H1000C 1000C HRS 28-060-03 38H1000 0.5 H4000B 4000B HRS 25-050-00 38H4000 0.3H1000D 1000D HRS 32-300-00 38H1000 0.05 H4000B 4000B HRS 25-080-00 38H4000 0.3H1000E 1000E HRS 72-020-01 38H1000 0.5 H4000B 4000B HRS 25-090-00 38H4000 0.3H1000E 1000E HRS 72-020-02 38H1000 0.5 H4000B 4000B HRS 25-105-00 38H4000 0.2H1000F 1000F HRS 78-120-01 38H1000 0.01 H4000C 4000C HRS 27-011-00 38H4000 0.5H1000F 1000F HRS 78-120-02 38H1000 0.01 H4000D 4000D HRS 27-013-01 38H4000 0.6H1000G 1000G HRS 79-020-01 38H1000 0.05 H4000D 4000D HRS 27-013-02 38H4000 0.6H1000G 1000G HRS 79-020-02 38H1000 0.05 H4000D 4000D HRS 27-026-01 38H4000 0.5H1250 1250 HRS 27-216-00 38H1000 0.7 H4000D 4000D HRS 27-026-02 38H4000 0.4H1250 1250 HRS 27-224-00 38H1000 0.05 H4000D 4000D HRS 27-136-01 38H4000 0.4 H4000D 4000D HRS 27-136-02 38H4000 0.4H1600A 1600A HRS 24-010-01 38H1600 1 H4000D 4000D HRS 27-182-00 38H4000 0.1H1600A 1600A HRS 24-010-02 38H1600 1 H4000D 4000D HRS 27-182-01 38H4000 0.4H1600A 1600A HRS 24-040-01 38H1600 0.5 H4000D 4000D HRS 27-182-02 38H4000 0.4H1600A 1600A HRS 24-040-02 38H1600 0.5 H4000D 4000D HRS 27-215-01 38H4000 0.4H1600A 1600A HRS 24-050-01 38H1600 0.2 H4000D 4000D HRS 27-215-02 38H4000 0.4H1600A 1600A HRS 24-050-02 38H1600 0.2 H4000D 4000D HRS 28-010-00 38H4000 0.5H1600B 1600B HRS 26-050-00 38H1600 0.05 H4000E 4000E HRS 29-060-00 38H4000 0.05H1600C 1600C HRS 27-102-00 38H1600 0.4 H4000E 4000E HRS 29-070-00 38H4000 0.2 H4000E 4000E HRS 29-080-00 38H4000 0.7H2000A 2000A HRS 24-090-00 38H2000 0.2 H4000E 4000E HRS 35-010-00 38H4000 0.2
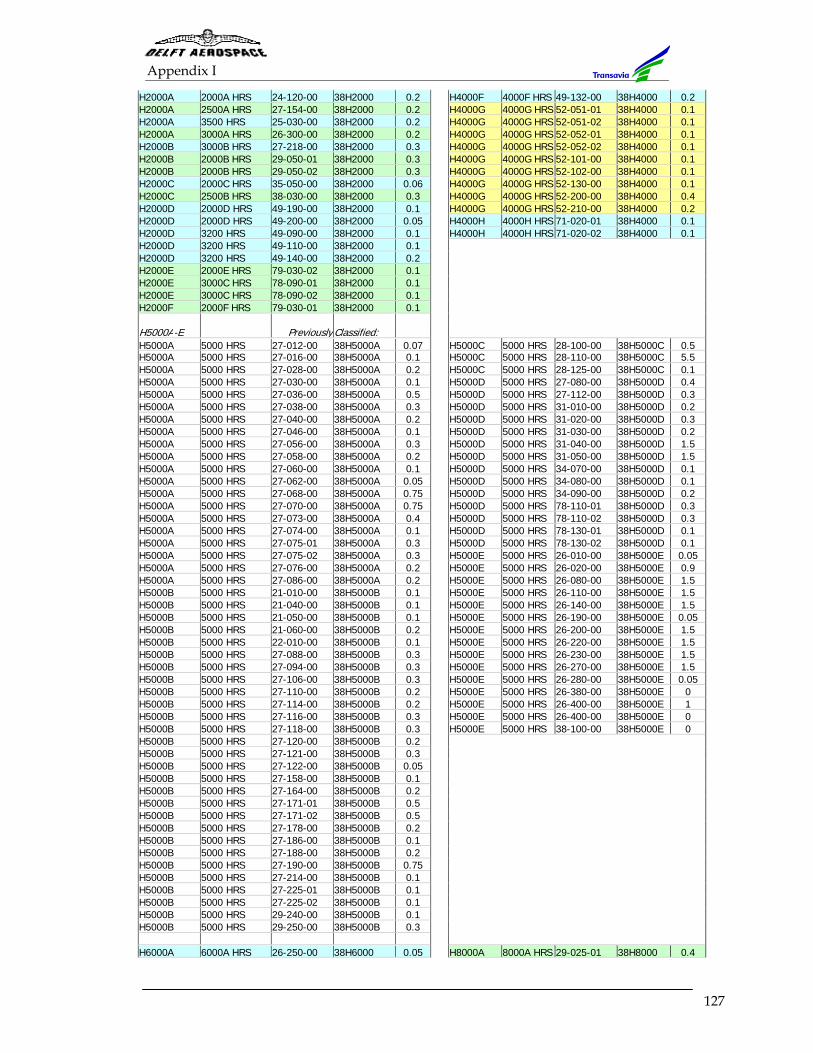
Appendix I
127
H2000A 2000A HRS 24-120-00 38H2000 0.2 H4000F 4000F HRS 49-132-00 38H4000 0.2H2000A 2500A HRS 27-154-00 38H2000 0.2 H4000G 4000G HRS 52-051-01 38H4000 0.1H2000A 3500 HRS 25-030-00 38H2000 0.2 H4000G 4000G HRS 52-051-02 38H4000 0.1H2000A 3000A HRS 26-300-00 38H2000 0.2 H4000G 4000G HRS 52-052-01 38H4000 0.1H2000B 3000B HRS 27-218-00 38H2000 0.3 H4000G 4000G HRS 52-052-02 38H4000 0.1H2000B 2000B HRS 29-050-01 38H2000 0.3 H4000G 4000G HRS 52-101-00 38H4000 0.1H2000B 2000B HRS 29-050-02 38H2000 0.3 H4000G 4000G HRS 52-102-00 38H4000 0.1H2000C 2000C HRS 35-050-00 38H2000 0.06 H4000G 4000G HRS 52-130-00 38H4000 0.1H2000C 2500B HRS 38-030-00 38H2000 0.3 H4000G 4000G HRS 52-200-00 38H4000 0.4H2000D 2000D HRS 49-190-00 38H2000 0.1 H4000G 4000G HRS 52-210-00 38H4000 0.2H2000D 2000D HRS 49-200-00 38H2000 0.05 H4000H 4000H HRS 71-020-01 38H4000 0.1H2000D 3200 HRS 49-090-00 38H2000 0.1 H4000H 4000H HRS 71-020-02 38H4000 0.1H2000D 3200 HRS 49-110-00 38H2000 0.1H2000D 3200 HRS 49-140-00 38H2000 0.2H2000E 2000E HRS 79-030-02 38H2000 0.1H2000E 3000C HRS 78-090-01 38H2000 0.1H2000E 3000C HRS 78-090-02 38H2000 0.1H2000F 2000F HRS 79-030-01 38H2000 0.1 H5000A-E Previously Classified:H5000A 5000 HRS 27-012-00 38H5000A 0.07 H5000C 5000 HRS 28-100-00 38H5000C 0.5H5000A 5000 HRS 27-016-00 38H5000A 0.1 H5000C 5000 HRS 28-110-00 38H5000C 5.5H5000A 5000 HRS 27-028-00 38H5000A 0.2 H5000C 5000 HRS 28-125-00 38H5000C 0.1H5000A 5000 HRS 27-030-00 38H5000A 0.1 H5000D 5000 HRS 27-080-00 38H5000D 0.4H5000A 5000 HRS 27-036-00 38H5000A 0.5 H5000D 5000 HRS 27-112-00 38H5000D 0.3H5000A 5000 HRS 27-038-00 38H5000A 0.3 H5000D 5000 HRS 31-010-00 38H5000D 0.2H5000A 5000 HRS 27-040-00 38H5000A 0.2 H5000D 5000 HRS 31-020-00 38H5000D 0.3H5000A 5000 HRS 27-046-00 38H5000A 0.1 H5000D 5000 HRS 31-030-00 38H5000D 0.2H5000A 5000 HRS 27-056-00 38H5000A 0.3 H5000D 5000 HRS 31-040-00 38H5000D 1.5H5000A 5000 HRS 27-058-00 38H5000A 0.2 H5000D 5000 HRS 31-050-00 38H5000D 1.5H5000A 5000 HRS 27-060-00 38H5000A 0.1 H5000D 5000 HRS 34-070-00 38H5000D 0.1H5000A 5000 HRS 27-062-00 38H5000A 0.05 H5000D 5000 HRS 34-080-00 38H5000D 0.1H5000A 5000 HRS 27-068-00 38H5000A 0.75 H5000D 5000 HRS 34-090-00 38H5000D 0.2H5000A 5000 HRS 27-070-00 38H5000A 0.75 H5000D 5000 HRS 78-110-01 38H5000D 0.3H5000A 5000 HRS 27-073-00 38H5000A 0.4 H5000D 5000 HRS 78-110-02 38H5000D 0.3H5000A 5000 HRS 27-074-00 38H5000A 0.1 H5000D 5000 HRS 78-130-01 38H5000D 0.1H5000A 5000 HRS 27-075-01 38H5000A 0.3 H5000D 5000 HRS 78-130-02 38H5000D 0.1H5000A 5000 HRS 27-075-02 38H5000A 0.3 H5000E 5000 HRS 26-010-00 38H5000E 0.05H5000A 5000 HRS 27-076-00 38H5000A 0.2 H5000E 5000 HRS 26-020-00 38H5000E 0.9H5000A 5000 HRS 27-086-00 38H5000A 0.2 H5000E 5000 HRS 26-080-00 38H5000E 1.5H5000B 5000 HRS 21-010-00 38H5000B 0.1 H5000E 5000 HRS 26-110-00 38H5000E 1.5H5000B 5000 HRS 21-040-00 38H5000B 0.1 H5000E 5000 HRS 26-140-00 38H5000E 1.5H5000B 5000 HRS 21-050-00 38H5000B 0.1 H5000E 5000 HRS 26-190-00 38H5000E 0.05H5000B 5000 HRS 21-060-00 38H5000B 0.2 H5000E 5000 HRS 26-200-00 38H5000E 1.5H5000B 5000 HRS 22-010-00 38H5000B 0.1 H5000E 5000 HRS 26-220-00 38H5000E 1.5H5000B 5000 HRS 27-088-00 38H5000B 0.3 H5000E 5000 HRS 26-230-00 38H5000E 1.5H5000B 5000 HRS 27-094-00 38H5000B 0.3 H5000E 5000 HRS 26-270-00 38H5000E 1.5H5000B 5000 HRS 27-106-00 38H5000B 0.3 H5000E 5000 HRS 26-280-00 38H5000E 0.05H5000B 5000 HRS 27-110-00 38H5000B 0.2 H5000E 5000 HRS 26-380-00 38H5000E 0H5000B 5000 HRS 27-114-00 38H5000B 0.2 H5000E 5000 HRS 26-400-00 38H5000E 1H5000B 5000 HRS 27-116-00 38H5000B 0.3 H5000E 5000 HRS 26-400-00 38H5000E 0H5000B 5000 HRS 27-118-00 38H5000B 0.3 H5000E 5000 HRS 38-100-00 38H5000E 0H5000B 5000 HRS 27-120-00 38H5000B 0.2H5000B 5000 HRS 27-121-00 38H5000B 0.3H5000B 5000 HRS 27-122-00 38H5000B 0.05H5000B 5000 HRS 27-158-00 38H5000B 0.1H5000B 5000 HRS 27-164-00 38H5000B 0.2H5000B 5000 HRS 27-171-01 38H5000B 0.5H5000B 5000 HRS 27-171-02 38H5000B 0.5H5000B 5000 HRS 27-178-00 38H5000B 0.2H5000B 5000 HRS 27-186-00 38H5000B 0.1H5000B 5000 HRS 27-188-00 38H5000B 0.2H5000B 5000 HRS 27-190-00 38H5000B 0.75H5000B 5000 HRS 27-214-00 38H5000B 0.1H5000B 5000 HRS 27-225-01 38H5000B 0.1H5000B 5000 HRS 27-225-02 38H5000B 0.1H5000B 5000 HRS 29-240-00 38H5000B 0.1H5000B 5000 HRS 29-250-00 38H5000B 0.3 H6000A 6000A HRS 26-250-00 38H6000 0.05 H8000A 8000A HRS 29-025-01 38H8000 0.4
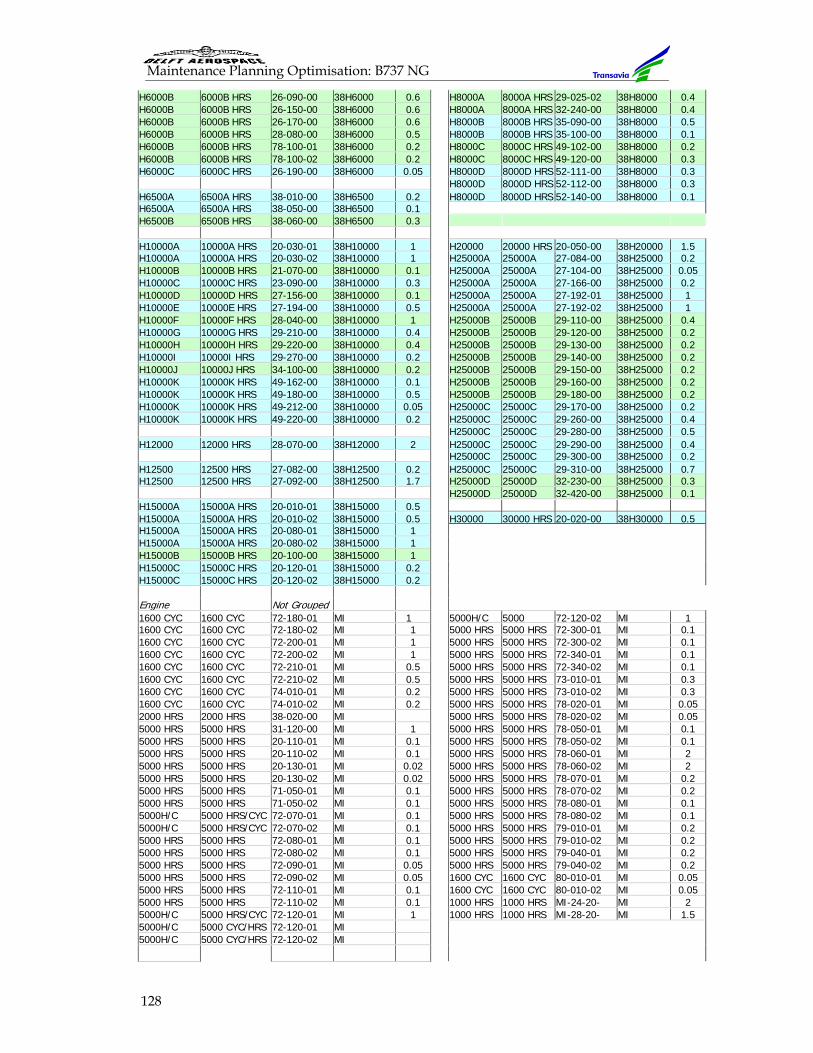
Maintenance Planning Optimisation: B737 NG
128
H6000B 6000B HRS 26-090-00 38H6000 0.6 H8000A 8000A HRS 29-025-02 38H8000 0.4H6000B 6000B HRS 26-150-00 38H6000 0.6 H8000A 8000A HRS 32-240-00 38H8000 0.4H6000B 6000B HRS 26-170-00 38H6000 0.6 H8000B 8000B HRS 35-090-00 38H8000 0.5H6000B 6000B HRS 28-080-00 38H6000 0.5 H8000B 8000B HRS 35-100-00 38H8000 0.1H6000B 6000B HRS 78-100-01 38H6000 0.2 H8000C 8000C HRS 49-102-00 38H8000 0.2H6000B 6000B HRS 78-100-02 38H6000 0.2 H8000C 8000C HRS 49-120-00 38H8000 0.3H6000C 6000C HRS 26-190-00 38H6000 0.05 H8000D 8000D HRS 52-111-00 38H8000 0.3 H8000D 8000D HRS 52-112-00 38H8000 0.3H6500A 6500A HRS 38-010-00 38H6500 0.2 H8000D 8000D HRS 52-140-00 38H8000 0.1H6500A 6500A HRS 38-050-00 38H6500 0.1H6500B 6500B HRS 38-060-00 38H6500 0.3 H10000A 10000A HRS 20-030-01 38H10000 1 H20000 20000 HRS 20-050-00 38H20000 1.5H10000A 10000A HRS 20-030-02 38H10000 1 H25000A 25000A 27-084-00 38H25000 0.2H10000B 10000B HRS 21-070-00 38H10000 0.1 H25000A 25000A 27-104-00 38H25000 0.05H10000C 10000C HRS 23-090-00 38H10000 0.3 H25000A 25000A 27-166-00 38H25000 0.2H10000D 10000D HRS 27-156-00 38H10000 0.1 H25000A 25000A 27-192-01 38H25000 1H10000E 10000E HRS 27-194-00 38H10000 0.5 H25000A 25000A 27-192-02 38H25000 1H10000F 10000F HRS 28-040-00 38H10000 1 H25000B 25000B 29-110-00 38H25000 0.4H10000G 10000G HRS 29-210-00 38H10000 0.4 H25000B 25000B 29-120-00 38H25000 0.2H10000H 10000H HRS 29-220-00 38H10000 0.4 H25000B 25000B 29-130-00 38H25000 0.2H10000I 10000I HRS 29-270-00 38H10000 0.2 H25000B 25000B 29-140-00 38H25000 0.2H10000J 10000J HRS 34-100-00 38H10000 0.2 H25000B 25000B 29-150-00 38H25000 0.2H10000K 10000K HRS 49-162-00 38H10000 0.1 H25000B 25000B 29-160-00 38H25000 0.2H10000K 10000K HRS 49-180-00 38H10000 0.5 H25000B 25000B 29-180-00 38H25000 0.2H10000K 10000K HRS 49-212-00 38H10000 0.05 H25000C 25000C 29-170-00 38H25000 0.2H10000K 10000K HRS 49-220-00 38H10000 0.2 H25000C 25000C 29-260-00 38H25000 0.4 H25000C 25000C 29-280-00 38H25000 0.5H12000 12000 HRS 28-070-00 38H12000 2 H25000C 25000C 29-290-00 38H25000 0.4 H25000C 25000C 29-300-00 38H25000 0.2H12500 12500 HRS 27-082-00 38H12500 0.2 H25000C 25000C 29-310-00 38H25000 0.7H12500 12500 HRS 27-092-00 38H12500 1.7 H25000D 25000D 32-230-00 38H25000 0.3 H25000D 25000D 32-420-00 38H25000 0.1H15000A 15000A HRS 20-010-01 38H15000 0.5 H15000A 15000A HRS 20-010-02 38H15000 0.5 H30000 30000 HRS 20-020-00 38H30000 0.5H15000A 15000A HRS 20-080-01 38H15000 1H15000A 15000A HRS 20-080-02 38H15000 1H15000B 15000B HRS 20-100-00 38H15000 1H15000C 15000C HRS 20-120-01 38H15000 0.2H15000C 15000C HRS 20-120-02 38H15000 0.2 Engine Not Grouped1600 CYC 1600 CYC 72-180-01 MI 1 5000H/C 5000 72-120-02 MI 11600 CYC 1600 CYC 72-180-02 MI 1 5000 HRS 5000 HRS 72-300-01 MI 0.11600 CYC 1600 CYC 72-200-01 MI 1 5000 HRS 5000 HRS 72-300-02 MI 0.11600 CYC 1600 CYC 72-200-02 MI 1 5000 HRS 5000 HRS 72-340-01 MI 0.11600 CYC 1600 CYC 72-210-01 MI 0.5 5000 HRS 5000 HRS 72-340-02 MI 0.11600 CYC 1600 CYC 72-210-02 MI 0.5 5000 HRS 5000 HRS 73-010-01 MI 0.31600 CYC 1600 CYC 74-010-01 MI 0.2 5000 HRS 5000 HRS 73-010-02 MI 0.31600 CYC 1600 CYC 74-010-02 MI 0.2 5000 HRS 5000 HRS 78-020-01 MI 0.052000 HRS 2000 HRS 38-020-00 MI 5000 HRS 5000 HRS 78-020-02 MI 0.055000 HRS 5000 HRS 31-120-00 MI 1 5000 HRS 5000 HRS 78-050-01 MI 0.15000 HRS 5000 HRS 20-110-01 MI 0.1 5000 HRS 5000 HRS 78-050-02 MI 0.15000 HRS 5000 HRS 20-110-02 MI 0.1 5000 HRS 5000 HRS 78-060-01 MI 25000 HRS 5000 HRS 20-130-01 MI 0.02 5000 HRS 5000 HRS 78-060-02 MI 25000 HRS 5000 HRS 20-130-02 MI 0.02 5000 HRS 5000 HRS 78-070-01 MI 0.25000 HRS 5000 HRS 71-050-01 MI 0.1 5000 HRS 5000 HRS 78-070-02 MI 0.25000 HRS 5000 HRS 71-050-02 MI 0.1 5000 HRS 5000 HRS 78-080-01 MI 0.15000H/C 5000 HRS/CYC 72-070-01 MI 0.1 5000 HRS 5000 HRS 78-080-02 MI 0.15000H/C 5000 HRS/CYC 72-070-02 MI 0.1 5000 HRS 5000 HRS 79-010-01 MI 0.25000 HRS 5000 HRS 72-080-01 MI 0.1 5000 HRS 5000 HRS 79-010-02 MI 0.25000 HRS 5000 HRS 72-080-02 MI 0.1 5000 HRS 5000 HRS 79-040-01 MI 0.25000 HRS 5000 HRS 72-090-01 MI 0.05 5000 HRS 5000 HRS 79-040-02 MI 0.25000 HRS 5000 HRS 72-090-02 MI 0.05 1600 CYC 1600 CYC 80-010-01 MI 0.055000 HRS 5000 HRS 72-110-01 MI 0.1 1600 CYC 1600 CYC 80-010-02 MI 0.055000 HRS 5000 HRS 72-110-02 MI 0.1 1000 HRS 1000 HRS MI-24-20- MI 25000H/C 5000 HRS/CYC 72-120-01 MI 1 1000 HRS 1000 HRS MI-28-20- MI 1.55000H/C 5000 CYC/HRS 72-120-01 MI5000H/C 5000 CYC/HRS 72-120-02 MI
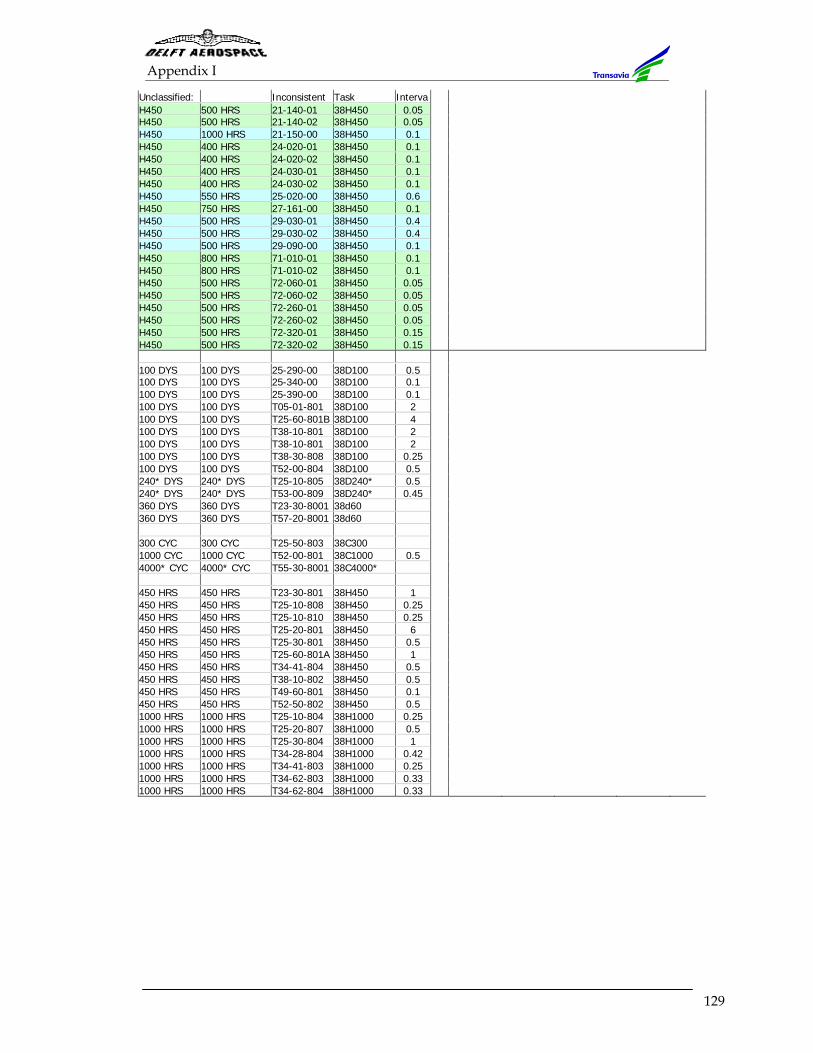
Appendix I
129
Unclassified: Inconsistent Task IntervaH450 500 HRS 21-140-01 38H450 0.05H450 500 HRS 21-140-02 38H450 0.05H450 1000 HRS 21-150-00 38H450 0.1H450 400 HRS 24-020-01 38H450 0.1H450 400 HRS 24-020-02 38H450 0.1H450 400 HRS 24-030-01 38H450 0.1H450 400 HRS 24-030-02 38H450 0.1H450 550 HRS 25-020-00 38H450 0.6H450 750 HRS 27-161-00 38H450 0.1H450 500 HRS 29-030-01 38H450 0.4H450 500 HRS 29-030-02 38H450 0.4H450 500 HRS 29-090-00 38H450 0.1H450 800 HRS 71-010-01 38H450 0.1H450 800 HRS 71-010-02 38H450 0.1H450 500 HRS 72-060-01 38H450 0.05H450 500 HRS 72-060-02 38H450 0.05H450 500 HRS 72-260-01 38H450 0.05H450 500 HRS 72-260-02 38H450 0.05 H450 500 HRS 72-320-01 38H450 0.15H450 500 HRS 72-320-02 38H450 0.15 100 DYS 100 DYS 25-290-00 38D100 0.5100 DYS 100 DYS 25-340-00 38D100 0.1100 DYS 100 DYS 25-390-00 38D100 0.1100 DYS 100 DYS T05-01-801 38D100 2100 DYS 100 DYS T25-60-801B 38D100 4100 DYS 100 DYS T38-10-801 38D100 2100 DYS 100 DYS T38-10-801 38D100 2100 DYS 100 DYS T38-30-808 38D100 0.25100 DYS 100 DYS T52-00-804 38D100 0.5240* DYS 240* DYS T25-10-805 38D240* 0.5240* DYS 240* DYS T53-00-809 38D240* 0.45360 DYS 360 DYS T23-30-8001 38d60360 DYS 360 DYS T57-20-8001 38d60 300 CYC 300 CYC T25-50-803 38C3001000 CYC 1000 CYC T52-00-801 38C1000 0.54000* CYC 4000* CYC T55-30-8001 38C4000* 450 HRS 450 HRS T23-30-801 38H450 1450 HRS 450 HRS T25-10-808 38H450 0.25450 HRS 450 HRS T25-10-810 38H450 0.25450 HRS 450 HRS T25-20-801 38H450 6450 HRS 450 HRS T25-30-801 38H450 0.5450 HRS 450 HRS T25-60-801A 38H450 1450 HRS 450 HRS T34-41-804 38H450 0.5450 HRS 450 HRS T38-10-802 38H450 0.5450 HRS 450 HRS T49-60-801 38H450 0.1450 HRS 450 HRS T52-50-802 38H450 0.51000 HRS 1000 HRS T25-10-804 38H1000 0.251000 HRS 1000 HRS T25-20-807 38H1000 0.51000 HRS 1000 HRS T25-30-804 38H1000 11000 HRS 1000 HRS T34-28-804 38H1000 0.421000 HRS 1000 HRS T34-41-803 38H1000 0.251000 HRS 1000 HRS T34-62-803 38H1000 0.331000 HRS 1000 HRS T34-62-804 38H1000 0.33

Appendix J
131
J. The Maintenance Item Allocation Model (MIAM)
J.1. Necessity
In order to determine the most optimum way of clustering maintenance items (Maintenance tasks grouped into either Transavia Checks or Maintenance Task Packages), a choice can be made between the application of an analytical method or a simulation method. Owing to the large amount of data that needs to be calculated simultaneously, including the consideration of various scenarios, a computer model in the form of a hybrid simulation is preferred.
J.2. Hybrid Simulation
J.2.1. Components of a Discrete-Event simulation model The following is a list of components generally present in most ‘discrete-event’ simulation models. System state: State variables that describe the system state at a particular time Event List: A list containing the next time when each type of event will occur Statistical Counters: Variables used for storing statistical information about system performance Initialisation Routine: A sub-program to initialise the simulation model at a time zero Event Routine: A subprogram that updates the system state when a particular type of event occurs (there is one event routine for each event type). Library routines: a set of subprograms used to generate random observations from the probability distributions determined as part of the simulation model Report Generator: A subprogram that computes estimates (from the statistical counters) of the desired measures of performance and produces a report when the simulation ends Main program: This is the subprogram that invokes the routines to determine the next event and update the system state appropriately. [Hilston, 2001]
J.3. Library Routine: Utilisation Simulation
J.3.1. Actual Aircraft Utilisation
Table J. 1 below tabulates the specific annual utilisation of the B737 NG Fleet, over the period 1999-2000. It only includes that part of the fleet that was present for the whole calendar year, i.e. from January till December.
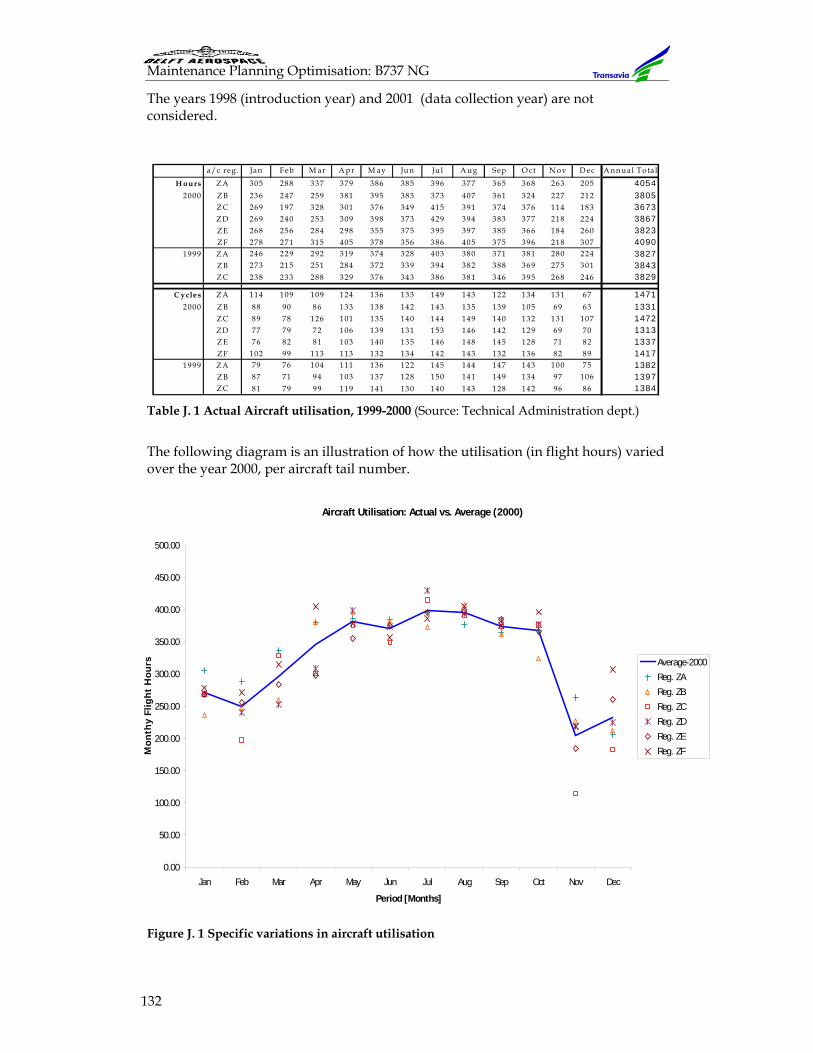
Maintenance Planning Optimisation: B737 NG
132
The years 1998 (introduction year) and 2001 (data collection year) are not considered.
Table J. 1 Actual Aircraft utilisation, 1999-2000 (Source: Technical Administration dept.)
The following diagram is an illustration of how the utilisation (in flight hours) varied over the year 2000, per aircraft tail number.
Figure J. 1 Specific variations in aircraft utilisation
a/c reg . Jan Feb M ar A p r M ay Jun Ju l A ug Sep O ct N ov D ec A nnual T ota l
H ou rs Z A 305 288 337 379 386 385 396 377 365 368 263 205 40542000 Z B 236 247 259 381 395 383 373 407 361 324 227 212 3805
Z C 269 197 328 301 376 349 415 391 374 376 114 183 3673Z D 269 240 253 309 398 373 429 394 383 377 218 224 3867Z E 268 256 284 298 355 375 395 397 385 366 184 260 3823Z F 278 271 315 405 378 356 386 405 375 396 218 307 4090
1999 Z A 246 229 292 319 374 328 403 380 371 381 280 224 3827Z B 273 215 251 284 372 339 394 382 388 369 275 301 3843Z C 238 233 288 329 376 343 386 381 346 395 268 246 3829
C ycles Z A 114 109 109 124 136 133 149 143 122 134 131 67 14712000 Z B 88 90 86 133 138 142 143 135 139 105 69 63 1331
Z C 89 78 126 101 135 140 144 149 140 132 131 107 1472Z D 77 79 72 106 139 131 153 146 142 129 69 70 1313Z E 76 82 81 103 140 135 146 148 145 128 71 82 1337Z F 102 99 113 113 132 134 142 143 132 136 82 89 1417
1999 Z A 79 76 104 111 136 122 145 144 147 143 100 75 1382Z B 87 71 94 103 137 128 150 141 149 134 97 106 1397Z C 81 79 99 119 141 130 140 143 128 142 96 86 1384
Aircraft Utilisation: Actual vs. Average (2000)
0.00
50.00
100.00
150.00
200.00
250.00
300.00
350.00
400.00
450.00
500.00
Jan Feb Mar Apr May Jun Jul Aug Sep Oct Nov Dec
Period [Months]
Mon
thy
Flig
ht
Hou
rs Average-2000Reg. ZAReg. ZBReg. ZCReg. ZDReg. ZEReg. ZF
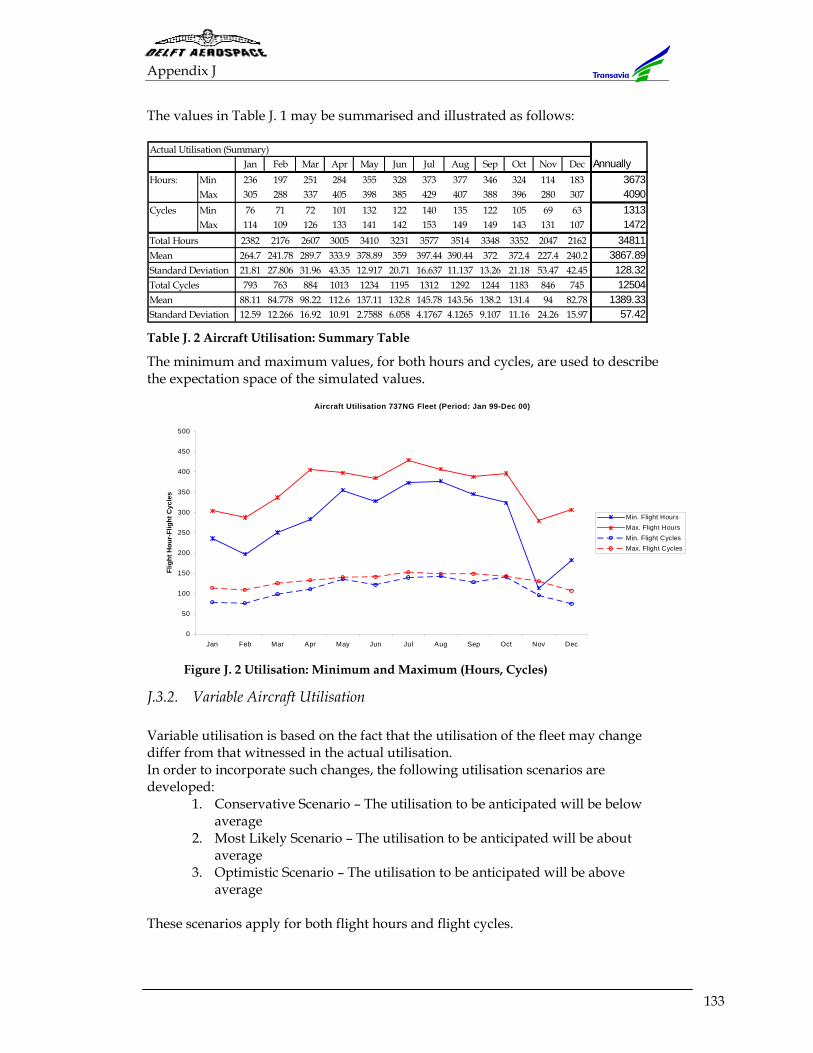
Appendix J
133
The values in Table J. 1 may be summarised and illustrated as follows:
Table J. 2 Aircraft Utilisation: Summary Table
The minimum and maximum values, for both hours and cycles, are used to describe the expectation space of the simulated values.
J.3.2. Variable Aircraft Utilisation Variable utilisation is based on the fact that the utilisation of the fleet may change differ from that witnessed in the actual utilisation. In order to incorporate such changes, the following utilisation scenarios are developed:
1. Conservative Scenario – The utilisation to be anticipated will be below average
2. Most Likely Scenario – The utilisation to be anticipated will be about average
3. Optimistic Scenario – The utilisation to be anticipated will be above average
These scenarios apply for both flight hours and flight cycles.
Actual Utilisation (Summary) Jan Feb Mar Apr May Jun Jul Aug Sep Oct Nov Dec Annually
Hours: Min 236 197 251 284 355 328 373 377 346 324 114 183 3673Max 305 288 337 405 398 385 429 407 388 396 280 307 4090
Cycles Min 76 71 72 101 132 122 140 135 122 105 69 63 1313Max 114 109 126 133 141 142 153 149 149 143 131 107 1472
Total Hours 2382 2176 2607 3005 3410 3231 3577 3514 3348 3352 2047 2162 34811Mean 264.7 241.78 289.7 333.9 378.89 359 397.44 390.44 372 372.4 227.4 240.2 3867.89Standard Deviation 21.81 27.806 31.96 43.35 12.917 20.71 16.637 11.137 13.26 21.18 53.47 42.45 128.32Total Cycles 793 763 884 1013 1234 1195 1312 1292 1244 1183 846 745 12504Mean 88.11 84.778 98.22 112.6 137.11 132.8 145.78 143.56 138.2 131.4 94 82.78 1389.33Standard Deviation 12.59 12.266 16.92 10.91 2.7588 6.058 4.1767 4.1265 9.107 11.16 24.26 15.97 57.42
Aircraft Utilisation 737NG Fleet (Period: Jan 99-Dec 00)
0
50
100
150
200
250
300
350
400
450
500
Jan Feb Mar Apr May Jun Jul Aug Sep Oct Nov Dec
Calendar Months
Flig
ht H
our-
Flig
ht C
ycle
s
Min. Flight HoursMax. Flight HoursMin. Flight CyclesMax. Flight Cycles
Figure J. 2 Utilisation: Minimum and Maximum (Hours, Cycles)
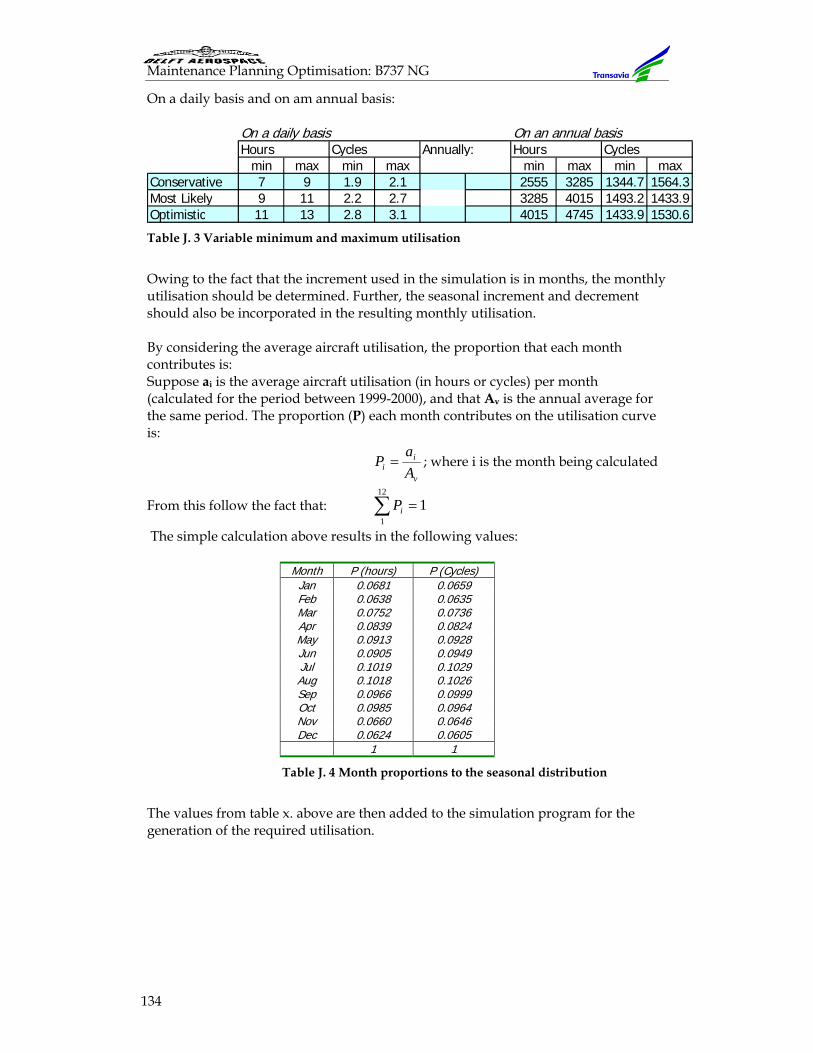
Maintenance Planning Optimisation: B737 NG
134
On a daily basis and on am annual basis:
Table J. 3 Variable minimum and maximum utilisation
Owing to the fact that the increment used in the simulation is in months, the monthly utilisation should be determined. Further, the seasonal increment and decrement should also be incorporated in the resulting monthly utilisation. By considering the average aircraft utilisation, the proportion that each month contributes is: Suppose ai is the average aircraft utilisation (in hours or cycles) per month (calculated for the period between 1999-2000), and that Av is the annual average for the same period. The proportion (P) each month contributes on the utilisation curve is:
v
ii A
aP = ; where i is the month being calculated
From this follow the fact that: 112
1=∑ iP
The simple calculation above results in the following values:
Month P (hours) P (Cycles) Jan 0.0681 0.0659 Feb 0.0638 0.0635 Mar 0.0752 0.0736 Apr 0.0839 0.0824 May 0.0913 0.0928 Jun 0.0905 0.0949 Jul 0.1019 0.1029 Aug 0.1018 0.1026 Sep 0.0966 0.0999 Oct 0.0985 0.0964 Nov 0.0660 0.0646 Dec 0.0624 0.0605
1 1
Table J. 4 Month proportions to the seasonal distribution
The values from table x. above are then added to the simulation program for the generation of the required utilisation.
On a daily basis On an annual basisHours Cycles Annually: Hours Cycles
min max min max min max min maxConservative 7 9 1.9 2.1 2555 3285 1344.7 1564.3Most Likely 9 11 2.2 2.7 3285 4015 1493.2 1433.9Optimistic 11 13 2.8 3.1 4015 4745 1433.9 1530.6
Appendix J
135
J.4. Visual Basic Code
J.4.1. Line Maintenance Codes Option Explicit 'Attribute VB_Name = "Module1" 'UMXSMP/PICCO/Anthony\Visual Basic code ' ' ' 'UTDAYS = Days limit on check 'UTHOURS = Hours limit on check 'UTCYCLES = Cycles limit on check 'VISITS = Hangar visit date 'FREQUENCY = Hangar visit frequency 'RDAYS = Days in a Calendar month 'RHOURS = Production hours (following utilisation) corresponding to the indicated month 'RCYCLES = Production cycles (following utilisation) corresponding to the indicated month 'For the leading column applies: If Value>UTLIMIT then MOD(Value,UTLIMIT) Function DueDate (Visit, Frequency, PrevVal, NextVis As Double, PrevRw, Value, RVALUE, UTLIMIT, NextRw As Integer) As Integer Dim i, j, k, l As Integer 'Calculating due dates for items (checks) with single limits 'RVALUE refers to RDAYS, RHOURS and RCYCLES ' k = RVALUE + NextRw j = PrevVal + PrevRw l = j - UTLIMIT If Value = UTLIMIT Then 'DueDate = l + RVALUE DueDate = RVALUE 'Else 'If j < UTLIMIT Then 'DueDate = RVALUE Else 'If (NextVis < Frequency) And (Value + k < UTLIMIT) Then 'DueDate = Value + RVALUE If Value + k < UTLIMIT Then DueDate = Value + RVALUE Else 'If Visit = Frequency And (Value + RVALUE > UTLIMIT) Then If Visit = Frequency Then
Maintenance Planning Optimisation: B737 NG
136
DueDate = UTLIMIT Else If NextVis = Frequency Then DueDate = Value + RVALUE Else DueDate = Value + RVALUE End If 'End If End If End If End If End Function Function DUALDH (Switch As Integer, Visit, Frequency, PrevVal, PrevVal2, NextVis As Double, PrevRd, PrevRh, Value, Value2, RDAYS, RHOURS, UTDAYS, UTHOURS, NextRd, NextRh As Integer) As Integer Dim TDDY, TDHR, i, j, k As Integer ' 'Function generates the due dates for checks with dual intervals (applicable to both D/H and D/C items) ' j = RDAYS + NextRd k = RHOURS + NextRh If Value = UTDAYS Then TDDY = PrevVal + PrevRd - Value + RDAYS If TDDY < 28 Then TDDY = RDAYS End If Else If (Value + j < UTDAYS) Then TDDY = Value + RDAYS Else If Visit = Frequency Then TDDY = UTDAYS Else If NextVis = Frequency Then TDDY = Value + RDAYS End If End If End If End If If Value2 = UTHOURS Then TDHR = PrevVal2 + PrevRh - Value2 If TDHR < 200 Then TDHR = RHOURS
Appendix J
137
End If Else If (Value2 + k < UTHOURS) Then TDHR = Value2 + RHOURS Else If Visit = Frequency Then TDHR = UTHOURS Else If NextVis = Frequency Then TDHR = Value2 + RHOURS End If End If End If End If If (TDHR = UTHOURS) Or (TDDY = UTDAYS) Then TDHR = UTHOURS TDDY = UTDAYS End If If Switch = 1 Then DUALDH = TDHR Else DUALDH = TDDY End If End Function Function ToHangar5 (Freq, PrevVal As Double, Value, RDAYS, PrevRd, PPrevRd As Integer) Dim i, j As Double ' 'Function calculates the date on which hangar maintenance should be performed ' 'Value = Value of previous cell 'Freq = Hangar visit Frequency 'RDAYS = Days of the month for the Cell in question ' 'Frequency never exceeds 54, and the least possible summation is 30+28 = 58. Therefore, 'Value < Freq will always be followed by Freq j = Value + RDAYS If Freq < 31 Then i = Freq Else If Value < Freq Then i = Freq
Maintenance Planning Optimisation: B737 NG
138
Else If Value < Freq And (Value + RDAYS >= Freq) Then i = Freq Else If Value = Freq And (PrevVal = Freq) Then i = RDAYS Else If Value = Freq And (PrevRd - (Freq - PrevVal) + RDAYS >= Freq) Then i = Freq Else If Value = Freq And (PrevRd - (Freq - PrevVal) + RDAYS < Freq) Then i = PrevRd - (Freq - PrevVal) + RDAYS End If End If End If End If End If End If ToHangar5 = i End Function Function LoSSeS (Value, RDAYS, UTLIMIT As Integer, PrevVal, ValuatorL As Double) Dim i As Double i = PrevVal + RDAYS If (Value = UTLIMIT) And (i < UTLIMIT) Then LoSSeS = (UTLIMIT MOD i)) * ValuatorL * 3.4 Else LoSSeS = 0 End If End Function Function Crosses (Value, UTLIMIT As Integer) As Characters ‘Function identifies maintenance due items with a cross mark If Value = UTLIMIT Then Crosses = "x" Else Crosses = " " End If End Function Function General1(Value, RVALUE, UTLIMIT As Integer) Dim i As Integer ‘This function calculates the exact maintenance demand
Appendix J
139
If Value = UTLIMIT Then i = RVALUE Else If Value + RVALUE < UTLIMIT Then i = Value + RVALUE Else i = UTLIMIT End If End If General1 = i End Function Function General2(Switch, Value, Value2, RVALUE, RVALUE2, UTLIMIT, UTLIMIT2 As Integer) Dim i, j As Integer ‘This function calculates the exact maintenance demand If Value = UTLIMIT Then i = RVALUE Else If Value + RVALUE < UTLIMIT Then i = Value + RVALUE Else i = UTLIMIT End If End If If Value2 = UTLIMIT2 Then j = RVALUE2 Else If Value2 + RVALUE2 < UTLIMIT2 Then j = Value2 + RVALUE2 Else j = UTLIMIT2 End If End If If i = UTLIMIT Or j = UTLIMIT2 Then i = UTLIMIT j = UTLIMIT2 End If If Switch = 1 Then General2 = j Else General2 = i End If End Function
Maintenance Planning Optimisation: B737 NG
140
J.4.2. Base Maintenance Codes Option Explicit 'For the leading column applies: If Value>UTLIMIT then MOD (Value, UTLIMIT) Function ShortDue (RVALUE, Value As Double, UTLIMIT As Integer) As Integer Dim m As Integer If Value = UTLIMIT Then ShortDue = RVALUE Else If Value + RVALUE < UTLIMIT Then ShortDue = Value + RVALUE Else ShortDue = UTLIMIT End If End If End Function Function CheckDue (RVALUE As Double, ADDIT, Freq, Value, UTLIMIT, UTVALUE As Integer) As Integer Dim i, j, k As Integer 'Calculating due dates for items (checks) with single limits 'RVALUE refers to RDAYS, RHOURS and RCYCLES i = Value + UTVALUE j = Freq k = RVALUE If Value = UTLIMIT Then CheckDue = RVALUE Else If (ADDIT = 1) And (i > UTLIMIT) Then CheckDue = UTLIMIT Else CheckDue = Value + RVALUE End If End If End Function Function DUALDC (Switch, ADDIT, Value, Value2, UTLIMIT, UTLIMIT2, UTVALUE, UTVALUE2 As Integer, RVALUE, RVALUE2 As Double) As Integer
Appendix J
141
Dim TDDY, TDHR, DAYSD, i, k As Integer, CYCSD, j, l As Double ' 'Function generates the due dates for checks with dual intervals '(applicable to both D/H and D/C items) ' i = RVALUE j = RVALUE2 k = Value + UTVALUE l = Value2 + UTVALUE2 If Value = UTLIMIT Then DAYSD = RVALUE Else If (ADDIT = 1) And (k > UTLIMIT) Then DAYSD = UTLIMIT Else DAYSD = Value + RVALUE End If End If If Value2 = UTLIMIT2 Then CYCSD = RVALUE2 Else If (ADDIT = 1) And (l > UTLIMIT2) Then CYCSD = UTLIMIT2 Else CYCSD = Value2 + RVALUE2 End If End If If (DAYSD = UTLIMIT) Or (CYCSD = UTLIMIT2) Then DAYSD = UTLIMIT CYCSD = UTLIMIT2 End If If Switch = 1 Then DUALDC = CYCSD Else DUALDC = DAYSD End If End Function Function BaseLosseS (Value, RVALUE, UTLIMIT As Integer, PrevVal, ValuatorL, Manhours As Double) Dim i As Double i = PrevVal + RVALUE
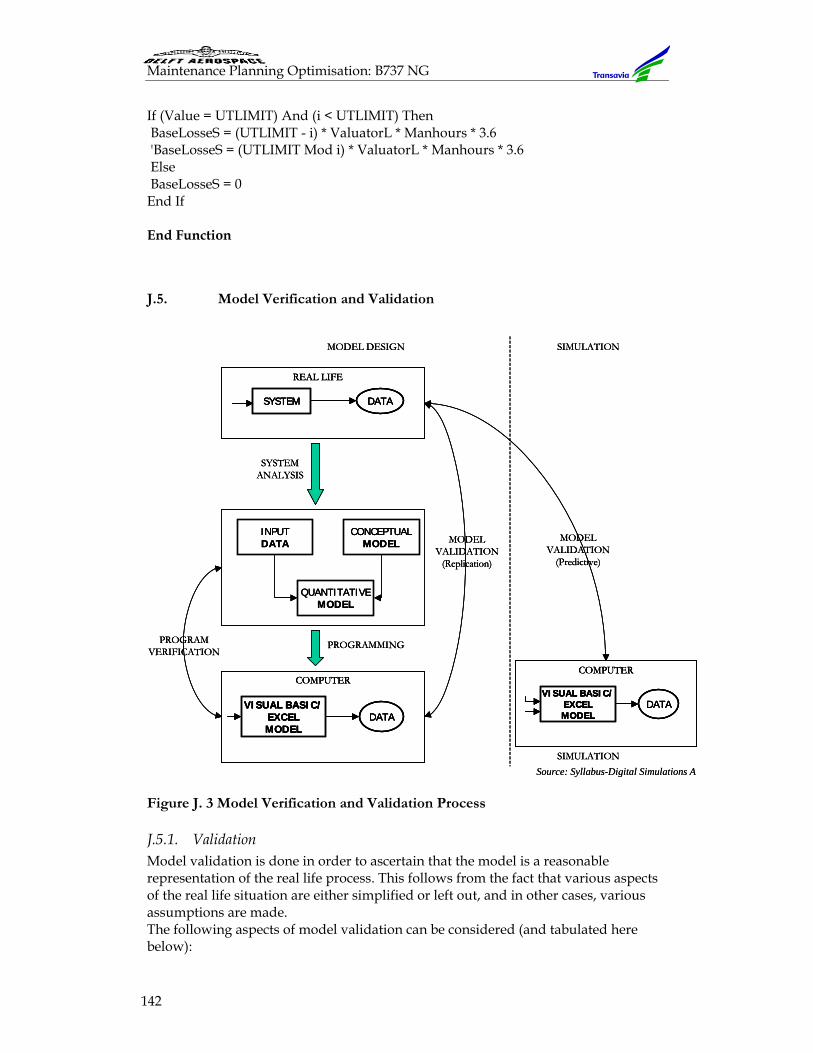
Maintenance Planning Optimisation: B737 NG
142
If (Value = UTLIMIT) And (i < UTLIMIT) Then BaseLosseS = (UTLIMIT - i) * ValuatorL * Manhours * 3.6 'BaseLosseS = (UTLIMIT Mod i) * ValuatorL * Manhours * 3.6 Else BaseLosseS = 0 End If End Function
J.5. Model Verification and Validation
Figure J. 3 Model Verification and Validation Process
J.5.1. Validation Model validation is done in order to ascertain that the model is a reasonable representation of the real life process. This follows from the fact that various aspects of the real life situation are either simplified or left out, and in other cases, various assumptions are made. The following aspects of model validation can be considered (and tabulated here below):
INPUTDATA
CONCEPTUALMODEL
QUANTITATIVEMODEL
SYSTEM DATA
REAL LIFE
VISUAL BASIC/EXCELMODEL
DATA
COMPUTER
SYSTEM ANALYSIS
PROGRAMMING
MODEL VALIDATION
(Replication)
PROGRAM VERIFICATION
VISUAL BASIC/EXCELMODEL
DATA
COMPUTER
SIMULATION
MODEL VALIDATION
(Predictive)
MODEL DESIGN SIMULATION
Source: Syllabus-Digital Simulations A
INPUTDATA
CONCEPTUALMODEL
QUANTITATIVEMODEL
SYSTEM DATA
REAL LIFE
VISUAL BASIC/EXCELMODEL
DATA
COMPUTER
SYSTEM ANALYSIS
PROGRAMMING
MODEL VALIDATION
(Replication)
PROGRAM VERIFICATION
VISUAL BASIC/EXCELMODEL
DATA
COMPUTER
SIMULATION
MODEL VALIDATION
(Predictive)
MODEL DESIGN SIMULATION
INPUTDATA
CONCEPTUALMODEL
QUANTITATIVEMODEL
SYSTEM DATA
REAL LIFE
SYSTEM DATA
REAL LIFE
VISUAL BASIC/EXCELMODEL
DATA
COMPUTER
VISUAL BASIC/EXCELMODEL
DATA
COMPUTER
SYSTEM ANALYSIS
PROGRAMMING
MODEL VALIDATION
(Replication)
PROGRAM VERIFICATION
VISUAL BASIC/EXCELMODEL
DATA
COMPUTER
VISUAL BASIC/EXCELMODEL
DATA
COMPUTER
SIMULATION
MODEL VALIDATION
(Predictive)
MODEL DESIGN SIMULATION
Source: Syllabus-Digital Simulations A
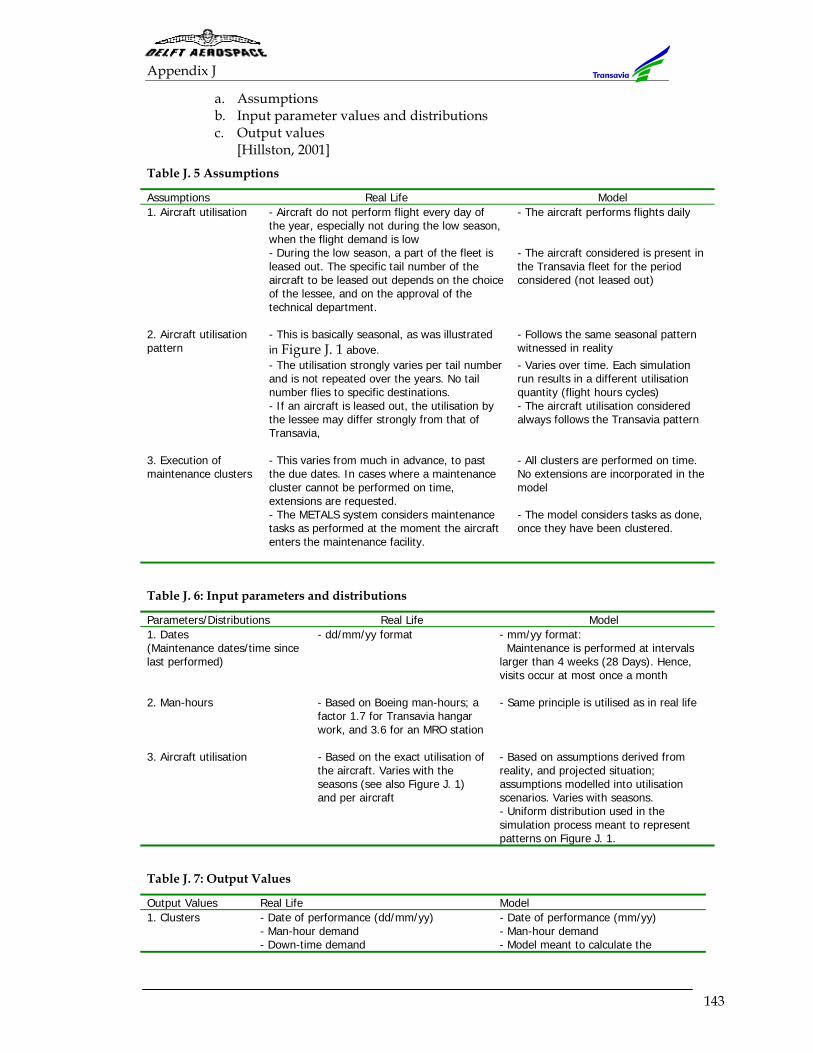
Appendix J
143
a. Assumptions b. Input parameter values and distributions c. Output values
[Hillston, 2001] Table J. 5 Assumptions
Assumptions Real Life Model 1. Aircraft utilisation - Aircraft do not perform flight every day of
the year, especially not during the low season, when the flight demand is low
- The aircraft performs flights daily
- During the low season, a part of the fleet is leased out. The specific tail number of the aircraft to be leased out depends on the choice of the lessee, and on the approval of the technical department.
- The aircraft considered is present in the Transavia fleet for the period considered (not leased out)
2. Aircraft utilisation pattern
- This is basically seasonal, as was illustrated in Figure J. 1 above.
- Follows the same seasonal pattern witnessed in reality
- The utilisation strongly varies per tail number and is not repeated over the years. No tail number flies to specific destinations.
- Varies over time. Each simulation run results in a different utilisation quantity (flight hours cycles)
- If an aircraft is leased out, the utilisation by the lessee may differ strongly from that of Transavia,
- The aircraft utilisation considered always follows the Transavia pattern
3. Execution of maintenance clusters
- This varies from much in advance, to past the due dates. In cases where a maintenance cluster cannot be performed on time, extensions are requested.
- All clusters are performed on time. No extensions are incorporated in the model
- The METALS system considers maintenance tasks as performed at the moment the aircraft enters the maintenance facility.
- The model considers tasks as done, once they have been clustered.
Table J. 6: Input parameters and distributions
Parameters/Distributions Real Life Model 1. Dates (Maintenance dates/time since last performed)
- dd/mm/yy format - mm/yy format: Maintenance is performed at intervals larger than 4 weeks (28 Days). Hence, visits occur at most once a month
2. Man-hours - Based on Boeing man-hours; a
factor 1.7 for Transavia hangar work, and 3.6 for an MRO station
- Same principle is utilised as in real life
3. Aircraft utilisation - Based on the exact utilisation of
the aircraft. Varies with the seasons (see also Figure J. 1) and per aircraft
- Based on assumptions derived from reality, and projected situation; assumptions modelled into utilisation scenarios. Varies with seasons. - Uniform distribution used in the simulation process meant to represent patterns on Figure J. 1.
Table J. 7: Output Values
Output Values Real Life Model 1. Clusters - Date of performance (dd/mm/yy) - Date of performance (mm/yy) - Man-hour demand - Man-hour demand - Down-time demand - Model meant to calculate the
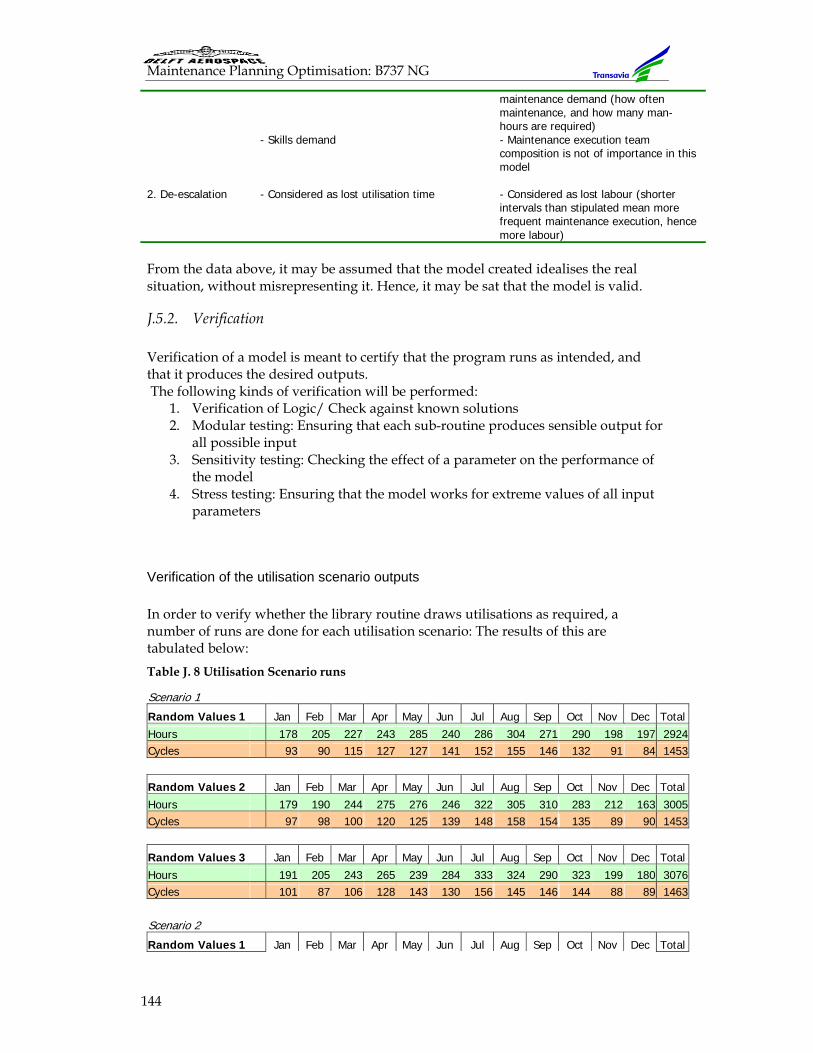
Maintenance Planning Optimisation: B737 NG
144
maintenance demand (how often maintenance, and how many man-hours are required)
- Skills demand - Maintenance execution team composition is not of importance in this model
2. De-escalation - Considered as lost utilisation time - Considered as lost labour (shorter
intervals than stipulated mean more frequent maintenance execution, hence more labour)
From the data above, it may be assumed that the model created idealises the real situation, without misrepresenting it. Hence, it may be sat that the model is valid.
J.5.2. Verification Verification of a model is meant to certify that the program runs as intended, and that it produces the desired outputs. The following kinds of verification will be performed:
1. Verification of Logic/ Check against known solutions 2. Modular testing: Ensuring that each sub-routine produces sensible output for
all possible input 3. Sensitivity testing: Checking the effect of a parameter on the performance of
the model 4. Stress testing: Ensuring that the model works for extreme values of all input
parameters
Verification of the utilisation scenario outputs In order to verify whether the library routine draws utilisations as required, a number of runs are done for each utilisation scenario: The results of this are tabulated below: Table J. 8 Utilisation Scenario runs
Scenario 1
Random Values 1 Jan Feb Mar Apr May Jun Jul Aug Sep Oct Nov Dec TotalHours 178 205 227 243 285 240 286 304 271 290 198 197 2924Cycles 93 90 115 127 127 141 152 155 146 132 91 84 1453
Random Values 2 Jan Feb Mar Apr May Jun Jul Aug Sep Oct Nov Dec Total
Hours 179 190 244 275 276 246 322 305 310 283 212 163 3005Cycles 97 98 100 120 125 139 148 158 154 135 89 90 1453
Random Values 3 Jan Feb Mar Apr May Jun Jul Aug Sep Oct Nov Dec Total
Hours 191 205 243 265 239 284 333 324 290 323 199 180 3076Cycles 101 87 106 128 143 130 156 145 146 144 88 89 1463 Scenario 2
Random Values 1 Jan Feb Mar Apr May Jun Jul Aug Sep Oct Nov Dec Total
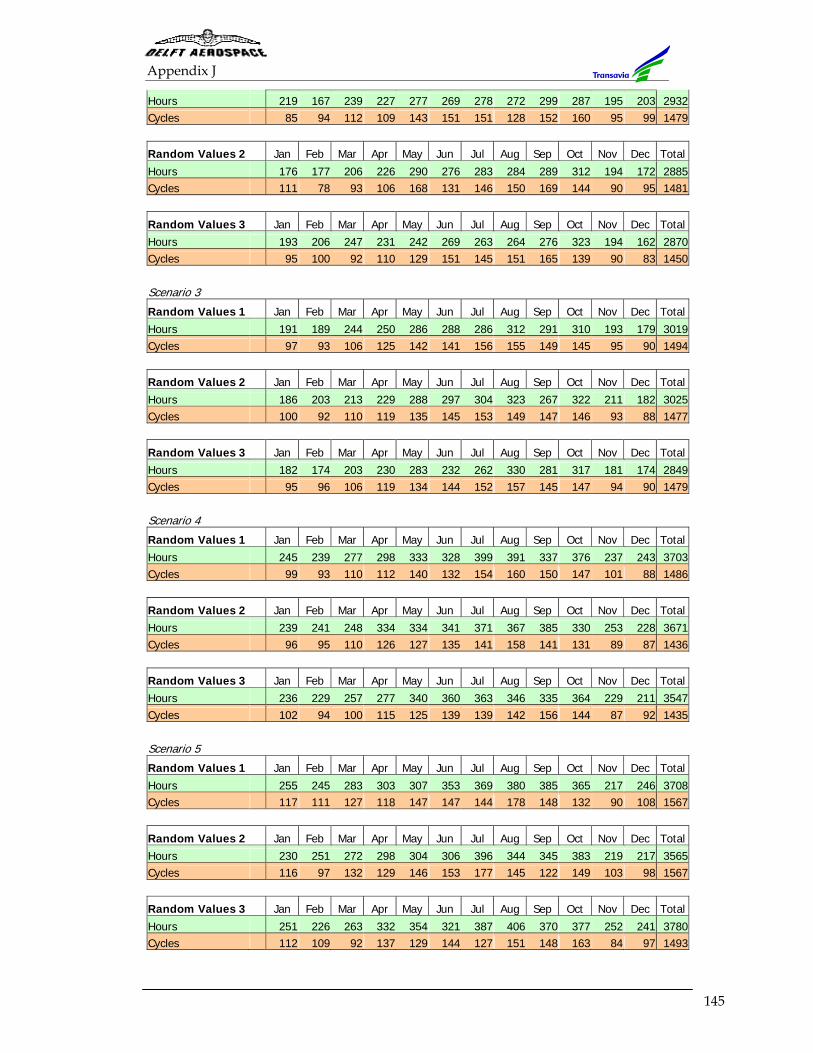
Appendix J
145
Hours 219 167 239 227 277 269 278 272 299 287 195 203 2932Cycles 85 94 112 109 143 151 151 128 152 160 95 99 1479
Random Values 2 Jan Feb Mar Apr May Jun Jul Aug Sep Oct Nov Dec Total
Hours 176 177 206 226 290 276 283 284 289 312 194 172 2885Cycles 111 78 93 106 168 131 146 150 169 144 90 95 1481
Random Values 3 Jan Feb Mar Apr May Jun Jul Aug Sep Oct Nov Dec TotalHours 193 206 247 231 242 269 263 264 276 323 194 162 2870Cycles 95 100 92 110 129 151 145 151 165 139 90 83 1450 Scenario 3
Random Values 1 Jan Feb Mar Apr May Jun Jul Aug Sep Oct Nov Dec Total
Hours 191 189 244 250 286 288 286 312 291 310 193 179 3019Cycles 97 93 106 125 142 141 156 155 149 145 95 90 1494
Random Values 2 Jan Feb Mar Apr May Jun Jul Aug Sep Oct Nov Dec Total
Hours 186 203 213 229 288 297 304 323 267 322 211 182 3025Cycles 100 92 110 119 135 145 153 149 147 146 93 88 1477
Random Values 3 Jan Feb Mar Apr May Jun Jul Aug Sep Oct Nov Dec TotalHours 182 174 203 230 283 232 262 330 281 317 181 174 2849Cycles 95 96 106 119 134 144 152 157 145 147 94 90 1479 Scenario 4
Random Values 1 Jan Feb Mar Apr May Jun Jul Aug Sep Oct Nov Dec Total
Hours 245 239 277 298 333 328 399 391 337 376 237 243 3703Cycles 99 93 110 112 140 132 154 160 150 147 101 88 1486
Random Values 2 Jan Feb Mar Apr May Jun Jul Aug Sep Oct Nov Dec TotalHours 239 241 248 334 334 341 371 367 385 330 253 228 3671Cycles 96 95 110 126 127 135 141 158 141 131 89 87 1436
Random Values 3 Jan Feb Mar Apr May Jun Jul Aug Sep Oct Nov Dec TotalHours 236 229 257 277 340 360 363 346 335 364 229 211 3547Cycles 102 94 100 115 125 139 139 142 156 144 87 92 1435 Scenario 5
Random Values 1 Jan Feb Mar Apr May Jun Jul Aug Sep Oct Nov Dec Total
Hours 255 245 283 303 307 353 369 380 385 365 217 246 3708Cycles 117 111 127 118 147 147 144 178 148 132 90 108 1567
Random Values 2 Jan Feb Mar Apr May Jun Jul Aug Sep Oct Nov Dec TotalHours 230 251 272 298 304 306 396 344 345 383 219 217 3565Cycles 116 97 132 129 146 153 177 145 122 149 103 98 1567
Random Values 3 Jan Feb Mar Apr May Jun Jul Aug Sep Oct Nov Dec Total
Hours 251 226 263 332 354 321 387 406 370 377 252 241 3780Cycles 112 109 92 137 129 144 127 151 148 163 84 97 1493
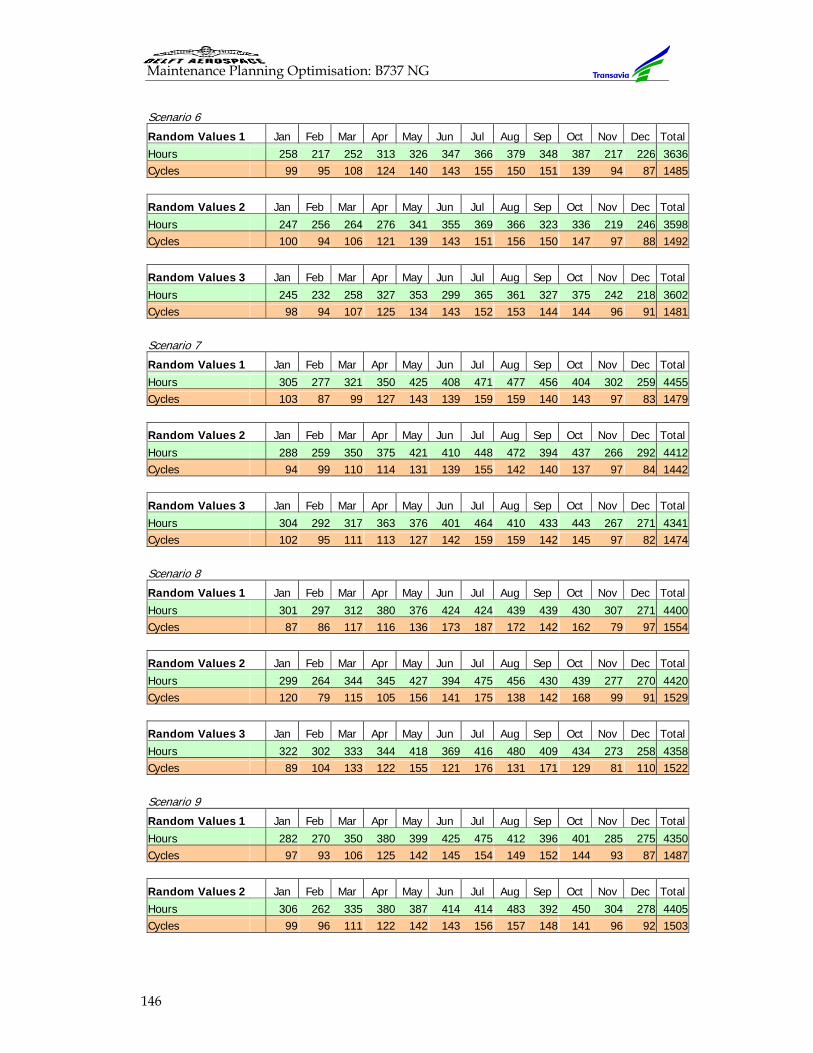
Maintenance Planning Optimisation: B737 NG
146
Scenario 6
Random Values 1 Jan Feb Mar Apr May Jun Jul Aug Sep Oct Nov Dec TotalHours 258 217 252 313 326 347 366 379 348 387 217 226 3636Cycles 99 95 108 124 140 143 155 150 151 139 94 87 1485
Random Values 2 Jan Feb Mar Apr May Jun Jul Aug Sep Oct Nov Dec Total
Hours 247 256 264 276 341 355 369 366 323 336 219 246 3598Cycles 100 94 106 121 139 143 151 156 150 147 97 88 1492
Random Values 3 Jan Feb Mar Apr May Jun Jul Aug Sep Oct Nov Dec Total
Hours 245 232 258 327 353 299 365 361 327 375 242 218 3602Cycles 98 94 107 125 134 143 152 153 144 144 96 91 1481 Scenario 7
Random Values 1 Jan Feb Mar Apr May Jun Jul Aug Sep Oct Nov Dec Total
Hours 305 277 321 350 425 408 471 477 456 404 302 259 4455Cycles 103 87 99 127 143 139 159 159 140 143 97 83 1479
Random Values 2 Jan Feb Mar Apr May Jun Jul Aug Sep Oct Nov Dec Total
Hours 288 259 350 375 421 410 448 472 394 437 266 292 4412Cycles 94 99 110 114 131 139 155 142 140 137 97 84 1442
Random Values 3 Jan Feb Mar Apr May Jun Jul Aug Sep Oct Nov Dec Total
Hours 304 292 317 363 376 401 464 410 433 443 267 271 4341Cycles 102 95 111 113 127 142 159 159 142 145 97 82 1474 Scenario 8
Random Values 1 Jan Feb Mar Apr May Jun Jul Aug Sep Oct Nov Dec Total
Hours 301 297 312 380 376 424 424 439 439 430 307 271 4400Cycles 87 86 117 116 136 173 187 172 142 162 79 97 1554
Random Values 2 Jan Feb Mar Apr May Jun Jul Aug Sep Oct Nov Dec Total
Hours 299 264 344 345 427 394 475 456 430 439 277 270 4420Cycles 120 79 115 105 156 141 175 138 142 168 99 91 1529
Random Values 3 Jan Feb Mar Apr May Jun Jul Aug Sep Oct Nov Dec Total
Hours 322 302 333 344 418 369 416 480 409 434 273 258 4358Cycles 89 104 133 122 155 121 176 131 171 129 81 110 1522 Scenario 9
Random Values 1 Jan Feb Mar Apr May Jun Jul Aug Sep Oct Nov Dec Total
Hours 282 270 350 380 399 425 475 412 396 401 285 275 4350Cycles 97 93 106 125 142 145 154 149 152 144 93 87 1487
Random Values 2 Jan Feb Mar Apr May Jun Jul Aug Sep Oct Nov Dec TotalHours 306 262 335 380 387 414 414 483 392 450 304 278 4405Cycles 99 96 111 122 142 143 156 157 148 141 96 92 1503
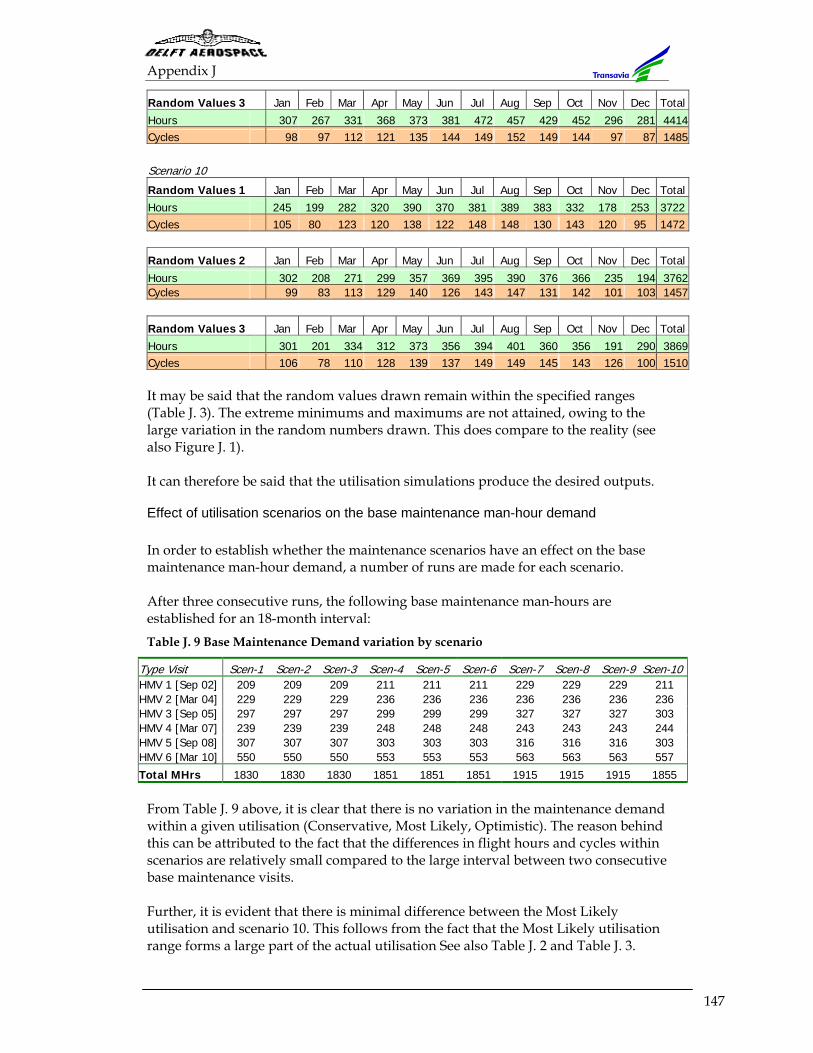
Appendix J
147
Random Values 3 Jan Feb Mar Apr May Jun Jul Aug Sep Oct Nov Dec Total
Hours 307 267 331 368 373 381 472 457 429 452 296 281 4414Cycles 98 97 112 121 135 144 149 152 149 144 97 87 1485 Scenario 10
Random Values 1 Jan Feb Mar Apr May Jun Jul Aug Sep Oct Nov Dec TotalHours 245 199 282 320 390 370 381 389 383 332 178 253 3722Cycles 105 80 123 120 138 122 148 148 130 143 120 95 1472
Random Values 2 Jan Feb Mar Apr May Jun Jul Aug Sep Oct Nov Dec Total
Hours 302 208 271 299 357 369 395 390 376 366 235 194 3762Cycles 99 83 113 129 140 126 143 147 131 142 101 103 1457
Random Values 3 Jan Feb Mar Apr May Jun Jul Aug Sep Oct Nov Dec Total
Hours 301 201 334 312 373 356 394 401 360 356 191 290 3869Cycles 106 78 110 128 139 137 149 149 145 143 126 100 1510 It may be said that the random values drawn remain within the specified ranges (Table J. 3). The extreme minimums and maximums are not attained, owing to the large variation in the random numbers drawn. This does compare to the reality (see also Figure J. 1). It can therefore be said that the utilisation simulations produce the desired outputs.
Effect of utilisation scenarios on the base maintenance man-hour demand In order to establish whether the maintenance scenarios have an effect on the base maintenance man-hour demand, a number of runs are made for each scenario. After three consecutive runs, the following base maintenance man-hours are established for an 18-month interval: Table J. 9 Base Maintenance Demand variation by scenario
Type Visit Scen-1 Scen-2 Scen-3 Scen-4 Scen-5 Scen-6 Scen-7 Scen-8 Scen-9 Scen-10HMV 1 [Sep 02] 209 209 209 211 211 211 229 229 229 211 HMV 2 [Mar 04] 229 229 229 236 236 236 236 236 236 236 HMV 3 [Sep 05] 297 297 297 299 299 299 327 327 327 303 HMV 4 [Mar 07] 239 239 239 248 248 248 243 243 243 244 HMV 5 [Sep 08] 307 307 307 303 303 303 316 316 316 303 HMV 6 [Mar 10] 550 550 550 553 553 553 563 563 563 557
Total MHrs 1830 1830 1830 1851 1851 1851 1915 1915 1915 1855 From Table J. 9 above, it is clear that there is no variation in the maintenance demand within a given utilisation (Conservative, Most Likely, Optimistic). The reason behind this can be attributed to the fact that the differences in flight hours and cycles within scenarios are relatively small compared to the large interval between two consecutive base maintenance visits. Further, it is evident that there is minimal difference between the Most Likely utilisation and scenario 10. This follows from the fact that the Most Likely utilisation range forms a large part of the actual utilisation See also Table J. 2 and Table J. 3.
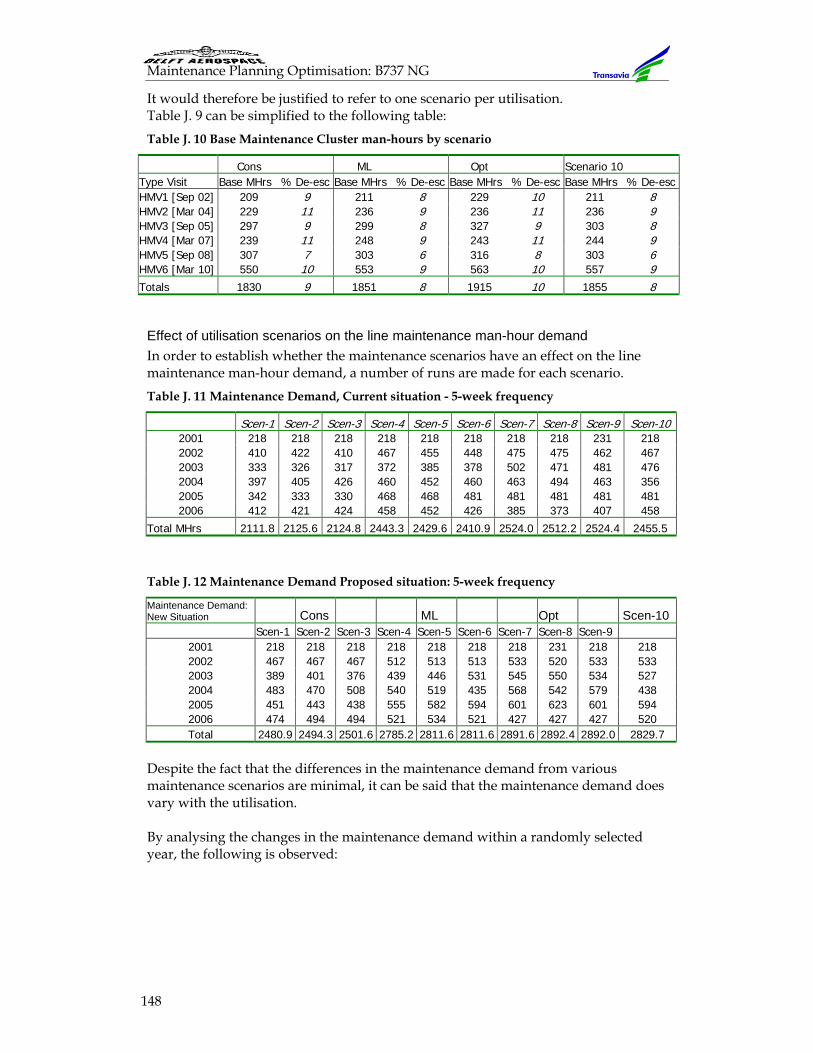
Maintenance Planning Optimisation: B737 NG
148
It would therefore be justified to refer to one scenario per utilisation. Table J. 9 can be simplified to the following table: Table J. 10 Base Maintenance Cluster man-hours by scenario
Cons ML Opt Scenario 10 Type Visit Base MHrs % De-esc Base MHrs % De-esc Base MHrs % De-esc Base MHrs % De-escHMV1 [Sep 02] 209 9 211 8 229 10 211 8 HMV2 [Mar 04] 229 11 236 9 236 11 236 9 HMV3 [Sep 05] 297 9 299 8 327 9 303 8 HMV4 [Mar 07] 239 11 248 9 243 11 244 9 HMV5 [Sep 08] 307 7 303 6 316 8 303 6 HMV6 [Mar 10] 550 10 553 9 563 10 557 9 Totals 1830 9 1851 8 1915 10 1855 8
Effect of utilisation scenarios on the line maintenance man-hour demand In order to establish whether the maintenance scenarios have an effect on the line maintenance man-hour demand, a number of runs are made for each scenario. Table J. 11 Maintenance Demand, Current situation - 5-week frequency
Scen-1 Scen-2 Scen-3 Scen-4 Scen-5 Scen-6 Scen-7 Scen-8 Scen-9 Scen-102001 218 218 218 218 218 218 218 218 231 218 2002 410 422 410 467 455 448 475 475 462 467 2003 333 326 317 372 385 378 502 471 481 476 2004 397 405 426 460 452 460 463 494 463 356 2005 342 333 330 468 468 481 481 481 481 481 2006 412 421 424 458 452 426 385 373 407 458
Total MHrs 2111.8 2125.6 2124.8 2443.3 2429.6 2410.9 2524.0 2512.2 2524.4 2455.5
Table J. 12 Maintenance Demand Proposed situation: 5-week frequency
Maintenance Demand: New Situation Cons ML Opt Scen-10 Scen-1 Scen-2 Scen-3 Scen-4 Scen-5 Scen-6 Scen-7 Scen-8 Scen-9
2001 218 218 218 218 218 218 218 231 218 218 2002 467 467 467 512 513 513 533 520 533 533 2003 389 401 376 439 446 531 545 550 534 527 2004 483 470 508 540 519 435 568 542 579 438 2005 451 443 438 555 582 594 601 623 601 594 2006 474 494 494 521 534 521 427 427 427 520 Total 2480.9 2494.3 2501.6 2785.2 2811.6 2811.6 2891.6 2892.4 2892.0 2829.7
Despite the fact that the differences in the maintenance demand from various maintenance scenarios are minimal, it can be said that the maintenance demand does vary with the utilisation. By analysing the changes in the maintenance demand within a randomly selected year, the following is observed:
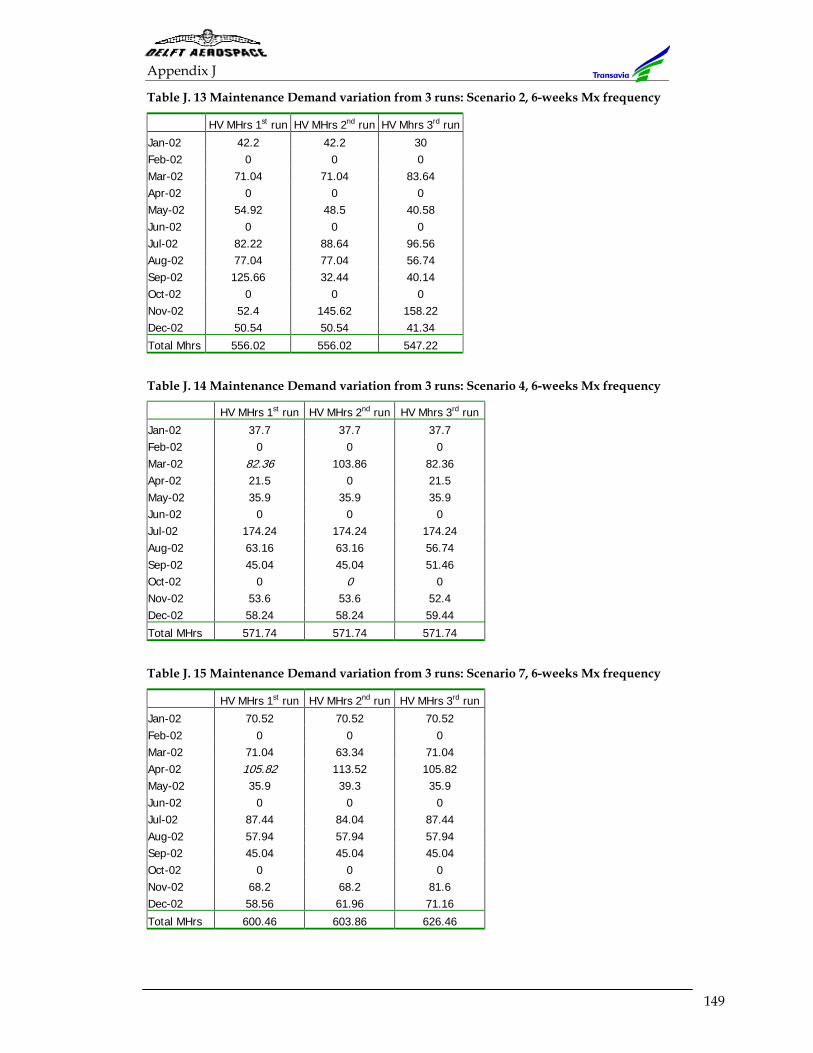
Appendix J
149
Table J. 13 Maintenance Demand variation from 3 runs: Scenario 2, 6-weeks Mx frequency
HV MHrs 1st run HV MHrs 2nd run HV Mhrs 3rd run
Jan-02 42.2 42.2 30 Feb-02 0 0 0 Mar-02 71.04 71.04 83.64 Apr-02 0 0 0 May-02 54.92 48.5 40.58 Jun-02 0 0 0 Jul-02 82.22 88.64 96.56 Aug-02 77.04 77.04 56.74 Sep-02 125.66 32.44 40.14 Oct-02 0 0 0 Nov-02 52.4 145.62 158.22 Dec-02 50.54 50.54 41.34
Total Mhrs 556.02 556.02 547.22
Table J. 14 Maintenance Demand variation from 3 runs: Scenario 4, 6-weeks Mx frequency
HV MHrs 1st run HV MHrs 2nd run HV Mhrs 3rd run
Jan-02 37.7 37.7 37.7 Feb-02 0 0 0 Mar-02 82.36 103.86 82.36 Apr-02 21.5 0 21.5 May-02 35.9 35.9 35.9 Jun-02 0 0 0 Jul-02 174.24 174.24 174.24 Aug-02 63.16 63.16 56.74 Sep-02 45.04 45.04 51.46 Oct-02 0 0 0 Nov-02 53.6 53.6 52.4 Dec-02 58.24 58.24 59.44
Total MHrs 571.74 571.74 571.74 Table J. 15 Maintenance Demand variation from 3 runs: Scenario 7, 6-weeks Mx frequency
HV MHrs 1st run HV MHrs 2nd run HV MHrs 3rd run
Jan-02 70.52 70.52 70.52 Feb-02 0 0 0 Mar-02 71.04 63.34 71.04 Apr-02 105.82 113.52 105.82 May-02 35.9 39.3 35.9 Jun-02 0 0 0 Jul-02 87.44 84.04 87.44 Aug-02 57.94 57.94 57.94 Sep-02 45.04 45.04 45.04 Oct-02 0 0 0 Nov-02 68.2 68.2 81.6 Dec-02 58.56 61.96 71.16
Total MHrs 600.46 603.86 626.46
Maintenance Planning Optimisation: B737 NG
150
Table J. 13 till Table J. 15 clearly show that no three runs will result in identical clusters all year round. However, the total maintenance demand remains more or less stable. The purpose of the simulation model was to ensure that the maintenance demand follows the aircraft utilisation, and that this varies over the years and over the selected periods (Months). The tables above indicate that this purpose is achieved. Modular Testing: Subroutines in the program include:
- The Utilisation Scenario Sub-routine (See above): The working of this sub-routine has been verified above
- The Maintenance Frequency Sub-routine: This sub-routine incorporates the maintenance frequency into the model. Its working can easily be checked, owing to the fact that the maintenance frequency is included in all outputs
- The Maintenance Mode Sub-routine: Incorporates either the current maintenance item definition or the proposed Maintenance Task Packages into the model. Its working is also easy to verify, in that either Maintenance Checks or Maintenance Task packages are listed in the model.
Sensitivity testing: The model works well when a single parameter is altered. Stress testing: Model inputs include: the maintenance frequency, the maintenance interval limits, and the aircraft utilisation. - The aircraft utilisation varies as listed in Table J. 3 above. The model behaviour
under this conditions it included in Table J. 8 above - The maintenance frequency is defined to lie between the following ranges:
Line Maintenance 4 – 7 Weeks: At a three-week frequency, the model functions inappropriately because it is designed to cluster at intervals of 4 Weeks and above. Three weeks translates to 21 days, while the model works with values above 28 days (See also: Model Validation). At an eight-week frequency, the model functions properly as pertains to the maintenance frequency sub-routine. However, this frequency leads to the violation of a number maintenance limits, hence rendering all outputs invalid Base Maintenance 18 – 24 Months: The model operates normally for all intervals. However, intervals larger than 24 months leads to the violation of a number of maintenance limits, hence rendering the outputs invalid.
- As for the maintenance interval limits, the model will calculate all limits not
lower than 28 days, 250 flight hours and 50 flight cycles. This is because it is modelled to work with the lowest maintenance interval indicated in the OMP. It will also not calculate Fight Cycle intervals exceeding 32780. The reason behind this is not clear, but it may be attributed to the program (MS Excel) itself. However, such high limits may be ignored because Transavia
Appendix J
151
does not operate airplanes with over 50,000 flight hours or 25,000 flight cycles.

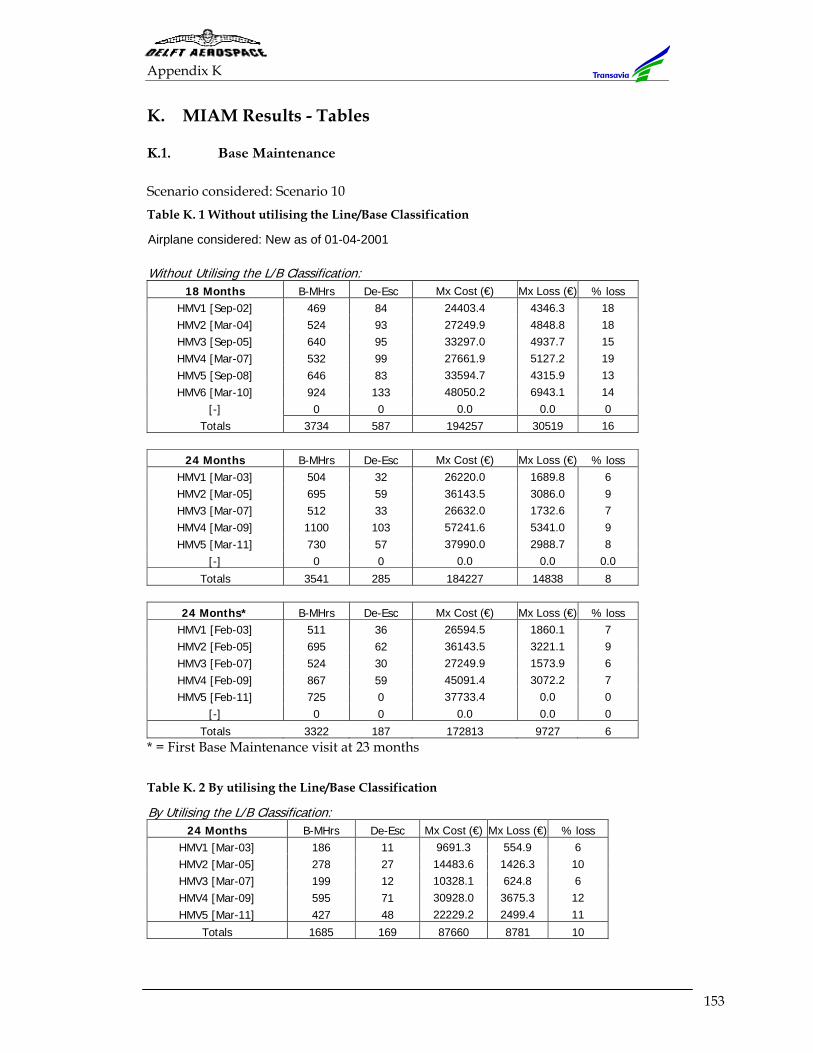
Appendix K
153
K. MIAM Results - Tables
K.1. Base Maintenance
Scenario considered: Scenario 10 Table K. 1 Without utilising the Line/Base Classification
Airplane considered: New as of 01-04-2001 Without Utilising the L/B Classification:
18 Months B-MHrs De-Esc Mx Cost (€) Mx Loss (€) % loss HMV1 [Sep-02] 469 84 24403.4 4346.3 18 HMV2 [Mar-04] 524 93 27249.9 4848.8 18 HMV3 [Sep-05] 640 95 33297.0 4937.7 15 HMV4 [Mar-07] 532 99 27661.9 5127.2 19 HMV5 [Sep-08] 646 83 33594.7 4315.9 13 HMV6 [Mar-10] 924 133 48050.2 6943.1 14
[-] 0 0 0.0 0.0 0 Totals 3734 587 194257 30519 16
24 Months B-MHrs De-Esc Mx Cost (€) Mx Loss (€) % loss
HMV1 [Mar-03] 504 32 26220.0 1689.8 6 HMV2 [Mar-05] 695 59 36143.5 3086.0 9 HMV3 [Mar-07] 512 33 26632.0 1732.6 7 HMV4 [Mar-09] 1100 103 57241.6 5341.0 9 HMV5 [Mar-11] 730 57 37990.0 2988.7 8
[-] 0 0 0.0 0.0 0.0 Totals 3541 285 184227 14838 8
24 Months* B-MHrs De-Esc Mx Cost (€) Mx Loss (€) % loss HMV1 [Feb-03] 511 36 26594.5 1860.1 7 HMV2 [Feb-05] 695 62 36143.5 3221.1 9 HMV3 [Feb-07] 524 30 27249.9 1573.9 6 HMV4 [Feb-09] 867 59 45091.4 3072.2 7 HMV5 [Feb-11] 725 0 37733.4 0.0 0
[-] 0 0 0.0 0.0 0 Totals 3322 187 172813 9727 6
* = First Base Maintenance visit at 23 months Table K. 2 By utilising the Line/Base Classification
By Utilising the L/B Classification: 24 Months B-MHrs De-Esc Mx Cost (€) Mx Loss (€) % loss
HMV1 [Mar-03] 186 11 9691.3 554.9 6 HMV2 [Mar-05] 278 27 14483.6 1426.3 10 HMV3 [Mar-07] 199 12 10328.1 624.8 6 HMV4 [Mar-09] 595 71 30928.0 3675.3 12 HMV5 [Mar-11] 427 48 22229.2 2499.4 11
Totals 1685 169 87660 8781 10
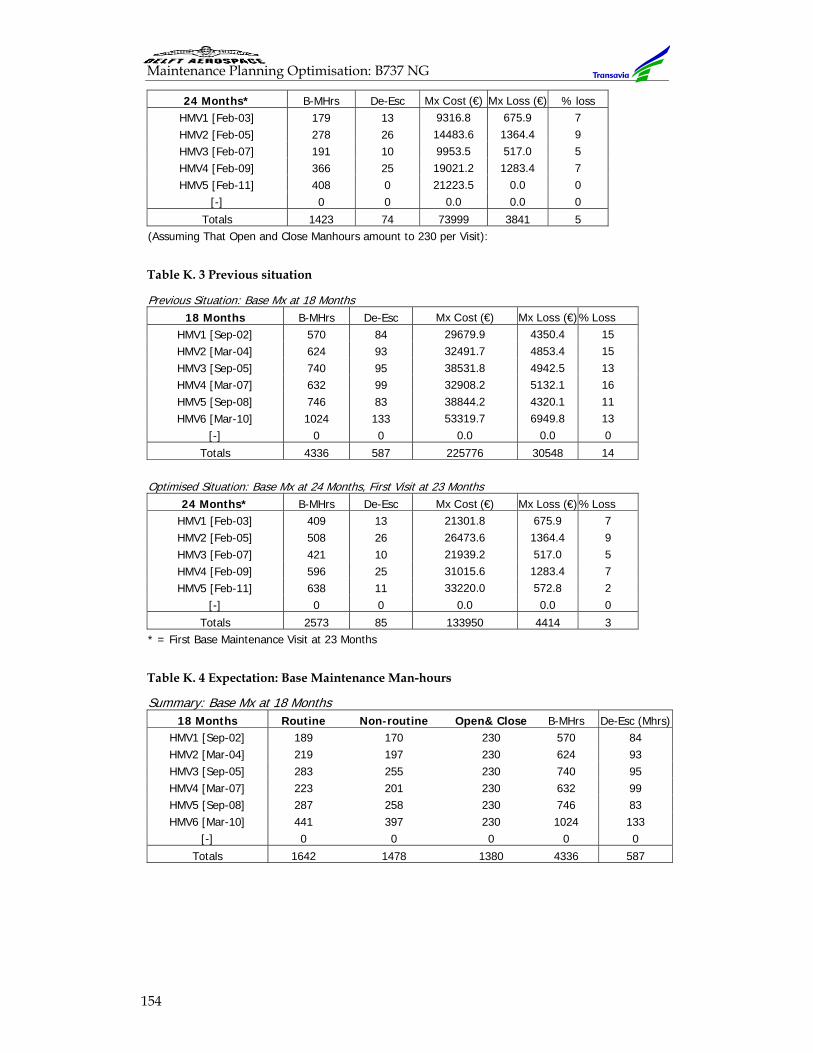
Maintenance Planning Optimisation: B737 NG
154
24 Months* B-MHrs De-Esc Mx Cost (€) Mx Loss (€) % loss HMV1 [Feb-03] 179 13 9316.8 675.9 7 HMV2 [Feb-05] 278 26 14483.6 1364.4 9 HMV3 [Feb-07] 191 10 9953.5 517.0 5 HMV4 [Feb-09] 366 25 19021.2 1283.4 7 HMV5 [Feb-11] 408 0 21223.5 0.0 0
[-] 0 0 0.0 0.0 0 Totals 1423 74 73999 3841 5
(Assuming That Open and Close Manhours amount to 230 per Visit): Table K. 3 Previous situation
Previous Situation: Base Mx at 18 Months 18 Months B-MHrs De-Esc Mx Cost (€) Mx Loss (€) % Loss
HMV1 [Sep-02] 570 84 29679.9 4350.4 15 HMV2 [Mar-04] 624 93 32491.7 4853.4 15 HMV3 [Sep-05] 740 95 38531.8 4942.5 13 HMV4 [Mar-07] 632 99 32908.2 5132.1 16 HMV5 [Sep-08] 746 83 38844.2 4320.1 11 HMV6 [Mar-10] 1024 133 53319.7 6949.8 13
[-] 0 0 0.0 0.0 0 Totals 4336 587 225776 30548 14
Optimised Situation: Base Mx at 24 Months, First Visit at 23 Months
24 Months* B-MHrs De-Esc Mx Cost (€) Mx Loss (€) % Loss HMV1 [Feb-03] 409 13 21301.8 675.9 7 HMV2 [Feb-05] 508 26 26473.6 1364.4 9 HMV3 [Feb-07] 421 10 21939.2 517.0 5 HMV4 [Feb-09] 596 25 31015.6 1283.4 7 HMV5 [Feb-11] 638 11 33220.0 572.8 2
[-] 0 0 0.0 0.0 0 Totals 2573 85 133950 4414 3
* = First Base Maintenance Visit at 23 Months Table K. 4 Expectation: Base Maintenance Man-hours
Summary: Base Mx at 18 Months 18 Months Routine Non-routine Open& Close B-MHrs De-Esc (Mhrs)
HMV1 [Sep-02] 189 170 230 570 84 HMV2 [Mar-04] 219 197 230 624 93 HMV3 [Sep-05] 283 255 230 740 95 HMV4 [Mar-07] 223 201 230 632 99 HMV5 [Sep-08] 287 258 230 746 83 HMV6 [Mar-10] 441 397 230 1024 133
[-] 0 0 0 0 0
Totals 1642 1478 1380 4336 587
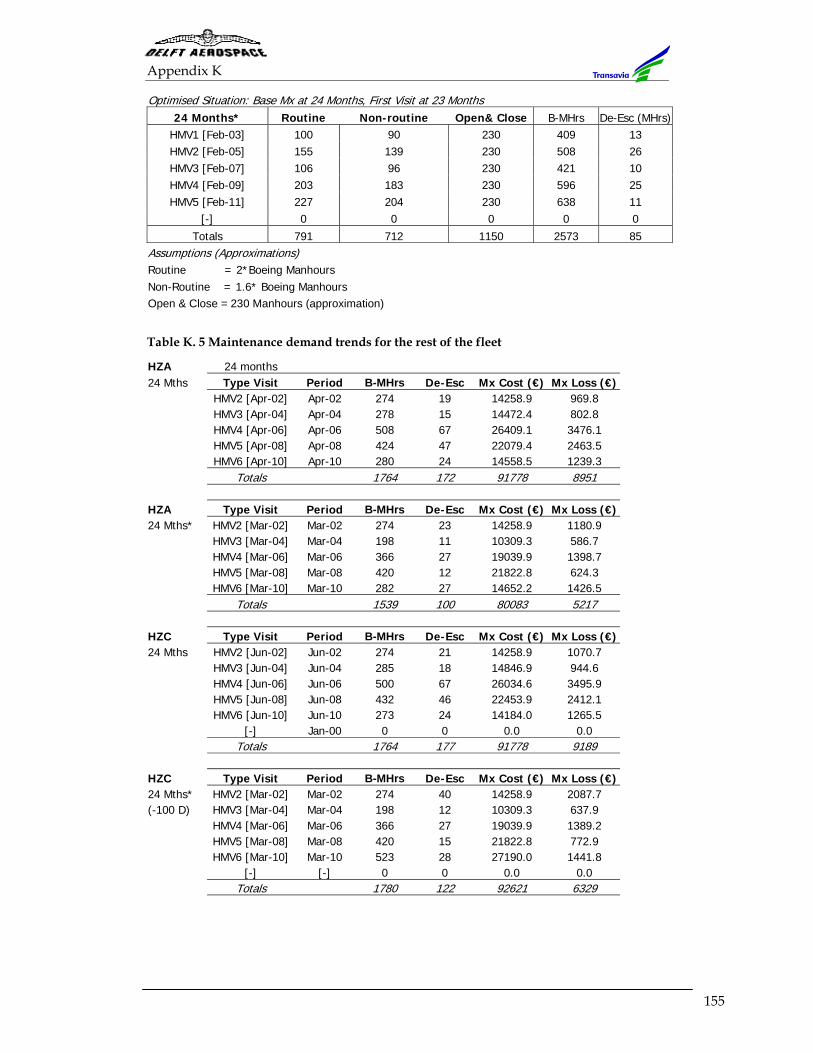
Appendix K
155
Optimised Situation: Base Mx at 24 Months, First Visit at 23 Months
24 Months* Routine Non-routine Open& Close B-MHrs De-Esc (MHrs)HMV1 [Feb-03] 100 90 230 409 13 HMV2 [Feb-05] 155 139 230 508 26 HMV3 [Feb-07] 106 96 230 421 10 HMV4 [Feb-09] 203 183 230 596 25 HMV5 [Feb-11] 227 204 230 638 11
[-] 0 0 0 0 0
Totals 791 712 1150 2573 85 Assumptions (Approximations) Routine = 2*Boeing Manhours Non-Routine = 1.6* Boeing Manhours Open & Close = 230 Manhours (approximation) Table K. 5 Maintenance demand trends for the rest of the fleet
HZA 24 months 24 Mths Type Visit Period B-MHrs De-Esc Mx Cost (€) Mx Loss (€) HMV2 [Apr-02] Apr-02 274 19 14258.9 969.8 HMV3 [Apr-04] Apr-04 278 15 14472.4 802.8 HMV4 [Apr-06] Apr-06 508 67 26409.1 3476.1 HMV5 [Apr-08] Apr-08 424 47 22079.4 2463.5 HMV6 [Apr-10] Apr-10 280 24 14558.5 1239.3 Totals 1764 172 91778 8951 HZA Type Visit Period B-MHrs De-Esc Mx Cost (€) Mx Loss (€) 24 Mths* HMV2 [Mar-02] Mar-02 274 23 14258.9 1180.9 HMV3 [Mar-04] Mar-04 198 11 10309.3 586.7 HMV4 [Mar-06] Mar-06 366 27 19039.9 1398.7 HMV5 [Mar-08] Mar-08 420 12 21822.8 624.3 HMV6 [Mar-10] Mar-10 282 27 14652.2 1426.5 Totals 1539 100 80083 5217 HZC Type Visit Period B-MHrs De-Esc Mx Cost (€) Mx Loss (€) 24 Mths HMV2 [Jun-02] Jun-02 274 21 14258.9 1070.7 HMV3 [Jun-04] Jun-04 285 18 14846.9 944.6 HMV4 [Jun-06] Jun-06 500 67 26034.6 3495.9 HMV5 [Jun-08] Jun-08 432 46 22453.9 2412.1 HMV6 [Jun-10] Jun-10 273 24 14184.0 1265.5 [-] Jan-00 0 0 0.0 0.0 Totals 1764 177 91778 9189 HZC Type Visit Period B-MHrs De-Esc Mx Cost (€) Mx Loss (€) 24 Mths* HMV2 [Mar-02] Mar-02 274 40 14258.9 2087.7 (-100 D) HMV3 [Mar-04] Mar-04 198 12 10309.3 637.9 HMV4 [Mar-06] Mar-06 366 27 19039.9 1389.2 HMV5 [Mar-08] Mar-08 420 15 21822.8 772.9 HMV6 [Mar-10] Mar-10 523 28 27190.0 1441.8 [-] [-] 0 0 0.0 0.0 Totals 1780 122 92621 6329
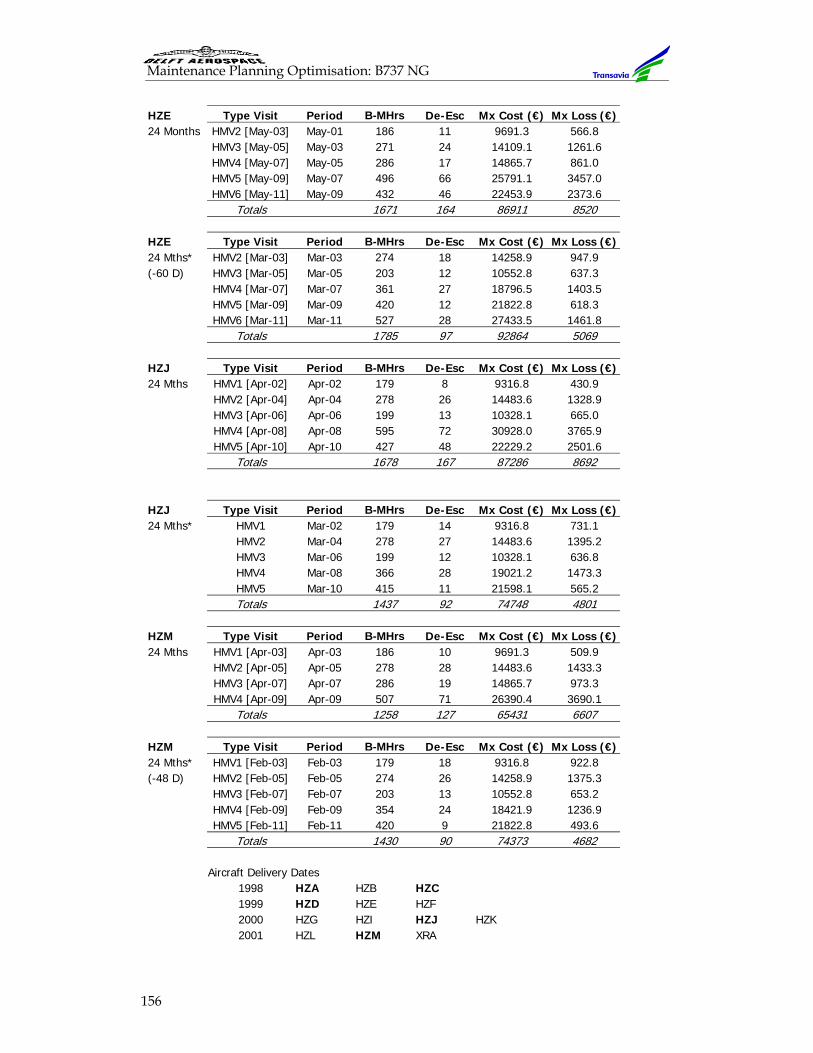
Maintenance Planning Optimisation: B737 NG
156
HZE Type Visit Period B-MHrs De-Esc Mx Cost (€) Mx Loss (€) 24 Months HMV2 [May-03] May-01 186 11 9691.3 566.8 HMV3 [May-05] May-03 271 24 14109.1 1261.6 HMV4 [May-07] May-05 286 17 14865.7 861.0 HMV5 [May-09] May-07 496 66 25791.1 3457.0 HMV6 [May-11] May-09 432 46 22453.9 2373.6 Totals 1671 164 86911 8520 HZE Type Visit Period B-MHrs De-Esc Mx Cost (€) Mx Loss (€) 24 Mths* HMV2 [Mar-03] Mar-03 274 18 14258.9 947.9 (-60 D) HMV3 [Mar-05] Mar-05 203 12 10552.8 637.3 HMV4 [Mar-07] Mar-07 361 27 18796.5 1403.5 HMV5 [Mar-09] Mar-09 420 12 21822.8 618.3 HMV6 [Mar-11] Mar-11 527 28 27433.5 1461.8 Totals 1785 97 92864 5069 HZJ Type Visit Period B-MHrs De-Esc Mx Cost (€) Mx Loss (€) 24 Mths HMV1 [Apr-02] Apr-02 179 8 9316.8 430.9 HMV2 [Apr-04] Apr-04 278 26 14483.6 1328.9 HMV3 [Apr-06] Apr-06 199 13 10328.1 665.0 HMV4 [Apr-08] Apr-08 595 72 30928.0 3765.9 HMV5 [Apr-10] Apr-10 427 48 22229.2 2501.6 Totals 1678 167 87286 8692 HZJ Type Visit Period B-MHrs De-Esc Mx Cost (€) Mx Loss (€) 24 Mths* HMV1 Mar-02 179 14 9316.8 731.1 HMV2 Mar-04 278 27 14483.6 1395.2 HMV3 Mar-06 199 12 10328.1 636.8 HMV4 Mar-08 366 28 19021.2 1473.3 HMV5 Mar-10 415 11 21598.1 565.2 Totals 1437 92 74748 4801 HZM Type Visit Period B-MHrs De-Esc Mx Cost (€) Mx Loss (€) 24 Mths HMV1 [Apr-03] Apr-03 186 10 9691.3 509.9 HMV2 [Apr-05] Apr-05 278 28 14483.6 1433.3 HMV3 [Apr-07] Apr-07 286 19 14865.7 973.3 HMV4 [Apr-09] Apr-09 507 71 26390.4 3690.1 Totals 1258 127 65431 6607 HZM Type Visit Period B-MHrs De-Esc Mx Cost (€) Mx Loss (€) 24 Mths* HMV1 [Feb-03] Feb-03 179 18 9316.8 922.8 (-48 D) HMV2 [Feb-05] Feb-05 274 26 14258.9 1375.3 HMV3 [Feb-07] Feb-07 203 13 10552.8 653.2 HMV4 [Feb-09] Feb-09 354 24 18421.9 1236.9 HMV5 [Feb-11] Feb-11 420 9 21822.8 493.6 Totals 1430 90 74373 4682 Aircraft Delivery Dates 1998 HZA HZB HZC 1999 HZD HZE HZF 2000 HZG HZI HZJ HZK 2001 HZL HZM XRA
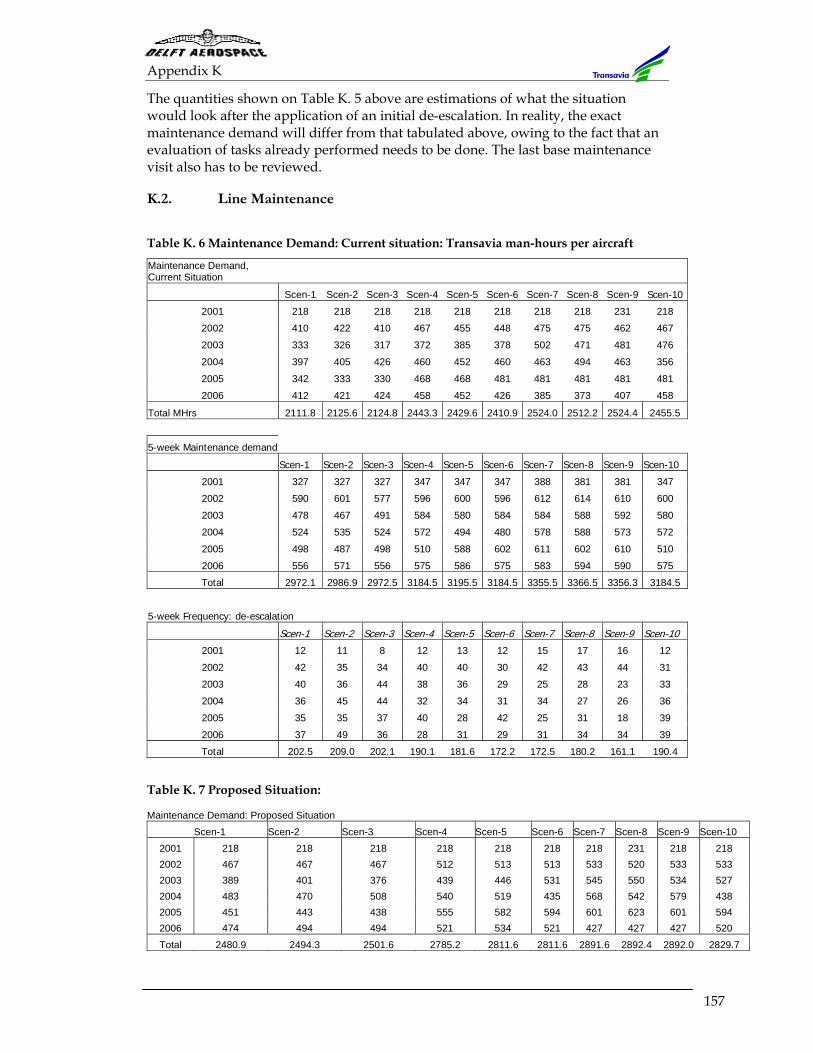
Appendix K
157
The quantities shown on Table K. 5 above are estimations of what the situation would look after the application of an initial de-escalation. In reality, the exact maintenance demand will differ from that tabulated above, owing to the fact that an evaluation of tasks already performed needs to be done. The last base maintenance visit also has to be reviewed.
K.2. Line Maintenance
Table K. 6 Maintenance Demand: Current situation: Transavia man-hours per aircraft
Maintenance Demand, Current Situation
Scen-1 Scen-2 Scen-3 Scen-4 Scen-5 Scen-6 Scen-7 Scen-8 Scen-9 Scen-10
2001 218 218 218 218 218 218 218 218 231 218
2002 410 422 410 467 455 448 475 475 462 467
2003 333 326 317 372 385 378 502 471 481 476
2004 397 405 426 460 452 460 463 494 463 356
2005 342 333 330 468 468 481 481 481 481 481
2006 412 421 424 458 452 426 385 373 407 458
Total MHrs 2111.8 2125.6 2124.8 2443.3 2429.6 2410.9 2524.0 2512.2 2524.4 2455.5 5-week Maintenance demand
Scen-1 Scen-2 Scen-3 Scen-4 Scen-5 Scen-6 Scen-7 Scen-8 Scen-9 Scen-10
2001 327 327 327 347 347 347 388 381 381 347
2002 590 601 577 596 600 596 612 614 610 600
2003 478 467 491 584 580 584 584 588 592 580
2004 524 535 524 572 494 480 578 588 573 572
2005 498 487 498 510 588 602 611 602 610 510
2006 556 571 556 575 586 575 583 594 590 575
Total 2972.1 2986.9 2972.5 3184.5 3195.5 3184.5 3355.5 3366.5 3356.3 3184.5
5-week Frequency: de-escalation Scen-1 Scen-2 Scen-3 Scen-4 Scen-5 Scen-6 Scen-7 Scen-8 Scen-9 Scen-10
2001 12 11 8 12 13 12 15 17 16 12
2002 42 35 34 40 40 30 42 43 44 31
2003 40 36 44 38 36 29 25 28 23 33
2004 36 45 44 32 34 31 34 27 26 36
2005 35 35 37 40 28 42 25 31 18 39
2006 37 49 36 28 31 29 31 34 34 39
Total 202.5 209.0 202.1 190.1 181.6 172.2 172.5 180.2 161.1 190.4
Table K. 7 Proposed Situation:
Maintenance Demand: Proposed Situation Scen-1 Scen-2 Scen-3 Scen-4 Scen-5 Scen-6 Scen-7 Scen-8 Scen-9 Scen-10
2001 218 218 218 218 218 218 218 231 218 218 2002 467 467 467 512 513 513 533 520 533 533 2003 389 401 376 439 446 531 545 550 534 527 2004 483 470 508 540 519 435 568 542 579 438 2005 451 443 438 555 582 594 601 623 601 594 2006 474 494 494 521 534 521 427 427 427 520 Total 2480.9 2494.3 2501.6 2785.2 2811.6 2811.6 2891.6 2892.4 2892.0 2829.7
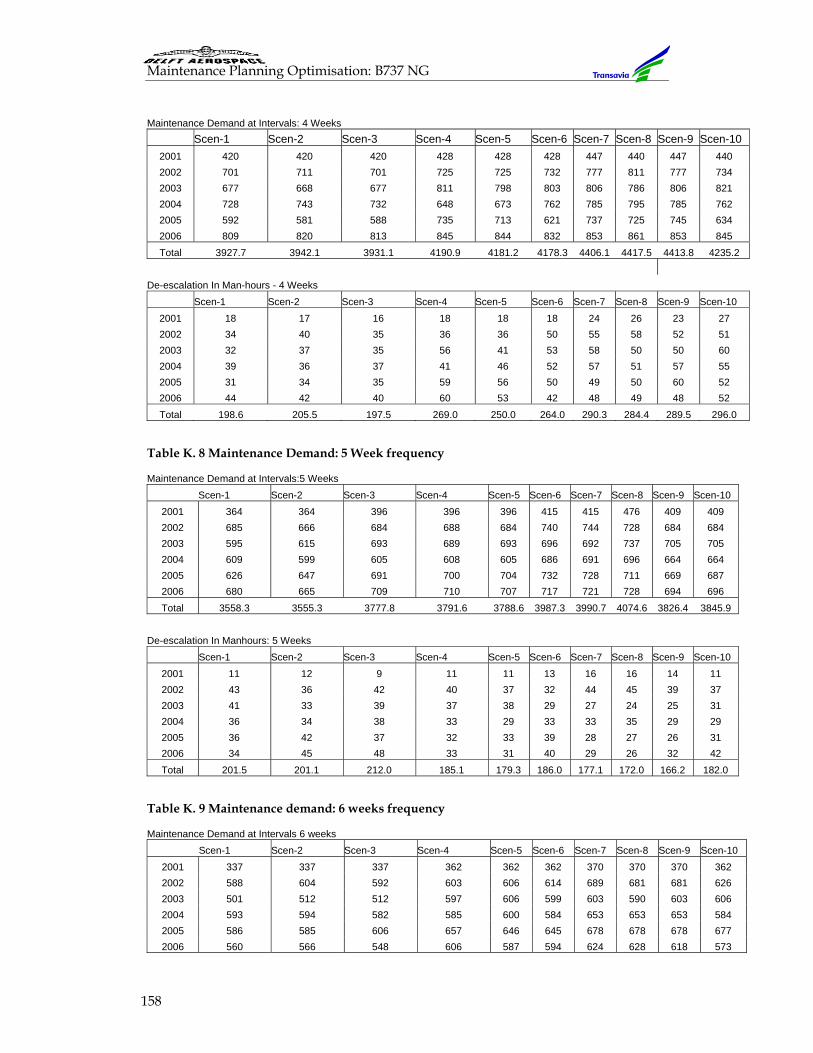
Maintenance Planning Optimisation: B737 NG
158
Maintenance Demand at Intervals: 4 Weeks Scen-1 Scen-2 Scen-3 Scen-4 Scen-5 Scen-6 Scen-7 Scen-8 Scen-9 Scen-10
2001 420 420 420 428 428 428 447 440 447 440 2002 701 711 701 725 725 732 777 811 777 734 2003 677 668 677 811 798 803 806 786 806 821 2004 728 743 732 648 673 762 785 795 785 762 2005 592 581 588 735 713 621 737 725 745 634 2006 809 820 813 845 844 832 853 861 853 845 Total 3927.7 3942.1 3931.1 4190.9 4181.2 4178.3 4406.1 4417.5 4413.8 4235.2
De-escalation In Man-hours - 4 Weeks Scen-1 Scen-2 Scen-3 Scen-4 Scen-5 Scen-6 Scen-7 Scen-8 Scen-9 Scen-10
2001 18 17 16 18 18 18 24 26 23 27 2002 34 40 35 36 36 50 55 58 52 51 2003 32 37 35 56 41 53 58 50 50 60 2004 39 36 37 41 46 52 57 51 57 55 2005 31 34 35 59 56 50 49 50 60 52 2006 44 42 40 60 53 42 48 49 48 52 Total 198.6 205.5 197.5 269.0 250.0 264.0 290.3 284.4 289.5 296.0
Table K. 8 Maintenance Demand: 5 Week frequency
Maintenance Demand at Intervals:5 Weeks Scen-1 Scen-2 Scen-3 Scen-4 Scen-5 Scen-6 Scen-7 Scen-8 Scen-9 Scen-10
2001 364 364 396 396 396 415 415 476 409 409 2002 685 666 684 688 684 740 744 728 684 684 2003 595 615 693 689 693 696 692 737 705 705 2004 609 599 605 608 605 686 691 696 664 664 2005 626 647 691 700 704 732 728 711 669 687 2006 680 665 709 710 707 717 721 728 694 696 Total 3558.3 3555.3 3777.8 3791.6 3788.6 3987.3 3990.7 4074.6 3826.4 3845.9
De-escalation In Manhours: 5 Weeks Scen-1 Scen-2 Scen-3 Scen-4 Scen-5 Scen-6 Scen-7 Scen-8 Scen-9 Scen-10
2001 11 12 9 11 11 13 16 16 14 11 2002 43 36 42 40 37 32 44 45 39 37 2003 41 33 39 37 38 29 27 24 25 31 2004 36 34 38 33 29 33 33 35 29 29 2005 36 42 37 32 33 39 28 27 26 31 2006 34 45 48 33 31 40 29 26 32 42 Total 201.5 201.1 212.0 185.1 179.3 186.0 177.1 172.0 166.2 182.0
Table K. 9 Maintenance demand: 6 weeks frequency
Maintenance Demand at Intervals 6 weeks Scen-1 Scen-2 Scen-3 Scen-4 Scen-5 Scen-6 Scen-7 Scen-8 Scen-9 Scen-10
2001 337 337 337 362 362 362 370 370 370 362 2002 588 604 592 603 606 614 689 681 681 626 2003 501 512 512 597 606 599 603 590 603 606 2004 593 594 582 585 600 584 653 653 653 584 2005 586 585 606 657 646 645 678 678 678 677 2006 560 566 548 606 587 594 624 628 618 573
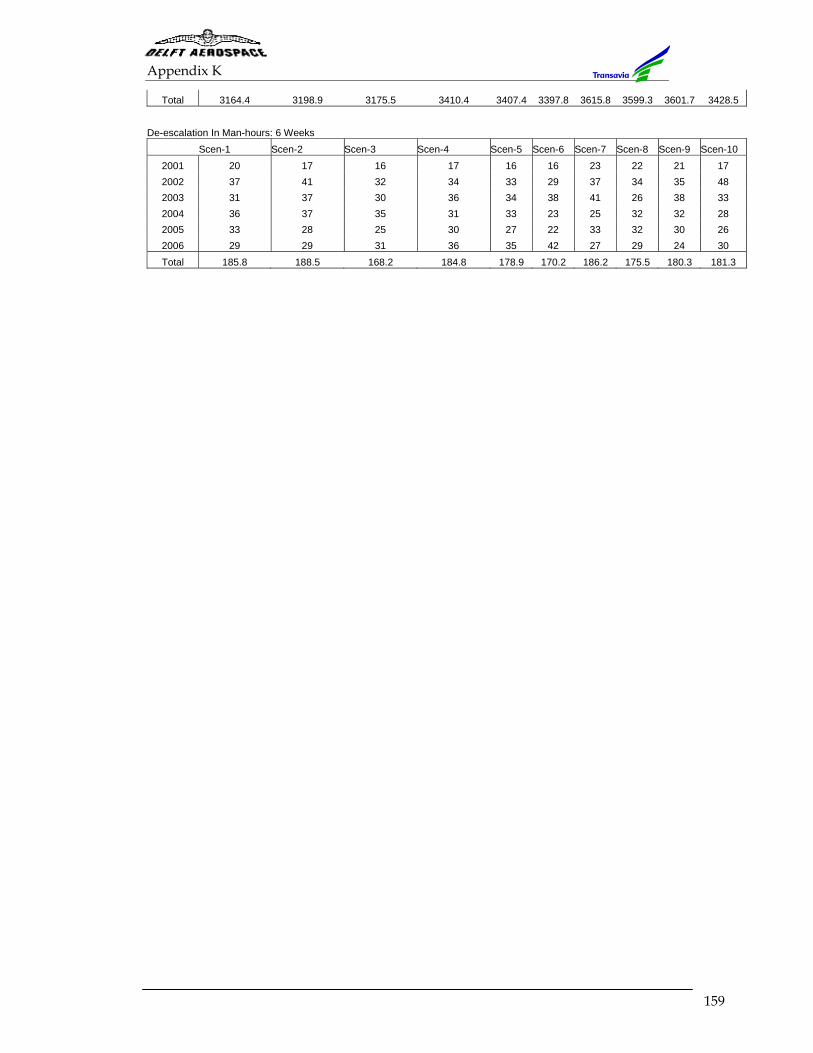
Appendix K
159
Total 3164.4 3198.9 3175.5 3410.4 3407.4 3397.8 3615.8 3599.3 3601.7 3428.5 De-escalation In Man-hours: 6 Weeks Scen-1 Scen-2 Scen-3 Scen-4 Scen-5 Scen-6 Scen-7 Scen-8 Scen-9 Scen-10
2001 20 17 16 17 16 16 23 22 21 17 2002 37 41 32 34 33 29 37 34 35 48 2003 31 37 30 36 34 38 41 26 38 33 2004 36 37 35 31 33 23 25 32 32 28 2005 33 28 25 30 27 22 33 32 30 26 2006 29 29 31 36 35 42 27 29 24 30 Total 185.8 188.5 168.2 184.8 178.9 170.2 186.2 175.5 180.3 181.3

Appendix L
161
L. Appendix L