Embed Size (px)
Citation preview
molecules
Article
Microbial Synthesis of Non-NaturalAnthraquinone Glucosides DisplayingSuperior Antiproliferative Properties
Trang Thi Huyen Nguyen 1,†, Ramesh Prasad Pandey 1,2,† ID , Prakash Parajuli 1 ID , Jang Mi Han 1,Hye Jin Jung 1,2, Yong Il Park 3 and Jae Kyung Sohng 1,2,* ID
1 Department of Life Science and Biochemical Engineering, Sun Moon University, 70 Sunmoon-ro 221,Tangjeong-myeon, Asan-si, Chungnam 31460, Korea; [email protected] (T.T.H.N.);[email protected] (R.P.P.); [email protected] (P.P.); [email protected] (J.M.H.);[email protected] (H.J.J.)
2 Department of BT-Convergent Pharmaceutical Engineering, Sun Moon University, 70 Sunmoon-ro 221,Tangjeong-myeon, Asan-si, Chungnam 31460, Korea
3 Department of Biotechnology, The Catholic University of Korea, Bucheon, Gyeonggi-do 14662, Korea;[email protected]
* Correspondence: [email protected]; Tel: +82-(41)-530-2246; Fax: +82-(41)-530-8229† These authors contributed equally to this work.
Received: 17 July 2018; Accepted: 21 August 2018; Published: 28 August 2018�����������������
Abstract: Anthraquinones, naturally occurring bioactive compounds, have been reported to exhibitvarious biological activities, including anti-inflammatory, antiviral, antimicrobial, and anticancereffects. In this study, we biotransformed three selected anthraquinones into their novel O-glucosidederivatives, expressing a versatile glycosyltransferase (YjiC) from Bacillus licheniformis DSM13 in Escherichia coli. Anthraflavic acid, alizarin, and 2-amino-3-hydroxyanthraquinone wereexogenously fed to recombinant E. coli as substrate for biotransformation. The products anthraflavicacid-O-glucoside, alizarin 2-O-β-D-glucoside, and 2-amino-3-O-glucosyl anthraquinone producedin the culture broths were characterized by various chromatographic and spectroscopic analyses.The comparative anti-proliferative assay against various cancer cells (gastric cancer-AGS, uterinecervical cancer-HeLa, and liver cancer-HepG2) were remarkable, since the synthesized glucosidecompounds showed more than 60% of cell growth inhibition at concentrations ranging from ~50 µMto 100 µM. Importantly, one of the synthesized glucoside derivatives, alizarin 2-O-glucoside inhibitedmore than 90% of cell growth in all the cancer cell lines tested.
Keywords: anti-cancer agents; anthraquinones; glycosyltransferase
1. Introduction
Anthraquinones are naturally occurring phenolic compounds based on the 9,10-anthraquinoneskeleton. They are widely available from plants, microbes, fungi, and lichens [1]. Anthraquinoneshave various biological benefits [2,3]. Anthraquinones of the Rubiaceae family exhibit interestingin vivo biological activities such as antimicrobial [4], antifungal [5], hypotensive and analgesic [6],anti-malarial [7], anti-oxidant [8], antileukemic, and mutagenic functions [9]. Several anthraquinonesare widely used in the treatment of cancer. They display cytotoxic activities through interaction withDNA, preferentially at guanine/cytosine-rich sites [10]. Emodin was studied as an agent that couldreduce the impact of type 2 diabetes [11] and could inhibit human cytomegalovirus development [12].Aloe emodin has strong stimulant-laxative action [13] and is found in the gel, soap or leaves of Aloe veraand the rhizome of rhubarb (Rheum rhaponticum). Chrysazin (known as Dantron) is mainly used in
Molecules 2018, 23, 2171; doi:10.3390/molecules23092171 www.mdpi.com/journal/molecules
Molecules 2018, 23, 2171 2 of 13
palliative care to counteract the constipating effects of opioids [14]. Quinizarin is an inexpensivedye used to color gasoline and heating oil [15]. It is also used as an intermediate for the synthesis ofindanthrene- and alizarin-derived dyes. Alizarin has been used as a prominent red dye, principallyfor dyeing textile fabrics. Anthraquinone glycosides upon hydrolysis yield the aglycone, which isusually a di-, tri- or tetrahydroxyanthraquinone or a derivative of these compounds. While freeanthraquinone aglycones exhibit therapeutic activity, glycosides that enhance solubility are acceptedas key active components with various pharmacological actions such as antileukemic, antiseptic,anti-cancer, and antitumor activity [16,17].
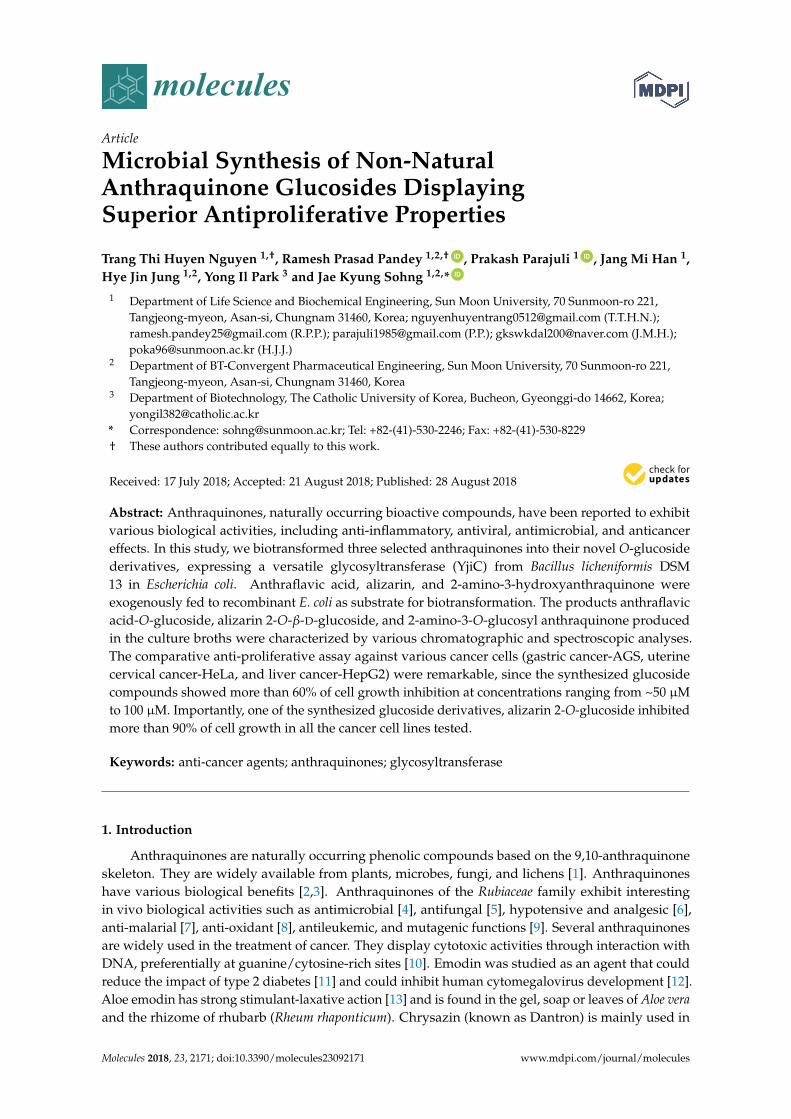
Recently, the synthesis of anthraquinone derivatives has attracted significant interest. Varioussynthesis methods have been reported, the most common of which is the intramolecular condensationof aryl and O-arylbenzoic acids, using fuming sulfuric acid, benzoyl chloride, concentrated sulfuricacid, benzoyl chloride, zinc chloride, and POCl3/P2O3Cl4 as catalyst, which produces anthraquinonederivatives [18]. Anthraquinone and its associated derivatives were previously synthesized by achemical pathway, although this method was expensive and involved several hurdles [19]. This reportis based on the utilization of indigenous E. coli sugar (uridine diphosphate (UDP)-glucose) as asugar donor which will be utilized by the glycosyltransferase to conjugate to different anthraquionederivatives. This process is inexpensive and environmentally friendly. We designed a schemeto consider wild type E. coli BL21 (DE3) strain. We then expressed glycosyltransferases fromBacillus licheniformis DSM13 (YjiC) and biotransformed three anthraquionones into their respectiveglucosides (Figure 1). The anticancer activities of all derivatives were assessed and the results weresignificant compared with those of the corresponding aglycones.
Molecules 2018, 23, x FOR PEER REVIEW 2 of 14
found in the gel, soap or leaves of Aloe vera and the rhizome of rhubarb (Rheum rhaponticum). Chrysazin (known as Dantron) is mainly used in palliative care to counteract the constipating effects of opioids [14]. Quinizarin is an inexpensive dye used to color gasoline and heating oil [15]. It is also used as an intermediate for the synthesis of indanthrene- and alizarin-derived dyes. Alizarin has been used as a prominent red dye, principally for dyeing textile fabrics. Anthraquinone glycosides upon hydrolysis yield the aglycone, which is usually a di-, tri- or tetrahydroxyanthraquinone or a derivative of these compounds. While free anthraquinone aglycones exhibit therapeutic activity, glycosides that enhance solubility are accepted as key active components with various pharmacological actions such as antileukemic, antiseptic, anti-cancer, and antitumor activity [16,17].
Recently, the synthesis of anthraquinone derivatives has attracted significant interest. Various synthesis methods have been reported, the most common of which is the intramolecular condensation of aryl and O-arylbenzoic acids, using fuming sulfuric acid, benzoyl chloride, concentrated sulfuric acid, benzoyl chloride, zinc chloride, and POCl3/P2O3Cl4 as catalyst, which produces anthraquinone derivatives [18]. Anthraquinone and its associated derivatives were previously synthesized by a chemical pathway, although this method was expensive and involved several hurdles [19]. This report is based on the utilization of indigenous E. coli sugar (uridine diphosphate (UDP)-glucose) as a sugar donor which will be utilized by the glycosyltransferase to conjugate to different anthraquione derivatives. This process is inexpensive and environmentally friendly. We designed a scheme to consider wild type E. coli BL21 (DE3) strain. We then expressed glycosyltransferases from Bacillus licheniformis DSM13 (YjiC) and biotransformed three anthraquionones into their respective glucosides (Figure 1). The anticancer activities of all derivatives were assessed and the results were significant compared with those of the corresponding aglycones.
Figure 1. Scheme showing pathway and utilizing Escherichia coli indigenous UDP-glucose by Bacillus glycosyltransferase for modification of selected anthraquinones into respective glucosides.
Figure 1. Scheme showing pathway and utilizing Escherichia coli indigenous UDP-glucose by Bacillusglycosyltransferase for modification of selected anthraquinones into respective glucosides.
2. Results
2.1. Biotransformation of Anthraquinones
The approach was to biosynthesize anthraquinone glucoside utilizing E. coli indigenousUDP-glucose as a sugar donor to the expressing glycosyltransefrase (Figure 1). Cultures were preparedfor biotransformation reactions with recombinant strain expressing pET28a-YjiC, as explained in the
Molecules 2018, 23, 2171 3 of 13
Materials and Methods section. Three anthraquinones: 2-amino-3-hydroxyanthraquinone, anthraflavicacid, and alizarin were chosen for biotransformation.
Anthraquinones were supplied exogenously to each flask of E. coli BL21 (DE3) harboringpET28a-YjiC culture after 20 h of IPTG induction at a final concentration of 0.2 mM. Cultures wereallowed to undergo biotransformation for up to 60 h and were then harvested using a double volume ofethyl acetate and analyzed by analytical HPLC-PDA, as described in the Materials and Methods section.
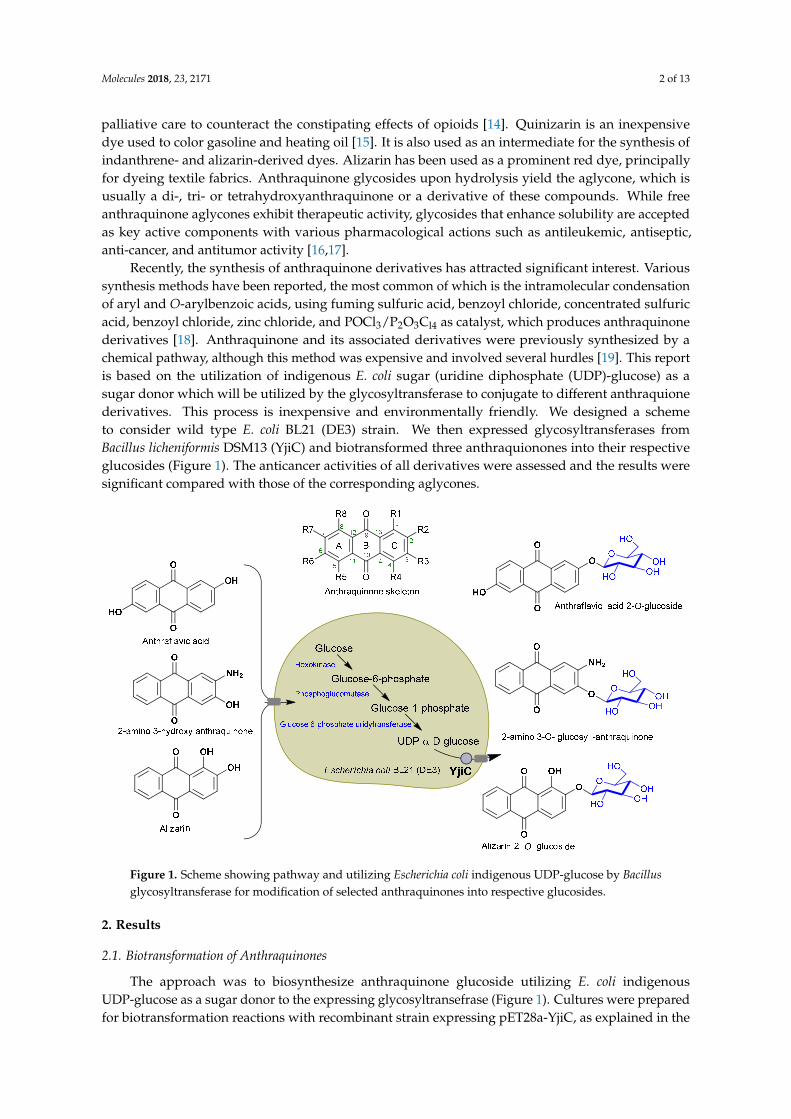
While analyzing the HPLC-PDA of each sample, product peaks appeared at shorter retentiontimes (tR) than the substrate peak in each reaction mixture, as expected. New peaks at tR ~ 18.9 minfor 2-amino-3-hydroxyanthraquinone-O-glucoside, of which the substrate peak was at tR 21.7 min,tR ~ 17.3 min for anthraflavic acid-O-glucoside, of which the substrate peak was at tR 20.8 min,and tR ~ 19.4 min for alizarin-O-glucoside, of which the substrate peak was detected at tR 23.4 min atthe UV absorbance of 420 nm (Figure 2).
Molecules 2018, 23, x FOR PEER REVIEW 3 of 14
2. Results
2.1. Biotransformation of Anthraquinones
The approach was to biosynthesize anthraquinone glucoside utilizing E. coli indigenous UDP-glucose as a sugar donor to the expressing glycosyltransefrase (Figure 1). Cultures were prepared for biotransformation reactions with recombinant strain expressing pET28a-YjiC, as explained in the Materials and Methods section. Three anthraquinones: 2-amino-3-hydroxyanthraquinone, anthraflavic acid, and alizarin were chosen for biotransformation.
Anthraquinones were supplied exogenously to each flask of E. coli BL21 (DE3) harboring pET28a-YjiC culture after 20 h of IPTG induction at a final concentration of 0.2 mM. Cultures were allowed to undergo biotransformation for up to 60 h and were then harvested using a double volume of ethyl acetate and analyzed by analytical HPLC-PDA, as described in the Materials and Methods section.
While analyzing the HPLC-PDA of each sample, product peaks appeared at shorter retention times (tR) than the substrate peak in each reaction mixture, as expected. New peaks at tR ~18.9 min for 2-amino-3-hydroxyanthraquinone-O-glucoside, of which the substrate peak was at tR 21.7 min, tR ~17.3 min for anthraflavic acid-O-glucoside, of which the substrate peak was at tR 20.8 min, and tR ~19.4 min for alizarin-O-glucoside, of which the substrate peak was detected at tR 23.4 min at the UV absorbance of 420 nm (Figure 2).
Figure 2. HPLC-PDA chromatogram of biotransformation reaction mixtures compared with respective standards. S refers to the substrate peak and P refers to the product. (A) 2-amino-3-hydroxyanthraquinone, (B) alizarin, and (C) anthraflavic acid.
Figure 2. HPLC-PDA chromatogram of biotransformation reaction mixtures compared withrespective standards. S refers to the substrate peak and P refers to the product. (A) 2-amino-3-hydroxyanthraquinone, (B) alizarin, and (C) anthraflavic acid.
These product peaks detected from the glycosylation systems were further analyzed byLC-QTOF-ESI/MS in positive ion mode. The mass spectra displayed an exact mass of2-amino-3-hydroxyanthraquinone [M + H]+ m/z+ ~ 240.0660, while the mass spectrum of [M + H]+
m/z+ ~ 402.1175 resembled the glucose conjugated derivative of 2-amino-3-hydroxyanthraquinone.Similarly, anthraflavic acid conjugated to glucose [M + H]+ m/z+ ~ 403.1025 and the alizarin conjugatedto glucose (which was [M + H]+ m/z+ ~ 403.1015) were assumed from the mass analysis as respective
Molecules 2018, 23, 2171 4 of 13
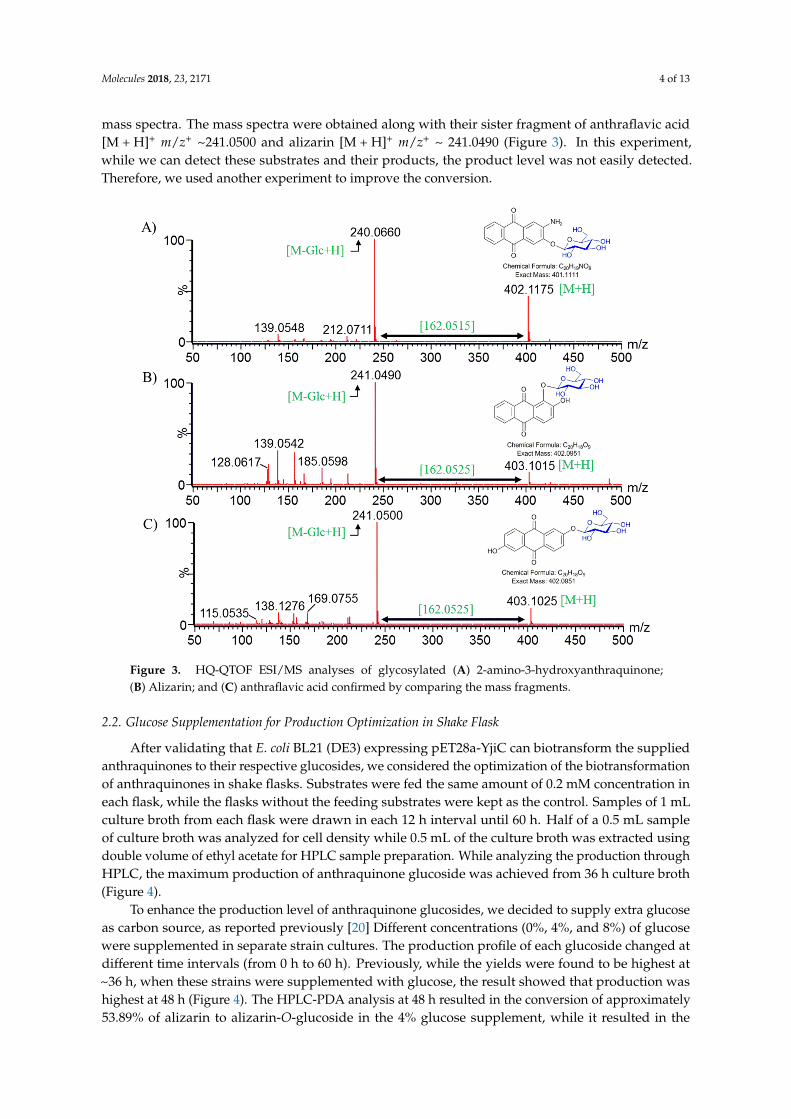
mass spectra. The mass spectra were obtained along with their sister fragment of anthraflavic acid[M + H]+ m/z+ ~241.0500 and alizarin [M + H]+ m/z+ ~ 241.0490 (Figure 3). In this experiment,while we can detect these substrates and their products, the product level was not easily detected.Therefore, we used another experiment to improve the conversion.
Molecules 2018, 23, x FOR PEER REVIEW 4 of 14
These product peaks detected from the glycosylation systems were further analyzed by LC-QTOF-ESI/MS in positive ion mode. The mass spectra displayed an exact mass of 2-amino-3-hydroxyanthraquinone [M + H]+ m/z+ ~240.0660, while the mass spectrum of [M + H]+ m/z+ ~402.1175 resembled the glucose conjugated derivative of 2-amino-3-hydroxyanthraquinone. Similarly, anthraflavic acid conjugated to glucose [M + H]+ m/z+ ~403.1025 and the alizarin conjugated to glucose (which was [M + H]+ m/z+ ~403.1015) were assumed from the mass analysis as respective mass spectra. The mass spectra were obtained along with their sister fragment of anthraflavic acid [M + H]+ m/z+ ~241.0500 and alizarin [M + H]+ m/z+ ~241.0490 (Figure 3). In this experiment, while we can detect these substrates and their products, the product level was not easily detected. Therefore, we used another experiment to improve the conversion.
Figure 3. HQ-QTOF ESI/MS analyses of glycosylated (A) 2-amino-3-hydroxyanthraquinone; (B) Alizarin; and (C) anthraflavic acid confirmed by comparing the mass fragments.
2.2. Glucose Supplementation for Production Optimization in Shake Flask
After validating that E. coli BL21 (DE3) expressing pET28a-YjiC can biotransform the supplied anthraquinones to their respective glucosides, we considered the optimization of the biotransformation of anthraquinones in shake flasks. Substrates were fed the same amount of 0.2 mM concentration in each flask, while the flasks without the feeding substrates were kept as the control. Samples of 1 mL culture broth from each flask were drawn in each 12 h interval until 60 h. Half of a 0.5 mL sample of culture broth was analyzed for cell density while 0.5 mL of the culture broth was extracted using double volume of ethyl acetate for HPLC sample preparation. While analyzing the production through HPLC, the maximum production of anthraquinone glucoside was achieved from 36 h culture broth (Figure 4).
Figure 3. HQ-QTOF ESI/MS analyses of glycosylated (A) 2-amino-3-hydroxyanthraquinone;(B) Alizarin; and (C) anthraflavic acid confirmed by comparing the mass fragments.
2.2. Glucose Supplementation for Production Optimization in Shake Flask
After validating that E. coli BL21 (DE3) expressing pET28a-YjiC can biotransform the suppliedanthraquinones to their respective glucosides, we considered the optimization of the biotransformationof anthraquinones in shake flasks. Substrates were fed the same amount of 0.2 mM concentration ineach flask, while the flasks without the feeding substrates were kept as the control. Samples of 1 mLculture broth from each flask were drawn in each 12 h interval until 60 h. Half of a 0.5 mL sampleof culture broth was analyzed for cell density while 0.5 mL of the culture broth was extracted usingdouble volume of ethyl acetate for HPLC sample preparation. While analyzing the production throughHPLC, the maximum production of anthraquinone glucoside was achieved from 36 h culture broth(Figure 4).
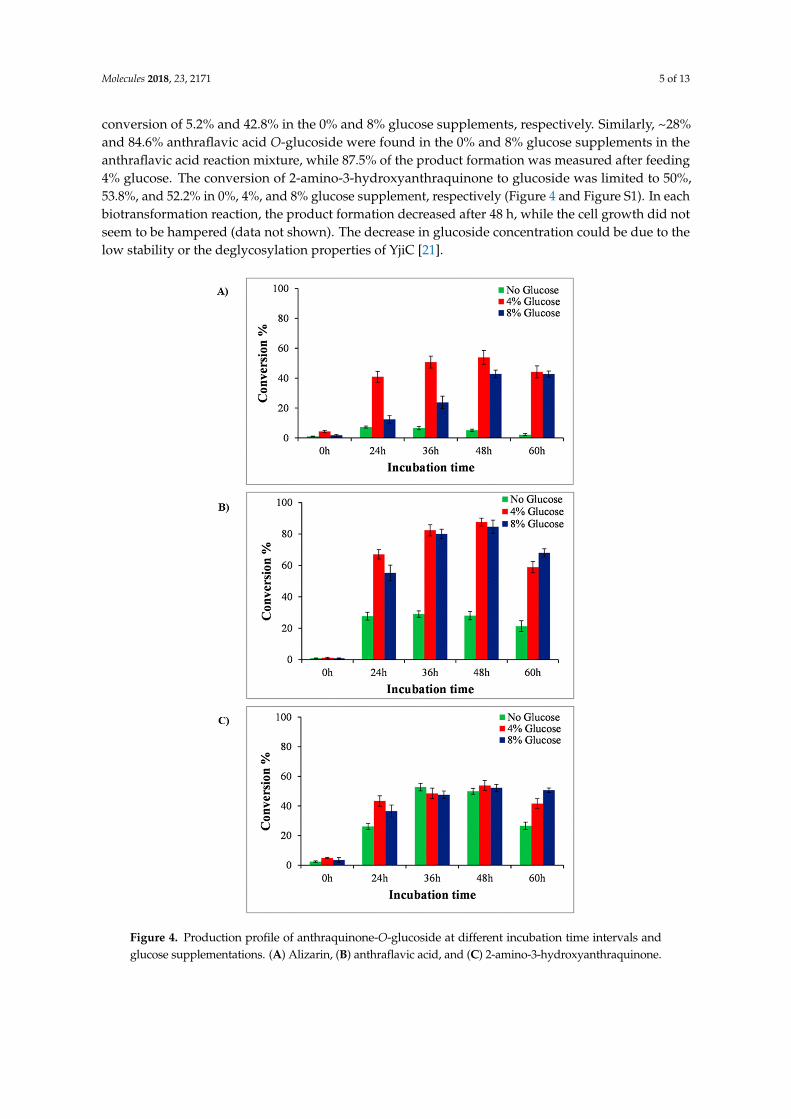
To enhance the production level of anthraquinone glucosides, we decided to supply extra glucoseas carbon source, as reported previously [20] Different concentrations (0%, 4%, and 8%) of glucosewere supplemented in separate strain cultures. The production profile of each glucoside changed atdifferent time intervals (from 0 h to 60 h). Previously, while the yields were found to be highest at~36 h, when these strains were supplemented with glucose, the result showed that production washighest at 48 h (Figure 4). The HPLC-PDA analysis at 48 h resulted in the conversion of approximately53.89% of alizarin to alizarin-O-glucoside in the 4% glucose supplement, while it resulted in the
Molecules 2018, 23, 2171 5 of 13
conversion of 5.2% and 42.8% in the 0% and 8% glucose supplements, respectively. Similarly, ~28%and 84.6% anthraflavic acid O-glucoside were found in the 0% and 8% glucose supplements in theanthraflavic acid reaction mixture, while 87.5% of the product formation was measured after feeding4% glucose. The conversion of 2-amino-3-hydroxyanthraquinone to glucoside was limited to 50%,53.8%, and 52.2% in 0%, 4%, and 8% glucose supplement, respectively (Figure 4 and Figure S1). In eachbiotransformation reaction, the product formation decreased after 48 h, while the cell growth did notseem to be hampered (data not shown). The decrease in glucoside concentration could be due to thelow stability or the deglycosylation properties of YjiC [21].Molecules 2018, 23, x FOR PEER REVIEW 6 of 14
Figure 4. Production profile of anthraquinone-O-glucoside at different incubation time intervals and glucose supplementations. (A) Alizarin, (B) anthraflavic acid, and (C) 2-amino-3-hydroxyanthraquinone.
2.3. Comparative Anticancer Activity of Anthraquinone and Their Glucoside Derivatives
Previous studies have revealed that the anticancer effects of anthraquinones are associated with their suppressive activities of cancer cell proliferation. We thus evaluated the effects of 2-amino-3-hydroxyanthraquinone, anthraflavic acid, alizarin, and their glycosylated derivatives on the proliferation of the AGS, Hela, and HepG2 cell lines. The inhibitory effect of anthraflavic acid-O-glucoside on cancer cell growth was comparable to that of anthraflavic acid. Besides, 2-amino-3-hydroxyanthraquinone-O-glucoside exhibited greater growth inhibitory effect than 2-amino-3-hydroxyanthraquinone. Furthermore, the inhibitory effects of alizarin-O-glucoside were higher
Figure 4. Production profile of anthraquinone-O-glucoside at different incubation time intervals andglucose supplementations. (A) Alizarin, (B) anthraflavic acid, and (C) 2-amino-3-hydroxyanthraquinone.
Molecules 2018, 23, 2171 6 of 13
2.3. Comparative Anticancer Activity of Anthraquinone and Their Glucoside Derivatives
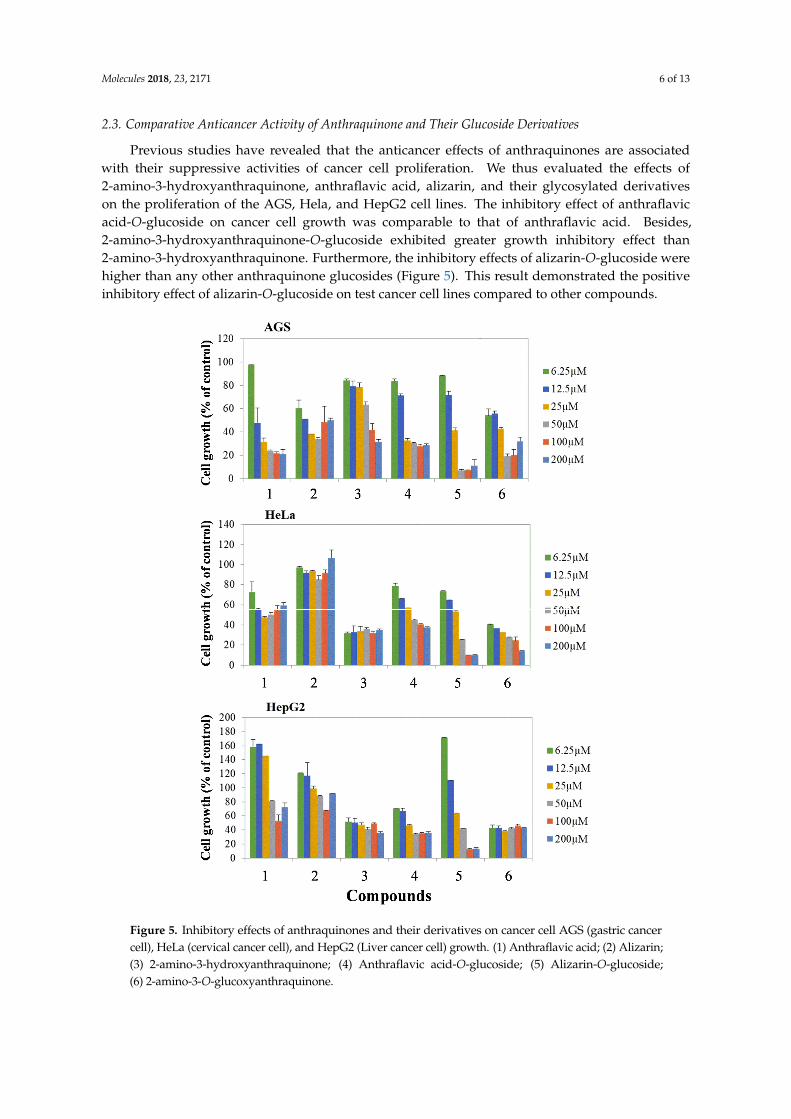
Previous studies have revealed that the anticancer effects of anthraquinones are associatedwith their suppressive activities of cancer cell proliferation. We thus evaluated the effects of2-amino-3-hydroxyanthraquinone, anthraflavic acid, alizarin, and their glycosylated derivativeson the proliferation of the AGS, Hela, and HepG2 cell lines. The inhibitory effect of anthraflavicacid-O-glucoside on cancer cell growth was comparable to that of anthraflavic acid. Besides,2-amino-3-hydroxyanthraquinone-O-glucoside exhibited greater growth inhibitory effect than2-amino-3-hydroxyanthraquinone. Furthermore, the inhibitory effects of alizarin-O-glucoside werehigher than any other anthraquinone glucosides (Figure 5). This result demonstrated the positiveinhibitory effect of alizarin-O-glucoside on test cancer cell lines compared to other compounds.
Molecules 2018, 23, x FOR PEER REVIEW 7 of 14
than any other anthraquinone glucosides (Figure 5). This result demonstrated the positive inhibitory effect of alizarin-O-glucoside on test cancer cell lines compared to other compounds.
Figure 5. Inhibitory effects of anthraquinones and their derivatives on cancer cell AGS (gastric cancer cell), HeLa (cervical cancer cell), and HepG2 (Liver cancer cell) growth. (1) Anthraflavic acid; (2) Alizarin; (3) 2-amino-3-hydroxyanthraquinone; (4) Anthraflavic acid-O-glucoside; (5) Alizarin-O-glucoside; (6) 2-amino-3-O-glucoxyanthraquinone.
2.4. Scale up Production of Alizarin-O-Glucoside in Bioreactor
Based on the anticancer activity of alizarin-O-glucoside, we carried out a scale-up experiment for the same molecule to study the feasibility of microbial biosynthesis in a lab scale fermentor. The reaction culture broth was harvested at a regular time interval of 12 h and analyzed by HPLC–PDA
Figure 5. Inhibitory effects of anthraquinones and their derivatives on cancer cell AGS (gastric cancercell), HeLa (cervical cancer cell), and HepG2 (Liver cancer cell) growth. (1) Anthraflavic acid; (2) Alizarin;(3) 2-amino-3-hydroxyanthraquinone; (4) Anthraflavic acid-O-glucoside; (5) Alizarin-O-glucoside;(6) 2-amino-3-O-glucoxyanthraquinone.
Molecules 2018, 23, 2171 7 of 13
2.4. Scale up Production of Alizarin-O-Glucoside in Bioreactor
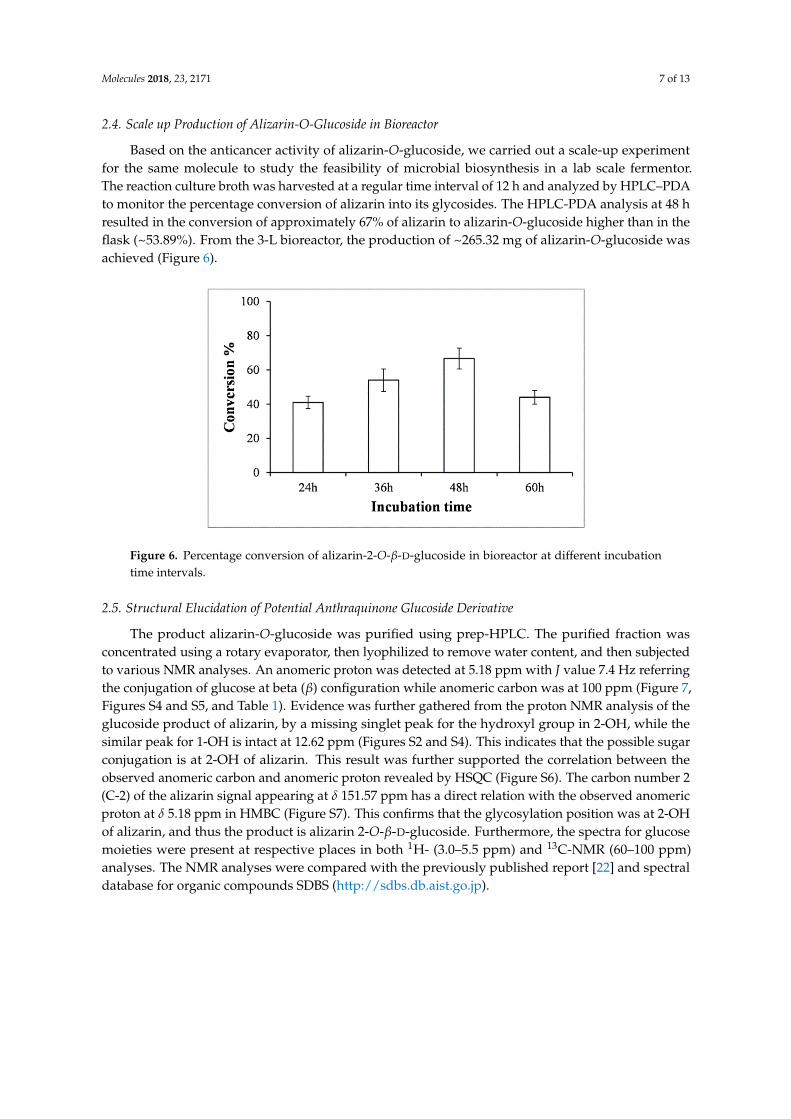
Based on the anticancer activity of alizarin-O-glucoside, we carried out a scale-up experimentfor the same molecule to study the feasibility of microbial biosynthesis in a lab scale fermentor.The reaction culture broth was harvested at a regular time interval of 12 h and analyzed by HPLC–PDAto monitor the percentage conversion of alizarin into its glycosides. The HPLC-PDA analysis at 48 hresulted in the conversion of approximately 67% of alizarin to alizarin-O-glucoside higher than in theflask (~53.89%). From the 3-L bioreactor, the production of ~265.32 mg of alizarin-O-glucoside wasachieved (Figure 6).
Molecules 2018, 23, x FOR PEER REVIEW 8 of 14
to monitor the percentage conversion of alizarin into its glycosides. The HPLC-PDA analysis at 48 h resulted in the conversion of approximately 67% of alizarin to alizarin-O-glucoside higher than in the flask (~53.89%). From the 3-L bioreactor, the production of ~265.32 mg of alizarin-O-glucoside was achieved (Figure 6).
Figure 6. Percentage conversion of alizarin-2-O-β-D-glucoside in bioreactor at different incubation time intervals.
2.5. Structural Elucidation of Potential Anthraquinone Glucoside Derivative
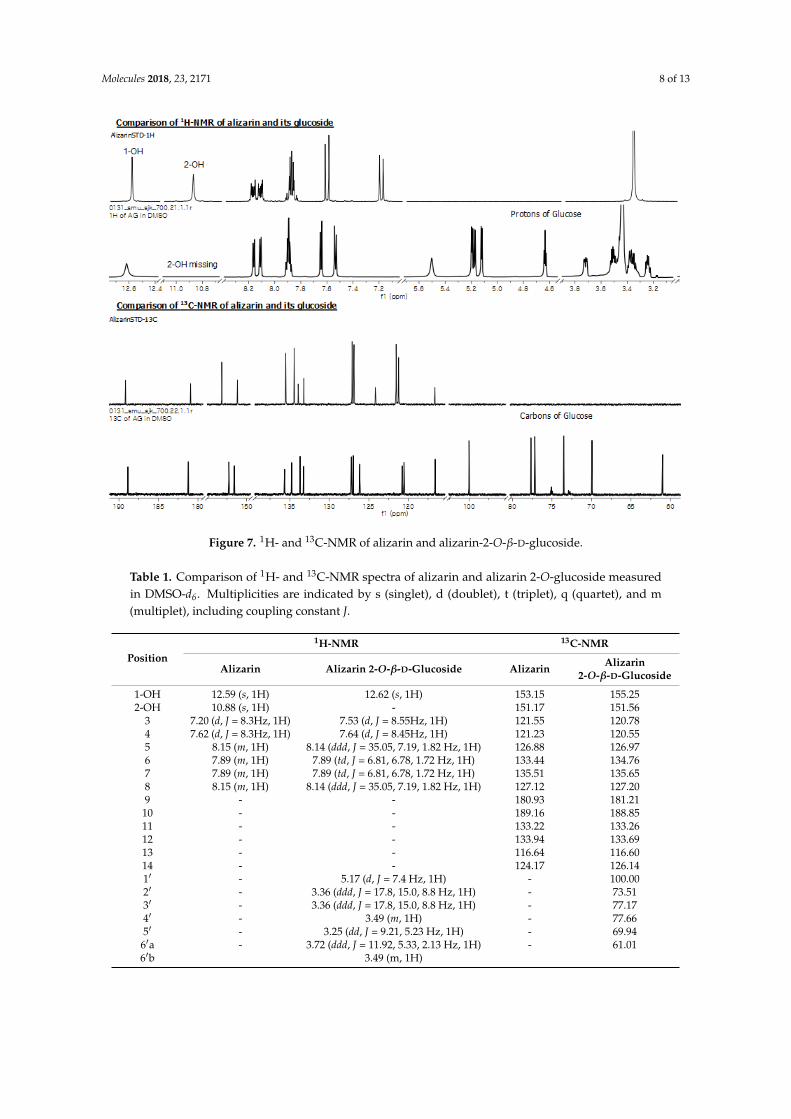
The product alizarin-O-glucoside was purified using prep-HPLC. The purified fraction was concentrated using a rotary evaporator, then lyophilized to remove water content, and then subjected to various NMR analyses. An anomeric proton was detected at 5.18 ppm with J value 7.4 Hz referring the conjugation of glucose at beta (β) configuration while anomeric carbon was at 100 ppm (Figure 7, Figures S4 and S5, and Table 1). Evidence was further gathered from the proton NMR analysis of the glucoside product of alizarin, by a missing singlet peak for the hydroxyl group in 2-OH, while the similar peak for 1-OH is intact at 12.62 ppm (Figures S2 and S4). This indicates that the possible sugar conjugation is at 2-OH of alizarin. This result was further supported the correlation between the observed anomeric carbon and anomeric proton revealed by HSQC (Figure S6). The carbon number 2 (C-2) of the alizarin signal appearing at δ 151.57 ppm has a direct relation with the observed anomeric proton at δ 5.18 ppm in HMBC (Figure S7). This confirms that the glycosylation position was at 2-OH of alizarin, and thus the product is alizarin 2-O-β-D-glucoside. Furthermore, the spectra for glucose moieties were present at respective places in both 1H- (3.0–5.5 ppm) and 13C-NMR (60–100 ppm) analyses. The NMR analyses were compared with the previously published report [22]and spectral database for organic compounds SDBS (http://sdbs.db.aist.go.jp).
Figure 6. Percentage conversion of alizarin-2-O-β-D-glucoside in bioreactor at different incubationtime intervals.
2.5. Structural Elucidation of Potential Anthraquinone Glucoside Derivative
The product alizarin-O-glucoside was purified using prep-HPLC. The purified fraction wasconcentrated using a rotary evaporator, then lyophilized to remove water content, and then subjectedto various NMR analyses. An anomeric proton was detected at 5.18 ppm with J value 7.4 Hz referringthe conjugation of glucose at beta (β) configuration while anomeric carbon was at 100 ppm (Figure 7,Figures S4 and S5, and Table 1). Evidence was further gathered from the proton NMR analysis of theglucoside product of alizarin, by a missing singlet peak for the hydroxyl group in 2-OH, while thesimilar peak for 1-OH is intact at 12.62 ppm (Figures S2 and S4). This indicates that the possible sugarconjugation is at 2-OH of alizarin. This result was further supported the correlation between theobserved anomeric carbon and anomeric proton revealed by HSQC (Figure S6). The carbon number 2(C-2) of the alizarin signal appearing at δ 151.57 ppm has a direct relation with the observed anomericproton at δ 5.18 ppm in HMBC (Figure S7). This confirms that the glycosylation position was at 2-OHof alizarin, and thus the product is alizarin 2-O-β-D-glucoside. Furthermore, the spectra for glucosemoieties were present at respective places in both 1H- (3.0–5.5 ppm) and 13C-NMR (60–100 ppm)analyses. The NMR analyses were compared with the previously published report [22] and spectraldatabase for organic compounds SDBS (http://sdbs.db.aist.go.jp).
Molecules 2018, 23, 2171 8 of 13Molecules 2018, 23, x FOR PEER REVIEW 9 of 14
Figure 7. 1H- and 13C-NMR of alizarin and alizarin-2-O-β-D-glucoside.
Table 1. Comparison of 1H- and 13C-NMR spectra of alizarin and alizarin 2-O-glucoside measured in DMSO-d6. Multiplicities are indicated by s (singlet), d (doublet), t (triplet), q (quartet), and m (multiplet), including coupling constant J.
Position 1H-NMR 13C-NMR
Alizarin Alizarin 2-O-β-D-Glucoside Alizarin Alizarin 2-O-β-D-Glucoside
1-OH 12.59 (s, 1H) 12.62 (s, 1H) 153.15 155.25 2-OH 10.88 (s, 1H) - 151.17 151.56
3 7.20 (d, J = 8.3Hz, 1H) 7.53 (d, J = 8.55Hz, 1H) 121.55 120.78 4 7.62 (d, J = 8.3Hz, 1H) 7.64 (d, J = 8.45Hz, 1H) 121.23 120.55 5 8.15 (m, 1H) 8.14 (ddd, J = 35.05, 7.19, 1.82 Hz, 1H) 126.88 126.97 6 7.89 (m, 1H) 7.89 (td, J = 6.81, 6.78, 1.72 Hz, 1H) 133.44 134.76 7 7.89 (m, 1H) 7.89 (td, J = 6.81, 6.78, 1.72 Hz, 1H) 135.51 135.65 8 8.15 (m, 1H) 8.14 (ddd, J = 35.05, 7.19, 1.82 Hz, 1H) 127.12 127.20 9 - - 180.93 181.21 10 - - 189.16 188.85 11 - - 133.22 133.26 12 - - 133.94 133.69 13 - - 116.64 116.60 14 - - 124.17 126.14 1′ - 5.17 (d, J = 7.4 Hz, 1H) - 100.00 2′ - 3.36 (ddd, J = 17.8, 15.0, 8.8 Hz, 1H) - 73.51 3′ - 3.36 (ddd, J = 17.8, 15.0, 8.8 Hz, 1H) - 77.17 4′ - 3.49 (m, 1H) - 77.66 5′ - 3.25 (dd, J = 9.21, 5.23 Hz, 1H) - 69.94
6′a - 3.72 (ddd, J = 11.92, 5.33, 2.13 Hz, 1H) - 61.01 6′b 3.49 (m, 1H)
Figure 7. 1H- and 13C-NMR of alizarin and alizarin-2-O-β-D-glucoside.
Table 1. Comparison of 1H- and 13C-NMR spectra of alizarin and alizarin 2-O-glucoside measuredin DMSO-d6. Multiplicities are indicated by s (singlet), d (doublet), t (triplet), q (quartet), and m(multiplet), including coupling constant J.
Position
1H-NMR 13C-NMR
Alizarin Alizarin 2-O-β-D-Glucoside Alizarin Alizarin2-O-β-D-Glucoside
1-OH 12.59 (s, 1H) 12.62 (s, 1H) 153.15 155.252-OH 10.88 (s, 1H) - 151.17 151.56
3 7.20 (d, J = 8.3Hz, 1H) 7.53 (d, J = 8.55Hz, 1H) 121.55 120.784 7.62 (d, J = 8.3Hz, 1H) 7.64 (d, J = 8.45Hz, 1H) 121.23 120.555 8.15 (m, 1H) 8.14 (ddd, J = 35.05, 7.19, 1.82 Hz, 1H) 126.88 126.976 7.89 (m, 1H) 7.89 (td, J = 6.81, 6.78, 1.72 Hz, 1H) 133.44 134.767 7.89 (m, 1H) 7.89 (td, J = 6.81, 6.78, 1.72 Hz, 1H) 135.51 135.658 8.15 (m, 1H) 8.14 (ddd, J = 35.05, 7.19, 1.82 Hz, 1H) 127.12 127.209 - - 180.93 181.21
10 - - 189.16 188.8511 - - 133.22 133.2612 - - 133.94 133.6913 - - 116.64 116.6014 - - 124.17 126.141′ - 5.17 (d, J = 7.4 Hz, 1H) - 100.002′ - 3.36 (ddd, J = 17.8, 15.0, 8.8 Hz, 1H) - 73.513′ - 3.36 (ddd, J = 17.8, 15.0, 8.8 Hz, 1H) - 77.174′ - 3.49 (m, 1H) - 77.665′ - 3.25 (dd, J = 9.21, 5.23 Hz, 1H) - 69.94
6′a - 3.72 (ddd, J = 11.92, 5.33, 2.13 Hz, 1H) - 61.016′b 3.49 (m, 1H)
Molecules 2018, 23, 2171 9 of 13
3. Discussion
Anthraquinones are the largest group of natural pigments, with potential applications in variousfields, such as an anticancer, antibacterial agents, and anti-inflammatory agents in pharmaceuticalmedicine [2,23,24]. The industrial significance of anthraquinones is as synthetic dyes providing brilliantcolors, providing the natural red chromogen [25], and in the application of the production of hydrogenperoxide [26], etc. These phenolic compounds can be naturally obtained from various sources suchas plant, bacteria, fungi, and lichens [27,28]. These compounds are attracting more attention dueto the various key factors as aforementioned. While type II polyketide synthase is responsible foranthraquinone biosynthesis in fungus, reports regarding its biosynthesis and modification in microbialhosts are quite limited [29]. The microbial production of such valuable compounds is performed usingsimple biotransformation techniques, or is used to enhance production using genetic engineering, thesynthetic biological tool is an affirmative practice and certainly increases yields [30]. We considereda versatile post-modifying enzyme, the glycosyltransferase (YjiC), that has revealed potential inglycosylating various classes of natural products including anthraquinone itself [31–33]. A zeroengineered wild type E. coli strain was considered to express YjiC for whole-cell biotransformation.The YjiC could catalyze glycosylation reaction over different anthraquinones that were fed exogenouslyand were confirmed by HPLC-PDA and HQ-QTOF ESI/MS (Figures 2 and 3). Among the products,alizarin-O-glucoside, 2-amino-3-O-glucoxy anthraquinone, and anthraflavic acid-O-glucoside wereconfirmed by mass analysis (Figure 3) while alizarin-O-glucoside was elucidated using variousNMR analyses.
For production enhancement, glucose was used as a supplemental carbon source. Differentconcentrations of glucose affected the yield and cell density. As can be seen in Figure 4, while a highconcentration of glucose (8%) improved the production level, maximum cell growth was achievedwithin 24 h (growth curve not shown). However, 4% glucose supplement was optimized and favoredenhancement in production by maintaining the cell growth and production yield within 48 h comparedto the previous experiment (Figure 2).
Microbial production of emodin O-glucoside, aloe-emodin O-glucoside using YjiC [33],chrysophanol 8-O-β-D-glucoside, physcion 8-O-β-D-glucoside, emodin 6-O-β-D-glucoside,and aloe-emodin 1-O-β-D-glucoside were produced by screening 21 different fungal strains forrespective anthraquinones biotransformation reported previously [34]. However, all of their biologicalactivities remain unclear, although emodin and aloe-emodin glucoside have shown anti-proliferativeactivity against some cancer cell lines [33]. Since anthraquinones are potential anticancer agents [35],we synthesized three different O-glucosides of 2-amino-3-hydroxyanthraquinone, anthraflavic acid,and alizarin in recombinant E. coli strains. These compounds were investigated for anticancer activityagainst gastric cancer-AGS, uterine cervical cancer-HeLa and liver cancer-HepG2 cells (Figure 5).During the anti-proliferative assay using AGS, HeLa, and HepG2 cancer cell lines, the anthraflavicacid O-glucoside and 2-amino-3-O-glucosyl anthraquinone revealed more enhanced inhibitoryactivity than its aglycones, while alizarin O-glucoside was more effective than alizarin and othercompounds (Figure 5). Although this is a preliminary study for anti-cancer assay, this result suggeststhat this compound could be developed as an anticancer lead agent in the future. At this point,we needed to determine the exact chemical structure of alizarin O-glucoside. Thus, the prep-HPLCpurified compound was analyzed with various NMR spectroscopies to elucidate the chemicalstructure to be alizarin-2-O-β-D-glucoside (Figure 7). Since other molecules exhibited less activity thanalizarin-2-O-β-D-glucoside, we did not require further structural elucidation of these compounds.
This study provides a comprehensive view of the modification of anthraquinones viabiotransformation approach, expressing glycosyltransferase in E. coli strain. Anticancer activitiesof these compounds were assayed against three different cancer cell lines. Among the synthesizedderivatives of anthraquinones, alizarin-2-O-β-D-glucoside was the most effective comparatively in lowconcentration. This compound could be further investigated in vivo to validate its further potency.
Molecules 2018, 23, 2171 10 of 13
4. Materials and Methods
4.1. General Procedures
Anthraquinones (2-amino-3-hydroxyanthraquinone, anthraflavic acid, and alizarin) werepurchased from Tokyo Chemical Industry (Tokyo, Japan). All other chemicals and reagents were ofhighest chemical grade. E. coli BL21 (DE3, Stratagene, La Jolla, CA, USA) was used as expressionand biotransformation hosts. Restriction enzymes were used either from Takara Bio. Inc. (Kusatsu,Japan) or Promega (Madison, WI, USA). Luria-Bertani (LB) plates and broth media supplemented withan appropriate antibiotic (kanamycin 50 µg/mL) was used for the E. coli growth, colony selection,culture preparation, and biotransformation. Fermentation was conducted in LB medium to enhanceproduction and collection for biological activity.
4.2. Vectors and Recombinant Strains
The previously constructed recombinant vector pET28a-YjiC [36] was used for recombinantstrain construction. The vector was confirmed by restriction endonuclease activity digestion withBamHI/XhoI, followed by transformation into wild type E. coli BL21 (DE3) for biotransformation study.
4.3. Culture Preparation and Whole Cell Biotransformation
Seed culture of E. coli strains harboring pET28a-YjiC was prepared in 5 mL LB mediumsupplemented with 50 µg/mL kanamycin for the maintenance of recombinants in each case, and wasthen incubated overnight at 37 ◦C. Approximately 500 µL of seeds were transferred to the same medium(50 mL) and incubated at 37 ◦C until the cells’ optical density reached 600 nm (OD600nm) reached0.5–0.7, 0.5 mM isopropyl β-D-1-thiogalactopyranoside (IPTG) was added to induce protein expression,followed by incubation for 18 h at 20 ◦C. Since substrates such as 2-amino-3-hydroxyanthraquinone,anthraflavic acid, and alizarin are dissolved in DMSO, we prepared 50 mM stock of each substrate forexogenous supply to the 20 h incubated induced culture prepared. Each substrate at a concentrationof 0.2 mM was fed and was allowed to biotransform into the respective products. At the same time,in each case, recombinant strains expressing only vector pET28a(+) without the gene were also fed bythe same concentration of anthraquinones as that for the control experiment. After 60 h of incubation,all biotransformation cultures (including controls) were harvested by transforming into a separatingfunnel followed by the addition of double volume of ethyl acetate and vertical shaking for 30 min thenthe aqueous and organic layers of the cultures were allowed to settle for another 30 min. The organicethyl acetate layer in each case was transferred and evaporated using a rotatory evaporator. The finalremaining sample was dissolved in 1 mL methanol. This sample was directly analyzed using a highperformance liquid chromatogram connected to a photo diode array (HPLC-PDA) and high-resolutionquadruple time-of-flight electrospray ionization-mass spectrometry (HQ-QTOF ESI/MS) analysis.
4.4. Whole Cell Biocatalysis in Bioreactor
The recombinant strain of E. coli BL21 (DE3) harboring pET28a-YjiC was cultured and the seedwas prepared for fermentation. Fermentation was conducted under aerobic condition in LB medium,supplementing glucose as the carbon source. Most protocols followed were similar to those describedin our previous reports [20,37]. For the production of anthraquinones glucoside on a large scale,we used a 5-L fermentor system (Biotron, Incheon, Korea). We prepared 3-L of LB medium forfermentation. The seed culture of the recombinant strain expressing glycosyltransferase was culturedin a shake flask (100 mL medium) as an inoculum for the fermentor. Culture was grown overnight at37 ◦C in a shaking incubator. For fermentation, the pH meter and the dissolved oxygen (DO) probewere calibrated according to the manufacturer’s protocol. The pH was maintained at 7.0 through theprocess, using commercially available ammonium hydroxide, while the DO level was maintainedat >95% during the entire fermentation period. When the optical density of the culture at 600 nmreached 10, the culture was induced by lactose and the temperature was lowered to 20 ◦C. After 6 h of
Molecules 2018, 23, 2171 11 of 13
culture induction, 240 mg of anthraquinone including 2-amino-3-hydroxyanthraquinone, anthraflavicacid, and alizarin (approximately 0.3 mM final concentration) was added to the culture mediumfor biotransformation. The fermentor was continuously run for 60 h, maintaining the DO and pH,as mentioned. In each 12-h interval, 100 mL of 50% glucose (autoclaved) was supplied as the carbonsource for proper growth. At the end of fermentation, the culture medium was harvested, adding adouble volume of ethyl acetate in a separating funnel while vigorously shaking. The aqueous andorganic layers were then left to settle. The organic layer was then evaporated using a rotary evaporatorto concentrate the samples. The final samples were dissolved in methanol and subjected to purify theproducts using preparative-HPLC.
4.5. Analytical Procedures
From the samples prepared, 20 µL volume was injected and directly analyzed by HPLC-PDA(Shimadzu, Kyoto, Japan; SPD-M20A Detector) using a reverse phase C18 column (Mightysil-RP-18GP,250 × 4.6mm, Kanto Chemical, Tokyo, Japan). The binary mobile phase was composed of solvent A(HPLC grade water + 0.05% trifluoro acetic acid) and solvent B (100% acetonitrile). The total flow ratewas maintained as 1 mL/min for a 35-min program. ACN concentrations were 10% (0–10 min), 20%(10–25 min), 100% (25–28 min), 70% (28–30 min), and 10% (30–35 min).
Products were purified by prep-HPLC with a C18 column (YMC-Pack ADS-AQ (250 × 20 mmI.D., 10 µm) connected to a UV detector set at 420 nm using a 35 min binary program with ACNconcentrations. The ACN concentrations were as follows: 10% (0–10 min), 20% (10–15 min), 50%(15–20 min), 70% (20–25 min), 90% (25–30 min), 50% (30–34 min), and 20% (34–35 min). Purifiedproducts were then completely dried in a lyophilizer and used for structural elucidation and bioactivity.
High resolution quadruple time-of-flight electrospray ionization-mass spectrometry (HQ-QTOFESI/MS) spectra were obtained on ACQUITY (UPLC; Waters, Milford, MA, USA) coupled withSYNAPT G2-S (Waters, Milford, MA, USA). For structural elucidation of biotransformed metabolites,samples including the standards were dissolved in dimethyl-sulfoxide-d6 (Sigma-Aldrich, St. Louis,MO, USA). Nuclear magnetic resonance (NMR) was conducted by analyzing 1H-, 13C-NMR withtwo 2D NMR spectroscopies (heteronuclear single-quantum correlation [HSQC] and heteronuclearmultiple-bond correlation [HMBC]). Standard molecules were analyzed using a 300 MHz BrukerBioSpin NMR instrument (Karlsruhe, Germany). Structures of metabolites were elucidated usingMestReNova 11.0 program (Mestrelab Research S.L., Santiago de Compostela, Spain).
4.6. Inhibitory Effects of Derivatives on Cancer Cell Growth
Gastric carcinoma cells (AGS) were maintained at the Roswell Park Memorial Institute(RPMI) 1640 medium containing 10% fetal bovine serum (FBS). Cervical carcinoma (HeLa) andhepatocarcinoma cells (HepG2) were grown in Dulbecco’s modified Eagle’s medium (DMEM)supplemented with 10% FBS. All cells were maintained at 37 ◦C in a humidified 5% CO2 incubator.For cell growth assay, various cancer cells were plated at 2 × 10³ cells/well in 96-well culture plates.Compounds were added to each well with various concentrations, and the cells were incubatedfor 72 h. Cell growth was measured using a 3-(4,5-dimethylthiazol-2-yl)-2,5-diphenyltetrazoliumbromide (MTT) colorimetric assay. 50 µL of MTT (2 mg/mL stock solution) was added and the plateswere incubated for an additional 4 h. After removal of the medium, 100 µL of DMSO was added.Absorbance was measured at 540 nm using a Multiskan® Spectrum microplate spectrophotometer(Thermo Scientific, Waltham, MA, USA,).
Supplementary Materials: The following are available online at, Figure S1: Comparison of glucose concentrationbased on the recombinant strain in 48 h incubation. Maximum conversion of anthraquinone to respectiveanthraquinone glycosides were achieved while supplementing 4% additional glucose in the medium. (A) Alizarin;(B) Anthraflavic acid; (C) 2-amino 3-hydroxyanthraquinone. S stands for substrate peak while P stands for product,Figure S2: 1H-NMR of alizarin, Figure S3: 13C-NMR of alizarin, Figure S4: 1H-NMR of alizarin-2-O-β-D-glucoside,Figure S5: 13C-NMR of alizarin-2-O-β-D-glucoside, Figure S6: HSQC correlation of alizarin 2-O-β-D-glucoside,Figure S7: HMBC correlation of alizarin 2-O-β-D-glucoside.
Molecules 2018, 23, 2171 12 of 13
Author Contributions: T.T.H.N. conceived and designed the experiments. J.M.H. performed the anticanceractivity experiments. T.T.H.N. and P.P. performed other experiments, analyzed the data and wrote the manuscript.H.J.J., R.P.P. and Y.I.P. revised the manuscript. J.K.S. revised the manuscript and is supervision. All authors readand approved the final manuscript.
Funding: This work was supported by a grant from the Next-Generation BioGreen 21 Program (SSAC, grant#:PJ013137 (JKS), PJ013206 (YIP)), Rural Development Administration, Korea.
Conflicts of Interest: The authors declare no conflict of interest.
References
1. Dave, H.; Ledwani, L. A review on anthraquinones isolated from Cassia species and their applications.Indian J. Nat. Prod. Resour. 2012, 3, 291–319.
2. Kanokmedhakul, K.; Kanokmedhakul, S.; Phatchana, R. Biological activity of Anthraquinones andTriterpenoids from Prismatomeris fragrans. J. Ethnopharmacol. 2005, 100, 284–288. [CrossRef] [PubMed]
3. Kosalec, I.; Kremer, D.; Locatelli, M.; Epifano, F.; Genovese, S.; Carlucci, G.; Randic, M.; Zovko Koncic, M.Anthraquinone profile, antioxidant and antimicrobial activity of bark extracts of Rhamnus alaternus, R. fallax,R. intermedia and R. pumila. Food Chem. 2013, 136, 335–341. [CrossRef] [PubMed]
4. Sittie, A.A.; Lemmich, E.; Olsen, C.E.; Hviid, L.; Kharazmi, A.; Nkrumah, F.K.; Christensen, S.B.Structure-activity studies: In vitro antileishmanial and antimalarial activities of anthraquinones fromMorinda lucida. Planta Med. 1999, 65, 259–261. [CrossRef] [PubMed]
5. Rath, G.; Ndonzao, M.; Hostettmann, K. Antifungal anthraquinones from Morinda lucia. Int. J. Pharmacogn.1995, 33, 107–114. [CrossRef]
6. Younos, C.; Rolland, A.; Fleurentin, J.; Lanhers, M.; Misslin, R.; Mortier, F. Analgesic and Behavioural Effectsof Morinda citrifolia. Planta Med. 1990, 56, 430–434. [CrossRef] [PubMed]
7. Koumaglo, K.; Gbeassor, M.; Nikabu, O.; de Souza, C.; Werner, W. Effects of three compound extracted fromMorinda lucida on Plasmodium falciparum. Planta Med. 1991, 58, 533–534. [CrossRef] [PubMed]
8. Akhtar, M.N.; Zareen, S.; Yeap, S.K.; Ho, W.Y.; Lo, K.M.; Hasan, A.; Alitheen, N.B. Total synthesis, cytotoxiceffects of damnacanthal, nordamnacanthal and related anthraquinone analogues. Molecules 2013, 18,10042–10055. [CrossRef] [PubMed]
9. Ismail, N.H.; Mohamad, H.; Mohidin, A.; Lajis, N.H. Antioxidant activity of anthraquinones fromMorinda elliptica. Nat. Prod. Sci. 2002, 8, 48–51.
10. Al-Otaibi, J.S.; EL Gogary, T.M. Synthesis of novel anthraquinones: Molecular structure, molecular chemicalreactivity descriptors and interactions with DNA as antibiotic and anti-cancer drugs. J. Mol. Struct. 2017,1130, 799–809. [CrossRef]
11. Feng, Y.; Huang, S.; Dou, W.; Zhang, S.; Chen, J.H.; Shen, Y.; Shen, J.H.; Leng, Y. Emodin, a naturalproduct, selectively inhibits 11β-hydroxysteroid dehydrogenase type 1 and ameliorates metabolic disorderin diet-induced obese mice. Br. J. Pharmacol. 2010, 161, 113–126. [CrossRef] [PubMed]
12. Alam, Z.; Al-Mahdi, Z.; Zhu, Y.; McKee, Z.; Parris, D.S.; Parikh, H.I.; Kellogg, G.E.; Kuchta, A.; McVoy, M.A.Anti-cytomegalovirus activity of the anthraquinone atanyl blue PRL. Antivir. Res. 2015, 114, 86–95. [CrossRef][PubMed]
13. Srinivas, G.; Babykutty, S.; Sathiadevan, P.P.; Srinivas, P. Molecular mechanism of emodin action: Transitionfrom laxative ingredient to an antitumor agent. Med. Res. Rev. 2007, 27, 591–608. [CrossRef] [PubMed]
14. Twycross, R.; Sykes, N.; Mihalyo, M.; Wilcock, A. Stimulant Laxatives and Opioid-Induced Constipation.J. Pain Symptom Manag. 2012, 43, 306–313. [CrossRef] [PubMed]
15. Hunger, K. Industrial Dyes: Chemistry, Properties, Applications; Wiley-VCH: Weinheim, Germany, 2003.16. Huang, Q.; Lu, G.; Shen, H.M.; Chung, M.C.M.; Choon, N.O. Anti-cancer properties of anthraquinones from
rhubarb. Med. Res. Rev. 2007, 27, 609–630. [CrossRef] [PubMed]17. Malik, E.M.; Müller, C.E. Anthraquionones as pharmacological tools and drugs. Med. Res. Rev. 2016, 36,
705–748. [CrossRef] [PubMed]18. Madje, B.R.; Shelke, K.F.; Sapkal, S.B.; Kakade, G.K.; Shingare, M.S. An efficient one-pot synthesis of
anthraquinone derivatives catalyzed by alum in aqueous media. Green Chem. Lett. Rev. 2010, 3, 269–273.[CrossRef]
Molecules 2018, 23, 2171 13 of 13
19. Seidel, N.; Hahn, T.; Lirbing, S.; Seichter, W.; Kortus, J.; Weber, E. Synthesis and properties of new9,10-anthraquinone derived compounds for molecular electronics. New J. Chem. 2013, 37, 601–610. [CrossRef]
20. Pandey, R.P.; Li, T.F.; Kim, E.H.; Yamaguchi, T.; Park, Y.I.; Kim, J.S.; Sohng, J.K. Enzymatic synthesis of novelphloretin glucosides. Appl. Environ. Microbiol. 2013, 79, 3516–3521. [CrossRef] [PubMed]
21. Pandey, R.P.; Malla, S.; Simkhada, D.; Kim, B.G.; Sohng, J.K. Production of 3-O-xylosyl quercetin inEscherichia coli. Appl. Microbiol. Biotechnol. 2013, 97, 1889–1901. [CrossRef] [PubMed]
22. Parajuli, P.; Pandey, R.P.; Trang, N.T.H.; Chaudhary, A.K.; Sohng, J.K. Synthetic sugar cassettes for theefficient production of flavonol glycosides in Escherichia coli. Microb. Cell Fact. 2015, 14, 76. [CrossRef][PubMed]
23. Pandey, P.; Parajuli, P.; Shin, J.Y.; Lee, J.; Lee, S.; Hong, Y.S.; Park, Y.I.; Kim, J.S.; Sohng, J.K. Enzymaticbiosynthesis of novel resveratrol glucoside and glycoside derivatives. Appl. Environ. Microbiol. 2014, 80,7235–7243. [CrossRef] [PubMed]
24. Kalidhar, S.B. Structural elucidation in anthraquinones using 1H NMR glycosylation and alkylation shifts.Phytochemistry 1989, 28, 3459–3463. [CrossRef]
25. Manojlovic, N.T.; Solujic, S.; Sukdolak, S.; Krstic, L.J. Isolation and antimicrobial activity of anthraquinonefrom some species of the lichen genus Xanthoria. J. Serb. Chem. Soc. 2000, 65, 555–560. [CrossRef]
26. Chien, S.C.; Wu, Y.C.; Chen, Z.W.; Yang, W.C. Naturally occurring anthraquinones: Chemistry andtherapeutic potential in autoimmune diabetes. Evid. Based Complement. Altern. Med. 2015, 2015, 357357.[CrossRef] [PubMed]
27. Gürses, A.; Açıkyıldız, M.; Günes, K.; Sadi Gürses, M. Dyes Pigments; Springer: Basel, Switzerland, 2016;p. 88.
28. Chen, Q. Development of an anthraquinone process for the production of hydrogen peroxide in a trickle bedreactor-From bench scale to industrial scale. Chem. Eng. Process. Process Intensif. 2008, 47, 787–792. [CrossRef]
29. Wink, M. Biochemistry of Plant Secondary Metabolism. In Annual Plant Reviews, 2nd ed.; Wiley-Blackwell:Oxford, UK, 2010; Volume 40, pp. 483–485.
30. Duval, J.; Pecher, V.; Poujol, M.; Lesellier, E. Research advances for the extraction, analysis and uses ofanthraquinones: A review. Ind. Crops Prod. 2016, 94, 812–833. [CrossRef]
31. Brachmann, A.O.; Joyce, S.A.; Kodama, H.J.; Schwar, G.; Clarke, D.J.; Bode, H.B. A type II polyketidesynthase is responsible for anthraquinone biosynthesis in Photorhabdus luminescens. ChemBioChem 2007, 8,1721–1728. [CrossRef] [PubMed]
32. Pandey, R.P.; Parajuli, P.; Koffas, M.A.G.; Sohng, J.K. Microbial production of natural and non-naturalflavonoids: Pathway engineering, directed evolution and systems/synthetic biology. Biotechnol. Adv. 2016,34, 634–662. [CrossRef] [PubMed]
33. Pandey, R.P.; Gurung, R.B.; Parajuli, P.; Koirala, N.; Tuoi, L.T.; Sohng, J.K. Assessing acceptor substratepromiscuity of YjiC-mediated glycosylation toward flavonoids. Carbohydr. Res. 2014, 393, 26–31. [CrossRef][PubMed]
34. Parajuli, P.; Pandey, R.P.; Pokhrel, A.R.; Ghimire, G.P.; Sohng, J.K. Enzymatic glycosylation of the topicalantibiotic mupirocin. Glycoconj. J. 2014, 31, 563–572. [CrossRef] [PubMed]
35. Ghimire, G.P.; Koirala, N.; Pandey, R.P.; Jung, H.J.; Sohng, J.K. Modification of emodin and aloe-emodinby glycosylation in engineered Escherihia coli. World J. Microbiol. Biotechnol. 2015, 31, 611–619. [CrossRef][PubMed]
36. Zhang, W.; Ye, M.; Zhan, J.; Chen, Y.; Guo, D. Microbial glycosylation of four free anthraquinones byAbsidia coerulea. Biotechnol. Lett. 2004, 26, 127–131. [CrossRef] [PubMed]
37. Nam, W.; Kim, S.; Nam, S.; Friedman, M. Structure-Antioxidative and Anti-Inflammatory ActivityRelationships of Purpurin and Related Anthraquinones in Chemical and Cell Assays. Molecules 2017,22, 265. [CrossRef] [PubMed]
Sample Availability: Samples of the compounds are available from the authors.
© 2018 by the authors. Licensee MDPI, Basel, Switzerland. This article is an open accessarticle distributed under the terms and conditions of the Creative Commons Attribution(CC BY) license (http://creativecommons.org/licenses/by/4.0/).