Embed Size (px)
Citation preview
Millennial-Scale Response of a Western Mediterranean River to Late
Quaternary Climate Changes: A View from the Deep Sea
Lucile Bonneau,1,2,* Stéphan J. Jorry,2 Samuel Toucanne,2
Ricardo Silva Jacinto,2 and Laurent Emmanuel1
1. Laboratoire Biominéralisations et Environnements Sédimentaires, Université Pierre et Marie Curie; and Institutdes Sciences de la Terre de Paris, Paris, France; 2. Laboratoire Environnements Sédimentaires,
Institut français de recherche pour l’exploitation de la mer, F-29280 Plouzané, France
AB STRACT
Although it is widely accepted that erosion and sediment transfer respond to millennial-scale climatic variability,these changes remain difficult to detect in marine sedimentary archives. In the Var sediment-routing system,northwestern Mediterranean Sea, the absence of a continental shelf results in a direct connection between the VarRiver mouth and the deep basin during both highstand and lowstand conditions. This makes the Var sediment-routing system an ideal target to test whether rivers can transmit climate-driven high-frequency changes in sedimentflux to the ocean. On the basis of an unprecedented (centennial-to-millennial-scale) resolution in turbidite sequences,we reconstructed the activity of turbidity current overflows along the deep-sea Var Sedimentary Ridge over the past75 kyr. The overflow activity is highest (one event every 10–30 yr) during maximum glacial conditions (30 kyr–16 kyrago [ka]) and rapidly decreases (down to one event every 100–500 yr) during the last glacial-interglacial transition(Termination 1). During marine isotope stage (MIS)4 and MIS3 (75–30 ka), peaks in the overflow activity occurredsynchronously with cold and arid Dansgaard-Oeschger stadials, while warmer and wetter interstadial conditionscorrespond to low overflow activity. We conclude that overflow activity on the Var Sedimentary Ridge mainly re-flects changes in the magnitude of hyperpycnal currents flowing in the turbiditic channel-levee system in relationwith variations in suspended-sediment concentration during Var River floods. We show that this signal is sensitive tochanges in pure sediment flux induced by climatic perturbations occurring inland: (1) the decrease in glacier-derivedsediment input after glacier retreat and (2) changes in erosion induced by shifts in the vegetation cover in response toDansgaard-Oeschger climate swings.
Introduction
Sediment delivery to the ocean results from thebalance between sediment production by erosionand transfer/storage by fluvial systems (Schumm1977; Castelltort and Van Den Driessche 2003).Since the last glacial period (after 80 kyr ago [ka]),southern Europe has repeatedly undergone dras-tic climatic changes that have affected land sur-faces, including glacial termination (i.e., Termi-nation 1, from ca. 20 ka to 10 ka; Hinderer 2001;Moreno et al. 2012; Sternai et al. 2013) andDansgaard-Oeschger (D/O) cycles (e.g., Allen et al.
1999; Sánchez-Goñi et al. 2002; Fletcher andSánchez-Goñi 2008; Fletcher et al. 2010; Macklinet al. 2012), and have probably resulted in changesin the sediment budget delivered to the ocean(Kettner and Syvitsky 2008, 2009). These changesremain difficult to detect from the marine sedi-mentary archives because of the strong overprintexerted by the concomitant sea-level changes andthe subsequent emergence/flooding of continen-tal shelves that directly affects the morphologyof sediment-routing systems (e.g., drainage basinarea, hypsometry, and delta migration; Blum andTörnqvist 2000) and their ability to deliver sedi-ment to the ocean (Mulder and Syvitsky 1996; see,e.g., Toucanne et al. 2012 for the western Euro-pean margin). Therefore, the response of sedimen-tary systems to Late Quaternary climate changes
Manuscript received October 3, 2013; accepted June 2, 2014;electronically published October xx, 2014.
* Author for correspondence; e-mail: [email protected].
80411.proof.3d 1 10/17/14 02:17Achorn International
000
[The Journal of Geology, 2014, volume 122, p. 000–000] q 2014 by The University of Chicago.
All rights reserved. 0022-1376/2014/12206-00XX$15.00. DOI:10.1086/677844
is usually highlighted in close proximity with theerosion zone, such as in lacustrine records (e.g.,Hinderer 2001; Hinderer and Einsele 2001; Col-lier et al. 2000), or in fluvial incision/aggradationphases (e.g., Macklin et al. 2012 for a thorough re-view). As a result, large uncertainties remain con-cerning the ability of fluvial systems to transmitthe signal of millennial-scale perturbations to theocean (Castelltort and Van Den Driessche 2003;Meybeck and Vörösmarty 2005; Allen 2008; Jerol-mack and Paola 2010; Simpson and Castelltort2012; Armitage et al. 2013; Coulthard and Van deWiel 2013).
In this context, small, mountainous rivers drain-ing active margins with narrow shelves could pro-vide interesting study sites to investigate climaticcontrol of the amount of sediments delivered tothe ocean (Allen 2008; Romans et al. 2009; Covaultet al. 2010, 2011). Because sediment transfers aremostly ensured by periodic floods and because theirfloodplains and deltas/estuaries are reduced in size,these rivers are more likely to discharge larger per-centages of their sediment loads directly to thesea (i.e., a lesser proportion of sediments is seques-tered before entering the sea) than do large rivers(Milliman and Syvitsky 1992; Mulder and Syvit-sky 1996; Allen 2008). Thereafter, sediments caneasily escape the narrow shelves and feed deep ba-sins during both high and low stands of sea level(Milliman and Syvitsky 1992; Mulder and Syvit-sky 1996). Recent studies focusing on the termi-nus of short sediment-routing systems along theToyama Deep-Sea Channel (Japan; Nakajima andItaki 2007) and on the Newport deep-sea depo-sitional system (California; Covault et al. 2010)have shown that during specific intervals, climatechanges alone could have controlled the sedimen-tary inputs and the turbidite activity, with minorimpact from sea level fluctuations. This highlightsthat, in addition to lacustrine and fluvial environ-ments, deep-sea sediment accumulation in shortsediment-routing systems can be used to investi-gate the response of terrestrial surface erosion toclimate changes.
In this study, we focus on the sediment depo-sition pattern of the Var sediment-routing sys-tem (fig. 1),q1 located in the northwestern Mediter-ranean Sea, where the absence of a continentalshelf resulted in the direct connection betweenthe Var river mouth and the deep basin duringboth highstand and lowstand conditions (Savoyeet al. 1993). On the basis of sedimentary cores withhigh-resolution stratigraphic frameworks, we re-constructed the Late Pleistocene–Holocene tem-poral changes of unconfined turbidity-current ac-
tivities off the Var River, more precisely on thedeep-sea turbiditic levee (Var Sedimentary Ridge[VSR]). The results are comparedwith proxy recordsof climate and terrestrial erosion in the westernMediterranean realm in order to examine whetherrapid climate changes have driven the sediment-flux variability.
The Var Sediment-Routing System
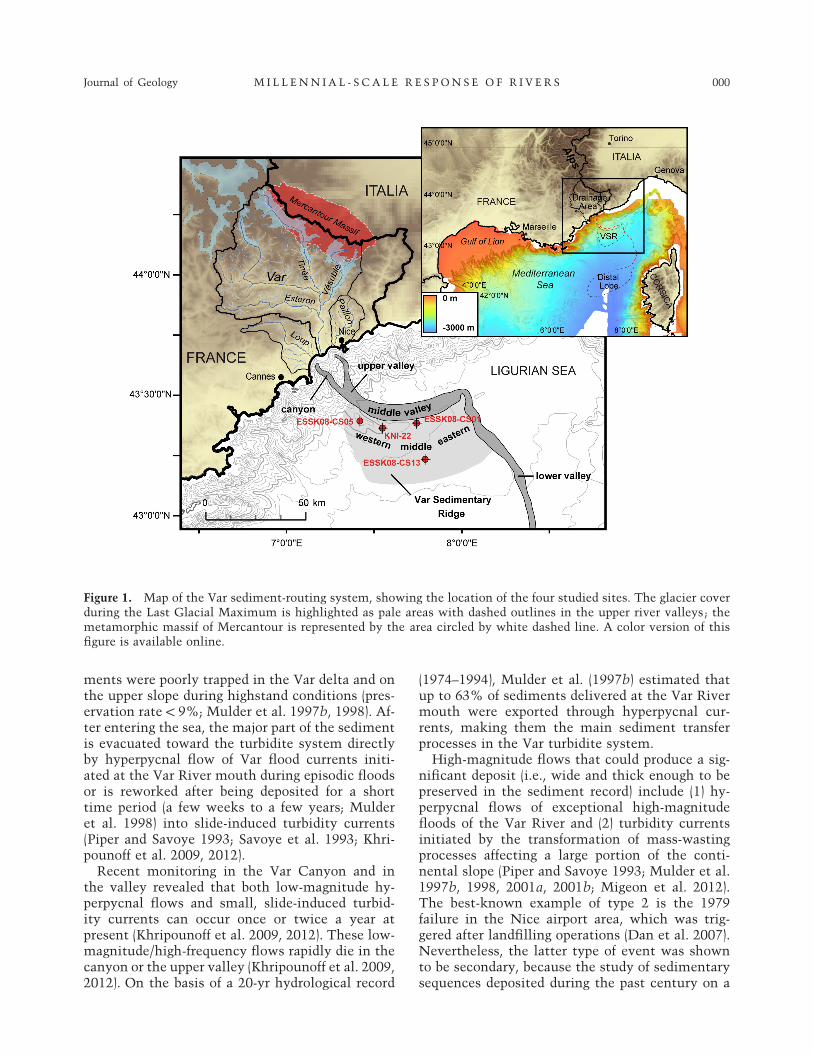
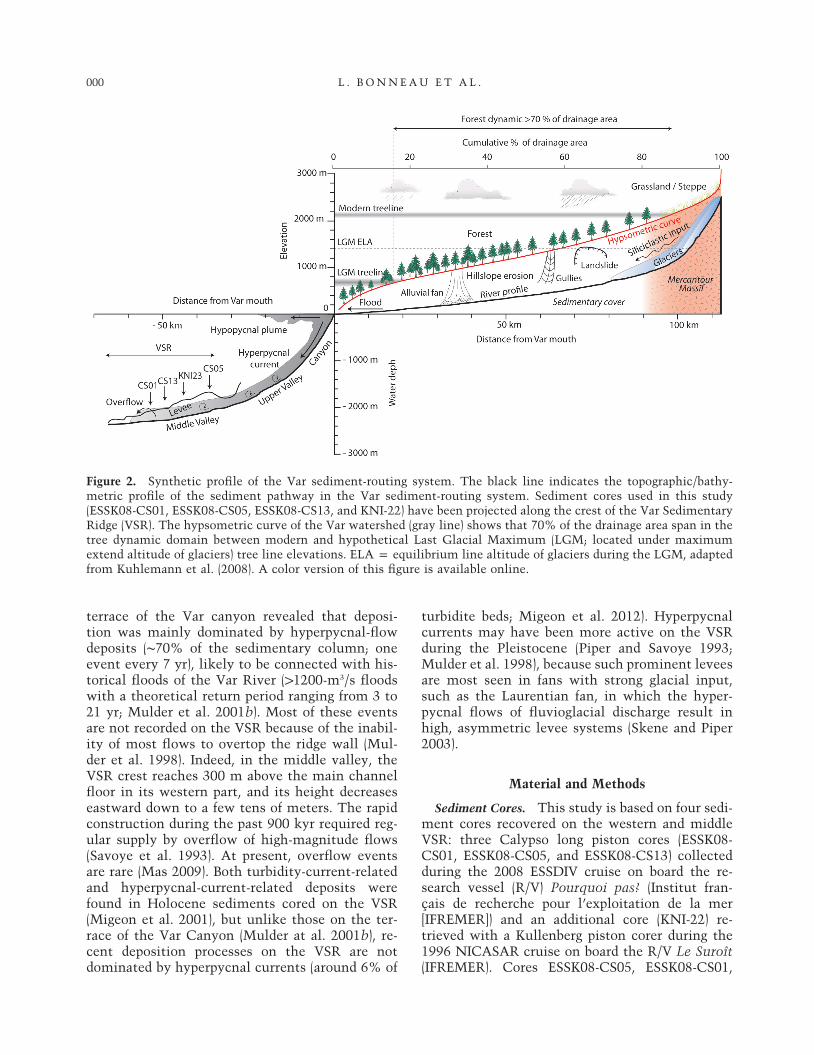
The Var sediment-routing system extends from theupper reaches of the southern French Alps (up to3000 m; fig. 2) q2to the deep Ligurian Sea in the Varturbiditic system that ends near the continentalslope of Corsica at a water depth of 2700 m (fig. 1).The southern French Alps margin is characterizedby a very narrow continental shelf (2–3 km maxi-mum; figs. 1, 2), which is even absent near the VarRiver mouth, off Nice. The continental slope issteep (up to 16%) and is incised by two main sub-marine canyons, the Var Canyon and the PaillonCanyon, directly connected to the Var and LoupRivers and to the Paillon River, respectively. Thesecanyons merge into a single upper valley at thebase of the continental slope. The deep deposi-tional system includes a prominent levee (the VSR)on the right-hand bank of the middle valley and adistal lobe at the end of the lower valley (fig. 1).
The Var River (120 km long; fig. 2) is the maincontributor of sediment to the deep depositionalsystem (Migeon et al. 2012). Annual sediment dis-charge of the Var River is estimated between 1.32and 1.63 million tons/yr (Mulder et al. 1997b,1998). The Var drainage area (ca. 2800 km2) is lo-cated on the edge between the Mediterranean andalpine domains and is characterized by a steepslope (mean slope: 237). Carbonate rocks from thealpine foreland form the downstream part of theriver basin, while igneous/metamorphic rocks ofexternal alpine massifs form the upstream areas(Mercantour Massif; figs. 1, 2). The high sedimentyield (about 500 tons/km2/yr) is mostly associatedwith episodic floods, which can reach a magnitude(1800 m3/s), larger than the mean annual discharge(70 m3/s), in only a few hours (Dubar and Anthony1995). Floods mainly occur in autumn, during theheavy rainfall season, and in spring, when snowmelts (Sage 1976). In 1994, a catastrophic, high-magnitude flood (200-yr flood) transported in a fewhours the amount of sediment that is normallytransported in 11–14 yr (Mulder et al. 1997b, 1998).
Holocene marine sedimentation rates recon-structed near the Var River mouth are a fraction(between 1/11 and 1/39) of those predicted by sedi-mentation models, q3thus revealing that the sedi-
80411.proof.3d 2 10/17/14 02:17Achorn International
000 L . B ONN EAU E T A L .
ments were poorly trapped in the Var delta and onthe upper slope during highstand conditions (pres-ervation rate ! 9%; Mulder et al. 1997b, 1998). Af-ter entering the sea, the major part of the sedimentis evacuated toward the turbidite system directlyby hyperpycnal flow of Var flood currents initi-ated at the Var River mouth during episodic floodsor is reworked after being deposited for a shorttime period (a few weeks to a few years; Mulderet al. 1998) into slide-induced turbidity currents(Piper and Savoye 1993; Savoye et al. 1993; Khri-pounoff et al. 2009, 2012).Recent monitoring in the Var Canyon and in
the valley revealed that both low-magnitude hy-perpycnal flows and small, slide-induced turbid-ity currents can occur once or twice a year atpresent (Khripounoff et al. 2009, 2012). These low-magnitude/high-frequency flows rapidly die in thecanyon or the upper valley (Khripounoff et al. 2009,2012). On the basis of a 20-yr hydrological record
(1974–1994), Mulder et al. (1997b) estimated thatup to 63% of sediments delivered at the Var Rivermouth were exported through hyperpycnal cur-rents, making them the main sediment transferprocesses in the Var turbidite system.High-magnitude flows that could produce a sig-
nificant deposit (i.e., wide and thick enough to bepreserved in the sediment record) include (1) hy-perpycnal flows of exceptional high-magnitudefloods of the Var River and (2) turbidity currentsinitiated by the transformation of mass-wastingprocesses affecting a large portion of the conti-nental slope (Piper and Savoye 1993; Mulder et al.1997b, 1998, 2001a, 2001b; Migeon et al. 2012).The best-known example of type 2 is the 1979failure in the Nice airport area, which was trig-gered after landfilling operations (Dan et al. 2007).Nevertheless, the latter type of event was shownto be secondary, because the study of sedimentarysequences deposited during the past century on a
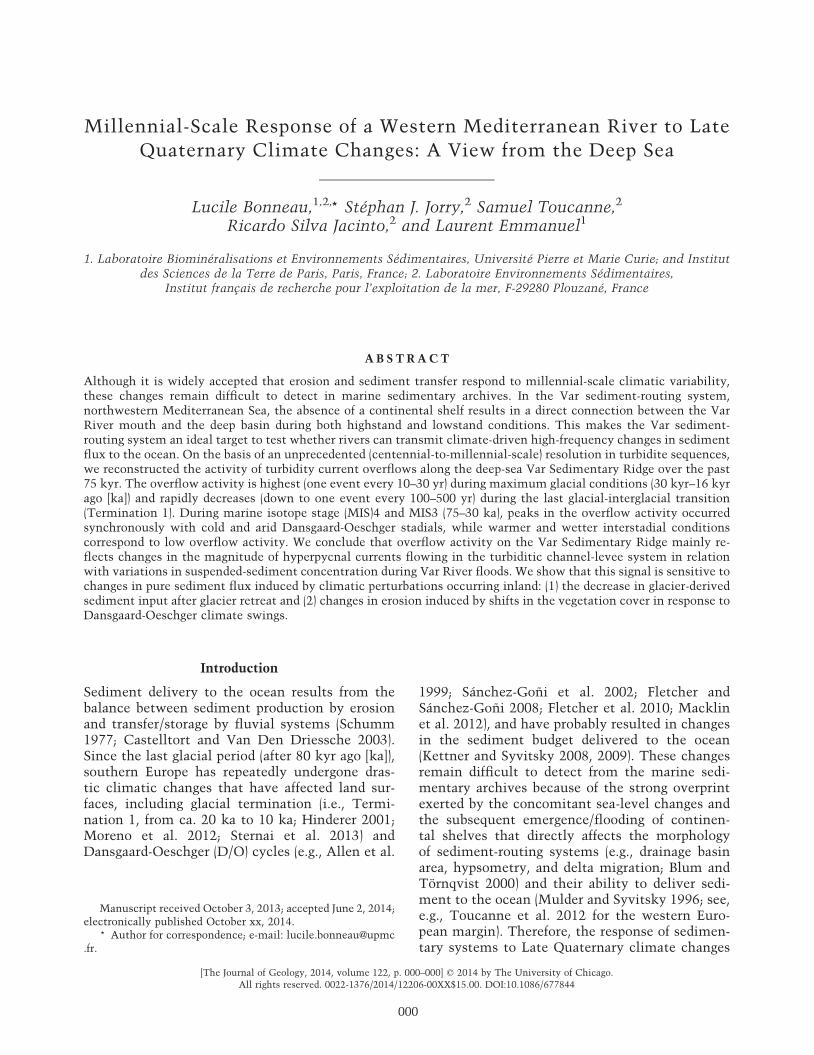
Figure 1. Map of the Var sediment-routing system, showing the location of the four studied sites. The glacier coverduring the Last Glacial Maximum is highlighted as pale areas with dashed outlines in the upper river valleys; themetamorphic massif of Mercantour is represented by the area circled by white dashed line. A color version of thisfigure is available online.
80411.proof.3d 3 10/17/14 02:17Achorn International
Journal of Geology 000M I L L E NN I A L - S C A L E R E S P ON S E O F R I V E R S
terrace of the Var canyon revealed that deposi-tion was mainly dominated by hyperpycnal-flowdeposits (∼70% of the sedimentary column; oneevent every 7 yr), likely to be connected with his-torical floods of the Var River (11200-m3/s floodswith a theoretical return period ranging from 3 to21 yr; Mulder et al. 2001b). Most of these eventsare not recorded on the VSR because of the inabil-ity of most flows to overtop the ridge wall (Mul-der et al. 1998). Indeed, in the middle valley, theVSR crest reaches 300 m above the main channelfloor in its western part, and its height decreaseseastward down to a few tens of meters. The rapidconstruction during the past 900 kyr required reg-ular supply by overflow of high-magnitude flows(Savoye et al. 1993). At present, overflow eventsare rare (Mas 2009). Both turbidity-current-relatedand hyperpycnal-current-related deposits werefound in Holocene sediments cored on the VSR(Migeon et al. 2001), but unlike those on the ter-race of the Var Canyon (Mulder at al. 2001b), re-cent deposition processes on the VSR are notdominated by hyperpycnal currents (around 6% of
turbidite beds; Migeon et al. 2012). Hyperpycnalcurrents may have been more active on the VSRduring the Pleistocene (Piper and Savoye 1993;Mulder et al. 1998), because such prominent leveesare most seen in fans with strong glacial input,such as the Laurentian fan, in which the hyper-pycnal flows of fluvioglacial discharge result inhigh, asymmetric levee systems (Skene and Piper2003).
Material and Methods
Sediment Cores. This study is based on four sedi-ment cores recovered on the western and middleVSR: three Calypso long piston cores (ESSK08-CS01, ESSK08-CS05, and ESSK08-CS13) collectedduring the 2008 ESSDIV cruise on board the re-search vessel (R/V) Pourquoi pas? q4(Institut fran-çais de recherche pour l’exploitation de la mer[IFREMER]) and an additional core (KNI-22) re-trieved with a Kullenberg piston corer during the1996 NICASAR cruise on board the R/V Le Suroît(IFREMER). Cores ESSK08-CS05, ESSK08-CS01,
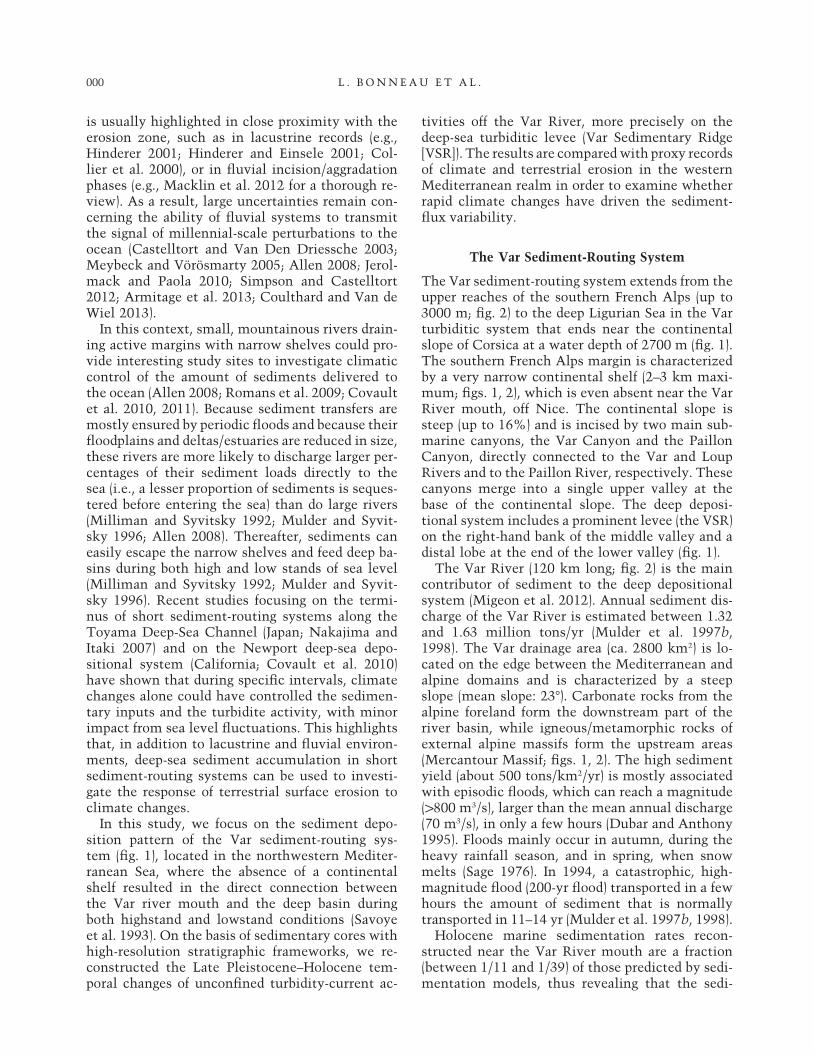
Figure 2. Synthetic profile of the Var sediment-routing system. The black line indicates the topographic/bathy-metric profile of the sediment pathway in the Var sediment-routing system. Sediment cores used in this study(ESSK08-CS01, ESSK08-CS05, ESSK08-CS13, and KNI-22) have been projected along the crest of the Var SedimentaryRidge (VSR). The hypsometric curve of the Var watershed (gray line) shows that 70% of the drainage area span in thetree dynamic domain between modern and hypothetical Last Glacial Maximum (LGM; located under maximumextend altitude of glaciers) tree line elevations. ELA p equilibrium line altitude of glaciers during the LGM, adaptedfrom Kuhlemann et al. (2008). A color version of this figure is available online.
80411.proof.3d 4 10/17/14 02:17Achorn International
000 L . B ONN EAU E T A L .
and KNI-22 were collected along the levee crest;core ESSK08-CS13 is located on the southwesternflank of the VSR (fig. 1). The location and coringcharacteristics of each core are described in table 1.Recognition of turbidite beds is based on visual
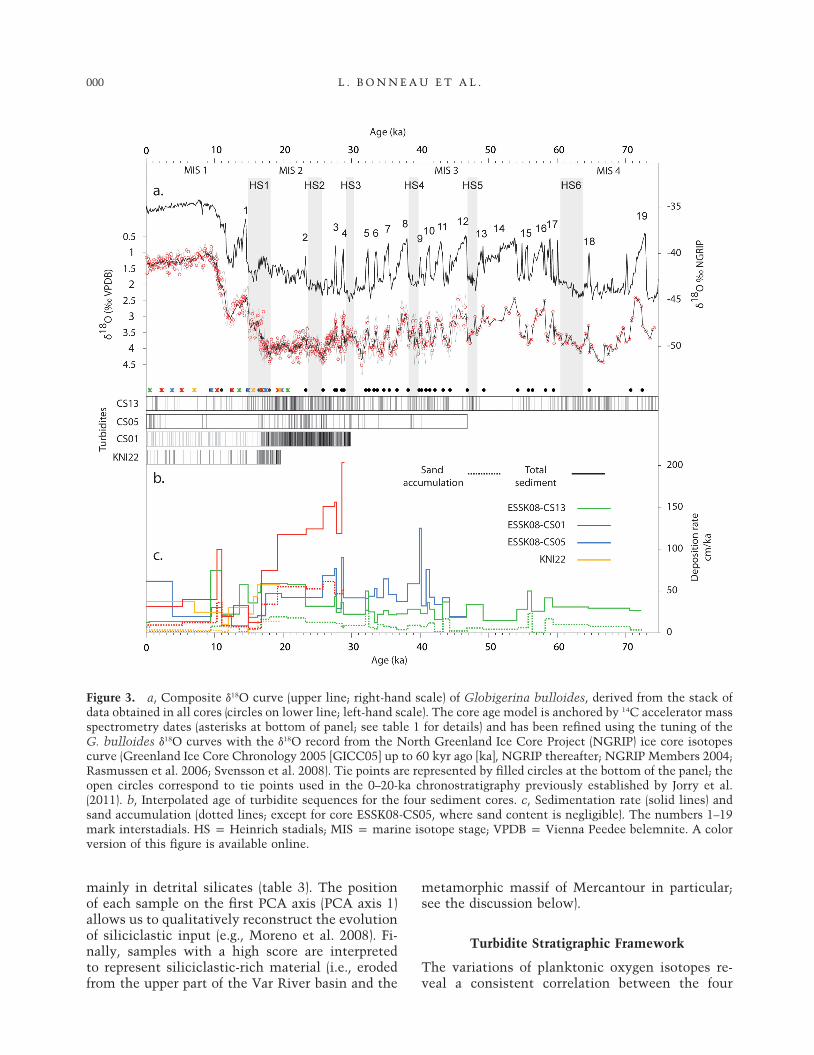
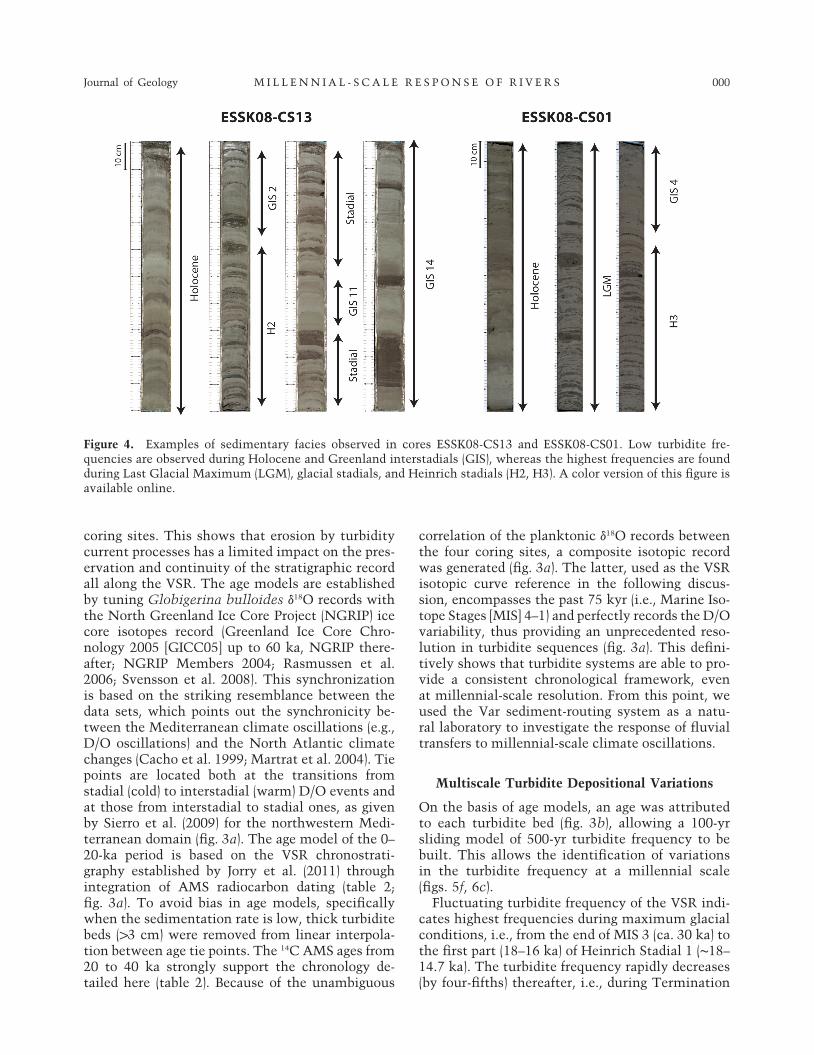
description. Core ESSK08-CS05 is located on theuppermost part of the VSR, where levee heightexceeds 300 m (fig. 2). The whole core is composedof hemipelagic mud and rare, very thin millimet-ric silt beds (fig. 3b).q5 In cores ESSK08-CS01 andKNI-22, the upper 5 m are mainly composed ofhemipelagic mud and a few turbidite beds, mainlyfine-grained, while numerous sandy beds, alter-nating with silt mud, are described in the lowerpart of the cores (figs. 3b, 4).q6 Core ESSK08-CS13,located on the southern flank of the VSR about20 km from the middle valley (fig. 1), shows richturbidite bed intervals alternating with thickhemipelagic facies (figs. 3b, 4). Core ESSK08-CS01,located on the lowermost part of the VSR crestabout 130 m above the canyon floor (fig. 2), con-tains the highest number of turbidite beds. Thecumulative length of sandy/silt beds (i.e., Tc ofthe Bouma sequence; Bouma 1962) is negligible incore ESSK08-CS05, while it represents about 15%in KNI-22, 30% in ESSK08-CS13, and 40% of thetotal length in ESSK08-CS01 (fig. 3b).
Stratigraphic Framework. Planktonic foramini-fers Globigerina bulloides have been used to estab-lish the chronostratigraphic framework and havebeen picked every 10 cm in hemipelagic layers.When the turbidites were too dense and the re-sumptions of hemipelagic deposition were not clear(e.g., core ESSK08-CS01; fig. 4), samples have beentaken in the uppermost part of the turbidite se-quence (Te-d of the Bouma sequence; Bouma 1962),where the lithic sand content theoretically is ab-sent and no foraminifers transported by turbiditycurrents can be found (Zaragosi et al. 2006). How-ever, the sand fraction (1125 mm) was checked afterwashing and before the picking of foraminifers.Samples with a large content of lithic grains (120%)were removed in order to avoid analysis of alloch-tonous foraminifers.The oxygen isotopic composition of G. bulloides
was measured on a few specimens (3–5 shells)
weighing from 20 to 50 mg. CO2 was extracted witha Kiel IV carbonate device, and analyses were per-formed on a DELTA V isotope ratio mass spec-trometer at the Pierre and Marie Curie University(Paris). Isotope values are reported in delta nota-tion relative to Vienna Peedee belemnite. Repeatedanalyses of a marble working reference (calibratedagainst the international reference NBS-19) showan accuracy and precision of 0.1‰ (1j). The oxygenisotope curves of the first 7 m of cores ESSK08-CS013, ESSK08-CS05, and KNI-22 were previouslypublished by Jorry et al. (2011).Radiocarbon accelerator mass spectrometry
(AMS) dating was provided by the Poznan Radio-carbon Laboratory (Poland) and the Laboratoire deMesure du Carbone 14 (Commissariat à l’énergieatomique et aux énergies alternatives [CEA] Sac-lay, Gif-sur-Yvette, France) q7and was measured onabout 10 mg of G. bulloides or bulk planktonicforaminifers (see details in table 2). The 14C ageswere calibrated with Calib.06 software and theIntCal09 calibration curve (Reimer 2009; table 2).
q8A reservoir age of 400 yr was used. Calibratedkiloyears before present are referred to as age “ka”in this contribution.
Geochemical Analyses. In core ESSK08-CS05, X-ray fluorescence (XRF) semiquantitative elementdata were produced on an Avaatech XRF core scan-ner at IFREMER (France) at a step size set of 1 cm.Two measurements were performed, both count-ing times being integrated over 10 s. The first mea-surement was realized with an X-ray current of600 mA and 10 kV, giving access to light elementssuch as Al, Si, Ca, Cl, S, Ti, K, Mn, and Fe. Thesecond measurement, using an X-ray current of1000 mA and 30 kV, measured Rb, Sr, and Zr. Ele-ment abundance is expressed in count rate (area).Principal-component analysis (PCA) was carriedout with an XRF core-scanner data set of 12 in-dependent geochemical variables (1876 cases) inorder to describe the main variance of the data set,providing common trends observed for each ele-ment. The first eigenvector of PCA, accounting for58.5% of the total variance, displays low Ca valuesassociated with high positive scores for Al, Si, K,Ti, Fe, Rb, and Zr, the latter elements being present
Table 1. Location, bathymetry, and length of the studied cores
Core Cruise Research vessel Latitude Longitude Water depth (m) Length (cm)
KNI-22 NICASAR Le Suroît 43721.75′N 7732.63′E 1900 849ESSK08-CS01 ESSDIV Pourquoi Pas? 43723.24′N 7744.181′E 2130 1052ESSK08-CS05 ESSDIV Pourquoi Pas? 43723.60′N 7725.190′E 1694 2878ESSK08-CS13 ESSDIV Pourquoi Pas? 43714.922′N 7747.817′E 2473 2450
80411.proof.3d 5 10/17/14 02:17Achorn International
Journal of Geology 000M I L L E NN I A L - S C A L E R E S P ON S E O F R I V E R S
mainly in detrital silicates (table 3).q9 The positionof each sample on the first PCA axis (PCA axis 1)allows us to qualitatively reconstruct the evolutionof siliciclastic input (e.g., Moreno et al. 2008). Fi-nally, samples with a high score are interpretedto represent siliciclastic-rich material (i.e., erodedfrom the upper part of the Var River basin and the
metamorphic massif of Mercantour in particular;see the discussion below).
Turbidite Stratigraphic Framework
The variations of planktonic oxygen isotopes re-veal a consistent correlation between the four
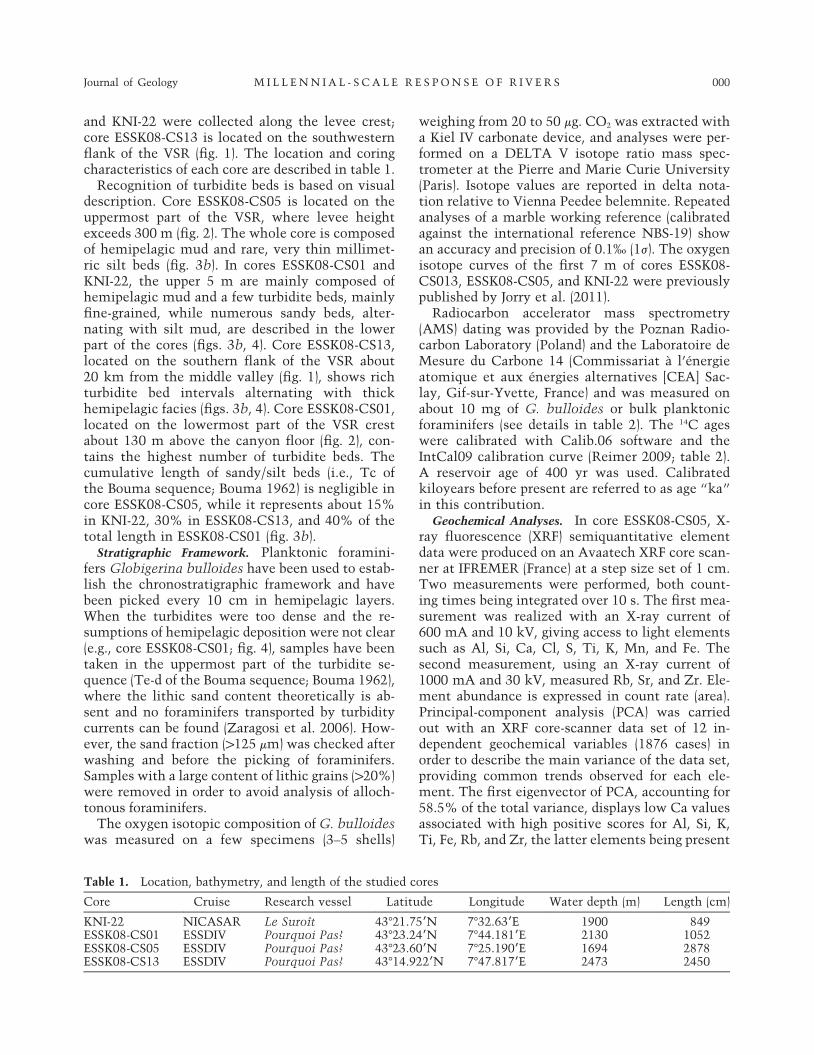
Figure 3. a, Composite d18O curve (upper line; right-hand scale) of Globigerina bulloides, derived from the stack ofdata obtained in all cores (circles on lower line; left-hand scale). The core age model is anchored by 14C accelerator massspectrometry dates (asterisks at bottom of panel; see table 1 for details) and has been refined using the tuning of theG. bulloides d18O curves with the d18O record from the North Greenland Ice Core Project (NGRIP) ice core isotopescurve (Greenland Ice Core Chronology 2005 [GICC05] up to 60 kyr ago [ka], NGRIP thereafter; NGRIP Members 2004;Rasmussen et al. 2006; Svensson et al. 2008). Tie points are represented by filled circles at the bottom of the panel; theopen circles correspond to tie points used in the 0–20-ka chronostratigraphy previously established by Jorry et al.(2011). b, Interpolated age of turbidite sequences for the four sediment cores. c, Sedimentation rate (solid lines) andsand accumulation (dotted lines; except for core ESSK08-CS05, where sand content is negligible). The numbers 1–19mark interstadials. HS p Heinrich stadials; MIS p marine isotope stage; VPDB p Vienna Peedee belemnite. A colorversion of this figure is available online.
80411.proof.3d 6 10/17/14 02:17Achorn International
000 L . B ONN EAU E T A L .
coring sites. This shows that erosion by turbiditycurrent processes has a limited impact on the pres-ervation and continuity of the stratigraphic recordall along the VSR. The age models are establishedby tuning Globigerina bulloides d18O records withthe North Greenland Ice Core Project (NGRIP) icecore isotopes record (Greenland Ice Core Chro-nology 2005 [GICC05] up to 60 ka, NGRIP there-after; NGRIP Members 2004;q10 Rasmussen et al.2006; Svensson et al. 2008). This synchronizationis based on the striking resemblance between thedata sets, which points out the synchronicity be-tween the Mediterranean climate oscillations (e.g.,D/O oscillations) and the North Atlantic climatechanges (Cacho et al. 1999; Martrat et al. 2004). Tiepoints are located both at the transitions fromstadial (cold) to interstadial (warm) D/O events andat those from interstadial to stadial ones, as givenby Sierro et al. (2009) for the northwestern Medi-terranean domain (fig. 3a). The age model of the 0–20-ka period is based on the VSR chronostrati-graphy established by Jorry et al. (2011) throughintegration of AMS radiocarbon dating (table 2;fig. 3a). To avoid bias in age models, specificallywhen the sedimentation rate is low, thick turbiditebeds (13 cm) were removed from linear interpola-tion between age tie points. The 14C AMS ages from20 to 40 ka strongly support the chronology de-tailed here (table 2). Because of the unambiguous
correlation of the planktonic d18O records betweenthe four coring sites, a composite isotopic recordwas generated (fig. 3a). The latter, used as the VSRisotopic curve reference in the following discus-sion, encompasses the past 75 kyr (i.e., Marine Iso-tope Stages [MIS] 4–1) and perfectly records the D/Ovariability, thus providing an unprecedented reso-lution in turbidite sequences (fig. 3a). This defini-tively shows that turbidite systems are able to pro-vide a consistent chronological framework, evenat millennial-scale resolution. From this point, weused the Var sediment-routing system as a natu-ral laboratory to investigate the response of fluvialtransfers to millennial-scale climate oscillations.
Multiscale Turbidite Depositional Variations
On the basis of age models, an age was attributedto each turbidite bed (fig. 3b), allowing a 100-yrsliding model of 500-yr turbidite frequency to bebuilt. This allows the identification of variationsin the turbidite frequency at a millennial scale(figs. 5f, 6c). q11
Fluctuating turbidite frequency of the VSR indi-cates highest frequencies during maximum glacialconditions, i.e., from the end of MIS 3 (ca. 30 ka) tothe first part (18–16 ka) of Heinrich Stadial 1 (∼18–14.7 ka). The turbidite frequency rapidly decreases(by four-fifths) thereafter, q12i.e., during Termination
Figure 4. Examples of sedimentary facies observed in cores ESSK08-CS13 and ESSK08-CS01. Low turbidite fre-quencies are observed during Holocene and Greenland interstadials (GIS), whereas the highest frequencies are foundduring Last Glacial Maximum (LGM), glacial stadials, and Heinrich stadials (H2, H3). A color version of this figure isavailable online.
80411.proof.3d 7 10/17/14 02:17Achorn International
Journal of Geology 000M I L L E NN I A L - S C A L E R E S P ON S E O F R I V E R S
1 (with the maximum decrease centered at 16 ka)and reaches minimum values during the Early Ho-locene (11.7–5 ka; fig. 5f ).
In detail, the VSR turbidite frequency duringMIS 4 and MIS 3 shows a strong correlation withthe climatic variations recorded in the planktonicd18O record (figs. 4, 6).q13 Peaks in the turbidite fre-quency occurred synchronously with D/O stadials(5–10 turbidites/500 yr at site ESSK08-CS13), while
interstadial conditions corresponded to low turbi-dite frequencies (0–5 turbidites/500 yr). As a result,the turbidite activity seems to be directly con-nected to D/O climate perturbations, according toa cold-high/warm-low turbidite activity pattern(fig. 6). The latter relationship is emphasized by thefact that frequencies as low as those encounteredduring the Early Holocene are reached when in-terstadial conditions are maintained long enough,
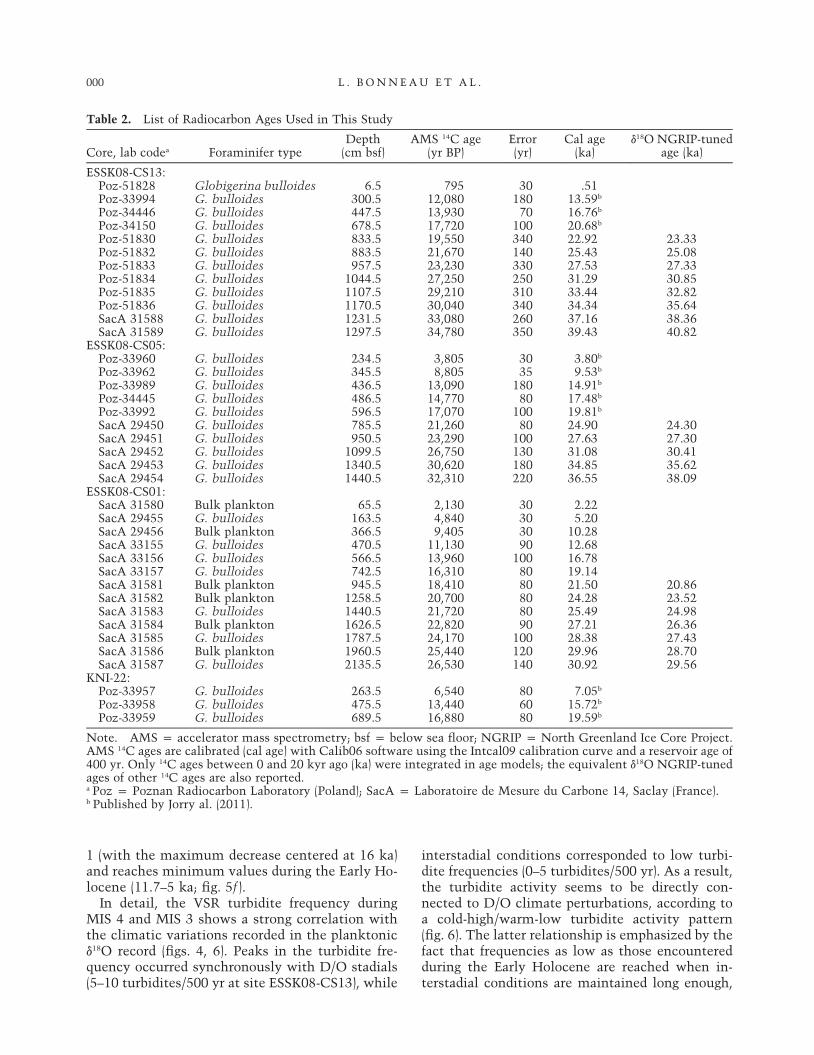
Table 2. List of Radiocarbon Ages Used in This Study
Core, lab codea Foraminifer typeDepth(cm bsf)
AMS 14C age(yr BP)
Error(yr)
Cal age(ka)
d18O NGRIP-tunedage (ka)
ESSK08-CS13:Poz-51828 Globigerina bulloides 6.5 795 30 .51Poz-33994 G. bulloides 300.5 12,080 180 13.59b
Poz-34446 G. bulloides 447.5 13,930 70 16.76b
Poz-34150 G. bulloides 678.5 17,720 100 20.68b
Poz-51830 G. bulloides 833.5 19,550 340 22.92 23.33Poz-51832 G. bulloides 883.5 21,670 140 25.43 25.08Poz-51833 G. bulloides 957.5 23,230 330 27.53 27.33Poz-51834 G. bulloides 1044.5 27,250 250 31.29 30.85Poz-51835 G. bulloides 1107.5 29,210 310 33.44 32.82Poz-51836 G. bulloides 1170.5 30,040 340 34.34 35.64SacA 31588 G. bulloides 1231.5 33,080 260 37.16 38.36SacA 31589 G. bulloides 1297.5 34,780 350 39.43 40.82
ESSK08-CS05:Poz-33960 G. bulloides 234.5 3,805 30 3.80b
Poz-33962 G. bulloides 345.5 8,805 35 9.53b
Poz-33989 G. bulloides 436.5 13,090 180 14.91b
Poz-34445 G. bulloides 486.5 14,770 80 17.48b
Poz-33992 G. bulloides 596.5 17,070 100 19.81b
SacA 29450 G. bulloides 785.5 21,260 80 24.90 24.30SacA 29451 G. bulloides 950.5 23,290 100 27.63 27.30SacA 29452 G. bulloides 1099.5 26,750 130 31.08 30.41SacA 29453 G. bulloides 1340.5 30,620 180 34.85 35.62SacA 29454 G. bulloides 1440.5 32,310 220 36.55 38.09
ESSK08-CS01:SacA 31580 Bulk plankton 65.5 2,130 30 2.22SacA 29455 G. bulloides 163.5 4,840 30 5.20SacA 29456 Bulk plankton 366.5 9,405 30 10.28SacA 33155 G. bulloides 470.5 11,130 90 12.68SacA 33156 G. bulloides 566.5 13,960 100 16.78SacA 33157 G. bulloides 742.5 16,310 80 19.14SacA 31581 Bulk plankton 945.5 18,410 80 21.50 20.86SacA 31582 Bulk plankton 1258.5 20,700 80 24.28 23.52SacA 31583 G. bulloides 1440.5 21,720 80 25.49 24.98SacA 31584 Bulk plankton 1626.5 22,820 90 27.21 26.36SacA 31585 G. bulloides 1787.5 24,170 100 28.38 27.43SacA 31586 Bulk plankton 1960.5 25,440 120 29.96 28.70SacA 31587 G. bulloides 2135.5 26,530 140 30.92 29.56
KNI-22:Poz-33957 G. bulloides 263.5 6,540 80 7.05b
Poz-33958 G. bulloides 475.5 13,440 60 15.72b
Poz-33959 G. bulloides 689.5 16,880 80 19.59b
Note. AMS p accelerator mass spectrometry; bsf p below sea floor; NGRIP p North Greenland Ice Core Project.AMS 14C ages are calibrated (cal age) with Calib06 software using the Intcal09 calibration curve and a reservoir age of400 yr. Only 14C ages between 0 and 20 kyr ago (ka) were integrated in age models; the equivalent d18O NGRIP-tunedages of other 14C ages are also reported.a Poz p Poznan Radiocarbon Laboratory (Poland); SacA p Laboratoire de Mesure du Carbone 14, Saclay (France).b Published by Jorry al. (2011).
80411.proof.3d 8 10/17/14 02:17Achorn International
000 L . B ONN EAU E T A L .
precisely during D/O interstadials 8, 12, 14, 16, and19. As a consequence, frequencies of D/O cycles 5–12 (47–30 ka) seem to be modulated by the so-called Bond cycles (Bond et al. 1993), during whichmaximum turbidite activity is coeval with Hein-rich stadials (fig. 6).
Discussion
Do Temporal Variations of Turbidite Deposits on the
VSR Reflect Changes in Sediment Input at the River
Mouth? Our results show that deep turbidite ac-cumulation seems to respond to climatic changesat centennial-to-millennial timescales (figs. 5, 6).Nevertheless, before drawing conclusions aboutthe mechanisms driven by climate changes thatcontrol sediment erosion and transfer in the Varsediment-routing system, it is important to defineto what extent temporal variations in turbidite de-posits on the VSR reflect changes in sediment in-put at the river mouth.On the VSR, vertical accumulation (in a single
core) of turbidites reflects variations in overflowactivity of turbidity currents through time. Onthe other hand, the increase in the number of tur-bidite beds and sand content eastward (down-stream; from core ESSK08-CS05 to ESSK08-CS01,located at about 300 and 130 m above the canyonfloor, respectively; figs. 3b, 3c, 5f ) is likely causedby the gradual decrease of the elevation of theVSR, which becomes less and less effective at con-fining the flows (Piper and Savoye 1993; Migeonet al. 2001; Dennielou et al. 2006; fig. 2).
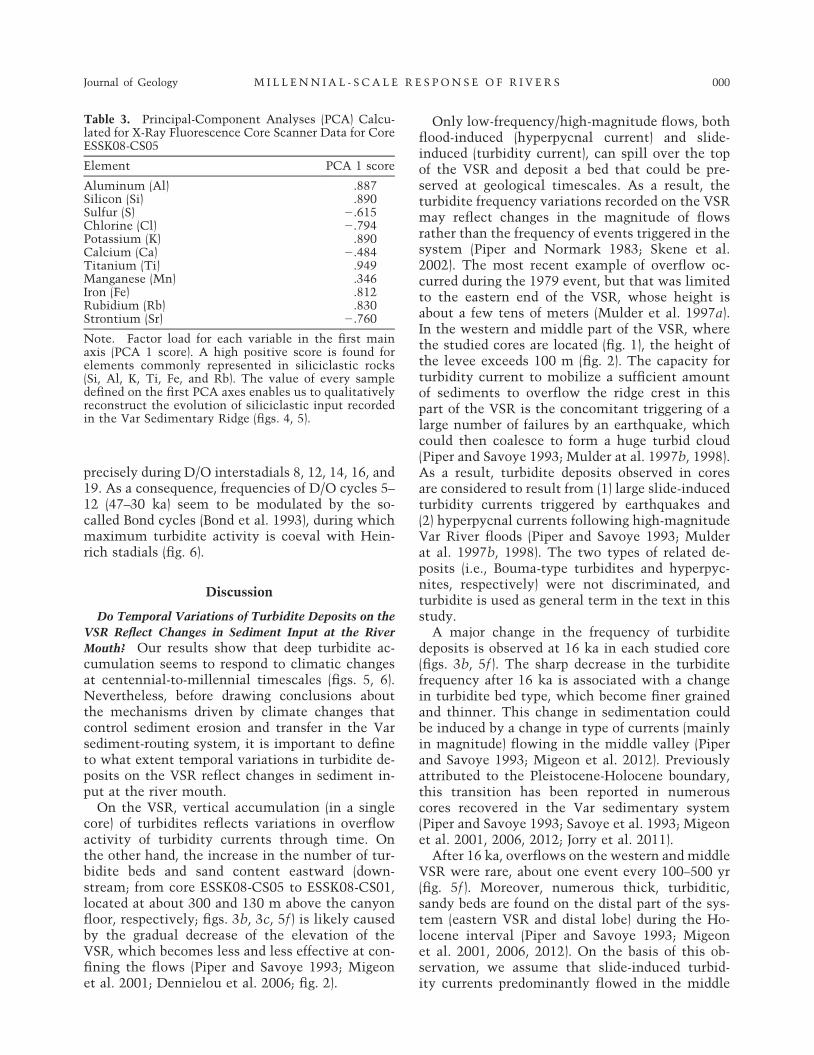
Only low-frequency/high-magnitude flows, bothflood-induced (hyperpycnal current) and slide-induced (turbidity current), can spill over the topof the VSR and deposit a bed that could be pre-served at geological timescales. As a result, theturbidite frequency variations recorded on the VSRmay reflect changes in the magnitude of flowsrather than the frequency of events triggered in thesystem (Piper and Normark 1983; Skene et al.2002). The most recent example of overflow oc-curred during the 1979 event, but that was limitedto the eastern end of the VSR, whose height isabout a few tens of meters (Mulder et al. 1997a).In the western and middle part of the VSR, wherethe studied cores are located (fig. 1), the height ofthe levee exceeds 100 m (fig. 2). The capacity forturbidity current to mobilize a sufficient amountof sediments to overflow the ridge crest in thispart of the VSR is the concomitant triggering of alarge number of failures by an earthquake, whichcould then coalesce to form a huge turbid cloud(Piper and Savoye 1993; Mulder at al. 1997b, 1998).
q14As a result, turbidite deposits observed in coresare considered to result from (1) large slide-inducedturbidity currents triggered by earthquakes and(2) hyperpycnal currents following high-magnitudeVar River floods (Piper and Savoye 1993; Mulderat al. 1997b, 1998). The two types of related de-posits (i.e., Bouma-type turbidites and hyperpyc-nites, respectively) were not discriminated, andturbidite is used as general term in the text in thisstudy.A major change in the frequency of turbidite
deposits is observed at 16 ka in each studied core(figs. 3b, 5f ). The sharp decrease in the turbiditefrequency after 16 ka is associated with a changein turbidite bed type, which become finer grainedand thinner. This change in sedimentation couldbe induced by a change in type of currents (mainlyin magnitude) flowing in the middle valley (Piperand Savoye 1993; Migeon et al. 2012). Previouslyattributed to the Pleistocene-Holocene boundary,this transition has been reported in numerouscores recovered in the Var sedimentary system(Piper and Savoye 1993; Savoye et al. 1993; Migeonet al. 2001, 2006, 2012; Jorry et al. 2011).After 16 ka, overflows on the western and middle
VSR were rare, about one event every 100–500 yr(fig. 5f ). Moreover, numerous thick, turbiditic,sandy beds are found on the distal part of the sys-tem (eastern VSR and distal lobe) during the Ho-locene interval (Piper and Savoye 1993; Migeonet al. 2001, 2006, 2012). On the basis of this ob-servation, we assume that slide-induced turbid-ity currents predominantly flowed in the middle
Table 3. Principal-Component Analyses (PCA) Calcu-lated for X-Ray Fluorescence Core Scanner Data for CoreESSK08-CS05
Element PCA 1 score
Aluminum (Al) .887Silicon (Si) .890Sulfur (S) 2.615Chlorine (Cl) 2.794Potassium (K) .890Calcium (Ca) 2.484Titanium (Ti) .949Manganese (Mn) .346Iron (Fe) .812Rubidium (Rb) .830Strontium (Sr) 2.760
Note. Factor load for each variable in the first mainaxis (PCA 1 score). A high positive score is found forelements commonly represented in siliciclastic rocks(Si, Al, K, Ti, Fe, and Rb). The value of every sampledefined on the first PCA axes enables us to qualitativelyreconstruct the evolution of siliciclastic input recordedin the Var Sedimentary Ridge (figs. 4, 5).
80411.proof.3d 9 10/17/14 02:17Achorn International
Journal of Geology 000M I L L E NN I A L - S C A L E R E S P ON S E O F R I V E R S
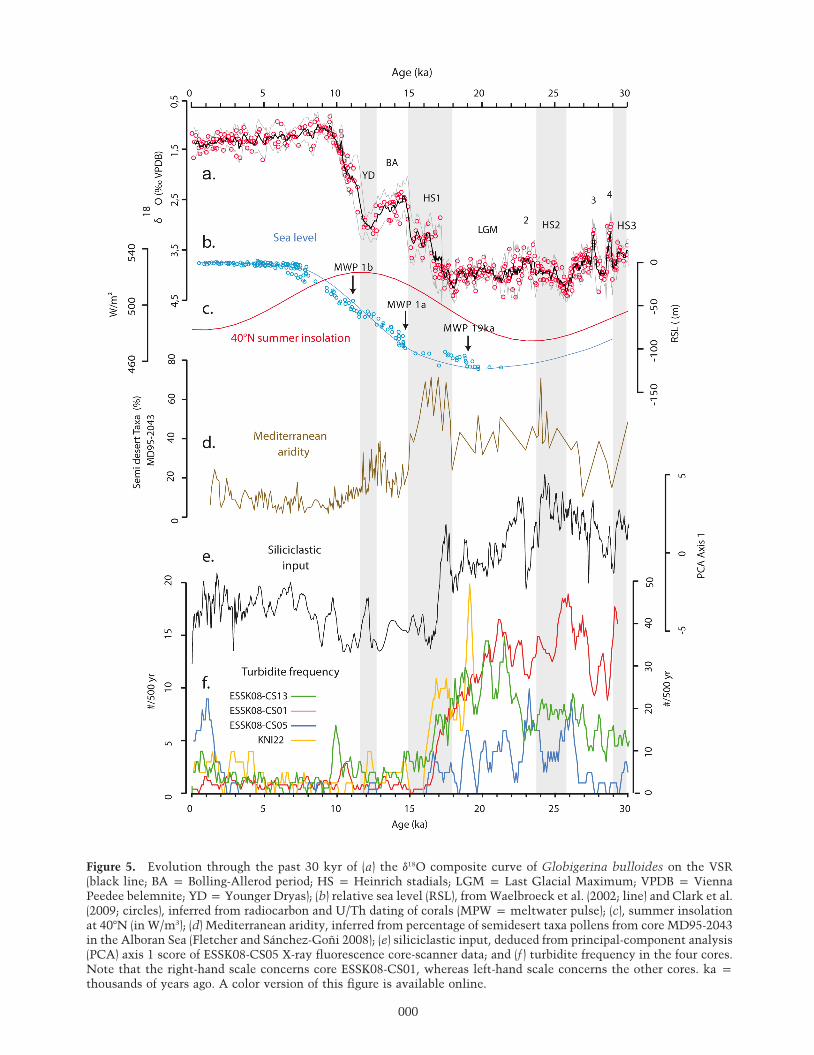
Figure 5. Evolution through the past 30 kyr of (a) the d18O composite curve of Globigerina bulloides on the VSR(black line; BA p Bolling-Allerod period; HS p Heinrich stadials; LGM p Last Glacial Maximum; VPDB p ViennaPeedee belemnite; YDp Younger Dryas); (b) relative sea level (RSL), fromWaelbroeck et al. (2002; line) and Clark et al.(2009; circles), inferred from radiocarbon and U/Th dating of corals (MPW p meltwater pulse); (c), summer insolationat 407N (in W/m3); (d) Mediterranean aridity, inferred from percentage of semidesert taxa pollens from core MD95-2043in the Alboran Sea (Fletcher and Sánchez-Goñi 2008); (e) siliciclastic input, deduced from principal-component analysis(PCA) axis 1 score of ESSK08-CS05 X-ray fluorescence core-scanner data; and (f ) turbidite frequency in the four cores.Note that the right-hand scale concerns core ESSK08-CS01, whereas left-hand scale concerns the other cores. ka p
thousands of years ago. A color version of this figure is available online.
80411.proof.3d 10 10/17/14 02:17Achorn International
000
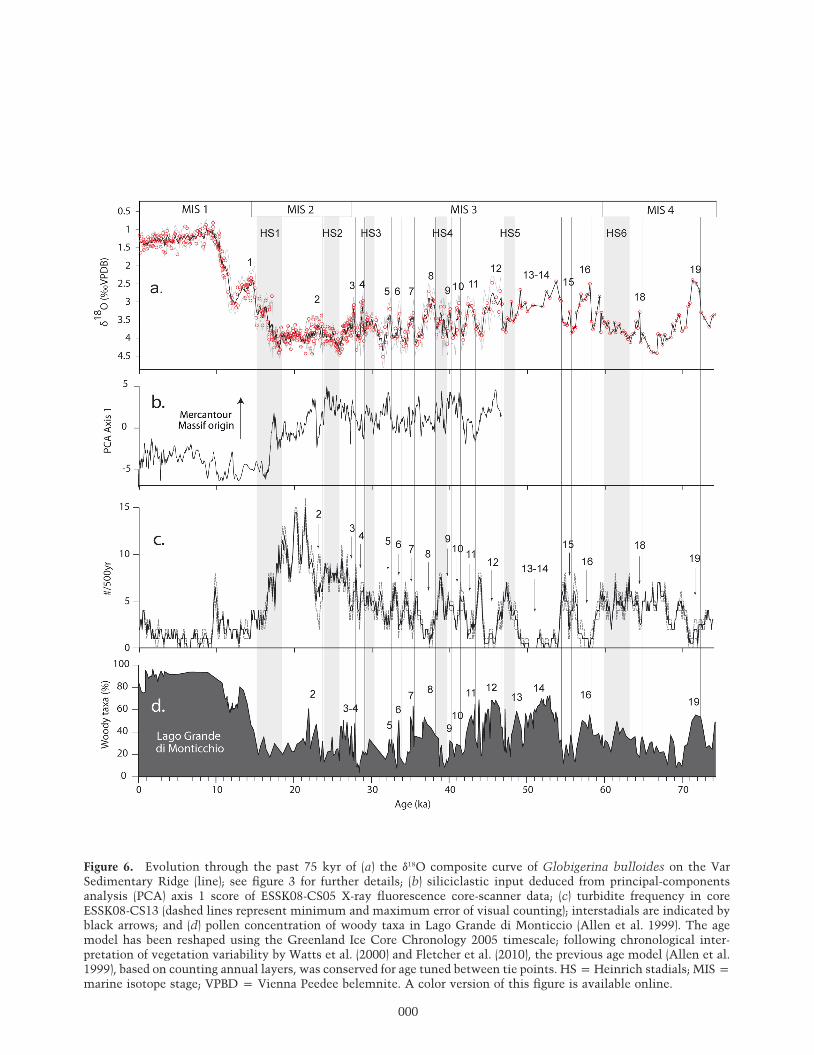
Figure 6. Evolution through the past 75 kyr of (a) the d18O composite curve of Globigerina bulloides on the VarSedimentary Ridge (line); see figure 3 for further details; (b) siliciclastic input deduced from principal-componentsanalysis (PCA) axis 1 score of ESSK08-CS05 X-ray fluorescence core-scanner data; (c) turbidite frequency in coreESSK08-CS13 (dashed lines represent minimum and maximum error of visual counting); interstadials are indicated byblack arrows; and (d) pollen concentration of woody taxa in Lago Grande di Monticcio (Allen et al. 1999). The agemodel has been reshaped using the Greenland Ice Core Chronology 2005 timescale; following chronological inter-pretation of vegetation variability by Watts et al. (2000) and Fletcher et al. (2010), the previous age model (Allen et al.1999), based on counting annual layers, was conserved for age tuned between tie points. HSpHeinrich stadials; MISp
marine isotope stage; VPBD p Vienna Peedee belemnite. A color version of this figure is available online.
80411.proof.3d 11 10/17/14 02:17Achorn International
000
valley after 16 ka. Indeed, such fast (with a largecontent of sands eroded from the channel) andthin flows hardly spilled over the (100–300-m-high)western and middle VSR but may have depositedsand beds downstream, where the elevation of thelevee decreases significantly. As a result, the lowfrequency of turbidites and the low sedimentationrate observed in cores after 16 ka (figs. 3, 5f ) are, aspreviously suggested by Piper and Savoye (1993),more likely caused by flows bypassing the upper/middle VSR, shifting the sedimentation prefer-entially to the downstream portion of the sys-tem, rather than by disconnection of the deep de-positional system from the Var River in responseto deglacial sea level change. This assumption isstrongly supported by the absence of a continentalshelf off the Var River, enabling a perennial river-canyon connection through time (Savoye et al.1993).
Before 16 ka (i.e., during the Pleistocene), over-flows on the western and middle VSR were fre-quent, up to one event every 10–30 yr (fig. 5f ). Tur-bidite beds are thick (several centimeters) andcomposed of mixed sediments. These beds wereprobably deposited by slow (carrying a largeamount of mud) and thick currents with a dura-tion of days to weeks (Piper and Savoye 1993;Mulder et al. 2001a, 2003). Given the absence ofcontinental shelf, no morphological difference inthe Var delta between lowstand and highstandconditions could have induced slide-related tur-bidity currents with such characteristics (Piper andSavoye 1993). So we assume that the characteris-tics of Pleistocene flows correspond more closelyto flood-induced hyperpycnal currents (Mulderand Alexander 2001; Alexander and Mulder 2002;Piper and Normark 2009) originated from the VarRiver (Piper and Savoye 1993; Mulder et al. 1998,2001a). The continental influence of such currentsis supported by the low abundance of coccolithsin Pleistocene turbidite beds (Piper and Savoye1993; Mulder and Alexander 2001). The high fre-quency of turbidites observed on the western/mid-dle VSR before 16 ka may reflect that hyperpycnalcurrents spilling over the VSR occurred more fre-quently than during Termination 1 and the Holo-cene. This result does not necessarily reflect anincreasing number of hyperpycnal events in the Varsediment-routing system but could indicate thata larger volume of sediments was involved dur-ing glacial times, at least during high-magnitudeevents (Piper and Normark 1983).
We conclude that variations in frequency ofoverflows recorded in cores from the western-to-middle VSR mainly reflect changes in the magni-
tude of hyperpycnal flows of Var River floods. Low-magnitude events represent the main part of thesediment flux in the Var sediment-routing system(Mulder et al. 1997b, 1998) but have a very limitedimportance in the geological record, since theydo not deposit sediments on the VSR, where theyhave the best chance of being preserved in the longterm. Furthermore, high-magnitude events con-tributed sporadically to sediment flux but werevery important for the interpretation of the geo-logical record. Therefore, we cannot affirm thatevolution of the frequency of high-magnitude hy-perpycnal currents, observed in cores, is represen-tative of variations in the sediment flux transitingthe system. Nevertheless, this signal is mainly re-lated to flood magnitude, and thus it contains in-formation about the climate conditions that pre-vailed in the drainage area. Indeed, the capacity ofa river to generate hyperpycnal flows with vari-ous frequency, magnitude, and duration dependson relationships between the suspended-sedimentconcentration and the water discharge (i.e., den-sity contrast with seawater) that are highly sensi-tive to climate conditions (Mulder and Syvitsky1995; Mulder et al. 1997b, 1998, 2003). For the VarRiver, Mulder et al. (1997b) demonstrated that, fora given water discharge, floods occurring afterdry periods have an enhanced suspended-sedimentconcentration and hence are more likely to betransformed in hyperpycnal flows into the sea.Therefore, hyperpycnal activity could have beenmore sensitive to pure sediment-flux perturbations(due to variations in erosion/sediment availabil-ity) than to changes in sediment-flux variationsarising from water discharge (Mulder et al. 2003).To verify this hypothesis, the following discussionfocuses on the turbidity activity changes in reac-tion to climate change.
Climate Interpretation of Turbidite Frequency Rec-
ords. The Last Glacial Maximum and Termina-tion 1. The maximum of the VSR turbidite ac-tivity is observed between 30 and 16 ka (fig. 5f ), aperiod encompassing the global Last Glacial Max-imum (LGM; 26–19.5 ka). During this period, Eu-rope was characterized by a cold climate that ledto extensive glaciation in the Alps (Ivy-Ochs et al.2008) and in the Var River basin (Buoncristiani andCampy 2004). At that time, glaciers covered about17% of the total Var drainage basin area (Jorry et al.2011; figs. 1, 2).
Recently, numerical modeling of Alpine riverspredicted that LGM floods were characterized byboth a lower frequency and a lower water dischargethan those during the subsequent Bolling-Allerod(14.7–12.9 ka), Younger Dryas (12.9–11.7 ka), and
80411.proof.3d 12 10/17/14 02:17Achorn International
000 L . B ONN EAU E T A L .
Holocene periods (Kettner and Syvitski 2008,2009). However, these studies showed that LGMfloods transported a significantly higher sedimentload, related to the large amount of sediments pro-duced by glaciers. Savoye and Piper (1993)q15 firstsuggested that the large number of turbidites ob-served on the VSR during the Pleistocene resultedfrom high-magnitude hyperpycnal flow of fluvio-glacial Var floods with a high sediment load. Thisinterpretation is supported by siliciclastic inputvariations presented in figure 5e. The Var water-shed is mainly composed of marls and limestones,and the siliciclastic input appears to be essentiallydelivered by the metamorphic massif of Mercan-tour (fig. 1). During the LGM period, glaciers werelocated in two main valleys (the Vésubie and TinéeValleys) that drain the Mercantour Massif (Buon-cristiani and Campy 2004; fig. 1). As a result, sili-ciclastic sediments deposited during the LGM canbe interpreted as glacier-derived sediments. Bothsiliciclastic/glacier-derived sediment input and tur-bidite frequency were high during glacial timeand synchronously decreased at 16 ka (fig. 5). Sincethis timing corresponds to the age of major glacialretreat reported in the Alps (20–16 ka; Hinderer2001; Ivy-Ochs et al. 2004, 2008; Schaefer et al.2006), we assume that the 16-ka transition in theVSR turbidite sedimentation is explained by thedecreasing impact of alpine glaciers on both ero-sion in and sediment delivery to the Var River.This finding is consistent with results from slack-water sediments from an eastern Mediterraneanwatershed in which a similar rapid change in flood-ing sediment origin from ice melt related to rain-fall related occurred between 20 and 17 ka (Wood-ward et al. 2008).
The D/O Cycles. Temporal changes in tur-bidite deposition recorded in core ESSK08-CS13cover the past 70 kyr, including MIS3 and MIS4.The southern European climate during MIS3 wascharacterized by millennial-scale oscillations (D/Ocycles), with cold and arid periods (D/O stadials,including the Heinrich stadials) followed by rela-tively warm and wet periods (D/O interstadials).Turbidite activity on the VSR clearly responds toD/O cycles through a stadial-high/interstadial-lowturbidite activity pattern (fig. 6). This draws an in-verse relationship between precipitation and turbi-dite accumulation that contrasts highly with otherrecent studies conducted on turbidite systems (Na-kajima et al. 2007; Covault et al. 2010). This con-firms that in the case of the Var sediment-routingsystem, in which sediment transport by hyperpyc-nal flow predominates, deep-sea sediment transfers
are more reactive to pure sediment-flux perturba-tions (i.e., erosion/sediment availability) than towater-discharge changes (Mulder et al. 2003). Weassume that these variations could be driven byvariations in erosion induced by changes in glacierand vegetation cover.Little is known about the response of alpine gla-
ciers to climate oscillation during MIS 3 and theD/O cycles, since the maximum extension ofLGM glaciers erased former moraines. Siliciclas-tic/glacier-derived sediment inputs in the Varsediment-routing system remained high duringthe whole last glacial period (50–16 ka; fig. 6b).This suggests that glaciers could have existed dur-ing MIS 3 in the upper basin and stayed quite sta-ble. Importantly, there is no relation between tur-bidite activity and the PC1 curve (siliciclasitc/glacier-derived sediment inputs), suggesting thatglaciers may have had a limited control over sedi-ment transfers at that time.Moreover, vegetation in southern Europe quickly
responded to D/O climate oscillations, with sparsevegetation cover under cold and arid stadial con-ditions (Allen et al. 1999; Sánchez Goñi et al. 2002;Combourieu Nebout et al. 2002; Fletcher and Sán-chez Goñi 2008; Fletcher et al. 2010; fig. 6d). Thisprobably enhanced runoff and erosion and thusinduced a larger sediment supply in the Var wa-tershed (e.g., Syvitski and Milliman 2007). Con-versely, the development of vegetation cover inthe watershed under wetter interstadial conditionswould have contributed to stabilizing soils andlimited runoff. The impact of vegetal cover onsediment transfer was probably exacerbated bythe geomorphological characteristics of the wa-tershed. Because of the high elevation (ca. 90%above 500 m) and relief, a small change in tem-perature corresponds to a large change in vegeta-tion cover (especially forest cover; fig. 2). Thispattern is correlated with alluvial stratigraphicstudies that reveal aggradation of Mediterraneanrivers linked to intense erosion of unvegetatedsoils during stadial intervals, while mean waterdischarge (i.e., volume) was greater during wetterinterstadials, as attested by incision phases inMediterranean rivers (Macklin et al. 2002, 2012;Woodward et al. 2008).
Conclusions
This study presents the first detailed millennial-scale stratigraphic framework in the Var sediment-routing system over the most recent glacial andinterglacial intervals (i.e., the past 75 kyr), basedon temporal changes in turbidite deposition in the
80411.proof.3d 13 10/17/14 02:17Achorn International
Journal of Geology 000M I L L E NN I A L - S C A L E R E S P ON S E O F R I V E R S
western Mediterranean Sea. Turbidity activity onthe VSR mainly reflects changes in magnitude ofhyperpycnal flows spilling over the ridge, in rela-tion with variations of the suspended-sedimentconcentration of the Var River floods. We showthat this signal is sensitive to changes in pure sed-iment flux induced by climatic perturbations oc-curring inland. Precisely, erosion/sediment avail-ability changes in response to (1) the presence orabsence of glaciers in the drainage area and (2) thereduction or development of vegetation cover inresponse to D/O climate swings. Our findings,based on an unprecedented resolution in turbiditesequences for the past 75 kyr, show that riverscan transmit high-frequency changes in sediment-flux changes to deep basins and that turbidity de-posits can be used as archives of high-resolutionland-to-sea transfers. As 66% of global rivers areable to produce hyperpycnal currents (Mulder andSyvitski 1995), the Var River represents a majorcase study for understanding the modulation of
sediment transfer to the deep ocean through gla-cial/interglacial and millennial-timescale climatechanges.
ACKNOWL EDGMENT S
We would like to acknowledge the ARTEMIS(Accélérateur pour la Recherche en sciences de laTerre, Environnement, Muséologie) Saclay andPoznan laboratories for having provided the radio-carbon dates. q16We thank N. Labourdette (Univer-sité Pierre et Marie Curie [UPMC]), J. Etoubleau(IFREMER), and M. Rovere (IFREMER) for theirtechnical support and advice. The captains, crewmembers, and principal investigators of the 1996NICASAR and 2008 ESSDIV cruises are warmlythanked for having contributed to the collection ofhigh-quality sediment cores along the VSR. Thisproject is funded by UPMC (Institut des Sciencesde la Terre de Paris) and IFREMER (projects Sedi-mentary Systems and Geological Hazards).
R E F E R EN C E S C I T E D
Alexander, J., and Mulder, T. 2002. Experimental quasi-steady density currents. Mar. Geol. 186:195–210.
Allen, J. R. M.; Brandt, U.; Brauer, A.; Hubberten, H.-W.;Huntley, B.; Keller, J.; Kraml, M.; et al. 1999. Rapidenvironmental changes in southern Europe duringthe last glacial period. Nature 400:740–743.
Allen, P. A. 2008. Time scales of tectonic landscapesand their sediment routing systems. In Gallagher, K.;Jones, S. J.; and Wainwright, J., eds. Landscape evo-lution: denudation, climate and tectonics over dif-ferent time and space scales. Geol. Soc. Lond. Spec.Publ. 296:7–28.
Armitage, J. J.; Dunkley Jones, T.; Duller, R. A.; Whitta-ker, A. C.; and Allen, P. A. 2013. Temporal bufferingof climate-driven sediment flux cycles by transientcatchment response. Earth Planet. Sci. Lett. 369–370:200–210.
Blum, M. D., and Törnqvist, T. E. 2000. Fluvial re-sponses to climate and sea-level change: a reviewand look forward. Sedimentology 47:2–48.
Bond, G.; Broecker, W.; Johnsen, S.; McManus, J.;Labeyrie, L.; Jouzel, J.; and Bonani, G. 1993. Correla-tions between climate records from North Atlanticsediments and Greenland ice. Nature 365:143–147.
Bouma, A. H. 1962. Sedimentology of some flysch de-posits. Amsterdam, Elsevier, 168 p.
Buoncristiani, J.-F., and Campy, M. 2004. The palaeo-geography of the last two glacial episodes in France:the Alps and Jura. In Ehlers, J., and Gibbard, P., eds.Quaternary glaciations: extent and chronology. De-velopments in Quaternary science. Vol. 2, Pt. 1. Am-sterdam, Elsevier, p. 101–110.
Cacho, I.; Grimalt, J. O.; Pelejero, C.; Canals, M.; Sierro,F. J.; Flores, J. A.; and Shackleton, N. 1999. Dansgaard-Oeschger and Heinrich event imprints in Alboran Seapaleotemperatures. Paleoceanography 14:698–705.
Castelltort, S., and Van Den Driessche, J. 2003. Howplausible are high-frequency sediment supply-drivencycles in the stratigraphic record? Sediment. Geol.157:3–13.
Collier, R. E. L.; Leeder, M. R.; Trout, M.; Ferentinos,G.; Lyberis, E.; and Papatheodorou, G. 2000. Highsediment yields and cool, wet winters: test of lastglacial paleoclimates in the northern Mediterranean.Geology 28:999–1002.
Combourieu Nebout, N.; Turon, J. L.; Zahn, R.;Capotondi, L.; Londeix, L.; and Pahnke, K. 2002. En-hanced aridity and atmospheric high-pressure sta-bility over the western Mediterranean during theNorth Atlantic cold events of the past 50 k.y. Geology30:863–866.
Coulthard, T. J., and Van de Wiel, M. J. 2013. Climate,tectonics or morphology: what signals can we seein drainage basin sediment yields? Earth Surf. Dyn.1:67–91.
Covault, J. A.; Romans, B. W.; Fildani, A.; McGann, M.;and Graham, S. A. 2010. Rapid climatic signal propa-gation from source to sink in a southern Californiasediment-routing system. J. Geol. 118:247–259.
Covault, J. A.; Romans, B. W.; Graham, S. A.; Fildani, A.;and Hilley, G. E. 2011. Terrestrial source to deep-seasink sediment budgets at high and low sea levels: in-sights from tectonically active southern California.Geology 39:619–622.
80411.proof.3d 14 10/17/14 02:17Achorn International
000 L . B ONN EAU E T A L .
Dan, G.; Sultan, N.; and Savoye, B. 2007. The 1979 Niceharbour catastrophe revisited: trigger mechanism in-ferred from geotechnical measurements and numeri-cal modelling. Mar. Geol. 245:40–64.
Dennielou, B.; Huchon, A.; Beaudouin, C.; and Berné, S.2006. Vertical grain-size variability within a turbiditelevee: autocyclicity or allocyclicity? A case studyfrom the Rhône neofan, Gulf of Lions, western Med-iterranean. Mar. Geol. 234:191–213.
Dubar, M., and Anthony, E. J. 1995. Holocene envi-ronmental change and river-mouth sedimentationin the Baie des Anges, French Riviera. Quat Res. 43:329–343.
Fletcher, W. J., and Sánchez Goñi, M. F. 2008. Orbital-and sub-orbital-scale climate impacts on vegetationof the western Mediterranean basin over the last48,000 yr. Quat. Res. 70:451–464.
Fletcher, W. J.; Sánchez Goñi, M. F.; Allen, J. R. M.;Cheddadi, R.; Combourieu-Nebout, N.; Huntley, B.;Lawson, I.; et al. 2010. Millennial-scale variabilityduring the last glacial in vegetation records fromEurope. Quat. Sci. Rev. 29:2839–2864.
Hinderer, M. 2001. Late Quaternary denudation of theAlps, valley and lake fillings and modern river loads.Geodin. Acta 14:231–263.
Hinderer,M., and Einsele, G. 2001. Theworld’s large lakebasins as denudation-accumulation systems and im-plications for their lifetimes. J. Paleolimnol. 26:355–372.
Ivy-Ochs, S.; Kerschner, H.; Reuther, A.; Preusser, F.;Heine, K.; Maisch, M.; Kubik, P. W.; and Schlüchter,C. 2008. Chronology of the last glacial cycle in theEuropean Alps. J. Quat. Sci. 23:559–573.
Ivy-Ochs, S.; Schäfer, J.; Kubik, P.; Synal, H.-A.; andSchlüchter, C. 2004. Timing of deglaciation on thenorthern Alpine foreland (Switzerland). Eclogae Geol.Helv. 97:47–55.
Jerolmack, D. J., and Paola, C. 2010. Shredding of envi-ronmental signals by sediment transport. Geophys.Res. Lett. 37:L19401.
Jorry, S. J.; Jégou, I.; Emmanuel, L.; Silva Jacinto, R.;and Savoye, B. 2011. Turbiditic levee deposition inresponse to climate changes: the Var SedimentaryRidge (Ligurian Sea). Mar. Geol. 279:148–161.
Kettner, A. J., and Syvitski, J. P. M. 2008. Predictingdischarge and sediment flux of the Po River, Italysince the Last Glacial Maximum. In de Boer, P.;Postma, G.; van der Zwan, K.; Burgess, P.; andKukla, P., eds. Analogue and numerical modellingof sedimentary systems: from understanding to pre-diction. Chichester, Wiley, p. 171–189.
———. 2009. Fluvial responses to environmental per-turbations in the northern Mediterranean since theLast Glacial Maximum. Quat. Sci. Rev. 28:2386–2397.
Khripounoff, A.; Crassous, P.; Lo Bue, N.; Dennielou,B.; and Silva Jacinto, R. 2012. Different types ofsediment gravity flows detected in the Var subma-rine canyon (northwestern Mediterranean Sea). Prog.Oceanogr. 106:138–153.
Khripounoff, A.; Vangriesheim, A.; Crassous, P.; andEtoubleau, J. 2009. High frequency of sediment grav-ity flow events in the Var submarine canyon (Medi-terranean Sea). Mar. Geol. 263:1–6.
Macklin, M. G.; Fuller, I. C.; Lewin, J.; Maas, G. S.;Passmore, D. G.; Rose, J.; Woodward, J. C.; Black,S.; Hamlin, R. H. B.; and Rowan, J. S. 2002. Cor-relation of fluvial sequences in the Mediterraneanbasin over the last 2000 ka and their relationshipto climate change. Quat. Sci. Rev. 21:1633–1641.
Macklin, M. G.; Lewin, J.; and Woodward, J. C. 2012.The fluvial record of climate change. Philos. Trans.R. Soc. A 370:2143–2172.
Martrat, B.; Grimalt, J. O.; Lopez-Martinez, C.; Cacho, I.;Sierro, F. J.; Flores, J. A.; Zahn, R.; Canals, M.; Curtis,J. H.; and Hodell, D. A. 2004. Abrupt temperaturechanges in the western Mediterranean over the past250,000 years. Science 306:1762–1765.
Mas, V. 2009. Caractérisation de l’activité hydrosédi-mentaire dans le système turbiditique du Var (NOMéditerranée) et de son enregistrement dans l’archivesédimentaire. PhD thesis, Université Bordeaux I.
Meybeck, M., and Vörösmarty, C. 2005. Fluvial filteringof land-to-ocean fluxes: from natural Holocene varia-tions to Anthropocene. C. R. Geosci. 337:107–123.
Migeon, S.; Mulder, T.; Savoye, B.; and Sage, F. 2006. TheVar turbidite system (Ligurian Sea, northwesternMediterranean)—morphology, sediment supply, con-struction of turbidite levee and sediment waves: im-plications for hydrocarbon reservoirs. Geo-Mar. Lett.26:361–371.
———. 2012. Hydrodynamic processes, velocity struc-ture and stratification in natural turbidity currents:results inferred from field data in the Var turbiditesystem. Sediment. Geol. 245–246:48–62.
Migeon, S.; Savoye, B.; Zanella, E.; Mulder, T.; Faugères,J. C.; and Weber, O. 2001. Detailed seismic-reflectionand sedimentary study of turbidite sediment waveson the Var Sedimentary Ridge (SE France): signifi-cance for sediment transport and deposition and forthe mechanisms of sediment-wave construction. Mar.Petrol. Geol. 18:179–208.
Milliman, J. D., and Syvitski, J. P. M. 1992. Geomorphic/tectonic control of sediment discharge to the ocean:the importance of small mountainous rivers. J. Geol.100:525–544.
Moreno, A.; González-Sampériz, P.; Morellón, M.;Valero-Garcés, B. L.; and Fletcher, W. J. 2012.Northern Iberian abrupt climate change dynamicsduring the last glacial cycle: a view from lacustrinesediments. Quat. Sci. Rev. 36:139–153.
Moreno, A.; Valero-Garcés, B.; González-Sampériz, P.;and Rico, M. 2008. Flood response to rainfall vari-ability during the last 2000 years inferred from theTaravilla Lake record (Central Iberian Range, Spain).J. Paleolimnol. 40:943–961.
Mulder, T., and Alexander, J. 2001. The physical char-acter of subaqueous sedimentary density flows andtheir deposits. Sedimentology 48:269–299.
80411.proof.3d 15 10/17/14 02:17Achorn International
Journal of Geology 000M I L L E NN I A L - S C A L E R E S P ON S E O F R I V E R S
Mulder, T.; Migeon, S.; Savoye, B.; and Faugères, J. C.2001a. Inversely graded turbidite sequences in thedeep Mediterranean: a record of deposits from flood-generated turbidity currents? Geo-Mar. Lett. 21:86–93.
Mulder, T.; Migeon, S.; Savoye, B.; and Jouanneau, J.-M.2001b. Twentieth century floods recorded in the deepMediterranean sediments. Geology 29:1011–1014.
Mulder, T.; Savoye, B.; Piper, D. J. W.; and Syvitski,J. P. M. 1998. The Var submarine sedimentary sys-tem: understanding Holocene sediment delivery pro-cesses and their importance to the geological rec-ord. In Stoker, M. S.; Evans, D.; and Cramp, A., eds.Geological processes on continental margins: sedi-mentation, mass-wasting and stability. Geol. Soc.Lond. Spec. Publ. 129:145–166.
Mulder, T.; Savoye, B.; and Syvitski, J. P. M. 1997a.Numerical modelling of a mid-sized gravity flow:the 1979 Nice turbidity current (dynamics, pro-cesses, sediment budget and seafloor impact). Sed-imentology 44:305–326.
Mulder, T.; Savoye, B.; Syvitski, J. P. M.; and Parize, O.1997b. Des courants de turbidité hyperpycnaux dansla tête du canyon du Var? données hydrologiques etobservations de terrain. Oceanol. Acta 20:607–626.
Mulder, T., and Syvitski, J. P.M. 1995. Turbidity currentsgenerated at river mouths during exceptional dis-charges to the world oceans. J. Geol. 103:285–299.
———. 1996. Climatic and morphologic relationshipsof rivers: implications of sea-level fluctuations onriver loads. J. Geol. 104:509–523.
Mulder, T.; Syvitski, J. P. M.; Migeon, S.; Faugères,J.-C.; and Savoye, B. 2003. Marine hyperpycnal flows:initiation, behavior and related deposits. A review.Mar. Petrol. Geol. 20:861–882.
Nakajima, T., and Itaki, T. 2007. Late Quaternary ter-restrial climatic variability recorded in deep-sea tur-bidites along the Toyama Deep-Sea Channel, centralJapan Sea. Palaeogeogr. Palaeoclimatol. Palaeoecol.247:162–179.
NGRIP (North Greenland Ice Core Project) Members.2004. High-resolution record of Northern Hemisphereclimate extending into the last interglacial period.Nature 431:147–151.q17
Piper, D. J. W., and Normark, W. R. 1983. Turbidite de-positional patterns and flow characteristics, NavySubmarine Fan, California Borderland. Sedimentology30:681–694.
———. 2009. Processes that initiate turbidity currentsand their influence on turbidites: a marine geologyperspective. J. Sediment. Res. 79:347–362.
Piper, D. J. W., and Savoye, B. 1993. Processes of lateQuaternary turbidity current flow and depositionon the Var deep-sea fan, north-west MediterraneanSea. Sedimentology 40:557–582.
Rasmussen, S. O.; Andersen, K. K.; Svensson, A. M.;Steffensen, J. P.; Vinther, B. M.; Clausen, H. B.;Siggaard-Andersen, M. L.; et al. 2006. A new Green-
land ice core chronology for the last glacial termina-tion. J. Geophys. Res. Atmos. 111:D06102.
Reimer, P. J.; Baillie, M. G. L.; Bard, E.; Bayliss, A.;Beck, J. W.; Blackwell, P. G.; Ramsey, C. B.; et al.2009. IntCal09 and Marine09 radiocarbon age cal-ibration curves, 0–50,000 years cal BP. Radiocarbon51:1111–1150.
Romans, B. W.; Normark, W. R.; McGann, M. M.;Covault, J. A.; and Graham, S. A. 2009. Coarse-grainedsediment delivery and distribution in the HoloceneSanta Monica Basin, California: implications for eval-uating source-to-sink flux at millennial time scales.Geol. Soc. Am. Bull. 121:1394–1408.
Sage, L. 1976. La sédimentation à l’embouchure d’unfleuve côtier méditerranéen: le Var. Université deNice. q18
SánchezGoñi,M.; Cacho, I.; Turon, J.; Guiot, J.; Sierro, F.;Peypouquet, J.; Grimalt, J.; and Shackleton, N. 2002.Synchroneity between marine and terrestrial re-sponses to millennial scale climatic variability dur-ing the last glacial period in the Mediterranean re-gion. Clim. Dyn. 19:95–105.
Savoye, B.; Piper, D. J. W.; and Droz, L. 1993. Plio-Pleistocene evolution of the Var deep-sea fan offthe French Riviera. Mar. Petrol. Geol. 10:550–571.
Schaefer, J. M.; Denton, G. H.; Barrell, D. J.; Ivy-Ochs, S.;Kubik, P. W.; Andersen, B. G.; Phillips, F. M.; Lowell,T. V.; and Schlüchter, C. 2006. Near-synchronousinterhemispheric termination of the last glacial max-imum in mid-latitudes. Science 312:1510–1513.
Schumm, S. A. 1977. The fluvial system. New York,Wiley, 338 p.
Sierro, F. J.; Andersen, N.; Bassetti, M. A.; Berné, S.; Ca-nals, M.; Curtis, J. H.; Dennielou, B.; et al. 2009. Phaserelationship between sea level and abrupt climatechange. Quat. Sci. Rev. 28:2867–2881.
Simpson, G., and Castelltort, S. 2012. Model showsthat rivers transmit high-frequency climate cyclesto the sedimentary record. Geology 40:1131–1134.
Skene, K. I., and Piper, D. J. W. 2003. Late Quaternarystratigraphy of Laurentian Fan: a record of events offthe eastern Canadian continental margin during thelast deglacial period. Quat. Int. 99–100:135–152.
Skene, K. I.; Piper, D. J. W.; and Hill, P. S. 2002.Quantitative analysis of variations in depositionalsequence thickness from submarine channel levees.Sedimentology 49:1411–1430.
Sternai, P.; Herman, F.; Valla, P. G.; and Champagnac,J.-D. 2013. Spatial and temporal variations of glacialerosion in the Rhône valley (Swiss Alps): insightsfrom numerical modeling. Earth Planet. Sci. Lett.368:119–131.
Svensson, A.; Andersen, K. K.; Bigler, M.; Clausen,H. B.; Dahl-Jensen, D.; Davies, S. M.; Johnsen, S. J.;et al. 2008. A 60 000 year Greenland stratigraphicice core chronology. Clim. Past 4:47–57.
Syvitski, J. P. M., and Milliman, J. D. 2007. Geology, ge-ography, and humans battle for dominance over the
80411.proof.3d 16 10/17/14 02:17Achorn International
000 L . B ONN EAU E T A L .
delivery of fluvial sediment to the coastal ocean. J.Geol. 115:1–19.
Toucanne, S.; Zaragosi, S.; Bourillet, J.-F.; Dennielou,B.; Jorry, S. J.; Jouet, G.; and Cremer, M. 2012. Ex-ternal controls on turbidite sedimentation on theglacially-influenced Armorican margin (Bay of Biscay,western European margin). Mar. Geol. 303–306:137–153.
Woodward, J. C.; Hamlin, R. H. B.; Macklin, M. G.;Hughes, P. D.; and Lewin, J. 2008. Glacial activity and
catchment dynamics in northwest Greece: long-termriver behaviour and the slackwater sediment recordfor the last glacial to interglacial transition. Geomor-phology 101:44–67.
Zaragosi, S.; Bourillet, J.-F.; Eynaud, F.; Toucanne, S.;Denhard, B.; VanToer, A.; and Lanfumey, V. 2006. Theimpact of the last European deglaciation on the deep-sea turbidite systems of the Celtic-Armorican mar-gin (Bay of Biscay). Geo-Mar. Lett. 26:317–329.26:317–329.
80411.proof.3d 17 10/17/14 02:17Achorn International
Journal of Geology 000M I L L E NN I A L - S C A L E R E S P ON S E O F R I V E R S