Embed Size (px)
Citation preview
Modelisation numerique des equilibres de phases et sa
contribution a la comprehension des processus
orogeniques
Pavel Pitra
To cite this version:
Pavel Pitra. Modelisation numerique des equilibres de phases et sa contribution a lacomprehension des processus orogeniques. Sciences de la Terre. Universite Rennes 1, 2011.<tel-00611728>
HAL Id: tel-00611728
https://tel.archives-ouvertes.fr/tel-00611728
Submitted on 29 Jul 2011
HAL is a multi-disciplinary open accessarchive for the deposit and dissemination of sci-entific research documents, whether they are pub-lished or not. The documents may come fromteaching and research institutions in France orabroad, or from public or private research centers.
L’archive ouverte pluridisciplinaire HAL, estdestinee au depot et a la diffusion de documentsscientifiques de niveau recherche, publies ou non,emanant des etablissements d’enseignement et derecherche francais ou etrangers, des laboratoirespublics ou prives.
Numerical modelling of phase equilibria
and its contribution to understanding orogenic processes
Modélisation numérique des équilibres de phases et sa
contribution à la compréhension des processus orogéniques
Mémoire présenté en vue d‟obtenir
l‟Habilitation à diriger des recherches
par
Pavel PITRA
Université Rennes 1
Géosciences Rennes, UMR CNRS 6118
Spécialité : Sciences de la Terre
Soutenance prévue le 17 juin 2011, devant le jury composé de
Michel BALLÈVRE, professeur, Université Rennes 1, examinateur
Jean-Pierre BURG, professeur, ETH Zürich, rapporteur
Jean-Marc LARDEAUX, professeur, Université de Nice, rapporteur
Francisco MARTÍNEZ, professeur, Universitat Autònoma de Barcelona, rapporteur
Roger POWELL, professeur, University of Melbourne, examinateur
Jean VAN DEN DRIESSCHE, professeur, Université Rennes 1, examinateur

2
3
AVANT-PROPOS
Ce mémoire écrit afin d‟obtenir l‟Habilitation à Diriger des Recherches à l‟Université de
Rennes 1 dresse le bilan de mes activités de recherche effectuées au laboratoire Géosciences
Rennes de l‟Université de Rennes 1 depuis mon recrutement comme Maître de Conférences
en 1999.
Il propose d‟abord un curriculum vitae qui résume aussi mes activités de recherche et de
formation, complétées par une liste de mes publications et communications.
Mon approche scientifique et mes activités de recherche sont ensuite détaillées, autour du
thème principal de la compréhension des processus orogéniques à travers l‟étude pétrologique
impliquant la modélisation numérique des équilibres de phases. Les développements futurs de
l‟activité de recherche que je souhaite mener sont ensuite présentés succinctement, en partie
au travers de certains des projets INSU / ANR auxquels j‟émarge.
Une sélection des publications récentes auxquelles j‟ai participé est présentée en annexes.

4
5
TABLE DES MATIERES
AVANT-PROPOS .............................................................................................................................................. 3 TABLE DES MATIERES ..................................................................................................................................... 5
A – CURRICULUM VITÆ .............................................................................................................................. 6
ETAT CIVIL ..................................................................................................................................................... 6 DISCIPLINE DE RECHERCHE ............................................................................................................................. 6 TITRES UNIVERSITAIRES ET DEROULEMENT DE CARRIERE ............................................................................... 6 ACTIVITES D‟ENSEIGNEMENT .......................................................................................................................... 7 ACTIVITES ADMINISTRATIVES ......................................................................................................................... 7 ENCADREMENT DES ETUDIANTS ..................................................................................................................... 8 PARTICIPATION AUX JURYS DE DOCTORAT ...................................................................................................... 9 PARTICIPATION AUX PROGRAMMES DE RECHERCHE ........................................................................................ 9 SEJOURS DANS DES LARORATOIRES ETRANGERS.............................................................................................. 9 RAPPORTS DE LECTURE (“ REVIEWS ”) .......................................................................................................... 10 PUBLICATIONS .............................................................................................................................................. 10
B – NUMERICAL MODELLING OF PHASE EQUILIBRIA ..................................................................... 13
INTRODUCTION ............................................................................................................................................. 13 ANALYSING METAMORPHIC ROCKS .............................................................................................................. 15
Equilibrium model of metamorphism ....................................................................................................... 15 Petrography ............................................................................................................................................. 15 Mineral composition ................................................................................................................................ 19 Minding the structures ............................................................................................................................. 21
CONSTRAINING THE CONDITIONS OF METAMORPHISM ................................................................................... 26 Geothermobarometry ............................................................................................................................... 26 Phase diagrams ....................................................................................................................................... 27
PSEUDOSECTIONS .......................................................................................................................................... 29 Choosing of the “right” bulk composition ................................................................................................ 31 Choosing the appropriate model system ................................................................................................... 35 Mixing models (a-x relations) .................................................................................................................. 36 Available software ................................................................................................................................... 37 Not only phase diagrams… avPT ............................................................................................................. 38
CASE STUDIES .............................................................................................................................................. 40 High-pressure metamorphism and subduction zones ................................................................................ 40 Inverted metamorphic sequences ............................................................................................................. 43 Palaeoproterozoic homogeneous thickening ............................................................................................ 45 Metasomatic shear zones ......................................................................................................................... 48 In conclusion… ........................................................................................................................................ 49
REFERENCES ................................................................................................................................................. 49 PERSPECTIVES............................................................................................................................................... 54
Metamorphism and shear zones: from the field to the model .................................................................... 54 Inverted metamorphic sequences ............................................................................................................. 62 Statistical methods ................................................................................................................................... 64
C – ANNEXES ................................................................................................................................................ 66
6
A – Curriculum vitæ
ETAT CIVIL
Pavel PITRA
43 ans ; né le 31 mars 1968 à Prague (Tchécoslovaquie) ;
marié, 4 enfants (7 ; 5 ; 2 ; 0,2 ans)
Grade : maître de conférences Etablissement : Géosciences Rennes – UMR CNRS 6118,
Université Rennes 1, Campus de Beaulieu,
35 042 Rennes CEDEX
Tél. : 02.23.23.65.06
E-mail : [email protected]
NUMEN : 14S9905289CVG
DISCIPLINE DE RECHERCHE
géologie, pétrologie métamorphique
TITRES UNIVERSITAIRES ET DEROULEMENT DE CARRIERE
1999-… maître de conférences, depuis le 1/09/1999 ; titularisé le 1/09/2001 ; spécialité:
pétrologie métamorphique
1998-99 Chercheur post-doctoral au Département de géologie de l‟Université de Pretoria
(Afrique du Sud)
1997 Assistant de Recherche au Département de Minéralogie, Géochimie et
Ressources Minières, Universita Karlova, Prague (République Tchèque)
1992-96 Thèse de doctorat du Muséum National d‟Histoire Naturelle (cotutelle avec
Université de Prague) soutenue le 19 novembre 1996 à Paris :
"Étude pétrostructurale des régions marginales du Moldanubien de Bohême et de
ses relations avec le bloc du Barrandien" ; directeurs : M. Guiraud, J-P. Burg, K.
Schulmann
Jury : Jacques Fabriès, Jean-Pierre Burg, Jean-Robert Kiénast, Michel Guiraud,
Karel Schulmann, Angelika Kalt.
Mention très honorable avec félicitations
1991-92 D.E.A. à l‟Université de Montpellier soutenu le 8 Juillet 1992. Directeur : J-P.
Burg. Mention bien (classement 3/28)
1986-91 4 années d‟études combinées à la Faculté de Sciences et à la Faculté de Lettres de
l‟Université de Prague. Orientation : Géologie + Français + Russe
7
ACTIVITES D’ENSEIGNEMENT
Université Rennes 1 : Service supérieur à 192 heures éq. TD (194-220 h).
L2 - minéralogie, cristallographie et optique cristalline (filières “ ST ” et “ SVT ” – CM, TD,
TP)
L3 - pétrologie magmatique et métamorphique (filières “ ST ” et “ SVT ” – CM, TD, TP,
sorties de terrain – Bretagne)
- thermodynamique (CM, TD)
M1 - pétrologie métamorphique (filières “ recherche ” et “ enseignement ” – CM, TD, TP,
stages de terrain – Alpes, Bretagne, Corse)
- encadrement des sujets bibliographiques personnels (TER) et stages professionnels
M2 - thermodynamique des roches et fluides métamorphiques (CM)
Université Bretagne Sud (Vannes) : chargé d‟enseignement – pétrologie métamorphique et
magmatique (CM, TP, TD ; 10-40 h en fonction des autres enseignants ; à partir de 2005)
Université de Prague et Universitat Autonòma de Barcelona – enseignement régulier dans
le cadre des échanges européens Erasmus / Socrates - Pétrologie et équilibres de phases,
cours et TD niveau master, doctorat (depuis 2002, une semaine par an)
ACTIVITES ADMINISTRATIVES
Responsabilités collectives
Responsable des relations internationales
Membre élu du conseil d‟unité (UMR Géosciences Rennes)
Responsable d‟entretien du parc des microscopes du Laboratoire (recherche et
enseignement)
Membre de la commission “ Valorisation ” au sein de Géosciences Rennes
Membre des jurys de diplôme : licence (L3), master 1 et master 2
Responsabilité d‟UE :
- L2 : UE Matériaux géologiques (L2 PCSTM)
- M1 : UE Magmatisme et métamorphisme (M1-ST jusqu‟à 2008)
- M2 : UE Roches et fluides métamorphiques (M2-GG)
Activité éditoriale
Rapporteur (« reviewer ») régulier pour différents journaux internationaux – ca. 30 rapports
depuis 2000.
8
ENCADREMENT DES ETUDIANTS
Doctorat d’Université
Benjamin LE BAYON, co-encadrée à 50% avec Michel Ballèvre : Evolution structurale et
métamorphique d’une croûte continentale subductée (Grand Paradis, Alpes occidentales) ;
soutenu en 2005 ; Benjamin est actuellement en poste au BRGM
Kristina BURIANKOVÁ co-encadrée à 30% avec Jan Kosler (Prague / Bergen) : Dating
movements and metamorphism in the MCT Zone of the eastern and central Himalaya:
implications for diachronous uplift of the High Himalayan rocks. Kristina prépare sa thèse
tout en travaillant à temps plein (CDI) comme chercheuse au Service Géologique Tchèque.
Martin RACEK co-encadré à 50% avec Pavla Stípská (Prague / Strasbourg). Thèse en
cotutelle : Relation of extrusion and horizontal flow of lower crust to the origin of the lower
crustal wedge along eastern margin of the Bohemian massif, soutenu en septembre 2007,
actuellement en poste au Service géologique Tchèque
Abdelkhaleq AFIRI co-encadrée à 50% avec Frédéric Gueydan (40%) et Abderrahim Essaifi
(10%, Univ. Marrakech) : Etude pétro-structurale de péridotites de Beni Bousera (Maroc) et
de leur enveloppe métamorphique, soutenance prévue en 2011
Alicia LOPEZ CARMONA co-encadré à 50% avec Jacobo Abati (Madrid). Thèse en
cotutelle : Initiation de la subduction Varisque: Modélisation pétrologique et
géochronologique des litholoiges de haute pression de Malpica-Tuy (Galice, NW du Massif
Ibérique) , soutenance prévue en 2012
Diplôme d’Etudes Approfondies / Master 2
Benjamin LE BAYON : co-encadré à 70% avec Pierre Gautier et Michel Ballèvre : Le
métamorphisme inverse et le développement séquentiel d’une zone de chevauchement
(Marvejols, Massif Central) ; soutenu en 2002 – classement 1er/15
Vladimir ANTONOFF : j‟ai assuré la totalité de l‟encadrement : Étude des niveaux
peralumineux de l’île d’Yeu (Vendée). Estimation des conditions P/T de la formation de la
chaîne Varisque dans le Massif Armoricain ; soutenu en 2005 – classement 4e/15 ;
actuellement en thèse à l‟Institut National de la Recherche Scientifique (Québec)
Pierre-Alban DONGUY : co-encadré à 50% avec Marc Poujol : Dater la déformation
varisque : étude pétrologique et géochronologique des zones de cisaillement métasomatiques
(Ile d’Yeu, Massif armoricain). 2007/08. Pierre-Alban est actuellement géologue à la carrière
de talc à Luzenac.
Caroline BOLLINGER: co-encadré à 30% avec Pavla Stipska et Karel Schulmann (Univ.
Strasbourg): Evolution pétrologique et analyse pression-température-déformation des
éclogites de subduction du massif de Bohême . 2008/09. Caroline est actuellement en thèse à
l‟Université de Lille.
Jean-Charles POILVET: co-encadré à 30% avec Marc Poujol et Jean Van Den Driessche :
Datation et mise en place des migmatites et granites C/S de la Montagne Noire. 2009/10. J-C
est actuellement en thèse à l‟Université de Besançon.
Lorraine TUAL: Evolutions progrades et rétrogrades de différentes unités métamorphiques
de haute pression des Cyclades – implications pour les processus de subduction et
d'exhumation. 2010/11. J‟assure la totalité de l‟encadrement.
9
Encadrements d’autres stages
2008: stage de L3, Lorraine TUAL, 3 mois, Métamorphisme inverse dans la vallée du Lot
2009: stage de M1, Lorraine TUAL, 3 mois, Pétrologie des schistes bleus de Syros
PARTICIPATION AUX JURYS DE DOCTORAT
- Martin RACEK (2007, Univ. Prague) co-directeur
- Jan FRANEK (2007, Univ. Prague) rapporteur
- Monika KOSULICOVA (2007, Univ. Strasbourg) rapporteur
- Jirí SLÁMA (2008, Univ. Prague) examinateur
- Ruben DIEZ FERNANDEZ (2010, Univ. Salamanca) examinateur suppléant
PARTICIPATION AUX PROGRAMMES DE RECHERCHE
coordonnateur du projet blanc INSU (Actions sur projets INSU - Appels d‟offres 2009) :
Transferts de matière et cristallisations métamorphiques : exemple du
métasomatisme magnésien (avec Philippe Boulvais, Rennes ; Didier Marquer et Philippe
Goncalves, Besançon)
projet bilatéral PAI Picasso entre l‟Université de Rennes et l‟Université de Barcelone
(avec J. Van Den Driessche, F. Martínez, J. Reche) 2006 et 2007
participation au projet ANR « Laterally-forced overturns (LFO) enhanced by melt induced softening (MIS) in orogens: new model for continental tectonics » (coordonné par
K. Schulmann, Univ. Strasbourg) 2006-2009
participation au projet Franco-Indien: IFCPAR project n° 2307-1: Accretionary processes of juvenile crust and continental growth: the late Archean eastern Dharwar
Craton. Animateur: J-J. Peucat (Univ. Rennes 1) 2002-04
collaboration avec l‟Université de Prague sur le programme “ Dating movements and
metamorphism in the MCT Zone of the eastern and central Himalaya: implications for
diachronous uplift of the High Himalayan rocks ”, financé par la “ Grant Agency of the
Czech Republic ” : thèse de K. Burianková
SEJOURS DANS DES LARORATOIRES ETRANGERS
2008 – 6 semaines à l‟Université de Melbourne, Australie
10
RAPPORTS DE LECTURE (“ REVIEWS ”)
Je produis régulièrement, depuis 2000, des rapports de lecture pour de nombreux journaux
internationaux – entre autres : Journal of Metamorphic Geology, Journal of Petrology,
International Journal of Earth Science, Lithos, European Journal of Mineralogy, Canadian
Journal of Earth Sciences, Mineralogy and Petrology, Contributions to Mineralogy and
Petrology.
2006 – 4 reviews ; 2007 – 5 reviews ; 2008 – 6 reviews ; 2009 – 7 reviews ; 2010 – 7 reviews
PUBLICATIONS
Publications soumises
Gueydan, F., A. Afiri, P. Pitra, A. Essaifi. Oligo-Miocene exhumation of the Beni-Bousera
peridotite through a lithosphere-scale extensional shear zone, Geodinamica Acta, in press.
Poilvet J-C., M. Poujol, P. Pitra, J. Van Den Driessche, J-L. Paquette. The Montalet granite,
Montagne Noire, France: An early Permian syn-extensional pluton as evidenced by new
U-Th-Pb data on zircon and monazite, Comptes Rendus Geoscience, in press.
Chopin, F., K. Schulmann, P. Štípská, J.E. Martelat, P. Pitra, O. Lexa, & B. Petri.
Microstructural and petrological evolution of a high pressure felsic orthogneiss during
continental subduction (Orlica-Śnieżnik dome, NE Bohemian Massif), Journal of
Metamorphic Geology, soumis.
Štípská, P., F. Chopin, E. Skrzypek, K. Schulmann, O. Lexa, P. Pitra, J.E. Martelat, C.
Bollinger. The role of large-scale folding on juxtaposition of eclogite and mid-crustal
rocks (Orlica-Śnieżnik Dome, Bohemian Massif), Journal of Metamorphic Geology,
soumis.
Articles publiés
12) Pitra, P., Ballèvre, M., Ruffet, G., 2010. Inverted metamorphic field gradient towards a
Variscan suture zone (Champtoceaux Complex, Armorican Massif, France). Journal of
Metamorphic Geology, 28, 183-208.
11) Pitra P., Kouamelan A. N., Ballèvre M., Peucat J. J., 2010. Palaeoproterozoic high-
pressure granulite overprint of the Archaean continental crust: evidence for homogeneous
crustal thickening (Man Rise, Ivory Coast), Journal of Metamorphic Geology, 28, 41-58.
10) Ballèvre, M., Bosse, V., Ducassou, C. & Pitra, P., 2009. Palaeozoic history of the
Armorican Massif: Models for the tectonic evolution of the suture zones. Comptes
Rendus Geoscience, 341, 174-201.
9) Pitra, P., Boulvais, P., Antonoff, V. & Diot, H. 2008. Wagnerite in a cordierite-gedrite
gneiss: witness of long-term fluid-rock interaction in the continental crust (Ile d‟Yeu,
Armorican Massif, France), American Mineralogist, 93, 315-326.
11
8) Le Bayon, B., Pitra, P., Ballèvre, M. & Bohn, M. 2006. Reconstructing P-T paths during
continental collision using multi-stage garnets (Gran Paradiso nappe, Western Alps).
Journal of Metamorphic Geology, 24, 477-496.
7) Stípská, P., Pitra, P. & Powell, R., 2006. Separate or shared metamorphic histories of
eclogites and surrounding rocks? An example from the Bohemian Massif. Journal of
Metamorphic Geology, 24(3), 219-240.
6) Racek, M., Stípská, P., Pitra, P., Schulmann, K. & Lexa, O., 2006. Metamorphic record of
burial and exhumation of orogenic lower and middle crust: new tectonothermal model for
the Drosendorf window, Bohemian Massif. Mineralogy and Petrology, 86, 221–251.
5) Ballèvre, M., Pitra, P. and Bohn, M., 2003. Lawsonite growth in the epidote blueschists
from the Ile de Groix (Armorican Massif, France): a potential geobarometer. Journal of
Metamorphic Geology, 21, 723-735.
4) Pitra, P. & de Waal, S. A., 2001. High-temperature low-pressure metamorphism and
development of prograde symplectites, Marble Hall Fragment, Bushveld Complex, South
Africa. Journal of Metamorphic Geology, 19(3), 311-325.
3) Pitra, P., Burg, J. P. & Guiraud, M., 1999. Late-Variscan strike-slip tectonics between the
Teplá-Barrandian and Moldanubian terranes (Czech Bohemian Massif): petrostructural
evidence. Journal of the Geological Society, London, 156, 1003-1020.
2) Pitra, P. & Guiraud, M., 1996. Probable anticlockwise P-T evolution in extending crust:
Hlinsko region, Bohemian Massif. Journal of Metamorphic Geology, 14, 49-60.
1) Pitra, P., Burg, J. P., Schulmann, K. & Ledru, P., 1994. Late orogenic extension in the
Bohemian Massif: petrostructural evidence in the Hlinsko region. Geodinamica Acta,
7(1), 15-30.
Bibliométrie
12 articles publiés ; indice de citation : 198 ; nombre moyen de citations : 16.5 ; indice H : 9
(Source : ISI Web of Knowledge, avril 2011)
environ 30 présentation dans des conférences nationales et internationales (liste non fournie)
Conférences invitées
Prague 2005, 2006
Barcelona 2008

12
13
B – Numerical Modelling of Phase Equilibria
INTRODUCTION
The aim of my scientific work is to contribute to the understanding of geodynamic processes
using a parallel study of metamorphic processes and geological structures, while taking into
account the associated magmatic and sedimentary aspects in selected key regions. The focus
is on the study of pressure–temperature conditions and their evolution with time. I approach
these problems from a thermodynamic point of view, through numerical modelling of phase
relations using various types of phase diagrams calculated with the THERMOCALC
software. Nevertheless, I pay particular attention to a solid field work, a sound structural
investigation, and a meticulous petrographical analysis, which are essential prerequisites for
the quality of the subsequent phase diagram modelling.
My publication record is not particularly rich. Yet, my contribution is significant in all
papers that I co-authored and most of these papers show a citation record that is moderate but
steady through the time. I tend to believe that this reflects the quality of the work.
Nor can I boast about any significant methodological developments, although this is what
generally helps to boost one‟s citation index and what is then expected from a researcher in
the current climate. Clearly, the focus of my research is the application of modern
petrological methods to various regions in order to understand their tectonic history. I
consider it as a bonus, if some sort of generally valid conclusion can be drawn from this work.
My philosophy is that it would be of little use to produce models and sophisticated tools if
there was nobody capable to use these tools with ability or test the models in the nature.
Nevertheless, working on an interesting but local object (e.g. shear zones on Ile d‟Yeu), may
reveal new questions of general interest and lead to formulating new challenging projects (e.g.
the development of the magnesian metasomatism). Finally, testing the models and the tools
on specific field examples can show their strengths and shortcomings and possibly lead to
their improvement. This is the important contribution of this kind of work to the collective
effort of the scientific community to enhance our understanding of the Natural system we are
living in.
The general link between most subjects approached in my research is the application of a
detailed petrographical analysis of the relations between deformation and metamorphic
crystallisations, and the interpretation of the observations using calculated phase diagrams.
The goal is to understand the record of the continental collision by metamorphic rocks, from
their subduction to the exhumation. The following list gives the principal problems and
regions that I worked on since my arrival to the University of Rennes.
high pressure metamorphism and subduction zones the role of lawsonite (collaboration with M. Ballèvre; publication 5)
associations of rocks with contrasting metamorphic histories (Bohemian Massif;
collaboration with P. Stípská; publication 7 + submitted)
PT evolution of a polymetamorphic continental crust (Alps ; PhD of B. Le Bayon ;
publication 8)
initial stages of the Variscan orogeny, subduction of the Rheic ocean (blueschists in
Galicia; PhD of Alicia López)
contrasting record of the burial and exhumation in a subduction zone (Cycladic
blueschists; PhD of Melody Philippon)
14
development and exhumation of inverted metamorphic sequences
Massif Armoricain (publication 12)
Himalaya in Nepal (PhD of K. Buriánková)
metamorphism and tectonics of a “hot” continental crust – high pressure granulites formation of high pressure granulites through homogeneous crustal thickening (Côte
d‟Ivoire, collaboration with Alain Kouamelan, publication 11)
burial and exhumation of orogenic lower and middle crust (Bohemian Massif – PhD
of M. Racek; publication 6 ; project ANR – LFO)
unravelling PT conditions of continental collision from metasomatic shear zones (Massif Armoricain – MSc of V. Antonoff – publication 9 ; project INSU – Alps)
exhumation of the Beni Bousera peridotites (Morocco; PhD of Abdelkhaleq Afiri;
publication in press in Geodinamica Acta)
15
ANALYSING METAMORPHIC ROCKS
Equilibrium model of metamorphism
The underlying principle for using phase equilibrium modelling in metamorphic petrology is
that all geological systems tend to achieve equilibrium. At equilibrium the energy of the
system is minimized. The character, proportions and chemical compositions of the phases
involved in the system do not change with time and are characteristic of the conditions at
which equilibrium was attained. Attaining equilibrium implies therefore modifying phase
proportions and compositions through diffusion of chemical components between the phases
(minerals, fluids and liquids). As soon as the conditions (e.g. pressure, temperature) change,
the system will immediately tend to a new equilibrium state. But since diffusion is involved,
the scale at which the equilibrium will be achieved depends on the particular conditions
(especially the temperature), on the character of the phases involved (e.g. diffusion in fluids is
much faster than in solids), and on the available time. If the conditions change rapidly, the
scale of equilibration will be small. However, it can be argued that even in this case the
system will develop local equilibria – small domains where equilibrium is achieved or
approached (e.g. Korzhinskii 1959; Thompson 1959). The equilibrium phase (mineral)
assemblages and compositions can then be identified through a rigorous petrological analysis
and the principles of equilibrium thermodynamics may be applied in order to understand the
rock and determine the conditions of formation (cf. Powell 1978).
Petrography
In order to determine correctly the conditions of formation, the identification of the
equilibrium mineral assemblages and the scale of equilibration is therefore necessary.
However, this is not a straightforward exercise in complex geological systems and implies a
certain amount of more or less subjective interpretation. Due to the relatively low
temperatures and the relative rapidity at which many geological processes occur (in particular
in the crust), complete equilibration is the exception rather than the rule in most crustal rocks.
Instead, the rocks tend to partially preserve a sequence of local equilibria, achieved
successively during their evolution. This is obviously a chance, since it offers a geologist a
glance into the past of the rock. Nevertheless, understanding correctly the message requires
careful and commonly time-consuming observations, and an open mind ready to reconsider
previous interpretations in the light of new evidence. Such an evidence/suggestion may come
from other domains of the same thin-section, from associated samples, or, importantly, be
inferred from the results of numerical modelling of phase equilibria.
Inclusions
Among the textures most commonly used to infer the history of metamorphic rocks are
mineral inclusions in porphyroblasts. Their interpretation may seem straightforward –
inclusions should be older than matrix minerals, inclusions in the porphyroblast core should
be older than those situated close to the rim. Indeed, inclusion sequences have been
successfully used to infer coherent, reasonable P–T evolutions (e.g. Thompson et al. 1977;
Štípská et al. 2006). However, in many instances inclusions may be misinterpreted (e.g.
Vernon et al. 2008). Are inclusions older than or contemporaneous with the porphyroblasts?
Could they be younger? Are polymineralic inclusion clusters the image of the pre-existing
16
assemblage or the result of reequilibration / destabilisation of another mineral? Some of these
aspects are discussed in the following figures (Figs. 1-4).
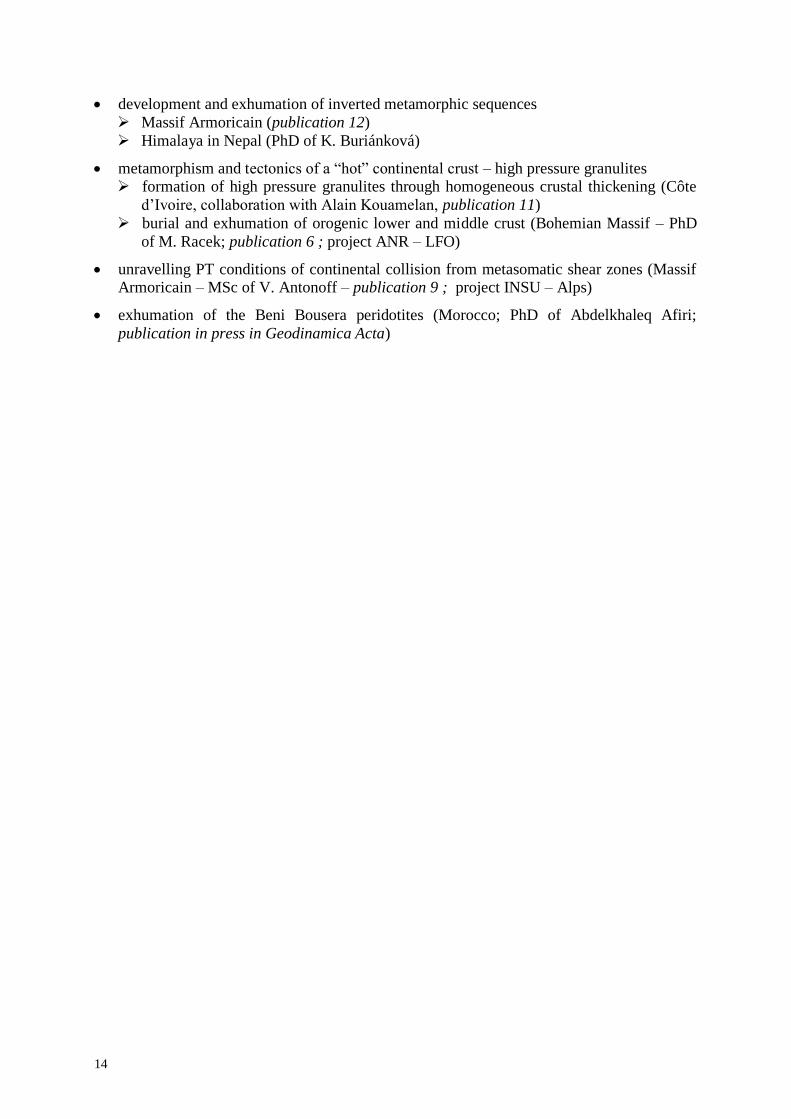
Fig. 1: Subhedral crystal of chiastolitic
andalusite, surrounded by cordierite and
wrapped by a fibrolitic sillimanite (fib)-
bearing foliation (Marble Hall, Transvaal,
Pitra and de Waal 2001). It contains relatively
coarse inclusions of prismatic sillimanite,
pointed by black arrows (besides the tiny
inclusions of quartz and graphite defining the
chiastolite cross). A straightforward
interpretation of the crystallisation sequence
would be: prismatic sillimanite andalusite
cordierite fibrolitic sillimanite. This
would imply a complex P–T path involving
two high T stages separated by a period of cooling, during which chiastolite would crystallise.
However, chiastolite is only reported from rocks having undergone prograde metamorphism,
whereas late, retrograde andalusite never displays the chiastolite texture. This may be attributed to
the increase of grain size during metamorphism. Only very small minerals may be incorporated in
the chiastolite texture – such small crystals are generally found in rocks that have not been
previously metamorphosed. This argues against the prismatic sillimanite being older than the
chiastolite. But then how can it be found inside the chiastolite crystals?!
A careful observation reveals that all sillimanite prisms have the same crystallographic orientation,
in this case with [001] sub-normal to the photograph, as suggested by the lozenge shape
characteristic for (001) sections. Interestingly, the chiastolite prism has the same orientation.
Consequently, the texture may be attributed to a topotactic replacement of chiastolite by prismatic
andalusite – known (Vernon 1987), but clearly not trivial… In this case, the first-order P–T path
may be interpreted in terms of a much simpler, single prograde history. Chiastolitic andalusite
crystallised during a progressive prograde metamorphism of an unmetamorphosed sediment.
Subsequently, during further temperature increase, andalusite interior was partly converted to
prismatic sillimanite. Such textures are attributed to high temperatures and dry environments (e.g.
Carlson and Rosenfeld 1981). Meanwhile, fibrolite grew locally along planes where fluids were
present.
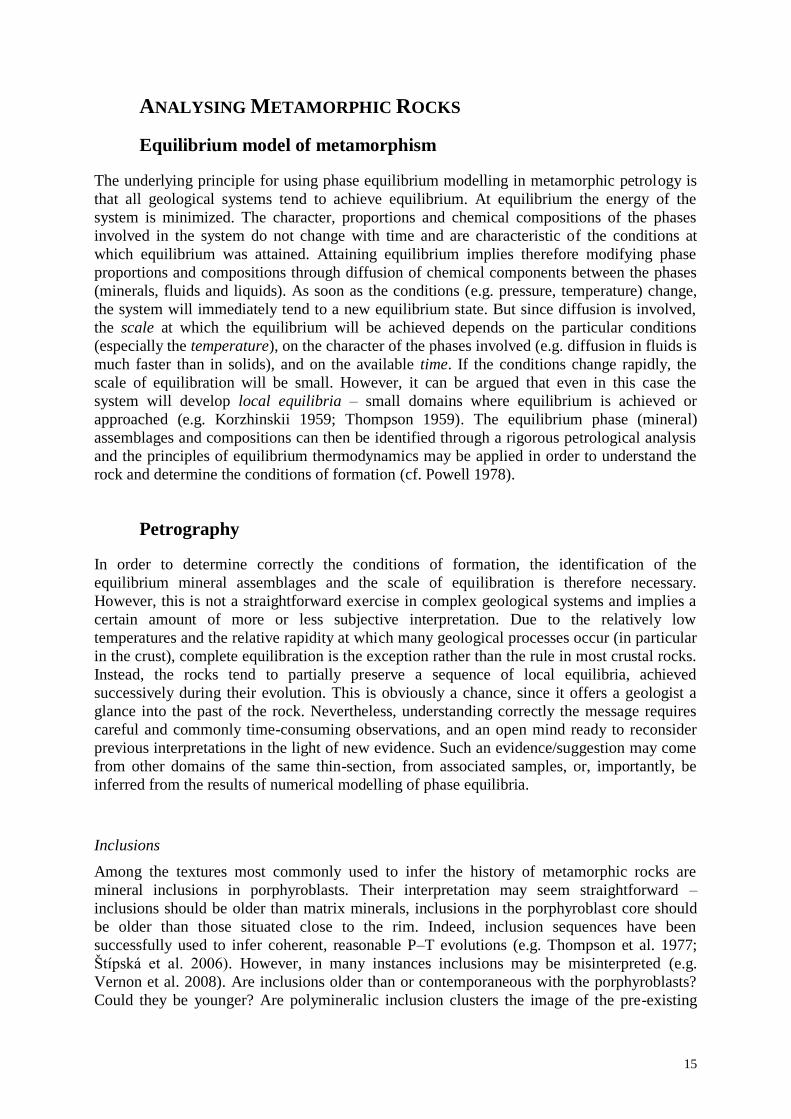
Fig. 2: Rutile + phengite inclusion cluster in a
garnet from Gran Paradiso (Italian Alps).
Owing to the particular form of the cluster
and considering subsequent phase equilibrium
modelling, these inclusions are inferred to
have formed after the growth of this garnet,
replacing the original inclusion of ilmenite at
a moment when it was connected by fractures
(now sealed by a second garnet generation) to
the matrix (Le Bayon et al. 2006). The
implications for the P–T history are not
negligible. Whereas rutile (a fortiori with
phengite) points commonly to rather HP-LT
conditions, ilmenite is reputed stable at LP-
HT conditions.
17
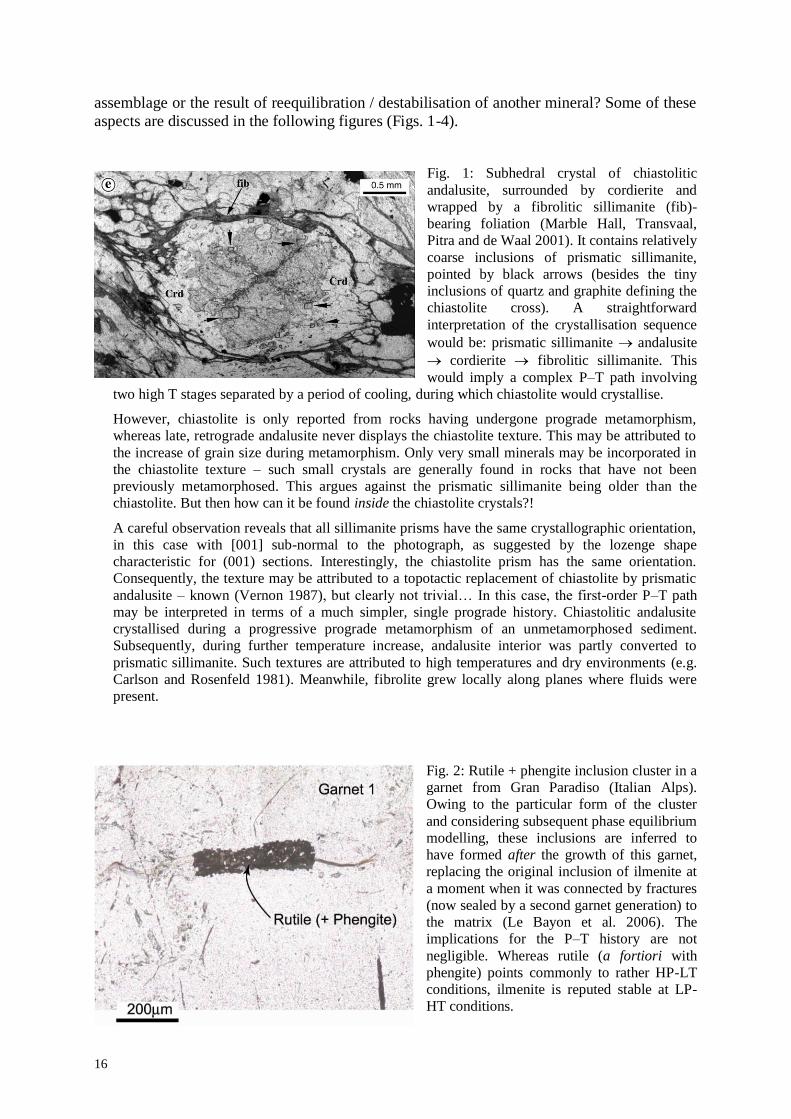
Fig. 3: “Spongy” garnet from the Upper Allochthon unit of the Champtoceaux complex (Armorican massif)
(Pitra et al. 2010a). The poikilitic core contains “inclusions” of kyanite and large crystals of biotite and white
mica. These inclusions are the same, in mineralogy, chemical composition and size, as the matrix minerals.
They generally lack preferred orientation and take the appearance of a mineral assemblage statically
replacing the garnet cores. These “inclusions” are therefore also inferred to have developed after the garnet
crystal. This interpretation is supported by the following observations in neighbouring domains of the thin-
section.
In some rare garnet crystals, the cores are preserved. They contain an inclusion assemblage that has a
different grain size and mineral character (among others small crystals of epidote and staurolite). The
chemical composition of the core also differs strongly from that of the garnet rim. This suggests that the core
formed at different conditions than the garnet rim. It was “farther” from equilibrium at the conditions when
the matrix formed, and hence more liable to destabilisation than the rim, which survived.
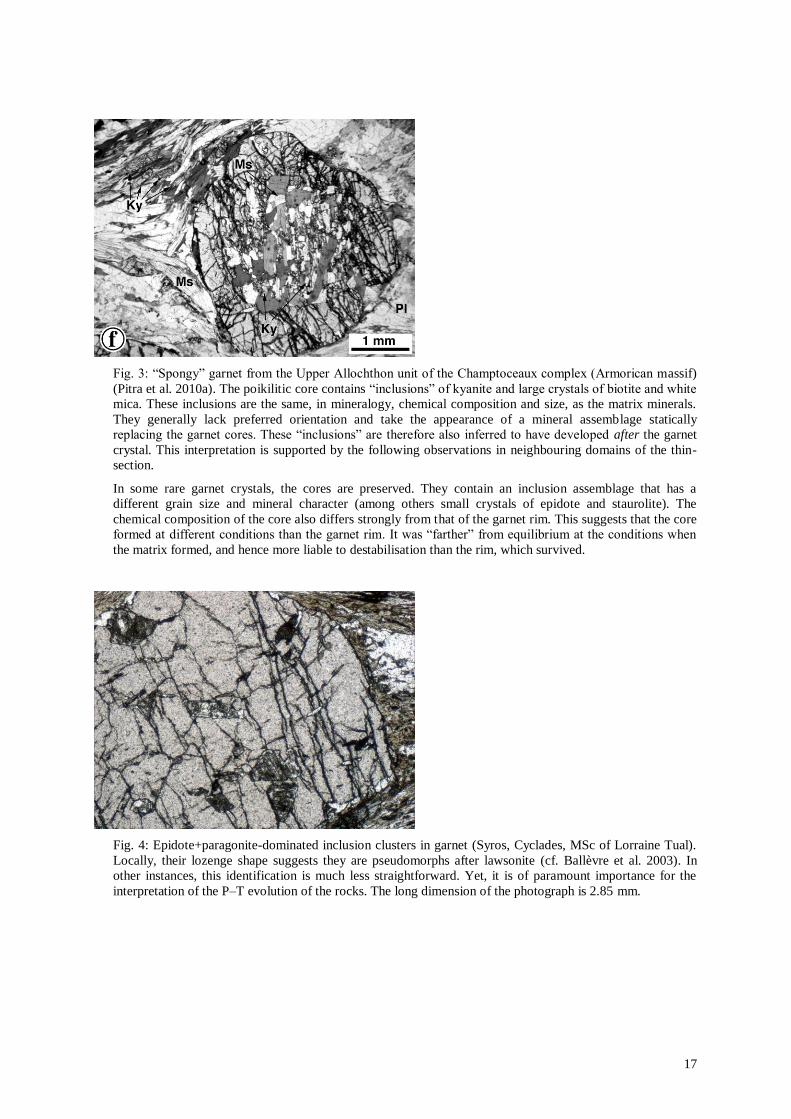
Fig. 4: Epidote+paragonite-dominated inclusion clusters in garnet (Syros, Cyclades, MSc of Lorraine Tual).
Locally, their lozenge shape suggests they are pseudomorphs after lawsonite (cf. Ballèvre et al. 2003). In
other instances, this identification is much less straightforward. Yet, it is of paramount importance for the
interpretation of the P–T evolution of the rocks. The long dimension of the photograph is 2.85 mm.
18
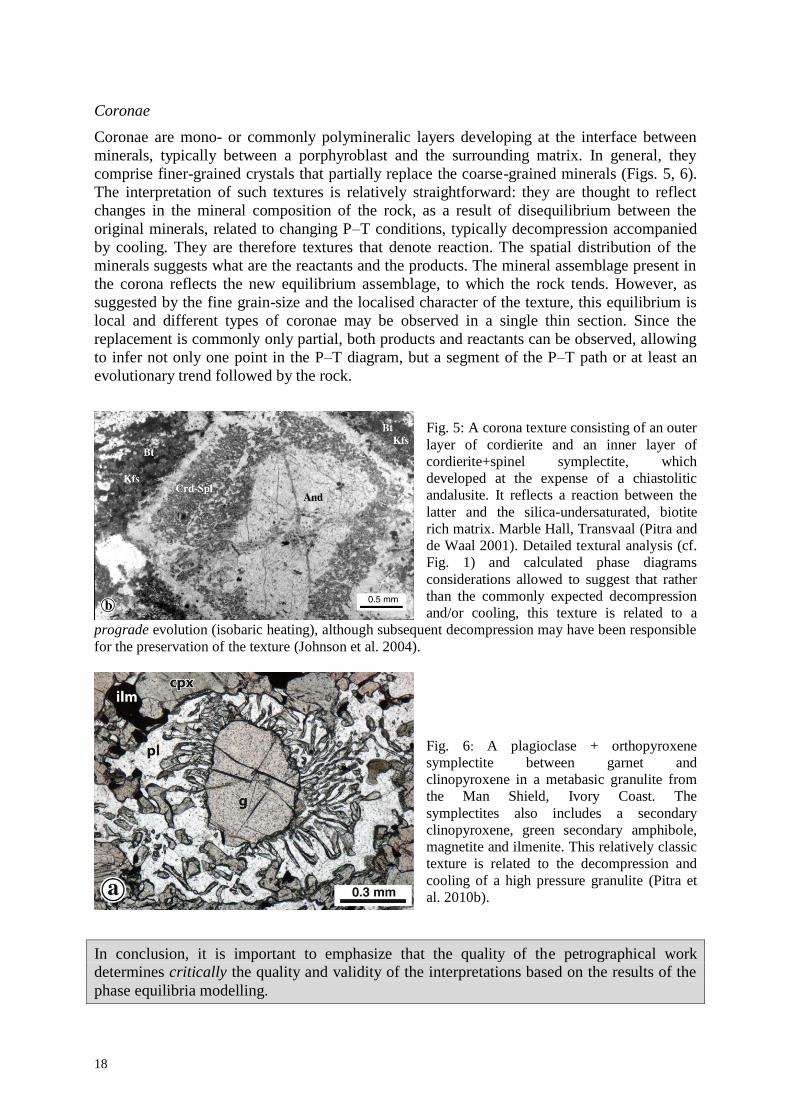
Coronae
Coronae are mono- or commonly polymineralic layers developing at the interface between
minerals, typically between a porphyroblast and the surrounding matrix. In general, they
comprise finer-grained crystals that partially replace the coarse-grained minerals (Figs. 5, 6).
The interpretation of such textures is relatively straightforward: they are thought to reflect
changes in the mineral composition of the rock, as a result of disequilibrium between the
original minerals, related to changing P–T conditions, typically decompression accompanied
by cooling. They are therefore textures that denote reaction. The spatial distribution of the
minerals suggests what are the reactants and the products. The mineral assemblage present in
the corona reflects the new equilibrium assemblage, to which the rock tends. However, as
suggested by the fine grain-size and the localised character of the texture, this equilibrium is
local and different types of coronae may be observed in a single thin section. Since the
replacement is commonly only partial, both products and reactants can be observed, allowing
to infer not only one point in the P–T diagram, but a segment of the P–T path or at least an
evolutionary trend followed by the rock.
Fig. 5: A corona texture consisting of an outer
layer of cordierite and an inner layer of
cordierite+spinel symplectite, which
developed at the expense of a chiastolitic
andalusite. It reflects a reaction between the
latter and the silica-undersaturated, biotite
rich matrix. Marble Hall, Transvaal (Pitra and
de Waal 2001). Detailed textural analysis (cf.
Fig. 1) and calculated phase diagrams
considerations allowed to suggest that rather
than the commonly expected decompression
and/or cooling, this texture is related to a
prograde evolution (isobaric heating), although subsequent decompression may have been responsible
for the preservation of the texture (Johnson et al. 2004).
Fig. 6: A plagioclase + orthopyroxene
symplectite between garnet and
clinopyroxene in a metabasic granulite from
the Man Shield, Ivory Coast. The
symplectites also includes a secondary
clinopyroxene, green secondary amphibole,
magnetite and ilmenite. This relatively classic
texture is related to the decompression and
cooling of a high pressure granulite (Pitra et
al. 2010b).
In conclusion, it is important to emphasize that the quality of the petrographical work determines critically the quality and validity of the interpretations based on the results of the
phase equilibria modelling.
19
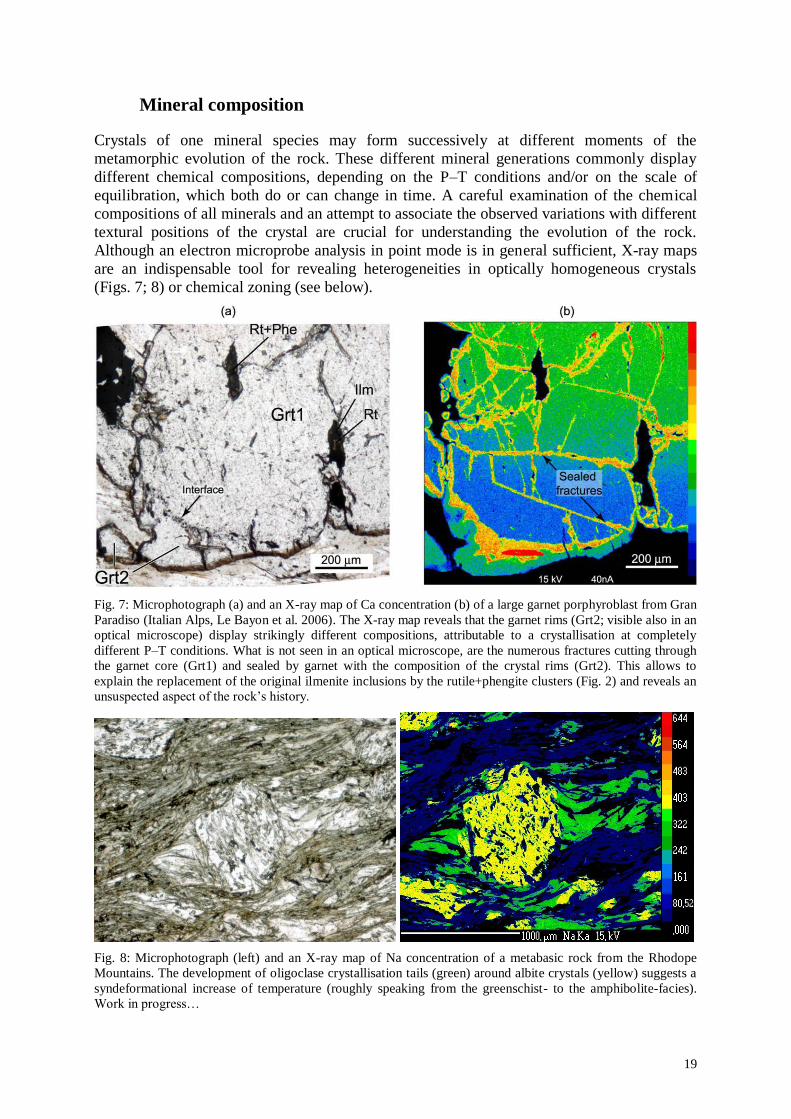
Mineral composition
Crystals of one mineral species may form successively at different moments of the
metamorphic evolution of the rock. These different mineral generations commonly display
different chemical compositions, depending on the P–T conditions and/or on the scale of
equilibration, which both do or can change in time. A careful examination of the chemical
compositions of all minerals and an attempt to associate the observed variations with different
textural positions of the crystal are crucial for understanding the evolution of the rock.
Although an electron microprobe analysis in point mode is in general sufficient, X-ray maps
are an indispensable tool for revealing heterogeneities in optically homogeneous crystals
(Figs. 7; 8) or chemical zoning (see below).
Fig. 7: Microphotograph (a) and an X-ray map of Ca concentration (b) of a large garnet porphyroblast from Gran
Paradiso (Italian Alps, Le Bayon et al. 2006). The X-ray map reveals that the garnet rims (Grt2; visible also in an
optical microscope) display strikingly different compositions, attributable to a crystallisation at completely
different P–T conditions. What is not seen in an optical microscope, are the numerous fractures cutting through
the garnet core (Grt1) and sealed by garnet with the composition of the crystal rims (Grt2). This allows to
explain the replacement of the original ilmenite inclusions by the rutile+phengite clusters (Fig. 2) and reveals an
unsuspected aspect of the rock‟s history.
Fig. 8: Microphotograph (left) and an X-ray map of Na concentration of a metabasic rock from the Rhodope
Mountains. The development of oligoclase crystallisation tails (green) around albite crystals (yellow) suggests a
syndeformational increase of temperature (roughly speaking from the greenschist- to the amphibolite-facies).
Work in progress…
20
Chemical zoning
The best-known example of the mineral composition evolution along a P–T path is the
development of chemical zoning. Two end-member types of zoning are distinguished (e.g.
Tracy 1982). Growth zoning corresponds to the case, where the equilibrium composition of a
mineral changes progressively as the metamorphic conditions evolve, and each successive
layer of the growing crystal has a different chemical composition. In order to be preserved,
growth zoning requires minerals characterised by a slow intracrystalline diffusion, typically
garnets. Diffusional zoning represents the case where the composition of a mineral
(previously homogeneous or not) is progressively changed by intracrystalline diffusion. This
is generally driven by reaction of the surface of the crystal with matrix minerals. A typical
example is the increase of the Mn content at the rim of a progressively resorbed garnet, due to
the strong partitioning of Mn into garnet. However, in the case of a previously zoned crystal,
chemical potential gradients between the successive crystal „layers‟ may be the driving force.
Intracrystalline diffusion then modifies the existing chemical differences (i.e. the zoning) and
tends to homogenize the crystal chemistry.
When preserved, growth zoning may be used, in combination with calculated phase diagrams,
to understand and quantify the prograde evolution of metamorphic rocks (e.g. Vance and
Mahar 1998; Štípská and Powell 2005; Le Bayon et al. 2006; Štípská et al. 2006). Despite the
apparent success of this method, more caution is possibly needed in using zoned crystals.
Recent work tends to suggest that the diffusional alteration of an existing zoning even in
minerals like garnet may be relatively rapid and more important than previously thought
(Caddick et al. 2010). Since the resetting is commonly only partial, the resulting compositions
reflect then neither the original nor the final metamorphic conditions. Nevertheless, since the
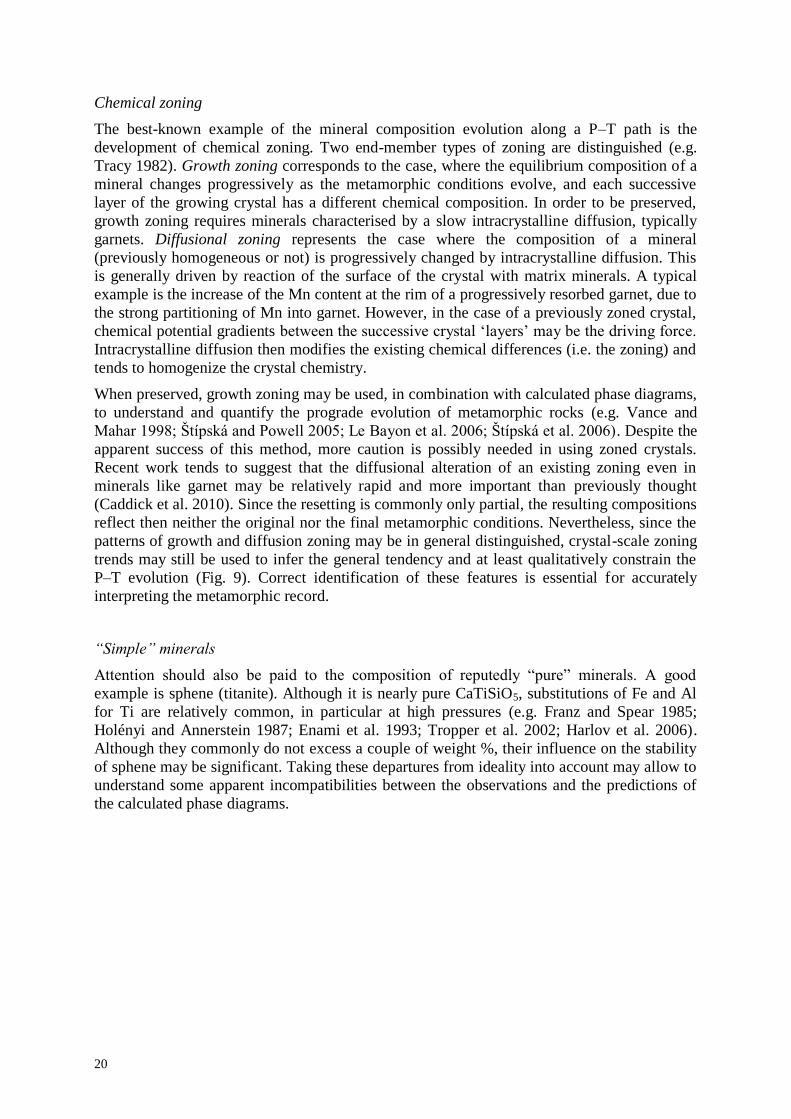
patterns of growth and diffusion zoning may be in general distinguished, crystal-scale zoning
trends may still be used to infer the general tendency and at least qualitatively constrain the
P–T evolution (Fig. 9). Correct identification of these features is essential for accurately
interpreting the metamorphic record.
“Simple” minerals
Attention should also be paid to the composition of reputedly “pure” minerals. A good
example is sphene (titanite). Although it is nearly pure CaTiSiO5, substitutions of Fe and Al
for Ti are relatively common, in particular at high pressures (e.g. Franz and Spear 1985;
Holényi and Annerstein 1987; Enami et al. 1993; Tropper et al. 2002; Harlov et al. 2006).
Although they commonly do not excess a couple of weight %, their influence on the stability
of sphene may be significant. Taking these departures from ideality into account may allow to
understand some apparent incompatibilities between the observations and the predictions of
the calculated phase diagrams.
21
Fig. 9: X-ray maps showing Mn and Ca zoning in garnets in a lawsonite-blueschist from Syros
(Greece; collaboration with Melody Philippon). Garnets included in the pseudomorphed lawsonite
crystal (red-dominated rectangle in the Ca-map, right) display the same type of zoning as those in
the matrix, including the thin high-Mn and high-Ca rim, interpreted as the result of partial
resorption. This may suggest that lawsonite only started to crystallise when garnet was partly
resorbed after its growth. Generally speaking, this would suggest lawsonite growth during
decompression and/or cooling.
However, lawsonite crystals are entirely pseudomorphed. The replacement of lawsonite by an
epidote + paragonite + chlorite ± albite mixture would allow the communication of the garnet
inclusions with the matrix and the development of diffusion zoning in the rim. It is therefore
possible that garnet resorption is contemporaneous with the destabilisation of lawsonite. Lawsonite
would then have grown at the metamorphic peak, at the end of garnet crystallisation, but before its
resorption. A close study of the calculated phase diagrams can help discriminate between the two
hypotheses.
Minding the structures
If the goal of a metamorphic study is to contribute to the understanding of the tectonic
evolution of a region (rather than methodological development, explaining the formation of
particular textures, etc.), the results must be linked with a structural framework. This requires
attentive structurally-oriented field work, collecting oriented samples, cutting the thin sections
in appropriate orientations and last, but not least, diligent petrographical work aiming to
comprehend the relations between different mineral assemblages and particular structures.
The petrographic (or microscopic) part of this exercise involves deciphering the relations
between foliations and metamorphic minerals, in particular porphyroblasts (the
“crystallisation–deformation relations”), interpreting foliation superpositions and shear-sense
criteria in thin sections – and telling them apart. Despite the classic nature of this exercise, its
importance is commonly underestimated, which may lead to erroneous interpretations
(Fig. 10).
22
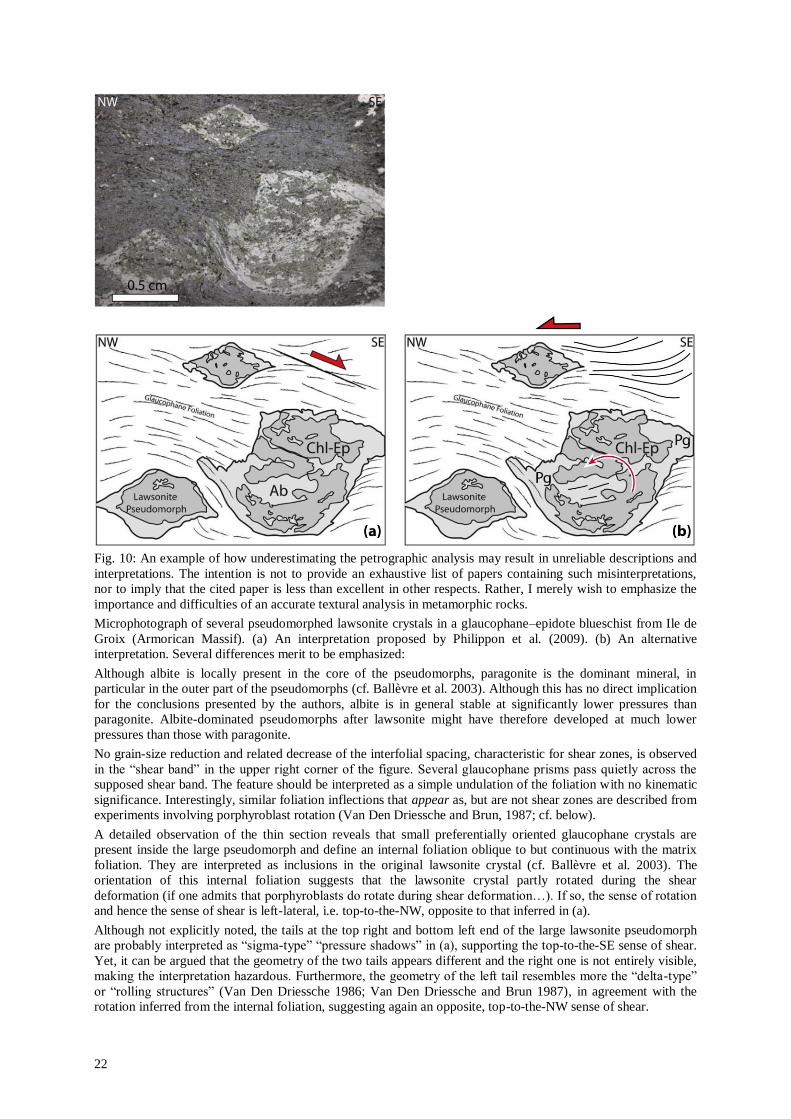
Fig. 10: An example of how underestimating the petrographic analysis may result in unreliable descriptions and
interpretations. The intention is not to provide an exhaustive list of papers containing such misinterpretations,
nor to imply that the cited paper is less than excellent in other respects. Rather, I merely wish to emphasize the
importance and difficulties of an accurate textural analysis in metamorphic rocks.
Microphotograph of several pseudomorphed lawsonite crystals in a glaucophane–epidote blueschist from Ile de
Groix (Armorican Massif). (a) An interpretation proposed by Philippon et al. (2009). (b) An alternative
interpretation. Several differences merit to be emphasized:
Although albite is locally present in the core of the pseudomorphs, paragonite is the dominant mineral, in
particular in the outer part of the pseudomorphs (cf. Ballèvre et al. 2003). Although this has no direct implication
for the conclusions presented by the authors, albite is in general stable at significantly lower pressures than
paragonite. Albite-dominated pseudomorphs after lawsonite might have therefore developed at much lower
pressures than those with paragonite.
No grain-size reduction and related decrease of the interfolial spacing, characteristic for shear zones, is observed
in the “shear band” in the upper right corner of the figure. Several glaucophane prisms pass quietly across the
supposed shear band. The feature should be interpreted as a simple undulation of the foliation with no kinematic
significance. Interestingly, similar foliation inflections that appear as, but are not shear zones are described from
experiments involving porphyroblast rotation (Van Den Driessche and Brun, 1987; cf. below).
A detailed observation of the thin section reveals that small preferentially oriented glaucophane crystals are
present inside the large pseudomorph and define an internal foliation oblique to but continuous with the matrix
foliation. They are interpreted as inclusions in the original lawsonite crystal (cf. Ballèvre et al. 2003). The
orientation of this internal foliation suggests that the lawsonite crystal partly rotated during the shear
deformation (if one admits that porphyroblasts do rotate during shear deformation…). If so, the sense of rotation
and hence the sense of shear is left-lateral, i.e. top-to-the-NW, opposite to that inferred in (a).
Although not explicitly noted, the tails at the top right and bottom left end of the large lawsonite pseudomorph
are probably interpreted as “sigma-type” “pressure shadows” in (a), supporting the top-to-the-SE sense of shear.
Yet, it can be argued that the geometry of the two tails appears different and the right one is not entirely visible,
making the interpretation hazardous. Furthermore, the geometry of the left tail resembles more the “delta-type”
or “rolling structures” (Van Den Driessche 1986; Van Den Driessche and Brun 1987), in agreement with the
rotation inferred from the internal foliation, suggesting again an opposite, top-to-the-NW sense of shear.
23
As another example, Lexa et al. (2004) have demonstrated that many sections across samples
with folded foliations exhibit shear band-like geometry, although they are not real shear
zones. They have shown how using these apparent shear bands as shear sense indicators lead
to misunderstanding an important part of the tectonic evolution of the western Carpathians.
On the other hand, accurate interpretation of the crystallisation–deformation relations may
reveal the relative timing of foliation formation (and hence a particular deformation event)
with respect to porphyroblast growth. If the porphyroblasts form at a particular locus of the P–
T path (e.g. the pressure or temperature peak), then the deformation may be attributed to a
specific part of the orogenic process (subduction, collision, exhumation, etc.) (Fig. 11, 12).
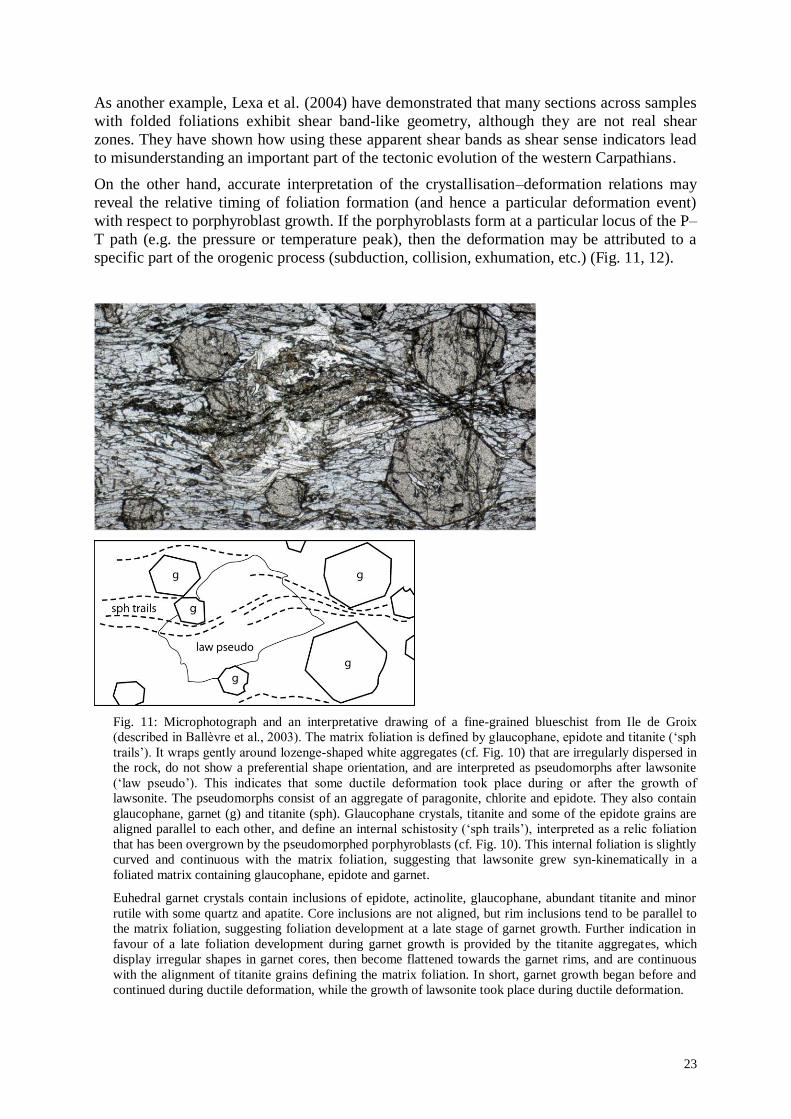
Fig. 11: Microphotograph and an interpretative drawing of a fine-grained blueschist from Ile de Groix
(described in Ballèvre et al., 2003). The matrix foliation is defined by glaucophane, epidote and titanite („sph
trails‟). It wraps gently around lozenge-shaped white aggregates (cf. Fig. 10) that are irregularly dispersed in
the rock, do not show a preferential shape orientation, and are interpreted as pseudomorphs after lawsonite
(„law pseudo‟). This indicates that some ductile deformation took place during or after the growth of
lawsonite. The pseudomorphs consist of an aggregate of paragonite, chlorite and epidote. They also contain
glaucophane, garnet (g) and titanite (sph). Glaucophane crystals, titanite and some of the epidote grains are
aligned parallel to each other, and define an internal schistosity („sph trails‟), interpreted as a relic foliation
that has been overgrown by the pseudomorphed porphyroblasts (cf. Fig. 10). This internal foliation is slightly
curved and continuous with the matrix foliation, suggesting that lawsonite grew syn-kinematically in a
foliated matrix containing glaucophane, epidote and garnet.
Euhedral garnet crystals contain inclusions of epidote, actinolite, glaucophane, abundant titanite and minor
rutile with some quartz and apatite. Core inclusions are not aligned, but rim inclusions tend to be parallel to
the matrix foliation, suggesting foliation development at a late stage of garnet growth. Further indication in
favour of a late foliation development during garnet growth is provided by the titanite aggregates, which
display irregular shapes in garnet cores, then become flattened towards the garnet rims, and are continuous
with the alignment of titanite grains defining the matrix foliation. In short, garnet growth began before and
continued during ductile deformation, while the growth of lawsonite took place during ductile deformation.
24
The pseudomorphic replacement of lawsonite is interpreted as post-kinematic as suggested by the lack of
preferred orientation of the breakdown products in the pseudomorphs and the preserved shape of the original
crystals (cf. Fig. 10). Similarly, local partial replacement of garnet by unoriented chlorite–albite aggregates
post-dates the development of the foliation.
To sum up, the paragenetic history of the sample is characterized by three stages, namely (i) pre-kinematic
garnet cores in equilibrium with actinolite, glaucophane, epidote, and titanite, (ii) syn-kinematic lawsonite
and garnet rims in equilibrium with glaucophane, epidote, and (iii) breakdown of lawsonite into chlorite–
epidote–paragonite, and chlorite–albite growth at the expense of garnet. Ductile deformation began during
garnet growth and ceased before stage (iii).
Subsequent numerical modelling of phase equilibria (Ballèvre et al. 2003) suggests that the growth of garnet
and lawsonite occurred along the prograde part of the P–T path, and culminated at the pressure peak. This
allows to attribute the development of the foliation (and the possibly associated shear-sense criteria) in this
sample to the stage when the rock was going down into the subduction zone. As suggested by Philippon et al.
(2009), the exhumation of the Ile de Groix metamorphic complex occurred under greenschist facies
conditions with an opposed kinematics, localised and documented in other parts of the island.
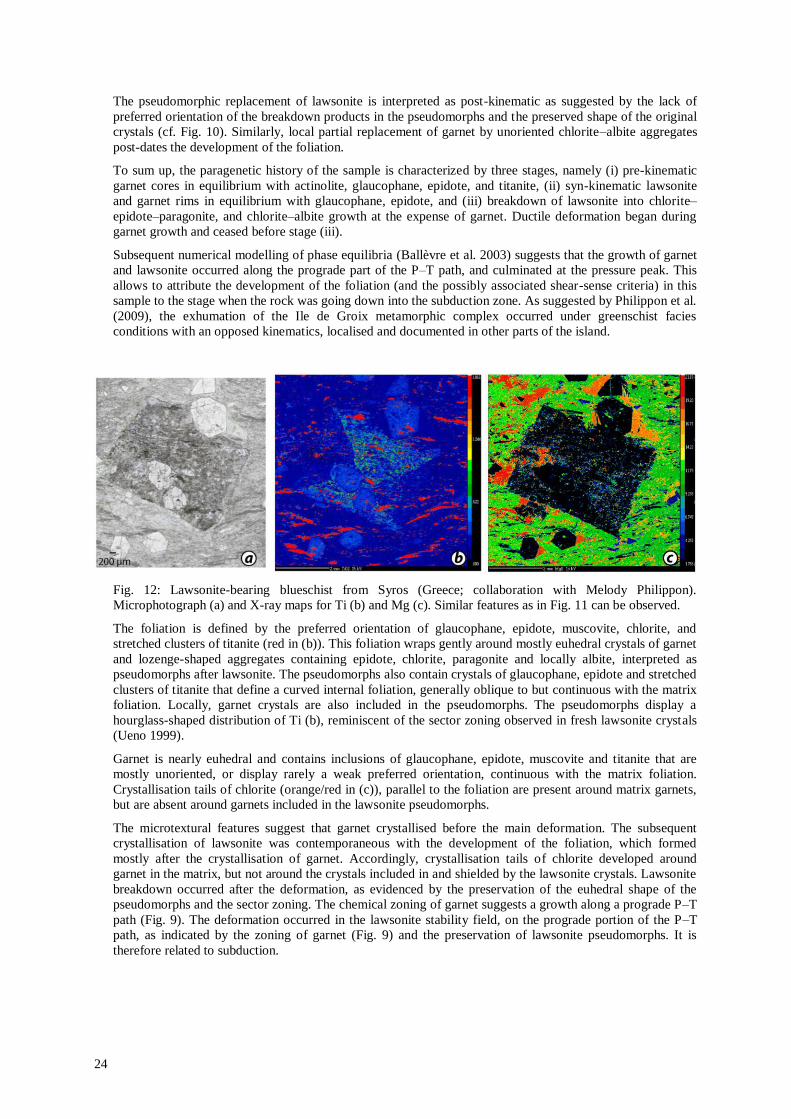
Fig. 12: Lawsonite-bearing blueschist from Syros (Greece; collaboration with Melody Philippon).
Microphotograph (a) and X-ray maps for Ti (b) and Mg (c). Similar features as in Fig. 11 can be observed.
The foliation is defined by the preferred orientation of glaucophane, epidote, muscovite, chlorite, and
stretched clusters of titanite (red in (b)). This foliation wraps gently around mostly euhedral crystals of garnet
and lozenge-shaped aggregates containing epidote, chlorite, paragonite and locally albite, interpreted as
pseudomorphs after lawsonite. The pseudomorphs also contain crystals of glaucophane, epidote and stretched
clusters of titanite that define a curved internal foliation, generally oblique to but continuous with the matrix
foliation. Locally, garnet crystals are also included in the pseudomorphs. The pseudomorphs display a
hourglass-shaped distribution of Ti (b), reminiscent of the sector zoning observed in fresh lawsonite crystals
(Ueno 1999).
Garnet is nearly euhedral and contains inclusions of glaucophane, epidote, muscovite and titanite that are
mostly unoriented, or display rarely a weak preferred orientation, continuous with the matrix foliation.
Crystallisation tails of chlorite (orange/red in (c)), parallel to the foliation are present around matrix garnets,
but are absent around garnets included in the lawsonite pseudomorphs.
The microtextural features suggest that garnet crystallised before the main deformation. The subsequent
crystallisation of lawsonite was contemporaneous with the development of the foliation, which formed
mostly after the crystallisation of garnet. Accordingly, crystallisation tails of chlorite developed around
garnet in the matrix, but not around the crystals included in and shielded by the lawsonite crystals. Lawsonite
breakdown occurred after the deformation, as evidenced by the preservation of the euhedral shape of the
pseudomorphs and the sector zoning. The chemical zoning of garnet suggests a growth along a prograde P–T
path (Fig. 9). The deformation occurred in the lawsonite stability field, on the prograde portion of the P–T
path, as indicated by the zoning of garnet (Fig. 9) and the preservation of lawsonite pseudomorphs. It is
therefore related to subduction.

25
It is only through integrating the metamorphic record with structural data (as well as,
obviously, the geochronological, magmatic, sedimentary, geophysical, etc. information) that a
reliable tectonic picture of a region may be drawn. From this point of view, it is regrettable
that large-scale thermomechanical numerical modelling, or exploring the crust–mantle or
lithosphere–atmosphere interactions, for example, rather than field-based structural geology
are viewed as the exclusive future of tectonics and the young generation of tectonicians is
more and more encouraged in this direction. It is then increasingly common – but sometimes
possibly unfortunate – that the responsibility of a sound structural analysis and the subsequent
tectonic interpretation relies solely on the metamorphic petrologist.
26
CONSTRAINING THE CONDITIONS OF METAMORPHISM
In the framework of understanding the geodynamic evolution of a region, one of the primary
goals of metamorphic petrology is to give quantitative or qualitative constraints on the
pressure – temperature (P–T) conditions of formation of metamorphic rocks and, if possible,
their evolution in time. Indeed, despite the locally important problems of strain-induced
tectonic overpressure (e.g. Petrini and Podladchikov 2000; Mancktelow 2008; Raimbourg and
Kimura 2008; Li et al. 2010), pressure can be – at the first order – directly correlated with
depth (z) through the lithostatic pressure model (P = ρgz, where ρ is the density of the
overlying rock column). Knowing the temperature at a given depth allows calculating the
geothermal gradient, which can, in turn, be correlated with a particular geodynamic setting
(e.g. Miyashiro 1961, 1973; Winter 2001). This task can be approached from two directions:
using geothermobarometry, or using phase diagrams.
Geothermobarometry
The principle of „classic‟ geothermobarometry is using two, in general directly
(experimentally) calibrated equilibria written between end-members of phases inferred in
equilibrium in the given rock (or equilibration volume) and reading the equilibration P–T
conditions from their intersection (e.g. garnet–biotite Fe-Mg exchange combined with the
garnet–aluminium silicate–quartz–plagioclase net-transfer equilibrium). The reason for the
success of this method – in particular among non-petrologists – resides in its
straightforwardness: analyse a couple of grains on a microprobe – calculate a couple of simple
compositional parameters – use an excel sheet – get a result. However, this
straightforwardness represents also the major danger of this method: whatever the input
parameters, one always gets a result that can be directly used, unless the resulting numbers are
completely unrealistic (e.g. negative). No cross-check, beyond possibly the common
petrological sense, is available.
With the appearance of internally-consistent sets of thermodynamic data (Powell and Holland
1985; Berman 1988) and associated computer programmes, the application of multi-
equilibrium geothermobarometry became possible (Powell and Holland 1988; Berman 1991).
The use of thermodynamic datasets allows to take into account many more equilibria than
those directly experimentally calibrated and obtain then a better constrained result. Moreover,
multi-equilibrium geothermobarometry also gives the possibility to estimate the coherence of
the data and hence whether or not the used minerals approached equilibrium. Two different
approaches are dominant in the present-day petrological literature – the method used by
Berman and the programme TWEEQU on the one hand, and Powell and Holland and the
programme THERMOCALC on the other hand. The major difference concerns the statistical
treatment of the results and the uncertainties. TWEEQU calculates all the equilibria between
the end-members of the phases inferred to be in equilibrium and plots them as lines in a P–T
diagram. This „tightness‟ of the intersection of the lines allows a visual qualitative estimation
of the coherence of the input data and the uncertainty. However, many of the equilibria are
necessarily linear combinations of others, and the final graphical output gives a false
impression of robustness. On the other hand, the “average P–T” method of THERMOCALC
uses only an independent set of equilibria (from which all the other possible equilibria can be
calculated) and a robust statistical treatment to indicate quantitatively the uncertainty on the
result, and the „goodness of the fit‟ of the data (to what extent the data are probable to reflect
27
an equilibrium / suitable to be used together) (Powell and Holland 1994; Powell and Holland
2008).
Nevertheless, despite the superiority of the multi-equilibrium methods over „classic‟
geothermobarometry, the result is always one point in the P–T diagram and it is in general not
possible to obtain quantitative information about the P–T evolution of the rock. Furthermore,
additional problems comprise (e.g. Spear 1993; Winter 2001)
- the equilibrium chemical composition of the phases: (i) problem of identification of
the part of a chemically zoned crystals that was in equilibrium with the other minerals;
(ii) problem of the diffusional modification of the equilibrium composition
(reequilibration), and the related problem of blocking temperatures (temperatures
below which the diffusion is too slow to modify the chemical composition of the
phases)
- extrapolating the experimentally calibrated equilibrium (i) to minerals of different composition (the effect of additional components – e.g. Ca, Mn in garnet); (ii) to P–T
conditions different from the experimental ones.
Yet, geothermobarometry can yield interesting information in the hands of a careful user and
the relative simplicity and rapidity of use can surely be an advantage, in particular in the early
stages of a project. However, as noted above, despite the apparent simplicity of the method, a
proper textural analysis and interpretation, understanding the compositional heterogeneity and
the reaction history of the rock are essential prerequisites for geothermobarometry to yield
any useful results.
Phase diagrams
The mineral composition of metamorphic rocks reflects just as much the physical
equilibration conditions (P–T), as the chemical system – i.e. the chemical composition of the
rock (or the equilibration volume), possibly modified by externally-derived fluids or liquids.
These two fundamental aspects are approached by the two classic end-member types of phase
diagrams used in petrology:
- the pressure – temperature diagram (or P–T projection), typically representing the
position of various chemical reactions, which subdivide the P–T space into domains
characterised by the possible stability of particular mineral associations. Although
such diagrams may be useful to understand first order principles, they only represent
the univariant, discontinuous reactions, whereas most mineral changes in complex
systems are achieved via continuous (higher variance) reactions. Furthermore, in
complex systems, such diagrams are difficult to read because of the large number of
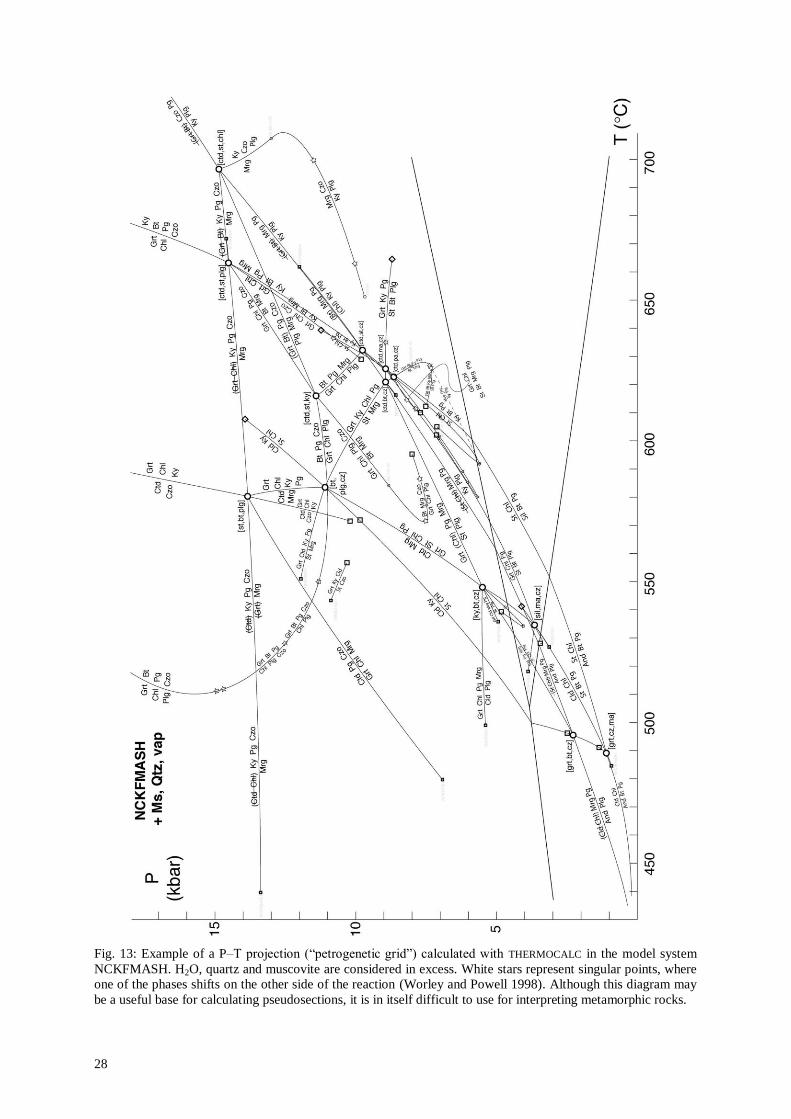
reactions present and the large number of phases involved on each of them (Fig. 13).
- the isobaric, isothermal compatibility diagram, representing all the mineral assemblages in a given chemical system that are compatible (in rocks of different bulk
composition!) at the given pressure and temperature.
In order to understand completely a rock, both aspects need to be considered. A simple
example of such a combination are the binary temperature (or pressure) – composition
diagrams used in magmatic petrology to explain the crystallisation / melting relations in the
solidus – liquidus region. The concept of combining these aspects in one diagram is brought
to the uttermost level in the diagrams known as “pseudosections”.
28
Fig. 13: Example of a P–T projection (“petrogenetic grid”) calculated with THERMOCALC in the model system
NCKFMASH. H2O, quartz and muscovite are considered in excess. White stars represent singular points, where
one of the phases shifts on the other side of the reaction (Worley and Powell 1998). Although this diagram may
be a useful base for calculating pseudosections, it is in itself difficult to use for interpreting metamorphic rocks.
29
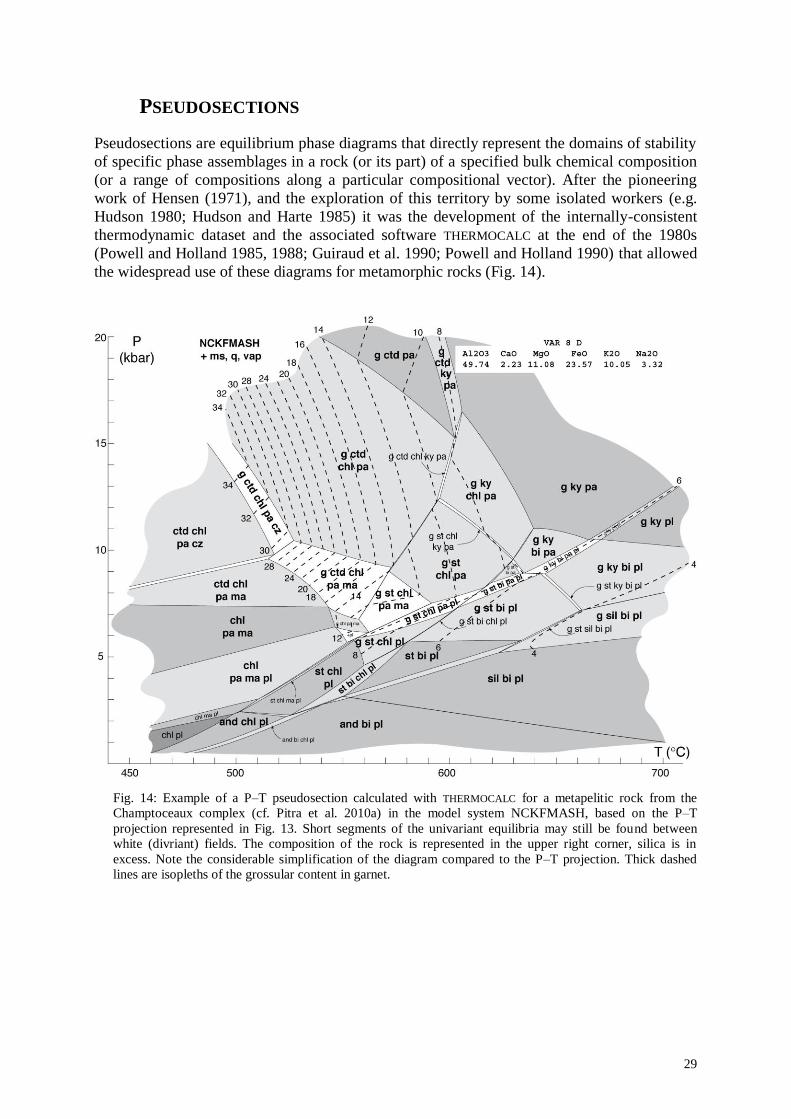
PSEUDOSECTIONS
Pseudosections are equilibrium phase diagrams that directly represent the domains of stability
of specific phase assemblages in a rock (or its part) of a specified bulk chemical composition
(or a range of compositions along a particular compositional vector). After the pioneering
work of Hensen (1971), and the exploration of this territory by some isolated workers (e.g.
Hudson 1980; Hudson and Harte 1985) it was the development of the internally-consistent
thermodynamic dataset and the associated software THERMOCALC at the end of the 1980s
(Powell and Holland 1985, 1988; Guiraud et al. 1990; Powell and Holland 1990) that allowed
the widespread use of these diagrams for metamorphic rocks (Fig. 14).
Fig. 14: Example of a P–T pseudosection calculated with THERMOCALC for a metapelitic rock from the
Champtoceaux complex (cf. Pitra et al. 2010a) in the model system NCKFMASH, based on the P–T
projection represented in Fig. 13. Short segments of the univariant equilibria may still be found between
white (divriant) fields. The composition of the rock is represented in the upper right corner, silica is in
excess. Note the considerable simplification of the diagram compared to the P–T projection. Thick dashed
lines are isopleths of the grossular content in garnet.
30
When calculated using a thermodynamic dataset, pseudosections represent the result of a
forward numerical modelling and are independent on the petrographic observations that can
be done in the specific rock. As such, they can be used to retrieve general information about
the behaviour of metamorphic rocks – e.g. the conditions and sequence of appearance and
disappearance of some characteristic phases (minerals, fluids or liquids), the evolution of their
chemical composition and abundance, the volume or density changes, etc. (e.g. Guiraud et al.
1990; Powell and Holland 1990; Powell et al. 1998; Guiraud et al. 2001; White et al. 2001;
White and Powell 2002; Powell et al. 2005; Guiraud and Powell 2006).
However, when calculated for a particular rock, pseudosections allow to understand its
metamorphic evolution through comparing the observations and the results of the numerical
model. Then they enter the territory of inverse modelling and geothermobarometry sensu lato
(cf. Powell and Holland 2008). That said, they are in several aspects superior to the
geothermobarometric methods mentioned above:
1) Since pseudosections represent the stability domains of mineral assemblages, the first
order petrographic observations (i.e. the inferred equilibrium assemblages) may be
used without recourse to the chemical composition of individual phases (liable to
reequilibration etc.)
2) For the same reason, even partly preserved assemblages (inclusions, partly
pseudomorphed minerals, …) may be useful to infer parts of the P–T path of the rock,
before and after the main equilibration stage.
3) Although the exact position of the individual stability fields is subject to uncertainty
(depending on the bulk composition, on the thermodynamic dataset and its
uncertainties, on the activity–composition relations and finally on the software used),
the relative position of the fields is a robust information (e.g. Hoschek 2004; de
Capitani and Petrakakis 2010). Hence, for example, the development of distinct
mineral assemblages in rocks of the same chemical composition may be interpreted in
terms of differences of equilibration conditions, although the absolute conditions may
be undistinguishable within the uncertainty. In general, my opinion is that the
qualitative information about the relative equilibration conditions or about the
evolution of a rock is the major strength of the pseudosection approach.
4) At each point of a pseudosection, the composition and proportion of all phases may be
calculated. This information, commonly expressed in the form of mineral composition
or mineral proportion isopleths, may be used to further constrain the equilibration
conditions (cf. Fig. 14).
5) Isopleths may also be used to understand the chemical zoning of minerals and use it to
constrain the evolution of the rock (e.g. Stüwe and Powell 1995; Vance and Mahar
1998; Štípská et al. 2006; Pitra et al. 2010b).
6) Finally, given the various difficulties related to the interpretation of rock textures
(some of which are outlined above), pseudosections are a valuable tool to check and
reconsider one‟s inferences. I believe that an iterative feedback, a frequent back and
forth way between petrography and phase equilibria modelling, is the best way for
understanding metamorphic rocks.
Nevertheless, despite this eulogy, the use of pseudosections is time-consuming and several
problematic aspects, shortly addressed below, deserve attention.
31
Choosing of the “right” bulk composition
The inconvenient of incorporating the bulk rock composition into a P–T diagram in
pseudosections is that they are only valid for this particular bulk chemistry. The choice of this
composition is therefore a crucial step. At first glance, the answer may seem ridiculously
simple: “take your rock, crush it and have it analysed!”. Indeed, rock powder chemical
analyses (XRF, or more commonly ICP-AES) are commonly available and relatively
inexpensive. Yet, what is the volume that should be analysed? Whereas “the bigger, the
better” may work for geochemical purposes, the goal of which is, in general, to get an
analysis „representative‟ of large rock volumes, in particular for magmatic rocks, it commonly
does not for pseudosection calculations in metamorphic rocks.
Equilibration volumes
Indeed, metamorphic rocks are commonly heterogeneous and display compositional layering,
of sedimentary or metamorphic origin, lenses of quartz, albite, … or granitic material
resulting from fluid or liquid percolation. Furthermore, as mentioned above, metamorphic
rocks do not necessarily equilibrate at large distances and may be characterised by a multitude
of relatively small equilibration volumes. Clearly, what is needed, is the „bulk‟ composition of
these equilibration volumes.
It may be very difficult to identify with certainty the equilibration volume for a particular part
of a rock sample. Part of the problem lies in the different diffusivities of the different
elements and hence different distances at which these elements can reach equilibrium. This
issue is clearly even more present in fluid-deficient environments (characteristic e.g. for the
retrograde evolution).
In apparently homogeneous rocks, analysed bulk compositions (XRF, ICP-AES,…) have
proved efficient in modelling the prograde metamorphic evolution and peak mineral
assemblages, because equilibration volumes are probably large at high temperatures and fluid-
saturated conditions. However, the size of equilibration volumes decreases rapidly as fluids
are consumed and temperature decreases during the retrograde evolution. Yet, for a
reasonably homogeneous rock, mineral proportions at the metamorphic peak at, for example,
thin section scale are similar to those observed at the scale of a large sample. When
metamorphic conditions change, the reacting effective bulk composition will then be similar
to the bulk of the sample, even if equilibration volumes are small. This should be reflected by
the homogeneity of the reaction textures across the sample. If this is the case, pseudosections
calculated for the analysed bulk compositions may still be used for understanding the entire
metamorphic evolution. Analysed bulk compositions are therefore commonly a good starting
point.
In layered rocks the solution is either to extract and analyse only the particular layer of
interest, or to calculate the bulk composition from the chemical composition of the phases
present and their modal proportions (determined e.g. by point counting). The treatment of
lenses of quartz or quartzo-feldspathic material depends on the interpretation of their origin. If
the material is believed to be externally-derived, it should be removed. If it is inferred to
represent a local segregation from the rock, then the treatment depends on the segment of the
rock history that we are interested in, with respect to the moment of formation of the
segregations.
32
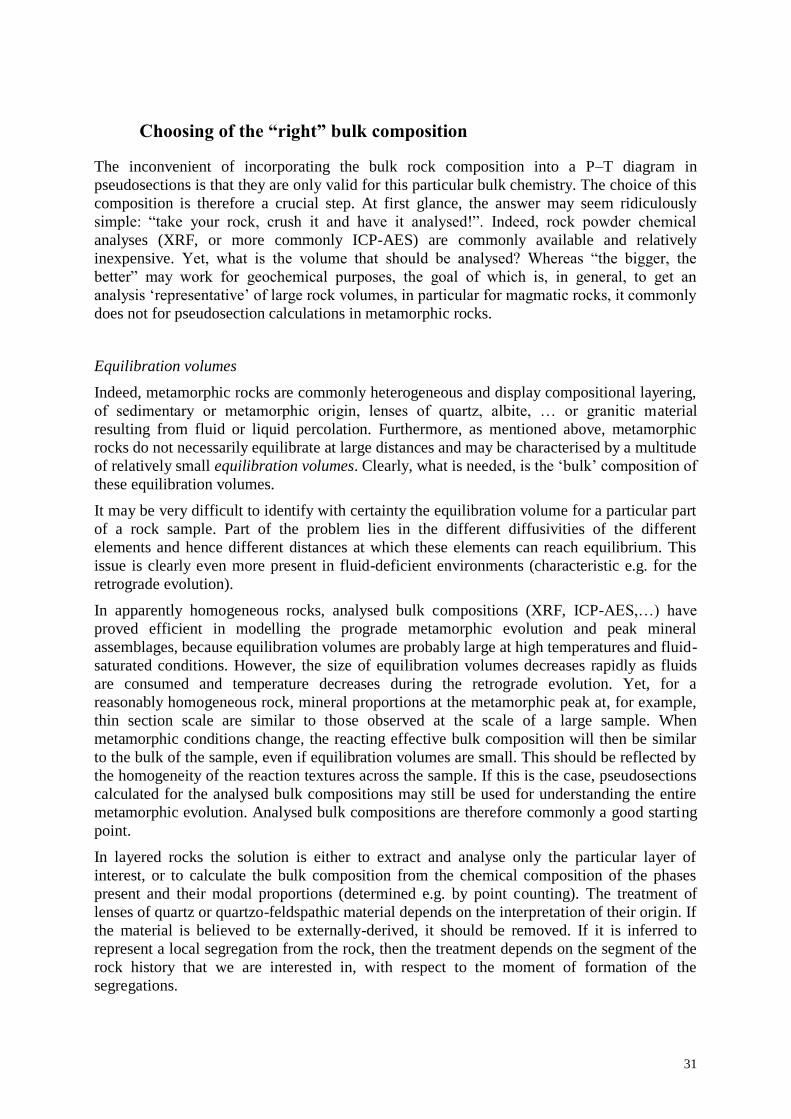
Zoned minerals
The presence of variations in the chemical composition of minerals of the same species
reflects a lack of equilibration at the scale of observation. The presence of preserved chemical
zoning in minerals is such an example. Cores of a chemically zoned garnet are clearly not in
equilibrium with the matrix minerals (that may be in equilibrium with the garnet rims) and
retain chemical components that are then unavailable for the equilibration of the matrix (e.g.
Stüwe 1997). Consequently, these parts of the zoned crystals should be removed from the
analysed bulk composition (e.g. Marmo et al. 2002), although the first order effect is
commonly not impressive (Fig. 15).
Fig. 15: X-ray maps of a strongly zoned garnet from the Champtoceaux complex (Armorican
massif), and a series of P–T pseudosections contoured for garnet composition expressed as
proportions (%) of spessartine (Mn) and grossular (Ca). a) is calculated for the analysed bulk
composition. b) is for a composition where the garnet core (≈4% of the rock), inferred not in
equilibrium with the crystallising matrix, was subtracted from the analysed bulk composition. The
composition in c) is that of b) minus additional 4% of the garnet “high-Ca” middle zone. The main
chemical effect is the decrease of the CaO and MnO content. The position of most fields remains
unaffected, but the isopleths are significantly displaced. Garnet disappears at low pressures and
temperatures.
33
Ferric iron
Iron commonly occurs in two oxidation states in rocks and minerals – the ferrous Fe2+
and the
ferric Fe3+
. Metapelitic rocks form in general under relatively reducing conditions and
calculations indicate that small to moderate amounts of Fe2O3 in typical metapelitic bulk
compositions have little effect on silicate mineral equilibria in metapelites (e.g. White et al.
2000). The situation is different in metabasic rocks, where several minerals – in particular
clinopyroxenes, clinoamphiboles and epidote – may incorporate significant amounts of Fe3+
,
which has an important effect on their stability (e.g. Ballèvre et al. 2003; Warren and Waters
2006; Diener et al. 2007).
Since the formulation of satisfactory solid-solution models including ferric iron for
amphiboles and pyroxenes (Dale et al. 2005; Diener et al. 2007; Green et al. 2007), it became
clear that the amount of ferric iron in metabasic rocks needs to be taken into account.
Unfortunately, because alteration may affect significantly the oxidation state, it became a
common practice not to analyse specifically for FeO and Fe2O3 and deal with “total iron”.
Whereas this may be acceptable from the geochemical point of view, it clearly hinders a
satisfactory understanding of phase relations and equilibration conditions of metamorphic, in
particular metabasic rocks. In the absence of reliable data on the oxidation state of metabasic
rocks, the amount of ferric iron can be estimated from the chemical composition and the mode
of the minerals present (e.g. Ballèvre et al. 2003; Warren and Waters 2006). Nevertheless, in
this case a supplementary uncertainty arises from the problematic estimation of the ferric iron
content from microprobe analyses (e.g. Droop 1987). In this situation some authors relied on
one of the rare systematic studies (Schilling et al. 1983), which suggested that ferric iron
represents ca. 12% of total iron in the MORB-type rocks. Although this assumption lead to
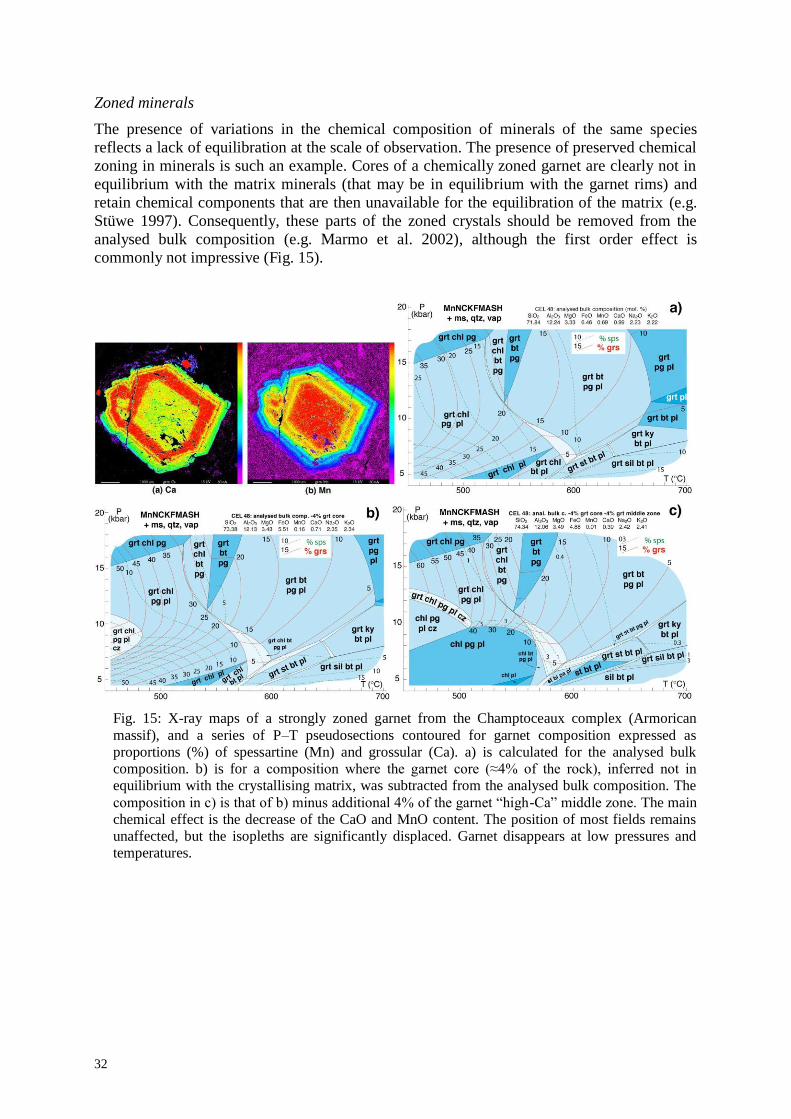
reasonable results (Diener et al. 2007; Pitra et al. 2010b), chemical analyses of unaltered
metabasic rocks show that the amount of ferric iron may be significantly higher (e.g. up to
≈30% and ≈45% of total iron in the omphacite-bearing blueschists from Ile de Groix and
Syros, respectively!), with non-negligible effects on the modelled phase relations (Fig. 16). It
becomes clear that the amount of ferric iron in the bulk rock composition is a fundamental
parameter that needs to be analysed systematically. Remains the problem of simple and
accurate analysing of Fe3+
in individual minerals…
Fig. 16: T–X (temperature–composition)
pseudosection calculated at 16 kbar for a
blueschist (sample GAL1) from the island of
Syros (Greece) by Lorraine Tual. The
compositional vector corresponds to the variation
of the proportion of the ferric out of the total
iron. 12% corresponds to the amount of ferric
iron reported by Schilling et al. (1983), 40%
(extreme right) corresponds to the amount
analysed in the sample. This amount seemed so
unreasonably high that we started the
calculations with 12% Fe3+
. The misfit between
the model and the observations led us to
reconsider this point. Note in particular the
disappearance of omphacite (upper right corner)
at high values of Fe3+
, in agreement with the
(unusual in the sector) lack of omphacite in this
sample.
34
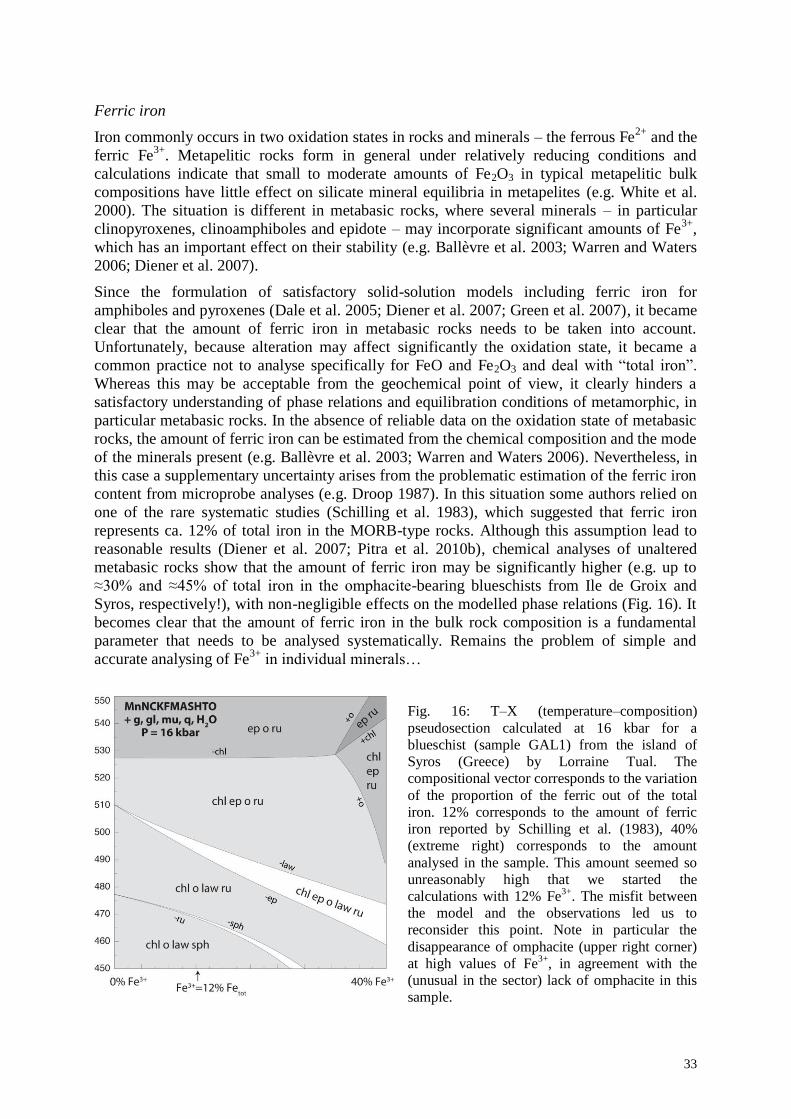
Available H2O
A vast majority of metamorphic reactions have a dehydration character and produce an H2O-
fluid when crossed upon heating, during the prograde evolution. Accordingly, most rocks are
saturated in H2O, which is then commonly considered in excess. Whereas this approach yields
correct results in most cases, several exceptions merit to be stressed out:
1) polycyclic evolution: the above is only true if the metamorphosed rock is initially an
unmetamorphosed or a low-grade hydrated rock. This is clearly not the case if
metamorphism is imposed on a rock that suffered a previous metamorphic event and
related dehydration.
2) partial melting: melting reactions are fluid-consuming (or fluid-absent) and the
amount of available H2O plays an important role for the phase relations beyond the
solidus (e.g. Powell 1983; Powell and Downes 1990; White et al. 2001).
3) retrograde evolution: just as fluid is produced on the prograde path, it is consumed at
the retrograde path. Accordingly, the amount of the available fluid at the onset of the
retrograde evolution has important consequences for the phase relations upon cooling.
4) subduction metamorphism: metamorphism in subduction zones is characterised by low
geothermal gradients (steep in a P–T diagram). Rocks following these gradients may
cross some dehydration reactions in the „wrong‟, H2O-consuming direction. This is the
case of the reactions involving lawsonite, which have a relatively „flat‟ slope with
lawsonite being stable at the high pressure, low temperature side. Consequently, rocks
become H2O-undersaturated with important implications for the phase relations and
mineral assemblages encountered in such environments (e.g. Ballèvre et al. 2003;
Clarke et al. 2006) (Fig. 17).
In all these cases the initial available amount of free H2O-fluid needs to be estimated. It can
be argued that for mechanical reasons free fluids in rocks can only be present at grain
boundaries and limited intercrystalline spaces, the volume of which does not exceed 1-2
vol.%, but possibly as little as 0.1 vol. % (Thompson and Connolly 1990). The common
procedure is to consider that the rock was “just fluid-saturated”, i.e. containing some small,
arbitrary amount of free H2O-fluid at the moment just before crossing the fluid-consuming
reactions.
Fig. 17: P–T pseudosections calculated for a blueschist from Ile de Groix (Ballèvre et al. 2003). H2O-fluid
(Vap) is considered in excess in (a). The H2O content was set so that about 0.1 mole % of free H2O fluid is
present in the stability field of Gln-Chl-Ep-Pg in (b). Whereas the fluid-saturated part of the diagrams is
identical, significant differences exist in the H2O-undersaturated, LT-HP part. Water undersaturation results
in the extension of the fluid-absent equivalents of the high temperature fields towards lower temperatures and
in the strongly pressure-dependent character of their boundaries.
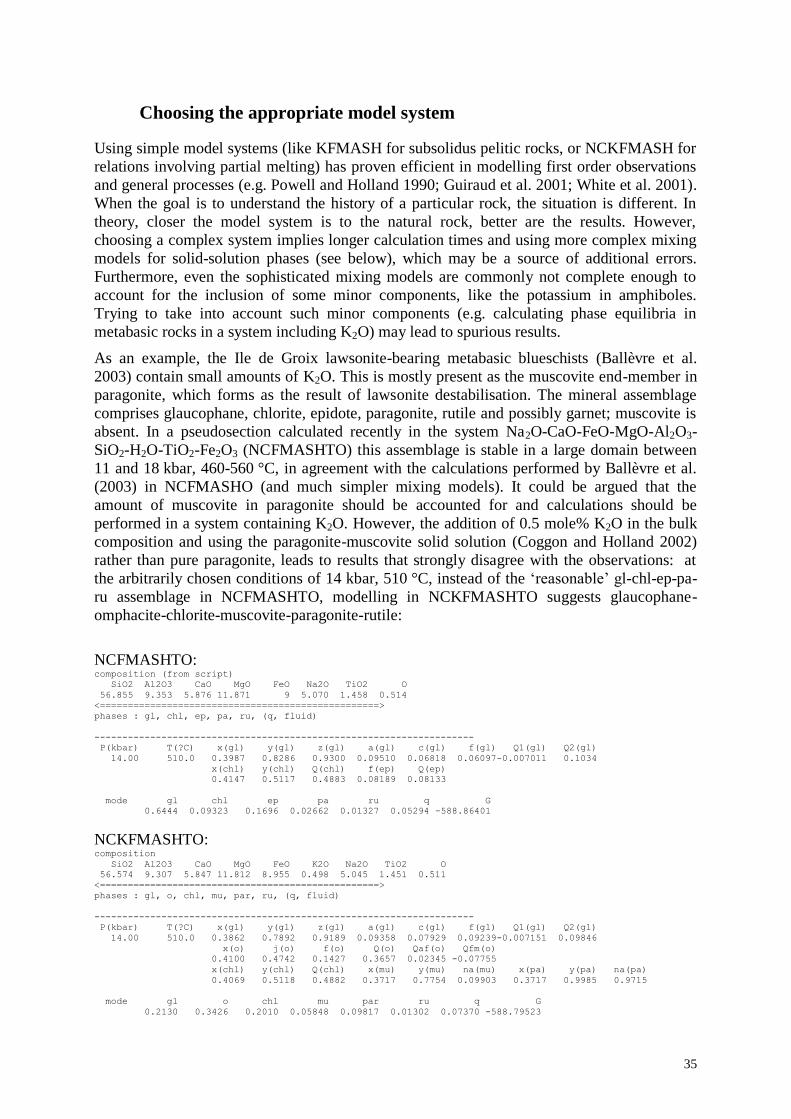
35
Choosing the appropriate model system
Using simple model systems (like KFMASH for subsolidus pelitic rocks, or NCKFMASH for
relations involving partial melting) has proven efficient in modelling first order observations
and general processes (e.g. Powell and Holland 1990; Guiraud et al. 2001; White et al. 2001).
When the goal is to understand the history of a particular rock, the situation is different. In
theory, closer the model system is to the natural rock, better are the results. However,
choosing a complex system implies longer calculation times and using more complex mixing
models for solid-solution phases (see below), which may be a source of additional errors.
Furthermore, even the sophisticated mixing models are commonly not complete enough to
account for the inclusion of some minor components, like the potassium in amphiboles.
Trying to take into account such minor components (e.g. calculating phase equilibria in
metabasic rocks in a system including K2O) may lead to spurious results.
As an example, the Ile de Groix lawsonite-bearing metabasic blueschists (Ballèvre et al.
2003) contain small amounts of K2O. This is mostly present as the muscovite end-member in
paragonite, which forms as the result of lawsonite destabilisation. The mineral assemblage
comprises glaucophane, chlorite, epidote, paragonite, rutile and possibly garnet; muscovite is
absent. In a pseudosection calculated recently in the system Na2O-CaO-FeO-MgO-Al2O3-
SiO2-H2O-TiO2-Fe2O3 (NCFMASHTO) this assemblage is stable in a large domain between
11 and 18 kbar, 460-560 °C, in agreement with the calculations performed by Ballèvre et al.
(2003) in NCFMASHO (and much simpler mixing models). It could be argued that the
amount of muscovite in paragonite should be accounted for and calculations should be
performed in a system containing K2O. However, the addition of 0.5 mole% K2O in the bulk
composition and using the paragonite-muscovite solid solution (Coggon and Holland 2002)
rather than pure paragonite, leads to results that strongly disagree with the observations: at
the arbitrarily chosen conditions of 14 kbar, 510 °C, instead of the „reasonable‟ gl-chl-ep-pa-
ru assemblage in NCFMASHTO, modelling in NCKFMASHTO suggests glaucophane-
omphacite-chlorite-muscovite-paragonite-rutile:
NCFMASHTO: composition (from script)
SiO2 Al2O3 CaO MgO FeO Na2O TiO2 O
56.855 9.353 5.876 11.871 9 5.070 1.458 0.514
<==================================================>
phases : gl, chl, ep, pa, ru, (q, fluid)
--------------------------------------------------------------------
P(kbar) T(?C) x(gl) y(gl) z(gl) a(gl) c(gl) f(gl) Q1(gl) Q2(gl)
14.00 510.0 0.3987 0.8286 0.9300 0.09510 0.06818 0.06097-0.007011 0.1034
x(chl) y(chl) Q(chl) f(ep) Q(ep)
0.4147 0.5117 0.4883 0.08189 0.08133
mode gl chl ep pa ru q G
0.6444 0.09323 0.1696 0.02662 0.01327 0.05294 -588.86401
NCKFMASHTO: composition
SiO2 Al2O3 CaO MgO FeO K2O Na2O TiO2 O
56.574 9.307 5.847 11.812 8.955 0.498 5.045 1.451 0.511
<==================================================>
phases : gl, o, chl, mu, par, ru, (q, fluid)
--------------------------------------------------------------------
P(kbar) T(?C) x(gl) y(gl) z(gl) a(gl) c(gl) f(gl) Q1(gl) Q2(gl)
14.00 510.0 0.3862 0.7892 0.9189 0.09358 0.07929 0.09239-0.007151 0.09846
x(o) j(o) f(o) Q(o) Qaf(o) Qfm(o)
0.4100 0.4742 0.1427 0.3657 0.02345 -0.07755
x(chl) y(chl) Q(chl) x(mu) y(mu) na(mu) x(pa) y(pa) na(pa)
0.4069 0.5118 0.4882 0.3717 0.7754 0.09903 0.3717 0.9985 0.9715
mode gl o chl mu par ru q G
0.2130 0.3426 0.2010 0.05848 0.09817 0.01302 0.07370 -588.79523
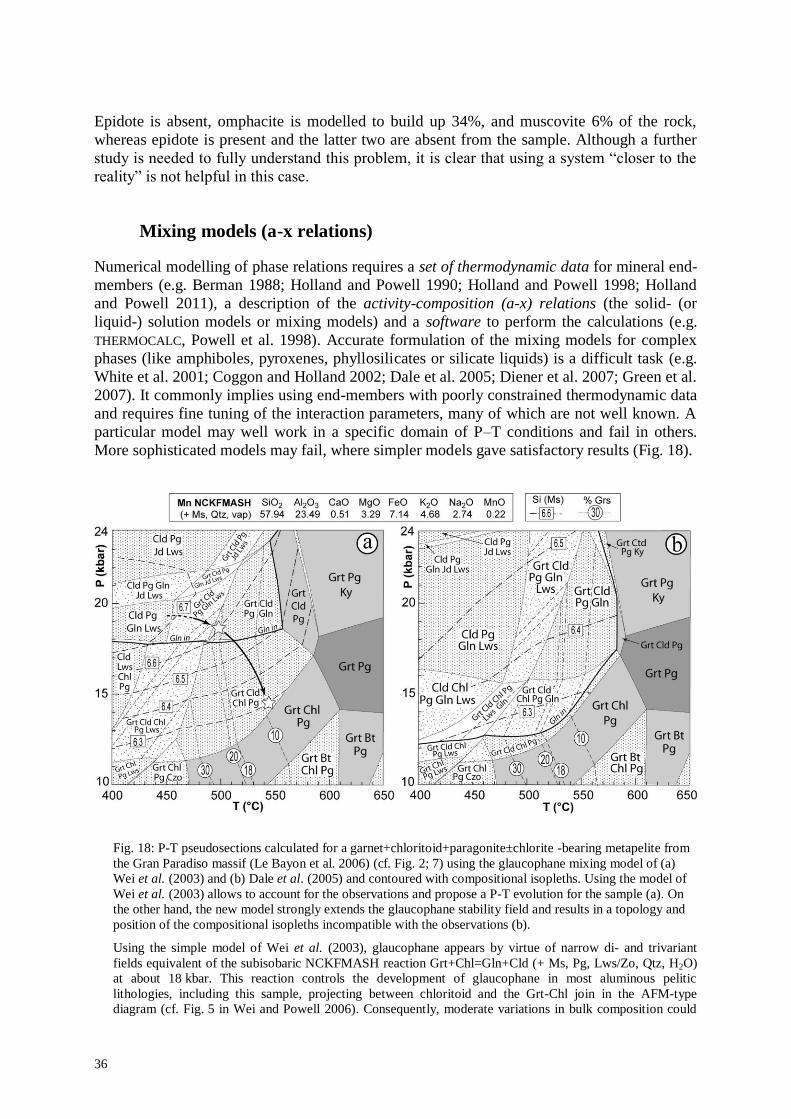
36
Epidote is absent, omphacite is modelled to build up 34%, and muscovite 6% of the rock,
whereas epidote is present and the latter two are absent from the sample. Although a further
study is needed to fully understand this problem, it is clear that using a system “closer to the
reality” is not helpful in this case.
Mixing models (a-x relations)
Numerical modelling of phase relations requires a set of thermodynamic data for mineral end-
members (e.g. Berman 1988; Holland and Powell 1990; Holland and Powell 1998; Holland
and Powell 2011), a description of the activity-composition (a-x) relations (the solid- (or
liquid-) solution models or mixing models) and a software to perform the calculations (e.g.
THERMOCALC, Powell et al. 1998). Accurate formulation of the mixing models for complex
phases (like amphiboles, pyroxenes, phyllosilicates or silicate liquids) is a difficult task (e.g.
White et al. 2001; Coggon and Holland 2002; Dale et al. 2005; Diener et al. 2007; Green et al.
2007). It commonly implies using end-members with poorly constrained thermodynamic data
and requires fine tuning of the interaction parameters, many of which are not well known. A
particular model may well work in a specific domain of P–T conditions and fail in others.
More sophisticated models may fail, where simpler models gave satisfactory results (Fig. 18).
Fig. 18: P-T pseudosections calculated for a garnet+chloritoid+paragonite±chlorite -bearing metapelite from
the Gran Paradiso massif (Le Bayon et al. 2006) (cf. Fig. 2; 7) using the glaucophane mixing model of (a)
Wei et al. (2003) and (b) Dale et al. (2005) and contoured with compositional isopleths. Using the model of
Wei et al. (2003) allows to account for the observations and propose a P-T evolution for the sample (a). On
the other hand, the new model strongly extends the glaucophane stability field and results in a topology and
position of the compositional isopleths incompatible with the observations (b).
Using the simple model of Wei et al. (2003), glaucophane appears by virtue of narrow di- and trivariant
fields equivalent of the subisobaric NCKFMASH reaction Grt+Chl=Gln+Cld (+ Ms, Pg, Lws/Zo, Qtz, H2O)
at about 18 kbar. This reaction controls the development of glaucophane in most aluminous pelitic
lithologies, including this sample, projecting between chloritoid and the Grt-Chl join in the AFM-type
diagram (cf. Fig. 5 in Wei and Powell 2006). Consequently, moderate variations in bulk composition could
37
not explain the absence of glaucophane above this reaction. According to the position of the compositional
isopleths, muscovite and garnet 2 cores would have equilibrated in the Grt-Cld-Pg-Gln field at PT conditions
of about 18-20 kbar, 490-500°C. The small amount of glaucophane present at this stage (ca. 5%) could have
easily reacted out during subsequent evolution, explaining its absence from the sample.
On the other hand, if glaucophane is modelled according to the more complex model of Dale et al. (2005),
the NCKFMASH reaction Grt+Chl=Gln+Cld (+ Ms, Pg, Lws/Zo, Qtz, H2O) has a strongly positive slope
(10 kbar at 440°C, 18 kbar at 550°C) and the stability of glaucophane expands considerably towards low
pressures. In consequence, the stability field of the main observed paragenesis Grt-Cld-Chl-Pg shrinks to
merely a narrow band just beyond the Gln-in line. Moreover, the isopleths of Si(Ms) are shifted towards high
pressures and there is no intersection between the isopleths corresponding to the composition of the cores of
muscovite and that of garnet. Additionally, the highest values of Si-content measured in the muscovite cores
and muscovite “inclusions” in garnet are modelled in the pseudosection only at extremely high pressures or
low temperatures. In consequence, it is difficult to interpret the observed equilibrium relations in the
framework of this diagram.
Finally, because the dataset has to be internally-consistent and the thermodynamic data for
many end-members are not or poorly experimentally constrained, the generation of some data
requires some hypotheses about the activity-composition relations to be made. Then, the
dataset and the a-x relations used for phase equilibria modelling are not completely
independent and care is needed for the user to choose the appropriate solid-solution model
when using a particular dataset.
Available software
Two competing approaches (and related software) exist for constructing the pseudosections.
1) Gibbs energy minimisation. In this approach, the calculated diagram (P–T, P–X, T–X, …)
is divided into a grid and Gibbs energy is minimised for each imaginable phase combination
(within the selected system, using the selected mixing models for solution phases) at each
point of the grid. At each point, the combination having the lowest Gibbs energy is declared
the “stable” one and retained for the graphical output. The result is a juxtaposition of fields
corresponding to the different phase assemblages. The field boundaries are not calculated, but
interpolated between two points with non-identical phase assemblages. The software gives a
(more or less elegant) graphical output of the result. Examples of software using this approach
are Perple_X (Connolly 1990; Connolly and Petrini 2002) or Theriak-Domino (de Capitani
and Brown 1987; de Capitani and Petrakakis 2010).
2) Non-linear equation solver. This approach uses the fundamental elegant fact that at the
boundary between two fields with different phase assemblages, the Gibbs energies of both
assemblages are identical and hence ∆G = 0. Lines, instead of fields are calculated, by solving
series of non-linear equations. It is the responsibility of the user to decide what equilibria
should be calculated. The calculated lines need to be assembled manually in order to produce
the desired phase diagram. THERMOCALC (Powell and Holland 1988; Powell et al. 1998) uses
this approach.
The direct graphical output offered by the „Gibbs energy minimisers‟ is appealing, as is the
fact that the brain can rest while the software is performing the calculation. Nevertheless, this
is also the danger of this approach. Far too often papers are submitted, and commonly
accepted, which contain diagrams that contain serious errors, or are plainly wrong (perhaps is
it wiser not to give references here). Indeed, although the calculations are performed
automatically, a serious work is needed (beyond the petrographical analysis) in order to
38
choose the correct chemical system, appropriate mixing models, eliminate „inappropriate‟
end-members, etc. (as outlined in the above sections).
Some of the errors (although rather minor) are related to the very principle of the method. In
complex P–T regions, where many assemblages have closely similar energies, spurious
results are locally obtained, related to the technical aspects of the calculation – here again the
user input is needed (and sadly commonly lacking).
Despite all the drawbacks (time-consuming, not always user-friendly, capricious with starting
guesses, no quick graphical output, …) the major advantage of THERMOCALC is the strong
coherence between the software, the thermodynamic database and the development of mixing
models, due to the long-term work of the group around Roger Powell and Tim Holland.
Indeed, THERMOCALC is at present the only software capable of handling in an acceptable way
phase relations in complex systems involving complex solid solutions (like the amphibole-
and pyroxene-bearing metabasic rocks).
Finally, the intellectual implication required for using THERMOCALC makes the software more
suitable for pedagogical purposes (which is not negligible for a lecturer) – the student can see
what is happening and is required to think about the calculations that are to be performed,
which leads to a much better understanding of the metamorphic systems.
To sum up, assuming an aware user, the rapidity and relative easiness of use make Perple_X
and Theriak-Domino interesting alternatives for use in relatively simple systems (like the
metapelitic rocks), in particular if a large range of various diagrams is to be calculated.
THERMOCALC remains the best choice for calculating accurate phase diagrams in complex
systems or with phases requiring complex mixing models. And this is also my choice…
Not only phase diagrams… avPT
Despite the general superiority of the phase diagram approach, „geothermobarometry‟ can still
yield useful results, in particular in the multi-equilibrium form (e.g. Powell and Holland
2008). THERMOCALC offers the possibility of performing multi-equilibrium
geothermobarometric calculations – in the so-called “average PT”, or “avPT”, mode. Full
details are discussed in Powell and Holland (1988; 1994). The major advantage of
THERMOCALC in this domain is the realistic treatment of uncertainties and their propagation
through the calculations. Using the 2 statistical test, THERMOCALC also allows to estimate the
coherence of the input data used and, if needed, eliminate the inappropriate phases. Although
the results may be disappointing (very large uncertainties in some high variance or
incompletely equilibrated assemblages), at least this indicates that such rocks simply do not
have the geothermobarometric potential expected and should not be used (although the phase
diagram treatment may make them speak in some instances).
Finally, THERMOCALC-based average pressure-temperature calculations may give an idea of
the activity of H2O during metamorphism, by allowing to investigate the dependence of the
uncertainties and the results of the 2 test (“fit”) on aH2O (cf. Powell & Holland, 1988; 1994).
Two examples of using this method are given in the following section (Fig. 23, 26).

39
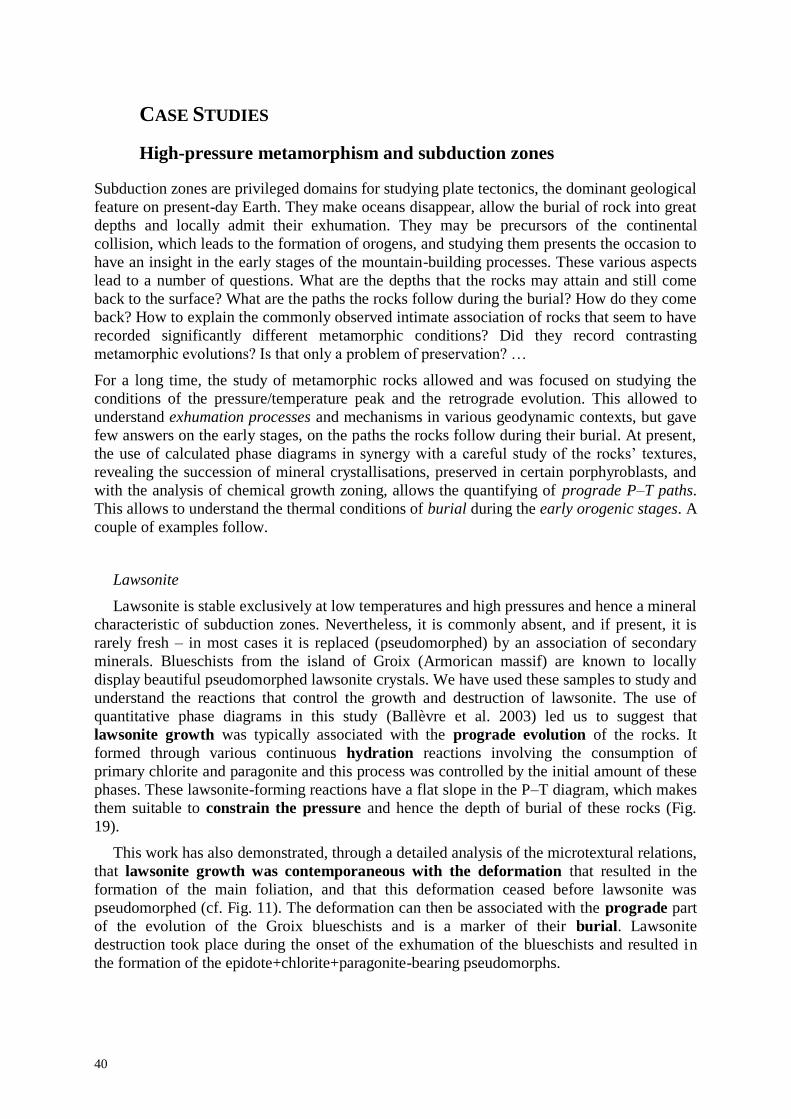
40
CASE STUDIES
High-pressure metamorphism and subduction zones
Subduction zones are privileged domains for studying plate tectonics, the dominant geological
feature on present-day Earth. They make oceans disappear, allow the burial of rock into great
depths and locally admit their exhumation. They may be precursors of the continental
collision, which leads to the formation of orogens, and studying them presents the occasion to
have an insight in the early stages of the mountain-building processes. These various aspects
lead to a number of questions. What are the depths that the rocks may attain and still come
back to the surface? What are the paths the rocks follow during the burial? How do they come
back? How to explain the commonly observed intimate association of rocks that seem to have
recorded significantly different metamorphic conditions? Did they record contrasting
metamorphic evolutions? Is that only a problem of preservation? …
For a long time, the study of metamorphic rocks allowed and was focused on studying the
conditions of the pressure/temperature peak and the retrograde evolution. This allowed to
understand exhumation processes and mechanisms in various geodynamic contexts, but gave
few answers on the early stages, on the paths the rocks follow during their burial. At present,
the use of calculated phase diagrams in synergy with a careful study of the rocks‟ textures,
revealing the succession of mineral crystallisations, preserved in certain porphyroblasts, and
with the analysis of chemical growth zoning, allows the quantifying of prograde P–T paths.
This allows to understand the thermal conditions of burial during the early orogenic stages. A
couple of examples follow.
Lawsonite
Lawsonite is stable exclusively at low temperatures and high pressures and hence a mineral
characteristic of subduction zones. Nevertheless, it is commonly absent, and if present, it is
rarely fresh – in most cases it is replaced (pseudomorphed) by an association of secondary
minerals. Blueschists from the island of Groix (Armorican massif) are known to locally
display beautiful pseudomorphed lawsonite crystals. We have used these samples to study and
understand the reactions that control the growth and destruction of lawsonite. The use of
quantitative phase diagrams in this study (Ballèvre et al. 2003) led us to suggest that
lawsonite growth was typically associated with the prograde evolution of the rocks. It
formed through various continuous hydration reactions involving the consumption of
primary chlorite and paragonite and this process was controlled by the initial amount of these
phases. These lawsonite-forming reactions have a flat slope in the P–T diagram, which makes
them suitable to constrain the pressure and hence the depth of burial of these rocks (Fig.
19).
This work has also demonstrated, through a detailed analysis of the microtextural relations,
that lawsonite growth was contemporaneous with the deformation that resulted in the
formation of the main foliation, and that this deformation ceased before lawsonite was
pseudomorphed (cf. Fig. 11). The deformation can then be associated with the prograde part
of the evolution of the Groix blueschists and is a marker of their burial. Lawsonite
destruction took place during the onset of the exhumation of the blueschists and resulted in
the formation of the epidote+chlorite+paragonite-bearing pseudomorphs.
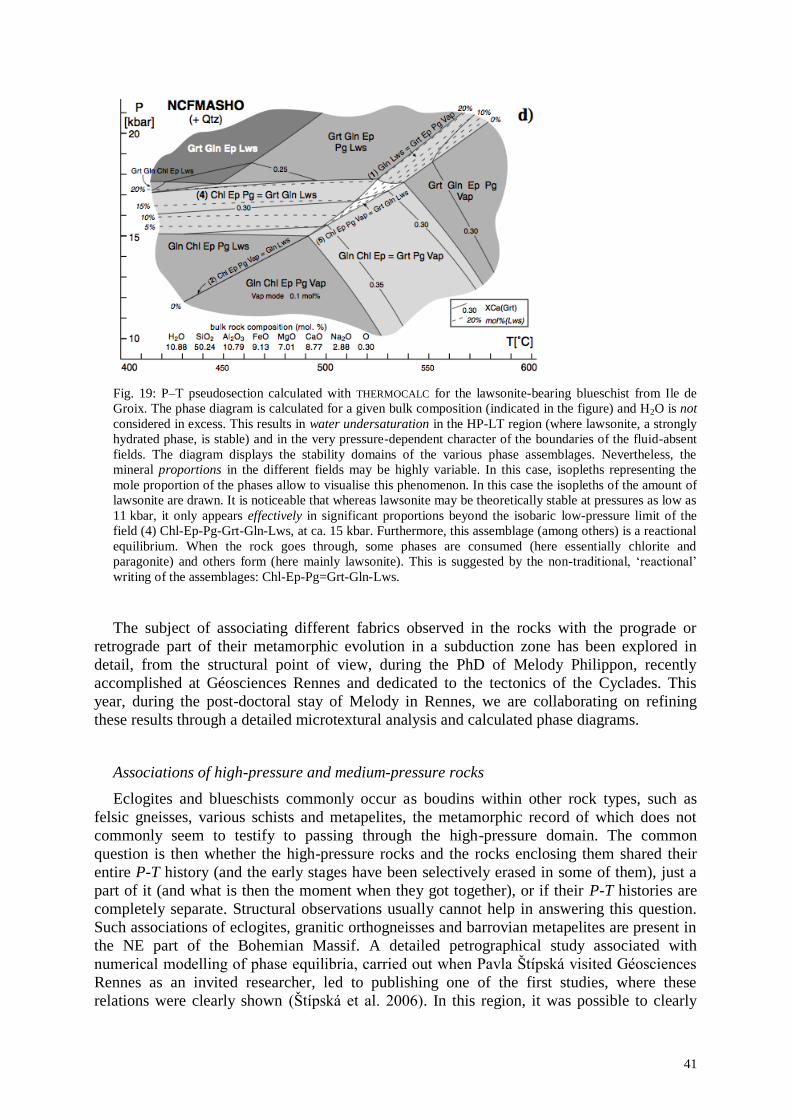
41
Fig. 19: P–T pseudosection calculated with THERMOCALC for the lawsonite-bearing blueschist from Ile de
Groix. The phase diagram is calculated for a given bulk composition (indicated in the figure) and H2O is not
considered in excess. This results in water undersaturation in the HP-LT region (where lawsonite, a strongly
hydrated phase, is stable) and in the very pressure-dependent character of the boundaries of the fluid-absent
fields. The diagram displays the stability domains of the various phase assemblages. Nevertheless, the
mineral proportions in the different fields may be highly variable. In this case, isopleths representing the
mole proportion of the phases allow to visualise this phenomenon. In this case the isopleths of the amount of
lawsonite are drawn. It is noticeable that whereas lawsonite may be theoretically stable at pressures as low as
11 kbar, it only appears effectively in significant proportions beyond the isobaric low-pressure limit of the
field (4) Chl-Ep-Pg-Grt-Gln-Lws, at ca. 15 kbar. Furthermore, this assemblage (among others) is a reactional
equilibrium. When the rock goes through, some phases are consumed (here essentially chlorite and
paragonite) and others form (here mainly lawsonite). This is suggested by the non-traditional, „reactional‟
writing of the assemblages: Chl-Ep-Pg=Grt-Gln-Lws.
The subject of associating different fabrics observed in the rocks with the prograde or
retrograde part of their metamorphic evolution in a subduction zone has been explored in
detail, from the structural point of view, during the PhD of Melody Philippon, recently
accomplished at Géosciences Rennes and dedicated to the tectonics of the Cyclades. This
year, during the post-doctoral stay of Melody in Rennes, we are collaborating on refining
these results through a detailed microtextural analysis and calculated phase diagrams.
Associations of high-pressure and medium-pressure rocks
Eclogites and blueschists commonly occur as boudins within other rock types, such as
felsic gneisses, various schists and metapelites, the metamorphic record of which does not
commonly seem to testify to passing through the high-pressure domain. The common
question is then whether the high-pressure rocks and the rocks enclosing them shared their
entire P-T history (and the early stages have been selectively erased in some of them), just a
part of it (and what is then the moment when they got together), or if their P-T histories are
completely separate. Structural observations usually cannot help in answering this question.
Such associations of eclogites, granitic orthogneisses and barrovian metapelites are present in
the NE part of the Bohemian Massif. A detailed petrographical study associated with
numerical modelling of phase equilibria, carried out when Pavla Štípská visited Géosciences
Rennes as an invited researcher, led to publishing one of the first studies, where these
relations were clearly shown (Štípská et al. 2006). In this region, it was possible to clearly
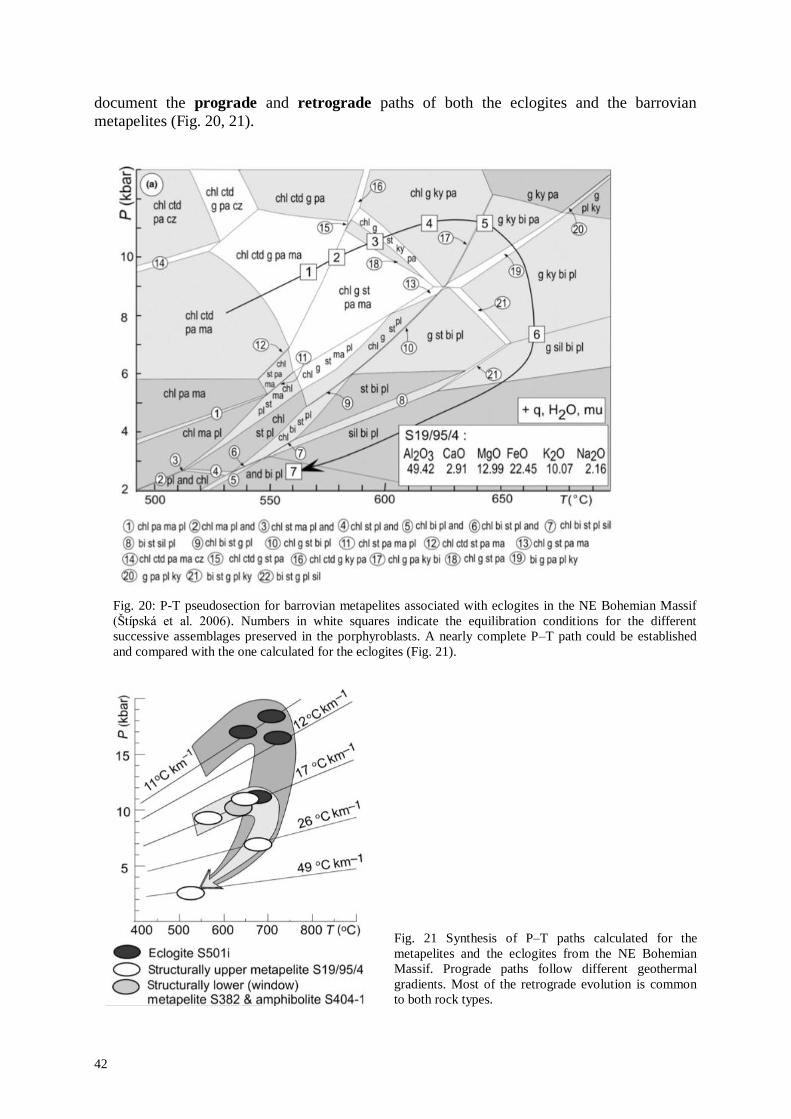
42
document the prograde and retrograde paths of both the eclogites and the barrovian
metapelites (Fig. 20, 21).
Fig. 20: P-T pseudosection for barrovian metapelites associated with eclogites in the NE Bohemian Massif
(Štípská et al. 2006). Numbers in white squares indicate the equilibration conditions for the different
successive assemblages preserved in the porphyroblasts. A nearly complete P–T path could be established
and compared with the one calculated for the eclogites (Fig. 21).
Fig. 21 Synthesis of P–T paths calculated for the
metapelites and the eclogites from the NE Bohemian
Massif. Prograde paths follow different geothermal
gradients. Most of the retrograde evolution is common
to both rock types.
43
This work has shown that the two rock types have followed distinct prograde evolutions,
along different geothermal gradients. They minimum difference in peak pressures is ca. 6-
7 kbar, corresponding to a difference in the burial depth of some 25 km. Both lithologies
came together in depths of ca. 40 km (11 kbar) and shared the same retrograde evolution from
this point on.
Although the geodynamic context, characterised by the metamorphic conditions and the
geothermal gradients, is that of a continental accretionary prism rather than that of a
subduction zone, the approach can clearly be exported into subduction zone contexts, where
similar associations are frequently observed.
Inverted metamorphic sequences
A common feature of orogenic belts issued from continental collision is the presence of
crustal-scale thrusts that superpose high-grade metamorphic units over lower-grade ones. The
result is an inverted metamorphic zoning. Structural elements associated to these thrusts are
commonly overprinted by later tectonic events, and inverted metamorphism is often the only
trace of continental collision in old orogens. Despite numerous field-based studies and
numerical models, the development of inverted metamorphic zoning, its preservation and
exhumation remain controversial, although it is a key-point in understanding of orogenic
processes. In particular, it is important to understand if the metamorphic inversion reflects,
and to what extent, the transient inversion of the geothermal gradient. The combination of a
petrological analysis and a detailed multi-method geochronological approach appears to be an
efficient way to address this problem.
We have shown (Pitra et al. 2010a) that the Champtoceaux Complex (Armorican Massif)
displays such an inverted metamorphic zoning (Fig. 22). The temperature of the syntectonic
assemblages increases in a continuous way from <500°C to >650°C (Fig. 23), from the base
of the sequence to the major thrust, marked by lenses of serpentinised peridotites, interpreted
as remnants of an oceanic crust, at the base of a migmatitic unit. Yet, this temperature
increase is not accompanied by a pressure gradient, which would be expected from a post-
metamorphic inversion. No low-temperature shear zone has been observed within the inverted
sequence. Finally, all the peak metamorphic assemblages are syn-kinematic. These
observations led us to conclude that the inverted metamorphic gradient resulted form a
thermal perturbation, induced by the rapid emplacement of a hot nappe, probably
migmatitic, on colder rocks.
Ar-Ar geochronology allowed to show that metamorphism took place nearly
simultaneously through the entire inverted sequence. But first of all, the similarity of the Rb-
Sr and Ar-Ar ages on both sides of the major thrust testifies to a particularly efficient cooling
of the whole sequence. This rapid cooling, attributable to a tectonic denudation, allowed the
preservation of the inverted metamorphic gradient.
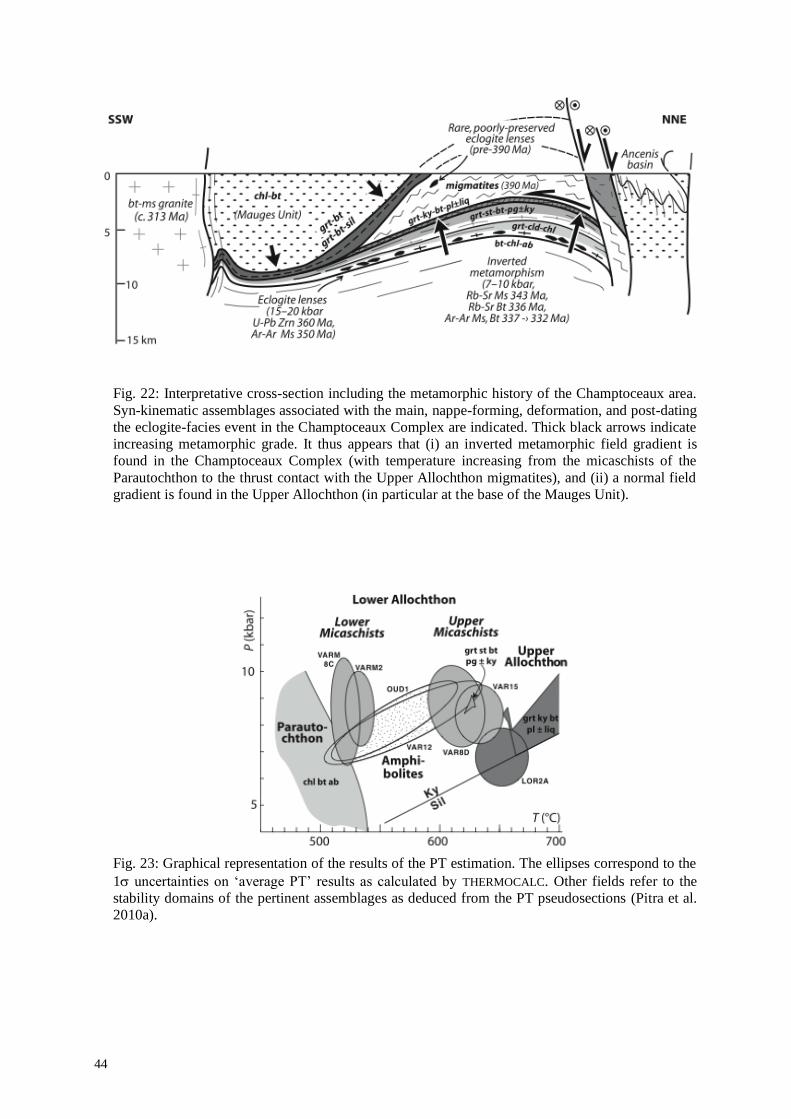
44
Fig. 22: Interpretative cross-section including the metamorphic history of the Champtoceaux area.
Syn-kinematic assemblages associated with the main, nappe-forming, deformation, and post-dating
the eclogite-facies event in the Champtoceaux Complex are indicated. Thick black arrows indicate
increasing metamorphic grade. It thus appears that (i) an inverted metamorphic field gradient is
found in the Champtoceaux Complex (with temperature increasing from the micaschists of the
Parautochthon to the thrust contact with the Upper Allochthon migmatites), and (ii) a normal field
gradient is found in the Upper Allochthon (in particular at the base of the Mauges Unit).
Fig. 23: Graphical representation of the results of the PT estimation. The ellipses correspond to the
1 uncertainties on „average PT‟ results as calculated by THERMOCALC. Other fields refer to the
stability domains of the pertinent assemblages as deduced from the PT pseudosections (Pitra et al.
2010a).
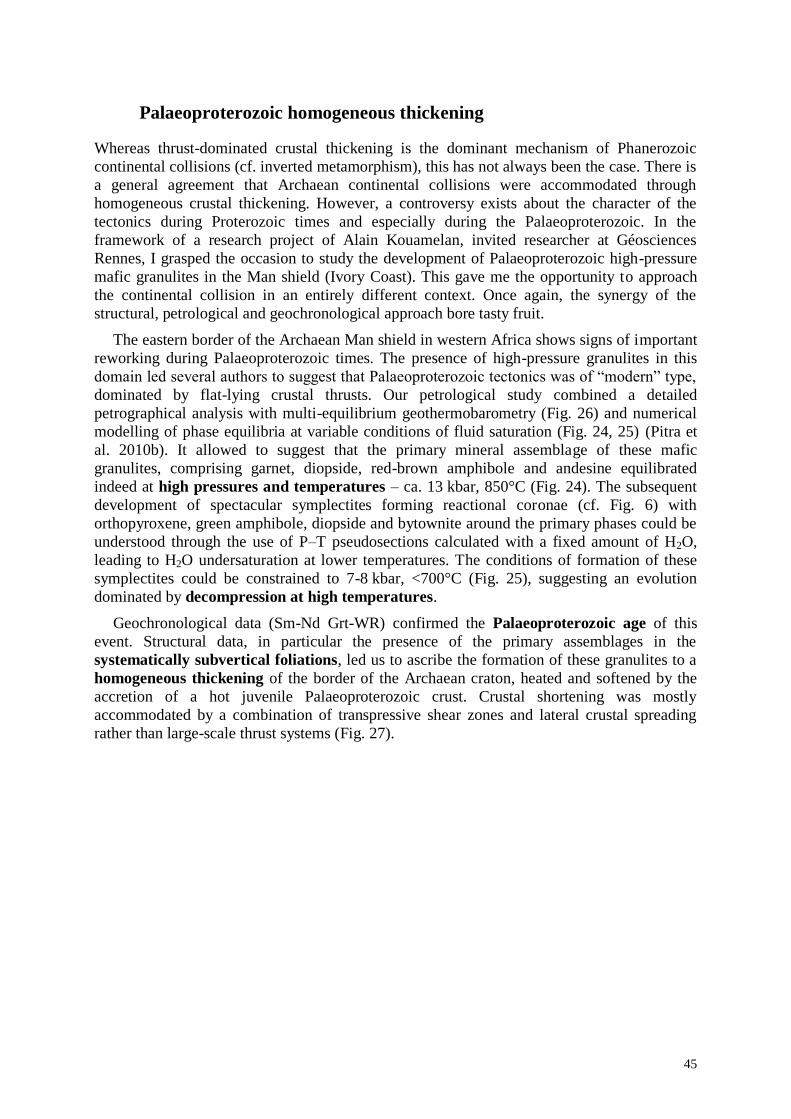
45
Palaeoproterozoic homogeneous thickening
Whereas thrust-dominated crustal thickening is the dominant mechanism of Phanerozoic
continental collisions (cf. inverted metamorphism), this has not always been the case. There is
a general agreement that Archaean continental collisions were accommodated through
homogeneous crustal thickening. However, a controversy exists about the character of the
tectonics during Proterozoic times and especially during the Palaeoproterozoic. In the
framework of a research project of Alain Kouamelan, invited researcher at Géosciences
Rennes, I grasped the occasion to study the development of Palaeoproterozoic high-pressure
mafic granulites in the Man shield (Ivory Coast). This gave me the opportunity to approach
the continental collision in an entirely different context. Once again, the synergy of the
structural, petrological and geochronological approach bore tasty fruit.
The eastern border of the Archaean Man shield in western Africa shows signs of important
reworking during Palaeoproterozoic times. The presence of high-pressure granulites in this
domain led several authors to suggest that Palaeoproterozoic tectonics was of “modern” type,
dominated by flat-lying crustal thrusts. Our petrological study combined a detailed
petrographical analysis with multi-equilibrium geothermobarometry (Fig. 26) and numerical
modelling of phase equilibria at variable conditions of fluid saturation (Fig. 24, 25) (Pitra et
al. 2010b). It allowed to suggest that the primary mineral assemblage of these mafic
granulites, comprising garnet, diopside, red-brown amphibole and andesine equilibrated
indeed at high pressures and temperatures – ca. 13 kbar, 850°C (Fig. 24). The subsequent
development of spectacular symplectites forming reactional coronae (cf. Fig. 6) with
orthopyroxene, green amphibole, diopside and bytownite around the primary phases could be
understood through the use of P–T pseudosections calculated with a fixed amount of H2O,
leading to H2O undersaturation at lower temperatures. The conditions of formation of these
symplectites could be constrained to 7-8 kbar, <700°C (Fig. 25), suggesting an evolution
dominated by decompression at high temperatures.
Geochronological data (Sm-Nd Grt-WR) confirmed the Palaeoproterozoic age of this
event. Structural data, in particular the presence of the primary assemblages in the
systematically subvertical foliations, led us to ascribe the formation of these granulites to a
homogeneous thickening of the border of the Archaean craton, heated and softened by the
accretion of a hot juvenile Palaeoproterozoic crust. Crustal shortening was mostly
accommodated by a combination of transpressive shear zones and lateral crustal spreading
rather than large-scale thrust systems (Fig. 27).
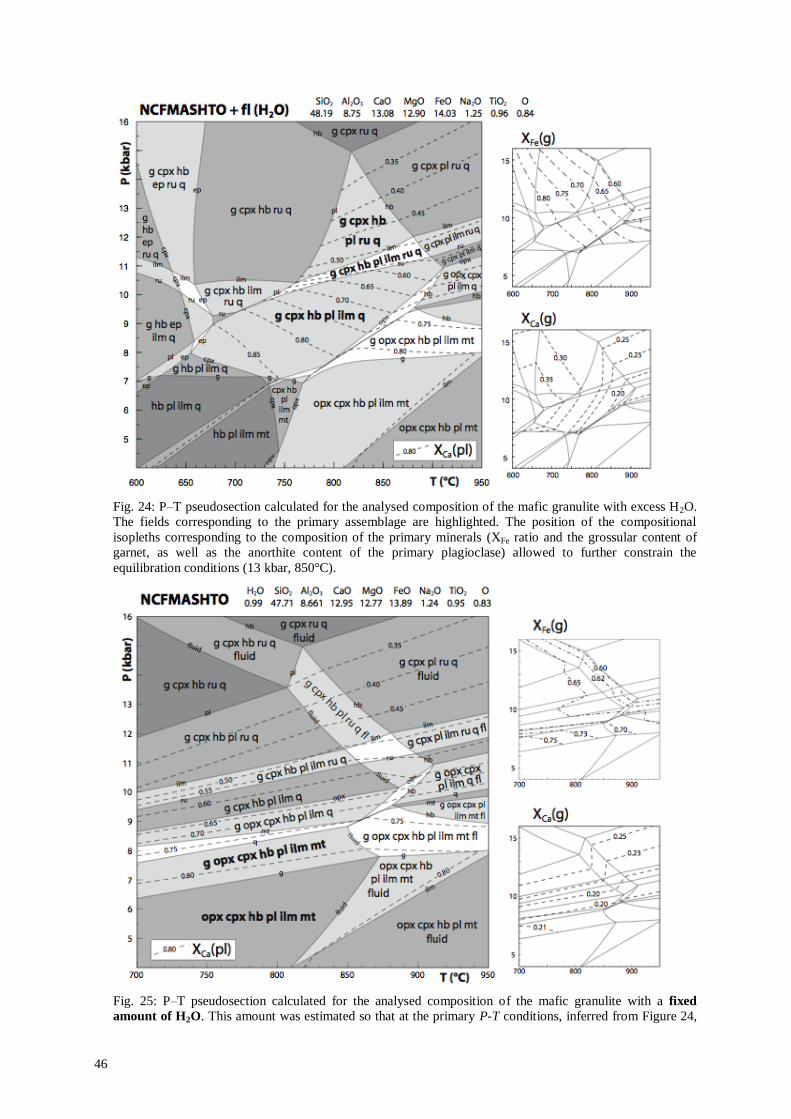
46
Fig. 24: P–T pseudosection calculated for the analysed composition of the mafic granulite with excess H2O.
The fields corresponding to the primary assemblage are highlighted. The position of the compositional
isopleths corresponding to the composition of the primary minerals (XFe ratio and the grossular content of
garnet, as well as the anorthite content of the primary plagioclase) allowed to further constrain the
equilibration conditions (13 kbar, 850°C).
Fig. 25: P–T pseudosection calculated for the analysed composition of the mafic granulite with a fixed
amount of H2O. This amount was estimated so that at the primary P-T conditions, inferred from Figure 24,
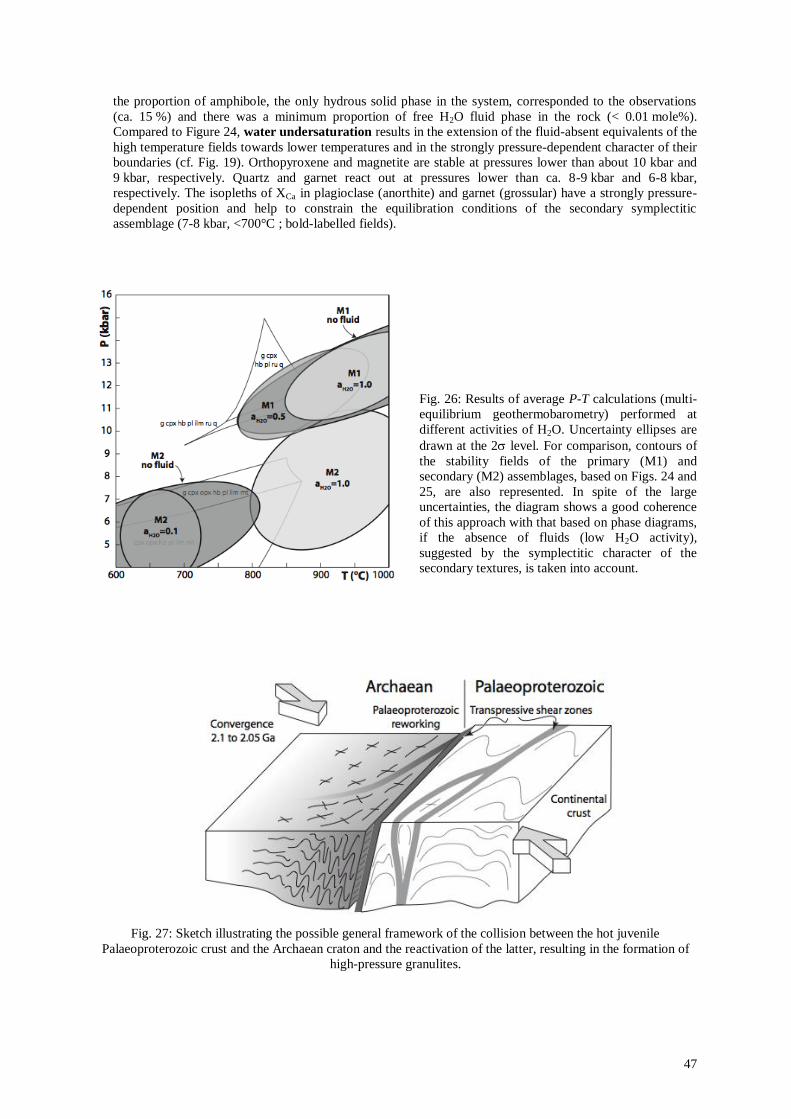
47
the proportion of amphibole, the only hydrous solid phase in the system, corresponded to the observations
(ca. 15 %) and there was a minimum proportion of free H2O fluid phase in the rock (< 0.01 mole%).
Compared to Figure 24, water undersaturation results in the extension of the fluid-absent equivalents of the
high temperature fields towards lower temperatures and in the strongly pressure-dependent character of their
boundaries (cf. Fig. 19). Orthopyroxene and magnetite are stable at pressures lower than about 10 kbar and
9 kbar, respectively. Quartz and garnet react out at pressures lower than ca. 8-9 kbar and 6-8 kbar,
respectively. The isopleths of XCa in plagioclase (anorthite) and garnet (grossular) have a strongly pressure-
dependent position and help to constrain the equilibration conditions of the secondary symplectitic
assemblage (7-8 kbar, <700°C ; bold-labelled fields).
Fig. 26: Results of average P-T calculations (multi-
equilibrium geothermobarometry) performed at
different activities of H2O. Uncertainty ellipses are
drawn at the 2 level. For comparison, contours of
the stability fields of the primary (M1) and
secondary (M2) assemblages, based on Figs. 24 and
25, are also represented. In spite of the large
uncertainties, the diagram shows a good coherence
of this approach with that based on phase diagrams,
if the absence of fluids (low H2O activity),
suggested by the symplectitic character of the
secondary textures, is taken into account.
Fig. 27: Sketch illustrating the possible general framework of the collision between the hot juvenile
Palaeoproterozoic crust and the Archaean craton and the reactivation of the latter, resulting in the formation of
high-pressure granulites.
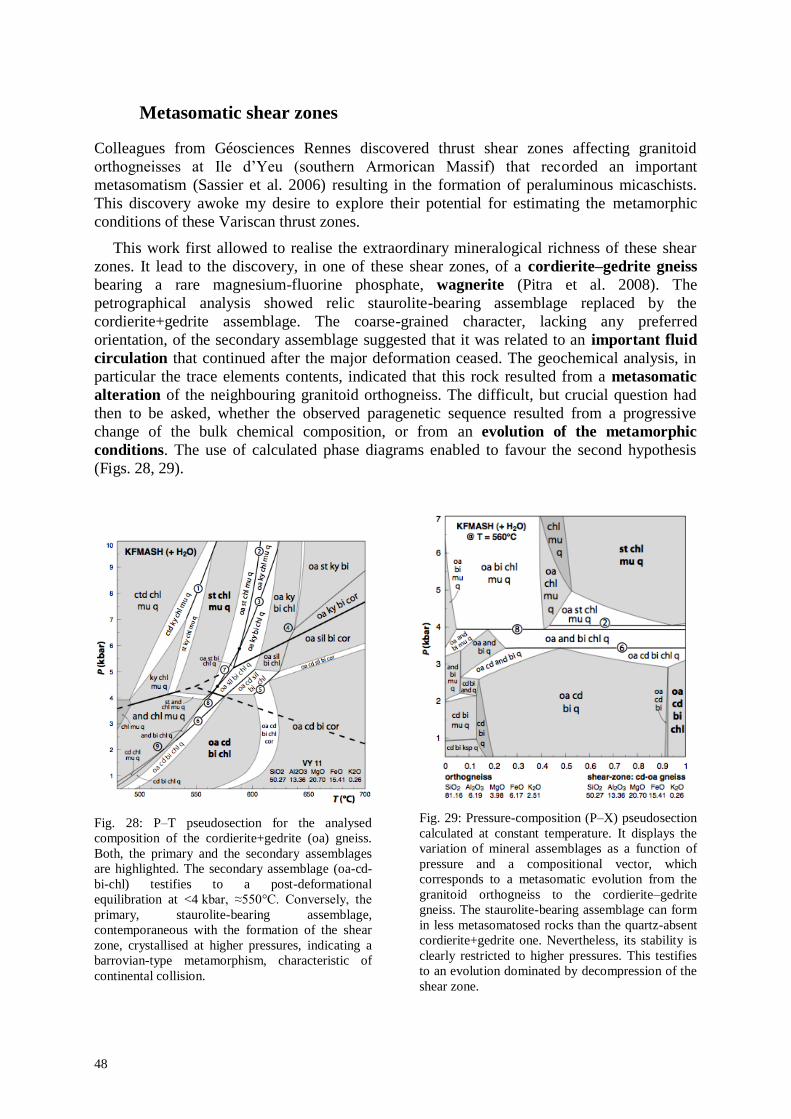
48
Metasomatic shear zones
Colleagues from Géosciences Rennes discovered thrust shear zones affecting granitoid
orthogneisses at Ile d‟Yeu (southern Armorican Massif) that recorded an important
metasomatism (Sassier et al. 2006) resulting in the formation of peraluminous micaschists.
This discovery awoke my desire to explore their potential for estimating the metamorphic
conditions of these Variscan thrust zones.
This work first allowed to realise the extraordinary mineralogical richness of these shear
zones. It lead to the discovery, in one of these shear zones, of a cordierite–gedrite gneiss
bearing a rare magnesium-fluorine phosphate, wagnerite (Pitra et al. 2008). The
petrographical analysis showed relic staurolite-bearing assemblage replaced by the
cordierite+gedrite assemblage. The coarse-grained character, lacking any preferred
orientation, of the secondary assemblage suggested that it was related to an important fluid
circulation that continued after the major deformation ceased. The geochemical analysis, in
particular the trace elements contents, indicated that this rock resulted from a metasomatic
alteration of the neighbouring granitoid orthogneiss. The difficult, but crucial question had
then to be asked, whether the observed paragenetic sequence resulted from a progressive
change of the bulk chemical composition, or from an evolution of the metamorphic
conditions. The use of calculated phase diagrams enabled to favour the second hypothesis
(Figs. 28, 29).
Fig. 28: P–T pseudosection for the analysed
composition of the cordierite+gedrite (oa) gneiss.
Both, the primary and the secondary assemblages
are highlighted. The secondary assemblage (oa-cd-
bi-chl) testifies to a post-deformational
equilibration at <4 kbar, ≈550°C. Conversely, the
primary, staurolite-bearing assemblage,
contemporaneous with the formation of the shear
zone, crystallised at higher pressures, indicating a
barrovian-type metamorphism, characteristic of
continental collision.
Fig. 29: Pressure-composition (P–X) pseudosection
calculated at constant temperature. It displays the
variation of mineral assemblages as a function of
pressure and a compositional vector, which
corresponds to a metasomatic evolution from the
granitoid orthogneiss to the cordierite–gedrite
gneiss. The staurolite-bearing assemblage can form
in less metasomatosed rocks than the quartz-absent
cordierite+gedrite one. Nevertheless, its stability is
clearly restricted to higher pressures. This testifies
to an evolution dominated by decompression of the
shear zone.
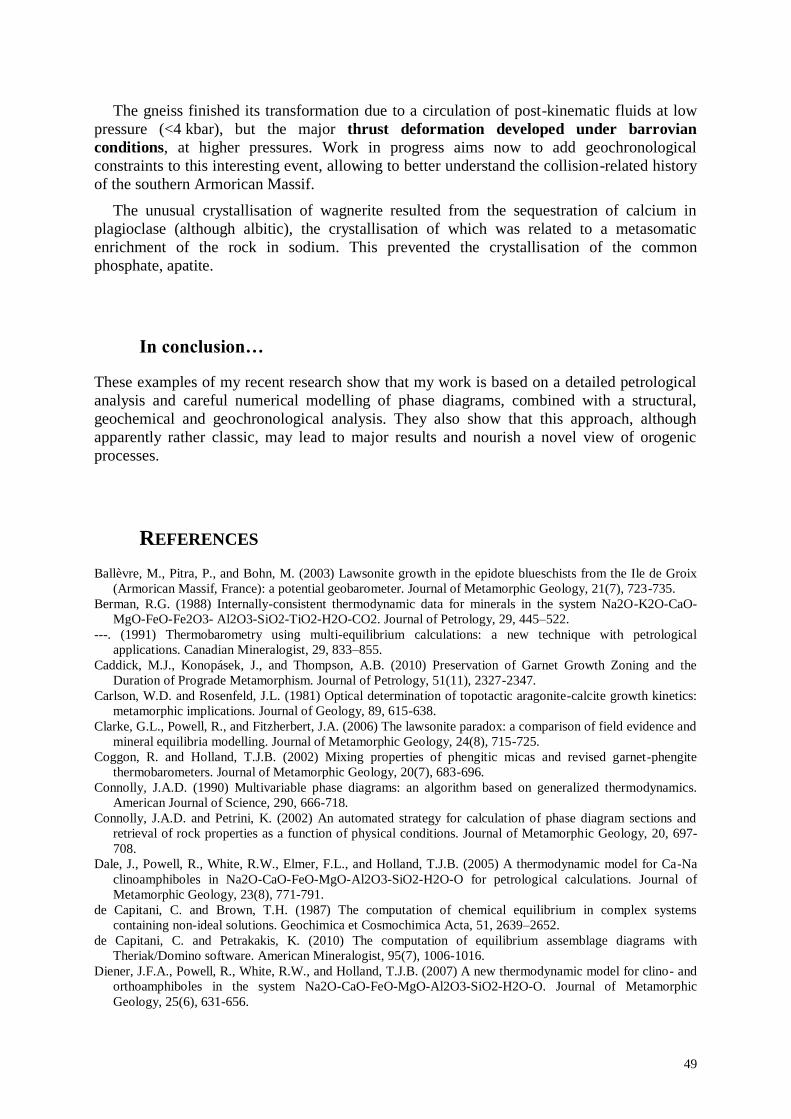
49
The gneiss finished its transformation due to a circulation of post-kinematic fluids at low
pressure (<4 kbar), but the major thrust deformation developed under barrovian
conditions, at higher pressures. Work in progress aims now to add geochronological
constraints to this interesting event, allowing to better understand the collision-related history
of the southern Armorican Massif.
The unusual crystallisation of wagnerite resulted from the sequestration of calcium in
plagioclase (although albitic), the crystallisation of which was related to a metasomatic
enrichment of the rock in sodium. This prevented the crystallisation of the common
phosphate, apatite.
In conclusion…
These examples of my recent research show that my work is based on a detailed petrological
analysis and careful numerical modelling of phase diagrams, combined with a structural,
geochemical and geochronological analysis. They also show that this approach, although
apparently rather classic, may lead to major results and nourish a novel view of orogenic
processes.
REFERENCES
Ballèvre, M., Pitra, P., and Bohn, M. (2003) Lawsonite growth in the epidote blueschists from the Ile de Groix
(Armorican Massif, France): a potential geobarometer. Journal of Metamorphic Geology, 21(7), 723-735.
Berman, R.G. (1988) Internally-consistent thermodynamic data for minerals in the system Na2O-K2O-CaO-
MgO-FeO-Fe2O3- Al2O3-SiO2-TiO2-H2O-CO2. Journal of Petrology, 29, 445–522.
---. (1991) Thermobarometry using multi-equilibrium calculations: a new technique with petrological
applications. Canadian Mineralogist, 29, 833–855.
Caddick, M.J., Konopásek, J., and Thompson, A.B. (2010) Preservation of Garnet Growth Zoning and the
Duration of Prograde Metamorphism. Journal of Petrology, 51(11), 2327-2347.
Carlson, W.D. and Rosenfeld, J.L. (1981) Optical determination of topotactic aragonite-calcite growth kinetics:
metamorphic implications. Journal of Geology, 89, 615-638.
Clarke, G.L., Powell, R., and Fitzherbert, J.A. (2006) The lawsonite paradox: a comparison of field evidence and
mineral equilibria modelling. Journal of Metamorphic Geology, 24(8), 715-725.
Coggon, R. and Holland, T.J.B. (2002) Mixing properties of phengitic micas and revised garnet-phengite
thermobarometers. Journal of Metamorphic Geology, 20(7), 683-696.
Connolly, J.A.D. (1990) Multivariable phase diagrams: an algorithm based on generalized thermodynamics.
American Journal of Science, 290, 666-718.
Connolly, J.A.D. and Petrini, K. (2002) An automated strategy for calculation of phase diagram sections and
retrieval of rock properties as a function of physical conditions. Journal of Metamorphic Geology, 20, 697-
708.
Dale, J., Powell, R., White, R.W., Elmer, F.L., and Holland, T.J.B. (2005) A thermodynamic model for Ca-Na
clinoamphiboles in Na2O-CaO-FeO-MgO-Al2O3-SiO2-H2O-O for petrological calculations. Journal of
Metamorphic Geology, 23(8), 771-791.
de Capitani, C. and Brown, T.H. (1987) The computation of chemical equilibrium in complex systems
containing non-ideal solutions. Geochimica et Cosmochimica Acta, 51, 2639–2652.
de Capitani, C. and Petrakakis, K. (2010) The computation of equilibrium assemblage diagrams with
Theriak/Domino software. American Mineralogist, 95(7), 1006-1016.
Diener, J.F.A., Powell, R., White, R.W., and Holland, T.J.B. (2007) A new thermodynamic model for clino- and
orthoamphiboles in the system Na2O-CaO-FeO-MgO-Al2O3-SiO2-H2O-O. Journal of Metamorphic
Geology, 25(6), 631-656.
50
Droop, G.T.R. (1987) A general equation for estimating Fe3+ concentrations in ferromagnesian silicates and
oxides from microprobe analyses, using stoichiometric criteria. Mineralogical Magazine, 51, 431-435.
Enami, M., Suzuki, K., Liou, J.G., and Bird, D.K. (1993) Al–Fe3+ and F–OH substitutions in titanite and
constraints on their P–T dependence. European Journal of Mineralogy, 5, 219 – 231.
Franz, G. and Spear, F.S. (1985) Aluminious titanite (sphene) from the Eclogite zone, south-central Tauern
Window, Austria. Chemical Geology, 50, 33-46.
Green, E., Holland, T., and Powell, R. (2007) An order-disorder model for omphacitic pyroxenes in the system
jadeite-diopside-hedenbergite-acmite, with applications to eclogitic rocks. American Mineralogist, 92, 1181-
1189.
Guiraud, M., Holland, T., and Powell, R. (1990) Calculated mineral equilibria in the greenschist - blueschist -
eclogite facies in Na2O-FeO-MgO-Al2O3-SiO2-H2O: Methods, results and geological applications.
Contributions to Mineralogy and Petrology, 104, 85-98.
Guiraud, M. and Powell, R. (2006) P-V-T relationships and mineral equilibria in inclusions in minerals. Earth
and Planetary Science Letters, 244(3-4), 683-694.
Guiraud, M., Powell, R., and Rebay, G. (2001) H2O in metamorphism and unexpected behaviour in the
preservation of metamorphic mineral assemblages. Journal of Metamorphic Geology, 19, 445– 454.
Harlov, D., Tropper, P., Seifert, W., Nijland, T., and Förster, H.-J. (2006) Formation of Al-rich titanite
(CaTiSiO4O-CaAlSiO4OH) reaction rims on ilmenite in metamorphic rocks as a function of fH2O and fO2.
Lithos, 88(1-4), 72-84.
Hensen, B.J. (1971) Theoretical phase relations involving garnet and cordierite in the system MgO-FeO-Al2O3-
SiO2. Contributions to Mineralogy and Petrology, 33, 191-214.
Holényi, K. and Annerstein, H. (1987) Iron in titanite: a Mössbauer-spectroscopy study. Canadian Mineralogist,
25, 429 – 433.
Holland, T. and Powell, R. (1990) An enlarged and updated internally consistent thermodynamic dataset with
uncertainties and correlations : the system K2O-Na2O-CaO-MgO-MnO-FeO-Fe2O3-Al2O3-TiO2-SiO2-C-H2-O).
Journal of Metamorphic Geology, 8, 89-124.
Holland, T.J.B. and Powell, R. (1998) An internally consistent thermodynamic data set for phases of petrological
interest. Journal of Metamorphic Geology, 16(3), 309-343.
---. (2011) An improved and extended internally consistent thermodynamic dataset for phases of petrological
interest, involving a new equation of state for solids. Journal of Metamorphic Geology, 29(3), 333-383.
Hoschek, G. (2004) Comparison of calculated P-T pseudosections for a kyanite eclogite from the Tauern
Window, Eastern Alps, Austria. European Journal of Mineralogy, 16, 59-72.
Hudson, N.F.C. (1980) Regional metamorphism of some Dalradian pelites in the Buchan Area, NE Scotland.
Contributions to Mineralogy and Petrology, 73, 39-51.
Hudson, N.F.C. and Harte, B. (1985) K2O-poor, aluminous assemblages from the Buchan Dalradian, and the
variety of orthoamphibole assemblages in aluminous bulk compositions in the amphibolite facies. American
Journal of Science, 285, 224-266.
Johnson, T., Brown, M., Gibson, R., and Wing, B. (2004) Spinel-cordierite symplectites replacing andalusite:
evidence for melt-assisted diapirism in the Bushveld Complex, South Africa. Journal of Metamorphic
Geology, 22(6), 529-545.
Korzhinskii, D.S. (1959) Physicochemical Basis of the Analysis of the Paragenesis of Minerals. 142 p.
Consultants Bureau, New York.
Le Bayon, B., Pitra, P., Ballèvre, M., and Bohn, M. (2006) Reconstructing P–T paths during continental collision
using multi-stage garnet (Gran Paradiso nappe, Western Alps). Journal of Metamorphic Geology, 24(6), 477-
496.
Lexa, O., Cosgrove, J.W., and Schulmann, K. (2004) Apparent shear-band geometry resulting from oblique fold
sections. Journal of Structural Geology, 26, 155-161.
Li, Z.H., Gerya, T.V., and Burg, J.P. (2010) Influence of tectonic overpressure on P–T paths of HP–UHP rocks
in continental collision zones: thermomechanical modelling. Journal of Metamorphic Geology, 28(3), 227-
247.
Mancktelow, N.S. (2008) Tectonic pressure: Theoretical concepts and modelled examples. Lithos, 103(1-2),
149-177.
Marmo, B.A., Clarke, G.L., and Powell, R. (2002) Fractionation of bulk rock composition due to porphyroblast
growth: effects on eclogite mineral equilibria, Pam Peninsula, New Caledonia. Journal of Metamorphic
Geology, 20(1), 151-165.
Miyashiro, A. (1961) Evolution of Metamorphic Belts. Journal of Petrology, 2(3), 277-311.
---. (1973) Metamorphism and metamorphic belts. 492 p. Allen & Unwin, London.
Petrini, K. and Podladchikov, Y. (2000) Lithospheric pressure-depth relationship in compressive regions of
thickened crust. Journal of Metamorphic Geology, 18(1), 67-78.
51
Philippon, M., Brun, J.-P., and Gueydan, F. (2009) Kinematic records of subduction and exhumation in the Ile
de Groix blueschists (Hercynian belt; Western France). Journal of Structural Geology, 31, 1308-1321.
Pitra, P., Ballèvre, M., and Ruffet, G. (2010a) Inverted metamorphic field gradient towards a Variscan suture
zone (Champtoceaux Complex, Armorican Massif, France). Journal of Metamorphic Geology, 28(2), 183-
208.
Pitra, P., Boulvais, P., Antonoff, V., and Diot, H. (2008) Wagnerite in a cordierite-gedrite gneiss: Witness of
long-term fluid-rock interaction in the continental crust (Ile d‟Yeu, Armorican Massif, France). American
Mineralogist, 93, 315-326.
Pitra, P. and de Waal, S.A. (2001) High-temperature, low-pressure metamorphism and development of prograde
symplectites, Marble Hall Fragment, Bushveld Complex (South Africa). Journal of Metamorphic Geology,
19(3), 311-325.
Pitra, P., Kouamelan, A.N., Ballèvre, M., and Peucat, J.-J. (2010b) Palaeoproterozoic high-pressure granulite
overprint of the Archean continental crust: evidence for homogeneous crustal thickening (Man Rise, Ivory
Coast). Journal of Metamorphic Geology, 28(1), 41-58.
Powell, R. (1978) Equilibrium thermodynamics in petrology (An Introduction). 284 p. Harper & Row, London.
---. (1983) Fluids and melting under upper amphibolite facies conditions. Journal of the Geological Society,
London, 140, 629-633.
Powell, R. and Downes, J. (1990) Garnet porphyroblast-bearing leucosomes in metapelites: mechanisms, phase
diagrams, and an example from Borken Hill, Australia. In J.R. Ashworth and M. Brown, Eds., High
Temperature Metamorphism and Crustal Anatexis, p. 105-123. The Mineralogical Society series, 2, Unwin
Hyman, London.
Powell, R., Guiraud, M., and White, R.W. (2005) Truth and beauty in metamorphic phase equilibria: conjugate
variables and phase diagrams. Canadian Mineralogist, 43(1), 21-33.
Powell, R. and Holland, T. (1990) Calculated mineral equilbria in the pelite system, KFMASH. American
Mineralogist, 75, 367-380.
---. (1994) Optimal geothermometry and geobarometry. American Mineralogist, 79, 120-133.
Powell, R., Holland, T., and Worley, B. (1998) Calculating phase diagrams involving solid solutions via non-
linear equations, with examples using THERMOCALC. Journal of Metamorphic Geology, 16(4), 577-588.
Powell, R. and Holland, T.J.B. (1985) An internally consistent dataset with uncertainties and correlations: 1.
Methods and a worked example. Journal of Metamorphic Geology, 3, 327-342.
---. (1988) An internally consistent dataset with uncertainties and correlations: 3. Applications to geobarometry,
worked examples and a computer program. Journal of Metamorphic Geology, 6, 173-204.
---. (2008) On thermobarometry. Journal of Metamorphic Geology, 26(2), 155-179.
Raimbourg, H. and Kimura, G. (2008) Non-lithostatic pressure in subduction zones. Earth and Planetary Science
Letters, 274(3-4), 414-422.
Sassier, C., Boulvais, P., Gapais, D., Capdevila, R., and Diot, H. (2006) From granitoid to kyanite-bearing
micaschist during fluid-assisted shearing (Ile d‟Yeu, France). International Journal of Earth Sciences, 95, 2-
18.
Schilling, J.G., Zajac, M., Evans, R., Johnston, T., White, W., Devine, J.D., and Kingsley, R. (1983) Petrologic
and geochemical variations along the Mid-Atlantic Ridge from 27°N to 73°N. American Journal of Science,
283(6), 510–586.
Spear, F.S. (1993) Metamorphic phase equilibria and pressure-temperature-time paths. 799 p. Mineralogical
Society of America, Washington.
Štípská, P., Pitra, P., and Powell, R. (2006) Separate or shared metamorphic histories of eclogites and
surrounding rocks? An example from the Bohemian Massif. Journal of Metamorphic Geology, 24(3), 219-
240.
Štípská, P. and Powell, R. (2005) Constraining the P-T path of a MORB-type eclogite using pseudosections,
garnet zoning and garnet-clinopyroxene thermometry: an example from the Bohemian Massif. Journal of
Metamorphic Geology, 23(8), 725-743.
Stüwe, K. (1997) Effective bulk composition changes due to cooling: a model predicting complexities in
retrograde reaction textures. Contributions to Mineralogy and Petrology, 129(1), 43-52.
Stüwe, K. and Powell, R. (1995) PT paths from modal proportions: application to the Koralm Complex, Eastern
Alps. Contributions to Mineralogy and Petrology, 119, 83-93.
Thompson, A.B. and Connolly, J.A.D. (1990) Metamorphic fluids and anomalous porosities in the lower crust.
Tectonophysics, 1982, 47-55.
Thompson, A.B., Tracy, R.J., Lyttle, P.T., and Thompson Jr., J.B. (1977) Prograde reaction histories deduced
from compositional zonation and mineral inclusions in garnet from the Gassetts schist, Vermont. American
Journal of Science, 277, 1152-1167.
Thompson, J.B. (1959) Local equilibrium in metasomatic processes. In P.H. Abelson, Ed., Researches in
Geochemistry, p. 427–457. Wiley, New York.
52
Tracy, R.J. (1982) Compositional zoning and inclusions in metamorphic minerals. In J.M. Ferry, Ed.,
Characterization of metamorphism through mineral equilibria, p. 355-397. Reviews in Mineralogy, 10,
Mineralogical Society of America.
Tropper, P., Manning, C.E., and Essene, E.J. (2002) The substitution of Al and F in titanite at high pressure and
temperature: experimental constraints on phase relations and solid solution properties. Journal of Petrology,
43, 1787 – 1814.
Ueno, T. (1999) REE-bearing sector-zoned lawsonite in the Sanbagawa pelitic schists of the eastern Kii
Peninsula, central Japan. European Journal of Mineralogy, 11(6), 993-998.
Van Den Driessche, J. (1986) Structures d'enroulement et sens de cisaillement. Exemples et modèles. Comptes
rendus de l'Académie des Sciences Paris, série II, 303(5), 413-418.
Van Den Driessche, J. and Brun, J.-P. (1987) Rolling structures at large shear strain. Journal of Structural
Geology, 9(5-6), 691-704.
Vance, D. and Mahar, E. (1998) Pressure-temperature paths from P-T pseudosections and zoned garnets:
potential, limitations and examples from the Zanskar Himalaya, NW India. Contributions to Mineralogy and
Petrology, 132, 225-245.
Vernon, R.H. (1987) Oriented growth of sillimanite in andalusite, Placitas - Juan Tabo area, New Mexico,
U.S.A. Canadian Journal of Earth Sciences, 24, 580-590.
Vernon, R.H., White, R.W., and Clarke, G.L. (2008) False metamorphic events inferred from misinterpretation
of microstructural evidence and P-T data. Journal of Metamorphic Geology, 26(4), 437-449.
Warren, C.J. and Waters, D.J. (2006) Oxidized eclogites and garnet-blueschists from Oman: P-T path modelling
in the NCFMASHO system. Journal of Metamorphic Geology, 24(9), 783-802.
Wei, C.J. and Powell, R. (2006) Calculated phase relations in the system NCKFMASH (Na2O-CaO-K2O-FeO-
MgO-Al2O3-SiO2-H2O) for high-pressure metapelites. Journal of Petrology, 47(2), 385-408.
White, R.W. and Powell, R. (2002) Melt loss and the preservation of granulite facies mineral assemblages.
Journal of Metamorphic Geology, 20(7), 621-632.
White, R.W., Powell, R., and Holland, T.J.B. (2001) Calculation of partial melting equilibria in the system
Na2O-CaO-K2O-FeO-MgO-Al2O3-SiO2-H2O (NCKFMASH). Journal of Metamorphic Geology, 19(2), 139-
153.
White, R.W., Powell, R., Holland, T.J.B., and Worley, B.A. (2000) The effect of TiO2 and Fe2O3 on metapelitic
assemblages at greenschist and amphibolite facies conditions: mineral equilibria calculations in the system
K2O-FeO-MgO-Al2O3-SiO2-H2O-TiO2-Fe2O3. Journal of Metamorphic Geology, 18(5), 497-511.
Winter, J.D. (2001) An introduction to igneous and metamorphic petrology. 697 p. Prentice Hall, Upper Saddle
River, New Jersey.
Worley, B. and Powell, R. (1998) Singularities in NCKFMASH (Na2O-CaO-K2O-FeO-MgO-Al2O3-SiO2-
H2O). Journal of Metamorphic Geology, 16(2), 169-188.

53
54
PERSPECTIVES
In coherence with my past research activity, my projects for the years to come remain centred
on the use of numerical modelling of phase equilibria for a better understanding of orogenic
processes. Nevertheless, I aim to enrich this approach by a collaborative association of
numerical modelling of geodynamic processes, in particular through collaboration with
Philippe Yamato, recently recruited at Geosciences Rennes. My plans are centred on three
axes, two fundamental, and the third one slightly more technical:
- metamorphism and shear zones
- development of inverted metamorphic sequences
- application statistical methods
These aspects are presented in more detail below.
Metamorphism and shear zones: from the field to the model
A PhD project
Understanding the liberation and circulation of metamorphic fluids is indispensable for
understanding geological processes. They take part in most metamorphic reaction and are
commonly associated with zones of localised deformation. Through their rheological impact,
they control the emplacement of tectonic units in mountain belts, but also the style of
deformation.
It would be interesting to study shear zones at various scales (from the millimetre to the
kilometre), in some selected target regions (Alps, Norway, Variscan belt), from the point of
view of metamorphic transformations and evaluate the interactions with deformation, fluid
circulation and a possible associated metasomatism. Following a careful field description,
thermodynamic modelling of phase equilibria would be associated with thermomechanical
models in order to understand the behaviour of shear zones during orogeny. What do they
record (burial, exhumation,…), what are the relations with the neighbouring undeformed
rocks?
Associating field work, metamorphic petrology and numerical modelling is expected to
produce novel results in the understanding of the rheological behaviour of the lithosphere and
the impact of the geodynamics of convergent zones.
With P. Yamato we plan to propose this problem as a PhD subject this year.
55
Thermodynamic modelling of fluid-rock interactions: example of the magnesian
metasomatism
What follows is a part of a scientific project proposed to the INSU (CNRS) with Philippe
Goncalves and Didier Marquer (Besançon)
Crystallisation of metamorphic minerals is achieved by diffusion of chemical components
between the minerals and the percolating fluids and liquids. The driving force is the presence
of chemical potential gradients. Quantitative phase diagrams using chemical potentials as
variables are known and occasionally used for deciphering the evolution of metamorphic
rocks since the pioneering work of Korzhinskii (1959). However, only the recent development
of software tools for the calculation of thermodynamic phase equilibria (THERMOCALC,
Perple_X) made it possible to study the quantitative relations between metamorphic
crystallisations and transport of chemical constituents (e.g. through diffusion or fluid
circulation), and to understand its causes through the evolution of chemical potential gradients
(e.g. White et al., 2008). The use of equilibrium thermodynamics (the underlying principle of
the above software) may seem unadapted for this kind of problem. Yet, at each moment of the
metasomatic or reactional process, the systems tend to achieve local equilibria (e.g.
Korzhinskii, 1959; White et al., 2008, Pitra et al., 2010), which can be addressed via this
approach. Moreover, open systems may tend to achieve equilibrium even more rapidly and
easily than closed ones, since they are commonly characterised by the presence of fluids that
facilitate diffusion, transport of elements on grain boundaries and hence equilibration.
This problem is particularly interesting in metasomatic systems. In classic metasomatic
systems (e.g. skarns) material transport controls the types of mineral composition
(metasomatic fronts). However, thermodynamic modelling suggests that in some cases
metamorphic recrystallisations in deformed rocks may induce the flux of metasomatising
elements (Fig. 1).
In this project, we want to apply thermodynamic modelling on local equilibria in open
systems in order to quantify the physical and chemical characteristics (P-T-X-µ) of the
processes involved in fluid-rock interactions. Our goal is to get an insight into the respective
roles of mass-transfer and metamorphic crystallisations during large-scale fluid
circulations (chemical mass-transfer enhanced by metamorphic reactions vs. metamorphic
crystallisations enhanced by chemical mass-transfer) (Oliot et al., 2010). This subject presents
a fundamental scientific interest for understanding the processes of formation of metamorphic
rocks. However, since many ore deposits are of metasomatic origin, the project has the
potential to enhance our understanding of the formation of some of these deposits.
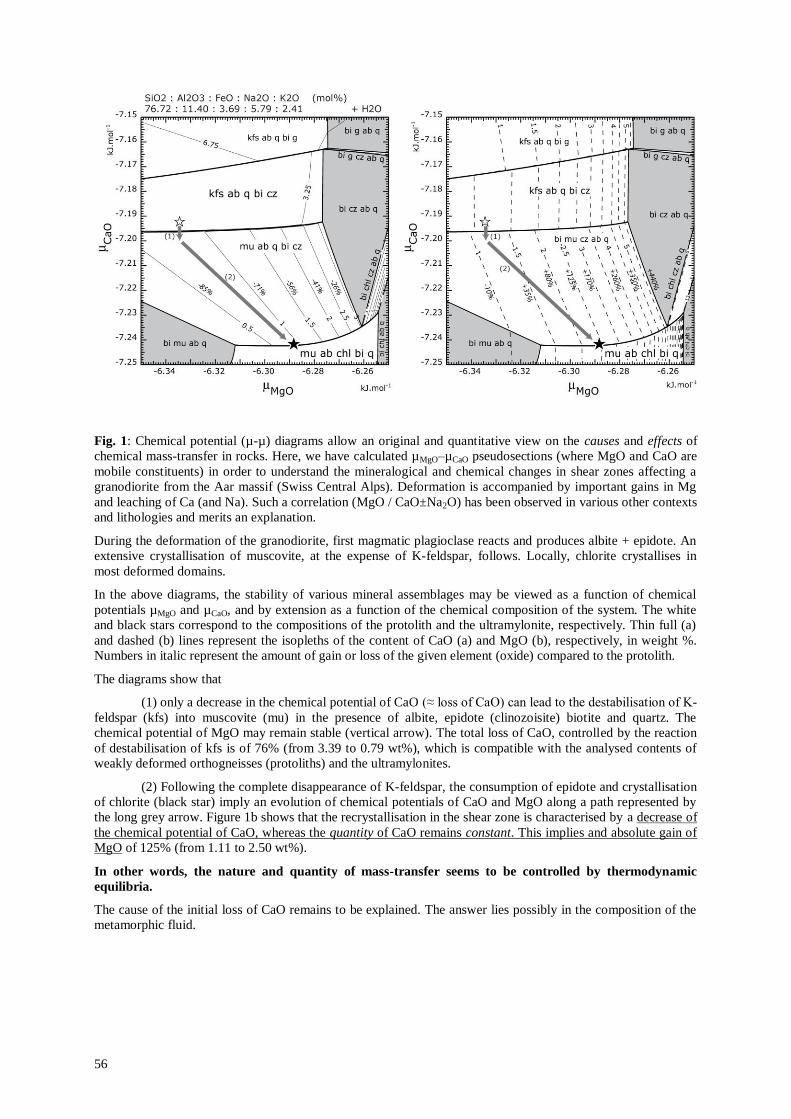
56
Fig. 1: Chemical potential (µ-µ) diagrams allow an original and quantitative view on the causes and effects of
chemical mass-transfer in rocks. Here, we have calculated µMgO–µCaO pseudosections (where MgO and CaO are
mobile constituents) in order to understand the mineralogical and chemical changes in shear zones affecting a
granodiorite from the Aar massif (Swiss Central Alps). Deformation is accompanied by important gains in Mg
and leaching of Ca (and Na). Such a correlation (MgO / CaO±Na2O) has been observed in various other contexts
and lithologies and merits an explanation.
During the deformation of the granodiorite, first magmatic plagioclase reacts and produces albite + epidote. An
extensive crystallisation of muscovite, at the expense of K-feldspar, follows. Locally, chlorite crystallises in
most deformed domains.
In the above diagrams, the stability of various mineral assemblages may be viewed as a function of chemical
potentials µMgO and µCaO, and by extension as a function of the chemical composition of the system. The white
and black stars correspond to the compositions of the protolith and the ultramylonite, respectively. Thin full (a)
and dashed (b) lines represent the isopleths of the content of CaO (a) and MgO (b), respectively, in weight %.
Numbers in italic represent the amount of gain or loss of the given element (oxide) compared to the protolith.
The diagrams show that
(1) only a decrease in the chemical potential of CaO (≈ loss of CaO) can lead to the destabilisation of K-
feldspar (kfs) into muscovite (mu) in the presence of albite, epidote (clinozoisite) biotite and quartz. The
chemical potential of MgO may remain stable (vertical arrow). The total loss of CaO, controlled by the reaction
of destabilisation of kfs is of 76% (from 3.39 to 0.79 wt%), which is compatible with the analysed contents of
weakly deformed orthogneisses (protoliths) and the ultramylonites.
(2) Following the complete disappearance of K-feldspar, the consumption of epidote and crystallisation
of chlorite (black star) imply an evolution of chemical potentials of CaO and MgO along a path represented by
the long grey arrow. Figure 1b shows that the recrystallisation in the shear zone is characterised by a decrease of
the chemical potential of CaO, whereas the quantity of CaO remains constant. This implies and absolute gain of
MgO of 125% (from 1.11 to 2.50 wt%).
In other words, the nature and quantity of mass-transfer seems to be controlled by thermodynamic
equilibria.
The cause of the initial loss of CaO remains to be explained. The answer lies possibly in the composition of the
metamorphic fluid.
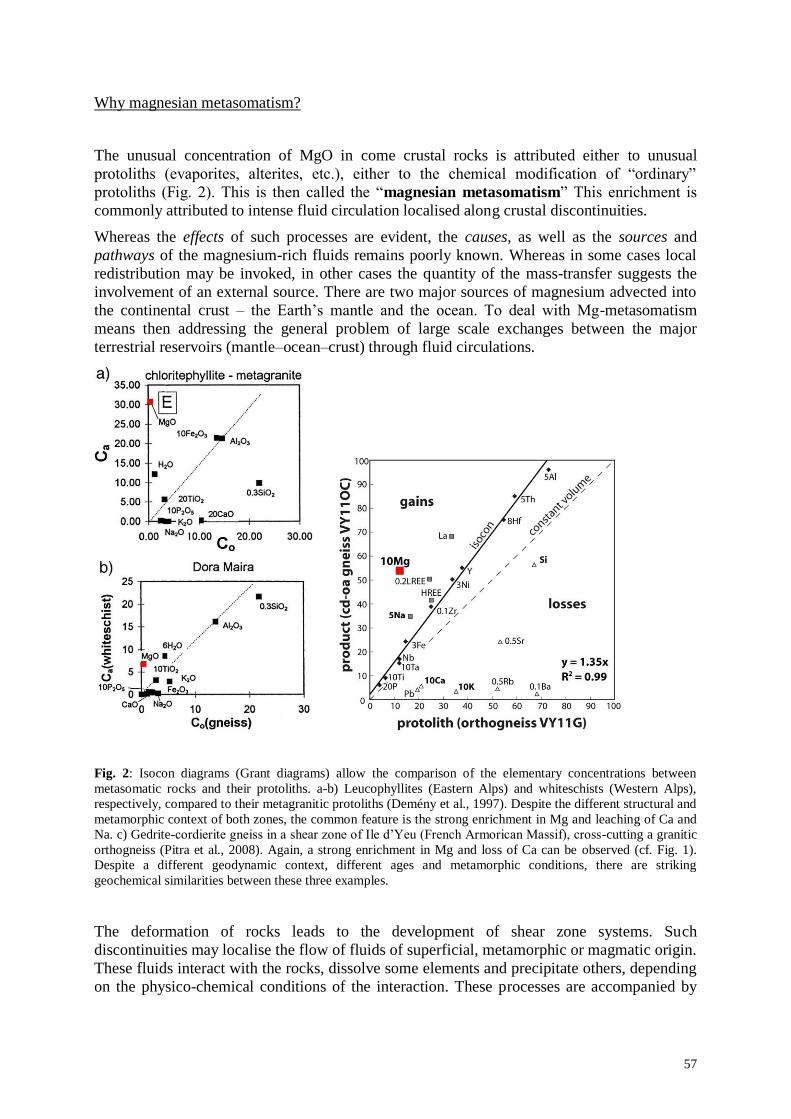
57
Why magnesian metasomatism?
The unusual concentration of MgO in come crustal rocks is attributed either to unusual
protoliths (evaporites, alterites, etc.), either to the chemical modification of “ordinary”
protoliths (Fig. 2). This is then called the “magnesian metasomatism” This enrichment is
commonly attributed to intense fluid circulation localised along crustal discontinuities.
Whereas the effects of such processes are evident, the causes, as well as the sources and
pathways of the magnesium-rich fluids remains poorly known. Whereas in some cases local
redistribution may be invoked, in other cases the quantity of the mass-transfer suggests the
involvement of an external source. There are two major sources of magnesium advected into
the continental crust – the Earth‟s mantle and the ocean. To deal with Mg-metasomatism
means then addressing the general problem of large scale exchanges between the major
terrestrial reservoirs (mantle–ocean–crust) through fluid circulations.
Fig. 2: Isocon diagrams (Grant diagrams) allow the comparison of the elementary concentrations between
metasomatic rocks and their protoliths. a-b) Leucophyllites (Eastern Alps) and whiteschists (Western Alps),
respectively, compared to their metagranitic protoliths (Demény et al., 1997). Despite the different structural and
metamorphic context of both zones, the common feature is the strong enrichment in Mg and leaching of Ca and
Na. c) Gedrite-cordierite gneiss in a shear zone of Ile d‟Yeu (French Armorican Massif), cross-cutting a granitic
orthogneiss (Pitra et al., 2008). Again, a strong enrichment in Mg and loss of Ca can be observed (cf. Fig. 1).
Despite a different geodynamic context, different ages and metamorphic conditions, there are striking
geochemical similarities between these three examples.
The deformation of rocks leads to the development of shear zone systems. Such
discontinuities may localise the flow of fluids of superficial, metamorphic or magmatic origin.
These fluids interact with the rocks, dissolve some elements and precipitate others, depending
on the physico-chemical conditions of the interaction. These processes are accompanied by
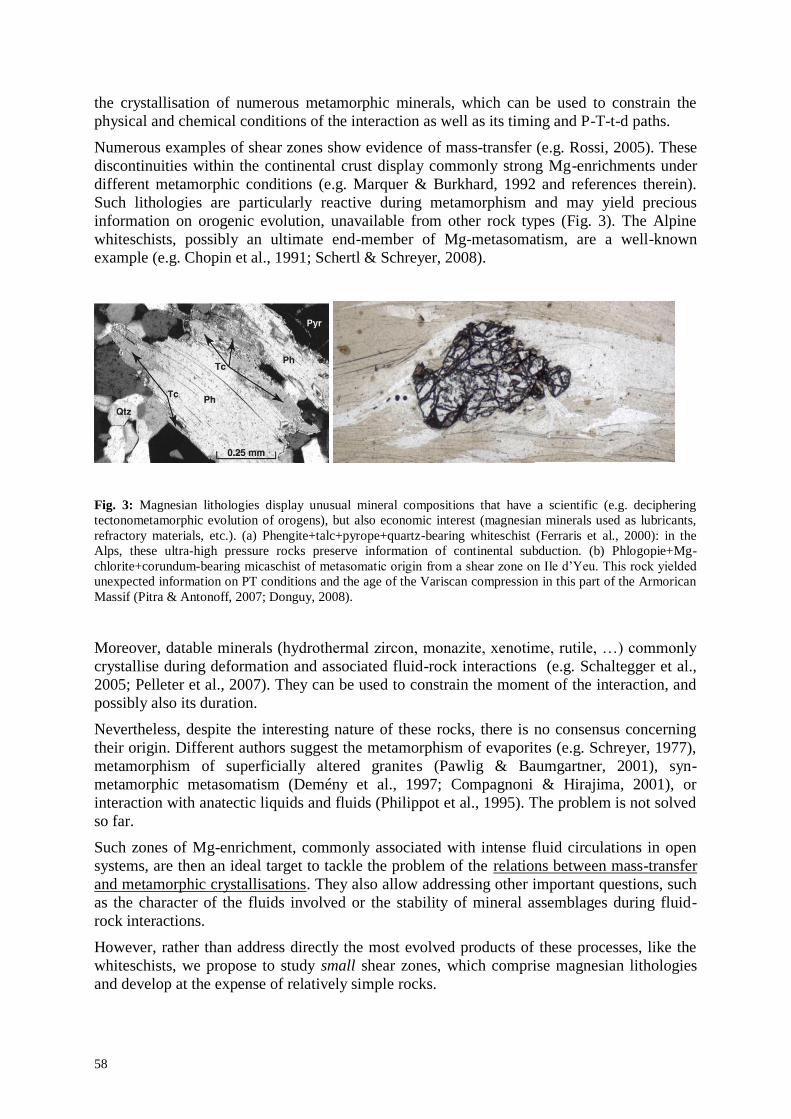
58
the crystallisation of numerous metamorphic minerals, which can be used to constrain the
physical and chemical conditions of the interaction as well as its timing and P-T-t-d paths.
Numerous examples of shear zones show evidence of mass-transfer (e.g. Rossi, 2005). These
discontinuities within the continental crust display commonly strong Mg-enrichments under
different metamorphic conditions (e.g. Marquer & Burkhard, 1992 and references therein).
Such lithologies are particularly reactive during metamorphism and may yield precious
information on orogenic evolution, unavailable from other rock types (Fig. 3). The Alpine
whiteschists, possibly an ultimate end-member of Mg-metasomatism, are a well-known
example (e.g. Chopin et al., 1991; Schertl & Schreyer, 2008).
Fig. 3: Magnesian lithologies display unusual mineral compositions that have a scientific (e.g. deciphering
tectonometamorphic evolution of orogens), but also economic interest (magnesian minerals used as lubricants,
refractory materials, etc.). (a) Phengite+talc+pyrope+quartz-bearing whiteschist (Ferraris et al., 2000): in the
Alps, these ultra-high pressure rocks preserve information of continental subduction. (b) Phlogopie+Mg-
chlorite+corundum-bearing micaschist of metasomatic origin from a shear zone on Ile d‟Yeu. This rock yielded
unexpected information on PT conditions and the age of the Variscan compression in this part of the Armorican
Massif (Pitra & Antonoff, 2007; Donguy, 2008).
Moreover, datable minerals (hydrothermal zircon, monazite, xenotime, rutile, …) commonly
crystallise during deformation and associated fluid-rock interactions (e.g. Schaltegger et al.,
2005; Pelleter et al., 2007). They can be used to constrain the moment of the interaction, and
possibly also its duration.
Nevertheless, despite the interesting nature of these rocks, there is no consensus concerning
their origin. Different authors suggest the metamorphism of evaporites (e.g. Schreyer, 1977),
metamorphism of superficially altered granites (Pawlig & Baumgartner, 2001), syn-
metamorphic metasomatism (Demény et al., 1997; Compagnoni & Hirajima, 2001), or
interaction with anatectic liquids and fluids (Philippot et al., 1995). The problem is not solved
so far.
Such zones of Mg-enrichment, commonly associated with intense fluid circulations in open
systems, are then an ideal target to tackle the problem of the relations between mass-transfer
and metamorphic crystallisations. They also allow addressing other important questions, such
as the character of the fluids involved or the stability of mineral assemblages during fluid-
rock interactions.
However, rather than address directly the most evolved products of these processes, like the
whiteschists, we propose to study small shear zones, which comprise magnesian lithologies
and develop at the expense of relatively simple rocks.
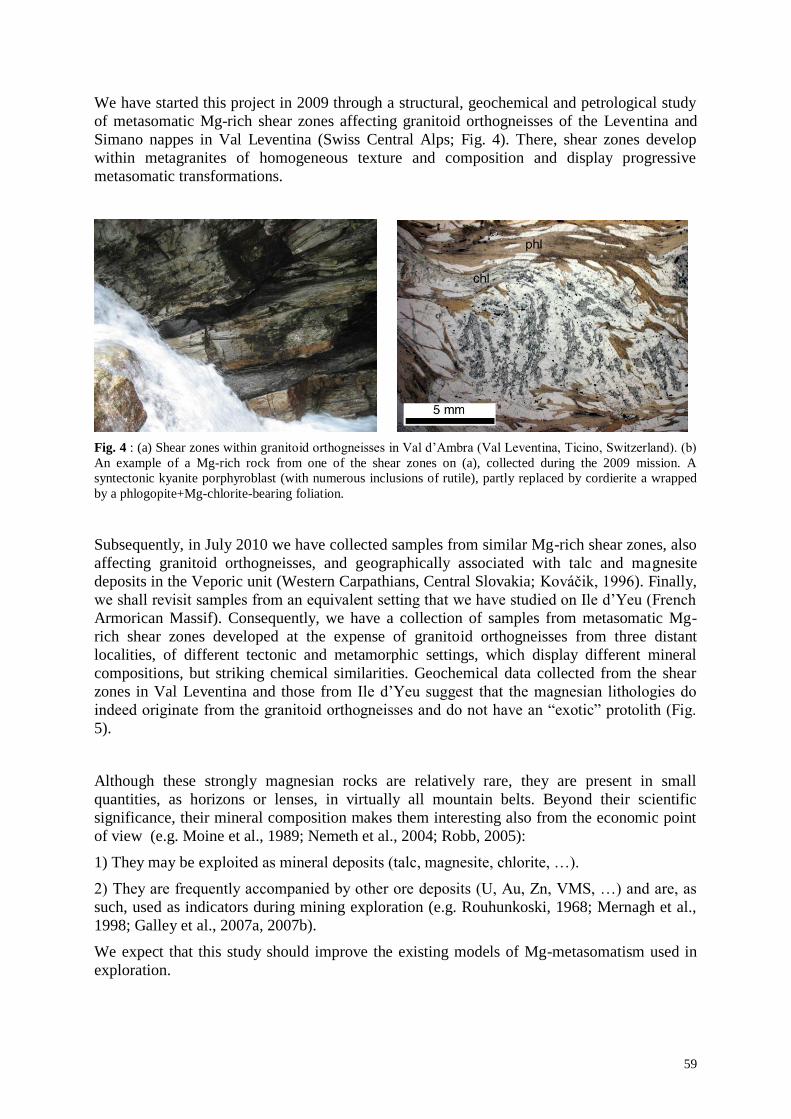
59
We have started this project in 2009 through a structural, geochemical and petrological study
of metasomatic Mg-rich shear zones affecting granitoid orthogneisses of the Leventina and
Simano nappes in Val Leventina (Swiss Central Alps; Fig. 4). There, shear zones develop
within metagranites of homogeneous texture and composition and display progressive
metasomatic transformations.
Fig. 4 : (a) Shear zones within granitoid orthogneisses in Val d‟Ambra (Val Leventina, Ticino, Switzerland). (b)
An example of a Mg-rich rock from one of the shear zones on (a), collected during the 2009 mission. A
syntectonic kyanite porphyroblast (with numerous inclusions of rutile), partly replaced by cordierite a wrapped
by a phlogopite+Mg-chlorite-bearing foliation.
Subsequently, in July 2010 we have collected samples from similar Mg-rich shear zones, also
affecting granitoid orthogneisses, and geographically associated with talc and magnesite
deposits in the Veporic unit (Western Carpathians, Central Slovakia; Kováčik, 1996). Finally,
we shall revisit samples from an equivalent setting that we have studied on Ile d‟Yeu (French
Armorican Massif). Consequently, we have a collection of samples from metasomatic Mg-
rich shear zones developed at the expense of granitoid orthogneisses from three distant
localities, of different tectonic and metamorphic settings, which display different mineral
compositions, but striking chemical similarities. Geochemical data collected from the shear
zones in Val Leventina and those from Ile d‟Yeu suggest that the magnesian lithologies do
indeed originate from the granitoid orthogneisses and do not have an “exotic” protolith (Fig.
5).
Although these strongly magnesian rocks are relatively rare, they are present in small
quantities, as horizons or lenses, in virtually all mountain belts. Beyond their scientific
significance, their mineral composition makes them interesting also from the economic point
of view (e.g. Moine et al., 1989; Nemeth et al., 2004; Robb, 2005):
1) They may be exploited as mineral deposits (talc, magnesite, chlorite, …).
2) They are frequently accompanied by other ore deposits (U, Au, Zn, VMS, …) and are, as
such, used as indicators during mining exploration (e.g. Rouhunkoski, 1968; Mernagh et al.,
1998; Galley et al., 2007a, 2007b).
We expect that this study should improve the existing models of Mg-metasomatism used in
exploration.
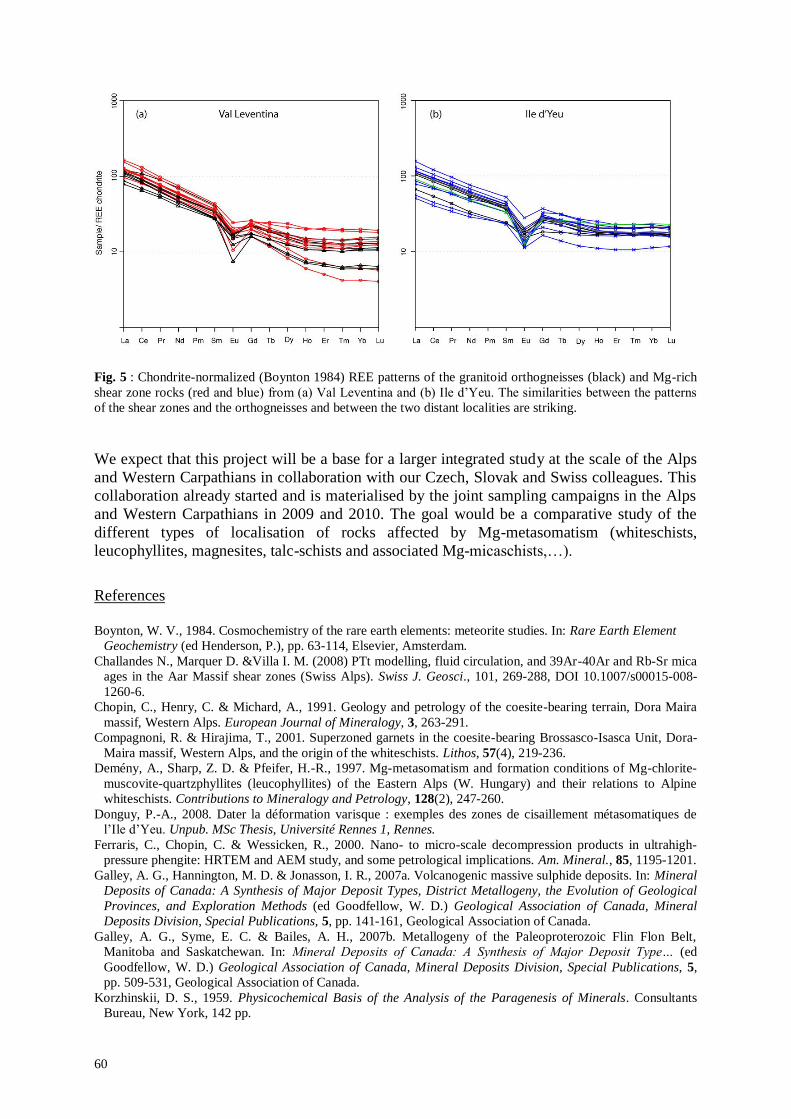
60
Fig. 5 : Chondrite-normalized (Boynton 1984) REE patterns of the granitoid orthogneisses (black) and Mg-rich
shear zone rocks (red and blue) from (a) Val Leventina and (b) Ile d‟Yeu. The similarities between the patterns
of the shear zones and the orthogneisses and between the two distant localities are striking.
We expect that this project will be a base for a larger integrated study at the scale of the Alps
and Western Carpathians in collaboration with our Czech, Slovak and Swiss colleagues. This
collaboration already started and is materialised by the joint sampling campaigns in the Alps
and Western Carpathians in 2009 and 2010. The goal would be a comparative study of the
different types of localisation of rocks affected by Mg-metasomatism (whiteschists,
leucophyllites, magnesites, talc-schists and associated Mg-micaschists,…).
References
Boynton, W. V., 1984. Cosmochemistry of the rare earth elements: meteorite studies. In: Rare Earth Element
Geochemistry (ed Henderson, P.), pp. 63-114, Elsevier, Amsterdam.
Challandes N., Marquer D. &Villa I. M. (2008) PTt modelling, fluid circulation, and 39Ar-40Ar and Rb-Sr mica
ages in the Aar Massif shear zones (Swiss Alps). Swiss J. Geosci., 101, 269-288, DOI 10.1007/s00015-008-
1260-6.
Chopin, C., Henry, C. & Michard, A., 1991. Geology and petrology of the coesite-bearing terrain, Dora Maira
massif, Western Alps. European Journal of Mineralogy, 3, 263-291.
Compagnoni, R. & Hirajima, T., 2001. Superzoned garnets in the coesite-bearing Brossasco-Isasca Unit, Dora-
Maira massif, Western Alps, and the origin of the whiteschists. Lithos, 57(4), 219-236.
Demény, A., Sharp, Z. D. & Pfeifer, H.-R., 1997. Mg-metasomatism and formation conditions of Mg-chlorite-
muscovite-quartzphyllites (leucophyllites) of the Eastern Alps (W. Hungary) and their relations to Alpine
whiteschists. Contributions to Mineralogy and Petrology, 128(2), 247-260.
Donguy, P.-A., 2008. Dater la déformation varisque : exemples des zones de cisaillement métasomatiques de
l‟Ile d‟Yeu. Unpub. MSc Thesis, Université Rennes 1, Rennes.
Ferraris, C., Chopin, C. & Wessicken, R., 2000. Nano- to micro-scale decompression products in ultrahigh-
pressure phengite: HRTEM and AEM study, and some petrological implications. Am. Mineral., 85, 1195-1201.
Galley, A. G., Hannington, M. D. & Jonasson, I. R., 2007a. Volcanogenic massive sulphide deposits. In: Mineral
Deposits of Canada: A Synthesis of Major Deposit Types, District Metallogeny, the Evolution of Geological
Provinces, and Exploration Methods (ed Goodfellow, W. D.) Geological Association of Canada, Mineral
Deposits Division, Special Publications, 5, pp. 141-161, Geological Association of Canada.
Galley, A. G., Syme, E. C. & Bailes, A. H., 2007b. Metallogeny of the Paleoproterozoic Flin Flon Belt,
Manitoba and Saskatchewan. In: Mineral Deposits of Canada: A Synthesis of Major Deposit Type… (ed
Goodfellow, W. D.) Geological Association of Canada, Mineral Deposits Division, Special Publications, 5,
pp. 509-531, Geological Association of Canada.
Korzhinskii, D. S., 1959. Physicochemical Basis of the Analysis of the Paragenesis of Minerals. Consultants
Bureau, New York, 142 pp.
61
Kosler, J., 2007. Laser ablation ICP-MS - a new dating tool in Earth science. Proceedings of the Geologists
Association, 118, 19-24.
Kováčik, M., 1996. Kyanite-magnesian chlorite schist and its petrogenetic significance (the Sinec Massif,
southern Veporic Unit, Western Carpathians). Geologica Carpathica, 47, 245-255.
Marquer, D. & Burkhard, M., 1992. Fluid circulation, progressive deformation and chemical mass-transfer in the
upper crust: example of basement-cover relationships in the external cristalline massifs (Switzerland). Journal
of Structural Geology, 14(8/9), 1047-1058.
Marquer, D., Petrucci, E. & Iacumin, P., 1994. Fluid advection in shear zones: evidence from geological and
geochemical relationships in the Aiguilles Rouges Massif (Western Alps - Switzerland). Schweizerische
Mineralogische und Petrographische Mitteilungen, 74(1), 137-148.
Mernagh, T. P., Wyborn, L. A. I. & Jagodzinski, E. A., 1998. „Unconformity-related‟ U±Au±platinum-group-
element deposits. AGSO Journal of Australian Geology and Geophysics, 17(4), 197-205.
Moine, B., Fortuné, J. P., Moreau, P. & Viguier, F., 1989. Comparative mineralogy, geochemistry, and
conditions of formation of two metasomatic talc and chlorite deposits; Trimouns (Pyrenees, France) and
Rabenwald (Eastern Alps, Austria). Economic Geology, 84(5), 1398-1416.
Nemeth, Z., Prochaska, W., Radvanec, M., Kováčik, M., Madaras, J., Koděra, P. & Hrasko, L., 2004. Magnesite
and talc origin in the sequence of geodynamic events in Veporicum, Inner Western Carpathians, Slovakia. Acta
Petrologica Sinica, 20(4), 837-854.
Oliot, E., Goncalves, P. & Marquer, D., 2010. Role of plagioclase and reaction softening in a metagranite shear
zone at mid-crustal conditions (Gotthard Massif, Swiss Central Alps). Journal of Metamorphic Geology, 28,
849-871.
Pawlig, S. & Baumgartner, L. P., 2001. Geochemistry of a talc-kyanite-chloritoid shear zone within the Monte
Rosa granite, Val d'Ayas, Italy. Schweizerische mineral. und petrographische Mitteilungen, 81(3), 329-346.
Pelleter, E., Cheilletz, A., Gasquet, D. et al., 2007. Hydrothermal zircons: A tool for ion microprobe U-Pb dating
of gold mineralization (Tamlalt-Menhouhou gold deposit - Morocco). Chemical Geology, 245(3-4), 135-161.
Philippot, P., Chevallier, P., Chopin, C. & Dubessy, J., 1995. Fluid composition and evolution in coesite-bearing
rocks (Dora-Maira massif, Western Alps): implications for element recycling during subduction. Contributions
to Mineralogy and Petrology, 121(1), 29-44.
Pitra, P. & Antonoff, V., 2007. Metamorphic conditions of the Variscan collision inferred from metasomatic
shear zones (Ile d‟Yeu, Armorican Massif, France). Mechanics of Variscan Orogeny: a modern view on
orogenic research (September 13-15 2007), Orléans, France
Pitra, P., Boulvais, P., Antonoff, V. & Diot, H., 2008. Wagnerite in a cordierite-gedrite gneiss: Witness of long-
term fluid-rock interaction in the continental crust (Ile d‟Yeu, Armorican Massif, France). American
Mineralogist, 93, 315-326.
Pitra, P., Kouamelan, A.N., Ballèvre, M., & Peucat, J.J., 2010. Palaeoproterozoic high-pressure granulite
overprint of the Archaean continental crust: evidence for homogeneous crustal thickening (Man Rise, Ivory
Coast). Journal of Metamorphic Geology, 28, 41-58.
Robb, L., 2005. Introduction to ore-forming proceses. Blackwell Publishing, Oxford.
Rossi, M., 2005. Déformation, transferts de matière et de fluide dans la croûte continentale: application aux
massifs cristallins externes des Alpes, Université Joseph Fourier - Grenoble 1, Grenoble.
Rouhunkoski, P., 1968. On the geology and geochemistry of the Vihanti zinc ore deposit. Bulletin de la
Commission Géologique de Finlande, 236, 1-121.
Schaltegger, U., Pettke, T., Audetat, A. et al., 2005. Magmatic-to-hydrothermal crystallization in the W-Sn
mineralized Mole Granite (NSW, Australia): Part I: Crystallization of zircon and REE-phosphates over three
million years - a geochemical and U-Pb geochronological study. Chemical Geology, 220(3-4), 215-235.
Schertl, H.-P. & Schreyer, W., 2008. Geochemistry of coesite-bearing „„pyrope quartzite‟‟ and related rocks
from the Dora-Maira Massif, Western Alps. European Journal of Mineralogy, 20, 791–809.
Schreyer, W., 1977. Whiteschists: Their compositions and pressure-temperature regimes based on experimental,
field, and petrographic evidence. Tectonophysics, 43(1-2), 127-144.
White, R. W., Powell, R. & Baldwin, J. A., 2008. Calculated phase equilibria involving chemical potentials to
investigate the textural evolution of metamorphic rocks. Journal of Metamorphic Geology, 26(2), 181-198.
62
Inverted metamorphic sequences
Extended abstract of an ANR project, submitted in 2011 (leader – Michel Ballèvre).
Mechanisms of heat transfer in a thickened crust: the inverted metamorphism in the Variscan
belt
Inverted metamorphic zonings develop in orogens dominated by continental collision and
record their thermo-mechanical evolution. The main goal of this project is to understand their
formation and preservation. Indeed, in zones of lithospheric convergence, crustal-scale thrusts
lead to the thickening of the continental crust and are commonly associated with local
inversions of the apparent metamorphic gradient. We aim to understand
1) whether, and to what extent does this inversion reflect the inversion of the geothermal
gradient
2) how can this inversion be preserved along strike of some mountain belts (over 3000 km in
the case of the Himalayan and Variscan orogen).
In order to answer these questions, our project combines in a complementary way detailed
case studies and numerical modelling.
The chosen case study is the European Variscan belt, where inverted metamorphic
sequences are observed from the NW part of Spain till the Bohemian massif. The inverted
metamorphism has mostly been studied in the Himalayas, without yielding a consensual
answer to the above questions. Then the Variscan belt represents an opportunity to study
another case, with a different history, but similar scale. The comparison of the two belts will
allow to abstract from the specificities of each orogen and retrieve the fundamental
parameters, which control the development of the common phenomenon (inverted
metamorphic zoning).
We propose to study in detail an example, the existence of which was recently shown by
our team (Pitra et al., 2010) – the Champtoceaux Complex in the French Armorican Massif.
We shall also explore a secondary target, the Lot valley in the southern Massif Central, from
which preliminary results have been obtained some 25 years ago (Burg et al., 1984, 1986).
Our first objective, of petrological character, is to establish (1) the initial dip of the
original subduction zone at the scale of the orogen, by confirming the existence of a pressure
gradient among the eclogite lenses scattered below the major thrust zone, and (2) the P–T
paths of the rocks across the inverted gradient. This will test the presence or absence of
discontinuities within the inverted sequence and the possible superposition of several P–T
cycles.
Our second objective, of geochronological character, aims to establish the age of the
eclogite-forming episode, still subject to uncertainties, and to clarify the age of the post-
eclogite partial melting, recorded in the upper unit. Finally, the cooling history of the nappe
stack will be examined in detail, in order to understand if the recorded interval of ages reflects
different closure mechanisms of the isotopic systems in different samples, a diachronous
uplift of the different stacked units, or other factors.
The goal of the numerical modelling will be to address the problem of the formation and
preservation of an inverted metamorphic sequence through parametric studies. The latter will
aim to quantify the physical key parameters such as the rate of thrusting, thermal conductivity
of the rocks, influence of shear-heating, etc. For this, modelling will be performed at various
degrees of complexity. First, kinematically-controlled thermal models, in order to access the
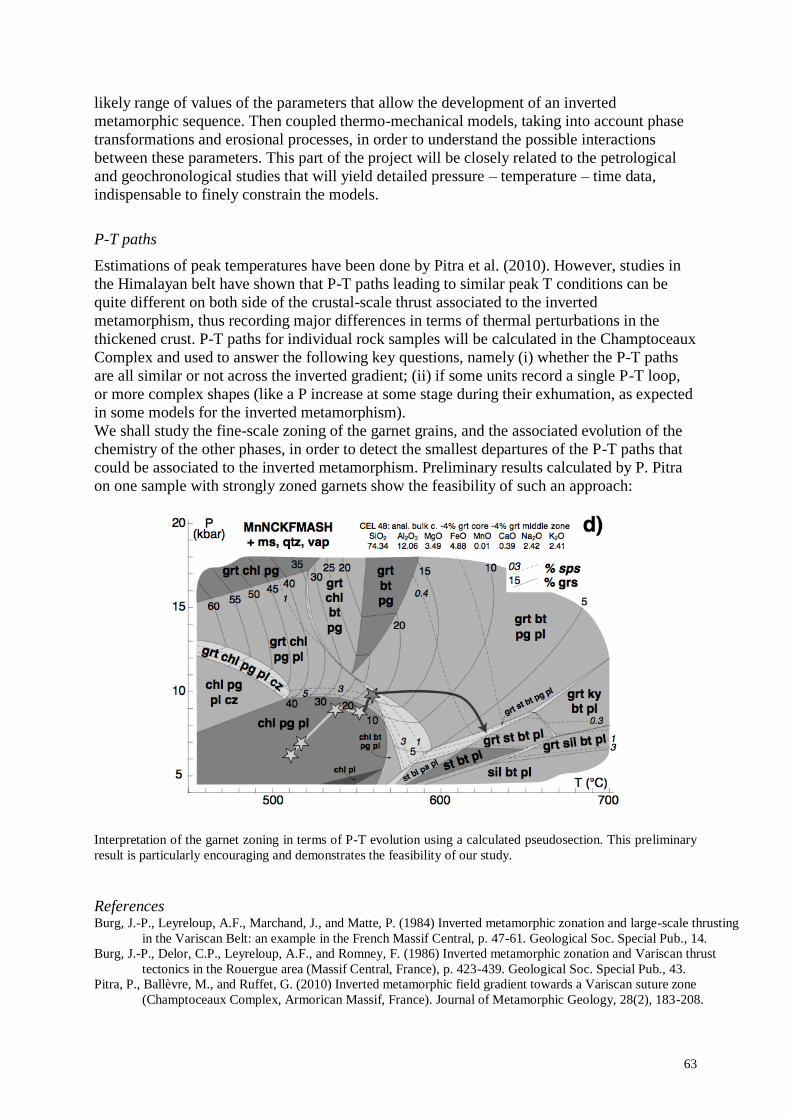
63
likely range of values of the parameters that allow the development of an inverted
metamorphic sequence. Then coupled thermo-mechanical models, taking into account phase
transformations and erosional processes, in order to understand the possible interactions
between these parameters. This part of the project will be closely related to the petrological
and geochronological studies that will yield detailed pressure – temperature – time data,
indispensable to finely constrain the models.
P-T paths
Estimations of peak temperatures have been done by Pitra et al. (2010). However, studies in
the Himalayan belt have shown that P-T paths leading to similar peak T conditions can be
quite different on both side of the crustal-scale thrust associated to the inverted
metamorphism, thus recording major differences in terms of thermal perturbations in the
thickened crust. P-T paths for individual rock samples will be calculated in the Champtoceaux
Complex and used to answer the following key questions, namely (i) whether the P-T paths
are all similar or not across the inverted gradient; (ii) if some units record a single P-T loop,
or more complex shapes (like a P increase at some stage during their exhumation, as expected
in some models for the inverted metamorphism).
We shall study the fine-scale zoning of the garnet grains, and the associated evolution of the
chemistry of the other phases, in order to detect the smallest departures of the P-T paths that
could be associated to the inverted metamorphism. Preliminary results calculated by P. Pitra
on one sample with strongly zoned garnets show the feasibility of such an approach:
Interpretation of the garnet zoning in terms of P-T evolution using a calculated pseudosection. This preliminary
result is particularly encouraging and demonstrates the feasibility of our study.
References Burg, J.-P., Leyreloup, A.F., Marchand, J., and Matte, P. (1984) Inverted metamorphic zonation and large-scale thrusting
in the Variscan Belt: an example in the French Massif Central, p. 47-61. Geological Soc. Special Pub., 14.
Burg, J.-P., Delor, C.P., Leyreloup, A.F., and Romney, F. (1986) Inverted metamorphic zonation and Variscan thrust
tectonics in the Rouergue area (Massif Central, France), p. 423-439. Geological Soc. Special Pub., 43.
Pitra, P., Ballèvre, M., and Ruffet, G. (2010) Inverted metamorphic field gradient towards a Variscan suture zone
(Champtoceaux Complex, Armorican Massif, France). Journal of Metamorphic Geology, 28(2), 183-208.
64
Statistical methods
The goal of the study of metamorphic rocks is in general to determine the evolution of the
physico-chemcial conditions (pressure-temperature-composition) in time, in order to set them
in a geodynamic context. This information is therefore the basis for all tectonic interpretations
and models. Yet, this information is subject to uncertainty, the importance of which is
systematically neglected or underestimated. This uncertainty concerns not only the absolute
value of the pressure–temperature conditions, but also the character of their evolution in time
(the form of the “P–T paths”). It comes from several sources:
- “geological” uncertainty, related to the problem of understanding correctly the rocks –
estimating the equilibration volumes, interpreting the equilibrium assemblages, the
heterogeneity of mineral compositions, etc.
- analytical uncertainty,
- thermodynamic uncertainty, associated with the fundamental thermodynamic data
and the formulation of the mixing models for solution phases.
Realistic estimation of these uncertainties and their propagation through the
thermodynamic calculations allows to get results that approach the reality, and to have a
better idea of their reliability. The information on the reliability of the petrological data (P
and T at a given moment, reflecting the transient geotherm; their evolution in time, reflecting
e.g. a decompression accompanied by heating, or cooling, etc.) can appear crucial, since they
are used as the base for elaborating or justifying numerous tectonic models (e.g. on the
exhumation of rocks in subduction zones, the formation of mountain belts, etc.) and
underestimating the uncertainties may lead to unjustified invalidation of some of the models.
In the framework of my research, this aspect is crucial, for example, in the interpretation
of the development of the inverted metamorphic sequences. Indeed, this interpretation
depends on how the petrological record (in particular e.g. the chemical zoning of minerals)
can be interpreted in terms of depth and temperature variations (related for example to the
transient overload due to the emplacement of a nappe) and the precision, with which this can
be done. But it plays an important role also in the estimation of the pressure – temperature
conditions, and hence the geothermal gradients, in subduction zones.
In order to approach this aspect that I believe fundamental for the future of metamorphic
petrology, I spent four weeks with Roger Powell at the University of Melbourne, Australia. I
would like to further develop this aspect by acquiring the necessary mathematical tools and
applying them to the various running projects.

65

66
C – Annexes


![[PPT] Chapitre 1 Equilibres](https://img.pdfslide.fr/doc/110x75/559b32ad1a28ab39638b4581/ppt-chapitre-1-equilibres.jpg)