Embed Size (px)
Citation preview
AL QAWATI et al., JMES, 2018, 9 (1), pp. 293-304 293
J. Mater. Environ. Sci., 2018, Volume 9, Issue 1, Page 293-304
https://doi.org/10.26872/jmes.2018.9.1.33
http://www.jmaterenvironsci.com
Journal of Materials and Environmental Sciences ISSN : 2028-2508 CODEN : JMESCN
Copyright © 2017, University of Mohammed Premier Oujda Morocco
1. Introduction
Groundwater is the world’s largest and most reliable source of freshwater, with nearly 80% of global inhabitants
relying on it as a source of drinking water [1]. It is an essential source for domestic, industrial and agricultural
activities. However, it is threatened with pollution and pure water is not available everywhere. Even the storage
and availability of fresh water are not always secured. Also, the majority of irrigation and drinking water
resources do not always conform to the international quality standards. This probably signifies the presence of
anthropogenic or geochemical contamination. There are many reports worldwide indicating the contamination
of groundwater or that it becomes at risk of contamination [2]. Failure to minimize water contamination can
result in severe adverse effects on human health, animal and agriculture. Most diseases in human beings are
caused by polluted water.
Knowledge of hydrogeochemistry is a key to determining the origin of the chemical composition of
groundwater, the interaction between water and rock and the process of groundwater flow [3 , 4]. Groundwater
quality is naturally linked to the chemical properties of the aquifer’s geology through which it flows. Thus, there
is spatial variability in the quality of groundwater from one aquifer to another. Geology is not the only factor
determining groundwater quality; anthropogenic factors also play an important role [5-7].
Journal of materials and Environmental Sciences ISSN : 2028-2508
Copyright © 2017,
University of Mohammed Premier
Oujda Morocco
Abstract
The natural hydrogeochemical processes and the human activities are some of the
factors that have direct effects on the groundwater quality. In this study, a
hydrogeochemical assessment of groundwater was carried out to determine its
chemical characteristics and its suitability for drinking in the region Sidi Allal Tazi-
Morocco. The study has been carried out on 54 groundwater wells in the region under
study. The groundwater samples were collected and analyzed during Dec 2016 –
January 2017. The parameters examined were pH, electrical conductivity, total
dissolved solids, calcium, magnesium, sodium, potassium, nitrates, ammonium, sulfate,
chloride, carbonate and bicarbonate. The results have shown that the ammonium
concentration in 96% of wells and nitrate concentration in 78% of them are much
higher than the World Health Organization (WHO) standards, indicating the
nitrogenous pollution. The electric conductivity in 50% of wells, chloride concentration
in 46% and sodium concentration in 31% of them are relatively higher than WHO
standards, indicating the mineral contamination, the Atlantic-Ocean water intrusion as
well as the natural weathering reactions. The study has also revealed that other
parameters are approximately in concord with the WHO standards. It showed that the
dominant types of water in the study region are 59.26 % mixed Ca–Mg–SO4–Cl,
18.52 % Ca–HCO3 and 22.22 % Na–Cl type, indicating the gradual water–rock
interaction. It is concluded that the groundwater of the study region has approximately
the same geochemical evolution and medium quality for drinking.
Hydrogeochemical Study of Groundwater Quality in the West of Sidi Allal Tazi,
Gharb area, Morocco
Mohammed AL-QAWATI, Mouhcine EL-QAYSY, Nabil DARWESH, Mohamed SIBBARI,
Farid HAMDAOUI, Imane KHERRATI, Khadija EL KHARRIM, Driss BELGHYTI Laboratory of agro-physiology, biotechnology, environment and quality, water team, wastewater, health,
Faculty of Science, Ibn Tofail University. Kenitra. Morocco.
Received 30 Jul 2017,
Revised 01 Oct 2017,
Accepted 10 Oct 2017
Keywords
Hydrogeochemical,
Groundwater,
Quality,
Sidi Allal Tazi-Morocco.
[email protected]; Phone: +212762730079;
ORCID iD:
0000-0003-0950-3520
AL QAWATI et al., JMES, 2018, 9 (1), pp. 293-304 294
The majority of water resources are increasingly getting polluted due to human activities such as
maltreatment of sanitation systems (agricultural, industrial and domestic), reuse of wastewater in agriculture
without prior treatment, war repercussions, chemical and nuclear tests. This problem is intensified in coastal
aquifers where human activity results in retrogradation of water quality. Naturally, the uncontrolled application
of irrigation water and fertilizers will definitely lead to the waste of water resources and in possible groundwater
pollution [8-12]. Also, the natural factors such as climate changes, depth of wells, natural mineralization;
geochemical, chemical composition of rocks and soil (dissolvable salt rate and heavy metals) and the chemical
composition of the rainwater (especially acid rains) can be considered important factors for chemical contents of
groundwater. The danger of pollution of the underground water depends on the type and concentration rate of
the pollutants in it. The polluted surface water may be absorbed by or penetrated through the soil into the water
table. Water resources in Morocco confront several quantity problems such as scarcity of pure water, and quality
problems like chemically polluted, biologically polluted or physically polluted water source, especially in areas
with more human activities or those near to water sanitary outlets. The degradation of soil and groundwater
quality is due to the mismanagement of irrigation water and agrochemical inputs [13].
The intensive agricultural activity in the Gharb-Morocco is considered one of the important factors that
can contribute to the degradation of the quality of water. More over the groundwater resources of the Gharb are
contaminate by the organochlorine pesticides (0.03-0.3µg/L) [13].
Sidi Allal Tazi (region of the study), situated in the north-west of Morocco, between the coast of the
Atlantic Ocean and the polluted Sebou River, is an agricultural region with some industrial activities. For this
reason, the groundwater in this region is vulnerable to high pollution rate due to the overuse of the pesticides
and fertilizers and high risk of biological and chemical pollution. Underground water in the western region of
Morocco confronts the problem of pollution with the pesticides and the fertilizers.
The paper examines the groundwater quality for drinking in Sidi Allal Tazi-Morocco region. The
analytical procedures of the paper focus more on identifying the types of mineral pollution to help accelerating
the reduction of its effect and analyzing the different rates of mineral pollution.
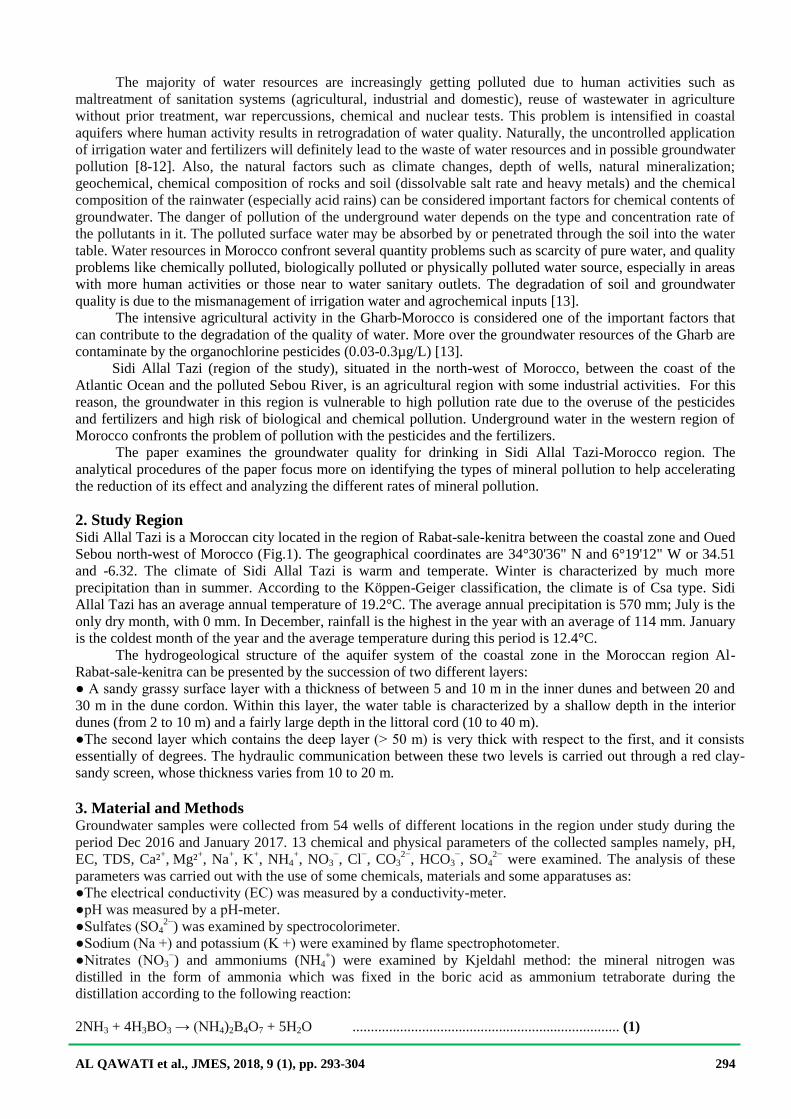
2. Study Region Sidi Allal Tazi is a Moroccan city located in the region of Rabat-sale-kenitra between the coastal zone and Oued
Sebou north-west of Morocco (Fig.1). The geographical coordinates are 34°30'36" N and 6°19'12" W or 34.51
and -6.32. The climate of Sidi Allal Tazi is warm and temperate. Winter is characterized by much more
precipitation than in summer. According to the Köppen-Geiger classification, the climate is of Csa type. Sidi
Allal Tazi has an average annual temperature of 19.2°C. The average annual precipitation is 570 mm; July is the
only dry month, with 0 mm. In December, rainfall is the highest in the year with an average of 114 mm. January
is the coldest month of the year and the average temperature during this period is 12.4°C.
The hydrogeological structure of the aquifer system of the coastal zone in the Moroccan region Al-
Rabat-sale-kenitra can be presented by the succession of two different layers:
● A sandy grassy surface layer with a thickness of between 5 and 10 m in the inner dunes and between 20 and
30 m in the dune cordon. Within this layer, the water table is characterized by a shallow depth in the interior
dunes (from 2 to 10 m) and a fairly large depth in the littoral cord (10 to 40 m).
●The second layer which contains the deep layer (> 50 m) is very thick with respect to the first, and it consists
essentially of degrees. The hydraulic communication between these two levels is carried out through a red clay-
sandy screen, whose thickness varies from 10 to 20 m.
3. Material and Methods Groundwater samples were collected from 54 wells of different locations in the region under study during the
period Dec 2016 and January 2017. 13 chemical and physical parameters of the collected samples namely, pH,
EC, TDS, Ca²+, Mg²
+, Na
+, K
+, NH4
+, NO3
−, Cl
−, CO3
2−, HCO3
−, SO4
2− were examined. The analysis of these
parameters was carried out with the use of some chemicals, materials and some apparatuses as:
●The electrical conductivity (EC) was measured by a conductivity-meter.
●pH was measured by a pH-meter.
●Sulfates (SO42−
) was examined by spectrocolorimeter.
●Sodium (Na +) and potassium (K +) were examined by flame spectrophotometer.
●Nitrates (NO3−) and ammoniums (NH4
+) were examined by Kjeldahl method: the mineral nitrogen was
distilled in the form of ammonia which was fixed in the boric acid as ammonium tetraborate during the
distillation according to the following reaction:
2NH3 + 4H3BO3 → (NH4)2B4O7 + 5H2O ......................................................................... (1)
AL QAWATI et al., JMES, 2018, 9 (1), pp. 293-304 295
Figure 1: location of the study region (Sidi Allal Tazi-Morocco)
Subsequently, the ammonia absorbed in the form of (NH4)2B4O7 was titrated with H2SO4 according to the
following reaction:
(NH4)2B4O7 + 5H2O + H2SO4 → (NH4)2 SO4 + 4H3BO3 ................................................ (2)
●Chloride (Cl–) was titrated by silver nitrate, in the presence of potassium chromate solution as an indicator.
The silver nitrate reacts with the chloride ions in water according to the following equation:
AgNO3 + Cl−
→ AgCl + NO3− ........................................................................................... (3)
The excess ions of Ag+ react with the chromate of potassium and give Ag2CrO4 (precipitate red) according to
the following equation:
2Ag+
+ K2CrO4 → Ag2CrO4 + 2K+ ................................................................................ (4)
AL QAWATI et al., JMES, 2018, 9 (1), pp. 293-304 296
●Ca2+
and (Ca2+
+ Mg2+
) were titrated by EDTA-2Na complex, in the presence of a buffer solution and an
indicator (Patton and Reeder’s indicator for Ca2+
or Eriochrome black T for Ca2+
+ Mg2+
).
The cationic exchange concerned is carried out according to the following reactions:
Na2[H2EDTA] + Ca2+
→ Na2[Ca EDTA] + 2H+ ............................................................... (5)
Na2[H2EDTA] + Mg2+
→ Na2[Mg EDTA] + 2H+ .............................................................. (6)
●Carbonates (CO32−
) and bicarbonates (HCO3−) were titrated by sulfuric acid solution, in the presence of an
indicator (phenolphthalein for CO32−
or bromocresol green for HCO3−).
The sulfuric acid reacts with the carbonates and bicarbonates according to the following equations:
H2SO4 + CO32−
→ SO42−
+ H2O + CO2 .................................................................... (7)
H2SO4 + 2 HCO3− → SO4
2− + 2H2O + 2CO2 .................................................................... (8)
4. Results and discussion
The results of analysis of the groundwater samples collected in the period of the monitoring are presented in
the Tables 1, 2, 3.
4.1. pH
The pH of water is the rate of hydrogen ion concentration. It indicates the acidic or alkaline nature of water.
The pH has correlation with the variables that affect the hydro-chemical interactions and the concentrations of
the ions in the water such as the temperature which has a significant effect on the pH rate [14 , 15]. The natural
water composition is controlled by a combination of geochemical and biological processes, which are largely
affected by pH [1]. Taking pH into consideration is important in almost all uses of water. In general, low pH
values in natural water may be due to high level of CO2, SO2, NO, and H2S dissolved in it, that can be
produced by some domestic or industrial contaminants and may cause acid rain. In addition to that, the
overuse of some salts of fertilization such as NH4NO3, (NH4)2SO4 and NH4Cl can contribute to the
acidification (low pH) of irrigation water and soil as a result of its hydrolysis that can increase H3O+
concentration (low pH). For example, NH4Cl hydrolysis can increase H3O+ concentration according to the
following equation:
NH4Cl + 2H2O → NH4OH + H3O+ + Cl
− ..........................................................................(9)
On the contrary, there are chemical contaminants that can increase the alkaline (high pH) of water such
as alkaline detergents (KOH, NaOH, Na3PO4, NaCO3,... etc). Geochemical and biological processes affect also
water pH.
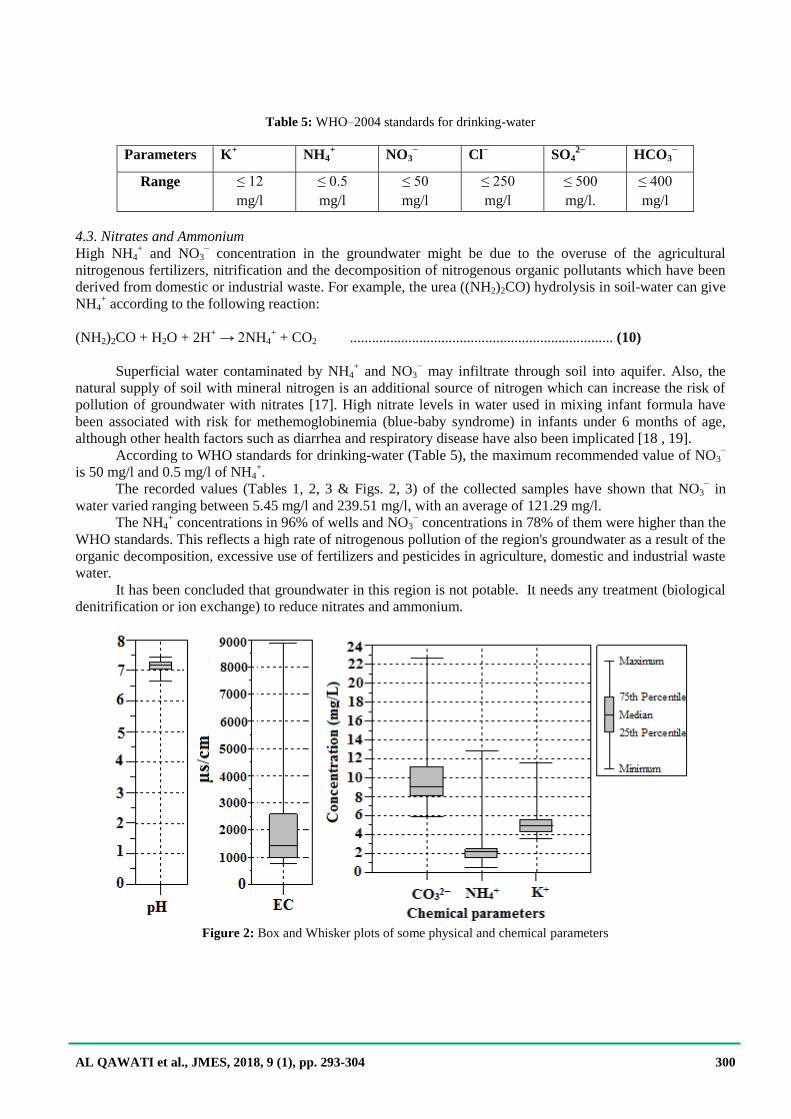
According to WHO standards for drinking-water (Table 4), the optimum pH is usually in the range of
6.5–8.5. The recorded pH values (Tables 1, 2, 3) of water in the region under study show no difference from
the norm (the maximum registered value was 7.44, the minimum was 6.68, and the average was 7.24 (Fig. 2)).
It has been noted that the groundwater of the study region was neutral and in concord with the WHO
standards. The results have shown that the quality of water according to this parameter is excellent for
drinking.
4.2. Electrical conductivity (EC) and Total dissolved solids (TDS)
The electrical conductivity (EC) of water is a measure of water’s electric conduction (ionic Conductivity).
Naturally, high electrical conductivity values in groundwater is due to high concentration of mineral ions
(Ca²+, Mg²
+, Na
+, K
+, HCO3
−, SO4
2−, Cl
−, NO3
− , …..) as a result of dissolved mineral electrolytes (soluble salts
or inorganic chemicals), natural chemical weathering and erosion of rocks and minerals, water–rock
interaction, infiltration of superficial saltwater and industrial-domestic discharges into aquifer as well as the
probability of ocean/sea water intrusion into coastal aquifer. Consequently, the electrical conductivity of water
is an indicator of its mineralization and its salinity. Groundwater that is used for domestic and irrigation
purposes may vary greatly in its conductive quality depending upon the type and quantity of dissolved salts
[16].
According to WHO standards for drinking-water (Table 4), the optimum values of EC are 500–1500
µs/cm, and 500–1500 mg/l of TDS.
AL QAWATI et al., JMES, 2018, 9 (1), pp. 293-304 297
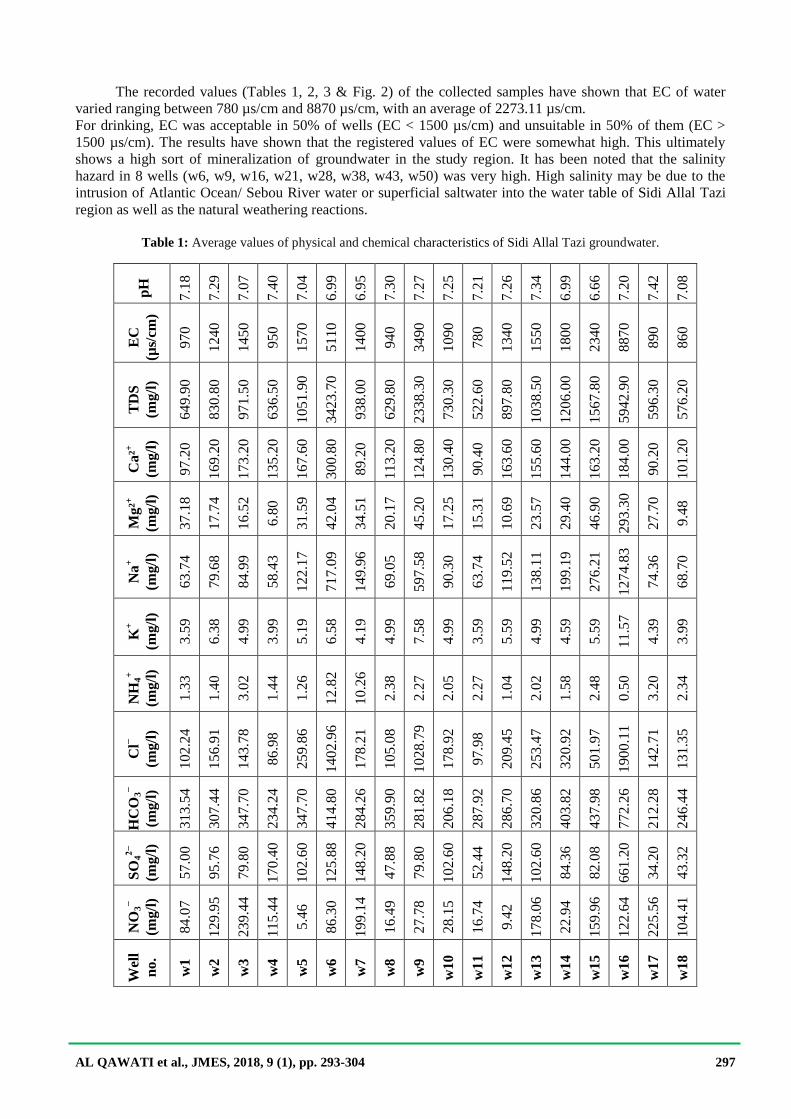
The recorded values (Tables 1, 2, 3 & Fig. 2) of the collected samples have shown that EC of water
varied ranging between 780 µs/cm and 8870 µs/cm, with an average of 2273.11 µs/cm.
For drinking, EC was acceptable in 50% of wells (EC < 1500 µs/cm) and unsuitable in 50% of them (EC >
1500 µs/cm). The results have shown that the registered values of EC were somewhat high. This ultimately
shows a high sort of mineralization of groundwater in the study region. It has been noted that the salinity
hazard in 8 wells (w6, w9, w16, w21, w28, w38, w43, w50) was very high. High salinity may be due to the
intrusion of Atlantic Ocean/ Sebou River water or superficial saltwater into the water table of Sidi Allal Tazi
region as well as the natural weathering reactions.
Table 1: Average values of physical and chemical characteristics of Sidi Allal Tazi groundwater.
pH
7.1
8
7.2
9
7.0
7
7.4
0
7.0
4
6.9
9
6.9
5
7.3
0
7.2
7
7.2
5
7.2
1
7.2
6
7.3
4
6.9
9
6.6
6
7.2
0
7.4
2
7.0
8
EC
(µs/
cm)
97
0
12
40
14
50
95
0
15
70
51
10
14
00
94
0
34
90
10
90
78
0
13
40
15
50
18
00
23
40
88
70
89
0
86
0
TD
S
(mg/l
)
64
9.9
0
83
0.8
0
97
1.5
0
63
6.5
0
10
51
.90
34
23
.70
93
8.0
0
62
9.8
0
23
38
.30
73
0.3
0
52
2.6
0
89
7.8
0
10
38
.50
12
06
.00
15
67
.80
59
42
.90
59
6.3
0
57
6.2
0
Ca²+
(mg/l
)
97.2
0
169.2
0
173.2
0
135.2
0
167.6
0
300.8
0
89.2
0
113.2
0
124.8
0
130.4
0
90.4
0
163.6
0
155.6
0
144.0
0
163.2
0
184.0
0
90.2
0
101.2
0
Mg²+
(mg/l
)
37.1
8
17.7
4
16.5
2
6.8
0
31.5
9
42.0
4
34.5
1
20.1
7
45.2
0
17.2
5
15.3
1
10.6
9
23.5
7
29.4
0
46.9
0
293.3
0
27.7
0
9.4
8
Na
+
(mg/l
)
63.7
4
79.6
8
84.9
9
58.4
3
122.1
7
717.0
9
149.9
6
69.0
5
597.5
8
90.3
0
63.7
4
119.5
2
138.1
1
199.1
9
276.2
1
1274.8
3
74.3
6
68.7
0
K+
(mg/l
)
3.5
9
6.3
8
4.9
9
3.9
9
5.1
9
6.5
8
4.1
9
4.9
9
7.5
8
4.9
9
3.5
9
5.5
9
4.9
9
4.5
9
5.5
9
11.5
7
4.3
9
3.9
9
NH
4+
(mg/l
)
1.3
3
1.4
0
3.0
2
1.4
4
1.2
6
12.8
2
10.2
6
2.3
8
2.2
7
2.0
5
2.2
7
1.0
4
2.0
2
1.5
8
2.4
8
0.5
0
3.2
0
2.3
4
Cl−
(mg/l
)
102.2
4
156.9
1
143.7
8
86.9
8
259.8
6
1402.9
6
178.2
1
105.0
8
1028.7
9
178.9
2
97.9
8
209.4
5
253.4
7
320.9
2
501.9
7
1900.1
1
142.7
1
131.3
5
HC
O3−
(mg/l
)
31
3.5
4
30
7.4
4
34
7.7
0
23
4.2
4
34
7.7
0
41
4.8
0
28
4.2
6
35
9.9
0
28
1.8
2
20
6.1
8
28
7.9
2
28
6.7
0
32
0.8
6
40
3.8
2
43
7.9
8
77
2.2
6
21
2.2
8
24
6.4
4
SO
42−
(mg/l
)
57
.00
95
.76
79
.80
17
0.4
0
10
2.6
0
12
5.8
8
14
8.2
0
47
.88
79
.80
10
2.6
0
52
.44
14
8.2
0
10
2.6
0
84
.36
82
.08
66
1.2
0
34
.20
43
.32
NO
3−
(mg/l
)
84
.07
12
9.9
5
23
9.4
4
11
5.4
4
5.4
6
86
.30
19
9.1
4
16
.49
27
.78
28
.15
16
.74
9.4
2
17
8.0
6
22
.94
15
9.9
6
12
2.6
4
22
5.5
6
10
4.4
1
Wel
l
no.
w1
w2
w3
w4
w5
w6
w7
w8
w9
w10
w11
w12
w13
w14
w15
w16
w17
w18
AL QAWATI et al., JMES, 2018, 9 (1), pp. 293-304 298
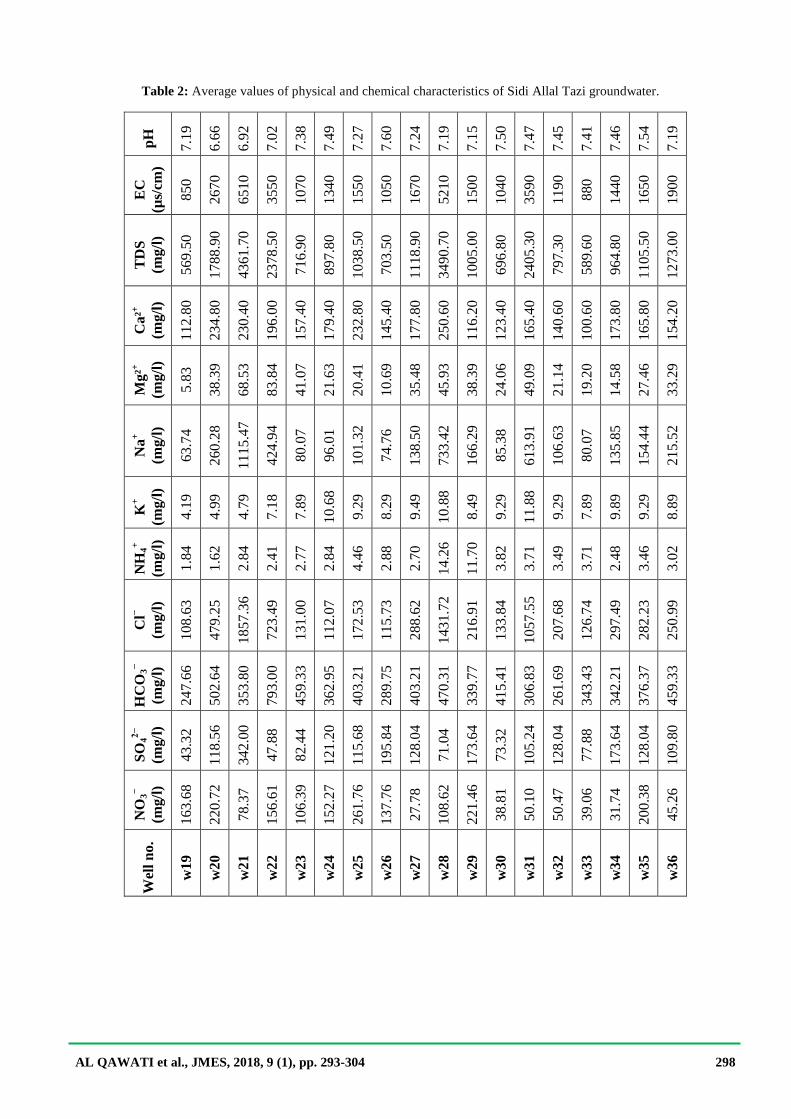
Table 2: Average values of physical and chemical characteristics of Sidi Allal Tazi groundwater.
pH
7.1
9
6.6
6
6.9
2
7.0
2
7.3
8
7.4
9
7.2
7
7.6
0
7.2
4
7.1
9
7.1
5
7.5
0
7.4
7
7.4
5
7.4
1
7.4
6
7.5
4
7.1
9
EC
(µs/
cm)
85
0
26
70
65
10
35
50
10
70
13
40
15
50
10
50
16
70
52
10
15
00
10
40
35
90
11
90
88
0
14
40
16
50
19
00
TD
S
(mg/l
)
56
9.5
0
17
88
.90
43
61
.70
23
78
.50
71
6.9
0
89
7.8
0
10
38
.50
70
3.5
0
11
18
.90
34
90
.70
10
05
.00
69
6.8
0
24
05
.30
79
7.3
0
58
9.6
0
96
4.8
0
11
05
.50
12
73
.00
Ca
²+
(mg/l
)
11
2.8
0
23
4.8
0
23
0.4
0
19
6.0
0
15
7.4
0
17
9.4
0
23
2.8
0
14
5.4
0
17
7.8
0
25
0.6
0
11
6.2
0
12
3.4
0
16
5.4
0
14
0.6
0
10
0.6
0
17
3.8
0
16
5.8
0
15
4.2
0
Mg
²+
(mg/l
)
5.8
3
38
.39
68
.53
83
.84
41
.07
21
.63
20
.41
10
.69
35
.48
45
.93
38
.39
24
.06
49
.09
21
.14
19
.20
14
.58
27
.46
33
.29
Na
+
(mg/l
)
63.7
4
260.2
8
1115.4
7
424.9
4
80.0
7
96.0
1
101.3
2
74.7
6
138.5
0
733.4
2
166.2
9
85.3
8
613.9
1
106.6
3
80.0
7
135.8
5
154.4
4
215.5
2
K+
(mg/l
)
4.1
9
4.9
9
4.7
9
7.1
8
7.8
9
10.6
8
9.2
9
8.2
9
9.4
9
10.8
8
8.4
9
9.2
9
11.8
8
9.2
9
7.8
9
9.8
9
9.2
9
8.8
9
NH
4+
(mg/l
)
1.8
4
1.6
2
2.8
4
2.4
1
2.7
7
2.8
4
4.4
6
2.8
8
2.7
0
14.2
6
11.7
0
3.8
2
3.7
1
3.4
9
3.7
1
2.4
8
3.4
6
3.0
2
Cl−
(mg/l
)
108.6
3
479.2
5
1857.3
6
723.4
9
131.0
0
112.0
7
172.5
3
115.7
3
288.6
2
1431.7
2
216.9
1
133.8
4
1057.5
5
207.6
8
126.7
4
297.4
9
282.2
3
250.9
9
HC
O3−
(mg/l
)
247.6
6
502.6
4
353.8
0
793.0
0
459.3
3
362.9
5
403.2
1
289.7
5
403.2
1
470.3
1
339.7
7
415.4
1
306.8
3
261.6
9
343.4
3
342.2
1
376.3
7
459.3
3
SO
42−
(mg/l
)
43.3
2
118.5
6
342.0
0
47.8
8
82.4
4
121.2
0
115.6
8
195.8
4
128.0
4
71.0
4
173.6
4
73.3
2
105.2
4
128.0
4
77.8
8
173.6
4
128.0
4
109.8
0
NO
3−
(mg/l
)
16
3.6
8
22
0.7
2
78
.37
15
6.6
1
10
6.3
9
15
2.2
7
26
1.7
6
13
7.7
6
27
.78
10
8.6
2
22
1.4
6
38
.81
50
.10
50
.47
39
.06
31
.74
20
0.3
8
45
.26
Wel
l n
o.
w1
9
w2
0
w2
1
w2
2
w2
3
w2
4
w2
5
w2
6
w2
7
w2
8
w2
9
w3
0
w3
1
w3
2
w3
3
w3
4
w3
5
w3
6
AL QAWATI et al., JMES, 2018, 9 (1), pp. 293-304 299
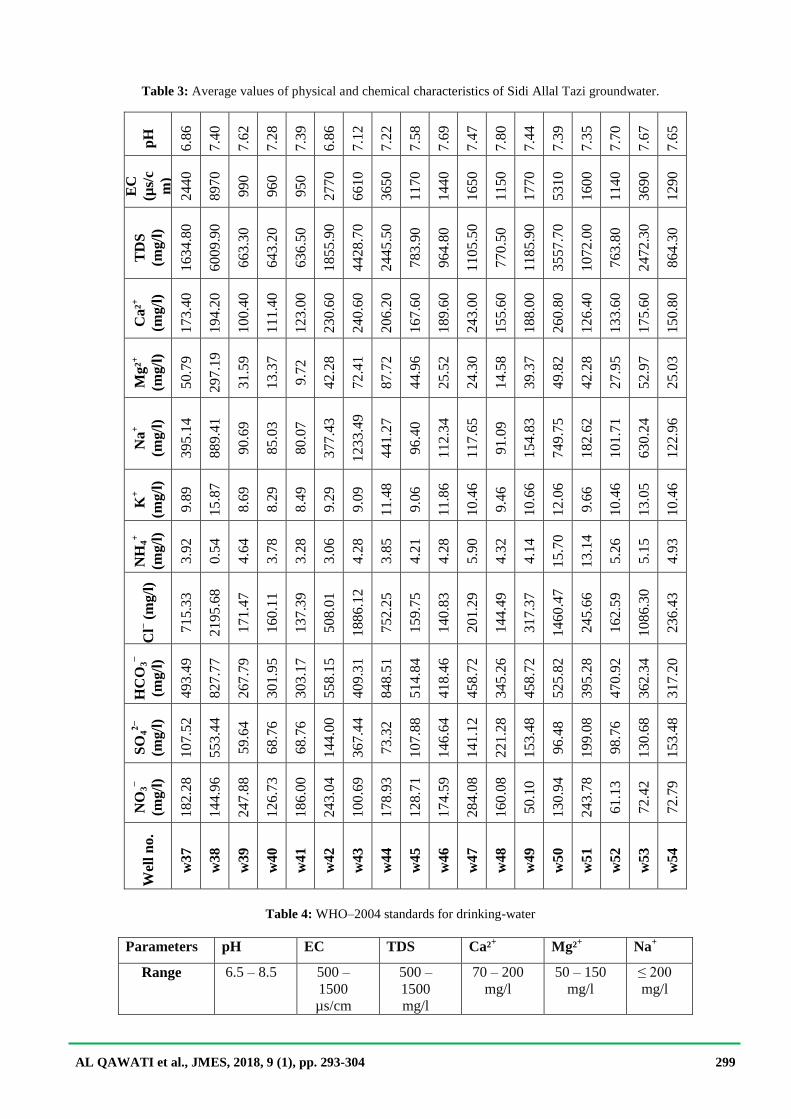
Table 3: Average values of physical and chemical characteristics of Sidi Allal Tazi groundwater.
pH
6.8
6
7.4
0
7.6
2
7.2
8
7.3
9
6.8
6
7.1
2
7.2
2
7.5
8
7.6
9
7.4
7
7.8
0
7.4
4
7.3
9
7.3
5
7.7
0
7.6
7
7.6
5
EC
(µs/
c
m)
24
40
89
70
99
0
96
0
95
0
27
70
66
10
36
50
11
70
14
40
16
50
11
50
17
70
53
10
16
00
11
40
36
90
12
90
TD
S
(mg/l
)
16
34
.80
60
09
.90
66
3.3
0
64
3.2
0
63
6.5
0
18
55
.90
44
28
.70
24
45
.50
78
3.9
0
96
4.8
0
11
05
.50
77
0.5
0
11
85
.90
35
57
.70
10
72
.00
76
3.8
0
24
72
.30
86
4.3
0
Ca
²+
(mg/l
)
17
3.4
0
19
4.2
0
10
0.4
0
11
1.4
0
12
3.0
0
23
0.6
0
24
0.6
0
20
6.2
0
16
7.6
0
18
9.6
0
24
3.0
0
15
5.6
0
18
8.0
0
26
0.8
0
12
6.4
0
13
3.6
0
17
5.6
0
15
0.8
0
Mg
²+
(mg/l
)
50
.79
29
7.1
9
31
.59
13
.37
9.7
2
42
.28
72
.41
87
.72
44
.96
25
.52
24
.30
14
.58
39
.37
49
.82
42
.28
27
.95
52
.97
25
.03
Na
+
(mg/l
)
395.1
4
889.4
1
90.6
9
85.0
3
80.0
7
377.4
3
1233
.49
441.2
7
96.4
0
112.3
4
117.6
5
91.0
9
154.8
3
749.7
5
182.6
2
101.7
1
630.2
4
122.9
6
K+
(mg/l
)
9.8
9
15.8
7
8.6
9
8.2
9
8.4
9
9.2
9
9.0
9
11.4
8
9.0
6
11.8
6
10.4
6
9.4
6
10.6
6
12.0
6
9.6
6
10.4
6
13.0
5
10.4
6
NH
4+
(mg/l
)
3.9
2
0.5
4
4.6
4
3.7
8
3.2
8
3.0
6
4.2
8
3.8
5
4.2
1
4.2
8
5.9
0
4.3
2
4.1
4
15.7
0
13.1
4
5.2
6
5.1
5
4.9
3
Cl−
(m
g/l
)
715.3
3
2195.6
8
171.4
7
160.1
1
137.3
9
508.0
1
1886.1
2
752.2
5
159.7
5
140.8
3
201.2
9
144.4
9
317.3
7
1460.4
7
245.6
6
162.5
9
1086.3
0
236.4
3
HC
O3−
(mg/l
)
493.4
9
827.7
7
267.7
9
301.9
5
303.1
7
558.1
5
409.3
1
848.5
1
514.8
4
418.4
6
458.7
2
345.2
6
458.7
2
525.8
2
395.2
8
470.9
2
362.3
4
317.2
0
SO
42−
(mg/l
)
107.5
2
553.4
4
59.6
4
68.7
6
68.7
6
144.0
0
367.4
4
73.3
2
107.8
8
146.6
4
141.1
2
221.2
8
153.4
8
96.4
8
199.0
8
98.7
6
130.6
8
153.4
8
NO
3−
(mg/l
)
18
2.2
8
14
4.9
6
24
7.8
8
12
6.7
3
18
6.0
0
24
3.0
4
10
0.6
9
17
8.9
3
12
8.7
1
17
4.5
9
28
4.0
8
16
0.0
8
50
.10
13
0.9
4
24
3.7
8
61
.13
72
.42
72
.79
Wel
l n
o.
w3
7
w3
8
w3
9
w4
0
w4
1
w4
2
w4
3
w4
4
w4
5
w4
6
w4
7
w4
8
w4
9
w5
0
w5
1
w5
2
w5
3
w5
4
Table 4: WHO–2004 standards for drinking-water
Parameters pH EC TDS Ca²+ Mg²
+ Na
+
Range 6.5 – 8.5 500 –
1500
µs/cm
500 –
1500
mg/l
70 – 200
mg/l
50 – 150
mg/l
≤ 200
mg/l
AL QAWATI et al., JMES, 2018, 9 (1), pp. 293-304 300
Table 5: WHO–2004 standards for drinking-water
Parameters K+ NH4
+ NO3
− Cl
− SO4
2− HCO3
−
Range ≤ 12
mg/l
≤ 0.5
mg/l
≤ 50
mg/l
≤ 250
mg/l
≤ 500
mg/l.
≤ 400
mg/l
4.3. Nitrates and Ammonium
High NH4+ and NO3
− concentration in the groundwater might be due to the overuse of the agricultural
nitrogenous fertilizers, nitrification and the decomposition of nitrogenous organic pollutants which have been
derived from domestic or industrial waste. For example, the urea ((NH2)2CO) hydrolysis in soil-water can give
NH4+ according to the following reaction:
(NH2)2CO + H2O + 2H+ → 2NH4
+ + CO2 ........................................................................ (10)
Superficial water contaminated by NH4+ and NO3
− may infiltrate through soil into aquifer. Also, the
natural supply of soil with mineral nitrogen is an additional source of nitrogen which can increase the risk of
pollution of groundwater with nitrates [17]. High nitrate levels in water used in mixing infant formula have
been associated with risk for methemoglobinemia (blue-baby syndrome) in infants under 6 months of age,
although other health factors such as diarrhea and respiratory disease have also been implicated [18 , 19].
According to WHO standards for drinking-water (Table 5), the maximum recommended value of NO3−
is 50 mg/l and 0.5 mg/l of NH4+.
The recorded values (Tables 1, 2, 3 & Figs. 2, 3) of the collected samples have shown that NO3− in
water varied ranging between 5.45 mg/l and 239.51 mg/l, with an average of 121.29 mg/l.
The NH4+ concentrations in 96% of wells and NO3
− concentrations in 78% of them were higher than the
WHO standards. This reflects a high rate of nitrogenous pollution of the region's groundwater as a result of the
organic decomposition, excessive use of fertilizers and pesticides in agriculture, domestic and industrial waste
water.
It has been concluded that groundwater in this region is not potable. It needs any treatment (biological
denitrification or ion exchange) to reduce nitrates and ammonium.
Figure 2: Box and Whisker plots of some physical and chemical parameters
AL QAWATI et al., JMES, 2018, 9 (1), pp. 293-304 301
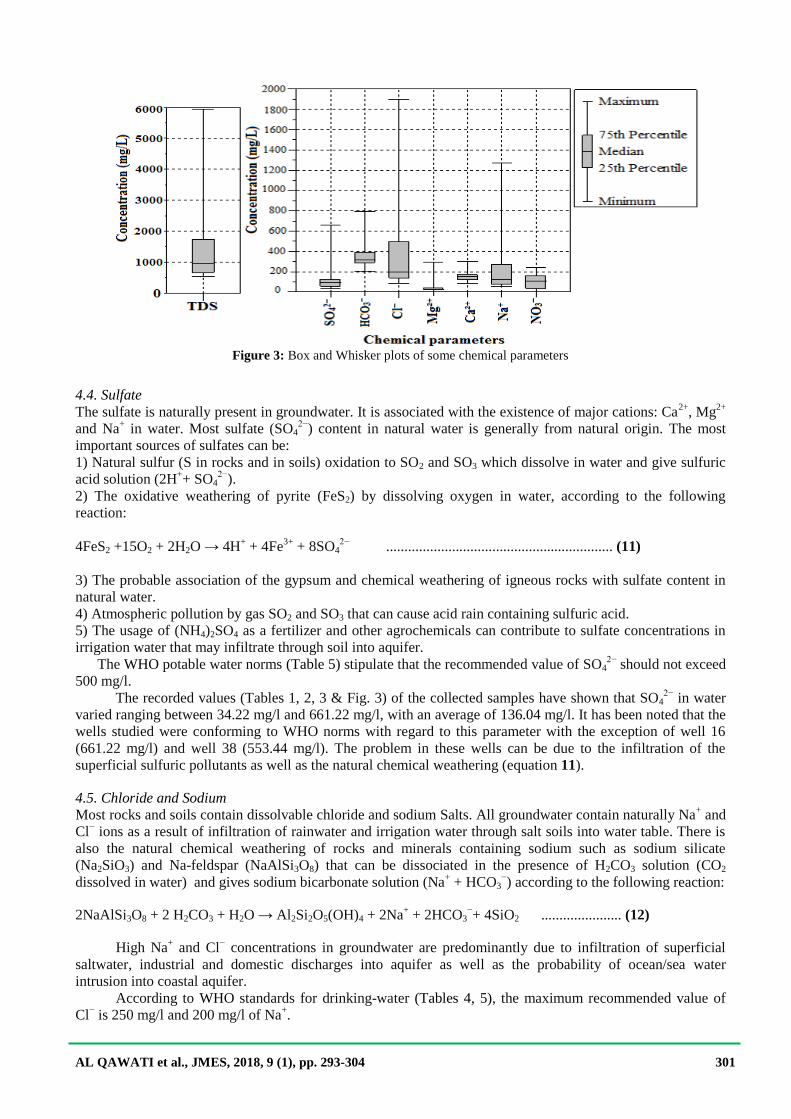
Figure 3: Box and Whisker plots of some chemical parameters
4.4. Sulfate
The sulfate is naturally present in groundwater. It is associated with the existence of major cations: Ca2+
, Mg2+
and Na+ in water. Most sulfate (SO4
2−) content in natural water is generally from natural origin. The most
important sources of sulfates can be:
1) Natural sulfur (S in rocks and in soils) oxidation to SO2 and SO3 which dissolve in water and give sulfuric
acid solution (2H++ SO4
2−).
2) The oxidative weathering of pyrite (FeS2) by dissolving oxygen in water, according to the following
reaction:
4FeS2 +15O2 + 2H2O → 4H+ + 4Fe
3+ + 8SO4
2− .............................................................. (11)
3) The probable association of the gypsum and chemical weathering of igneous rocks with sulfate content in
natural water.
4) Atmospheric pollution by gas SO2 and SO3 that can cause acid rain containing sulfuric acid.
5) The usage of (NH4)2SO4 as a fertilizer and other agrochemicals can contribute to sulfate concentrations in
irrigation water that may infiltrate through soil into aquifer.
The WHO potable water norms (Table 5) stipulate that the recommended value of SO42−
should not exceed
500 mg/l.
The recorded values (Tables 1, 2, 3 & Fig. 3) of the collected samples have shown that SO42−
in water
varied ranging between 34.22 mg/l and 661.22 mg/l, with an average of 136.04 mg/l. It has been noted that the
wells studied were conforming to WHO norms with regard to this parameter with the exception of well 16
(661.22 mg/l) and well 38 (553.44 mg/l). The problem in these wells can be due to the infiltration of the
superficial sulfuric pollutants as well as the natural chemical weathering (equation 11).
4.5. Chloride and Sodium
Most rocks and soils contain dissolvable chloride and sodium Salts. All groundwater contain naturally Na+ and
Cl− ions as a result of infiltration of rainwater and irrigation water through salt soils into water table. There is
also the natural chemical weathering of rocks and minerals containing sodium such as sodium silicate
(Na2SiO3) and Na-feldspar (NaAlSi3O8) that can be dissociated in the presence of H2CO3 solution (CO2
dissolved in water) and gives sodium bicarbonate solution (Na+ + HCO3
−) according to the following reaction:
2NaAlSi3O8 + 2 H2CO3 + H2O → Al2Si2O5(OH)4 + 2Na+ + 2HCO3
−+ 4SiO2 ...................... (12)
High Na+ and Cl
− concentrations in groundwater are predominantly due to infiltration of superficial
saltwater, industrial and domestic discharges into aquifer as well as the probability of ocean/sea water
intrusion into coastal aquifer.
According to WHO standards for drinking-water (Tables 4, 5), the maximum recommended value of
Cl− is 250 mg/l and 200 mg/l of Na
+.
AL QAWATI et al., JMES, 2018, 9 (1), pp. 293-304 302
The recorded values (Tables 1, 2, 3 & Fig. 3) of the collected samples have shown that Cl− in water
varied ranging between 87.07 mg/l and 1900.11 mg/l, with an average of 473.68 mg/l, while Na+ was varied
between 58.56 mg/l and 1274.91 mg/l, with an average of 274.99 mg/l.
The results obtained have shown that the Cl− concentration in 46% of wells and Na
+ concentration in
31% of them was higher than the WHO standards. It has been noted that the chloride and sodium hazard in 8
wells (w6, w9, w16, w21, w28, w38, w43, w50) was very high. This indicates a high rate of mineralization in
the water. The elevated concentrations of Cl− and NO3
− in groundwater are attributed to anthropogenic sources
[20]. The usage of KCl or NH4Cl as a fertilizer has probably contributed to high chloride concentrations in
agricultural soil. In general, most of the Cl− and Na
+ are from wastewater that has probably infiltrated through
the soil into the water table. This is not the only reason; there is also the chemical properties of the aquifer’s
geology through which it flows and the probable infiltration of saltwater from the Atlantic Ocean or Sebou
River into the water table of Sidi Allal Tazi region.
4.6. Potassium
Potassium is an essential element for humans, but it often occurs in groundwater at levels well below those of
health concern. Most potassium content in natural water might be due to the natural chemical weathering and
erosion of rocks and minerals containing potassium such as K-feldspar (KAlSi3O8) that can be dissociated in
presence H2CO3 solution (CO2 dissolved in water) and gives potassium bicarbonate solution (K+ + HCO3
−)
according to the following reaction:
2KAlSi3O8 + 2 H2CO3 + H2O → Al2Si2O5(OH)4 + 2K+ + 2HCO3
− + 4SiO2 ......................... (13)
According to WHO standards (Table 5), the maximum recommended value of K+ in potable water is 12
mg/l. The registered values (Tables 1, 2, 3 & Fig. 2) of K+ were varied between 3.60 mg/l and 11.58 mg/l with
an average of 7.14 mg/l. The results have shown that potassium content in the wells studied is less than the
desirable level for drinking with the exception of well 16 (11.58 mg/l), and well 38 (11.23 mg/l). High
potassium concentrations in groundwater are probably due to the infiltration of irrigation water containing
potassium as a fertilizer and ocean/sea water intrusion into coastal aquifer as well as the natural chemical
weathering (equation 13).
4.7. Calcium and Magnesium
Calcium and magnesium are present in all groundwater. Most of their concentrations in natural water might be
due to the chemical weathering and the erosion of rocks and minerals containing calcium and magnesium,
such as limestone, magnetite, aragonite, calcite (CaCO3), dolomite (CaMg(CO3)2), magnesia alba (MgCO3),
gypsum (CaSO4·2H2O), apatite (Ca5(PO4)3X (X=OH, F, Cl, Br)) and fluorite (CaF2), that are intensified in the
presence of certain acids such as H2CO3, H2SO4 and HNO3 which can come from the atmosphere in the form
of acid rains due to environmental pollution by CO2, SO2 and NO2. For example, the calcite (CaCO3) can be
dissolved in the presence of CO2 and H2O according to the following reaction:
CaCO3 + CO2 + H2O → Ca2+
+ 2HCO3− ........................................................................ (14)
Also the dolomite (CaMg(CO3)2) can be dissolved according to the following reaction:
CaMg(CO3)2 + 2CO2 + 2H2O → Ca2+
+ Mg²+ + 4 HCO3
− ............................................. (15)
According to WHO standards for drinking-water (Table 4), the optimal concentration of Ca2+
is 70–
200 mg/l and that of Mg2+
is 50 – 150 mg/l.
The results obtained (Tables 1, 2, 3 & Fig. 3) of the collected samples have shown that Ca2+
in water
varied ranging between 89.15 mg/l and 300.75 mg/l, with an average of 163.34 mg/l, while Mg2+
was varied
between 5.87 mg/l and 293.33 mg/l, with an average of 42.06 mg/l.
It has been noted that the wells studied were conforming to WHO norms with regard to these
parameters with the exception of wells: w6, w20, w21, w28, w42, w43, w47, w50 (High Ca2+
concentration),
w16 and w38 (High Mg2+
concentration). The natural chemical weathering of rocks and minerals (equations
14, 15) can explain the high Ca2+
and Mg2+
content in groundwater as well as the infiltration probability of
superficial saltwater and ocean/sea water intrusion into coastal aquifer.
AL QAWATI et al., JMES, 2018, 9 (1), pp. 293-304 303
4.8. Carbonate and Bicarbonate
Most carbonate and bicarbonate content in natural water is produced by CO2 dissolved in the form of H2CO3
acid that can cause dissolution of calcite (equation 14).
In addition to that, the dissolution of SO2 or SO3 in water give sulfuric acid solution (H2SO4) that can
react with calcite (CaCO3) and release bicarbonate ions according to the following equation:
H2SO4 + CaCO3 + 2H2O → CaSO4·2H2O (gypsum) + H+ + HCO3
− .............................. (16)
According to WHO standards (Table 5), the maximum value of HCO3− in potable water is 400 mg/l.
The registered values (Tables 1, 2, 3 & Fig. 2, 3) of HCO3− were varied between 206.31 mg/l and 793.13 mg/l
with an average of 396.64 mg/l. The results have shown that 63.33 % of the studied wells conform to WHO
standards, 20 % of them were relatively close to those standards, whereas 16.67% (w16, w20, w22, w38, w42,
w44, w45, w50 and w52) contained high HCO3− concentration. High bicarbonate concentrations in
groundwater are predominantly due to CO2 dissolution which can have been derived from the decomposition
of organic pollutants and pollution of atmosphere with CO2 which can cause acid rain containing H2CO3 that
can infiltrate through soil into aquifer as well as the natural chemical weathering (equations 14, 15, 16). In
general, it can be said that the quality of water in the study region according to this parameter is acceptable to
human consumption.
Hydrogeochemistry The major ionic composition (Ca²
+, Mg²
+, Na
+, K
+, Cl
−, CO3
2−, HCO3
−, SO4
2−) of the groundwater studied was
plotted on a Piper diagram (Fig. 4) as percents on two triangles (cations & anions) and Central parallelogram
(combination).
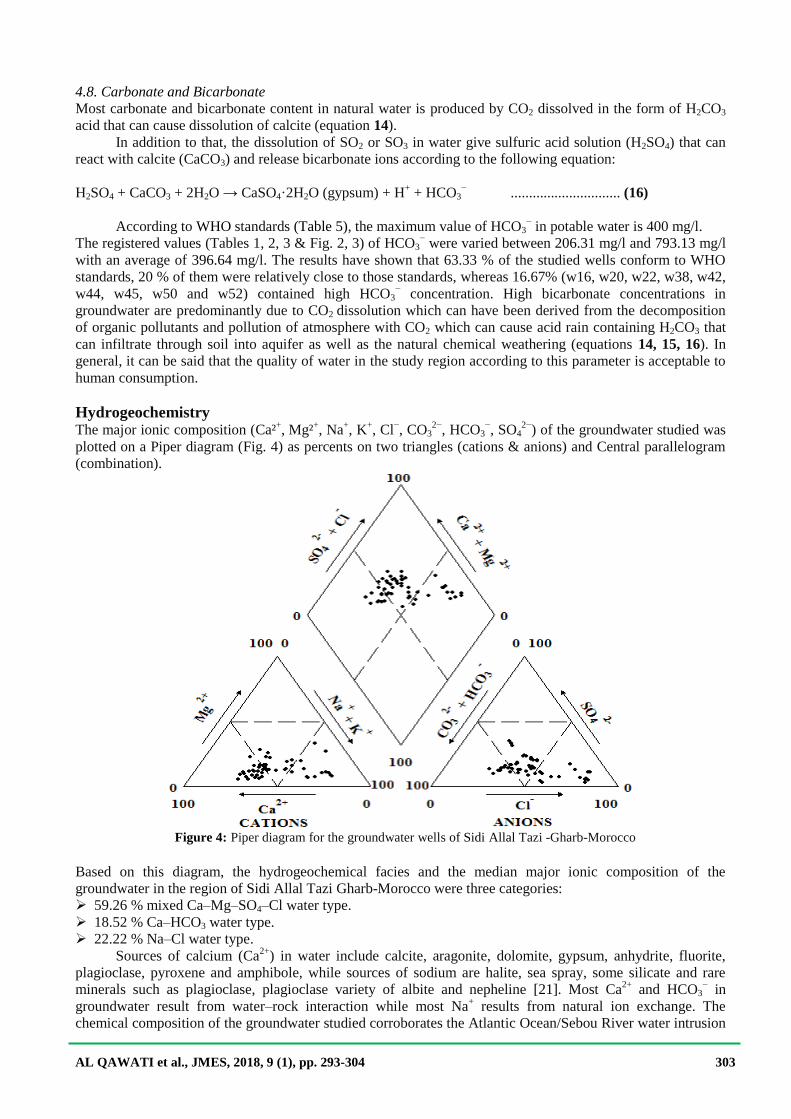
Figure 4: Piper diagram for the groundwater wells of Sidi Allal Tazi -Gharb-Morocco
Based on this diagram, the hydrogeochemical facies and the median major ionic composition of the
groundwater in the region of Sidi Allal Tazi Gharb-Morocco were three categories:
59.26 % mixed Ca–Mg–SO4–Cl water type.
18.52 % Ca–HCO3 water type.
22.22 % Na–Cl water type. Sources of calcium (Ca
2+) in water include calcite, aragonite, dolomite, gypsum, anhydrite, fluorite,
plagioclase, pyroxene and amphibole, while sources of sodium are halite, sea spray, some silicate and rare
minerals such as plagioclase, plagioclase variety of albite and nepheline [21]. Most Ca2+
and HCO3− in
groundwater result from water–rock interaction while most Na+ results from natural ion exchange. The
chemical composition of the groundwater studied corroborates the Atlantic Ocean/Sebou River water intrusion
AL QAWATI et al., JMES, 2018, 9 (1), pp. 293-304 304
(sources of Na+ and Cl
−) into Allal Tazi aquifer and the chemical weathering (water–rock interaction (sources
of Ca²+, Mg²
+ and HCO3
−)) (equations 14, 15, 16). The Piper diagram (Fig.4) showed approximately the same
major ionic composition with the exception of a few wells, indicating the groundwater of the study region has
approximately the same geochemical evolution.
Conclusion
Natural occurrences and hydrogeochemical processes are not the only factors determining groundwater
quality; human activities also play an important role. The results of this study have shown that the
concentration of ammonium (NH4+) in 96% of wells and nitrate (NO3
-) in 78% of them are much higher than
the WHO standards. This indicates that there is nitrogenous pollution as a result of the degradation of
industrial and domestic organic wastes and the excessive use of fertilizers. The electric conductivity (EC) in
50% of wells, concentration of chloride (Cl−) in 46% and concentration of sodium (Na
+) in 31% of them are
relatively higher than WHO standards. This indicates the existence of high level of mineralization in
groundwater of the study region due to the infiltration of the superficial pollutants as well as the natural
weathering reactions. High salinity indicates also the probability of water infiltration from the Atlantic Ocean
and the Sebou River into the water table of the coastal region. The study has also revealed that other
parameters are approximately in concord with the WHO standards. It showed that the dominant type of water
in the study region is mixed Ca–Mg–SO4–Cl (calcite, dolomite and gypsum aquifer). It is concluded that the
groundwater of the study region has approximately the same geochemical evolution and medium quality for
drinking. The chemical pollutants in an aquifer may be diluted by mixing with other unpolluted or using
physicochemical treatment.
References
1. G. Hanrahan, Key Concepts in Environmental Chemistry, 10.1016/B978-0-12-374993-2.10004-4 (2012) 109-
152.
2. B.L. Morris, A.R.L. Lawrence, P.J.C. Chilton, B. Adams, R.C. Calow, B.A. Klinck, Early Warning and
Assessment Report Series, (2003) RS. 03-3.
3. A. Zaporozec, Ground Water, (1972) 10: 32–43.
4. M. Ghalit, E.B. Yousfi, M. Zouhairi, E. Gharibi, J-D. Taupin, Mor. J. Chem. 5 (2) (2017) 272-284.
5. M. Pitchard, T. Mkandawire, T.G. Óneill, Phys. Chem. Earth. 32 (2007) 1167–1177.
6. M. Pitchard, T. Mkandawire, T.G. Óneill, 8th WATERNET /WARFSA/GWP-P-SA Symposium, Zambia, 1–3
Nov. (2008).
7. N.A.G. Moyo, Physics and Chemistry of the Earth, 66 (2013) 27–32.
8. F.E. Allison, Adv. Agron. 18 (1996) 219-258.
9. S. Paramasivam, A.K. Alva, A. Fares, K.S. Sajwan, J. Environ. Qual. 31 (2002) 671-681.
10. V. Phogat, M.A. Skewes, J.W. Cox, J. Alam, G. Grigson, J. Simunek, Water. Manag. 127 (2013) 74-84.
11. N.N. Kourgialas, G.P. Karatzas, G. Marianou, Glob. Nest. J. 17 (1) (2014) 72-81.
12. N.N. Kourgialas, P.G. Karatzas, C.G. Koubouris, Journal of Environmental Management, 189 (2017) 150-
159.
13. N. El Khodrani, A. Zouahri, A. Douaik, S. Omrania, H. Iaaich, A. Yahyaoui, M. Fekhaoui, J. Mater.
Environ. Sci., 8 (7) (2017) 2339-2346.
14. ASTM, Annual book of ASTM standards Part 31 Philadelphia, PA, ASTM, (1976) p 178.
15. APHA, Standard methods for the examination of water and wastewater, (1989) 17th ed Washington USA.
16. S.A. Hassanien, Environ. Earth. Sci. (2017) 76-147.
17. N. Aghzar, H. Berdai, A. Bellouti, B. Soudi, Rev. Sci. Eau. (2002) 459-492.
18. M.H. Ward, T.M. deKok, P. Levallois, J. Brender, G. Gulis, B.T. Nolan, et al., Environ. Health. Perspect.
113 (2005) 1607–1614.
19. B. Jo Ann, B. Libra, P. Weyer, S. Heathcote, D. Kolpin, S.P. Thorne, M. Wichman, Environmental Health
Perspectives, 115:2: (2007) 308-312.
20. W. Bajjali, Hydrogeol. J. 14 (2006) 180-191.
21. S.A. Arabi, I.I. Funtua, S.A. Alagbe, P. Zabosrki, B.B.M. Dewu, Journal of American Science, 6(12) (2010)
664–672.
(2018) ; http://www.jmaterenvironsci.com