Embed Size (px)
Citation preview
BioMed CentralBMC Biochemistry
ss
Open AcceResearch articleMolecular cloning, gene structure and expression profile of two mouse peroxisomal 3-ketoacyl-CoA thiolase genesGrégory Chevillard1, Marie-Claude Clémencet1, Philippe Etienne1, Pascal Martin2, Thierry Pineau2, Norbert Latruffe1 and Valérie Nicolas-Francès*1Address: 1Laboratoire de Biologie Moléculaire et Cellulaire (GDR-CNRS n°2583), Université de Bourgogne, 6 Bd Gabriel, 21000 Dijon, France and 2Laboratoire de Pharmacologie et Toxicologie, INRA, BP 3, 31931 Cedex 09 Toulouse, France
Email: Grégory Chevillard - [email protected]; Marie-Claude Clémencet - [email protected]; Philippe Etienne - [email protected]; Pascal Martin - [email protected]; Thierry Pineau - [email protected]; Norbert Latruffe - [email protected]; Valérie Nicolas-Francès* - [email protected]
* Corresponding author
AbstractBackground: In rats, two peroxisomal 3-ketoacyl-CoA thiolase genes (A and B) have been cloned,whereas only one thiolase gene is found in humans. The aim of this study was thus to clone thedifferent mouse thiolase genes in order to study both their tissue expression and their associatedenzymatic activity.
Results: In this study, we cloned and characterized two mouse peroxisomal 3-ketoacyl-CoA thiolasegenes (termed thiolase A and B). Both thiolase A and B genes contain 12 exons and 11 introns. UsingRNA extracted from mouse liver, we cloned the two corresponding cDNAs. Thiolase A and BcDNAs possess an open reading frame of 1272 nucleotides encoding a protein of 424 amino acids.In the coding sequence, the two thiolase genes exhibited ≈97% nucleotide sequence identity and≈96% identity at the amino acid level. The tissue-specific expression of the two peroxisomal 3-ketoacyl-CoA thiolase genes was studied in mice. Thiolase A mRNA was mainly expressed in liver andintestine, while thiolase B mRNA essentially exhibited hepatic expression and weaker levels inkidney, intestine and white adipose tissue. Thiolase A and B expressions in the other tissues suchas brain or muscle were very low though these tissues were chiefly involved in peroxisomaldisorders. At the enzymatic level, thiolase activity was detected in liver, kidney, intestine and whiteadipose tissue but no significant difference was observed between these four tissues. Moreover,thiolase A and B genes were differently induced in liver of mice treated with fenofibrate.
Conclusion: Two mouse thiolase genes and cDNAs were cloned. Their corresponding transcriptsare mostly expressed in the liver of mice and are differently induced by fenofibrate.
BackgroundIn eukaryotic cells, fatty acyl-CoA β-oxidation systems aremainly located in two organelles, peroxisomes and mito-chondria. The major difference between mitochondrial
and peroxisomal β-oxidations is their substrate specificity:mitochondria mainly oxidize short, medium, and mostlong chain fatty acids, while peroxisomes preferentially
Published: 25 March 2004
BMC Biochemistry 2004, 5:3
Received: 10 October 2003Accepted: 25 March 2004
This article is available from: http://www.biomedcentral.com/1471-2091/5/3
© 2004 Chevillard et al; licensee BioMed Central Ltd. This is an Open Access article: verbatim copying and redistribution of this article are permitted in all media for any purpose, provided this notice is preserved along with the article's original URL.
Page 1 of 13(page number not for citation purposes)
BMC Biochemistry 2004, 5 http://www.biomedcentral.com/1471-2091/5/3
oxidize very long chain fatty acids and branched-chainfatty acids [1].
In rodents, two distinct peroxisomal β-oxidation path-ways are found to metabolize either straight-chain fattyacids [2,3] or branched-chain fatty acids [4]. Each path-way contains its own enzymes encoded by different genes.Straight-chain fatty acyl-CoAs are catabolized by fattyacyl-CoA oxidase (AOX), peroxisomal L-3-hydroxyacyl-CoA hydratase/L-3-hydroxyacyl-CoA dehydrogenase(bifunctional enzyme: L-PBE) and peroxisomal 3-ketoa-cyl-CoA thiolase (PTL). The enzymes involved in thebranched-chain fatty acids pathway include branched-chain fatty acyl-CoA oxidase, peroxisomal D-3-hydroxya-cyl-CoA hydratase/D-3-hydroxyacyl-CoA dehydrogenase(bifunctional enzyme: D-PBE) and sterol carrier protein2/3-ketoacyl-CoA thiolase (SCP2 /thiolase) also namedsterol carrier protein x (SCPx). Humans differ since bothvery long chain and branched-fatty acids are degraded byD-PBE [5]. L-PBE might not be required for these degrada-tions. Very long chain fatty acids seem to be degraded byPTL as well as by SCPx.
Administration of peroxisome proliferators to rodentsresults in peroxisomal proliferation and induction of thethree peroxisomal enzymes involved in the straight-chainfatty acid β-oxidation i.e. AOX, L-PBE and PTL. In rat liver,the level of these enzymes can be over 20 times as highafter treatment with di-(2-ethyl-hexyl)phthalate, a peroxi-some proliferator [6]. In contrast, a weak induction of theenzymes of the peroxisomal branched-chain fatty acidssystem is observed after treatment with clofibrate [7].
In the rat, peroxisomal 3-ketoacyl-CoA thiolase activity isencoded by two distinct genes: thiolase A and thiolase B[8,9]. The aim of this study was to clone the mouse thiolasegenes in order to study the tissue expression and associ-ated enzymatic activity. This work will lead to furtherstudy of the regulation of their corresponding transcripts,the functionality of the thiolase promoters and the identi-fication of the response elements implicated in theirregulation.
We cloned and characterized two mouse peroxisomal 3-ketoacyl-CoA thiolase genes and their correspondingcDNAs. The tissue distribution of their correspondingtranscripts is described in mice: peroxisomal thiolase A andB transcripts are mainly expressed in liver [preliminaryresults, [10]]. With the aim of following gene expressionmain steps, this study was undertaken at the mRNA andenzymatic levels.
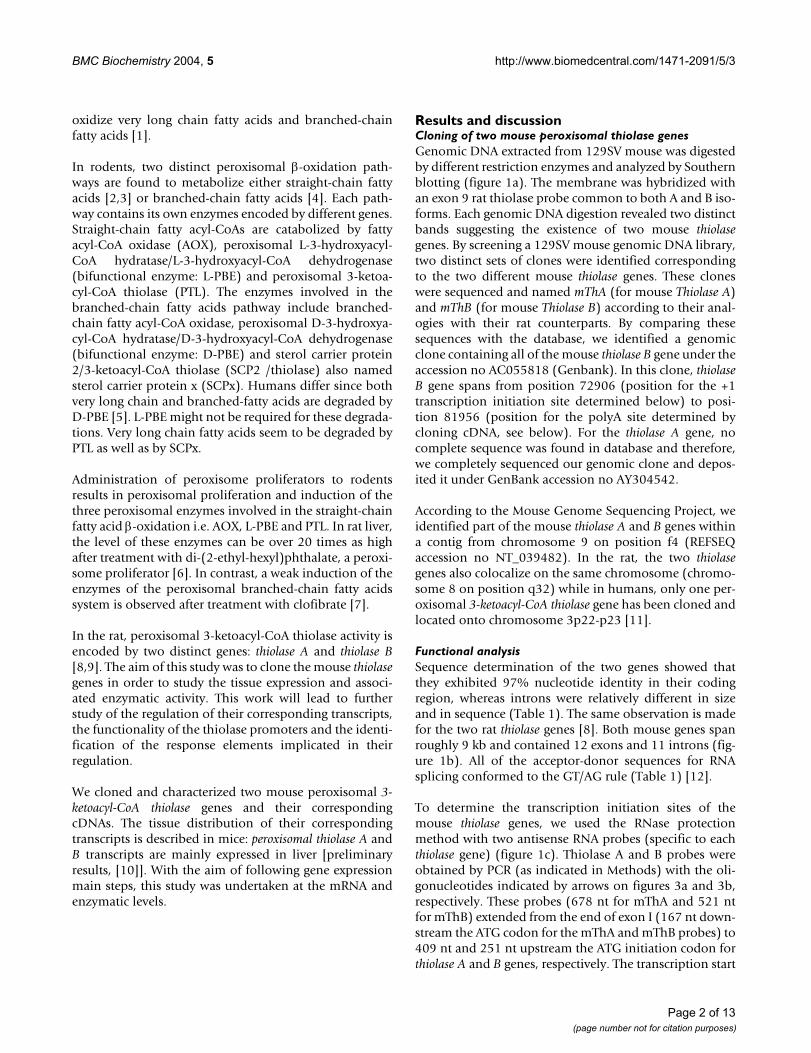
Results and discussionCloning of two mouse peroxisomal thiolase genesGenomic DNA extracted from 129SV mouse was digestedby different restriction enzymes and analyzed by Southernblotting (figure 1a). The membrane was hybridized withan exon 9 rat thiolase probe common to both A and B iso-forms. Each genomic DNA digestion revealed two distinctbands suggesting the existence of two mouse thiolasegenes. By screening a 129SV mouse genomic DNA library,two distinct sets of clones were identified correspondingto the two different mouse thiolase genes. These cloneswere sequenced and named mThA (for mouse Thiolase A)and mThB (for mouse Thiolase B) according to their anal-ogies with their rat counterparts. By comparing thesesequences with the database, we identified a genomicclone containing all of the mouse thiolase B gene under theaccession no AC055818 (Genbank). In this clone, thiolaseB gene spans from position 72906 (position for the +1transcription initiation site determined below) to posi-tion 81956 (position for the polyA site determined bycloning cDNA, see below). For the thiolase A gene, nocomplete sequence was found in database and therefore,we completely sequenced our genomic clone and depos-ited it under GenBank accession no AY304542.
According to the Mouse Genome Sequencing Project, weidentified part of the mouse thiolase A and B genes withina contig from chromosome 9 on position f4 (REFSEQaccession no NT_039482). In the rat, the two thiolasegenes also colocalize on the same chromosome (chromo-some 8 on position q32) while in humans, only one per-oxisomal 3-ketoacyl-CoA thiolase gene has been cloned andlocated onto chromosome 3p22-p23 [11].
Functional analysisSequence determination of the two genes showed thatthey exhibited 97% nucleotide identity in their codingregion, whereas introns were relatively different in sizeand in sequence (Table 1). The same observation is madefor the two rat thiolase genes [8]. Both mouse genes spanroughly 9 kb and contained 12 exons and 11 introns (fig-ure 1b). All of the acceptor-donor sequences for RNAsplicing conformed to the GT/AG rule (Table 1) [12].
To determine the transcription initiation sites of themouse thiolase genes, we used the RNase protectionmethod with two antisense RNA probes (specific to eachthiolase gene) (figure 1c). Thiolase A and B probes wereobtained by PCR (as indicated in Methods) with the oli-gonucleotides indicated by arrows on figures 3a and 3b,respectively. These probes (678 nt for mThA and 521 ntfor mThB) extended from the end of exon I (167 nt down-stream the ATG codon for the mThA and mThB probes) to409 nt and 251 nt upstream the ATG initiation codon forthiolase A and B genes, respectively. The transcription start
Page 2 of 13(page number not for citation purposes)
BMC Biochemistry 2004, 5 http://www.biomedcentral.com/1471-2091/5/3
sites were determined with liver RNA extracted from mice.The thiolase A probe protected three fragments of 388 nt,398 nt and 431 nt (figure 1c, lane 1) allowing to localizethree transcription initiation sites indicated by dots on fig-ures 1c and 3a. The most intense band corresponds to thelargest fragment. For thiolase B, five fragments were pro-tected: 267 nt, 270 nt, 284 nt, 288 nt and 298 nt (figure1c, lane 6). The 267 nt-protected fragment was consideredas the major transcription initiation site and designed as
+1 (figure 3b). As control, experiments using the sameRNase concentration were performed without RNAhybridization or using yeast tRNA alone for hybridizationshowing that the probes were totally degraded under ourexperimental conditions (data not shown).
Using RT-PCR on mouse liver RNA, we cloned twocDNAs, which were completely sequenced and corre-spond to the thiolase A and B genes. The 3' end of each thi-
Cloning of the two mouse peroxisomal thiolase genes and determination of the transcription initiation sites of each geneFigure 1Cloning of the two mouse peroxisomal thiolase genes and determination of the transcription initiation sites of each gene. a) Southern blot of a 129SV mouse genomic DNA digested with different restriction enzymes. Membrane was hybridized with an exon 9 rat thiolase 32P-labelled cDNA probe. A molecular weight marker DNA is indicated on the left in kb. b) Structural organizations of the mouse thiolase A and B genes: exon-intron distribution. Exons are numbered from I to XII. Translated sequences are shown as black boxes and untranslated sequences are open boxes. c) Identification of the transcrip-tion initiation sites of mouse thiolase A and B genes by ribonuclease protection assay. RNA probes corresponding to the genomic sequence extending upstream from the exon 1-intron 1 border (probes size: 678 nt and 521 nt for mThA and mThB, respectively) were hybridized to mouse liver RNA (lanes 1 and 6) and digested with RNAses. The protected fragments were analysed on a denaturing polyacrylamide gel (for details, see Methods). Lanes 2–5 and 7–10, DNA sequencing ladder from plas-mids containing +1 mThA and +1 mThB probes, respectively. Arrows and dots indicate the different bands corresponding to multiple transcription initiation sites.
23 kb
9.3 kb
6.5 kb
2.3 kb2 kb
Pst I
Hin
dII
I
Bam
HI
Eco
R I
mThA gene
I II III IV V VI VII VIIIIX XXI XII
9 kb
I II III IVV VI VII VIIIIX XXI XII
9 kb
mThB gene
1 kb
a) b)
AT GC
mThA1 2 3 54
atctaattcccctca
gaacggggtct
•
•
•
G A T C
mThB7 8 9 106
atataaaagacggatgggtaagacgtc
•
•
•
•
•
c)
Page 3 of 13(page number not for citation purposes)
BMC Biochemistry 2004, 5 http://www.biomedcentral.com/1471-2091/5/3
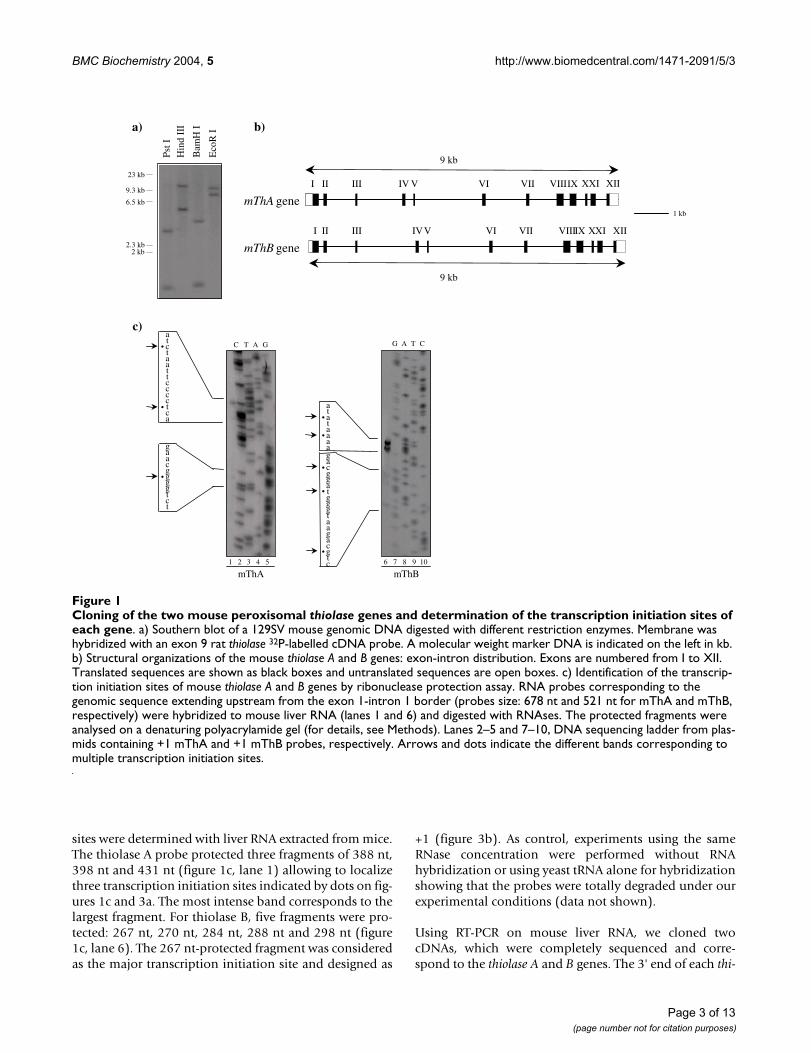
olase cDNA was determined by 3' RACE (for details seeMethods) and the 5' ends were deduced from RNaseprotection results (figure 1c). These complete cDNAs(1758 bp and 1667 bp for mThA and mThB, respectively)are presented in figure 2 and referenced in GenBank withaccession nos AY273811 (for mThA) and AY273812 (formThB).
The mouse thiolase A and B cDNAs displayed 85% nucle-otide identity (figure 2). The translation initiation site wasassigned to the first ATG triplet downstream of the major5' transcription initiation site. The nucleotide contextaround the ATG codon conformed to the consensussequence of the eukaryotic translation initiation signal[13]. This start codon allowed the translation of a precur-
sor protein of 424 aa, showing more than 95% proteinidentity with the rat peroxisomal thiolase proteins (refer-enced on ncbi server http://www.ncbi.nih.gov with acces-sion numbers: NP_036621 for rThA protein andBAA14107 for rThB protein). Then, these proteins werecleaved into two mature forms of 398 aa (figure 2).Whereas in rat genes the rThA mRNA encodes a precursorform 10 aa longer than the protein encoded by the rThBmRNA [9]. Nevertheless, after cleavage of the two precur-sor isoforms, the two thiolase A and B proteins had thesame size. The rThA mRNA contains two in frame ATG atits 5' end while mThA mRNA contains only one ATGcodon.
Table 1: Exon-intron boundaries of the mouse peroxisomal 3-ketoacyl-CoA thiolase A (upper panel) and B (lower panel) genesa.
Thiolase A
Exon Intron 5' Splice donor 3' Splice acceptor
Number Length (bp) Number Length (bp)
1 392 1 139 AGGCTTCAAGgtgaggcccc... ...cgccctgcagAACACCACCC2 94 2 804 ATCTCCGTGGgtgagctccc... ...ctatctacagGCAATGTTCT3 58 3 1392 AATTTCTGAGgtaactcttt... ...tctgtttcagCGGCATCCCA4 80 4 213 AACATTGCTGgtaagtggtg... ...tttattgcagGTGGCATCAG5 43 5 1961 TGGCCTGTGGgtaagatcgc... ...tcctccttagGGTGGAGTCC6 99 6 1161 CTCCTATGGGgtgagtgttc... ...tgtgcactagGATGACCTCG7 81 7 770 CCCAGCAGAAgtgagtgtgg... ...gtgctggcagGGCAGCAAGC8 191 8 149 ACCACGGCTGgtgagcgcag... ...cctcccttagGAAACTCCAG9 180 9 253 CAGAAAGCAGgtgaggtggc... ...ttgtctacagGGCTGACTGT10 56 10 82 TGCAAGTCAGgtgagcctgg... ...ttccttccagGCCGTCTACT11 146 11 320 GTGGCAGACGgtaaggctgc... ...cctttcccagGGCTTACGGC12 338
Thiolase B
Exon Intron 5' Splice donor 3' Splice acceptor
Number Length (bp) Number Length (bp)
1 268 1 139 CTGCTTCAAGgtgaggcccc... ...cgccctgcagGACACCACCC2 94 2 788 ATCTCCGTGGgtgagctccc... ...ctatccacagGCAATGTGCT3 58 3 1739 AGTTCCTGAGgtaatctctc... ...tctgtttcagCGGCATCCCA4 80 4 213 AACATTGCTGgtaagtggtg... ...tttattgcagGTGGCATCAG5 43 5 1755 TGGCCTGTGGgtaagatcgc... ...ttttcatcagGGTGGAGTCC6 99 6 911 TTCCTATGGGgtgagatatct... ...tgtgcactagGATAACTTCG7 81 7 1033 CCCAGCAGAAgtgagtgtgg... ...gtgctggcagGGCAGCAAGC8 191 8 149 ACCACGGCTGgtgagcgcgg... ...cctcccttagGAAACTCCAG9 180 9 253 CAGAAAGCAGgtgaggtggc... ...ttgtctacagGGCTGACTGT10 56 10 82 TGCAAGTCAGgtgagcctgg... ...ctccttccagGCCGTCTACT11 146 11 320 GTGGCAGACGgtaaggctgc... ...cctttcccagGGCTTACGGC12 371
a The sizes of the exons and introns, along with the exon-intron boundary sequences, are shown. Exon sequences are given in capitals and introns in lower case letters. Each intron begins with a GT (in bold) and ends with an AG (in bold).
Page 4 of 13(page number not for citation purposes)
BMC Biochemistry 2004, 5 http://www.biomedcentral.com/1471-2091/5/3
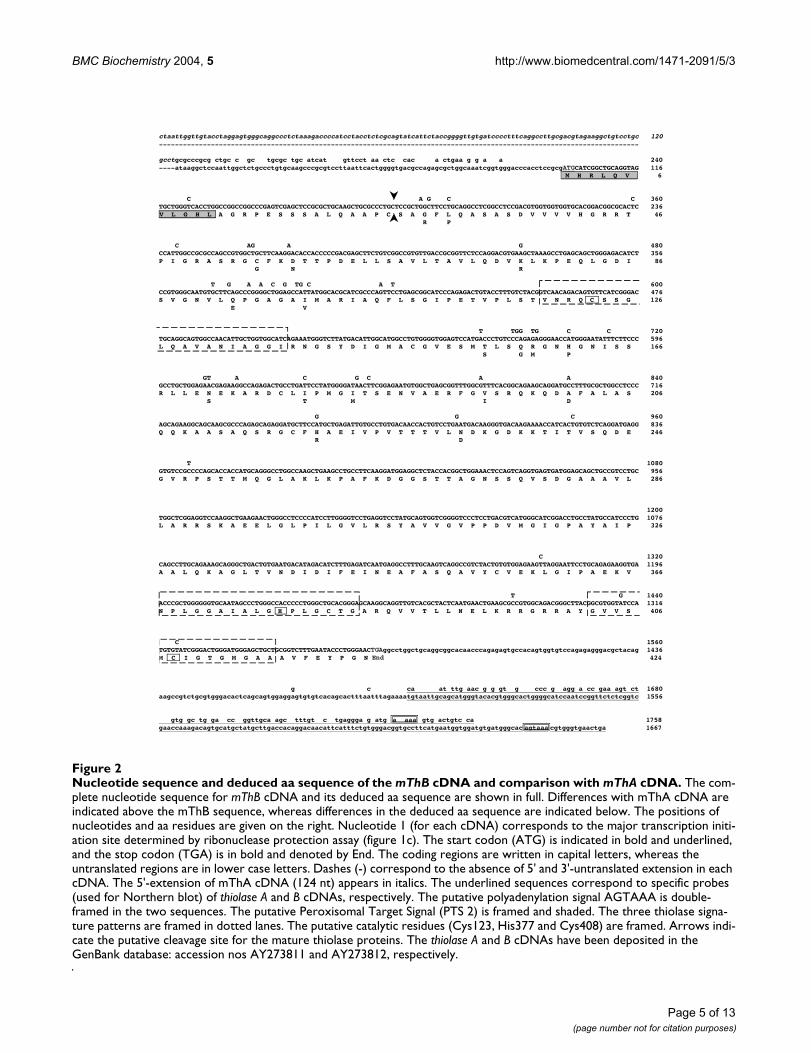
Nucleotide sequence and deduced aa sequence of the mThB cDNA and comparison with mThA cDNAFigure 2Nucleotide sequence and deduced aa sequence of the mThB cDNA and comparison with mThA cDNA. The com-plete nucleotide sequence for mThB cDNA and its deduced aa sequence are shown in full. Differences with mThA cDNA are indicated above the mThB sequence, whereas differences in the deduced aa sequence are indicated below. The positions of nucleotides and aa residues are given on the right. Nucleotide 1 (for each cDNA) corresponds to the major transcription initi-ation site determined by ribonuclease protection assay (figure 1c). The start codon (ATG) is indicated in bold and underlined, and the stop codon (TGA) is in bold and denoted by End. The coding regions are written in capital letters, whereas the untranslated regions are in lower case letters. Dashes (-) correspond to the absence of 5' and 3'-untranslated extension in each cDNA. The 5'-extension of mThA cDNA (124 nt) appears in italics. The underlined sequences correspond to specific probes (used for Northern blot) of thiolase A and B cDNAs, respectively. The putative polyadenylation signal AGTAAA is double-framed in the two sequences. The putative Peroxisomal Target Signal (PTS 2) is framed and shaded. The three thiolase signa-ture patterns are framed in dotted lanes. The putative catalytic residues (Cys123, His377 and Cys408) are framed. Arrows indi-cate the putative cleavage site for the mature thiolase proteins. The thiolase A and B cDNAs have been deposited in the GenBank database: accession nos AY273811 and AY273812, respectively.
ctaattggttgtacctaggagtgggcaggccctctaaagaccccatcctacctctcgcagtatcattctaccggggttgtgatcccctttcaggccttgcgacgtagaaggctgtcctgc 120------------------------------------------------------------------------------------------------------------------------
gcctgcgcccgcg ctgc c gc tgcgc tgc atcat gttcct aa ctc cac a ctgaa g g a a 240----ataaggctccaattggctctgccctgtgcaagcccgcgtccttaattcactggggtgacgccagagcgctggcaaatcggtgggacccacctccgcgATGCATCGGCTGCAGGTAG 116
M H R L Q V 6
C A G C C 360 TGCTGGGTCACCTGGCCGGCCGGCCCGAGTCGAGCTCCGCGCTGCAAGCTGCGCCCTGCTCCGCTGGCTTCCTGCAGGCCTCGGCCTCCGACGTGGTGGTGGTGCACGGACGGCGCACTC 236
V L G H L A G R P E S S S A L Q A A P C S A G F L Q A S A S D V V V V H G R R T 46R P
C AG A G 480 CCATTGGCCGCGCCAGCCGTGGCTGCTTCAAGGACACCACCCCCGACGAGCTTCTGTCGGCCGTGTTGACCGCGGTTCTCCAGGACGTGAAGCTAAAGCCTGAGCAGCTGGGAGACATCT 356 P I G R A S R G C F K D T T P D E L L S A V L T A V L Q D V K L K P E Q L G D I 86 G N R
T G A A C G TG C A T 600CCGTGGGCAATGTGCTTCAGCCCGGGGCTGGAGCCATTATGGCACGCATCGCCCAGTTCCTGAGCGGCATCCCAGAGACTGTACCTTTGTCTACGGTCAACAGACAGTGTTCATCGGGAC 476S V G N V L Q P G A G A I M A R I A Q F L S G I P E T V P L S T V N R Q C S S G 126
E V
T TGG TG C C 720 TGCAGGCAGTGGCCAACATTGCTGGTGGCATCAGAAATGGGTCTTATGACATTGGCATGGCCTGTGGGGTGGAGTCCATGACCCTGTCCCAGAGAGGGAACCATGGGAATATTTCTTCCC 596 L Q A V A N I A G G I R N G S Y D I G M A C G V E S M T L S Q R G N H G N I S S 166
S G M P
GT A C G C A A 840 GCCTGCTGGAGAACGAGAAGGCCAGAGACTGCCTGATTCCTATGGGGATAACTTCGGAGAATGTGGCTGAGCGGTTTGGCGTTTCACGGCAGAAGCAGGATGCCTTTGCGCTGGCCTCCC 716 R L L E N E K A R D C L I P M G I T S E N V A E R F G V S R Q K Q D A F A L A S 206 S T M I D
G G C 960 AGCAGAAGGCAGCAAGCGCCCAGAGCAGAGGATGCTTCCATGCTGAGATTGTGCCTGTGACAACCACTGTCCTGAATGACAAGGGTGACAAGAAAACCATCACTGTGTCTCAGGATGAGG 836 Q Q K A A S A Q S R G C F H A E I V P V T T T V L N D K G D K K T I T V S Q D E 246 R D
T 1080 GTGTCCGCCCCAGCACCACCATGCAGGGCCTGGCCAAGCTGAAGCCTGCCTTCAAGGATGGAGGCTCTACCACGGCTGGAAACTCCAGTCAGGTGAGTGATGGAGCAGCTGCCGTCCTGC 956 G V R P S T T M Q G L A K L K P A F K D G G S T T A G N S S Q V S D G A A A V L 286
1200 TGGCTCGGAGGTCCAAGGCTGAAGAACTGGGCCTCCCCATCCTTGGGGTCCTGAGGTCCTATGCAGTGGTCGGGGTCCCTCCTGACGTCATGGGCATCGGACCTGCCTATGCCATCCCTG 1076 L A R R S K A E E L G L P I L G V L R S Y A V V G V P P D V M G I G P A Y A I P 326
C 1320 CAGCCTTGCAGAAAGCAGGGCTGACTGTGAATGACATAGACATCTTTGAGATCAATGAGGCCTTTGCAAGTCAGGCCGTCTACTGTGTGGAGAAGTTAGGAATTCCTGCAGAGAAGGTGA 1196 A A L Q K A G L T V N D I D I F E I N E A F A S Q A V Y C V E K L G I P A E K V 366
T G 1440 ACCCGCTGGGGGGTGCAATAGCCCTGGGCCACCCCCTGGGCTGCACGGGAGCAAGGCAGGTTGTCACGCTACTCAATGAACTGAAGCGCCGTGGCAGACGGGCTTACGGCGTGGTATCCA 1316 N P L G G A I A L G H P L G C T G A R Q V V T L L N E L K R R G R R A Y G V V S 406
C 1560 TGTGTATCGGGACTGGGATGGGAGCTGCTGCGGTCTTTGAATACCCTGGGAACTGAggcctggctgcaggcggcacaacccagagagtgccacagtggtgtccagagagggacgctacag 1436 M C I G T G M G A A A V F E Y P G N End 424
g c ca at ttg aac g g gt g ccc g agg a cc gaa agt ct 1680 aagccgtctgcgtgggacactcagcagtggaggagtgtgtcacagcactttaatttagaaaatgtaattgcagcatgggtacacgtgggcactggggcatccaatccggttctctcggtc 1556
gtg gc tg ga cc ggttgca agc tttgt c tgaggga g atg a aaa gtg actgtc ca 1758gaaccaaagacagtgcatgctatgcttgaccacaggacaacattcatttctgtgggacggtgccttcatgaatggtggatgtgatgggcac agtaaa cgtgggtgaactga 1667
Page 5 of 13(page number not for citation purposes)
BMC Biochemistry 2004, 5 http://www.biomedcentral.com/1471-2091/5/3
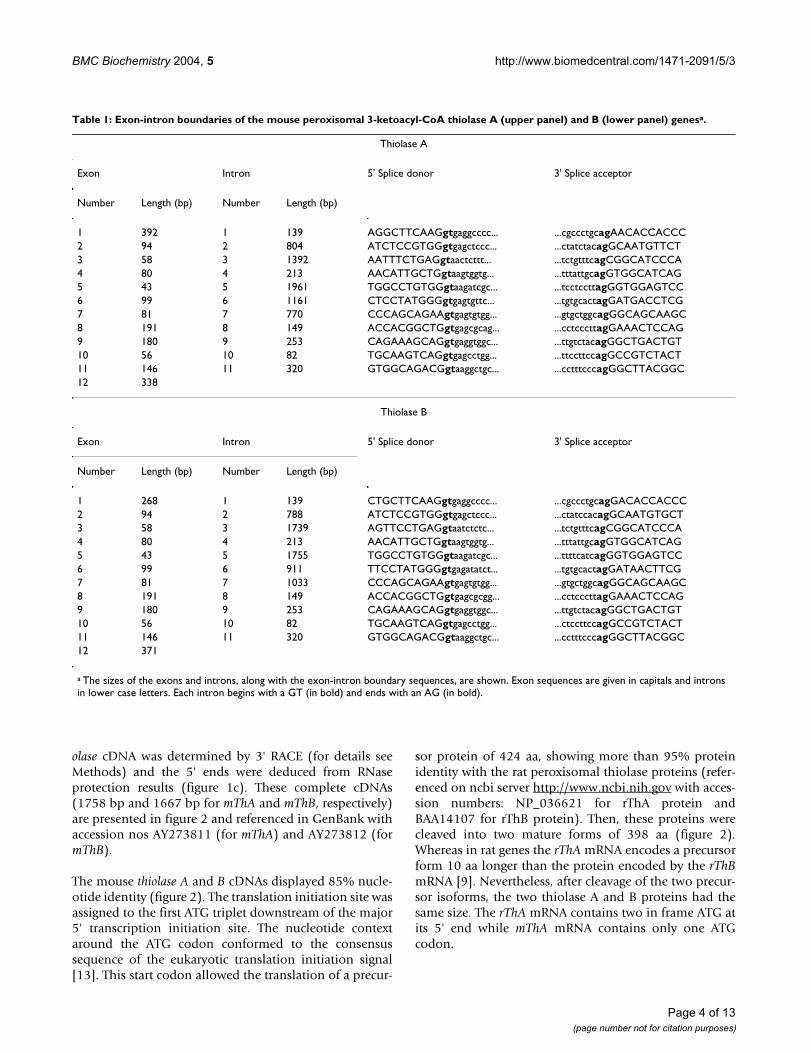
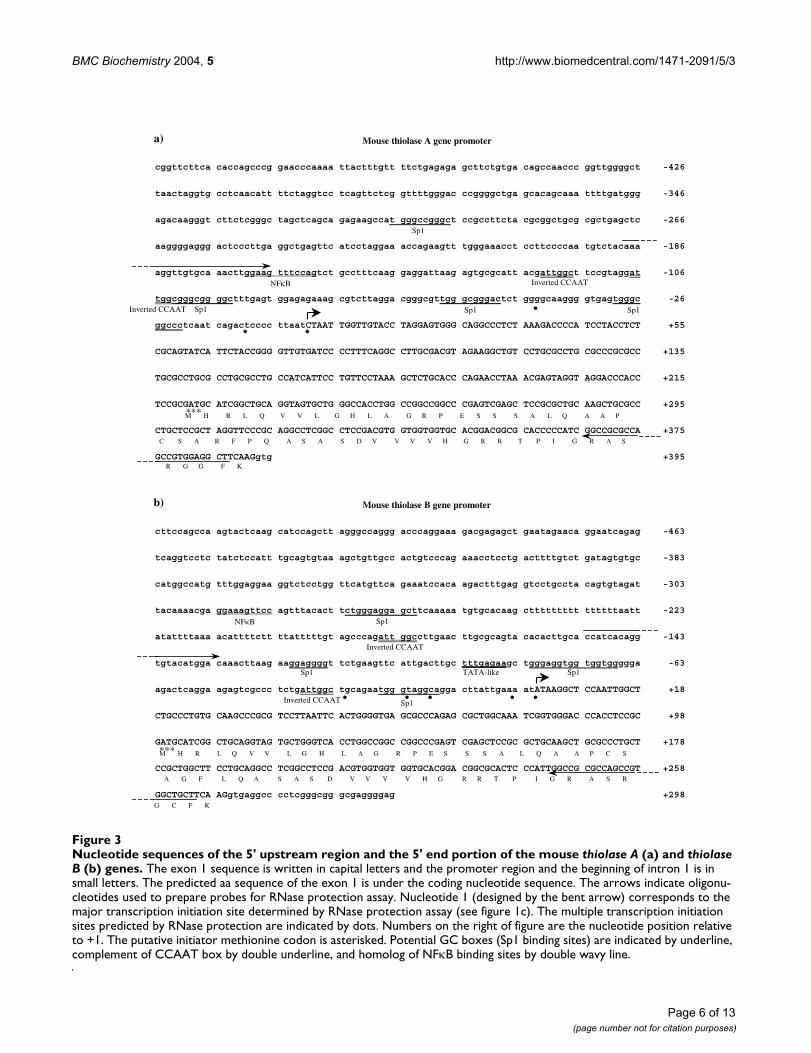
Nucleotide sequences of the 5' upstream region and the 5' end portion of the mouse thiolase A (a) and thiolase B (b) genesFigure 3Nucleotide sequences of the 5' upstream region and the 5' end portion of the mouse thiolase A (a) and thiolase B (b) genes. The exon 1 sequence is written in capital letters and the promoter region and the beginning of intron 1 is in small letters. The predicted aa sequence of the exon 1 is under the coding nucleotide sequence. The arrows indicate oligonu-cleotides used to prepare probes for RNase protection assay. Nucleotide 1 (designed by the bent arrow) corresponds to the major transcription initiation site determined by RNase protection assay (see figure 1c). The multiple transcription initiation sites predicted by RNase protection are indicated by dots. Numbers on the right of figure are the nucleotide position relative to +1. The putative initiator methionine codon is asterisked. Potential GC boxes (Sp1 binding sites) are indicated by underline, complement of CCAAT box by double underline, and homolog of NFκB binding sites by double wavy line.
Mouse thiolase A gene promoter
cggttcttca caccagcccg gaacccaaaa ttactttgtt ttctgagaga gcttctgtga cagccaaccc ggttggggct -426
taactaggtg cctcaacatt ttctaggtcc tcagttctcg gttttgggac ccggggctga gcacagcaaa ttttgatggg -346
agacaagggt cttctcgggc tagctcagca gagaagccat gggccgggct ccgccttcta cgcggctgcg cgctgagctc -266
aaggggaggg actcccttga ggctgagttc atcctaggaa accagaagtt tgggaaacct ccttccccaa tgtctacaaa -186
aggttgtgca aacttggaag tttccagtct gcctttcaag gaggattaag agtgcgcatt acgattggct tccgtaggat -106
tggcgggcgg ggctttgagt ggagagaaag cgtcttagga cgggcgttgg gcgggactct ggggcaaggg gtgagtgggc -26
ggccctcaat cagactcccc ttaatCTAAT TGGTTGTACC TAGGAGTGGG CAGGCCCTCT AAAGACCCCA TCCTACCTCT +55
CGCAGTATCA TTCTACCGGG GTTGTGATCC CCTTTCAGGC CTTGCGACGT AGAAGGCTGT CCTGCGCCTG CGCCCGCGCC +135
TGCGCCTGCG CCTGCGCCTG CCATCATTCC TGTTCCTAAA GCTCTGCACC CAGAACCTAA ACGAGTAGGT AGGACCCACC +215
TCCGCGATGC ATCGGCTGCA GGTAGTGCTG GGCCACCTGG CCGGCCGGCC CGAGTCGAGC TCCGCGCTGC AAGCTGCGCC +295
CTGCTCCGCT AGGTTCCCGC AGGCCTCGGC CTCCGACGTG GTGGTGGTGC ACGGACGGCG CACCCCCATC GGCCGCGCCA +375
GCCGTGGAGG CTTCAAGgtg +395
Mouse thiolase B gene promoter
cttccagcca agtactcaag catccagctt agggccaggg acccaggaaa gacgagagct gaatagaaca ggaatcagag -463
tcaggtcctc tatctccatt tgcagtgtaa agctgttgcc actgtcccag aaacctcctg acttttgtct gatagtgtgc -383
catggccatg tttggaggaa ggtctcctgg ttcatgttca gaaatccaca agactttgag gtcctgccta cagtgtagat -303
tacaaaacga ggaaagttcc agtttacact tctgggagga gcttcaaaaa tgtgcacaag cttttttttt ttttttaatt -223
atattttaaa acattttctt ttatttttgt agcccagatt ggccttgaac ttgcgcagta cacacttgca ccatcacagg -143
tgtacatgga caaacttaag aaggaggggt tctgaagttc attgacttgc tttgagaagc tgggaggtgg tggtggggga -63
agactcagga agagtcgccc tctgattggc tgcagaatgg gtaggcagga cttattgaaa atATAAGGCT CCAATTGGCT +18
CTGCCCTGTG CAAGCCCGCG TCCTTAATTC ACTGGGGTGA GCGCCCAGAG CGCTGGCAAA TCGGTGGGAC CCACCTCCGC +98
GATGCATCGG CTGCAGGTAG TGCTGGGTCA CCTGGCCGGC CGGCCCGAGT CGAGCTCCGC GCTGCAAGCT GCGCCCTGCT +178
CCGCTGGCTT CCTGCAGGCC TCGGCCTCCG ACGTGGTGGT GGTGCACGGA CGGCGCACTC CCATTGGCCG CGCCAGCCGT +258
GGCTGCTTCA AGgtgaggcc cctcgggcgg gcgaggggag +298
***
NFκB
Sp1 Sp1 Sp1
Sp1
•
•
M H R L Q V V L G H L A G R P E S S S A L Q A A P
C S A R F P Q A S A S D V V V V H G R R T P I G R A S
R G G F K
•
a)
Inverted CCAAT
Inverted CCAAT
***
•••• •
NFκB Sp1
Sp1 Sp1
Sp1
M H R L Q V V L G H L A G R P E S S S A L Q A A P C S
A G F L Q A S A S D V V V V H G R R T P I G R A S R
G C F K
b)
Inverted CCAAT
Inverted CCAAT
TATA-like
Page 6 of 13(page number not for citation purposes)
BMC Biochemistry 2004, 5 http://www.biomedcentral.com/1471-2091/5/3
At the protein level, thiolase sequences contain severalwell conserved characteristics between human, rat andmouse, both for thiolase A and B proteins. For example,the three thiolase signature patterns were found (framedin dotted lines on the sequences in figure 2): two of whichwere based on the regions around the cysteine residues(Cys123, Cys408) which are essential for the catalyticfunction and the third was based on a highly conservedregion in the C-terminal part of these proteins containinghistidine 377 also involved in the catalytic function [14].The putative Peroxisomal Target Signal (PTS 2) was alsoidentified in the N-terminal region of the protein. This sig-nal is characteristic of peroxisomal thiolase and is cleavedafter the import of the protein in peroxisomes [15], whichresults in a mature protein of 398 aa. At the 3' ends of thecDNAs, the stop codon and the putative polyadenylationsignal AGTAAA were identified (figure 2). In this 3' region,downstream of the stop codon, the two thiolase cDNAswere very different (55% identity on a 136 nt stretch),which allowed us to prepare probes specific to each thio-
lase cDNA (underlined sequences, figure 2). These probeswere used thereafter for Northern blot and Slot blot exper-iments (figure 4).
Nucleotide sequences of the 5'-flanking regions of the twothiolase genes are shown in figure 3. The 5'-flanking regionof the mThA gene contains four putative Sp1 binding sites(GC boxes) at positions -30 to -21, -58 to -49, -105 to -93and -306 to -297 and two inverted "CCAAT boxes" (i.e."ATTGG sequences") at -107 to -102, and -122 to -117.However, there was no evidence for a typical TATA boxsequence in the mouse thiolase A promoter region, as pre-viously reported for numerous mammalian peroxisomalprotein genes, such as the genes encoding rat 3-ketoacyl-CoA thiolase A [8], human 3-ketoacyl-CoA thiolase [11], ratacyl-CoA oxidase [16], rat bifunctional enzyme [17], human[18] and rat catalase [19]. In contrast, in the 5'-flankingregion of the mThB gene, one TATA box-like AT richsequence is present at -92 to -85 together with four GCboxes (at -26 to -16, -81 to -67, -120 to -114, and -271 to
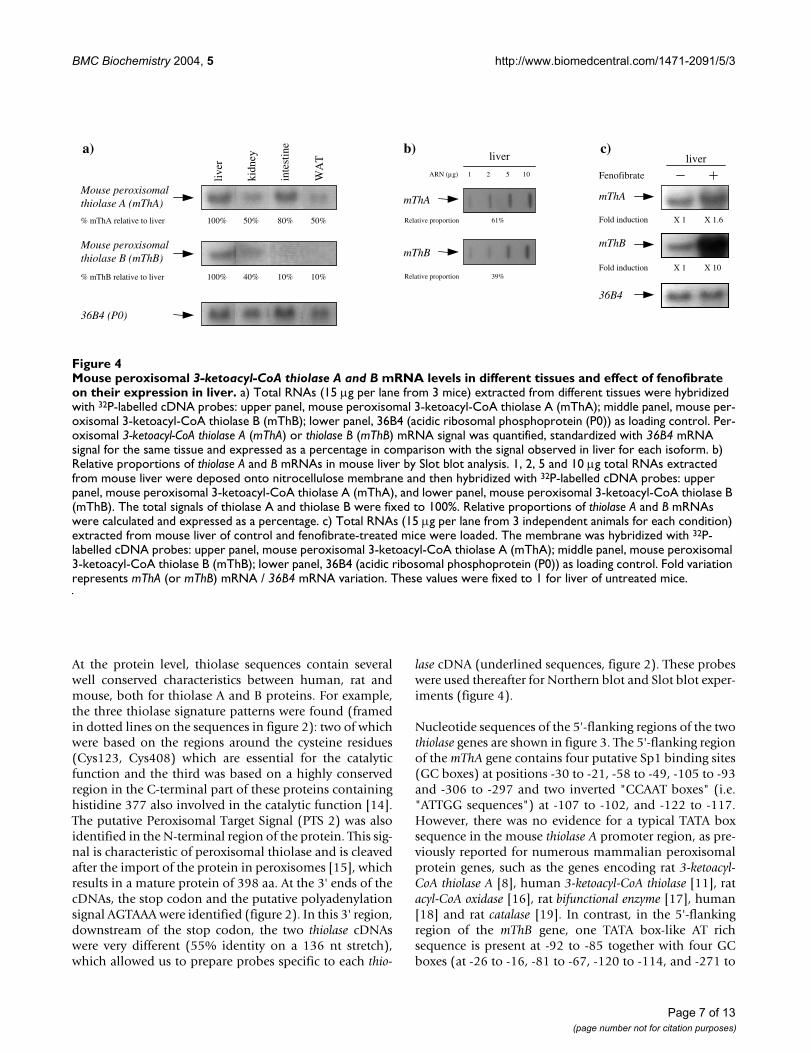
Mouse peroxisomal 3-ketoacyl-CoA thiolase A and B mRNA levels in different tissues and effect of fenofibrate on their expression in liverFigure 4Mouse peroxisomal 3-ketoacyl-CoA thiolase A and B mRNA levels in different tissues and effect of fenofibrate on their expression in liver. a) Total RNAs (15 µg per lane from 3 mice) extracted from different tissues were hybridized with 32P-labelled cDNA probes: upper panel, mouse peroxisomal 3-ketoacyl-CoA thiolase A (mThA); middle panel, mouse per-oxisomal 3-ketoacyl-CoA thiolase B (mThB); lower panel, 36B4 (acidic ribosomal phosphoprotein (P0)) as loading control. Per-oxisomal 3-ketoacyl-CoA thiolase A (mThA) or thiolase B (mThB) mRNA signal was quantified, standardized with 36B4 mRNA signal for the same tissue and expressed as a percentage in comparison with the signal observed in liver for each isoform. b) Relative proportions of thiolase A and B mRNAs in mouse liver by Slot blot analysis. 1, 2, 5 and 10 µg total RNAs extracted from mouse liver were deposed onto nitrocellulose membrane and then hybridized with 32P-labelled cDNA probes: upper panel, mouse peroxisomal 3-ketoacyl-CoA thiolase A (mThA), and lower panel, mouse peroxisomal 3-ketoacyl-CoA thiolase B (mThB). The total signals of thiolase A and thiolase B were fixed to 100%. Relative proportions of thiolase A and B mRNAs were calculated and expressed as a percentage. c) Total RNAs (15 µg per lane from 3 independent animals for each condition) extracted from mouse liver of control and fenofibrate-treated mice were loaded. The membrane was hybridized with 32P-labelled cDNA probes: upper panel, mouse peroxisomal 3-ketoacyl-CoA thiolase A (mThA); middle panel, mouse peroxisomal 3-ketoacyl-CoA thiolase B (mThB); lower panel, 36B4 (acidic ribosomal phosphoprotein (P0)) as loading control. Fold variation represents mThA (or mThB) mRNA / 36B4 mRNA variation. These values were fixed to 1 for liver of untreated mice.
Relative proportion 39%
ARN (µg)
mThA
liver
mThB
61%Relative proportion
1 2 5 10
b)
Mouse peroxisomal thiolase A (mThA)
36B4 (P0)
liver
kidn
ey
inte
stin
e
Mouse peroxisomal thiolase B (mThB)
WA
T
100% 50% 80% 50%
100% 40% 10% 10%
% mThA relative to liver
% mThB relative to liver
a)liver
Fenofibrate
mThA
36B4
Fold induction
mThB
Fold induction
X 1.6
X 10
X 1
X 1
c)
Page 7 of 13(page number not for citation purposes)
BMC Biochemistry 2004, 5 http://www.biomedcentral.com/1471-2091/5/3
-260) and two inverted "CCAAT boxes" (at -185 to -180and -38 to -33). A similar putative sequence for thebinding of NF-κB was present in both mThA and mThBgenes, at position -170 to -159, and -292 to -283,respectively.
Tissue distribution of the two mouse peroxisomal thiolase transcripts and differential regulation by fenofibrateBasal mRNA levels of mouse peroxisomal 3-ketoacyl-CoAthiolase A and B in tissues with important lipid metabo-lism were determined by Northern blot analysis using spe-cific probes for each thiolase mRNA (figure 4a).Peroxisomal thiolase A mRNA was mainly expressed inliver and intestine of mice. Thiolase A mRNA was lessabundant in kidney and white adipose tissue. Peroxiso-mal thiolase B mRNA was mainly expressed in liver of miceand to a lesser extent in kidney, intestine and whiteadipose tissue. In the other tissues (skeletal muscle, heartand brain), thiolase A and B mRNAs were hardly detecta-ble; their expression represented less than 10% of thatfound in liver (data not shown). The high expression ofthiolase A and B mRNAs in the liver may be closely relatedto larger peroxisome volume in this organ, a major site ofperoxisomal lipid oxidation. The smaller thiolase mRNAcontents in kidney, adipose tissue, skeletal muscle andheart compared to liver were in concordance with whatwas observed in these same tissues for the mouse acyl CoAoxidase gene [20]. However, the thiolase mRNA level islow in brain whereas Nöhammer et al. [20] found consid-erable amount of acyl CoA oxidase mRNA.
The low thiolase mRNA level in the brain may appear as aparadox since in most human peroxisomal disorders, neu-rodevelopmental delay is a prominent abnormality. Evenif the peroxisomal oxidation enzymes are lower expressedin brain compared to liver ([20], this work), their presenceis essential for metabolism of specific lipids such asdocosahexaenoic acid (C22:6n-3) and very long chainfatty acids. Moreover, Janssen et al. [21] described thatneuronal migration alteration in Pex5 knock out micecould be significantly corrected by a partial reconstitutionof peroxisomal function in liver suggesting that hepaticperoxisomal metabolism defect could affect the normalneuronal development. Taken together, these results sug-gest that peroxisomal disorders could not be due to a tis-sue-specific deficiency but rather to an association ofmultiple factors localized in several tissues.
In order to evaluate the relative proportions of mThA andmThB mRNA in liver, Slot blot experiments were carriedout with mouse liver RNA (figure 4b). We found thathepatic mThA mRNA represented 60% of the overallhepatic thiolase mRNA population since mThB mRNA rep-resents 40%. Comparable values were obtained in kidney,intestine and white adipose tissue (data not shown). The
results obtained in mouse liver were different from thoseobtained in rat liver since in the absence of treatment witha peroxisome proliferator, only thiolase A mRNA wasdetected [8,9]. After peroxisome proliferator treatment,rThB gene expression was greatly induced whereas rThAgene expression was increased less than two-fold [8]. Inorder to evaluate if this differential gene regulation by per-oxisome proliferators occurs also in mouse, we comparedthe ratio of the mThA and the mThB mRNAs betweenmice treated or not with fenofibrate, a peroxisome prolif-erator. As shown in figure 4c, mThB mRNA level wasincreased more than ten-fold whereas mThA mRNA levelwas increased two-fold. These results are in agreementwith what is described in the rat.
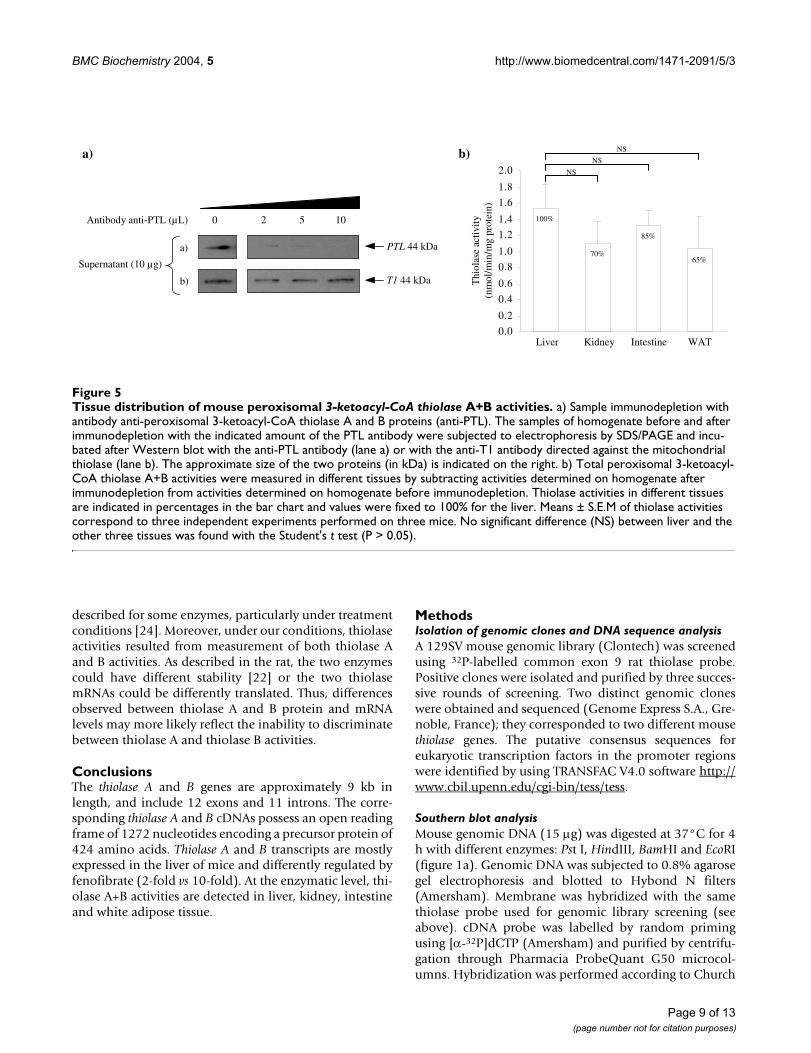
Thiolase enzyme activity assaysWe measured the enzymatic activity of the peroxisomal 3-ketoacyl-CoA thiolase by using an immunodepletion-based method. Because of the presence of distinct thio-lases both in mitochondria and peroxisomes, we used theindirect method of Miyazawa et al. [6] to specificallydetermine peroxisomal 3-ketoacyl-CoA thiolase A+Bactivities. It consists in the measurement of thiolase activ-ities before and after an immunodepletion with an anti-body directed against both thiolase A and thiolase Bproteins. Since no substrate specificity has been describedto distinguish between rat thiolase A and B activities[22,23], differentiating their activities in the mouse wasnot feasible. Therefore, thiolase activities were measuredby using 3-keto-octanoyl-CoA as substrate, as previouslydescribed by Miyazawa et al. [6].
To verify the complete immunodepletion of peroxisomal3-ketoacyl-CoA thiolase from the homogenate, samplesof the homogenate before and after immunodepletionwere separated on a polyacrylamide gel and analysed byWestern blotting. Membranes were incubated with ananti-peroxisomal 3-ketoacyl-CoA thiolase antibody (fig-ure 5a, lane a) and after stripping, membranes were rep-robed with an anti-mitochondrial 3-ketoacyl-CoAthiolase antibody (T1) to verify the specificity of theimmunodepletion (figure 5a, lane b). Peroxisomal thio-lase A+B proteins were totally absent from the homoge-nate after immunodepletion with 5 µl and 10 µl of anti-PTL antibody (figure 5a, lane a). Under these conditions,the amount of mitochondrial 3-ketoacyl-CoA thiolasewas not affected by the immunodepletion showing thespecificity of this technique (figure 5a, lane b). Once theseverifications were done, the peroxisomal thiolase activitywas measured in the four tissues showing the strongestthiolase mRNA levels (figure 5b). Thiolase A+B activitieswere detected in liver, kidney, intestine and white adiposetissue. No significant differences were observed betweenliver and the other three tissues. Discrepancies betweenenzymatic activity and mRNA level have already been
Page 8 of 13(page number not for citation purposes)
BMC Biochemistry 2004, 5 http://www.biomedcentral.com/1471-2091/5/3
described for some enzymes, particularly under treatmentconditions [24]. Moreover, under our conditions, thiolaseactivities resulted from measurement of both thiolase Aand B activities. As described in the rat, the two enzymescould have different stability [22] or the two thiolasemRNAs could be differently translated. Thus, differencesobserved between thiolase A and B protein and mRNAlevels may more likely reflect the inability to discriminatebetween thiolase A and thiolase B activities.
ConclusionsThe thiolase A and B genes are approximately 9 kb inlength, and include 12 exons and 11 introns. The corre-sponding thiolase A and B cDNAs possess an open readingframe of 1272 nucleotides encoding a precursor protein of424 amino acids. Thiolase A and B transcripts are mostlyexpressed in the liver of mice and differently regulated byfenofibrate (2-fold vs 10-fold). At the enzymatic level, thi-olase A+B activities are detected in liver, kidney, intestineand white adipose tissue.
MethodsIsolation of genomic clones and DNA sequence analysisA 129SV mouse genomic library (Clontech) was screenedusing 32P-labelled common exon 9 rat thiolase probe.Positive clones were isolated and purified by three succes-sive rounds of screening. Two distinct genomic cloneswere obtained and sequenced (Genome Express S.A., Gre-noble, France); they corresponded to two different mousethiolase genes. The putative consensus sequences foreukaryotic transcription factors in the promoter regionswere identified by using TRANSFAC V4.0 software http://www.cbil.upenn.edu/cgi-bin/tess/tess.
Southern blot analysisMouse genomic DNA (15 µg) was digested at 37°C for 4h with different enzymes: Pst I, HindIII, BamHI and EcoRI(figure 1a). Genomic DNA was subjected to 0.8% agarosegel electrophoresis and blotted to Hybond N filters(Amersham). Membrane was hybridized with the samethiolase probe used for genomic library screening (seeabove). cDNA probe was labelled by random primingusing [α-32P]dCTP (Amersham) and purified by centrifu-gation through Pharmacia ProbeQuant G50 microcol-umns. Hybridization was performed according to Church
Tissue distribution of mouse peroxisomal 3-ketoacyl-CoA thiolase A+B activitiesFigure 5Tissue distribution of mouse peroxisomal 3-ketoacyl-CoA thiolase A+B activities. a) Sample immunodepletion with antibody anti-peroxisomal 3-ketoacyl-CoA thiolase A and B proteins (anti-PTL). The samples of homogenate before and after immunodepletion with the indicated amount of the PTL antibody were subjected to electrophoresis by SDS/PAGE and incu-bated after Western blot with the anti-PTL antibody (lane a) or with the anti-T1 antibody directed against the mitochondrial thiolase (lane b). The approximate size of the two proteins (in kDa) is indicated on the right. b) Total peroxisomal 3-ketoacyl-CoA thiolase A+B activities were measured in different tissues by subtracting activities determined on homogenate after immunodepletion from activities determined on homogenate before immunodepletion. Thiolase activities in different tissues are indicated in percentages in the bar chart and values were fixed to 100% for the liver. Means ± S.E.M of thiolase activities correspond to three independent experiments performed on three mice. No significant difference (NS) between liver and the other three tissues was found with the Student's t test (P > 0.05).
PTL 44 kDa
T1 44 kDab)
a)
10520Antibody anti-PTL (µL)
Supernatant (10 µg)
a) b)
0.0
0.2
0.4
0.6
0.8
1.0
1.2
1.4
1.6
1.8
2.0
Liver IntestineKidney
Thi
olas
e ac
tivi
ty(n
mol
/min
/mg
prot
ein)
WAT
100%
70%
85%
65%
NS
NS
NS
Page 9 of 13(page number not for citation purposes)
BMC Biochemistry 2004, 5 http://www.biomedcentral.com/1471-2091/5/3
and Gilbert [25]. Blots were washed at high stringency(65°C, 0.5 × SSC, 0.1% SDS) before autoradiographyusing X-ray films (Amersham).
Determination of transcription initiation sites by ribonuclease protection assayTwo probes were constructed by PCR using mousegenomic DNA. The thiolase A probe (named +1mThAprobe and extending from -188 to +388 in the promoterregion of mouse thiolase A (figure 3a)) was PCR-ampli-fied with primers 5'-AAAAGGTTGTGCAAACTTGGAAG-3'and 5'-AAGCCTCCACGGCTGGCGCGGCC-3'. The thio-lase B probe (named +1mThB probe and extending from-152 to +266 in the promoter region of mouse thiolase B(figure 3b)) was PCR-amplified with primers 5'-CCAT-CACAGGTGTACATGGAC-3' and 5'-AAGCAGCCACG-GCTGGCGCGGCC-3'. The two fragments were subclonedinto pGEM®-T Easy vector (Promega) and verified bysequencing. These two vectors were linearized with SalIand used to synthesize the RNA probes by in vitro tran-scription (Riboprobe® in vitro transcription systems,Promega) using [α-32P]UTP (800 Ci/mmol, Amersham)and T7 RNA polymerase. The radiolabelled probes weregel-purified and hybridized to 15 µg (for +1mThA probe)or 10 µg (for +1mThB probe) of fenofibrate-treatedmouse liver RNA in a hybridization buffer (80%formamide, 10 mM PIPES, pH6.8, 0.25 mM EDTA, 0.1 MNaCl) overnight at 45°C. The reaction mixtures weredigested with 2 µg of ribonuclease A (Sigma) and 36 Unitsof ribonuclease T1 (Sigma) for 30 min at 37°C. Protectedfragments were visualized on a denaturing 7 M urea/5%polyacrylamide gel. Plasmids containing the +1mThA and+1mThB probes were sequenced with primers 5'-AAAAG-GTTGTGCAAACTTGGAAG-3', 5'-CCATCACAGGTGTA-CATGGAC-3' respectively, and run in parallel.
3' rapid amplification of the thiolase A and B cDNA ends (3' RACE)Three prime ends of the thiolase A and B cDNAs were pre-pared with the Marathon™ cDNA amplification kit (Clon-tech) using 3 µg of total liver RNA extracted from mice. 3'RACE reaction was performed using gene-specific primer(GSP) deduced from partial cDNAs of mouse thiolase Aand thiolase B (GenBank accession nos BC012400 andBC019882, respectively). A GSP common thiolase reverseprimer (5'-ACTCCAGTCAGGTGAGTGATG-3' (21-mer,located in exon 9)) and a forward primer correspondingto the Marathon™ adapter: (5'-CCATCCTAATACGACT-CACTATAGGGC-3' (27-mer)) were used. Briefly, totalRNA was reverse-transcribed with Moloney murine leuke-mia virus-reverse transcriptase using poly(dT)30-NN asprimer. Second strand synthesis was performed with amixture of E. coli DNA polymerase I, Rnase H, and DNAligase (Promega). Following the creation of blunt endswith T4 DNA polymerase, cDNAs were ligated with the
Marathon cDNA-adapter. Then, the 3' cDNA ends wereamplified using this cDNA population with the ExpandLong Template PCR System (Roche) for 30 cycles usingthe following steps: 95°C for 30 s, 56°C for 30 s and 68°Cfor 1 min 30. The PCR products were analyzed by electro-phoresis on 1.2% agarose gel in TAE buffer. From each thi-olase A and B 3' RACE, a single amplification product wasobtained with a size of 717 bp and 750 bp, respectively.These PCR products were gel-purified, cloned in pGEM®-TEasy vector (Promega) and sequenced (Genome ExpressS.A., Grenoble, France).
Cloning of thiolase A and B cDNAsThiolase cDNAs were amplified by RT-PCR with 3 µg oftotal liver RNA extracted from mice. The thiolase A cDNAwas amplified using a specific sense primer 5'-GACGTA-GAAGGCTGTCCTGCGCCTGCGCCC-3' (280 to 309:position on the mouse thiolase A gene sequence (GenBankaccession no AY304542)) and an antisense primer 5'-GAGACAGTACACATTTACTGCATCCCTCCC-3' (9152 to9181: position on the mouse thiolase A gene sequence(GenBank accession no AY304542)). For the thiolase BcDNA, the primers used were 5'-TTCACTGGGGT-GACGCCAGAGCGCT-3' (46 to 70: position on mRNArelative to +1 initiation transcription site deduced fromthe mouse thiolase B gene sequence (GenBank accessionno AC055818)) and 5'-CAGTTCACCCACGTTTACTGT-GCCCATCAC-3' (1637 to 1666: position on mRNA rela-tive to +1 initiation transcription site deduced from themouse thiolase B gene sequence (GenBank accession noAC055818)). The two thiolase cDNA fragments werecloned in pGEM®-T Easy vector (Promega), completelysequenced (Genome Express S.A., Grenoble, France) anddeposited in the Genbank database (accession nos:AY273811 for mThA cDNA and AY273812 for mThBcDNA).
Animals and fenofibrate treatmentC57BL/6J male mice (aged 6 months, n = 8) were pur-chased from IFFA CREDO (L'Arbresle, France). Mice (n =4) were kept at 22°C with equal periods of darkness andlight and had free access to water and a standard chowcontaining 4.3% (w/v) lipid in total calories (U.A.R. A-03,Epinay sur Orge, France). Mice were treated for 14 days bygavage (200 µl/day) with fenofibrate (100 mg. kg-1. day-1,from Sigma) dispersed into water containing 3% arabicgum (Merck). Treatments were performed between 8.00a.m. and 10.00 a.m.. Animals were sacrificed by cervicaldislocation and the following tissues were rapidly excised:liver, kidney, heart, whole brain, skeletal muscle, entero-cytes (intestinal mucous membrane) and white adiposetissue (peritoneal, retroperitoneal and epididymalregions). Tissues were snap-frozen in liquid nitrogen andstored at -80°C until RNA and protein extractions. The
Page 10 of 13(page number not for citation purposes)
BMC Biochemistry 2004, 5 http://www.biomedcentral.com/1471-2091/5/3
general guideline for the care and use of laboratory ani-mals was followed.
RNA analysisNorthern blotting analysisFor the isolation of total RNA, each frozen tissue (20–200mg) was homogenized with an Ultra-Turrax homogenizer(IKA Labortechnik) in 3 ml of a mixture containing gua-nidium thiocyanate and extracted according to Chomc-zynski and Sacchi [26]. Total RNA from 3 independentanimals was denatured, subjected to electrophoresis on a1% (w/v) agarose gel containing 6% (v/v) formaldehydeand transferred overnight onto Hybond N filters (Amer-sham). Probes labelling and hybridization conditionswere the same as those described for Southern blot analy-sis (see above). Specific mouse peroxisomal thiolase Aand B probes (underlined sequences, figure 2) were usedfor hybridization. To monitor gel loading, a 443 bpmouse acidic ribosomal phosphoprotein-36B4 (P0)probe was generated by RT-PCR from mouse liver RNAusing primers based on the published cDNA sequence ofthe mouse acidic ribosomal phosphoprotein gene (GenBankaccession no X15267) [27]. The forward and reverse PCRprimers were respectively: 5'-AACGTGGGCTCCAAGCA-GATG-3' (position on mRNA: 173 to 193) and: 5'-GAGATGTTCAGCATGTTCAGCAG-3' (position onmRNA: 593 to 615). Band intensities were determined bydensitometry with an Alpha-Imager™ 1220 (AlphaInnotech Corporation).
Slot blot analysisIncreasing quantities of total RNA (1, 2, 5 and 10 µg) weredenatured and deposed onto Hybond N filters in a Slotblot equipment (Hoefer scientific instruments). Experi-ments were performed in 20 × SSC under vacuum andwashed twice in 10 × SSC for 5 min. Then, membraneswere wetted at room temperature for 10 min and hybrid-ization with thiolase probes was performed as Northernblot experiments. Linearity of the relationship betweensignal intensity and RNA concentration was confirmed foreach sample. Band intensities (for 2 µg RNA) were deter-mined by densitometry with an Alpha-Imager™ 1220(Alpha Innotech Corporation).
Protein analysisSDS-PAGE and immunoblottingProtein extractionLiver samples were homogenized with an Ultra-Turraxhomogenizer (IKA Labortechnik) and then with a Teflonpestle (Bioblock) in a lysis buffer (50 mM Tris-HCl pH8.0, 150 mM NaCl, 1% (v/v) Nonidet P40, 0.5% (w/v)sodium deoxycholate, 2 mM EDTA, 50 mM NaF) in thepresence of a mixture of protease inhibitors (Roche).Homogenates were briefly centrifuged to remove thedebris. Total protein concentration was determined by the
Bradford technique with the Bio-Rad reagent (Biorad) andwith bovine serum albumin as a standard.
Thiolase immunodepletion and enzymatic activity determinationThe rabbit polyclonal antibodies directed against boththiolase A and B proteins (named PTL) and against mito-chondrial thiolase (named T1) were a gift from Dr. T.Hashimoto and Dr. N. Usuda (Shinshu University Schoolof Medecine, Japan) and have been previously described[6].
Homogenates of proteins (25 µg) were incubated at roomtemperature for 1 h with 5 µl of anti-peroxisomal 3-ketoa-cyl-CoA thiolase antibody (PTL) in a buffer containing 25mM Tris-HCl pH 8.0, 0.5% (v/v) Nonidet P40, 0.25% (w/v) sodium deoxycholate, 1 mM EDTA, 25 mM NaF. Six µgof protein A-Sepharose CL-4B (Sigma Chemical Co., StLouis, MO) in suspension in the lysis buffer were added tothe mixture and were incubated for 30 min at room tem-perature to allow the formation of the complex [antibody-antigen-protein A-Sepharose]. This complex was sedi-mented by centrifugation at 10 000 g for 2 min.
For immunoblotting, 10 µg of homogenate (with or with-out immunodepletion) were separated on 10% (w/v)polyacrylamide gels in the presence of 0.1% (w/v) SDSand transferred onto nitrocellulose membranes (Bio-Rad). After membrane saturation at room temperature for1 h 30 with TBS (0.1 M Tris-HCl pH8.0, 0.15 M NaCl)containing 0.05% (v/v) Tween 20 and 1% (w/v) BSA,blots were incubated in the same solution for 1 h with rab-bit polyclonal antibodies directed againt thiolase A andthiolase B proteins (PTL, diluted to 1:15000) or directedagainst mitochondrial 3-ketoacyl-CoA thiolase (T1,diluted to 1:30000). After three washes in TBS containing0.05% (v/v) Tween 20, primary antibody was detectedusing peroxidase-conjugated anti-rabbit (1:30000). Thebands labelled with the antibodies were visualized usinga Western blotting Chemiluminescence luminol reagent(Santa Cruz Biotechnology) by exposure to X-ray films(Amersham). Membranes were stripped for 15 min atroom temperature in a Restore buffer (Pierce, Montluçon,France) and four washes in TBS were performed beforenew hybridization.
Enzyme activity assaysThe 3-ketoacyl-CoA thiolase activities were determined at25°C by measuring the absorbance decrease at 303 nmdue to Mg2+-enolate cleavage [28]. The reaction mixture(500 µl) contained: 5 µg of protein homogenate (with orwithout immunodepletion), 100 mM Tris-HCl pH8.0, 25mM MgCl2 and 10 µM 3-keto-octanoyl-CoA (a generousgift of Dr. T. Hashimoto and Dr. N. Usuda, Shinshu Uni-versity School of Medecine, Japan). The enzymatic reac-tion was activated by adding Coenzyme A at a final
Page 11 of 13(page number not for citation purposes)
BMC Biochemistry 2004, 5 http://www.biomedcentral.com/1471-2091/5/3
concentration of 100 µM (Sigma Chemical Co., St Louis,MO). Under these assay conditions, the molar absorptioncoefficient was determined by the method of Staack et al.[29]: 3-keto-octanoyl-CoA, 14400 M.cm-1. Thiolase A+Bactivities were measured on homogenates before and afterimmunodepletion. Peroxisomal 3-ketoacyl-CoA thiolaseA+B activity was calculated as the difference between thesetwo determinations. Units of thiolase activities areexpressed as nmol of substrate utilized per mg of totalprotein per min. The results are expressed as means ±S.E.M. The significance of differences between tissues wasdetermined by Student's t test (NS > 0.05, *P < 0.05, **P< 0.01, ***P < 0.001).
List of abbreviations usedaa, amino acid(s); AOX, peroxisomal fatty acyl-CoA oxi-dase; D-PBE, peroxisomal D-3-hydroxyacyl-CoAhydratase/L-3-hydroxyacyl-CoA dehydrogenase bifunc-tional enzyme; GSP, Gene Specific Primer; L-PBE, L-3-hydroxyacyl-CoA hydratase/L-3-hydroxyacyl-CoA dehy-drogenase bifunctional enzyme; mThA (or mThB), mouseperoxisomal 3-ketoacyl-CoA thiolase A (or B); NFκB,nuclear factor kappa B; PTL, antibody against peroxisomal3-ketoacyl-CoA thiolase A and B proteins; PTS, Peroxiso-mal Target Signal; 3' RACE, 3' rapid amplification ofcDNA ends; rThA (or rThB), rat peroxisomal 3-ketoacyl-CoA thiolase A (or B); SCPx, sterol carrier protein x; T1,antibody against mitochondrial short chain-specific 3-ketoacyl-CoA thiolase; WAT, white adipose tissue; 36B4,acidic ribosomal phosphoprotein (P0).
Authors' contributionsGC carried out the transcription initiation sites determi-nation, the Northern blot experiments and the enzymaticactivity assays. MCC performed gene cloning and thesequence analysis. PE cloned the cDNAs and performedthe Slot blot analysis. PM, TP and GC conducted theexperiments on animals. VNF participated to the cloningof genes. GC and VNF wrote the draft of the manuscript.NL and VNF conceived the study and supervised the work.All authors read and approved the final manuscript.
AcknowledgementsThe authors would like to thank Dr T. Hashimoto and Dr N. Usuda (Shin-shu University School of Medicine, Matsumoto, Japan) for the generous gift of thiolase antibodies and 3-keto-octanoyl-CoA, Dr T. Osumi (Institute of Technology, Himeji, Japan) and Dr M. Bugaut (LBMC, Dijon, France) for their helpful discussions. We are grateful to Dr C. Le Jossic-Corcos and Dr S. Fourcade (LBMC, Dijon, France) for excellent assistance and to Dr L. Corcos (INSERM U517, Dijon, France) and Dr Anne Magnet (university English teacher, University of Burgundy, Dijon, France) for critically reading the manuscript. Our thanks go to the Regional Council of Burgundy for its financial support and the French Ministry of Research and Technology for G.C. PhD fellowship.
References1. Mannaerts GP, van Veldhoven PP: Functions and organization of
peroxisomal beta-oxidation. Ann N Y Acad Sci 1996, 804:99-115.2. Reddy JK, Mannaerts GP: Peroxisomal lipid metabolism. Annu
Rev Nutr 1994, 14:343-70.3. Wanders RJ, van Grunsven EG, Jansen GA: Lipid metabolism in
peroxisomes: enzymology, functions and dysfunctions of thefatty acid alpha- and beta-oxidation systems in humans. Bio-chem Soc Trans 2000, 28:141-9.
4. Huyghe S, Casteels M, Janssen A, Meulders L, Mannaerts GP,Declercq PE, van Veldhoven PP, Baes M: Prenatal and postnataldevelopment of peroxisomal lipid-metabolizing pathways inmouse. Biochem J 2001, 353:673-680.
5. Wanders RJ, Vreken P, Ferdinandusse S, Jansen GA, Waterham HR,van Roermund CW, Van Grunsven EG: Peroxisomal fatty acidalpha- and beta-oxidation in humans: enzymology, peroxiso-mal metabolite transporters and peroxisomal diseases. Bio-chem Soc Trans 2001, 29:250-67.
6. Miyazawa S, Osumi T, Hashimoto T: The presence of a new 3-oxoacyl-CoA thiolase in rat liver peroxisomes. Eur J Biochem1980, 103:589-96.
7. Ostlund Farrants AK, Bjorkhem I, Pedersen JI: Differential induc-tion of peroxisomal oxidation of palmitic acid and 3 alpha, 7alpha, 12 alpha-trihydroxy-5 beta-cholestanoic acid in ratliver. Biochim Biophys Acta 1990, 1046:173-7.
8. Hijikata M, Wen JK, Osumi T, Hashimoto T: Rat peroxisomal 3-ketoacyl-CoA thiolase gene. Occurrence of two closelyrelated but differentially regulated genes. J Biol Chem 1990,265:4600-6.
9. Bodnar AG, Rachubinski RA: Cloning and sequence determina-tion of cDNA encoding a second rat liver peroxisomal 3-ketoacyl-CoA thiolase. Gene 1990, 91:193-9.
10. Chevillard G, Clemencet MC, Etienne P, Martin P, Pineau T, LatruffeN, Nicolas-Frances V: Tissue-specific expression of two peroxi-somal 3-ketoacyl-CoA thiolase genes in wild and PPARalpha-null mice and induction by fenofibrate. Adv Exp Med Biol2003, 544:55-6.
11. Bout A, Hoovers JM, Bakker E, Mannens MM, Geurts van Kessel A,Westerveld A, Tager JM, Benne R: Assignment of the gene cod-ing for human peroxisomal 3-oxoacyl-CoA thiolase (ACAA)to chromosome region 3p22-p23. Cytogenet Cell Genet 1989,52:147-50.
12. Shapiro M, Senapathy P: RNA splice junctions of different classesof eukaryotes: sequence statistics and functional implica-tions in gene expression. Nucleic Acids Res 1987, 15:7155-74.
13. Kozak M: Selection of initiation sites by eucaryotic ribosomes:effect of inserting AUG triplets upstream from the codingsequence for preproinsulin. Nucleic Acids Res 1984, 12:3873-93.
14. Fukao T, Kamijo K, Osumi T, Fujiki Y, Yamaguchi S, Orii T, HashimotoT: Molecular cloning and nucleotide sequence of cDNAencoding the entire precursor of rat mitochondrial ace-toacetyl-CoA thiolase. J Biochem (Tokyo) 1989, 106:197-204.
15. Swinkels BW, Gould SJ, Bodnar AG, Rachubinski RA, Subramani S: Anovel, cleavable peroxisomal targeting signal at the amino-terminus of the rat 3-ketoacyl-CoA thiolase. Embo J 1991,10:3255-62.
16. Osumi T, Ishii N, Miyazawa S, Hashimoto T: Isolation and struc-tural characterization of the rat acyl-CoA oxidase gene. J BiolChem 1987, 262:8138-43.
17. Ishii N, Hijikata M, Osumi T, Hashimoto T: Structural organiza-tion of the gene for rat enoyl-CoA hydratase:3-hydroxyacyl-CoA dehydrogenase bifunctional enzyme. J Biol Chem 1987,262:8144-50.
18. Quan F, Korneluk RG, Tropak MB, Gravel RA: Isolation and char-acterization of the human catalase gene. Nucleic Acids Res 1986,14:5321-35.
19. Nakashima H, Yamamoto M, Goto K, Osumi T, Hashimoto T, EndoH: Isolation and characterization of the rat catalase-encod-ing gene. Gene 1989, 79:279-88.
20. Nöhammer C, El-Shabrawi Y, Schauer S, Hiden M, Berger J, Forss-Pet-ter S, Winter E, Eferl R, Zechner R, Hoefler G: cDNA cloning andanalysis of tissue-specific expression of mouse peroxisomalstraight-chain acyl-CoA oxidase. Eur J Biochem 2000,267:1254-60.
21. Janssen A, Gressens P, Grabenbauer M, Baumgart E, Schad A, Van-horebeek I, Brouwers A, Declercq PE, Fahimi D, Evrard P, Schoonjans
Page 12 of 13(page number not for citation purposes)
BMC Biochemistry 2004, 5 http://www.biomedcentral.com/1471-2091/5/3
Publish with BioMed Central and every scientist can read your work free of charge
"BioMed Central will be the most significant development for disseminating the results of biomedical research in our lifetime."
Sir Paul Nurse, Cancer Research UK
Your research papers will be:
available free of charge to the entire biomedical community
peer reviewed and published immediately upon acceptance
cited in PubMed and archived on PubMed Central
yours — you keep the copyright
Submit your manuscript here:http://www.biomedcentral.com/info/publishing_adv.asp
BioMedcentral
L, Collen D, Carmeliet P, Mannaerts G, Van Veldhoven P, Baes M:Neuronal migration depends on intact peroxisomal functionin brain and in extraneuronal tissues. J Neurosci 2003,23:9732-41.
22. Antonenkov VD, Van Veldhoven PP, Waelkens E, Mannaerts GP:Comparison of the stability and substrate specificity of puri-fied peroxisomal 3-oxoacyl-CoA thiolases A and B from ratliver. Biochim Biophys Acta 1999, 1437:136-41.
23. Antonenkov VD, Van Veldhoven PP, Mannaerts GP: The commonlyused Mg2+-enolate assay can lead to underestimation of thi-olase activity. Anal Biochem 1999, 267:418-20.
24. Takahashi Y, Kushiro M, Shinohara K, Ide T: Activity and mRNAlevels of enzymes involved in hepatic fatty acid synthesis andoxidation in mice fed conjugated linoleic acid. Biochim BiophysActa 2003, 1631:265-73.
25. Church GM, Gilbert W: Genomic sequencing. Proc Natl Acad Sci US A 1984, 81:1991-5.
26. Chomczynski P, Sacchi N: Single-step method of RNA isolationby acid guanidinium thiocyanate-phenol-chloroformextraction. Anal Biochem 1987, 162:156-9.
27. Krowczynska AM, Coutts M, Makrides S, Brawerman G: The mousehomologue of the human acidic ribosomal phosphoproteinPO: a highly conserved polypeptide that is under transla-tional control. Nucleic Acids Res 1989, 17:6408.
28. Lazarow PB: Rat liver peroxisomes catalyze the beta oxidationof fatty acids. J Biol Chem 1978, 253:1522-8.
29. Staack H, Binstock JF, Schulz H: Purification and properties of apig heart thiolase with broad chain length specificity andcomparison of thiolases from pig heart and Escherichia coli.J Biol Chem 1978, 253:1827-31.
Page 13 of 13(page number not for citation purposes)


![IPv6-Gene[1].. Chap7](https://img.pdfslide.fr/doc/110x75/563dbb0d550346aa9aa9dcfc/ipv6-gene1-chap7.jpg)