Embed Size (px)
Citation preview
Ocean island densities and models of lithospheric flexure
T. A. Minshull1 and Ph. Charvis2
1 School of Ocean and Earth Science, University of Southampton, Southampton Oceanography Centre, European Way, Southampton SO14 3ZH, UK.
E-mail: [email protected] Unite Mixte de Recherche Geosciences Azur, Institut de Recherche pour le Developpement (IRD), BP48, 06235, Villefranche-sur-mer, France
Accepted 2001 January 15. Received 2000 September 21; in original form 1999 December 15
SUMMARY
Estimates of the effective elastic thickness (Te) of the oceanic lithosphere based ongravity and bathymetric data from island loads are commonly significantly lower thanthose based on the wavelength of plate bending at subduction zones. The anomalouslylow values for ocean islands have been attributed to the finite yield strength of the litho-sphere, to erosion of the mechanical boundary layer by mantle plumes, to pre-existingthermal stresses and to overprinting of old volcanic loads by younger ones. A fifthpossible contribution to the discrepancy is an incorrect assumption about the densityof volcanic loads. We suggest that load densities have been systematically overestimatedin studies of lithospheric flexure, potentially resulting in systematic underestimation ofeffective elastic thickness and overestimation of the effects of hotspot volcanism. Weillustrate the effect of underestimating load density with synthetic examples and anexample from the Marquesas Islands. This effect, combined with the other effects listedabove, in many cases may obviate the need to invoke hotspot reheating to explain lowapparent elastic thickness.
Key words: density, gravity anomalies, lithospheric flexure, ocean islands, rheology,volcanic structure.
I N T R O D U C T I O N
Our main constraint on the rheology of the oceanic lithosphere
comes from its deformation in response to applied stresses.
While laboratory studies make an important contribution,
empirical relations based on laboratory measurements must be
extrapolated over several orders of magnitude in order to apply
them to geological strain rates, and such extrapolations must
have large uncertainties. The largest stresses to the oceanic
lithosphere are applied at plate boundaries and beneath intra-
plate volcanic loads and our understanding of its response to
stresses on geological timescales comes mainly from gravity
and bathymetric studies of these features. It has long been
recognized that estimates of effective elastic thickness (Te) from
oceanic intraplate volcanoes are significantly lower than estimates
of the mechanical thickness of the lithosphere of the same age at
subduction zones (McNutt 1984; Fig. 1). Part of this difference
arises because the finite yield strength of the oceanic litho-
sphere can be exceeded due to plate curvature beneath volcanoes
(Bodine et al. 1981). Wessel (1992) attributed a further part of
the discrepancy to thermal stresses due to lithospheric cooling,
which sets up a bending moment which places the lower part of
the plate in tension and the upper part in compression. Plate
flexure due to volcanic loading releases thermal stresses, so that
the plate appears weakened.
Wessel (1992) found that a combination of the above
effects could partly explain the low Te values from ocean island
loading studies, but not completely. The remaining reduction
was attributed to ‘hotspot reheating’—the reduction of litho-
spheric strength by mechanical injection of heat from the mantle
plumes assumed to give rise to ocean islands. This effect has
been proposed by many authors (e.g. Detrick & Crough 1978)
and was quantified by McNutt (1984), who suggested that the
age of the lithosphere was effectively ‘reset’ by plume activity,
to a value corresponding to the regional average basement depth.
A problem with this suggestion is that hotspot swells exhibit heat
flow anomalies which are much smaller than those predicted by
the reheating model (Courtney & White 1986; Von Herzen et al.
1989). More recently, anomalously low Te values for some ocean
island chains have been attributed to errors in the inferred age
of loading where older volcanic loads have been overprinted
by younger ones (e.g. McNutt et al. 1997; Gutscher et al.
1999). Here we propose an additional explanation for the low
apparent Te of the lithosphere beneath many oceanic volcanoes
which comes from the methods of data analysis used rather
than from geodynamic processes.
T H E D E N S I T Y O F O C E A N I CI N T R A P L A T E V O L C A N O E S
Estimation of Te requires quantification of both the load
represented by the volcano and the flexure of the underlying
plate. In a few cases the flexure has been quantified by mapping
Geophys. J. Int. (2001) 145, 731–739
# 2001 RAS 731
the shapes of the top of the oceanic crust and the Moho by
seismic methods (e.g. Watts & ten Brink 1989; Caress et al.
1995; Watts et al. 1997). Even in some of these studies, the
shape of the flexed plate beneath the centre of the load is poorly
constrained by seismic data, since the sampling of this region
by marine shots recorded on land stations is poor and addi-
tional constraints from gravity modelling are needed. The vast
majority of the values shown in Fig. 1 come from studies
using bathymetric and gravity or geoid data. The limitations of
values based on the ETOPO5 global gridded bathymetry and
low-resolution satellite gravity data have been discussed else-
where (e.g. Goodwillie & Watts 1993; Minshull & Brozena 1997).
However, even where values have been derived from shipboard
data, significant errors can arise because of the trade-off in
gravity modelling between the shape of density contrasts and
their magnitude.
Key parameters in gravity modelling of ocean islands and
seamounts are the density of the load and the density of the
material filling the flexural depression made by the load. These
two quantities are normally set to be equal because the infill
material lying beneath the load is likely to have a similar density
to the load itself, and allowing the density of the infill to vary
laterally introduces significant additional complexity into gravity
and flexure calculations. Calculations are further simplified
if this density is taken to be equal to that of the underlying
oceanic crust, since then if the preloading sediment thickness
can be taken to be negligible, only one flexed density contrast
(the Moho) needs to be considered. Therefore, many authors
make this assumption, using typical oceanic crustal density
of 2800 kg mx3 (e.g. Watts et al. 1975; Calmant et al. 1990;
McNutt et al. 1997). Some support for this value came from
drilling studies in the Azores and Bermuda, which led Hyndman
et al. (1979) to conclude that ‘the mean density of the bulk of
oceanic volcanic islands and seamounts is about 2.8 g cmx3 ’.
Independent constraints on load density and flexural para-
meters are available in the gravity and bathymetric data them-
selves. For example, the diameter of the flexural node is a clear
indicator of Te and in some cases this can be defined from
bathymetric data (e.g. Watts 1994). The shape of gravity or geoid
anomalies also provides constraints. A least-squares fitting
approach where both Te and density are varied may allow an
estimate of the density to be made, but commonly there is
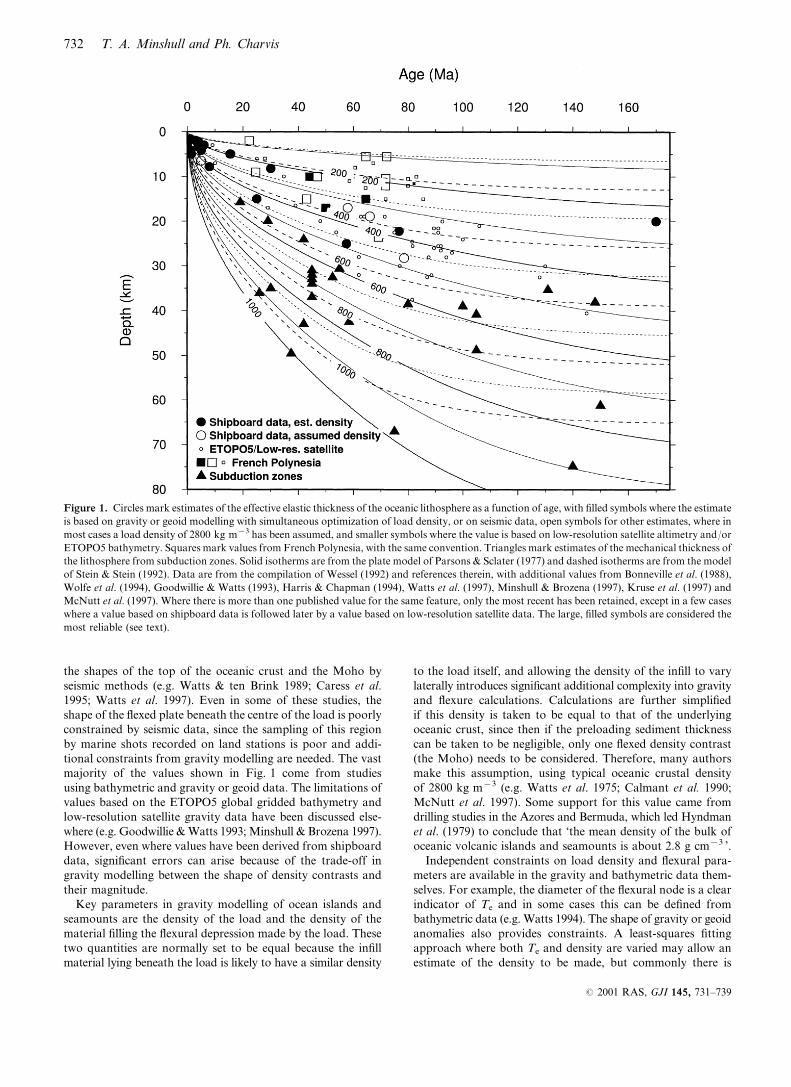
Figure 1. Circles mark estimates of the effective elastic thickness of the oceanic lithosphere as a function of age, with filled symbols where the estimate
is based on gravity or geoid modelling with simultaneous optimization of load density, or on seismic data, open symbols for other estimates, where in
most cases a load density of 2800 kg mx3 has been assumed, and smaller symbols where the value is based on low-resolution satellite altimetry and/or
ETOPO5 bathymetry. Squares mark values from French Polynesia, with the same convention. Triangles mark estimates of the mechanical thickness of
the lithosphere from subduction zones. Solid isotherms are from the plate model of Parsons & Sclater (1977) and dashed isotherms are from the model
of Stein & Stein (1992). Data are from the compilation of Wessel (1992) and references therein, with additional values from Bonneville et al. (1988),
Wolfe et al. (1994), Goodwillie & Watts (1993), Harris & Chapman (1994), Watts et al. (1997), Minshull & Brozena (1997), Kruse et al. (1997) and
McNutt et al. (1997). Where there is more than one published value for the same feature, only the most recent has been retained, except in a few cases
where a value based on shipboard data is followed later by a value based on low-resolution satellite data. The large, filled symbols are considered the
most reliable (see text).
732 T. A. Minshull and Ph. Charvis
# 2001 RAS, GJI 145, 731–739
a strong trade-off between elastic thickness and density which
leads to an ill-defined misfit function with large uncertainties
(e.g. Watts 1994; Minshull & Brozena 1997). The major contri-
bution to a least-squares fit is the peak amplitude of the anomaly,
and this value is highly sensitive to the load density. The trade-
off may be avoided by using an alternative optimization, for
example by including the cross-correlation between residual
gravity and topography as an additional term in the misfit
function (Smith et al. 1989).
Constraints on density can also come from wide-angle
seismic studies, since for oceanic crustal rocks there is a strong
correlation between seismic velocity and density (Carlson &
Herrick 1990). Except perhaps for rocks with large fracture
porosity, densities can be predicted from seismic velocity
measurements with an uncertainty of only a few per cent (e.g.
Minshull 1996). Using Carlson & Herrick’s preferred relation,
a density of 2800 kg mx3 corresponds to a mean seismic
velocity of 6.0 km sx1; these authors suggest a mean density
of 2860t30 kg mx3 for normal oceanic crust. However, a
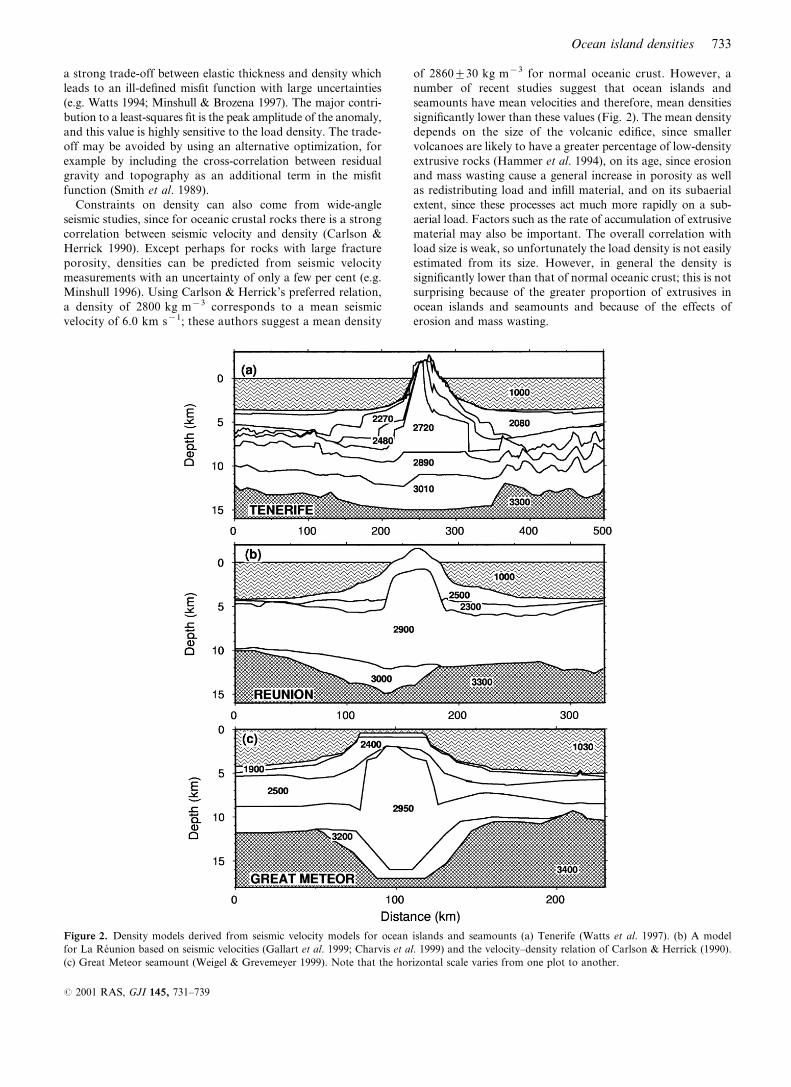
number of recent studies suggest that ocean islands and
seamounts have mean velocities and therefore, mean densities
significantly lower than these values (Fig. 2). The mean density
depends on the size of the volcanic edifice, since smaller
volcanoes are likely to have a greater percentage of low-density
extrusive rocks (Hammer et al. 1994), on its age, since erosion
and mass wasting cause a general increase in porosity as well
as redistributing load and infill material, and on its subaerial
extent, since these processes act much more rapidly on a sub-
aerial load. Factors such as the rate of accumulation of extrusive
material may also be important. The overall correlation with
load size is weak, so unfortunately the load density is not easily
estimated from its size. However, in general the density is
significantly lower than that of normal oceanic crust; this is not
surprising because of the greater proportion of extrusives in
ocean islands and seamounts and because of the effects of
erosion and mass wasting.
Figure 2. Density models derived from seismic velocity models for ocean islands and seamounts (a) Tenerife (Watts et al. 1997). (b) A model
for La Reunion based on seismic velocities (Gallart et al. 1999; Charvis et al. 1999) and the velocity–density relation of Carlson & Herrick (1990).
(c) Great Meteor seamount (Weigel & Grevemeyer 1999). Note that the horizontal scale varies from one plot to another.
Ocean island densities 733
# 2001 RAS, GJI 145, 731–739
E F F E C T O N F L E X U R E A N D E L A S T I CT H I C K N E S S E S T I M A T E S
The above evidence suggests that load densities may be
systematically overestimated in studies of the flexural strength
of the oceanic lithosphere. There are two resulting effects on
flexural modelling. First, the vertical stress exerted by the load
is overestimated, so for a given Te value the depression of the
top of the crust and Moho is overestimated and the corres-
ponding negative gravity anomaly is overestimated. Second,
the positive gravity anomaly of the load itself is overestimated.
The latter effect is always larger, even for Airy isostasy, since
the corresponding density contrast is closer to the observation
point. The resulting effect on Te estimates may be quantified by
computing the flexure, gravity anomalies and geoid anomalies
due to a series of synthetic loads and then estimating the
corresponding elastic thickness by least-squares fitting of the
anomalies with an incorrect assumed density. The effect varies
with the size of the load, so in this study three load sizes are
considered (Table 1): a small load, comparable with some sea-
mount chains, a large load comparable to large ocean islands
such as Tenerife and La Reunion and an intermediate load. The
result also depends on the shape of the load. The simplest shapes
for computational purposes are a cone and an axisymmetric
Gaussian bell. Most ocean islands and seamounts have more
of their mass focused close to the volcano axis than a conical
shape would imply, so a Gaussian shape is chosen here. For
simplicity, the loads were assumed to be entirely submarine.
Flexure computations used the Fourier methods of e.g. Watts
(1994), while gravity anomalies were calculated using the
approach of Parker (1974), retaining terms up to fifth order
in the Taylor series expansion to ensure the gravity anomalies
of the steeply sloping load flanks were well represented.
Geoid anomalies were computed by Fourier methods from
the corresponding gravity anomalies. Load and infill densities
of 2500–2700 kg mx3 were considered, with the densities of
the water, crust and mantle set to 1030, 2800 and 3330 kg mx3,
respectively, and a normal oceanic crustal thickness of 7 km
(White et al. 1992). The crustal density used is the most
commonly used value, although it is slightly lower than Carlson
& Herrick’s (1990) preferred value. For a series of pre-defined
Te values, Te was estimated using an assumed load and infill
density of 2800 kg mx3.
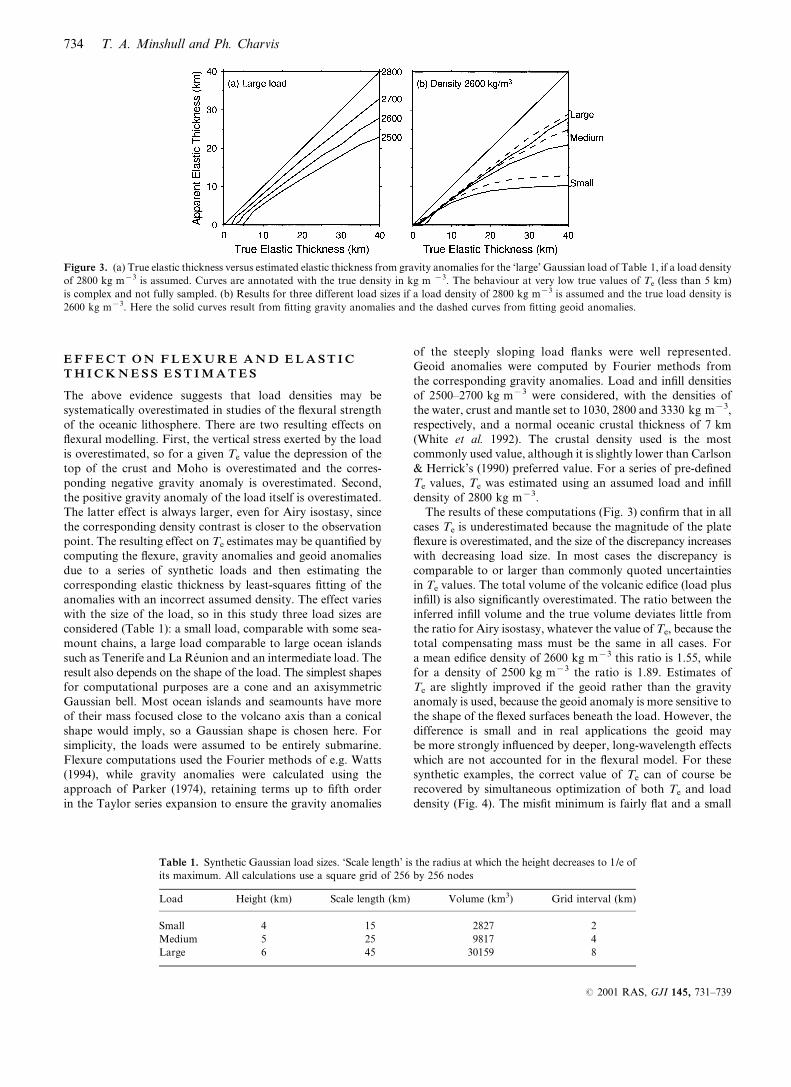
The results of these computations (Fig. 3) confirm that in all
cases Te is underestimated because the magnitude of the plate
flexure is overestimated, and the size of the discrepancy increases
with decreasing load size. In most cases the discrepancy is
comparable to or larger than commonly quoted uncertainties
in Te values. The total volume of the volcanic edifice (load plus
infill) is also significantly overestimated. The ratio between the
inferred infill volume and the true volume deviates little from
the ratio for Airy isostasy, whatever the value of Te, because the
total compensating mass must be the same in all cases. For
a mean edifice density of 2600 kg mx3 this ratio is 1.55, while
for a density of 2500 kg mx3 the ratio is 1.89. Estimates of
Te are slightly improved if the geoid rather than the gravity
anomaly is used, because the geoid anomaly is more sensitive to
the shape of the flexed surfaces beneath the load. However, the
difference is small and in real applications the geoid may
be more strongly influenced by deeper, long-wavelength effects
which are not accounted for in the flexural model. For these
synthetic examples, the correct value of Te can of course be
recovered by simultaneous optimization of both Te and load
density (Fig. 4). The misfit minimum is fairly flat and a small
Table 1. Synthetic Gaussian load sizes. ‘Scale length’ is the radius at which the height decreases to 1/e of
its maximum. All calculations use a square grid of 256 by 256 nodes
Load Height (km) Scale length (km) Volume (km3) Grid interval (km)
Small 4 15 2827 2
Medium 5 25 9817 4
Large 6 45 30159 8
Figure 3. (a) True elastic thickness versus estimated elastic thickness from gravity anomalies for the ‘large’ Gaussian load of Table 1, if a load density
of 2800 kg mx3 is assumed. Curves are annotated with the true density in kg m x3. The behaviour at very low true values of Te (less than 5 km)
is complex and not fully sampled. (b) Results for three different load sizes if a load density of 2800 kg mx3 is assumed and the true load density is
2600 kg mx3. Here the solid curves result from fitting gravity anomalies and the dashed curves from fitting geoid anomalies.
734 T. A. Minshull and Ph. Charvis
# 2001 RAS, GJI 145, 731–739
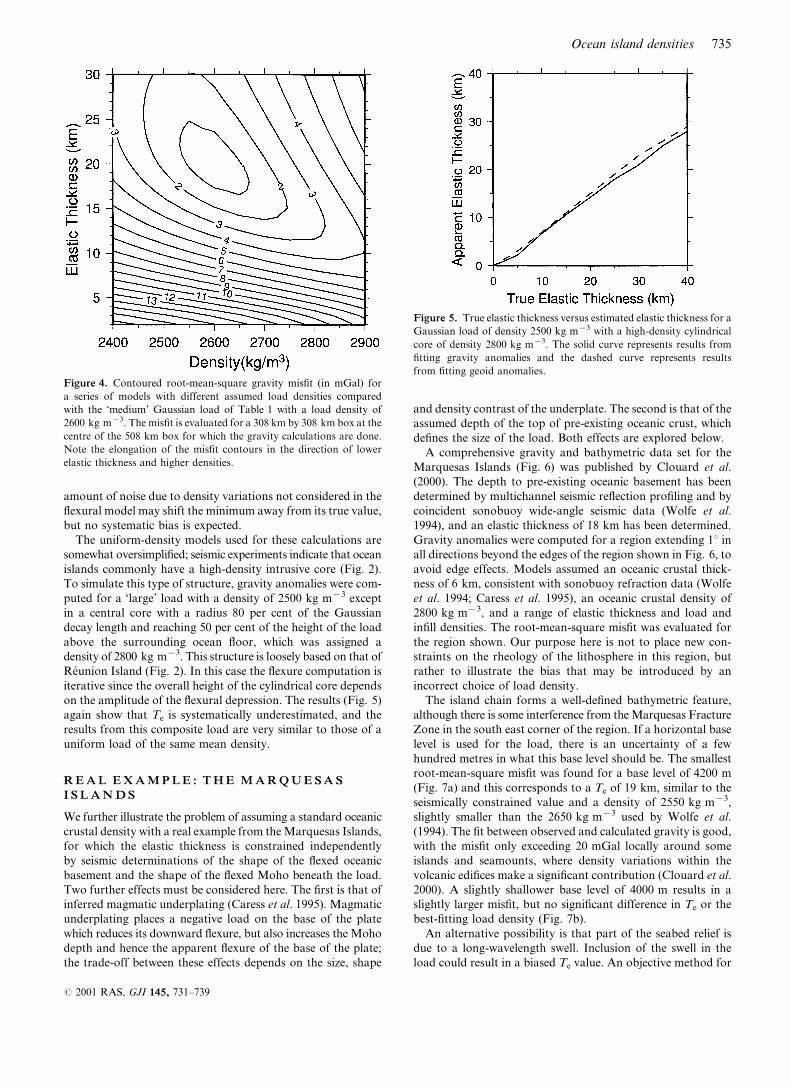
amount of noise due to density variations not considered in the
flexural model may shift the minimum away from its true value,
but no systematic bias is expected.
The uniform-density models used for these calculations are
somewhat oversimplified; seismic experiments indicate that ocean
islands commonly have a high-density intrusive core (Fig. 2).
To simulate this type of structure, gravity anomalies were com-
puted for a ‘large’ load with a density of 2500 kg mx3 except
in a central core with a radius 80 per cent of the Gaussian
decay length and reaching 50 per cent of the height of the load
above the surrounding ocean floor, which was assigned a
density of 2800 kg mx3. This structure is loosely based on that of
Reunion Island (Fig. 2). In this case the flexure computation is
iterative since the overall height of the cylindrical core depends
on the amplitude of the flexural depression. The results (Fig. 5)
again show that Te is systematically underestimated, and the
results from this composite load are very similar to those of a
uniform load of the same mean density.
R E A L E X A M P L E : T H E M A R Q U E S A SI S L A N D S
We further illustrate the problem of assuming a standard oceanic
crustal density with a real example from the Marquesas Islands,
for which the elastic thickness is constrained independently
by seismic determinations of the shape of the flexed oceanic
basement and the shape of the flexed Moho beneath the load.
Two further effects must be considered here. The first is that of
inferred magmatic underplating (Caress et al. 1995). Magmatic
underplating places a negative load on the base of the plate
which reduces its downward flexure, but also increases the Moho
depth and hence the apparent flexure of the base of the plate;
the trade-off between these effects depends on the size, shape
and density contrast of the underplate. The second is that of the
assumed depth of the top of pre-existing oceanic crust, which
defines the size of the load. Both effects are explored below.
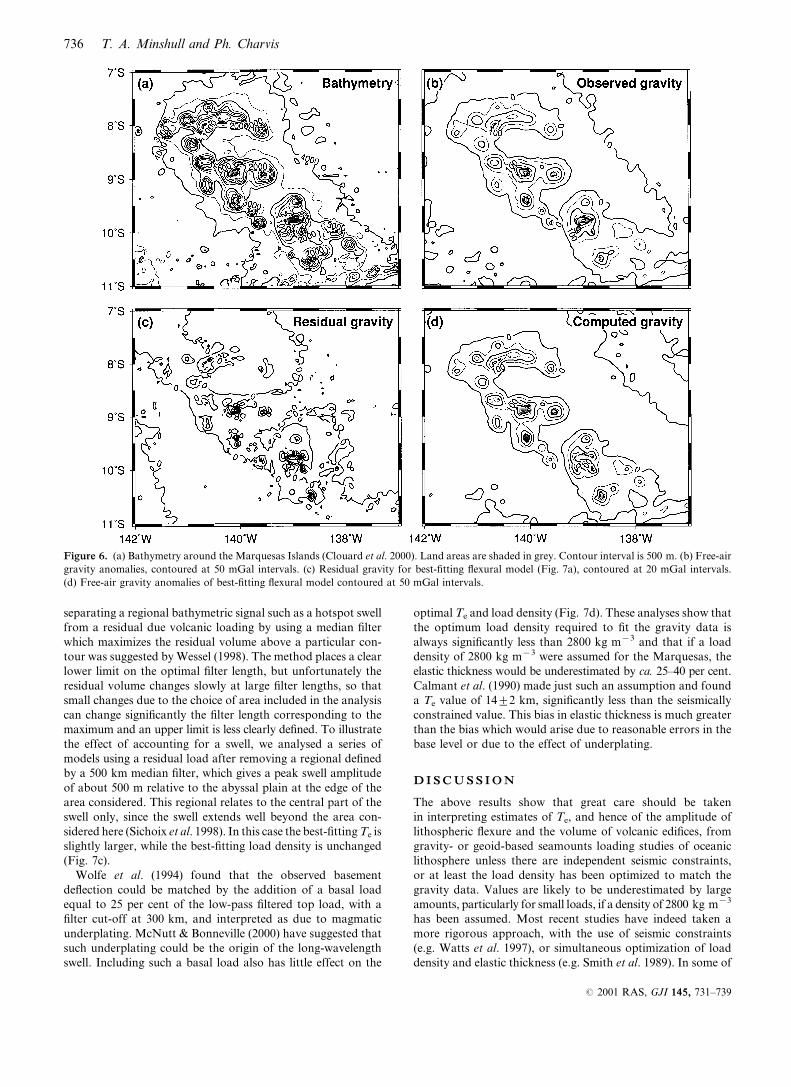
A comprehensive gravity and bathymetric data set for the
Marquesas Islands (Fig. 6) was published by Clouard et al.
(2000). The depth to pre-existing oceanic basement has been
determined by multichannel seismic reflection profiling and by
coincident sonobuoy wide-angle seismic data (Wolfe et al.
1994), and an elastic thickness of 18 km has been determined.
Gravity anomalies were computed for a region extending 1u in
all directions beyond the edges of the region shown in Fig. 6, to
avoid edge effects. Models assumed an oceanic crustal thick-
ness of 6 km, consistent with sonobuoy refraction data (Wolfe
et al. 1994; Caress et al. 1995), an oceanic crustal density of
2800 kg mx3, and a range of elastic thickness and load and
infill densities. The root-mean-square misfit was evaluated for
the region shown. Our purpose here is not to place new con-
straints on the rheology of the lithosphere in this region, but
rather to illustrate the bias that may be introduced by an
incorrect choice of load density.
The island chain forms a well-defined bathymetric feature,
although there is some interference from the Marquesas Fracture
Zone in the south east corner of the region. If a horizontal base
level is used for the load, there is an uncertainty of a few
hundred metres in what this base level should be. The smallest
root-mean-square misfit was found for a base level of 4200 m
(Fig. 7a) and this corresponds to a Te of 19 km, similar to the
seismically constrained value and a density of 2550 kg mx3,
slightly smaller than the 2650 kg mx3 used by Wolfe et al.
(1994). The fit between observed and calculated gravity is good,
with the misfit only exceeding 20 mGal locally around some
islands and seamounts, where density variations within the
volcanic edifices make a significant contribution (Clouard et al.
2000). A slightly shallower base level of 4000 m results in a
slightly larger misfit, but no significant difference in Te or the
best-fitting load density (Fig. 7b).
An alternative possibility is that part of the seabed relief is
due to a long-wavelength swell. Inclusion of the swell in the
load could result in a biased Te value. An objective method for
Figure 4. Contoured root-mean-square gravity misfit (in mGal) for
a series of models with different assumed load densities compared
with the ‘medium’ Gaussian load of Table 1 with a load density of
2600 kg mx3. The misfit is evaluated for a 308 km by 308 km box at the
centre of the 508 km box for which the gravity calculations are done.
Note the elongation of the misfit contours in the direction of lower
elastic thickness and higher densities.
Figure 5. True elastic thickness versus estimated elastic thickness for a
Gaussian load of density 2500 kg mx3 with a high-density cylindrical
core of density 2800 kg mx3. The solid curve represents results from
fitting gravity anomalies and the dashed curve represents results
from fitting geoid anomalies.
Ocean island densities 735
# 2001 RAS, GJI 145, 731–739
separating a regional bathymetric signal such as a hotspot swell
from a residual due volcanic loading by using a median filter
which maximizes the residual volume above a particular con-
tour was suggested by Wessel (1998). The method places a clear
lower limit on the optimal filter length, but unfortunately the
residual volume changes slowly at large filter lengths, so that
small changes due to the choice of area included in the analysis
can change significantly the filter length corresponding to the
maximum and an upper limit is less clearly defined. To illustrate
the effect of accounting for a swell, we analysed a series of
models using a residual load after removing a regional defined
by a 500 km median filter, which gives a peak swell amplitude
of about 500 m relative to the abyssal plain at the edge of the
area considered. This regional relates to the central part of the
swell only, since the swell extends well beyond the area con-
sidered here (Sichoix et al. 1998). In this case the best-fitting Te is
slightly larger, while the best-fitting load density is unchanged
(Fig. 7c).
Wolfe et al. (1994) found that the observed basement
deflection could be matched by the addition of a basal load
equal to 25 per cent of the low-pass filtered top load, with a
filter cut-off at 300 km, and interpreted as due to magmatic
underplating. McNutt & Bonneville (2000) have suggested that
such underplating could be the origin of the long-wavelength
swell. Including such a basal load also has little effect on the
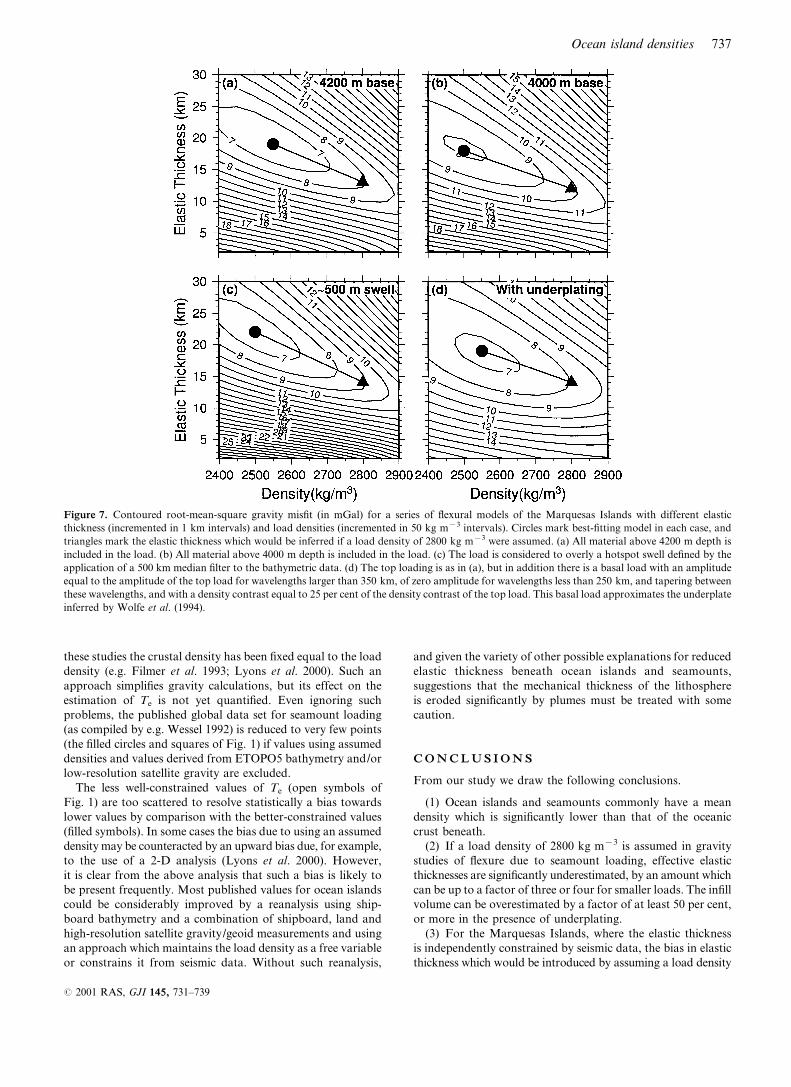
optimal Te and load density (Fig. 7d). These analyses show that
the optimum load density required to fit the gravity data is
always significantly less than 2800 kg mx3 and that if a load
density of 2800 kg mx3 were assumed for the Marquesas, the
elastic thickness would be underestimated by ca. 25–40 per cent.
Calmant et al. (1990) made just such an assumption and found
a Te value of 14t2 km, significantly less than the seismically
constrained value. This bias in elastic thickness is much greater
than the bias which would arise due to reasonable errors in the
base level or due to the effect of underplating.
D I S C U S S I O N
The above results show that great care should be taken
in interpreting estimates of Te, and hence of the amplitude of
lithospheric flexure and the volume of volcanic edifices, from
gravity- or geoid-based seamounts loading studies of oceanic
lithosphere unless there are independent seismic constraints,
or at least the load density has been optimized to match the
gravity data. Values are likely to be underestimated by large
amounts, particularly for small loads, if a density of 2800 kg mx3
has been assumed. Most recent studies have indeed taken a
more rigorous approach, with the use of seismic constraints
(e.g. Watts et al. 1997), or simultaneous optimization of load
density and elastic thickness (e.g. Smith et al. 1989). In some of
Figure 6. (a) Bathymetry around the Marquesas Islands (Clouard et al. 2000). Land areas are shaded in grey. Contour interval is 500 m. (b) Free-air
gravity anomalies, contoured at 50 mGal intervals. (c) Residual gravity for best-fitting flexural model (Fig. 7a), contoured at 20 mGal intervals.
(d) Free-air gravity anomalies of best-fitting flexural model contoured at 50 mGal intervals.
736 T. A. Minshull and Ph. Charvis
# 2001 RAS, GJI 145, 731–739
these studies the crustal density has been fixed equal to the load
density (e.g. Filmer et al. 1993; Lyons et al. 2000). Such an
approach simplifies gravity calculations, but its effect on the
estimation of Te is not yet quantified. Even ignoring such
problems, the published global data set for seamount loading
(as compiled by e.g. Wessel 1992) is reduced to very few points
(the filled circles and squares of Fig. 1) if values using assumed
densities and values derived from ETOPO5 bathymetry and/or
low-resolution satellite gravity are excluded.
The less well-constrained values of Te (open symbols of
Fig. 1) are too scattered to resolve statistically a bias towards
lower values by comparison with the better-constrained values
(filled symbols). In some cases the bias due to using an assumed
density may be counteracted by an upward bias due, for example,
to the use of a 2-D analysis (Lyons et al. 2000). However,
it is clear from the above analysis that such a bias is likely to
be present frequently. Most published values for ocean islands
could be considerably improved by a reanalysis using ship-
board bathymetry and a combination of shipboard, land and
high-resolution satellite gravity/geoid measurements and using
an approach which maintains the load density as a free variable
or constrains it from seismic data. Without such reanalysis,
and given the variety of other possible explanations for reduced
elastic thickness beneath ocean islands and seamounts,
suggestions that the mechanical thickness of the lithosphere
is eroded significantly by plumes must be treated with some
caution.
C O N C L U S I O N S
From our study we draw the following conclusions.
(1) Ocean islands and seamounts commonly have a mean
density which is significantly lower than that of the oceanic
crust beneath.
(2) If a load density of 2800 kg mx3 is assumed in gravity
studies of flexure due to seamount loading, effective elastic
thicknesses are significantly underestimated, by an amount which
can be up to a factor of three or four for smaller loads. The infill
volume can be overestimated by a factor of at least 50 per cent,
or more in the presence of underplating.
(3) For the Marquesas Islands, where the elastic thickness
is independently constrained by seismic data, the bias in elastic
thickness which would be introduced by assuming a load density
Figure 7. Contoured root-mean-square gravity misfit (in mGal) for a series of flexural models of the Marquesas Islands with different elastic
thickness (incremented in 1 km intervals) and load densities (incremented in 50 kg mx3 intervals). Circles mark best-fitting model in each case, and
triangles mark the elastic thickness which would be inferred if a load density of 2800 kg mx3 were assumed. (a) All material above 4200 m depth is
included in the load. (b) All material above 4000 m depth is included in the load. (c) The load is considered to overly a hotspot swell defined by the
application of a 500 km median filter to the bathymetric data. (d) The top loading is as in (a), but in addition there is a basal load with an amplitude
equal to the amplitude of the top load for wavelengths larger than 350 km, of zero amplitude for wavelengths less than 250 km, and tapering between
these wavelengths, and with a density contrast equal to 25 per cent of the density contrast of the top load. This basal load approximates the underplate
inferred by Wolfe et al. (1994).
Ocean island densities 737
# 2001 RAS, GJI 145, 731–739
of 2800 kg mx3 is much larger than biases which would be
introduced by reasonable variations in the chosen base of the
load or by failing to allow for the contribution of underplating
with a volume consistent with seismic data.
(4) Few flexural studies of ocean islands and seamounts have
used data of sufficient resolution and with sufficient constraint
on load densities to give an accurate estimate of the effective
elastic thickness; the paucity of reliable values severely limits their
use in constraining models of plume–lithosphere interaction.
A C K N O W L E D G M E N T S
TAM is supported by a Royal Society University Research
Fellowship. We thank A. Watts and I. Grevemeyer for supply-
ing digital data used in Fig. 2, and P. Wessel and M. McNutt
for constructive reviews. The GMT package of Wessel & Smith
(1998) was used extensively in this study. This research was
initiated during visits by both authors to the Instituto de
Ciencias de la Tierra (Jaume Almera), Barcelona, Spain. UMR
Geosciences Azur contribution 356.
R E F E R E N C E S
Bodine, J.H., Steckler, M.S. & Watts, A.B., 1981. Observations of
flexure and rheology of the oceanic lithosphere, J. geophys. Res., 86,
3695–3707.
Bonneville, A., Barriot, J.P. & Bayer, R., 1988. Evidence from
geoid data of a hot spot origin for the southern Mascarene Plateau
and Mascarene Islands (Indian Ocean), J. geophys. Res., 93,
4199–4212.
Calmant, S., Francheteau, J. & Cazenave, A., 1990. Elastic layer
thickening with age of the oceanic lithosphere: a tool for the
prediction of the ages of volcanoes or oceanic crust, Geophys. J. Int.,
100, 59–67.
Caress, D.W., McNutt, M.K., Detrick, R.S. & Mutter, J.C., 1995.
Seismic imaging of hotspot-related crustal underplating beneath the
Marquesas Islands, Nature, 373, 600–603.
Carlson, R.L. & Herrick, C.N., 1990. Densities and porosities in the
oceanic crust and their variations with depth and age, J. geophys.
Res., 95, 9153–9170.
Charvis, P. et al., 1999. Spatial distribution of hotspot material added
to the lithosphere under La Reunion, from wide-angle seismic data,
J. geophys. Res., 104, 2875–2893.
Clouard, V., Bonneville, A. & Barsczus, H.G., 2000. Size and depth
of ancient magma reservoirs under atolls and islands of French
Polynesia using gravity data, J. geophys. Res., 105, 8173–8191.
Courtney, R.C. & White, R.S., 1986. Anomalous heat flow and
geoid across the Cape Verde Rise: evidence of dynamic support
from a thermal plume in the mantle, Geophys. J. R. astr. Soc., 87,
815–868.
Detrick, R.S. & Crough, T., 1978. Island subsidence, hotspots and
lithospheric thinning, J. geophys. Res., 83, 1236–1244.
Filmer, P.E., McNutt, M.K. & Wolfe, C.J., 1993. Elastic thickness of
the lithosphere in the Marquesas and Society Islands, J, geophys,
Res., 98, 19 565–19 577.
Gallart, J., Driad, L., Charvis, P., Hirn, A., Lepine, J.-C., Diaz, J. &
de Voogd, B., 1999. Perturbation to the lithosphere along the hotspot
track of La Reunion from an onshore-offshore seismic transect,
J. geophys. Res., 104, 2895–2908.
Goodwillie, A.M. & Watts, A.B., 1993. An altimetric and bathymetric
study of elastic thickness in the central Pacific Ocean, Earth planet.
Sci. Lett., 118, 311–326.
Gutscher, M.-A., Olivet, J.-L., Aslanian, D., Eissen, J.-P. & Maury, R.,
1999. The ‘lost Inca Plateau’: cause of flat subduction beneath Peru?,
Earth planet. Sci. Lett., 171, 335–341.
Hammer, P.T.C., Dorman, L.M., Hildebrand, J.A. & Cornuelle, B.D.,
1994. Jasper Seamount structure: seafloor seismic refraction tomo-
graphy, J. geophys. Res., 99, 6731–6752.
Harris, R.N. & Chapman, D.S., 1994. A comparison of mechanical
thickness estimates from trough and seamount loading in the south-
eastern Gulf of Alaska, J. geophys. Res., 99, 9297–9317.
Hyndman, R.D., Christensen, N.I. & Drury, M.J., 1979. Velocities,
densities, electrical resistivities, porosities, and thermal conductivities
of core samples from boreholes in the islands of Bermuda and the
Azores in Deep Drilling Results in the Atlantic Ocean: Ocean Crust,
pp. 94–112, AGU, Washington, DC.
Kruse, S.E., Liu, Z.J., Naar, D.F. & Duncan. R.A., 1997. Effective
elastic thickness of the lithosphere along the Easter Seamount Chain,
J. geophys. Res., 102, 27 305–27 317.
Lyons, S.N., Sandwell, D.T. & Smith, W.H.F., 2000. Three-dimensional
estimation of elastic thickness under the Louisville Ridge, J. geophys.
Res., 105, 13 239–13 252.
McNutt, M., 1984. Lithospheric flexure and thermal anomalies,
J. geophys. Res., 89, 11 180–11 194.
McNutt, M. & Bonneville, A., 2000. A shallow, chemical origin
for the Marquesas Swell, Geochem. Geophys. Geosys., 1, paper
1999GC000028.
McNutt, M.K., Caress, D.W., Reynolds, J., Jordahl, K.A. &
Duncan, R.A., 1997. Failure of plume theory to explain midplate
volcanism in the southern Austral islands, Nature, 389, 479–482.
Minshull, T.A., 1996. Along-axis variations in oceanic crustal density
and their contribution to gravity anomalies at slow-spreading ridges,
Geophys. Res. Lett., 23, 849–852.
Minshull, T.A. & Brozena, J.M., 1997. Gravity anomalies and
flexure of the lithosphere at Ascension Island, Geophys. J. Int.,
131, 347–360.
Parker, R.L., 1974. A new method for modeling marine gravity and
magnetic anomalies, J. geophys. Res., 79, 2014–2016.
Parsons, B. & Sclater, J.G., 1977. An analysis of the variation of
ocean floor bathymetry and heat flow with age, J. geophys. Res., 82,
803–827.
Sichoix, L., Bonneville, A. & McNutt, M.K., 1998. The seafloor
swells and Superswell in French Polynesia, J. geophys. Res., 103,
27123–27133.
Smith, W.H.F., Staudigel, H., Watts, A.B. & Pringle, M.S., 1989. The
Magellan seamounts: Early Cretaceous record of the south Pacific
isotopic and thermal anomaly, J. geophys. Res., 94, 10 501–10 523.
Stein, C.A. & Stein, S., 1992. A model for the global variation
in oceanic depth and heat flow with lithospheric age, Nature, 359,
123–129.
Von Herzen, R.P., Cordery, M.J., Detrick, R.S. & Fang, C., 1989. Heat
flow and the thermal regime of hotspot swells: the Hawaiian swell
revisited, J. geophys. Res., 83, 1236–1244.
Watts, A.B., 1994. Crustal structure, gravity anomalies and flexure of
the lithosphere in the vicinity of the Canary Islands, Geophys. J. Int.,
119, 648–666.
Watts, A.B. & ten Brink, U.S., 1989. Crustal structure, flexure
and subsidence history of the Hawaiian islands, J. geophys. Res., 94,
10 473–10 500.
Watts, A.B., Cochran, J.R. & Selzer, G., 1975. Gravity anomalies
and flexure of the lithosphere: a three-dimensional study of the
Great Meteor seamount, northeast Atlantic, J. geophys. Res., 80,
1391–1398.
Watts, A.B., Peirce, C., Collier, J., Dalwood, R., Canales, J.P. &
Henstock, T.J., 1997. A seismic study of lithospheric flexure in
the vicinity of Tenerife Canary Islands, Earth planet. Sci. Lett., 146,
431–447.
Weigel, W. & Grevemeyer, I., 1999. The Great Meteor seamount:
seismic structure of a submerged intraplate volcano, J. Geodyn., 28,
27–40.
738 T. A. Minshull and Ph. Charvis
# 2001 RAS, GJI 145, 731–739
Wessel, P., 1992. Thermal stresses and the bimodal distribution of
elastic thickness estimates of the oceanic lithosphere, J. geophys. Res.,
97, 14 177–14 193.
Wessel, P., 1998. An empirical method for optimal robust regional-
residual separation of geophysical data, Math. Geol., 30, 391–408.
Wessel, P. & Smith, W.H.F., 1998. New, improved, version, of Generic
Mapping Tools released, EOS. Trans. Am. geophys. Un, 79, 579.
White, R.S., McKenzie, D. & O’Nions, R.K., 1992. Oceanic crustal
thickness from seismic measurements and rare earth element inversions,
J. geophys. Res., 97, 19 683–19 715.
Wolfe, C.J., McNutt, M.K. & Detrick, R.S., 1994. The Marquesas
archipelagic apron: seismic stratigraphy and implications for volcano
growth, mass wasting, and crustal underplating, J. geophys. Res., 99,
13 591–13 608.
Ocean island densities 739
# 2001 RAS, GJI 145, 731–739