Embed Size (px)
Citation preview
ORGANISME CONTRACTANT : I.N.R.A. LABORATOIRE : UMR Microbiologie et Géochimie des Sols, INRA-Université de Bourgogne 17 rue Sully, B.P. 86510, 21065 DIJON cedex
EFFET DES POLLUANTS SUR LE
POTENTIEL MICROBIEN DES SOLS :
méthodes utilisables en routine pour l’analyse de la taille, de la biodiversité et des activités microbiennes des sols.
Responsables Scientifiques : R. Chaussod et G. Soulas
SUBVENTION N° 01105 du 10/08/2001 Année de remise du rapport final : 2005
Référence du Programme : GESSOL Référence de l’appel à propositions : Appel à propositions 1999-2003 Axe 1 : Qualité des sols, critères et méthodes d’évaluation MINISTÈRE DE L’ÉCOLOGIE ET DU DÉVELOPPEMENT DURABLE
1
Rapport final de contrat GESSOL
Effet des polluants sur le potentiel microbien des sols : méthodes utilisables en routine pour l’analyse de la taille, de la biodiversité et des activités microbiennes des sols.
R. CHAUSSOD, D. CHENEBY, G. LAGUERRE, F. MARTIN-LAURENT, R. NOUAÏM, L. PHILIPPOT, L. RANJARD et G. SOULAS.
Avec la participation de L. Cornet, L. Courde, A. Echairi, S. Hachair et D. Lejon
UMR Microbiologie et Géochimie des Sols, INRA-Dijon / Université de Bourgogne 17 rue Sully, B.P. 86510, 21065 DIJON cedex
Résumé : Pour pouvoir assurer une gestion durable des sols, il est nécessaire de disposer de méthodes d’évaluation de leur qualité, notamment de leurs propriétés biologiques. Une préoccupation prioritaire concerne les effets de contaminants tels que des éléments-traces métalliques et des composés traces organiques (pesticides ou autres), liés à des pratiques agricoles. Pour pouvoir apprécier ces effets sur le fonctionnement microbien des sols dans une perspective « opérationnelle », nous avons effectué des travaux dans trois domaines complémentaires : - Développement méthodologique. Des méthodes microbiologiques quantitatives et qualitatives ont été développées en vue d’une utilisation en routine pour juger de la qualité biologique des sols. Un effort particulier a porté sur les méthodes bio-moléculaires, notamment pour ce qui concerne l’extraction de l’ADN microbien directement à partir du sol et les mesures subséquentes : analyse de la structure des communautés (B-RISA et F-RISA), détection et quantification de gènes fonctionnels (atzC, nirK, nodC…). Les aspects liés à l’échantillonnage ont également été abordés, pour s’assurer d’une cohérence à toutes les étapes, depuis les prélèvement de sol au champ jusqu’aux mesures de laboratoire. La variabilité spatio-temporelle a été étudiée pour quelques indicateurs dans des conditions de champ. - Application à des situations de terrain. Diverses méthodes potentiellement utilisables comme indicateurs ont été appliquées à des situations de terrain représentant des situations contrastées : expérimentations agronomiques avec des traitements très contrastés en un même site, ou bien parcelles d’enquête ou sols plus ou moins contaminés d’une même région mais intégrant d’autres source de variation. Ceci a permis de mettre en évidence l’intérêt et les limites des méthodes disponibles. Les méthodes bio-moléculaires peuvent très utilement compléter les mesures quantitatives globales (type biomasse microbienne) en apportant des informations fines sur des populations ou des fonctions d’intérêt agro-environnemental. Toutefois, l’interprétation de ces données est parfois délicate. - Mise en place de référentiels d’interprétation. La comparaison de traitements contrastés en un même lieu par une approche polyphasique est aujourd’hui totalement opérationnelle. En revanche, la comparaison de données issues de parcelles plus ou moins éloignées, intégrant différentes sources de variation, s’avère plus délicate. On peut en partie résoudre cette difficulté en mettant en place des référentiels régionaux stratifiés par type de sol et par système de culture. Un travail important d’acquisition reste à accomplir en ce domaine.
2
Sommaire : Page Introduction 4 1ère Partie : Méthodologie. 6 A) Microbiologie quantitative classique 6 1. Echantillonnage 6 2. Variabilité spatio-temporelle 8 B) Méthodes bio-moléculaires 10 1. Optimisation du protocole d’extraction d’ADN du sol 10 2. Taille minimum d’un échantillon de sol pour analyse biomoléculaire 13 3. Mesures quantitatives et qualitatives de gènes fonctionnels 14 2ème Partie : Applications (études de cas) 15 1) Expérimentation viticole : variabilité spatiale et réponse des indicateurs. 15 2) Expérimentation de contamination mono-métallique (site « cuivre ») 17 3) Etude des sols d’une zone polluée. 19 3ème partie : Référentiels 23 1) Référentiel sols viticoles de Champagne 23 2) Référentiel sols viticoles du Beaujolais 25 Conclusion – perspectives 27 Annexes : 30 - liste des publications 30 - article 1 - article 2 - article 3
3
- Introduction :
La gestion des ressources biologiques des sols est un élément essentiel de la durabilité des écosystèmes agricoles. Il est en particulier nécessaire de s’assurer d’une permanence fonctionnelle dans un environnement changeant et de sauvegarder une capacité d’évolution permettant une adaptation à des pratiques agricoles en évolution (Holling, 1973 ; Robert et al., 2003). Des pollutions par accumulation d’éléments-traces minéraux ou de composés traces organiques (pesticides ou autres) sont susceptibles d’altérer ces fonctions.
Au plan pratique, pour assurer la gestion des ressources biologiques, il est indispensable de disposer d’indicateurs microbiologiques permettant d’évaluer les effets des polluants (et de toute action anthropique en général) sur l’abondance, la diversité et l’activité des microorganismes des sols. Ces indicateurs doivent être pertinents, fiables et interprétables (Chaussod, 2002).
Au plan de l’écologie microbienne, divers aspects doivent être pris en compte
(Eijsackers, 2001) : - la variabilité spatio-temporelle, - la diversité génotypique et phénotypique, du gène au niveau de l’écosystème, - l’adaptation microbienne aux changements environnementaux, y compris les
effets d’actions anthropiques.
Au plan méthodologique, les conditions de mise en œuvre des mesures biologiques doivent être précisées au moins à un niveau « pré-normatif » si l’on envisage une utilisation en routine.
C’est dans ce cadre que s’est située notre contribution au programme
GESSOL. Cette contribution a consisté en travaux d’ordre méthodologique et d’écologie microbienne appliquée à la notion de Qualité des Sols. Les recherches ont été résolument orientées vers « l’opérationnel », depuis les mises au point méthodologiques jusqu’aux utilisations pour suivre les impacts d’origine anthropique tels que les effets de pratiques culturales, l’utilisation de pesticides, la contamination par les éléments-traces métalliques ou les composés traces organiques.
Les travaux ont porté sur trois points complémentaires : - Fiabilisation méthodologique. Il s’agit de définir un ensemble de paramètres biologiques pertinents et de les fiabiliser en précisant leurs conditions d’utilisation. C’est le cas en particulier pour des méthodes moléculaires. - Application à des études de cas. Les paramètres retenus précédemment sont appliqués à des situations de terrain et à des dispositifs expérimentaux recevant des micropolluants organiques (pesticides) ou minéraux (éléments traces métalliques). Cette étape permet d’en comparer les propriétés de sensibilité, de reproductibilité et de facilité de mise en œuvre. - Etablissement de référentiels. L’interprétation des données biologiques doit pouvoir tenir compte des sources de variation : type de sol, système de culture, pratiques culturales (apport de matières organiques, de pesticides ou contaminants divers).
4
Les points évoqués ci-dessus ont été étudiés en s’appuyant sur divers dispositifs : - des expérimentations agronomiques, avec des contaminations connues et
maîtrisées, toutes choses étant égales par ailleurs. Ex : dispositif « Boues Ambarès » à Bordeaux.
- des situations de terrain correspondant à des niveaux de contamination variables mais essentiellemenent mono-métallique (cuivre). Ex : parcelles viticoles en Bourgogne, en Champagne, en Beaujolais, etc.
- des situations de terrain correspondant à des niveaux de contamination variables et polymétalliques. Ex : zone d’épandage des eaux usées de la ville de Paris, à Pierrelaye.
5
1ère partie : méthodologie
A) Microbiologie quantitative classique
Utilisation de méthodes biologiques classiques en routine. Des méthodes potentiellement utilisables en tant qu’indicateur biologique ont
été testées. Il s’agit de méthodes validées ou en cours de développement. La Biomasse Microbienne, mesurée par la technique de fumigation-incubation a
été retenue comme paramètre de base. Des mesures d’activités globales (minéralisation de C et N) ou particulières (nitrification, dénitrification, dégradation de pesticides) ont été effectuées au cas par cas, sous une forme standardisée à partir de protocoles existants.
Dans un objectif d’utilisation en routine pour une utilisation appliquée à des
préoccupations agro-environnementales, les travaux ont tout d’abord porté sur l’évaluation de la variabilité spatiale et spatio-temporelle, en vue de définir des stratégies d’échantillonnage applicables à des parcelles expérimentales ou à des sites plus ou moins contaminés (voir aussi 2ème partie de ce rapport), ainsi qu’à l’alimentation de référentiels d’interprétation à partir de parcelles d’enquête (voir 3ème partie de ce rapport). 1 Echantillonnage
L’une des plus importantes difficultés liées à l’utilisation des indicateurs
biologiques est leur variabilité spatio-temporelle. La variabilité spatiale a été bien étudiée pour les caractéristiques « permanentes » des sols (propriétés physico-chimiques, incluant le carbone organique total) ; elle est moins bien connue pour les caractéristiques biologiques (Parkin, 1993). La variabilité saisonnière a été également peu étudiée.
Nos travaux ont porté sur 2 points :
Prélèvement d’un échantillon « représentatif » d’une parcelle, au champ. Une stratégie d’échantillonnage a été établie à partir de l’évaluation de la
variabilité spatiale au champ, d’une part dans un contexte de grandes cultures (sol à plat, travaillé), d’autre part dans un contexte viticole (sol en pente, non travaillé). Des travaux dans ce domaine ont été aussi menés en collaboration sur des sites relevant d’autres projets du programme GESSOL. Il s’agit en particulier du projet « Impact des pratiques agricoles et sylvicoles sur les variabilités spatiales et temporelles des constituants organiques du sol et de la biomasse microbienne ; aspects méthodologiques de la surveillance, identification de compartiments fonctionnels, modélisation et généralisation spatiale » (responsable D. Arrouays) et du projet « Impact de la récolte et de la régénération des peuplements sur la fertilité des sols forestiers » (responsable J. Ranger). La variabilité spatiale de la biomasse microbienne et d’activités globales ont été comparées à la variabilité spatiale des
6
paramètres classiques de l’analyse de sol (comme la teneur en matière organique totale par exemple).
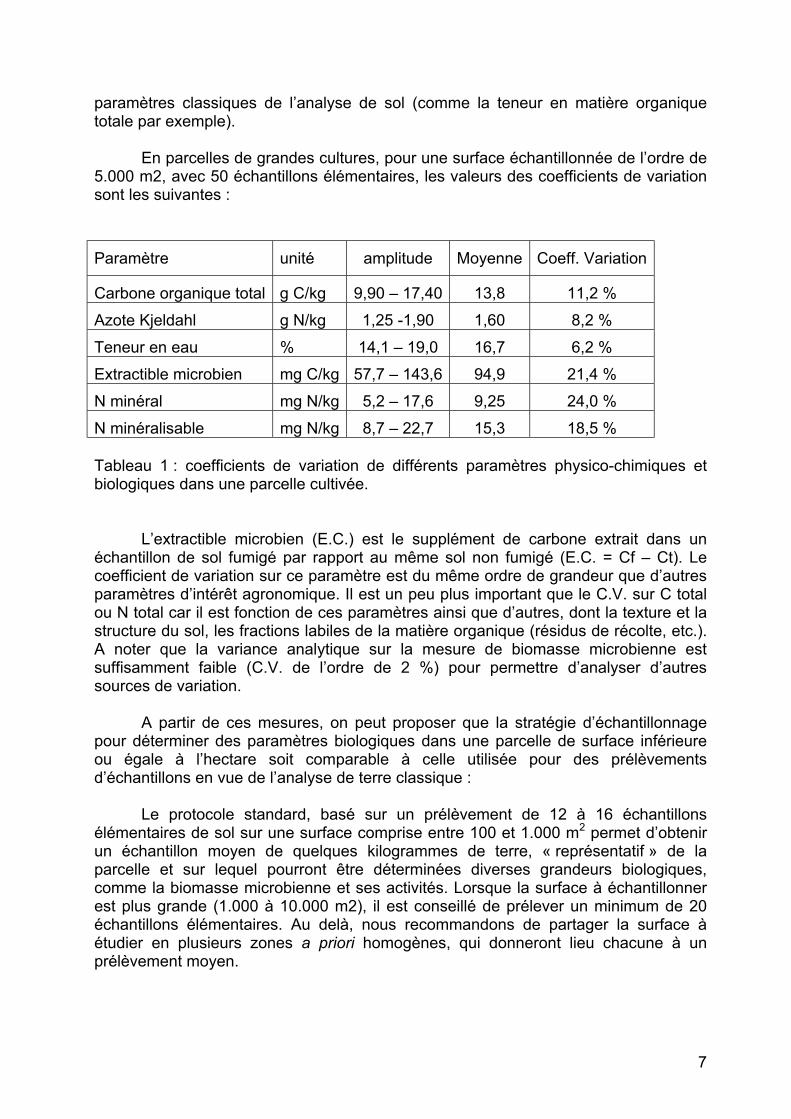
En parcelles de grandes cultures, pour une surface échantillonnée de l’ordre de
5.000 m2, avec 50 échantillons élémentaires, les valeurs des coefficients de variation sont les suivantes :
Paramètre unité amplitude Moyenne Coeff. Variation
Carbone organique total g C/kg 9,90 – 17,40 13,8 11,2 % Azote Kjeldahl g N/kg 1,25 -1,90 1,60 8,2 % Teneur en eau % 14,1 – 19,0 16,7 6,2 % Extractible microbien mg C/kg 57,7 – 143,6 94,9 21,4 % N minéral mg N/kg 5,2 – 17,6 9,25 24,0 % N minéralisable mg N/kg 8,7 – 22,7 15,3 18,5 % Tableau 1 : coefficients de variation de différents paramètres physico-chimiques et biologiques dans une parcelle cultivée.
L’extractible microbien (E.C.) est le supplément de carbone extrait dans un
échantillon de sol fumigé par rapport au même sol non fumigé (E.C. = Cf – Ct). Le coefficient de variation sur ce paramètre est du même ordre de grandeur que d’autres paramètres d’intérêt agronomique. Il est un peu plus important que le C.V. sur C total ou N total car il est fonction de ces paramètres ainsi que d’autres, dont la texture et la structure du sol, les fractions labiles de la matière organique (résidus de récolte, etc.). A noter que la variance analytique sur la mesure de biomasse microbienne est suffisamment faible (C.V. de l’ordre de 2 %) pour permettre d’analyser d’autres sources de variation.
A partir de ces mesures, on peut proposer que la stratégie d’échantillonnage
pour déterminer des paramètres biologiques dans une parcelle de surface inférieure ou égale à l’hectare soit comparable à celle utilisée pour des prélèvements d’échantillons en vue de l’analyse de terre classique :
Le protocole standard, basé sur un prélèvement de 12 à 16 échantillons
élémentaires de sol sur une surface comprise entre 100 et 1.000 m2 permet d’obtenir un échantillon moyen de quelques kilogrammes de terre, « représentatif » de la parcelle et sur lequel pourront être déterminées diverses grandeurs biologiques, comme la biomasse microbienne et ses activités. Lorsque la surface à échantillonner est plus grande (1.000 à 10.000 m2), il est conseillé de prélever un minimum de 20 échantillons élémentaires. Au delà, nous recommandons de partager la surface à étudier en plusieurs zones a priori homogènes, qui donneront lieu chacune à un prélèvement moyen.
7
L’échantillon de terre est rapporté au laboratoire, tamisé à 5-6 mm à l’état frais et conservé à 4°C jusqu’à utilisation. Le tamisage assure une homogénéisation de l’échantillon de sol et permet des prises d’essai « représentatives » pour les mesures biologiques quantitatives classiques.
Les mesures de biomasse microbienne et d’activités globales (minéralisation du
carbone et de l’azote) portent sur des échantillons de 20 à 40 grammes de sol, à raison de 3 ou 4 répétitions analytiques par mesure. Nous avons étudié des tailles d’échantillon de 0,5g, 1g, 2g, 5g, 10g, 20g et 40g. Sous réserve d’adapter le protocole expérimental, on obtient des résultats comparables (pour les valeurs moyennes) quelle que soit la taille de l’échantillon, mais l’incertitude associée (écart-type) augmente rapidement lorsque la prise d’échantillon descend en dessous de 10 g.
Les mesures de nitrification, dénitrification, dégradation de pesticides (etc.)
portent sur des échantillons de 10 à 20 g de sol, avec 3 ou 4 répétitions analytiques. De même, des populations particulières (Rhizobiacées, champignons endomycorhiziens) sont déterminées sur des échantillons unitaires de 10 g de sol, avec 3 répétitions analytiques par traitement.
Ces procédures assurent des résultats fiables, avec une variance analytique suffisamment faible (typiquement de l’ordre de + 5% et toujours < 10 %), permettant de mettre en évidence des différences statistiquement significatives entre traitements. 2. Variabilité spatio-temporelle.
Des échantillons de sols ont été prélevés à différentes dates dans des parcelles
de dispositifs expérimentaux de terrain. Il s’agit des dispositifs d’Epoisses et d’Auvillars, formés de 3 traitements répétés 4 fois (4 blocs). La variabilité spatiale liée à l’effet blocs et la variabilité temporelle (prélèvements à T0 puis après 1, 2, 4 et 12 mois) a été mesurée et rapprochée de la variabilité des paramètres physico-chimiques (dont l’humidité du sol lors du prélèvement). Sous réserve d’une humidité suffisante des sols (pas de stress hydrique), la biomasse microbienne s’avère relativement stable.
A titre d’exemple, on donne dans le tableau 2 page suivante les résultats obtenus sur le site d’Epoisses ; des résultats comparables ont été obtenus sur le site d’Auvillars. Ce dispositif expérimental comprend 4 blocs (notés I à IV dans le tableau). Les valeurs du carbone extractible microbien (E.C.) sont données en mg C/kg de sol ; les chiffres correspondent à la moyenne + écart-type pour 3 répétitions analytiques. Pour chaque échantillon et chaque date, on donne également la teneur en eau pondérale (en %). Si l’on se situe dans la perspective d’une étude in situ des effets de traitements, il faut prendre en considération à la fois la variabilité spatiale et la variabilité temporelle. Cette dernière est liée aux variations des conditions pédoclimatiques, d’origine naturelle ou anthropique. L’ordre de grandeur du coefficient de variation (10 à 20 %), tel qu’il apparaît dans le tableau 2 ci-dessous, donne une indication intéressante sur les différences qui peuvent être mises en évidence entre traitements
8
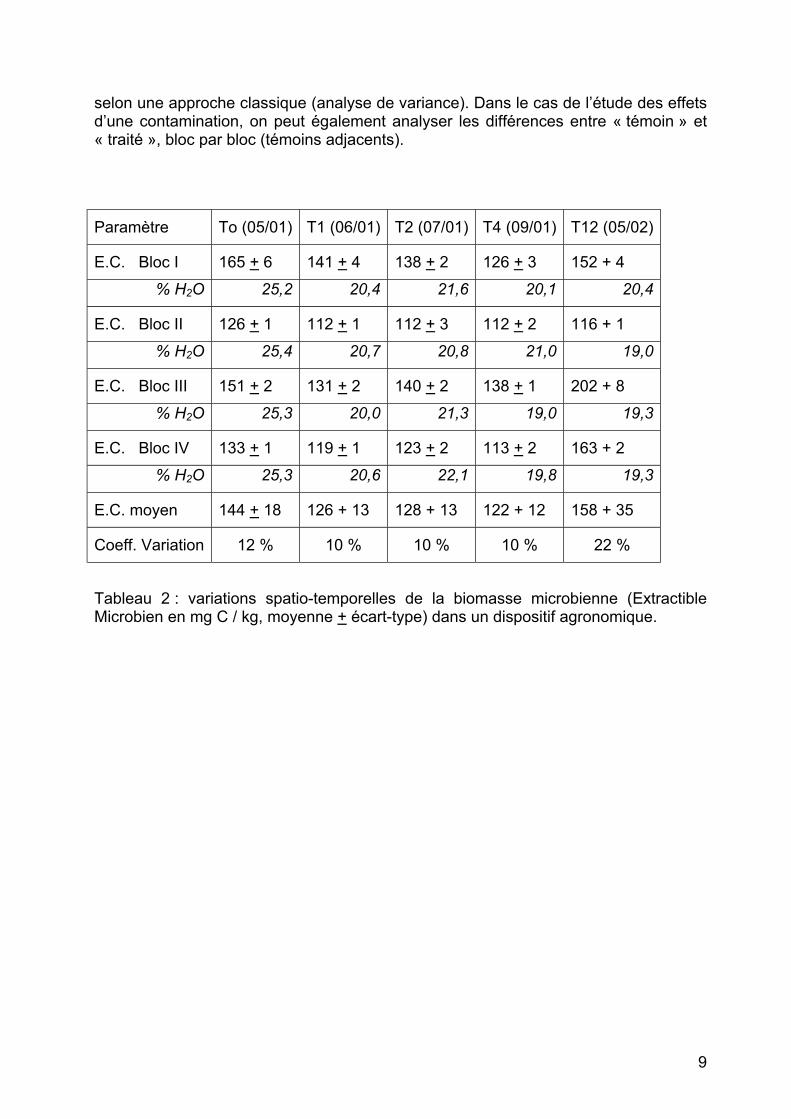
selon une approche classique (analyse de variance). Dans le cas de l’étude des effets d’une contamination, on peut également analyser les différences entre « témoin » et « traité », bloc par bloc (témoins adjacents).
Paramètre To (05/01) T1 (06/01) T2 (07/01) T4 (09/01) T12 (05/02)
E.C. Bloc I 165 + 6 141 + 4 138 + 2 126 + 3 152 + 4 % H2O 25,2 20,4 21,6 20,1 20,4
E.C. Bloc II 126 + 1 112 + 1 112 + 3 112 + 2 116 + 1 % H2O 25,4 20,7 20,8 21,0 19,0
E.C. Bloc III 151 + 2 131 + 2 140 + 2 138 + 1 202 + 8 % H2O 25,3 20,0 21,3 19,0 19,3
E.C. Bloc IV 133 + 1 119 + 1 123 + 2 113 + 2 163 + 2 % H2O 25,3 20,6 22,1 19,8 19,3
E.C. moyen 144 + 18 126 + 13 128 + 13 122 + 12 158 + 35
Coeff. Variation 12 % 10 % 10 % 10 % 22 % Tableau 2 : variations spatio-temporelles de la biomasse microbienne (Extractible Microbien en mg C / kg, moyenne + écart-type) dans un dispositif agronomique.
9
B) Méthodes bio-moléculaires
Les méthodes biomoléculaires sont basées sur l’extraction de l’ADN microbien à partir du sol, puis l’utilisation de cet ADN pour apprécier divers aspects des populations microbiennes et de leurs potentialités. Ceci recouvre d’une part des déterminations quantitatives ou qualitative liées aux fonctions agro-environnementales des sols (détection, quantification et recherche du polymorphisme de gènes de fonction), d’autre part la description de la structure des communautés bactériennes ou fongiques par des méthodes plus globales telles que l’ARISA ou la T-RFLP. Ces dernières méthodes sont appelées « empreintes moléculaires » (DNA fingerprints). La technique privilégiée ici a été l’ARISA (automatic ribosomal intergenic spacer analysis). Elle consiste à analyser le polymorphisme de longueur de l’espace intergénique de l’ADNr 16S-23S chez les bactéries (B-ARISA) et 18S-26S chez les champignons (F-ARISA).
Par ailleurs, une caractéristique de ces méthodes est qu’elles sont adaptées à l’utilisation de très faibles quantités d’ADN. Ce qui peut être un avantage au plan microbiologique pur (en microbiologie médicale par exemple) peut s’avérer un inconvénient en microbiologie des sols, en raison de l’hétérogénéité du milieu sol qui nécessite de travailler sur des échantillons de taille suffisante pour qu’ils soient aussi « représentatifs » que possible. Ceci est particulièrement important pour des applications agro-environnementales des méthodes biomoléculaires ; cet aspect d’échantillonnage a donc donné lieu à une étude spécifique. L’ensemble des travaux effectués dans le domaine biomoléculaire est présenté ci-dessous. Les publications issues de ces travaux sont données in extenso en annexe, en raison de leur importance pour ce compte-rendu d’activité. 1) Optimisation du protocole d’extraction de l’ADN du sol.
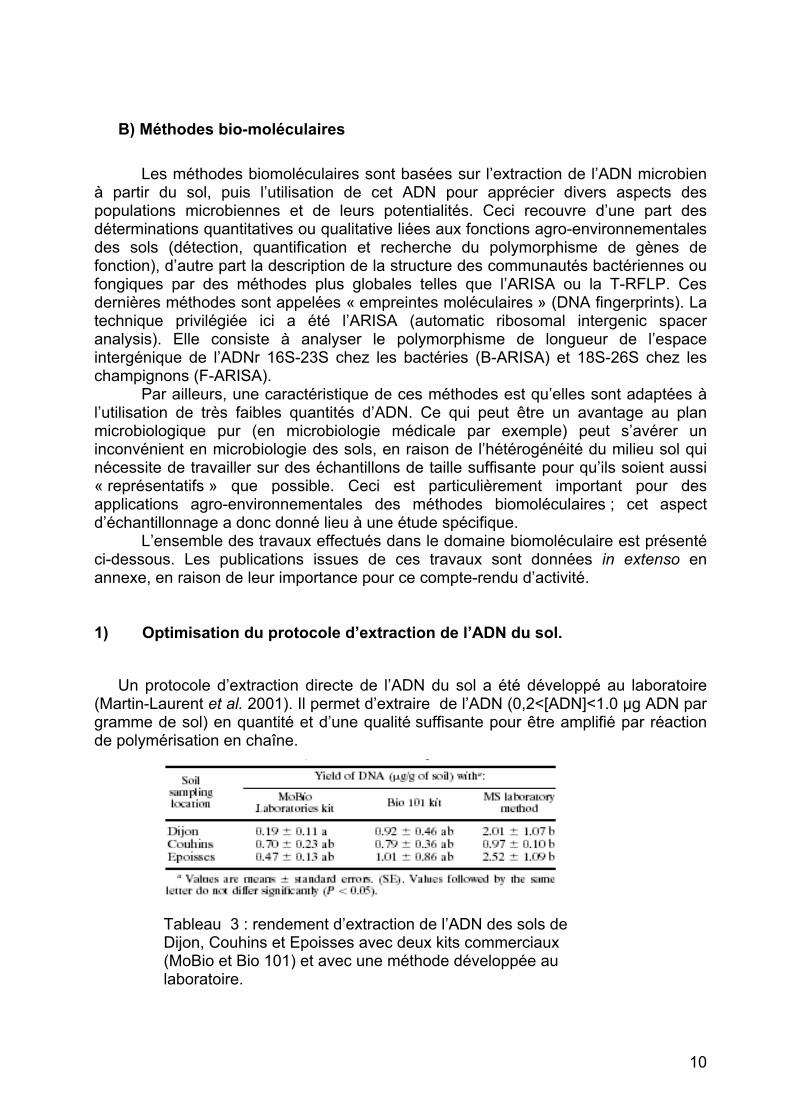
Un protocole d’extraction directe de l’ADN du sol a été développé au laboratoire (Martin-Laurent et al. 2001). Il permet d’extraire de l’ADN (0,2<[ADN]<1.0 µg ADN par gramme de sol) en quantité et d’une qualité suffisante pour être amplifié par réaction de polymérisation en chaîne. Tableau 3 : rendement d’extraction de l’ADN des sols de
Dijon, Couhins et Epoisses avec deux kits commerciaux (MoBio et Bio 101) et avec une méthode développée au laboratoire.
10
Cette méthode a été comparée à deux kits commerciaux (MoBio et Bio 101). L’analyse des rendements d’extraction d’ADN de trois sols agricoles différents montre que la méthode développée au laboratoire présente le meilleur rendement (Tableau 3). La différence est particulièrement marquée dans les sols argileux (Dijon et Epoisses) où notre méthode extrait deux fois plus d’ADN que les kits commerciaux.
Notons aussi que les quantités d’ADN extraites par notre méthode sont globalement en accord avec le niveau de la biomasse microbienne des 3 sols étudiés, ce qui n’est pas le cas pour le kit MoBio par exemple.
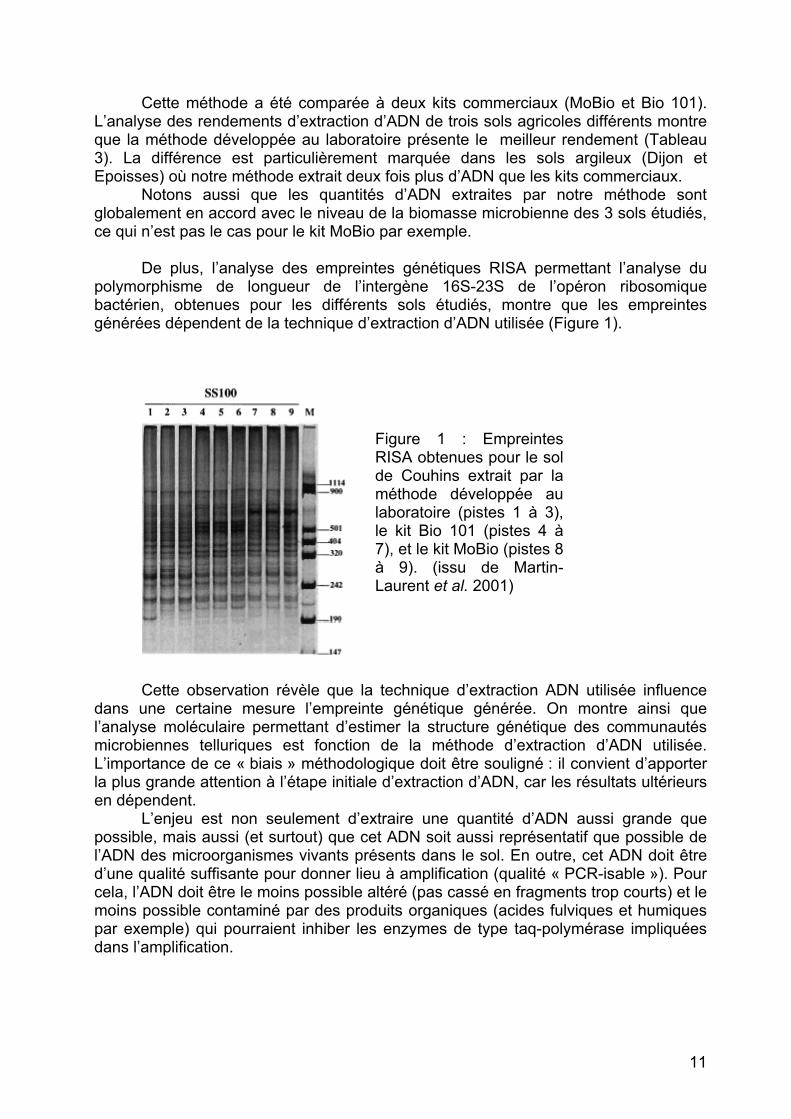
De plus, l’analyse des empreintes génétiques RISA permettant l’analyse du polymorphisme de longueur de l’intergène 16S-23S de l’opéron ribosomique bactérien, obtenues pour les différents sols étudiés, montre que les empreintes générées dépendent de la technique d’extraction d’ADN utilisée (Figure 1).
Figure 1 : Empreintes
RISA obtenues pour le solde Couhins extrait par laméthode développée aulaboratoire (pistes 1 à 3),le kit Bio 101 (pistes 4 à7), et le kit MoBio (pistes 8à 9). (issu de Martin-Laurent et al. 2001)
Cette observation révèle que la technique d’extraction ADN utilisée influence dans une certaine mesure l’empreinte génétique générée. On montre ainsi que l’analyse moléculaire permettant d’estimer la structure génétique des communautés microbiennes telluriques est fonction de la méthode d’extraction d’ADN utilisée. L’importance de ce « biais » méthodologique doit être souligné : il convient d’apporter la plus grande attention à l’étape initiale d’extraction d’ADN, car les résultats ultérieurs en dépendent.
L’enjeu est non seulement d’extraire une quantité d’ADN aussi grande que possible, mais aussi (et surtout) que cet ADN soit aussi représentatif que possible de l’ADN des microorganismes vivants présents dans le sol. En outre, cet ADN doit être d’une qualité suffisante pour donner lieu à amplification (qualité « PCR-isable »). Pour cela, l’ADN doit être le moins possible altéré (pas cassé en fragments trop courts) et le moins possible contaminé par des produits organiques (acides fulviques et humiques par exemple) qui pourraient inhiber les enzymes de type taq-polymérase impliquées dans l’amplification.
11
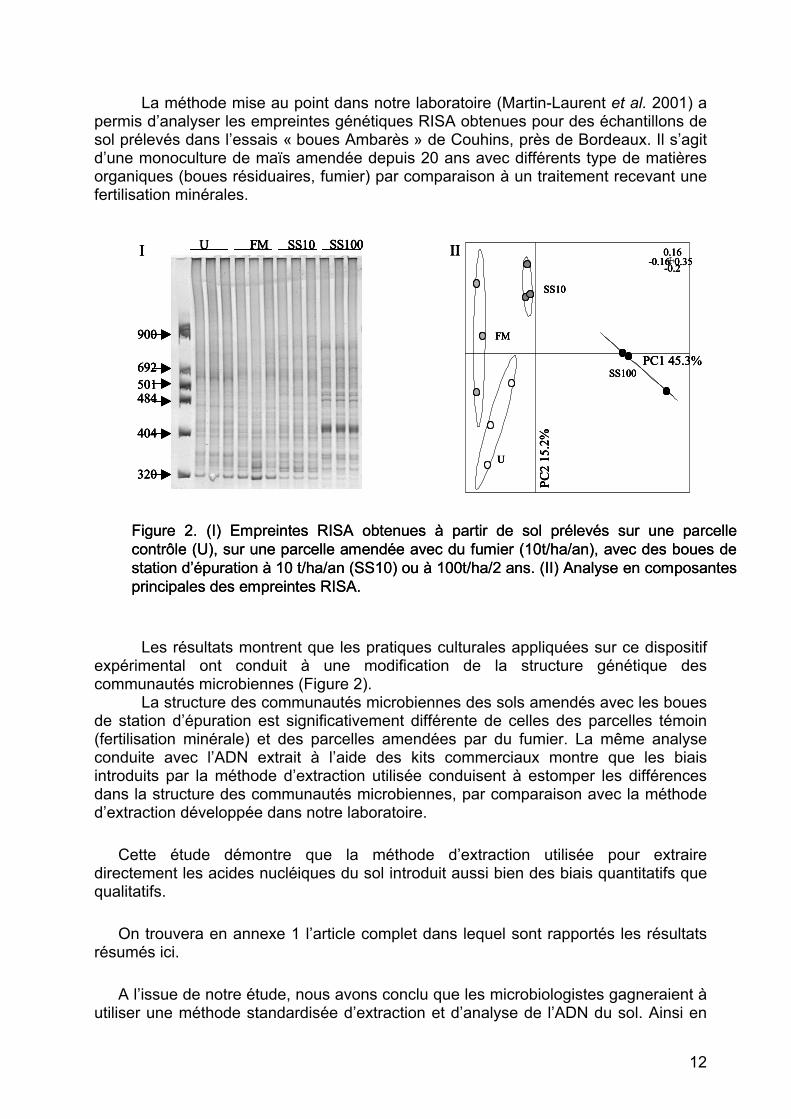
La méthode mise au point dans notre laboratoire (Martin-Laurent et al. 2001) a permis d’analyser les empreintes génétiques RISA obtenues pour des échantillons de sol prélevés dans l’essais « boues Ambarès » de Couhins, près de Bordeaux. Il s’agit d’une monoculture de maïs amendée depuis 20 ans avec différents type de matières organiques (boues résiduaires, fumier) par comparaison à un traitement recevant une fertilisation minérales.
-0.20.16
-0.16 0.35
FM
U
SS10
SS100
PC2
15.2
%
PC1 45.3%
IISS100SS10FMU
900
692501484
404
320
I
Figure 2. (I) Empreintes RISA obtenues à partir de sol prélevés sur une parcelle contrôle (U), sur une parcelle amendée avec du fumier (10t/ha/an), avec des boues de station d’épuration à 10 t/ha/an (SS10) ou à 100t/ha/2 ans. (II) Analyse en composantes principales des empreintes RISA.
-0.20.16
-0.16 0.35
FM
U
SS10
SS100
PC2
15.2
%
PC1 45.3%
IISS100SS10FMU
900
692501484
404
320
I-0.20.16
-0.16 0.35
FM
U
SS10
SS100
PC2
15.2
%
PC1 45.3%
II-0.20.16
-0.16 0.35
FM
U
SS10
SS100
PC2
15.2
%
PC1 45.3%
IISS100SS10FMU SS100SS10FMU
900
692501484
404
320
900
692501484
404
320
I
Figure 2. (I) Empreintes RISA obtenues à partir de sol prélevés sur une parcelle contrôle (U), sur une parcelle amendée avec du fumier (10t/ha/an), avec des boues de station d’épuration à 10 t/ha/an (SS10) ou à 100t/ha/2 ans. (II) Analyse en composantes principales des empreintes RISA.
Les résultats montrent que les pratiques culturales appliquées sur ce dispositif
expérimental ont conduit à une modification de la structure génétique des communautés microbiennes (Figure 2).
La structure des communautés microbiennes des sols amendés avec les boues de station d’épuration est significativement différente de celles des parcelles témoin (fertilisation minérale) et des parcelles amendées par du fumier. La même analyse conduite avec l’ADN extrait à l’aide des kits commerciaux montre que les biais introduits par la méthode d’extraction utilisée conduisent à estomper les différences dans la structure des communautés microbiennes, par comparaison avec la méthode d’extraction développée dans notre laboratoire.
Cette étude démontre que la méthode d’extraction utilisée pour extraire directement les acides nucléiques du sol introduit aussi bien des biais quantitatifs que qualitatifs.
On trouvera en annexe 1 l’article complet dans lequel sont rapportés les résultats résumés ici.
A l’issue de notre étude, nous avons conclu que les microbiologistes gagneraient à utiliser une méthode standardisée d’extraction et d’analyse de l’ADN du sol. Ainsi en
12
septembre 2004, nous avons proposé à l’AFNOR (Association Française pour la Normalisation) de normaliser la technique d’extraction de l’ADN du sol. Cette proposition a été retenue par l’AFNOR qui a poussé cette norme au niveau de l’ISO (International Standardization Organization). F Martin-Laurent a été nommé expert français au sein de l’AFNOR, chargé de présenter cette norme à l’ISO. 2) Echantillonnage : définition de la taille minimum d’un échantillon de sol
pour analyses bio-moléculaires sur ADN extrait du sol.
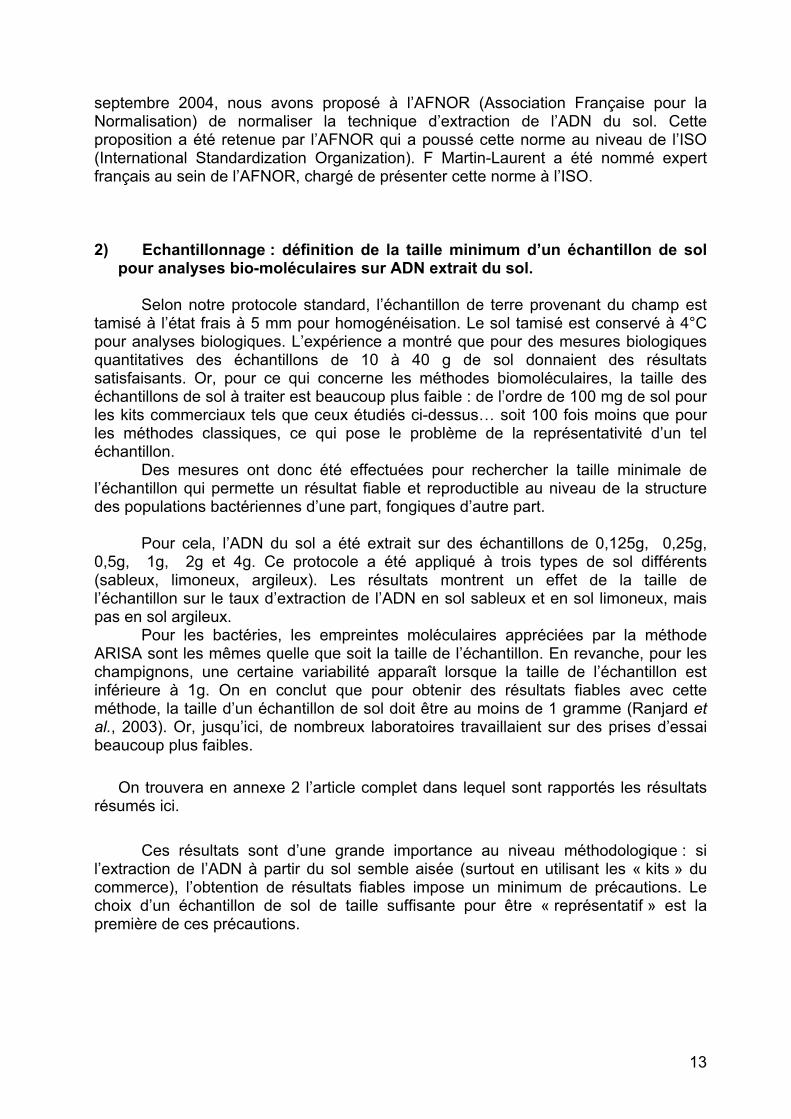
Selon notre protocole standard, l’échantillon de terre provenant du champ est tamisé à l’état frais à 5 mm pour homogénéisation. Le sol tamisé est conservé à 4°C pour analyses biologiques. L’expérience a montré que pour des mesures biologiques quantitatives des échantillons de 10 à 40 g de sol donnaient des résultats satisfaisants. Or, pour ce qui concerne les méthodes biomoléculaires, la taille des échantillons de sol à traiter est beaucoup plus faible : de l’ordre de 100 mg de sol pour les kits commerciaux tels que ceux étudiés ci-dessus… soit 100 fois moins que pour les méthodes classiques, ce qui pose le problème de la représentativité d’un tel échantillon.
Des mesures ont donc été effectuées pour rechercher la taille minimale de l’échantillon qui permette un résultat fiable et reproductible au niveau de la structure des populations bactériennes d’une part, fongiques d’autre part.
Pour cela, l’ADN du sol a été extrait sur des échantillons de 0,125g, 0,25g,
0,5g, 1g, 2g et 4g. Ce protocole a été appliqué à trois types de sol différents (sableux, limoneux, argileux). Les résultats montrent un effet de la taille de l’échantillon sur le taux d’extraction de l’ADN en sol sableux et en sol limoneux, mais pas en sol argileux.
Pour les bactéries, les empreintes moléculaires appréciées par la méthode ARISA sont les mêmes quelle que soit la taille de l’échantillon. En revanche, pour les champignons, une certaine variabilité apparaît lorsque la taille de l’échantillon est inférieure à 1g. On en conclut que pour obtenir des résultats fiables avec cette méthode, la taille d’un échantillon de sol doit être au moins de 1 gramme (Ranjard et al., 2003). Or, jusqu’ici, de nombreux laboratoires travaillaient sur des prises d’essai beaucoup plus faibles.
On trouvera en annexe 2 l’article complet dans lequel sont rapportés les résultats résumés ici. Ces résultats sont d’une grande importance au niveau méthodologique : si l’extraction de l’ADN à partir du sol semble aisée (surtout en utilisant les « kits » du commerce), l’obtention de résultats fiables impose un minimum de précautions. Le choix d’un échantillon de sol de taille suffisante pour être « représentatif » est la première de ces précautions.
13
3) Utilisation des méthodes bio-moléculaires pour des mesures
quantitatives et qualitatives liées aux fonctions agro-environnementales des sols. Bien que la caractérisation des communautés microbiennes fonctionnelles soit une
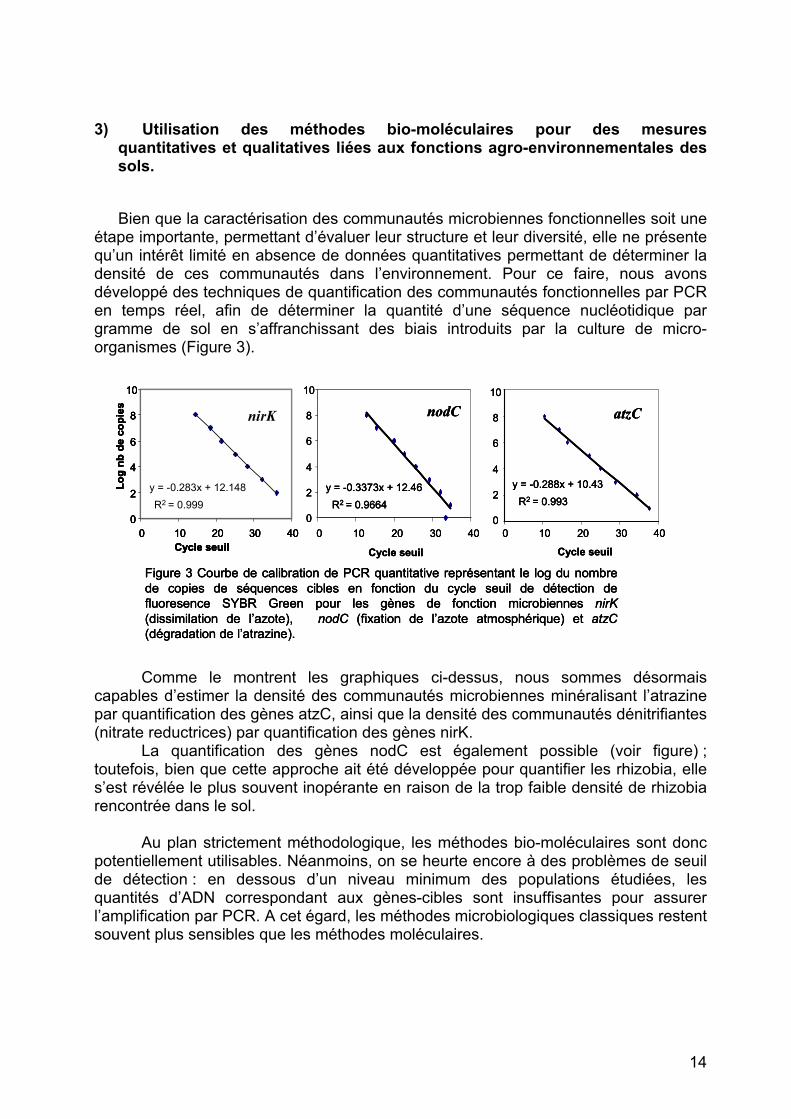
étape importante, permettant d’évaluer leur structure et leur diversité, elle ne présente qu’un intérêt limité en absence de données quantitatives permettant de déterminer la densité de ces communautés dans l’environnement. Pour ce faire, nous avons développé des techniques de quantification des communautés fonctionnelles par PCR en temps réel, afin de déterminer la quantité d’une séquence nucléotidique par gramme de sol en s’affranchissant des biais introduits par la culture de micro-organismes (Figure 3).
0 10 20 30 4
Cycle seuil
y = -0.288x + 10.43R2 = 0.993
0
2
4
6
8
10
atzC
y = -0.3373x + 12.46R2 = 0.9664
0
2
4
6
8
10
0 10 20 30 40
Cycle seuil
nodC
Log
nbde
cop
ies
0
2
4
6
8
10
0 10 20 30 40
nirK
y = -0.283x + 12.148R2 = 0.999
Cycle seuil
Figure 3 Courbe de calibration de PCR quantitative représentant le log du nombre de copies de séquences cibles en fonction du cycle seuil de détection de fluoresence SYBR Green pour les gènes de fonction microbiennes nirK(dissimilation de l’azote), nodC (fixation de l’azote atmosphérique) et atzC(dégradation de l’atrazine).
0 10 20 30 4
Cycle seuil
y = -0.288x + 10.43R2 = 0.993
0
2
4
6
8
10
atzC
0 10 20 30 4
Cycle seuil
y = -0.288x + 10.43R2 = 0.993
0
2
4
6
8
10
atzC
y = -0.3373x + 12.46R2 = 0.9664
0
2
4
6
8
10
0 10 20 30 40
Cycle seuil
nodC
y = -0.3373x + 12.46R2 = 0.9664
0
2
4
6
8
10
0 10 20 30 40
Cycle seuil
nodC
Log
nbde
cop
ies
0
2
4
6
8
10
0 10 20 30 40
nirK
y = -0.283x + 12.148R2 = 0.999
Cycle seuil
Figure 3 Courbe de calibration de PCR quantitative représentant le log du nombre de copies de séquences cibles en fonction du cycle seuil de détection de fluoresence SYBR Green pour les gènes de fonction microbiennes nirK(dissimilation de l’azote), nodC (fixation de l’azote atmosphérique) et atzC(dégradation de l’atrazine).
Log
nbde
cop
ies
0
2
4
6
8
10
0 10 20 30 40
nirK
y = -0.283x + 12.148R2 = 0.999
Cycle seuil
Log
nbde
cop
ies
0
2
4
6
8
10
0 10 20 30 40
nirK
y = -0.283x + 12.148R2 = 0.999
Cycle seuil
Figure 3 Courbe de calibration de PCR quantitative représentant le log du nombre de copies de séquences cibles en fonction du cycle seuil de détection de fluoresence SYBR Green pour les gènes de fonction microbiennes nirK(dissimilation de l’azote), nodC (fixation de l’azote atmosphérique) et atzC(dégradation de l’atrazine).
000
Comme le montrent les graphiques ci-dessus, nous sommes désormais
capables d’estimer la densité des communautés microbiennes minéralisant l’atrazine par quantification des gènes atzC, ainsi que la densité des communautés dénitrifiantes (nitrate reductrices) par quantification des gènes nirK.
La quantification des gènes nodC est également possible (voir figure) ; toutefois, bien que cette approche ait été développée pour quantifier les rhizobia, elle s’est révélée le plus souvent inopérante en raison de la trop faible densité de rhizobia rencontrée dans le sol.
Au plan strictement méthodologique, les méthodes bio-moléculaires sont donc
potentiellement utilisables. Néanmoins, on se heurte encore à des problèmes de seuil de détection : en dessous d’un niveau minimum des populations étudiées, les quantités d’ADN correspondant aux gènes-cibles sont insuffisantes pour assurer l’amplification par PCR. A cet égard, les méthodes microbiologiques classiques restent souvent plus sensibles que les méthodes moléculaires.
14
2ème partie : Etude de cas
L’application de contaminations mono-métalliques à des systèmes expérimentaux bien contrôlés (microcosmes de sol) a permis de réduire les sources de variation et de mettre en évidence les effets des traitements sur les paramètres mesurés. Un ensemble de déterminations quantitatives (biomasse microbienne, activités) et qualitatives (empreintes moléculaires) s’avère potentiellement utilisable. Les méthodes retenues ci-dessus, après optimisation et adaptation aux déterminations de routine, ont été appliquées à différentes situations pour évaluer les effets de différents traitements ou contaminations, dans un environnement marqué par une variabilité spatio-temporelle naturelle. 1) Expérimentation en milieu viticole : variabilité spatiale et réponse des indicateurs.
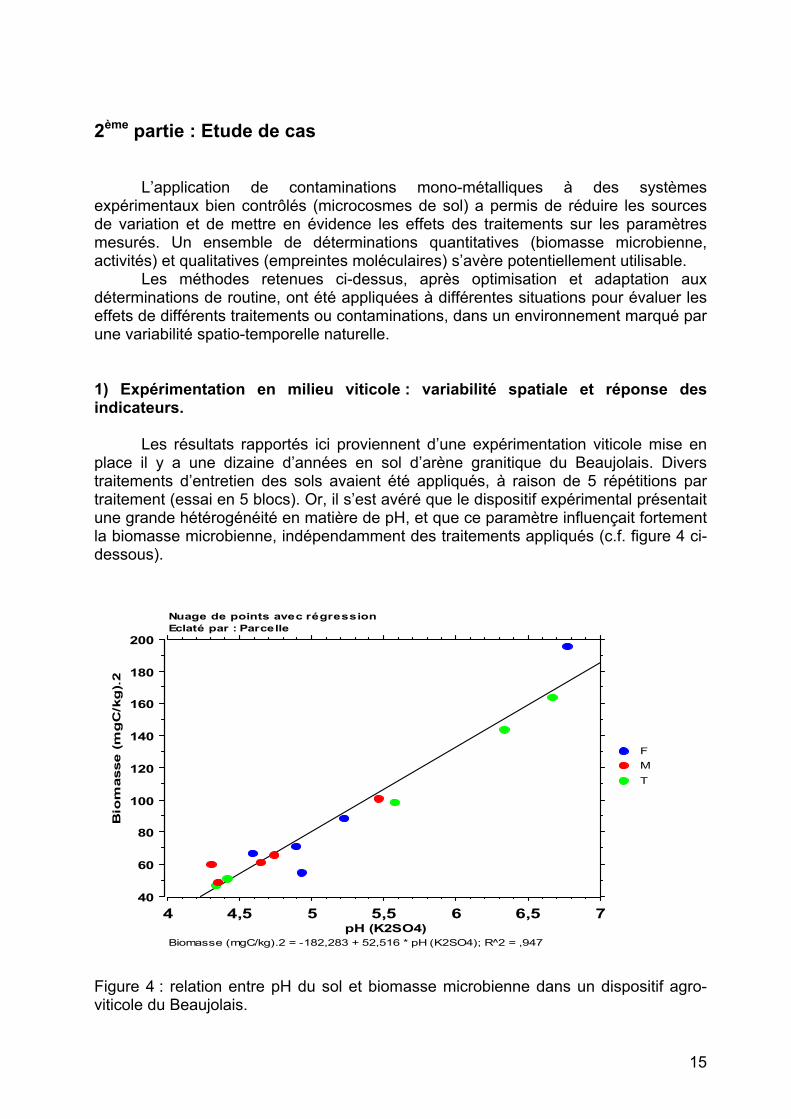
Les résultats rapportés ici proviennent d’une expérimentation viticole mise en
place il y a une dizaine d’années en sol d’arène granitique du Beaujolais. Divers traitements d’entretien des sols avaient été appliqués, à raison de 5 répétitions par traitement (essai en 5 blocs). Or, il s’est avéré que le dispositif expérimental présentait une grande hétérogénéité en matière de pH, et que ce paramètre influençait fortement la biomasse microbienne, indépendamment des traitements appliqués (c.f. figure 4 ci-dessous).
40
60
80
100
120
140
160
180
200
Bio
masse (
mg
C/k
g).
2
4 4,5 5 5,5 6 6,5 7pH (K2SO4)
TMF
Biomasse (mgC/kg).2 = -182,283 + 52,516 * pH (K2SO4); R^2 = ,947
Nuage de points avec régressionEclaté par : Parcelle
Figure 4 : relation entre pH du sol et biomasse microbienne dans un dispositif agro-viticole du Beaujolais.
15
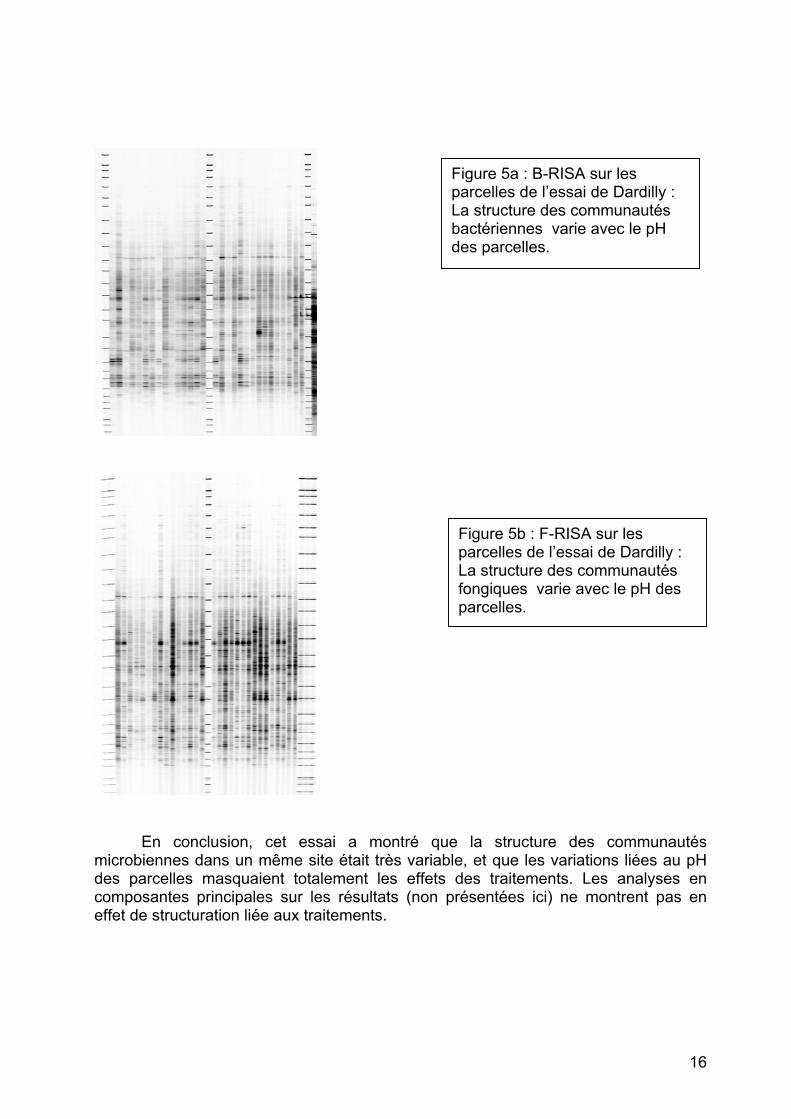
Figure 5a : B-RISA sur les parcelles de l’essai de Dardilly : La structure des communautés bactériennes varie avec le pH des parcelles.
Figure 5b : F-RISA sur les parcelles de l’essai de Dardilly : La structure des communautés fongiques varie avec le pH des parcelles.
En conclusion, cet essai a montré que la structure des communautés microbiennes dans un même site était très variable, et que les variations liées au pH des parcelles masquaient totalement les effets des traitements. Les analyses en composantes principales sur les résultats (non présentées ici) ne montrent pas en effet de structuration liée aux traitements.
16
2) Etude des effets de contamination mono-métallique.
2.1) Enquête en sols viticoles de Bourgogne
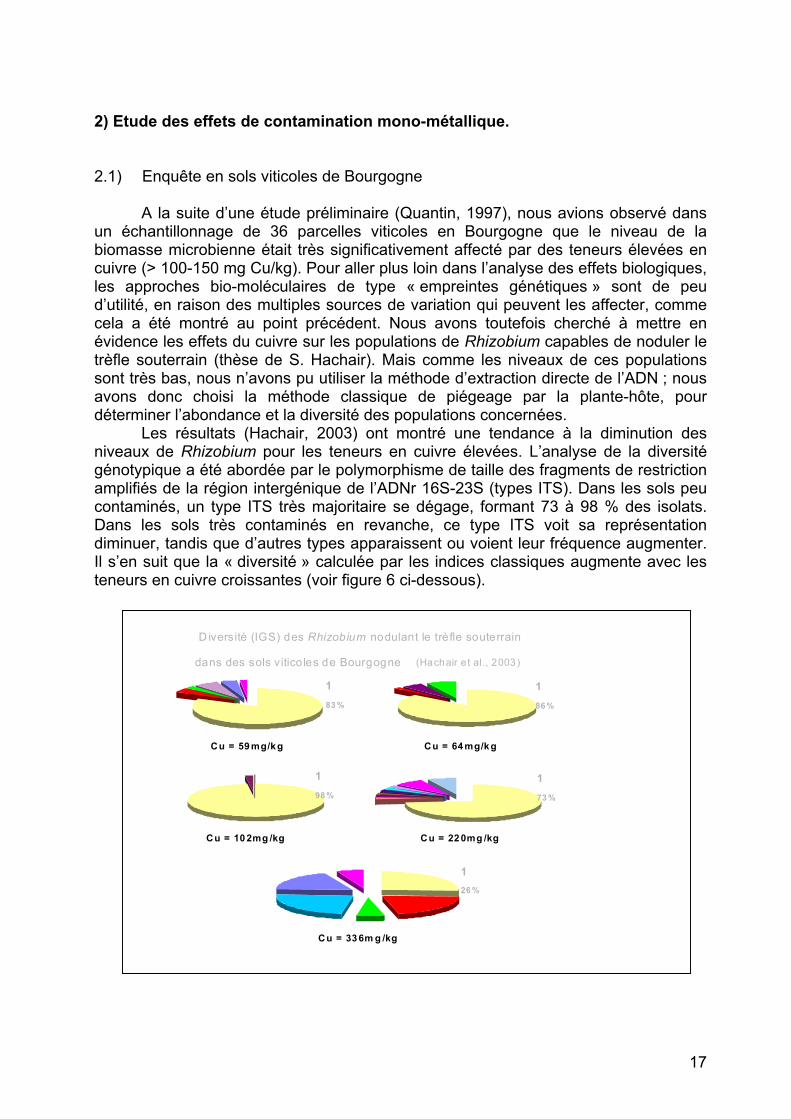
A la suite d’une étude préliminaire (Quantin, 1997), nous avions observé dans un échantillonnage de 36 parcelles viticoles en Bourgogne que le niveau de la biomasse microbienne était très significativement affecté par des teneurs élevées en cuivre (> 100-150 mg Cu/kg). Pour aller plus loin dans l’analyse des effets biologiques, les approches bio-moléculaires de type « empreintes génétiques » sont de peu d’utilité, en raison des multiples sources de variation qui peuvent les affecter, comme cela a été montré au point précédent. Nous avons toutefois cherché à mettre en évidence les effets du cuivre sur les populations de Rhizobium capables de noduler le trèfle souterrain (thèse de S. Hachair). Mais comme les niveaux de ces populations sont très bas, nous n’avons pu utiliser la méthode d’extraction directe de l’ADN ; nous avons donc choisi la méthode classique de piégeage par la plante-hôte, pour déterminer l’abondance et la diversité des populations concernées. Les résultats (Hachair, 2003) ont montré une tendance à la diminution des niveaux de Rhizobium pour les teneurs en cuivre élevées. L’analyse de la diversité génotypique a été abordée par le polymorphisme de taille des fragments de restriction amplifiés de la région intergénique de l’ADNr 16S-23S (types ITS). Dans les sols peu contaminés, un type ITS très majoritaire se dégage, formant 73 à 98 % des isolats. Dans les sols très contaminés en revanche, ce type ITS voit sa représentation diminuer, tandis que d’autres types apparaissent ou voient leur fréquence augmenter. Il s’en suit que la « diversité » calculée par les indices classiques augmente avec les teneurs en cuivre croissantes (voir figure 6 ci-dessous).
Diversité (IGS) des Rhizobium nodulant le trèfle souterrain
dans des sols vitico les de Bourgogne (Hachair e t al., 2003)
Cu = 59 mg/kg
183 %
Cu = 64 mg/kg
186 %
Cu = 22 0mg /kg
173 %
Cu = 33 6m g /kg
126 %
Cu = 10 2mg /kg
198 %
17
Outre la diversité au niveau de l’intergène 16S-23S (types ITS), les travaux ont porté également sur le polymorphisme des gènes impliqués dans la symbiose (Hachair, 2003). Il s’agit des gènes nodC (l’un des gènes impliqués dans la nodulation) et des gènes nifH (l’un des gènes impliqués dans la fixation d’azote). Il apparaît que le typage par ITS (chromosomique) et le typage par nodC (plasmidique) ne sont pas totalement indépendants, en raison d’associations préférentielles.
Enfin, l’efficacité des souches pour la fixation d’azote a été mesurée en serre, par inoculation de plants de trèfle souterrain poussant sur support minéral (Terragreen) irrigué par une solution nutritive sans azote. Les souches isolées des parcelles plus ou moins contaminées par le cuivre ont ainsi pu être classées selon leur efficacité à fixer l’azote. Cette efficience peut donc elle-même être mise en relation avec les typages ci-dessus (notamment nodC et nifH). Les souches isolées des parcelles les plus contaminées apparaissent globalement moins efficientes que celles isolées des sols peu contaminés. Au niveau méthodologique, le gène de fonction nifH s’est avéré être le meilleur marqueur de l’efficience à fixer l’azote.
En raison des « associations préférentielles » entre types ITS et types symbiotiques, ceci peut être la conséquence indirecte des effets du cuivre sur la structure des populations de Rhizobium : les différences observées au niveau du génome se traduiraient par une diminution de l’efficacité de la fixation biologique de l’azote par les populations concernées. Toutefois, une souche isolée de l’un des sols les plus contaminés se retrouve dans le lot de tête en matière d’efficacité. Les résultats de ce travail montrent que le modèle « Rhizobium / trèfle souterrain » représente un modèle de choix en tant qu’indicateur biologique de l’impact du cuivre dans les sols (Chaussod et al., 2003). Ce modèle permet d’aborder toutes les facettes d’une fonction-clé : abondance des populations concernées, diversité génotypique (structure des communautés par typage ITS), diversité des gènes fonctionnels (polymorphisme des gènes nod et nif), résistance au cuivre et autres aspects de la diversité phénotypique… 2.2) Expérimentation « cuivre »
Après une expérimention de faisabilité conduite en 2001, une expérimentation a
été mise en place en mai 2002 pour suivre, dans les conditions de champ, les effets d’apports de cuivre (sous forme de bouillie bordelaise) à deux doses. Cette expérimentation a été appliquée à deux types de sol différents : un sol limoneux à Auvillars et un sol argilo-limoneux à Epoisses. Les mêmes paramètres que ci-dessus ont été mesurés, à différents temps : avant apport, juste après apport et après des temps croissants, pour évaluer non seulement les effets immédiats mais également les possibilités de retour à l’état initial (résilience). Compte tenu de la variabilité spatio-temporelle naturelle, il s’avère difficile de mettre en évidence des effets significatifs. Cela signifie que les effets des traitements appliqués ont été (à une exception près) inférieurs aux variations naturelles. Dans le seul cas où un effet avait été visible, cet effet s’est estompé avec le temps. Pour l’une des situations expérimentales (Epoisses), les apports de cuivre ont été renouvelées une deuxième puis une troisième année sur les mêmes parcelles. Les résultats montrent une adaptation des populations microbiennes et une permanence des fonctions malgré une évolution des communautés microbiennes. La fraction des bactéries résistantes au cuivre augmente rapidement. Cette expérimentation en toujours en cours (quatrième année de traitements en 2005) et se terminera en mai 2006.
18
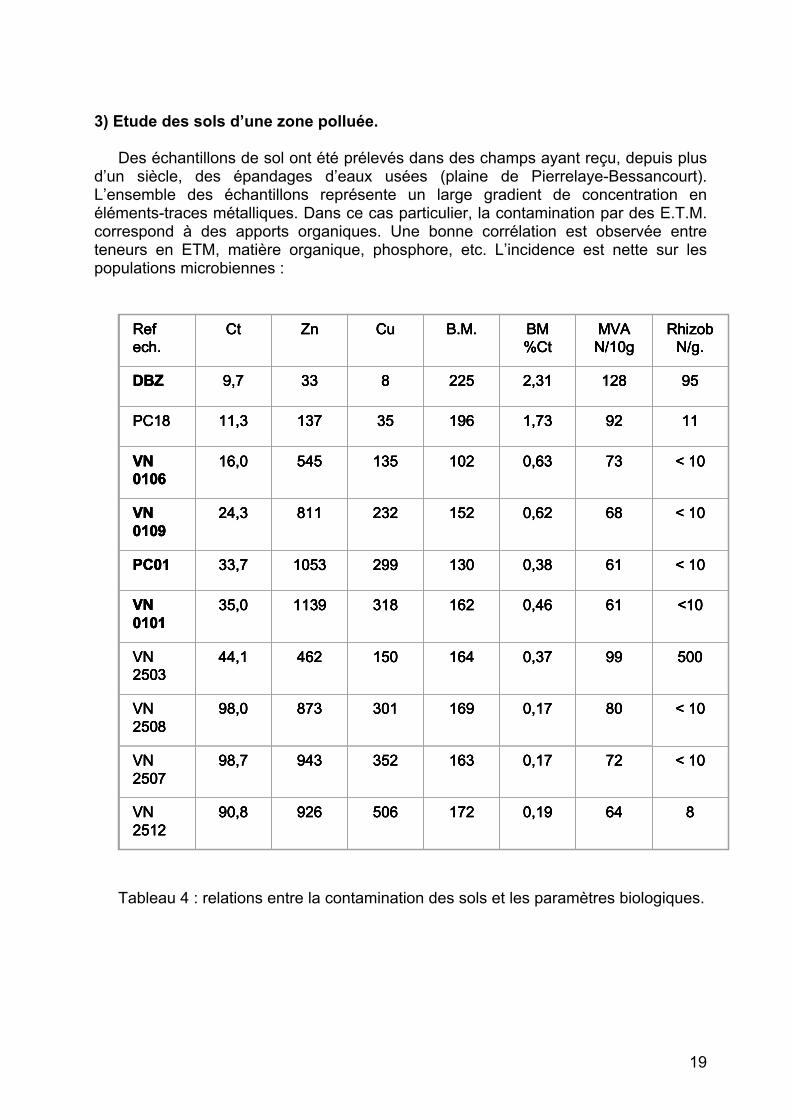
3) Etude des sols d’une zone polluée.
Des échantillons de sol ont été prélevés dans des champs ayant reçu, depuis plus
d’un siècle, des épandages d’eaux usées (plaine de Pierrelaye-Bessancourt). L’ensemble des échantillons représente un large gradient de concentration en éléments-traces métalliques. Dans ce cas particulier, la contamination par des E.T.M. correspond à des apports organiques. Une bonne corrélation est observée entre teneurs en ETM, matière organique, phosphore, etc. L’incidence est nette sur les populations microbiennes :
Ref ech.
Ct Zn Cu B.M. BM%Ct
MVAN/10g
RhizobN/g.
DBZ 9,7 33 8 225 2,31 128 95
PC18 11,3 137 35 196 1,73 92 11
VN0106
16,0 545 135 102 0,63 73 < 10
VN0109
24,3 811 232 152 0,62 68 < 10
PC01 33,7 1053 299 130 0,38 61 < 10
VN0101
35,0 1139 318 162 0,46 61 <10
VN2503
44,1 462 150 164 0,37 99 500
VN2508
98,0 873 301 169 0,17 80 < 10
VN2507
98,7 943 352 163 0,17 72 < 10
VN2512
90,8 926 506 172 0,19 64 8
Ref ech.Ref ech.
CtCt ZnZn CuCu B.M.B.M. BM%CtBM%Ct
MVAN/10gMVAN/10g
RhizobN/g.
RhizobN/g.
DBZDBZ 9,79,7 3333 88 225225 2,312,31 128128 9595
PC18PC18 11,311,3 137137 3535 196196 1,731,73 9292 1111
VN0106VN0106
16,016,0 545545 135135 102102 0,630,63 7373 < 10< 10
VN0109VN0109
24,324,3 811811 232232 152152 0,620,62 6868 < 10< 10
PC01PC01 33,733,7 10531053 299299 130130 0,380,38 6161 < 10< 10
VN0101VN0101
35,035,0 11391139 318318 162162 0,460,46 6161 <10<10
VN2503VN2503
44,144,1 462462 150150 164164 0,370,37 9999 500500
VN2508VN2508
98,098,0 873873 301301 169169 0,170,17 8080 < 10< 10
VN2507VN2507
98,798,7 943943 352352 163163 0,170,17 7272 < 10< 10
VN2512VN2512
90,890,8 926926 506506 172172 0,190,19 6464 88
Tableau 4 : relations entre la contamination des sols et les paramètres biologiques.
19
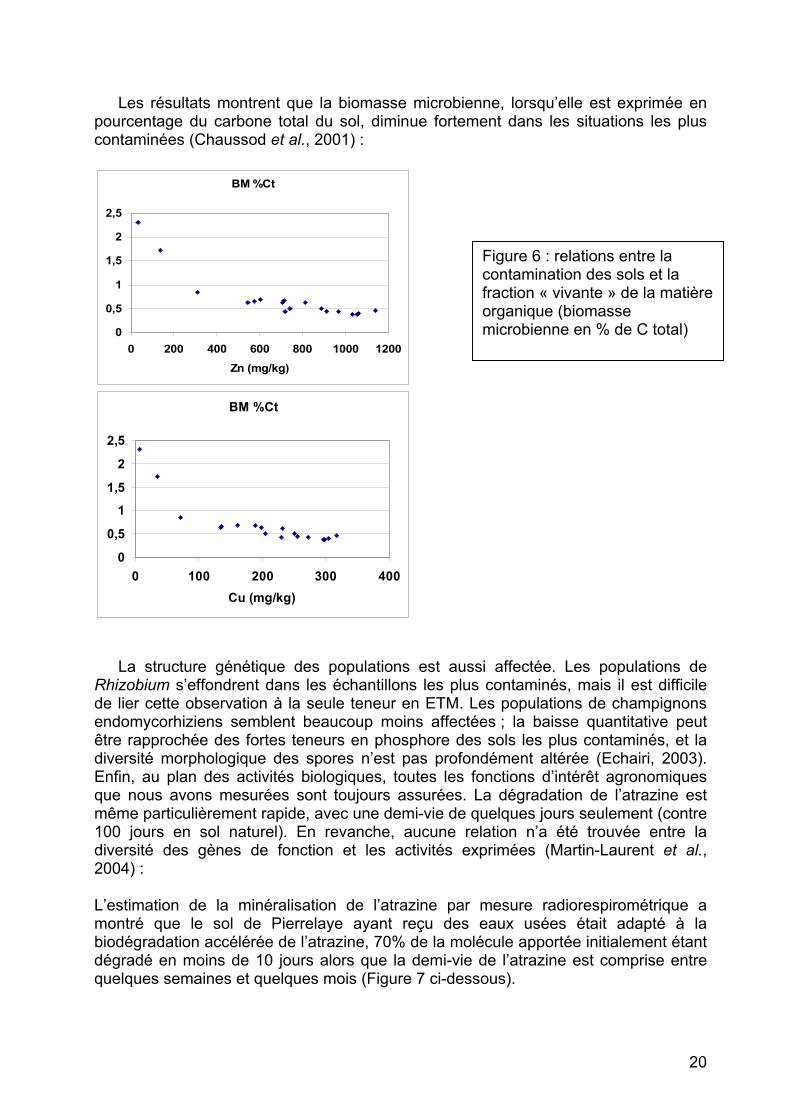
Les résultats montrent que la biomasse microbienne, lorsqu’elle est exprimée en pourcentage du carbone total du sol, diminue fortement dans les situations les plus contaminées (Chaussod et al., 2001) :
BM %Ct
0
0,5
1
1,5
2
2,5
0 200 400 600 800 1000 1200Zn (mg/kg)
Figure 6 : relations entre la contamination des sols et la fraction « vivante » de la matière organique (biomasse microbienne en % de C total)
BM %Ct
0
0,5
1
1,5
2
2,5
0 100 200 300 400Cu (mg/kg)
La structure génétique des populations est aussi affectée. Les populations de
Rhizobium s’effondrent dans les échantillons les plus contaminés, mais il est difficile de lier cette observation à la seule teneur en ETM. Les populations de champignons endomycorhiziens semblent beaucoup moins affectées ; la baisse quantitative peut être rapprochée des fortes teneurs en phosphore des sols les plus contaminés, et la diversité morphologique des spores n’est pas profondément altérée (Echairi, 2003). Enfin, au plan des activités biologiques, toutes les fonctions d’intérêt agronomiques que nous avons mesurées sont toujours assurées. La dégradation de l’atrazine est même particulièrement rapide, avec une demi-vie de quelques jours seulement (contre 100 jours en sol naturel). En revanche, aucune relation n’a été trouvée entre la diversité des gènes de fonction et les activités exprimées (Martin-Laurent et al., 2004) :
L’estimation de la minéralisation de l’atrazine par mesure radiorespirométrique a montré que le sol de Pierrelaye ayant reçu des eaux usées était adapté à la biodégradation accélérée de l’atrazine, 70% de la molécule apportée initialement étant dégradé en moins de 10 jours alors que la demi-vie de l’atrazine est comprise entre quelques semaines et quelques mois (Figure 7 ci-dessous).
20
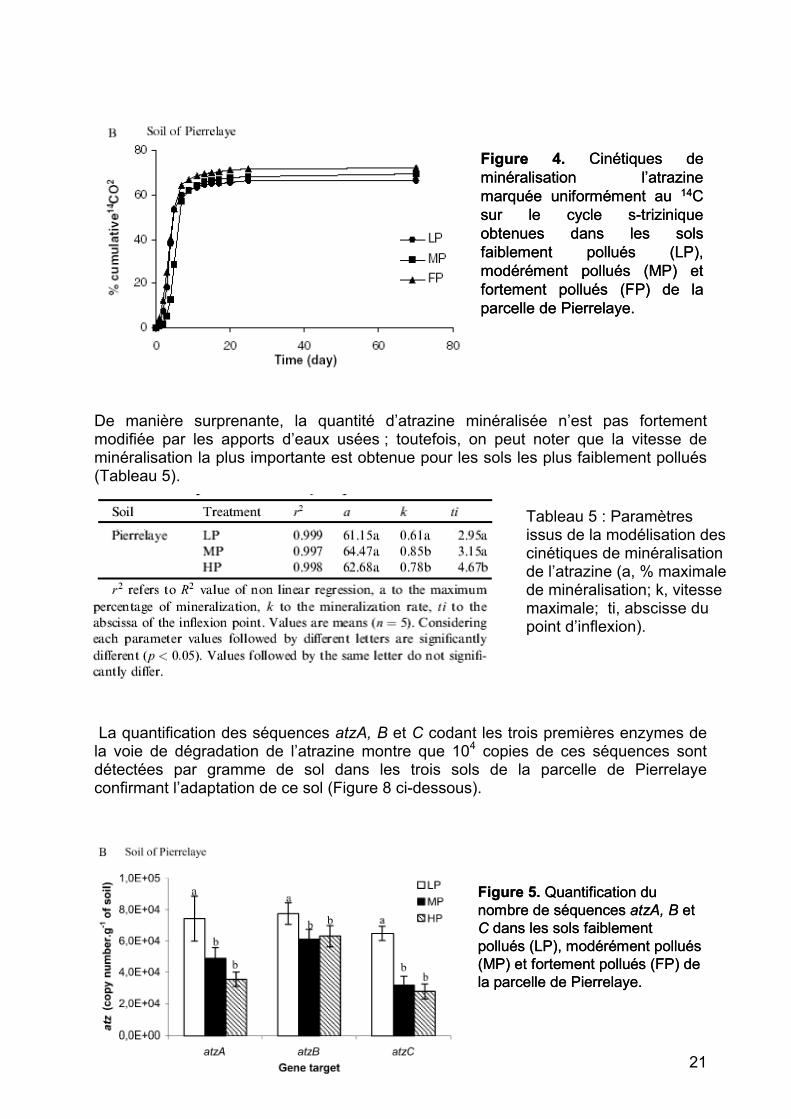
Figure 4. Cinétiques de minéralisation l’atrazinemarquée uniformément au 14C sur le cycle s-trizinique obtenues dans les sols faiblement pollués (LP),modérément pollués (MP) et fortement pollués (FP) de la parcelle de Pierrelaye.
Figure 4. Cinétiques de minéralisation l’atrazinemarquée uniformément au 14C sur le cycle s-trizinique obtenues dans les sols faiblement pollués (LP),modérément pollués (MP) et fortement pollués (FP) de la parcelle de Pierrelaye.
De manière surprenante, la quantité d’atrazine minéralisée n’est pas fortement modifiée par les apports d’eaux usées ; toutefois, on peut noter que la vitesse de minéralisation la plus importante est obtenue pour les sols les plus faiblement pollués (Tableau 5).
21
Figure 5. Quantification du nombre de séquences atzA, B et C dans les sols faiblement pollués (LP), modérément pollués (MP) et fortement pollués (FP) de la parcelle de Pierrelaye.
Figure 5. Quantification du nombre de séquences atzA, B et C dans les sols faiblement pollués (LP), modérément pollués (MP) et fortement pollués (FP) de la parcelle de Pierrelaye.
Tableau 5 : Paramètres issus de la modélisation des cinétiques de minéralisation de l’atrazine (a, % maximale de minéralisation; k, vitesse maximale; ti, abscisse du point d’inflexion).
La quantification des séquences atzA, B et C codant les trois premières enzymes de la voie de dégradation de l’atrazine montre que 104 copies de ces séquences sont détectées par gramme de sol dans les trois sols de la parcelle de Pierrelaye confirmant l’adaptation de ce sol (Figure 8 ci-dessous).
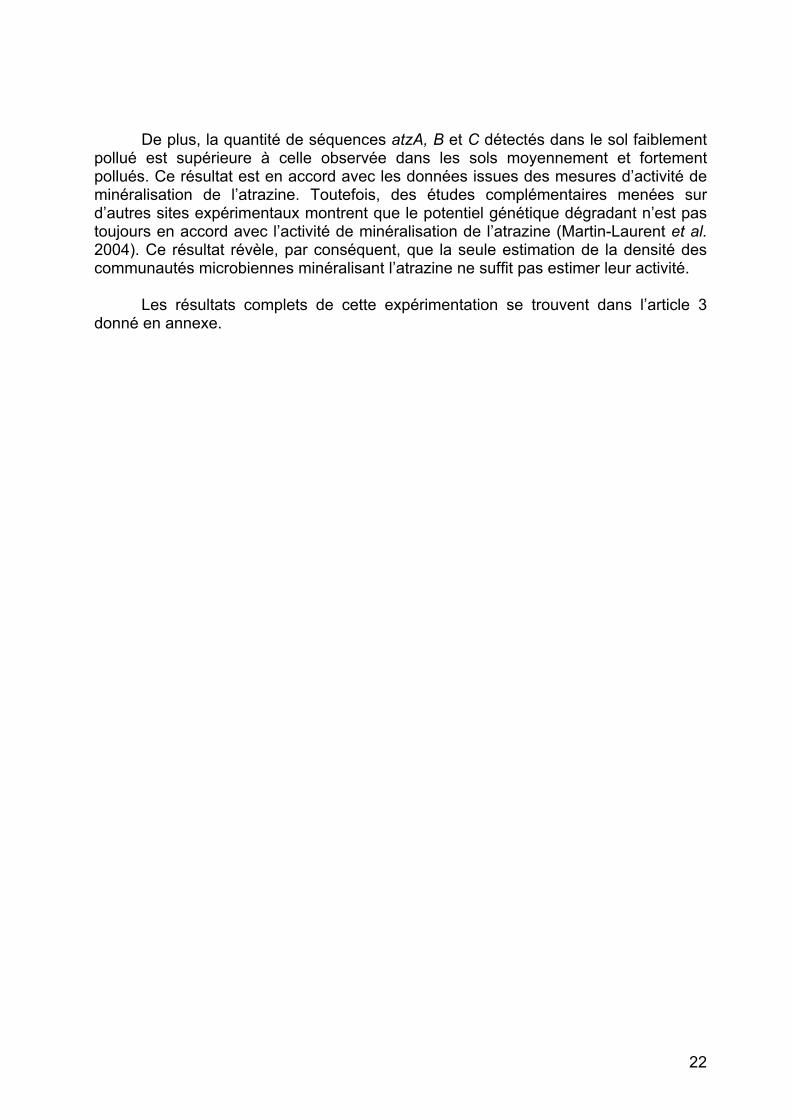
De plus, la quantité de séquences atzA, B et C détectés dans le sol faiblement
pollué est supérieure à celle observée dans les sols moyennement et fortement pollués. Ce résultat est en accord avec les données issues des mesures d’activité de minéralisation de l’atrazine. Toutefois, des études complémentaires menées sur d’autres sites expérimentaux montrent que le potentiel génétique dégradant n’est pas toujours en accord avec l’activité de minéralisation de l’atrazine (Martin-Laurent et al. 2004). Ce résultat révèle, par conséquent, que la seule estimation de la densité des communautés microbiennes minéralisant l’atrazine ne suffit pas estimer leur activité. Les résultats complets de cette expérimentation se trouvent dans l’article 3 donné en annexe.
22
3ème partie : Référentiels
La compilation des données quantitatives et leur classement par type de sol et par système de culture ouvre la possibilité d’interpréter les résultats d’une mesure particulière à la lumière d’un « référentiel » adapté. Cette démarche a été entreprise pour les sols viticoles, pour lesquels de nombreuses données étaient disponibles, suite à des mesures sur des dizaines de parcelles en Bourgogne, Champagne, Beaujolais, etc. On présente ci-dessous deux exemples de référentiels. 1) Référentiel « sols viticoles champenois ». En 2000 et 2001, des prélèvements de sols ont été réalisés pour établir un référentiel de la qualité biologique des sols viticoles de Champagne. La synthèse intégrant ces résultats et ceux obtenus sur les essais « Viti 2000 » depuis 1990 montre que : - les caractéristiques des sols (argile, azote organique, matières organiques) ont une
forte influence sur les niveaux de biomasse microbienne. Les données confirment par ailleurs l’effet dépressif du cuivre sur la biomasse microbienne (voir figure).
- il existe une relation positive entre la biomasse microbienne et la minéralisation du carbone et de l’azote ; le cuivre ne semble pas avoir d’influence négative sur ces minéralisations.
- plus la proportion de la fraction labile (en relation avec la fraction vivante) est faible, plus les micro-organismes ont une respiration spécifique élevée.
- plus le rapport C/N du sol est élevé, plus la proportion de carbone labile, issu de l’activité du carbone vivant, est faible
L e tableau suivant récapitule les données utilisées pour cette synthèse :
Nombre de données
Biomasse microbienne
Métabolites Cinétique CO2
Respiration spécifique
N minéralisable
Nitrification
Essais * 120 0 92 0 77 0
Référentiel** 51 49 51 51 51 34
Tableau 6 : Nombre de données recueillies sur les différents réseaux d’essai * Essais Viti2000, données recueillies depuis 1990 ** Référentiel : étude mise en place en 2000 et 2001 sur un réseau de parcelles choisies par le CIVC
(parcelles d’essai hors Viti 2000, types de sols particuliers…)
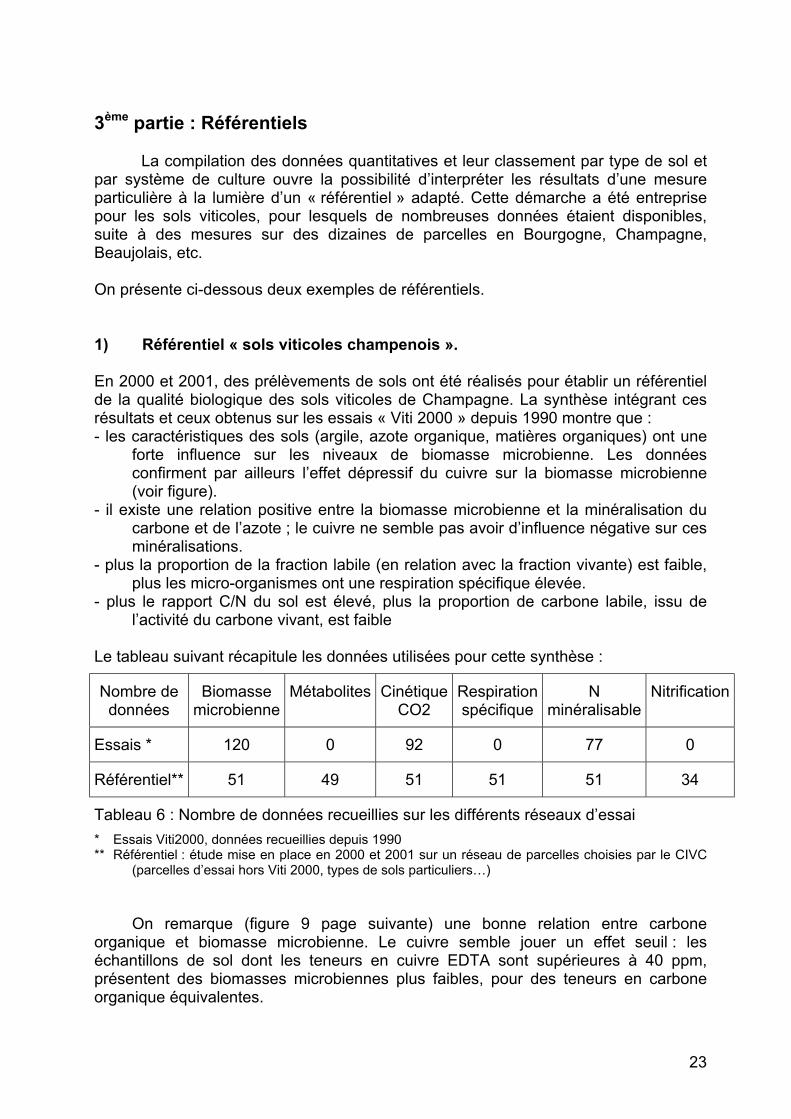
On remarque (figure 9 page suivante) une bonne relation entre carbone organique et biomasse microbienne. Le cuivre semble jouer un effet seuil : les échantillons de sol dont les teneurs en cuivre EDTA sont supérieures à 40 ppm, présentent des biomasses microbiennes plus faibles, pour des teneurs en carbone organique équivalentes.
23
Le comportement des sols de l’Aube présentant des teneurs en cuivre EDTA supérieures 40 ppm est similaires à celui des sols de la Marne avec des teneurs inférieures à 40 ppm. La nature même de ces sols (nature des argiles ?) pourrait peut-être expliquer l’absence d’effet dépressif du cuivre EDTA à ce seuil de 40 ppm. Figure 9 : Relations entre carbone organique, cuivre et biomasse microbienne (158 échantillons).
R2 = 0.64
R2 = 0.54
0
100
200
300
400
500
600
700
800
900
0 5 10 15 20 25 30 35 40 45 50 55
Carbone organique en p.m ille
Biomasse microbienne en mg/kg
Cu<40ppm
Cu>40ppm
Cu>40ppm - Aube
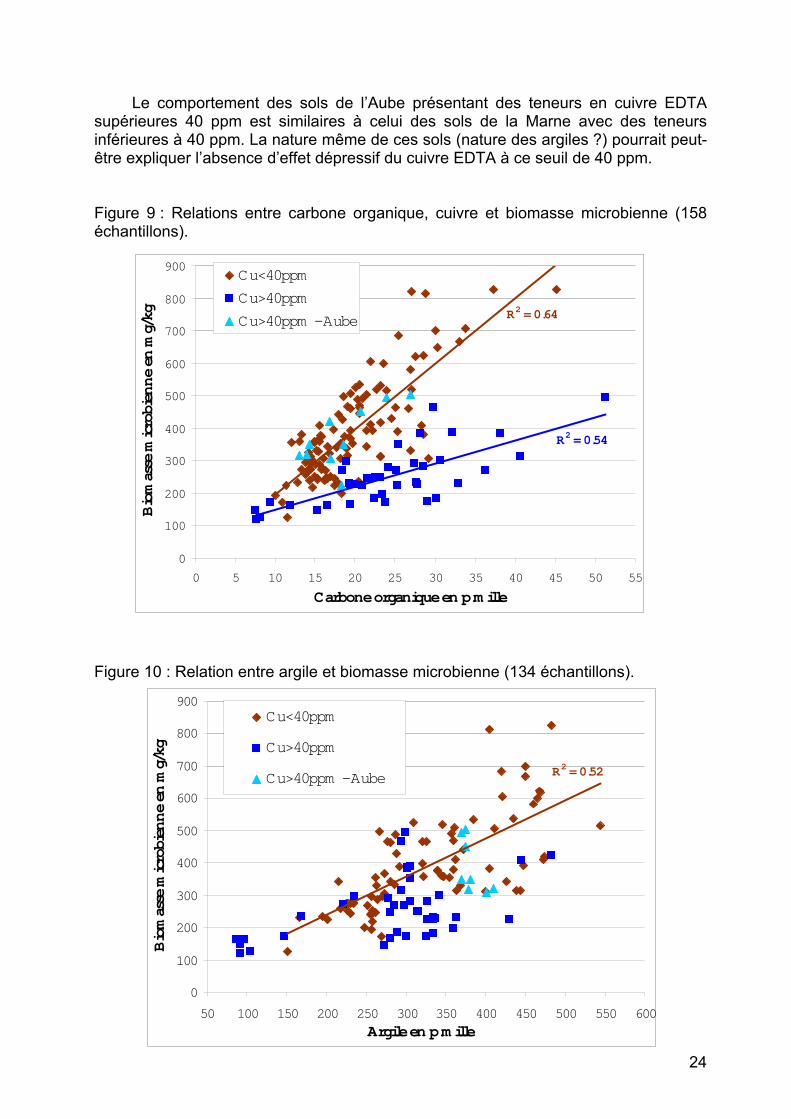
Figure 10 : Relation entre argile et biomasse microbienne (134 échantillons).
R2 = 0.52
0
100
200
300
400
500
600
700
800
900
50 100 150 200 250 300 350 400 450 500 550 600
Argile en p.m ille
Biomasse microbienne en mg/kg
Cu<40ppm
Cu>40ppm
Cu>40ppm - Aube
24
Sur la figure 10 page précédente, on observe une relation entre la teneur en
argile et la biomasse microbienne, notamment pour des échantillons dont les teneurs en cuivre EDTA sont inférieurs à 40 ppm. Naturellement, plus les sols sont argileux, plus la biomasse microbienne est élevée. 2) Référentiel « sols viticoles du Beaujolais »
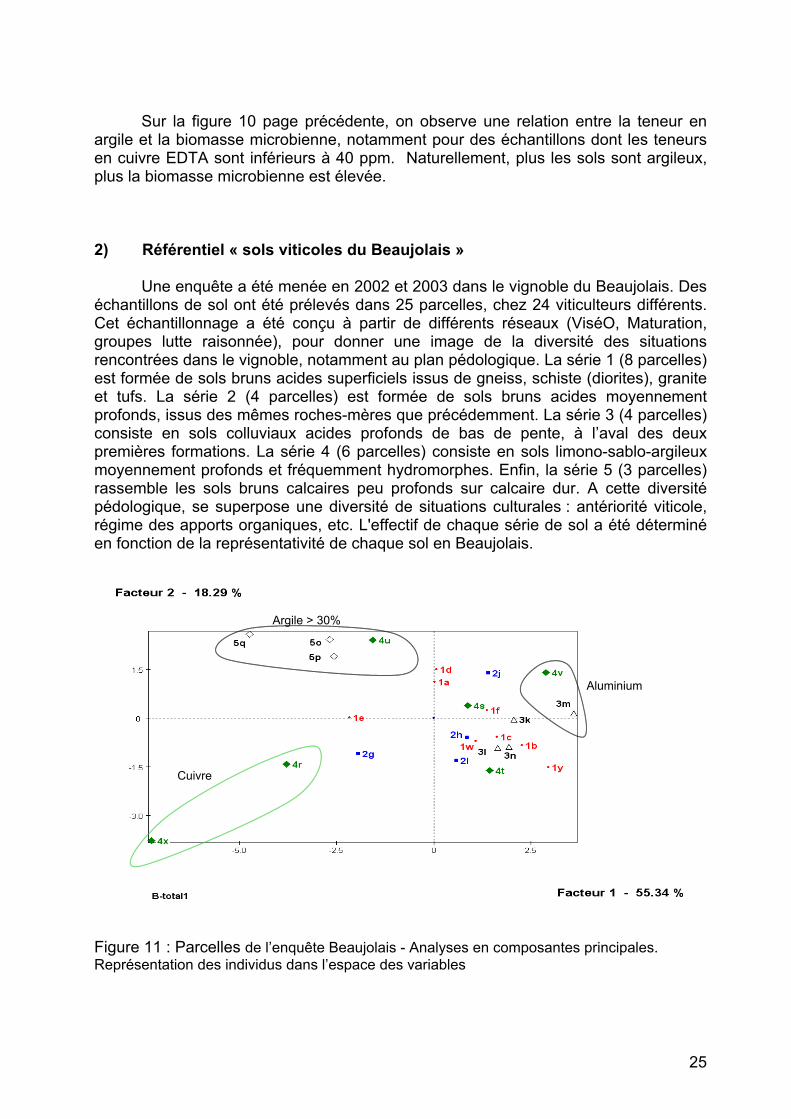
Une enquête a été menée en 2002 et 2003 dans le vignoble du Beaujolais. Des
échantillons de sol ont été prélevés dans 25 parcelles, chez 24 viticulteurs différents. Cet échantillonnage a été conçu à partir de différents réseaux (ViséO, Maturation, groupes lutte raisonnée), pour donner une image de la diversité des situations rencontrées dans le vignoble, notamment au plan pédologique. La série 1 (8 parcelles) est formée de sols bruns acides superficiels issus de gneiss, schiste (diorites), granite et tufs. La série 2 (4 parcelles) est formée de sols bruns acides moyennement profonds, issus des mêmes roches-mères que précédemment. La série 3 (4 parcelles) consiste en sols colluviaux acides profonds de bas de pente, à l’aval des deux premières formations. La série 4 (6 parcelles) consiste en sols limono-sablo-argileux moyennement profonds et fréquemment hydromorphes. Enfin, la série 5 (3 parcelles) rassemble les sols bruns calcaires peu profonds sur calcaire dur. A cette diversité pédologique, se superpose une diversité de situations culturales : antériorité viticole, régime des apports organiques, etc. L'effectif de chaque série de sol a été déterminé en fonction de la représentativité de chaque sol en Beaujolais.
Cuivre
Argile > 30%
Aluminium
Figure 11 : Parcelles de l’enquête Beaujolais - Analyses en composantes principales. Représentation des individus dans l’espace des variables
25
Sur ces échantillons, les principales caractéristiques physico-chimiques et biologiques ont été déterminées. Les résultats montrent une relation entre les paramètres biologiques, les caractéristiques des sols et les situations culturales. Une analyse statistique descriptive et une analyse multivariée ont été effectuées sur l’ensemble des résultats. Cette étude montre que si globalement on retrouve plus ou moins regroupés les échantillons correspondant à un même type de sol, des individus peuvent se distinguer en fonction de caractéristiques particulières. Ainsi, des teneurs particulièrement élevées en aluminium échangeable ou en cuivre se traduisent par des valeurs anormalement faibles de la biomasse microbienne. Dans les sols étudiés, la biomasse microbienne varie entre 30 et 455 mg C/kg de sol. Cela représente en moyenne 1,15% du carbone organique total, avec des variations très importantes (0,3 à 2,5%) selon les situations. D’après l’analyse statistique des résultats, la proportion "vivante" du carbone organique (MOV en % du carbone total) et la teneur du sol en cuivre extractible à l’EDTA sont largement antagonistes.
26
Conclusion – perspectives
Un ensemble cohérent de mesures biologiques complémentaires a été mis au point et validé en conditions de terrain. Ces mesures apportent des informations au moins partielles sur l’abondance, l’activité et la diversité des micro-organismes du sol. Pour ce qui concerne les déterminations quantitatives (biomasse microbienne, activités), il s’avère que l’interprétation des résultats biologiques doit impérativement tenir compte du type de sol et du système de culture. Ceci passe par l’utilisation de référentiels pour interpréter des données isolées. Bien entendu, lorsque les variations ne portent que sur les traitements appliqués, toutes choses étant égales par ailleurs, une simple comparaison des données apporte des informations utilisables.
Les déterminations qualitatives (empreintes moléculaires) ne sont pour l’instant utilisables que pour des comparaisons directes (ex : comparaison de traitements pour une même situation pédoclimatique). Les mesures de « biodiversité » sont pour l’instant de peu d’utilité pratique ; elles ne sont pas directement interprétables en termes de qualité des sols (Chaussod et al., 2002), même si il est admis qu’une diversité importante est le meilleur gage d’une potentialité de résilience et d’évolution. L’importance de la plante (culture) ne doit pas êtrte négligé (Johnson et al., 2003). Plutôt que des aspects de diversité génotypique, la diversité des aptitudes métaboliques serait une piste à développer pour des applications agronomiques.
Des approches globales de la « diversité » (en fait, la structure des
communautés microbiennes) ont été mises au point à partir du polymorphisme de l’ADN extrait directement du sol. Il s’agit principalement de la technique des empreintes moléculaires (Ranjard et al., 2001, 2003) spécifiques des bactéries (B-ARISA) et des champignons (F-ARISA), après optimisation de la procédure d’extraction de l’ADN (Martin-Laurent et al., 2001). Il s’agit d’une approche de la diversité populationnelle des communautés microbiennes appréhendées globalement, en s’affranchissant de l’isolement des microorganismes. Cette méthode est bien adaptée à la mise en évidence des effets de polluants sur les communautés microbiennes. La même approche peut être utilisée pour évaluer la diversité fonctionnelle, en s’adressant à des gènes spécifiques, tels ceux impliqués dans la dégradation de l’atrazine par exemple (Martin-Laurent et al., 2001, 2004), la dénitrification (travaux de Philippot et coll.), voire des gènes symbiotiques (travaux de Laguerre et coll.).
Toutefois, pour aborder les relations entre la diversité et la fonctionnalité des populations microbiennes d’intérêt agro-environnemental, les approches moléculaires ne peuvent pas encore être utilisées seules. Dans bien des cas, les approches de microbiologie classique restent très utiles. C’est le cas en particulier pour les rhizobiacées (Laguerre et al., 2001; Hachair, 2003) ou les champignons endomycorhiziens (Echairi, 2003). Enfin, une approche similaire a permis d’étudier les relations qui peuvent exister entre activité et diversité des microorganismes impliqués dans une fonction donnée, telle que par exemple la réduction en N2 du gaz à effet de serre N2O (Cheneby et al., 2001).
L’étude des rhizobiacées reste le plus souvent tributaire de l’isolement des populations nodulantes à partir des nodosités d’une plante-hôte (Laguerre et al., 2001). Pour les champignons mycorhiziens, les dénombrements par tamisage humide,
27
suivis de la détermination morphologique des spores, restent une approche très classique mais « opérationnelle » (Echairi, 2003). Ces techniques ont été utilisées à l’occasion de travaux sur des parcelles plus ou moins contaminées.
Des échantillons de sol ont été prélevés dans des parcelles correspondant soit à
des niveaux variables de contamination par le cuivre (sols viticoles), soit à des traitements agronomiques différenciés en matière de traitements pesticides. La même approche « polyphasique » a été appliquée à ces échantillons.
Pour ce qui concerne les déterminations quantitatives (biomasse microbienne, activités), il s’avère que l’interprétation des résultats biologiques doit impérativement tenir compte du type de sol et du système de culture.
Les déterminations qualitatives (empreintes moléculaires) ne sont pour l’instant utilisables que pour des comparaisons directes (ex : comparaison de traitements pour une même situation pédoclimatique).
Enfin, les déterminations concernant la « diversité génétique », aussi bien au niveau de populations (ex : Rhizobiacées) que de fonctions (ex : dégradation de l’atrazine), ne préjugent en rien des activités correspondantes.
L’étude de parcelles contaminées a donc été l’occasion de constater qu’il n’y avait pas forcément une relation simple et univoque entre degré de contamination, diversité populationnelle et fonctionnalités.
Il s’en suit que l’appréciation de la « qualité biologique » d’un sol n’est pas une mesure simple, pouvant se déduire par exemple d’une extraction d’ADN du sol suivie de l’application de quelques méthodes de biologie moléculaire. Les approches polyphasiques, basées sur diverses déterminations quantitatives (populations, fonctions) et qualitatives (diversité, polymorphisme génétique, etc.) restent nécessaires pour juger des effets réels de contaminants tels que des éléments-traces métalliques ou des pesticides sur la microflore des sols.
Dans le cadre de ce projet, nous avons beaucoup progressé au plan méthodologique, jusqu’à aborder le niveau « pré-normatif ». En matière de biologie moléculaire, l’incidence des choix méthodologiques sur le résultat (appréciation des effets de contaminations) est tel que la normalisation des méthodes est nécessaire, pour ne retenir que les plus performantes en termes de fiabilité, de reproductibilité et d’universalité (application aussi indépendante que possible du type de sol et de contaminant). Il reste un travail important à effectuer en matière de référentiels d’interprétation des effets éventuellement observés : intensité des perturbations, conséquences prévisibles en termes de fonctionnement (fonctions agro-environnementales), possibilité de résilience...
28
ANNEXES
Publications en lien avec le programme GESSOL : Chaussod R., Breuil M.C., Corbisier P., Cornet L., Echairi A., Martin-Laurent F.,
Nouaïm R. et Nowak V. 2001. Etude d’un secteur agricole pollué par des épandages d’eaux usées : bilan environnemental et possibilité de reconversion végétale. Volet microbiologique. Compte-rendu de contrat EPANDAGRI, 22 p.
Chaussod R. 2002. La qualité biologique des sols : des concepts à l’application. C.R. Académie d’Agriculture, 88, pp 61-68.
Chaussod R., Cheneby D., Hénault C., Laguerre G., Martin-Laurent F., Philippot L., Ranjard L. et Soulas G. 2002. Qualité biologique des sols : biodiversité et activités microbiennes. In : Forum Qualité des Sols, Ministère de l’Environnement & AFES, Paris, 15-16 Mai 2002.
Chaussod R., Ranjard L., Laguerre G., Hachair S., Echairi A. and Nouaïm R. 2002. Microbial diversity as a component of soil quality ? In : COST 831, Budapest, 12-14/09/02.
Chaussod R., Nouaim R., Breuil M.C., Hachair S. et Laguerre G. 2003. Un indicateur potentiel de la contamination des sols par les E.T.M. : Rhizobium leguminosarum bv trifolii. Développement d’un test. In : Colloque SMGBM, Tanger (Maroc) 18-20/12/03.
Chèneby D., Philippot L., Hartmann A., Hénault C. and Germon J.C. 2000. 16S rDNA analysis for characterization of denitrifying bacteria isolated from three agricultural soils. FEMS Microbiology Ecology, 34, pp 121-128.
Doledec A.F., Descotes A., Moncomble D., Cluzeau D., Pérès G. et Chaussod R. 2001. Viticulture raisonnée et préservation des terroirs en Champagne. Synthèse de dix années d’essais. Le Vigneron Champenois, 10, pp 2-15.
Hachair S., Laguerre G. et Chaussod R. 2001. Effects of repeated applications of copper sulfate on the size and the structure of Rhizobium leguminosarum populations. In : Int . Symp. Microbial Ecology, Amsterdam, Août 2001. Communication orale + Actes.
Hachair S., Laguerre G., Thioulouse J., Ranjard L. and Chaussod R. 2004. Long-term application of copper-based fungicides in vineyards affects the size and the genetic structure of Rhizobium leguminosarum biovar trifolii populations. Soumis à Environmental Microbiology.
Echairi A. 2003. Recherche d’indicateurs biologiques de la qualité des sols : application aux sols contaminés par les éléments-traces métalliques. DSER Université de Bourgogne, 67 p. + annexes.
I.T.A.B. 2002. Activités biologiques et fertilité des sols. Intérêts et limites des méthodes analytiques disponibles. 1ère édition, ITAB, Ed. (Paris).
29
30
Laguerre G., Allard M.R., Depret G., Breuil M.C., Nouaim R. et Houot S. 2001. Effet de la monoculture du maïs sur la diversité des populations de Rhizobium. In : 3ème colloque Rhizosphère, Dijon 28-29/11/01.
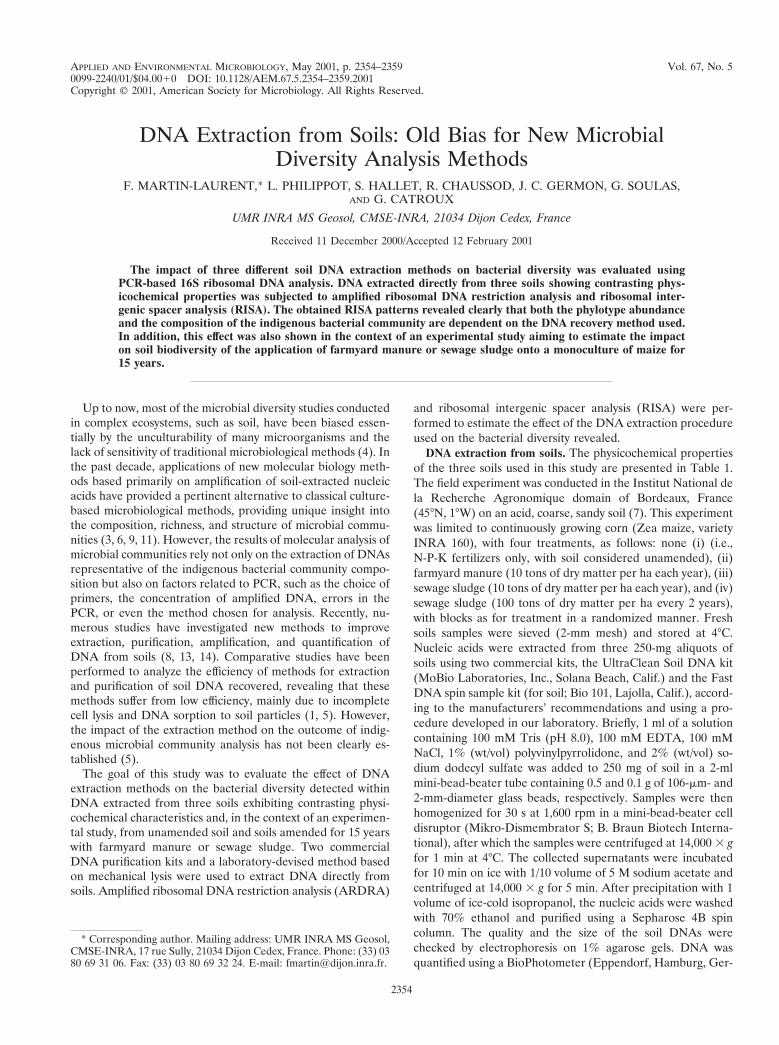
Martin-Laurent F., Philippot L., Hallet S., Chaussod R., Germon J.C., Soulas G. and Catroux G. 2001. DNA extraction from soils : old bias for new microbial diversity analysis methods. Applied & Environmental Microbiology, 67, pp 2354-2359.
Martin-Laurent F., Cornet L., Ranjard L., Lopez-Gutierrez J.C., Philippot L., Schwart C., Chaussod R., Catroux G. and Soulas G. 2004. Estimation of atrazine-degrading genetic potential and activity in three french agricultural soils. FEMS Microbiol. Ecol.,
Ranjard L., Poly F., Lata J.C., Mougel C., Thioulouse J. and Nazaret S. 2001. Characterisation of bacterial and fungal soil communities by automated ribosomal intergenic spacer analysis fingerprints: biological and methodological variability. Applied & Environmental Microbiology, 67, pp 4479-4487.
Ranjard L., Lejon D., Mougel C., Scherer L., Merdinoglu D. and Chaussod R. 2003. Sampling strategy in molecular microbial ecology : influence of soil sample size on DNA fingerprinting analysis of fungal and bacterial communities. Environmental Microbiology, 5, pp 1111-1120.
Autres publications citées dans ce rapport : Arrouays D., Jolivet C., Richer de Forges A., Andreux F., Lévèque J., Chaussod R.,
Trichet P., Bert D. et Bourhis F. 2002. Impact des pratiques agricoles et sylvicoles sur les variabilités spatiales et temporelles des constituants organiques du sol et de la biomasse microbienne. Aspects méthodologiques de la surveillance, identification de compartiments fonctionnels, modélisation et généralisation spatiale. Rapport final de recherches GESSOL 1998-2002, 56 p.
Eijsackers H. 2001. A future for soil ecology ? Connecting the sysytem levels : moving from genomes to ecosysytems. Opening lecture to the XIII ICSZ « Biodiversity of soil organisms and ecosystem functioning ». Eur. J. Soil Biol., 37, pp 213-220.
Holling C.S. 1973. Resilience and stability of ecological systems. Annual Review of Ecology and Systematics, 4, pp 1-23.
Johnson M.J., Lee K.Y. and Scow K.M. 2003. DNA fingerprinting reveals links among agricultural crops, soil properties, and the composition of soil microbial communities. Geoderma, 114, pp 279-303.
Parkin T.B. 1993. Spatial variability of microbial processes in soil – A review. J. Environ. Qual., 22, pp 409-417.
Robert M., Stengel P. et Vindimian E. 2003. Une nouvelle politique de protection des sols au niveau français et européen. Etude et Gestion des Sols, 10, pp 215-217.
ANNEXE 1
Article 1 : Extraction ADN sol
APPLIED AND ENVIRONMENTAL MICROBIOLOGY,0099-2240/01/$04.0010 DOI: 10.1128/AEM.67.5.2354–2359.2001
May 2001, p. 2354–2359 Vol. 67, No. 5
Copyright © 2001, American Society for Microbiology. All Rights Reserved.
DNA Extraction from Soils: Old Bias for New MicrobialDiversity Analysis Methods
F. MARTIN-LAURENT,* L. PHILIPPOT, S. HALLET, R. CHAUSSOD, J. C. GERMON, G. SOULAS,AND G. CATROUX
UMR INRA MS Geosol, CMSE-INRA, 21034 Dijon Cedex, France
Received 11 December 2000/Accepted 12 February 2001
The impact of three different soil DNA extraction methods on bacterial diversity was evaluated usingPCR-based 16S ribosomal DNA analysis. DNA extracted directly from three soils showing contrasting phys-icochemical properties was subjected to amplified ribosomal DNA restriction analysis and ribosomal inter-genic spacer analysis (RISA). The obtained RISA patterns revealed clearly that both the phylotype abundanceand the composition of the indigenous bacterial community are dependent on the DNA recovery method used.In addition, this effect was also shown in the context of an experimental study aiming to estimate the impacton soil biodiversity of the application of farmyard manure or sewage sludge onto a monoculture of maize for15 years.
Up to now, most of the microbial diversity studies conductedin complex ecosystems, such as soil, have been biased essen-tially by the unculturability of many microorganisms and thelack of sensitivity of traditional microbiological methods (4). Inthe past decade, applications of new molecular biology meth-ods based primarily on amplification of soil-extracted nucleicacids have provided a pertinent alternative to classical culture-based microbiological methods, providing unique insight intothe composition, richness, and structure of microbial commu-nities (3, 6, 9, 11). However, the results of molecular analysis ofmicrobial communities rely not only on the extraction of DNAsrepresentative of the indigenous bacterial community compo-sition but also on factors related to PCR, such as the choice ofprimers, the concentration of amplified DNA, errors in thePCR, or even the method chosen for analysis. Recently, nu-merous studies have investigated new methods to improveextraction, purification, amplification, and quantification ofDNA from soils (8, 13, 14). Comparative studies have beenperformed to analyze the efficiency of methods for extractionand purification of soil DNA recovered, revealing that thesemethods suffer from low efficiency, mainly due to incompletecell lysis and DNA sorption to soil particles (1, 5). However,the impact of the extraction method on the outcome of indig-enous microbial community analysis has not been clearly es-tablished (5).
The goal of this study was to evaluate the effect of DNAextraction methods on the bacterial diversity detected withinDNA extracted from three soils exhibiting contrasting physi-cochemical characteristics and, in the context of an experimen-tal study, from unamended soil and soils amended for 15 yearswith farmyard manure or sewage sludge. Two commercialDNA purification kits and a laboratory-devised method basedon mechanical lysis were used to extract DNA directly fromsoils. Amplified ribosomal DNA restriction analysis (ARDRA)
and ribosomal intergenic spacer analysis (RISA) were per-formed to estimate the effect of the DNA extraction procedureused on the bacterial diversity revealed.
DNA extraction from soils. The physicochemical propertiesof the three soils used in this study are presented in Table 1.The field experiment was conducted in the Institut National dela Recherche Agronomique domain of Bordeaux, France(45°N, 1°W) on an acid, coarse, sandy soil (7). This experimentwas limited to continuously growing corn (Zea maize, varietyINRA 160), with four treatments, as follows: none (i) (i.e.,N-P-K fertilizers only, with soil considered unamended), (ii)farmyard manure (10 tons of dry matter per ha each year), (iii)sewage sludge (10 tons of dry matter per ha each year), and (iv)sewage sludge (100 tons of dry matter per ha every 2 years),with blocks as for treatment in a randomized manner. Freshsoils samples were sieved (2-mm mesh) and stored at 4°C.Nucleic acids were extracted from three 250-mg aliquots ofsoils using two commercial kits, the UltraClean Soil DNA kit(MoBio Laboratories, Inc., Solana Beach, Calif.) and the FastDNA spin sample kit (for soil; Bio 101, Lajolla, Calif.), accord-ing to the manufacturers’ recommendations and using a pro-cedure developed in our laboratory. Briefly, 1 ml of a solutioncontaining 100 mM Tris (pH 8.0), 100 mM EDTA, 100 mMNaCl, 1% (wt/vol) polyvinylpyrrolidone, and 2% (wt/vol) so-dium dodecyl sulfate was added to 250 mg of soil in a 2-mlmini-bead-beater tube containing 0.5 and 0.1 g of 106-mm- and2-mm-diameter glass beads, respectively. Samples were thenhomogenized for 30 s at 1,600 rpm in a mini-bead-beater celldisruptor (Mikro-Dismembrator S; B. Braun Biotech Interna-tional), after which the samples were centrifuged at 14,000 3 gfor 1 min at 4°C. The collected supernatants were incubatedfor 10 min on ice with 1/10 volume of 5 M sodium acetate andcentrifuged at 14,000 3 g for 5 min. After precipitation with 1volume of ice-cold isopropanol, the nucleic acids were washedwith 70% ethanol and purified using a Sepharose 4B spincolumn. The quality and the size of the soil DNAs werechecked by electrophoresis on 1% agarose gels. DNA wasquantified using a BioPhotometer (Eppendorf, Hamburg, Ger-
* Corresponding author. Mailing address: UMR INRA MS Geosol,CMSE-INRA, 17 rue Sully, 21034 Dijon Cedex, France. Phone: (33) 0380 69 31 06. Fax: (33) 03 80 69 32 24. E-mail: [email protected].
2354
many). Three replicates were used for DNA evaluation. Adouble-factor analysis of variance was performed to determinesignificant differences in the yield of soil DNA. The Newman-Keuls procedure (P , 0.05) was used to evaluate the impact ofthe different soils and extraction methods used on the DNAextraction yield.
ARDRA and RISA. To test the possible selectivity of theDNA extraction method, ARDRA and RISA were performedon DNA extracted directly from soils. Three independent rep-licates were included in each analysis, and the results wereexamined separately. Small subunit (SSU) ribosomal DNA(rDNA) genes were amplified from each soil replicate in ther-mocycler (PTC 200 gradient cycler; MJ Research, Waltham,Mass.). PCR amplification from 50 ng of extracted soil DNAwas conducted with a total volume of 50 ml by using 1 mMconcentrations of the universal primers 27f (59-AGA GTTTGA TCM TGG CTC AG-39) and 1492r (59-TAC GGH TACCTT GTT ACG ACT T-39) (2) and 2.5 U of Taq DNA poly-merase (Appligene) under the following conditions: 5 min at94°C, 35 cycles of 1 min at 94°C, 1 min at 55°C, and 2 min at72°C, plus an additional 15-min cycle at 72°C. The PCR prod-ucts were then separated by electrophoresis on a 1% agarosegel. Bands were extracted and purified from the gel using theQiaex II kit (Qiagen, Hilden, Germany) as recommended bythe manufacturer. Ten microliters of purified 16S rDNA fromeach sample was digested with 15 U of RsaI, HhaI, or MspI in15-ml reaction mixtures.
The intergenic spacer region between the small and largesubunits of the ribosomal genes was amplified from 50 ng ofDNA extracted from soil with a total volume of 50 ml by usingthe universal primers 38r (59-CCG GGT TTC CCC ATTCGG-39) and 72f (59-TGC GGC TGG ATC TCC TT-39) (2)under the conditions described above. For both ARDRA andRISA, 15-ml aliquots were separated by electrophoresis on anative 6% acrylamide gel run for 12 or 17 h at 8 mA, respec-tively. Gels were stained with SYBR green II (MolecularProbes, Leiden, The Netherlands) by following the recom-mendations of the manufacturer.
PCR efficiency analysis. Three microliters of 16S rDNAPCR product was separated by electrophoresis on a 1% aga-rose gel run for 1 h at 100 V. Gels were stained with ethidiumbromide and analyzed with the ImageQuant program. 16S-23Sintergenic rDNA PCR products were purified with columns(Microcon PCR/Amicon Bioseparations; Millipore, Bedford,Mass.) according to the manufacturers’ recommendations. A2-ml volume of each purified PCR product was then dilutedinto 48 ml of sterile water, and the nucleic acid content wasdetermined using a BioPhotometer (Eppendorf). For both 16Sand 16S-23S intergenic rDNA PCR products, three repeats
were carried out. Data were analyzed statistically as describedabove.
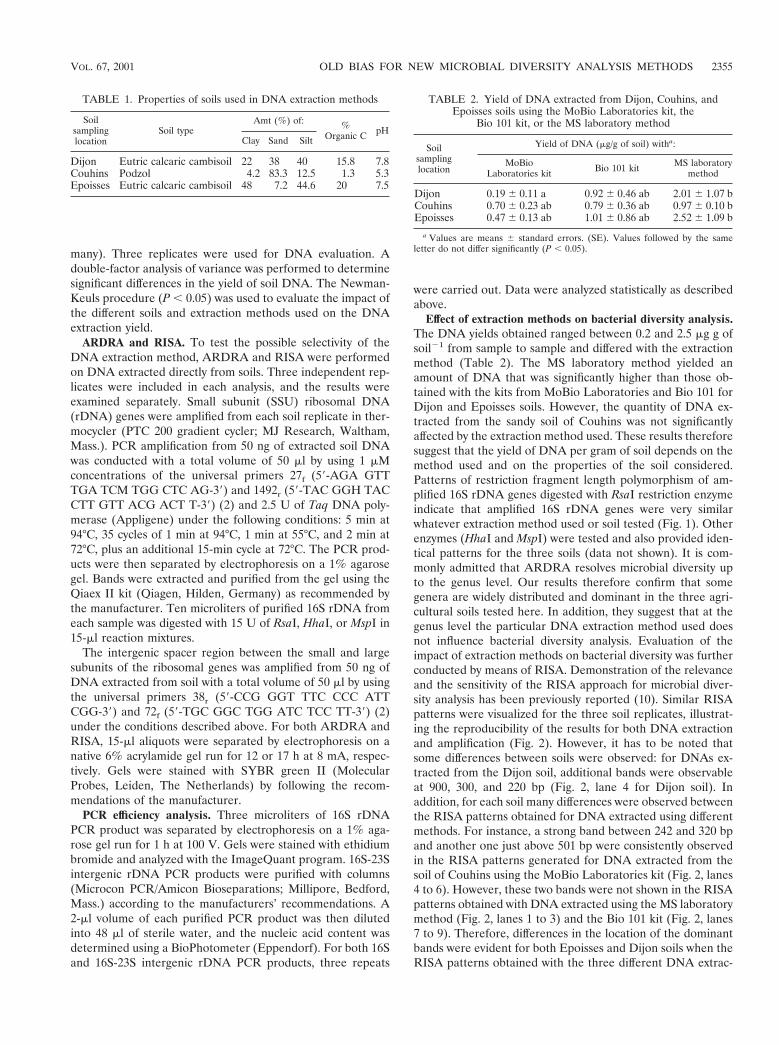
Effect of extraction methods on bacterial diversity analysis.The DNA yields obtained ranged between 0.2 and 2.5 mg g ofsoil21 from sample to sample and differed with the extractionmethod (Table 2). The MS laboratory method yielded anamount of DNA that was significantly higher than those ob-tained with the kits from MoBio Laboratories and Bio 101 forDijon and Epoisses soils. However, the quantity of DNA ex-tracted from the sandy soil of Couhins was not significantlyaffected by the extraction method used. These results thereforesuggest that the yield of DNA per gram of soil depends on themethod used and on the properties of the soil considered.Patterns of restriction fragment length polymorphism of am-plified 16S rDNA genes digested with RsaI restriction enzymeindicate that amplified 16S rDNA genes were very similarwhatever extraction method used or soil tested (Fig. 1). Otherenzymes (HhaI and MspI) were tested and also provided iden-tical patterns for the three soils (data not shown). It is com-monly admitted that ARDRA resolves microbial diversity upto the genus level. Our results therefore confirm that somegenera are widely distributed and dominant in the three agri-cultural soils tested here. In addition, they suggest that at thegenus level the particular DNA extraction method used doesnot influence bacterial diversity analysis. Evaluation of theimpact of extraction methods on bacterial diversity was furtherconducted by means of RISA. Demonstration of the relevanceand the sensitivity of the RISA approach for microbial diver-sity analysis has been previously reported (10). Similar RISApatterns were visualized for the three soil replicates, illustrat-ing the reproducibility of the results for both DNA extractionand amplification (Fig. 2). However, it has to be noted thatsome differences between soils were observed: for DNAs ex-tracted from the Dijon soil, additional bands were observableat 900, 300, and 220 bp (Fig. 2, lane 4 for Dijon soil). Inaddition, for each soil many differences were observed betweenthe RISA patterns obtained for DNA extracted using differentmethods. For instance, a strong band between 242 and 320 bpand another one just above 501 bp were consistently observedin the RISA patterns generated for DNA extracted from thesoil of Couhins using the MoBio Laboratories kit (Fig. 2, lanes4 to 6). However, these two bands were not shown in the RISApatterns obtained with DNA extracted using the MS laboratorymethod (Fig. 2, lanes 1 to 3) and the Bio 101 kit (Fig. 2, lanes7 to 9). Therefore, differences in the location of the dominantbands were evident for both Epoisses and Dijon soils when theRISA patterns obtained with the three different DNA extrac-
TABLE 1. Properties of soils used in DNA extraction methods
Soilsamplinglocation
Soil typeAmt (%) of: %
Organic C pHClay Sand Silt
Dijon Eutric calcaric cambisoil 22 38 40 15.8 7.8Couhins Podzol 4.2 83.3 12.5 1.3 5.3Epoisses Eutric calcaric cambisoil 48 7.2 44.6 20 7.5
TABLE 2. Yield of DNA extracted from Dijon, Couhins, andEpoisses soils using the MoBio Laboratories kit, the
Bio 101 kit, or the MS laboratory method
Soilsamplinglocation
Yield of DNA (mg/g of soil) witha:
MoBioLaboratories kit Bio 101 kit MS laboratory
method
Dijon 0.19 6 0.11 a 0.92 6 0.46 ab 2.01 6 1.07 bCouhins 0.70 6 0.23 ab 0.79 6 0.36 ab 0.97 6 0.10 bEpoisses 0.47 6 0.13 ab 1.01 6 0.86 ab 2.52 6 1.09 b
a Values are means 6 standard errors. (SE). Values followed by the sameletter do not differ significantly (P , 0.05).
VOL. 67, 2001 OLD BIAS FOR NEW MICROBIAL DIVERSITY ANALYSIS METHODS 2355
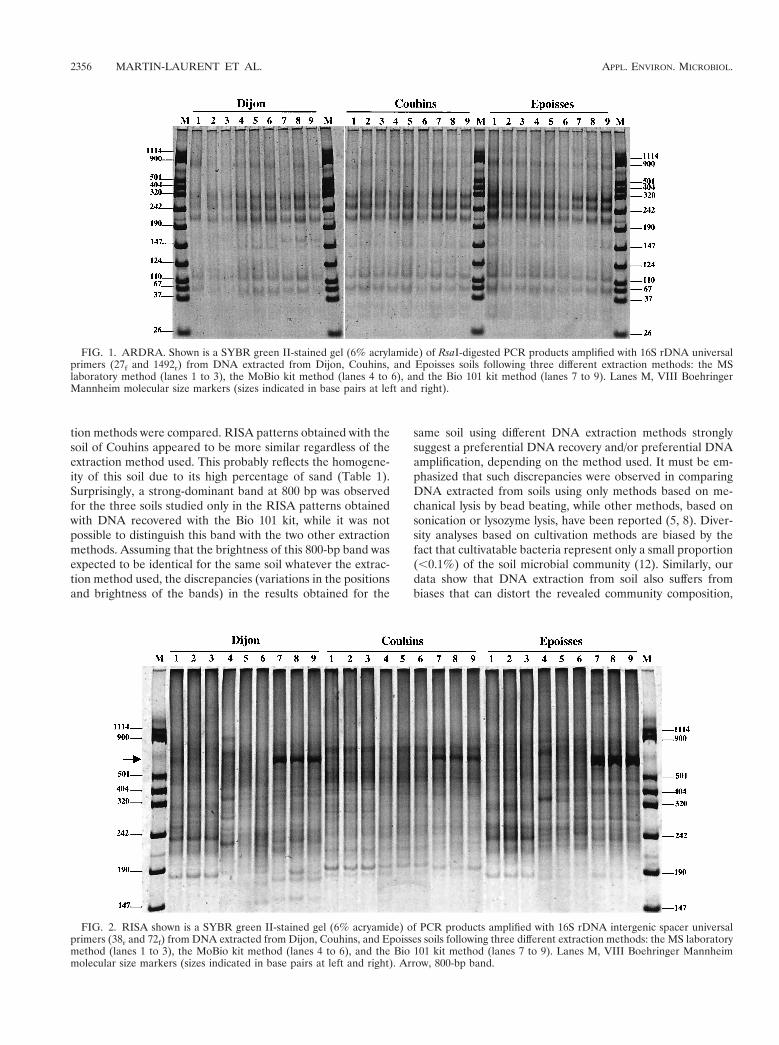
tion methods were compared. RISA patterns obtained with thesoil of Couhins appeared to be more similar regardless of theextraction method used. This probably reflects the homogene-ity of this soil due to its high percentage of sand (Table 1).Surprisingly, a strong-dominant band at 800 bp was observedfor the three soils studied only in the RISA patterns obtainedwith DNA recovered with the Bio 101 kit, while it was notpossible to distinguish this band with the two other extractionmethods. Assuming that the brightness of this 800-bp band wasexpected to be identical for the same soil whatever the extrac-tion method used, the discrepancies (variations in the positionsand brightness of the bands) in the results obtained for the
same soil using different DNA extraction methods stronglysuggest a preferential DNA recovery and/or preferential DNAamplification, depending on the method used. It must be em-phasized that such discrepancies were observed in comparingDNA extracted from soils using only methods based on me-chanical lysis by bead beating, while other methods, based onsonication or lysozyme lysis, have been reported (5, 8). Diver-sity analyses based on cultivation methods are biased by thefact that cultivatable bacteria represent only a small proportion(,0.1%) of the soil microbial community (12). Similarly, ourdata show that DNA extraction from soil also suffers frombiases that can distort the revealed community composition,
FIG. 1. ARDRA. Shown is a SYBR green II-stained gel (6% acrylamide) of RsaI-digested PCR products amplified with 16S rDNA universalprimers (27f and 1492r) from DNA extracted from Dijon, Couhins, and Epoisses soils following three different extraction methods: the MSlaboratory method (lanes 1 to 3), the MoBio kit method (lanes 4 to 6), and the Bio 101 kit method (lanes 7 to 9). Lanes M, VIII BoehringerMannheim molecular size markers (sizes indicated in base pairs at left and right).
FIG. 2. RISA shown is a SYBR green II-stained gel (6% acryamide) of PCR products amplified with 16S rDNA intergenic spacer universalprimers (38r and 72f) from DNA extracted from Dijon, Couhins, and Epoisses soils following three different extraction methods: the MS laboratorymethod (lanes 1 to 3), the MoBio kit method (lanes 4 to 6), and the Bio 101 kit method (lanes 7 to 9). Lanes M, VIII Boehringer Mannheimmolecular size markers (sizes indicated in base pairs at left and right). Arrow, 800-bp band.
2356 MARTIN-LAURENT ET AL. APPL. ENVIRON. MICROBIOL.
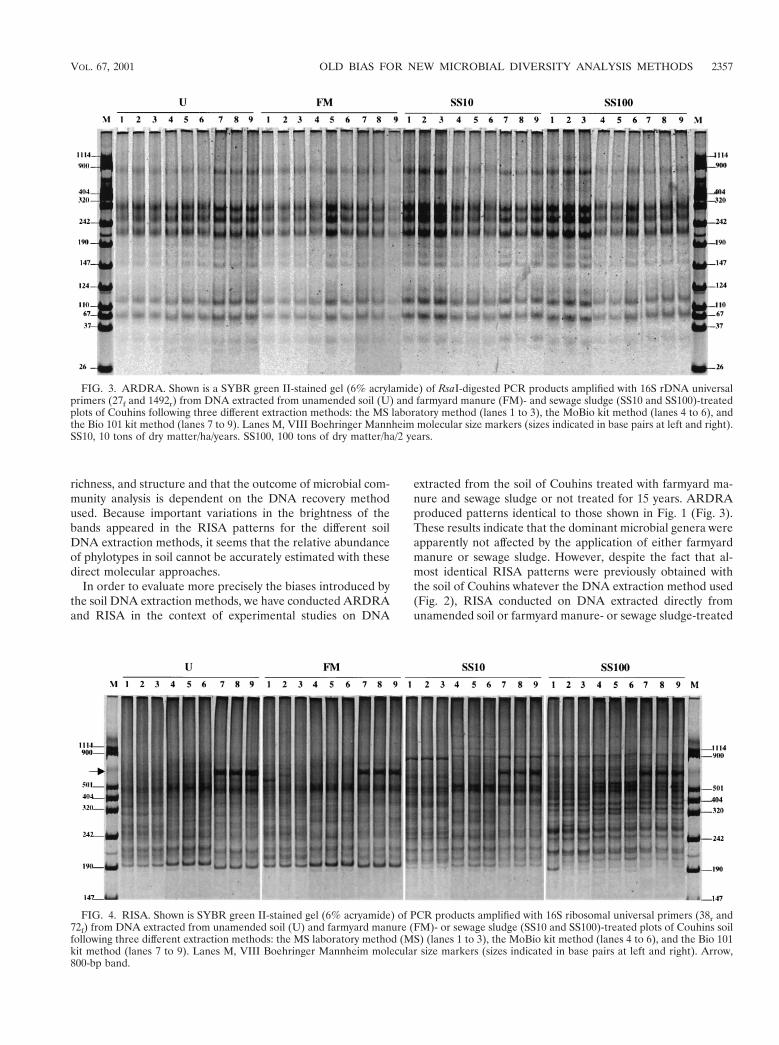
richness, and structure and that the outcome of microbial com-munity analysis is dependent on the DNA recovery methodused. Because important variations in the brightness of thebands appeared in the RISA patterns for the different soilDNA extraction methods, it seems that the relative abundanceof phylotypes in soil cannot be accurately estimated with thesedirect molecular approaches.
In order to evaluate more precisely the biases introduced bythe soil DNA extraction methods, we have conducted ARDRAand RISA in the context of experimental studies on DNA
extracted from the soil of Couhins treated with farmyard ma-nure and sewage sludge or not treated for 15 years. ARDRAproduced patterns identical to those shown in Fig. 1 (Fig. 3).These results indicate that the dominant microbial genera wereapparently not affected by the application of either farmyardmanure or sewage sludge. However, despite the fact that al-most identical RISA patterns were previously obtained withthe soil of Couhins whatever the DNA extraction method used(Fig. 2), RISA conducted on DNA extracted directly fromunamended soil or farmyard manure- or sewage sludge-treated
FIG. 3. ARDRA. Shown is a SYBR green II-stained gel (6% acrylamide) of RsaI-digested PCR products amplified with 16S rDNA universalprimers (27f and 1492r) from DNA extracted from unamended soil (U) and farmyard manure (FM)- and sewage sludge (SS10 and SS100)-treatedplots of Couhins following three different extraction methods: the MS laboratory method (lanes 1 to 3), the MoBio kit method (lanes 4 to 6), andthe Bio 101 kit method (lanes 7 to 9). Lanes M, VIII Boehringer Mannheim molecular size markers (sizes indicated in base pairs at left and right).SS10, 10 tons of dry matter/ha/years. SS100, 100 tons of dry matter/ha/2 years.
FIG. 4. RISA. Shown is SYBR green II-stained gel (6% acryamide) of PCR products amplified with 16S ribosomal universal primers (38r and72f) from DNA extracted from unamended soil (U) and farmyard manure (FM)- or sewage sludge (SS10 and SS100)-treated plots of Couhins soilfollowing three different extraction methods: the MS laboratory method (MS) (lanes 1 to 3), the MoBio kit method (lanes 4 to 6), and the Bio 101kit method (lanes 7 to 9). Lanes M, VIII Boehringer Mannheim molecular size markers (sizes indicated in base pairs at left and right). Arrow,800-bp band.
VOL. 67, 2001 OLD BIAS FOR NEW MICROBIAL DIVERSITY ANALYSIS METHODS 2357
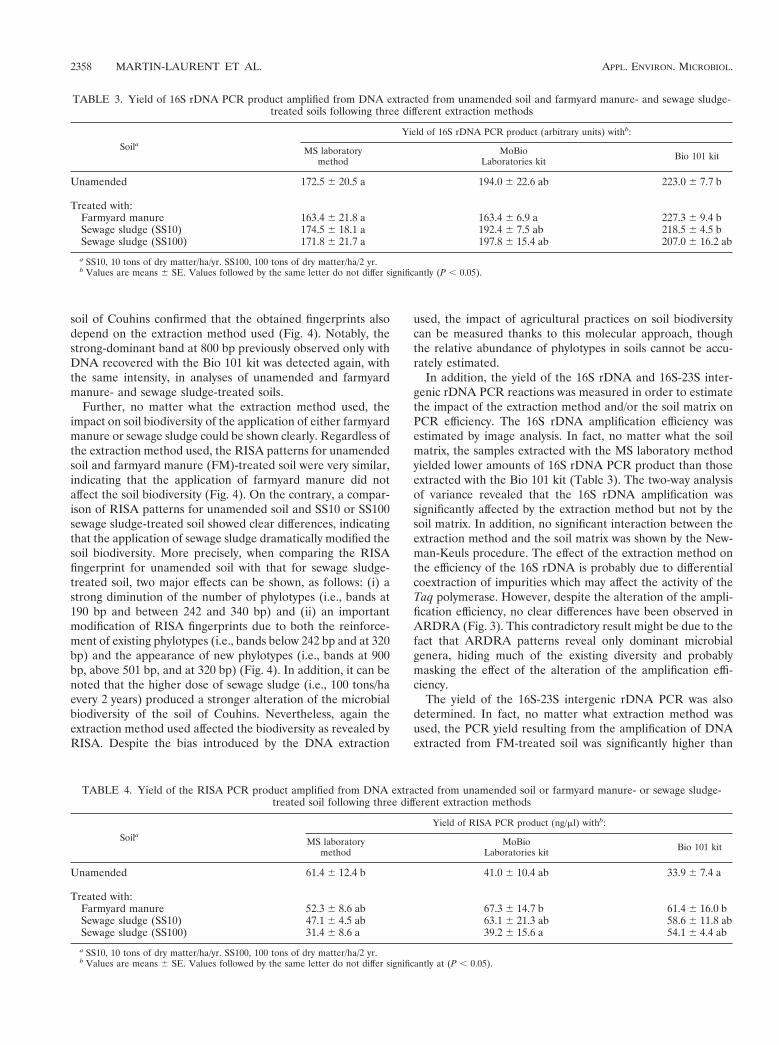
soil of Couhins confirmed that the obtained fingerprints alsodepend on the extraction method used (Fig. 4). Notably, thestrong-dominant band at 800 bp previously observed only withDNA recovered with the Bio 101 kit was detected again, withthe same intensity, in analyses of unamended and farmyardmanure- and sewage sludge-treated soils.
Further, no matter what the extraction method used, theimpact on soil biodiversity of the application of either farmyardmanure or sewage sludge could be shown clearly. Regardless ofthe extraction method used, the RISA patterns for unamendedsoil and farmyard manure (FM)-treated soil were very similar,indicating that the application of farmyard manure did notaffect the soil biodiversity (Fig. 4). On the contrary, a compar-ison of RISA patterns for unamended soil and SS10 or SS100sewage sludge-treated soil showed clear differences, indicatingthat the application of sewage sludge dramatically modified thesoil biodiversity. More precisely, when comparing the RISAfingerprint for unamended soil with that for sewage sludge-treated soil, two major effects can be shown, as follows: (i) astrong diminution of the number of phylotypes (i.e., bands at190 bp and between 242 and 340 bp) and (ii) an importantmodification of RISA fingerprints due to both the reinforce-ment of existing phylotypes (i.e., bands below 242 bp and at 320bp) and the appearance of new phylotypes (i.e., bands at 900bp, above 501 bp, and at 320 bp) (Fig. 4). In addition, it can benoted that the higher dose of sewage sludge (i.e., 100 tons/haevery 2 years) produced a stronger alteration of the microbialbiodiversity of the soil of Couhins. Nevertheless, again theextraction method used affected the biodiversity as revealed byRISA. Despite the bias introduced by the DNA extraction
used, the impact of agricultural practices on soil biodiversitycan be measured thanks to this molecular approach, thoughthe relative abundance of phylotypes in soils cannot be accu-rately estimated.
In addition, the yield of the 16S rDNA and 16S-23S inter-genic rDNA PCR reactions was measured in order to estimatethe impact of the extraction method and/or the soil matrix onPCR efficiency. The 16S rDNA amplification efficiency wasestimated by image analysis. In fact, no matter what the soilmatrix, the samples extracted with the MS laboratory methodyielded lower amounts of 16S rDNA PCR product than thoseextracted with the Bio 101 kit (Table 3). The two-way analysisof variance revealed that the 16S rDNA amplification wassignificantly affected by the extraction method but not by thesoil matrix. In addition, no significant interaction between theextraction method and the soil matrix was shown by the New-man-Keuls procedure. The effect of the extraction method onthe efficiency of the 16S rDNA is probably due to differentialcoextraction of impurities which may affect the activity of theTaq polymerase. However, despite the alteration of the ampli-fication efficiency, no clear differences have been observed inARDRA (Fig. 3). This contradictory result might be due to thefact that ARDRA patterns reveal only dominant microbialgenera, hiding much of the existing diversity and probablymasking the effect of the alteration of the amplification effi-ciency.
The yield of the 16S-23S intergenic rDNA PCR was alsodetermined. In fact, no matter what extraction method wasused, the PCR yield resulting from the amplification of DNAextracted from FM-treated soil was significantly higher than
TABLE 3. Yield of 16S rDNA PCR product amplified from DNA extracted from unamended soil and farmyard manure- and sewage sludge-treated soils following three different extraction methods
SoilaYield of 16S rDNA PCR product (arbitrary units) withb:
MS laboratorymethod
MoBioLaboratories kit Bio 101 kit
Unamended 172.5 6 20.5 a 194.0 6 22.6 ab 223.0 6 7.7 b
Treated with:Farmyard manure 163.4 6 21.8 a 163.4 6 6.9 a 227.3 6 9.4 bSewage sludge (SS10) 174.5 6 18.1 a 192.4 6 7.5 ab 218.5 6 4.5 bSewage sludge (SS100) 171.8 6 21.7 a 197.8 6 15.4 ab 207.0 6 16.2 ab
a SS10, 10 tons of dry matter/ha/yr. SS100, 100 tons of dry matter/ha/2 yr.b Values are means 6 SE. Values followed by the same letter do not differ significantly (P , 0.05).
TABLE 4. Yield of the RISA PCR product amplified from DNA extracted from unamended soil or farmyard manure- or sewage sludge-treated soil following three different extraction methods
SoilaYield of RISA PCR product (ng/ml) withb:
MS laboratorymethod
MoBioLaboratories kit Bio 101 kit
Unamended 61.4 6 12.4 b 41.0 6 10.4 ab 33.9 6 7.4 a
Treated with:Farmyard manure 52.3 6 8.6 ab 67.3 6 14.7 b 61.4 6 16.0 bSewage sludge (SS10) 47.1 6 4.5 ab 63.1 6 21.3 ab 58.6 6 11.8 abSewage sludge (SS100) 31.4 6 8.6 a 39.2 6 15.6 a 54.1 6 4.4 ab
a SS10, 10 tons of dry matter/ha/yr. SS100, 100 tons of dry matter/ha/2 yr.b Values are means 6 SE. Values followed by the same letter do not differ significantly at (P , 0.05).
2358 MARTIN-LAURENT ET AL. APPL. ENVIRON. MICROBIOL.
that resulting from the amplification of DNA extracted fromSS100 sewage sludge-treated soil (Table 4). Therefore, the soilmatrix significantly affected the yield of the 16S-23S rDNAamplification and the extraction method did not affect it sig-nificantly. Again, PCR efficiency alterations due to soil ma-trices would be in contradiction with the RISA results, whichshowed that the microbial diversity of unamended soil was verysimilar to that of the FM-treated soil but very different fromthat of either the SS10 or the SS100 sewage sludge-treated soil.Therefore, despite the observed soil matrix effect on the effi-ciency of 16S-23S rDNA amplification, the biodiversity re-vealed by RISA was not affected in the same way, suggestingthat the relation between PCR efficiency and the results ofRISA is not obvious.
In conclusion, the results presented here clearly demon-strate that soil DNA extraction methods can affect both phy-lotype abundance and composition of the indigenous bacterialcommunity. PCR biases also occur. Notably, the PCR effi-ciency of 16S or 16S-23S rDNA was affected by the extractionmethod or the soil matrix, respectively. Overall, assuming thatthe biases operated uniformly for all samples examined usingthe same DNA extraction method, our RISA data also indi-cated that these direct molecular methods allowed (i) the dif-ferentiation of soils according to their bacterial communitiesand (ii) the monitoring of differences in the bacterial commu-nities in a soil in response to a stress. However, all the prob-lems described above need to be considered before drawingconclusions concerning relative abundance of microbial phylo-types in soils. Additionally, our work suggests that the use ofstandard soil DNA extraction and PCR methods by soil mi-crobiologists could provide a more complete understanding ofthe composition and diversity of soil microbial communities.
We thank Jean-Claude Fournier and Bernard Lagacherie for helpfuldiscussions. This study was supported by the MATE and the BurgundyRegion (contract number B03039).
REFERENCES
1. Frostegard, A., S. Courtois, V. Ramisse, S. Clerc, D. Bernillon, F. LeGall, P.Jeanin, X. Nesme, and P. Simonet. 1999. Quantification of bias related to theextraction of DNA directly from soils. Appl. Environ. Microbiol. 65:5409–5420.
2. Gurtler V., and V. A. Stanisich. 1996. New approaches to typing and iden-tification of bacteria using the 16S–23S rDNA spacer region. Microbiology142:3–16.
3. Hill, G. T., N. A. Mitkowski, L. Aldrich-Wolfe, L. R. Emele, D. D. Jurkonie,A. Ficke, S. Maldona-Ramirez, S. T. Lynch, and E. B. Nelson. 2000. Methodsfor assessing the composition and diversity of soil microbial communities.Appl. Soil Ecol. 15:25–36.
4. Hugenholtz, P., B. M. Goebel, and N. R. Pace. 1998. Impact of culture-independent studies on the emerging phylogenetic view of bacterial diversity.J. Bacteriol. 180:4765–4774.
5. Kresk, M., and E. M. H. Wellington. 1999. Comparison of different methodsfor the isolation and purification of total community DNA from soil. J.Microbiol. Methods 39:1–16.
6. Kuske, C. R., S. M. Barns, and J. D. Bush. 1997. Diverse uncultivatedbacterial groups from soils of the arid southwestern United States that arepresent in many geographic regions. Appl. Environ. Microbiol. 63:3614–3621.
7. Lineres, I., R. Chaussod, C. Juste, and P. Solda. 1989. Microbial biomassand biological activities in an acid sandy soil treated with sewage sludge orfarmyard manure in a long term field experiment, p. 517–520. In A. H.Dirkzwager and P. L’Hermite (ed.), Sewage sludge treatment and use: newdevelopments, technological aspects and environmental effects. Elsevier Ap-plied Science, London, United Kingdom.
8. Miller, D. N., J. E. Bryant, E. L. Madsen, and W. C. Ghiorse. 1999. Evalu-ation and optimization of DNA extraction and purification procedures forsoil and sediment samples. Appl. Environ. Microbiol. 65:4715–4724.
9. Nusslein, K., and J. M. Tiedje. 1998. Characterization of the dominant andrare members of a young Hawaiian soil bacterial community with small-subunit ribosmal DNA from DNA fractionated on the basis of its guanineand cytosine composition. Appl. Environ. Microbiol. 64:1283–1289.
10. Ranjard, L., F. Poly, J. Combrisson, A. Richaume, F. Gourbiere, J. Thiou-louse, and S. Nazaret. 2000. Heterogeneous cell density and genetic struc-ture of bacterial pools associated with various soil microenvironments asdetermined by enumeration and DNA fingerprinting approach (RISA). Mi-crob. Ecol. 39:263–272.
11. Stackebrandt, E., W. Liesack, and B. M. Goebel. 1993. Bacterial diversity ina soil sample from a subtropical Australian environment as determined by16S rDNA analysis. FASEB J. 7:232–236.
12. Torsvik, V., J. Golsoyr, and F. Daae. 1990. High diversity in DNA of soilbacteria. Appl. Environ. Microbiol. 56:782–787.
13. Tsai, Y.-L., and B. H. Olson. 1991. Rapid method for direct extraction ofDNA from soil and sediment. Appl. Environ. Microbiol. 57:1070–1074.
14. Zhou, J., M. A. Bruns, and J. M. Tiedje. 1996. DNA recovery from soils ofdiverse composition. Appl. Environ. Microbiol. 62:316–322.
VOL. 67, 2001 OLD BIAS FOR NEW MICROBIAL DIVERSITY ANALYSIS METHODS 2359
ANNEXE 2
Article 2 : Taille d’échantillons pour méthodes bio-moléculaires
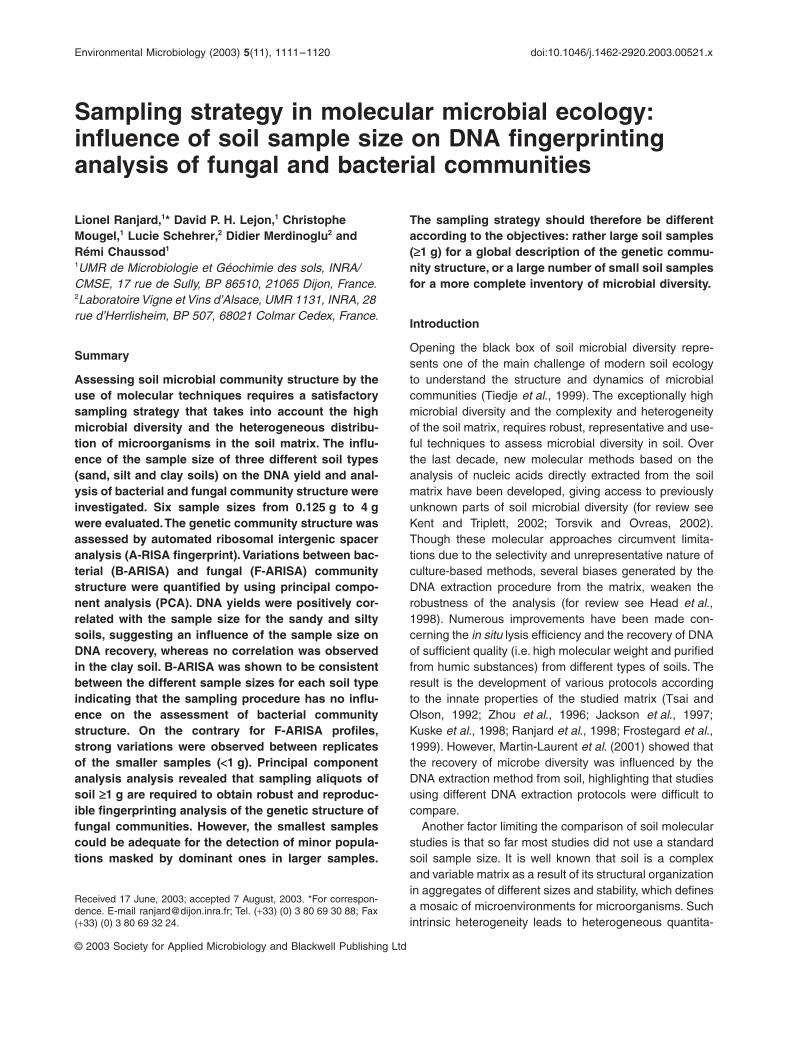
Environmental Microbiology (2003)
5
(11), 1111–1120 doi:10.1046/j.1462-2920.2003.00521.x
© 2003 Society for Applied Microbiology and Blackwell Publishing Ltd
Blackwell Science, LtdOxford, UKEMIEnvironmental Microbiology 1462-2920Society for Applied Microbiology and Blackwell Publishing Ltd, 20035
1111111120
Original Article
Influence of soil sample size on microbial community analysisL. Ranjard
et al.
Received 17 June, 2003; accepted 7 August, 2003. *For correspon-dence. E-mail [email protected]; Tel. (
+
33) (0) 3 80 69 30 88; Fax(
+
33) (0) 3 80 69 32 24.
Sampling strategy in molecular microbial ecology: influence of soil sample size on DNA fingerprinting analysis of fungal and bacterial communities
Lionel Ranjard,
1
* David P. H. Lejon,
1
Christophe Mougel,
1
Lucie Schehrer,
2
Didier Merdinoglu
2
and Rémi Chaussod
1
1
UMR de Microbiologie et Géochimie des sols, INRA/CMSE, 17 rue de Sully, BP 86510, 21065 Dijon, France.
2
Laboratoire Vigne et Vins d’Alsace, UMR 1131, INRA, 28 rue d’Herrlisheim, BP 507, 68021 Colmar Cedex, France.
Summary
Assessing soil microbial community structure by theuse of molecular techniques requires a satisfactorysampling strategy that takes into account the highmicrobial diversity and the heterogeneous distribu-tion of microorganisms in the soil matrix. The influ-ence of the sample size of three different soil types(sand, silt and clay soils) on the DNA yield and anal-ysis of bacterial and fungal community structure wereinvestigated. Six sample sizes from 0.125 g to 4 gwere evaluated. The genetic community structure wasassessed by automated ribosomal intergenic spaceranalysis (A-RISA fingerprint). Variations between bac-terial (B-ARISA) and fungal (F-ARISA) communitystructure were quantified by using principal compo-nent analysis (PCA). DNA yields were positively cor-related with the sample size for the sandy and siltysoils, suggesting an influence of the sample size onDNA recovery, whereas no correlation was observedin the clay soil. B-ARISA was shown to be consistentbetween the different sample sizes for each soil typeindicating that the sampling procedure has no influ-ence on the assessment of bacterial communitystructure. On the contrary for F-ARISA profiles,strong variations were observed between replicatesof the smaller samples (
<
1 g). Principal componentanalysis analysis revealed that sampling aliquots ofsoil
≥
1 g are required to obtain robust and reproduc-ible fingerprinting analysis of the genetic structure offungal communities. However, the smallest samplescould be adequate for the detection of minor popula-tions masked by dominant ones in larger samples.
The sampling strategy should therefore be differentaccording to the objectives: rather large soil samples(
≥
1 g) for a global description of the genetic commu-nity structure, or a large number of small soil samplesfor a more complete inventory of microbial diversity.
Introduction
Opening the black box of soil microbial diversity repre-sents one of the main challenge of modern soil ecologyto understand the structure and dynamics of microbialcommunities (Tiedje
et al
., 1999). The exceptionally highmicrobial diversity and the complexity and heterogeneityof the soil matrix, requires robust, representative and use-ful techniques to assess microbial diversity in soil. Overthe last decade, new molecular methods based on theanalysis of nucleic acids directly extracted from the soilmatrix have been developed, giving access to previouslyunknown parts of soil microbial diversity (for review seeKent and Triplett, 2002; Torsvik and Ovreas, 2002).Though these molecular approaches circumvent limita-tions due to the selectivity and unrepresentative nature ofculture-based methods, several biases generated by theDNA extraction procedure from the matrix, weaken therobustness of the analysis (for review see Head
et al
.,1998). Numerous improvements have been made con-cerning the
in situ
lysis efficiency and the recovery of DNAof sufficient quality (i.e. high molecular weight and purifiedfrom humic substances) from different types of soils. Theresult is the development of various protocols accordingto the innate properties of the studied matrix (Tsai andOlson, 1992; Zhou
et al
., 1996; Jackson
et al
., 1997;Kuske
et al
., 1998; Ranjard
et al
., 1998; Frostegard
et al
.,1999). However, Martin-Laurent
et al
. (2001) showed thatthe recovery of microbe diversity was influenced by theDNA extraction method from soil, highlighting that studiesusing different DNA extraction protocols were difficult tocompare.
Another factor limiting the comparison of soil molecularstudies is that so far most studies did not use a standardsoil sample size. It is well known that soil is a complexand variable matrix as a result of its structural organizationin aggregates of different sizes and stability, which definesa mosaic of microenvironments for microorganisms. Suchintrinsic heterogeneity leads to heterogeneous quantita-
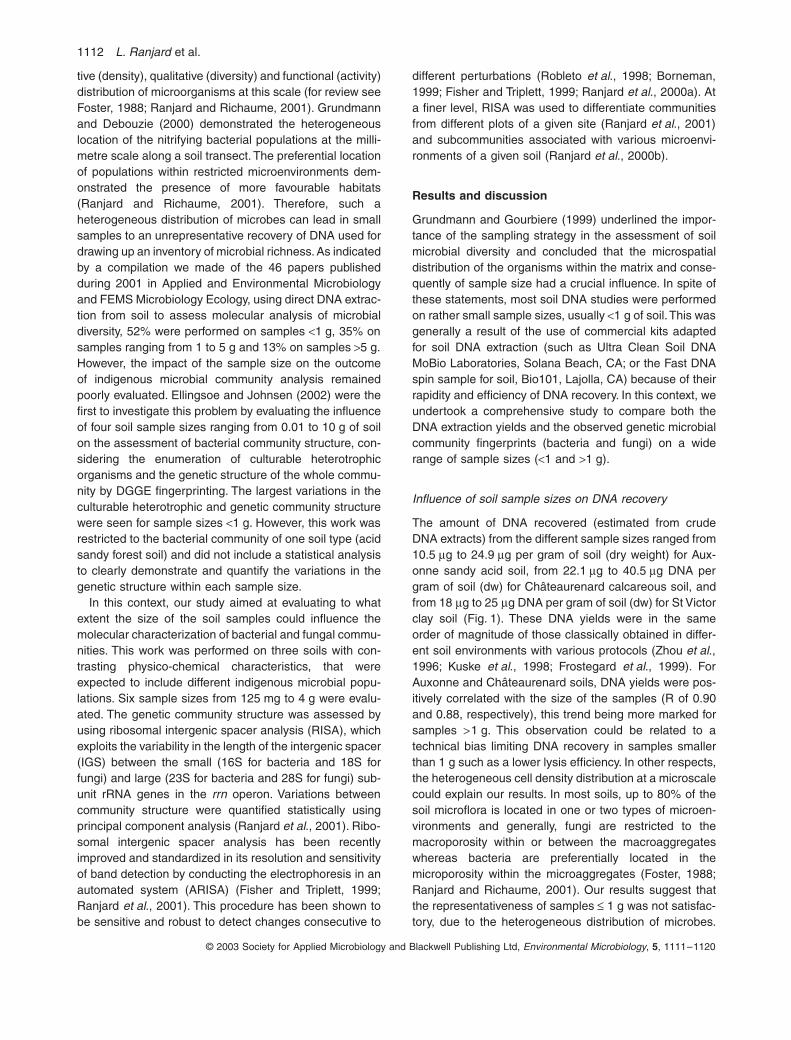
1112
L. Ranjard
et al.
© 2003 Society for Applied Microbiology and Blackwell Publishing Ltd,
Environmental Microbiology
,
5
, 1111–1120
tive (density), qualitative (diversity) and functional (activity)distribution of microorganisms at this scale (for review seeFoster, 1988; Ranjard and Richaume, 2001). Grundmannand Debouzie (2000) demonstrated the heterogeneouslocation of the nitrifying bacterial populations at the milli-metre scale along a soil transect. The preferential locationof populations within restricted microenvironments dem-onstrated the presence of more favourable habitats(Ranjard and Richaume, 2001). Therefore, such aheterogeneous distribution of microbes can lead in smallsamples to an unrepresentative recovery of DNA used fordrawing up an inventory of microbial richness. As indicatedby a compilation we made of the 46 papers publishedduring 2001 in Applied and Environmental Microbiologyand FEMS Microbiology Ecology, using direct DNA extrac-tion from soil to assess molecular analysis of microbialdiversity, 52% were performed on samples
<
1 g, 35% onsamples ranging from 1 to 5 g and 13% on samples
>
5 g.However, the impact of the sample size on the outcomeof indigenous microbial community analysis remainedpoorly evaluated. Ellingsoe and Johnsen (2002) were thefirst to investigate this problem by evaluating the influenceof four soil sample sizes ranging from 0.01 to 10 g of soilon the assessment of bacterial community structure, con-sidering the enumeration of culturable heterotrophicorganisms and the genetic structure of the whole commu-nity by DGGE fingerprinting. The largest variations in theculturable heterotrophic and genetic community structurewere seen for sample sizes
<
1 g. However, this work wasrestricted to the bacterial community of one soil type (acidsandy forest soil) and did not include a statistical analysisto clearly demonstrate and quantify the variations in thegenetic structure within each sample size.
In this context, our study aimed at evaluating to whatextent the size of the soil samples could influence themolecular characterization of bacterial and fungal commu-nities. This work was performed on three soils with con-trasting physico-chemical characteristics, that wereexpected to include different indigenous microbial popu-lations. Six sample sizes from 125 mg to 4 g were evalu-ated. The genetic community structure was assessed byusing ribosomal intergenic spacer analysis (RISA), whichexploits the variability in the length of the intergenic spacer(IGS) between the small (16S for bacteria and 18S forfungi) and large (23S for bacteria and 28S for fungi) sub-unit rRNA genes in the
rrn
operon. Variations betweencommunity structure were quantified statistically usingprincipal component analysis (Ranjard
et al
., 2001). Ribo-somal intergenic spacer analysis has been recentlyimproved and standardized in its resolution and sensitivityof band detection by conducting the electrophoresis in anautomated system (ARISA) (Fisher and Triplett, 1999;Ranjard
et al
., 2001). This procedure has been shown tobe sensitive and robust to detect changes consecutive to
different perturbations (Robleto
et al
., 1998; Borneman,1999; Fisher and Triplett, 1999; Ranjard
et al
., 2000a). Ata finer level, RISA was used to differentiate communitiesfrom different plots of a given site (Ranjard
et al
., 2001)and subcommunities associated with various microenvi-ronments of a given soil (Ranjard
et al
., 2000b).
Results and discussion
Grundmann and Gourbiere (1999) underlined the impor-tance of the sampling strategy in the assessment of soilmicrobial diversity and concluded that the microspatialdistribution of the organisms within the matrix and conse-quently of sample size had a crucial influence. In spite ofthese statements, most soil DNA studies were performedon rather small sample sizes, usually
<
1 g of soil. This wasgenerally a result of the use of commercial kits adaptedfor soil DNA extraction (such as Ultra Clean Soil DNAMoBio Laboratories, Solana Beach, CA; or the Fast DNAspin sample for soil, Bio101, Lajolla, CA) because of theirrapidity and efficiency of DNA recovery. In this context, weundertook a comprehensive study to compare both theDNA extraction yields and the observed genetic microbialcommunity fingerprints (bacteria and fungi) on a widerange of sample sizes (
<
1 and
>
1 g).
Influence of soil sample sizes on DNA recovery
The amount of DNA recovered (estimated from crudeDNA extracts) from the different sample sizes ranged from10.5
m
g to 24.9
m
g per gram of soil (dry weight) for Aux-onne sandy acid soil, from 22.1
m
g to 40.5
m
g DNA pergram of soil (dw) for Châteaurenard calcareous soil, andfrom 18
m
g to 25
m
g DNA per gram of soil (dw) for St Victorclay soil (Fig. 1). These DNA yields were in the sameorder of magnitude of those classically obtained in differ-ent soil environments with various protocols (Zhou
et al
.,1996; Kuske
et al
., 1998; Frostegard
et al
., 1999). ForAuxonne and Châteaurenard soils, DNA yields were pos-itively correlated with the size of the samples (R of 0.90and 0.88, respectively), this trend being more marked forsamples
>
1 g. This observation could be related to atechnical bias limiting DNA recovery in samples smallerthan 1 g such as a lower lysis efficiency. In other respects,the heterogeneous cell density distribution at a microscalecould explain our results. In most soils, up to 80% of thesoil microflora is located in one or two types of microen-vironments and generally, fungi are restricted to themacroporosity within or between the macroaggregateswhereas bacteria are preferentially located in themicroporosity within the microaggregates (Foster, 1988;Ranjard and Richaume, 2001). Our results suggest thatthe representativeness of samples
£
1 g was not satisfac-tory, due to the heterogeneous distribution of microbes.
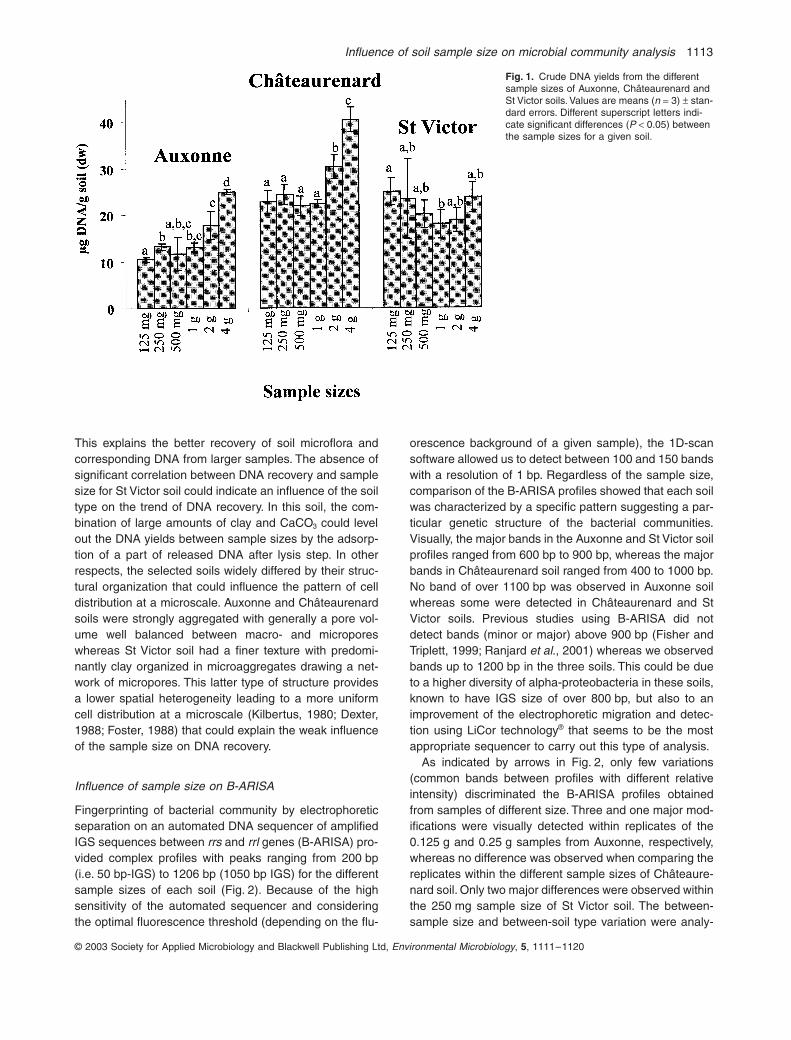
Influence of soil sample size on microbial community analysis
1113
© 2003 Society for Applied Microbiology and Blackwell Publishing Ltd,
Environmental Microbiology
,
5
, 1111–1120
This explains the better recovery of soil microflora andcorresponding DNA from larger samples. The absence ofsignificant correlation between DNA recovery and samplesize for St Victor soil could indicate an influence of the soiltype on the trend of DNA recovery. In this soil, the com-bination of large amounts of clay and CaCO
3
could levelout the DNA yields between sample sizes by the adsorp-tion of a part of released DNA after lysis step. In otherrespects, the selected soils widely differed by their struc-tural organization that could influence the pattern of celldistribution at a microscale. Auxonne and Châteaurenardsoils were strongly aggregated with generally a pore vol-ume well balanced between macro- and microporeswhereas St Victor soil had a finer texture with predomi-nantly clay organized in microaggregates drawing a net-work of micropores. This latter type of structure providesa lower spatial heterogeneity leading to a more uniformcell distribution at a microscale (Kilbertus, 1980; Dexter,1988; Foster, 1988) that could explain the weak influenceof the sample size on DNA recovery.
Influence of sample size on B-ARISA
Fingerprinting of bacterial community by electrophoreticseparation on an automated DNA sequencer of amplifiedIGS sequences between
rrs
and
rrl
genes (B-ARISA) pro-vided complex profiles with peaks ranging from 200 bp(i.e. 50 bp-IGS) to 1206 bp (1050 bp IGS) for the differentsample sizes of each soil (Fig. 2). Because of the highsensitivity of the automated sequencer and consideringthe optimal fluorescence threshold (depending on the flu-
orescence background of a given sample), the 1D-scansoftware allowed us to detect between 100 and 150 bandswith a resolution of 1 bp. Regardless of the sample size,comparison of the B-ARISA profiles showed that each soilwas characterized by a specific pattern suggesting a par-ticular genetic structure of the bacterial communities.Visually, the major bands in the Auxonne and St Victor soilprofiles ranged from 600 bp to 900 bp, whereas the majorbands in Châteaurenard soil ranged from 400 to 1000 bp.No band of over 1100 bp was observed in Auxonne soilwhereas some were detected in Châteaurenard and StVictor soils. Previous studies using B-ARISA did notdetect bands (minor or major) above 900 bp (Fisher andTriplett, 1999; Ranjard
et al
., 2001) whereas we observedbands up to 1200 bp in the three soils. This could be dueto a higher diversity of alpha-proteobacteria in these soils,known to have IGS size of over 800 bp, but also to animprovement of the electrophoretic migration and detec-tion using LiCor technology
®
that seems to be the mostappropriate sequencer to carry out this type of analysis.
As indicated by arrows in Fig. 2, only few variations(common bands between profiles with different relativeintensity) discriminated the B-ARISA profiles obtainedfrom samples of different size. Three and one major mod-ifications were visually detected within replicates of the0.125 g and 0.25 g samples from Auxonne, respectively,whereas no difference was observed when comparing thereplicates within the different sample sizes of Châteaure-nard soil. Only two major differences were observed withinthe 250 mg sample size of St Victor soil. The between-sample size and between-soil type variation were analy-
Fig. 1.
Crude DNA yields from the different sample sizes of Auxonne, Châteaurenard and St Victor soils. Values are means (
n
=
3)
±
stan-dard errors. Different superscript letters indi-cate significant differences (
P
<
0.05) between the sample sizes for a given soil.
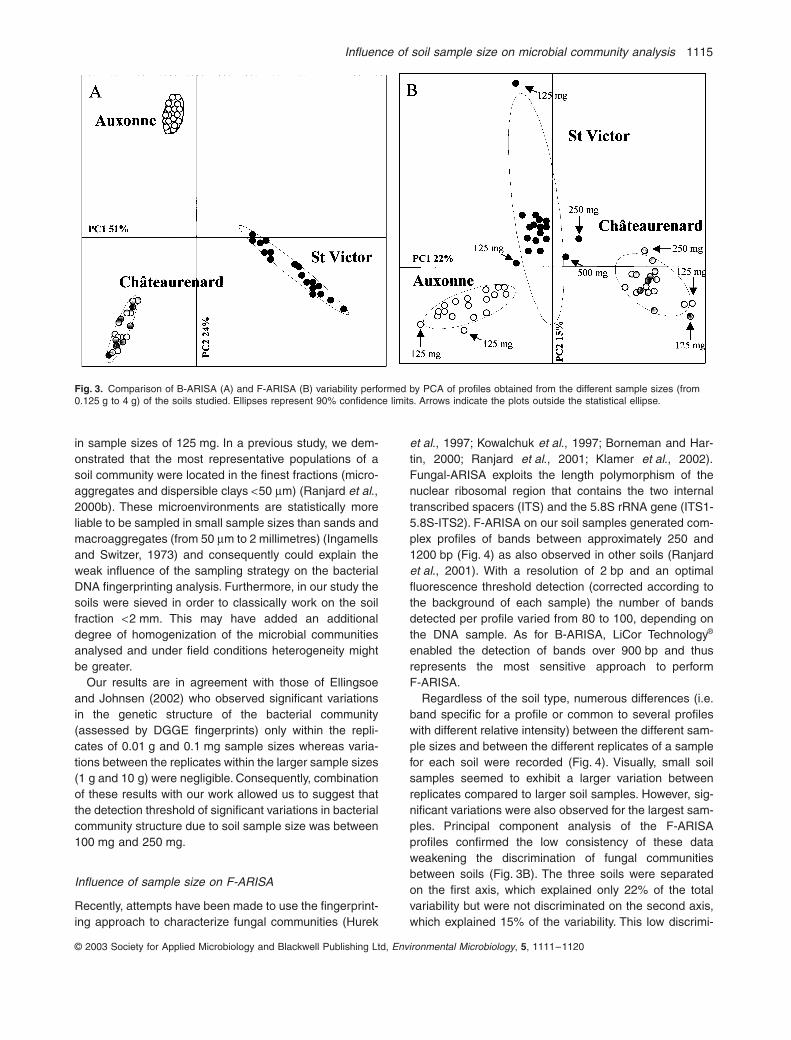
Influence of soil sample size on microbial community analysis
1115
© 2003 Society for Applied Microbiology and Blackwell Publishing Ltd,
Environmental Microbiology
,
5
, 1111–1120
in sample sizes of 125 mg. In a previous study, we dem-onstrated that the most representative populations of asoil community were located in the finest fractions (micro-aggregates and dispersible clays
<
50
m
m) (Ranjard
et al
.,2000b). These microenvironments are statistically moreliable to be sampled in small sample sizes than sands andmacroaggregates (from 50
m
m to 2 millimetres) (Ingamellsand Switzer, 1973) and consequently could explain theweak influence of the sampling strategy on the bacterialDNA fingerprinting analysis. Furthermore, in our study thesoils were sieved in order to classically work on the soilfraction
<
2 mm. This may have added an additionaldegree of homogenization of the microbial communitiesanalysed and under field conditions heterogeneity mightbe greater.
Our results are in agreement with those of Ellingsoeand Johnsen (2002) who observed significant variationsin the genetic structure of the bacterial community(assessed by DGGE fingerprints) only within the repli-cates of 0.01 g and 0.1 mg sample sizes whereas varia-tions between the replicates within the larger sample sizes(1 g and 10 g) were negligible. Consequently, combinationof these results with our work allowed us to suggest thatthe detection threshold of significant variations in bacterialcommunity structure due to soil sample size was between100 mg and 250 mg.
Influence of sample size on F-ARISA
Recently, attempts have been made to use the fingerprint-ing approach to characterize fungal communities (Hurek
et al
., 1997; Kowalchuk
et al
., 1997; Borneman and Har-tin, 2000; Ranjard
et al
., 2001; Klamer
et al
., 2002).Fungal-ARISA exploits the length polymorphism of thenuclear ribosomal region that contains the two internaltranscribed spacers (ITS) and the 5.8S rRNA gene (ITS1-5.8S-ITS2). F-ARISA on our soil samples generated com-plex profiles of bands between approximately 250 and1200 bp (Fig. 4) as also observed in other soils (Ranjard
et al
., 2001). With a resolution of 2 bp and an optimalfluorescence threshold detection (corrected according tothe background of each sample) the number of bandsdetected per profile varied from 80 to 100, depending onthe DNA sample. As for B-ARISA, LiCor Technology
®
enabled the detection of bands over 900 bp and thusrepresents the most sensitive approach to performF-ARISA.
Regardless of the soil type, numerous differences (i.e.band specific for a profile or common to several profileswith different relative intensity) between the different sam-ple sizes and between the different replicates of a samplefor each soil were recorded (Fig. 4). Visually, small soilsamples seemed to exhibit a larger variation betweenreplicates compared to larger soil samples. However, sig-nificant variations were also observed for the largest sam-ples. Principal component analysis of the F-ARISAprofiles confirmed the low consistency of these dataweakening the discrimination of fungal communitiesbetween soils (Fig. 3B). The three soils were separatedon the first axis, which explained only 22% of the totalvariability but were not discriminated on the second axis,which explained 15% of the variability. This low discrimi-
Fig. 3.
Comparison of B-ARISA (A) and F-ARISA (B) variability performed by PCA of profiles obtained from the different sample sizes (from 0.125 g to 4 g) of the soils studied. Ellipses represent 90% confidence limits. Arrows indicate the plots outside the statistical ellipse.
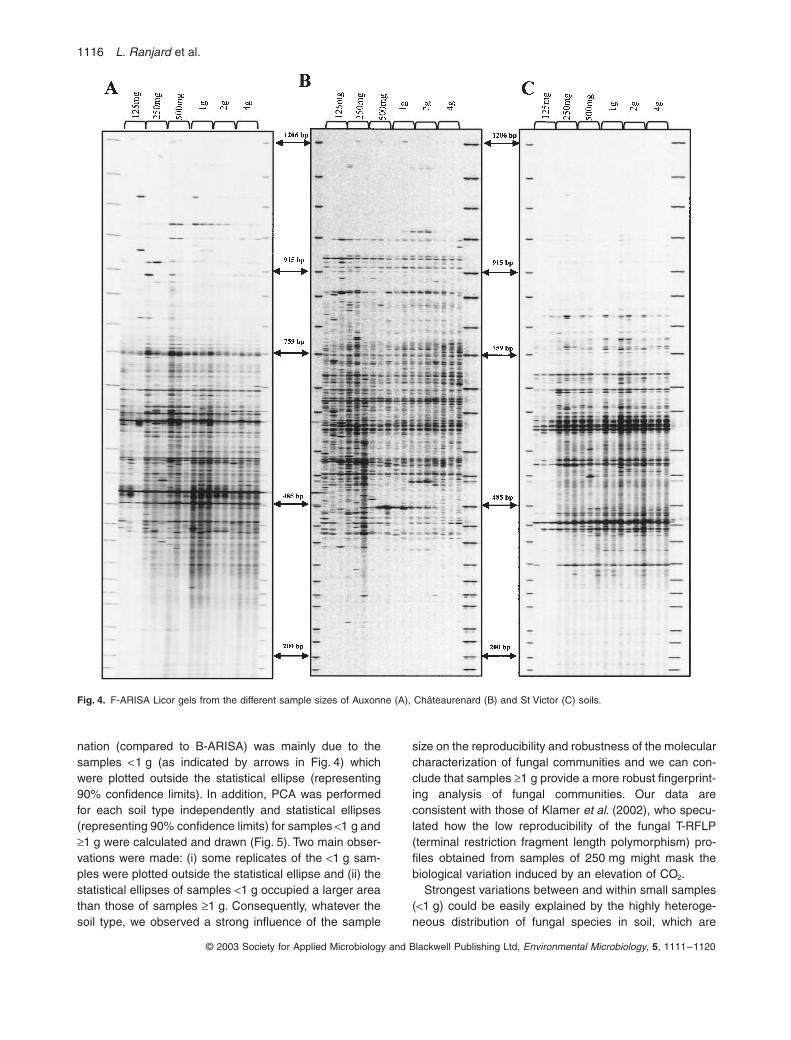
1116
L. Ranjard
et al.
© 2003 Society for Applied Microbiology and Blackwell Publishing Ltd,
Environmental Microbiology
,
5
, 1111–1120
nation (compared to B-ARISA) was mainly due to thesamples
<
1 g (as indicated by arrows in Fig. 4) whichwere plotted outside the statistical ellipse (representing90% confidence limits). In addition, PCA was performedfor each soil type independently and statistical ellipses(representing 90% confidence limits) for samples
<
1 g and
≥
1 g were calculated and drawn (Fig. 5). Two main obser-vations were made: (i) some replicates of the
<
1 g sam-ples were plotted outside the statistical ellipse and (ii) thestatistical ellipses of samples
<
1 g occupied a larger areathan those of samples
≥
1 g. Consequently, whatever thesoil type, we observed a strong influence of the sample
size on the reproducibility and robustness of the molecularcharacterization of fungal communities and we can con-clude that samples
≥
1 g provide a more robust fingerprint-ing analysis of fungal communities. Our data areconsistent with those of Klamer
et al
. (2002), who specu-lated how the low reproducibility of the fungal T-RFLP(terminal restriction fragment length polymorphism) pro-files obtained from samples of 250 mg might mask thebiological variation induced by an elevation of CO
2
.Strongest variations between and within small samples
(
<
1 g) could be easily explained by the highly heteroge-neous distribution of fungal species in soil, which are
Fig. 4.
F-ARISA Licor gels from the different sample sizes of Auxonne (A), Châteaurenard (B) and St Victor (C) soils.
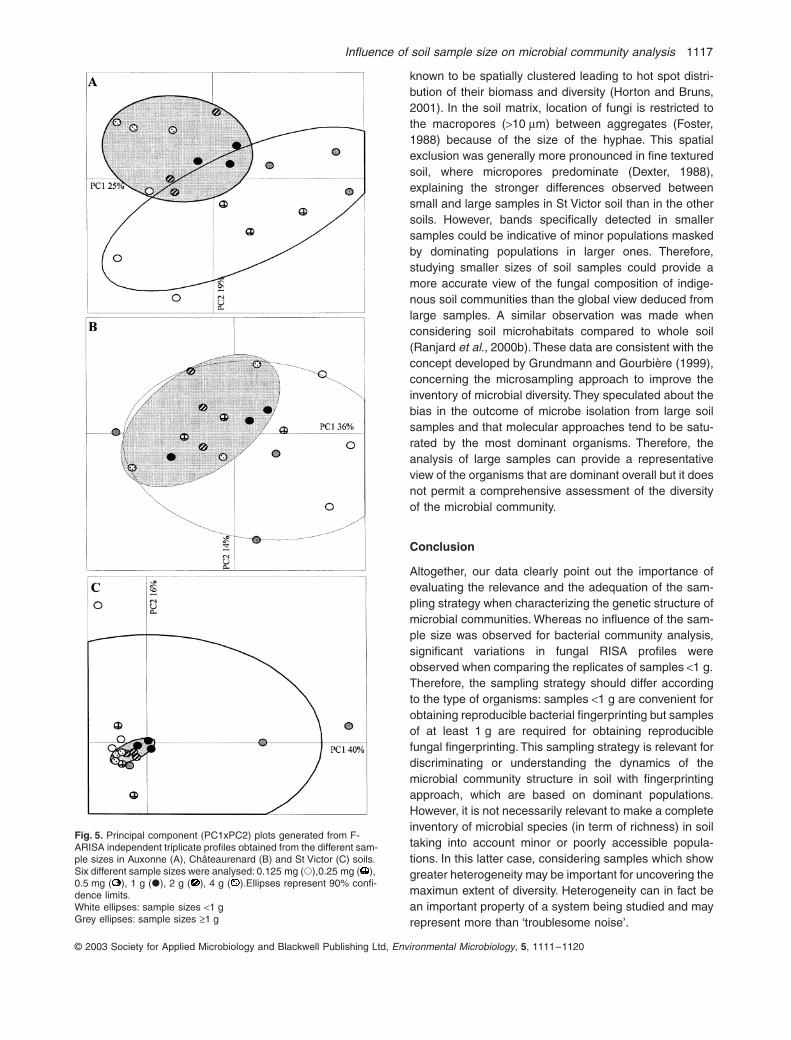
Influence of soil sample size on microbial community analysis
1117
© 2003 Society for Applied Microbiology and Blackwell Publishing Ltd,
Environmental Microbiology
,
5
, 1111–1120
known to be spatially clustered leading to hot spot distri-bution of their biomass and diversity (Horton and Bruns,2001). In the soil matrix, location of fungi is restricted tothe macropores (
>
10
m
m) between aggregates (Foster,1988) because of the size of the hyphae. This spatialexclusion was generally more pronounced in fine texturedsoil, where micropores predominate (Dexter, 1988),explaining the stronger differences observed betweensmall and large samples in St Victor soil than in the othersoils. However, bands specifically detected in smallersamples could be indicative of minor populations maskedby dominating populations in larger ones. Therefore,studying smaller sizes of soil samples could provide amore accurate view of the fungal composition of indige-nous soil communities than the global view deduced fromlarge samples. A similar observation was made whenconsidering soil microhabitats compared to whole soil(Ranjard
et al
., 2000b). These data are consistent with theconcept developed by Grundmann and Gourbière (1999),concerning the microsampling approach to improve theinventory of microbial diversity. They speculated about thebias in the outcome of microbe isolation from large soilsamples and that molecular approaches tend to be satu-rated by the most dominant organisms. Therefore, theanalysis of large samples can provide a representativeview of the organisms that are dominant overall but it doesnot permit a comprehensive assessment of the diversityof the microbial community.
Conclusion
Altogether, our data clearly point out the importance ofevaluating the relevance and the adequation of the sam-pling strategy when characterizing the genetic structure ofmicrobial communities. Whereas no influence of the sam-ple size was observed for bacterial community analysis,significant variations in fungal RISA profiles wereobserved when comparing the replicates of samples
<
1 g.Therefore, the sampling strategy should differ accordingto the type of organisms: samples
<
1 g are convenient forobtaining reproducible bacterial fingerprinting but samplesof at least 1 g are required for obtaining reproduciblefungal fingerprinting. This sampling strategy is relevant fordiscriminating or understanding the dynamics of themicrobial community structure in soil with fingerprintingapproach, which are based on dominant populations.However, it is not necessarily relevant to make a completeinventory of microbial species (in term of richness) in soiltaking into account minor or poorly accessible popula-tions. In this latter case, considering samples which showgreater heterogeneity may be important for uncovering themaximun extent of diversity. Heterogeneity can in fact bean important property of a system being studied and mayrepresent more than ‘troublesome noise’.
Fig. 5.
Principal component (PC1xPC2) plots generated from F-ARISA independent triplicate profiles obtained from the different sam-ple sizes in Auxonne (A), Châteaurenard (B) and St Victor (C) soils. Six different sample sizes were analysed: 0.125 mg (
�
),0.25 mg ( ), 0.5 mg ( ), 1 g (�), 2 g ( ), 4 g ( ).Ellipses represent 90% confi-dence limits.White ellipses: sample sizes <1 gGrey ellipses: sample sizes ≥1 g
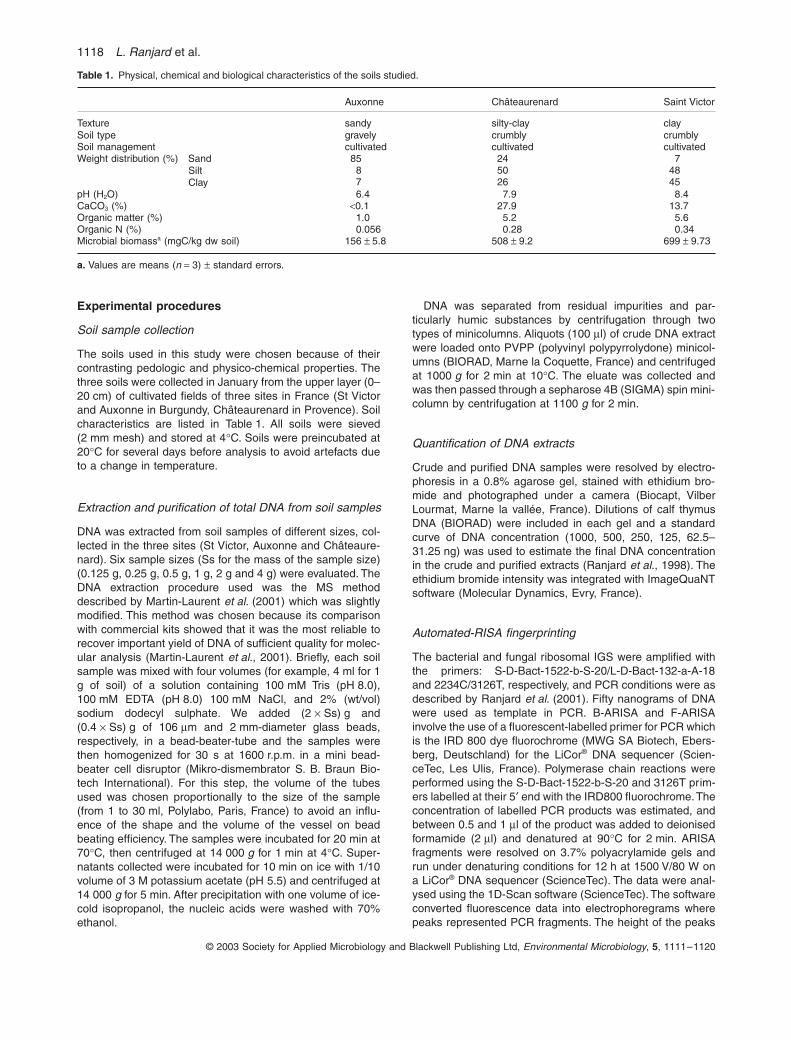
1118 L. Ranjard et al.
© 2003 Society for Applied Microbiology and Blackwell Publishing Ltd, Environmental Microbiology, 5, 1111–1120
Experimental procedures
Soil sample collection
The soils used in this study were chosen because of theircontrasting pedologic and physico-chemical properties. Thethree soils were collected in January from the upper layer (0–20 cm) of cultivated fields of three sites in France (St Victorand Auxonne in Burgundy, Châteaurenard in Provence). Soilcharacteristics are listed in Table 1. All soils were sieved(2 mm mesh) and stored at 4∞C. Soils were preincubated at20∞C for several days before analysis to avoid artefacts dueto a change in temperature.
Extraction and purification of total DNA from soil samples
DNA was extracted from soil samples of different sizes, col-lected in the three sites (St Victor, Auxonne and Châteaure-nard). Six sample sizes (Ss for the mass of the sample size)(0.125 g, 0.25 g, 0.5 g, 1 g, 2 g and 4 g) were evaluated. TheDNA extraction procedure used was the MS methoddescribed by Martin-Laurent et al. (2001) which was slightlymodified. This method was chosen because its comparisonwith commercial kits showed that it was the most reliable torecover important yield of DNA of sufficient quality for molec-ular analysis (Martin-Laurent et al., 2001). Briefly, each soilsample was mixed with four volumes (for example, 4 ml for 1g of soil) of a solution containing 100 mM Tris (pH 8.0),100 mM EDTA (pH 8.0) 100 mM NaCl, and 2% (wt/vol)sodium dodecyl sulphate. We added (2 ¥ Ss) g and(0.4 ¥ Ss) g of 106 mm and 2 mm-diameter glass beads,respectively, in a bead-beater-tube and the samples werethen homogenized for 30 s at 1600 r.p.m. in a mini bead-beater cell disruptor (Mikro-dismembrator S. B. Braun Bio-tech International). For this step, the volume of the tubesused was chosen proportionally to the size of the sample(from 1 to 30 ml, Polylabo, Paris, France) to avoid an influ-ence of the shape and the volume of the vessel on beadbeating efficiency. The samples were incubated for 20 min at70∞C, then centrifuged at 14 000 g for 1 min at 4∞C. Super-natants collected were incubated for 10 min on ice with 1/10volume of 3 M potassium acetate (pH 5.5) and centrifuged at14 000 g for 5 min. After precipitation with one volume of ice-cold isopropanol, the nucleic acids were washed with 70%ethanol.
DNA was separated from residual impurities and par-ticularly humic substances by centrifugation through twotypes of minicolumns. Aliquots (100 ml) of crude DNA extractwere loaded onto PVPP (polyvinyl polypyrrolydone) minicol-umns (BIORAD, Marne la Coquette, France) and centrifugedat 1000 g for 2 min at 10∞C. The eluate was collected andwas then passed through a sepharose 4B (SIGMA) spin mini-column by centrifugation at 1100 g for 2 min.
Quantification of DNA extracts
Crude and purified DNA samples were resolved by electro-phoresis in a 0.8% agarose gel, stained with ethidium bro-mide and photographed under a camera (Biocapt, VilberLourmat, Marne la vallée, France). Dilutions of calf thymusDNA (BIORAD) were included in each gel and a standardcurve of DNA concentration (1000, 500, 250, 125, 62.5–31.25 ng) was used to estimate the final DNA concentrationin the crude and purified extracts (Ranjard et al., 1998). Theethidium bromide intensity was integrated with ImageQuaNTsoftware (Molecular Dynamics, Evry, France).
Automated-RISA fingerprinting
The bacterial and fungal ribosomal IGS were amplified withthe primers: S-D-Bact-1522-b-S-20/L-D-Bact-132-a-A-18and 2234C/3126T, respectively, and PCR conditions were asdescribed by Ranjard et al. (2001). Fifty nanograms of DNAwere used as template in PCR. B-ARISA and F-ARISAinvolve the use of a fluorescent-labelled primer for PCR whichis the IRD 800 dye fluorochrome (MWG SA Biotech, Ebers-berg, Deutschland) for the LiCor® DNA sequencer (Scien-ceTec, Les Ulis, France). Polymerase chain reactions wereperformed using the S-D-Bact-1522-b-S-20 and 3126T prim-ers labelled at their 5¢ end with the IRD800 fluorochrome. Theconcentration of labelled PCR products was estimated, andbetween 0.5 and 1 ml of the product was added to deionisedformamide (2 ml) and denatured at 90∞C for 2 min. ARISAfragments were resolved on 3.7% polyacrylamide gels andrun under denaturing conditions for 12 h at 1500 V/80 W ona LiCor® DNA sequencer (ScienceTec). The data were anal-ysed using the 1D-Scan software (ScienceTec). The softwareconverted fluorescence data into electrophoregrams wherepeaks represented PCR fragments. The height of the peaks
Table 1. Physical, chemical and biological characteristics of the soils studied.
Auxonne Châteaurenard Saint Victor
Texture sandy silty-clay claySoil type gravely crumbly crumblySoil management cultivated cultivated cultivatedWeight distribution (%) Sand
SiltClay
85 24 78 50 487 26 45
pH (H2O) 6.4 7.9 8.4CaCO3 (%) <0.1 27.9 13.7Organic matter (%) 1.0 5.2 5.6Organic N (%) 0.056 0.28 0.34Microbial biomassa (mgC/kg dw soil) 156 ± 5.8 508 ± 9.2 699 ± 9.73
a. Values are means (n = 3) ± standard errors.
Influence of soil sample size on microbial community analysis 1119
© 2003 Society for Applied Microbiology and Blackwell Publishing Ltd, Environmental Microbiology, 5, 1111–1120
was calculated in conjunction with the median filter optionand the Gaussian integration in 1D-Scan, and representedthe relative proportion of the fragments in the total products.Lengths (in base pairs) were calculated by using a size stan-dard with bands ranging from 200 to 1206 bp. The standardwas made by PCR amplifications of different fragment sizesof phage M13 mp18 (Promega, Charbonnières, France).
Statistical analysis
Significant differences (P < 0.05) in DNA yields between dif-ferent sample sizes in each soil were determined using Stat-view-SE software with the Student’s t-test.
Data obtained from the 1D-Scan software were convertedinto a table summarizing the band presence (i.e. peak) andintensity (i.e. height or area of peak) using the PrepRISAprogram (Ranjard et al., 2001). This software allowed us tochoose the number of peaks (i.e. all detected populationsversus the most dominant populations), the profile resolution(between 1 and 10 bp), and the method of evaluating peakintensity (height or area). As described in a previous study,we tested various combinations of parameters to define thebest one for a robust analysis (Ranjard et al., 2001).
Principal component analysis on a B-ARISA and F-ARISAcovariance matrix was performed on the data matrix (bacte-rial communities as rows and bands as columns). Thismethod provided an ordination of bacterial or fungal commu-nities and of the encoded bands, which were plotted in twodimensions based on the scores in the first two principalcomponents. PCA and Monte Carlo test were performedusing the ADE-4 software (Thioulouse et al., 1997).
Acknowledgements
We are grateful to P. Lemanceau, S. Nazaret, V. Edel-Hermanand J.C. Lata for their comments on this work. We thank J.Thioulouse for its help in statistical analysis and G. Ganeshfor its support during this work. This work was supported bythe INRA and the Ministère de l’Environnement as part of the‘GESSOL’ project.
References
Borneman, J. (1999) Culture-independent identification ofmicroorganisms that respond to specified stimuli. ApplEnviron Microbiol 65: 3398–3400.
Borneman, J., and Hartin, R.J. (2000) PCR primers thatamplify fungal rRNA genes from environmental samples.Appl Environ Microbiol 66: 4356–4360.
Dexter, A.R. (1988) Advances in characterisation of soilstructure. Soil Till Res 11: 199–238.
Ellingsoe, P., and Johnsen, K. (2002) Influence of soil samplesizes on the assessment of bacterial community structure.Soil Biol Biochem 34: 1701–1707.
Fisher, M.M., and Triplett, E.W. (1999) Automated approachfor ribosomal intergenic spacer analysis of microbial diver-sity and its application to freshwater bacterial communities.Appl Environ Microbiol 65: 4630–4636.
Foster, R.C. (1988) Microenvironments of soil microorgan-isms. Biol Fertil Soils 6: 189–203.
Frostegard, A., Courtois, S., Ramisse, V., Clerc, S., Bernillon,D., Le Gall, F., et al. (1999) Quantification of bias relatedto the extraction of DNA directly from soils. Appl EnvironMicrobiol 65: 5409–5420.
Grundmann, L.G., and Gourbiere, F. (1999) A micro-sampling approach to improve the inventory of bacterialdiversity in soil. Appl Soil Ecol 13: 123–126.
Grundmann, G.L., and Debouzie, D. (2000) Geostatisti-cal analysis of the distribution of nh (4) (+) and no(2) (-)-oxidizing bacteria and serotypes at the millime-ter scale along a soil transect. FEMS Microbiol Ecol34: 57–62.
Head, I.M., Saunders, J.R., and Pickup, R.W. (1998) Micro-bial evolution, diversity, and ecology: a decade of riboso-mal RNA analysis of uncultivated microorganisms. MicrobEcol 35: 1–21.
Horton, T.R., and Bruns, T.D. (2001) The molecular revolu-tion in ectomycorrhizal ecology: Peeking into the black-box.Mol Ecol 10: 1855–1871.
Hurek, T., Wagner, B., and Reinhold-Hurek, B. (1997) Iden-tification of n2-fixing plant- and fungus-associated azoar-cus species by PCR-based genomic fingerprints. ApplEnviron Microbiol 63: 4331–4339.
Ingamells, C.O., and Switzer, P. (1973) A proposed samplingconstant for use in geochemical analysis. Talanta 20: 547–568.
Jackson, C., Harper, J., Willoughby, D., Roden, E., andChurchill, P. (1997) A simple, efficient method for the sep-aration of humic substances and DNA from environmentalsamples. Appl Environ Microbiol 63: 4993–4995.
Kent, A.D., and Triplett, E.W. (2002) Microbial communitiesand their interactions in soil and rhizosphere ecosystems.Annu Rev Microbiol 56: 211–236.
Kilbertus, G.N. (1980) Etude des microhabitats contenusdans les agrégats du sol, leur relation avec la biomassebactérienne et la taille des procaryotes présents. Rev EcolBiol Sols 17: 543–557.
Klamer, M., Roberts, M.S., Levine, L.H., Drake, B.G., andGarland, J.L. (2002) Influence of elevated CO2 on thefungal community in a coastal scrub oak forest soilinvestigated with terminal-restriction fragment lengthpolymorphism analysis. Appl Environ Microbiol 68:4370–4376.
Kowalchuk, G., Gerards, S., and Woldendorp, J. (1997)Detection and characterization of fungal infections ofammophila arenaria (marram grass) roots by denaturinggradient gel electrophoresis of specifically amplified 18srDNA. Appl Environ Microbiol 63: 3858–3865.
Kuske, C.R., Banton, K.L., Adorada, D.L., Stark, P.C., Hill,K.K., and Jackson, P.J. (1998) Small-scale DNA samplepreparation method for field pcr detection of microbial cellsand spores in soil. Appl Environ Microbiol 64: 2463–2472.
Martin-Laurent, F., Philippot, L., Hallet, S., Chaussod, R.,Germon, J.C., Soulas, G., and Catroux, G. (2001) DNAextraction from soils: Old bias for new microbial diversityanalysis methods. Appl Environ Microbiol 67: 2354–2359.
Ranjard, L., and Richaume, A. (2001) Quantitative and qual-itative microscale distribution of bacteria in soil. Res Micro-biol 152: 707–716.
Ranjard, L., Poly, F., Combrisson, J., Richaume, A., andNazaret, S. (1998) A single procedure to recover DNA fromthe surface or inside aggregates and in various size frac-
1120 L. Ranjard et al.
© 2003 Society for Applied Microbiology and Blackwell Publishing Ltd, Environmental Microbiology, 5, 1111–1120
tions of soil suitable for pcr-based assays of bacterial com-munities. Eur J Soil Biol 34: 89–97.
Ranjard, L., Nazaret, S., Gourbiere, F., Thioulouse, J., Linet,P., and Richaume, A. (2000a) A soil microscale study toreveal the heterogeneity of Hg (II) impact on indigenousbacteria by quantification of adapted phenotypes and anal-ysis of community DNA fingerprints. FEMS Microbiol Ecol31: 107–115.
Ranjard, L., Poly, F., Combrisson, J., Richaume, A., Gour-biere, F., Thioulouse, J., and Nazaret, S. (2000b) Hetero-geneous cell density and genetic structure of bacterialpools associated with various soil microenvironments asdetermined by enumeration and DNA fingerprintingapproach (risa). Microb Ecol 39: 263–272.
Ranjard, L., Poly, F., Lata, J.-C., Mougel, C., Thioulouse, J.,and Nazaret, S. (2001) Characterization of bacterial andfungal soil communities by automated ribosomal intergenicspacer analysis fingerprints: Biological and methodologicalvariability. Appl Environ Microbiol 67: 4479–4487.
Robleto, E.A., Borneman, J., and Triplett, E.W. (1998) Effectsof bacterial antibiotic production on rhizosphere microbialcommunities from a culture-independent perspective. ApplEnviron Microbiol 64: 5020–5022.
Thioulouse, J., Chessel, D., Dolédec, S., and Olivier, J.M.(1997) Ade-4: a multivariate analysis and graphical displaysoftware. Stat Comput 7: 75–83.
Tiedje, J.M.S., Asuming-Brempong, S., Nusslein, K., Marsh,T.L., and Flynn, S.J. (1999) Opening the black box of soilmicrobial diversity. Appl Soil Ecol 13: 109–122.
Torsvik, V., and Ovreas, L. (2002) Microbial diversity andfunction in soil: From genes to ecosystems. Curr Op Micro-biol 5: 240–245.
Tsai, Y.L., and Olson, B.H. (1992) Detection of low numbersof bacterial cells in soils and sediments by polymerasechain reaction. Appl Environ Microbiol 58: 754–757.
Zhou, J., Bruns, M., and Tiedje, J. (1996) DNA recovery fromsoils of diverse composition. Appl Environ Microbiol 62:316–322.
ANNEXE 3
Article 3 : Fonctions et gènes fonctionnels
FEMS Microbiology Ecology 48 (2004) 425–435
www.fems-microbiology.org
Estimation of atrazine-degrading genetic potential and activityin three French agricultural soils
Fabrice Martin-Laurent a,*, Laurent Cornet a, Lionel Ranjard a,Juan-Carlos L�opez-Guti�errez a, Laurent Philippot a, Christophe Schwartz b,
R�emi Chaussod a, G�erard Catroux a, Guy Soulas a,1
a INRA-CMSE, UMR 1229 INRA-Universit�e de Bourgogne, Microbiologie et G�eochimie des Sols, 17 rue Sully, BP 86510, 21065 Dijon Cedex, Franceb ENSAIA-INPL/INRA, Laboratoire Sols et Environnement UMR 1120, 2, avenue de la Foret de Haye, BP 172,
F-54505 Vandoeuvre-les-Nancy, France
Received 15 December 2003; received in revised form 28 January 2004; accepted 1 March 2004
First published online 2 April 2004
Abstract
The impact of organic amendment (sewage sludge or waste water) used to fertilize agricultural soils was estimated on the at-
razine-degrading activity, the atrazine-degrading genetic potential and the bacterial community structure of soils continuously
cropped with corn. Long-term application of organic amendment did not modify atrazine-mineralizing activity, which was found to
essentially depend on the soil type. It also did not modify atrazine-degrading genetic potential estimated by quantitative PCR
targeting atzA, B and C genes, which was shown to depend on soil type. The structure of soil bacterial community determined by
RISA fingerprinting was significantly affected by organic amendment. These results showed that modification of the structure of soil
bacterial community in response to organic amendment is not necessarily accompanied by a modification of atrazine-degrading
genetic potential or activity. In addition, these results revealed that different soils showing similar atrazine-degrading genetic po-
tentials may exhibit different atrazine-degrading activities.
� 2004 Federation of European Microbiological Societies. Published by Elsevier B.V. All rights reserved.
Keywords: Biodegradation; Atrazine; atz genes; Quantitative PCR; Soil bacterial community
1. Introduction
Soil microorganisms are among the most diverse
component of terrestrial ecosystems [1] where they
transform the organic matter and contribute to carbon
and nutrients fluxes [2]. They also play a key role in the
quality of agricultural soils which is usually defined asthe sustained capacity of the soil to produce healthy and
nourishing crops, resist erosion and reduce the impact of
environmental stresses on plants [3]. Soil microbiota
* Corresponding author. Tel.: +33-3-80-69-34-06; fax: +33-3-80-69-
32-24.
E-mail address: [email protected] (F. Martin-Laurent).1 Present address: UMR Oenologie-Amp�elologie, Universit�e Victor
Segalen Bordeaux 2, 351 cours de la lib�eration, 33405 Talence Cedex,
France.
0168-6496/$22.00 � 2004 Federation of European Microbiological Societies
doi:10.1016/j.femsec.2004.03.008
notably affects: (i) soil fertility (availability of plant
nutrients) [4] and health (suppression of soil-borne plant
disease) [5] and (ii) detoxifying ability (e.g., pesticides
and xenobiotic compounds biodegradation) [6]. Soil
microorganisms have long been regarded as ubiquitous,
i.e., ‘‘everything is everywhere’’ [7]. This view led to the
common assumption that soil microbial communitiesare black boxes often considered as passive catalysts for
degradation, which is ultimately controlled by abiotic
factors such as temperature, humidity and pH [7].
However, increasing evidence shows that abiotic vari-
ables are not universally suitable for describing major
soil processes such as organic matter turnover and xe-
nobiotics behaviour. It was suggested that the key to
understanding soil functioning is the description of thecomposition and the biodiversity of soil microbial
communities [8]. Although soil microorganisms have
. Published by Elsevier B.V. All rights reserved.
426 F. Martin-Laurent et al. / FEMS Microbiology Ecology 48 (2004) 425–435
been grouped into functional clusters, the ecological and
process regulatory significance of species richness in soil
communities remains obscure [1]. Indeed, the hypo-
thetical interrelation between soil microbial biodiversity
and soil ecological functioning is poorly documented.This underlines the need to develop approaches that
allow explicit links to be established between the pres-
ence of specific microorganisms and the processes they
catalyse [9].
In order to determine possible interrelations among
(i) the functioning of specific soil microbial communi-
ties, (ii) the genetic potential and (iii) the soil microbial
community structure, we have chosen to study atrazine-degrading communities in three French agricultural soils
cropped with maize and yearly treated with atrazine at
the dose of 1 kg ha�1. Atrazine [2-chloro-4-(ethyla-
mino)-6-(iso propyl-amino)-s-triazine] is one of the most
widely used s-triazine-ring herbicides for controlling,
through photosystem II inhibition, pre- and post-emer-
gence broadleaf weeds in important crops such as maize
(Zea mays) and sorghum (Sorghum sp.) [10]. This her-bicide is moderately persistent in natural environments
where it is slowly degraded to hydroxyatrazine by
chemical processes [11] and partially hydroxylated to
deethylatrazine (DEA) and deisopropylatrazine (DIA)
by endogeneous bacterial mono-oxygenases [12]. As a
result, atrazine and its two main metabolites DEA and
DIA are environmentally prevalent s-triazines, fre-
quently detected at concentrations exceeding the Euro-pean Union limit of 0.1 lg l�1 of individual pesticide in
drinking water [13]. Soils repeatedly treated with this
herbicide show accelerated atrazine degradation ac-
companied by marked mineralization of s-triazine rings
[12,14,15]. A great variety of atrazine-degrading bacteria
have been isolated from soils that have been in contact
with this chemical [16–19]. These bacteria commonly
initiate atrazine degradation with a hydrolytic dechlo-rination, catalysed by ATZA [20] and followed by two
amidohydrolytic reactions catalysed by ATZB [21] and
ATZC [22], which together transform atrazine to cyan-
uric acid, which is then fully mineralized to CO2 and
NH3 by three other hydrolases ATZD, E and F [23].
The atzA, B and C genes coding enzymes related to the
amidohydrolase superfamily are widely dispersed, con-
served and associated with transposable elements similarto IS1071 [24,25]. Atrazine-degrading microbes are
phylogenetically diverse and show several catabolic gene
combinations in which atz genes are not always clus-
tered on the same plasmid suggesting that atrazine-de-
grading bacterial communities are still in evolution
[17,25].
We report the evaluation of: (i) the activity of soil
atrazine-degrading populations determined by radio-respirometry, (ii) the atrazine-degrading genetic poten-
tial of specific soil microbial communities estimated by
quantifying atzA, B and C gene copy number by real-
time PCR conducted on DNA directly extracted from
soil and (iii) the structure of soil microbial communities
estimated by ribosomal intergenic spacer analysis
(RISA) in French agricultural soils exposed to different
agricultural practices (soil amendment with sewagesludge or waste water).
2. Materials and methods
2.1. Soil origin, treatment and properties
Soil samples were collected from the agriculturalsoilsof Couhins (soil type: podzol), Pierrelaye (soil type:
sandy neoluvisoil) and La Bouzule (soil type: redoxic
neoluvisoil) cropped with corn and yearly treated with 1
kg ha�1 of atrazine.
The soil of Couhins is characterized by a very high
percentage of sand and a relatively low pH (Table 1).
This field plot (Institut National de la Recherche
Agronomique, INRA-Bordeaux, France) was continu-ously cropped with corn and treated for 19 years (from
1974 to 1993) as follows: none (N–P–K fertilizers only,
with soil considered non-amended) (U), farmyard ma-
nure (10 tons of dry matter per ha each year) (FM),
sewage sludge (10 tons of dry matter per ha each year)
(SS10) and sewage sludge (100 tons of dry matter per ha
every two year) (SS100). SS100 soil showed significantly
higher CEC, microbial C biomass and contents of or-ganic C and N than U, FM and SS10 soils. SS10 and
SS100 soils amended with sewage sludge showed a Cu
concentration 1.5 and 3.2 times higher than U soil, re-
spectively, and a Zn concentration 7.0 and 26.0 times
higher than U soil, respectively (Table 1).
The soil of Pierrelaye is typical from the Seine alluvial
valley presenting a high percentage of sand and a neutral
pH (Table 1). This site was amended for 102 years withthe municipal wastewater of Paris and used for mono-
culture of grain maize over the 30 last years. The site of
Pierrelaye was divided in three different areas according
to their level of contamination: weakly (WP), moder-
ately (MP) or heavily (HP) polluted. CEC and organic C
content were shown to be proportional to the level of
contamination of the soil (HP>MP>LP). HP soil
microbial C biomass was significantly higher than thoseof MP and LP. Pierrelaye soils were contaminated with
heavy metals (Zn and Cu) in proportion to the level of
soil pollution ([Cu/Zn]HP > [Cu/Zn]FP > [Cu/Zn]LP).
The soil of La Bouzule is typical from eastern part of
France presenting a high percentage of silt and clay as
well as a neutral pH (Table 1). This field experiment
(Institut National Polytechnique de Lorraine, Nancy,
France) previously cropped for 10 years with a winterwheat/rape rotation, was continuously cropped with
corn since year 2002 and treated as follows: none (U),
lightly dehydrated sewage sludge (LDSS), lightly dehy-
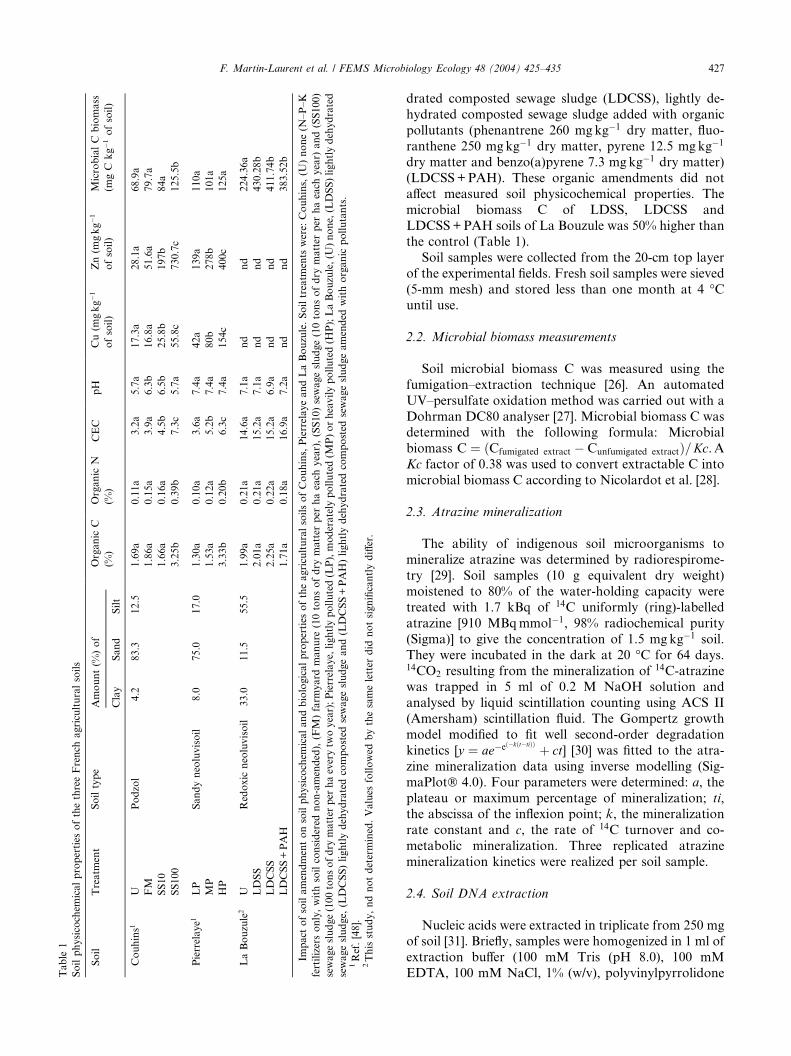
Table
1
Soilphysicochem
icalproperties
ofthethreeFrench
agriculturalsoils
Soil
Treatm
ent
Soiltype
Amount(%
)of
Organic
C
(%)
Organic
N
(%)
CEC
pH
Cu(m
gkg�1
ofsoil)
Zn(m
gkg�1
ofsoil)
MicrobialC
biomass
(mgC
kg�1ofsoil)
Clay
Sand
Silt
Couhins1
UPodzol
4.2
83.3
12.5
1.69a
0.11a
3.2a
5.7a
17.3a
28.1a
68.9a
FM
1.86a
0.15a
3.9a
6.3b
16.8a
51.6a
79.7a
SS10
1.66a
0.16a
4.5b
6.5b
25.8b
197b
84a
SS100
3.25b
0.39b
7.3c
5.7a
55.8c
730.7c
125.5b
Pierrelaye1
LP
Sandyneoluvisoil
8.0
75.0
17.0
1.30a
0.10a
3.6a
7.4a
42a
139a
110a
MP
1.53a
0.12a
5.2b
7.4a
80b
278b
101a
HP
3.33b
0.20b
6.3c
7.4a
154c
400c
125a
LaBouzule
2U
Redoxic
neoluvisoil
33.0
11.5
55.5
1.99a
0.21a
14.6a
7.1a
nd
nd
224.36a
LDSS
2.01a
0.21a
15.2a
7.1a
nd
nd
430.28b
LDCSS
2.25a
0.22a
15.2a
6.9a
nd
nd
411.74b
LDCSS+PAH
1.71a
0.18a
16.9a
7.2a
nd
nd
383.52b
Impact
ofsoilamendmentonsoilphysicochem
icalandbiologicalproperties
oftheagriculturalsoilsofCouhins,PierrelayeandLaBouzule.Soiltreatm
ents
were:
Couhins,(U
)none(N
–P–K
fertilizersonly,withsoilconsidered
non-amended),(FM)farm
yard
manure
(10tonsofdry
matter
per
haeach
year),(SS10)sewagesludge(10tonsofdry
matter
per
haeach
year)
and(SS100)
sewagesludge(100tonsofdry
matter
per
haeverytw
oyear);Pierrelaye,lightlypolluted(LP),moderately
polluted(M
P)orheavilypolluted(H
P);LaBouzule,(U
)none,(LDSS)lightlydehydrated
sewagesludge,
(LDCSS)lightlydehydratedcomposted
sewagesludgeand(LDCSS+PAH)lightlydehydratedcomposted
sewagesludgeamended
withorganic
pollutants.
1Ref.[48].
2Thisstudy,ndnotdetermined.Values
followed
bythesameletter
did
notsignificantlydiffer.
F. Martin-Laurent et al. / FEMS Microbiology Ecology 48 (2004) 425–435 427
drated composted sewage sludge (LDCSS), lightly de-
hydrated composted sewage sludge added with organic
pollutants (phenantrene 260 mg kg�1 dry matter, fluo-
ranthene 250 mgkg�1 dry matter, pyrene 12.5 mg kg�1
dry matter and benzo(a)pyrene 7.3 mg kg�1 dry matter)(LDCSS+PAH). These organic amendments did not
affect measured soil physicochemical properties. The
microbial biomass C of LDSS, LDCSS and
LDCSS+PAH soils of La Bouzule was 50% higher than
the control (Table 1).
Soil samples were collected from the 20-cm top layer
of the experimental fields. Fresh soil samples were sieved
(5-mm mesh) and stored less than one month at 4 �Cuntil use.
2.2. Microbial biomass measurements
Soil microbial biomass C was measured using the
fumigation–extraction technique [26]. An automated
UV–persulfate oxidation method was carried out with a
Dohrman DC80 analyser [27]. Microbial biomass C wasdetermined with the following formula: Microbial
biomass C ¼ ðCfumigated extract � Cunfumigated extractÞ=Kc. AKc factor of 0.38 was used to convert extractable C into
microbial biomass C according to Nicolardot et al. [28].
2.3. Atrazine mineralization
The ability of indigenous soil microorganisms tomineralize atrazine was determined by radiorespirome-
try [29]. Soil samples (10 g equivalent dry weight)
moistened to 80% of the water-holding capacity were
treated with 1.7 kBq of 14C uniformly (ring)-labelled
atrazine [910 MBqmmol�1, 98% radiochemical purity
(Sigma)] to give the concentration of 1.5 mg kg�1 soil.
They were incubated in the dark at 20 �C for 64 days.14CO2 resulting from the mineralization of 14C-atrazinewas trapped in 5 ml of 0.2 M NaOH solution and
analysed by liquid scintillation counting using ACS II
(Amersham) scintillation fluid. The Gompertz growth
model modified to fit well second-order degradation
kinetics [y ¼ ae�eð�kðt�tiÞÞ þ ct] [30] was fitted to the atra-
zine mineralization data using inverse modelling (Sig-
maPlot� 4.0). Four parameters were determined: a, the
plateau or maximum percentage of mineralization; ti,the abscissa of the inflexion point; k, the mineralization
rate constant and c, the rate of 14C turnover and co-
metabolic mineralization. Three replicated atrazine
mineralization kinetics were realized per soil sample.
2.4. Soil DNA extraction
Nucleic acids were extracted in triplicate from 250 mgof soil [31]. Briefly, samples were homogenized in 1 ml of
extraction buffer (100 mM Tris (pH 8.0), 100 mM
EDTA, 100 mM NaCl, 1% (w/v), polyvinylpyrrolidone
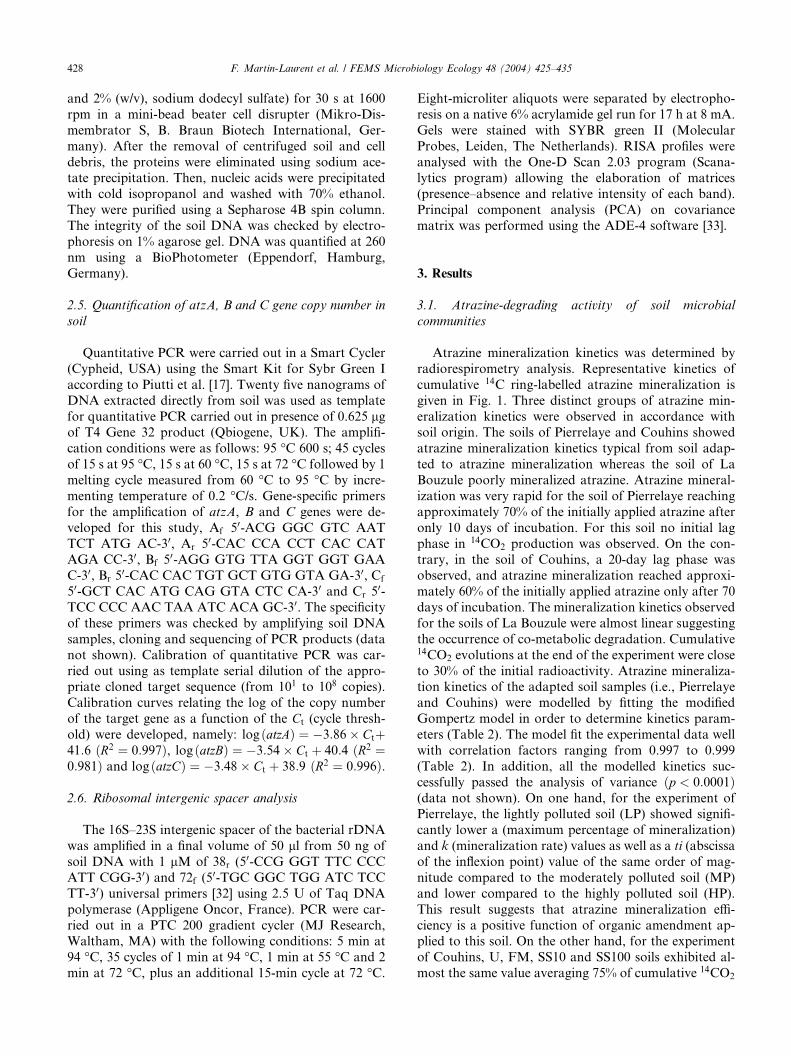
428 F. Martin-Laurent et al. / FEMS Microbiology Ecology 48 (2004) 425–435
and 2% (w/v), sodium dodecyl sulfate) for 30 s at 1600
rpm in a mini-bead beater cell disrupter (Mikro-Dis-
membrator S, B. Braun Biotech International, Ger-
many). After the removal of centrifuged soil and cell
debris, the proteins were eliminated using sodium ace-tate precipitation. Then, nucleic acids were precipitated
with cold isopropanol and washed with 70% ethanol.
They were purified using a Sepharose 4B spin column.
The integrity of the soil DNA was checked by electro-
phoresis on 1% agarose gel. DNA was quantified at 260
nm using a BioPhotometer (Eppendorf, Hamburg,
Germany).
2.5. Quantification of atzA, B and C gene copy number in
soil
Quantitative PCR were carried out in a Smart Cycler
(Cypheid, USA) using the Smart Kit for Sybr Green I
according to Piutti et al. [17]. Twenty five nanograms of
DNA extracted directly from soil was used as template
for quantitative PCR carried out in presence of 0.625 lgof T4 Gene 32 product (Qbiogene, UK). The amplifi-
cation conditions were as follows: 95 �C 600 s; 45 cycles
of 15 s at 95 �C, 15 s at 60 �C, 15 s at 72 �C followed by 1
melting cycle measured from 60 �C to 95 �C by incre-
menting temperature of 0.2 �C/s. Gene-specific primers
for the amplification of atzA, B and C genes were de-
veloped for this study, Af 50-ACG GGC GTC AAT
TCT ATG AC-30, Ar 50-CAC CCA CCT CAC CATAGA CC-30, Bf 5
0-AGG GTG TTA GGT GGT GAA
C-30, Br 50-CAC CAC TGT GCT GTG GTA GA-30, Cf
50-GCT CAC ATG CAG GTA CTC CA-30 and Cr 50-
TCC CCC AAC TAA ATC ACA GC-30. The specificityof these primers was checked by amplifying soil DNA
samples, cloning and sequencing of PCR products (data
not shown). Calibration of quantitative PCR was car-
ried out using as template serial dilution of the appro-priate cloned target sequence (from 101 to 108 copies).
Calibration curves relating the log of the copy number
of the target gene as a function of the Ct (cycle thresh-
old) were developed, namely: log ðatzAÞ ¼ �3:86� Ctþ41:6 ðR2 ¼ 0:997Þ, log ðatzBÞ ¼ �3:54� Ct þ 40:4 ðR2 ¼0:981Þ and log ðatzCÞ ¼ �3:48� Ct þ 38:9 ðR2 ¼ 0:996Þ.
2.6. Ribosomal intergenic spacer analysis
The 16S–23S intergenic spacer of the bacterial rDNA
was amplified in a final volume of 50 ll from 50 ng of
soil DNA with 1 lM of 38r (50-CCG GGT TTC CCC
ATT CGG-30) and 72f (50-TGC GGC TGG ATC TCC
TT-30) universal primers [32] using 2.5 U of Taq DNA
polymerase (Appligene Oncor, France). PCR were car-
ried out in a PTC 200 gradient cycler (MJ Research,Waltham, MA) with the following conditions: 5 min at
94 �C, 35 cycles of 1 min at 94 �C, 1 min at 55 �C and 2
min at 72 �C, plus an additional 15-min cycle at 72 �C.
Eight-microliter aliquots were separated by electropho-
resis on a native 6% acrylamide gel run for 17 h at 8 mA.
Gels were stained with SYBR green II (Molecular
Probes, Leiden, The Netherlands). RISA profiles were
analysed with the One-D Scan 2.03 program (Scana-lytics program) allowing the elaboration of matrices
(presence–absence and relative intensity of each band).
Principal component analysis (PCA) on covariance
matrix was performed using the ADE-4 software [33].
3. Results
3.1. Atrazine-degrading activity of soil microbial
communities
Atrazine mineralization kinetics was determined by
radiorespirometry analysis. Representative kinetics of
cumulative 14C ring-labelled atrazine mineralization is
given in Fig. 1. Three distinct groups of atrazine min-
eralization kinetics were observed in accordance withsoil origin. The soils of Pierrelaye and Couhins showed
atrazine mineralization kinetics typical from soil adap-
ted to atrazine mineralization whereas the soil of La
Bouzule poorly mineralized atrazine. Atrazine mineral-
ization was very rapid for the soil of Pierrelaye reaching
approximately 70% of the initially applied atrazine after
only 10 days of incubation. For this soil no initial lag
phase in 14CO2 production was observed. On the con-trary, in the soil of Couhins, a 20-day lag phase was
observed, and atrazine mineralization reached approxi-
mately 60% of the initially applied atrazine only after 70
days of incubation. The mineralization kinetics observed
for the soils of La Bouzule were almost linear suggesting
the occurrence of co-metabolic degradation. Cumulative14CO2 evolutions at the end of the experiment were close
to 30% of the initial radioactivity. Atrazine mineraliza-tion kinetics of the adapted soil samples (i.e., Pierrelaye
and Couhins) were modelled by fitting the modified
Gompertz model in order to determine kinetics param-
eters (Table 2). The model fit the experimental data well
with correlation factors ranging from 0.997 to 0.999
(Table 2). In addition, all the modelled kinetics suc-
cessfully passed the analysis of variance ðp < 0:0001Þ(data not shown). On one hand, for the experiment ofPierrelaye, the lightly polluted soil (LP) showed signifi-
cantly lower a (maximum percentage of mineralization)
and k (mineralization rate) values as well as a ti (abscissa
of the inflexion point) value of the same order of mag-
nitude compared to the moderately polluted soil (MP)
and lower compared to the highly polluted soil (HP).
This result suggests that atrazine mineralization effi-
ciency is a positive function of organic amendment ap-plied to this soil. On the other hand, for the experiment
of Couhins, U, FM, SS10 and SS100 soils exhibited al-
most the same value averaging 75% of cumulative 14CO2

0
20
40
60
80
0 20 40 60 80Time (day)
U
SS10
SS100
FM
A Soil of Couhins
0
20
40
60
80
0 20 40 60 80Time (day)
LP
MP
FP
Soil of Pierrelaye
0
20
40
60
80
0 20 40 60 80
Time (day)
% c
um
ula
tive
14C
O2
% c
um
ula
tive
14C
O2
% c
um
ula
tive
14C
O2
U
LDSS
LDCSS
LDCSS+PAH
So il of La Bouzule
B
C
Fig. 1. Kinetics of degradation of 14C ring-labelled atrazine in [panel
A] the soil of Couhins (U) non-amended, amended with (FM) farm-
yard manure, (SS10) sewage sludge (10 ton ha�1 year�1) and (SS100)
sewage sludge (100 ton ha�1 year�2); [panel B] the soil of Pierrelaye
amended with (LP) lightly polluted, (MP) moderately polluted or (HP)
highly polluted waste water; [panel C] the soil of La Bouzule (U) non-
amended, (LDSS) amended with lightly dehydrated sewage sludge,
(LDCSS) amended with lightly dehydrated composted sewage sludge
and (LDCSS+PAH) amended with lightly dehydrated composted
sewage sludge added with polyaromatic hydrocarbon.
Table 2
Parameters of atrazine mineralization kinetics obtained for the soil of
Couhins U, FM, SS10 and SS100 and for the soil of Pierrelaye LP, MP
or HP after fitting the modified Gompertz growth model
Soil Treatment r2 a k ti
Couhins U 0.999 70.71a 0.04a 35.70a
FM 0.997 70.19a 0.04a 36.67a
SS10 0.998 75.48a 0.04a 38.24a
SS100 0.999 76.70a 0.1b 29.33b
Pierrelaye LP 0.999 61.15a 0.61a 2.95a
MP 0.997 64.47a 0.85b 3.15a
HP 0.998 62.68a 0.78b 4.67b
r2 refers to R2 value of non linear regression, a to the maximum
percentage of mineralization, k to the mineralization rate, ti to the
abscissa of the inflexion point. Values are means (n ¼ 5). Considering
each parameter values followed by different letters are significantly
different (p < 0:05). Values followed by the same letter do not signifi-
cantly differ.
F. Martin-Laurent et al. / FEMS Microbiology Ecology 48 (2004) 425–435 429
emitted in 70 days. The rate of mineralization of atra-
zine (k) of SS100 soil was higher than those found in the
control, FM and SS10 soils. Therefore, the applicationof organic amendment to the three agricultural soils did
not tremendously affect the maximum percentage of
atrazine mineralization.
3.2. Atrazine-degrading potential of soil microbial com-
munities
Atrazine-degrading genetic potential of soil microbial
communities was determined by real-time PCR quanti-fication of the copy number of atzA, B and C genes. The
copy number of 16S rDNA sequences was determined
for each soil DNA sample in order to verify the effi-
ciency of DNA extraction/amplification (data not
shown). Specific quantitative PCR protocols were de-
veloped for each targeted gene according to Piutti et al.
[17]. The results of the quantification of the copy num-
ber of atzA, B and C sequences determined on DNAextracted directly from the soils of Couhins, Pierrelaye
and La Bouzule are presented in Fig. 2. The atzA, B and
C genes were detected in all tested soil DNA samples in
quantities varying from 5.0� 103 to 8.0� 104 copies per
gram of soil.
For the soil of Couhins, atzB was detected in signif-
icantly (p < 0:05) higher density in FM soil (23.06�4.10� 103 atzB g�1 of soil) than in SS10 (8.70� 2.6�103 atzB g�1 of soil). atzC was detected in significantly
(p < 0:05) higher density in SS10 soil (18.63 3.90� 103
atzC g�1 of soil) than in SS100 (11.57 1.89� 103
atzC g�1 of soil) (Fig. 2A). Similar densities of atzA (in
mean 11.50� 3.20� 103 atzA g�1 of soil) were detected
in U, FM, SS10 and SS100 soil samples (Fig. 2A). For
the soil of Pierrelaye, the atzA, B and C genes showed
very similar pattern of quantification. atz genes weredetected in significantly (p < 0:05) higher number in
the lightly polluted soil (LP) than in the moderately
(MP) and highly (HP) polluted soil (Fig. 2B). It is
noteworthy that the density of atz sequences detected
in the soil of Pierrelaye which exhibited the highest
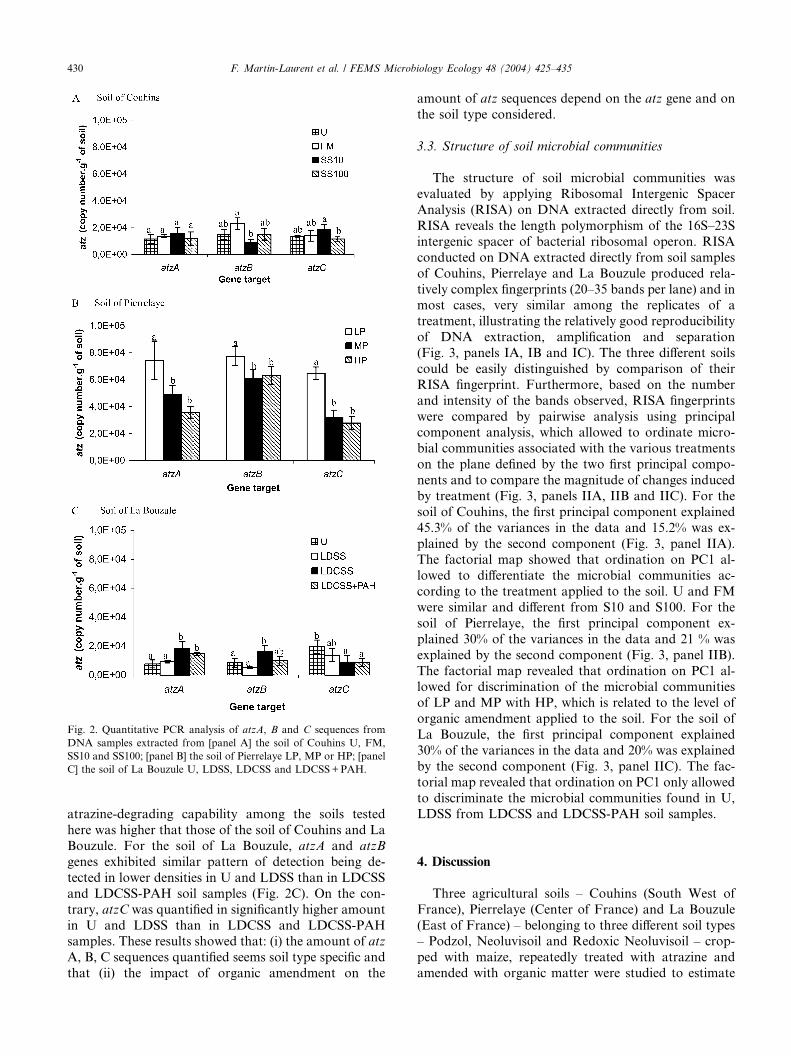
Fig. 2. Quantitative PCR analysis of atzA, B and C sequences from
DNA samples extracted from [panel A] the soil of Couhins U, FM,
SS10 and SS100; [panel B] the soil of Pierrelaye LP, MP or HP; [panel
C] the soil of La Bouzule U, LDSS, LDCSS and LDCSS+PAH.
430 F. Martin-Laurent et al. / FEMS Microbiology Ecology 48 (2004) 425–435
atrazine-degrading capability among the soils tested
here was higher that those of the soil of Couhins and La
Bouzule. For the soil of La Bouzule, atzA and atzB
genes exhibited similar pattern of detection being de-
tected in lower densities in U and LDSS than in LDCSS
and LDCSS-PAH soil samples (Fig. 2C). On the con-
trary, atzC was quantified in significantly higher amount
in U and LDSS than in LDCSS and LDCSS-PAHsamples. These results showed that: (i) the amount of atz
A, B, C sequences quantified seems soil type specific and
that (ii) the impact of organic amendment on the
amount of atz sequences depend on the atz gene and on
the soil type considered.
3.3. Structure of soil microbial communities
The structure of soil microbial communities was
evaluated by applying Ribosomal Intergenic Spacer
Analysis (RISA) on DNA extracted directly from soil.
RISA reveals the length polymorphism of the 16S–23S
intergenic spacer of bacterial ribosomal operon. RISA
conducted on DNA extracted directly from soil samples
of Couhins, Pierrelaye and La Bouzule produced rela-
tively complex fingerprints (20–35 bands per lane) and inmost cases, very similar among the replicates of a
treatment, illustrating the relatively good reproducibility
of DNA extraction, amplification and separation
(Fig. 3, panels IA, IB and IC). The three different soils
could be easily distinguished by comparison of their
RISA fingerprint. Furthermore, based on the number
and intensity of the bands observed, RISA fingerprints
were compared by pairwise analysis using principalcomponent analysis, which allowed to ordinate micro-
bial communities associated with the various treatments
on the plane defined by the two first principal compo-
nents and to compare the magnitude of changes induced
by treatment (Fig. 3, panels IIA, IIB and IIC). For the
soil of Couhins, the first principal component explained
45.3% of the variances in the data and 15.2% was ex-
plained by the second component (Fig. 3, panel IIA).The factorial map showed that ordination on PC1 al-
lowed to differentiate the microbial communities ac-
cording to the treatment applied to the soil. U and FM
were similar and different from S10 and S100. For the
soil of Pierrelaye, the first principal component ex-
plained 30% of the variances in the data and 21 % was
explained by the second component (Fig. 3, panel IIB).
The factorial map revealed that ordination on PC1 al-lowed for discrimination of the microbial communities
of LP and MP with HP, which is related to the level of
organic amendment applied to the soil. For the soil of
La Bouzule, the first principal component explained
30% of the variances in the data and 20% was explained
by the second component (Fig. 3, panel IIC). The fac-
torial map revealed that ordination on PC1 only allowed
to discriminate the microbial communities found in U,LDSS from LDCSS and LDCSS-PAH soil samples.
4. Discussion
Three agricultural soils – Couhins (South West of
France), Pierrelaye (Center of France) and La Bouzule
(East of France) – belonging to three different soil types– Podzol, Neoluvisoil and Redoxic Neoluvisoil – crop-
ped with maize, repeatedly treated with atrazine and
amended with organic matter were studied to estimate
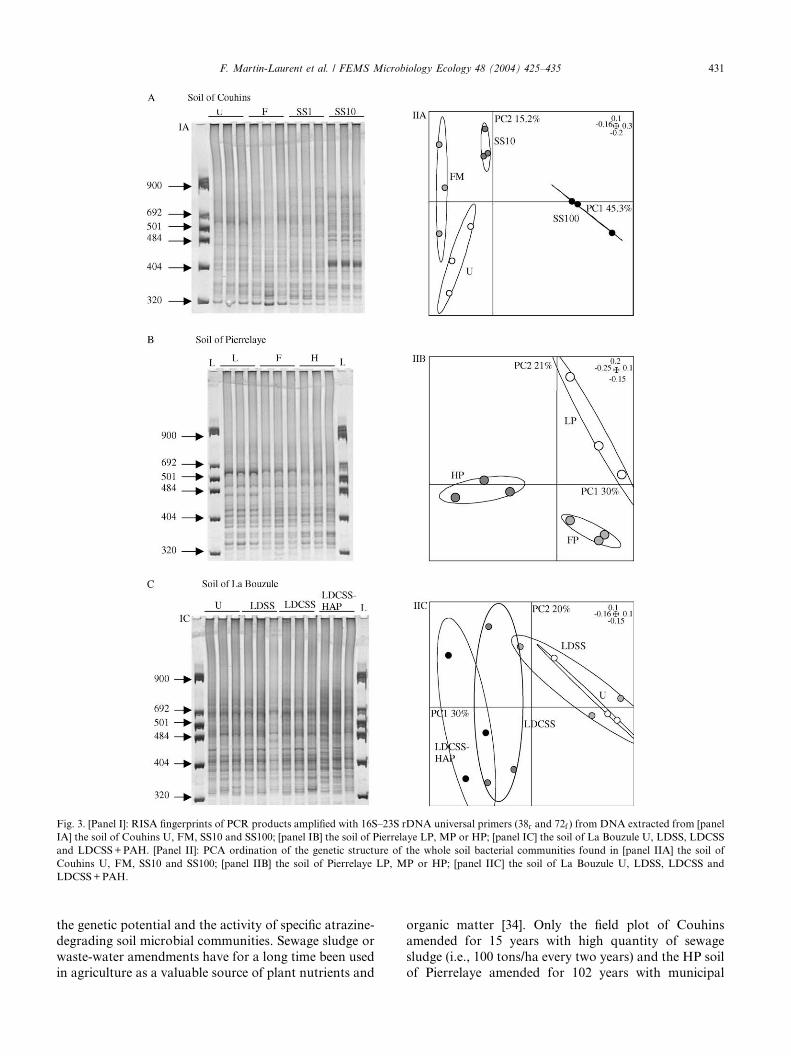
Fig. 3. [Panel I]: RISA fingerprints of PCR products amplified with 16S–23S rDNA universal primers (38r and 72f ) from DNA extracted from [panel
IA] the soil of Couhins U, FM, SS10 and SS100; [panel IB] the soil of Pierrelaye LP, MP or HP; [panel IC] the soil of La Bouzule U, LDSS, LDCSS
and LDCSS+PAH. [Panel II]: PCA ordination of the genetic structure of the whole soil bacterial communities found in [panel IIA] the soil of
Couhins U, FM, SS10 and SS100; [panel IIB] the soil of Pierrelaye LP, MP or HP; [panel IIC] the soil of La Bouzule U, LDSS, LDCSS and
LDCSS+PAH.
F. Martin-Laurent et al. / FEMS Microbiology Ecology 48 (2004) 425–435 431
the genetic potential and the activity of specific atrazine-
degrading soil microbial communities. Sewage sludge or
waste-water amendments have for a long time been used
in agriculture as a valuable source of plant nutrients and
organic matter [34]. Only the field plot of Couhins
amended for 15 years with high quantity of sewage
sludge (i.e., 100 tons/ha every two years) and the HP soil
of Pierrelaye amended for 102 years with municipal
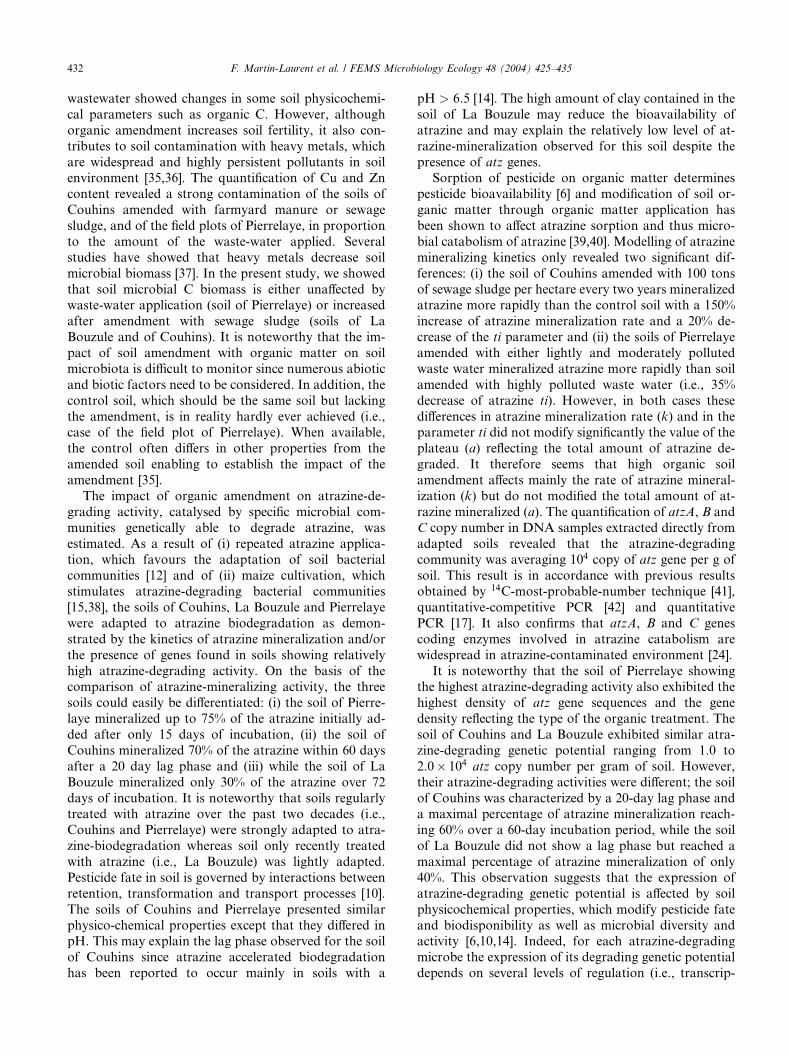
432 F. Martin-Laurent et al. / FEMS Microbiology Ecology 48 (2004) 425–435
wastewater showed changes in some soil physicochemi-
cal parameters such as organic C. However, although
organic amendment increases soil fertility, it also con-
tributes to soil contamination with heavy metals, which
are widespread and highly persistent pollutants in soilenvironment [35,36]. The quantification of Cu and Zn
content revealed a strong contamination of the soils of
Couhins amended with farmyard manure or sewage
sludge, and of the field plots of Pierrelaye, in proportion
to the amount of the waste-water applied. Several
studies have showed that heavy metals decrease soil
microbial biomass [37]. In the present study, we showed
that soil microbial C biomass is either unaffected bywaste-water application (soil of Pierrelaye) or increased
after amendment with sewage sludge (soils of La
Bouzule and of Couhins). It is noteworthy that the im-
pact of soil amendment with organic matter on soil
microbiota is difficult to monitor since numerous abiotic
and biotic factors need to be considered. In addition, the
control soil, which should be the same soil but lacking
the amendment, is in reality hardly ever achieved (i.e.,case of the field plot of Pierrelaye). When available,
the control often differs in other properties from the
amended soil enabling to establish the impact of the
amendment [35].
The impact of organic amendment on atrazine-de-
grading activity, catalysed by specific microbial com-
munities genetically able to degrade atrazine, was
estimated. As a result of (i) repeated atrazine applica-tion, which favours the adaptation of soil bacterial
communities [12] and of (ii) maize cultivation, which
stimulates atrazine-degrading bacterial communities
[15,38], the soils of Couhins, La Bouzule and Pierrelaye
were adapted to atrazine biodegradation as demon-
strated by the kinetics of atrazine mineralization and/or
the presence of genes found in soils showing relatively
high atrazine-degrading activity. On the basis of thecomparison of atrazine-mineralizing activity, the three
soils could easily be differentiated: (i) the soil of Pierre-
laye mineralized up to 75% of the atrazine initially ad-
ded after only 15 days of incubation, (ii) the soil of
Couhins mineralized 70% of the atrazine within 60 days
after a 20 day lag phase and (iii) while the soil of La
Bouzule mineralized only 30% of the atrazine over 72
days of incubation. It is noteworthy that soils regularlytreated with atrazine over the past two decades (i.e.,
Couhins and Pierrelaye) were strongly adapted to atra-
zine-biodegradation whereas soil only recently treated
with atrazine (i.e., La Bouzule) was lightly adapted.
Pesticide fate in soil is governed by interactions between
retention, transformation and transport processes [10].
The soils of Couhins and Pierrelaye presented similar
physico-chemical properties except that they differed inpH. This may explain the lag phase observed for the soil
of Couhins since atrazine accelerated biodegradation
has been reported to occur mainly in soils with a
pH > 6:5 [14]. The high amount of clay contained in the
soil of La Bouzule may reduce the bioavailability of
atrazine and may explain the relatively low level of at-
razine-mineralization observed for this soil despite the
presence of atz genes.Sorption of pesticide on organic matter determines
pesticide bioavailability [6] and modification of soil or-
ganic matter through organic matter application has
been shown to affect atrazine sorption and thus micro-
bial catabolism of atrazine [39,40]. Modelling of atrazine
mineralizing kinetics only revealed two significant dif-
ferences: (i) the soil of Couhins amended with 100 tons
of sewage sludge per hectare every two years mineralizedatrazine more rapidly than the control soil with a 150%
increase of atrazine mineralization rate and a 20% de-
crease of the ti parameter and (ii) the soils of Pierrelaye
amended with either lightly and moderately polluted
waste water mineralized atrazine more rapidly than soil
amended with highly polluted waste water (i.e., 35%
decrease of atrazine ti). However, in both cases these
differences in atrazine mineralization rate (k) and in theparameter ti did not modify significantly the value of the
plateau (a) reflecting the total amount of atrazine de-
graded. It therefore seems that high organic soil
amendment affects mainly the rate of atrazine mineral-
ization (k) but do not modified the total amount of at-
razine mineralized (a). The quantification of atzA, B and
C copy number in DNA samples extracted directly from
adapted soils revealed that the atrazine-degradingcommunity was averaging 104 copy of atz gene per g of
soil. This result is in accordance with previous results
obtained by 14C-most-probable-number technique [41],
quantitative-competitive PCR [42] and quantitative
PCR [17]. It also confirms that atzA, B and C genes
coding enzymes involved in atrazine catabolism are
widespread in atrazine-contaminated environment [24].
It is noteworthy that the soil of Pierrelaye showingthe highest atrazine-degrading activity also exhibited the
highest density of atz gene sequences and the gene
density reflecting the type of the organic treatment. The
soil of Couhins and La Bouzule exhibited similar atra-
zine-degrading genetic potential ranging from 1.0 to
2.0� 104 atz copy number per gram of soil. However,
their atrazine-degrading activities were different; the soil
of Couhins was characterized by a 20-day lag phase anda maximal percentage of atrazine mineralization reach-
ing 60% over a 60-day incubation period, while the soil
of La Bouzule did not show a lag phase but reached a
maximal percentage of atrazine mineralization of only
40%. This observation suggests that the expression of
atrazine-degrading genetic potential is affected by soil
physicochemical properties, which modify pesticide fate
and biodisponibility as well as microbial diversity andactivity [6,10,14]. Indeed, for each atrazine-degrading
microbe the expression of its degrading genetic potential
depends on several levels of regulation (i.e., transcrip-
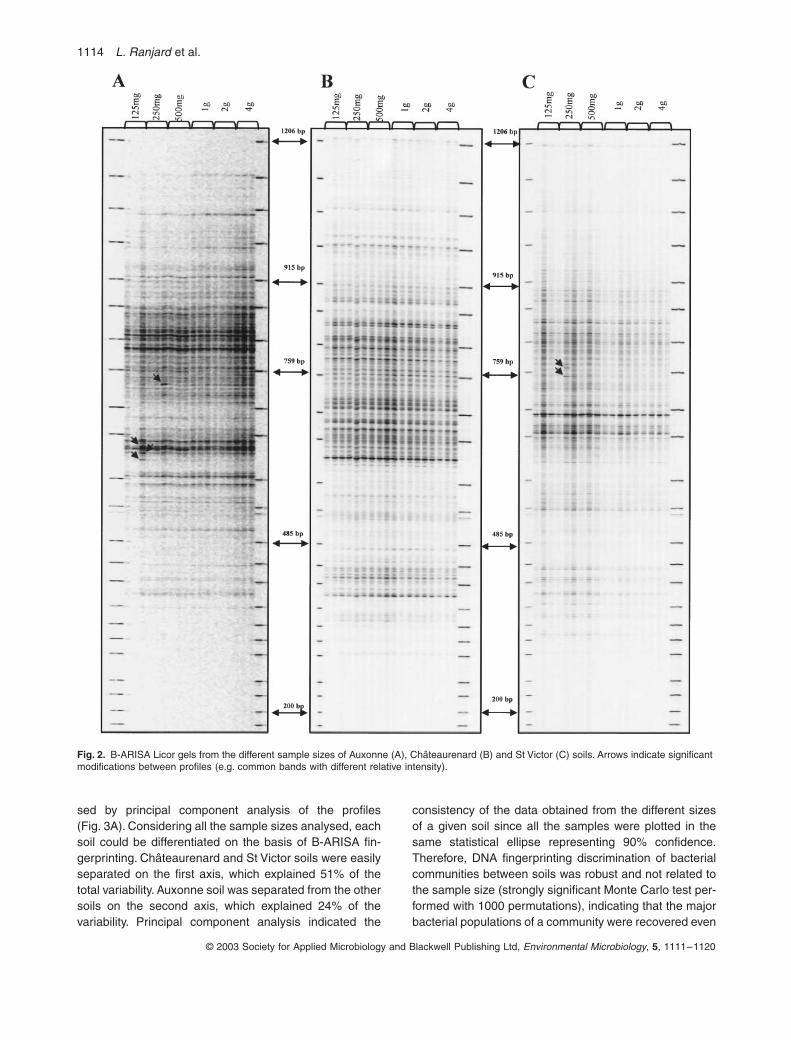
1114
L. Ranjard
et al.
© 2003 Society for Applied Microbiology and Blackwell Publishing Ltd,
Environmental Microbiology
,
5
, 1111–1120
sed by principal component analysis of the profiles(Fig. 3A). Considering all the sample sizes analysed, eachsoil could be differentiated on the basis of B-ARISA fin-gerprinting. Châteaurenard and St Victor soils were easilyseparated on the first axis, which explained 51% of thetotal variability. Auxonne soil was separated from the othersoils on the second axis, which explained 24% of thevariability. Principal component analysis indicated the
consistency of the data obtained from the different sizesof a given soil since all the samples were plotted in thesame statistical ellipse representing 90% confidence.Therefore, DNA fingerprinting discrimination of bacterialcommunities between soils was robust and not related tothe sample size (strongly significant Monte Carlo test per-formed with 1000 permutations), indicating that the majorbacterial populations of a community were recovered even
Fig. 2.
B-ARISA Licor gels from the different sample sizes of Auxonne (A), Châteaurenard (B) and St Victor (C) soils. Arrows indicate significant modifications between profiles (e.g. common bands with different relative intensity).
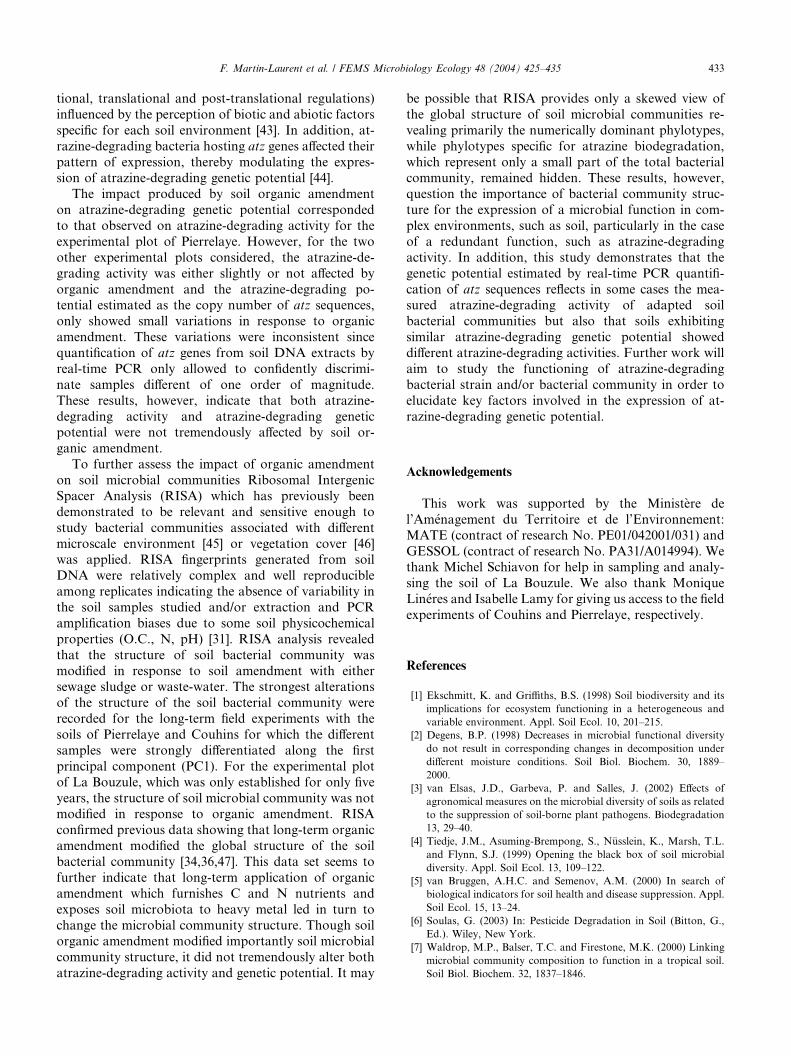
F. Martin-Laurent et al. / FEMS Microbiology Ecology 48 (2004) 425–435 433
tional, translational and post-translational regulations)
influenced by the perception of biotic and abiotic factors
specific for each soil environment [43]. In addition, at-
razine-degrading bacteria hosting atz genes affected their
pattern of expression, thereby modulating the expres-sion of atrazine-degrading genetic potential [44].
The impact produced by soil organic amendment
on atrazine-degrading genetic potential corresponded
to that observed on atrazine-degrading activity for the
experimental plot of Pierrelaye. However, for the two
other experimental plots considered, the atrazine-de-
grading activity was either slightly or not affected by
organic amendment and the atrazine-degrading po-tential estimated as the copy number of atz sequences,
only showed small variations in response to organic
amendment. These variations were inconsistent since
quantification of atz genes from soil DNA extracts by
real-time PCR only allowed to confidently discrimi-
nate samples different of one order of magnitude.
These results, however, indicate that both atrazine-
degrading activity and atrazine-degrading geneticpotential were not tremendously affected by soil or-
ganic amendment.
To further assess the impact of organic amendment
on soil microbial communities Ribosomal Intergenic
Spacer Analysis (RISA) which has previously been
demonstrated to be relevant and sensitive enough to
study bacterial communities associated with different
microscale environment [45] or vegetation cover [46]was applied. RISA fingerprints generated from soil
DNA were relatively complex and well reproducible
among replicates indicating the absence of variability in
the soil samples studied and/or extraction and PCR
amplification biases due to some soil physicochemical
properties (O.C., N, pH) [31]. RISA analysis revealed
that the structure of soil bacterial community was
modified in response to soil amendment with eithersewage sludge or waste-water. The strongest alterations
of the structure of the soil bacterial community were
recorded for the long-term field experiments with the
soils of Pierrelaye and Couhins for which the different
samples were strongly differentiated along the first
principal component (PC1). For the experimental plot
of La Bouzule, which was only established for only five
years, the structure of soil microbial community was notmodified in response to organic amendment. RISA
confirmed previous data showing that long-term organic
amendment modified the global structure of the soil
bacterial community [34,36,47]. This data set seems to
further indicate that long-term application of organic
amendment which furnishes C and N nutrients and
exposes soil microbiota to heavy metal led in turn to
change the microbial community structure. Though soilorganic amendment modified importantly soil microbial
community structure, it did not tremendously alter both
atrazine-degrading activity and genetic potential. It may
be possible that RISA provides only a skewed view of
the global structure of soil microbial communities re-
vealing primarily the numerically dominant phylotypes,
while phylotypes specific for atrazine biodegradation,
which represent only a small part of the total bacterialcommunity, remained hidden. These results, however,
question the importance of bacterial community struc-
ture for the expression of a microbial function in com-
plex environments, such as soil, particularly in the case
of a redundant function, such as atrazine-degrading
activity. In addition, this study demonstrates that the
genetic potential estimated by real-time PCR quantifi-
cation of atz sequences reflects in some cases the mea-sured atrazine-degrading activity of adapted soil
bacterial communities but also that soils exhibiting
similar atrazine-degrading genetic potential showed
different atrazine-degrading activities. Further work will
aim to study the functioning of atrazine-degrading
bacterial strain and/or bacterial community in order to
elucidate key factors involved in the expression of at-
razine-degrading genetic potential.
Acknowledgements
This work was supported by the Minist�ere de
l’Am�enagement du Territoire et de l’Environnement:
MATE (contract of research No. PE01/042001/031) and
GESSOL (contract of research No. PA31/A014994). Wethank Michel Schiavon for help in sampling and analy-
sing the soil of La Bouzule. We also thank Monique
Lin�eres and Isabelle Lamy for giving us access to the field
experiments of Couhins and Pierrelaye, respectively.
References
[1] Ekschmitt, K. and Griffiths, B.S. (1998) Soil biodiversity and its
implications for ecosystem functioning in a heterogeneous and
variable environment. Appl. Soil Ecol. 10, 201–215.
[2] Degens, B.P. (1998) Decreases in microbial functional diversity
do not result in corresponding changes in decomposition under
different moisture conditions. Soil Biol. Biochem. 30, 1889–
2000.
[3] van Elsas, J.D., Garbeva, P. and Salles, J. (2002) Effects of
agronomical measures on the microbial diversity of soils as related
to the suppression of soil-borne plant pathogens. Biodegradation
13, 29–40.
[4] Tiedje, J.M., Asuming-Brempong, S., N€usslein, K., Marsh, T.L.
and Flynn, S.J. (1999) Opening the black box of soil microbial
diversity. Appl. Soil Ecol. 13, 109–122.
[5] van Bruggen, A.H.C. and Semenov, A.M. (2000) In search of
biological indicators for soil health and disease suppression. Appl.
Soil Ecol. 15, 13–24.
[6] Soulas, G. (2003) In: Pesticide Degradation in Soil (Bitton, G.,
Ed.). Wiley, New York.
[7] Waldrop, M.P., Balser, T.C. and Firestone, M.K. (2000) Linking
microbial community composition to function in a tropical soil.
Soil Biol. Biochem. 32, 1837–1846.
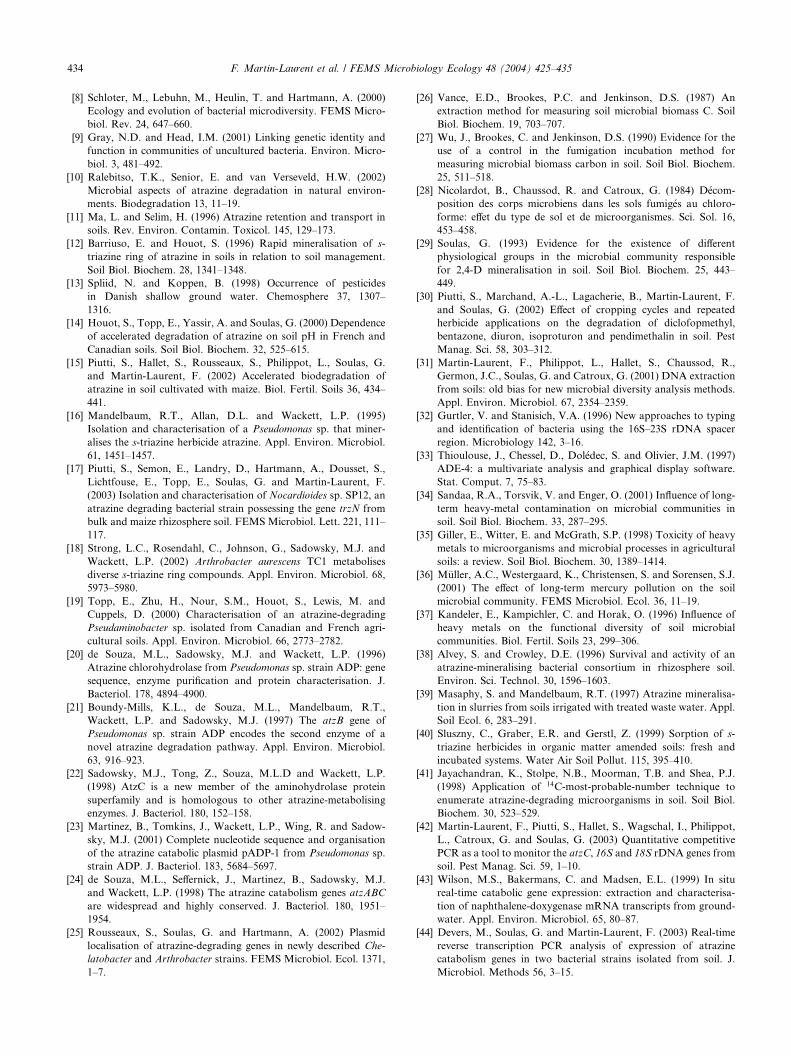
434 F. Martin-Laurent et al. / FEMS Microbiology Ecology 48 (2004) 425–435
[8] Schloter, M., Lebuhn, M., Heulin, T. and Hartmann, A. (2000)
Ecology and evolution of bacterial microdiversity. FEMS Micro-
biol. Rev. 24, 647–660.
[9] Gray, N.D. and Head, I.M. (2001) Linking genetic identity and
function in communities of uncultured bacteria. Environ. Micro-
biol. 3, 481–492.
[10] Ralebitso, T.K., Senior, E. and van Verseveld, H.W. (2002)
Microbial aspects of atrazine degradation in natural environ-
ments. Biodegradation 13, 11–19.
[11] Ma, L. and Selim, H. (1996) Atrazine retention and transport in
soils. Rev. Environ. Contamin. Toxicol. 145, 129–173.
[12] Barriuso, E. and Houot, S. (1996) Rapid mineralisation of s-
triazine ring of atrazine in soils in relation to soil management.
Soil Biol. Biochem. 28, 1341–1348.
[13] Spliid, N. and Koppen, B. (1998) Occurrence of pesticides
in Danish shallow ground water. Chemosphere 37, 1307–
1316.
[14] Houot, S., Topp, E., Yassir, A. and Soulas, G. (2000) Dependence
of accelerated degradation of atrazine on soil pH in French and
Canadian soils. Soil Biol. Biochem. 32, 525–615.
[15] Piutti, S., Hallet, S., Rousseaux, S., Philippot, L., Soulas, G.
and Martin-Laurent, F. (2002) Accelerated biodegradation of
atrazine in soil cultivated with maize. Biol. Fertil. Soils 36, 434–
441.
[16] Mandelbaum, R.T., Allan, D.L. and Wackett, L.P. (1995)
Isolation and characterisation of a Pseudomonas sp. that miner-
alises the s-triazine herbicide atrazine. Appl. Environ. Microbiol.
61, 1451–1457.
[17] Piutti, S., Semon, E., Landry, D., Hartmann, A., Dousset, S.,
Lichtfouse, E., Topp, E., Soulas, G. and Martin-Laurent, F.
(2003) Isolation and characterisation of Nocardioides sp. SP12, an
atrazine degrading bacterial strain possessing the gene trzN from
bulk and maize rhizosphere soil. FEMSMicrobiol. Lett. 221, 111–
117.
[18] Strong, L.C., Rosendahl, C., Johnson, G., Sadowsky, M.J. and
Wackett, L.P. (2002) Arthrobacter aurescens TC1 metabolises
diverse s-triazine ring compounds. Appl. Environ. Microbiol. 68,
5973–5980.
[19] Topp, E., Zhu, H., Nour, S.M., Houot, S., Lewis, M. and
Cuppels, D. (2000) Characterisation of an atrazine-degrading
Pseudaminobacter sp. isolated from Canadian and French agri-
cultural soils. Appl. Environ. Microbiol. 66, 2773–2782.
[20] de Souza, M.L., Sadowsky, M.J. and Wackett, L.P. (1996)
Atrazine chlorohydrolase from Pseudomonas sp. strain ADP: gene
sequence, enzyme purification and protein characterisation. J.
Bacteriol. 178, 4894–4900.
[21] Boundy-Mills, K.L., de Souza, M.L., Mandelbaum, R.T.,
Wackett, L.P. and Sadowsky, M.J. (1997) The atzB gene of
Pseudomonas sp. strain ADP encodes the second enzyme of a
novel atrazine degradation pathway. Appl. Environ. Microbiol.
63, 916–923.
[22] Sadowsky, M.J., Tong, Z., Souza, M.L.D and Wackett, L.P.
(1998) AtzC is a new member of the aminohydrolase protein
superfamily and is homologous to other atrazine-metabolising
enzymes. J. Bacteriol. 180, 152–158.
[23] Martinez, B., Tomkins, J., Wackett, L.P., Wing, R. and Sadow-
sky, M.J. (2001) Complete nucleotide sequence and organisation
of the atrazine catabolic plasmid pADP-1 from Pseudomonas sp.
strain ADP. J. Bacteriol. 183, 5684–5697.
[24] de Souza, M.L., Seffernick, J., Martinez, B., Sadowsky, M.J.
and Wackett, L.P. (1998) The atrazine catabolism genes atzABC
are widespread and highly conserved. J. Bacteriol. 180, 1951–
1954.
[25] Rousseaux, S., Soulas, G. and Hartmann, A. (2002) Plasmid
localisation of atrazine-degrading genes in newly described Che-
latobacter and Arthrobacter strains. FEMS Microbiol. Ecol. 1371,
1–7.
[26] Vance, E.D., Brookes, P.C. and Jenkinson, D.S. (1987) An
extraction method for measuring soil microbial biomass C. Soil
Biol. Biochem. 19, 703–707.
[27] Wu, J., Brookes, C. and Jenkinson, D.S. (1990) Evidence for the
use of a control in the fumigation incubation method for
measuring microbial biomass carbon in soil. Soil Biol. Biochem.
25, 511–518.
[28] Nicolardot, B., Chaussod, R. and Catroux, G. (1984) D�ecom-
position des corps microbiens dans les sols fumig�es au chloro-
forme: effet du type de sol et de microorganismes. Sci. Sol. 16,
453–458.
[29] Soulas, G. (1993) Evidence for the existence of different
physiological groups in the microbial community responsible
for 2,4-D mineralisation in soil. Soil Biol. Biochem. 25, 443–
449.
[30] Piutti, S., Marchand, A.-L., Lagacherie, B., Martin-Laurent, F.
and Soulas, G. (2002) Effect of cropping cycles and repeated
herbicide applications on the degradation of diclofopmethyl,
bentazone, diuron, isoproturon and pendimethalin in soil. Pest
Manag. Sci. 58, 303–312.
[31] Martin-Laurent, F., Philippot, L., Hallet, S., Chaussod, R.,
Germon, J.C., Soulas, G. and Catroux, G. (2001) DNA extraction
from soils: old bias for new microbial diversity analysis methods.
Appl. Environ. Microbiol. 67, 2354–2359.
[32] Gurtler, V. and Stanisich, V.A. (1996) New approaches to typing
and identification of bacteria using the 16S–23S rDNA spacer
region. Microbiology 142, 3–16.
[33] Thioulouse, J., Chessel, D., Dol�edec, S. and Olivier, J.M. (1997)
ADE-4: a multivariate analysis and graphical display software.
Stat. Comput. 7, 75–83.
[34] Sandaa, R.A., Torsvik, V. and Enger, O. (2001) Influence of long-
term heavy-metal contamination on microbial communities in
soil. Soil Biol. Biochem. 33, 287–295.
[35] Giller, E., Witter, E. and McGrath, S.P. (1998) Toxicity of heavy
metals to microorganisms and microbial processes in agricultural
soils: a review. Soil Biol. Biochem. 30, 1389–1414.
[36] M€uller, A.C., Westergaard, K., Christensen, S. and Sorensen, S.J.
(2001) The effect of long-term mercury pollution on the soil
microbial community. FEMS Microbiol. Ecol. 36, 11–19.
[37] Kandeler, E., Kampichler, C. and Horak, O. (1996) Influence of
heavy metals on the functional diversity of soil microbial
communities. Biol. Fertil. Soils 23, 299–306.
[38] Alvey, S. and Crowley, D.E. (1996) Survival and activity of an
atrazine-mineralising bacterial consortium in rhizosphere soil.
Environ. Sci. Technol. 30, 1596–1603.
[39] Masaphy, S. and Mandelbaum, R.T. (1997) Atrazine mineralisa-
tion in slurries from soils irrigated with treated waste water. Appl.
Soil Ecol. 6, 283–291.
[40] Sluszny, C., Graber, E.R. and Gerstl, Z. (1999) Sorption of s-
triazine herbicides in organic matter amended soils: fresh and
incubated systems. Water Air Soil Pollut. 115, 395–410.
[41] Jayachandran, K., Stolpe, N.B., Moorman, T.B. and Shea, P.J.
(1998) Application of 14C-most-probable-number technique to
enumerate atrazine-degrading microorganisms in soil. Soil Biol.
Biochem. 30, 523–529.
[42] Martin-Laurent, F., Piutti, S., Hallet, S., Wagschal, I., Philippot,
L., Catroux, G. and Soulas, G. (2003) Quantitative competitive
PCR as a tool to monitor the atzC, 16S and 18S rDNA genes from
soil. Pest Manag. Sci. 59, 1–10.
[43] Wilson, M.S., Bakermans, C. and Madsen, E.L. (1999) In situ
real-time catabolic gene expression: extraction and characterisa-
tion of naphthalene-doxygenase mRNA transcripts from ground-
water. Appl. Environ. Microbiol. 65, 80–87.
[44] Devers, M., Soulas, G. and Martin-Laurent, F. (2003) Real-time
reverse transcription PCR analysis of expression of atrazine
catabolism genes in two bacterial strains isolated from soil. J.
Microbiol. Methods 56, 3–15.
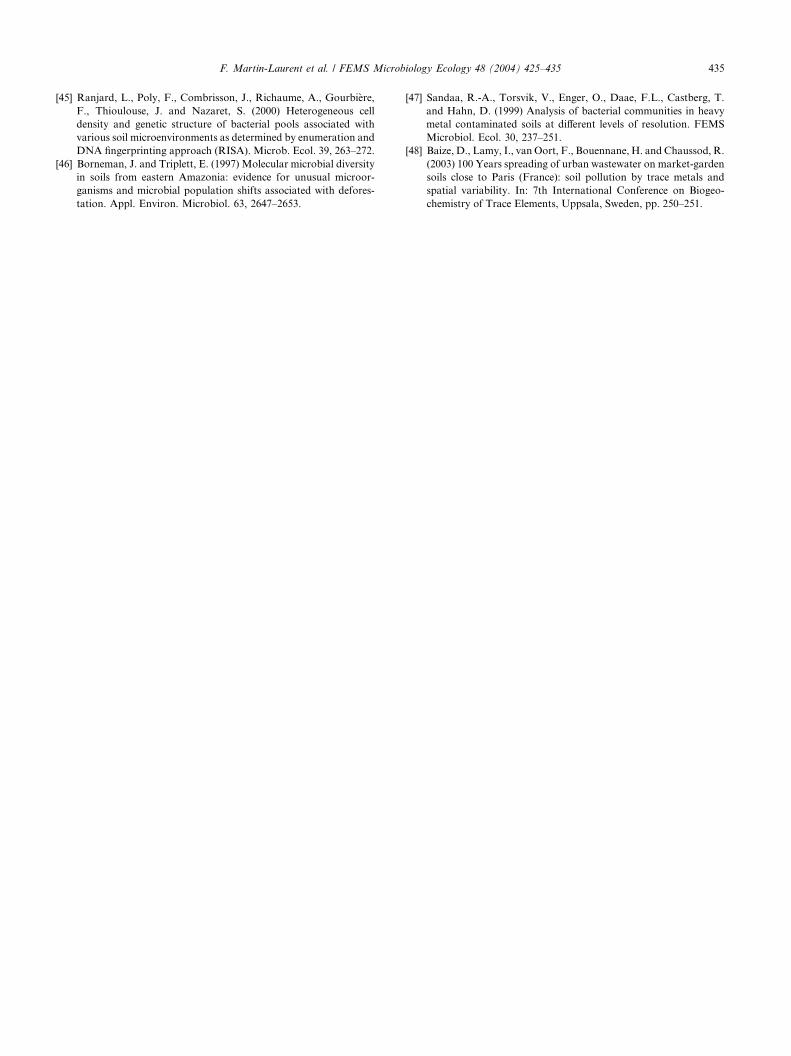
F. Martin-Laurent et al. / FEMS Microbiology Ecology 48 (2004) 425–435 435
[45] Ranjard, L., Poly, F., Combrisson, J., Richaume, A., Gourbi�ere,
F., Thioulouse, J. and Nazaret, S. (2000) Heterogeneous cell
density and genetic structure of bacterial pools associated with
various soil microenvironments as determined by enumeration and
DNA fingerprinting approach (RISA). Microb. Ecol. 39, 263–272.
[46] Borneman, J. and Triplett, E. (1997) Molecular microbial diversity
in soils from eastern Amazonia: evidence for unusual microor-
ganisms and microbial population shifts associated with defores-
tation. Appl. Environ. Microbiol. 63, 2647–2653.
[47] Sandaa, R.-A., Torsvik, V., Enger, O., Daae, F.L., Castberg, T.
and Hahn, D. (1999) Analysis of bacterial communities in heavy
metal contaminated soils at different levels of resolution. FEMS
Microbiol. Ecol. 30, 237–251.
[48] Baize, D., Lamy, I., vanOort, F., Bouennane, H. and Chaussod, R.
(2003) 100 Years spreading of urban wastewater on market-garden
soils close to Paris (France): soil pollution by trace metals and
spatial variability. In: 7th International Conference on Biogeo-
chemistry of Trace Elements, Uppsala, Sweden, pp. 250–251.