Embed Size (px)
Citation preview
Pol. J. Environ. Stud. Vol. 21, No. 4 (2012), 973-992
*e-mail: [email protected]
Original ResearchComparison of Extraction Techniques by Matrix
Solid Phase Dispersion and Liquid-Liquid
for Screening 150 Pesticides from Soil,
and Determination by Gas Chromatography
Bożena Łozowicka*, Magdalena Jankowska, Ewa Rutkowska,
Piotr Kaczyński, Izabela Hrynko
Plant Protection Institute – National Research Institute, Regional Experimental Station, Laboratory of Pesticide Residues,
Chełmońskiego 22, 15-195 Białystok, Poland
Received: 5 May 2011Accepted: 28 February 2012
Abstract
Interest in the determination and screening of pesticide residues in soil is caused by widespread use of
chemical pesticides in agriculture, which increase soil contamination. Two extraction techniques, matrix solid
phase dispersion (MSPD) and liquid-liquid extraction (LLE) of residual pesticides (acaricides, insecticides,
herbicides, and fungicides) from soil were compared. Advantages and disadvantages of both approaches were
discussed. Pesticides from different chemical classes (organohalogen, organophosphorus, carbamates,
pyrethroids, strobilurines, triazoles) were quantified by GC with a dual system detection – electron capture
(EC) and/or nitrogen-phosphorus (NP). The MSPD was validated by comparing it with conventional LLE.
Recovery studies were carried out at three levels: 1) ranged between 0.005-0.05 mg/kg, 2) 0.05-0.5 mg/kg,
and 3) 0.25-2.5 mg/kg and average recoveries obtained for these compounds ranged from 72.4 to 120% for
MSPD and 70.6-120% for LLE with relative standard deviations (RSDs) below 20%. Both methods were lin-
ear over the range assayed, 0.005-2.5 mg/kg. The uncertainties of the analytical methods were lower than
25.6% and 30%, with and without recovery correction, respectively.
The rapid and practical MSPD technique has found a particular application in determining 147 pesticide
residues of different physicochemical properties in soil with satisfactory validation parameters. The study esti-
mated that MSPD has significant advantages over LLE because, coupled with simultaneous stage of purifica-
tion, it allowed for a radical reduction time of analysis and its cost. MSPD fulfilled the requirements of mul-
tiresidue techniques. The method is reliable and can be useful for routine monitoring in soil.
Keywords: soil, pesticide residue, liquid-liquid extraction, matrix solid phase dispersion, gas chro-
matography
Introduction
Pesticides are widely applied on agricultural crops toprotect from disease, weeds, and insect damage. The wide-spread and inappropriate use of chemical pesticides in agri-culture unfavorably affects the whole ecosystem by enter-ing into the food chain and polluting the soil, air, ground,and surface water. Although organochlorine insecticideslike aldrin, dieldrin, DDT, and its metabolite or lindane forinstance have been banned years ago in many countriesbased on their mutagenic, carcinogenic, and endocrine dis-rupting properties, they still can be found in environmentalsamples due to their persistence and lipophilic properties[1-3]. Organophosphorous insecticides (like chlorpyrifos,chlorpyrifos-methyl, or chlorfenvinphos) and triazine her-bicides (like atrazine, simazine, metribuzine) are the mostcommonly used pesticides around the world. They and theirmetabolites are detected in the environment, although sev-eral members of these classes have been banned for years[3]. Among the different groups of pesticides, herbicidesare more likely to pollute soils. Phenylurea and urea herbi-cides (e.g. diuron, linuron, or metamitron) are in a senseemerging herbicides in recent years, but are already includ-ed on an EU list of priority substances containing someendocrine disruptors [4] and monitored in environmentalsamples [5].
As a consequence of the implementation of EUDirective 91/414 [6], all pesticides have to be subjected toan authorization procedure. The condition for issue of anauthorization is that the pesticide or its residues do not exertunacceptable effects on human and animal health and notpersistent in soil to extend accumulation and cause pollu-tion problems.
Applied pesticides can degrade in soil surface, adsorbonto organic matter of soil, clay, or lixiviate, and can reachsurface waters through superficial fluxes and leaching, con-taminate groundwater by percolation, and disperse inatmosphere or accumulate as residues in food. Theseprocesses are highly dependent on the type of pesticide,soil, crop, climatic conditions, and application procedures,and thus the fate of pesticides is highly variable. Soil char-acteristics are important to pesticide movement. Clay soilshave a high capacity to adsorb pesticides, whereas sandysoils and organic matter in the soil have a much lowercapacity to adsorb these compounds.
The fate of pesticides in soil is controlled by the chem-ical, biological, and physical dynamics of this matrix [7].Pesticides are degraded by chemical reaction (such as pho-tolysis, hydrolysis, oxidation, and reduction) [8], andmicrobiological [9] processes. These processes take placeon the surface of the soil or deeper soil layers. For instance,photolysis is important only for pesticides present on thesurface of the soil and the rate of breakdown is influencedby the intensity and spectrum of sunlight, length of expo-sure, and the properties of the pesticide, whereas degrada-tion by microorganisms such as fungi and bacteria is takingplace at all soil depths, with varying rates due to changes inthe density.
Knowledge of the fate and behavior of pesticides inagricultural soils is required for the assessment of environ-mental pollution and for the selection of remediation strate-gies.
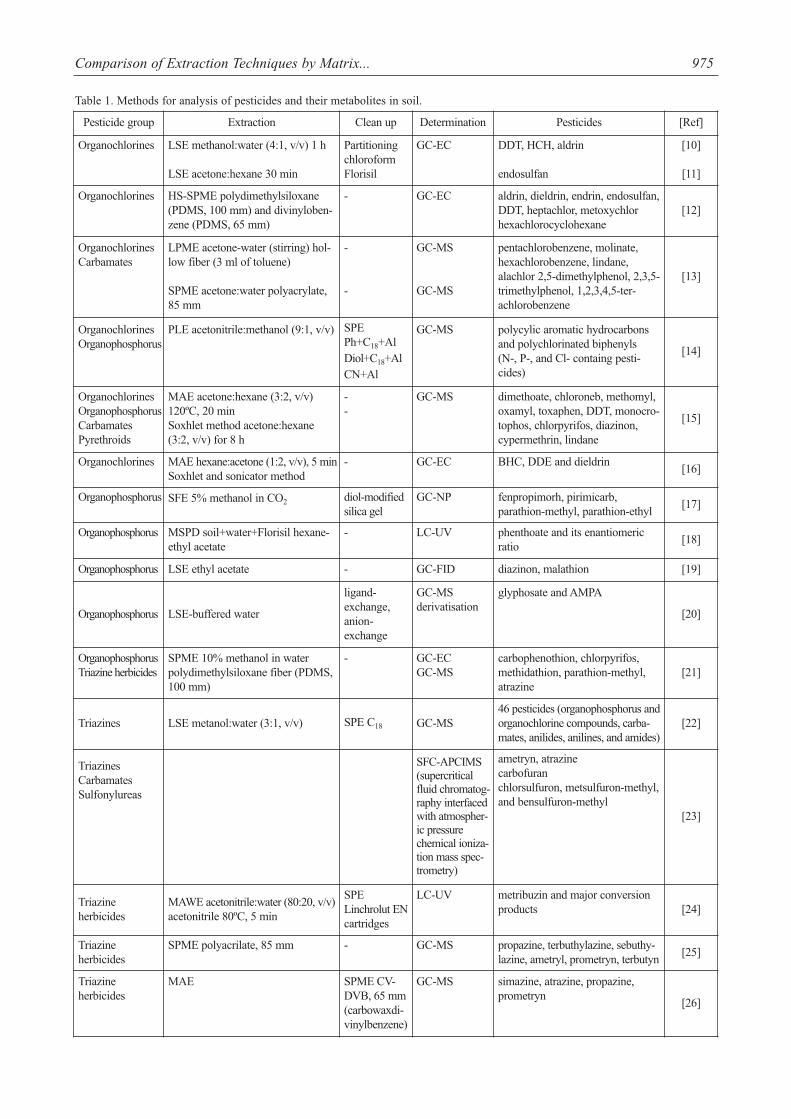
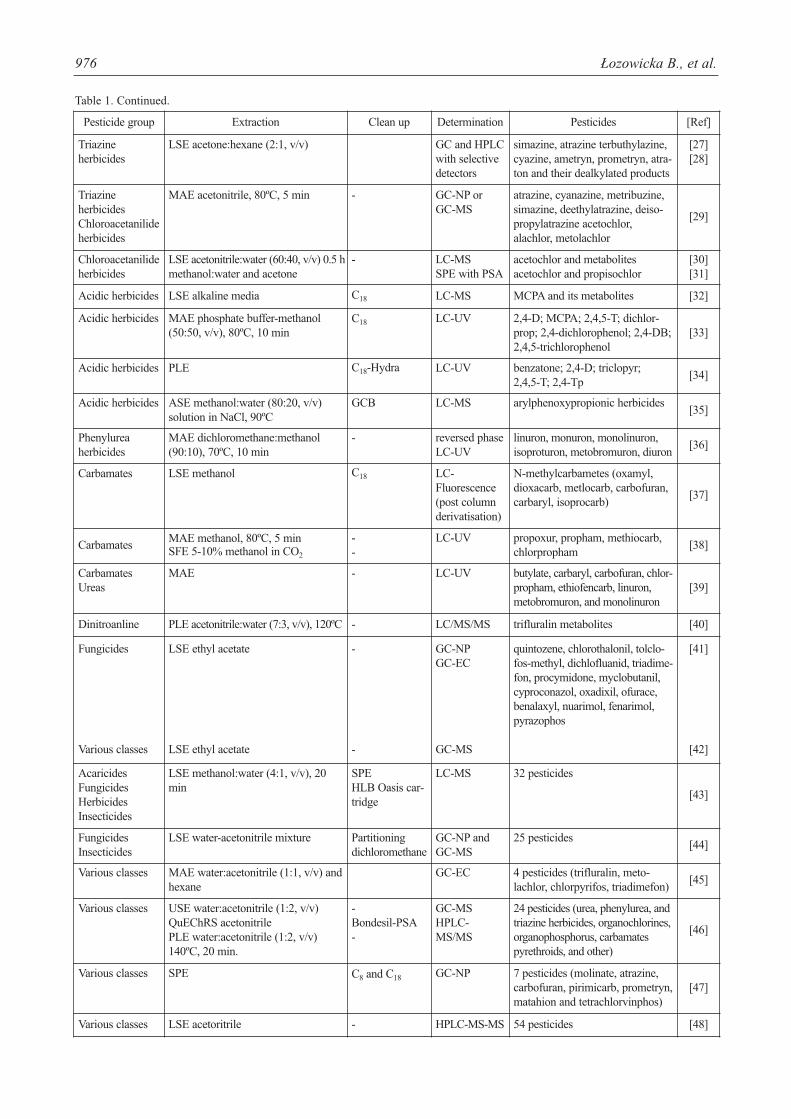
Determination of pesticides in soil is a challenging taskbecause of low concentrations of analytes, the great varietyof pesticides covering a wide range of polarities, and thecomplex blend of substances. Various analytical techniquesaimed at extracting, isolating, and determining pesticidesand their transformation products in soil have been recent-ly published [10-48]. Table 1 gives a summary of analyticalmethods used for the quantification of pesticides in soil.The steps involved are matrix preparation, extraction,clean-up, fractionation, and determination. Those analyticaltechniques usually require highly advanced equipment [20,38, 40].
Sample preparation plays an important role in the fieldof pesticide residue analysis. Traditionally, Soxhlet extrac-tion and ultrasound-assisted extraction are the conventionalpretreatment methods to extract pesticides from soil andsediment samples [49]. However, these methods usually arelaborious, time-consuming, and need large volumes oftoxic organic solvents. Recently, research has been focusedon those sample preparation methods that allow for thereduction of organic solvent consumption, the exclusion ofsample component degradation, the elimination of addi-tional sample clean-up, and pre-concentration steps beforechromatographic analysis as well as the improvement ofextraction efficiency, selectivity, and/or kinetics.
Matrix solid-phase dispersion (MSPD) is a simple andcheap sample preparation procedure involving simultane-ous disruption and extraction of various solid and semi-solid materials [50-52]. It permits complete fractionation ofthe sample matrix components and has the ability to selec-tively isolate a single compound or several classes of com-pounds from the sample. MSPD involves direct mechanicalblending of sample with a sorbent (mainly Florisil, C18, alu-mina, or silica). In this process, the sorbent acts both as anabrasive material disrupting sample architecture and as a‘bound’ solvent that assists in accomplishing sample dis-ruption. The sample is dispersed over the surface of thebonded-phase support material, producing a unique mixedcharacter phase for conducting target analyte isolation.After homogenization, blended mixture is transferred intoan SPE barrel and subjected to elution with an appropriateeluent. Finally, the obtained eluate undergoes the analyticalprocedure [53].
MSPD has many advantages over the traditional tech-niques, such as the use of smaller amounts of organic sol-vent, lower solvent cost, and reduced toxic organic solvent.LLE technique is time-consuming, laborious, and requireslarge volumes of both sample and organic solvents, but stillis the most popular.
The GC detection methods most commonly used forthis purpose are nitrogen-phosphorus (NPD) [17, 20], flameionization (FID) [19], electron-capture detection (ECD)[10, 11], and mass spectrometry (MS) [13-15]. In gas chro-matography analysis, some applications simultaneously use
974 Łozowicka B., et al.
Comparison of Extraction Techniques by Matrix... 975
Pesticide group Extraction Clean up Determination Pesticides [Ref]
Organochlorines LSE methanol:water (4:1, v/v) 1 h
LSE acetone:hexane 30 min
Partitioning chloroform Florisil
GC-EC DDT, HCH, aldrin
endosulfan
[10]
[11]
Organochlorines HS-SPME polydimethylsiloxane(PDMS, 100 mm) and divinyloben-zene (PDMS, 65 mm)
- GC-EC aldrin, dieldrin, endrin, endosulfan,DDT, heptachlor, metoxychlorhexachlorocyclohexane
[12]
OrganochlorinesCarbamates
LPME acetone-water (stirring) hol-low fiber (3 ml of toluene)
SPME acetone:water polyacrylate,85 mm
-
-
GC-MS
GC-MS
pentachlorobenzene, molinate,hexachlorobenzene, lindane,alachlor 2,5-dimethylphenol, 2,3,5-trimethylphenol, 1,2,3,4,5-ter-achlorobenzene
[13]
OrganochlorinesOrganophosphorus
PLE acetonitrile:methanol (9:1, v/v) SPE Ph+C18+Al Diol+C18+AlCN+Al
GC-MS polycylic aromatic hydrocarbonsand polychlorinated biphenyls (N-, P-, and Cl- containg pesti-cides)
[14]
OrganochlorinesOrganophosphorusCarbamatesPyrethroids
MAE acetone:hexane (3:2, v/v)120ºC, 20 min Soxhlet method acetone:hexane (3:2, v/v) for 8 h
--
GC-MS dimethoate, chloroneb, methomyl,oxamyl, toxaphen, DDT, monocro-tophos, chlorpyrifos, diazinon,cypermethrin, lindane
[15]
Organochlorines MAE hexane:acetone (1:2, v/v), 5 minSoxhlet and sonicator method
- GC-EC BHC, DDE and dieldrin[16]
Organophosphorus SFE 5% methanol in CO2 diol-modifiedsilica gel
GC-NP fenpropimorh, pirimicarb,parathion-methyl, parathion-ethyl
[17]
Organophosphorus MSPD soil+water+Florisil hexane-ethyl acetate
- LC-UV phenthoate and its enantiomericratio
[18]
Organophosphorus LSE ethyl acetate - GC-FID diazinon, malathion [19]
Organophosphorus LSE-buffered water
ligand-exchange,anion-exchange
GC-MSderivatisation
glyphosate and AMPA
[20]
OrganophosphorusTriazine herbicides
SPME 10% methanol in waterpolydimethylsiloxane fiber (PDMS,100 mm)
- GC-EC GC-MS
carbophenothion, chlorpyrifos,methidathion, parathion-methyl,atrazine
[21]
Triazines LSE metanol:water (3:1, v/v) SPE C18 GC-MS46 pesticides (organophosphorus andorganochlorine compounds, carba-mates, anilides, anilines, and amides)
[22]
TriazinesCarbamatesSulfonylureas
SFC-APCIMS(supercriticalfluid chromatog-raphy interfacedwith atmospher-ic pressurechemical ioniza-tion mass spec-trometry)
ametryn, atrazine carbofuranchlorsulfuron, metsulfuron-methyl,and bensulfuron-methyl
[23]
Triazine herbicides
MAWE acetonitrile:water (80:20, v/v)acetonitrile 80ºC, 5 min
SPELinchrolut ENcartridges
LC-UV metribuzin and major conversionproducts [24]
Triazine herbicides
SPME polyacrilate, 85 mm - GC-MS propazine, terbuthylazine, sebuthy-lazine, ametryl, prometryn, terbutyn
[25]
Triazine herbicides
MAE SPME CV-DVB, 65 mm(carbowaxdi-vinylbenzene)
GC-MS simazine, atrazine, propazine,prometryn
[26]
Table 1. Methods for analysis of pesticides and their metabolites in soil.
976 Łozowicka B., et al.
Table 1. Continued.
Pesticide group Extraction Clean up Determination Pesticides [Ref]
Triazine herbicides
LSE acetone:hexane (2:1, v/v) GC and HPLCwith selectivedetectors
simazine, atrazine terbuthylazine,cyazine, ametryn, prometryn, atra-ton and their dealkylated products
[27] [28]
Triazine herbicidesChloroacetanilideherbicides
MAE acetonitrile, 80ºC, 5 min - GC-NP or GC-MS
atrazine, cyanazine, metribuzine,simazine, deethylatrazine, deiso-propylatrazine acetochlor,alachlor, metolachlor
[29]
Chloroacetanilideherbicides
LSE acetonitrile:water (60:40, v/v) 0.5 hmethanol:water and acetone
- LC-MS SPE with PSA
acetochlor and metabolites acetochlor and propisochlor
[30] [31]
Acidic herbicides LSE alkaline media C18 LC-MS MCPA and its metabolites [32]
Acidic herbicides MAE phosphate buffer-methanol(50:50, v/v), 80ºC, 10 min
C18 LC-UV 2,4-D; MCPA; 2,4,5-T; dichlor-prop; 2,4-dichlorophenol; 2,4-DB;2,4,5-trichlorophenol
[33]
Acidic herbicides PLE C18-Hydra LC-UV benzatone; 2,4-D; triclopyr; 2,4,5-T; 2,4-Tp
[34]
Acidic herbicides ASE methanol:water (80:20, v/v)solution in NaCl, 90ºC
GCB LC-MS arylphenoxypropionic herbicides[35]
Phenylurea herbicides
MAE dichloromethane:methanol(90:10), 70ºC, 10 min
- reversed phaseLC-UV
linuron, monuron, monolinuron,isoproturon, metobromuron, diuron
[36]
Carbamates LSE methanol C18 LC-Fluorescence(post columnderivatisation)
N-methylcarbametes (oxamyl,dioxacarb, metlocarb, carbofuran,carbaryl, isoprocarb)
[37]
CarbamatesMAE methanol, 80ºC, 5 min SFE 5-10% methanol in CO2
- -
LC-UV propoxur, propham, methiocarb,chlorpropham
[38]
CarbamatesUreas
MAE - LC-UV butylate, carbaryl, carbofuran, chlor-propham, ethiofencarb, linuron,metobromuron, and monolinuron
[39]
Dinitroanline PLE acetonitrile:water (7:3, v/v), 120ºC - LC/MS/MS trifluralin metabolites [40]
Fungicides
Various classes
LSE ethyl acetate
LSE ethyl acetate
-
-
GC-NPGC-EC
GC-MS
quintozene, chlorothalonil, tolclo-fos-methyl, dichlofluanid, triadime-fon, procymidone, myclobutanil,cyproconazol, oxadixil, ofurace,benalaxyl, nuarimol, fenarimol,pyrazophos
[41]
[42]
AcaricidesFungicidesHerbicidesInsecticides
LSE methanol:water (4:1, v/v), 20min
SPE HLB Oasis car-tridge
LC-MS 32 pesticides
[43]
FungicidesInsecticides
LSE water-acetonitrile mixture Partitioningdichloromethane
GC-NP andGC-MS
25 pesticides[44]
Various classes MAE water:acetonitrile (1:1, v/v) andhexane
GC-EC 4 pesticides (trifluralin, meto-lachlor, chlorpyrifos, triadimefon)
[45]
Various classes USE water:acetonitrile (1:2, v/v)QuEChRS acetonitrile PLE water:acetonitrile (1:2, v/v)140ºC, 20 min.
- Bondesil-PSA -
GC-MSHPLC-MS/MS
24 pesticides (urea, phenylurea, andtriazine herbicides, organochlorines,organophosphorus, carbamatespyrethroids, and other)
[46]
Various classes SPE C8 and C18 GC-NP 7 pesticides (molinate, atrazine,carbofuran, pirimicarb, prometryn,matahion and tetrachlorvinphos)
[47]
Various classes LSE acetoritrile - HPLC-MS-MS 54 pesticides [48]
two GC detectors connected to two columns containing dif-ferent stationary phase [54] or the same stationary phase[55]. Applications where the flux of one single column isdivided between two different GC detectors or the splitter isplaced after the injection port or the precolumn and sampleruns in parallel onto two gas chromatographic columns ofdifferent polarities that may be used to analyze substanceswith different chemical structures while injecting the sam-ple only once. In our work the determination was carriedout with capillary gas chromatography using electron-cap-ture (EC) and nitrogen-phosphorus (NP) detection as selec-tive detection methods in parallel. The use of selectivedetection methods allowed much lower limits of detection(LODs) to be achieved. The low LODs obtained permit theflux to be divided into two different detector systems afterthe GC column in order to quantify pesticide residues ofdifferent natures. In the case of positive results we used acolumn with different polarity. Therefore, the parallelresponse was found to be a useful criterion for peak identi-fication down to the limit of detection.
Among cited works, only a few of them relate to thedetermination of a wide spectrum of pesticides belonging todifferent chemical classes [46]. It is interesting that notmany pesticides and all their possible metabolites havebeen monitored in soil. Therefore, there is a need for morestudies in this field.
The goals of the present study were to develop and val-idate under ISO 17025 criteria a multi-residue screeningmethod (MRM) to identify and quantify broad-spectrumpesticides (about 150 active substances) and their metabo-lites in soil by GC, and an autosampler with two selectivedetectors simultaneously: NPD and ECD. Two techniques:matrix solid phase dispersion (MSPD) and liquid-liquidextraction (LLE), were used to extract acaricides, insecti-cides, herbicides, and fungicides – widely used plant pro-tection products belonging to different chemical classes,including: organohalogen, organophosphorus, carbamates,
pyrethroids, strobilurines, and triazoles from soil. MSPDprocedure has also employed the use some extra columnadsorbents to obtain purification of extracts. Several para-meters of the MSPD method (weight of sample, amount,and type of dispersant solid-phase and used for clean-up,extraction solvent) and for LLE (extraction solvent) wereoptimized.
MSPD technique for extraction pesticide residues insoil have been chosen because there are still few reportsabout their usefulness and on the other hand criticizing orcomparing them with other techniques providing goodresults. Finally, the MSPD method was applied to thesimultaneous quantification of 147 compounds in soil.
Every analytical result is associated with uncertainty.Therefore, the uncertainty of the result of a determinationmust be calculated and accompany its presentation.Moreover, an analytical result should be recorded not asone value, but according to the values of a continuous ran-dom variable, as a confidence interval, i.e. the interval like-ly to include the expected value. In recent years many lab-oratories have been under pressure to present uncertain dataon the analytical results instead of just giving standard devi-ations due to most probable requirements for ISO standard17025. In the method validation procedures, estimation ofthe uncertainty is one of the main focuses of interest due toits importance in showing data quality. Detailed analysis ofuncertain sources can guide the analytical chemist about thecritical stages of the method where uncertainty should bereduced. For most purposes, an expanded uncertainty (U)should be used. The expanded uncertainty provides aninterval within which the value of the analyte is believed tolie within a higher level of confidence. According to theEURACHEM/CITAC document [56] the “bottom-up”approach can be used for estimation of combined standarduncertainty. This strategy splits the analytical process in sin-gle steps, estimating the individual contribution of each oneto the uncertainty of the final results. Subsequently, it is
Comparison of Extraction Techniques by Matrix... 977
Table 1. Continued.Abbreviations:ASE – accelerated solvent extractionGCB – graphitized carbon blackGC-EC – gas chromatography with electron capture detectorGC-MS – gas chromatography coupled with mass spectrometryGC-NP – gas chromatography with nitrogen phosphorus detectorHPLC – high-performance liquid chromatographyHS-SPME – head space solid-phase microextractionLC-UV – liquid chromatography with ultraviolet detectionLC-MS – liquid chromatography coupled with mass spectrometryLPME – liquid-phase microextractionLSE – liquid-soild extractionMAE – microwave-assisted extractionMAWE – microwave-assisted water extraction MSPD – matrix solid phase dispersionPLE – pressurized liquid extraction QuEChRS – Quick, Easy, Cheap, Effective, Rugged, and Safe extraction methodSFE – supercritical fluid extractionSPE – solid-phase extractionSPME – solid-phase microextractionUSE – ultrasonic solvent extraction
possible to decide which are the more significant and whichare negligible (and therefore do not deserve special atten-tion).
The identification uncertainty in the proposed method isvery important. Mechanical and physical properties of thecertain type of the soil may influence the uncertainty.Recoveries and LODs and LOQs might be different,depending on organic matter content [57].
Experimental Procedures
Chemicals and Reagents
All reagents used were residue analysis grade. Acetone,dichloromethane, diethyl ether, n-hexane and petroleumether for pesticide residue analysis were provided by J.T.Baker (Deventer, Holland), as well as Florisil (60-100mesh). Anhydrous sodium sulphate was purchased fromFluka (Seelze-Hannover, Germany). Silica gel (230-400mesh) was obtained from Merck (Darmstadt, Germany).All sorbents were activated at 600ºC (very important).Certified Reference Material (CRM) was purchased fromTusnovics Instrument Poland Sp. z o.o. (Trading andService Company, Poland).
Soil Samples
Blank soil samples were collected from the vincinty ofBialystok. The physico-chemical characteristics of soil arethe following: textural class-loamy sand, organic matter1.45%, pH 6.6, % silt 22.45 (0.002-0.05 mm), % sand75.32 (0.05-2 mm), % clay 2.43 (< 0.002 mm).
Field loamy sand samples were collected from privatecustomers from the Podlasie region (physico-chemicalproperties: organic matter content < 2%, pH 6-7.5, % silt18-38, % sand 59–68, % clay 2–6.4).
Pesticide Standards
Pesticides (154) were obtained from Dr. EhrenstorferLaboratory (Germany). Standard solutions were prepared inacetone and stored at 4ºC (purity >95%). Multicompoundstandard working solutions (M10÷M18, whose compositionis presented in Table 3) were prepared by dissolving appro-priate amounts of each stock solution in n-hexane/acetone(9:1, v/v) mixture (concentration range 0.005-2.5 mg/ml).
Preparation of Spiked Soil Samples
Representative portions of residue-free/blank soil (thesimilar type of soil of field soil and certified soil material)(500 g) was air-dried at about 40ºC and then sieved througha mesh with a grain size of 2 mm. They were stored at roomtemperature until fortified.
Spiked samples were prepared by adding an appropriatevolume of spiking solution to 2 g or 10 g of soil, dependingon the procedure used. The spiked samples were left for 30min.
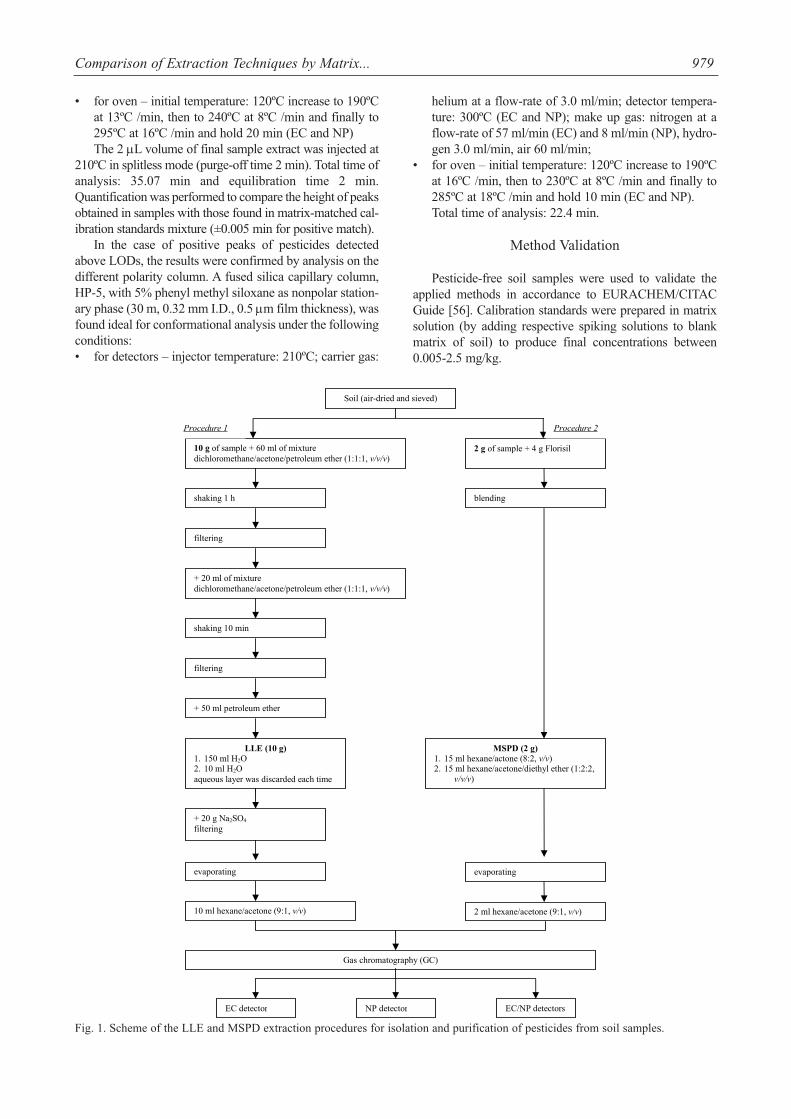
Soil samples were extracted by two techniques, MSPDand LLE (according to the scheme presented in Fig. 1). Themain purpose of this step was to calculate the average of therecovery percent of investigated pesticides by both extrac-tion techniques.
Procedure 1 – LLE Extraction
To 10 g of soil sample 60 ml of dichloromethane/acetone/petroleum ether (1:1:1, v/v/v) was added and shaken for 1h. Extract was filtered and 20 ml portion ofdichloromethane/acetone/petroleum ether (1:1:1, v/v/v)was added and shaken 10 min. Extracts were combined intothe same splitter and then 50 ml of petroleum ether wasadded. LLE extraction was carried out in two stages by theaddition of appropriate portions of water (150 ml and 10ml), each time discarding the aqueous layer. The combinedorganic layers were passed through a filter with 20 g anhy-drous sodium sulphate.
Procedure 2 – MSPD Extraction
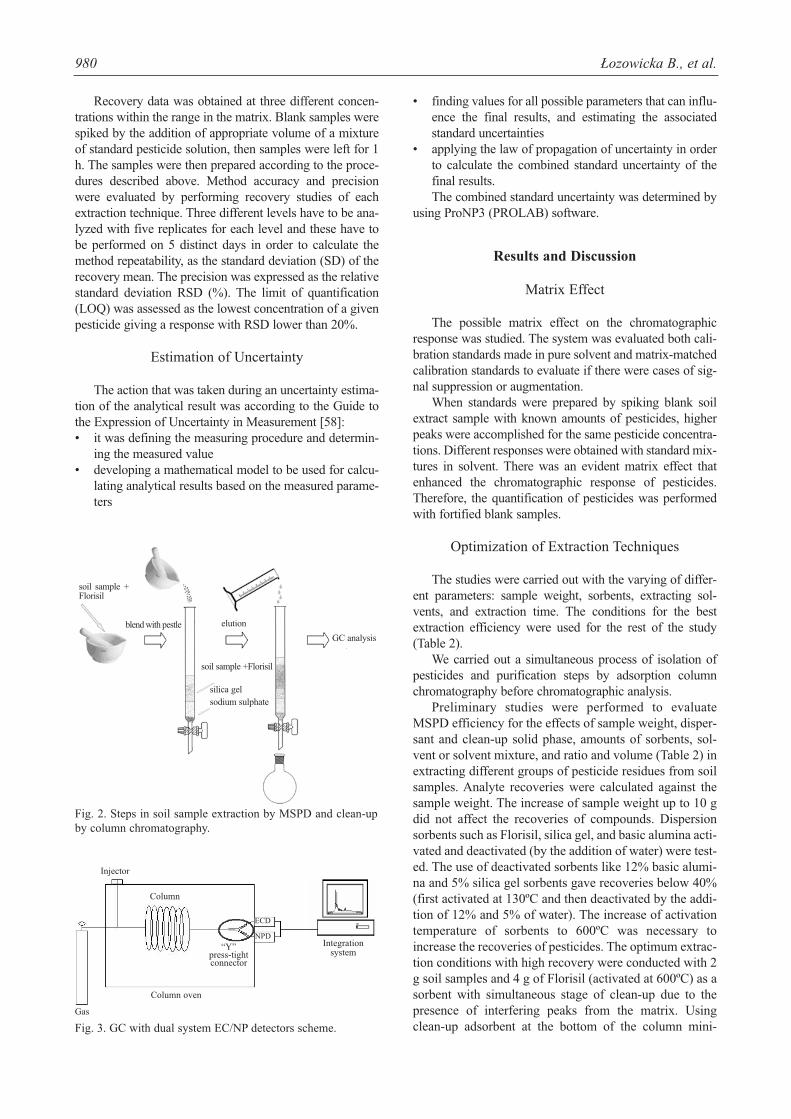
2 g of soil sample were put in a mortar with 4 g solidsupport (Florisil). All was manually blended using a pestleto produce a homogeneous mixture which was packed intoa glass macro column with anhydrous sodium sulphate (5g) and silica gel (2.5 g). The adsorbed analytes were elutedusing 15 ml hexane/acetone (8:2, v/v) and 15 ml of hexa-ne/acetone/diethyl ether (1:2:2, v/v/v). Stages in MSPDextraction procedure are shown in Fig. 2.
The extracts obtained from Procedures 1 and 2 wereevaporated to dryness using a rotary evaporator at about40ºC and dried residue was dissolved in appropriate vol-ume of hexane/acetone (9:1, v/v) (2 ml for Procedure 1 and10 ml for Procedure 2), and then transferred to 2 ml vialsfor further GC analysis.
GC Instrumentation
An Agilent 7890A gas chromatograph (Santa Clara,CA, USA) was equipped with an automatic split-splitlessinjector Model Agilent 7683B with a 63Ni micro-electroncapture detector (μEC) and nitrogen phosphorous detector(NP). The flux at the end of the GC column was dividedinto two branches by means of a “Y” press-tight connectorconnected at one end to the GC column and on the other tothe two detectors (Fig. 3). Data acquisition and processingwere performed using Chemstation (Hewlett-Packard, ver-sion B.04.01) software.
A DB-35 midpolarity column (35%-Phenyl)-methylpolysiloxane) with low bleed (30 m, 0.32 mm I.D.,0.5 μm film thickness) supplied by Agilent (Little Falls,DE, USA) was employed.
The operating conditions were as follows:• for detectors – injector temperature: 210ºC; carrier gas:
helium at a flow-rate of 1.9 ml/min; detector tempera-ture: 300ºC EC and 310ºC NP; make-up gas: nitrogen ata flow-rate of 60 ml/min (EC) and 8 ml/min (NP),hydrogen 3.0 ml/min, air 60 ml/min
978 Łozowicka B., et al.
• for oven – initial temperature: 120ºC increase to 190ºCat 13ºC /min, then to 240ºC at 8ºC /min and finally to295ºC at 16ºC /min and hold 20 min (EC and NP)The 2 μL volume of final sample extract was injected at
210ºC in splitless mode (purge-off time 2 min). Total time ofanalysis: 35.07 min and equilibration time 2 min.Quantification was performed to compare the height of peaksobtained in samples with those found in matrix-matched cal-ibration standards mixture (±0.005 min for positive match).
In the case of positive peaks of pesticides detectedabove LODs, the results were confirmed by analysis on thedifferent polarity column. A fused silica capillary column,HP-5, with 5% phenyl methyl siloxane as nonpolar station-ary phase (30 m, 0.32 mm I.D., 0.5 μm film thickness), wasfound ideal for conformational analysis under the followingconditions:• for detectors – injector temperature: 210ºC; carrier gas:
helium at a flow-rate of 3.0 ml/min; detector tempera-ture: 300ºC (EC and NP); make up gas: nitrogen at aflow-rate of 57 ml/min (EC) and 8 ml/min (NP), hydro-gen 3.0 ml/min, air 60 ml/min;
• for oven – initial temperature: 120ºC increase to 190ºCat 16ºC /min, then to 230ºC at 8ºC /min and finally to285ºC at 18ºC /min and hold 10 min (EC and NP).Total time of analysis: 22.4 min.
Method Validation
Pesticide-free soil samples were used to validate theapplied methods in accordance to EURACHEM/CITACGuide [56]. Calibration standards were prepared in matrixsolution (by adding respective spiking solutions to blankmatrix of soil) to produce final concentrations between0.005-2.5 mg/kg.
Comparison of Extraction Techniques by Matrix... 979
Soil (air-dried and sieved)
10 g of sample + 60 ml of mixture dichloromethane/acetone/petroleum ether (1:1:1, v/v/v)
MSPD (2 g) 1. 15 ml hexane/actone (8:2, v/v)2. 15 ml hexane/acetone/diethyl ether (1:2:2,
v/v/v)
Gas chromatography (GC)
EC detector NP detector EC/NP detectors
2 g of sample + 4 g Florisil
shaking 1 h
filtering
+ 20 ml of mixture dichloromethane/acetone/petroleum ether (1:1:1, v/v/v)
shaking 10 min
filtering
LLE (10 g) 1. 150 ml H2O2. 10 ml H2Oaqueous layer was discarded each time
+ 50 ml petroleum ether
blending
+ 20 g Na2SO4
filtering
evaporating evaporating
10 ml hexane/acetone (9:1, v/v) 2 ml hexane/acetone (9:1, v/v)
Procedure 1 Procedure 2
Fig. 1. Scheme of the LLE and MSPD extraction procedures for isolation and purification of pesticides from soil samples.
Recovery data was obtained at three different concen-trations within the range in the matrix. Blank samples werespiked by the addition of appropriate volume of a mixtureof standard pesticide solution, then samples were left for 1h. The samples were then prepared according to the proce-dures described above. Method accuracy and precisionwere evaluated by performing recovery studies of eachextraction technique. Three different levels have to be ana-lyzed with five replicates for each level and these have tobe performed on 5 distinct days in order to calculate themethod repeatability, as the standard deviation (SD) of therecovery mean. The precision was expressed as the relativestandard deviation RSD (%). The limit of quantification(LOQ) was assessed as the lowest concentration of a givenpesticide giving a response with RSD lower than 20%.
Estimation of Uncertainty
The action that was taken during an uncertainty estima-tion of the analytical result was according to the Guide tothe Expression of Uncertainty in Measurement [58]:• it was defining the measuring procedure and determin-
ing the measured value• developing a mathematical model to be used for calcu-
lating analytical results based on the measured parame-ters
• finding values for all possible parameters that can influ-ence the final results, and estimating the associatedstandard uncertainties
• applying the law of propagation of uncertainty in orderto calculate the combined standard uncertainty of thefinal results.The combined standard uncertainty was determined by
using ProNP3 (PROLAB) software.
Results and Discussion
Matrix Effect
The possible matrix effect on the chromatographicresponse was studied. The system was evaluated both cali-bration standards made in pure solvent and matrix-matchedcalibration standards to evaluate if there were cases of sig-nal suppression or augmentation.
When standards were prepared by spiking blank soilextract sample with known amounts of pesticides, higherpeaks were accomplished for the same pesticide concentra-tions. Different responses were obtained with standard mix-tures in solvent. There was an evident matrix effect thatenhanced the chromatographic response of pesticides.Therefore, the quantification of pesticides was performedwith fortified blank samples.
Optimization of Extraction Techniques
The studies were carried out with the varying of differ-ent parameters: sample weight, sorbents, extracting sol-vents, and extraction time. The conditions for the bestextraction efficiency were used for the rest of the study(Table 2).
We carried out a simultaneous process of isolation ofpesticides and purification steps by adsorption columnchromatography before chromatographic analysis.
Preliminary studies were performed to evaluateMSPD efficiency for the effects of sample weight, disper-sant and clean-up solid phase, amounts of sorbents, sol-vent or solvent mixture, and ratio and volume (Table 2) inextracting different groups of pesticide residues from soilsamples. Analyte recoveries were calculated against thesample weight. The increase of sample weight up to 10 gdid not affect the recoveries of compounds. Dispersionsorbents such as Florisil, silica gel, and basic alumina acti-vated and deactivated (by the addition of water) were test-ed. The use of deactivated sorbents like 12% basic alumi-na and 5% silica gel sorbents gave recoveries below 40%(first activated at 130ºC and then deactivated by the addi-tion of 12% and 5% of water). The increase of activationtemperature of sorbents to 600ºC was necessary toincrease the recoveries of pesticides. The optimum extrac-tion conditions with high recovery were conducted with 2g soil samples and 4 g of Florisil (activated at 600ºC) as asorbent with simultaneous stage of clean-up due to thepresence of interfering peaks from the matrix. Usingclean-up adsorbent at the bottom of the column mini-
980 Łozowicka B., et al.
Fig. 2. Steps in soil sample extraction by MSPD and clean-upby column chromatography.
Fig. 3. GC with dual system EC/NP detectors scheme.
soil sample +Florisil
soil sample +Florisil
blend with pestle elution
GC analysis
silica gelsodium sulphate
Injector
Gas
Column
“Y”press-tightconnector
Column oven
Integration system
ECD
NPD
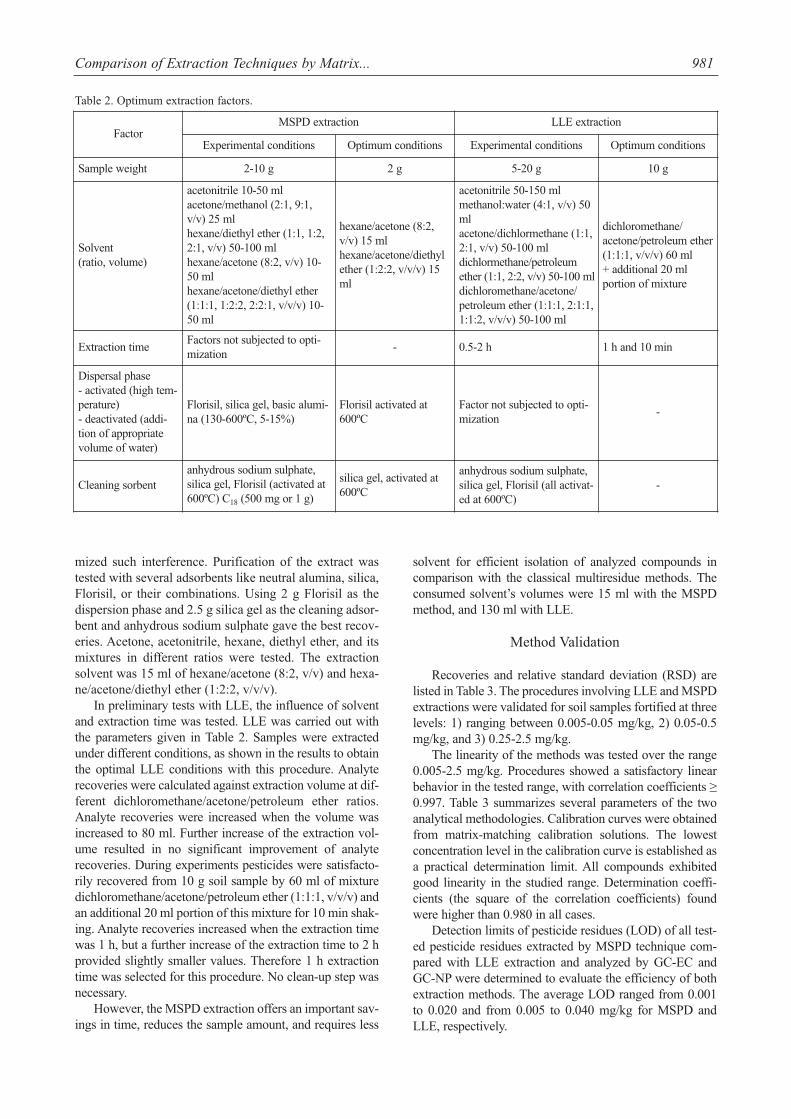
mized such interference. Purification of the extract wastested with several adsorbents like neutral alumina, silica,Florisil, or their combinations. Using 2 g Florisil as thedispersion phase and 2.5 g silica gel as the cleaning adsor-bent and anhydrous sodium sulphate gave the best recov-eries. Acetone, acetonitrile, hexane, diethyl ether, and itsmixtures in different ratios were tested. The extractionsolvent was 15 ml of hexane/acetone (8:2, v/v) and hexa-ne/acetone/diethyl ether (1:2:2, v/v/v).
In preliminary tests with LLE, the influence of solventand extraction time was tested. LLE was carried out withthe parameters given in Table 2. Samples were extractedunder different conditions, as shown in the results to obtainthe optimal LLE conditions with this procedure. Analyterecoveries were calculated against extraction volume at dif-ferent dichloromethane/acetone/petroleum ether ratios.Analyte recoveries were increased when the volume wasincreased to 80 ml. Further increase of the extraction vol-ume resulted in no significant improvement of analyterecoveries. During experiments pesticides were satisfacto-rily recovered from 10 g soil sample by 60 ml of mixturedichloromethane/acetone/petroleum ether (1:1:1, v/v/v) andan additional 20 ml portion of this mixture for 10 min shak-ing. Analyte recoveries increased when the extraction timewas 1 h, but a further increase of the extraction time to 2 hprovided slightly smaller values. Therefore 1 h extractiontime was selected for this procedure. No clean-up step wasnecessary.
However, the MSPD extraction offers an important sav-ings in time, reduces the sample amount, and requires less
solvent for efficient isolation of analyzed compounds incomparison with the classical multiresidue methods. Theconsumed solvent’s volumes were 15 ml with the MSPDmethod, and 130 ml with LLE.
Method Validation
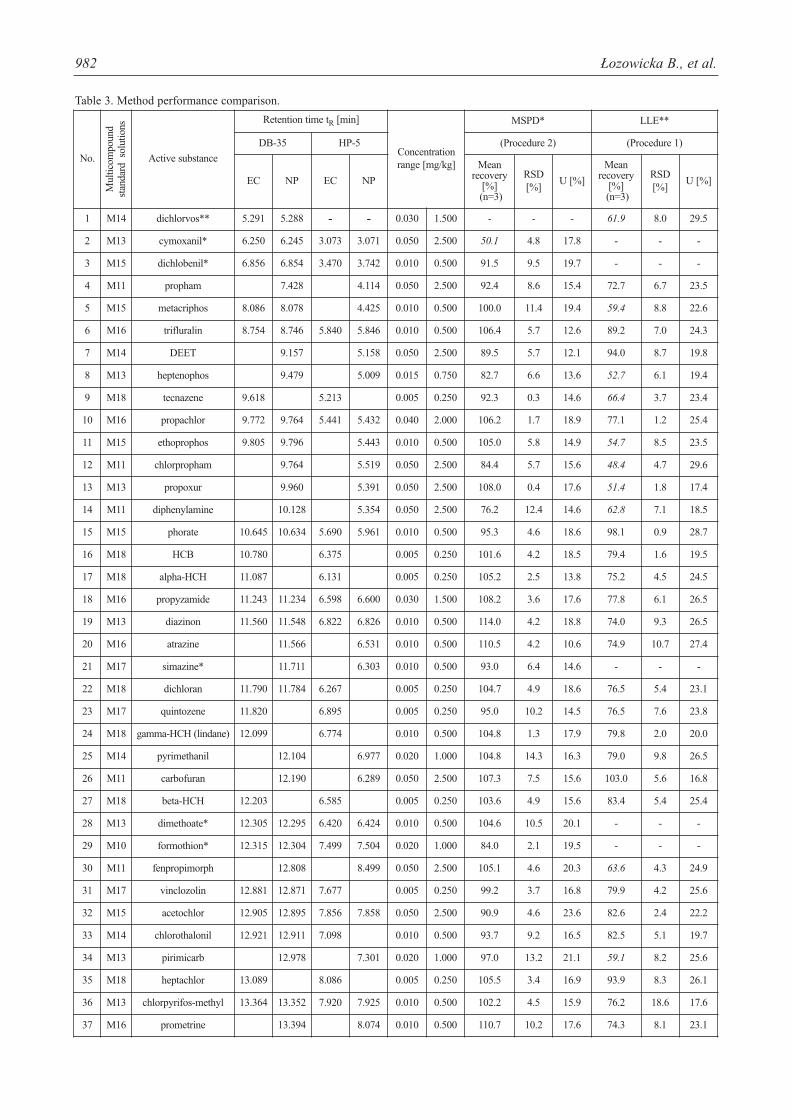
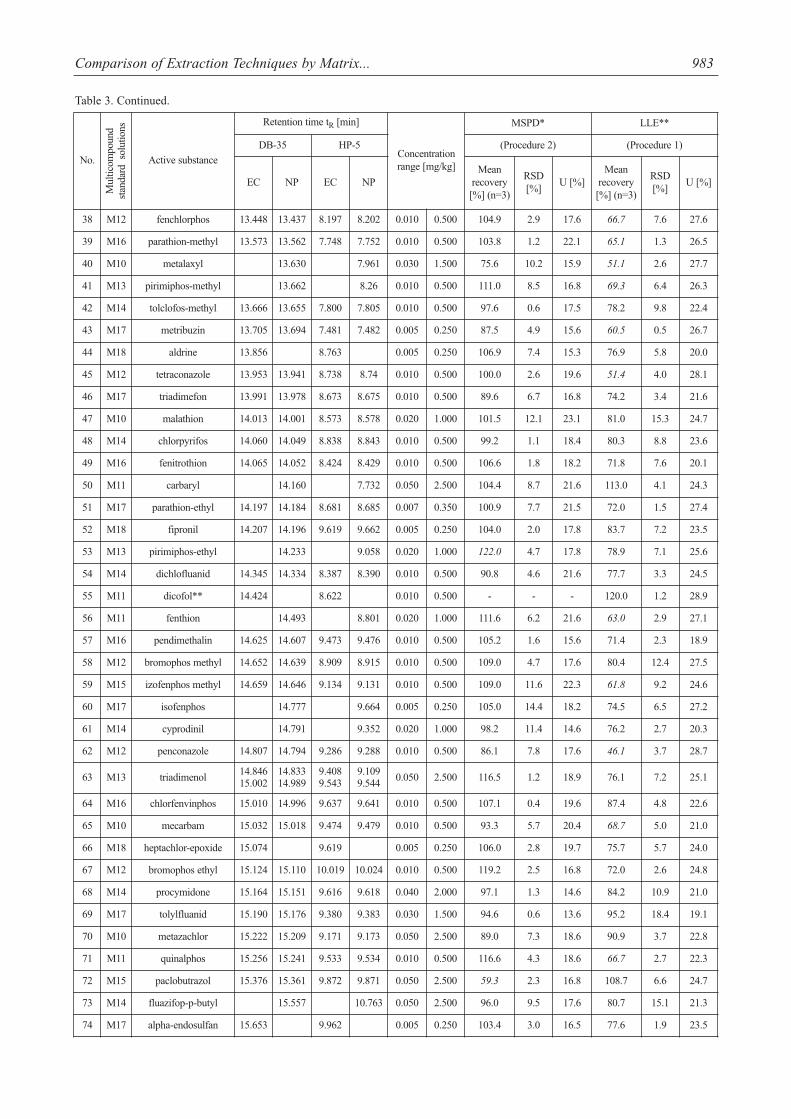
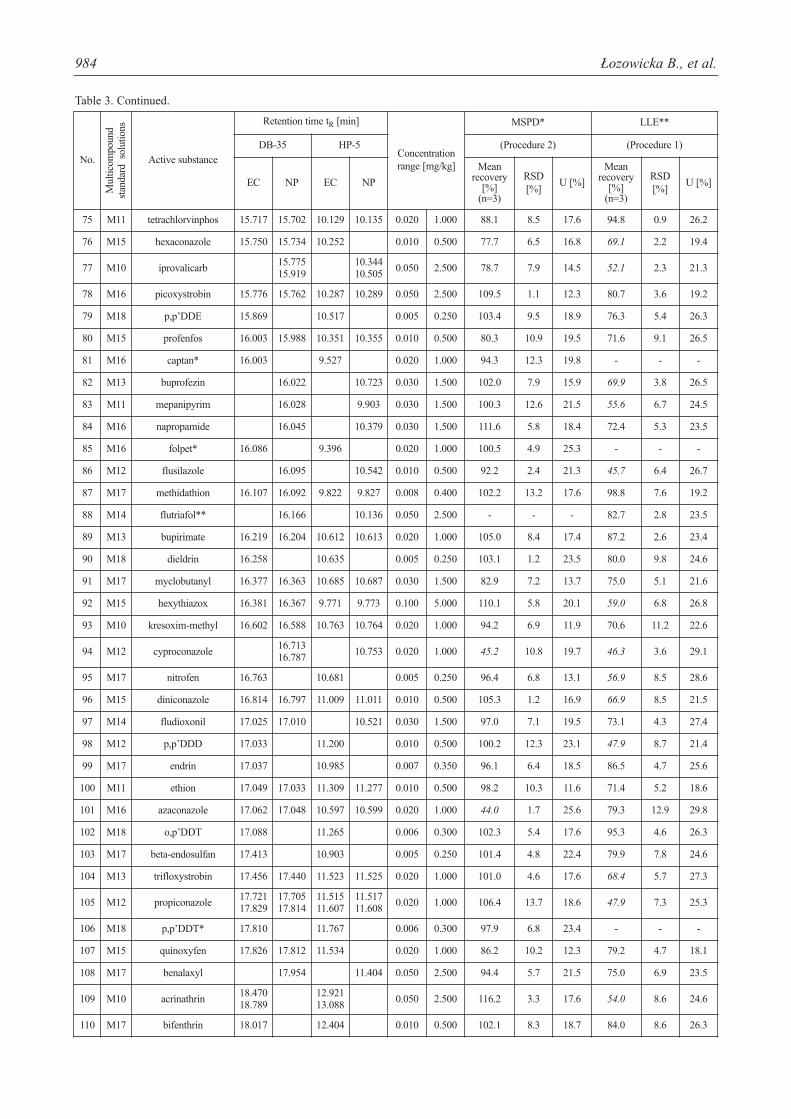
Recoveries and relative standard deviation (RSD) arelisted in Table 3. The procedures involving LLE and MSPDextractions were validated for soil samples fortified at threelevels: 1) ranging between 0.005-0.05 mg/kg, 2) 0.05-0.5mg/kg, and 3) 0.25-2.5 mg/kg.
The linearity of the methods was tested over the range0.005-2.5 mg/kg. Procedures showed a satisfactory linearbehavior in the tested range, with correlation coefficients ≥0.997. Table 3 summarizes several parameters of the twoanalytical methodologies. Calibration curves were obtainedfrom matrix-matching calibration solutions. The lowestconcentration level in the calibration curve is established asa practical determination limit. All compounds exhibitedgood linearity in the studied range. Determination coeffi-cients (the square of the correlation coefficients) foundwere higher than 0.980 in all cases.
Detection limits of pesticide residues (LOD) of all test-ed pesticide residues extracted by MSPD technique com-pared with LLE extraction and analyzed by GC-EC andGC-NP were determined to evaluate the efficiency of bothextraction methods. The average LOD ranged from 0.001to 0.020 and from 0.005 to 0.040 mg/kg for MSPD andLLE, respectively.
Comparison of Extraction Techniques by Matrix... 981
Table 2. Optimum extraction factors.
FactorMSPD extraction LLE extraction
Experimental conditions Optimum conditions Experimental conditions Optimum conditions
Sample weight 2-10 g 2 g 5-20 g 10 g
Solvent (ratio, volume)
acetonitrile 10-50 ml acetone/methanol (2:1, 9:1,v/v) 25 ml hexane/diethyl ether (1:1, 1:2,2:1, v/v) 50-100 ml hexane/acetone (8:2, v/v) 10-50 ml hexane/acetone/diethyl ether(1:1:1, 1:2:2, 2:2:1, v/v/v) 10-50 ml
hexane/acetone (8:2,v/v) 15 ml hexane/acetone/diethylether (1:2:2, v/v/v) 15ml
acetonitrile 50-150 ml methanol:water (4:1, v/v) 50ml acetone/dichlormethane (1:1,2:1, v/v) 50-100 mldichlormethane/petroleumether (1:1, 2:2, v/v) 50-100 mldichloromethane/acetone/petroleum ether (1:1:1, 2:1:1,1:1:2, v/v/v) 50-100 ml
dichloromethane/acetone/petroleum ether(1:1:1, v/v/v) 60 ml + additional 20 ml portion of mixture
Extraction timeFactors not subjected to opti-mization
- 0.5-2 h 1 h and 10 min
Dispersal phase - activated (high tem-perature) - deactivated (addi-tion of appropriatevolume of water)
Florisil, silica gel, basic alumi-na (130-600ºC, 5-15%)
Florisil activated at600ºC
Factor not subjected to opti-mization
-
Cleaning sorbentanhydrous sodium sulphate,silica gel, Florisil (activated at600ºC) C18 (500 mg or 1 g)
silica gel, activated at600ºC
anhydrous sodium sulphate,silica gel, Florisil (all activat-ed at 600ºC)
-
982 Łozowicka B., et al.
Table 3. Method performance comparison.
No.
Mul
ticom
poun
d st
anda
rd s
olut
ions
Active substance
Retention time tR [min]
Concentrationrange [mg/kg]
MSPD* LLE**
DB-35 HP-5 (Procedure 2) (Procedure 1)
EC NP EC NP
Meanrecovery
[%](n=3)
RSD[%]
U [%]
Meanrecovery
[%](n=3)
RSD[%]
U [%]
1 M14 dichlorvos** 5.291 5.288 - - 0.030 1.500 - - - 61.9 8.0 29.5
2 M13 cymoxanil* 6.250 6.245 3.073 3.071 0.050 2.500 50.1 4.8 17.8 - - -
3 M15 dichlobenil* 6.856 6.854 3.470 3.742 0.010 0.500 91.5 9.5 19.7 - - -
4 M11 propham 7.428 4.114 0.050 2.500 92.4 8.6 15.4 72.7 6.7 23.5
5 M15 metacriphos 8.086 8.078 4.425 0.010 0.500 100.0 11.4 19.4 59.4 8.8 22.6
6 M16 trifluralin 8.754 8.746 5.840 5.846 0.010 0.500 106.4 5.7 12.6 89.2 7.0 24.3
7 M14 DEET 9.157 5.158 0.050 2.500 89.5 5.7 12.1 94.0 8.7 19.8
8 M13 heptenophos 9.479 5.009 0.015 0.750 82.7 6.6 13.6 52.7 6.1 19.4
9 M18 tecnazene 9.618 5.213 0.005 0.250 92.3 0.3 14.6 66.4 3.7 23.4
10 M16 propachlor 9.772 9.764 5.441 5.432 0.040 2.000 106.2 1.7 18.9 77.1 1.2 25.4
11 M15 ethoprophos 9.805 9.796 5.443 0.010 0.500 105.0 5.8 14.9 54.7 8.5 23.5
12 M11 chlorpropham 9.764 5.519 0.050 2.500 84.4 5.7 15.6 48.4 4.7 29.6
13 M13 propoxur 9.960 5.391 0.050 2.500 108.0 0.4 17.6 51.4 1.8 17.4
14 M11 diphenylamine 10.128 5.354 0.050 2.500 76.2 12.4 14.6 62.8 7.1 18.5
15 M15 phorate 10.645 10.634 5.690 5.961 0.010 0.500 95.3 4.6 18.6 98.1 0.9 28.7
16 M18 HCB 10.780 6.375 0.005 0.250 101.6 4.2 18.5 79.4 1.6 19.5
17 M18 alpha-HCH 11.087 6.131 0.005 0.250 105.2 2.5 13.8 75.2 4.5 24.5
18 M16 propyzamide 11.243 11.234 6.598 6.600 0.030 1.500 108.2 3.6 17.6 77.8 6.1 26.5
19 M13 diazinon 11.560 11.548 6.822 6.826 0.010 0.500 114.0 4.2 18.8 74.0 9.3 26.5
20 M16 atrazine 11.566 6.531 0.010 0.500 110.5 4.2 10.6 74.9 10.7 27.4
21 M17 simazine* 11.711 6.303 0.010 0.500 93.0 6.4 14.6 - - -
22 M18 dichloran 11.790 11.784 6.267 0.005 0.250 104.7 4.9 18.6 76.5 5.4 23.1
23 M17 quintozene 11.820 6.895 0.005 0.250 95.0 10.2 14.5 76.5 7.6 23.8
24 M18 gamma-HCH (lindane) 12.099 6.774 0.010 0.500 104.8 1.3 17.9 79.8 2.0 20.0
25 M14 pyrimethanil 12.104 6.977 0.020 1.000 104.8 14.3 16.3 79.0 9.8 26.5
26 M11 carbofuran 12.190 6.289 0.050 2.500 107.3 7.5 15.6 103.0 5.6 16.8
27 M18 beta-HCH 12.203 6.585 0.005 0.250 103.6 4.9 15.6 83.4 5.4 25.4
28 M13 dimethoate* 12.305 12.295 6.420 6.424 0.010 0.500 104.6 10.5 20.1 - - -
29 M10 formothion* 12.315 12.304 7.499 7.504 0.020 1.000 84.0 2.1 19.5 - - -
30 M11 fenpropimorph 12.808 8.499 0.050 2.500 105.1 4.6 20.3 63.6 4.3 24.9
31 M17 vinclozolin 12.881 12.871 7.677 0.005 0.250 99.2 3.7 16.8 79.9 4.2 25.6
32 M15 acetochlor 12.905 12.895 7.856 7.858 0.050 2.500 90.9 4.6 23.6 82.6 2.4 22.2
33 M14 chlorothalonil 12.921 12.911 7.098 0.010 0.500 93.7 9.2 16.5 82.5 5.1 19.7
34 M13 pirimicarb 12.978 7.301 0.020 1.000 97.0 13.2 21.1 59.1 8.2 25.6
35 M18 heptachlor 13.089 8.086 0.005 0.250 105.5 3.4 16.9 93.9 8.3 26.1
36 M13 chlorpyrifos-methyl 13.364 13.352 7.920 7.925 0.010 0.500 102.2 4.5 15.9 76.2 18.6 17.6
37 M16 prometrine 13.394 8.074 0.010 0.500 110.7 10.2 17.6 74.3 8.1 23.1
Comparison of Extraction Techniques by Matrix... 983
Table 3. Continued.
No.
Mul
ticom
poun
d st
anda
rd s
olut
ions
Active substance
Retention time tR [min]
Concentrationrange [mg/kg]
MSPD* LLE**
DB-35 HP-5 (Procedure 2) (Procedure 1)
EC NP EC NPMean
recovery[%] (n=3)
RSD[%]
U [%]Mean
recovery[%] (n=3)
RSD[%]
U [%]
38 M12 fenchlorphos 13.448 13.437 8.197 8.202 0.010 0.500 104.9 2.9 17.6 66.7 7.6 27.6
39 M16 parathion-methyl 13.573 13.562 7.748 7.752 0.010 0.500 103.8 1.2 22.1 65.1 1.3 26.5
40 M10 metalaxyl 13.630 7.961 0.030 1.500 75.6 10.2 15.9 51.1 2.6 27.7
41 M13 pirimiphos-methyl 13.662 8.26 0.010 0.500 111.0 8.5 16.8 69.3 6.4 26.3
42 M14 tolclofos-methyl 13.666 13.655 7.800 7.805 0.010 0.500 97.6 0.6 17.5 78.2 9.8 22.4
43 M17 metribuzin 13.705 13.694 7.481 7.482 0.005 0.250 87.5 4.9 15.6 60.5 0.5 26.7
44 M18 aldrine 13.856 8.763 0.005 0.250 106.9 7.4 15.3 76.9 5.8 20.0
45 M12 tetraconazole 13.953 13.941 8.738 8.74 0.010 0.500 100.0 2.6 19.6 51.4 4.0 28.1
46 M17 triadimefon 13.991 13.978 8.673 8.675 0.010 0.500 89.6 6.7 16.8 74.2 3.4 21.6
47 M10 malathion 14.013 14.001 8.573 8.578 0.020 1.000 101.5 12.1 23.1 81.0 15.3 24.7
48 M14 chlorpyrifos 14.060 14.049 8.838 8.843 0.010 0.500 99.2 1.1 18.4 80.3 8.8 23.6
49 M16 fenitrothion 14.065 14.052 8.424 8.429 0.010 0.500 106.6 1.8 18.2 71.8 7.6 20.1
50 M11 carbaryl 14.160 7.732 0.050 2.500 104.4 8.7 21.6 113.0 4.1 24.3
51 M17 parathion-ethyl 14.197 14.184 8.681 8.685 0.007 0.350 100.9 7.7 21.5 72.0 1.5 27.4
52 M18 fipronil 14.207 14.196 9.619 9.662 0.005 0.250 104.0 2.0 17.8 83.7 7.2 23.5
53 M13 pirimiphos-ethyl 14.233 9.058 0.020 1.000 122.0 4.7 17.8 78.9 7.1 25.6
54 M14 dichlofluanid 14.345 14.334 8.387 8.390 0.010 0.500 90.8 4.6 21.6 77.7 3.3 24.5
55 M11 dicofol** 14.424 8.622 0.010 0.500 - - - 120.0 1.2 28.9
56 M11 fenthion 14.493 8.801 0.020 1.000 111.6 6.2 21.6 63.0 2.9 27.1
57 M16 pendimethalin 14.625 14.607 9.473 9.476 0.010 0.500 105.2 1.6 15.6 71.4 2.3 18.9
58 M12 bromophos methyl 14.652 14.639 8.909 8.915 0.010 0.500 109.0 4.7 17.6 80.4 12.4 27.5
59 M15 izofenphos methyl 14.659 14.646 9.134 9.131 0.010 0.500 109.0 11.6 22.3 61.8 9.2 24.6
60 M17 isofenphos 14.777 9.664 0.005 0.250 105.0 14.4 18.2 74.5 6.5 27.2
61 M14 cyprodinil 14.791 9.352 0.020 1.000 98.2 11.4 14.6 76.2 2.7 20.3
62 M12 penconazole 14.807 14.794 9.286 9.288 0.010 0.500 86.1 7.8 17.6 46.1 3.7 28.7
63 M13 triadimenol14.84615.002
14.83314.989
9.4089.543
9.1099.544
0.050 2.500 116.5 1.2 18.9 76.1 7.2 25.1
64 M16 chlorfenvinphos 15.010 14.996 9.637 9.641 0.010 0.500 107.1 0.4 19.6 87.4 4.8 22.6
65 M10 mecarbam 15.032 15.018 9.474 9.479 0.010 0.500 93.3 5.7 20.4 68.7 5.0 21.0
66 M18 heptachlor-epoxide 15.074 9.619 0.005 0.250 106.0 2.8 19.7 75.7 5.7 24.0
67 M12 bromophos ethyl 15.124 15.110 10.019 10.024 0.010 0.500 119.2 2.5 16.8 72.0 2.6 24.8
68 M14 procymidone 15.164 15.151 9.616 9.618 0.040 2.000 97.1 1.3 14.6 84.2 10.9 21.0
69 M17 tolylfluanid 15.190 15.176 9.380 9.383 0.030 1.500 94.6 0.6 13.6 95.2 18.4 19.1
70 M10 metazachlor 15.222 15.209 9.171 9.173 0.050 2.500 89.0 7.3 18.6 90.9 3.7 22.8
71 M11 quinalphos 15.256 15.241 9.533 9.534 0.010 0.500 116.6 4.3 18.6 66.7 2.7 22.3
72 M15 paclobutrazol 15.376 15.361 9.872 9.871 0.050 2.500 59.3 2.3 16.8 108.7 6.6 24.7
73 M14 fluazifop-p-butyl 15.557 10.763 0.050 2.500 96.0 9.5 17.6 80.7 15.1 21.3
74 M17 alpha-endosulfan 15.653 9.962 0.005 0.250 103.4 3.0 16.5 77.6 1.9 23.5
984 Łozowicka B., et al.
No.
Mul
ticom
poun
d st
anda
rd s
olut
ions
Active substance
Retention time tR [min]
Concentrationrange [mg/kg]
MSPD* LLE**
DB-35 HP-5 (Procedure 2) (Procedure 1)
EC NP EC NP
Meanrecovery
[%] (n=3)
RSD[%]
U [%]
Meanrecovery
[%] (n=3)
RSD[%]
U [%]
75 M11 tetrachlorvinphos 15.717 15.702 10.129 10.135 0.020 1.000 88.1 8.5 17.6 94.8 0.9 26.2
76 M15 hexaconazole 15.750 15.734 10.252 0.010 0.500 77.7 6.5 16.8 69.1 2.2 19.4
77 M10 iprovalicarb15.77515.919
10.34410.505
0.050 2.500 78.7 7.9 14.5 52.1 2.3 21.3
78 M16 picoxystrobin 15.776 15.762 10.287 10.289 0.050 2.500 109.5 1.1 12.3 80.7 3.6 19.2
79 M18 p,p’DDE 15.869 10.517 0.005 0.250 103.4 9.5 18.9 76.3 5.4 26.3
80 M15 profenfos 16.003 15.988 10.351 10.355 0.010 0.500 80.3 10.9 19.5 71.6 9.1 26.5
81 M16 captan* 16.003 9.527 0.020 1.000 94.3 12.3 19.8 - - -
82 M13 buprofezin 16.022 10.723 0.030 1.500 102.0 7.9 15.9 69.9 3.8 26.5
83 M11 mepanipyrim 16.028 9.903 0.030 1.500 100.3 12.6 21.5 55.6 6.7 24.5
84 M16 napropamide 16.045 10.379 0.030 1.500 111.6 5.8 18.4 72.4 5.3 23.5
85 M16 folpet* 16.086 9.396 0.020 1.000 100.5 4.9 25.3 - - -
86 M12 flusilazole 16.095 10.542 0.010 0.500 92.2 2.4 21.3 45.7 6.4 26.7
87 M17 methidathion 16.107 16.092 9.822 9.827 0.008 0.400 102.2 13.2 17.6 98.8 7.6 19.2
88 M14 flutriafol** 16.166 10.136 0.050 2.500 - - - 82.7 2.8 23.5
89 M13 bupirimate 16.219 16.204 10.612 10.613 0.020 1.000 105.0 8.4 17.4 87.2 2.6 23.4
90 M18 dieldrin 16.258 10.635 0.005 0.250 103.1 1.2 23.5 80.0 9.8 24.6
91 M17 myclobutanyl 16.377 16.363 10.685 10.687 0.030 1.500 82.9 7.2 13.7 75.0 5.1 21.6
92 M15 hexythiazox 16.381 16.367 9.771 9.773 0.100 5.000 110.1 5.8 20.1 59.0 6.8 26.8
93 M10 kresoxim-methyl 16.602 16.588 10.763 10.764 0.020 1.000 94.2 6.9 11.9 70.6 11.2 22.6
94 M12 cyproconazole16.71316.787
10.753 0.020 1.000 45.2 10.8 19.7 46.3 3.6 29.1
95 M17 nitrofen 16.763 10.681 0.005 0.250 96.4 6.8 13.1 56.9 8.5 28.6
96 M15 diniconazole 16.814 16.797 11.009 11.011 0.010 0.500 105.3 1.2 16.9 66.9 8.5 21.5
97 M14 fludioxonil 17.025 17.010 10.521 0.030 1.500 97.0 7.1 19.5 73.1 4.3 27.4
98 M12 p,p’DDD 17.033 11.200 0.010 0.500 100.2 12.3 23.1 47.9 8.7 21.4
99 M17 endrin 17.037 10.985 0.007 0.350 96.1 6.4 18.5 86.5 4.7 25.6
100 M11 ethion 17.049 17.033 11.309 11.277 0.010 0.500 98.2 10.3 11.6 71.4 5.2 18.6
101 M16 azaconazole 17.062 17.048 10.597 10.599 0.020 1.000 44.0 1.7 25.6 79.3 12.9 29.8
102 M18 o,p’DDT 17.088 11.265 0.006 0.300 102.3 5.4 17.6 95.3 4.6 26.3
103 M17 beta-endosulfan 17.413 10.903 0.005 0.250 101.4 4.8 22.4 79.9 7.8 24.6
104 M13 trifloxystrobin 17.456 17.440 11.523 11.525 0.020 1.000 101.0 4.6 17.6 68.4 5.7 27.3
105 M12 propiconazole17.72117.829
17.70517.814
11.51511.607
11.51711.608
0.020 1.000 106.4 13.7 18.6 47.9 7.3 25.3
106 M18 p,p’DDT* 17.810 11.767 0.006 0.300 97.9 6.8 23.4 - - -
107 M15 quinoxyfen 17.826 17.812 11.534 0.020 1.000 86.2 10.2 12.3 79.2 4.7 18.1
108 M17 benalaxyl 17.954 11.404 0.050 2.500 94.4 5.7 21.5 75.0 6.9 23.5
109 M10 acrinathrin18.47018.789
12.92113.088
0.050 2.500 116.2 3.3 17.6 54.0 8.6 24.6
110 M17 bifenthrin 18.017 12.404 0.010 0.500 102.1 8.3 18.7 84.0 8.6 26.3
Table 3. Continued.
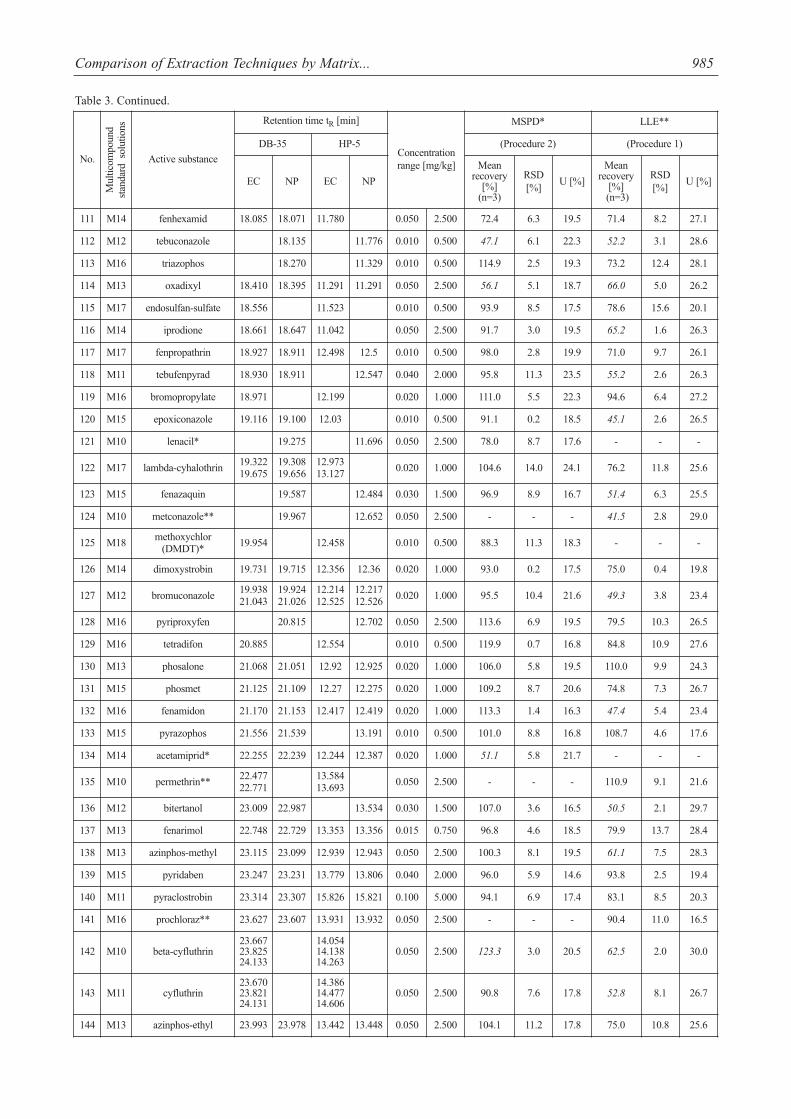
Comparison of Extraction Techniques by Matrix... 985
Table 3. Continued.
No.
Mul
ticom
poun
d st
anda
rd s
olut
ions
Active substance
Retention time tR [min]
Concentrationrange [mg/kg]
MSPD* LLE**
DB-35 HP-5 (Procedure 2) (Procedure 1)
EC NP EC NP
Meanrecovery
[%] (n=3)
RSD[%]
U [%]
Meanrecovery
[%](n=3)
RSD[%]
U [%]
111 M14 fenhexamid 18.085 18.071 11.780 0.050 2.500 72.4 6.3 19.5 71.4 8.2 27.1
112 M12 tebuconazole 18.135 11.776 0.010 0.500 47.1 6.1 22.3 52.2 3.1 28.6
113 M16 triazophos 18.270 11.329 0.010 0.500 114.9 2.5 19.3 73.2 12.4 28.1
114 M13 oxadixyl 18.410 18.395 11.291 11.291 0.050 2.500 56.1 5.1 18.7 66.0 5.0 26.2
115 M17 endosulfan-sulfate 18.556 11.523 0.010 0.500 93.9 8.5 17.5 78.6 15.6 20.1
116 M14 iprodione 18.661 18.647 11.042 0.050 2.500 91.7 3.0 19.5 65.2 1.6 26.3
117 M17 fenpropathrin 18.927 18.911 12.498 12.5 0.010 0.500 98.0 2.8 19.9 71.0 9.7 26.1
118 M11 tebufenpyrad 18.930 18.911 12.547 0.040 2.000 95.8 11.3 23.5 55.2 2.6 26.3
119 M16 bromopropylate 18.971 12.199 0.020 1.000 111.0 5.5 22.3 94.6 6.4 27.2
120 M15 epoxiconazole 19.116 19.100 12.03 0.010 0.500 91.1 0.2 18.5 45.1 2.6 26.5
121 M10 lenacil* 19.275 11.696 0.050 2.500 78.0 8.7 17.6 - - -
122 M17 lambda-cyhalothrin19.32219.675
19.30819.656
12.97313.127
0.020 1.000 104.6 14.0 24.1 76.2 11.8 25.6
123 M15 fenazaquin 19.587 12.484 0.030 1.500 96.9 8.9 16.7 51.4 6.3 25.5
124 M10 metconazole** 19.967 12.652 0.050 2.500 - - - 41.5 2.8 29.0
125 M18methoxychlor
(DMDT)*19.954 12.458 0.010 0.500 88.3 11.3 18.3 - - -
126 M14 dimoxystrobin 19.731 19.715 12.356 12.36 0.020 1.000 93.0 0.2 17.5 75.0 0.4 19.8
127 M12 bromuconazole19.93821.043
19.92421.026
12.21412.525
12.21712.526
0.020 1.000 95.5 10.4 21.6 49.3 3.8 23.4
128 M16 pyriproxyfen 20.815 12.702 0.050 2.500 113.6 6.9 19.5 79.5 10.3 26.5
129 M16 tetradifon 20.885 12.554 0.010 0.500 119.9 0.7 16.8 84.8 10.9 27.6
130 M13 phosalone 21.068 21.051 12.92 12.925 0.020 1.000 106.0 5.8 19.5 110.0 9.9 24.3
131 M15 phosmet 21.125 21.109 12.27 12.275 0.020 1.000 109.2 8.7 20.6 74.8 7.3 26.7
132 M16 fenamidon 21.170 21.153 12.417 12.419 0.020 1.000 113.3 1.4 16.3 47.4 5.4 23.4
133 M15 pyrazophos 21.556 21.539 13.191 0.010 0.500 101.0 8.8 16.8 108.7 4.6 17.6
134 M14 acetamiprid* 22.255 22.239 12.244 12.387 0.020 1.000 51.1 5.8 21.7 - - -
135 M10 permethrin**22.47722.771
13.58413.693
0.050 2.500 - - - 110.9 9.1 21.6
136 M12 bitertanol 23.009 22.987 13.534 0.030 1.500 107.0 3.6 16.5 50.5 2.1 29.7
137 M13 fenarimol 22.748 22.729 13.353 13.356 0.015 0.750 96.8 4.6 18.5 79.9 13.7 28.4
138 M13 azinphos-methyl 23.115 23.099 12.939 12.943 0.050 2.500 100.3 8.1 19.5 61.1 7.5 28.3
139 M15 pyridaben 23.247 23.231 13.779 13.806 0.040 2.000 96.0 5.9 14.6 93.8 2.5 19.4
140 M11 pyraclostrobin 23.314 23.307 15.826 15.821 0.100 5.000 94.1 6.9 17.4 83.1 8.5 20.3
141 M16 prochloraz** 23.627 23.607 13.931 13.932 0.050 2.500 - - - 90.4 11.0 16.5
142 M10 beta-cyfluthrin23.66723.82524.133
14.05414.13814.263
0.050 2.500 123.3 3.0 20.5 62.5 2.0 30.0
143 M11 cyfluthrin23.67023.82124.131
14.38614.47714.606
0.050 2.500 90.8 7.6 17.8 52.8 8.1 26.7
144 M13 azinphos-ethyl 23.993 23.978 13.442 13.448 0.050 2.500 104.1 11.2 17.8 75.0 10.8 25.6
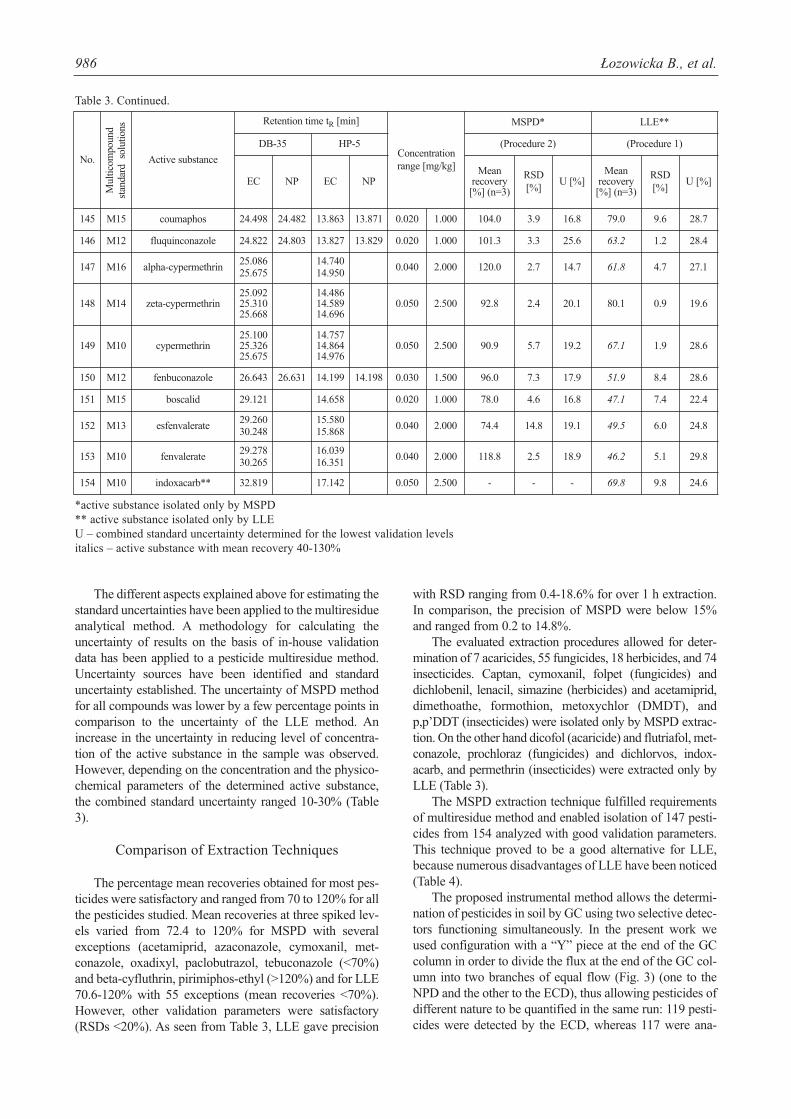
The different aspects explained above for estimating thestandard uncertainties have been applied to the multiresidueanalytical method. A methodology for calculating theuncertainty of results on the basis of in-house validationdata has been applied to a pesticide multiresidue method.Uncertainty sources have been identified and standarduncertainty established. The uncertainty of MSPD methodfor all compounds was lower by a few percentage points incomparison to the uncertainty of the LLE method. Anincrease in the uncertainty in reducing level of concentra-tion of the active substance in the sample was observed.However, depending on the concentration and the physico-chemical parameters of the determined active substance,the combined standard uncertainty ranged 10-30% (Table3).
Comparison of Extraction Techniques
The percentage mean recoveries obtained for most pes-ticides were satisfactory and ranged from 70 to 120% for allthe pesticides studied. Mean recoveries at three spiked lev-els varied from 72.4 to 120% for MSPD with severalexceptions (acetamiprid, azaconazole, cymoxanil, met-conazole, oxadixyl, paclobutrazol, tebuconazole (<70%)and beta-cyfluthrin, pirimiphos-ethyl (>120%) and for LLE70.6-120% with 55 exceptions (mean recoveries <70%).However, other validation parameters were satisfactory(RSDs <20%). As seen from Table 3, LLE gave precision
with RSD ranging from 0.4-18.6% for over 1 h extraction.In comparison, the precision of MSPD were below 15%and ranged from 0.2 to 14.8%.
The evaluated extraction procedures allowed for deter-mination of 7 acaricides, 55 fungicides, 18 herbicides, and 74insecticides. Captan, cymoxanil, folpet (fungicides) anddichlobenil, lenacil, simazine (herbicides) and acetamiprid,dimethoathe, formothion, metoxychlor (DMDT), andp,p’DDT (insecticides) were isolated only by MSPD extrac-tion. On the other hand dicofol (acaricide) and flutriafol, met-conazole, prochloraz (fungicides) and dichlorvos, indox-acarb, and permethrin (insecticides) were extracted only byLLE (Table 3).
The MSPD extraction technique fulfilled requirementsof multiresidue method and enabled isolation of 147 pesti-cides from 154 analyzed with good validation parameters.This technique proved to be a good alternative for LLE,because numerous disadvantages of LLE have been noticed(Table 4).
The proposed instrumental method allows the determi-nation of pesticides in soil by GC using two selective detec-tors functioning simultaneously. In the present work weused configuration with a “Y” piece at the end of the GCcolumn in order to divide the flux at the end of the GC col-umn into two branches of equal flow (Fig. 3) (one to theNPD and the other to the ECD), thus allowing pesticides ofdifferent nature to be quantified in the same run: 119 pesti-cides were detected by the ECD, whereas 117 were ana-
986 Łozowicka B., et al.
No.
Mul
ticom
poun
d st
anda
rd s
olut
ions
Active substance
Retention time tR [min]
Concentrationrange [mg/kg]
MSPD* LLE**
DB-35 HP-5 (Procedure 2) (Procedure 1)
EC NP EC NPMean
recovery[%] (n=3)
RSD[%]
U [%]Mean
recovery[%] (n=3)
RSD[%]
U [%]
145 M15 coumaphos 24.498 24.482 13.863 13.871 0.020 1.000 104.0 3.9 16.8 79.0 9.6 28.7
146 M12 fluquinconazole 24.822 24.803 13.827 13.829 0.020 1.000 101.3 3.3 25.6 63.2 1.2 28.4
147 M16 alpha-cypermethrin25.08625.675
14.74014.950
0.040 2.000 120.0 2.7 14.7 61.8 4.7 27.1
148 M14 zeta-cypermethrin25.09225.31025.668
14.48614.58914.696
0.050 2.500 92.8 2.4 20.1 80.1 0.9 19.6
149 M10 cypermethrin25.10025.32625.675
14.75714.86414.976
0.050 2.500 90.9 5.7 19.2 67.1 1.9 28.6
150 M12 fenbuconazole 26.643 26.631 14.199 14.198 0.030 1.500 96.0 7.3 17.9 51.9 8.4 28.6
151 M15 boscalid 29.121 14.658 0.020 1.000 78.0 4.6 16.8 47.1 7.4 22.4
152 M13 esfenvalerate29.26030.248
15.58015.868
0.040 2.000 74.4 14.8 19.1 49.5 6.0 24.8
153 M10 fenvalerate29.27830.265
16.03916.351
0.040 2.000 118.8 2.5 18.9 46.2 5.1 29.8
154 M10 indoxacarb** 32.819 17.142 0.050 2.500 - - - 69.8 9.8 24.6
Table 3. Continued.
*active substance isolated only by MSPD** active substance isolated only by LLEU – combined standard uncertainty determined for the lowest validation levelsitalics – active substance with mean recovery 40-130%
lyzed by NPD, although ECD and NPD also provided a dis-cernible signal for 82 of them.
In the case of coeluting pesticides, the application of adual detection system allows their determination. Forexample, the co-eluted peaks of pyrimethanil and gamma-
HCH were observed. However, this was not a problemsince pyrimethanil was only detected with NPD andgamma-HCH only with ECD (Table 3). In that situationalso a capillary column with different polarity in the samedetection system is used.
Comparison of Extraction Techniques by Matrix... 987
Table 4. Comparison of extraction techniques.
Extraction technique Advantages Disadvantages
LLE· Well-known procedure · Wide experience in the extraction field
· Long extraction time · Large consumption of toxic and inflammable solvents
(dichloromethane) – problems with evaporation · Multiple extractions · Laborious, time-consuming, expensive · Filtration required after extraction · From 144 extracted pesticides 55 (38%) with acceptable
mean recovery values (<70%) 89 pesticides extractedwith satisfactory mean recovery values
MSPD
· Simple and fast extraction (time reduction) · Small amount of organic solvent · Environmentally safe extraction · Economical and convenient to perform · Coupled with simultaneous stage of purification· No filtration required · Extraction of 147 pesticides, of which 138 have
satisfactory mean recovery values · Lower limits of detection (LODs)
· The use of anhydrous sorbents activated at high temperatures
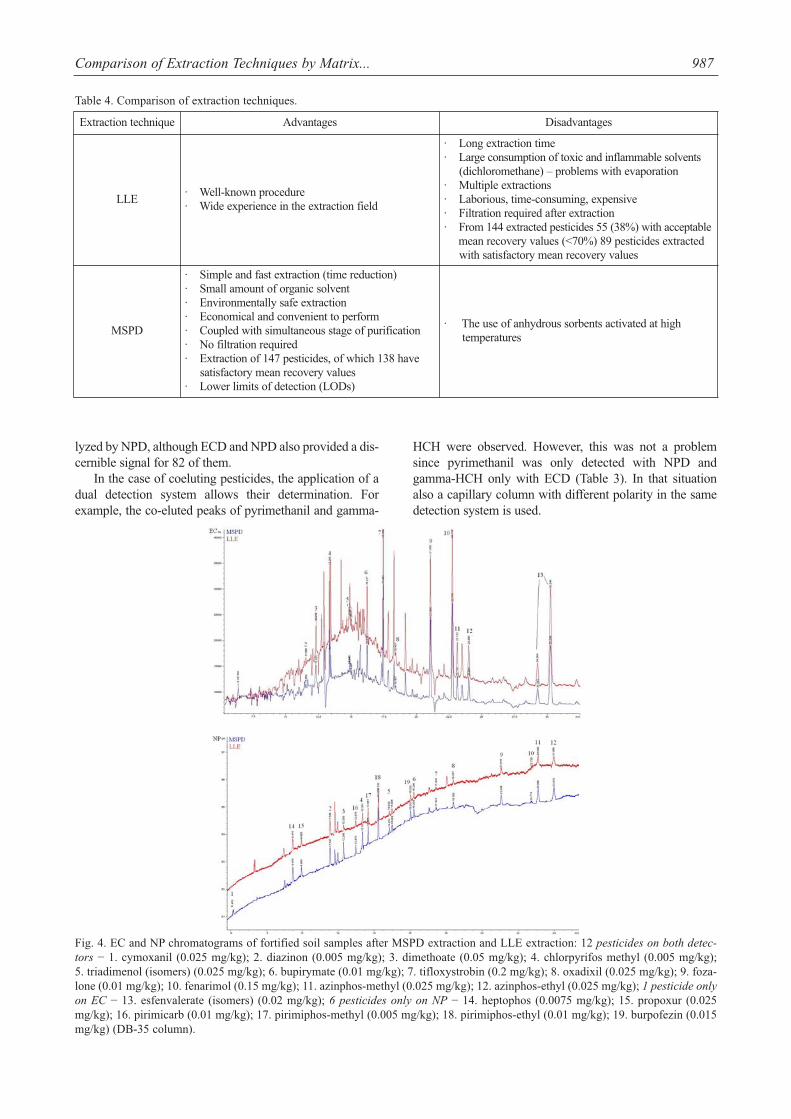
Fig. 4. EC and NP chromatograms of fortified soil samples after MSPD extraction and LLE extraction: 12 pesticides on both detec-tors − 1. cymoxanil (0.025 mg/kg); 2. diazinon (0.005 mg/kg); 3. dimethoate (0.05 mg/kg); 4. chlorpyrifos methyl (0.005 mg/kg); 5. triadimenol (isomers) (0.025 mg/kg); 6. bupirymate (0.01 mg/kg); 7. tifloxystrobin (0.2 mg/kg); 8. oxadixil (0.025 mg/kg); 9. foza-lone (0.01 mg/kg); 10. fenarimol (0.15 mg/kg); 11. azinphos-methyl (0.025 mg/kg); 12. azinphos-ethyl (0.025 mg/kg); 1 pesticide onlyon EC − 13. esfenvalerate (isomers) (0.02 mg/kg); 6 pesticides only on NP − 14. heptophos (0.0075 mg/kg); 15. propoxur (0.025mg/kg); 16. pirimicarb (0.01 mg/kg); 17. pirimiphos-methyl (0.005 mg/kg); 18. pirimiphos-ethyl (0.01 mg/kg); 19. burpofezin (0.015mg/kg) (DB-35 column).
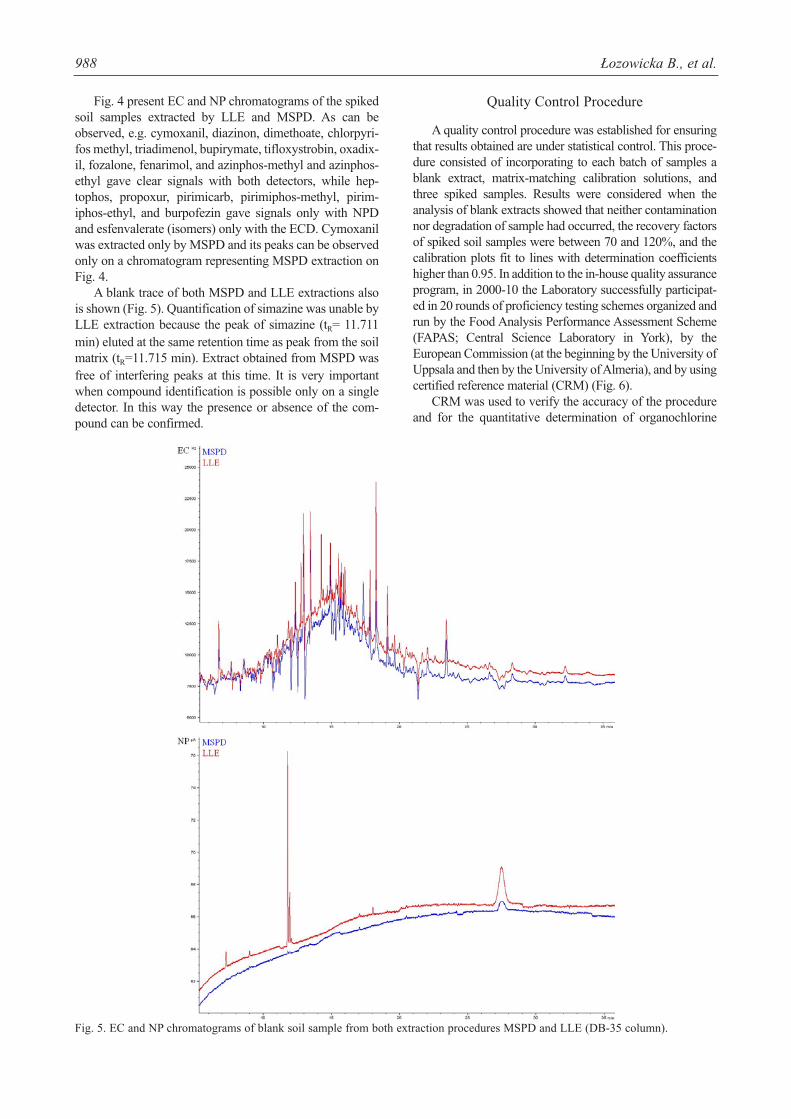
Fig. 4 present EC and NP chromatograms of the spikedsoil samples extracted by LLE and MSPD. As can beobserved, e.g. cymoxanil, diazinon, dimethoate, chlorpyri-fos methyl, triadimenol, bupirymate, tifloxystrobin, oxadix-il, fozalone, fenarimol, and azinphos-methyl and azinphos-ethyl gave clear signals with both detectors, while hep-tophos, propoxur, pirimicarb, pirimiphos-methyl, pirim-iphos-ethyl, and burpofezin gave signals only with NPDand esfenvalerate (isomers) only with the ECD. Cymoxanilwas extracted only by MSPD and its peaks can be observedonly on a chromatogram representing MSPD extraction onFig. 4.
A blank trace of both MSPD and LLE extractions alsois shown (Fig. 5). Quantification of simazine was unable byLLE extraction because the peak of simazine (tR= 11.711min) eluted at the same retention time as peak from the soilmatrix (tR=11.715 min). Extract obtained from MSPD wasfree of interfering peaks at this time. It is very importantwhen compound identification is possible only on a singledetector. In this way the presence or absence of the com-pound can be confirmed.
Quality Control Procedure
A quality control procedure was established for ensuringthat results obtained are under statistical control. This proce-dure consisted of incorporating to each batch of samples ablank extract, matrix-matching calibration solutions, andthree spiked samples. Results were considered when theanalysis of blank extracts showed that neither contaminationnor degradation of sample had occurred, the recovery factorsof spiked soil samples were between 70 and 120%, and thecalibration plots fit to lines with determination coefficientshigher than 0.95. In addition to the in-house quality assuranceprogram, in 2000-10 the Laboratory successfully participat-ed in 20 rounds of proficiency testing schemes organized andrun by the Food Analysis Performance Assessment Scheme(FAPAS; Central Science Laboratory in York), by theEuropean Commission (at the beginning by the University ofUppsala and then by the University of Almeria), and by usingcertified reference material (CRM) (Fig. 6).
CRM was used to verify the accuracy of the procedureand for the quantitative determination of organochlorine
988 Łozowicka B., et al.
Fig. 5. EC and NP chromatograms of blank soil sample from both extraction procedures MSPD and LLE (DB-35 column).
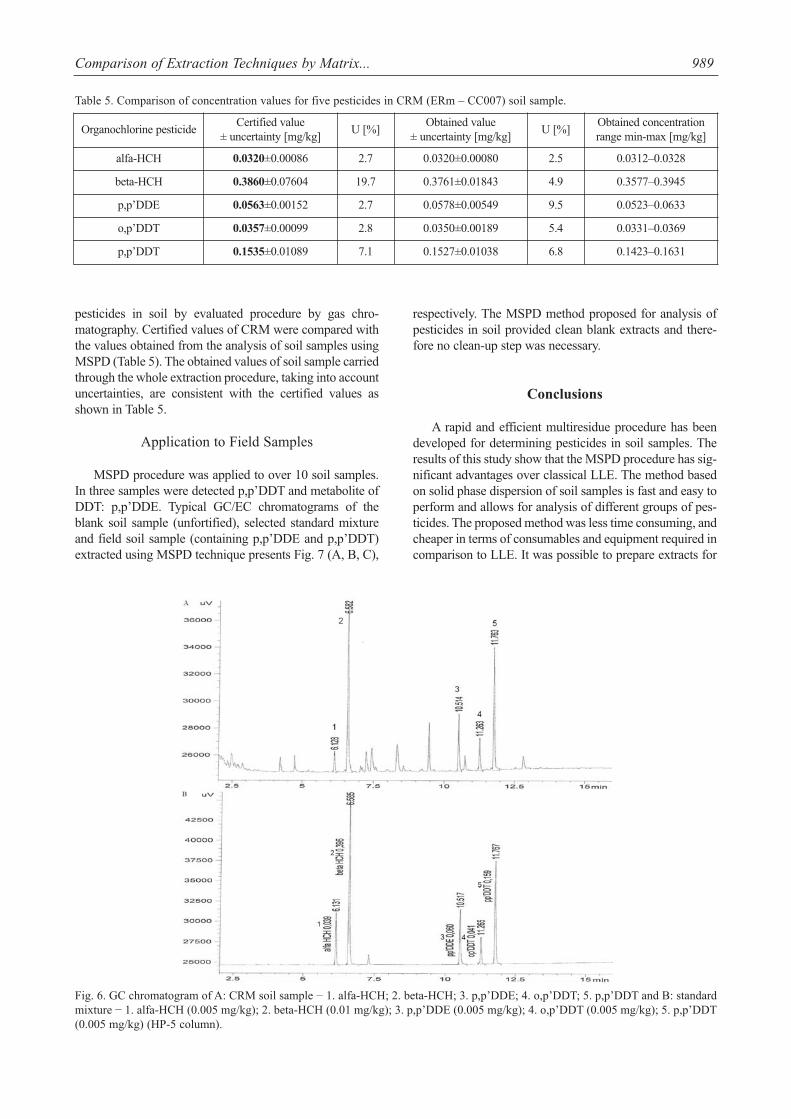
pesticides in soil by evaluated procedure by gas chro-matography. Certified values of CRM were compared withthe values obtained from the analysis of soil samples usingMSPD (Table 5). The obtained values of soil sample carriedthrough the whole extraction procedure, taking into accountuncertainties, are consistent with the certified values asshown in Table 5.
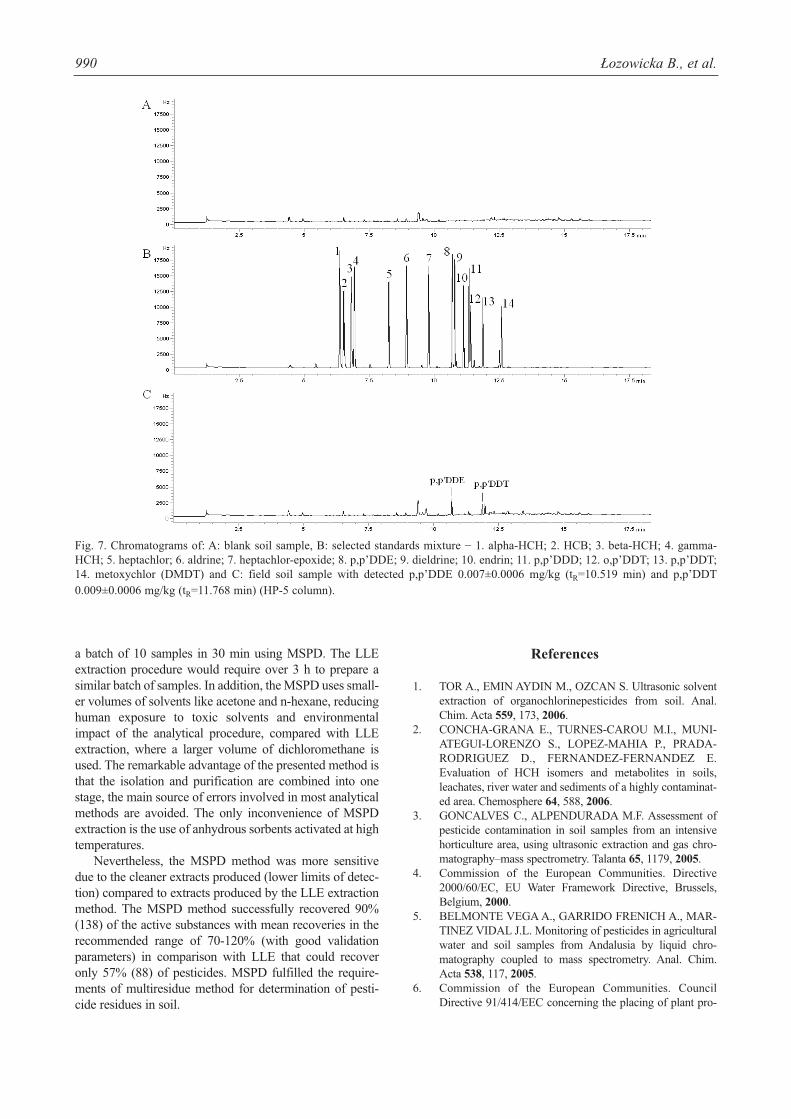
Application to Field Samples
MSPD procedure was applied to over 10 soil samples.In three samples were detected p,p’DDT and metabolite ofDDT: p,p’DDE. Typical GC/EC chromatograms of theblank soil sample (unfortified), selected standard mixtureand field soil sample (containing p,p’DDE and p,p’DDT)extracted using MSPD technique presents Fig. 7 (A, B, C),
respectively. The MSPD method proposed for analysis ofpesticides in soil provided clean blank extracts and there-fore no clean-up step was necessary.
Conclusions
A rapid and efficient multiresidue procedure has beendeveloped for determining pesticides in soil samples. Theresults of this study show that the MSPD procedure has sig-nificant advantages over classical LLE. The method basedon solid phase dispersion of soil samples is fast and easy toperform and allows for analysis of different groups of pes-ticides. The proposed method was less time consuming, andcheaper in terms of consumables and equipment required incomparison to LLE. It was possible to prepare extracts for
Comparison of Extraction Techniques by Matrix... 989
Table 5. Comparison of concentration values for five pesticides in CRM (ERm – CC007) soil sample.
Organochlorine pesticideCertified value
± uncertainty [mg/kg]U [%]
Obtained value ± uncertainty [mg/kg]
U [%]Obtained concentrationrange min-max [mg/kg]
alfa-HCH 0.0320±0.00086 2.7 0.0320±0.00080 2.5 0.0312–0.0328
beta-HCH 0.3860±0.07604 19.7 0.3761±0.01843 4.9 0.3577–0.3945
p,p’DDE 0.0563±0.00152 2.7 0.0578±0.00549 9.5 0.0523–0.0633
o,p’DDT 0.0357±0.00099 2.8 0.0350±0.00189 5.4 0.0331–0.0369
p,p’DDT 0.1535±0.01089 7.1 0.1527±0.01038 6.8 0.1423–0.1631
Fig. 6. GC chromatogram of A: CRM soil sample − 1. alfa-HCH; 2. beta-HCH; 3. p,p’DDE; 4. o,p’DDT; 5. p,p’DDT and B: standardmixture − 1. alfa-HCH (0.005 mg/kg); 2. beta-HCH (0.01 mg/kg); 3. p,p’DDE (0.005 mg/kg); 4. o,p’DDT (0.005 mg/kg); 5. p,p’DDT(0.005 mg/kg) (HP-5 column).
a batch of 10 samples in 30 min using MSPD. The LLEextraction procedure would require over 3 h to prepare asimilar batch of samples. In addition, the MSPD uses small-er volumes of solvents like acetone and n-hexane, reducinghuman exposure to toxic solvents and environmentalimpact of the analytical procedure, compared with LLEextraction, where a larger volume of dichloromethane isused. The remarkable advantage of the presented method isthat the isolation and purification are combined into onestage, the main source of errors involved in most analyticalmethods are avoided. The only inconvenience of MSPDextraction is the use of anhydrous sorbents activated at hightemperatures.
Nevertheless, the MSPD method was more sensitivedue to the cleaner extracts produced (lower limits of detec-tion) compared to extracts produced by the LLE extractionmethod. The MSPD method successfully recovered 90%(138) of the active substances with mean recoveries in therecommended range of 70-120% (with good validationparameters) in comparison with LLE that could recoveronly 57% (88) of pesticides. MSPD fulfilled the require-ments of multiresidue method for determination of pesti-cide residues in soil.
References
1. TOR A., EMIN AYDIN M., OZCAN S. Ultrasonic solventextraction of organochlorinepesticides from soil. Anal.Chim. Acta 559, 173, 2006.
2. CONCHA-GRANA E., TURNES-CAROU M.I., MUNI-ATEGUI-LORENZO S., LOPEZ-MAHIA P., PRADA-RODRIGUEZ D., FERNANDEZ-FERNANDEZ E.Evaluation of HCH isomers and metabolites in soils,leachates, river water and sediments of a highly contaminat-ed area. Chemosphere 64, 588, 2006.
3. GONCALVES C., ALPENDURADA M.F. Assessment ofpesticide contamination in soil samples from an intensivehorticulture area, using ultrasonic extraction and gas chro-matography–mass spectrometry. Talanta 65, 1179, 2005.
4. Commission of the European Communities. Directive2000/60/EC, EU Water Framework Directive, Brussels,Belgium, 2000.
5. BELMONTE VEGA A., GARRIDO FRENICH A., MAR-TINEZ VIDAL J.L. Monitoring of pesticides in agriculturalwater and soil samples from Andalusia by liquid chro-matography coupled to mass spectrometry. Anal. Chim.Acta 538, 117, 2005.
6. Commission of the European Communities. CouncilDirective 91/414/EEC concerning the placing of plant pro-
990 Łozowicka B., et al.
Fig. 7. Chromatograms of: A: blank soil sample, B: selected standards mixture − 1. alpha-HCH; 2. HCB; 3. beta-HCH; 4. gamma-HCH; 5. heptachlor; 6. aldrine; 7. heptachlor-epoxide; 8. p,p’DDE; 9. dieldrine; 10. endrin; 11. p,p’DDD; 12. o,p’DDT; 13. p,p’DDT;14. metoxychlor (DMDT) and C: field soil sample with detected p,p’DDE 0.007±0.0006 mg/kg (tR=10.519 min) and p,p’DDT0.009±0.0006 mg/kg (tR=11.768 min) (HP-5 column).
tection products on the market. Official Journal of theEuropean Communities No.L 230, 1991.
7. SPARKS R. Environmental Soil Chemistry. Elsevier,Amsterdam, 2003.
8. BAVCON M., TREBSE P., ZUPANCIC-KRALJ L.Investigations of the determination and transformations ofdiazinon and malathion under environmental conditionsusing gas chromatography coupled with a flame ionizationdetector. Chemosphere 50, 595, 2003.
9. NAVARRO S., VELA N., GARCIA C., NAVARRO G. Anoverview on the environmental behavior of pesticideresidues in soils. J. Agric. Food Chem. 51, 7359, 2004.
10. NAWAB A., ALEEM A., MALIK A. Determination oforganochlorine pesticides in agricultural soil with specialreference to γ-HCH degradation by Pseudomonas strains.Bioresour. Technol. 88, 41, 2003.
11. GHADIRI H., ROSE C.W. Degradation of endosulfan in aclay soil from cotton farms of western Queensland. J.Environ. Manage. 62, 155, 2001.
12. DOONG R.A., LIAO P.L. Determination of organochlorinepesticides and their metabolites in soil samples using head-space solid-phase microextraction. J. Chromatogr. A 918,177, 2001.
13. HOU L., KEE LEE H. Determination of pesticides in soil byliquid-phase microextraction and gas chromatography-massspectrometry. J. Chromatogr. A 1038, 37, 2004.
14. DĄBROWSKA H., DĄBROWSKI Ł., BIZIUK M., GACAJ., NAMIEŚNIK J. Solid-phase extraction clean-up of soiland sediment extracts for the determination of various typesof pollutants in a single run. J. Chromatogr. A 1003, 29,2003.
15. EL-SAEID M.H., AL-WABEL M.I., ABDEL-NASSER G.,AL-TURKI A.M., AL- GHAMDI A.G. One-step extractionof multiresidue pesticides in soil by microwave-assistedextraction technique. J. App. Sci. 10, 1775, 2010.
16. SANGHI R., KANNAMKUMARATH S.S. Comparison ofextraction methods by Soxhlet, sonicator and microwave inthe screening of pesticide residues from solid matrices. J.Anal. Chem. 59, (11), 1032, 2004.
17. KREUZIG R., KOINECKE A., BAHADIR M. Use ofsupercritical fluid extraction in the analysis of pesticides insoil. J. Biochem. Biophys. Methods 43, 403, 2000.
18. LI Z.Y., ZHANG Z.C., ZHOU Q.L., GAO R.Y., WANGQ.S. Fast and precise determination of phenthoate and itsenantiomeric ratio in soil by the matrix solid-phase disper-sion method and liquid chromatography. J. Chromatogr. A977, 17, 2002.
19. BAVCON M., TREBSE P., ZUPANCIC-KRALJ L.Investigations of the determination and transformations ofdiazinon and malathion under environmental conditionsusing gas chromatography coupled with a flame ionizationdetector. Chemosphere 50, 595, 2003.
20. BÖRJESSON E., TORSTENSSON L. New methods fordetermination of glyphosate and (aminomethyl)phosphonicacid in water and soil. J. Chromatogr. A 886, 207, 2000.
21. BOUAID A., RAMOS L., GONZALEZ M.J.,FERNÁNDEZ P., CÁMARA C. Solid-phase microextrac-tion method for the determination of atrazine and fourorganophosphorus pesticides in soil samples by gas chro-matography. J. Chromatogr. A 939, 13, 2001.
22. BAO M.L., PANTAMI F., BARBIERI K., BURRINI D.,GRIFFINI O. Multi-residue pesticide analysis in soil bysolid-phase disk extraction and gas chromatography/ion-trapmass spectrometry Int. J. Env. Anal. Chem. 64, (4), 233,1996.
23. DOST K., JONES D.C., AUERBACH R., DAVIDSON G.Determination of pesticides in soil samples by supercritical-fluid chromatography-atmospheric pressure chemical ion-ization mass spectrometric detection. Analyst 125, (10),1751, 2000.
24. PAPADAKIS E.N., PAPADOPOULOU-MOURKIDOU E.Determination of metribuzin and major conversion productsin soils by microwave-assisted water extraction followed byliquid chromatographic analysis of extracts. J. Chromatogr.A 962, 9, 2002.
25. ZAMBONIN C.G., PALMISANO F. Determination of tri-azines in soil leachates by solid-phase microextraction cou-pled to gas chromatography-mass spectrometry. J.Chromatogr. A 874, 247, 2000.
26. HOGENDOORN E.A., HULS R., DIJKMAN E.,HOOGERBRUGGE R. Microwave assisted solvent extrac-tion and coupled-column reversed-phase liquid chromatogra-phy with UV detection Use of an analytical restricted-access-medium column for the efficient multi-residue analysis ofacidic pesticides in soils J. Chromatogr. A 938, 23, 2001.
27. BARCHAŃSKA H., BARANOWSKA I. Procedures foranalysis of atrazine and simazine in environmental matrices.Rev. Env. Cont. Toxicol. 200, 53, 2009.
28. STIPICEVIC S., FINGLER S., ZUPANCIC-KRALJ L.,DREVENKAR V. Comparison of gas and high performanceliquid chromatography with selective detection for determi-nation of triazine herbicides and their degradation productsextracted ultrasonically from soil. J. Sep. Sci. 26, 1237,2003.
29. VRYZAS Z., PAPADOPOULOU-MOURKIDOU E.Determination of triazine and chloroacetanilide herbicidesin soils by microwave-assisted extraction (MAE) coupled togas chromatographic analysis with either GC-NP orGC−MS. J. Agric. Food Chem. 50, 5026, 2002.
30. DAGNAC T., JEANNOT R., MOUVET C., BARAN N.Determination of oxanilic and sulfonic acid metabolites ofacetochlor in soils by liquid chromatography-electrosprayionization mass spectrometry. J. Chromatogr. A 957, 69, 2002.
31. HU J.-Y., ZHEN Z.-H., DENG Z.-B. Simultaneous determi-nation of acetochlor and propisochlor residues in corn andsoil by solid phase extraction and gas chromatography withelectron capture detection. Bull Environ. Contim. Toxicol.86, 95, 2011.
32. POZO O., PITARCH E., SANCHO J.V., HERNANDEZ F.Determination of the herbicide 4-chloro-2-methylphenoxy-acetic acid and its main metabolite, 4-chloro-2-methylphe-nol in water and soil by liquid chromatography-electrospraytandem mass spectrometry. J. Chromatogr. A 923, 75, 2001.
33. PATSIAS J., PAPADAKIS E.N., PAPADOPOULOU-MOURKIDOU E. Analysis of phenoxyalkanoic acid herbi-cides and their phenolic conversion products in soil bymicrowave assisted solvent extraction and subsequentanalysis of extracts by on-line solid-phase extraction-liquidchromatography. J. Chromatogr. A 959, 153, 2002.
34. LUQUE-GARCÍA J.L., DE CASTRO M.D.L. Couplingcontinuous subcritical water extraction, filtration, precon-centration, chromatographic separation and UV detectionfor the determination of chlorophenoxy acid herbicides insoils. J. Chromatogr. A 959, 25, 2002.
35. MARCHESE S., PERRET D., GENTILI A., CURINI R.,MARINO A. Development of a method based on accelerat-ed solvent extraction and liquid chromatography/mass spec-trometry for determination of arylphenoxypropionic herbi-cides in soil. Rapid Commun. Mass Spectrom. 15, 393,2001.
Comparison of Extraction Techniques by Matrix... 991
36. MOLINS C., HOGENDOORN E.A., DIJKMAN E.,HEUSINKVELD H.A.G., BAUMANN R.A.Determination of linuron and related compounds in soil bymicrowave-assisted solvent extraction and reversed-phaseliquid chromatography with UV detection. J. Chromatogr. A869, 487, 2000.
37. CABALLO-LÓPEZ A., LUQUE DE CASTRO M.D.Continuous ultrasound-assisted extraction coupled to on linefiltration-solid-phase extraction-column liquid chromatogra-phy– post column derivatisation-fluorescence detection forthe determination of N-methylcarbamates in soil and food. J.Chromatogr. A 998, 51, 2003.
38. SUN L., LEE H.K. Optimization of microwave-assistedextraction and supercritical fluid extraction of carbamatepesticides in soil by experimental design methodology. J.Chromatogr. A 1014, 165, 2003.
39. PAIGA P., MORAIS S., CORREIA M., ALVES A.,DELERUE-MATOS C. A multiresidue method for theanalysis of carbamate and urea pesticides from soils bymicrowave-assisted extraction and liquid chromatographywith photodiode array detection. Anal. Lett. 41, (10), 1751,2008.
40. LERCH R.N., FERRER I., THURMAN E.M., ZABLO-TOWICZ R.M. Identification of trifluralin metabolites insoil using ion-trap LC/MS/MS. Am. Chem. Soc. 17, 291,2003.
41. SANCHEZ-BRUNETE C., MIGUEL E., TADEO J.L.Multiresidue analysis of fungicides in soil by sonication-assisted extraction in small columns and gas chromatogra-phy. J. Chromatogr. A 976, 319, 2002.
42. SANCHEZ-BRUNETE C., ALBERO B., TADEO J.L.Multiresidue determination of pesticides in soil by gas chro-matography-mass spectrometry detection. J. Agric. FoodChem. 52, (6), 1445, 2004.
43. BELMONTE VEGA A., GARRIDO FRENICH A., MAR-TINEZ VIDAL J.L. Monitoring of pesticides in agriculturalwater and soil samples from Andalusia by liquid chro-matography coupled to mass spectrometry. Anal. Chim.Acta 538, 117, 2005.
44. FENOLL J., HELLÍN P., MARÍN C., MARTÍNEZ C.M.,FLORES P. Multiresidue analysis of pesticides in soil by gaschromatography with nitrogen-phosphorus detection andgas chromatography mass spectrometry. J. Agric. FoodChem. 53, (20), 7661, 2005.
45. FUENTES E., BAEZ M.E., REYES D. Microwave-assistedextraction through an aqueous medium and simultaneouscleanup by partition on hexane for determining pesticides inagricultural soils by gas chromatography: A critical study.Anal. Chim. Acta 578, 122, 2006.
46. LESUER C., GARTNER M., MENTLEM A., FUER-HACKER M. Comparison of four extraction methods forthe analysis of 24 pesticides in soil samples with gas chro-matography-mass spectrometry and liquid chromatography-ion trap-mass spectrometry. Talanta 75, 284, 2008.
47. REDONDO M. J., RUIZ M. J., BOLUDA R., FONT G.Determination of pesticides in soil samples by solid phaseextraction disks. Chromatographia 36, 187, 1993.
48. FENOLL J., HELLÍN P., MARTÍNEZ C.M., FLORES P.Multiresidue analysis of pesticides in soil by high-perfor-mance liquid chromatography with tandem mass spectrom-etry. J. AOAC Int. 92, (5), 1566, 2009.
49. BABIC S., PETROVIC M., KASTELAN-MACAN M.Ultrasonic solvent extraction of pesticides from soil. JChromatogr. A 823, 3, 1998.
50. BAKER S.A. Applications of matrix solid-phase dispersionin food analysis, J. Chromatogr. A 880, 63, 2000.
51. BLANCO E., CASAIS M.C., MEJUTO M.C., CELA R.Approaches for the simultaneous extraction of tetrabromo-bisphenol A, tetrachlorobisphenol A, and related phenoliccompounds from sewage sludge and sediment samplesbased on matrix solid-phase dispersion. Anal. Chem. 78,2772, 2006.
52. KRISTENSON E.M., BRINKMAN U.A.Th., RAMOS L.Recent advances in matrix solidphase dispersion. TrendsAnal. Chem. 25, 96, 2006.
53. KADENCZKI L., ARPAD Z., GARDI I., AMBRUS A.,GYORFI, L., REESE, G. Column extraction of residues ofseveral pesticides from fruits and vegetables: A simple mul-tiresidue analysis method. J. AOAC Int. 75, 53, 1992.
54. TSE H., COMBA M., ALAEE M. Method for the determi-nation of organophosphate insecticides in water, sedimentand biota. Chemosphere, 54, 41, 2004.
55. MORELLO M., PREVIALE L., QUAGLINO P.J. Gaschromatographic system equipped with a mass detector anda selective nitrogen-phosphorous detector operating simulta-neously in the analysis of pesticide residues. J. Chromatogr.A, 740, 263, 1996.
56. EURACHEM GUIDE. The fitness for purpose of analyticalmethods. A laboratory guide to method validation and relat-ed topics, December 1998.
57. RASHID A, NAWAZ S, BARKER H, AHMAD I,ASHRAF M. Development of a simple extraction and clean-up procedure for determination of organochlorine pesticidesin soil using gas chromatography-tandem mass spectrome-try. J. Chromatogr. A 1217, (17), 2933, 2010.
58. GUIDE TO THE EXPRESSION OF UNCERTAINTY INMEASUREMENT (GUM), International Organization forStandardization, Geneva, 1993.
992 Łozowicka B., et al.