Embed Size (px)
Citation preview
Copyright ©2010 by Pearson Education, Inc.Upper Saddle River, New Jersey 07458
All rights reserved.
Statistics and Data Analysis for Nursing Research, Second EditionDenise F. Polit
Statistics and Data Analysisfor Nursing Research
Second Edition
CHAPTER
Analysis of Variance
7
Copyright ©2010 by Pearson Education, Inc.Upper Saddle River, New Jersey 07458
All rights reserved.
Statistics and Data Analysis for Nursing Research, Second EditionDenise F. Polit
Analysis of Variance
• Often abbreviated as ANOVA
• Used to compare group means when t-tests are not appropriate (e.g., when three or more groups are being compared)
Copyright ©2010 by Pearson Education, Inc.Upper Saddle River, New Jersey 07458
All rights reserved.
Statistics and Data Analysis for Nursing Research, Second EditionDenise F. Polit
ANOVA: Measurement Issues
• Dependent variable:– Interval or ratio level (e.g., heart rate, scores
on self-esteem scale)
• Independent variable:– Nominal level (e.g., three racial/ethnic
groups) – Ordinal level with small number of
categories (normal weight, overweight, obese)
Copyright ©2010 by Pearson Education, Inc.Upper Saddle River, New Jersey 07458
All rights reserved.
Statistics and Data Analysis for Nursing Research, Second EditionDenise F. Polit
ANOVA Hypotheses
• The null hypothesis: Group means are equal
• For example:– H0: µ1 = µ2 = µ3 = µ4
• The alternative hypothesis: At least some of the group means are not equal:– H1: Not H0
Copyright ©2010 by Pearson Education, Inc.Upper Saddle River, New Jersey 07458
All rights reserved.
Statistics and Data Analysis for Nursing Research, Second EditionDenise F. Polit
Assumptions for ANOVA
• Basic assumptions:– Random sampling from the populations
– Dependent variable is normally distributed in the populations
– Variances in the populations are equal Can be tested with Levene’s statistic
Copyright ©2010 by Pearson Education, Inc.Upper Saddle River, New Jersey 07458
All rights reserved.
Statistics and Data Analysis for Nursing Research, Second EditionDenise F. Polit
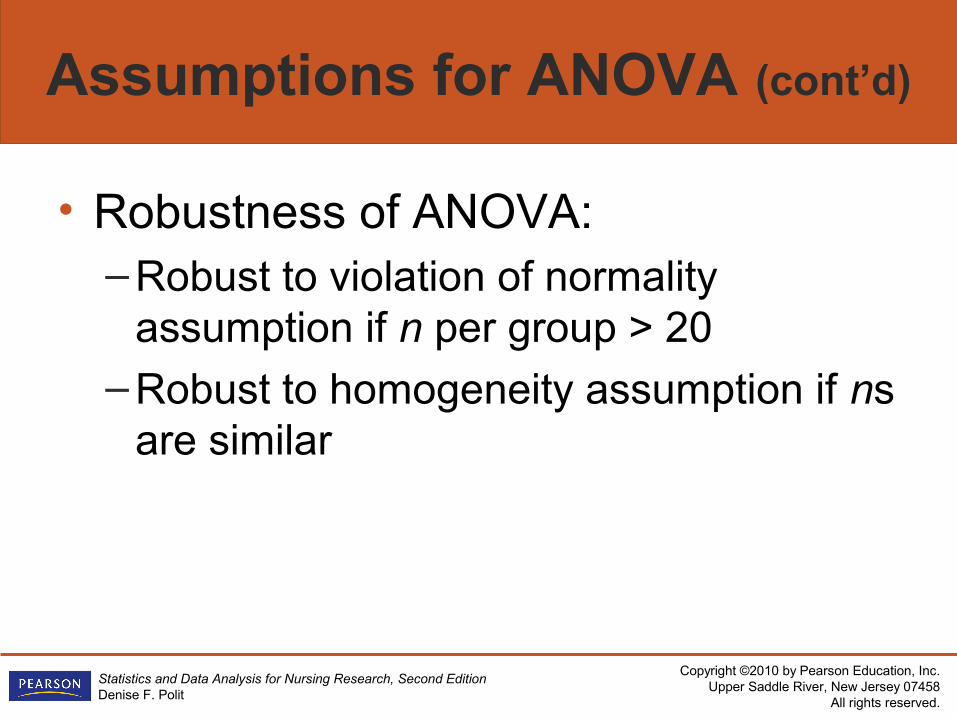
Assumptions for ANOVA (cont’d)
• Robustness of ANOVA:– Robust to violation of normality
assumption if n per group > 20
– Robust to homogeneity assumption if ns are similar
Copyright ©2010 by Pearson Education, Inc.Upper Saddle River, New Jersey 07458
All rights reserved.
Statistics and Data Analysis for Nursing Research, Second EditionDenise F. Polit
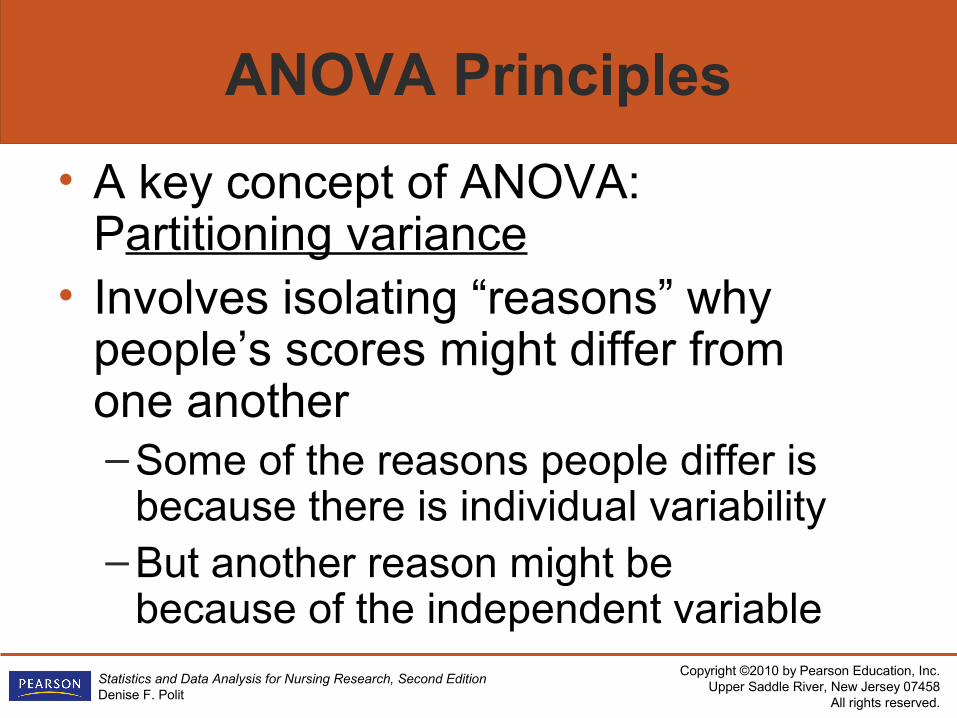
ANOVA Principles
• A key concept of ANOVA: Partitioning variance
• Involves isolating “reasons” why people’s scores might differ from one another– Some of the reasons people differ is
because there is individual variability– But another reason might be
because of the independent variable
Copyright ©2010 by Pearson Education, Inc.Upper Saddle River, New Jersey 07458
All rights reserved.
Statistics and Data Analysis for Nursing Research, Second EditionDenise F. Polit
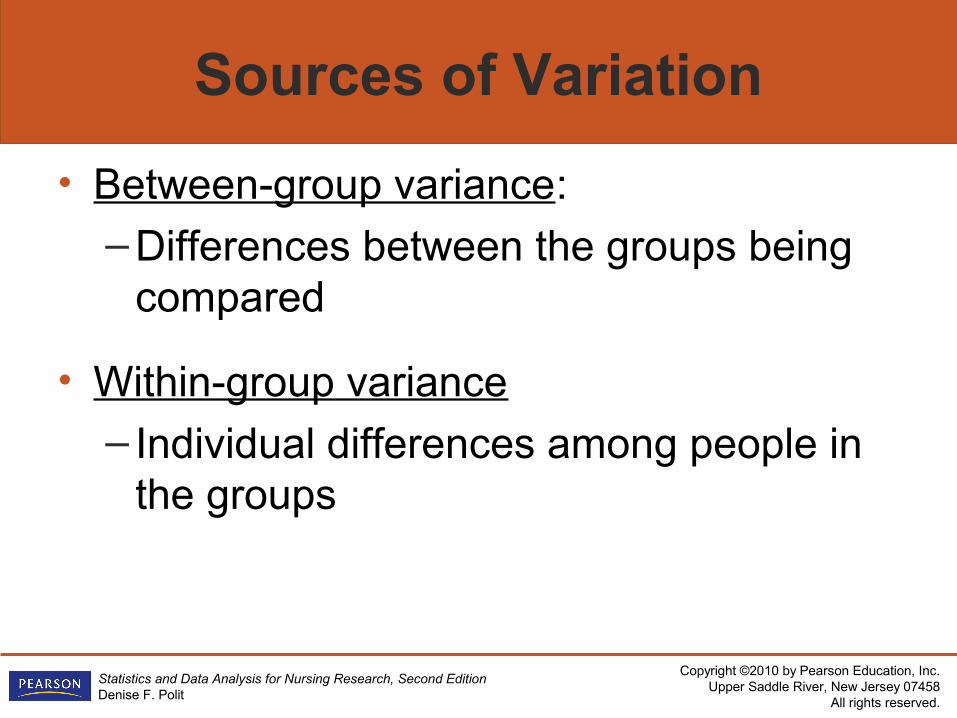
Sources of Variation
• Between-group variance:
– Differences between the groups being compared
• Within-group variance
– Individual differences among people in the groups
Copyright ©2010 by Pearson Education, Inc.Upper Saddle River, New Jersey 07458
All rights reserved.
Statistics and Data Analysis for Nursing Research, Second EditionDenise F. Polit
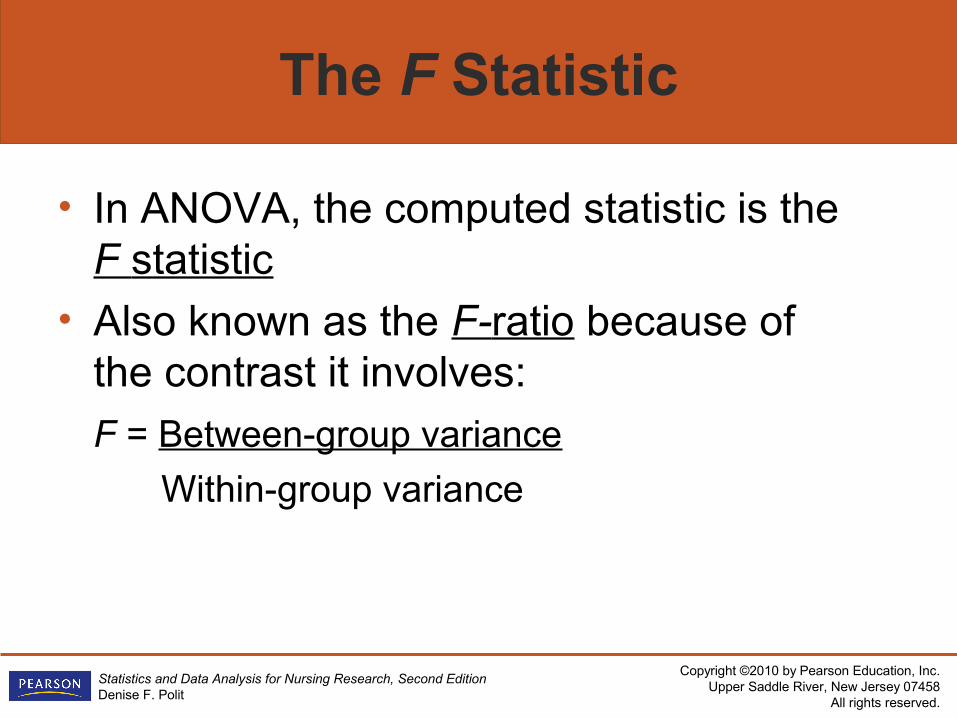
The F Statistic
• In ANOVA, the computed statistic is the F statistic
• Also known as the F-ratio because of the contrast it involves:
F = Between-group variance
Within-group variance
Copyright ©2010 by Pearson Education, Inc.Upper Saddle River, New Jersey 07458
All rights reserved.
Statistics and Data Analysis for Nursing Research, Second EditionDenise F. Polit
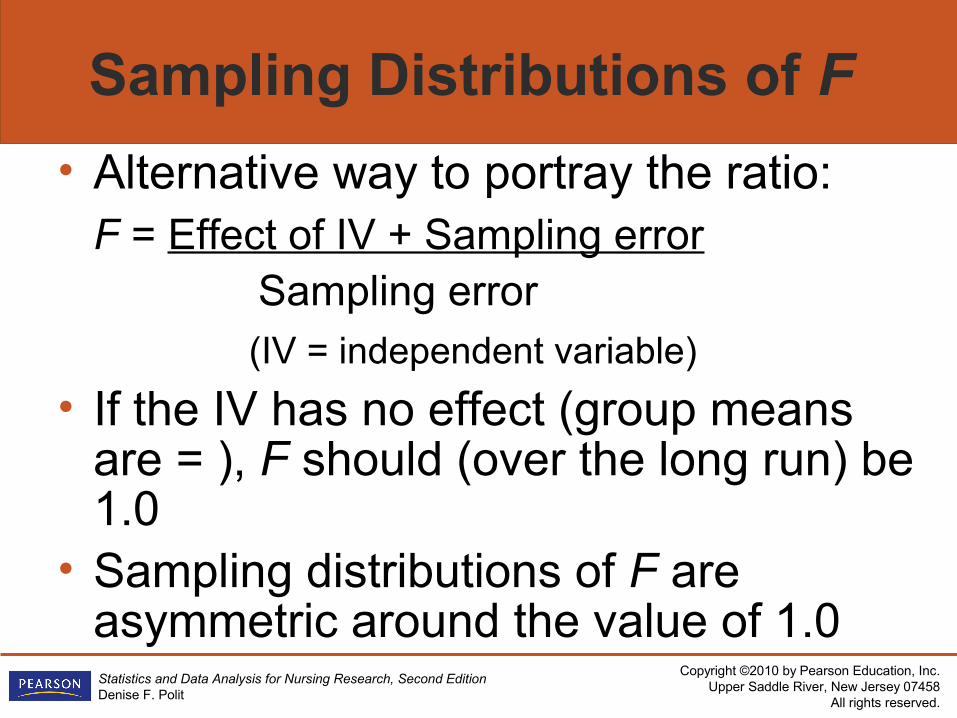
Sampling Distributions of F
• Alternative way to portray the ratio: F = Effect of IV + Sampling error
Sampling error(IV = independent variable)
• If the IV has no effect (group means are = ), F should (over the long run) be 1.0
• Sampling distributions of F are asymmetric around the value of 1.0
Copyright ©2010 by Pearson Education, Inc.Upper Saddle River, New Jersey 07458
All rights reserved.
Statistics and Data Analysis for Nursing Research, Second EditionDenise F. Polit
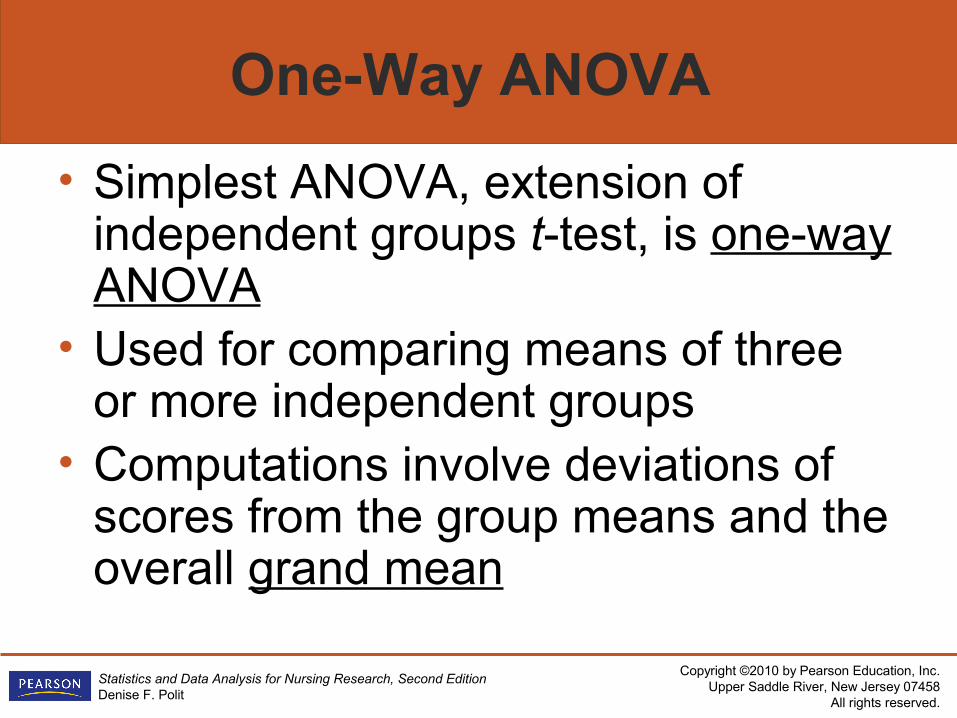
One-Way ANOVA
• Simplest ANOVA, extension of independent groups t-test, is one-way ANOVA
• Used for comparing means of three or more independent groups
• Computations involve deviations of scores from the group means and the overall grand mean
Copyright ©2010 by Pearson Education, Inc.Upper Saddle River, New Jersey 07458
All rights reserved.
Statistics and Data Analysis for Nursing Research, Second EditionDenise F. Polit
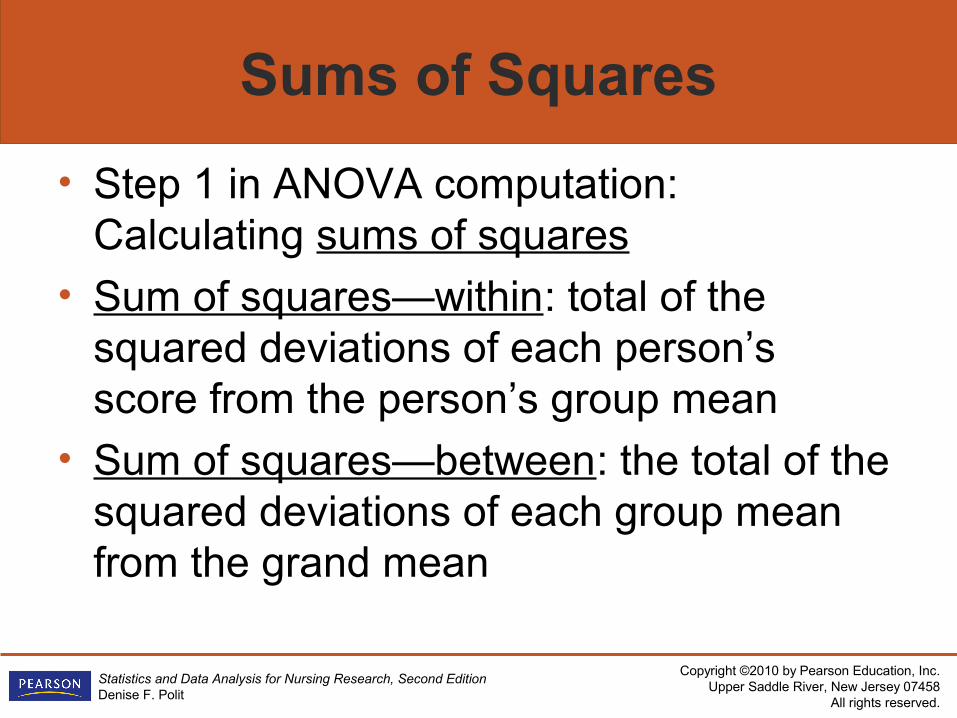
Sums of Squares
• Step 1 in ANOVA computation: Calculating sums of squares
• Sum of squares—within: total of the squared deviations of each person’s score from the person’s group mean
• Sum of squares—between: the total of the squared deviations of each group mean from the grand mean
Copyright ©2010 by Pearson Education, Inc.Upper Saddle River, New Jersey 07458
All rights reserved.
Statistics and Data Analysis for Nursing Research, Second EditionDenise F. Polit
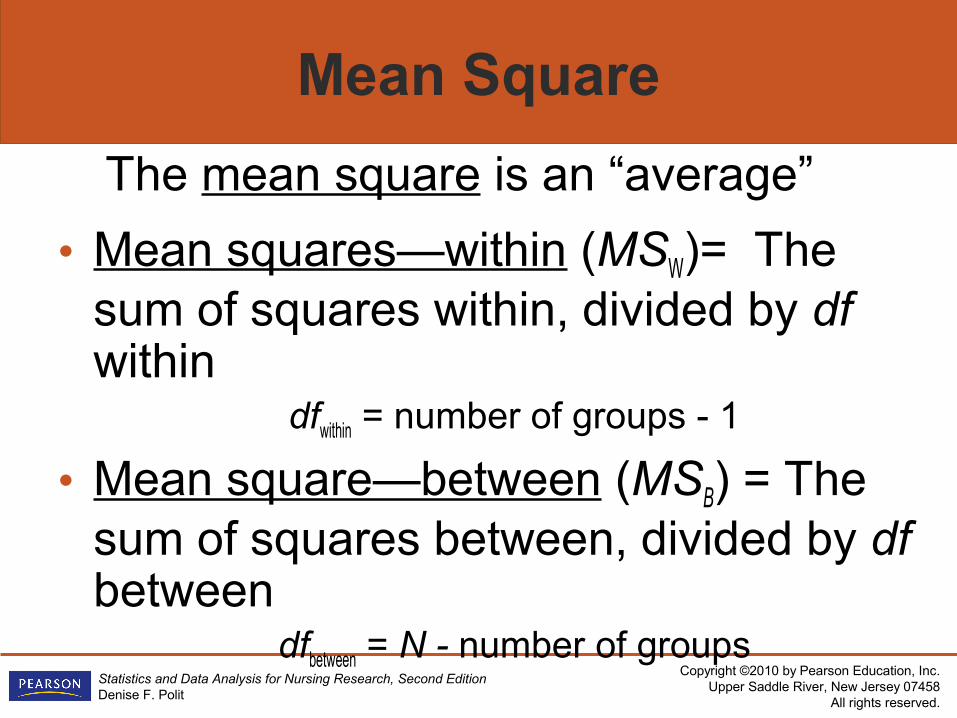
Mean Square
The mean square is an “average”
• Mean squares—within (MSW)= The sum of squares within, divided by df within
dfwithin = number of groups - 1
• Mean square—between (MSB) = The sum of squares between, divided by df between
dfbetween = N - number of groups
Copyright ©2010 by Pearson Education, Inc.Upper Saddle River, New Jersey 07458
All rights reserved.
Statistics and Data Analysis for Nursing Research, Second EditionDenise F. Polit
Testing F
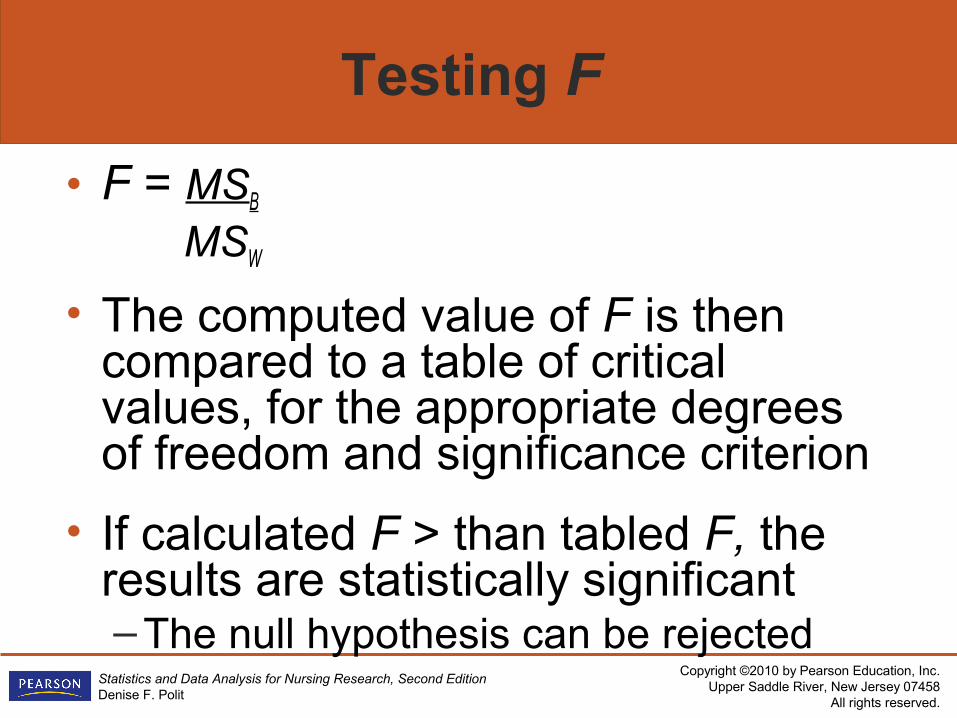
• F = MSB
MSW
• The computed value of F is then compared to a table of critical values, for the appropriate degrees of freedom and significance criterion
• If calculated F > than tabled F, the results are statistically significant– The null hypothesis can be rejected
Copyright ©2010 by Pearson Education, Inc.Upper Saddle River, New Jersey 07458
All rights reserved.
Statistics and Data Analysis for Nursing Research, Second EditionDenise F. Polit
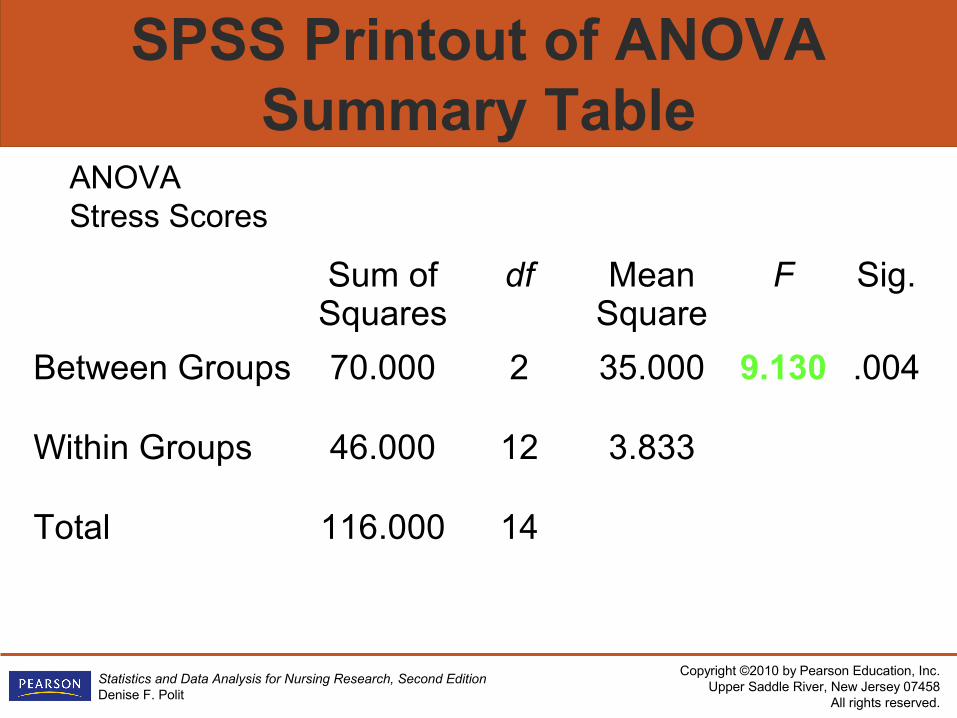
SPSS Printout of ANOVA Summary Table
ANOVAStress Scores
Sum of Squares
df Mean Square
F Sig.
Between Groups 70.000 2 35.000 9.130 .004
Within Groups 46.000 12 3.833
Total 116.000 14
Copyright ©2010 by Pearson Education, Inc.Upper Saddle River, New Jersey 07458
All rights reserved.
Statistics and Data Analysis for Nursing Research, Second EditionDenise F. Polit
Multifactor ANOVA
• ANOVA can be extended to situations in which there are multiple independent variables (IVs): Multifactor ANOVA
• Most typical: Two-way ANOVA, which involves two distinct IVs – In two-way ANOVA, each IV is
sometimes called a factor
Copyright ©2010 by Pearson Education, Inc.Upper Saddle River, New Jersey 07458
All rights reserved.
Statistics and Data Analysis for Nursing Research, Second EditionDenise F. Polit
Two-Way ANOVA
• Designs for two-way ANOVA:– Factorial experiment: Randomly assigning
people to combinations of two treatments– Randomized block design: Randomly
assigning people differing on a trait (e.g., males and females) to different treatments, separately
– Nonexperimental exploration of effect of two IVs on a dependent variable
Copyright ©2010 by Pearson Education, Inc.Upper Saddle River, New Jersey 07458
All rights reserved.
Statistics and Data Analysis for Nursing Research, Second EditionDenise F. Polit
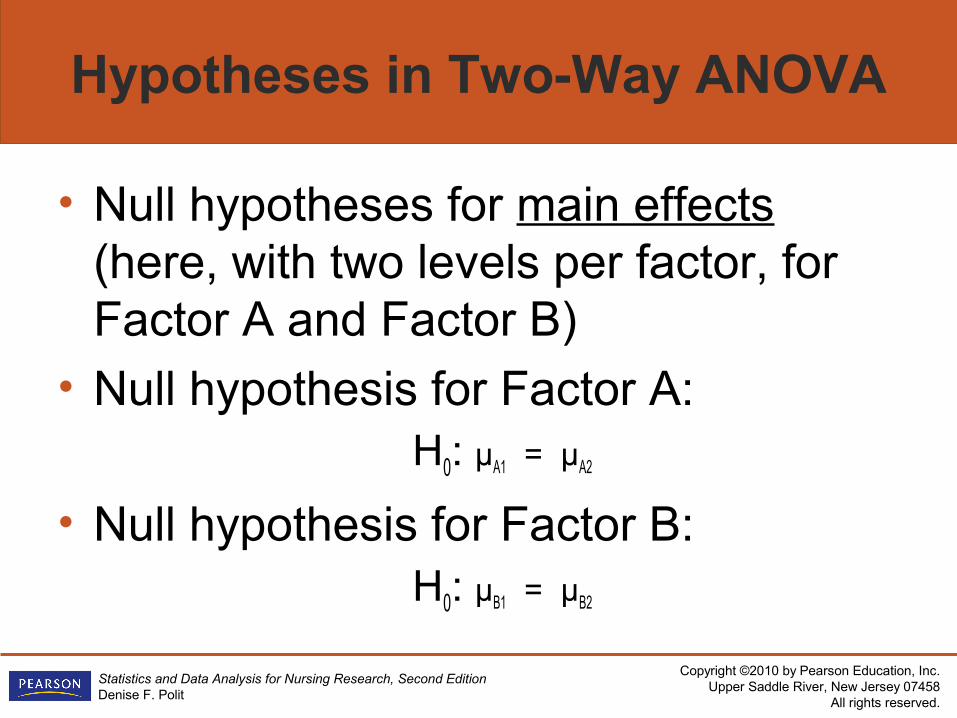
Hypotheses in Two-Way ANOVA
• Null hypotheses for main effects (here, with two levels per factor, for Factor A and Factor B)
• Null hypothesis for Factor A:H0: µA1 = µA2
• Null hypothesis for Factor B:H0: µB1 = µB2
Copyright ©2010 by Pearson Education, Inc.Upper Saddle River, New Jersey 07458
All rights reserved.
Statistics and Data Analysis for Nursing Research, Second EditionDenise F. Polit
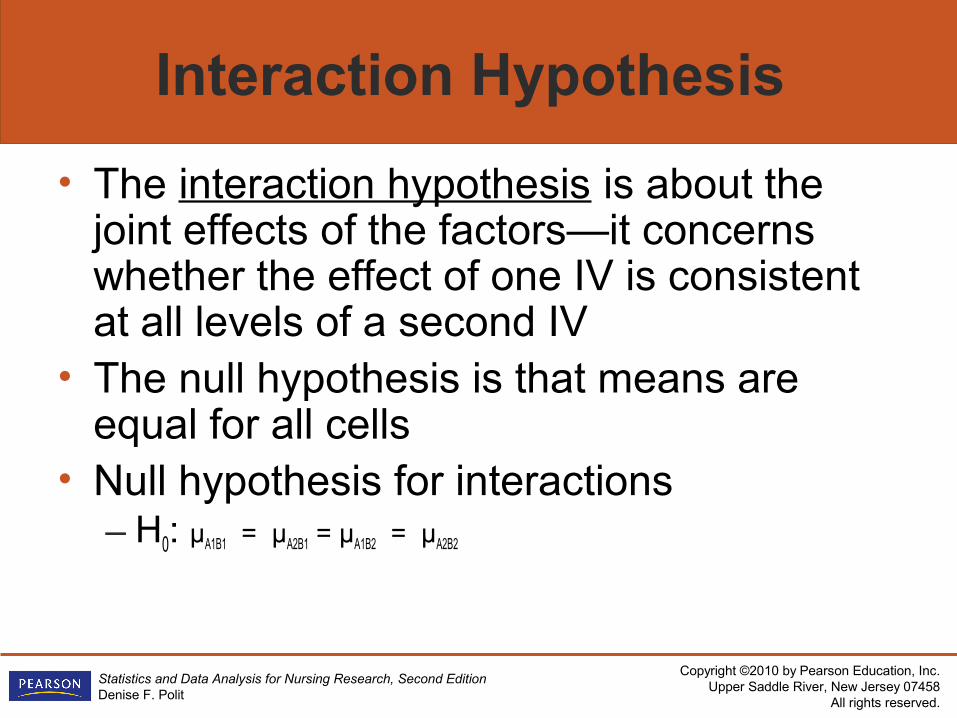
Interaction Hypothesis
• The interaction hypothesis is about the joint effects of the factors—it concerns whether the effect of one IV is consistent at all levels of a second IV
• The null hypothesis is that means are equal for all cells
• Null hypothesis for interactions– H0: µA1B1 = µA2B1 = µA1B2 = µA2B2
Copyright ©2010 by Pearson Education, Inc.Upper Saddle River, New Jersey 07458
All rights reserved.
Statistics and Data Analysis for Nursing Research, Second EditionDenise F. Polit
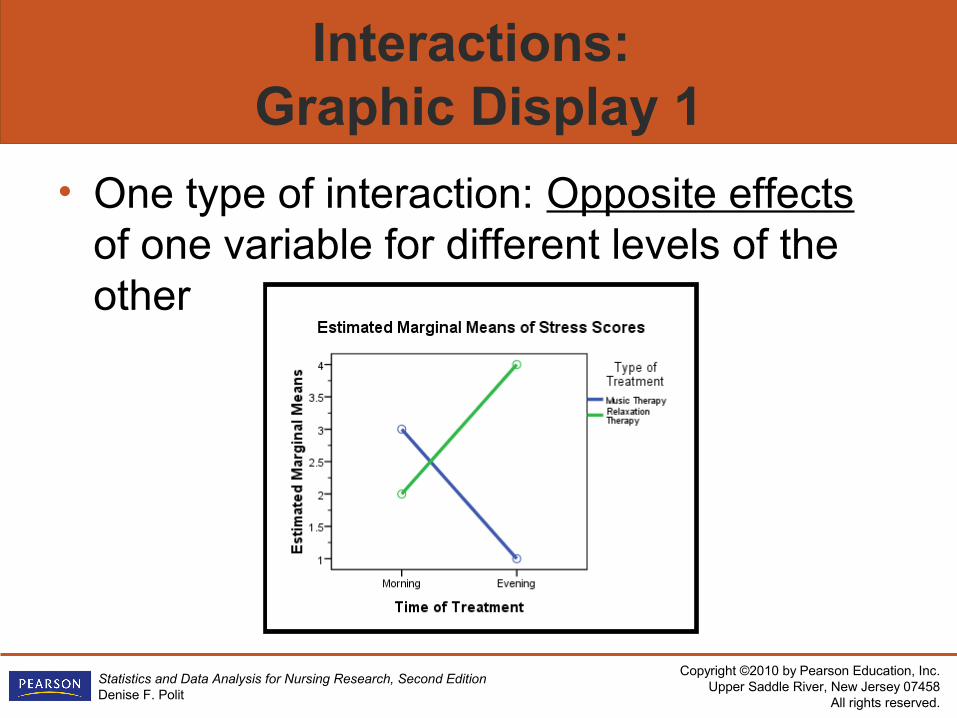
Interactions: Graphic Display 1
• One type of interaction: Opposite effects of one variable for different levels of the other
Copyright ©2010 by Pearson Education, Inc.Upper Saddle River, New Jersey 07458
All rights reserved.
Statistics and Data Analysis for Nursing Research, Second EditionDenise F. Polit
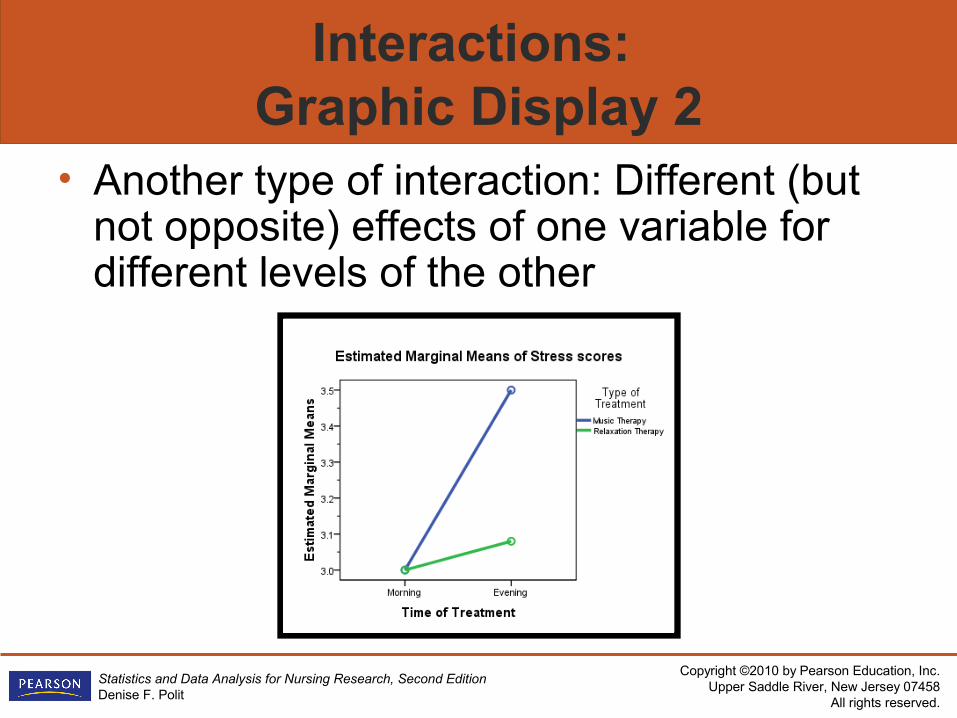
Interactions: Graphic Display 2
• Another type of interaction: Different (but not opposite) effects of one variable for different levels of the other
Copyright ©2010 by Pearson Education, Inc.Upper Saddle River, New Jersey 07458
All rights reserved.
Statistics and Data Analysis for Nursing Research, Second EditionDenise F. Polit
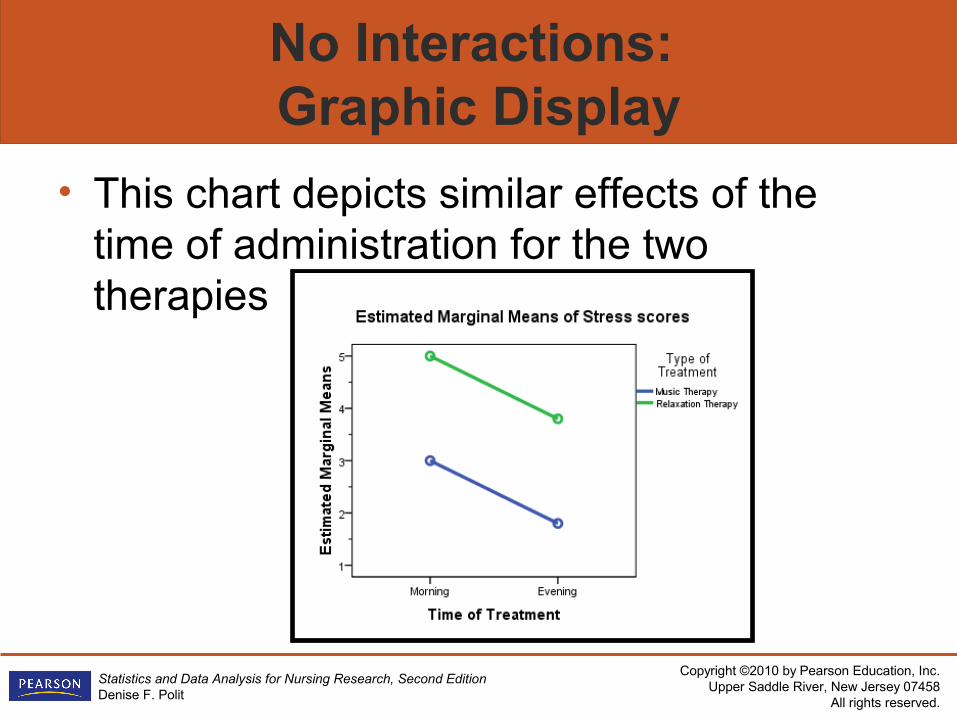
No Interactions: Graphic Display
• This chart depicts similar effects of the time of administration for the two therapies
Copyright ©2010 by Pearson Education, Inc.Upper Saddle River, New Jersey 07458
All rights reserved.
Statistics and Data Analysis for Nursing Research, Second EditionDenise F. Polit
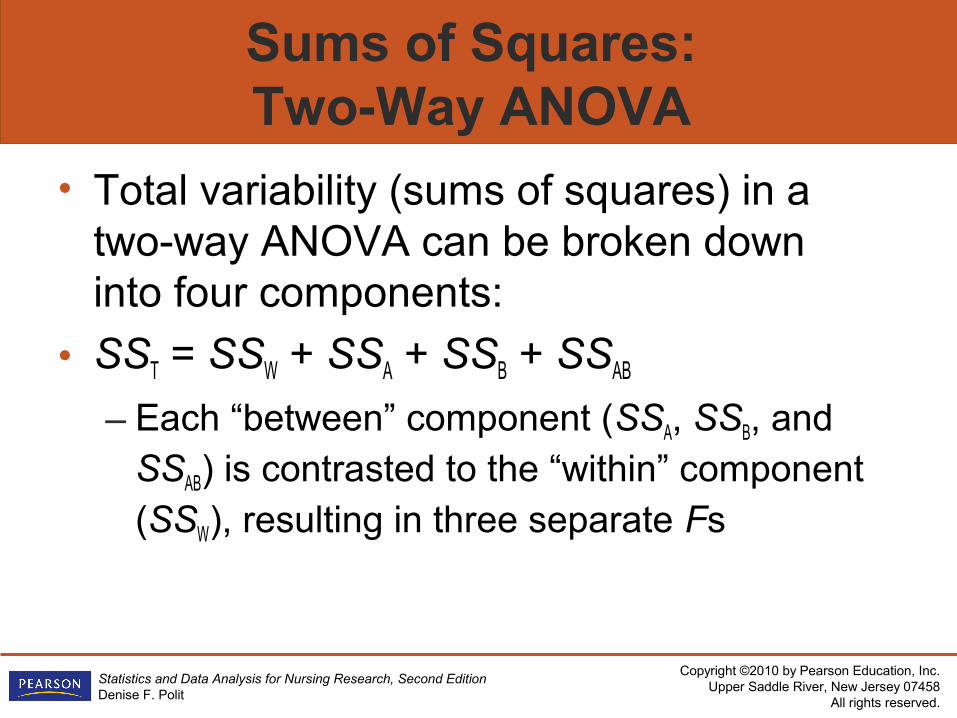
Sums of Squares: Two-Way ANOVA
• Total variability (sums of squares) in a two-way ANOVA can be broken down into four components:
• SST = SSW + SSA + SSB + SSAB
– Each “between” component (SSA, SSB, and SSAB) is contrasted to the “within” component (SSW), resulting in three separate Fs
Copyright ©2010 by Pearson Education, Inc.Upper Saddle River, New Jersey 07458
All rights reserved.
Statistics and Data Analysis for Nursing Research, Second EditionDenise F. Polit
Repeated Measures ANOVA
• One-way repeated measures ANOVA (RM-ANOVA) is an extension of the dependent groups t-test to three or more measurements
• Measurements are taken multiple times for the same people
• IV is either different treatments, or different time periods
Copyright ©2010 by Pearson Education, Inc.Upper Saddle River, New Jersey 07458
All rights reserved.
Statistics and Data Analysis for Nursing Research, Second EditionDenise F. Polit
Designs for RM-ANOVA
• One-way RM-ANOVA involves a within-subjects design:– Crossover design: People assigned to
different treatments in random order, serve as their own controls
– One-group pretest-posttest intervention design, with multiple posttests
– Nonexperimental: A group of interest is followed up at multiple points to assess the effects of time passing (here, time is the IV)
Copyright ©2010 by Pearson Education, Inc.Upper Saddle River, New Jersey 07458
All rights reserved.
Statistics and Data Analysis for Nursing Research, Second EditionDenise F. Polit
Variability in One-Way RM-ANOVA
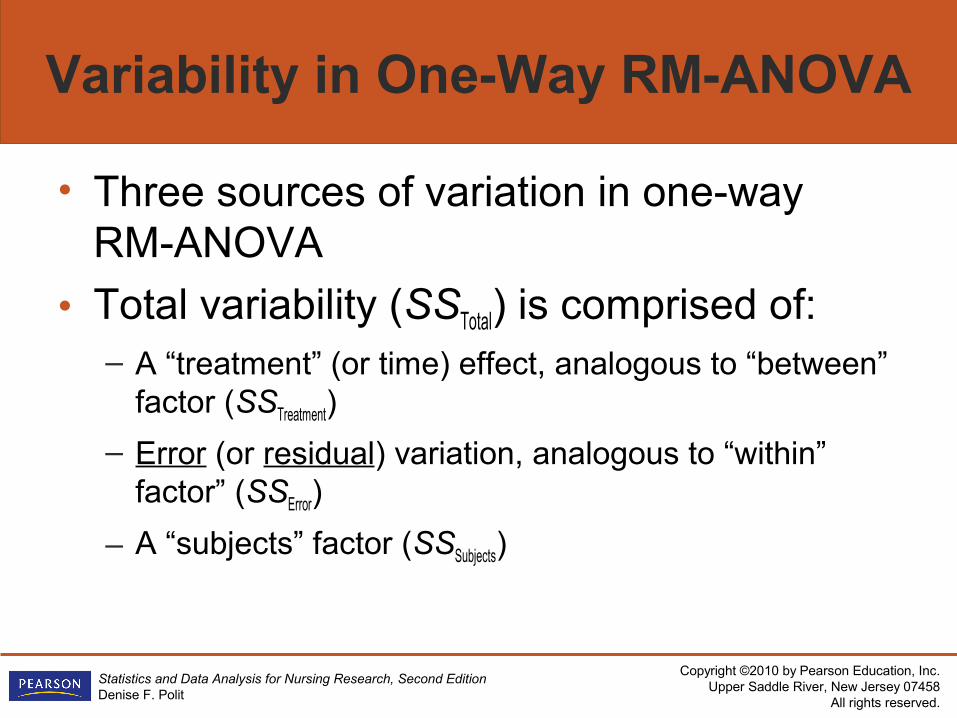
• Three sources of variation in one-way RM-ANOVA
• Total variability (SSTotal) is comprised of:– A “treatment” (or time) effect, analogous to “between”
factor (SSTreatment)
– Error (or residual) variation, analogous to “within” factor” (SSError)
– A “subjects” factor (SSSubjects)
Copyright ©2010 by Pearson Education, Inc.Upper Saddle River, New Jersey 07458
All rights reserved.
Statistics and Data Analysis for Nursing Research, Second EditionDenise F. Polit
Sum of Squares—Subjects
• Variability for subjects (SSSubjects) reflects individual differences, the tendency of people to be different from each other, but consistent across different conditions or at different times
• Individual differences (subject variability) can be captured because the same people are measured multiple times
Copyright ©2010 by Pearson Education, Inc.Upper Saddle River, New Jersey 07458
All rights reserved.
Statistics and Data Analysis for Nursing Research, Second EditionDenise F. Polit
Sum of Squares—Subjects (cont’d)
• Subject variability (SSSubjects) can be removed from the “error” term for calculating the F statistic
• The result is a more sensitive test of the effect of the independent variable, relative to a between-subjects design
Copyright ©2010 by Pearson Education, Inc.Upper Saddle River, New Jersey 07458
All rights reserved.
Statistics and Data Analysis for Nursing Research, Second EditionDenise F. Polit
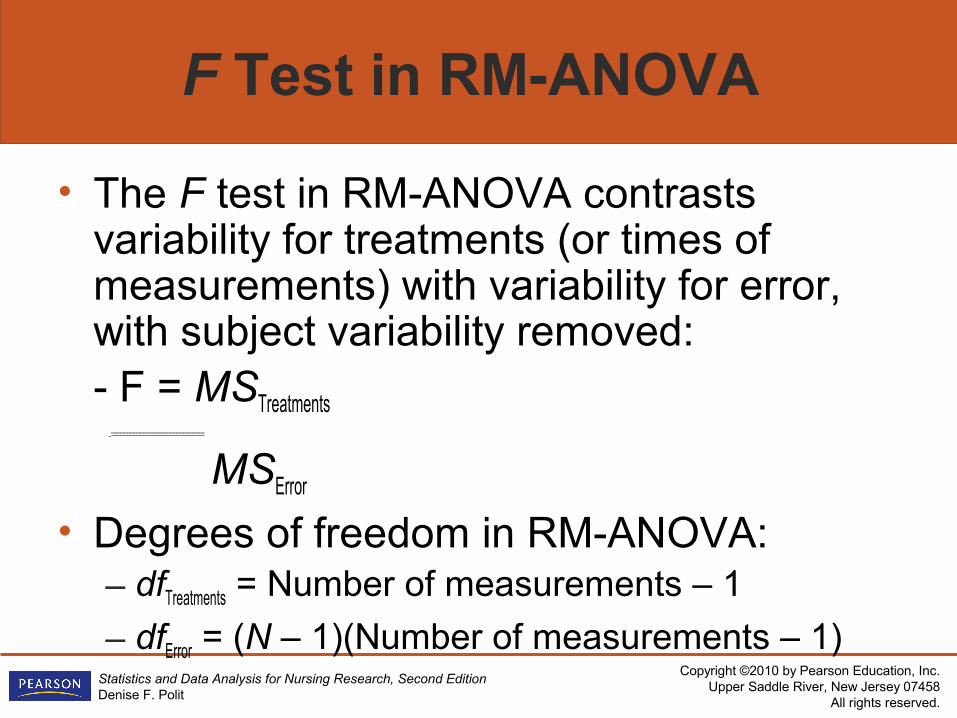
F Test in RM-ANOVA
• The F test in RM-ANOVA contrasts variability for treatments (or times of measurements) with variability for error, with subject variability removed:- F = MSTreatments
_-----------------------------------------------------------------
MSError
• Degrees of freedom in RM-ANOVA:– dfTreatments = Number of measurements – 1
– dfError = (N – 1)(Number of measurements – 1)
Copyright ©2010 by Pearson Education, Inc.Upper Saddle River, New Jersey 07458
All rights reserved.
Statistics and Data Analysis for Nursing Research, Second EditionDenise F. Polit
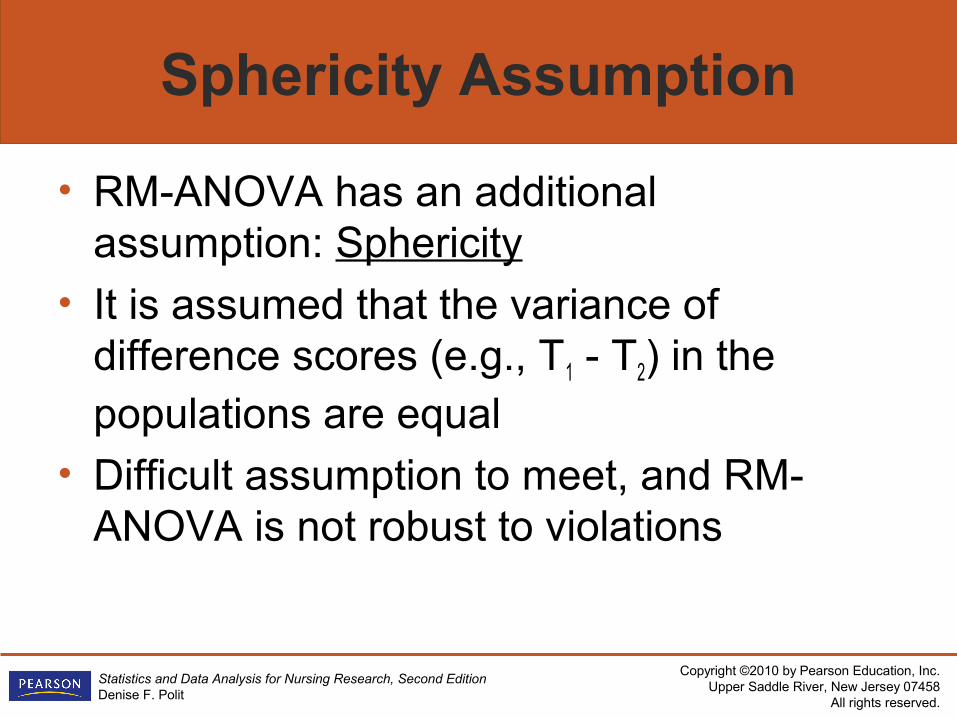
Sphericity Assumption
• RM-ANOVA has an additional assumption: Sphericity
• It is assumed that the variance of difference scores (e.g., T1 - T2) in the populations are equal
• Difficult assumption to meet, and RM-ANOVA is not robust to violations
Copyright ©2010 by Pearson Education, Inc.Upper Saddle River, New Jersey 07458
All rights reserved.
Statistics and Data Analysis for Nursing Research, Second EditionDenise F. Polit
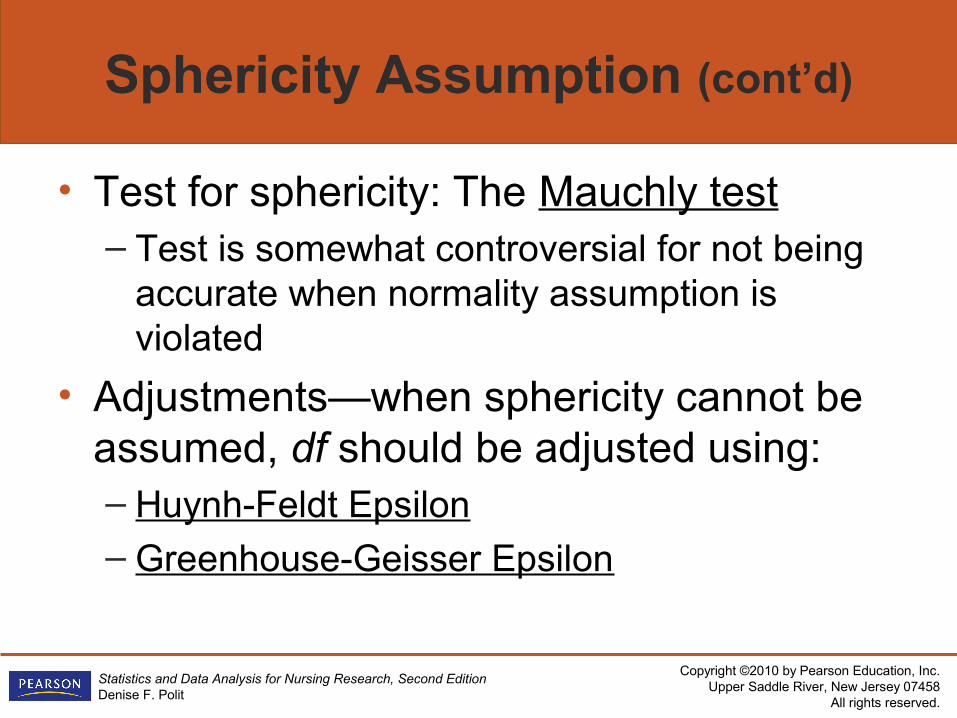
Sphericity Assumption (cont’d)
• Test for sphericity: The Mauchly test– Test is somewhat controversial for not being
accurate when normality assumption is violated
• Adjustments—when sphericity cannot be assumed, df should be adjusted using:– Huynh-Feldt Epsilon– Greenhouse-Geisser Epsilon
Copyright ©2010 by Pearson Education, Inc.Upper Saddle River, New Jersey 07458
All rights reserved.
Statistics and Data Analysis for Nursing Research, Second EditionDenise F. Polit
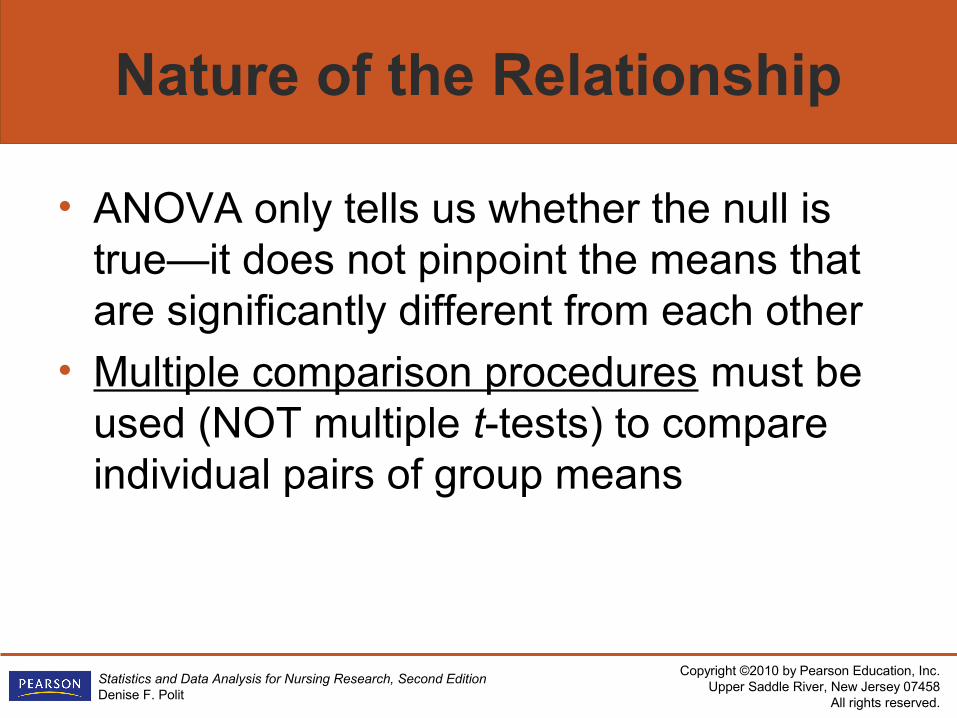
Nature of the Relationship
• ANOVA only tells us whether the null is true—it does not pinpoint the means that are significantly different from each other
• Multiple comparison procedures must be used (NOT multiple t-tests) to compare individual pairs of group means
Copyright ©2010 by Pearson Education, Inc.Upper Saddle River, New Jersey 07458
All rights reserved.
Statistics and Data Analysis for Nursing Research, Second EditionDenise F. Polit
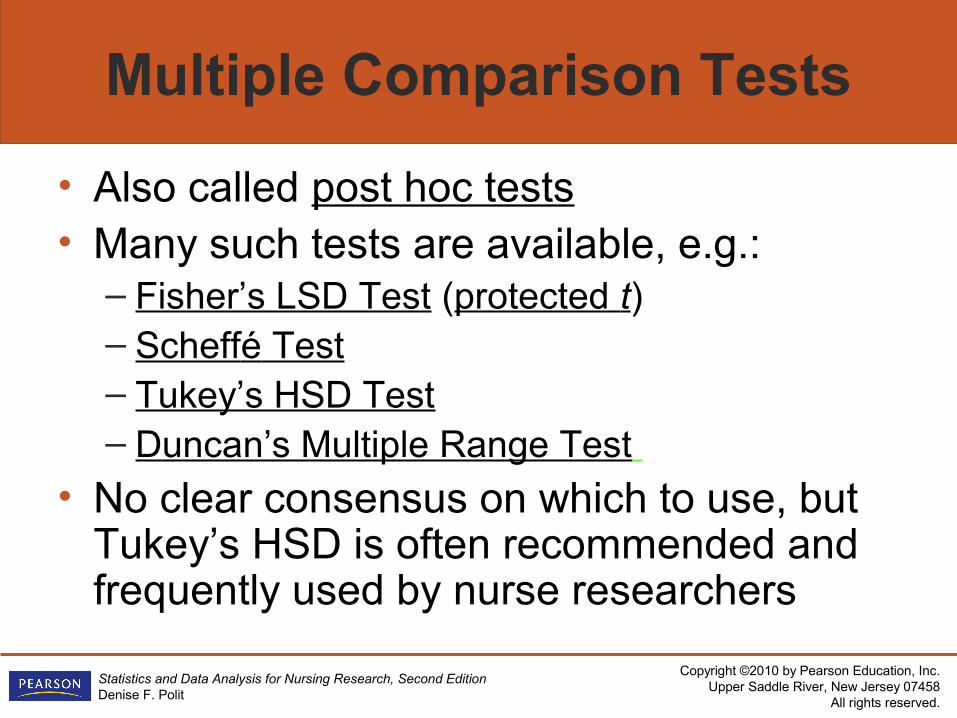
Multiple Comparison Tests
• Also called post hoc tests • Many such tests are available, e.g.:
– Fisher’s LSD Test (protected t)– Scheffé Test– Tukey’s HSD Test– Duncan’s Multiple Range Test
• No clear consensus on which to use, but Tukey’s HSD is often recommended and frequently used by nurse researchers
Copyright ©2010 by Pearson Education, Inc.Upper Saddle River, New Jersey 07458
All rights reserved.
Statistics and Data Analysis for Nursing Research, Second EditionDenise F. Polit
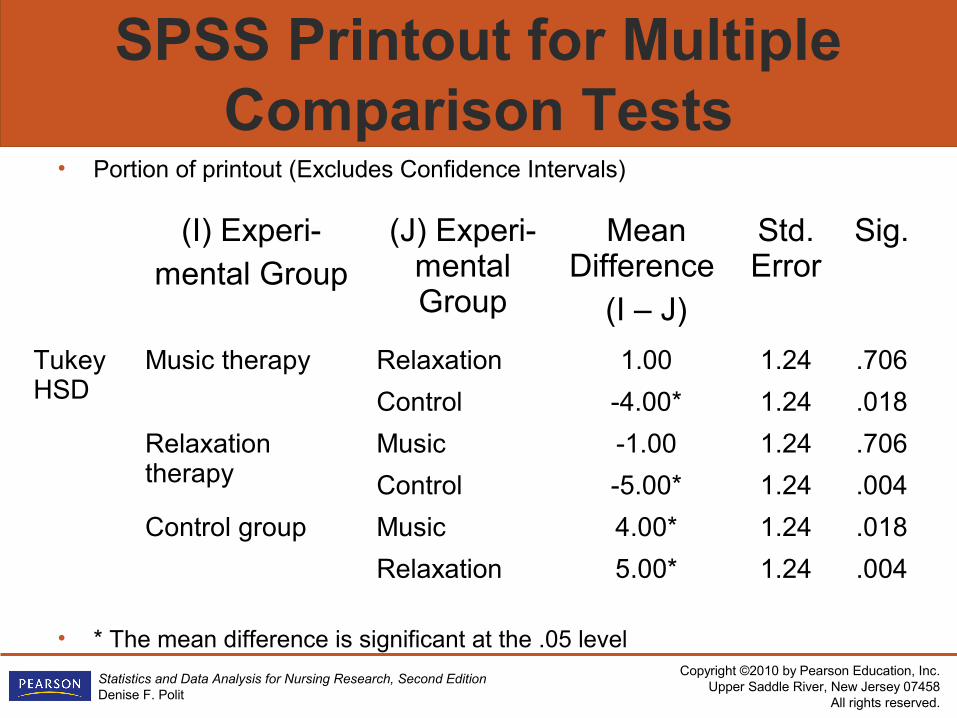
SPSS Printout for Multiple Comparison Tests
• Portion of printout (Excludes Confidence Intervals)
• * The mean difference is significant at the .05 level
(I) Experi-mental Group
(J) Experi-mental Group
Mean Difference
(I – J)
Std. Error
Sig.
Tukey HSD
Music therapy Relaxation 1.00 1.24 .706
Control -4.00* 1.24 .018
Relaxation therapy
Music -1.00 1.24 .706
Control -5.00* 1.24 .004
Control group Music 4.00* 1.24 .018
Relaxation 5.00* 1.24 .004
Copyright ©2010 by Pearson Education, Inc.Upper Saddle River, New Jersey 07458
All rights reserved.
Statistics and Data Analysis for Nursing Research, Second EditionDenise F. Polit
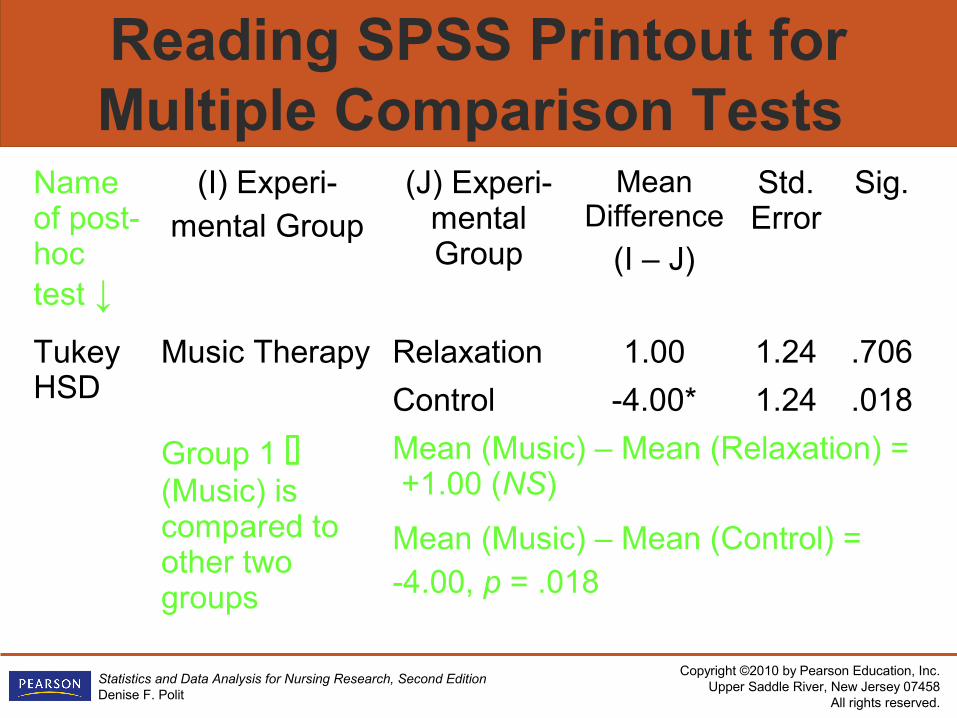
Reading SPSS Printout for Multiple Comparison Tests
Name of post-hoc test ↓
(I) Experi-mental Group
(J) Experi-mental Group
Mean Difference
(I – J)
Std. Error
Sig.
Tukey HSD
Music Therapy Relaxation 1.00 1.24 .706
Control -4.00* 1.24 .018
Group 1 (Music) is compared to other two groups
Mean (Music) – Mean (Relaxation) = +1.00 (NS)
Mean (Music) – Mean (Control) = -4.00, p = .018
Copyright ©2010 by Pearson Education, Inc.Upper Saddle River, New Jersey 07458
All rights reserved.
Statistics and Data Analysis for Nursing Research, Second EditionDenise F. Polit
Sensitivity Tests
• A useful concept in statistical testing: Sensitivity tests
• Involves assessing the sensitivity of the results to different assumptions or different analytic approaches, to see if the outcomes (i.e., the statistical decisions about the null hypothesis) are sensitive to alternative approaches
Copyright ©2010 by Pearson Education, Inc.Upper Saddle River, New Jersey 07458
All rights reserved.
Statistics and Data Analysis for Nursing Research, Second EditionDenise F. Polit
Precision in ANOVA
• Confidence intervals can be constructed around paired mean differences
• Confidence interval width is sensitive to which multiple comparison procedure was used
Copyright ©2010 by Pearson Education, Inc.Upper Saddle River, New Jersey 07458
All rights reserved.
Statistics and Data Analysis for Nursing Research, Second EditionDenise F. Polit
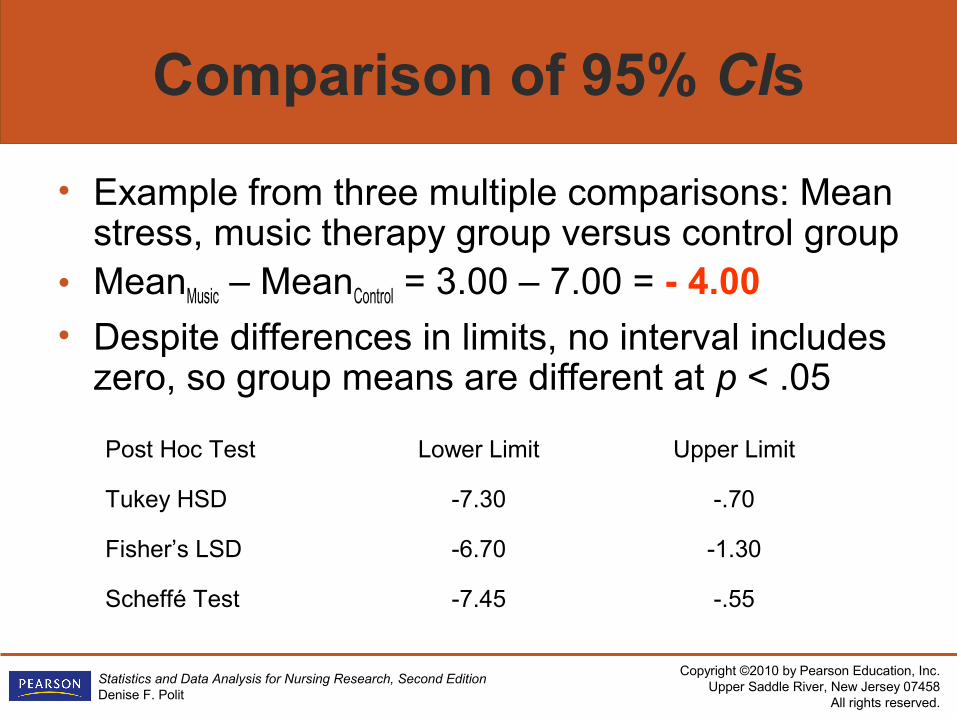
Comparison of 95% CIs
• Example from three multiple comparisons: Mean stress, music therapy group versus control group
• MeanMusic – MeanControl = 3.00 – 7.00 = - 4.00
• Despite differences in limits, no interval includes zero, so group means are different at p < .05
Post Hoc Test Lower Limit Upper Limit
Tukey HSD -7.30 -.70
Fisher’s LSD -6.70 -1.30
Scheffé Test -7.45 -.55
Copyright ©2010 by Pearson Education, Inc.Upper Saddle River, New Jersey 07458
All rights reserved.
Statistics and Data Analysis for Nursing Research, Second EditionDenise F. Polit
Magnitude of Effects in ANOVA
• The overall relationship between the independent variable (IV) and dependent variable (DV) can be estimated through the effect size index called eta-squared
• Eta-squared often symbolized as η2
• Eta-squared expresses the percentage of variability in the DV “explained” or accounted for by the IV
Copyright ©2010 by Pearson Education, Inc.Upper Saddle River, New Jersey 07458
All rights reserved.
Statistics and Data Analysis for Nursing Research, Second EditionDenise F. Polit
Eta-Squared
• Eta-squared is often used in estimating sample size needs (through power analysis) for ANOVA situations– Eta-squared must be estimated to solve for n
• Cohen’s conventions:– Small effect: η2 = .01– Moderate effect: η2 = .04– Large effect: η2 = .14
• Eta-squared is not usually used as effect size index in meta-analyses
Copyright ©2010 by Pearson Education, Inc.Upper Saddle River, New Jersey 07458
All rights reserved.
Statistics and Data Analysis for Nursing Research, Second EditionDenise F. Polit
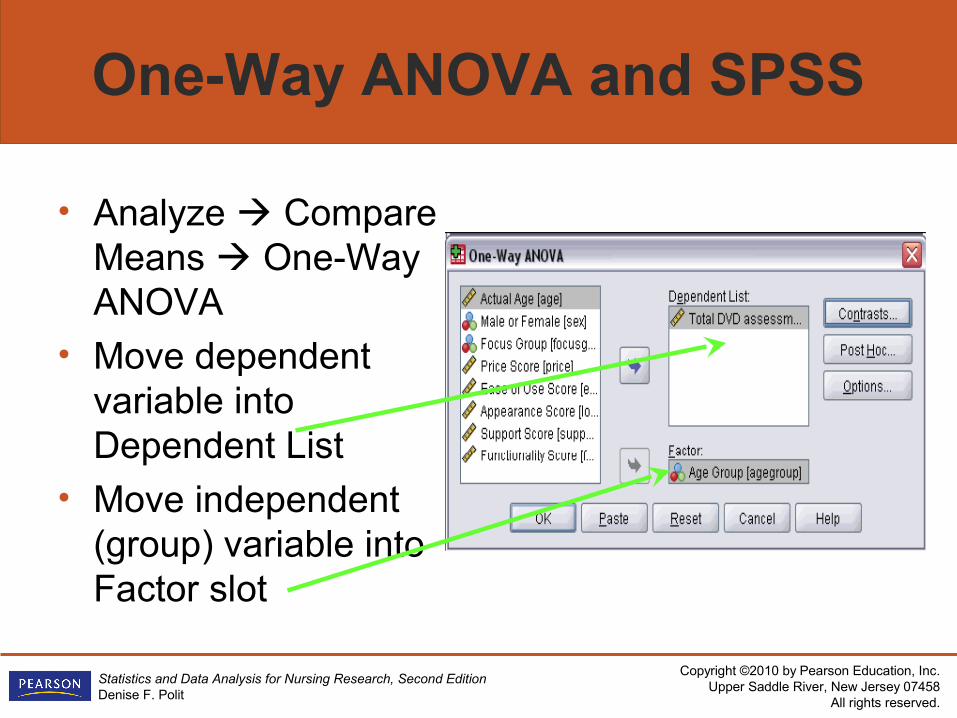
One-Way ANOVA and SPSS
• Analyze Compare Means One-Way ANOVA
• Move dependent variable into Dependent List
• Move independent (group) variable into Factor slot
Copyright ©2010 by Pearson Education, Inc.Upper Saddle River, New Jersey 07458
All rights reserved.
Statistics and Data Analysis for Nursing Research, Second EditionDenise F. Polit
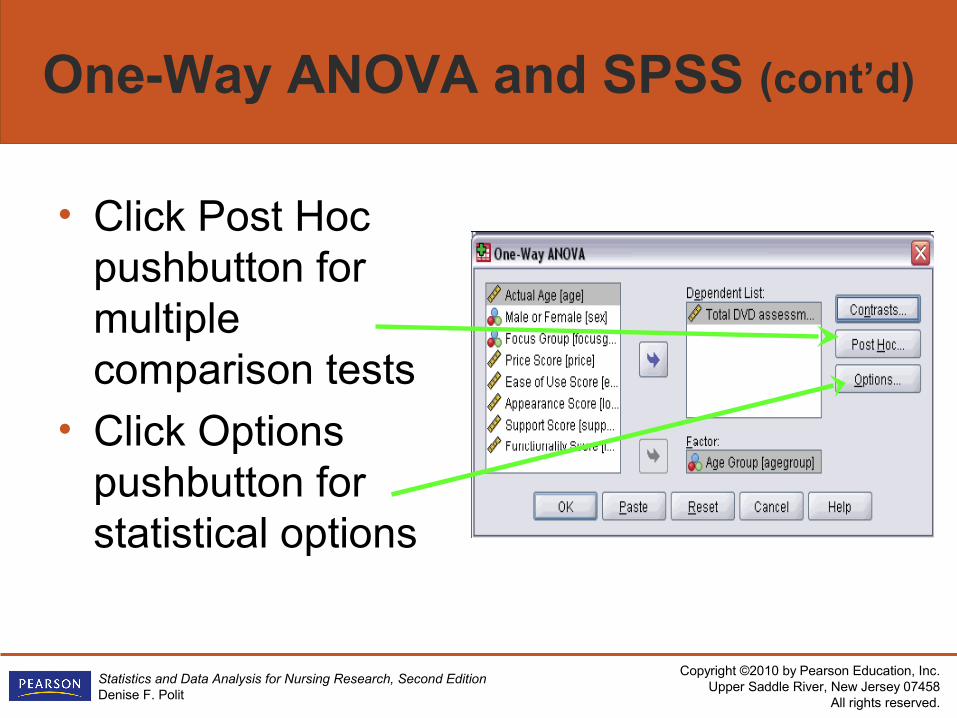
One-Way ANOVA and SPSS (cont’d)
• Click Post Hoc pushbutton for multiple comparison tests
• Click Options pushbutton for statistical options
Copyright ©2010 by Pearson Education, Inc.Upper Saddle River, New Jersey 07458
All rights reserved.
Statistics and Data Analysis for Nursing Research, Second EditionDenise F. Polit
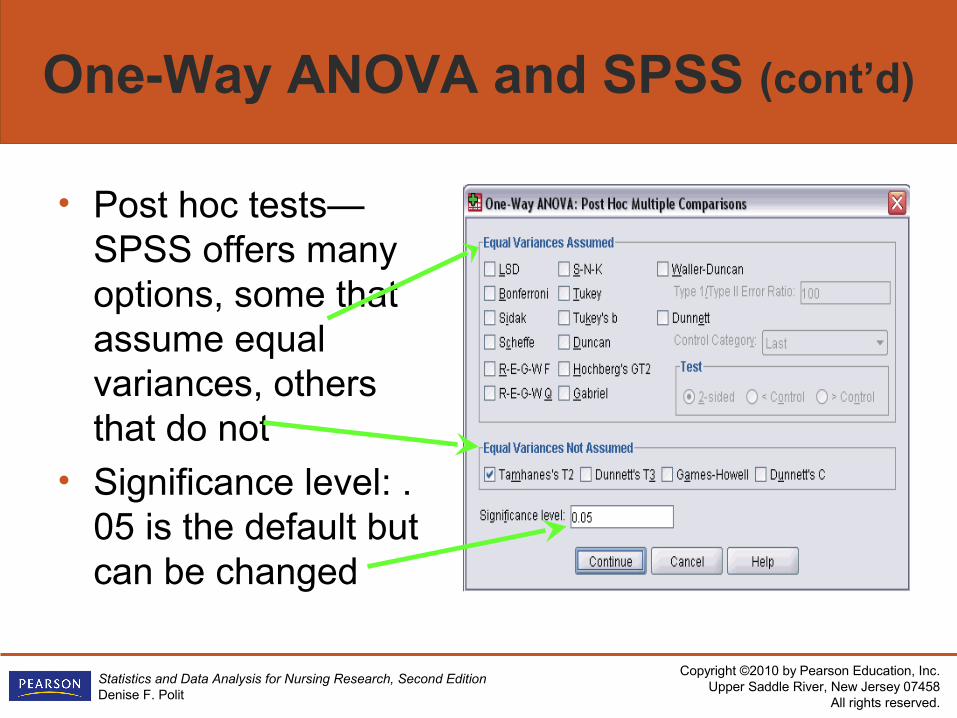
One-Way ANOVA and SPSS (cont’d)
• Post hoc tests—SPSS offers many options, some that assume equal variances, others that do not
• Significance level: .05 is the default but can be changed
Copyright ©2010 by Pearson Education, Inc.Upper Saddle River, New Jersey 07458
All rights reserved.
Statistics and Data Analysis for Nursing Research, Second EditionDenise F. Polit
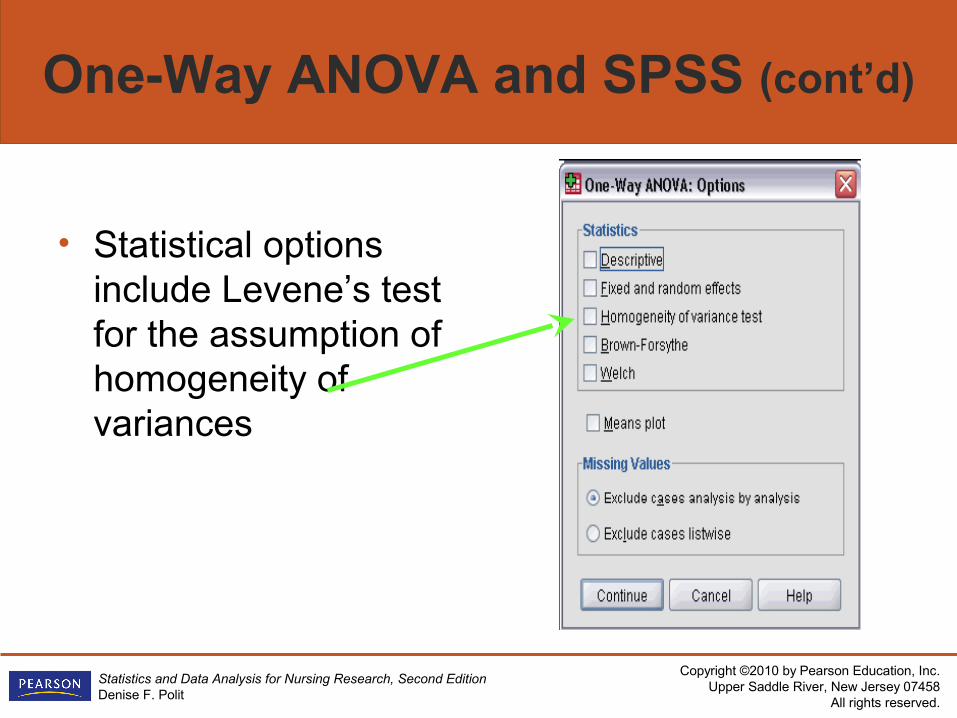
One-Way ANOVA and SPSS (cont’d)
• Statistical options include Levene’s test for the assumption of homogeneity of variances
Copyright ©2010 by Pearson Education, Inc.Upper Saddle River, New Jersey 07458
All rights reserved.
Statistics and Data Analysis for Nursing Research, Second EditionDenise F. Polit
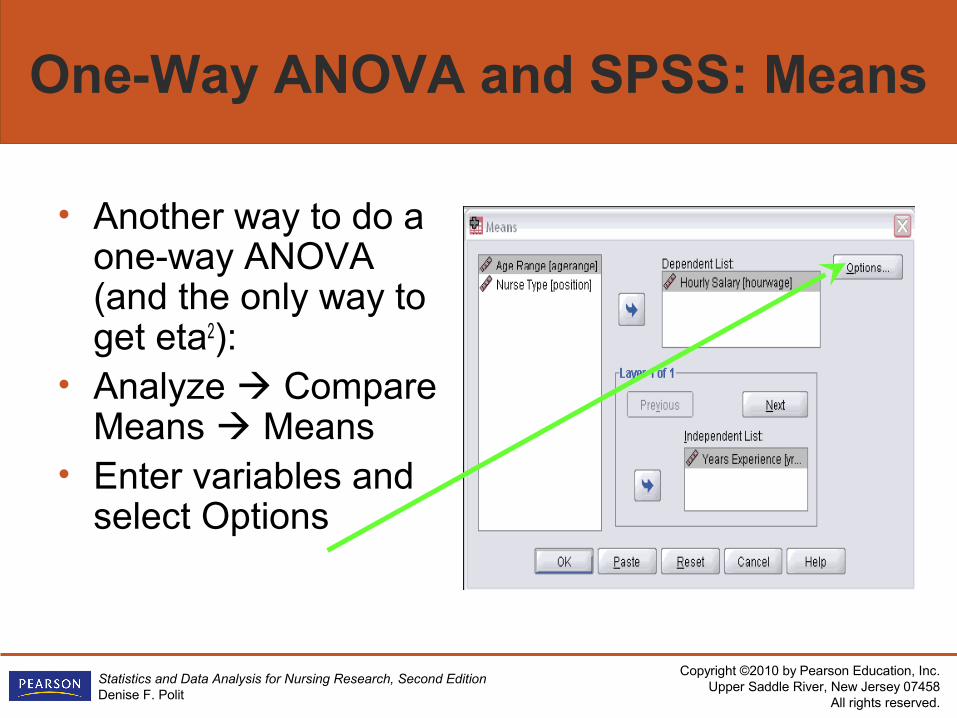
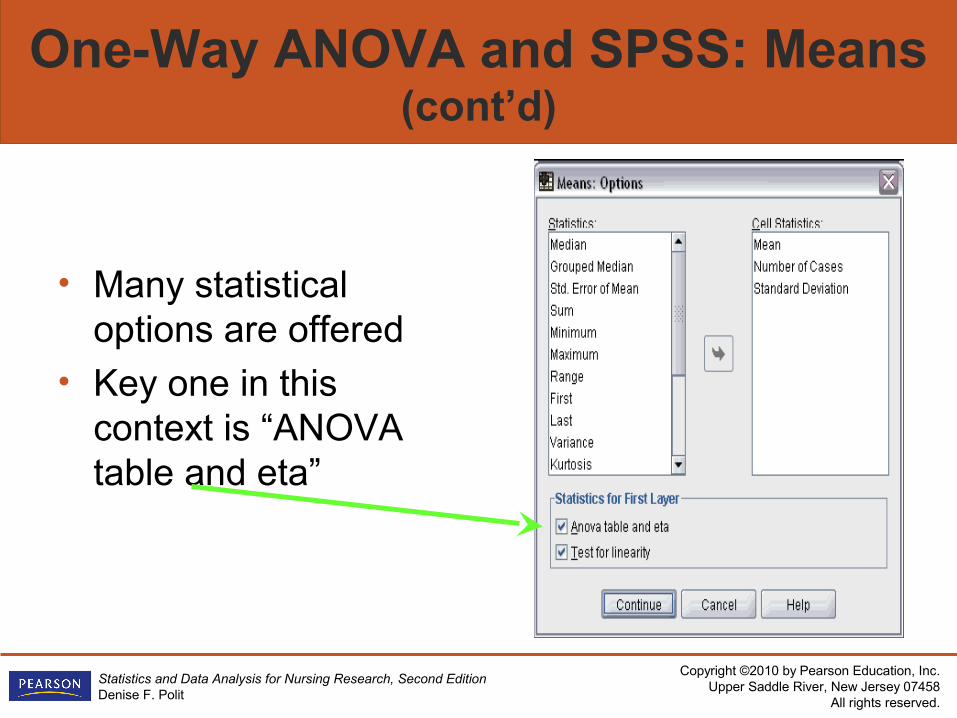
One-Way ANOVA and SPSS: Means
• Another way to do a one-way ANOVA (and the only way to get eta2):
• Analyze Compare Means Means
• Enter variables and select Options
Copyright ©2010 by Pearson Education, Inc.Upper Saddle River, New Jersey 07458
All rights reserved.
Statistics and Data Analysis for Nursing Research, Second EditionDenise F. Polit
One-Way ANOVA and SPSS: Means (cont’d)
• Many statistical options are offered
• Key one in this context is “ANOVA table and eta”
Copyright ©2010 by Pearson Education, Inc.Upper Saddle River, New Jersey 07458
All rights reserved.
Statistics and Data Analysis for Nursing Research, Second EditionDenise F. Polit
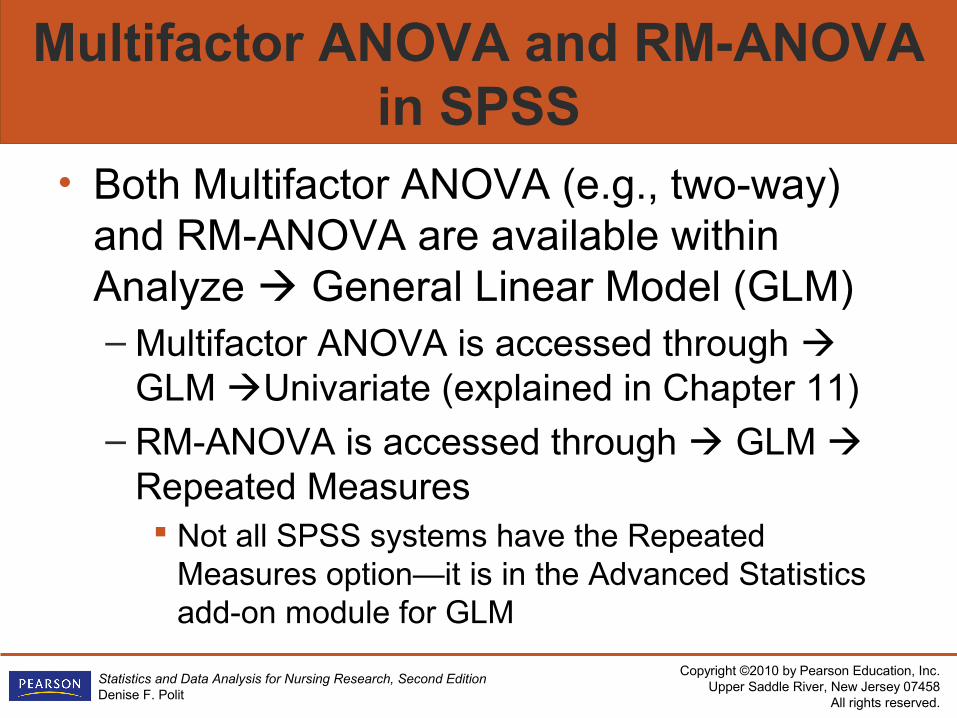
Multifactor ANOVA and RM-ANOVA in SPSS
• Both Multifactor ANOVA (e.g., two-way) and RM-ANOVA are available within Analyze General Linear Model (GLM)– Multifactor ANOVA is accessed through
GLM Univariate (explained in Chapter 11)– RM-ANOVA is accessed through GLM
Repeated Measures Not all SPSS systems have the Repeated
Measures option—it is in the Advanced Statistics add-on module for GLM


![FONCTION LOGARITHME NEPERIEN - maths et tiques · On la note lna. La fonction logarithme népérien, notée ln, est la fonction : ln: 0;] +∞](https://img.pdfslide.fr/doc/110x75/5b2ccd807f8b9ad76e8b7629/fonction-logarithme-neperien-maths-et-tiques-on-la-note-lna-la-fonction-logarithme.jpg)


![Intervalles musicaux et récupération de phase mémoire de …recherche.ircam.fr/equipes/repmus/moreno/MasterMandereau.pdfdans [CH07]. Plan du mémoire Le plan de ce mémoire permet](https://img.pdfslide.fr/doc/110x75/5fea6581e1f54033190274ed/intervalles-musicaux-et-rcupration-de-phase-mmoire-de-dans-ch07-plan-du.jpg)