Embed Size (px)
Citation preview
8/3/2019 Portfolio Math
http://slidepdf.com/reader/full/portfolio-math 1/12
NAME : MUAZ BIN ABDULLAHCLASS : M11DTEACHER : PN. SURINAMPORTFOLIO TITLE : INVESTIGATING THE GRAPH OF TRIGONOMETRIC
FUNCTION y = A sin (Bx + C)
PART 1
GDC in radian mode1) Investigate graphs of the form y= A sin xa) Graph of y=sin x for -2 x 2
A- Graph of y=sin x
b) Describe the curve in term of its amplitude and period
Amplitude equal to y=1 while period equal to x=2Referring to the graph in GDC shown above, amplitude is constant equal to 1 while periodicity alsoconstant and keep repeating by the period value x=2
The graphs of functions defined by y = sin x are called sine waves or sinusoidal waves. Noticethat the graph repeats itself as it moves along the x-axis. The cycles of this regular repeating arecalled periods. This graph repeats every 6.28 units or 2 radians. It ranges from -1 to 1; half thisdistance is called the amplitude. So the graph below has a period of 6.28 and an amplitude of 1.
We will investivage different values for the amplitude and period as well as phase shift whichappears to set the graph at a different place on the x axis.
The value A affects the amplitude. The amplitude (half the distance between the maximum andminimum values of the function) will be |A|, since distance is always positive. Increasing ordecreasing the value of A will vertically stretch or shrink the graph. Consider these examples:
8/3/2019 Portfolio Math
http://slidepdf.com/reader/full/portfolio-math 2/12
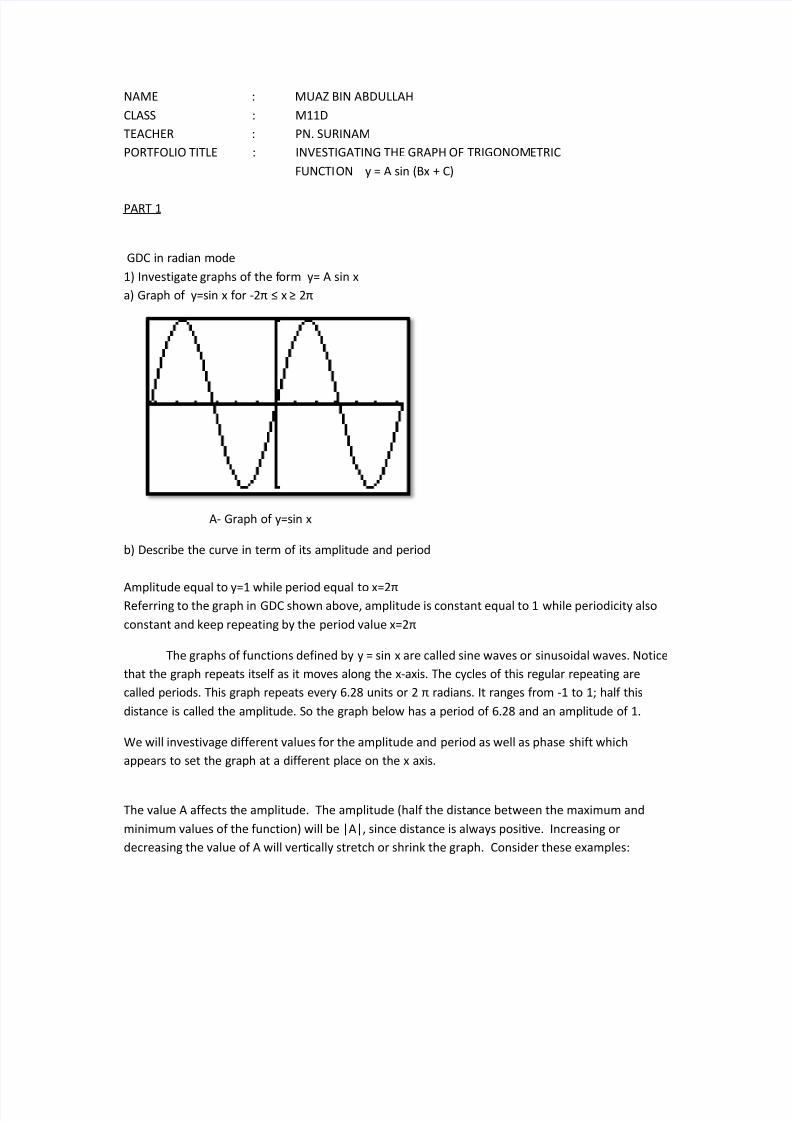
c) Graph of y= 2sinx and y= (1/2)sinx for -2 x 2
B - Graph of y= 2sinx C - Graph of y= (1/2)sinx
Key
................. y=2sinx
y=(1/2)sinx
y=sinx
Graph of A + B + C
y= A sinx
d) Referring to the graph above, it is obvious for any of number of A, the period still be the same thatis x=2 . The amplitude change if the value of A are changed. For instance, in graph y= 2sinx the
amplitude is 2 while in graph y= (1/2)sinx the amplitude is (1/2). So, it is obvious that there is acorrelation between value of A and the amplitude. As we can see, the higher the value of A ( that isfrom (1/2), 1 and lastly 2 ) referring to the each graph, it is clearly noticed that the amplitude alsogetting increase or becoming larger.
e) So, by the correlation that has been gotten, we can make a conclusion that the higher the value of A if positive, the higher the amplitude while the lower the value of A if negative, the lower theamplitude. In a nutshell, amplitude is dependent on the value of A. So the conclusion reached
8/3/2019 Portfolio Math
http://slidepdf.com/reader/full/portfolio-math 3/12
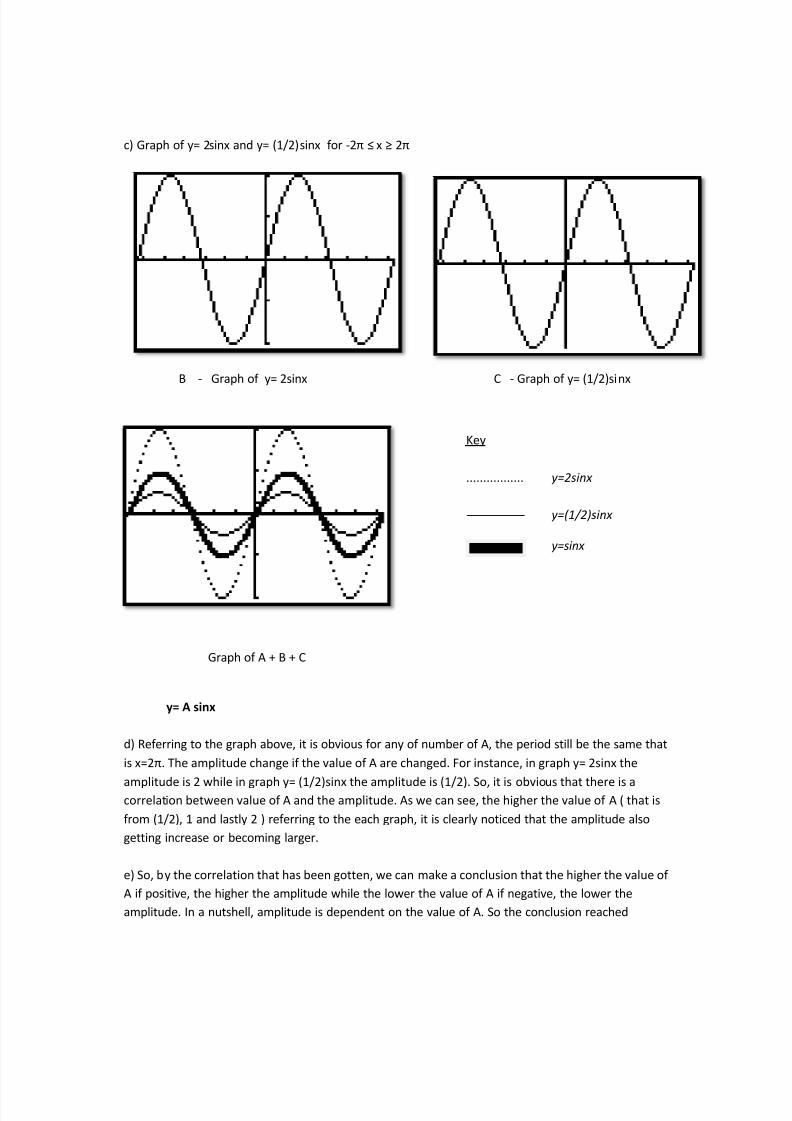
mathematically known as conjecture need to be proven clearly.One way is by considering what values of A that make the conjecture stated valid.If we look at the shape of graph, we will get the same shape appeared unless we replaced the valueof A with negative number.
-A y=(-)sinx -B y=( -2)sinx
-C y= -(1/2)sinx
Graph of (A + B + C)
Referring to the graph above, we can see that the graph is reflected along the x-axis. Hence, theshape of graph will be different. Apart from in terms of shape, all others are kept constant includingthe amplitude and period.
8/3/2019 Portfolio Math
http://slidepdf.com/reader/full/portfolio-math 4/12
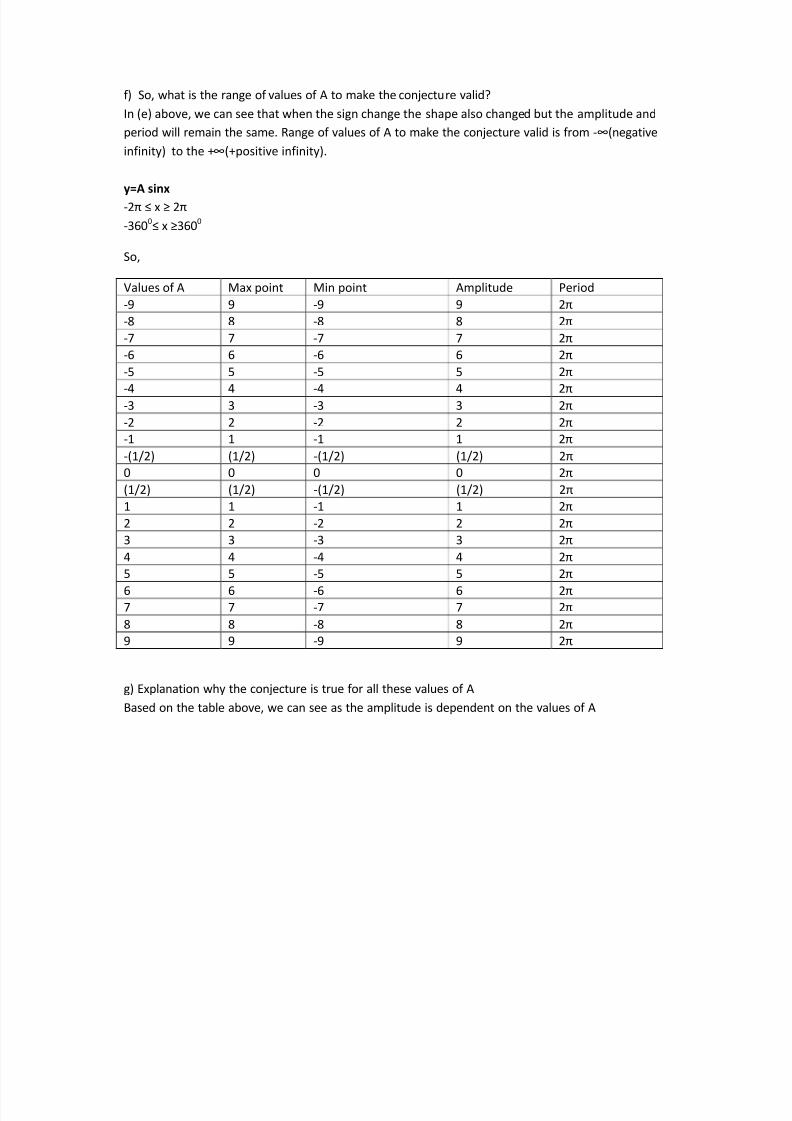
f) So, what is the range of values of A to make the conjecture valid?In (e) above, we can see that when the sign change the shape also changed but the amplitude andperiod will remain the same. Range of values of A to make the conjecture valid is from - (negativeinfinity) to the + (+positive infinity).
y=A sinx-2 x 2-360 0 x 360 0
So,
Values of A Max point Min point Amplitude Period-9 9 -9 9 2-8 8 -8 8 2-7 7 -7 7 2-6 6 -6 6 2-5 5 -5 5 2
-4 4 -4 4 2-3 3 -3 3 2-2 2 -2 2 2-1 1 -1 1 2-(1/2) (1/2) -(1/2) (1/2) 20 0 0 0 2(1/2) (1/2) -(1/2) (1/2) 21 1 -1 1 22 2 -2 2 23 3 -3 3 24 4 -4 4 25 5 -5 5 2
6 6 -6 6 27 7 -7 7 28 8 -8 8 29 9 -9 9 2
g) Explanation why the conjecture is true for all these values of ABased on the table above, we can see as the amplitude is dependent on the values of A
8/3/2019 Portfolio Math
http://slidepdf.com/reader/full/portfolio-math 5/12
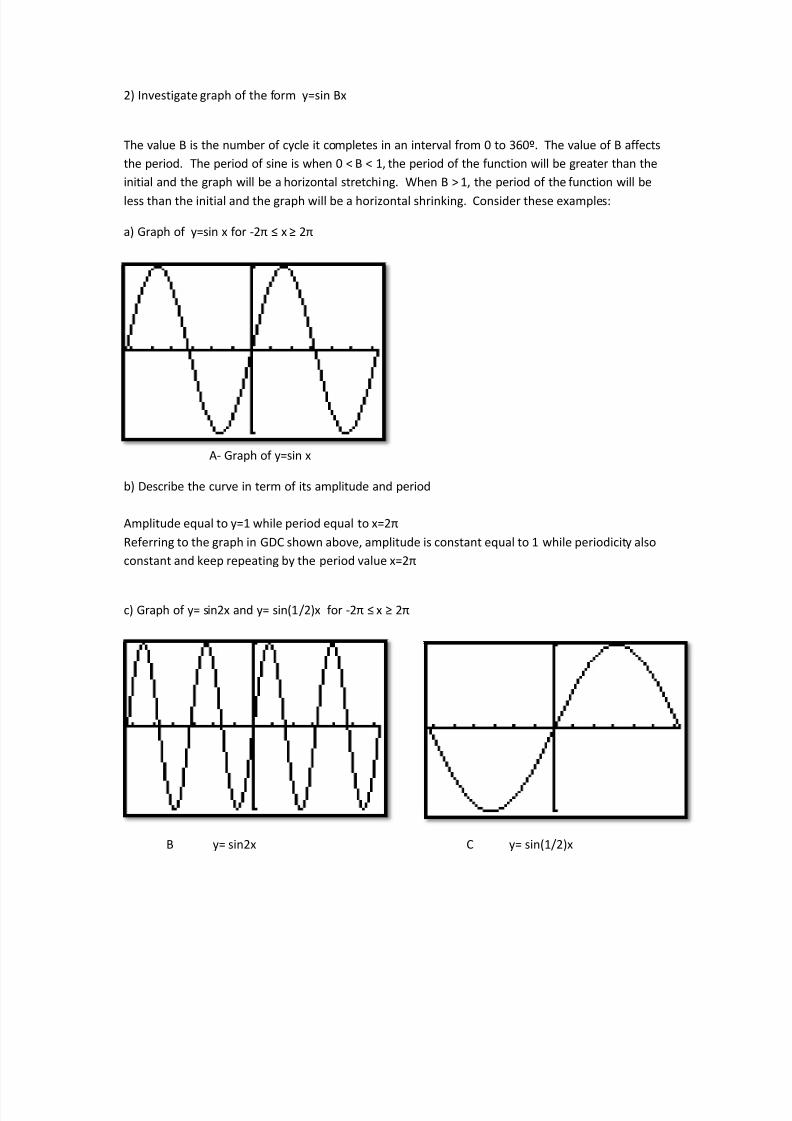
2) Investigate graph of the form y=sin Bx
The value B is the number of cycle it completes in an interval from 0 to 360º. The value of B affectsthe period. The period of sine is when 0 < B < 1, the period of the function will be greater than theinitial and the graph will be a horizontal stretching. When B > 1, the period of the function will be
less than the initial and the graph will be a horizontal shrinking. Consider these examples:
a) Graph of y=sin x for -2 x 2
A- Graph of y=sin x
b) Describe the curve in term of its amplitude and period
Amplitude equal to y=1 while period equal to x=2Referring to the graph in GDC shown above, amplitude is constant equal to 1 while periodicity alsoconstant and keep repeating by the period value x=2
c) Graph of y= sin2x and y= sin(1/2)x for -2 x 2
B y= sin2x C y= sin(1/2)x
8/3/2019 Portfolio Math
http://slidepdf.com/reader/full/portfolio-math 6/12
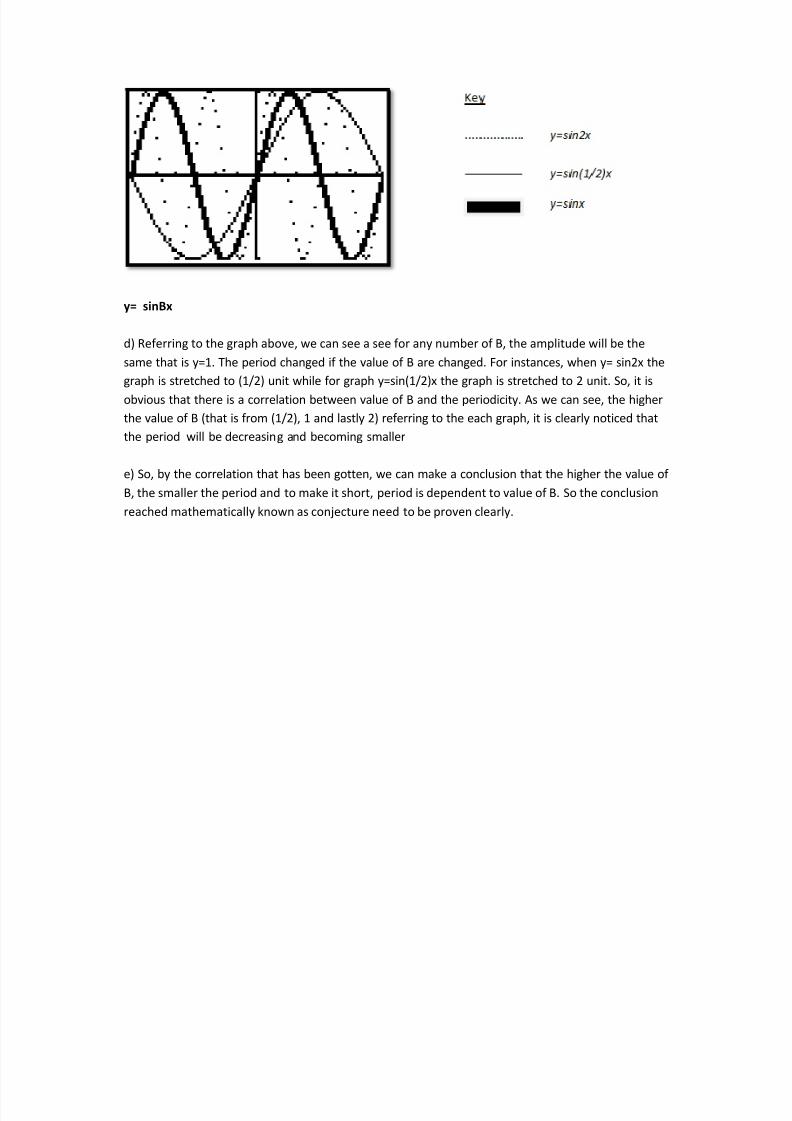
y= sinBx
d) Referring to the graph above, we can see a see for any number of B, the amplitude will be thesame that is y=1. The period changed if the value of B are changed. For instances, when y= sin2x thegraph is stretched to (1/2) unit while for graph y=sin(1/2)x the graph is stretched to 2 unit. So, it isobvious that there is a correlation between value of B and the periodicity. As we can see, the higherthe value of B (that is from (1/2), 1 and lastly 2) referring to the each graph, it is clearly noticed thatthe period will be decreasing and becoming smaller
e) So, by the correlation that has been gotten, we can make a conclusion that the higher the value of B, the smaller the period and to make it short, period is dependent to value of B. So the conclusionreached mathematically known as conjecture need to be proven clearly.
8/3/2019 Portfolio Math
http://slidepdf.com/reader/full/portfolio-math 7/12
8/3/2019 Portfolio Math
http://slidepdf.com/reader/full/portfolio-math 8/12
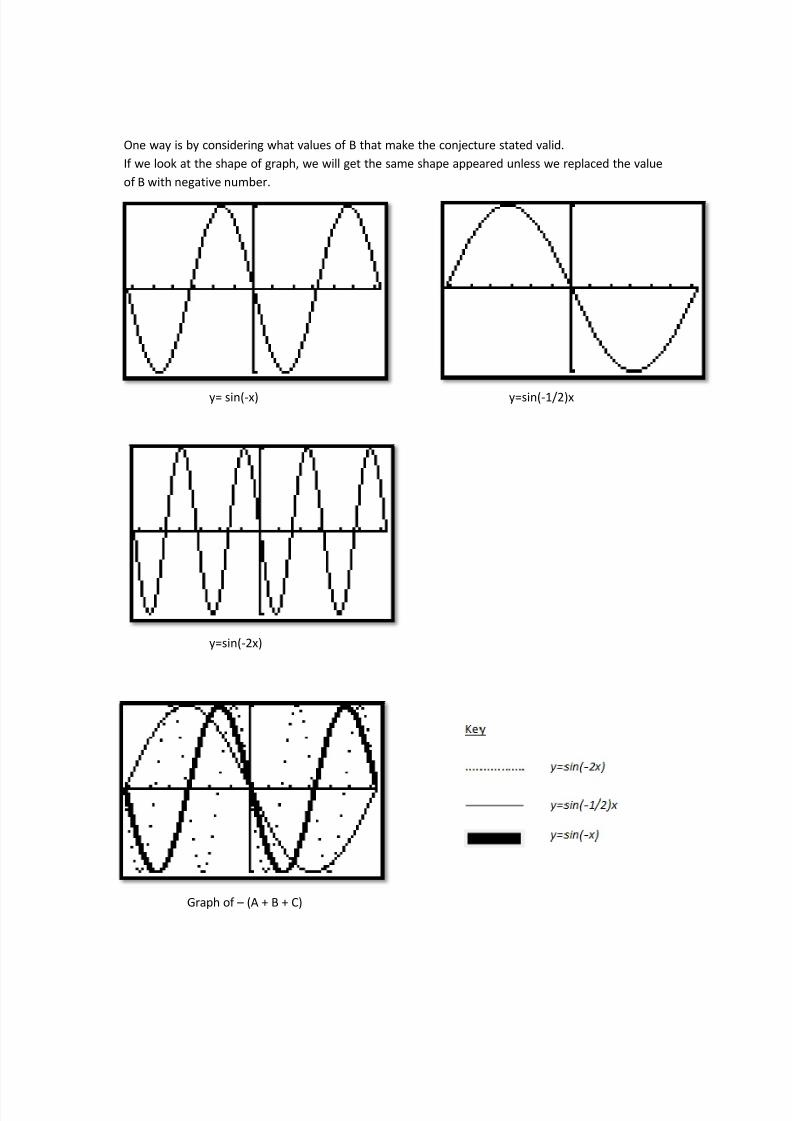
Referring to the graph above, we can see that the graph is reflected along the y-axis. Hence, theshape of graph will be different. Apart from in terms of shape, all others are kept constant includingthe period.
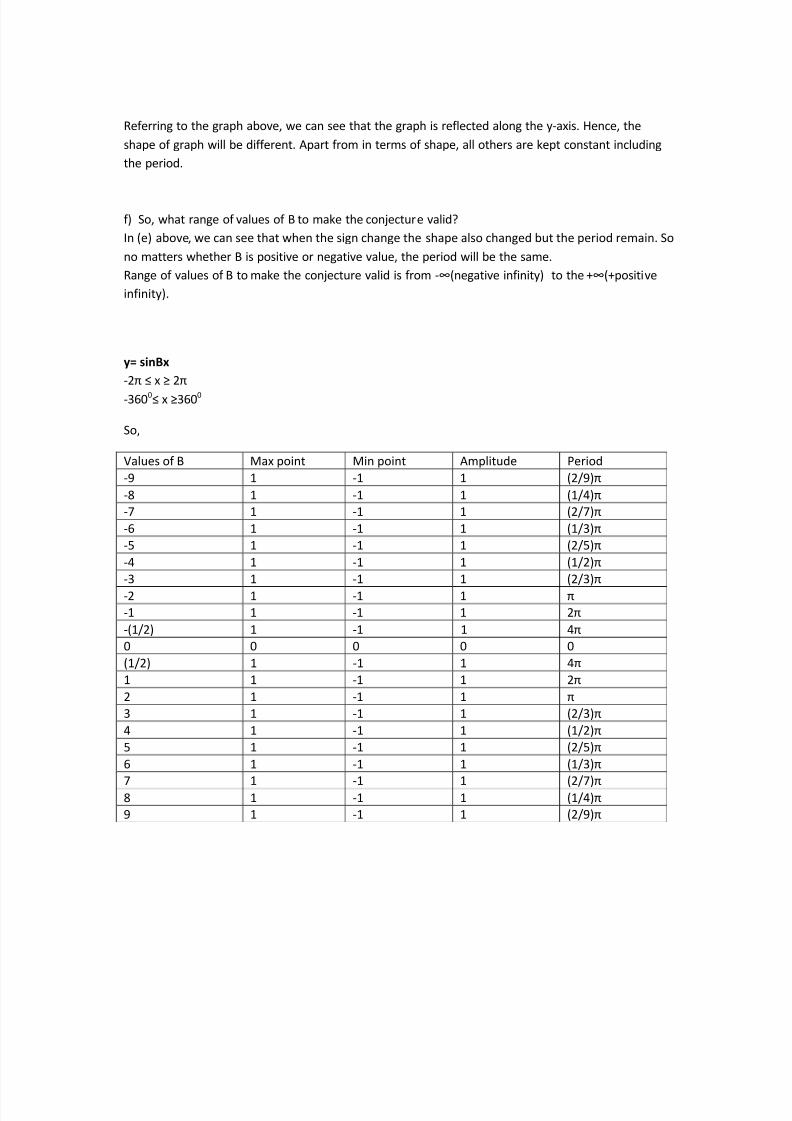
f) So, what range of values of B to make the conjecture valid?In (e) above, we can see that when the sign change the shape also changed but the period remain. Sono matters whether B is positive or negative value, the period will be the same.Range of values of B to make the conjecture valid is from - (negative infinity) to the + (+positiveinfinity).
y= sinBx-2 x 2-360 0 x 360 0
So,
Values of B Max point Min point Amplitude Period-9 1 -1 1 (2/9)-8 1 -1 1 (1/4)-7 1 -1 1 (2/7)-6 1 -1 1 (1/3)-5 1 -1 1 (2/5)-4 1 -1 1 (1/2)-3 1 -1 1 (2/3)-2 1 -1 1 -1 1 -1 1 2-(1/2) 1 -1 1 40 0 0 0 0(1/2) 1 -1 1 41 1 -1 1 22 1 -1 1 3 1 -1 1 (2/3)4 1 -1 1 (1/2)5 1 -1 1 (2/5)6 1 -1 1 (1/3)
7 1 -1 1 (2/7)8 1 -1 1 (1/4)9 1 -1 1 (2/9)
8/3/2019 Portfolio Math
http://slidepdf.com/reader/full/portfolio-math 9/12
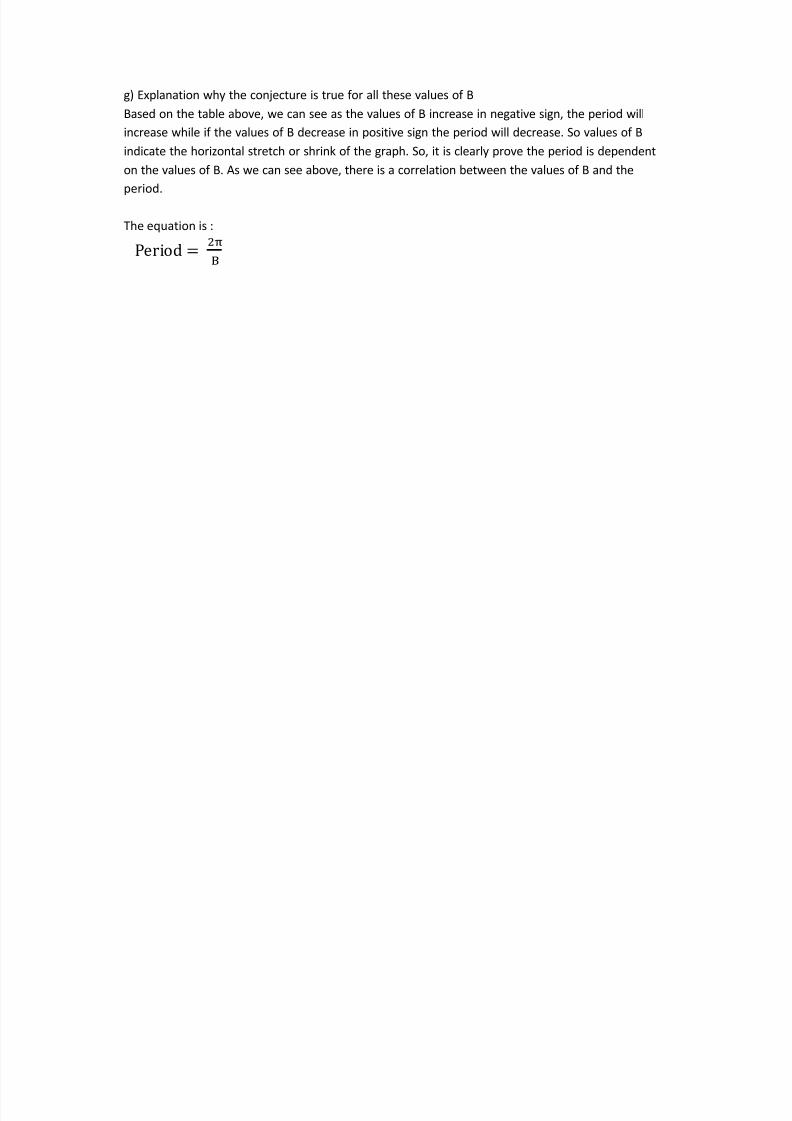
g) Explanation why the conjecture is true for all these values of BBased on the table above, we can see as the values of B increase in negative sign, the period willincrease while if the values of B decrease in positive sign the period will decrease. So values of Bindicate the horizontal stretch or shrink of the graph. So, it is clearly prove the period is dependenton the values of B. As we can see above, there is a correlation between the values of B and theperiod.
The equation is :
8/3/2019 Portfolio Math
http://slidepdf.com/reader/full/portfolio-math 10/12
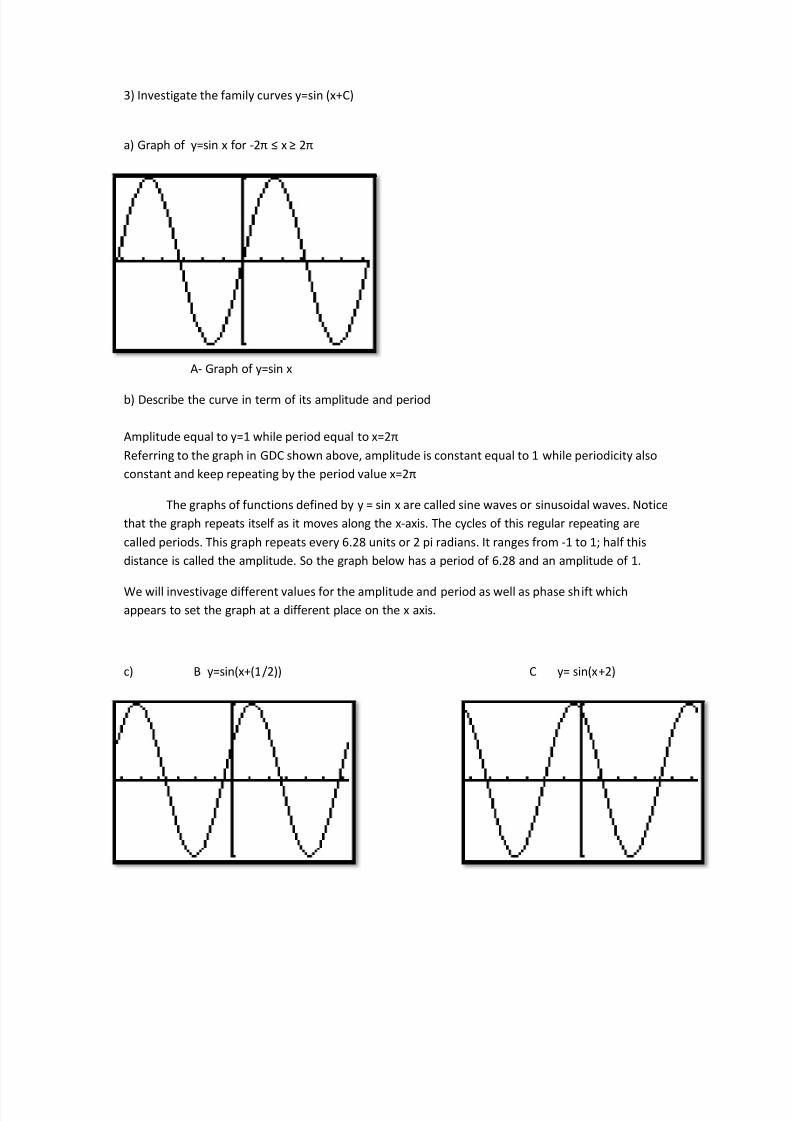
3) Investigate the family curves y=sin (x+C)
a) Graph of y=sin x for -2 x 2
A- Graph of y=sin x
b) Describe the curve in term of its amplitude and period
Amplitude equal to y=1 while period equal to x=2Referring to the graph in GDC shown above, amplitude is constant equal to 1 while periodicity alsoconstant and keep repeating by the period value x=2
The graphs of functions defined by y = sin x are called sine waves or sinusoidal waves. Noticethat the graph repeats itself as it moves along the x-axis. The cycles of this regular repeating arecalled periods. This graph repeats every 6.28 units or 2 pi radians. It ranges from -1 to 1; half thisdistance is called the amplitude. So the graph below has a period of 6.28 and an amplitude of 1.
We will investivage different values for the amplitude and period as well as phase shift whichappears to set the graph at a different place on the x axis.
c) B y=sin(x+(1/2)) C y= sin(x+2)
8/3/2019 Portfolio Math
http://slidepdf.com/reader/full/portfolio-math 11/12
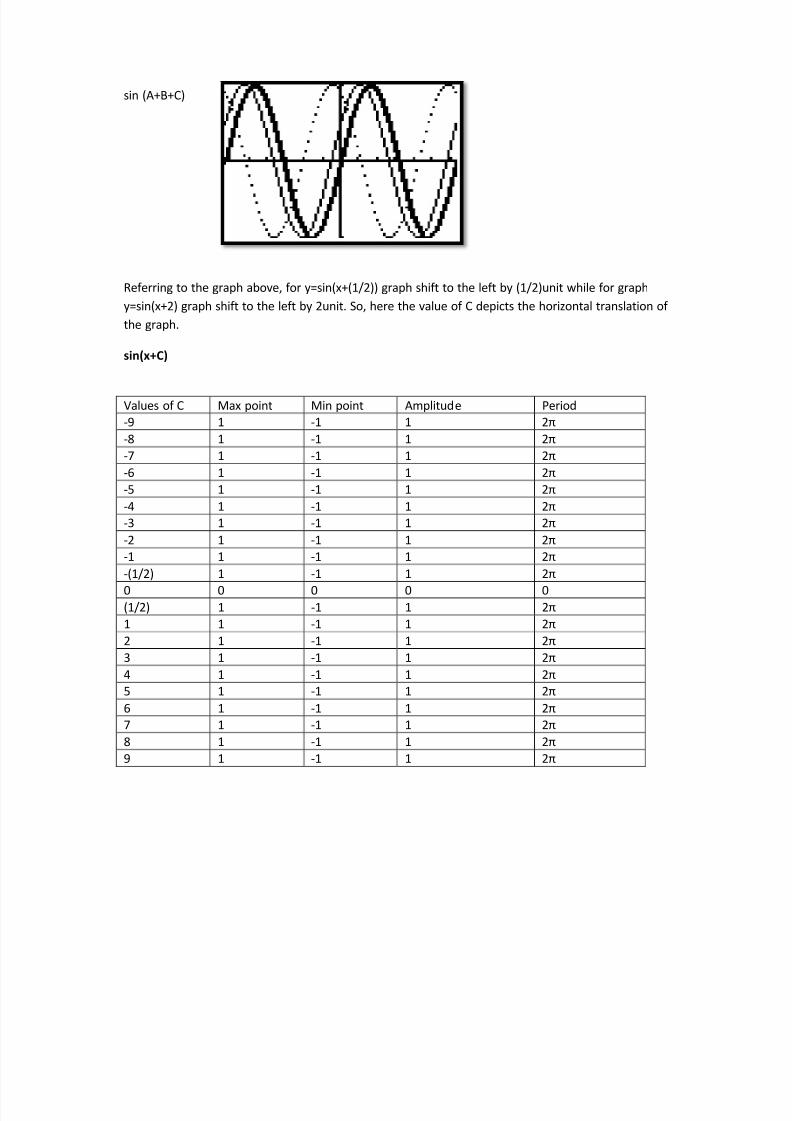
sin (A+B+C)
Referring to the graph above, for y=sin(x+(1/2)) graph shift to the left by (1/2)unit while for graphy=sin(x+2) graph shift to the left by 2unit. So, here the value of C depicts the horizontal translation of the graph.
sin(x+C)
Values of C Max point Min point Amplitude Period-9 1 -1 1 2-8 1 -1 1 2-7 1 -1 1 2-6 1 -1 1 2-5 1 -1 1 2-4 1 -1 1 2-3 1 -1 1 2-2 1 -1 1 2-1 1 -1 1 2-(1/2) 1 -1 1 2
0 0 0 0 0(1/2) 1 -1 1 21 1 -1 1 22 1 -1 1 23 1 -1 1 24 1 -1 1 25 1 -1 1 26 1 -1 1 27 1 -1 1 28 1 -1 1 29 1 -1 1 2
8/3/2019 Portfolio Math
http://slidepdf.com/reader/full/portfolio-math 12/12
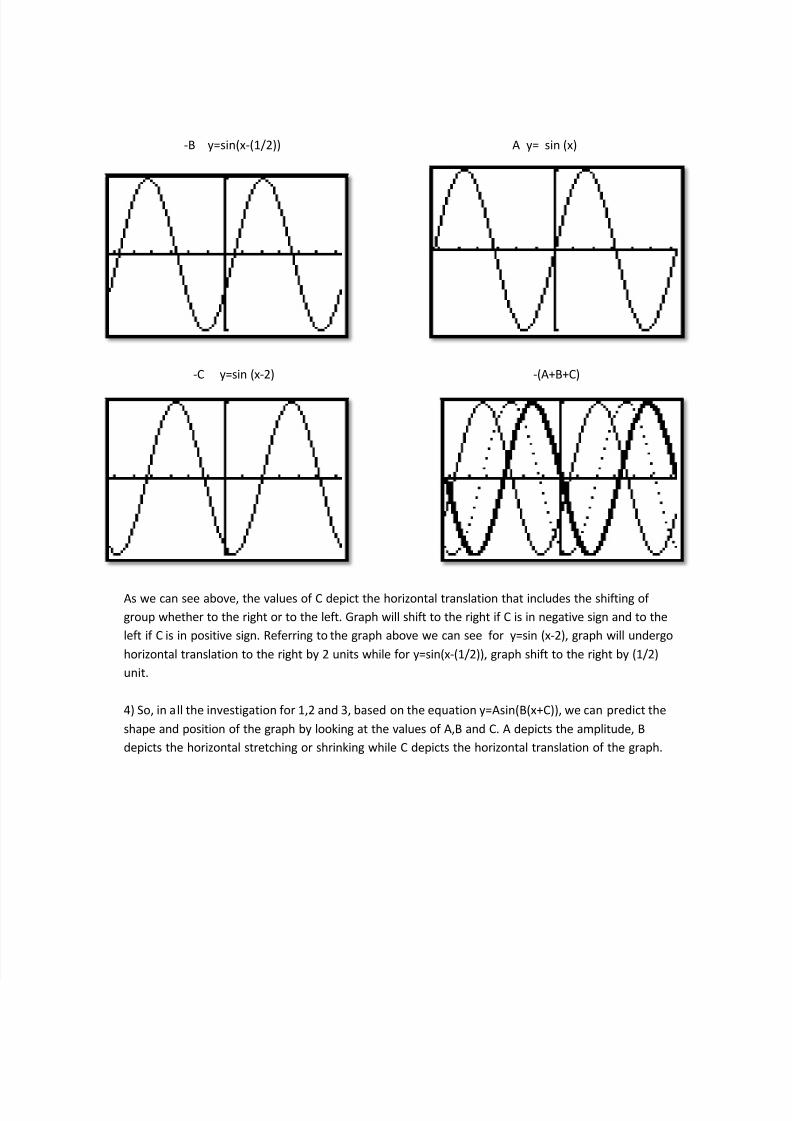
-B y=sin(x-(1/2)) A y= sin (x)
-C y=sin (x-2) -(A+B+C)
As we can see above, the values of C depict the horizontal translation that includes the shifting of group whether to the right or to the left. Graph will shift to the right if C is in negative sign and to theleft if C is in positive sign. Referring to the graph above we can see for y=sin (x-2), graph will undergohorizontal translation to the right by 2 units while for y=sin(x-(1/2)), graph shift to the right by (1/2)unit.
4) So, in all the investigation for 1,2 and 3, based on the equation y=Asin(B(x+C)), we can predict theshape and position of the graph by looking at the values of A,B and C. A depicts the amplitude, Bdepicts the horizontal stretching or shrinking while C depicts the horizontal translation of the graph.


![[MATH] ZeldovichMyshkis1972ru](https://img.pdfslide.fr/doc/110x75/577c7f591a28abe054a42d05/math-zeldovichmyshkis1972ru.jpg)